Article

Research on the Impact Performance of Polypropylene Fiber-Reinforced Concrete Composite Wall Panels

1
Water Conservancy Project Construction Center of Ningxia Autonomous Region, Yinchuan 750000, China
2
Materials & Structural Engineering Department, Nanjing Hydraulic Research Institute, Nanjing 210024, China
*
Authors to whom correspondence should be addressed.
Buildings 2025, 15(21), 3983; https://doi.org/10.3390/buildings15213983
Submission received: 22 August 2025 / Revised: 24 September 2025 / Accepted: 9 October 2025 / Published: 4 November 2025
(This article belongs to the Section Building Structures)

Abstract

Polypropylene fibers (PPFs), characterized by their low density, cost-effectiveness, and superior corrosion resistance, can be effectively incorporated into concrete to enhance the impact resistance of wall panels. This study introduces an innovative composite wall panel utilizing polypropylene fiber-reinforced concrete (PFRC) as the core material. Initially, an experimental investigation into the mechanical properties of PFRC was conducted, and based on these results, a constitutive model for PFRC was established. Subsequently, the impact-induced mechanical behavior of the innovative composite wall panel was investigated through finite element simulations employing ABAQUS, version 2020, software. The findings indicate that polypropylene fibers significantly improve both the compressive strength and ductility of concrete, with an optimal coarse fiber content of 1%. The inclusion of glass fiber grids and polypropylene fibers reduced the number of cracks and the overall deformation of the composite wall panel. The integration of glass fiber grids coupled with fiber reinforcement resulted in 7.2% and 27.8% enhancements in impact resistance, respectively. Parametric studies demonstrated that greater concrete panel thickness effectively diminishes post-impact peak and residual displacements in composite wall systems. Furthermore, the impact resistance was found to be weaker at the panel edges and stronger at a quarter of the panel height.

1. Introduction

Concrete predominates contemporary construction practices as the most extensively utilized engineering material [1]. However, it suffers from inherent drawbacks such as pronounced brittleness, low tensile strength, and poor impact resistance [2,3]. To improve its performance and promote sustainable resource utilization, researchers have attempted to incorporate waste materials into concrete, including recycled fibers [4,5,6], waste rubber [7,8,9], steel slag [10], and fly ash [11]. These practices not only facilitate the recycling of solid wastes but also significantly enhance the mechanical properties of concrete [12,13]. Among these alternatives, polypropylene fiber-reinforced concrete (PFRC) has attracted considerable attention due to its excellent tensile strength, toughness, and impact resistance [14,15]. When cracks occur in the concrete matrix, polypropylene fibers can effectively inhibit crack propagation [16,17,18]. Consequently, PFRC has been widely applied in various engineering structures such as wall panels [19,20,21], tunnels [22], railways [23], fences [24], and canals [25]. Owing to its favorable adaptability in structural engineering applications [26], PFRC demonstrates great potential for practical use. To further enhance the performance of precast composite wall panels, polypropylene fiber concrete has been introduced into this structural system. As one of the common forms of precast wall panels, such composite panels typically consist of two outer precast concrete layers and a thermal insulation core [27], and they exhibit high flexural capacity [28,29,30], excellent thermal performance [31,32,33], and favorable seismic resistance [34].
During service, building structures may be subjected to unexpected impact loads, such as vehicle collisions or pipeline ruptures. As critical components of the building envelope system, wall panels must therefore possess adequate impact resistance [35]. In recent years, several studies have investigated the impact resistance of PFRC [14]. For instance, Al-Rousan et al. [36] demonstrated through drop-weight impact tests that incorporating 0.90% polypropylene fibers by volume effectively enhanced the impact capacity of concrete slabs. Raj et al. [24] examined the static and dynamic performance of fiber-reinforced concrete fence posts and found that PFRC with a fiber dosage of 0.2% achieved an advantageous strength-to-cost ratio. Moreover, Nili et al. [37] and Zhang et al. [38] verified the reinforcing effect of polypropylene fibers on toughness and impact resistance from the perspectives of microstructural mechanisms and dynamic constitutive behavior, respectively.
Building upon this foundation, the research presents an innovative wall panel system integrating polypropylene fiber-reinforced concrete (PFRC) face sheets, an XPS insulation core, steel truss connectors, and glass fiber mesh reinforcement layers. To systematically investigate the impact resistance of this panel, finite element analysis (FEA) is conducted. Initially, a compressive constitutive model was developed for hybrid fiber-reinforced concrete containing dual-scale polypropylene fibers, founded on experimental material characterization. Subsequently, a validated computational model of the composite wall system was established using ABAQUS 2020 finite element analysis. Using this model, the dynamic response of the panel under impact loading is simulated to explore the synergistic effect between glass fiber mesh and polypropylene fibers as well as the underlying impact-resistance mechanism. Finally, the influence of key parameters on the impact performance is analyzed, thereby providing theoretical insights and design references for the engineering application of this sustainable wall panel system.

2. Mechanical Property Tests of Concrete with Hybrid Polypropylene Fibers

2.1. Experimental Procedures

2.1.1. Raw Materials

The polypropylene fibers (Shandong Karrida Building Materials Co., Ltd., Binzhou, China) used in the experiments were categorized into two types, coarse and fine, both commercially produced. The coarse fibers featured a corrugated surface designed to enhance their bond strength with concrete. Key performance parameters of the fibers, as provided by the manufacturer, are presented in Table 1.
The cementing material selected was P.O 42.5R Portland cement (Shandong Qingmin Building Materials Co., Ltd., Binzhou, China), conforming to Chinese Standard GB 175-2023 [39]. Its fundamental performance indicators are detailed in Table 2. The coarse aggregate (Shandong Qingmin Building Materials Co., Ltd., Binzhou, China) consisted of continuously graded, angular crushed stone with particle sizes ranging from 5 to 20 mm, produced through mechanical crushing and screening. The aggregate gradation met the requirements of Chinese Standard GB/T 14684-2022 [40]. Ordinary river sand was utilized as the fine aggregate.

2.1.2. Mix Proportion, Casting Procedures, and Specimen-Making

The experimental design stipulated a target concrete strength grade of C30. In accordance with the recommendations of Chinese Standard JGJ_T 221-2010 [41], the incorporation of an appropriate amount of synthetic fibers into ordinary concrete does not necessitate altering the original concrete mix proportion. Consequently, the reference mix proportion was designed based on Chinese Standard JGJ55-2019 [42]. The mix design ratio for plain concrete (PC) was 1:1.18:2.48:0.53 (Cement: Sand: Aggregate: Water).
Considering both the dispersibility of fibers within the cementitious matrix and economic efficiency and referencing American Concrete Institute (ACI) 544.1R—96 and related studies [5], the volume content of fine fibers was determined to be 0.1%. To address performance degradation from fiber agglomeration [43,44], coarse fiber volume fractions were designated as 0.5%, 1%, and 1.5%.
Considering the variations in coarse fiber content and length, a total of seven sets of specimens were designed for this experiment. For each set, three prismatic specimens, measuring 150 mm × 150 mm × 300 mm, were fabricated for axial compressive strength testing, resulting in a total of 21 specimens. The characteristic values for the fibers in each group are detailed in Table 3. The specimens were prepared using a forced-action mixer, with the specific mixing procedure illustrated in Figure 1.

2.1.3. Testing Procedure

Axial compression strength testing was performed in full compliance with Chinese National Standard GB/T 50081-2019 [45]. A 5000 kN electro-hydraulic servo universal testing machine (Jinan Xinguang Testing Machine Manufacturing Co., Ltd., Jinan, China) was utilized for the experiment, and loading was applied under displacement control. Axial deformation of the specimens was monitored using symmetrically mounted electronic dial gauges on both sides, with the mean value from dual measurements representing the definitive axial deformation.

2.2. Test Results and Analysis

2.2.1. Failure Mode Analysis

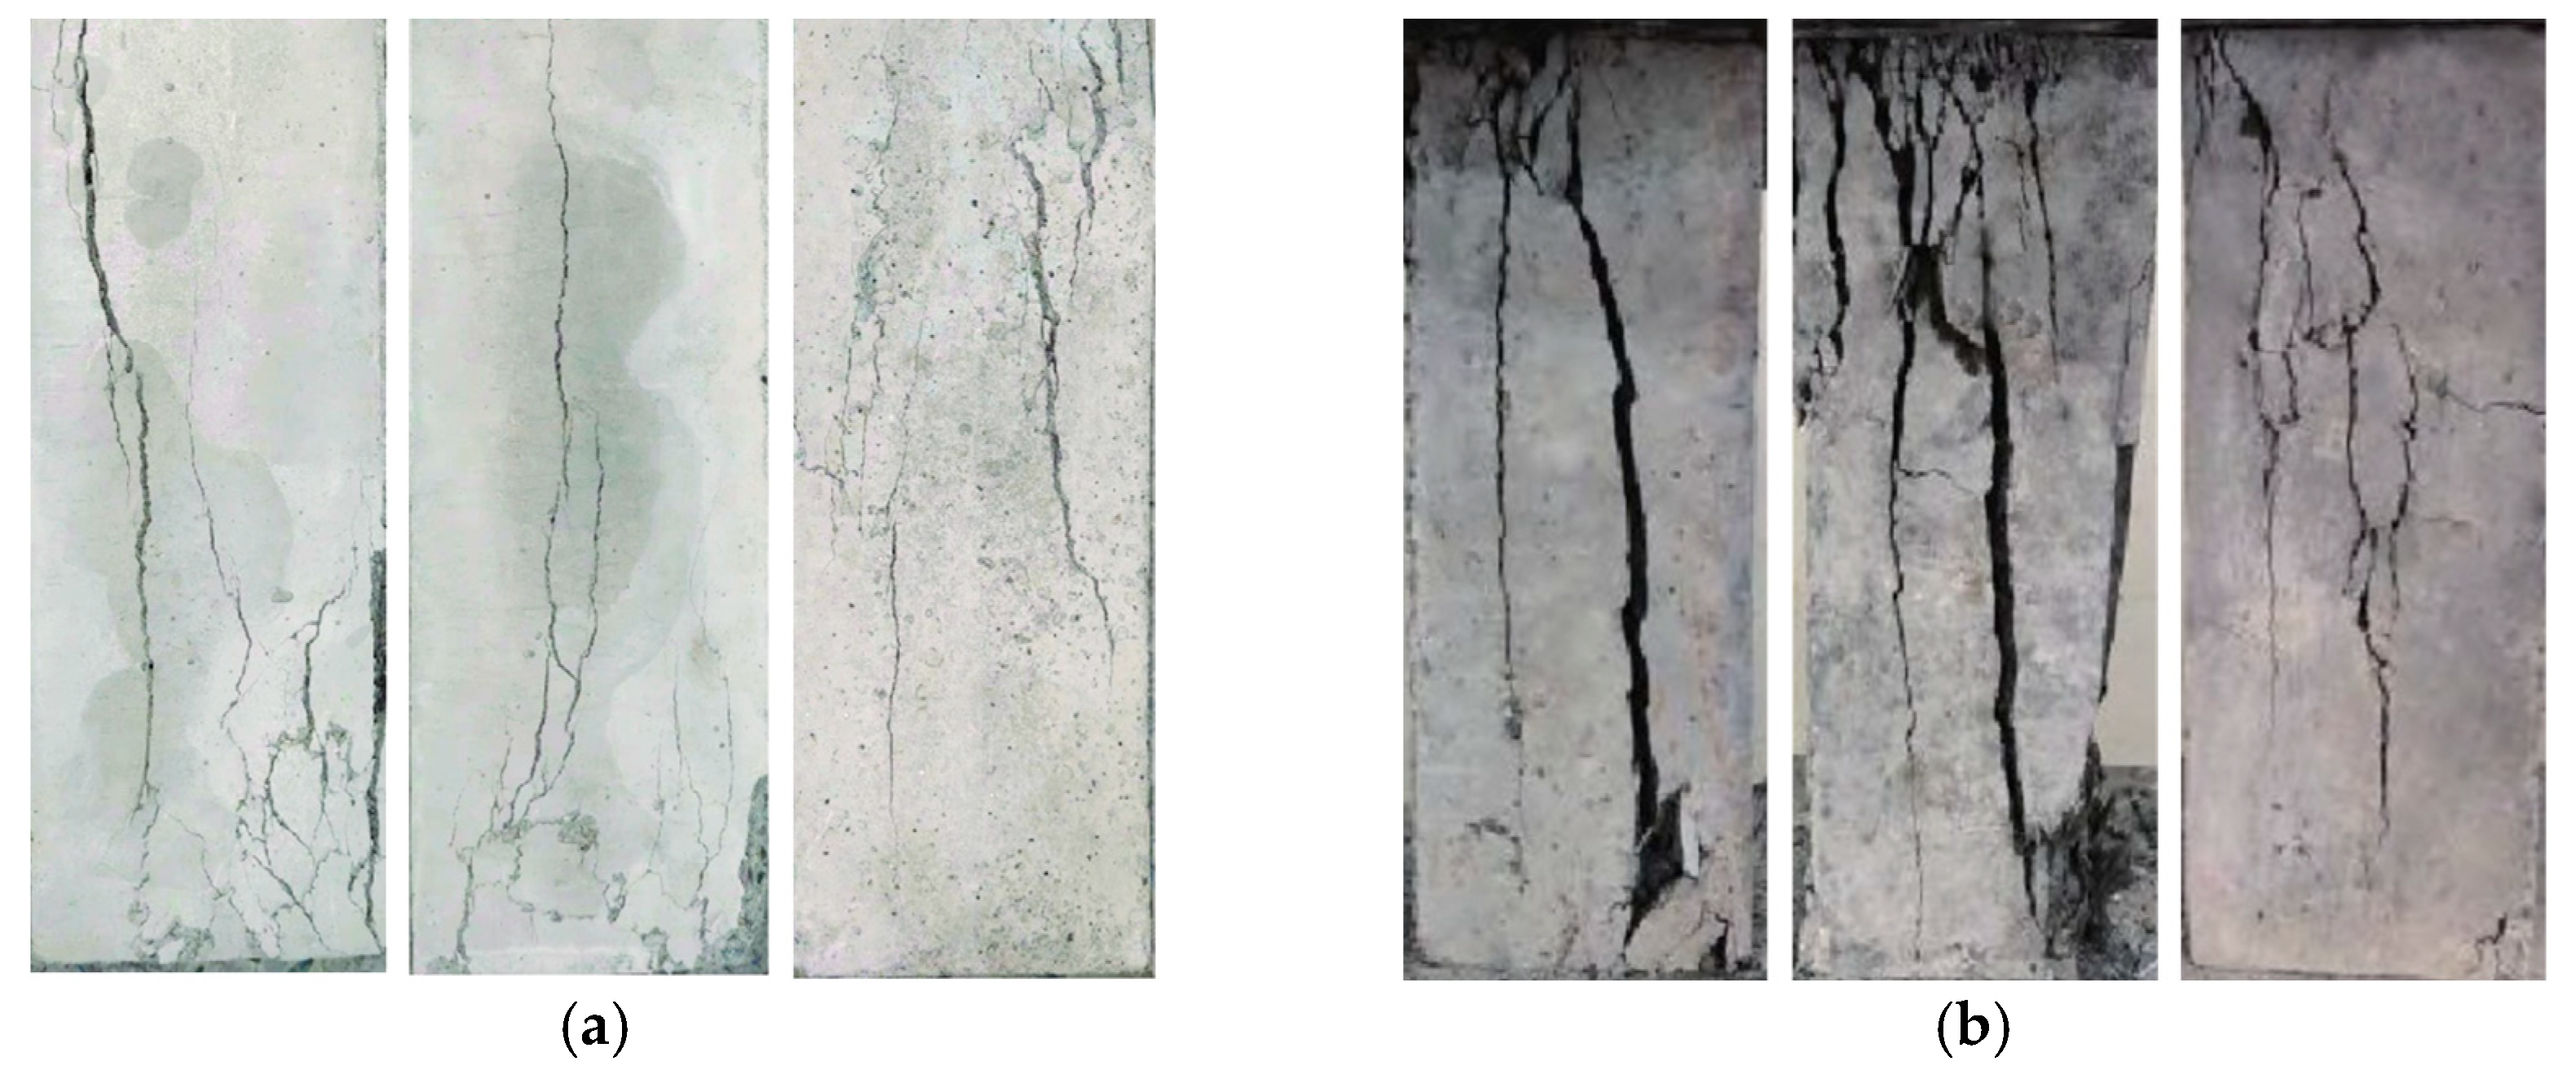
As illustrated in Figure 2, marked contrasts emerged in the failure mechanisms between conventional concrete and fiber-augmented versions. Unreinforced specimens demonstrated typical brittle fracture behavior, whereas their fiber-reinforced counterparts exhibited pronounced warning signs prior to failure and maintained structural integrity under loading. This performance enhancement principally stems from polypropylene fibers’ crack-spanning capability that restrains macro-crack development and coalescence, consequently substantially improving the material’s deformability and fracture energy absorption.

2.2.2. Stress–Strain Curve Analysis

The axial compressive stress–strain curves for all specimen groups are presented in Figure 3. Compared to plain concrete, the descending branches of the stress–strain curves for all fiber-reinforced concrete specimens were notably more gradual. This clearly demonstrates polypropylene fibers’ remarkable efficacy in augmenting concrete’s ductile behavior and fracture resistance.

2.2.3. Stress–Strain Curve Fitting

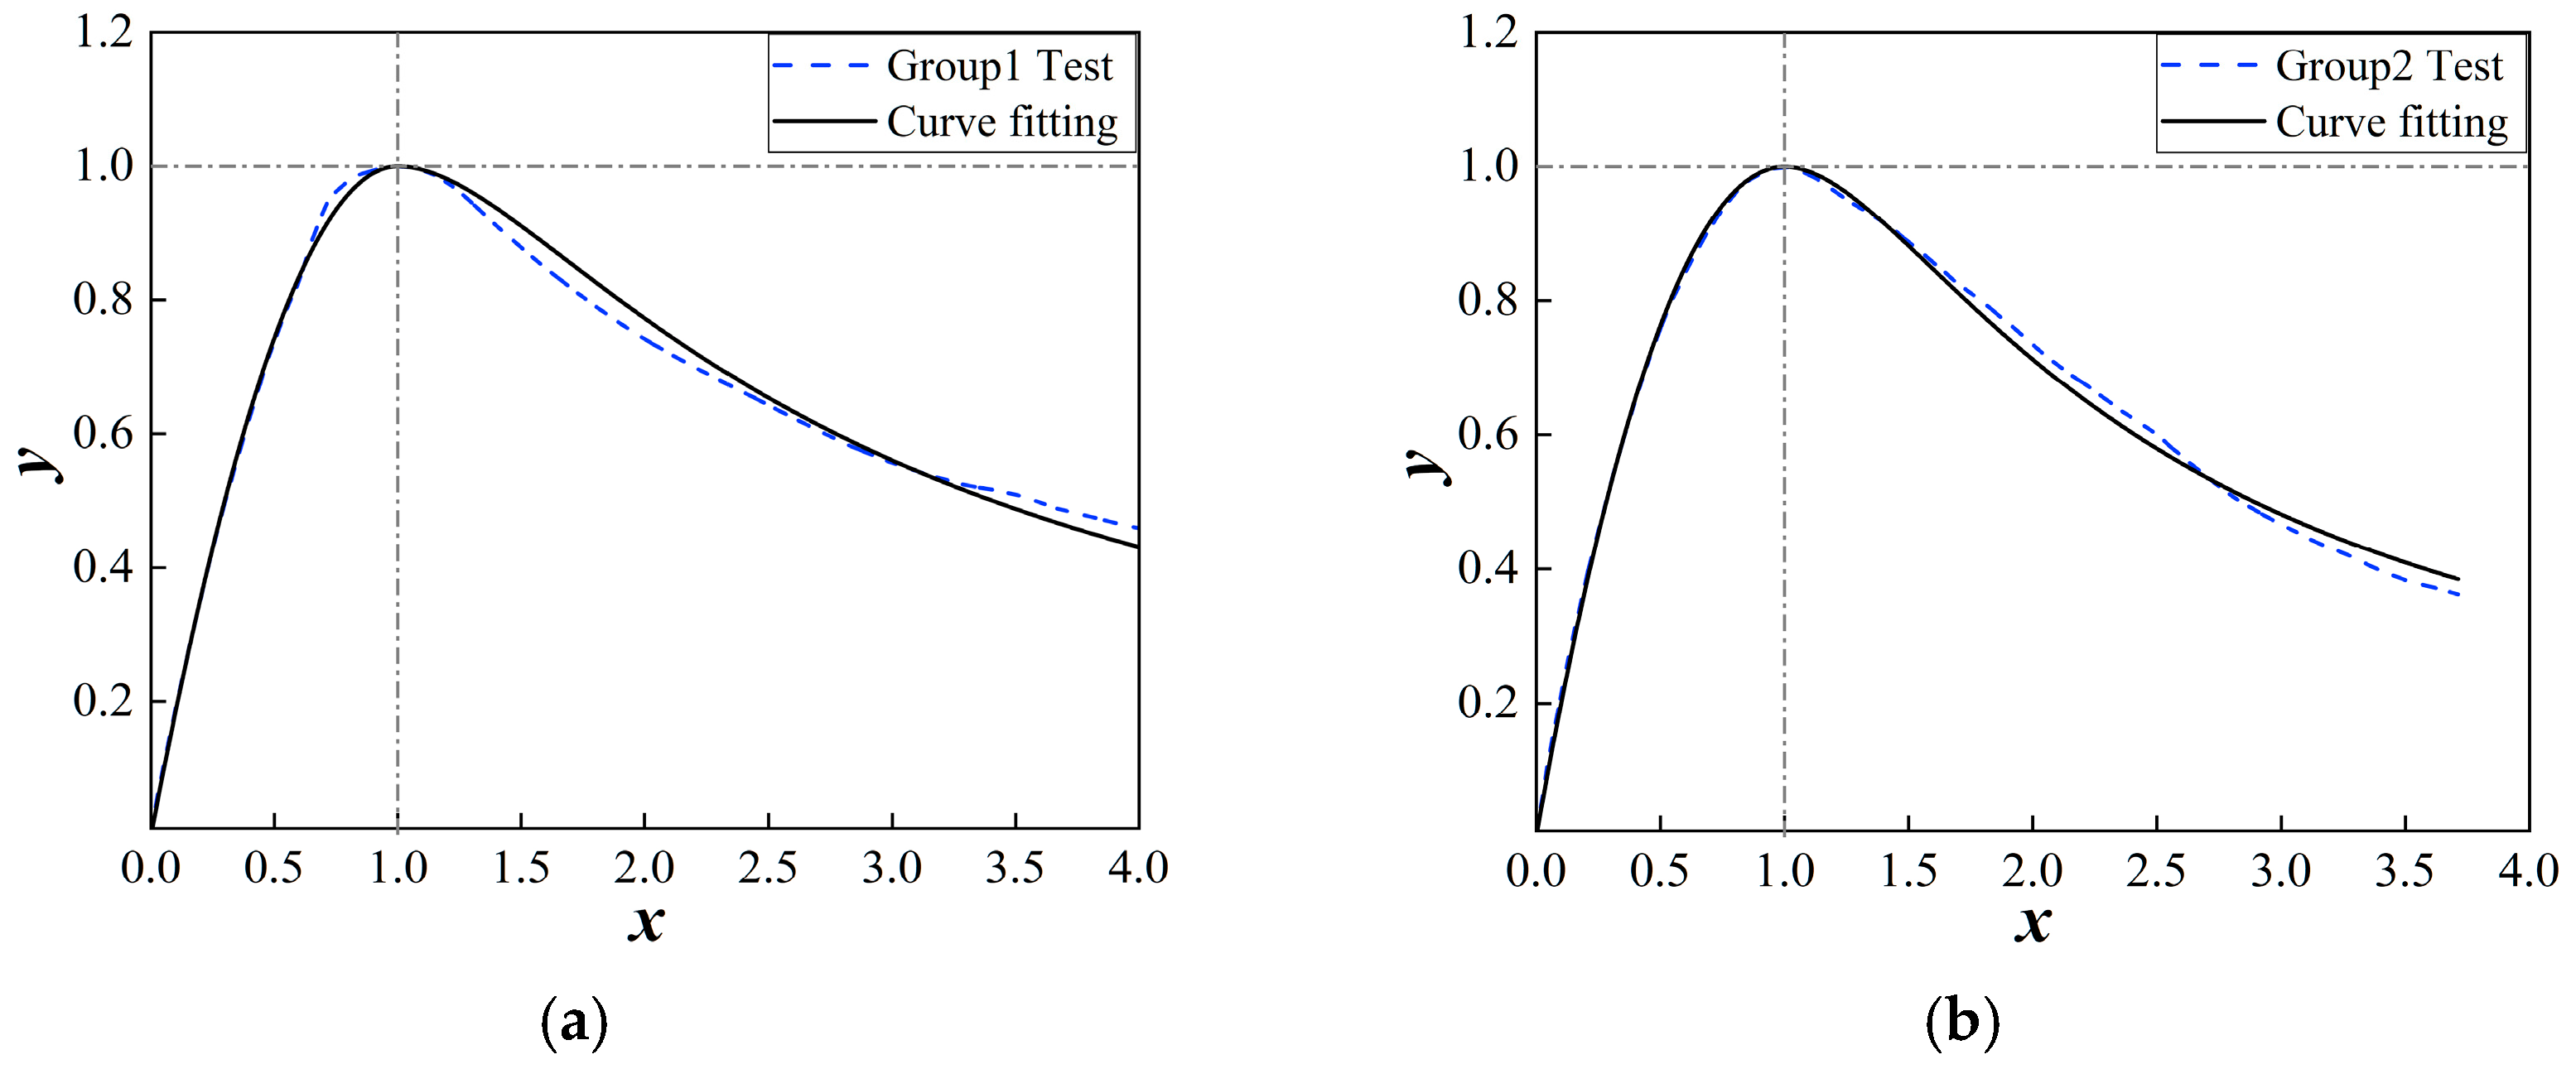
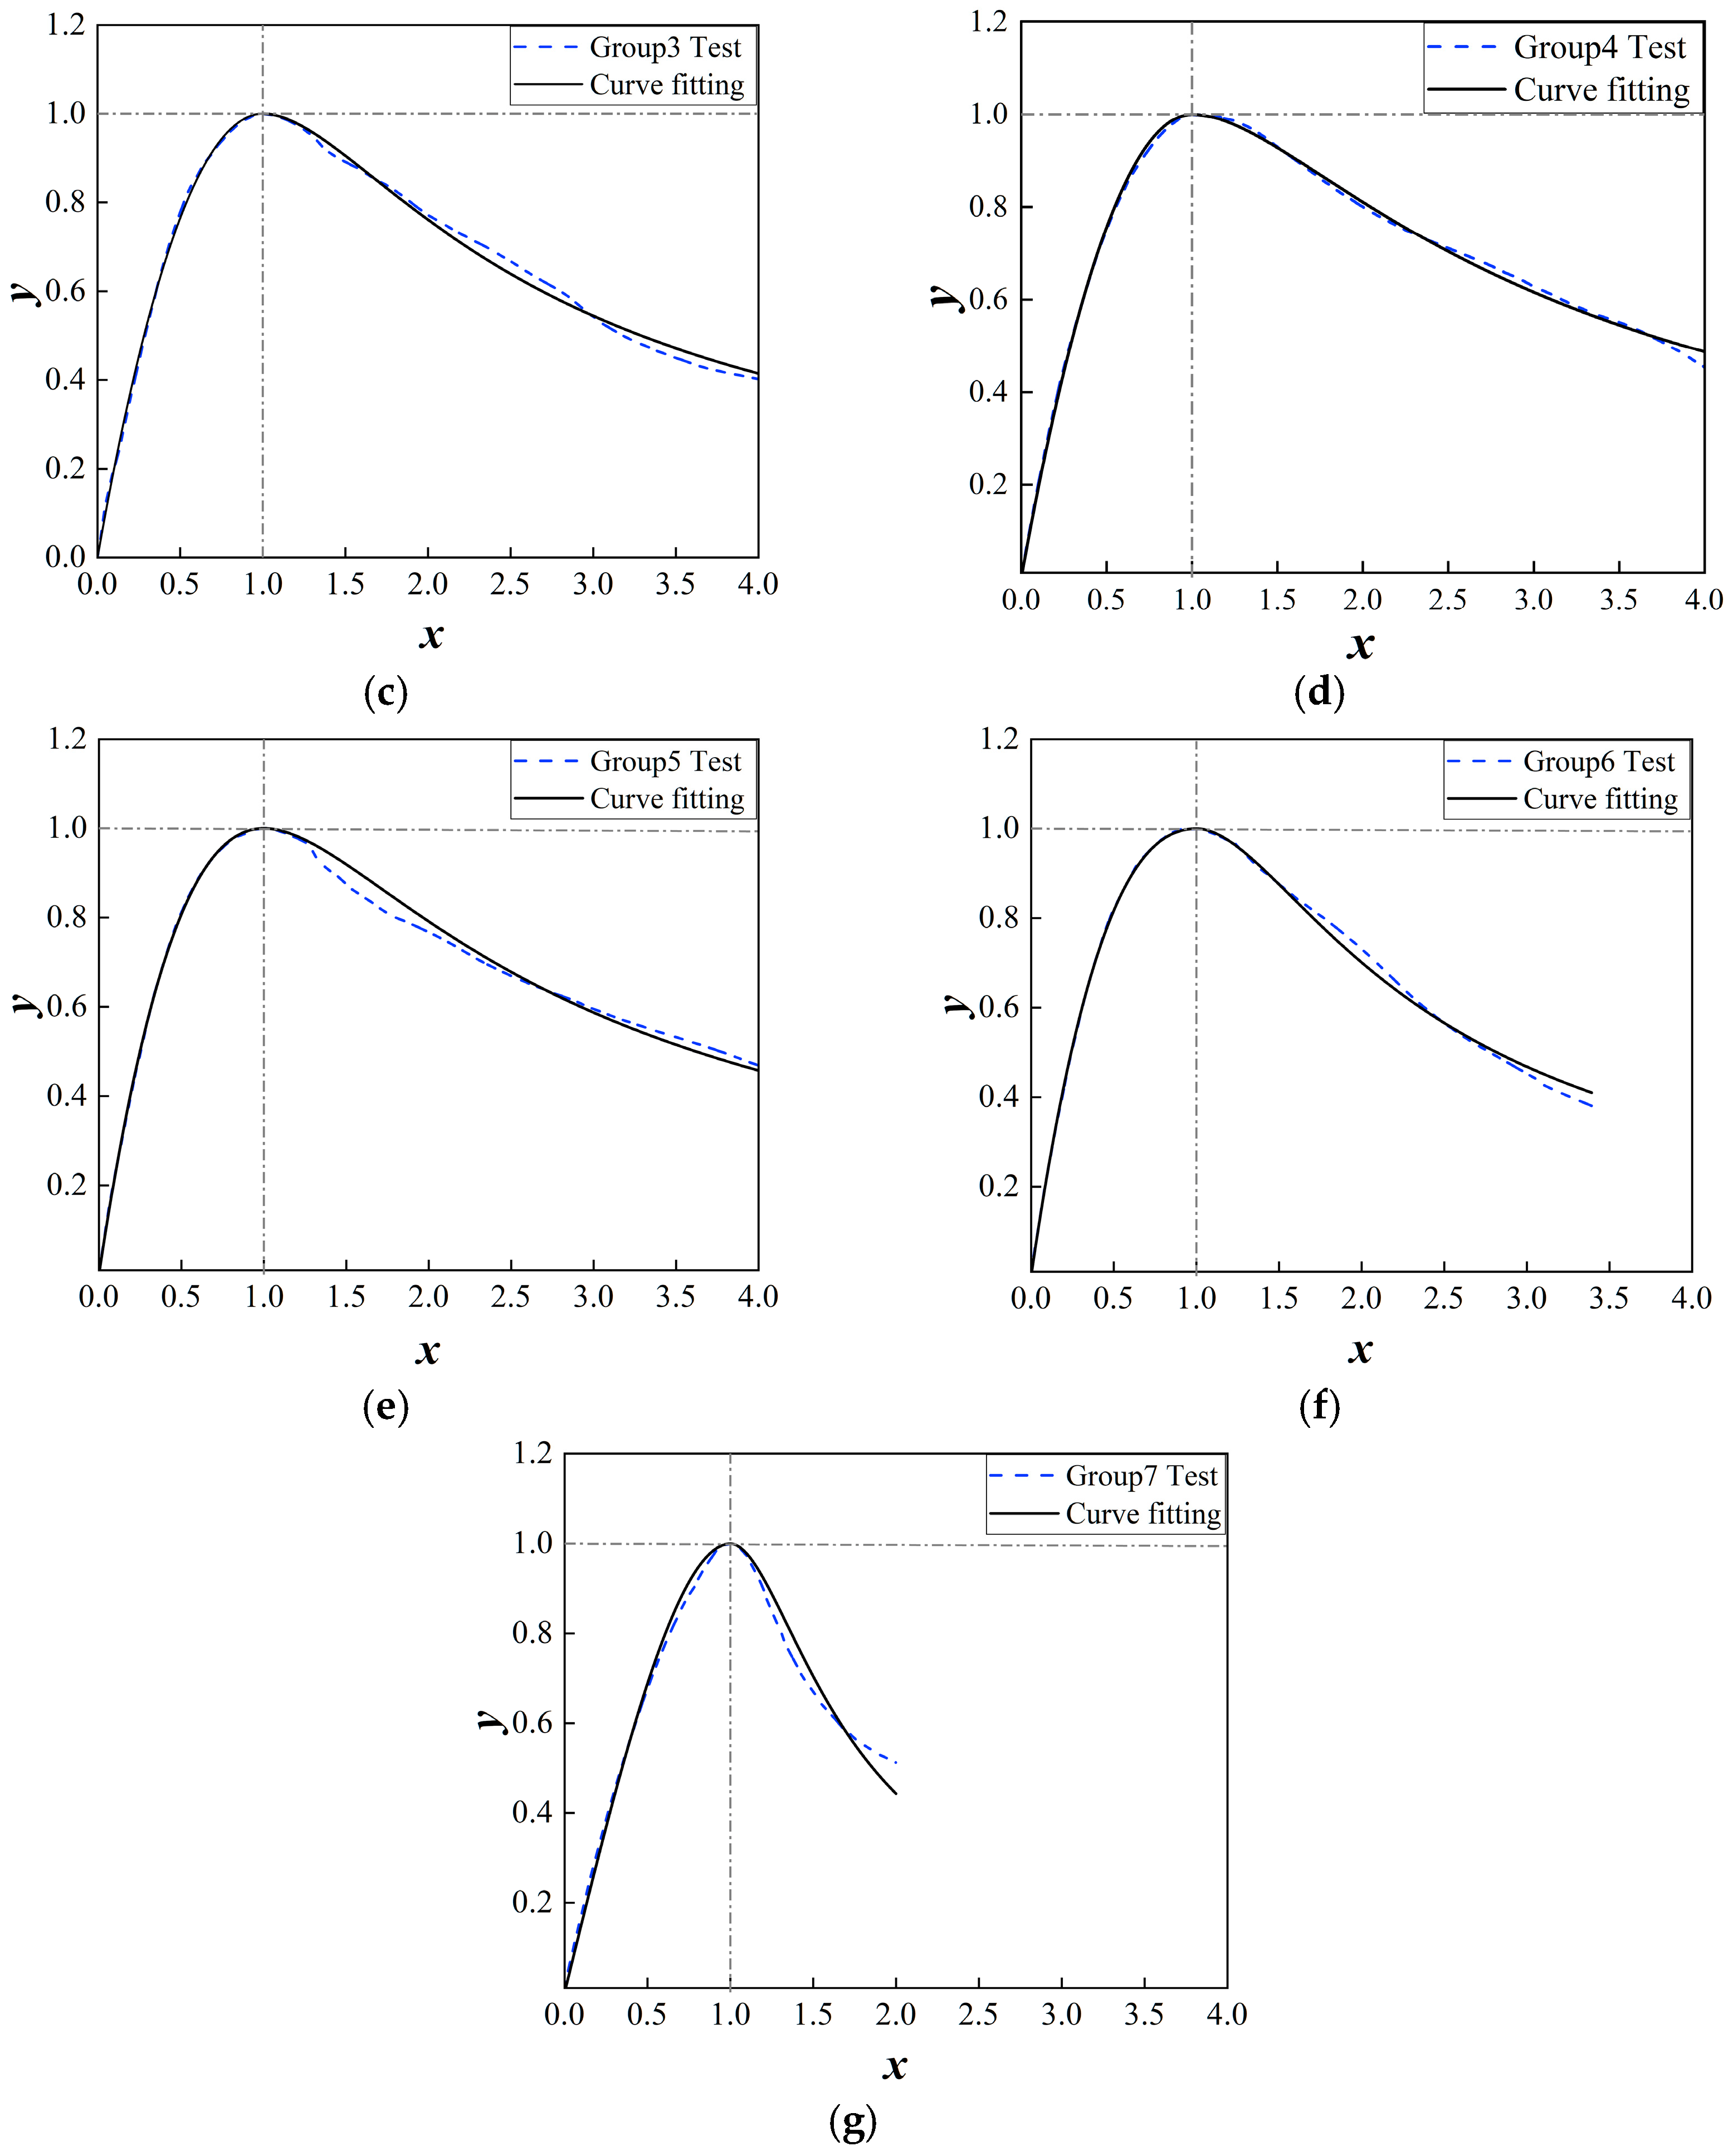
To accurately describe the mechanical behavior of the concrete with hybrid coarse and fine polypropylene fibers in this experiment, an axial compressive constitutive equation applicable to this material was established based on the classic model proposed by Guo Zhenhai [46].
y = a x + ( 3 2 a ) x 2 + ( a 2 ) x 3 0 x 1 y = x b ( x 1 ) 2 + x x > 1
y = σ / f c
x = ε / ε c
In the equation, σ is the axial compressive stress, fc is the uniaxial compressive strength, ε is the compressive strain, and εc is the peak compressive strain corresponding to fc; a is the shape parameter controlling the ascending branch of the curve, and b is the shape parameter controlling the descending branch.
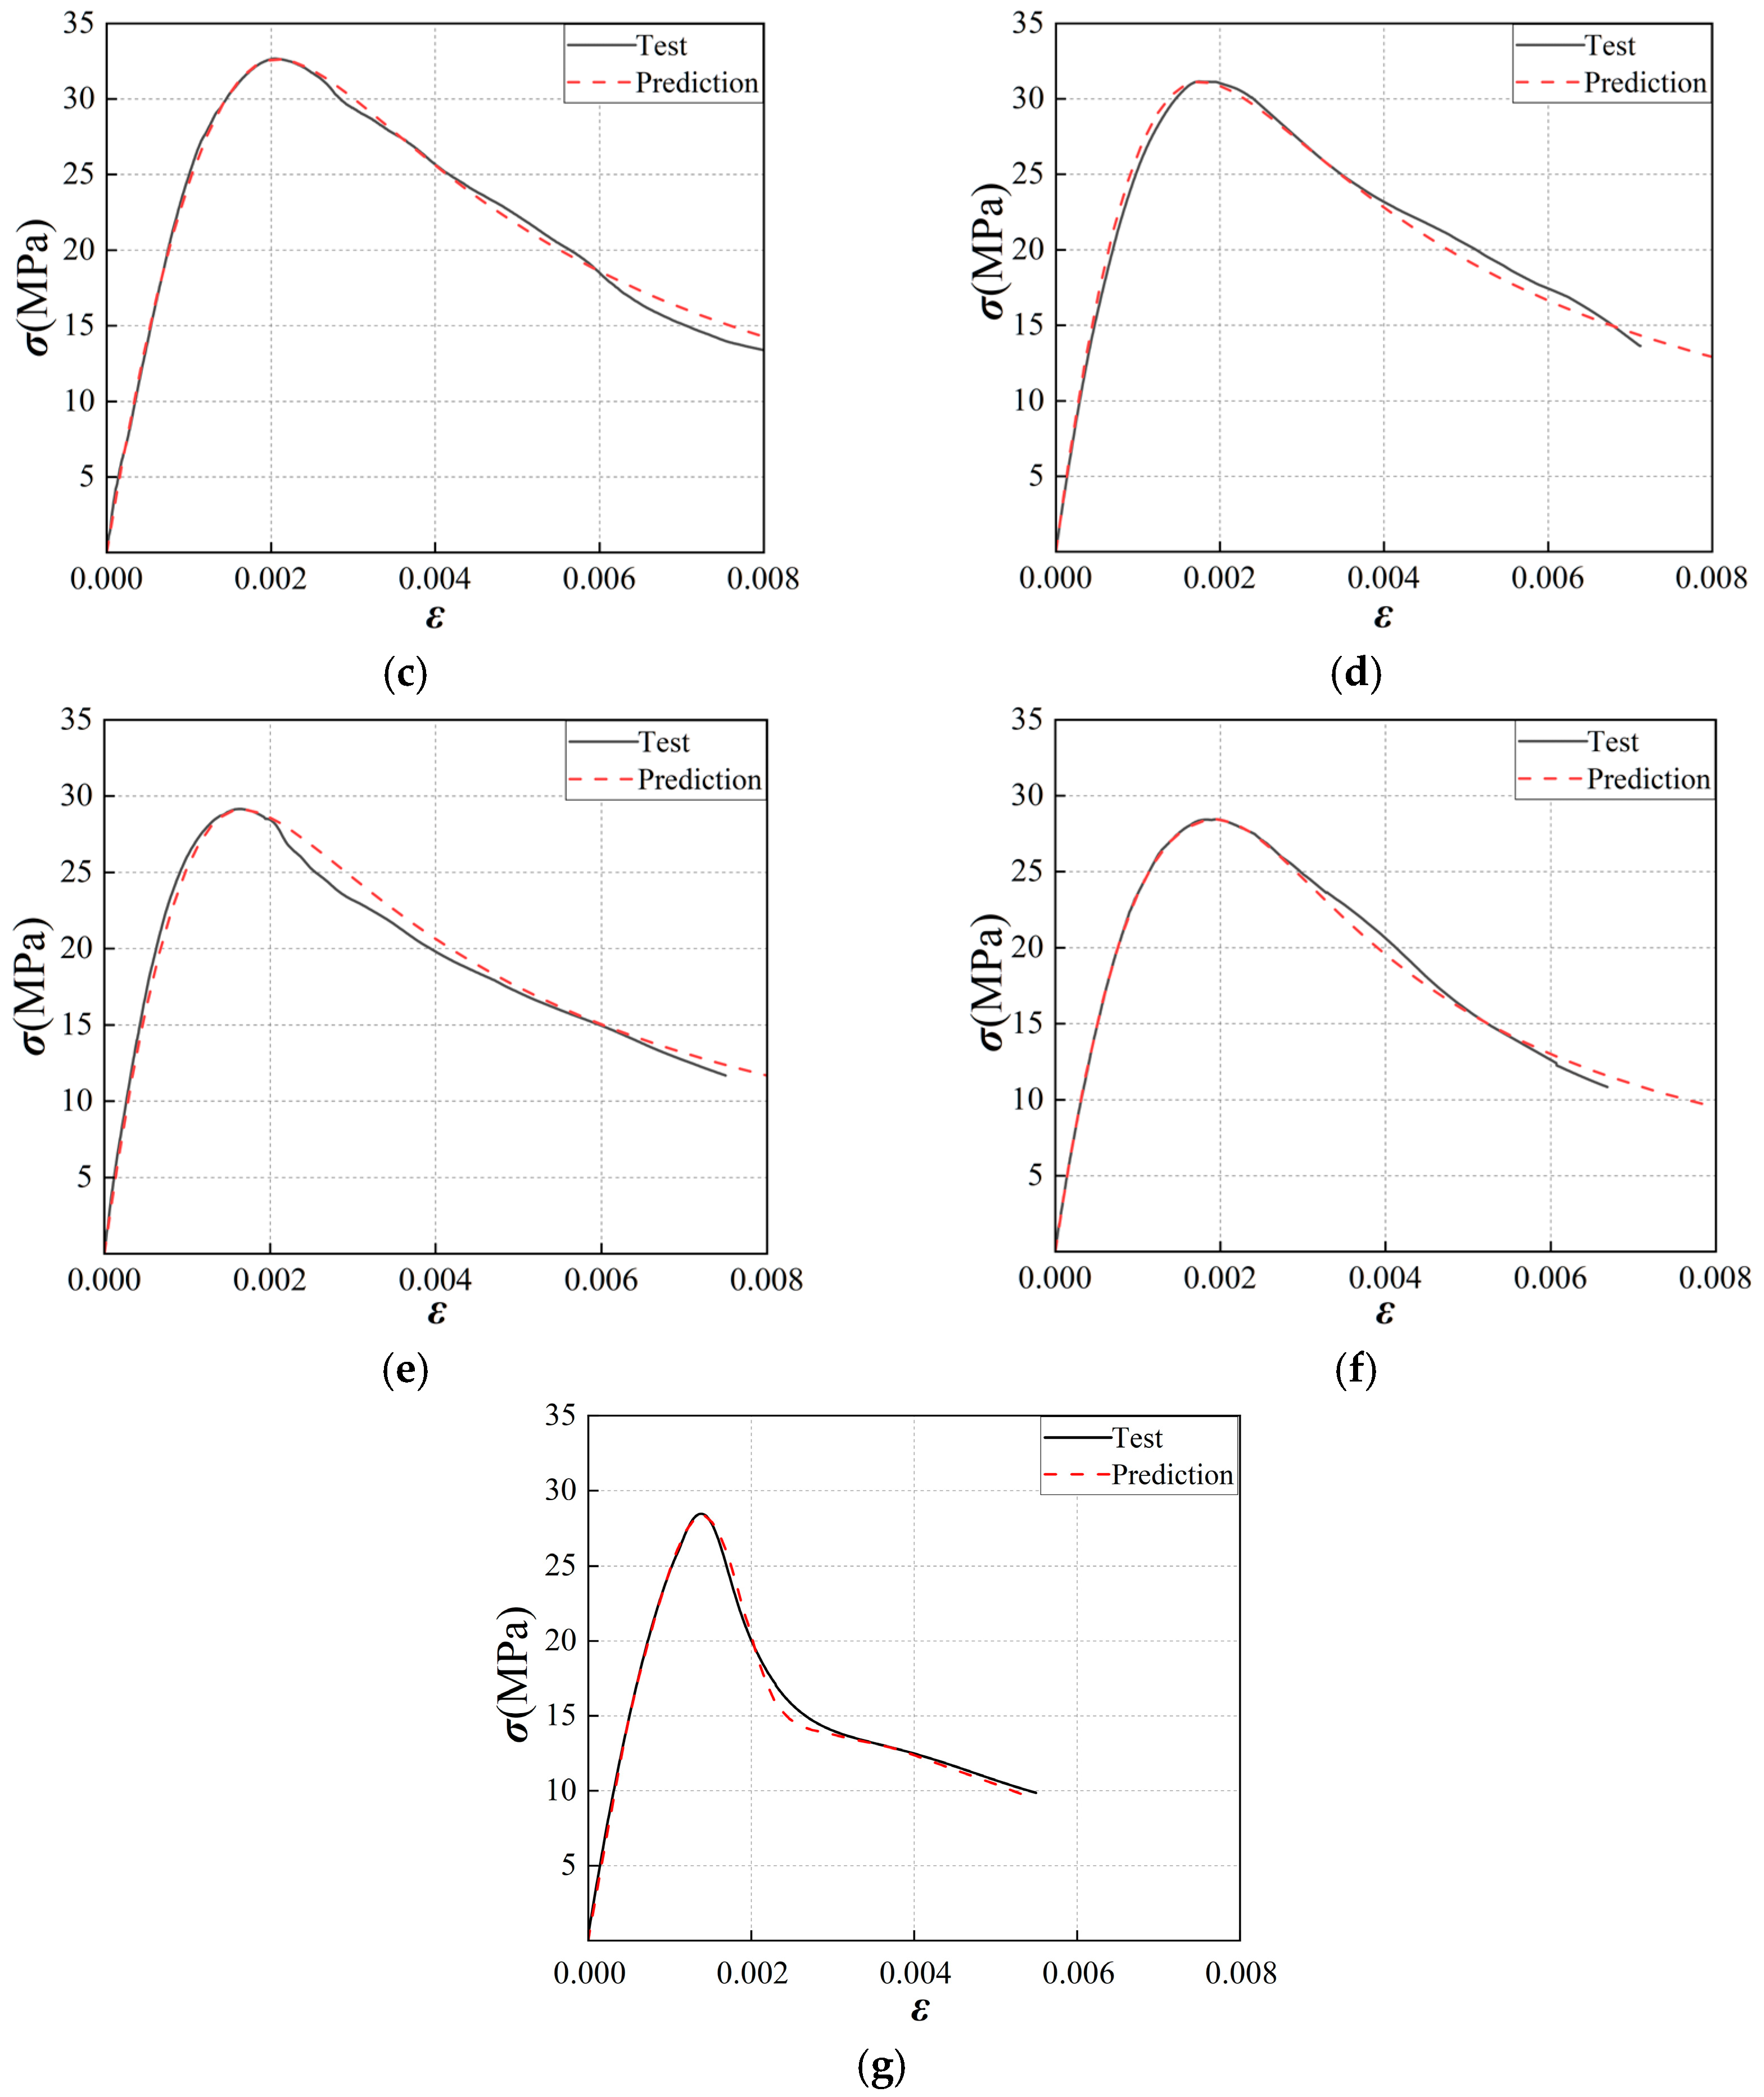
Based on the experimental results presented in Figure 3 and utilizing Equation (1), nonlinear fitting was performed on each set of experimental data using MATLAB 2024b. The resulting fitted curves are shown in Figure 4. This fitting process yielded parameters ‘a’ and ‘b’ in Equation (1), which are related to the concrete’s compressive strength and fiber characteristics, respectively.
a = 5.4268 + 4.8677 f 0.08454 + 1.5425 λ f
b = 1.6721 + 2.1425 f 0.07124 + 2.4527 λ f 3.4212 1.4542 λ f
where f represents the axial compressive strength of concrete; λf is the fiber characteristic value; λf = ρflf/df, ρf is the volumetric content of coarse polypropylene fibers; and lf/df is the aspect ratio of coarse polypropylene fibers.
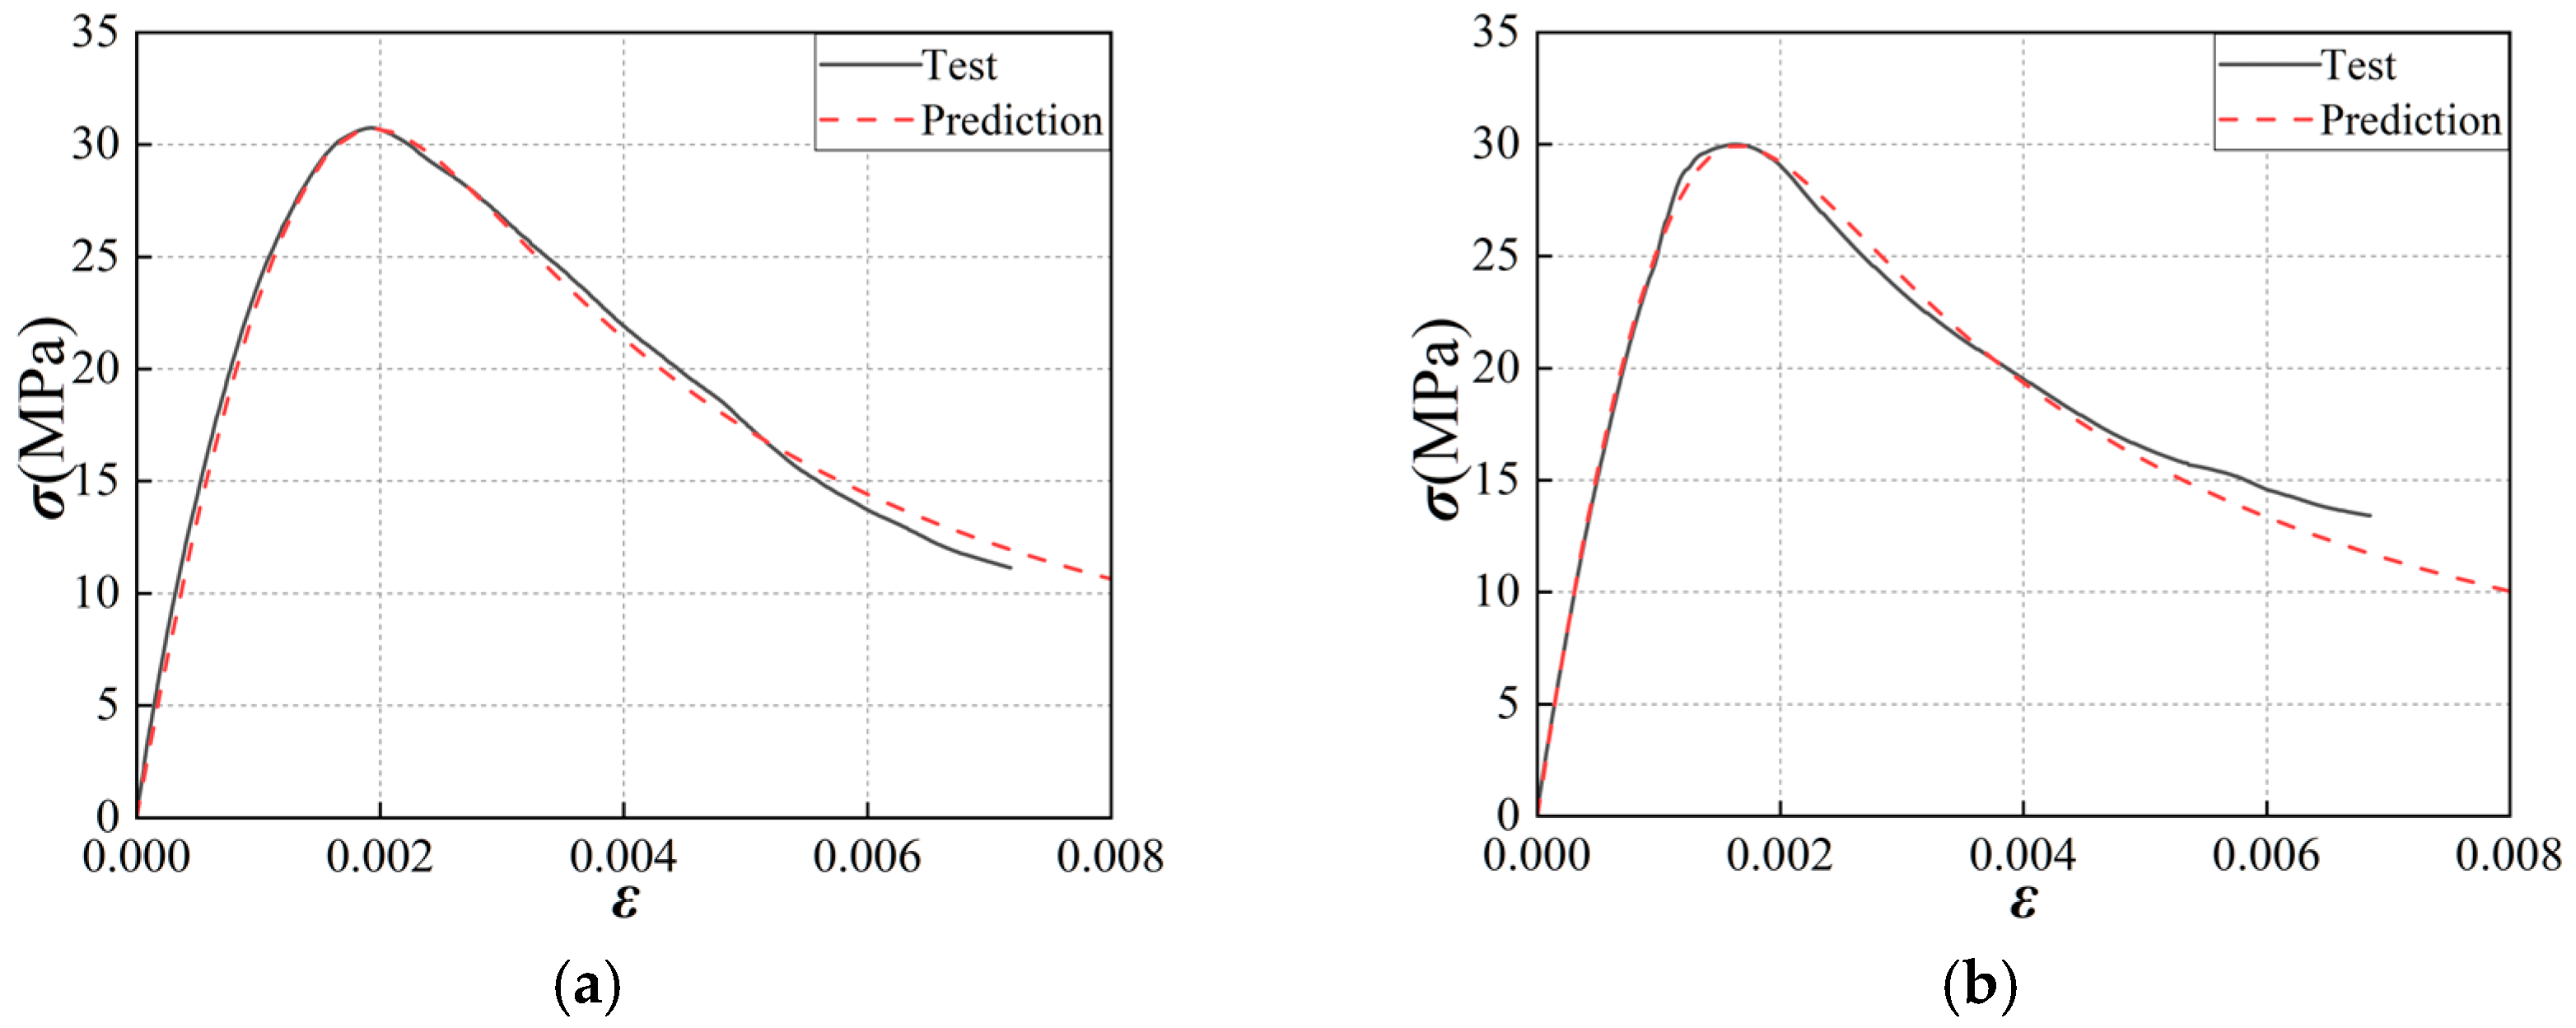
To verify the constitutive model’s accuracy, fitted parameters from empirical equations were incorporated into the theoretical framework. The derived analytical curves were subsequently evaluated against experimental data, as presented in Figure 5.
The mean ratio of the simulated to experimental peak stress of concrete was 1.004, with a variance of 0.012. The results demonstrate that the proposed calculation formulas for the shape parameters and the corresponding constitutive model can predict the compressive stress–strain behavior of PFRC with reasonable accuracy and can be applied in subsequent finite element simulation analyses of PFRC composite wall panels.

3. Finite Element Model Development and Validation

3.1. Wall Panel Design

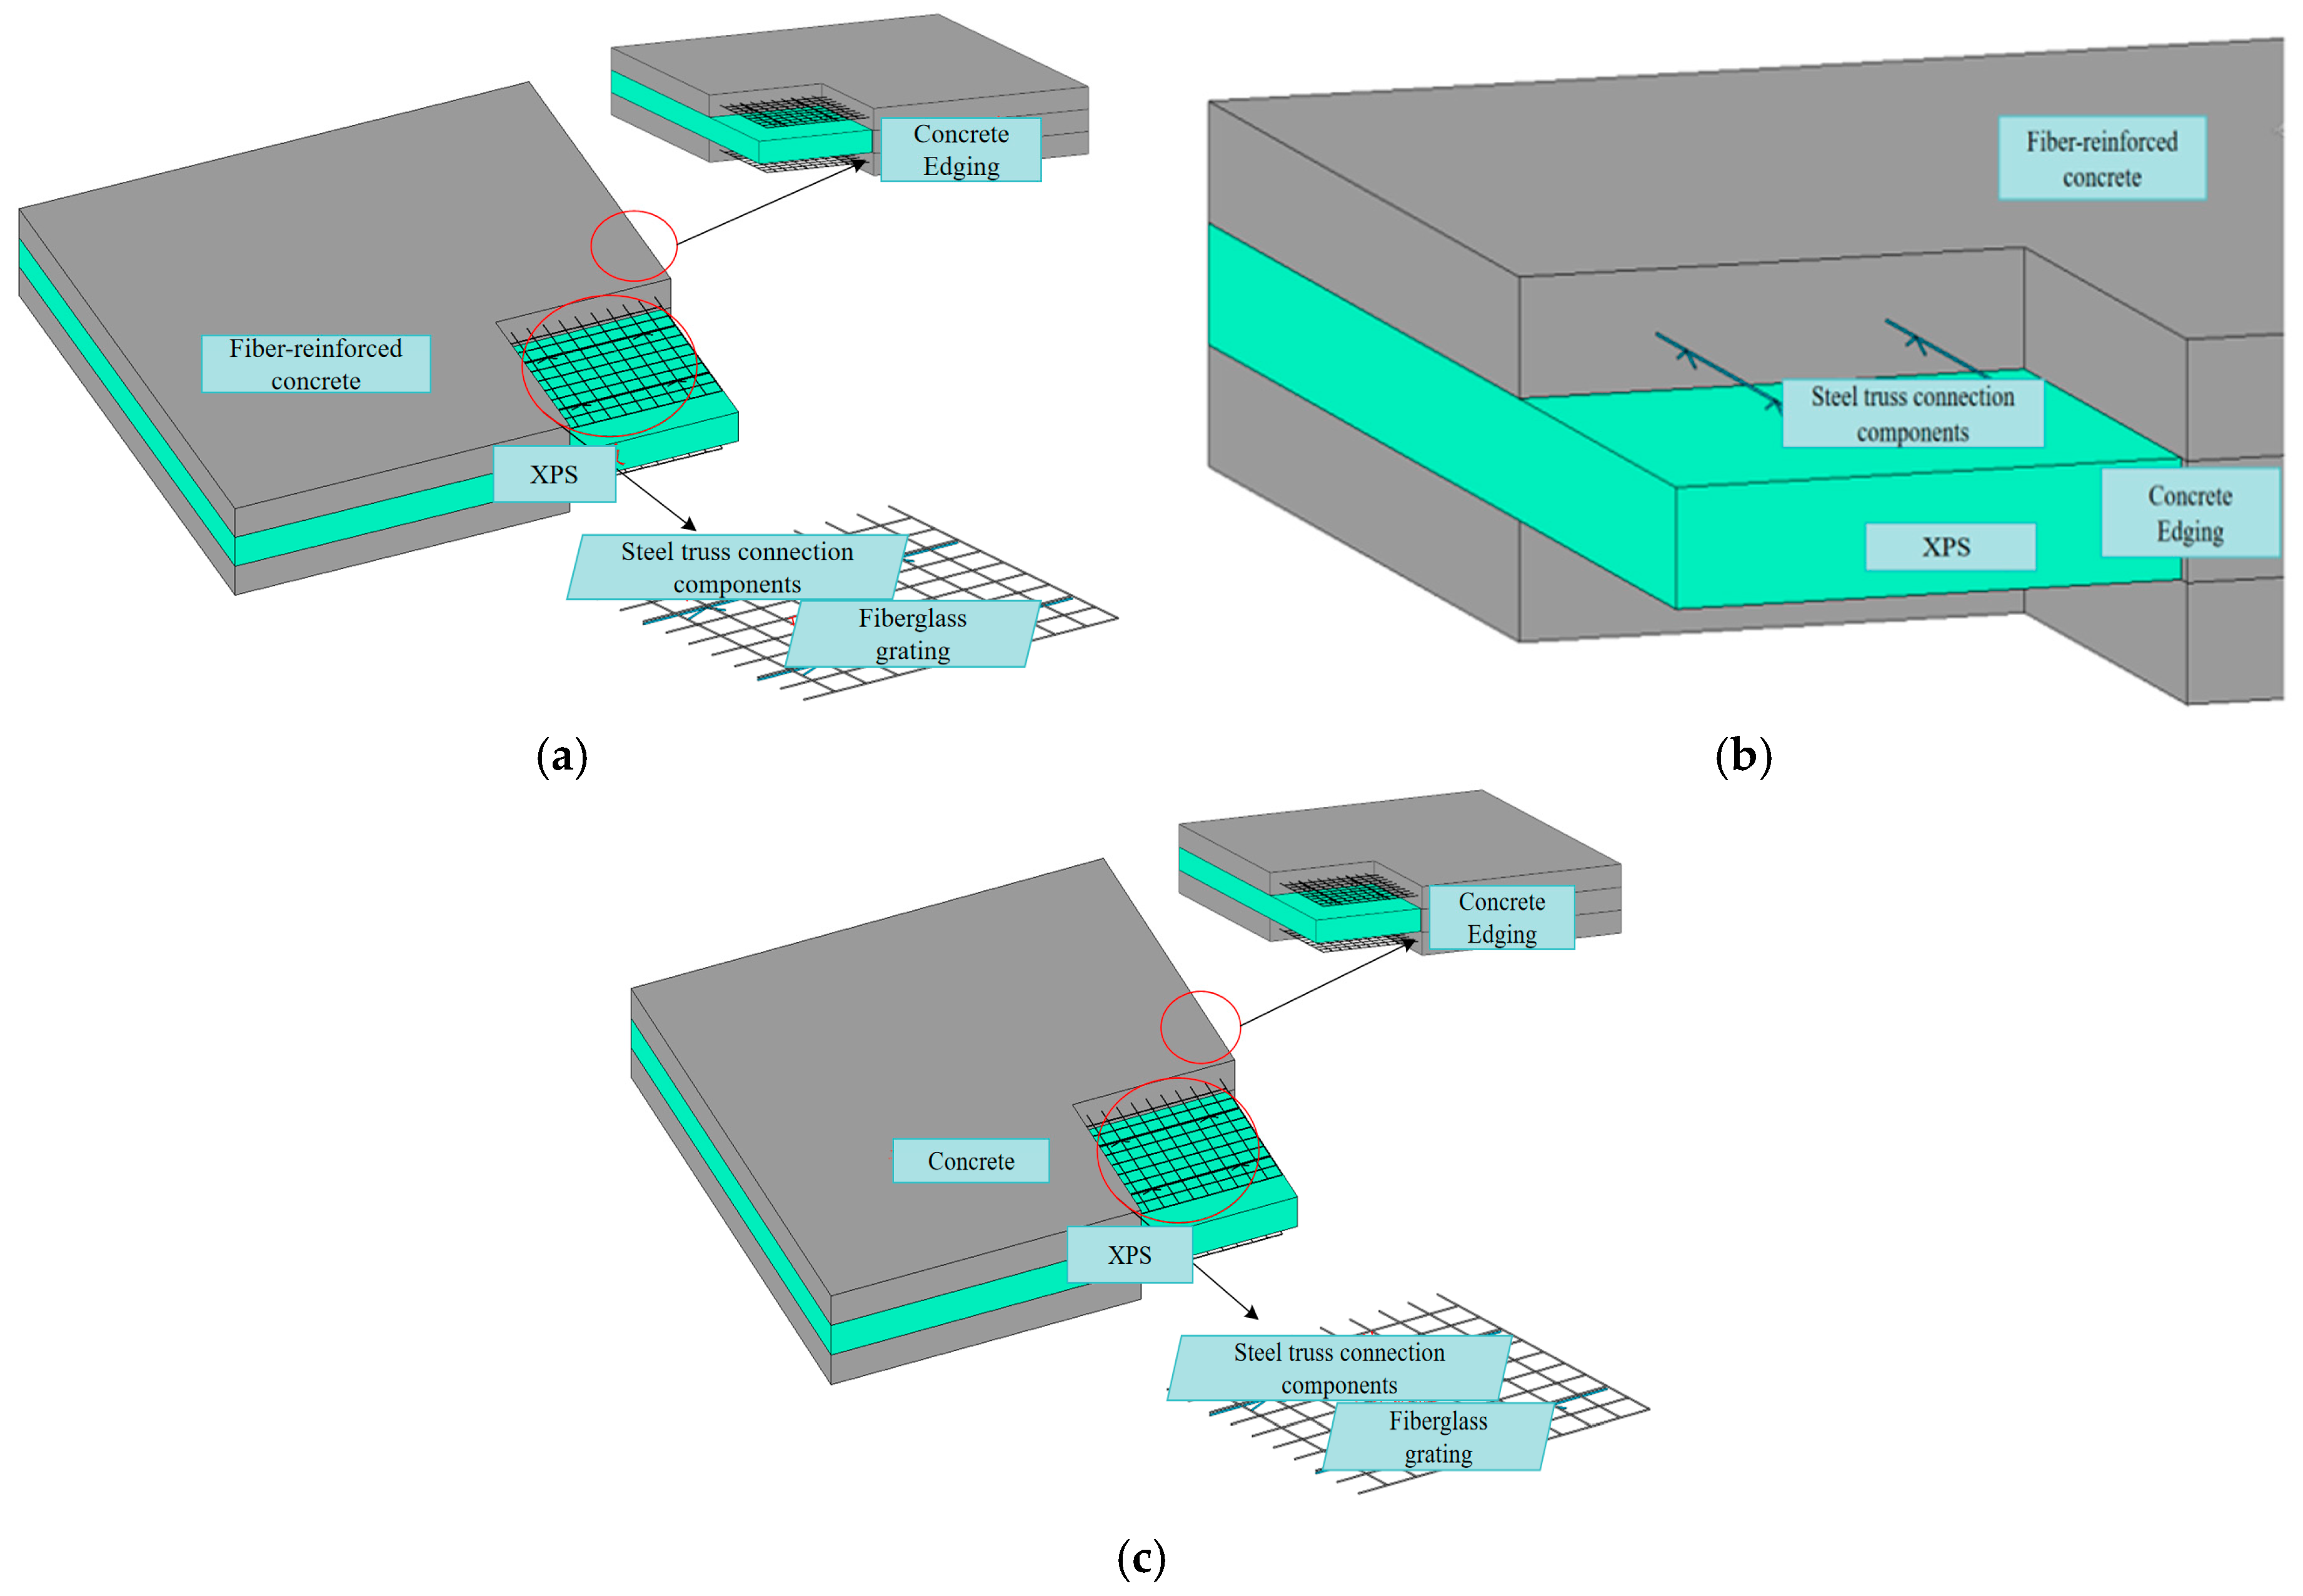
To examine how PFRC and glass fiber grids affect composite wall panel behavior, three types of wall panels were designed for numerical simulation analysis. Specifically, these included a fiber-reinforced concrete composite wall panel without steel mesh (FCSP), a PFRC composite wall panel reinforced with glass fiber grids (G-FCSP), and a plain concrete composite wall panel reinforced with glass fiber grids (G-CSP). The wall panels measured 4000 mm × 3000 mm × 150 mm (length × width × thickness). The detailed construction of the wall panels is illustrated in Figure 6.

3.2. Material Constitutive Relationships

3.2.1. Fiber-Reinforced Concrete

The concrete was modeled using the Concrete Plasticity Damage Model in ABAQUS 2020. The dilation angle was set to 36° and the eccentricity to 0.1, while the flow potential deviation and the fb0/fc0 ratio were kept at their default software values. The viscosity parameter μ was set to 0.001. The constitutive relationship under compression adopted the validated model presented in Section 2.2.3, expressed by Equations (1)–(5). The tensile constitutive behavior was defined by the tensile fracture energy GF [47] and the cracking stress σto.
G F = a × ( f c / 10 ) 0.7 × 10 3 N / mm
σ to = 0.26 × 1.25 ( f c ) 2 / 3
a = 1.25 × d max + 10
where GF represents the tensile fracture energy of concrete; σto is the cracking stress of concrete; dmax is the maximum aggregate size of concrete, taken as 20 mm in this study; and fc is the equivalent cylindrical compressive strength of the concrete.
The damage factor was calculated based on the Sidoroff principle of energy equivalence.
d = 1 σ E ε c
where d is the compressive damage factor of concrete, σ is the concrete stress, E is the elastic modulus, and εc is the compressive strain of concrete.
Concrete exhibits strain rate effects under impact loading. For fiber-reinforced concrete, the strain rate sensitivity varies with different fiber dosages and dimensions, making the derivation of a unified constitutive model that accounts for these effects rather complex. This study involves impact simulations at low strain rates, where the influence of strain rate effects is relatively minor. Therefore, in the subsequent dynamic finite element analysis, the concrete strain rate effect is approximately considered by referring to the strength increase factors suggested in the Eurocode CEB-FIP 2010 [48].
D I F = σ cd / σ cs = ( ε · cd / ε · cs ) 0.014 ε · cd     30 s 1 0.012 ( ε · cd / ε · c d ) 1 / 3 ε · cd   >   30 s 1
where σcd and σcs represent the compressive strengths of concrete under dynamic and static loading, and ε · cd and ε · cs denote the compressive strain rates of concrete under dynamic and static loading, respectively, with ε · cs considered as −30 × 10−6 s−1.
D I F = σ td / σ ts = ( ε · td / ε · ts ) 0.014 ε · td 1 s 1 0.0062 ( ε · td / ε · ts ) 1 / 3 ε · td > 1 s 1
where σtd and σts represent the tensile strengths of concrete under dynamic and static loading, respectively. ε · td and ε · ts denote the tensile strain rates of concrete under dynamic and static loading, respectively, with ε · ts considered as −1 × 10⁻⁶ s−1.

3.2.2. Steel Truss and Glass Fiber Mesh

In the steel truss, neither the high-strength steel bars (CRB550) nor the stainless-steel diagonal members (measured Rp0.2 = 510 MPa) exhibited a distinct yield point; therefore, an elastic–perfectly plastic constitutive model without a strain-hardening segment was adopted, where Rp0.2 is the nominal yield point for high-strength steel.
σ = E s ε 0 ε ε y f y ε > ε y
The strain rate effect for steel was described using the Cowper–Symonds model [49], which was developed for metals under low to medium strain rates.
σ y / σ 0 = 1 + ( ε · / C ) 1 p
where C and p are material-dependent constants, which for steel are taken as 40.4 s−1 and 5, respectively.
The glass fiber geogrid (model GGA5050) has a mesh size of 25.4 mm × 25.4 mm. Its longitudinal and transverse tensile strengths are both not less than 50 kN/m, and its elongation at break is not greater than 3%. The material’s elastic modulus is 35 GPa, and its Poisson’s ratio is 0.25. Although glass fiber geogrid is typically considered a ductile material [50], an elastic constitutive model was adopted in this study for simplification of analysis and to account for its deformation characteristics under specific application conditions. Existing research indicates that glass fiber geogrids also exhibit strain rate effects [51]. However, considering that the tensile strength of GFRP materials does not significantly change under low strain rates [52], and given that this simulation primarily focuses on its macroscopic mechanical response, strain rate effects are neglected in this simulation.

3.2.3. Insulation Material

The XPS insulation board has a negligible contribution to the overall mechanical performance of the wall panel and primarily serves as thermal insulation. Consequently, a linear elastic model was used (E = 4.66 MPa, υ = 0.05), and its strain rate effect was not considered.

3.3. Element Types and Meshing

The concrete and XPS insulation board in the wall panel were modeled using C3D8R elements, while the steel truss was modeled with B31 beam elements. As the glass fiber mesh is thin and assumed to carry only tensile forces with negligible bending stiffness, it was modeled using T3D2 truss elements. The model had a global mesh size of 50 mm, which was locally refined to 25 mm in the impact zone to balance computational accuracy and efficiency.

3.4. Contact Interactions and Boundary Conditions

The boundary conditions for the wall panel were set according to the impact performance test apparatus described in the “Standard for Test Methods of Building Wall Panels”. The contact in the model primarily involves the constraints from the fixed supports and the interaction between the impactor and the panel’s top surface. In the finite element model, surface-to-surface contact was defined between the fixed supports and the wall panel. The tangential behavior was modeled using a penalty friction coefficient of 0.76 [53], and the normal behavior was set to “Hard” Contact. The stiffness of the impactor and the fixed supports is much greater than that of the wall panel, and their own deformations are considered negligible in this simulation. Therefore, both were modeled as analytical rigid bodies. The specific modeling process is shown in Figure 7.

3.5. Model Validation

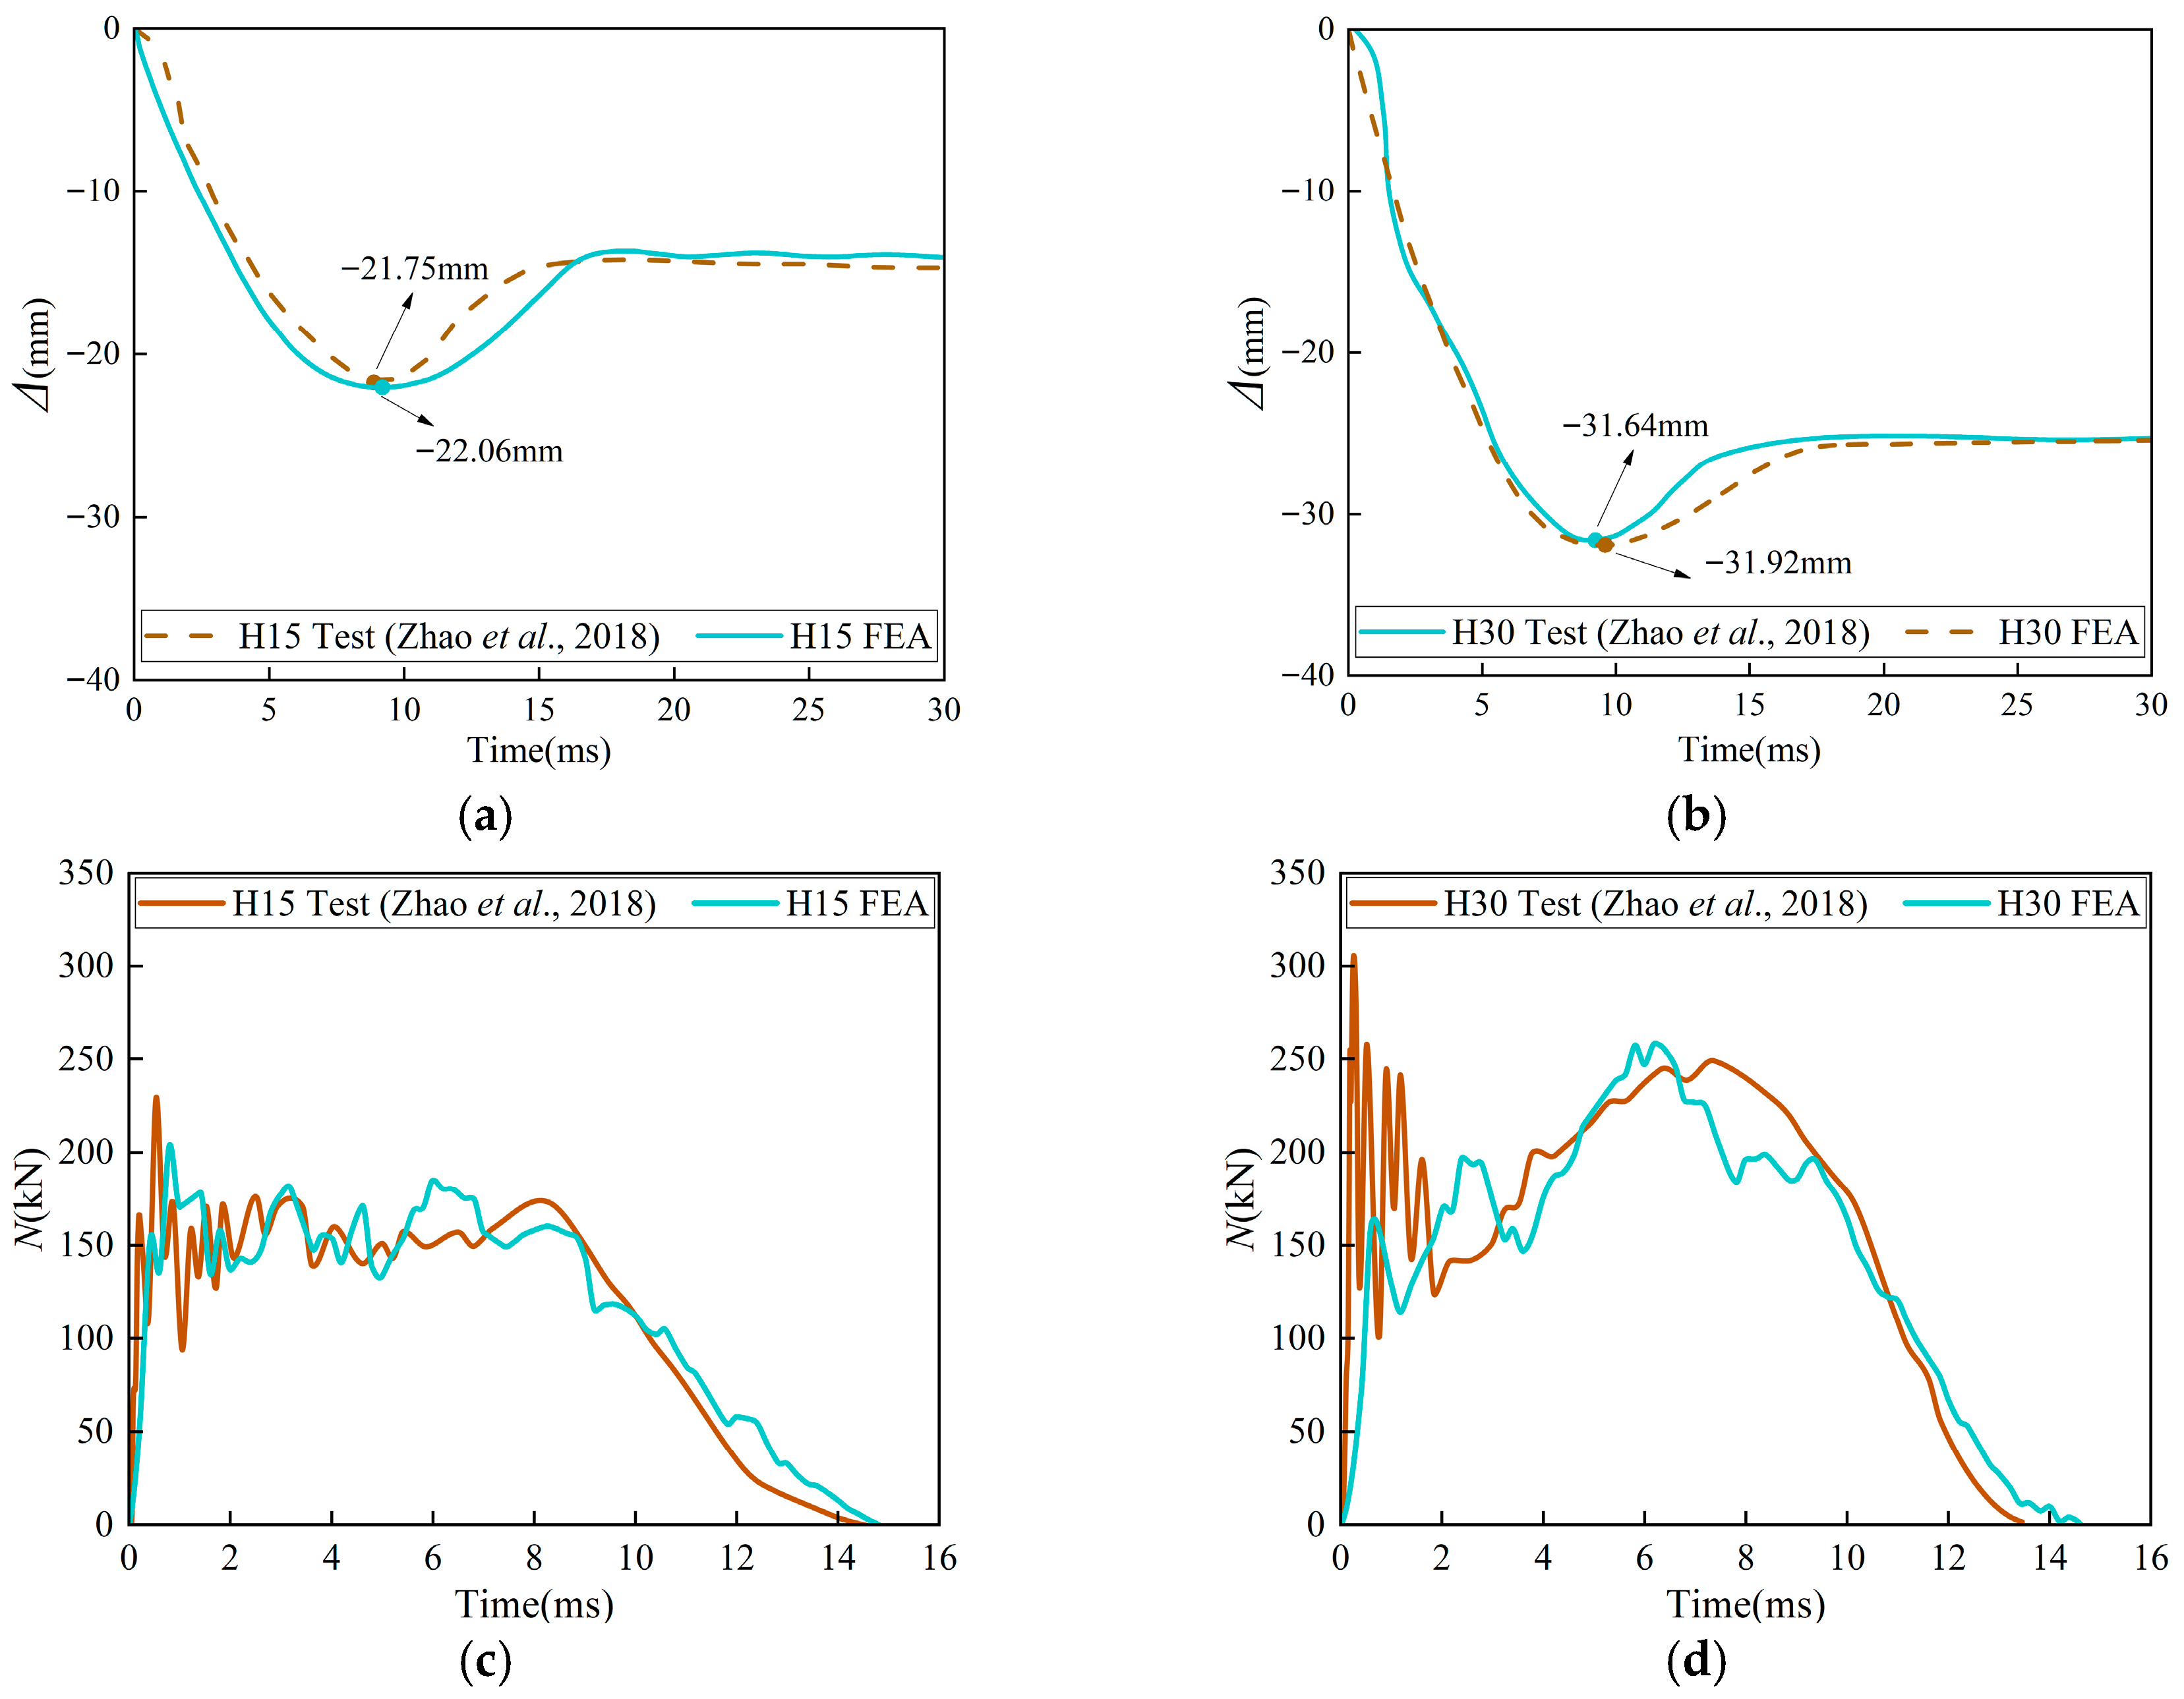
Figure 7 illustrates the numerical analysis model constructed in this study. To validate the model’s accuracy, a composite wall panel test specimen from the literature [54], structurally similar to the object of this study, was selected for simulation replication. The established model is consistent with the composite wall panel used in the experiments described in the literature [54], with its relevant parameters shown in Figure 8. The impact parameters for the replicated specimen are presented in Table 4. The simulated displacement–time and impact force–time history data were analyzed against experimental benchmarks from published studies, as illustrated in Figure 9. The peak displacement obtained from specimens H15 and H30 in reference [54] exhibited an error within 5% when compared to the finite element simulation results, and the average error for the impact force was mostly within 15%. The computational results indicate that the outcomes derived from the finite element model exhibit excellent alignment with the experimental findings, thereby validating that the modeling methodology employed in this research possesses the capability to accurately simulate the dynamic response characteristics of wall panels subjected to impact loading conditions.

4. Analysis of Simulation Results

Based on the validated model, impact response analyses were conducted on the three wall panels designed in Section 3.1 (G-FCSP, FCSP, G-CSP) using Abaqus 2020 finite element software. The baseline impact scenario was defined as a 120 kg impactor in free fall from a height of 2 m.

4.1. Displacement-Time History Curves

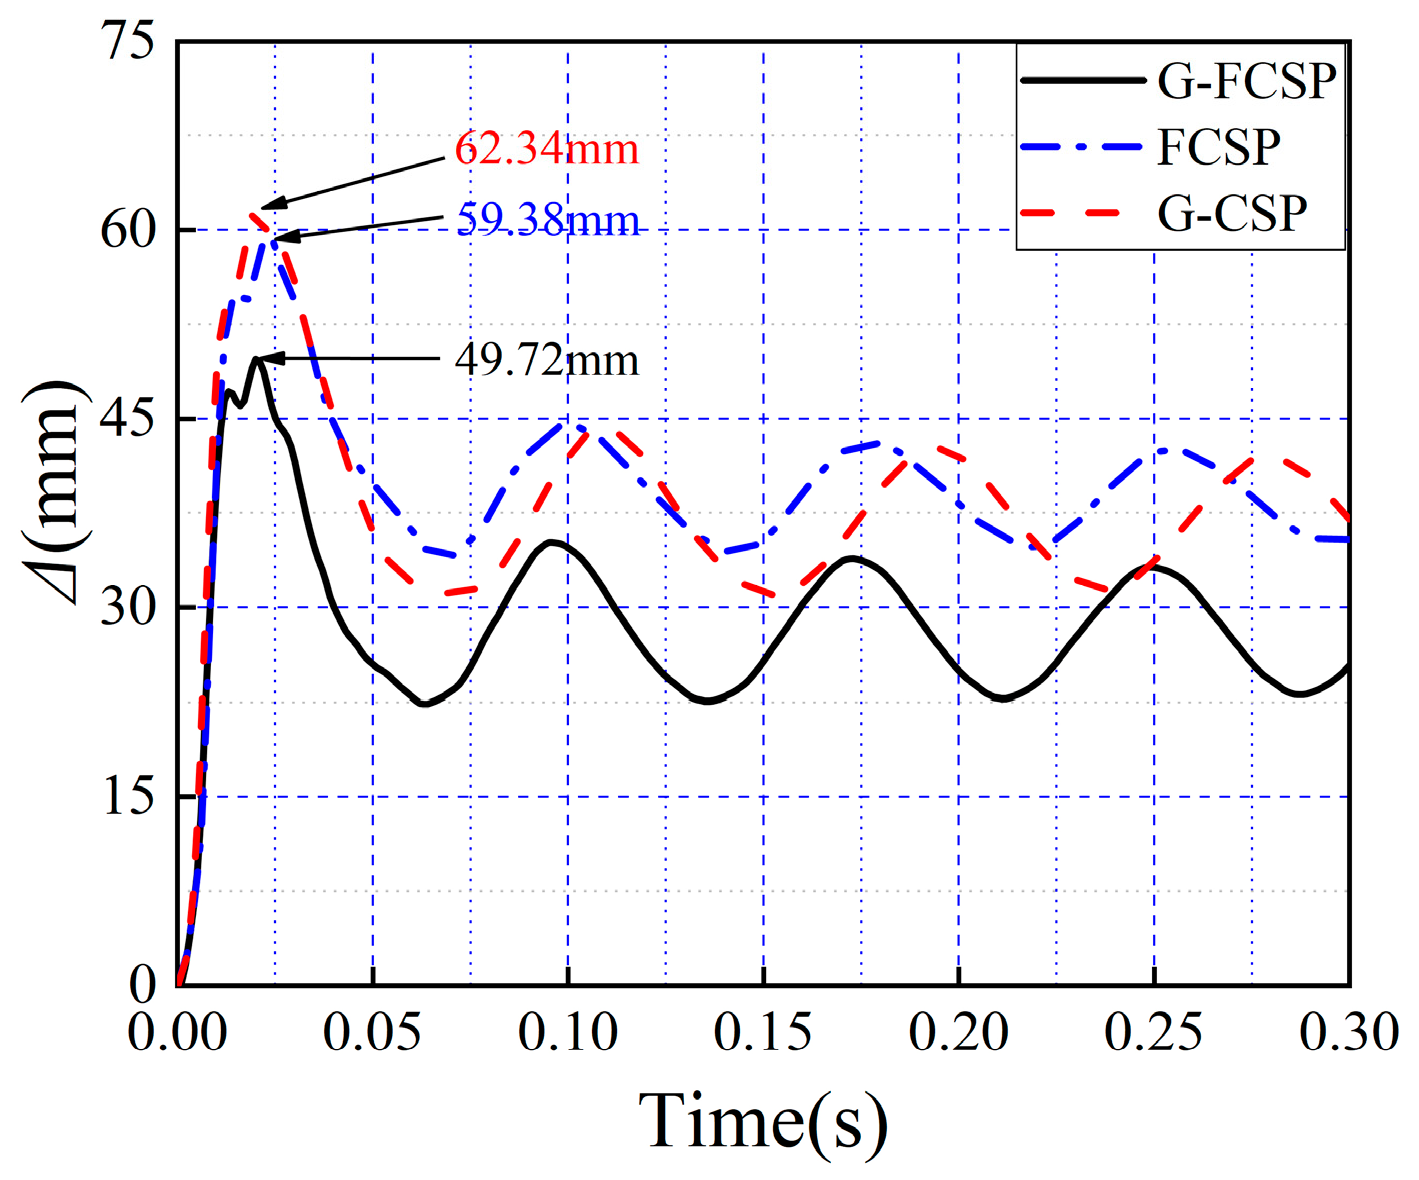
Figure 10 presents the displacement–time history curves of three wall panels with different materials (G-FCSP, FCSP, and G-CSP) obtained through Abaqus 2020 finite element software; the peak impact displacements of G-CSP, FCSP, and G-FCSP were measured at 62.34 mm, 59.38 mm, and 49.72 mm, respectively, while their residual impact displacements recorded values of 32.47 mm, 35.48 mm, and 20.31 mm correspondingly. It can be observed that the peak displacements of all three types correspond to approximately the same impact duration. Their displacement–time history curves exhibit similar trends, all undergoing repetitive fluctuation stages of rising and falling. This is primarily because during the initial impact phase, the wall panel experiences significant deformation due to the impactor’s action, reaching its peak displacement at this moment. Subsequently, the inherent elasticity of both impactor and wall panel induces post-impact rebound, enabling partial recovery of elastic strain while maintaining certain irreversible plastic deformation in the wall panel. The impacted zone subsequently undergoes persistent oscillation about the residual displacement, exhibiting the characteristic fluctuating pattern visible in displacement–time history records.
Comparative analysis reveals that both the peak and residual displacements of G-FCSP are smaller than those of FCSP and G-CSP, indicating that G-FCSP exhibits superior resistance to impact-induced deformation compared to the other two types. Relative to the G-CSP panel, the use of fiber-reinforced concrete in G-FCSP panels leads to significant improvements: fibers substantially enhance the impact resistance and integrity of concrete through crack bridging, energy dissipation, and toughness enhancement, leading to a 20.3% mitigation of peak displacement as well as a 37.4% mitigation of residual displacement for G-FCSP.
Compared to the FCSP panel, the G-FCSP showed a 16.3% mitigation of peak displacement as well as a 42.8% mitigation of residual displacement, indicating that the glass fiber mesh also significantly improves the simulated panel’s capacity to resist impact loads. This is because the impact on the simulated panel is a process of energy absorption. The impactor accumulates significant kinetic energy during its fall, which is rapidly converted into the simulated panel’s internal energy upon collision. The incorporated glass fiber mesh, due to its material properties, effectively absorbs a portion of the impact energy, resulting in reduced displacements induced by impact in the subsequent composite structure. This is manifested through lower peak and residual displacements. In comparison with FCSP and G-CSP, G-FCSP demonstrates superior impact resistance and deformation capacity. In conclusion, both fiber-reinforced concrete and glass fiber mesh reinforcement effectively enhance the impact resistance and anti-deformation capability of composite wall panels.

4.2. Impact Force–Time History Curves

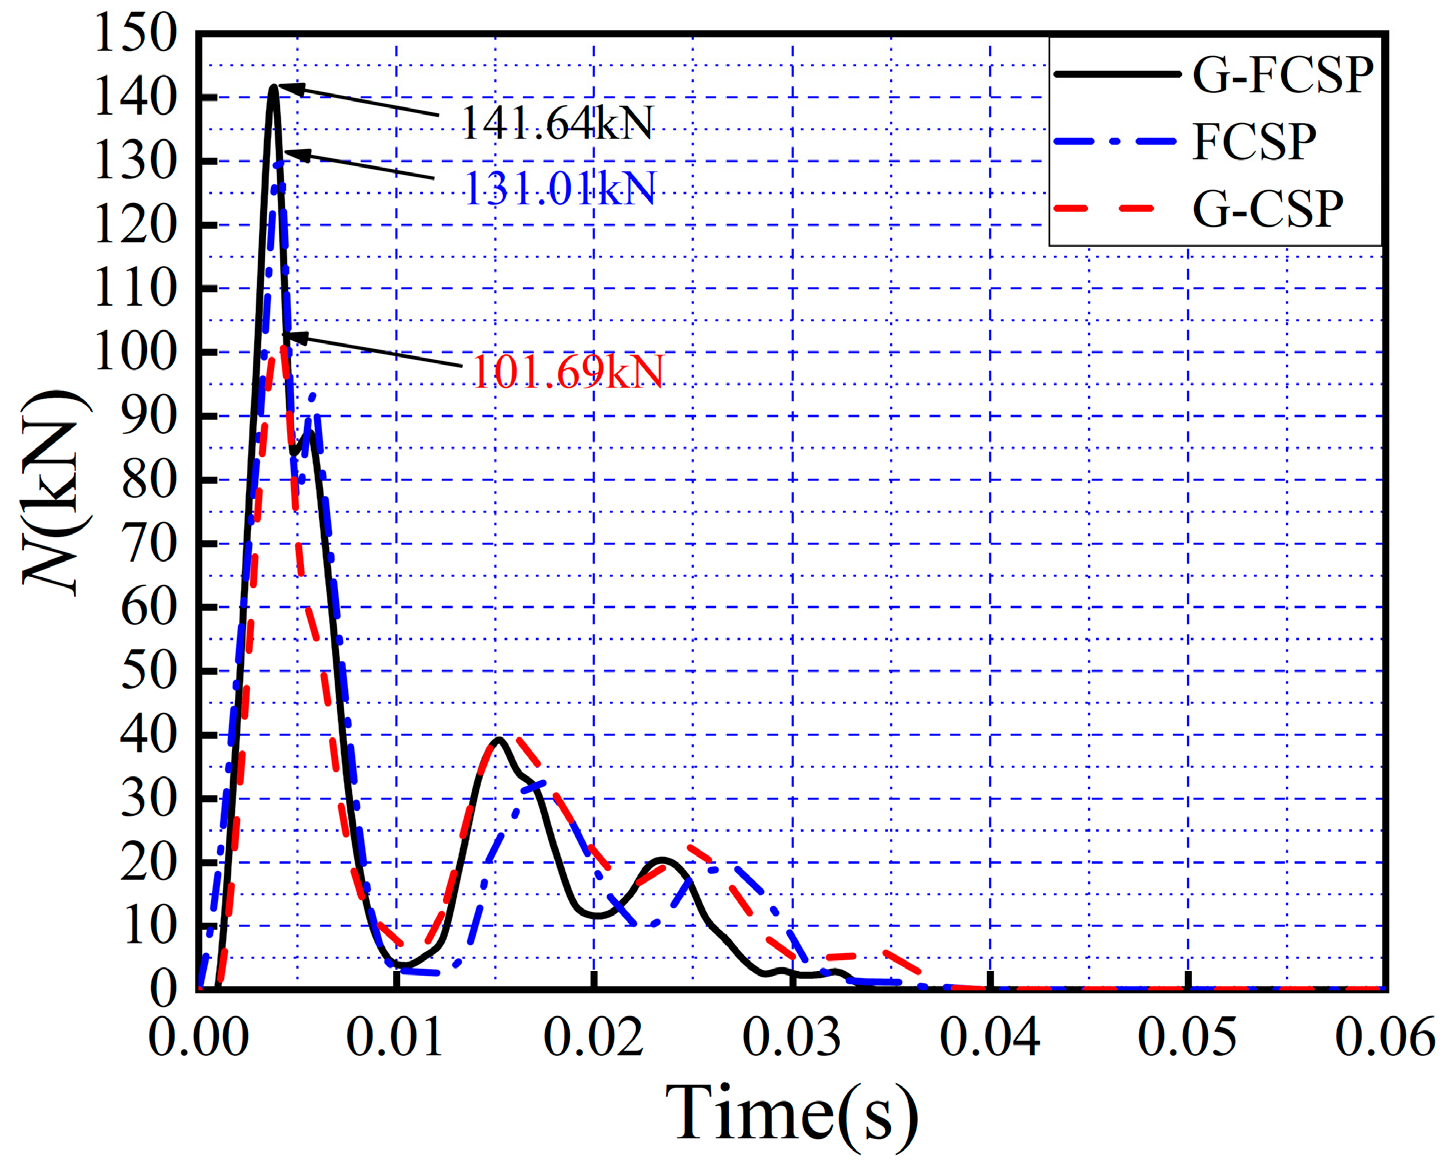
Figure 11 presents the impact force–time history curves for three wall panels (G-FCSP, FCSP, and G-CSP). These curves exhibit certain similarities in their overall trends but demonstrate differences at specific time nodes. The curves reveal that all three wall panels show primary and secondary peaks in their impact force–time history profiles. The primary peak corresponds to a higher peak impact force value with relatively shorter duration, while the secondary peak reaches less than half of the primary peak’s magnitude but exhibits longer interaction duration between the impactor and wall panel. Among them, G-CSP demonstrates the longest interaction duration, decaying to zero near 0.04 s. FCSP shows a slightly shorter interaction duration compared to G-FCSP, decaying to zero approximately at 0.035 s. G-FCSP exhibits the shortest interaction time, decaying to zero around 0.03 s. This phenomenon occurs because during the initial impact phase, when the impactor first contacts the wall panel, the peak impact force emerges as the panel absorbs most of the kinetic energy from the impactor. Subsequently, due to elastic effects, the impactor gradually disengages from the wall panel. The contact area between them progressively decreases, and the wall panel exhibits certain irreversible plastic deformations, causing the impact force to drop acutely. Throughout the rebound process of the wall panel and impactor, although both follow the same path, their velocities differ, leading to subsequent re-contact between them. This secondary contact generates additional impact force, resulting in the secondary peak. In the final stage, as the kinetic energy of both the wall panel and impactor is depleted, they gradually separate, and the impact force diminishes until it approaches zero.
As can be seen from Figure 11, the peak impact force of G-FCSP increased by 8.1% and 39.3% compared to FCSP and G-CSP, respectively. The peak impact forces of enhanced G-FCSP as well as unenhanced FCSP were relatively similar, and both demonstrated significant improvement in peak impact force compared to G-CSP. This indicates that for these three composite wall panel specimens, concrete strength is the determining factor for peak impact force: the mechanical properties of PFRC are significantly improved compared to plain concrete, leading to bigger peak impact force of G-FCSP relative to G-CSP.

4.3. Damage Contours

The damage distribution patterns in wall panels reveal crack propagation behavior under impact loading. Damage contour maps for the three types of wall panels were extracted from the Abaqus 2020 result files (ODB) for analysis, and the results are presented in Figure 12.
Observation of the frontal damage contours for the three panel types reveals common features: the most severe damage occurred at the center of the simulated panel’s face and bottom, with distinct local indentation developing at the point of impact. Damage propagation on the simulated panel’s face exhibited concentric circular patterns originating from the impact point, whereas radial fracture patterns developed at the bottom surface. The boundary conditions and the lower stiffness at the simulated panel’s mid-span made it susceptible to global bending deformation, which generated transverse damage cracks. Due to the superior impact toughness of the fiber-reinforced concrete, the G-FCSP experienced less overall and local deformation than the G-CSP. Consequently, the damage to the G-CSP was visibly more severe than that to the G-FCSP, with a greater number of transverse cracks. The inclusion of the glass fiber mesh also reduced the overall deformation of the G-FCSP, resulting in fewer cracks compared to the FCSP. Nevertheless, the incorporation of glass fiber mesh showed negligible effects on local deformation characteristics in the simulated panels, evidenced by consistently similar distributions of severely damaged zones at the impact region.

5. Parametric Analysis

5.1. Effect of Impact Height (Impact Energy) on Panel Impact Response

The parametric analysis was conducted by varying parameters only for the G-FCSP and FCSP panels. Diverging from the typical model, the mass of the impact object was fixed at 30 kg for the subsequent parametric analysis., a value based on the specifications in the “Standard for Test Methods of Building Wall Panels” and significantly lower than that of the baseline model.
To investigate the influence of impact energy on wall panels under a constant impact mass, the impactor was assigned velocities corresponding to free-fall from heights of 0.5 m, 1.5 m, 2.5 m, and 3.5 m, which were 3.13 m/s, 5.42 m/s, 7.00 m/s, and 8.28 m/s, correspondingly.
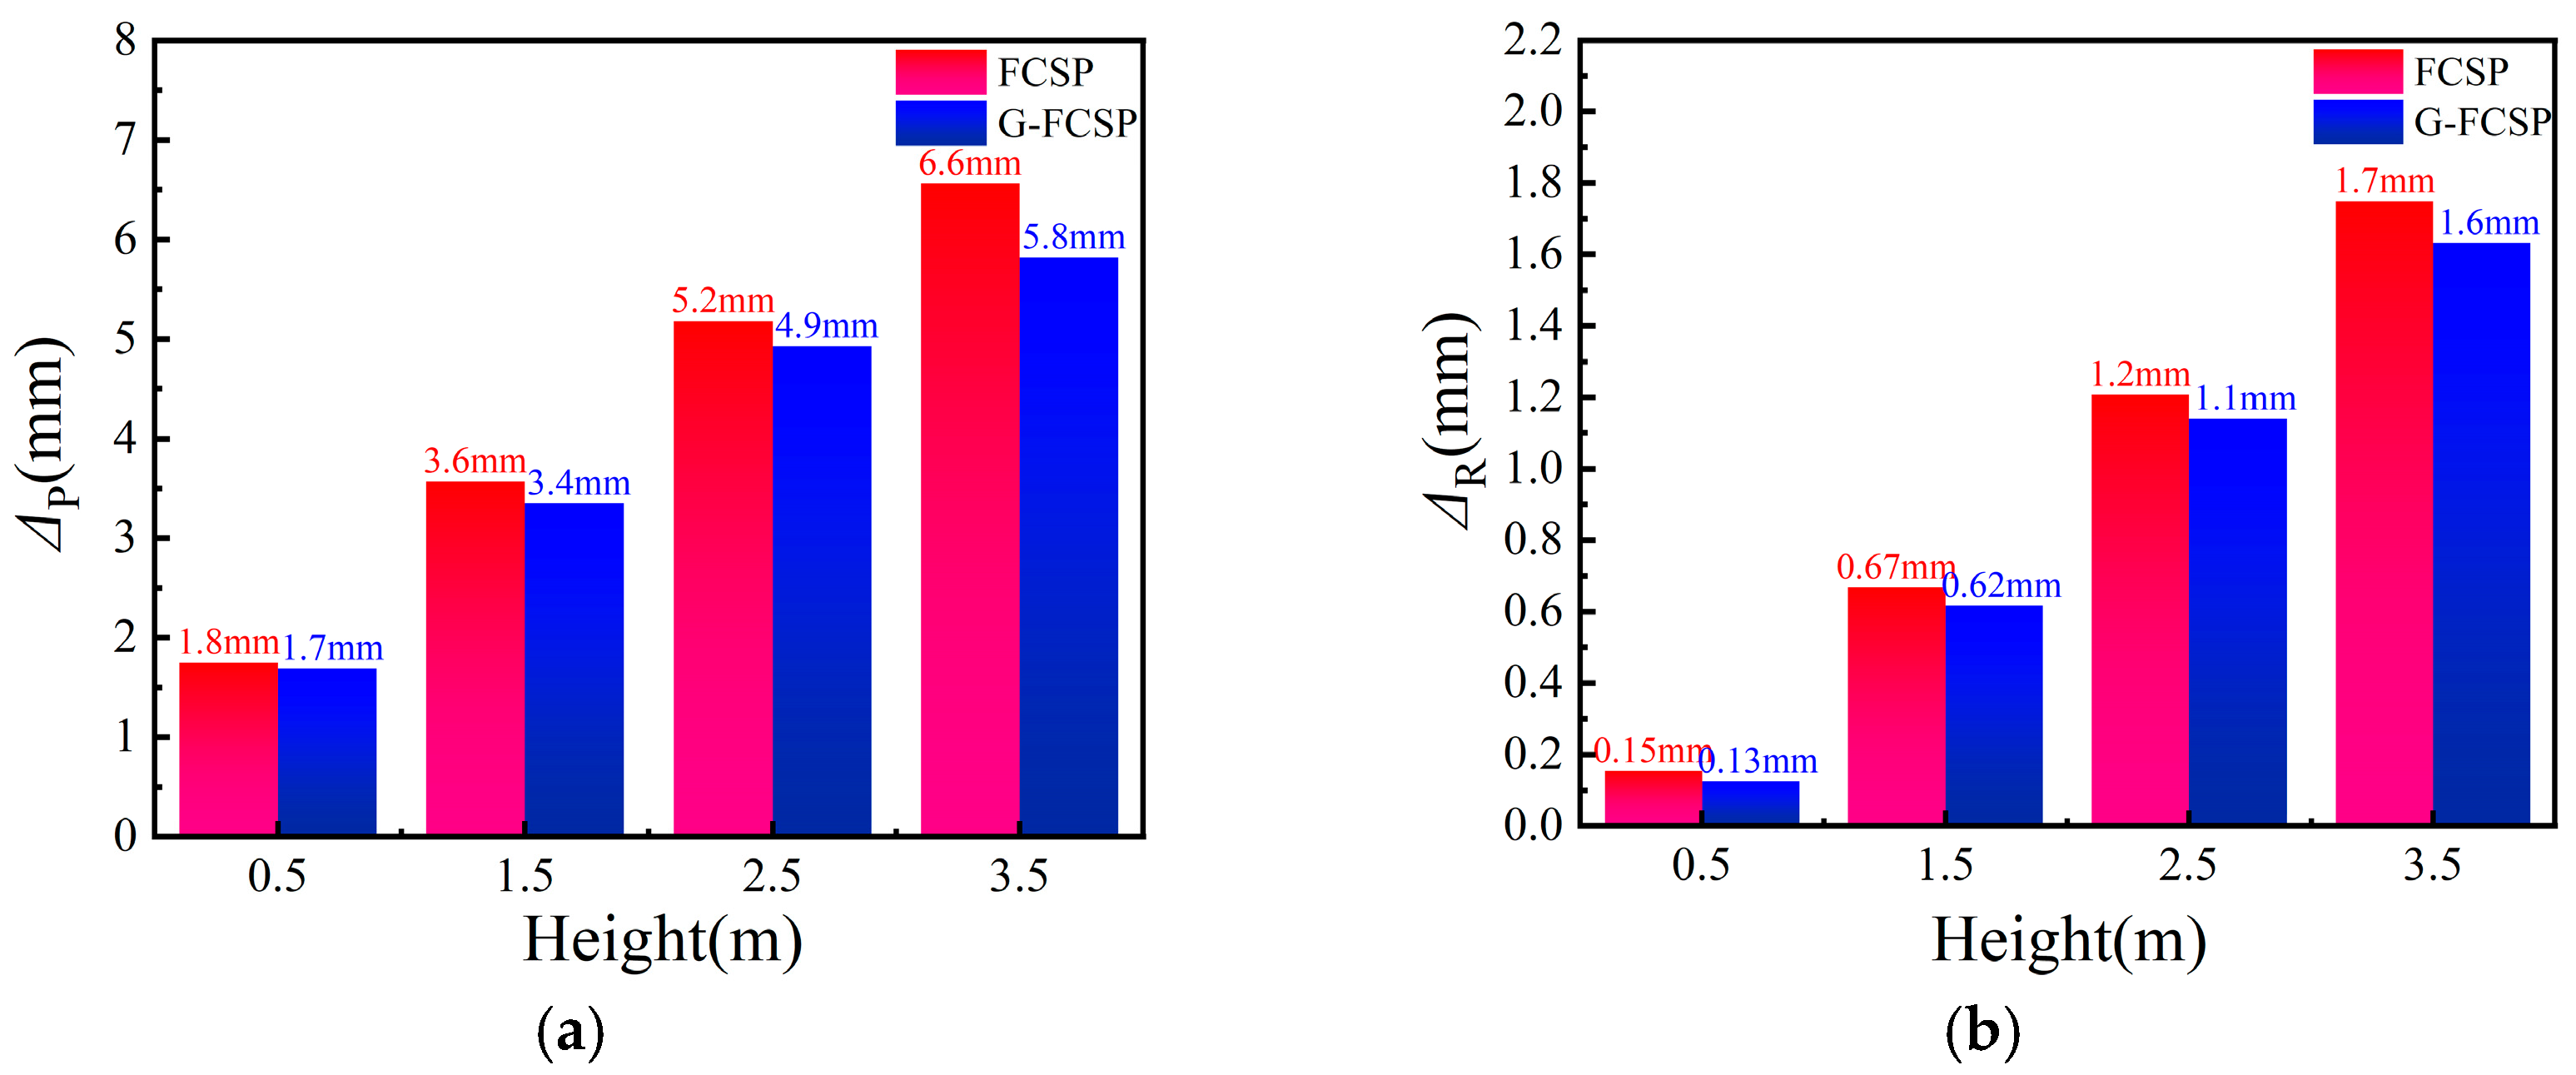
Figure 13 shows the simulated mid-span displacement–time history curves for G-FCSP as well as FCSP panels at different impact heights. A common trend observed is a progressive rise in the peak as well as residual displacements of panels with increasing impact height. However, the inclusion of the glass fiber mesh led to the peak and residual displacements of the G-FCSP being smaller than those of the FCSP. As can be seen from Figure 13, the peak displacements of G-FCSP are consistently smaller than those of FCSP at various impact heights, and the magnitude of reduction in peak displacement increases with higher impact energy. Compared to FCSP, the reduction percentages in peak displacement for G-FCSP are 3.4%, 6.2%, 5.1%, and 11.3%, correspondingly. This phenomenon corresponds to the behavior detected in the baseline model, where the mesh material significantly reduced displacements. This is because the glass fiber mesh, through the fiber–matrix interface, effectively transfers loads and inhibits crack propagation. During impact, it disperses stress concentration and delays the development of structural cracks.
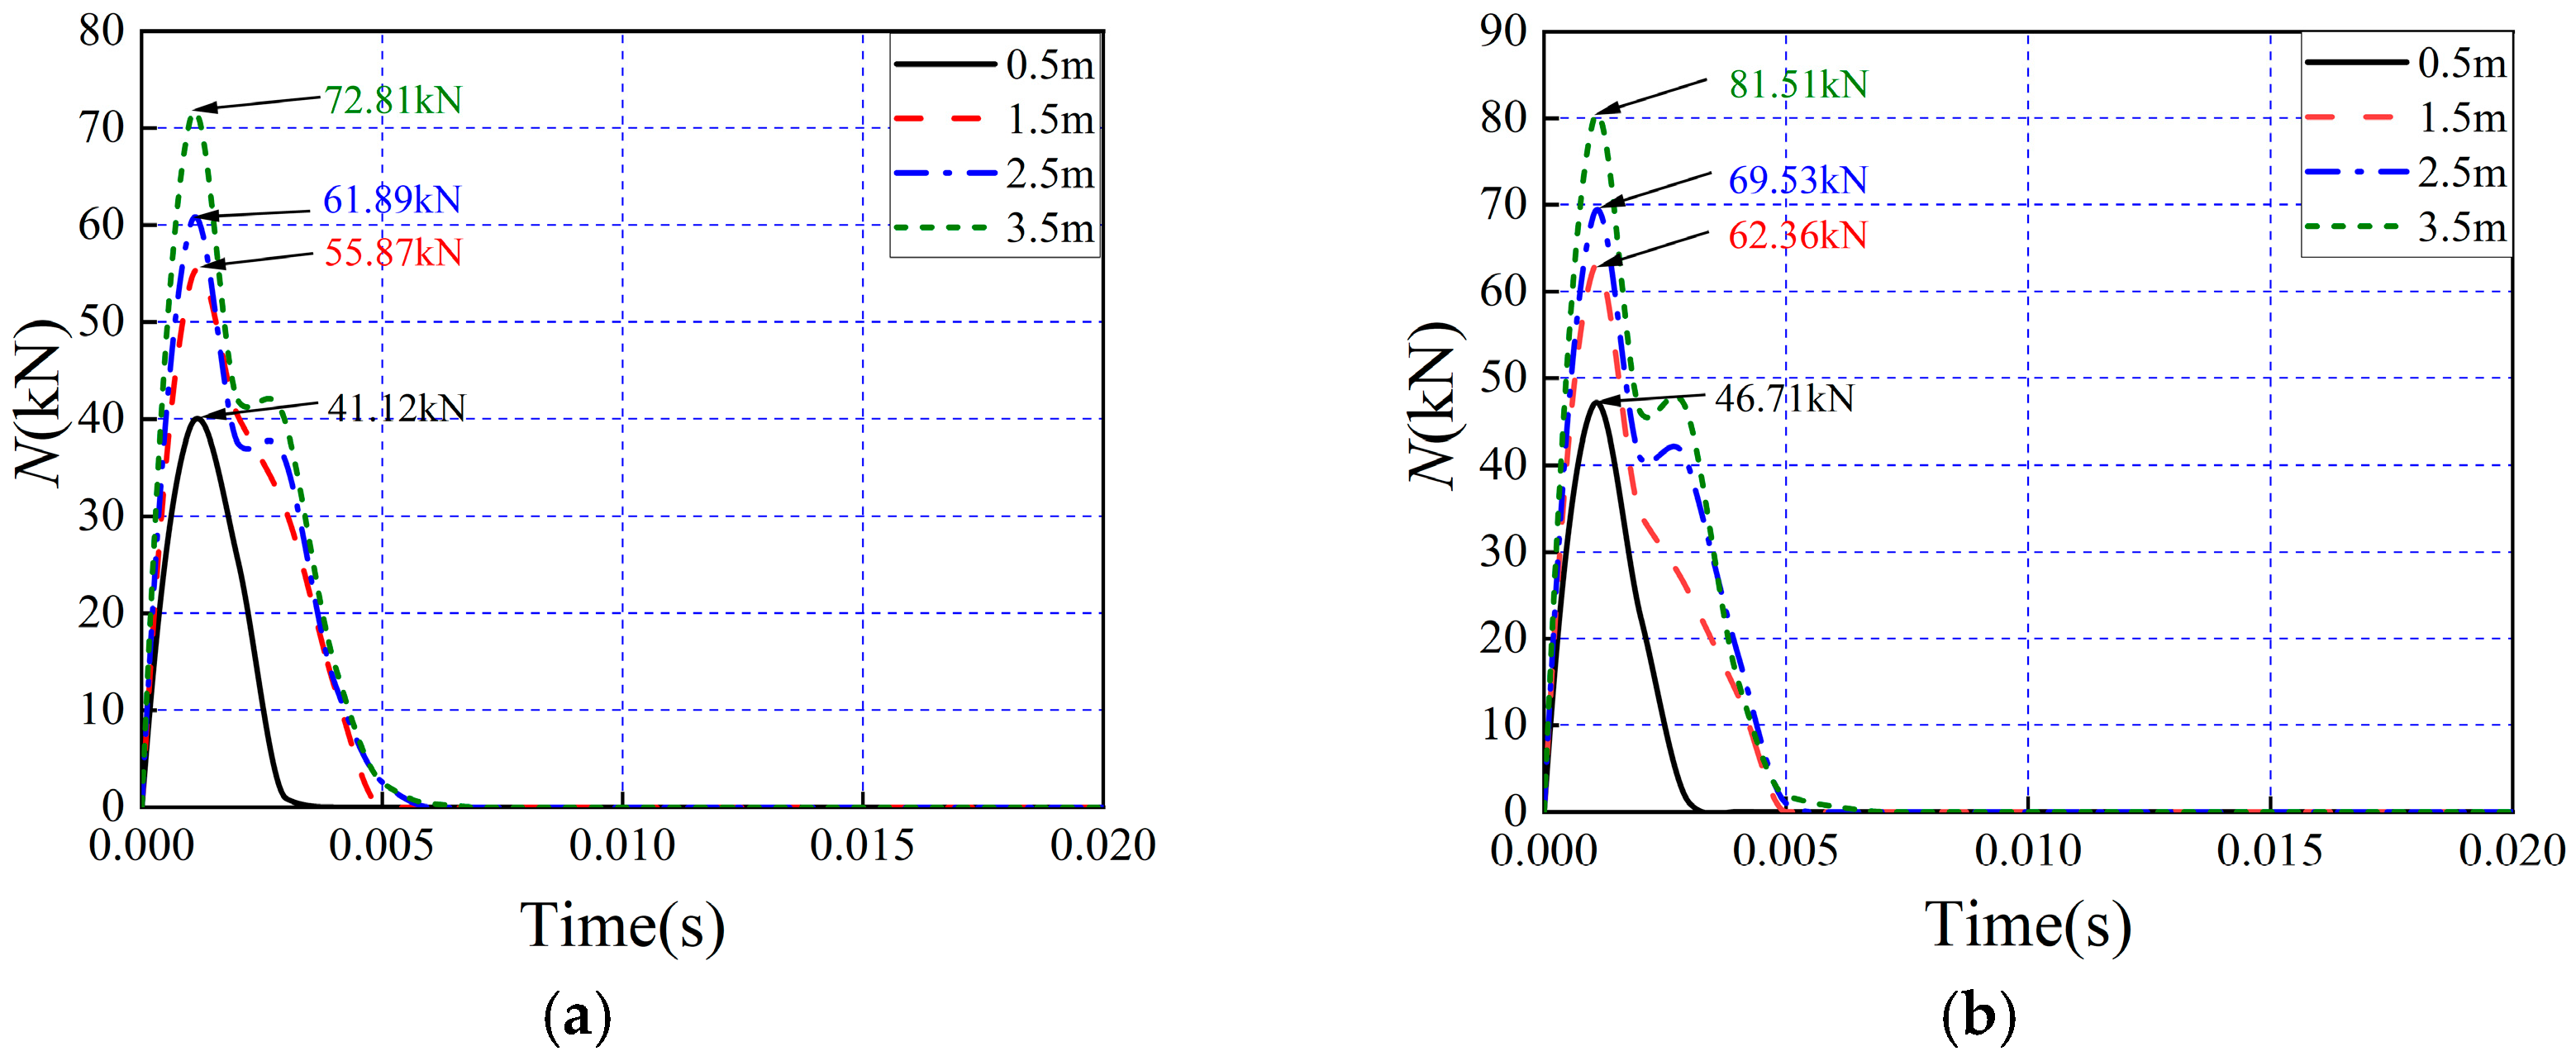
The variation in peak and residual displacements with impact height is shown in Figure 14. The figure indicates that both displacements increase approximately linearly with increasing impact height. As observed from the impact force–time history curves in Figure 15, the G-FCSP exhibited a higher peak impact force, with its value slightly exceeding that of the FCSP. This is because the glass fiber mesh, while controlling panel deformation to some extent, also enhanced the mechanical coupling between the simulated panel and the impactor. From the impact force–time history curves, it is evident that an increasing trend in impact force was observed across all simulated panels with rising impact height. Moreover, under identical impact heights, the peak impact force of G-FCSP increased by 14%, 12%, 12%, and 10%, respectively, compared to FCSP. This demonstrates that the incorporated glass fiber mesh effectively suppresses panel deformation.

5.2. Effect of Impactor Mass on Panel Impact Response

To analyze the effect of impactor mass on the simulated panel’s impact response, the mass was varied while keeping the impact energy constant. The impact energy was determined to be 441 J. Assuming a gravitational acceleration of 9.8 m/s2, the impactor mass selected were 30 kg, 60 kg, 90 kg, and 120 kg, with corresponding velocities of 5.42 m/s, 3.83 m/s, 3.13 m/s, and 2.71 m/s, respectively.
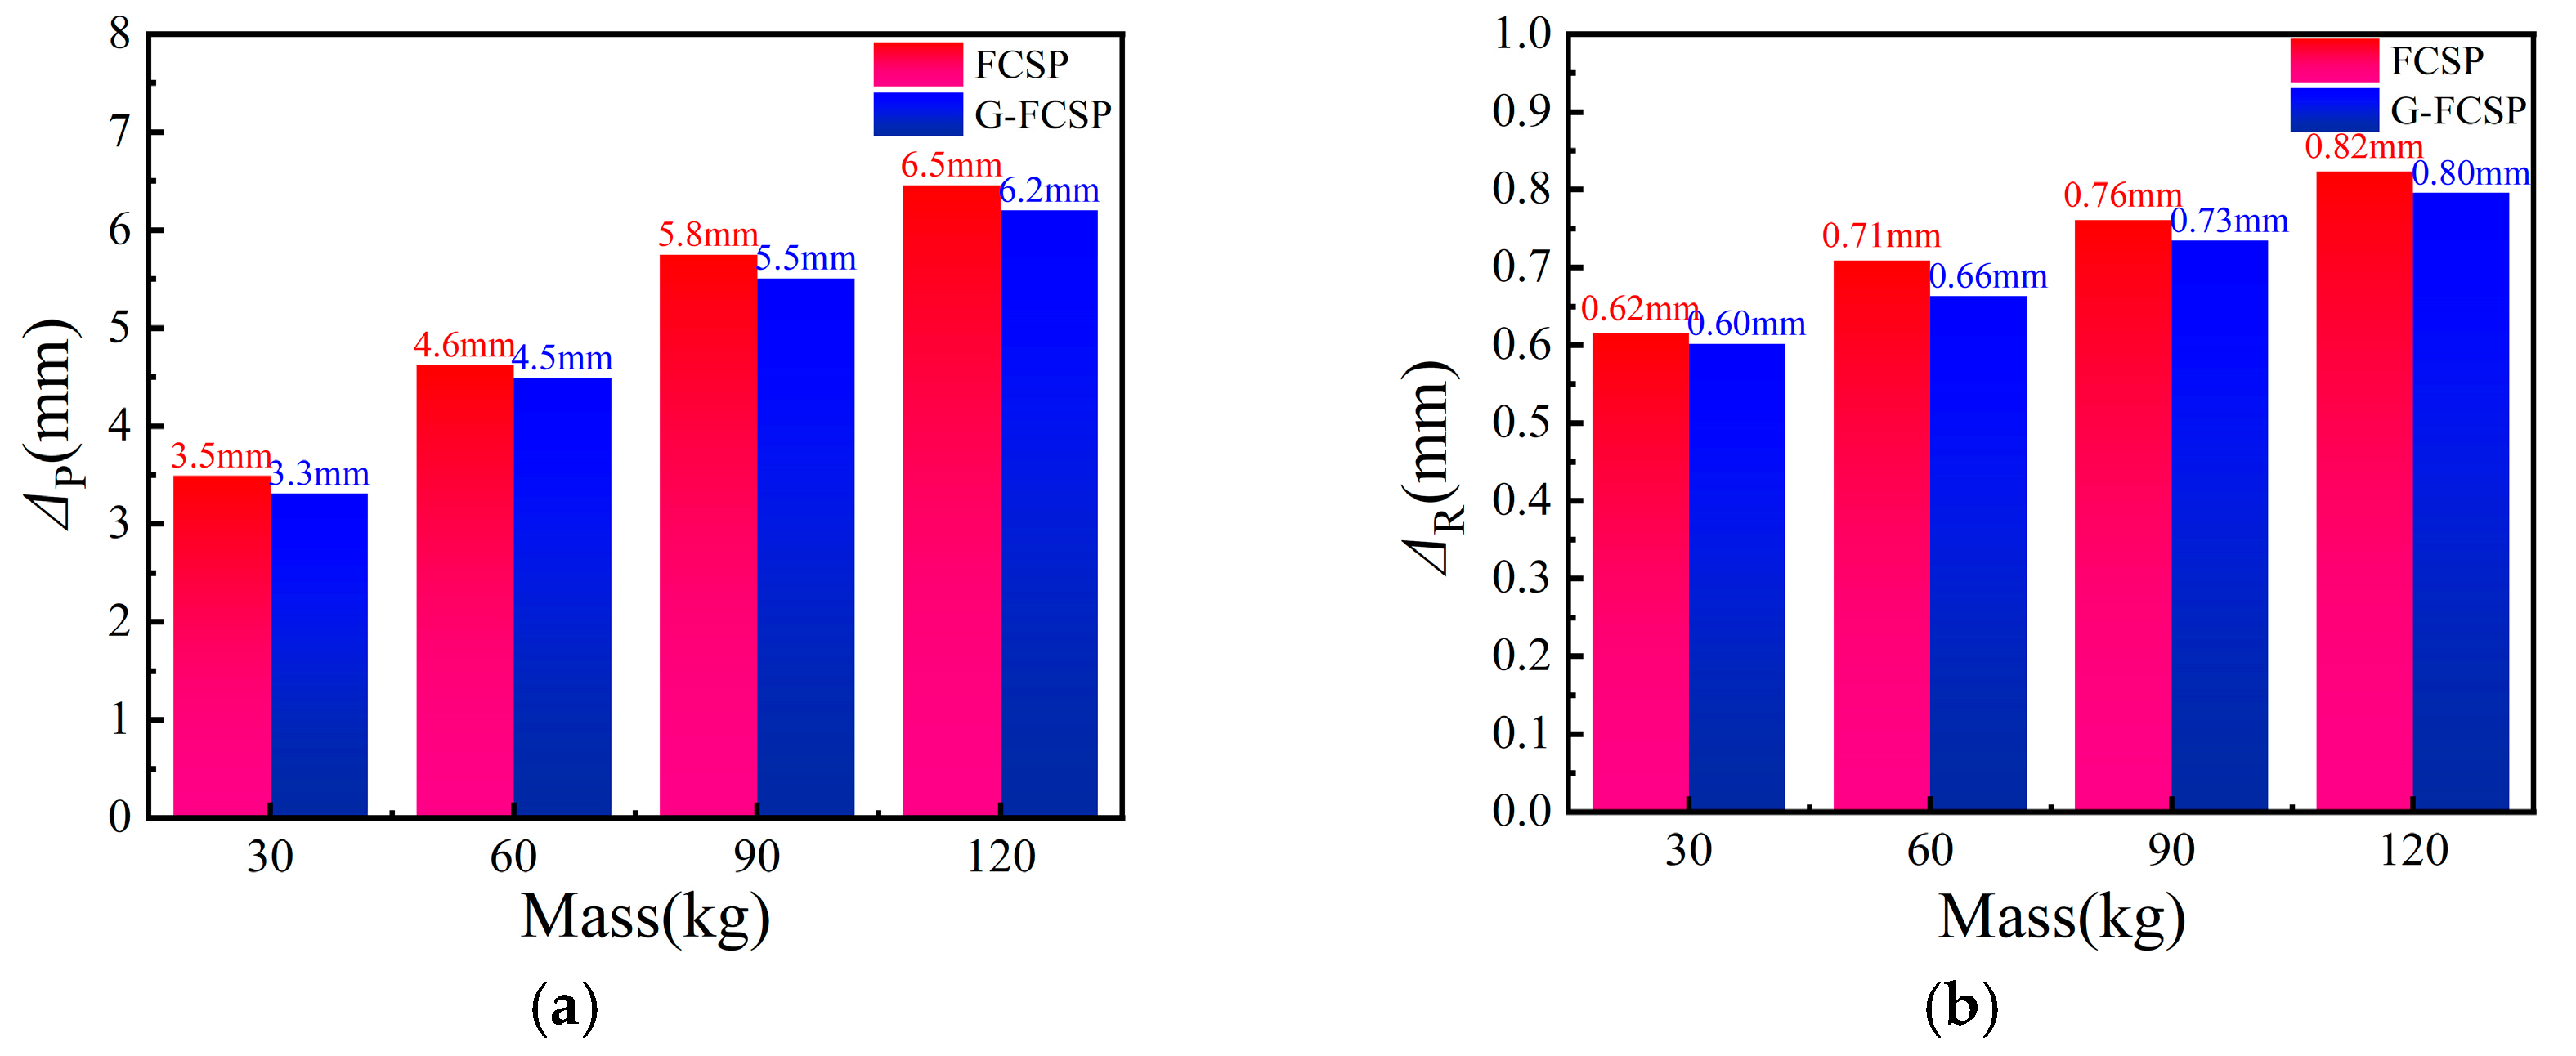
As shown in Figure 16 and Figure 17, as the impactor mass increases, the peak as well as residual displacements of the simulated panels surge post-impact. For the G-FCSP component, as the impactor mass increased from 30 kg to 120 kg, the peak displacement increased by 78.9%, and the residual displacement increased by 32.2%. When the impactor mass was 120 kg, the peak displacement of the G-FCSP component was reduced by 4.5% compared to the FCSP component, and the residual displacement was reduced by 2.4%. When the impactor mass was 30 kg, the peak displacement of the G-FCSP component was reduced by 5.4% compared to the FCSP component, and the residual displacement was reduced by 3.2%. The reduced displacement exhibited by G-FCSP relative to FCSP further confirms the effectiveness of the fiber in improving the impact resistance of wall panels. However, the variation in impact force differed from that observed under varying impact heights.
Observation of Figure 18 reveals that as the impactor mass increases, the period of the impact force extends accordingly; however, the peak impact force for both panel types does not exhibit a monotonic increase. The maximum peak impact forces for both FCSP and G-FCSP occur at an impactor mass of 60 kg. With the increase in impact force duration, the peak impact forces of both panels demonstrate a trend of initial increase followed by decrease. When the impactor masses are 30 kg, 60 kg, 90 kg, and 120 kg, the peak impact force of G-FCSP increases by 8.9%, 10.6%, 5.9%, and 4.2%, respectively, compared to FCSP. These results indicate that the extent of the force on the wall panels is governed by multiple interacting factors rather than being determined by any single isolated parameter.

5.3. Effect of Concrete Wythe Thickness on Panel Impact Response

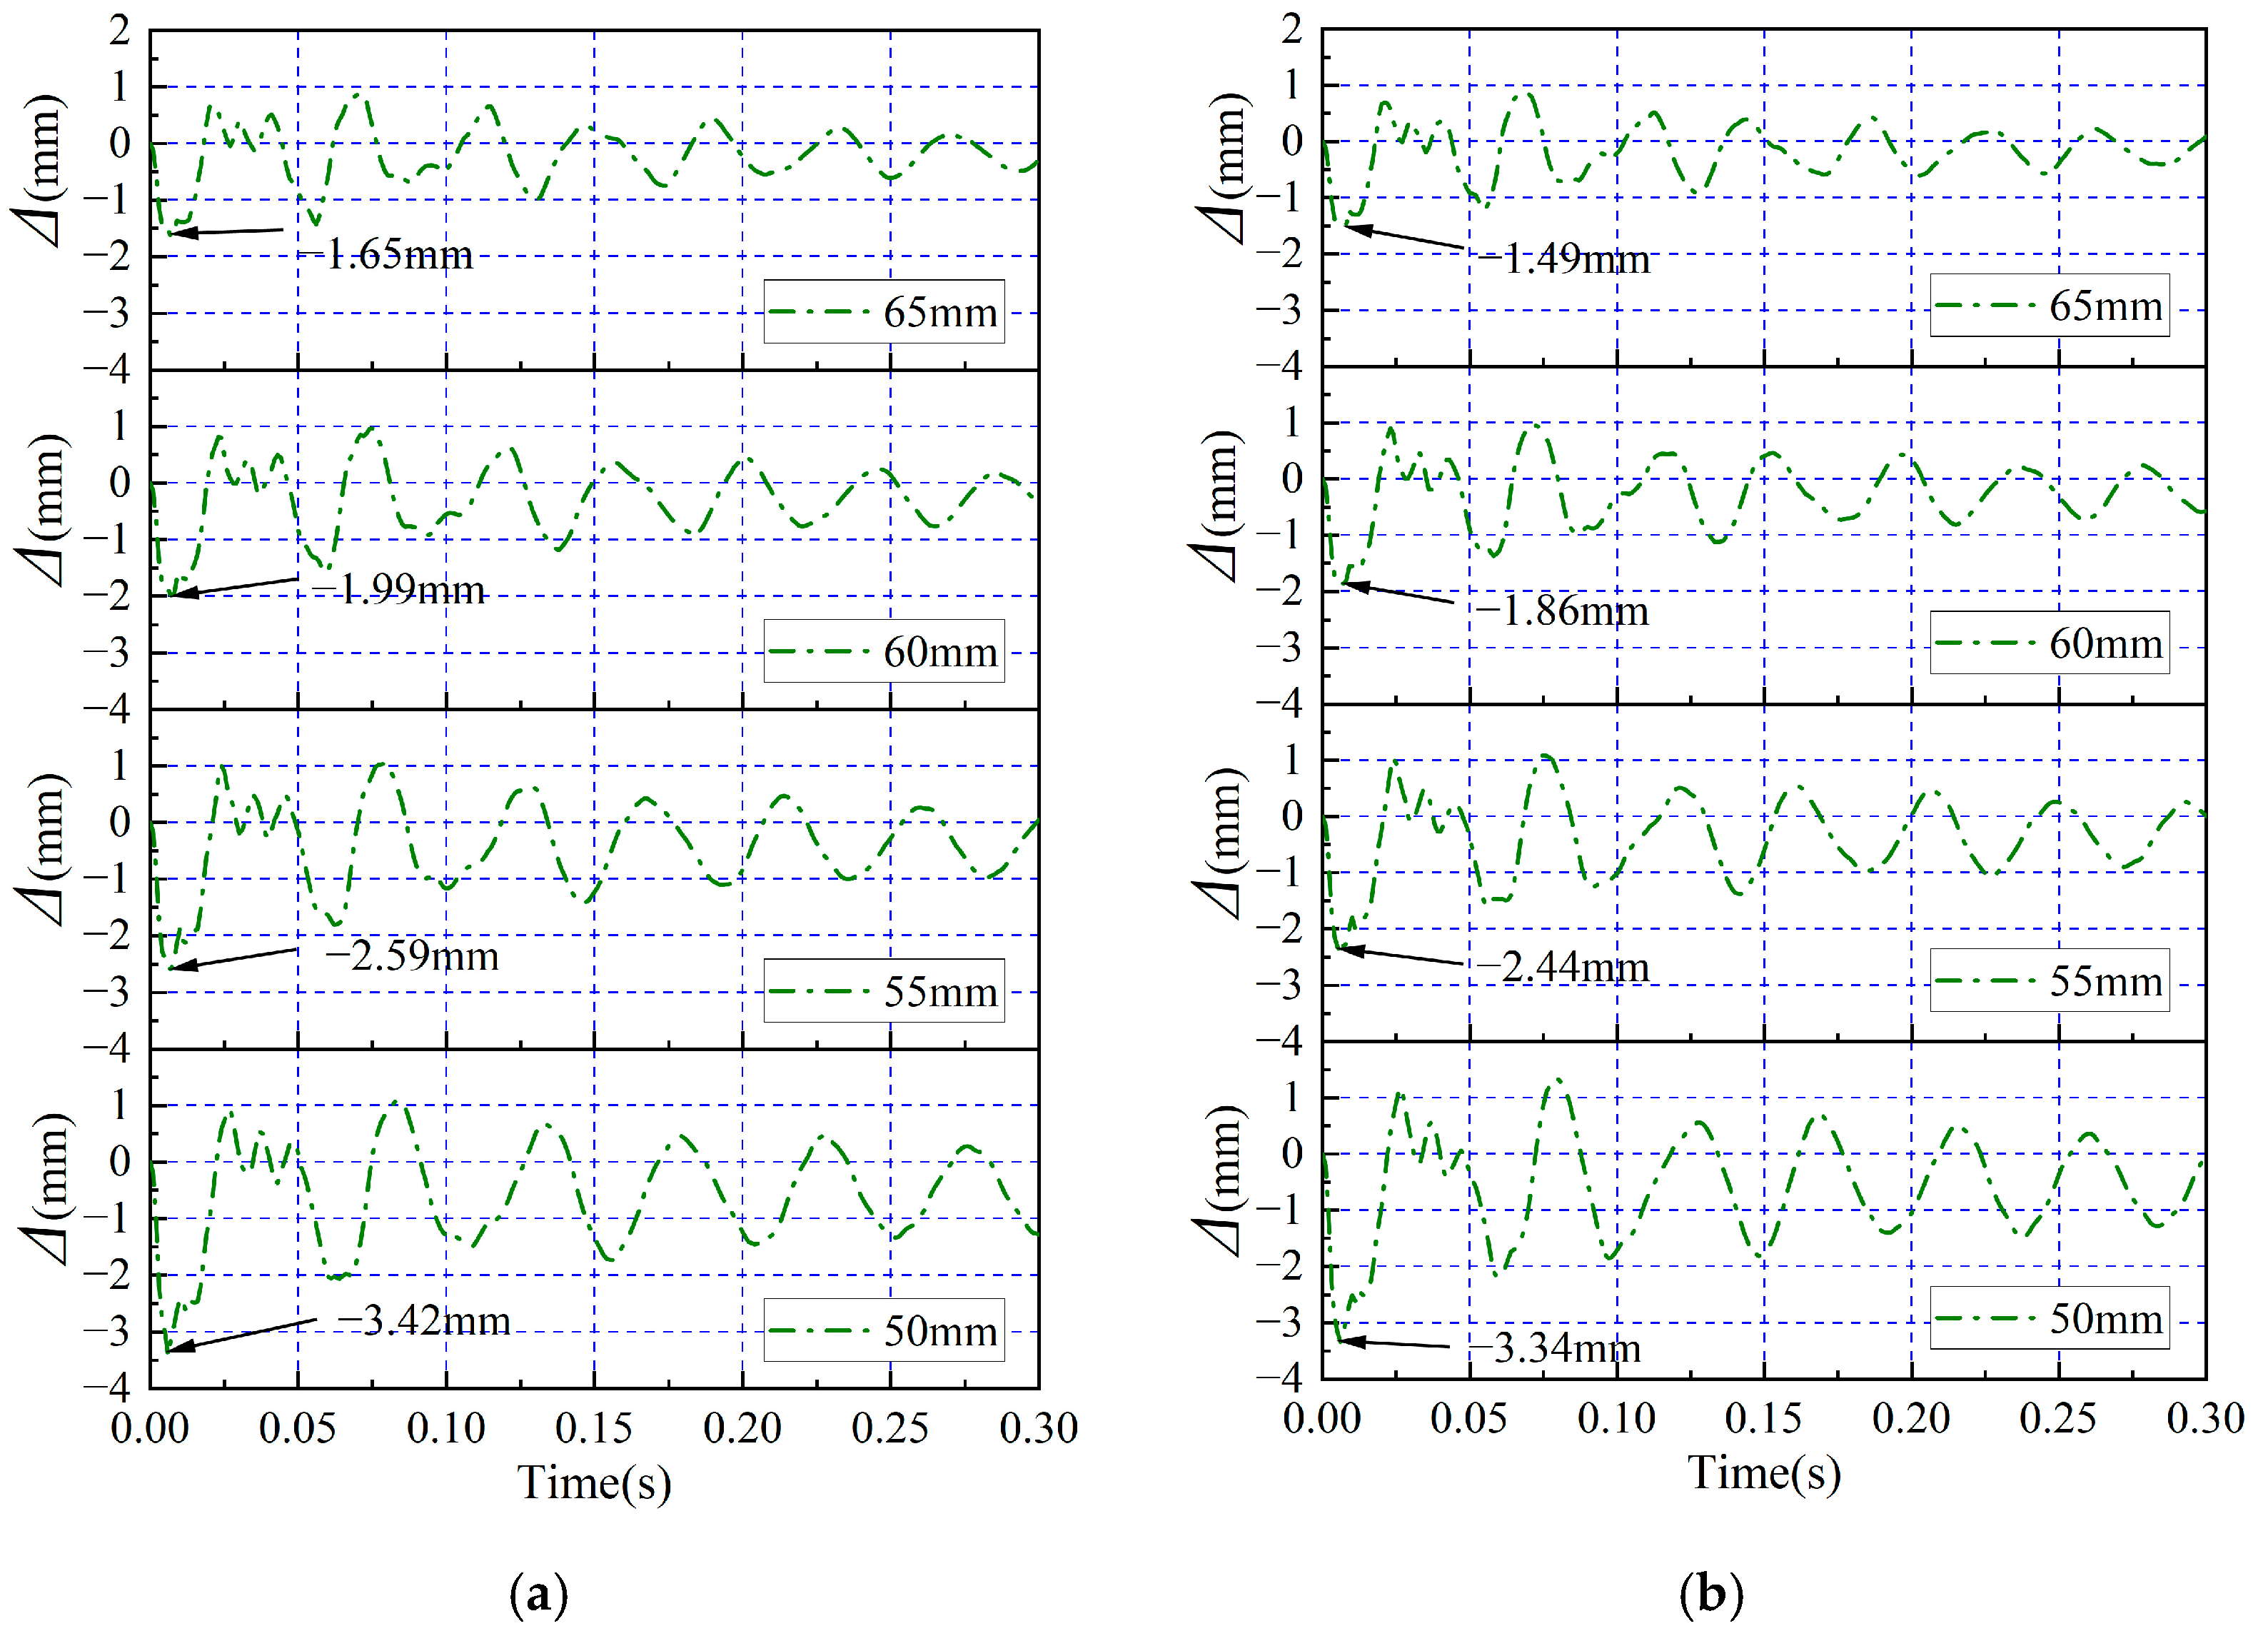
In this study, the original panel thickness of 50 mm, as well as the thicknesses of 55 mm, 60 mm, and 65 mm, have been established to develop distinct finite element models for parametric analysis based on varying concrete wall panel thicknesses. Figure 19 displays the displacement–time history curves of FCSP as well as G-FCSP under different concrete face thickness conditions. It can be observed that the trends and characteristic points of the two sets of curves are generally consistent. Figure 20 illustrates variations in peak as well as residual displacements of the wall panel assembly across a range of slab thicknesses. The data show that G-FCSP exhibits reductions in peak displacement of 2.4%, 6.1%, 7.0%, and 10.7%, and in residual displacement of 6.7%, 8.1%, 8.3%, and 8.0%, respectively, compared to FCSP. In conclusion, within the evaluated thickness range, G-FCSP demonstrates higher overall stiffness than FCSP, and increasing thickness of the concrete slab moderately improves the impact resistance of the wall panels.
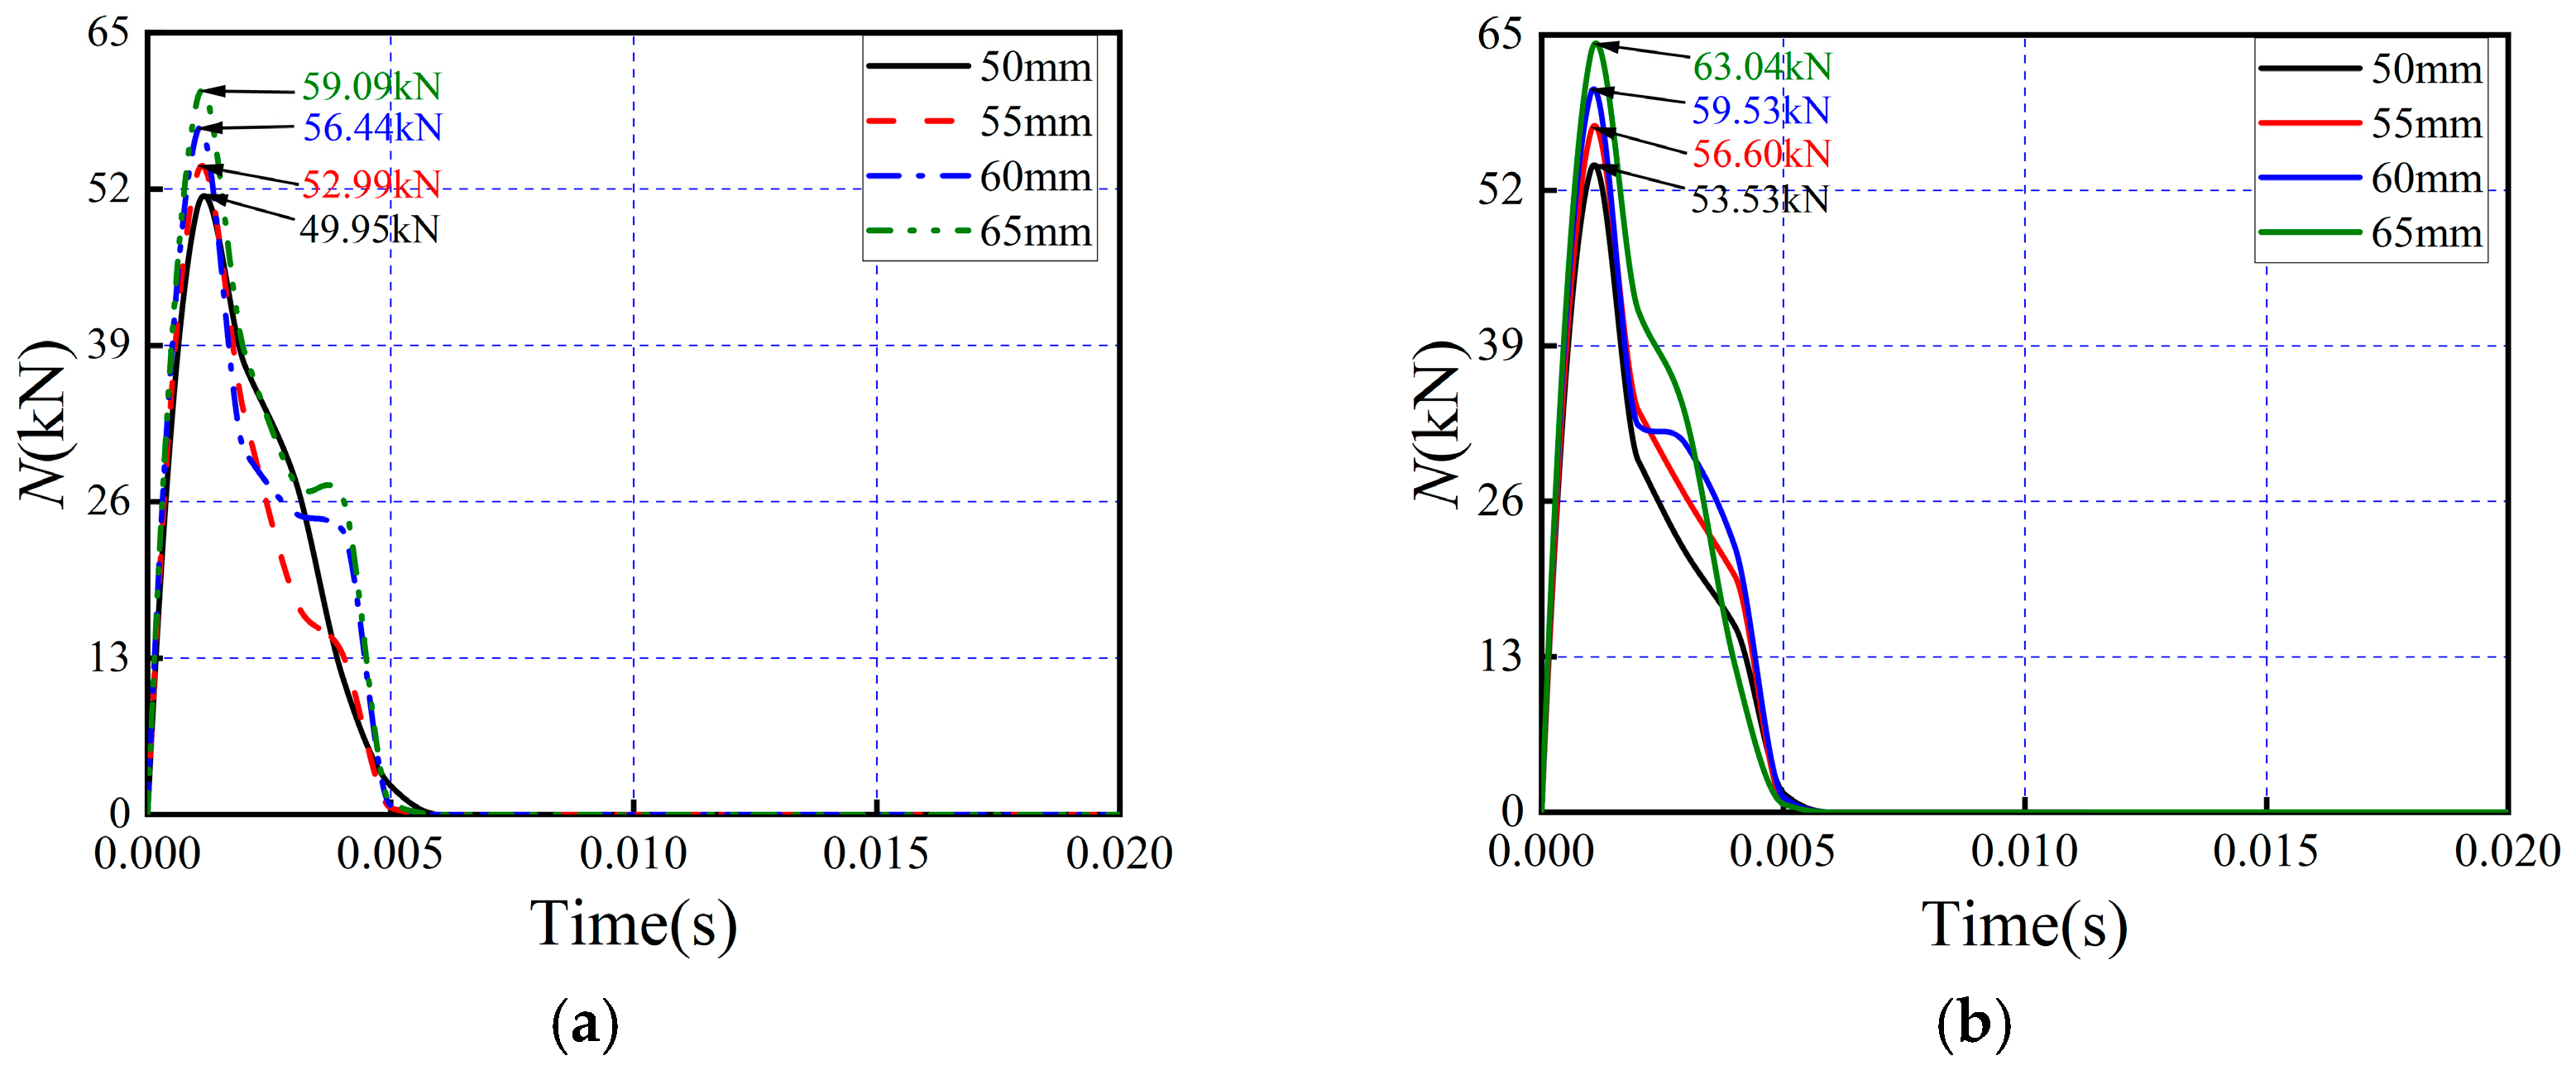
Figure 21 presents the variations in impact force–time history curves for FCSP as well as G-FCSP under diverse concrete slab thicknesses. The data indicate that the interaction duration between the impactor and wall panels remains approximately consistent across thickness variations. However, with progressive increases in slab thickness, the peak impact forces of both FCSP and G-FCSP exhibit continuous growth. Specifically, FCSP demonstrates peak impact force increments of 6.0%, 13.0%, and 18.2%, while corresponding values for G-FCSP reach 5.7%, 11.2%, and 17.8%, respectively. Under identical thickness conditions, the peak impact force of G-FCSP surpasses that of FCSP by 7.2%, 6.8%, 5.8%, and 5.5%, respectively.
These findings demonstrate that increasing concrete slab thickness enhances both deformation resistance and impact capacity of composite wall panels. However, the effectiveness of glass fiber grid reinforcement in improving deformation resistance diminishes with further thickness augmentation. This attenuation occurs because the thickened concrete substrate becomes increasingly dominant in load bearing, sufficiently resisting deformation through its inherent stiffness, thereby reducing the relative contribution of the fiber reinforcement.

5.4. Effect of Impact Location on Panel Impact Response

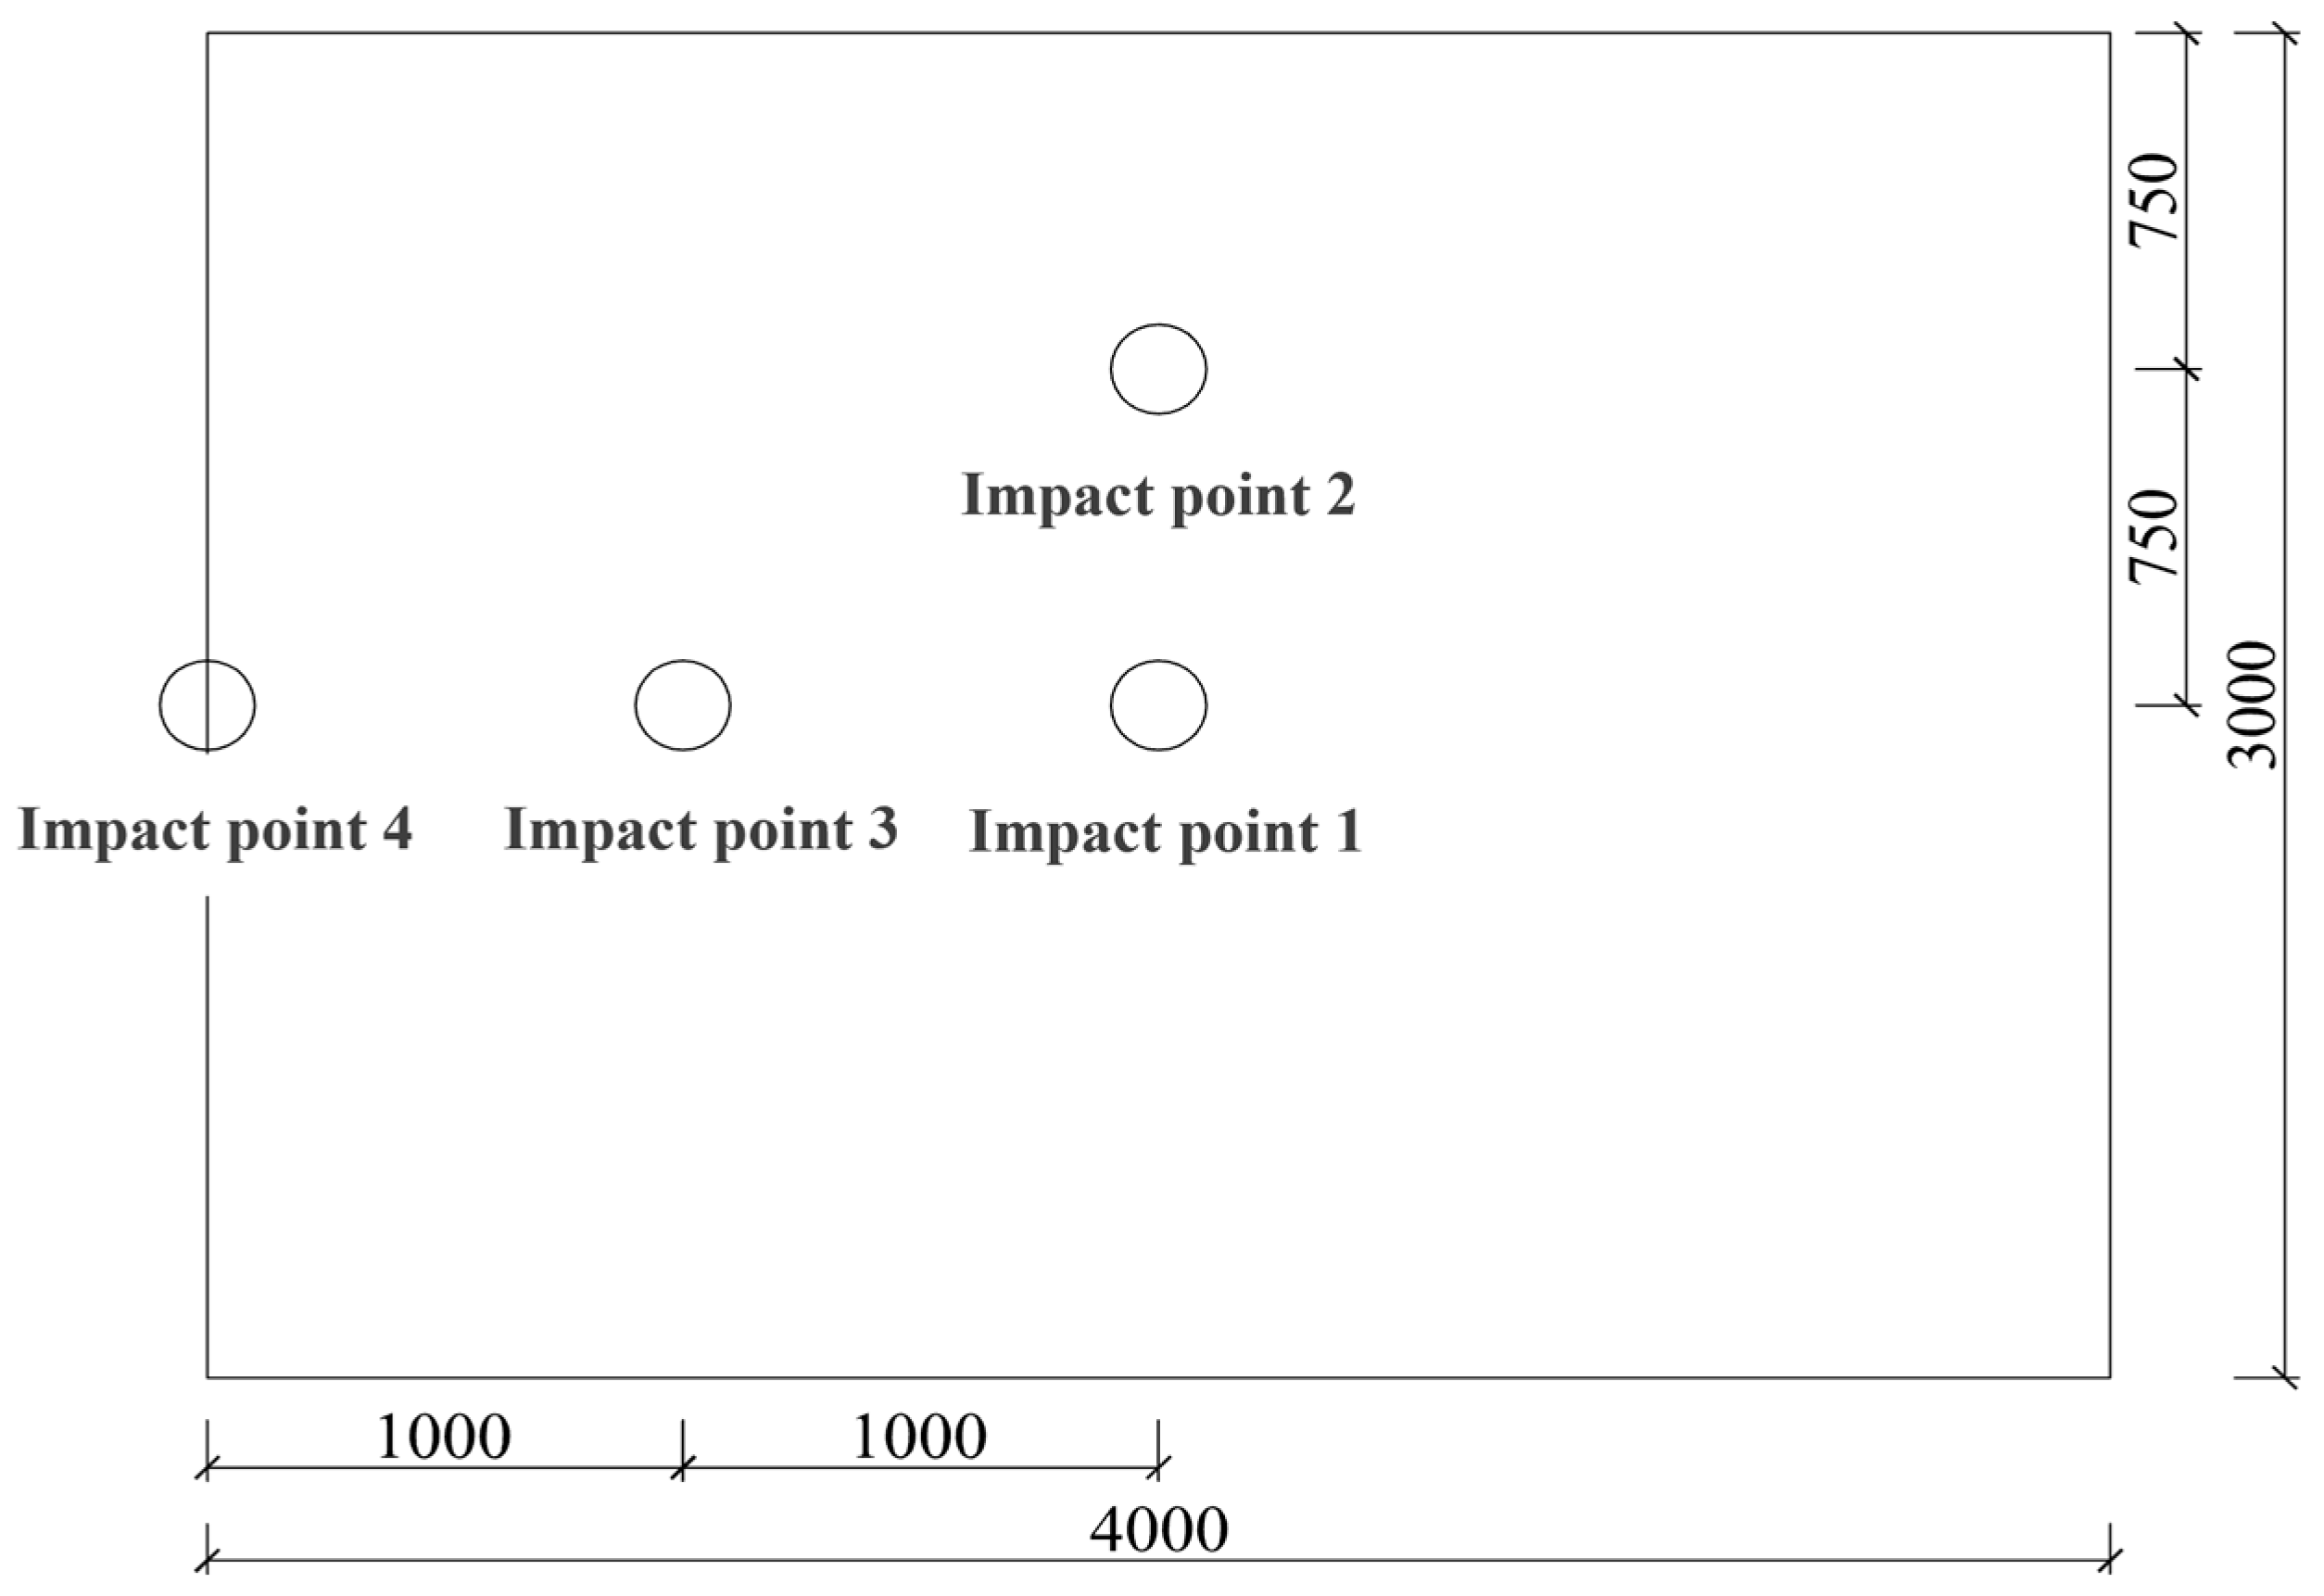
In practical applications, the specific usage scenarios of wall panels lead to randomness and uncertainty in impact locations. Therefore, while maintaining consistent parameters such as impactor mass, impact height, and other variables, this study conducts impact simulations at different positions on the wall to investigate the responses of wall panels under various impact locations. The four impact positions considered in the finite element software, as illustrated in Figure 22, are the mid-span of the simulated panel, the quarter-point of the panel width and the panel height, as well as the edge of the panel width. The displacement–time history curves of FCSP and G-FCSP under these diverse impact positions were shown in Figure 23. It can be observed that the displacement–time history curves of FCSP as well as G-FCSP exhibit significant differences under varying impact locations. As the impact position moves closer to the edge of the wall panel, displacement gradually increases. This indicates that impact locations nearer to the edge lack sufficient boundary constraints to provide adequate support. Consequently, special reinforcement measures for the edges and corner regions of wall panels are necessary in engineering design.
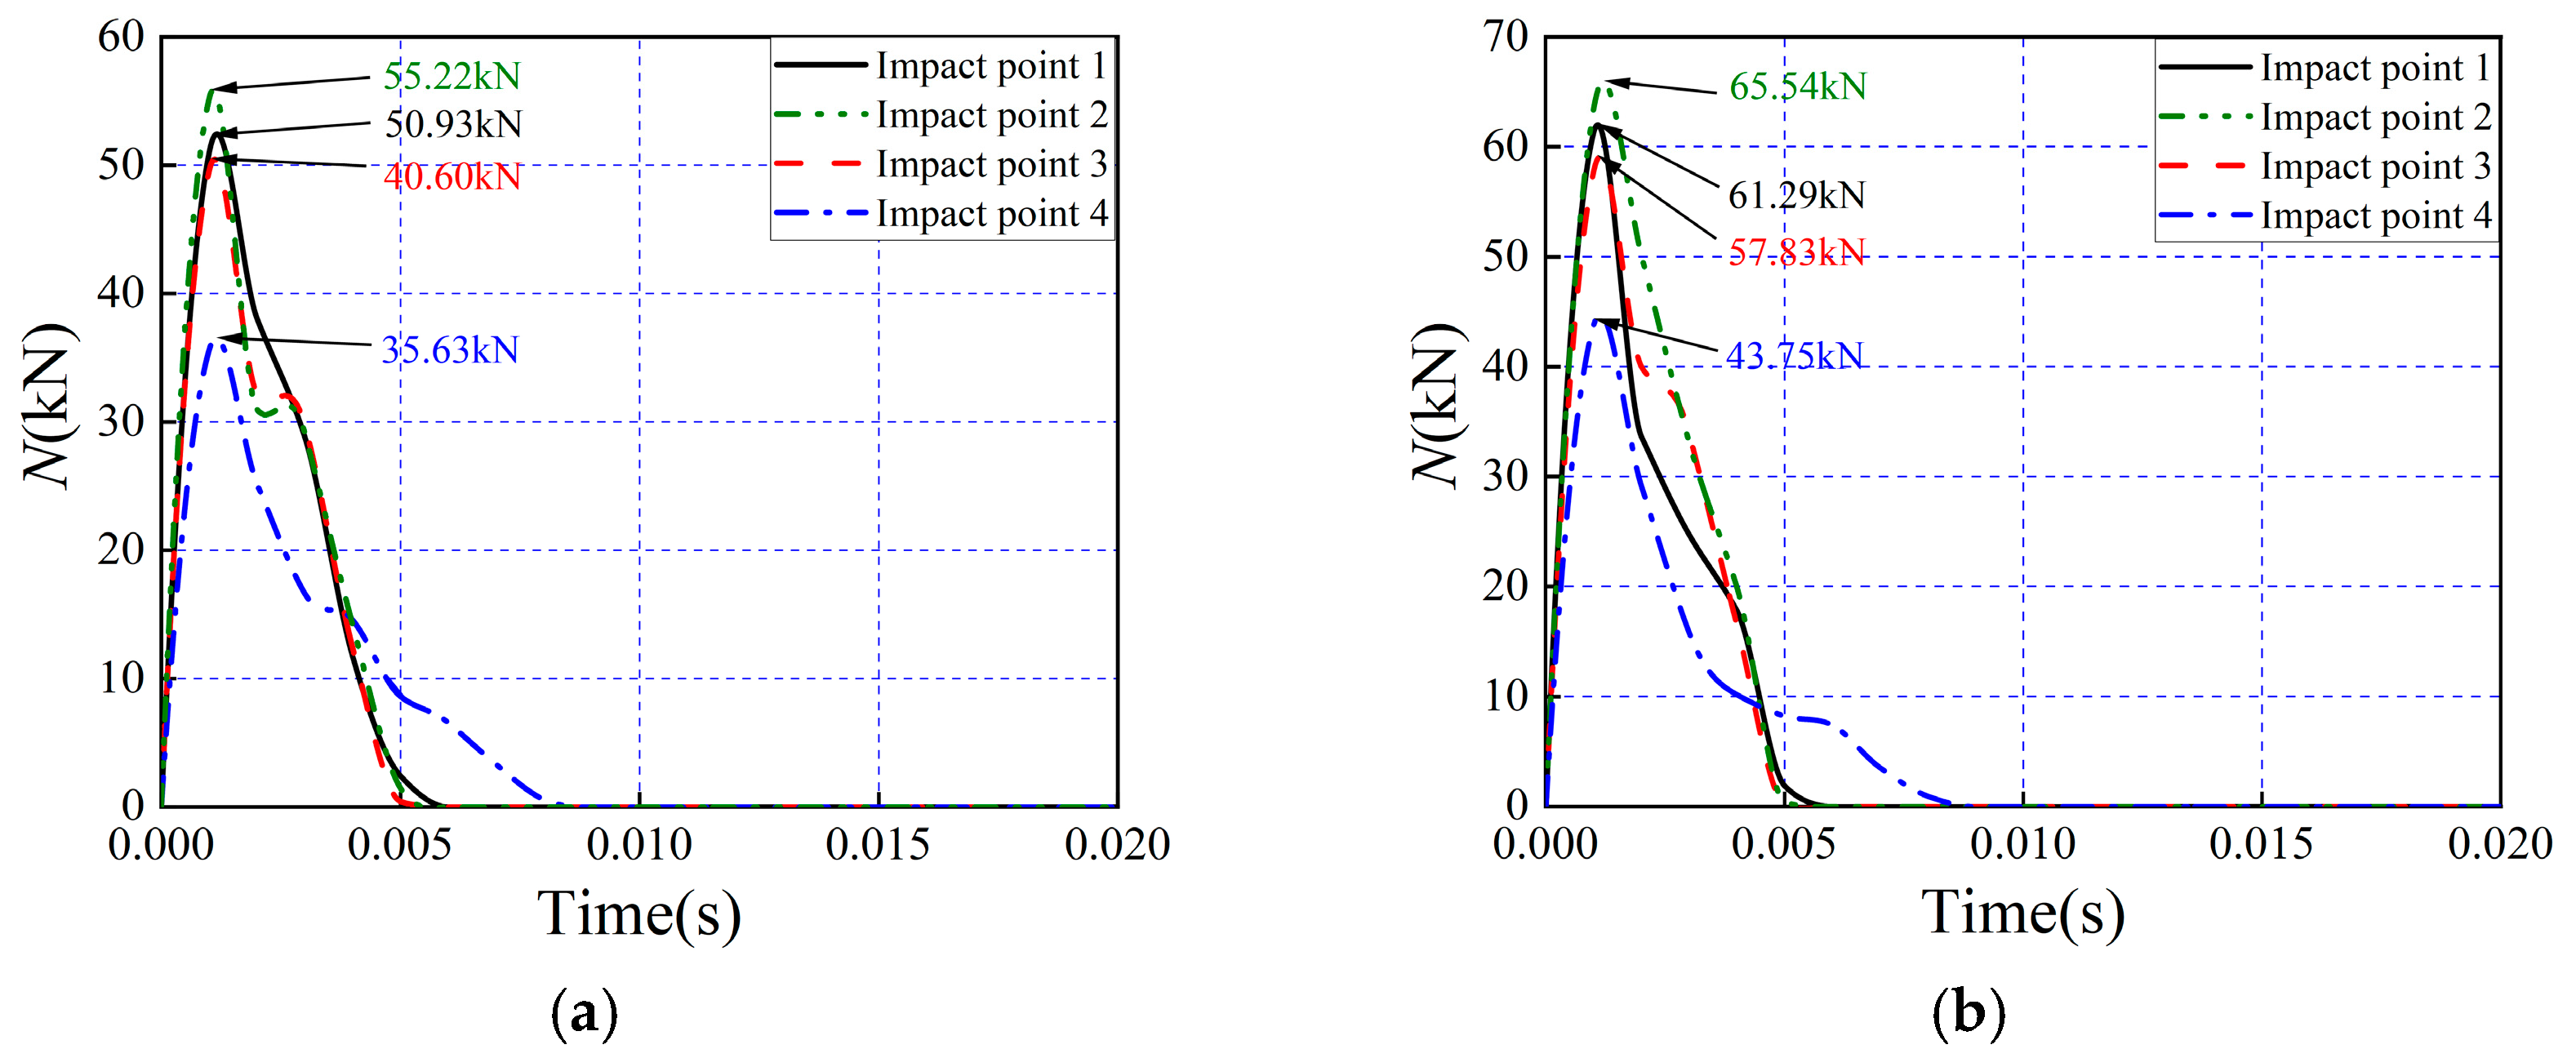
Figure 24 presents the impact force–time history curves of FCSP as well as G-FCSP under different impact locations. It can be observed that for FCSP, the impact force reaches its maximum when the impact is applied at the edge of the panel width. For G-FCSP, however, the maximum impact force occurs when the impact is exerted at one-quarter of panel height. This difference arises because the unreinforced FCSP component lacks effective boundary constraints to provide support at the edge region, whereas the glass fiber grid-reinforced G-FCSP component exhibits enhanced impact resistance. The impact location at one-quarter of the panel height is closer to the supporting boundary, leading to greater strength compared to other locations. Quantitatively, under identical impact conditions, the peak impact forces of G-FCSP increased by 20.3%, 18.7%, 42.4%, and 22.8%, respectively, compared to FCSP, demonstrating that the incorporated glass fiber grid effectively improves the impact resistance at critical locations while also enhancing the impact performance and stiffness at non-critical areas of the wall panel.

6. Conclusions

Regarding the fiber characteristics of each specimen group, this paper first conducted an experimental study on the mechanical properties of concrete mixed with coarse as well as fine polypropylene fibers. Subsequently, a novel PFRC composite wall panel was proposed, and its impact resistance was analyzed using finite element methods. The following conclusions are drawn:
  • In axial compression tests, the descending branch of the fiber-reinforced concrete stress–strain curve was significantly smoother, indicating that fiber addition can substantially improve the ductile and tough properties of concrete. As the coarse fiber content increased, the concrete strength initially rose and then decreased. The peak strength of the specimens was highest (32.66 MPa) at a coarse fiber content of 1% and a fiber length of 30 mm.
  • Utilizing the concrete constitutive model proposed by Guo Zhenhai, a stress–strain curve equation for concrete under compression, suitable for the steel fiber hybrid method employed in this study, was established. This equation was then compared and validated against experimental stress–strain curves, showing an error within 5% and a good agreement. The proposed shape parameter formula and the corresponding stress–strain equation can accurately predict the mechanical response of polypropylene fiber-reinforced concrete.
  • Under the same impact energy, compared to G-CSP, the peak displacement of G-FCSP decreased by 16.5%, and the residual displacement decreased by 27.9%. (There is a slight repetition in the original text, corrected here for flow). The impact energy capacity of G-FCSP was enhanced by 7.2% and 27.8% compared to FCSP and G-CSP, respectively.
  • Under varying impact heights, the incorporation of glass fiber grids effectively enhances the resistance to impact of composite wall panels. As the impact height increases, G-FCSP demonstrates reductions in peak displacement of 3.4%, 6.2%, 5.1%, and 11.3%, respectively, compared to FCSP. Similarly, under different impact mass conditions, when subjected to a 30 kg impact mass, G-FCSP exhibits 5.4% and 3.2% reductions in peak and residual displacements relative to FCSP. With a 120 kg impact mass, the corresponding reductions reach 4.5% and 2.4%. Increasing concrete panel thickness also improves the impact resistance and deformation capacity of composite wall panels, though this enhancement effect remains limited: for G-FCSP, a 15 mm increase in panel thickness results in merely 10.7% and 8.0% reductions in peak and residual displacements, while increasing peak impact force by 12.1%. Both G-FCSP and FCSP exhibit inferior impact resistance, reduced stiffness, and compromised deformation capacity at their edge regions. In contrast, the quarter-height location of the panels shows exceptionally high peak impact force. Practical engineering applications should therefore consider implementing special reinforcement measures for the edge zones of wall panels.

Author Contributions

Conceptualization, X.Z. and Y.S.; methodology, X.Z.; software, Y.S.; validation, X.Z., Y.S. and H.L.; formal analysis, Y.S.; investigation, Y.S., H.Z. and H.L.; resources, X.Z.; data curation, Y.S.; writing—original draft preparation, X.Z., Y.S. and H.L.; writing—review and editing, X.Z., Y.S. and H.L.; visualization, Y.S. and H.L.; supervision, R.H. and H.L.; project administration, W.C. and Y.L. All authors have read and agreed to the published version of the manuscript.

Funding

This research received no external funding.

Data Availability Statement

The data presented in this study is available on request from the corresponding author. The data is not publicly available due to privacy.

Acknowledgments

We acknowledge seven authors in this study.

Conflicts of Interest

The authors declare no conflicts of interest.

References

  1. Brandt, A.M. Fibre reinforced cement-based (FRC) composites after over 40 years of development in building and civil engineering. Compos. Struct. 2008, 86, 3–9. [Google Scholar] [CrossRef]
  2. Bibora, P.; Drdlová, M.; Prachař, V.; Sviták, O. The impact of various types of steel fibres on the strength parameters and blast resistance of high–performance concrete. In Proceedings of the IOP Conference Series: Materials Science and Engineering, Tatry Mountains, Slovakia, 14 August 2019; IOP Publishing: Bristol, UK, 2019; Volume 596, p. 012018. [Google Scholar]
  3. Esaker, M.; Thermou, G.E.; Neves, L. Impact resistance of concrete and fibre-reinforced concrete: A review. Int. J. Impact Eng. 2023, 180, 104722. [Google Scholar] [CrossRef]
  4. Qin, Y.; Zhang, X.; Chai, J.; Xu, Z.; Li, S. Experimental study of compressive behavior of polypropylene-fiber-reinforced and polypropylene-fiber-fabric-reinforced concrete. Constr. Build. Mater. 2019, 194, 216–225. [Google Scholar] [CrossRef]
  5. Ahmed, T.W.; Aljubory, N.H.; Zidan, R.S. Properties and performance of polypropylene fiber reinforced concrete: A review. Tikrit J. Eng. Sci. 2020, 27, 82–97. [Google Scholar] [CrossRef]
  6. Lakshmi, A.; Pandit, P.; Bhagwat, Y.; Nayak, G. A review on efficiency of polypropylene fiber-reinforced concrete. Sustain. Trends Chall. Civ. Eng. Sel. Proc. CTCS 2020, 2021, 799–812. [Google Scholar]
  7. Saini, R.; Chaturvedy, G.K.; Pandey, U.K. Examining the effects of nano iron oxide on physical and mechanical characteristics of rubberized concrete. Innov. Infrastruct. Solut. 2024, 9, 180. [Google Scholar] [CrossRef]
  8. Chaturvedy, G.K.; Pandey, U.K.; Mohan, G. Impact of nano-silica and multi-walled carbon nanotubes on the fire resistance performance of rubberized concrete. J. Build. Pathol. Rehabil. 2025, 10, 161. [Google Scholar] [CrossRef]
  9. Chaturvedy, G.K.; Kothari, P.K.; Pandey, U.K. Analyzing the effect of reduced graphene oxide on the physical, mechanical, and long-term durability performance of rubberized concrete. Fuller. Nanotub. Carbon Nanostruct. 2025, 33, 946–964. [Google Scholar] [CrossRef]
  10. Nguyen, C.T.; Pham, P.N.; Nam, H.P.; Nguyen, P. Factors affecting compressive strength of steel slag concrete: A systematic literature review. J. Build. Eng. 2025, 100, 111686. [Google Scholar] [CrossRef]
  11. Cao, J.; Zou, Z.; Zeng, P. Mechanical properties of fly ash concrete after the coupling effects of sustained load and sulphate erosion. Constr. Build. Mater. 2025, 460, 139866. [Google Scholar] [CrossRef]
  12. Li, Y.L.; Liu, F.Q.; Yu, P.; Du, T. A review of the application of steel slag in concrete. Structures 2024, 63, 106352. [Google Scholar] [CrossRef]
  13. Mohanta, N.R.; Murmu, M. A Review on the Utilization of Steel Slag as Alternative Coarse Aggregate in Concrete: Transforming Waste into Wealth. Iran. J. Sci. Technol. Trans. Civ. Eng. 2025, 1–36. [Google Scholar] [CrossRef]
  14. Zhang, P.; Qin, Z.; Gao, Z.; Wang, F.; Lai, C. Research progress on impact resistance of fiber-reinforced concrete—A review. J. Build. Eng. 2025, 112, 113982. [Google Scholar] [CrossRef]
  15. Li, P.; Huang, M.; Shang, Y.; Kuang, Y.; Xiong, G.; Tang, X. Study on Mechanical Properties of Coarse-Fine Polypropylene Fiber Blended Concrete. Buildings 2025, 15, 2971. [Google Scholar] [CrossRef]
  16. Khaloo, A.; Daneshyar, A.; Rezaei, B.; Fartash, A. Fiber bridging in polypropylene—Reinforced high—Strength concrete: An experimental and numerical survey. Struct. Concr. 2022, 23, 457–472. [Google Scholar] [CrossRef]
  17. Wei, X.; Qin, Z.; Wang, S.; Ma, S.; Shi, M.; Fa, J.; Li, G. Experimental study on dynamic impact mechanical properties and fracture resistance mechanism of polypropylene fiber reinforced concrete. J. Build. Eng. 2025, 112, 113654. [Google Scholar] [CrossRef]
  18. Shang, Y.; Li, P.; Tang, X.; Xiong, G. Numerical Analysis of Impact Resistance of Prefabricated Polypropylene Fiber-Reinforced Concrete Sandwich Wall Panels. Buildings 2025, 15, 3015. [Google Scholar] [CrossRef]
  19. Youm, K.; Moon, J. Experimental study on impact behavior of concrete panel with and without polypropylene macrofibers. Buildings 2023, 13, 303. [Google Scholar] [CrossRef]
  20. Xu, H.; Mindess, S.; Duca, I.J. Performance of plain and fiber reinforced concrete panels subjected to low velocity impact loading. In Proceedings of the RILEM Conference on Fiber Reinforced Concrete, BEFIB, Varenna, Italy, 20–22 September 2004; pp. 1257–1268. [Google Scholar]
  21. Hossain, M.T.; Shahid, M.A.; Mahmud, N.; Habib, A.; Rana, M.M.; Khan, S.A.; Hossain, M.D. Research and application of polypropylene: A review. Discov. Nano 2024, 19, 2. [Google Scholar] [CrossRef]
  22. Behfarnia, K.; Behravan, A. Application of high performance polypropylene fibers in concrete lining of water tunnels. Mater. Des. 2014, 55, 274–279. [Google Scholar] [CrossRef]
  23. Klomranok, T.; Su, Q. Assessment of the use of polypropylene fiber reinforced foam concrete as a subgrade material for the China railway track system (CRTS) III slab ballastless tracks. Transp. Res. Rec. J. Transp. Res. Board 2021, 2675, 641–654. [Google Scholar] [CrossRef]
  24. Raj, A.; Nagarajan, P.; Pallikkara, S.A. Application of fiber-reinforced rubcrete in fencing posts. Pr. Period. Struct. Des. Constr. 2020, 25, 04020037. [Google Scholar] [CrossRef]
  25. Rehman, A.; Ali, M. Optimization of hybrid fiber-reinforced concrete for controlling defects in canal lining. Materials 2024, 17, 4000. [Google Scholar] [CrossRef]
  26. Blazy, J.; Blazy, R. Polypropylene fiber reinforced concrete and its application in creating architectural forms of public spaces. Case Stud. Constr. Mater. 2021, 14, e00549. [Google Scholar] [CrossRef]
  27. Einea, A.; Salmon, D.C.D.C.; Tadros, M.K.; Culp, T. A new structurally and thermally efficient precast sandwich panel system. PCI J. 1994, 39, 90–101. [Google Scholar] [CrossRef]
  28. Mastali, M.; Valente, I.; Barros, J.A. Flexural performance of innovative hybrid sandwich panels with special focus on the shear connection behavior. Compos. Struct. 2017, 160, 100–117. [Google Scholar] [CrossRef]
  29. Gombeda, M.J.; Naito, C.J.; Quiel, S.E. Flexural performance of precast concrete insulated wall panels with various configurations of ductile shear ties. J. Build. Eng. 2021, 33, 101574. [Google Scholar] [CrossRef]
  30. Ahmad, A.; Singh, Y. Flexural behavior of Expanded Polystyrene core Reinforced Concrete Sandwich Panels with different construction methods and end conditions. Structures 2021, 34, 2900–2911. [Google Scholar] [CrossRef]
  31. Zhai, X.; Wang, Y.; Wang, X. Thermal performance of precast concrete sandwich walls with a novel hybrid connector. Energy Build. 2018, 166, 109–121. [Google Scholar] [CrossRef]
  32. Yu, S.; Liu, Y.; Wang, D.; Ma, C.; Liu, J. Theoretical, experimental and numerical study on the influence of connectors on the thermal performance of precast concrete sandwich walls. J. Build. Eng. 2022, 57, 104886. [Google Scholar] [CrossRef]
  33. Zhang, Z.; Hou, Y.; Wang, Y. Research on Thermal Performance of Polypropylene Fiber-Reinforced Concrete Wall Panels. Buildings 2025, 15, 2199. [Google Scholar] [CrossRef]
  34. Kasapgil, S.M.; Binici, B.; Canbay, E. Seismic behavior of AAC infill walls insulated with cementitious lightweight panels in reinforced concrete frames. Eng. Struct. 2021, 248, 113215. [Google Scholar] [CrossRef]
  35. Wang, Z.; Guo, Q. Dynamic performance of prestressed concrete panel under impact loads. Structures 2025, 71, 108157. [Google Scholar] [CrossRef]
  36. Al-Rousan, R.Z.; Alhassan, M.A.; Al-Salman, H. Impact resistance of polypropylene fiber reinforced concrete two-way slabs. Struct. Eng. Mech. 2017, 62, 373–380. [Google Scholar] [CrossRef]
  37. Nili, M.; Afroughsabet, V. The effects of silica fume and polypropylene fibers on the impact resistance and mechanical properties of concrete. Constr. Build. Mater. 2010, 24, 927–933. [Google Scholar] [CrossRef]
  38. Zhang, H.; Wang, L.; Zheng, K.; Bakura, T.J.; Jibrin, T.; Totakhil, P.G. Research on compressive impact dynamic behavior and constitutive model of polypropylene fiber reinforced concrete. Constr. Build. Mater. 2018, 187, 584–595. [Google Scholar] [CrossRef]
  39. GB 175-2023; Common Portland Cement. Standards Press of China: Beijing, China, 2023. (In Chinese)
  40. GB/T 14684-2022; Sand for construction. Standards Press of China: Beijing, China, 2022. (In Chinese)
  41. JGJ/T 221-2010; Technical Specification for Application of Fiber-Reinforced Concrete. China Architecture and Building Press: Beijing, China, 2010. (In Chinese)
  42. JGJ 55−2019; Specification for Mix Proportion Design of Ordinary Concrete. China Construction Industry Press: Beijing, China, 2019. (In Chinese)
  43. Sohaib, N.; Seemab, F.; Sana, G.; Mamoon, R. Using polypropylene fibers in concrete to achieve maximum strength. In Proceedings of the Eighth International Conference on Advances in Civil and Structural Engineering, Kuala Lumpur, Malaysia, 24 June 2018; pp. 36–42. [Google Scholar]
  44. Gao, H.; Xu, L.H.; Yu, M.; Long, Y.; Yu, C.L.; Huang, L.; Chi, Y. Cyclic compressive behavior of high-performance hybrid fiber reinforced recycled aggregate concrete: Degradation law and acoustic emission features. Constr. Build. Mater. 2024, 431, 136412. [Google Scholar] [CrossRef]
  45. GB/T 50081−2019; Standard for Test Methods of Concrete Physical and Mechanical Properties. China Architecture and Building Press: Beijing, China, 2019. (In Chinese)
  46. Guo, Z.H. Strength and Constitutive Relation of Concrete-Principle and Application; China Architecture and Building 541 Press: Beijing, China, 2004. (In Chinese) [Google Scholar]
  47. Zhao, X.; Liang, H.; Lu, Y.; Zhao, P. Size effect of square steel tube and sandwiched concrete jacketed circular RC columns under axial compression. J. Constr. Steel Res. 2020, 166, 110534. [Google Scholar] [CrossRef]
  48. Federation International du Beton (FIB). Model Code 2010-First Complete Draft; Fédération Internationale du Béton, Bulletin 56: Lausanne, Switzerland, 2010; Volume 1, pp. 763–777. [Google Scholar]
  49. Cowper, G.R.; Symonds, P.S. Strain-Hardening and Strain-Rate Effects in the Impact Loading of Cantilever Beams; Brown University: Providence, RI, USA, 1957. [Google Scholar]
  50. Barabanshchikov, Y.; Belyaeva, S.; Avdeeva, A.; Perez, M. Fiberglass reinforcement for concrete. Appl. Mech. Mater. 2015, 725, 475–480. [Google Scholar] [CrossRef]
  51. Li, Z.-X.; Zhang, X.; Shi, Y.; Wu, C.; Li, J. Predication of the residual axial load capacity of CFRP-strengthened RC column subjected to blast loading using artificial neural network. Eng. Struct. 2021, 242, 112519. [Google Scholar] [CrossRef]
  52. Ochola, R.; Marcus, K.; Nurick, G.; Franz, T. Mechanical behaviour of glass and carbon fibre reinforced composites at varying strain rates. Compos. Struct. 2004, 63, 455–467. [Google Scholar] [CrossRef]
  53. Yan, P.P. Mechanical and Thermal Properties of Composite Wallboard with Mixed Recycled Coarse Aggregate Concrete; Nanjing University of Aeronautics and Astronautics: Nanjing, China, 2023. (In Chinese) [Google Scholar]
  54. Zhao, W.Y.; Guo, Q.Q. Study on behavior of double-skin steel-concrete composite walls subjected to low-velocity impact. J. Civ. Eng. 2018, 51, 88–94. (In Chinese) [Google Scholar]
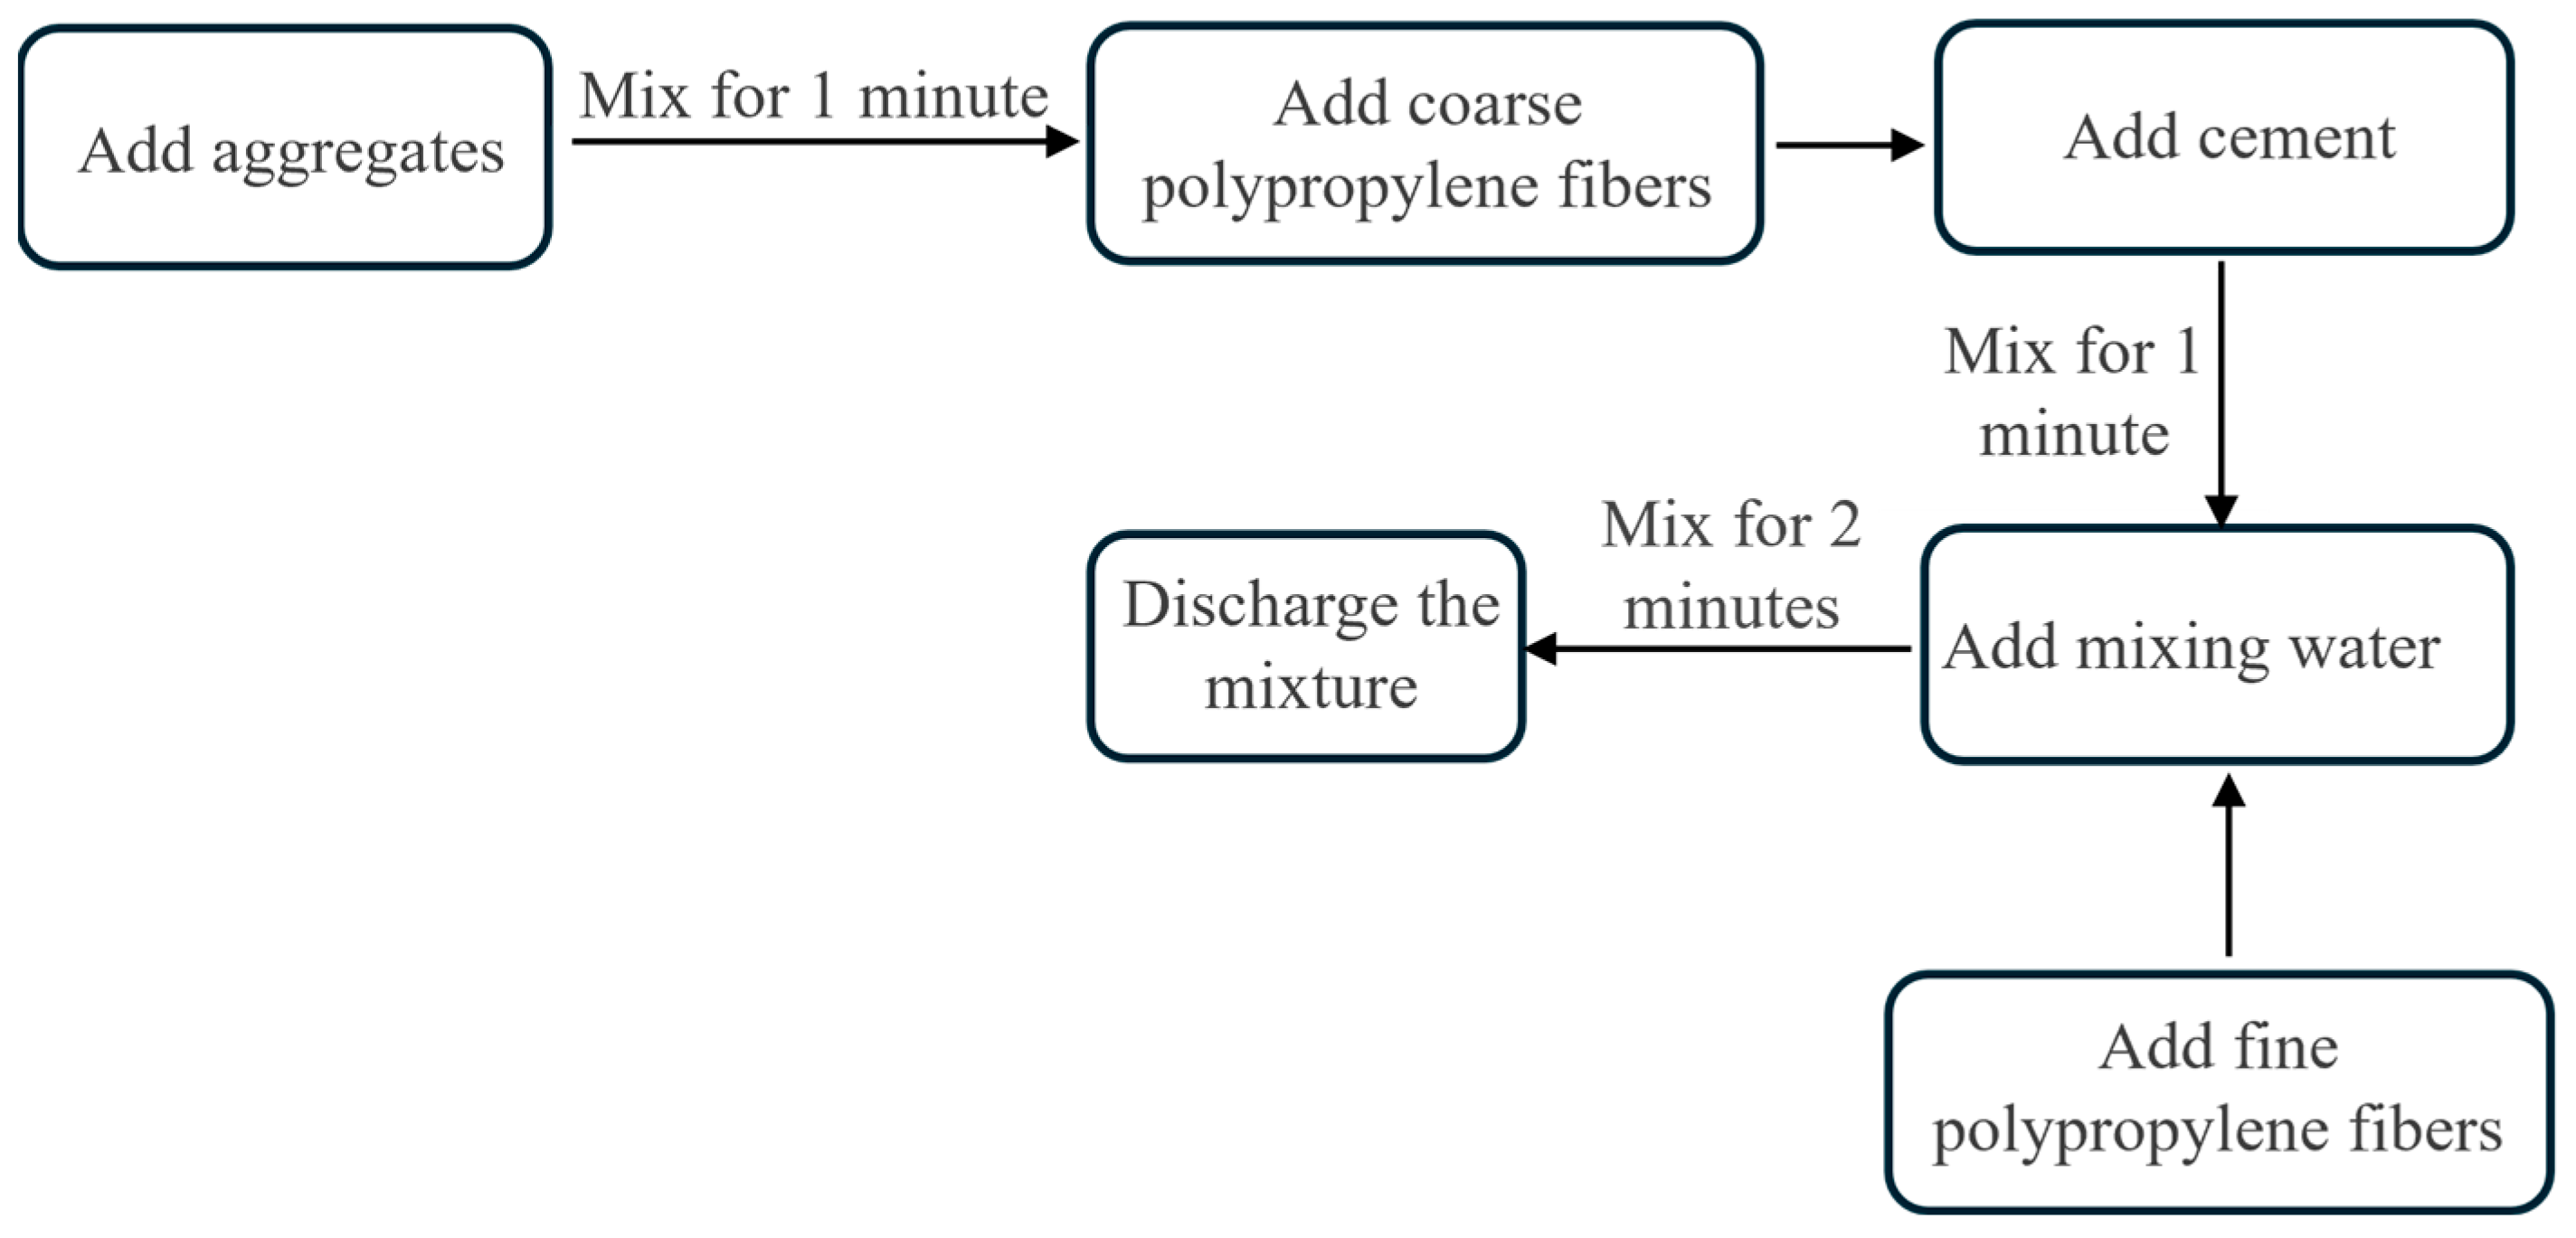
Figure 1. Mixing process.
Buildings 15 03983 g001
Figure 2. Failure mode comparison of specimens. (a) Plain concrete. (b) Fiber-reinforced concrete.
Buildings 15 03983 g002
Figure 3. Axial compression stress–strain curve. (a) G1; (b) G2; (c) G3; (d) G4; (e) G5; (f) G6; (g) G7.
Buildings 15 03983 g003
Figure 4. Axial compression stress–strain curve fitting diagram. (a) G1; (b) G2; (c) G3; (d) G4; (e) G5; (f) G6; (g) G7.
Buildings 15 03983 g004aBuildings 15 03983 g004b
Figure 5. Comparison between the predicted curve and the axial compressive stress–strain curve. (a) G1; (b) G2; (c) G3; (d) G4; (e) G5; (f) G6; (g) G7.
Buildings 15 03983 g005aBuildings 15 03983 g005b
Figure 6. Three-dimensional schematic diagram of wall panel structural configuration. (a) G-FCSP; (b) FCSP; (c) G-CSP.
Buildings 15 03983 g006
Figure 7. Computational simulation framework for assessing impact behavior of wall panel.
Buildings 15 03983 g007
Figure 8. Validation model.
Buildings 15 03983 g008
Figure 9. Comparison of finite element results with test results [54]. (a) Time history–displacement curve of H15; (b) Time history–displacement curve of H30; (c) Time history–impact force curve of H15; (d) Time history–impact force curve of H30.
Buildings 15 03983 g009
Figure 10. Wall panel displacement time history curve.
Buildings 15 03983 g010
Figure 11. Wall panel impact force–time history curve.
Buildings 15 03983 g011
Figure 12. Wall panel damage cloud map. (a) Top face of G-FCSP; (b) Bottom face of G-FCSP; (c) Top face of FCSP; (d) Bottom face of FCSP; (e) Top face of G-CSP; (f) Bottom face of G-CSP.
Buildings 15 03983 g012
Figure 13. The effect of impact height on the displacement–time history response of a wallboard. (a) FCSP; (b) G-FCSP.
Buildings 15 03983 g013
Figure 14. The variation in peak and residual displacement with impact height for the wallboard. (a) FCSP; (b) G-FCSP.
Buildings 15 03983 g014
Figure 15. (a,b) The effect of impact height on the impact force–time history of the wall panel.
Buildings 15 03983 g015
Figure 16. The effect of impact mass on the displacement–time history response of the wall panels. (a) FCSP; (b) G-FCSP.
Buildings 15 03983 g016
Figure 17. The variation in peak and residual displacement with impact mass for the wallboard. (a) FCSP; (b) G-FCSP.
Buildings 15 03983 g017
Figure 18. The time history curve of wallboard impact force under different impact mass. (a) FCSP; (b) G-FCSP.
Buildings 15 03983 g018
Figure 19. The effect of concrete slab thickness is reflected in the wallboard’s displacement time history. (a) FCSP; (b) G-FCSP.
Buildings 15 03983 g019
Figure 20. The variation in both peak and residual displacement in the wallboard correlates with the slab thickness. (a) FCSP; (b) G-FCSP.
Buildings 15 03983 g020
Figure 21. The variation in impact force–time history is influenced by concrete slab thickness. (a) FCSP; (b) G-FCSP.
Buildings 15 03983 g021
Figure 22. The impact location schematic of the wallboard.
Buildings 15 03983 g022
Figure 23. The effect of impact position on wallboard displacement–time history. (a) FCSP; (b) G-FCSP.
Buildings 15 03983 g023
Figure 24. The time history curve of wallboard impact force under different impact positions. (a) FCSP; (b) G-FCSP.
Buildings 15 03983 g024
Table 1. Fiber performance index.
TypeLength
/mm
Diameter
/um
Mass Density/
(g/cm3)
Tensile Strength/MPaElastic Modulus/GPaElongation at Break/%
Coarse3010000.91627.9106.3
Coarse5010000.91627.9106.3
Fine12270.916255.222
Table 2. Performance index of cement.
Specific Surface Area/m2·kg−1Setting Time/minCompressive Strength/MPaFlexural Strength/MPa
Initial SettingFinal Setting3d28d3d28d
3509515028.549.35.67.9
Table 3. Fiber characteristics of each group of specimens.
Test GroupCoarse Fiber Volume
Fraction/(%)
Fine Fiber Volume
Fraction/(%)
Fine Fiber Length/(mm)Coarse Fiber Length/(mm)
10.50.13012
20.550
3130
4150
51.530
61.550
7////
Table 4. Replicating the impact parameters of the specimen.
Specimen Name in Reference [54]Drop Hammer Height/(m)Impact Velocity/(m/s)
H151.55.42
H3037.67
Disclaimer/Publisher’s Note: The statements, opinions and data contained in all publications are solely those of the individual author(s) and contributor(s) and not of MDPI and/or the editor(s). MDPI and/or the editor(s) disclaim responsibility for any injury to people or property resulting from any ideas, methods, instructions or products referred to in the content.