Article

The Spatiotemporal Distribution Characteristics and Sensitivity Analysis of Stress in the Galleries of a Super-High Arch Dam During Construction

1
Changjiang River Scientific Research Institute, Wuhan 430010, China
2
Research Center on National Dam Safety Engineering Technology, Wuhan 430010, China
3
College of Water Conservancy and Hydropower Engineering, Hohai University, Nanjing 210098, China
*
Author to whom correspondence should be addressed.
Buildings 2025, 15(21), 3967; https://doi.org/10.3390/buildings15213967
Submission received: 15 September 2025 / Revised: 16 October 2025 / Accepted: 31 October 2025 / Published: 3 November 2025

Abstract

In recent years, construction has started on several high arch dams in the southwestern region of China, and the problem of concrete crack prevention has become prominent. During the construction period of the foundation gallery of high arch dams, the stress is high and there are many influencing factors, making it more prone to cracking, and there is relatively little systematic research on this issue. This article focuses on the cracks in the 733 m gallery of the 7th section of a super-high arch dam. Using self-developed 3D finite element software, the stress spatiotemporal distribution and influencing factors during the construction period were analyzed. Research has shown that a decrease of 4 °C in the average annual temperature inside the gallery results in an increase of approximately 0.25 MPa in surface stress on the arch and bottom plates. When poured to an elevation of 870 m, the circumferential stress caused by the self-weight on the arch of the gallery is 2.3 MPa, but it decreases to 0.9 MPa at a distance of 0.3 m from the surface of the arch. The stress at both ends of the bottom plate before and after the arch sealing is always greater than that in the middle, with a maximum stress of about 2.4 MPa. The selection of material parameters has a significant impact on the evaluation of crack resistance. When calculating the mechanical parameters of fully graded concrete, the crack resistance safety of the arch crown and bottom plate is significantly reduced. It is recommended to focus on strengthening the water cooling and “winter period” insulation measures for the arch crown and bottom plate during gallery construction and to use fully graded test parameters in simulation analysis to improve calculation accuracy and structural safety. The research results can provide reference for similar projects.

1. Introduction

As a highly statically indeterminate complex shell structure with superior mechanical properties and economic benefits, high arch dams play a crucial role in water conservancy and hydropower engineering [1,2,3]. However, the construction of high arch dams is confronted with challenges such as complex geological conditions, high-head hydraulic loads, and the construction of massive concrete structures. In particular, the gallery system serves as an essential passage within the dam body for transportation, monitoring, drainage, and maintenance [4,5,6]. During the construction period of high arch dams, the rock or concrete masses surrounding the galleries undergo a complex process of stress changes [7]. The spatiotemporal distribution characteristics of these stresses not only impact the stability and safety of the galleries themselves but may also have a profound influence on the stress state of the entire dam body [8,9].
Engineering practice has shown that the failure of arch dam structures [10,11] or the occurrence of harmful cracks in the concrete around their galleries has become a common problem worthy of attention. In 1911, the Austin Dam in the United States, which was 15 m high, collapsed due to its fragile foundation and the effect of uplift pressure. In 1963, the Vajoint hyperbolic arch dam in Italy experienced a 270 million cubic meter landslide in the upstream reservoir area, causing the dam to instantly exceed its ultimate bearing capacity [12], causing the reservoir to overflow and resulting in over 2000 deaths. The Kolnbrein hyperbolic arch dam, which is 200 m high in Austria, has a thin shape. When the water level reaches an elevation of 1890 m, cracks occur at the dam heel, the curtain is pulled apart, and the leakage rate increases sharply. During the second-stage impoundment of the Jinping I Arch Dam, cracks developed within the drainage holes of the drainage gallery at the dam base [13]. Prior to impoundment, multiple transverse deep cracks, with a maximum depth of 3.7 m, were observed in the crown of the 979 m-elevation traffic gallery and the 940 m-elevation foundation gallery of the Dagangshan Arch Dam [14]. The 15 m-below-crest horizontal gallery of the Ponte D’Garcia Dam, constructed in 1969, experienced multiple cracks during its operational phase [15]. Additionally, cracks have been reported in the galleries of the Padoh Dam in India [16] and the Zeuzier Arch Dam in Switzerland [6]. Once cracks occur in a dam, they tend to continuously develop and expand, posing significant risks. From a mechanical performance perspective, cracks disrupt the original static and dynamic mechanical response mechanisms of the arch dam. Functionally, they undermine the dam’s seepage resistance and reduce its long-term durability. Aesthetically, cracks detract from the overall appearance of the dam. More importantly, the presence of cracks seriously jeopardizes the overall structural safety of the arch dam [17].
In response to the issue of gallery cracking in high arch dams, scholars have conducted a series of research endeavors. Many researchers attribute the majority of cracks around galleries within dams to abrupt temperature drops in the surface concrete during the construction phase [18,19,20]. During construction, variations in the concrete temperature field may generate significant thermal stresses at locations such as gallery sidewalls and crowns. When tensile stresses exceed the ultimate strength of the concrete or when stress deformations surpass the ultimate deformation values of the concrete, longitudinal or circumferential cracks may develop. Given the high temperatures of the surrounding concrete during construction and the relatively low internal temperatures of the galleries, substantial temperature gradients form on the gallery surfaces, leading to surface cracks. The situation exacerbates during sudden temperature drops caused by cold waves. Furthermore, under certain conditions, surface cracks can evolve into deep or through-thickness cracks. Thermal stresses induced in the surrounding concrete of galleries due to foundation temperature differentials or internal–external temperature disparities, when encountered with structural features such as openings, sharp corners, or abrupt shape changes that cause stress concentrations, often result in a multiplicative increase in tensile stresses, thereby leading to cracks [17]. Zhuang, on the other hand, posits that excessive circumferential tensile stresses caused by the self-weight of the Dagangshan high arch dam near the gallery crown prior to impoundment are the root cause of gallery cracks. Additionally, if microseismic activities continue to intensify, cracks may emerge in galleries near the dam toe [7]. Nevertheless, the issue of concrete cracking around galleries is not solely influenced by the aforementioned factors; it is also affected by factors such as grouting uplift and leakage [21], hydrostatic pressure [22], alkali-aggregate reactions [23], and the weight of the dam [7]. These factors intertwine and interact synergistically. To this end, Wei et al. derived stress equations for D-shaped concrete galleries using the elastic complex function method and conformal mapping technique and analyzed their cracking mechanisms [21]. Lin et al., based on an analysis of cracking mechanisms and risk control investigations, proposed an engineering procedure for controlling and preventing gallery cracking by optimizing design theories, construction methods, and management philosophies [24]. Cavuslu et al. evaluated the impact of different reservoir water levels on the seismic performance of arch dams by considering creep material models [25]. All these studies have made positive contributions to understanding the mechanisms of gallery cracking in arch dams and developing anti-cracking technologies.
In general, current research predominantly focuses on the factors influencing stress in arch dam galleries and the causes of cracks in galleries during the construction process of engineering projects. However, there is a notable lack of studies on the spatial distribution of stress in various parts of arch dam galleries and its evolution over time. The author argues that for arch dam galleries, elucidating the temporal and spatial distribution patterns of stress is fundamental and prerequisite for formulating and optimizing anti-cracking criteria and measures. In light of this, this paper takes a super-high arch dam as the research object and addresses the crack issue in the gallery at an elevation of 733 m in Dam Section 7#. Based on a self-developed three-dimensional finite element simulation analysis software [26,27], a sensitivity analysis is conducted on the temporal and spatial distribution characteristics of stress in the gallery at an elevation of 733 m during the construction period, as well as on the influencing factors. The impacts of self-weight, temperature loads, gallery air temperature, wet-screened and fully graded concrete parameters and the presence of pump houses and sumps on the temporal and spatial distribution of stress in the gallery are clarified. The aim is to provide references for the construction and safety assessment of high arch dam galleries during the construction period and to further advance the development of high arch dam construction technology.

2. Case of Gallery Cracking

2.1. Basic Information of the Dam and the Gallery at an Elevation of 733 m

The development of this hydropower station primarily focuses on power generation, while also considering flood control to drive local development and alleviate poverty for resettled residents. The normal water level of the reservoir is set at 975 m, and the dead water level at 945 m. The main components of the hydroproject include water retaining, spillway, and diversion power generation structures. The water retaining structure is a concrete double-curvature arch dam, with a dam crest elevation of 988 m and a foundation surface at 718 m. The dam body is thin and constructed without longitudinal joints, using full-bin placement techniques. It is divided into 15 dam sections by 14 transverse joints. Five layers of longitudinal horizontal galleries are arranged within the dam. The steep slope sections on both banks are connected to grouting adits through climbing galleries. The foundation gallery (Gallery 733) runs through Dam Sections 5# to 10#, featuring a city-gate-shaped cross-section with dimensions of 4.0 m × 4.5 m. Dam Section 7# accommodates a pump room and a sump. The pump room spans an elevation range from 729.5 m to 735.5 m, while the sump extends from 719.4 m to 728.6 m. Two elevator shafts are also installed within the dam, located in Dam Sections 8# and 11#, respectively, along with stairwells and cable shafts. Each level of horizontal gallery is interconnected with the elevator shafts. The layout diagram of the galleries and outlets of the super-high arch dam is shown in Figure 1, it should be noted that the yellow dashed box in Figure 1 represents a partial internal structure and approximate location diagram.

2.2. Basic Information on the Cracks in the 733 Gallery of Dam Section 7# on the Riverbed

On 1 November 2018, a slender longitudinal crack nearly as wide as the dam section was discovered along the centerline of the gallery vault at an elevation of 733 m in the 8th pour of Dam Section 7#. The crack extended from the 7# transverse joint to the 6# transverse joint along the vault centerline, with a width ranging from 0.06 mm to 0.22 mm. According to ultrasonic testing, the crack depth ranged from 20.8 cm to 36.5 cm, with an average depth of 29 cm (similar to the cracks observed in the vault of the 5# and 10# riverbed dam sections at an elevation of 733 m before joint grouting). As of November 1 when the crack was found, a total of 47 pours (up to an elevation of 868 m) had been placed in Dam Section 7#, reaching a height of 150 m, with joint grouting carried out up to an elevation of 817 m. Specifically, the 7#-8 pour (at an elevation from 735.5 m to738.5 m) commenced on 20 June 2017, with an age of 498 days at the time of crack discovery. The pouring temperature was 17.5 °C, the maximum temperature reached 26.7 °C, and the grouting temperature was 13.3 °C. Joint grouting was completed on 19 January 2018. By November 2018, the temperature had risen to 16.7 °C, while the temperature inside the gallery was approximately 18 °C. The temperature control process was normal, and no cracks were observed during any of the water circulation or grouting stages.
Based on preliminary analysis, the late-age crack resistance of low-heat cement concrete is not inferior to that of moderate-heat cement concrete under similar conditions. Considering that the concrete age was nearly 500 days when the crack was found in the vault of the 733 m foundation gallery in Dam Section 7#, it can be preliminarily ruled out that the crack was caused by factors inherent to the low-heat cement concrete material itself.

3. Calculation Methods and Conditions

3.1. Analysis Method and Software

This study employs the three-dimensional finite element method for the simulation analysis of temperature and stress fields in concrete dams during the construction period [17]. The simulation software utilized is Ckysts [26,27,28], an independently developed concrete structure temperature control simulation analysis software by the Yangtze River Scientific Research Institute. The software has completed CPU + GPU. Heterogeneous parallelization transformation has greatly improved computational efficiency, enabling simulation of temperature, humidity, stress, and deformation spatiotemporal distribution throughout the entire life cycle of hydraulic structures (including construction, water storage, and operation) under complex service environmental conditions. It can simulate various factors including environment (gas temperature, water temperature, strong wind, sunshine, small warehouse environment, etc.), materials (hydration, hardening, creep, shrinkage, self-transformation), structures (contact surfaces, joints, keyways, reinforcement, etc.), construction (pouring, insulation, cooling water supply, excavation, grouting, etc.) in a refined manner, and has the ability to carry out real-time dynamic tracking and simulation calculation of super large projects. It has been used in the Three Gorges, South to North Water Diversion, Danjiangkou, Wudongde, and it has been applied and verified in a series of large-scale projects in China, such as Goupitan, diverting the Yangtze River to the Huai River, and diverting the Yangtze River to supplement the Han River.

3.2. Main Calculation Parameters

3.2.1. Temperature Data

The external ambient temperature of the dam is adopted as the fitted value of the annual average temperature and considered in the simulation calculation according to Formula (1) [17]. The air temperatures inside the gallery, collecting well, and pump house are fitted based on the actual site conditions and considered according to Formula (2).
T a = 24.3 + 6.85 × cos π 6 × t 6.3
T a = 18.5 + 2.0 × cos π 6 × t 6.3
where T a is the fitting value of air temperature, unit °C; t is the time, unit is month.

3.2.2. Main Thermodynamic Parameters of Foundation and Concrete

The main thermodynamic parameters of the foundation are referenced from the project documentation and similar projects [17]. The various thermodynamic parameters of the concrete (C18035) were obtained through laboratory tests. The specific values of these parameters are detailed in Table 1.
Elastic modulus of concrete (GPa):
E = 36.5 × 1.0 e 0.41 t 0.415
Concrete compressive strength (MPa):
f t = 46.5 1.0 e 0.49 τ 0.497
Concrete tensile strength (MPa):
f t = 3.0 1.0 e 0.967 τ 0.691
According to reference [17] the creep degree of concrete is taken as follows:
C ( t , τ ) = ( f 1 + g 1 τ p 1 ) [ 1 e τ 1 ( t τ ) ] + ( f 2 + g 2 τ p 2 ) [ 1 e τ 2 ( t τ ) ]
Adiabatic temperature rise (°C):
θ ( t ) = 18.3 t / t + 4.00

3.3. Construction and Measures

The progress of dam concrete placement, the division of grouting zones, and the timing of arch closure grouting were all simulated based on the actual on-site progress. Concrete placement for this dam section commenced in April 2017, with the elevation where the gallery is located being poured in June 2017. Mid-term and late-stage water flow were conducted at the end of September and early November of the same year, respectively. The water flow conditions for Dam Section 7# are presented in Table 2. The insulation measures are detailed in Table 3, with lateral insulation being determined based on the concrete placement progress of adjacent dam sections.

3.4. Calculation Model and Conditions

3.4.1. Calculation Model

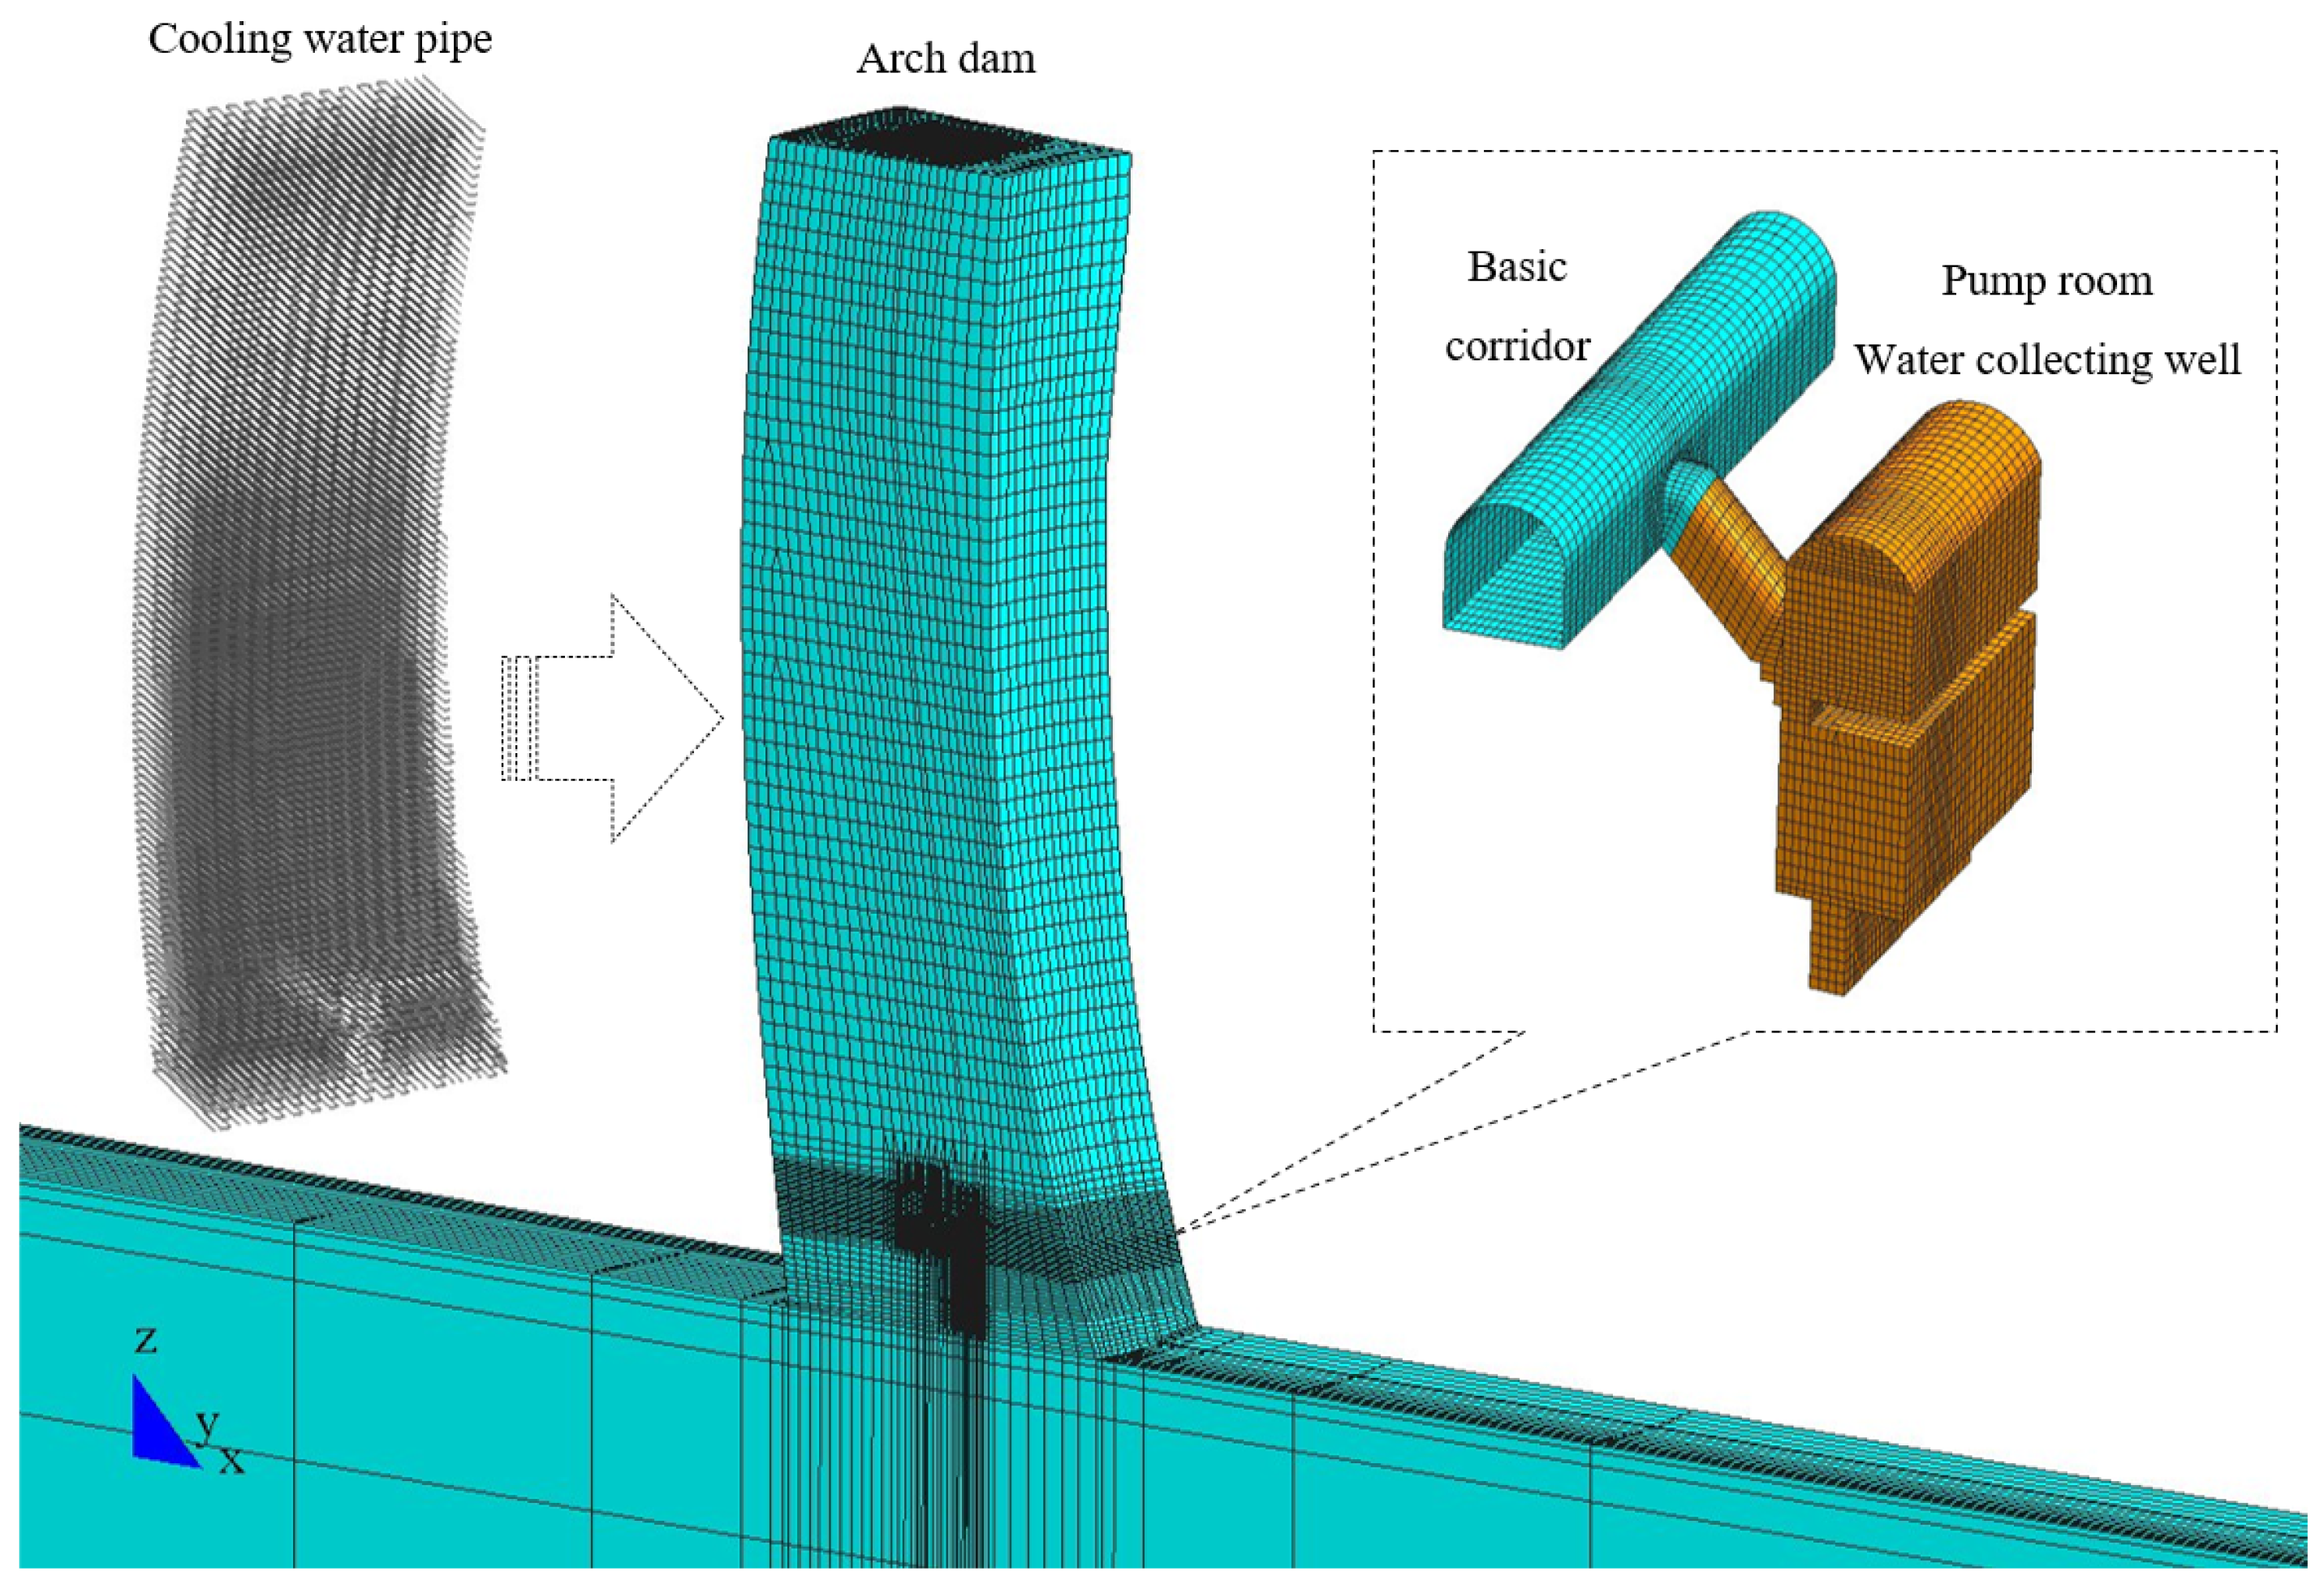
According to the construction progress of the project, by November 2018, the pouring of the 7# dam section had reached an elevation of 870 m. A three-dimensional finite element simulation model was established, as illustrated in Figure 2. The model comprises a total of 164,318 elements and 170,015 nodes. To ensure computational accuracy, refined meshing was applied to the gallery, collecting well, and pump room areas (as shown in Figure 2). The cooling process of the water pipes was simulated with high precision using an improved embedded water pipe element method. The layout of the cooling pipes was designed in accordance with the concrete construction technical requirements of the project, and the arrangement of cooling pipes in the 7# dam section is depicted in Figure 2. The X-direction represents the upstream-downstream direction, with downstream being positive, the Y-direction represents the left-right bank direction, with the left bank being positive, and the Z-direction represents the elevation direction, with the vertically upward direction being positive.
When simulating the temperature field, it is assumed that the bottom and surrounding surfaces of the dam foundation are adiabatic boundaries, the other surfaces are heat exchange boundaries (third type of thermal boundary conditions) [11], the transverse joint surface of the dam body is adiabatic boundary, and after the gallery is capped, it is adiabatic boundary. When simulating the stress field, it is assumed that the foundation bottom is a hinged support, surrounded by chain rod supports, and the free faces of the dam structure are all free.

3.4.2. Feature Points and Feature Sections

To facilitate the analysis of results, a series of characteristic points were selected in the 733 gallery of Dam Section 7#. Specifically, points T1 to T6 are located at the middle of the vault, with distances of 0 cm, 30 cm, 60 cm, 90 cm, 120 cm, and 160 cm from the vault surface, respectively. Point T7 is situated at the right end of the gallery in this dam section. Point T8 is located at the left end near the left bank. Points T9 to T14 are positioned beneath the floor slab, with distances of 0 cm, 30 cm, 70 cm, 90 cm, 120 cm, and 160 cm from the floor slab surface, respectively. Point T15 is at the right end of the gallery in this dam section, and point T16 is at the left end. The specific locations of these characteristic points are illustrated in Figure 3.

3.4.3. Calculation Conditions

To facilitate the analysis of the stress characteristics and cracking causes of the 733 gallery vault in Dam Section 7#, the actual concrete placement process was simulated, and ten computational cases were established for calculation and analysis, as shown in Table 4. Among them, Cases 1–3 were used to analyze the influence of factors such as self-weight and temperature on the gallery stress. Cases 4 and 5 were employed to analyze the impact of air temperature inside the gallery on the gallery stress. Cases 6 and 7 were utilized to examine the effect of differences in concrete mechanical parameters caused by wet screening on the gallery stress. Case 8 was designed to analyze the influence of the water pipe layout on the gallery roof on the gallery stress. Case 9 was conducted to assess the impact of the temperature inside the pump house and sump well on the stress characteristics of the gallery. Considering the enclosed structural characteristics of the sump well and pump house, the temperature inside them was maintained at a constant 18 °C. Case 10 analyzed the influence of the presence of the pump house and sump well on the stress characteristics of the gallery from a structural perspective. Based on the mesh shown in Figure 2, the cavities of the pump house and sump well were “filled” using solid elements (i.e., without considering the pump house and sump well).

4. Results Analysis and Discussion

4.1. Analysis of Temperature Characteristics of the 733 Gallery

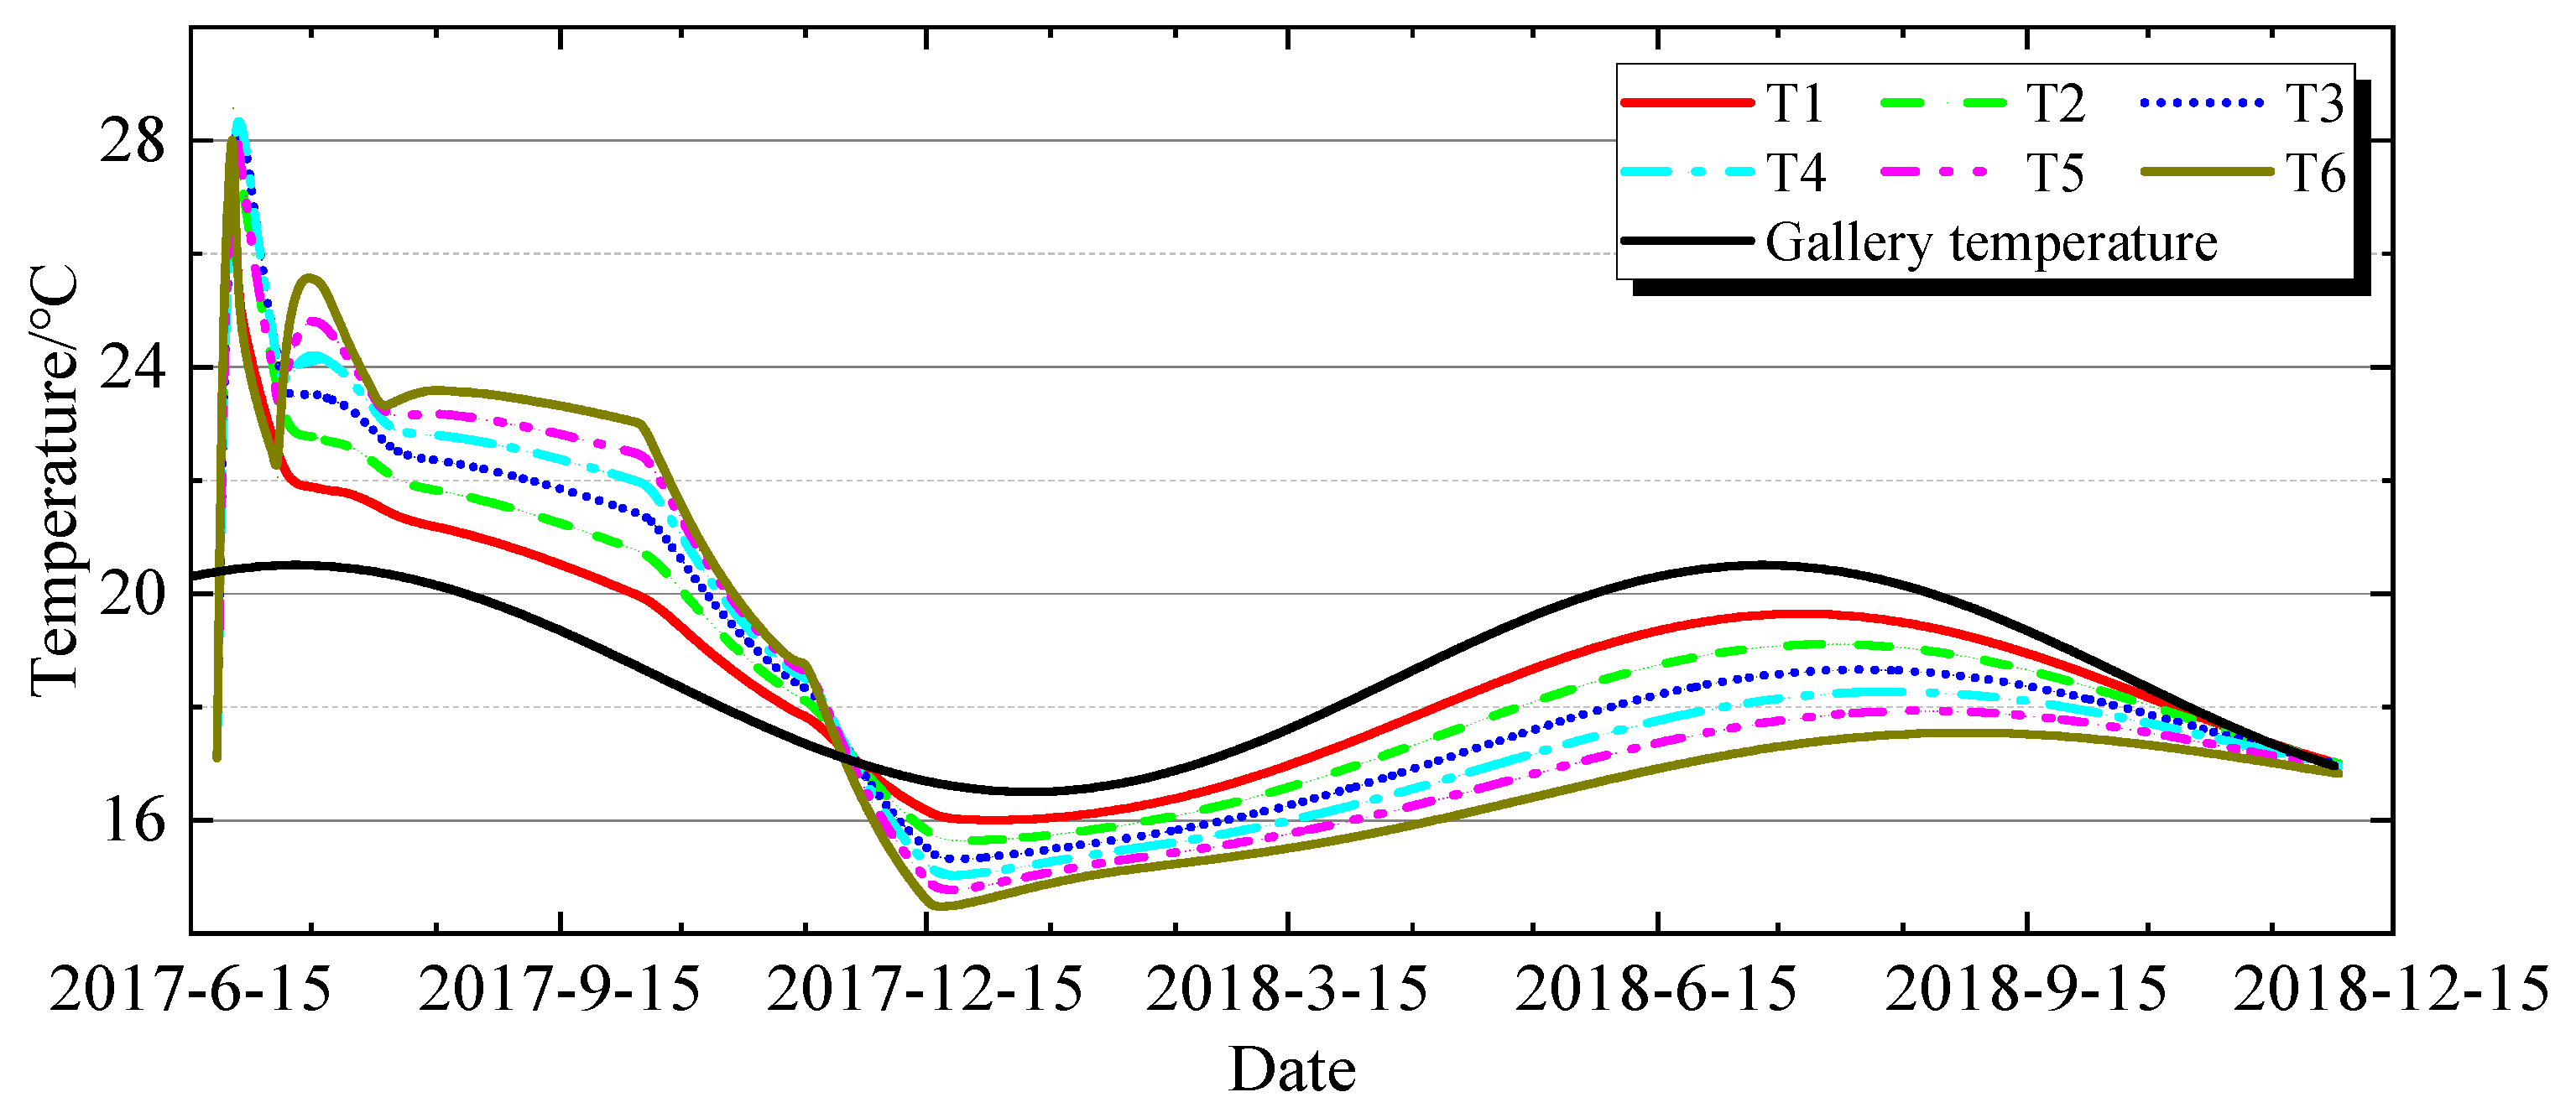
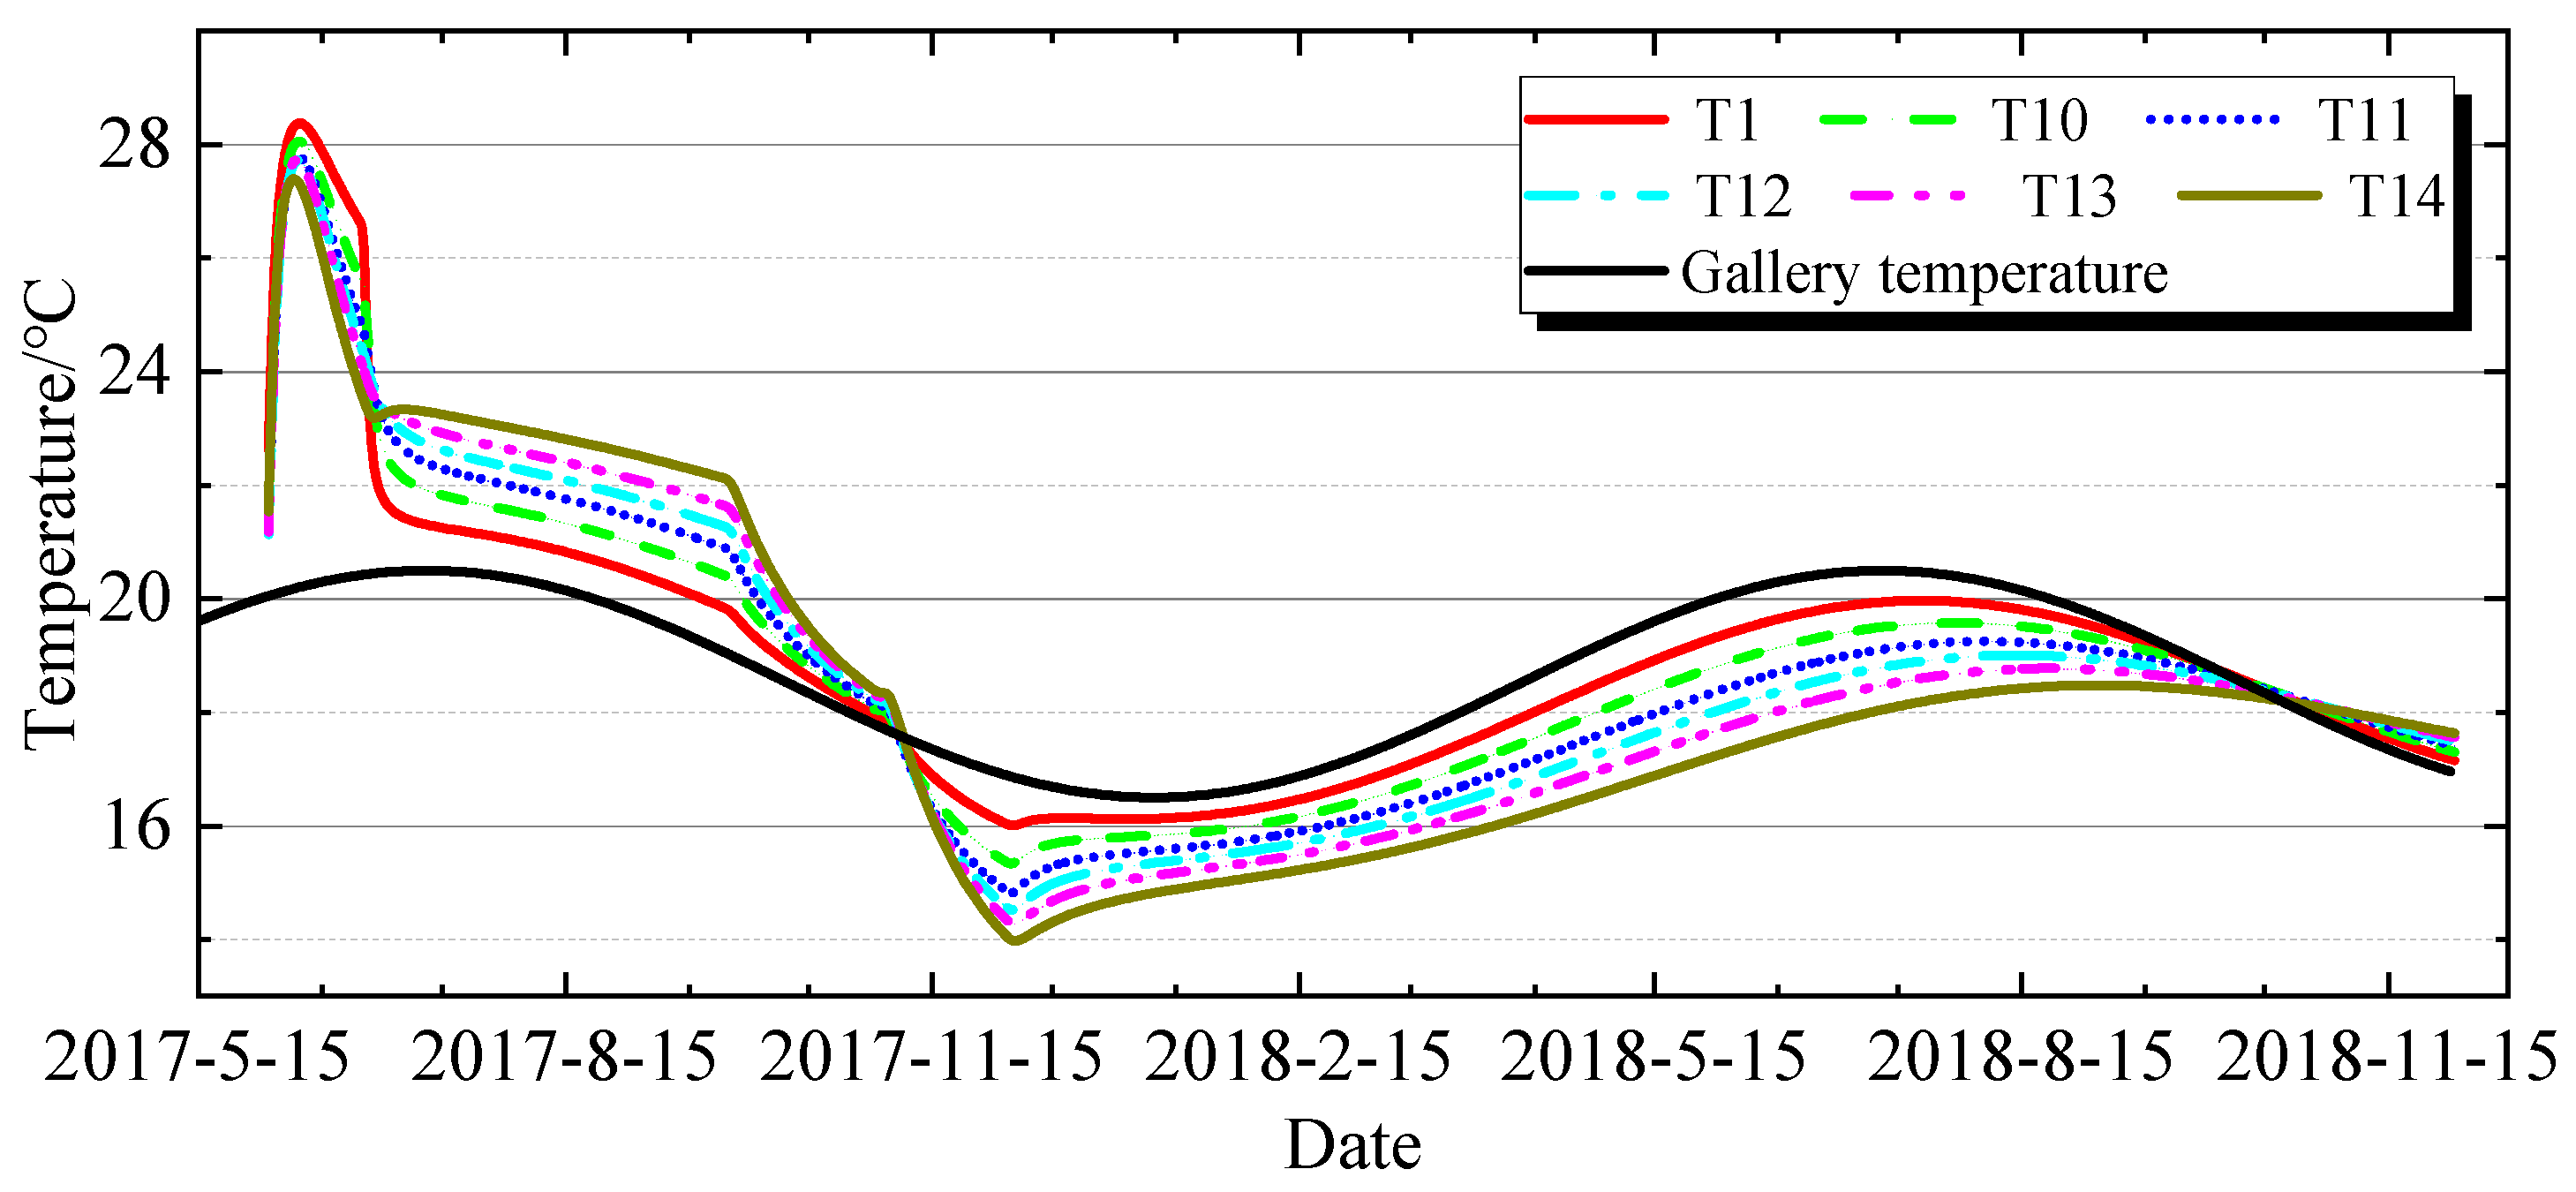
Under the current construction progress and measures, the average temperatures of each pouring layer near the gallery are shown in Figure 4, where each curve corresponds to the average temperature of different pouring layers. As can be observed from the figure, under the existing temperature control measures, the cooling rates and target temperatures at different stages for each pouring layer generally meet the design requirements. The temperature histories of concrete at different depths from the gallery crown surface and the floor surface are depicted in Figure 5 and Figure 6, respectively. The early-stage peak surface temperatures at the gallery crown and floor reach 28 °C, with their temperature variations primarily influenced by changes in the internal air temperature of the gallery (ranging from 17 °C to 22 °C). The farther the distance from the surface, the less significant the impact of the gallery’s internal air temperature on the concrete temperature becomes, while the influence of the cooling water flushing process on the temperature becomes more pronounced.
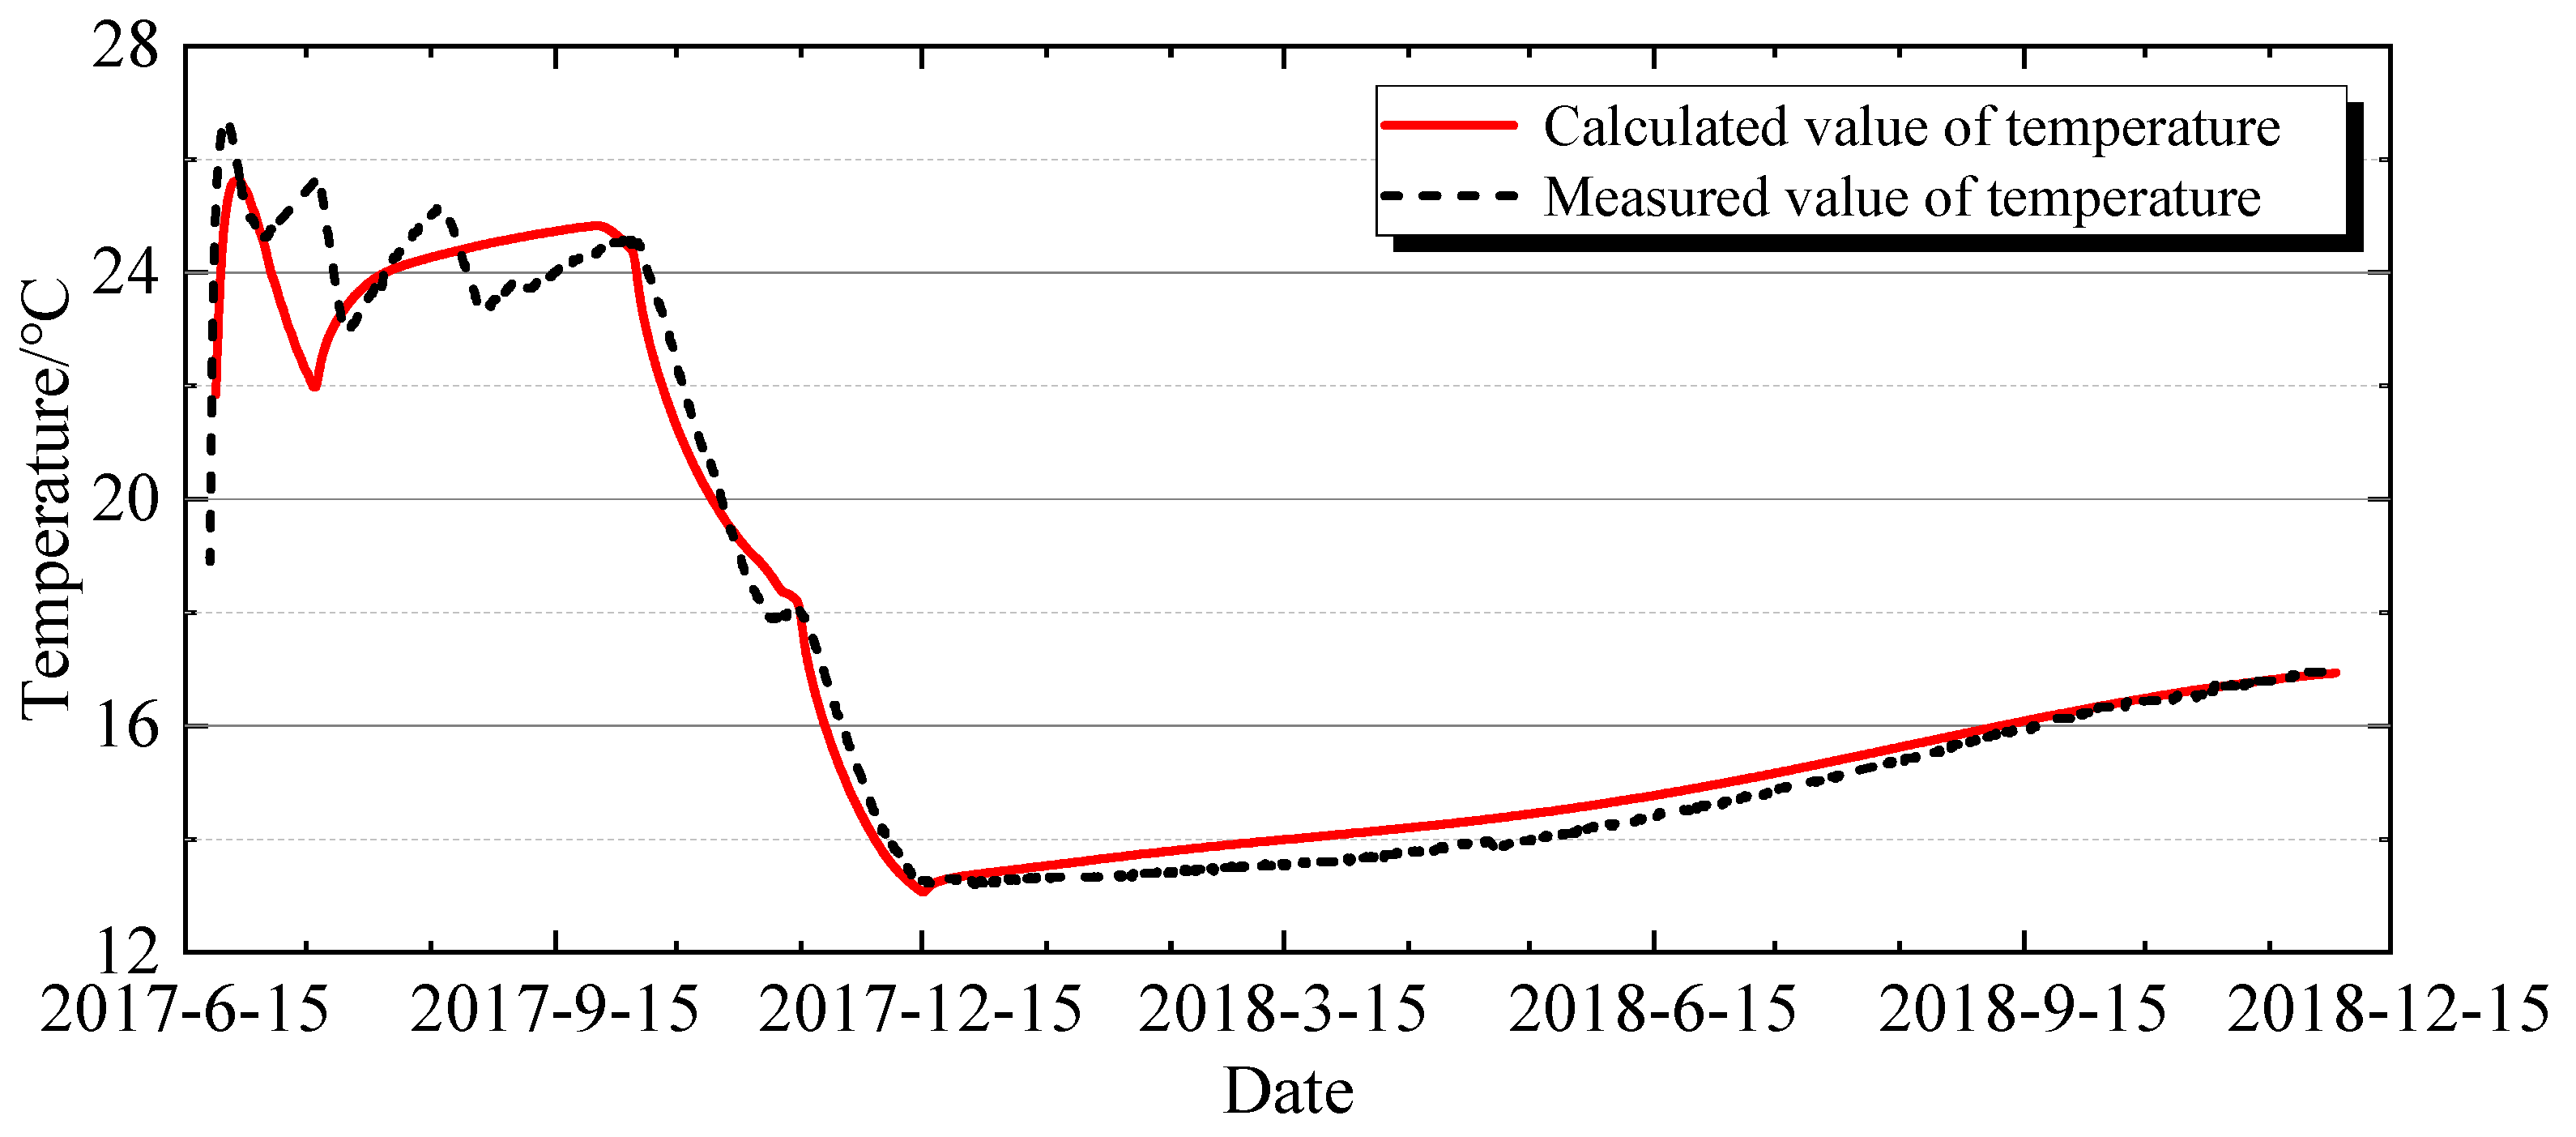
Figure 7 presents a comparison between the simulated and measured temperatures for the pouring layer where the gallery crown is located. The peak temperature of the concrete in this pouring section is approximately 26.8 °C. The cooling effect induced by medium-term water flushing results in a temperature drop of about 6 °C, while the cooling effect from late-stage water flushing leads to a further temperature reduction of approximately 5 °C. This comparison indicates that the simulation model effectively captures the thermal behavior of the concrete during the pouring and cooling processes, providing valuable insights for temperature control and stress analysis in the gallery structure.
Overall, except for the temperature fluctuations in the early stage caused by the intermittent water flushing of the intelligent water flushing system, the average temperatures of the pouring layers and the cooling rates at various stages obtained from the simulation calculations are in good agreement with the measured temperatures. This indicates that the temperature field calculation results are reasonable and reliable, providing a solid basis for further analysis of the thermal and stress behavior of the gallery structure during construction.

4.2. Analysis of Spatiotemporal Distribution Characteristics of Stress in the 733 Gallery

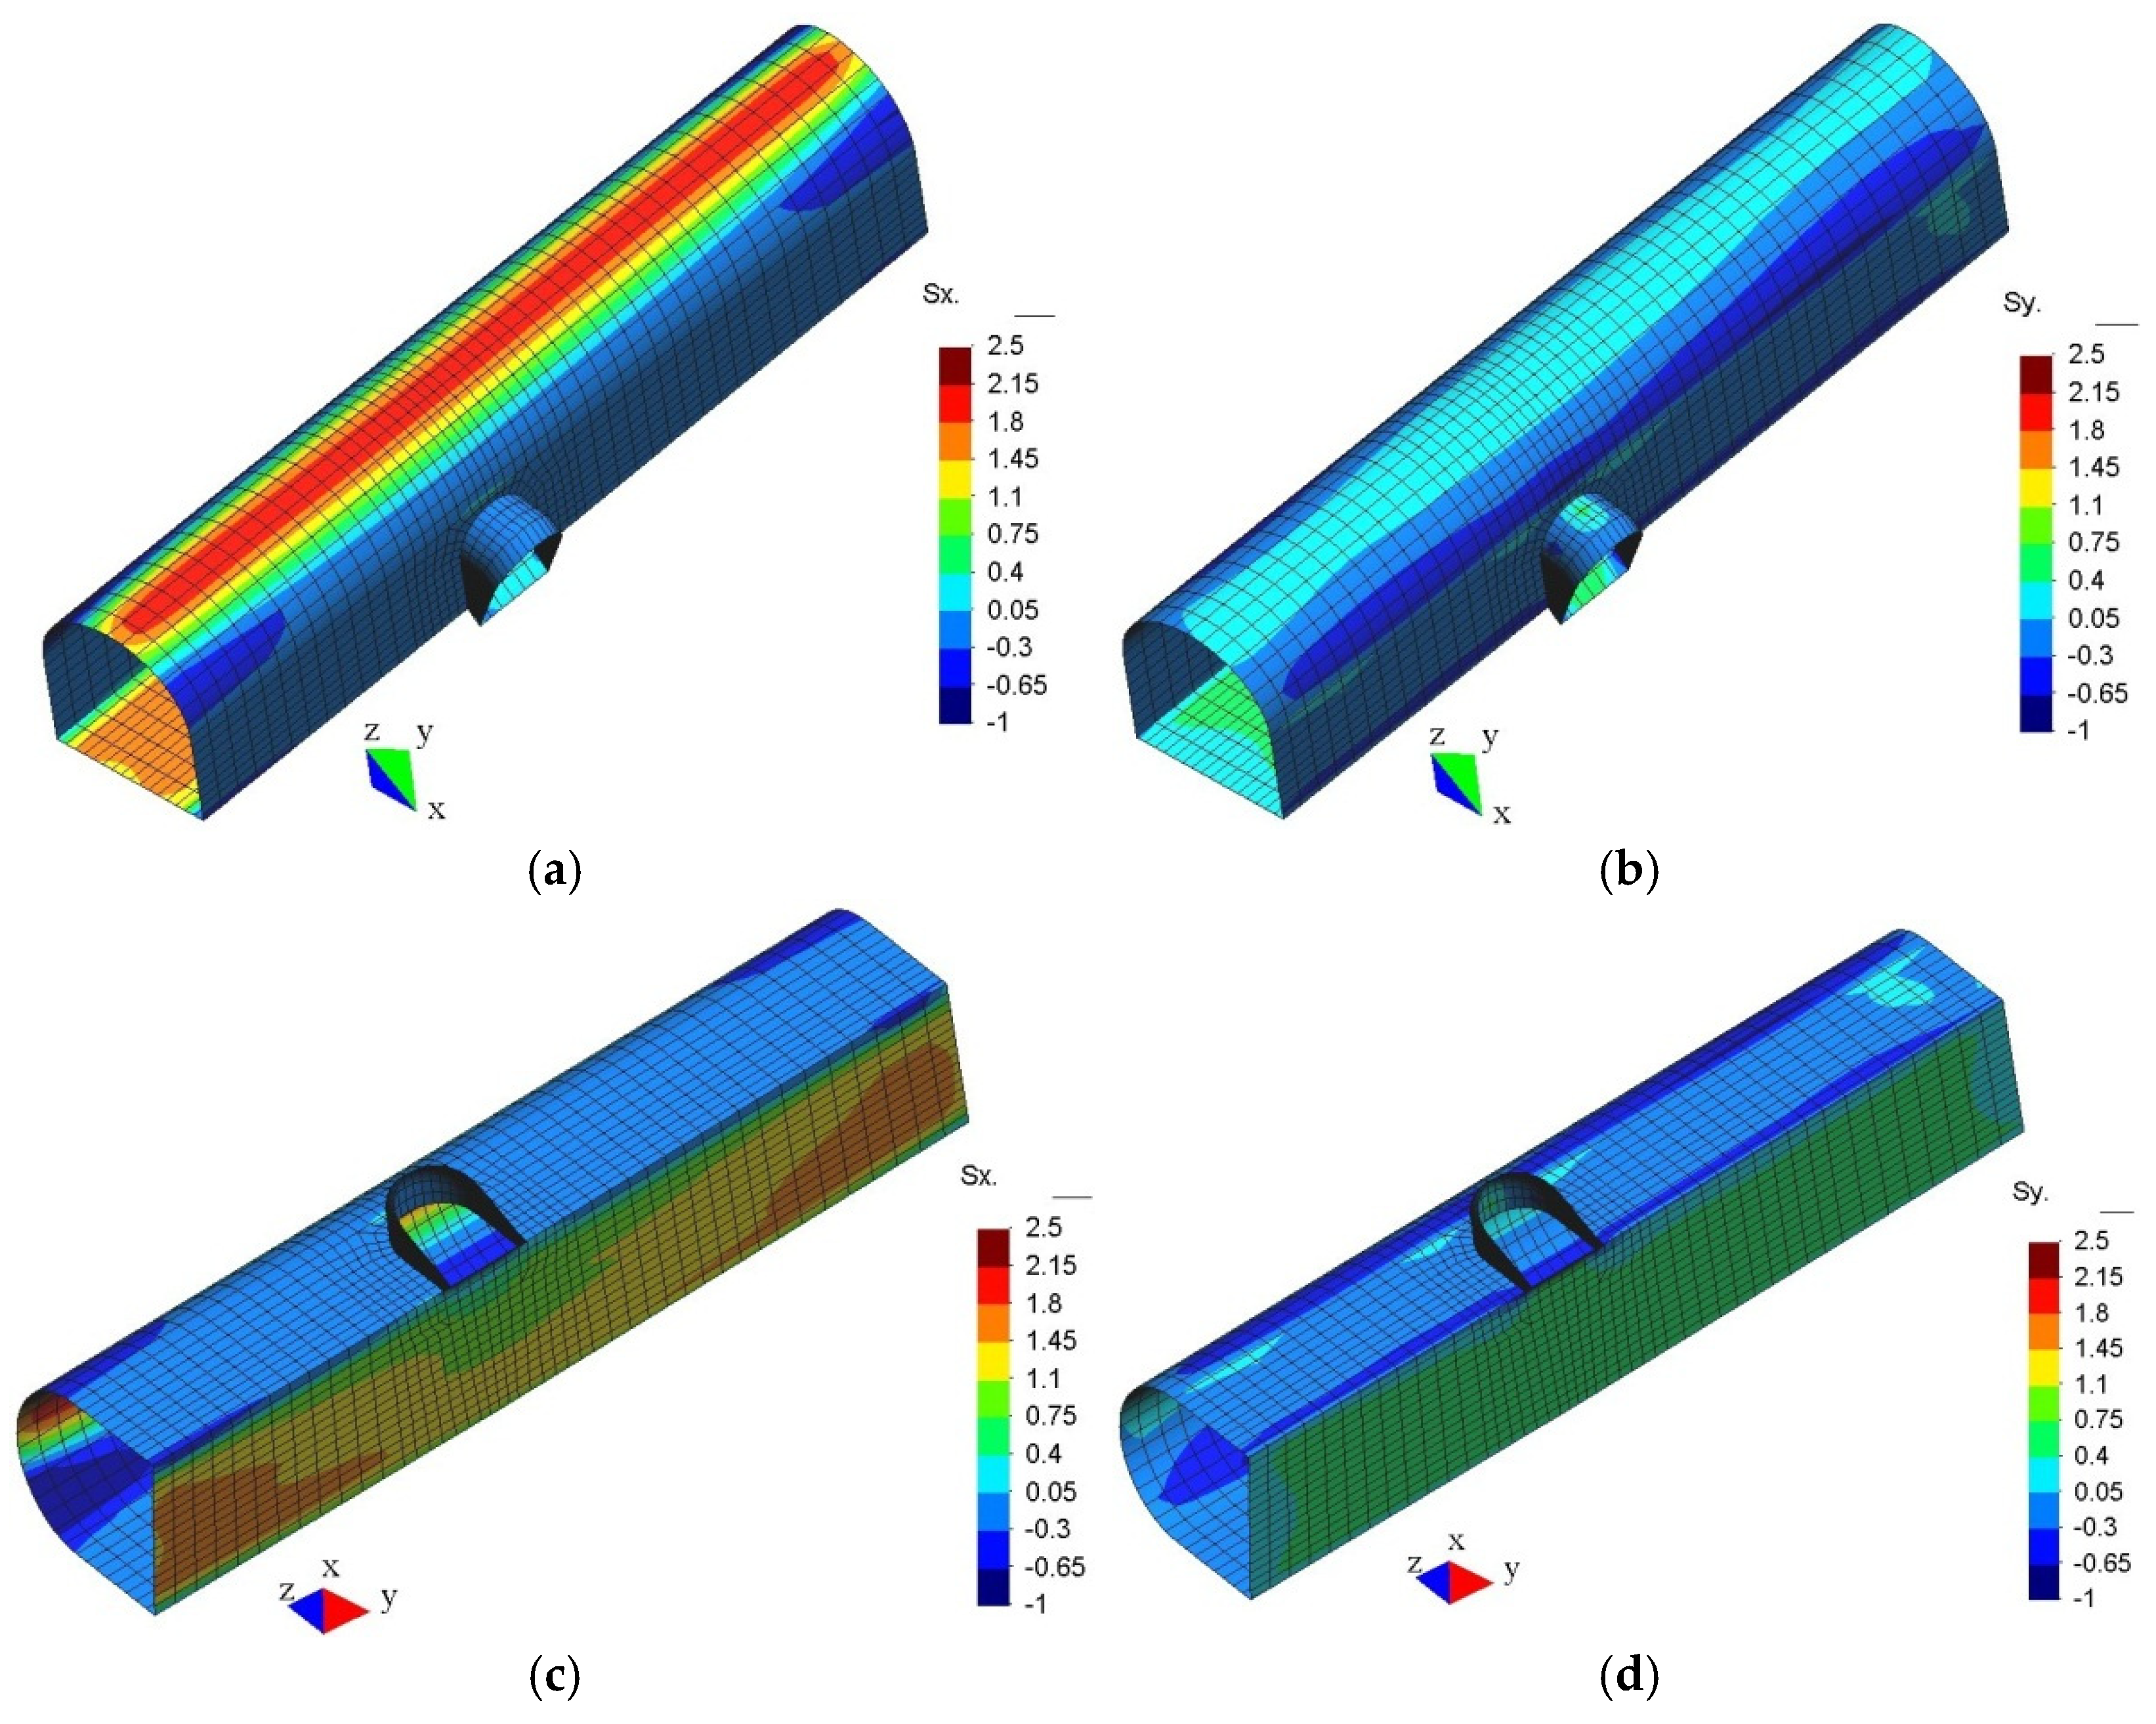
The distribution of hoop stress σx in the gallery vault and floor slab, as well as the stress along the gallery axis direction σy, at typical moments is shown in Figure 8. The high-stress zones in the gallery are mainly concentrated in the vault and the floor slabs at both ends. Due to the relatively small temperature gradient along the gallery axis direction in the dam body, the stress along the gallery axis direction is significantly smaller than the hoop stress, which makes the gallery vault and floor slab prone to developing cracks along the gallery axis direction. In view of this, subsequent analysis of the spatiotemporal distribution characteristics of gallery stress will primarily focus on the hoop stress.
From April 2017 to December 2018 (during which the concrete was poured up to an elevation of 871 m), the envelope diagram of the first principal stress σ1 and the distribution of the minimum crack resistance safety factor in the gallery are shown in Figure 9. During this period, the maximum stress in the middle section of the gallery vault was approximately 2.4 MPa, with a minimum crack resistance safety factor of around 1.02. At both ends of the gallery vault, the maximum stress reached 2.1 MPa, with a minimum crack resistance safety factor of 1.2. In the middle section of the gallery floor slab, the maximum stress was approximately 2.2 MPa, with a minimum crack resistance safety factor of 1.3. At both ends of the gallery floor slab, the maximum stress was around 2.4 MPa, with a minimum crack resistance safety factor of 1.2.

4.2.1. Characteristics of Stress Variation over Time

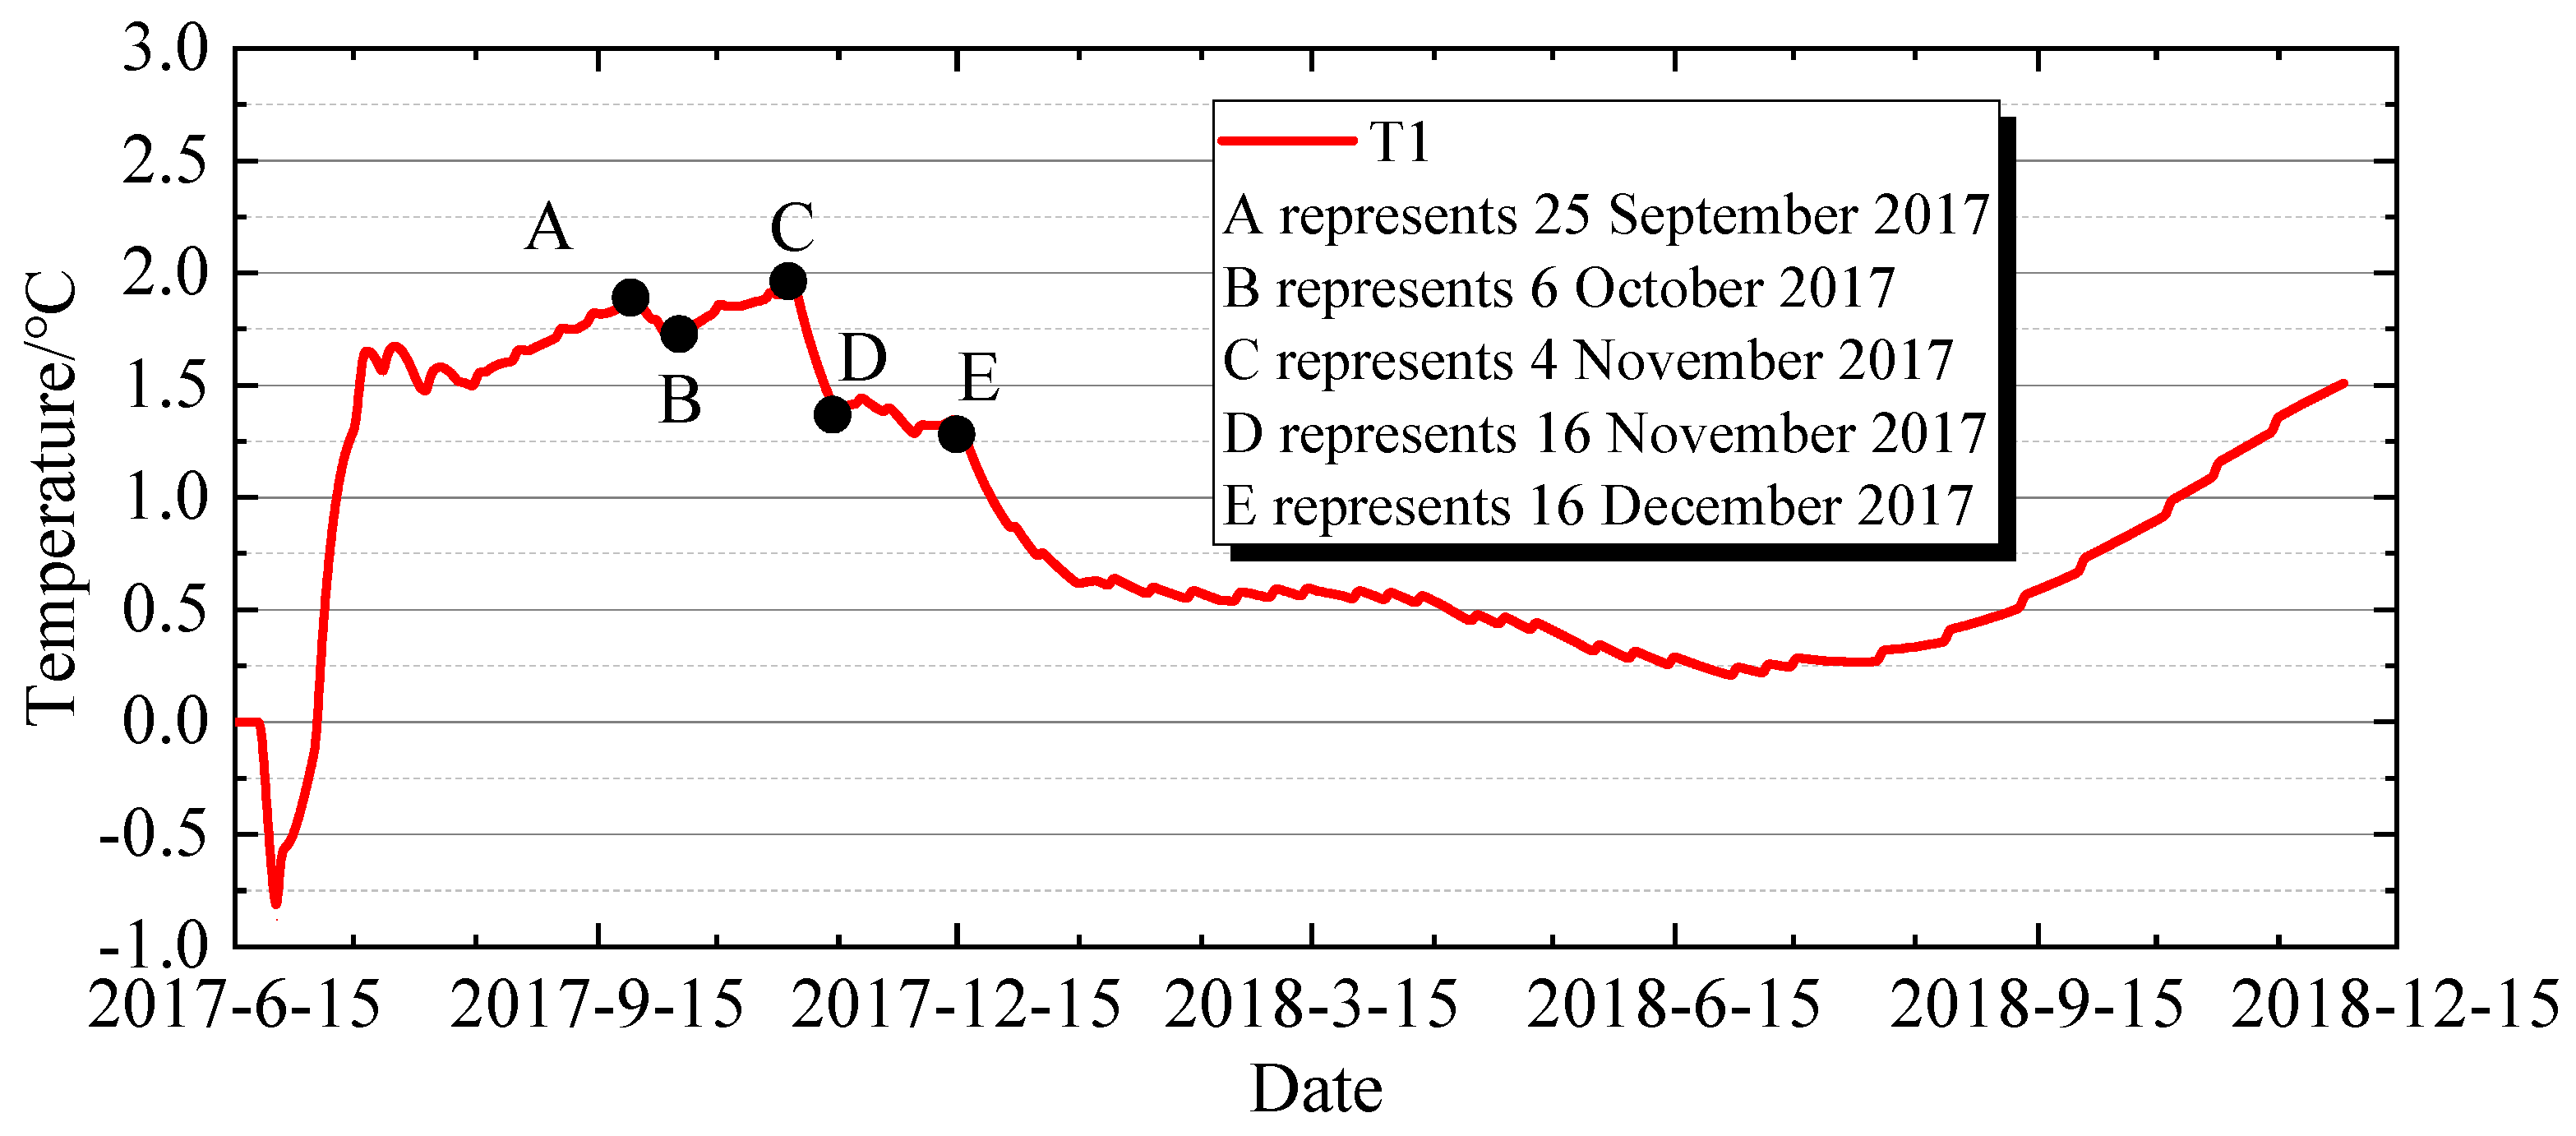
Regarding the temporal variation characteristics of the hoop stress at the vault, the development of the hoop stress (σx) at point T1 on the surface of the 733 gallery vault over time is illustrated in Figure 10. During the early stages of concrete placement, the hoop stress at the top was primarily influenced by the heat generated from the concrete’s own hydration, resulting in a compressive stress of approximately 0.8 MPa. Subsequently, as the surface dissipated heat and water cooling was applied, the concrete temperature began to decrease, and the stress started to increase continuously. By the end of the initial cooling phase, the hoop tensile stress at the vault reached about 1.62 MPa (with a crack-resistance safety factor of 1.16). Thereafter, until the start of the mid-term cooling water circulation, the tensile stress continued to increase by approximately 0.3 MPa due to the placement of upper concrete layers, reaching around 1.8 MPa (as shown in Figure 10, point A, on 25 September 2017). The concrete in the first and second irrigation zones below the 733 m elevation of the gallery began its mid-term cooling first. Due to the “squeezing” effect caused by their cooling-induced shrinkage, the hoop stress at the gallery vault decreased by about 0.2 MPa (as shown in Figure 10, point B, on 6 October 2017). When the third irrigation zone (ranging from 733.5 m to 745.0 m in elevation), where the gallery is located, began its mid-term cooling, the hoop stress at the gallery vault gradually increased again to 1.9 MPa under the combined influence of its own cooling-induced shrinkage and the self-weight of the continuously placed upper concrete (as shown in Figure 10, point C, on 4 November 2017).
When the first and second irrigation zones below the 737.5 m elevation of the gallery initiated their late-term cooling, while the fourth irrigation zone above them (ranging from 745.0 m to 754.0 m in elevation) began its mid-term cooling, the shrinkage and “squeezing” effects from the upper and lower irrigation zones led to a rapid decrease in the stress at the gallery vault to 1.5 MPa (as shown in Figure 10, point D, on 16 November 2017). After the late-term cooling of the third irrigation zone commenced, due to its own shrinkage, the rate of stress decrease slowed down. When the fourth irrigation zone began its late-term cooling on 16 December 2017 (Figure 10, point E), the “squeezing” effect from the upper fourth irrigation zone’s concrete again caused a decrease in the stress at the gallery vault to around 1.4 MPa. By mid-January 2018, when the late-term cooling of the upper irrigation zones concluded, the hoop stress at the vault was approximately 0.63 MPa. From February to August 2018, although the temperature inside the gallery rose, the continuous placement of upper concrete in Dam Section 7# limited the extent of stress decrease. By early July 2018, the stress decreased by about 0.2 MPa. Subsequently, as the air temperature inside the gallery began to drop, influenced by the combined effects of temperature and self-weight, the stress at the gallery vault started to increase continuously. By 2 December 2018, the hoop stress at the gallery vault reached 1.5 MPa.
From the above analysis, it can be seen that the stress at the gallery vault is primarily influenced by temperature and self-weight. Regarding self-weight, as the dam body rises, the self-weight will continuously contribute to an increase in the hoop tensile stress at the vault. In terms of temperature, the rise and fall of concrete temperature in the irrigation zones where the vault is located will cause a decrease and increase in the hoop tensile stress at the gallery vault, respectively. However, the cooling and shrinkage of concrete in the adjacent upper and lower irrigation zones of the gallery’s irrigation zone will lead to compression at the gallery vault and a decrease in the hoop tensile stress.
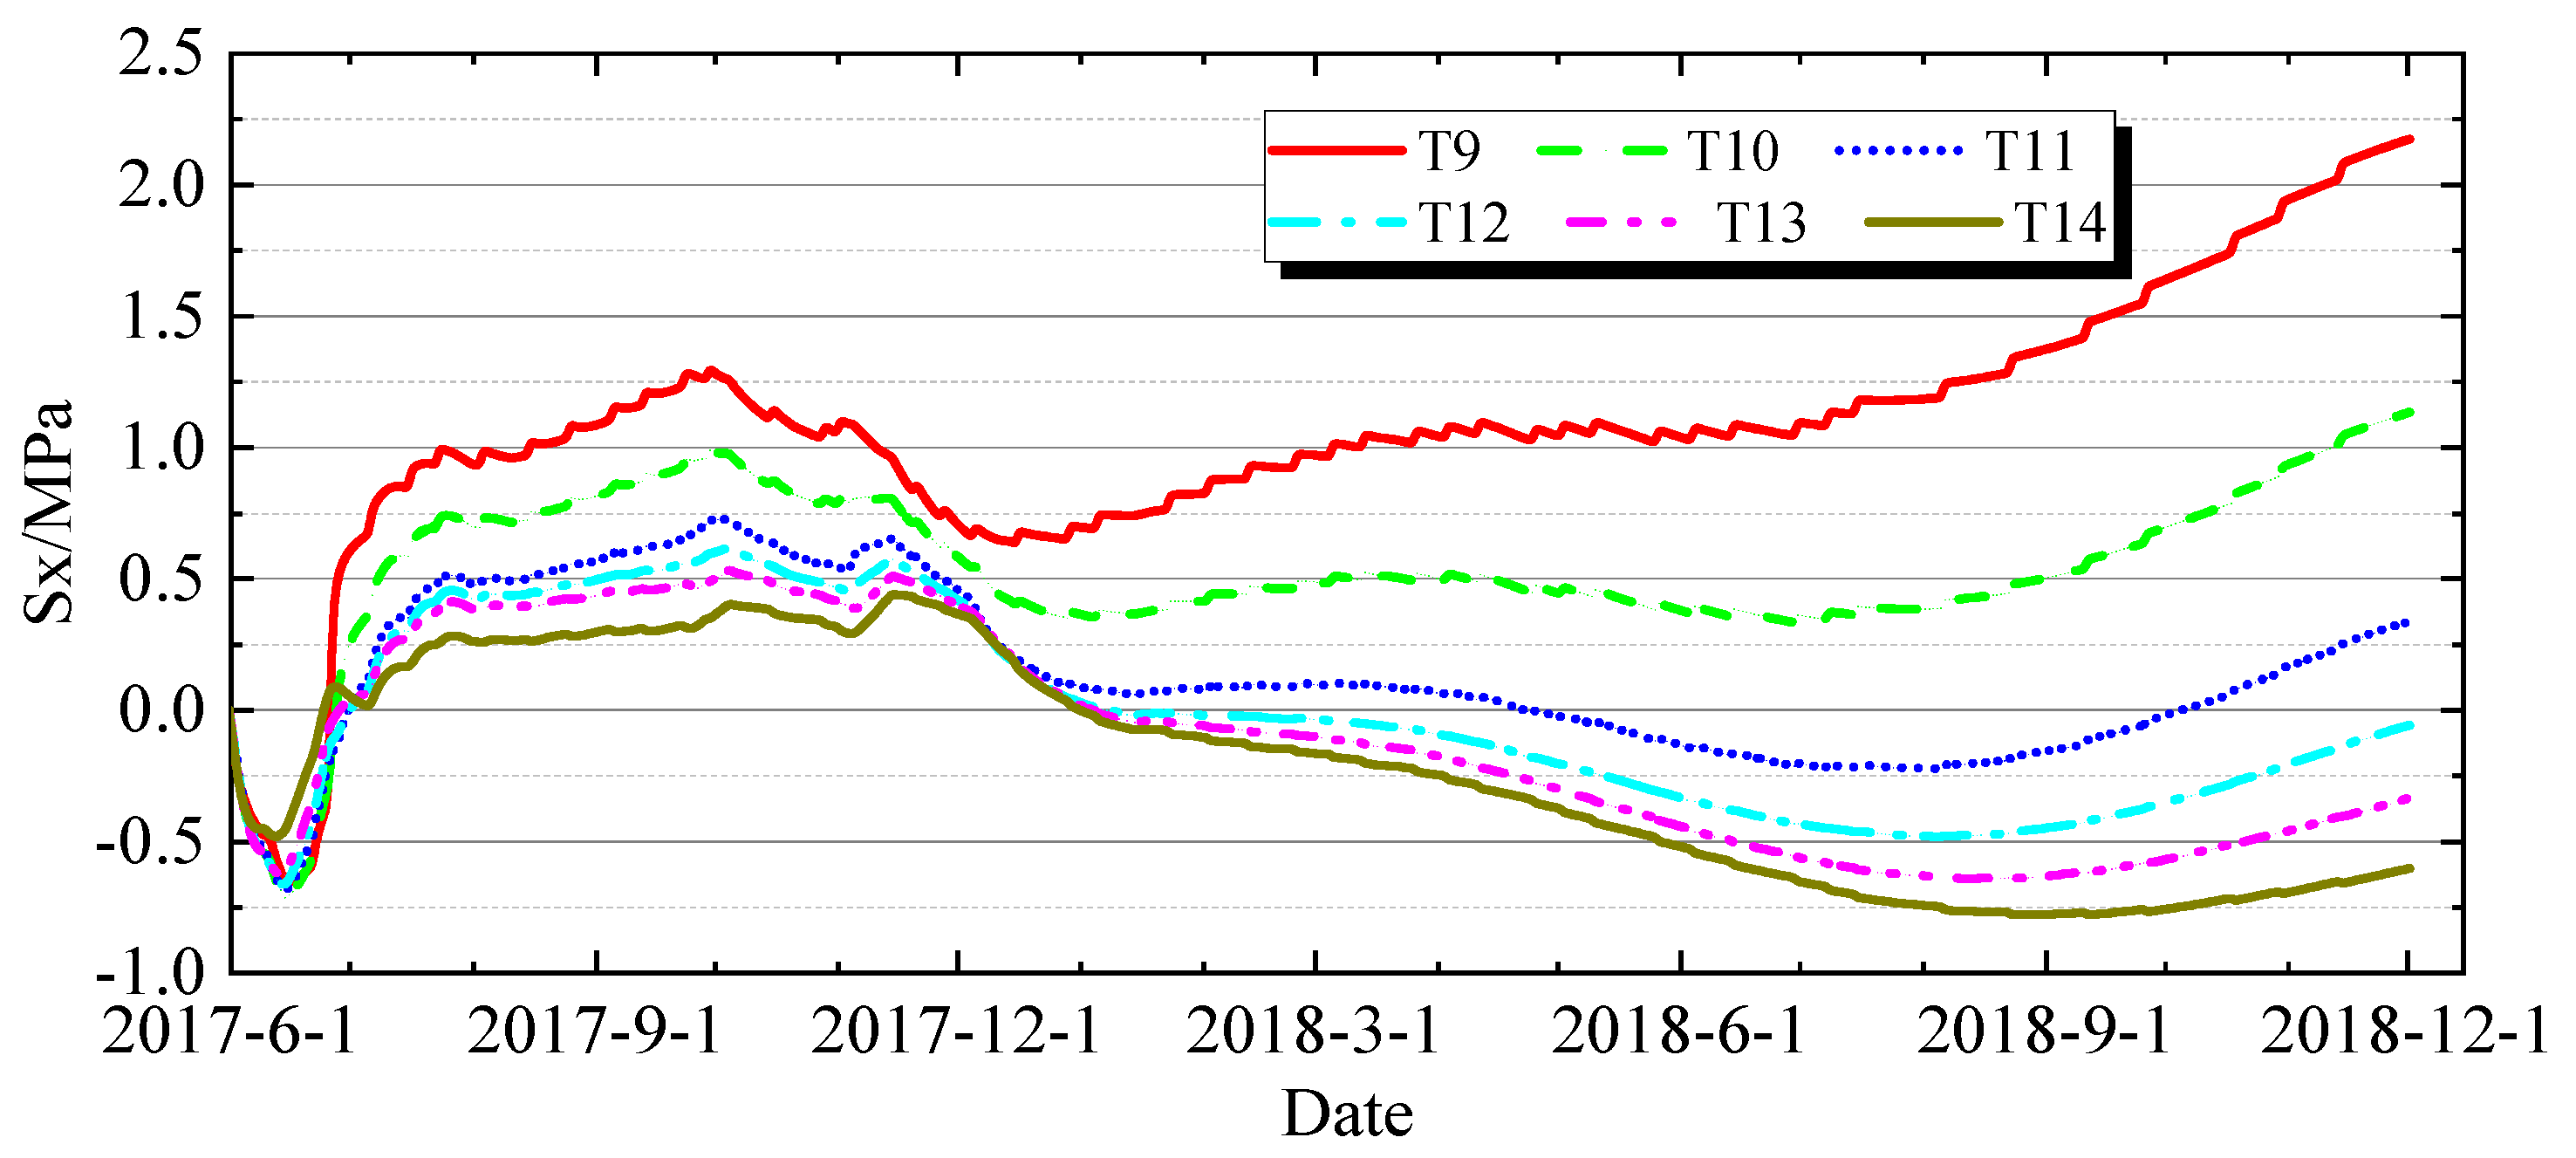
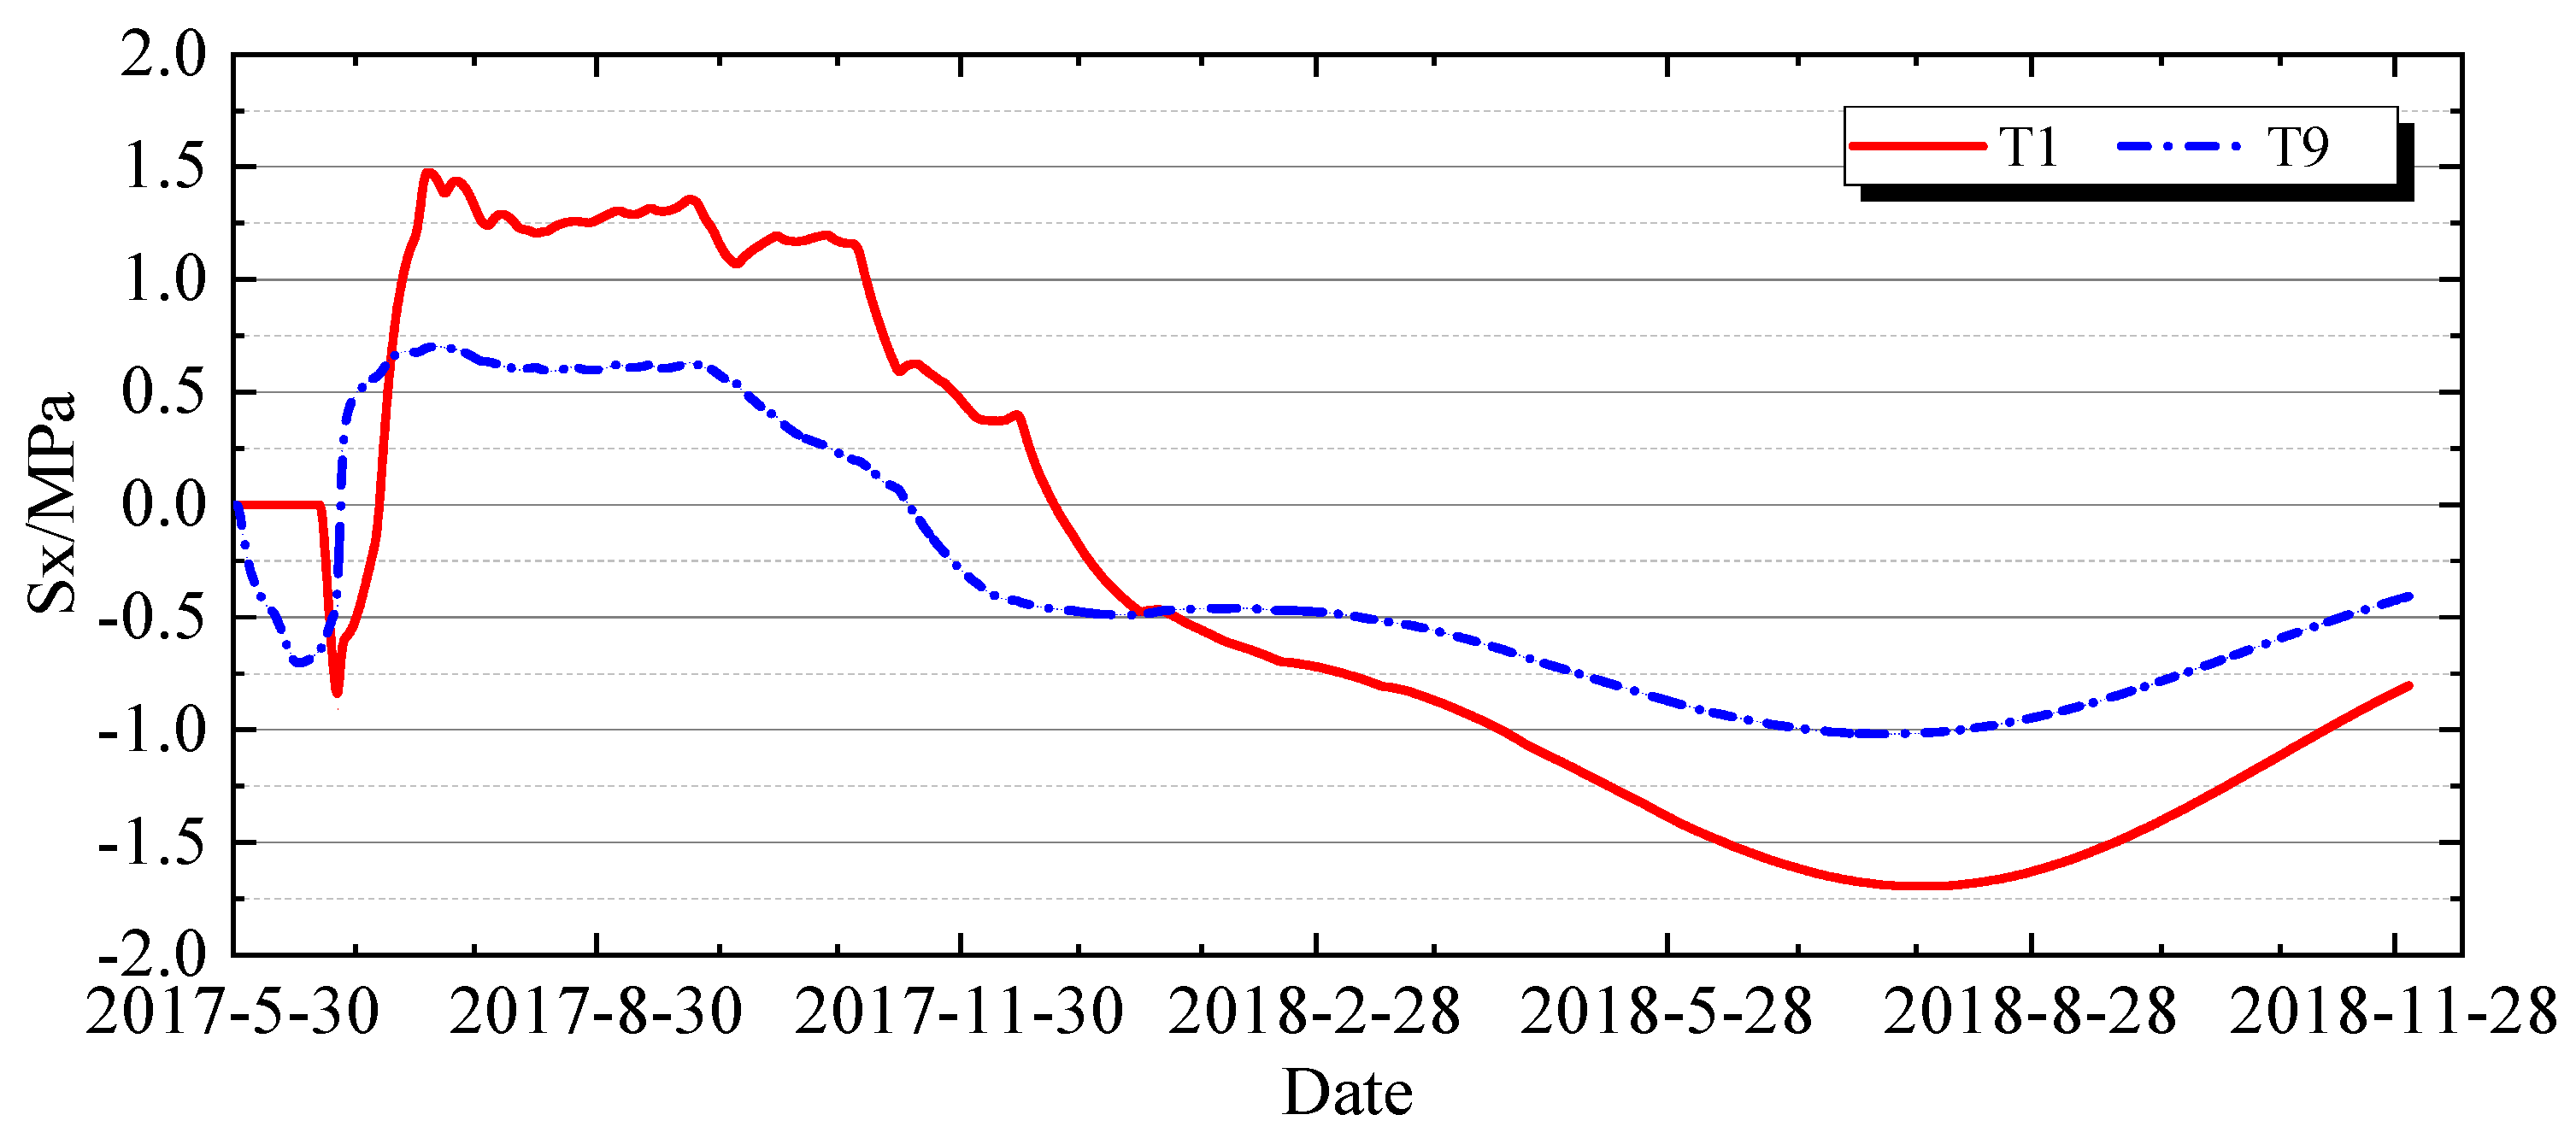
Regarding the temporal variation characteristics of the hoop stress at the floor, the development history of the hoop σx stress at point T9 on the surface of the gallery floor is illustrated in Figure 11. The pattern of its temporal development is generally consistent with that of the stress at the vault surface. The key difference lies in the period from February to July 2018, after the completion of arch closure, when the stress at the gallery floor surface gradually increased under the combined effects of temperature and the self-weight of the upper concrete. After August 2018, as the air temperature inside the gallery began to gradually decrease, the stress at the floor surface rapidly increased, reaching 2.17 MPa by 2 December 2018.

4.2.2. Stress Spatial Distribution Characteristics

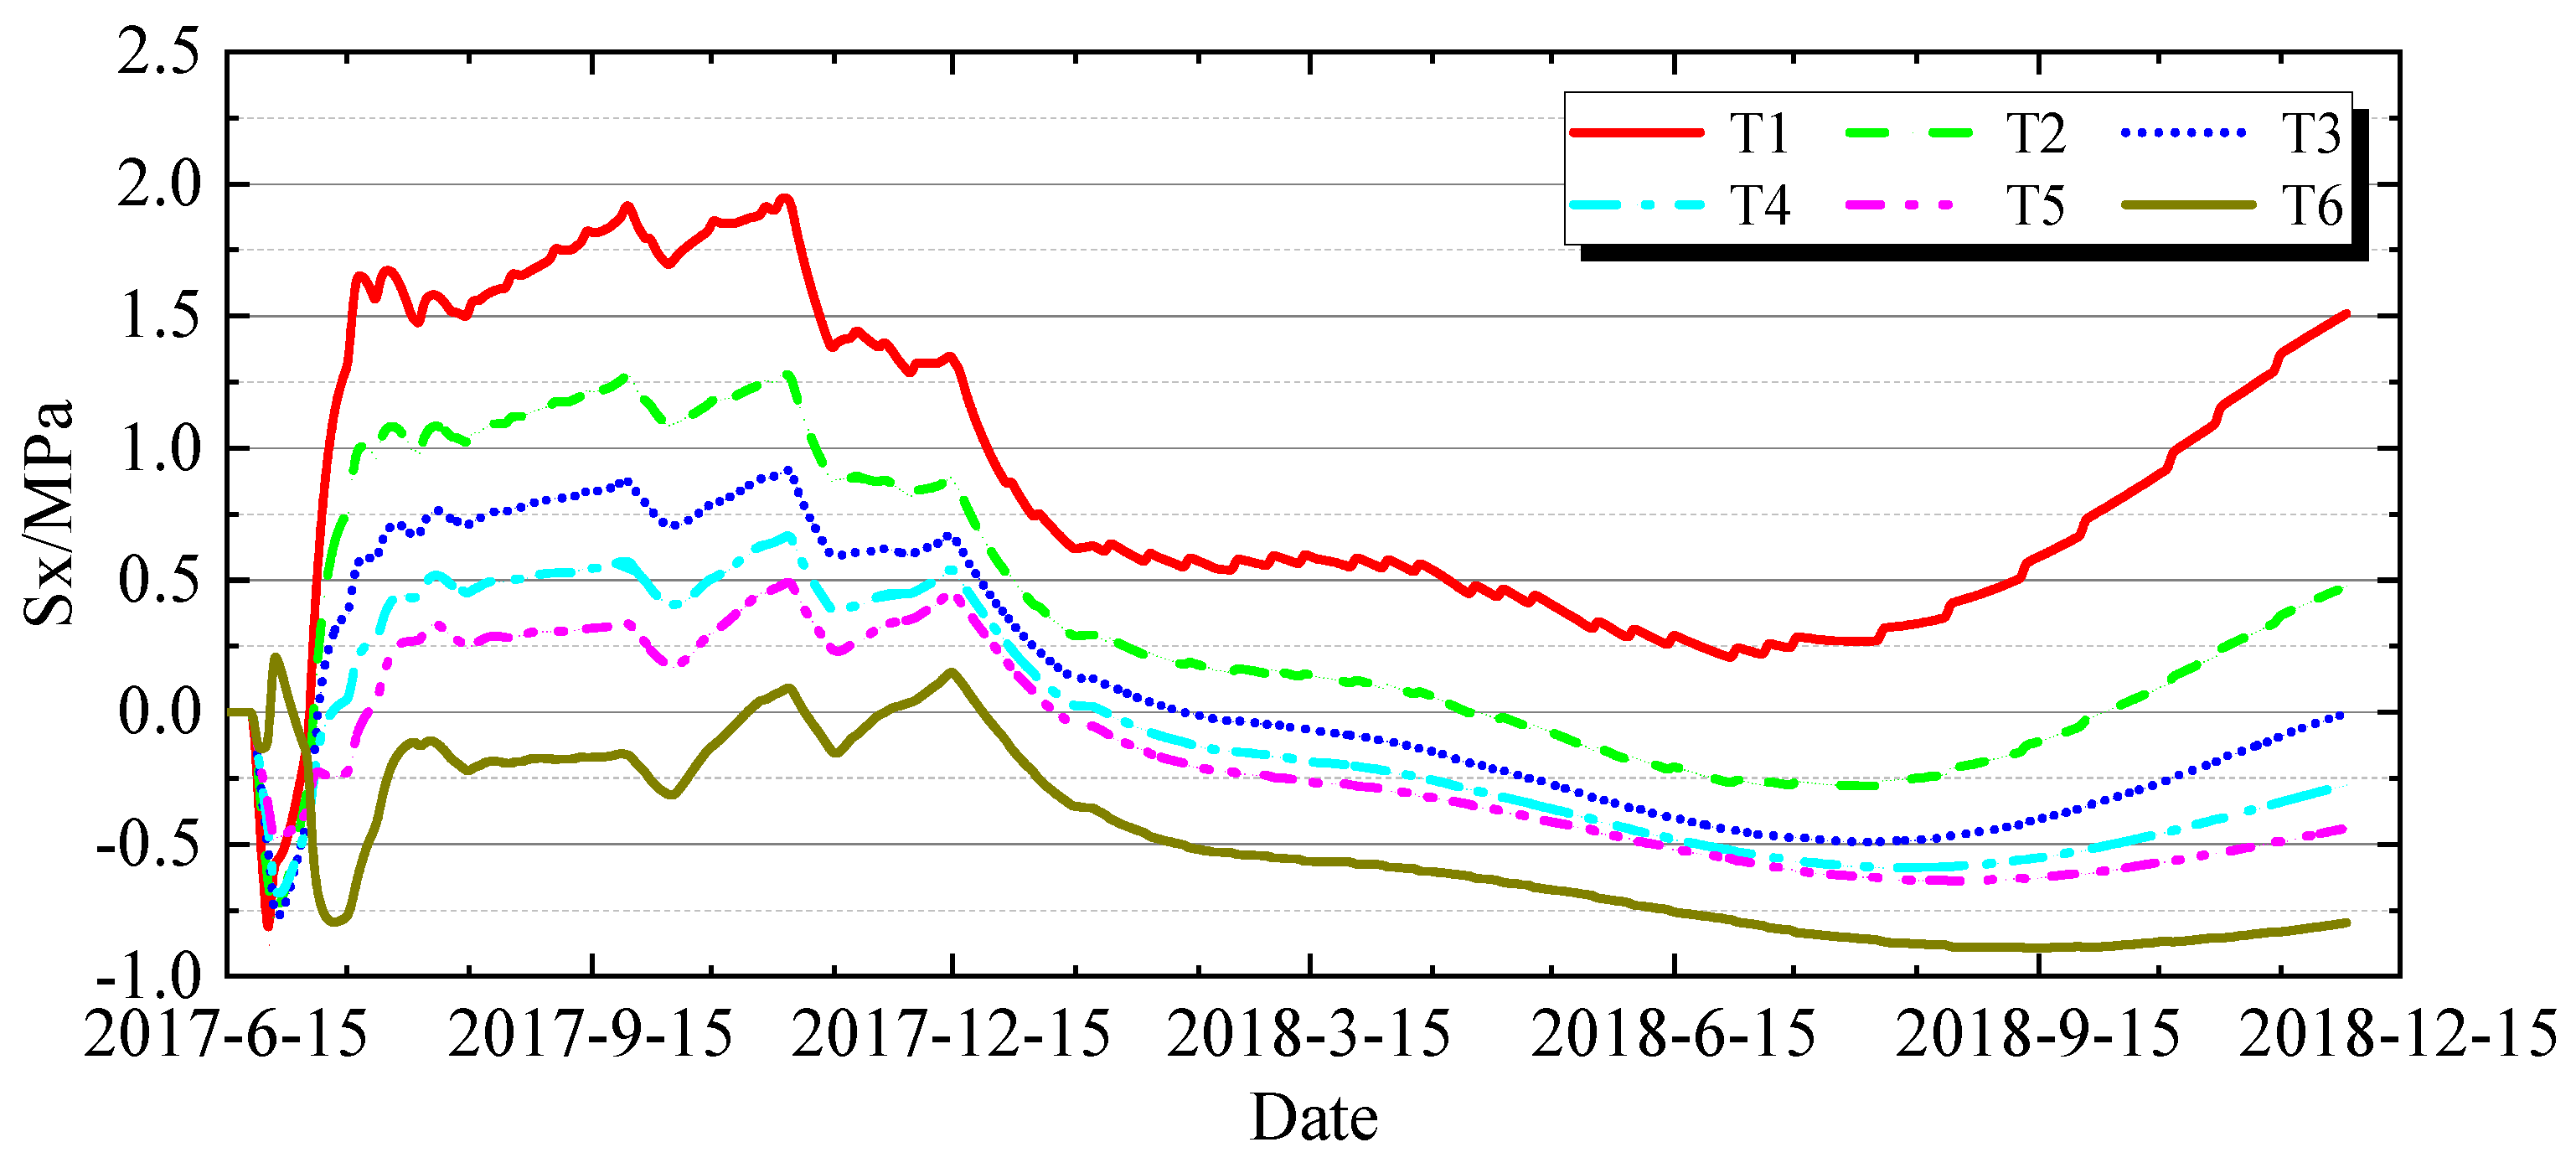
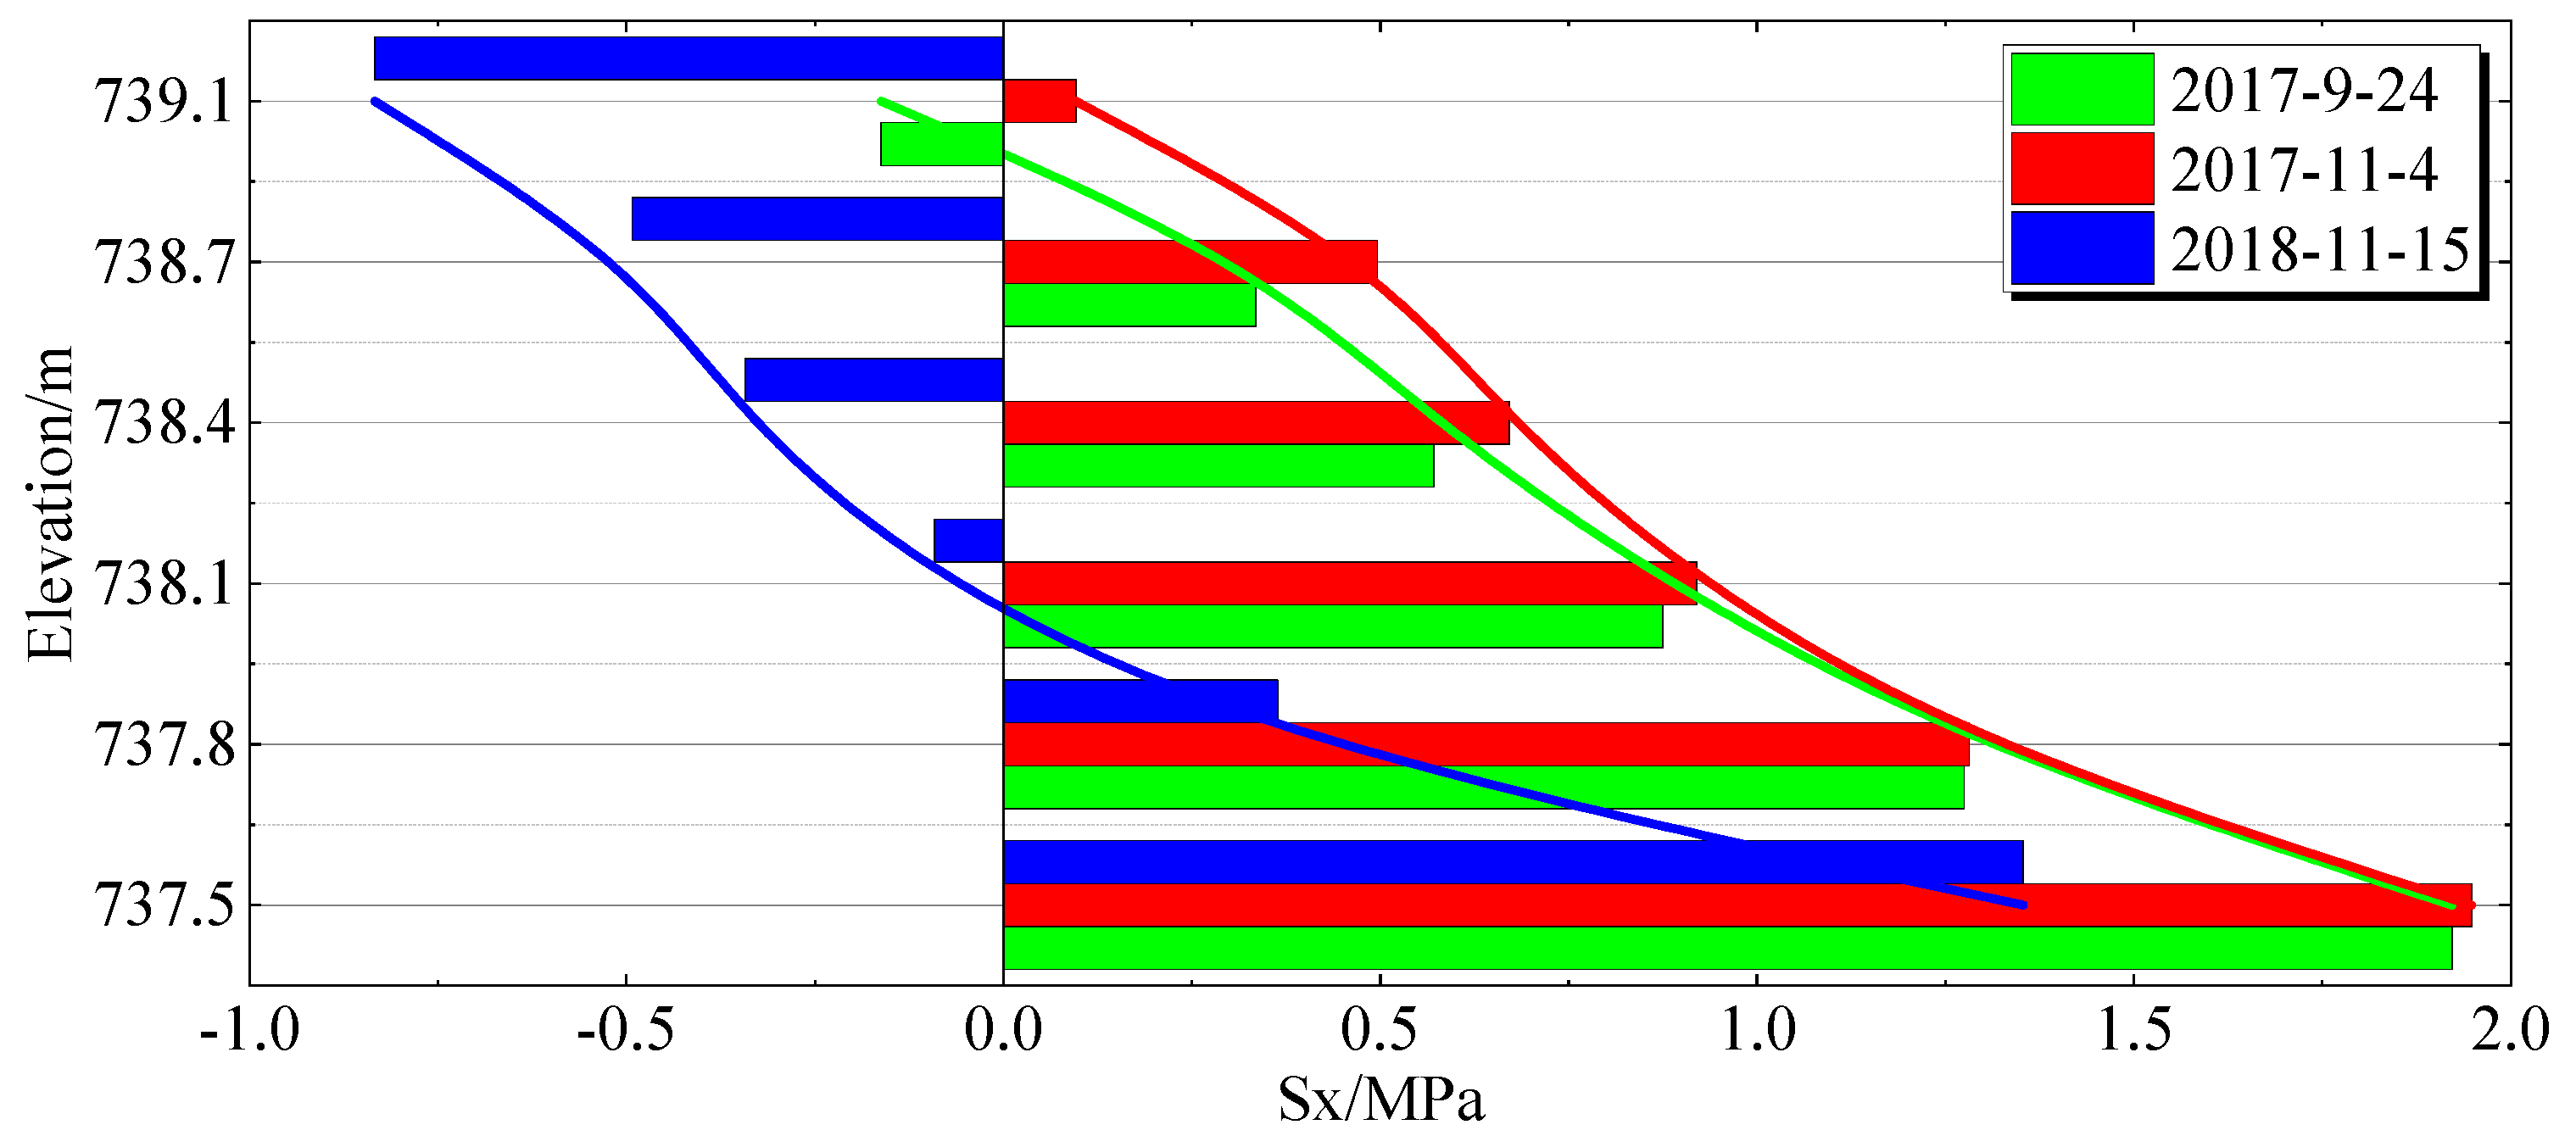
Regarding the distribution of hoop (X-direction) stress along the depth at the vault, the stress histories of hoop stress σx at feature points (from T1 to T6) at different depths of the 733 gallery vault are shown in Figure 12. The variations in hoop stress along the elevation at typical moments are depicted in Figure 13. The stress change patterns at different depths from the vault surface are generally consistent, but there are significant differences in stress magnitudes. As the distance from the vault surface increases, the stress rapidly decreases. Taking the stress on 15 November 2018, as an example, the hoop stress at the surface is 1.4 MPa, while it rapidly decreases to 0.3 MPa at a depth of 0.4 m from the surface. The distribution characteristics of hoop stress along the depth indicate that, based on simulation analysis under current conditions, the depth range of the high-stress zone at the 733 gallery vault is limited. If cracking occurs, the depth of the cracks will also be limited.
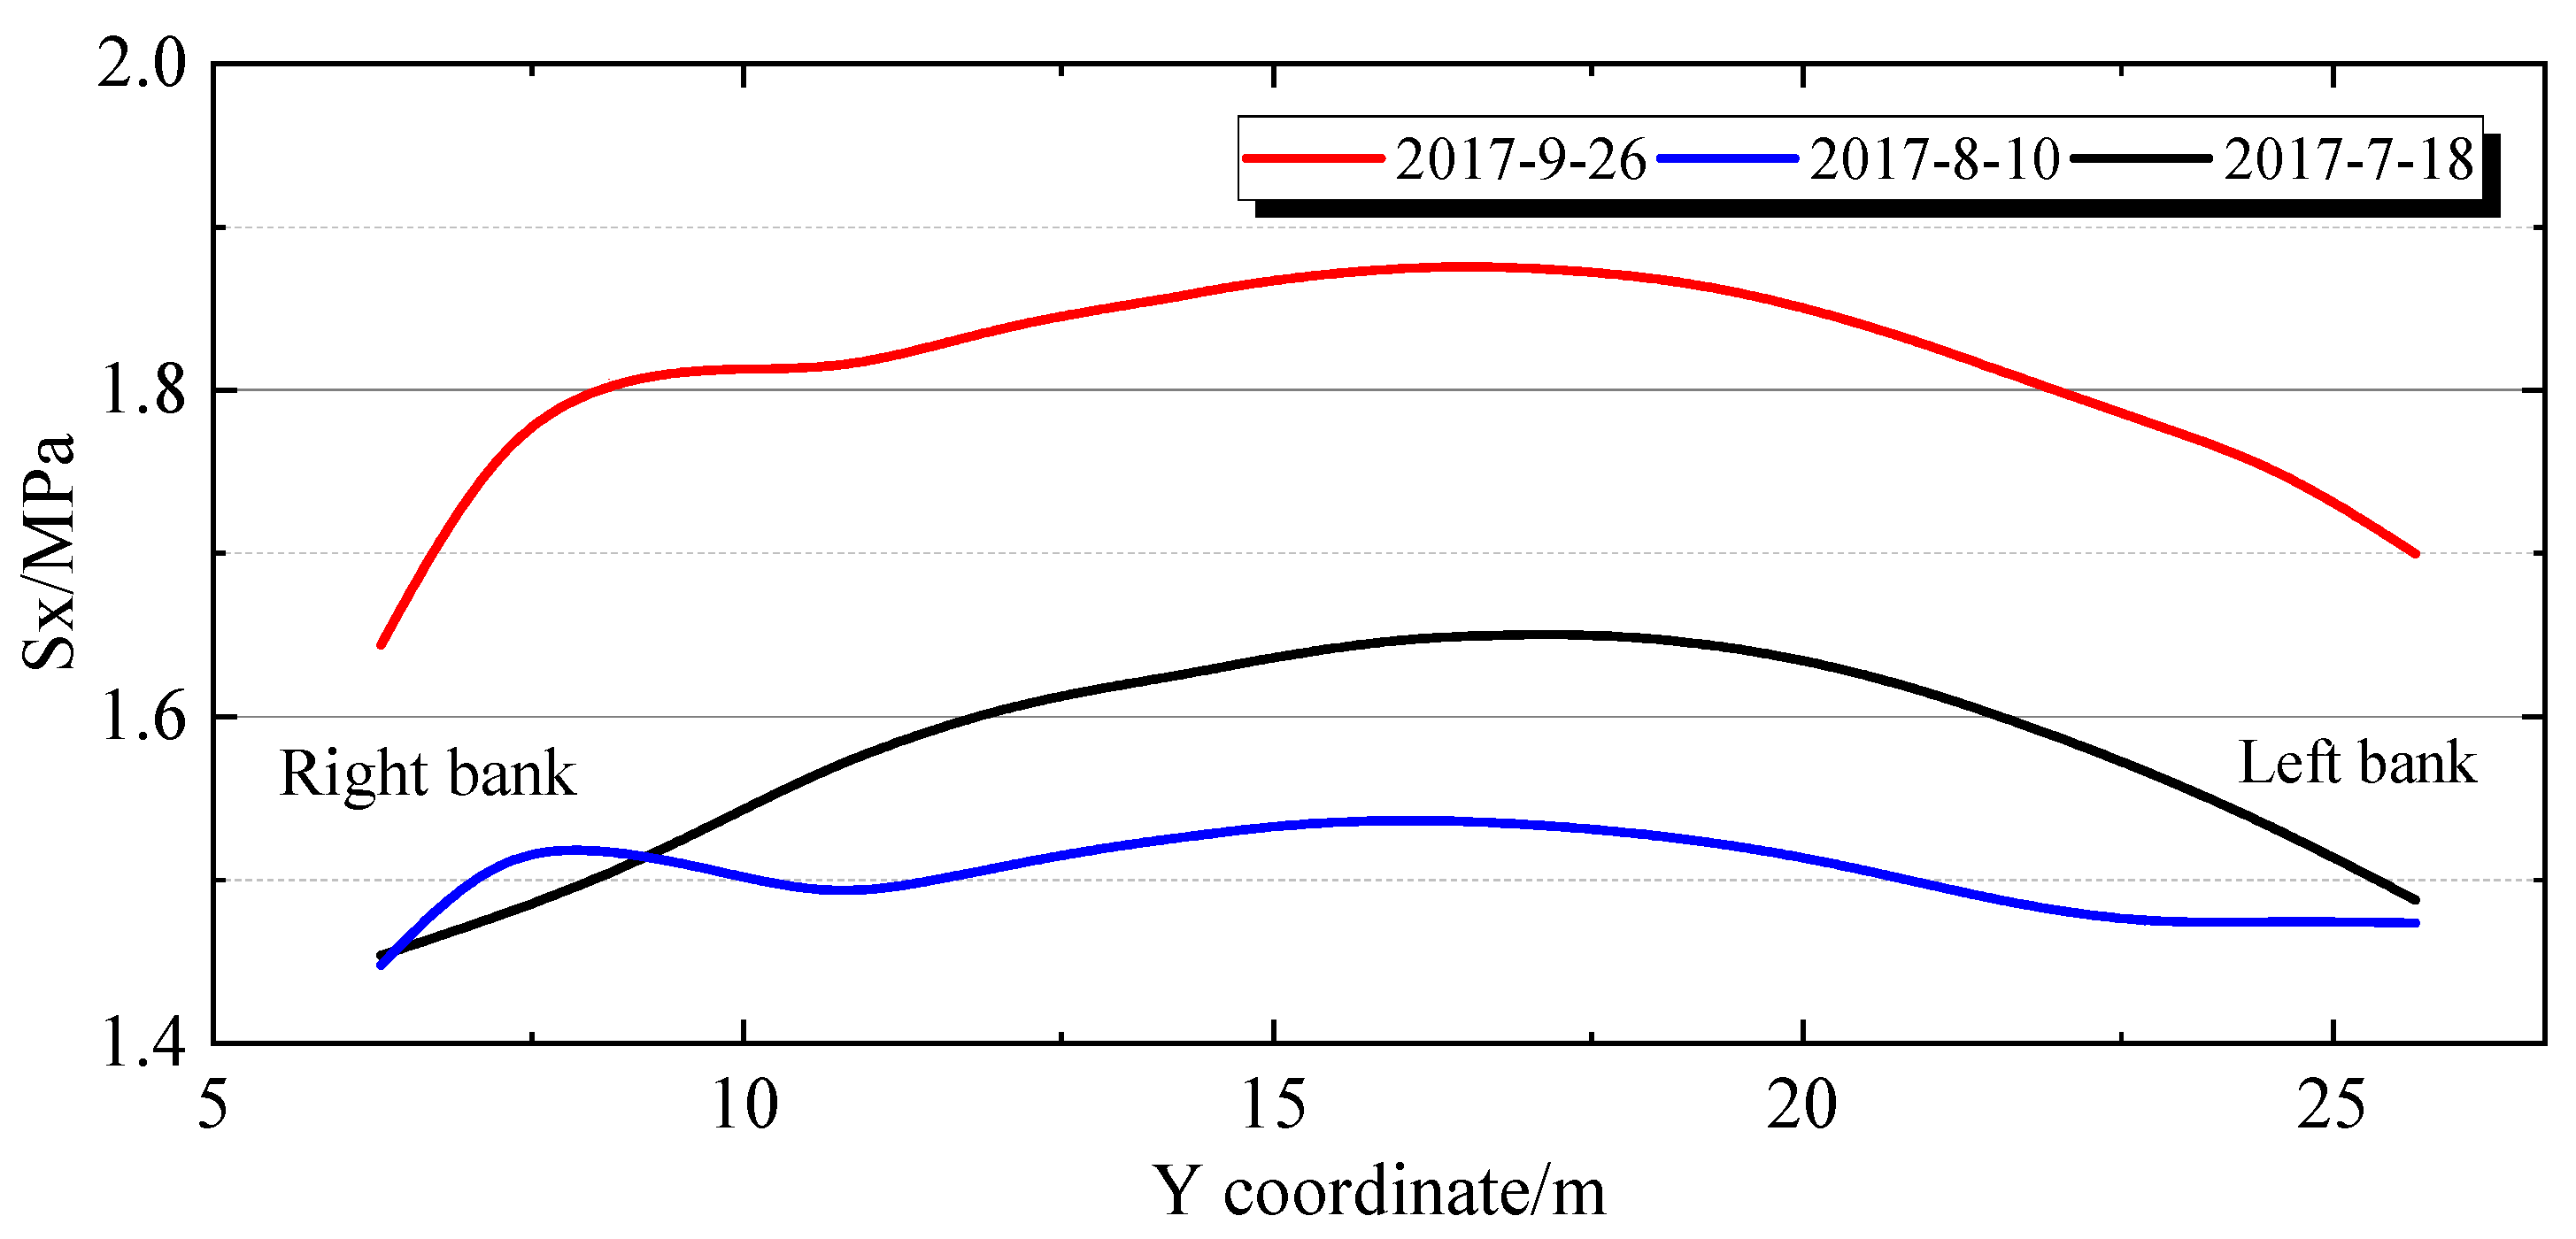
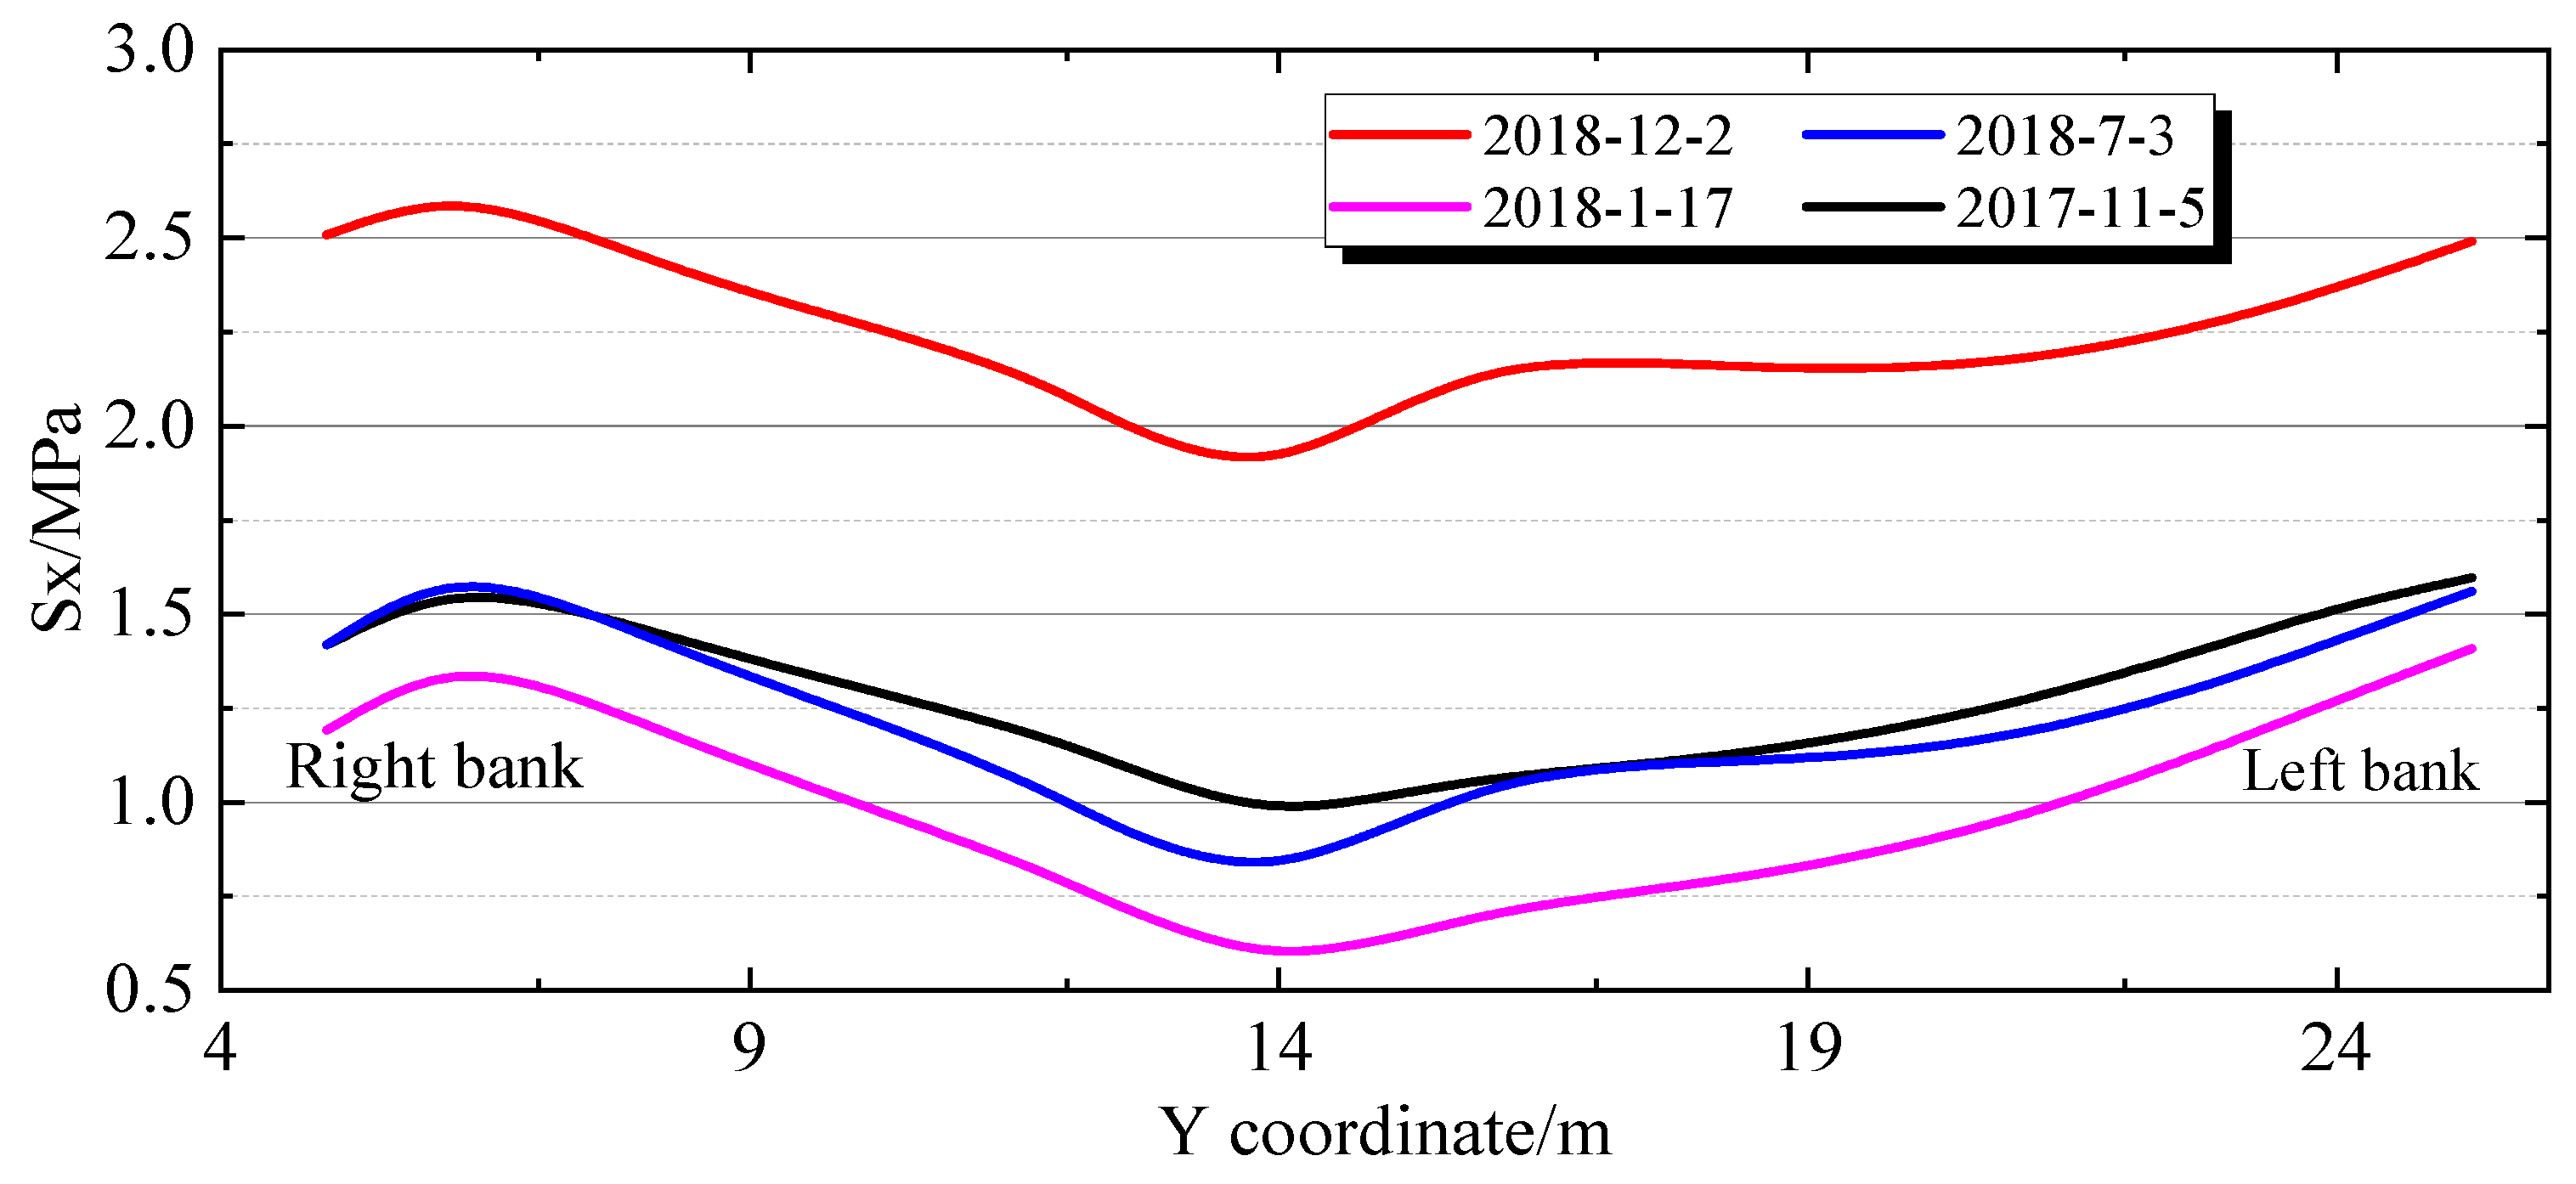
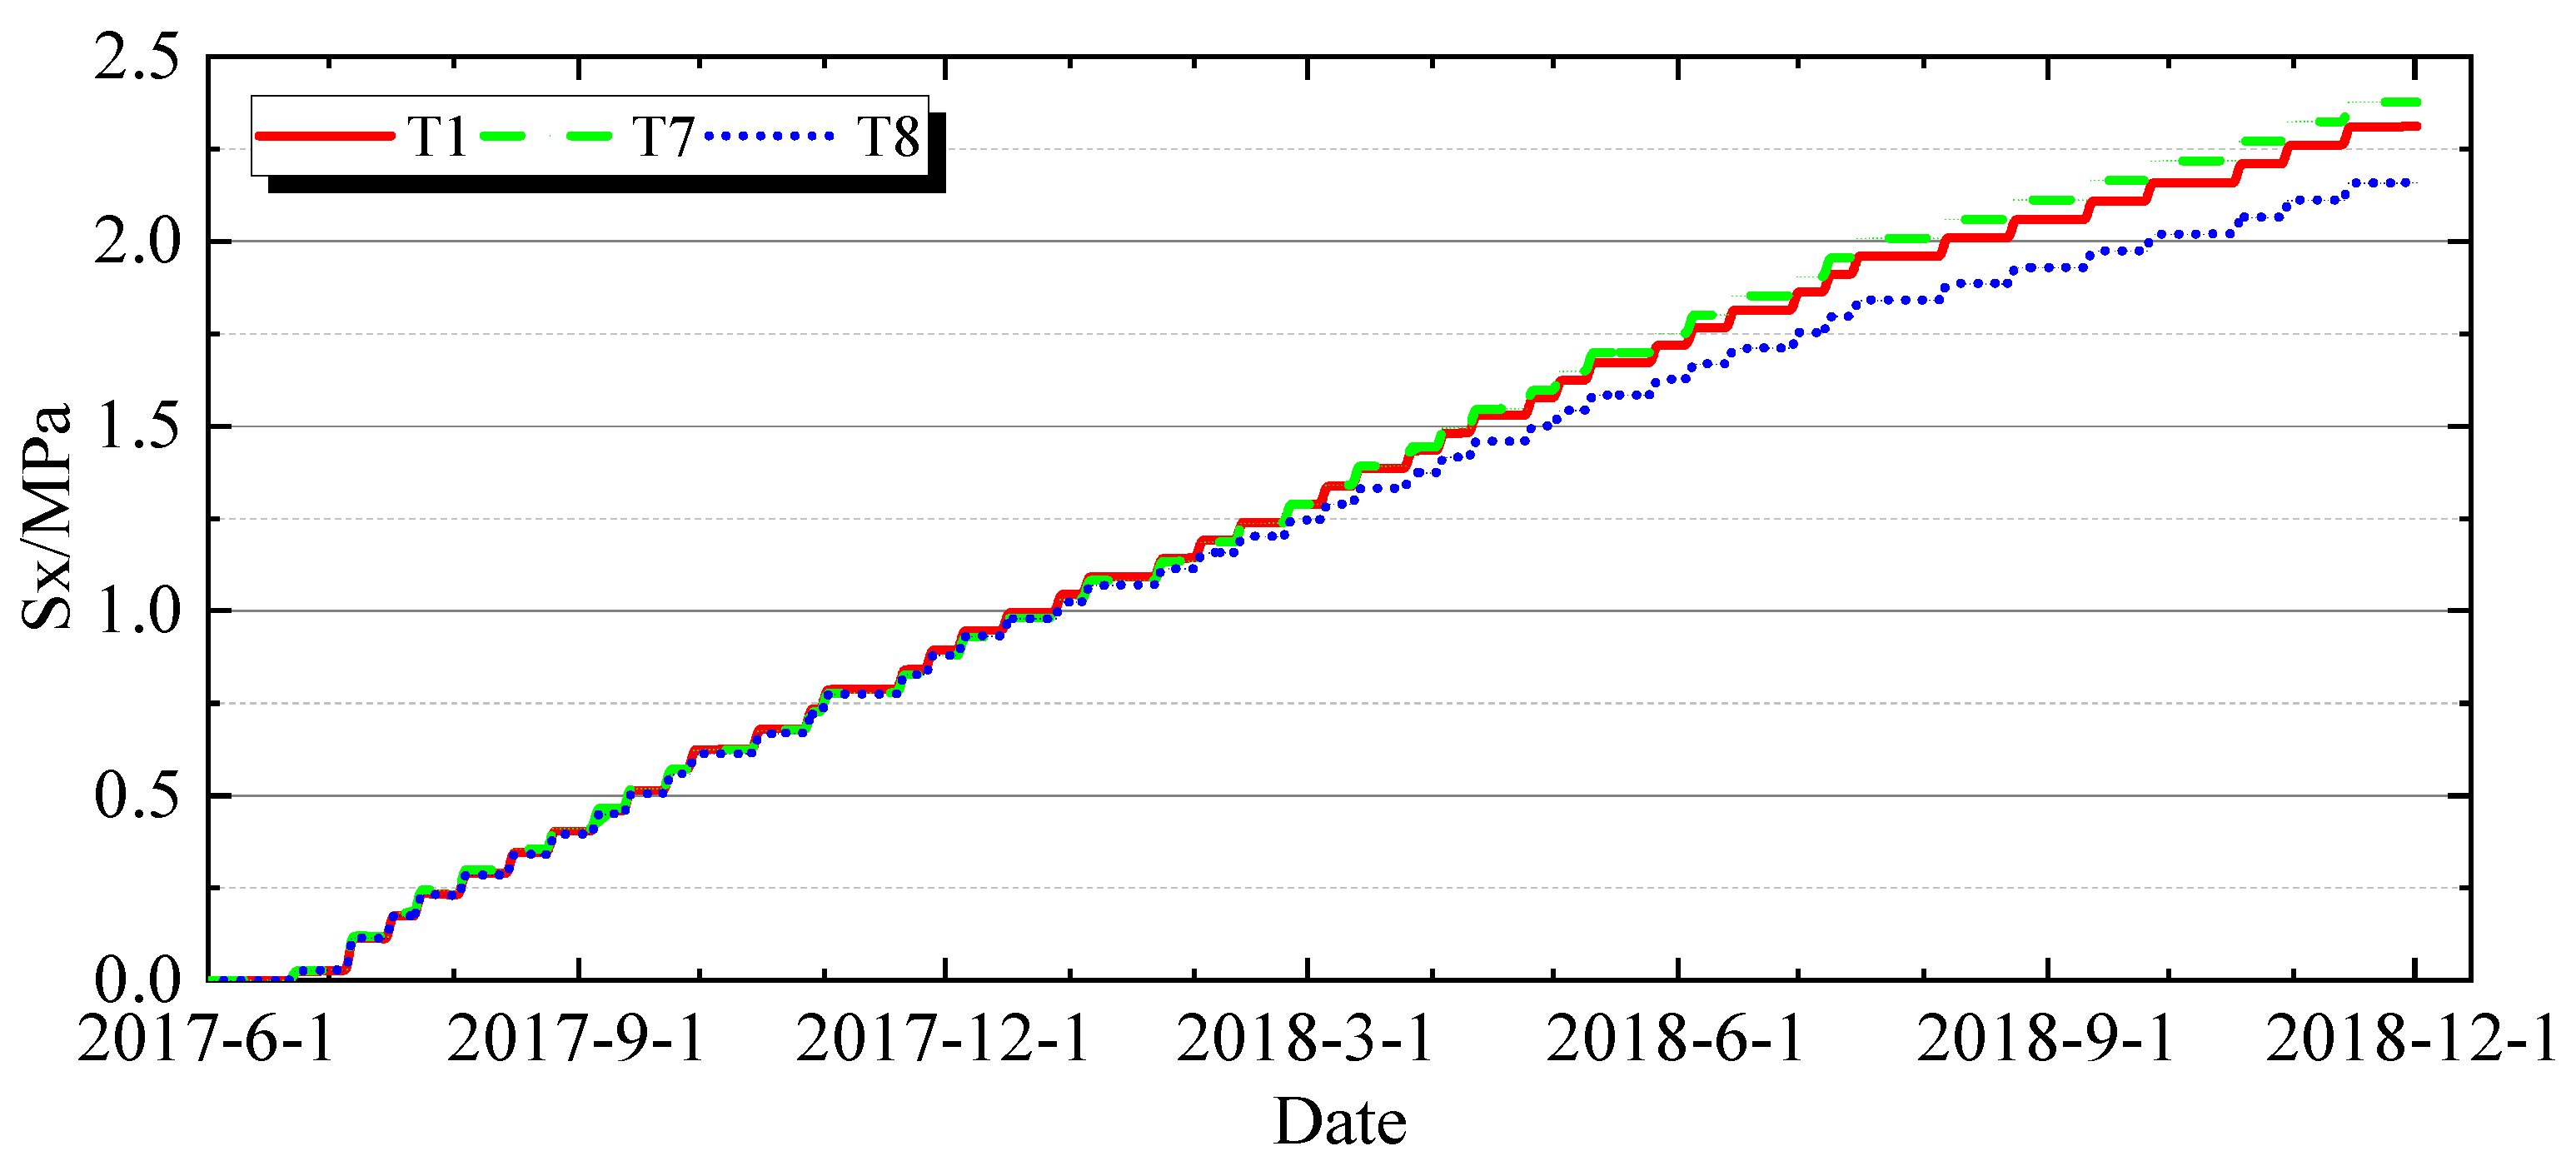
Regarding the distribution of hoop (X-direction) stress along the gallery direction at the vault, the axial distribution of hoop stress at the gallery vault at typical moments is illustrated in Figure 14 and Figure 15, while the stress histories at feature points (T1, T7, T8) of the vault are shown in Figure 16. Before the initiation of mid-term cooling, the hoop stresses at both ends of the gallery vault were generally comparable, with the hoop stress in the middle section being approximately 0.1 MPa to 0.2 MPa higher than at the ends. After the start of mid-term cooling, especially following the arch closure grouting at lower elevations and the gallery’s own elevation, due to increased constraints, the hoop stresses at both ends of the gallery gradually surpassed those in the middle section. Consequently, the hoop stress at the gallery vault exhibited a pattern where the stresses at both ends were greater than in the middle. By November 2018, the hoop stresses at both ends of the vault were 0.4 MPa to 0.5 MPa higher than in the middle section. Therefore, for the 733 gallery vault, the risk of cracking was higher in the middle section than at both ends before arch closure, whereas after arch closure, the risk of cracking became higher at both ends than in the middle section.
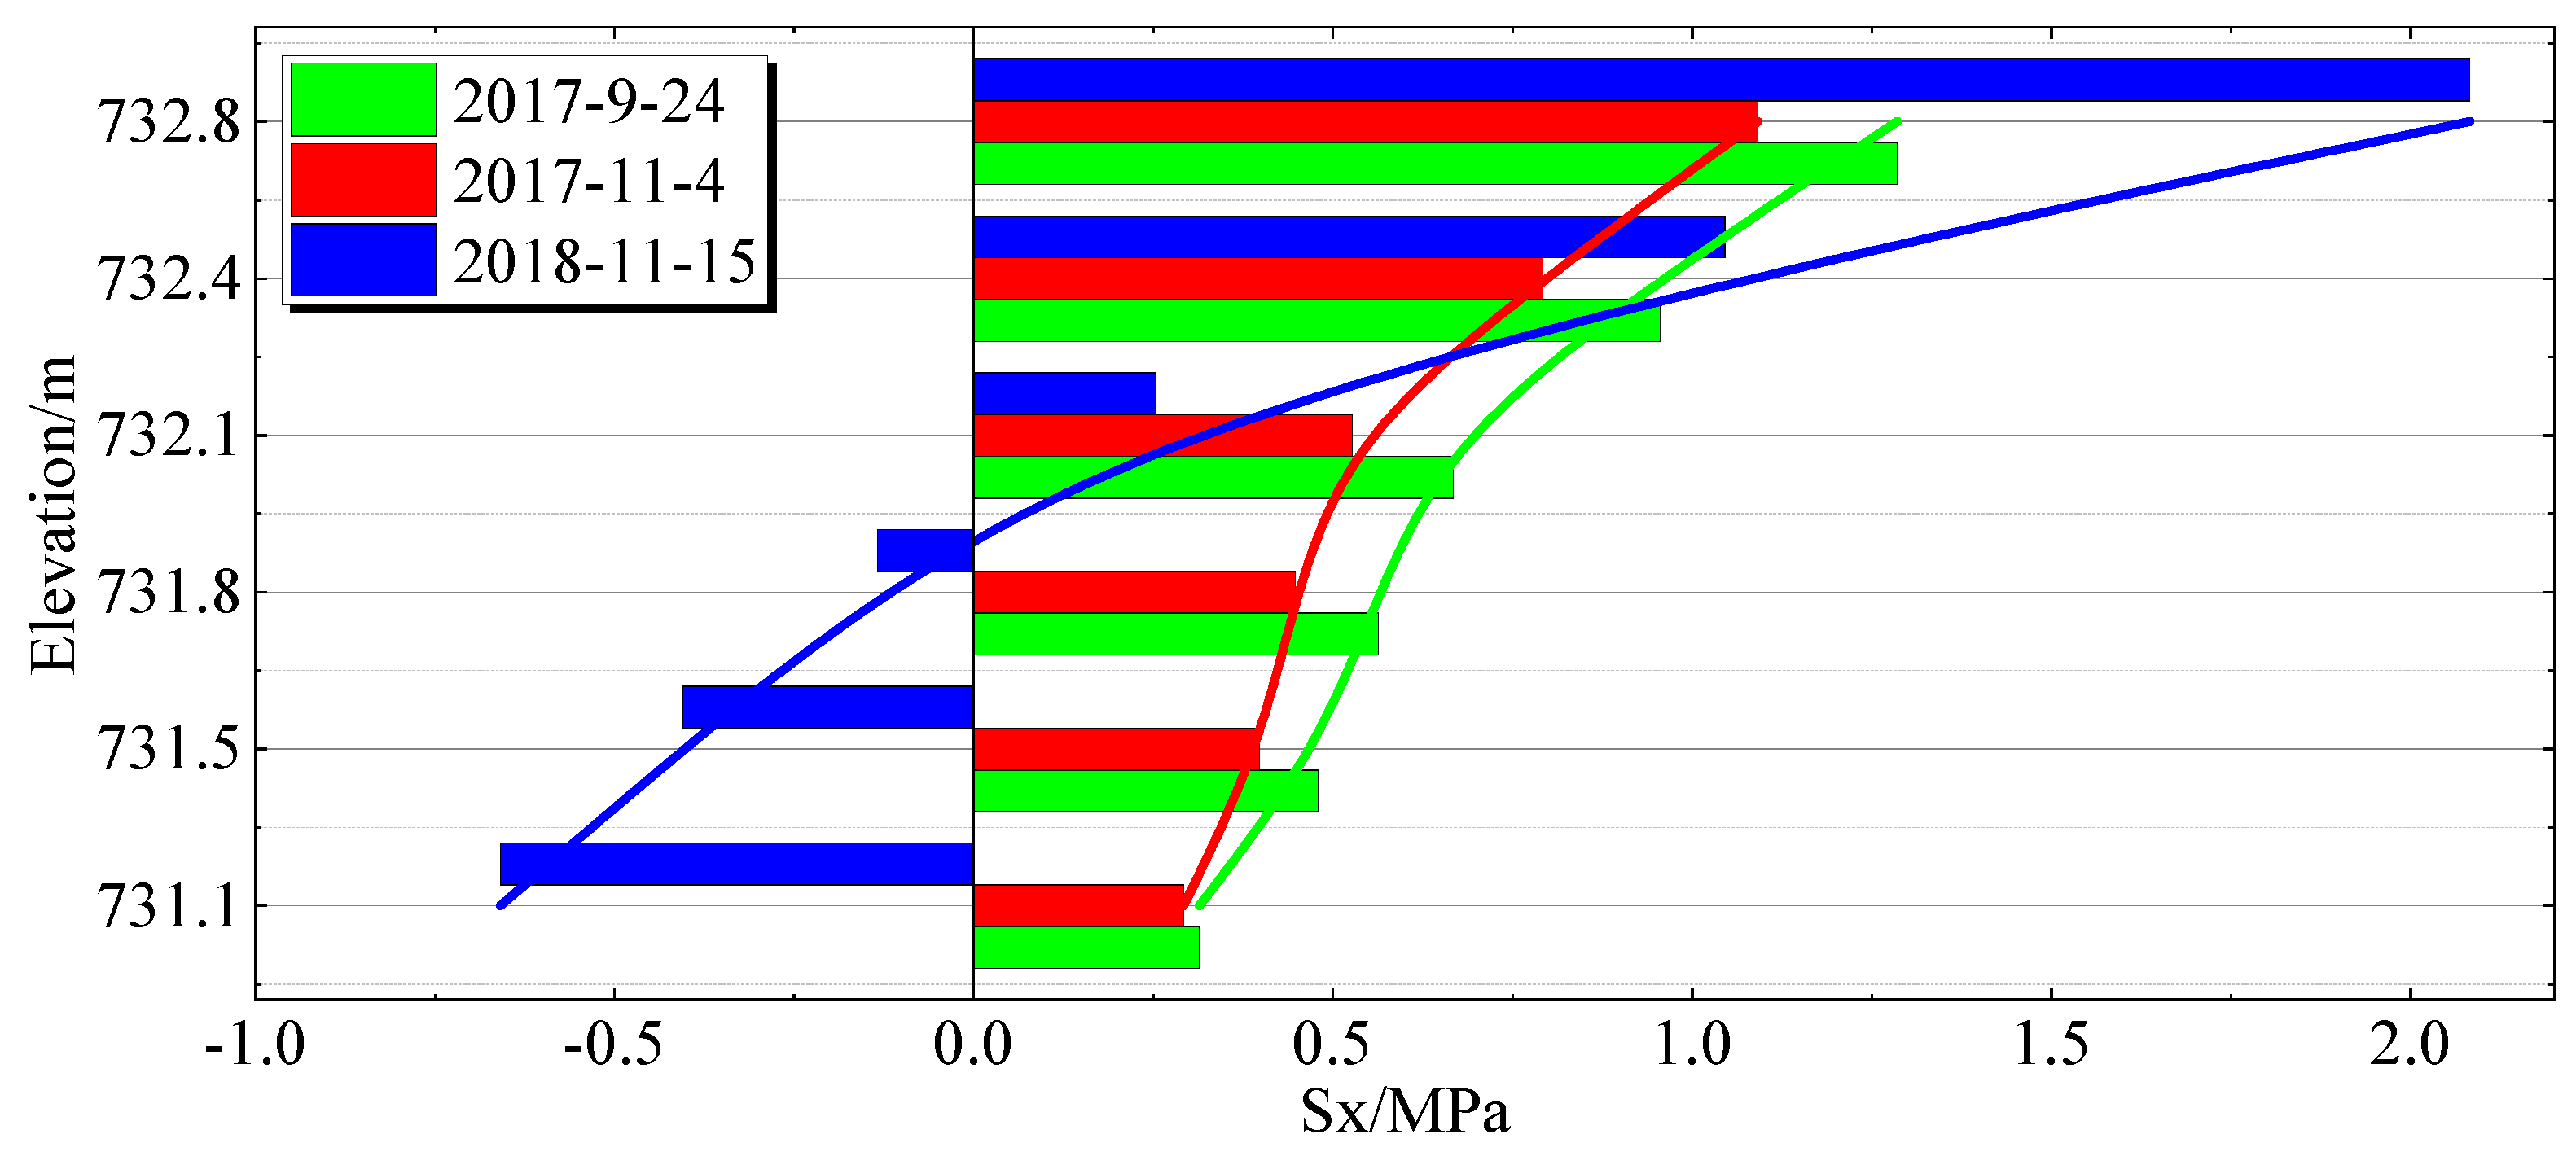
Regarding the vertical axial stress distribution along the depth of the floor slab, the histories of vertical axial stress σx at feature points (from T9 to T14) at different depths of the 733 gallery floor slab are shown in Figure 17, while the variation in vertical axial stress along the elevation of the floor slab is illustrated in Figure 18. The stress distribution pattern on the floor slab is generally consistent with that on the vault, with higher surface stresses that decrease rapidly as one moves deeper into the slab. Taking 15 November 2018, as an example, the vertical axial stress on the floor slab surface was 2.1 MPa, which rapidly decreased to 1.0 MPa at a depth of 0.35 m from the surface. The distribution characteristics of the vertical axial stress along the depth of the gallery floor slab indicate that, based on simulation analyses under current conditions, the depth range of the high-stress zone on the 733 gallery floor slab is limited. Consequently, if cracking occurs, its depth would also be limited.
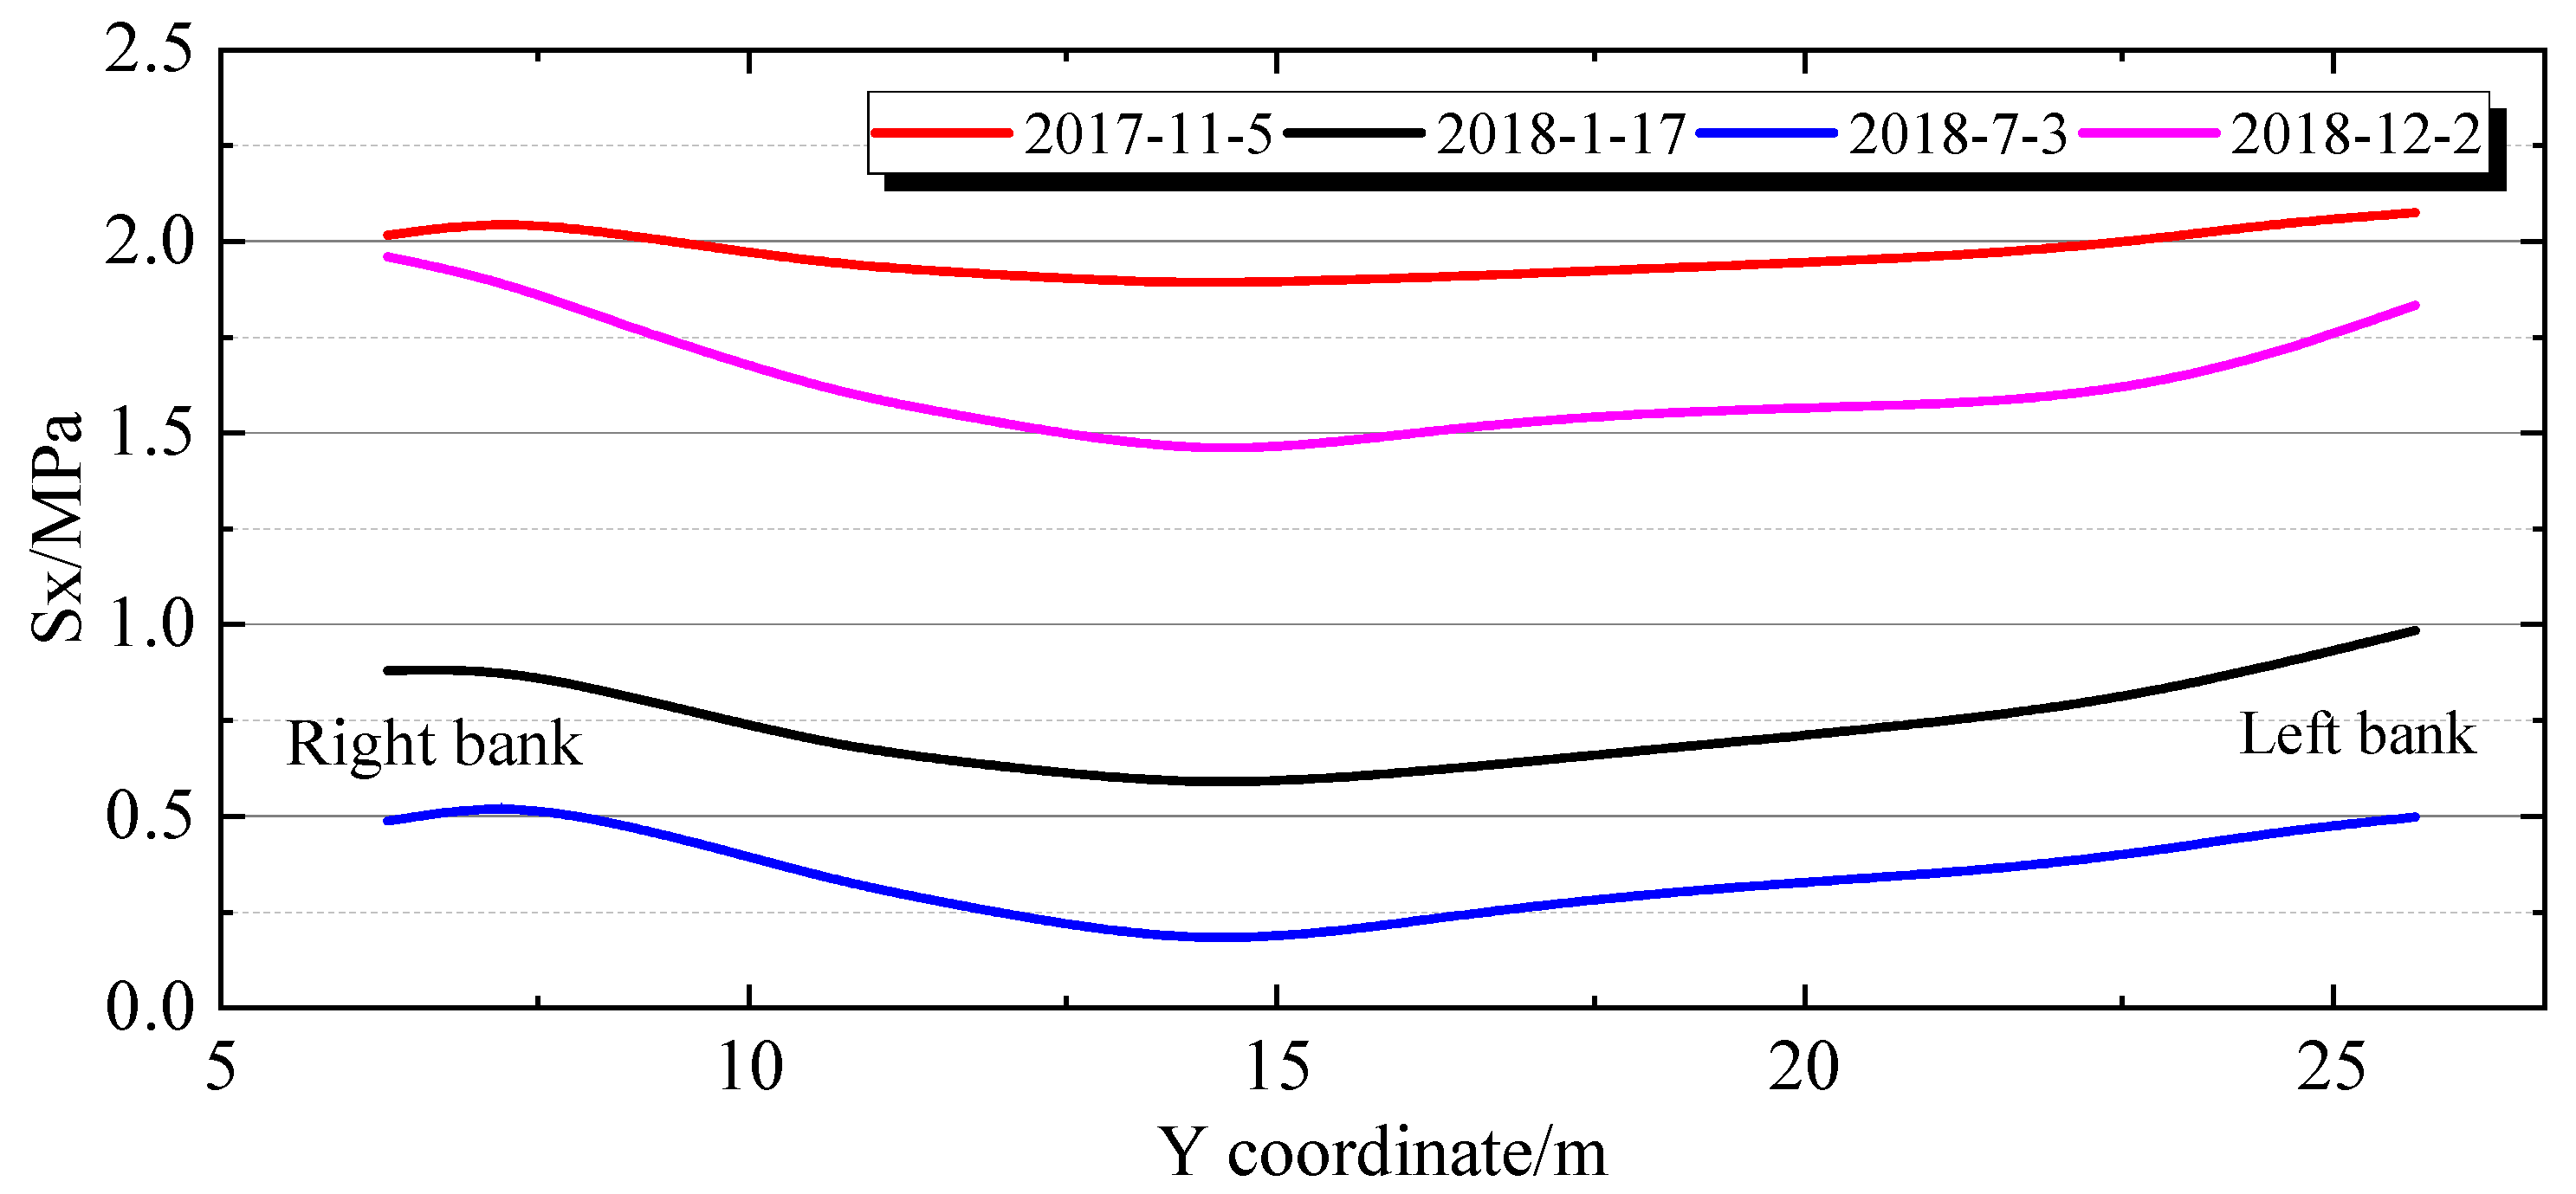
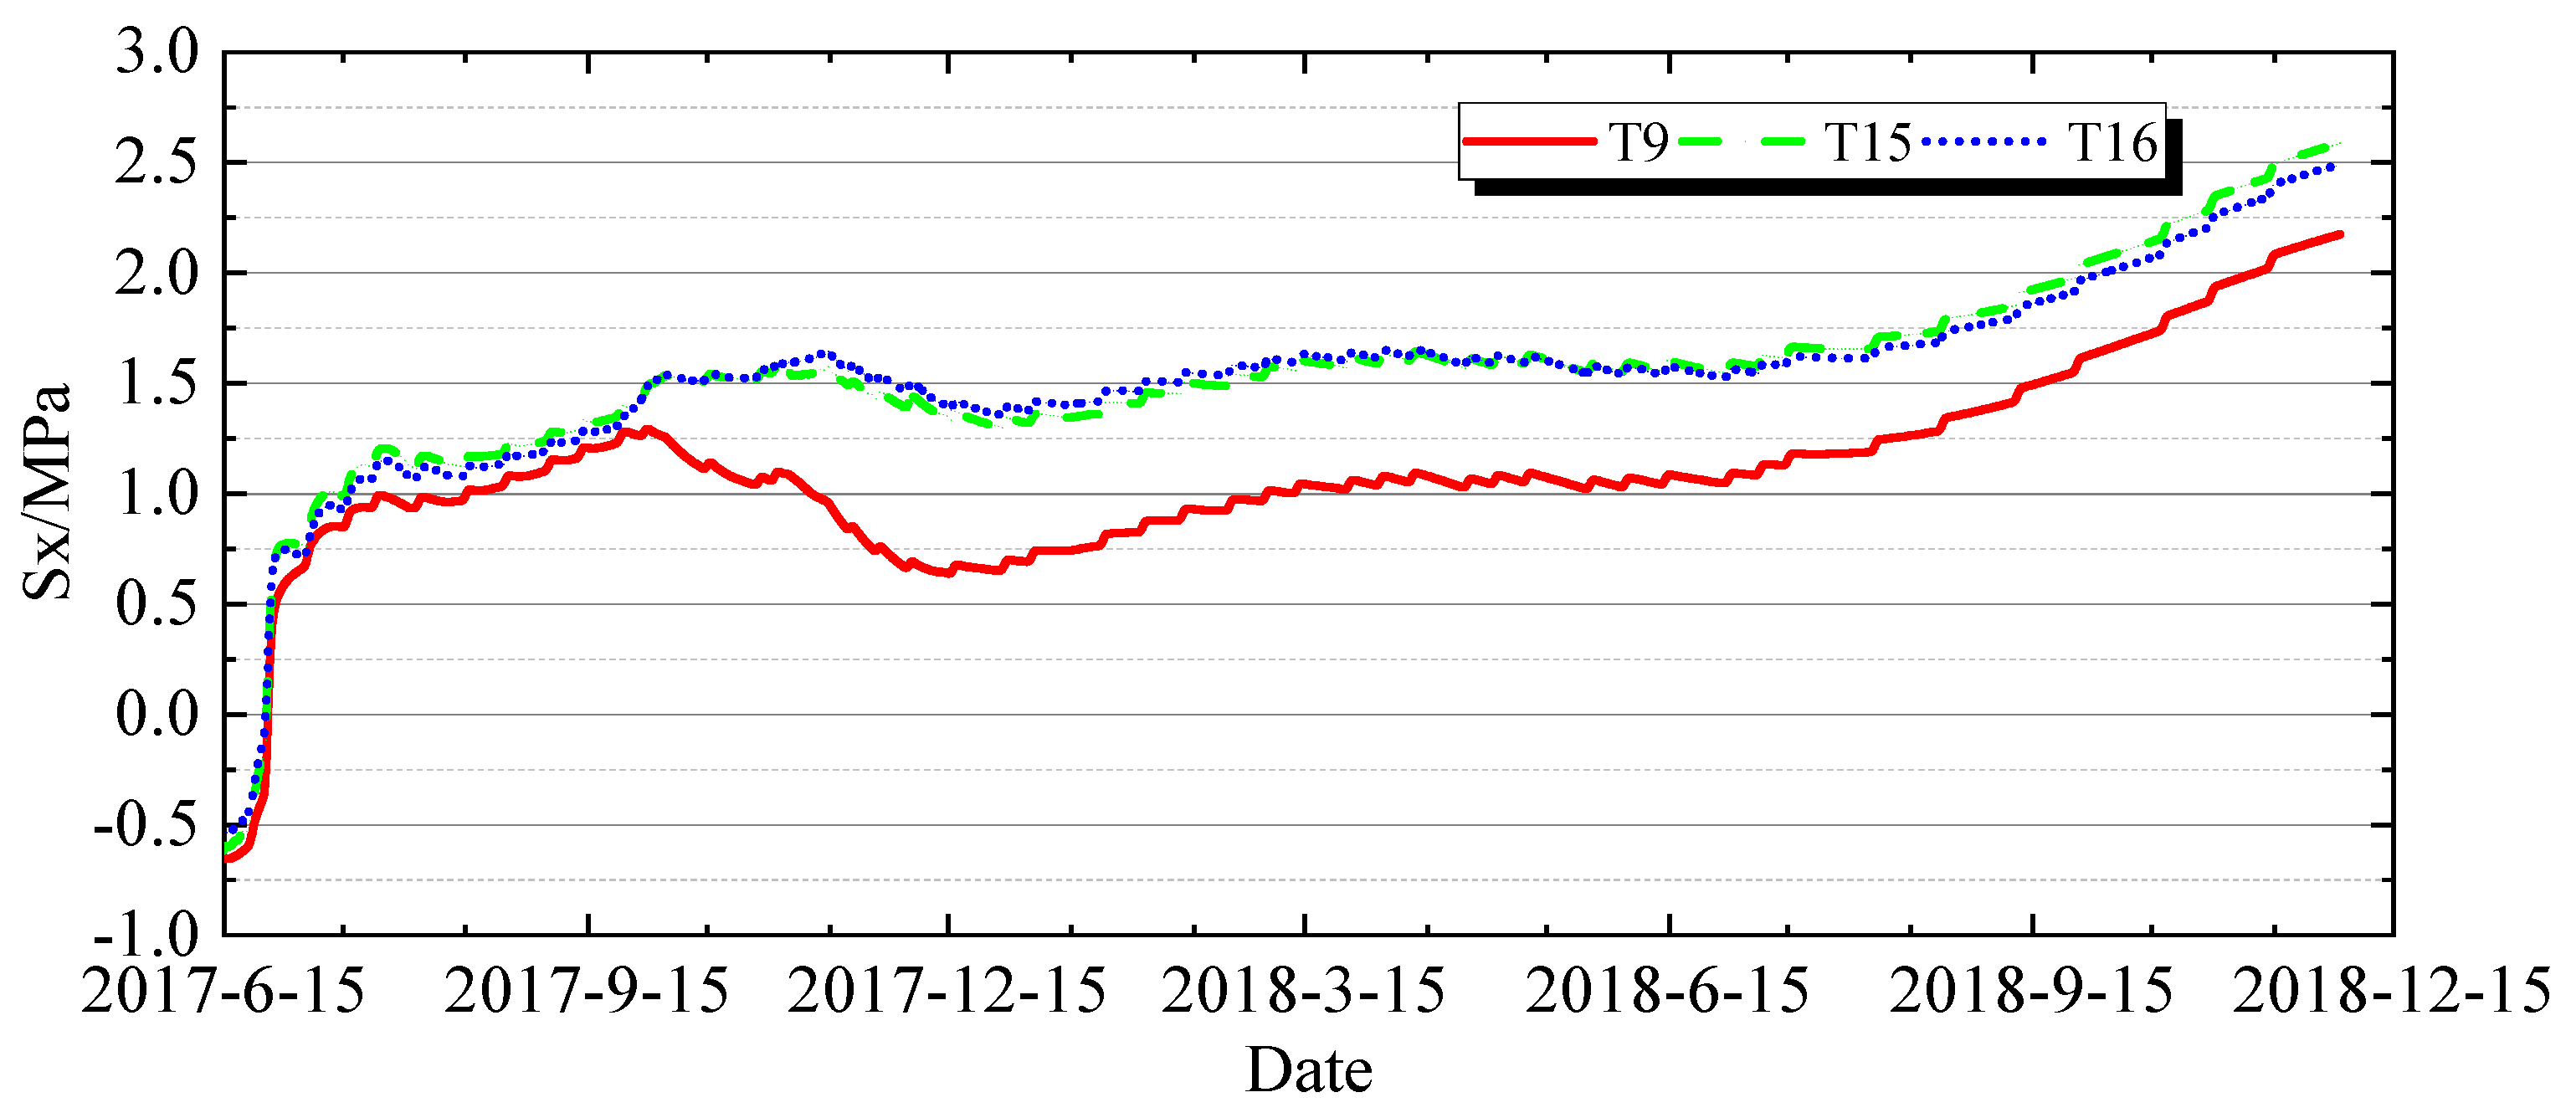
Regarding the distribution of vertical axial stress along the gallery axis on the floor slab, the axial distribution of vertical axial stress on the gallery floor slab at typical moments is illustrated in Figure 19 and Figure 20, while the stress histories of vertical axial stress at feature points (T9, T15, T16) on the floor slab are shown in Figure 21. Before and after cooling and arch closure, the vertical axial stresses at both ends of the gallery are generally comparable and greater than the stress in the middle section. Before mid-term cooling, the vertical axial stresses at both ends are approximately 0.2 to 0.3 MPa higher than in the middle section. After arch closure grouting, the stresses at both ends are about 0.4 MPa to 0.5 MPa higher than in the middle section. Therefore, for the 733 gallery floor slab, the risk of cracking is greater at both ends than in the middle section.

4.3. Stress Sensitivity Analysis of the 733 Gallery

4.3.1. Influence of Self-Weight

Under the condition of considering only the self-weight (Working Condition 1), the hoop stress history at feature points of different depths on the gallery vault is shown in Figure 22. As the dam is poured, the hoop stress on the gallery vault and the vertical axial stress on the floor continue to increase. When pouring reaches an elevation of 870 m (December 2018), the hoop stress caused by self-weight on the gallery vault is 2.3 MPa. The farther away from the vault surface, the smaller the hoop stress becomes, decreasing to 0.9 MPa at a distance of 0.3 m from the vault surface. Along the axis direction of the gallery, the difference in hoop stress caused by self-weight on the vault surface is within 0.2 MPa (see Figure 23).
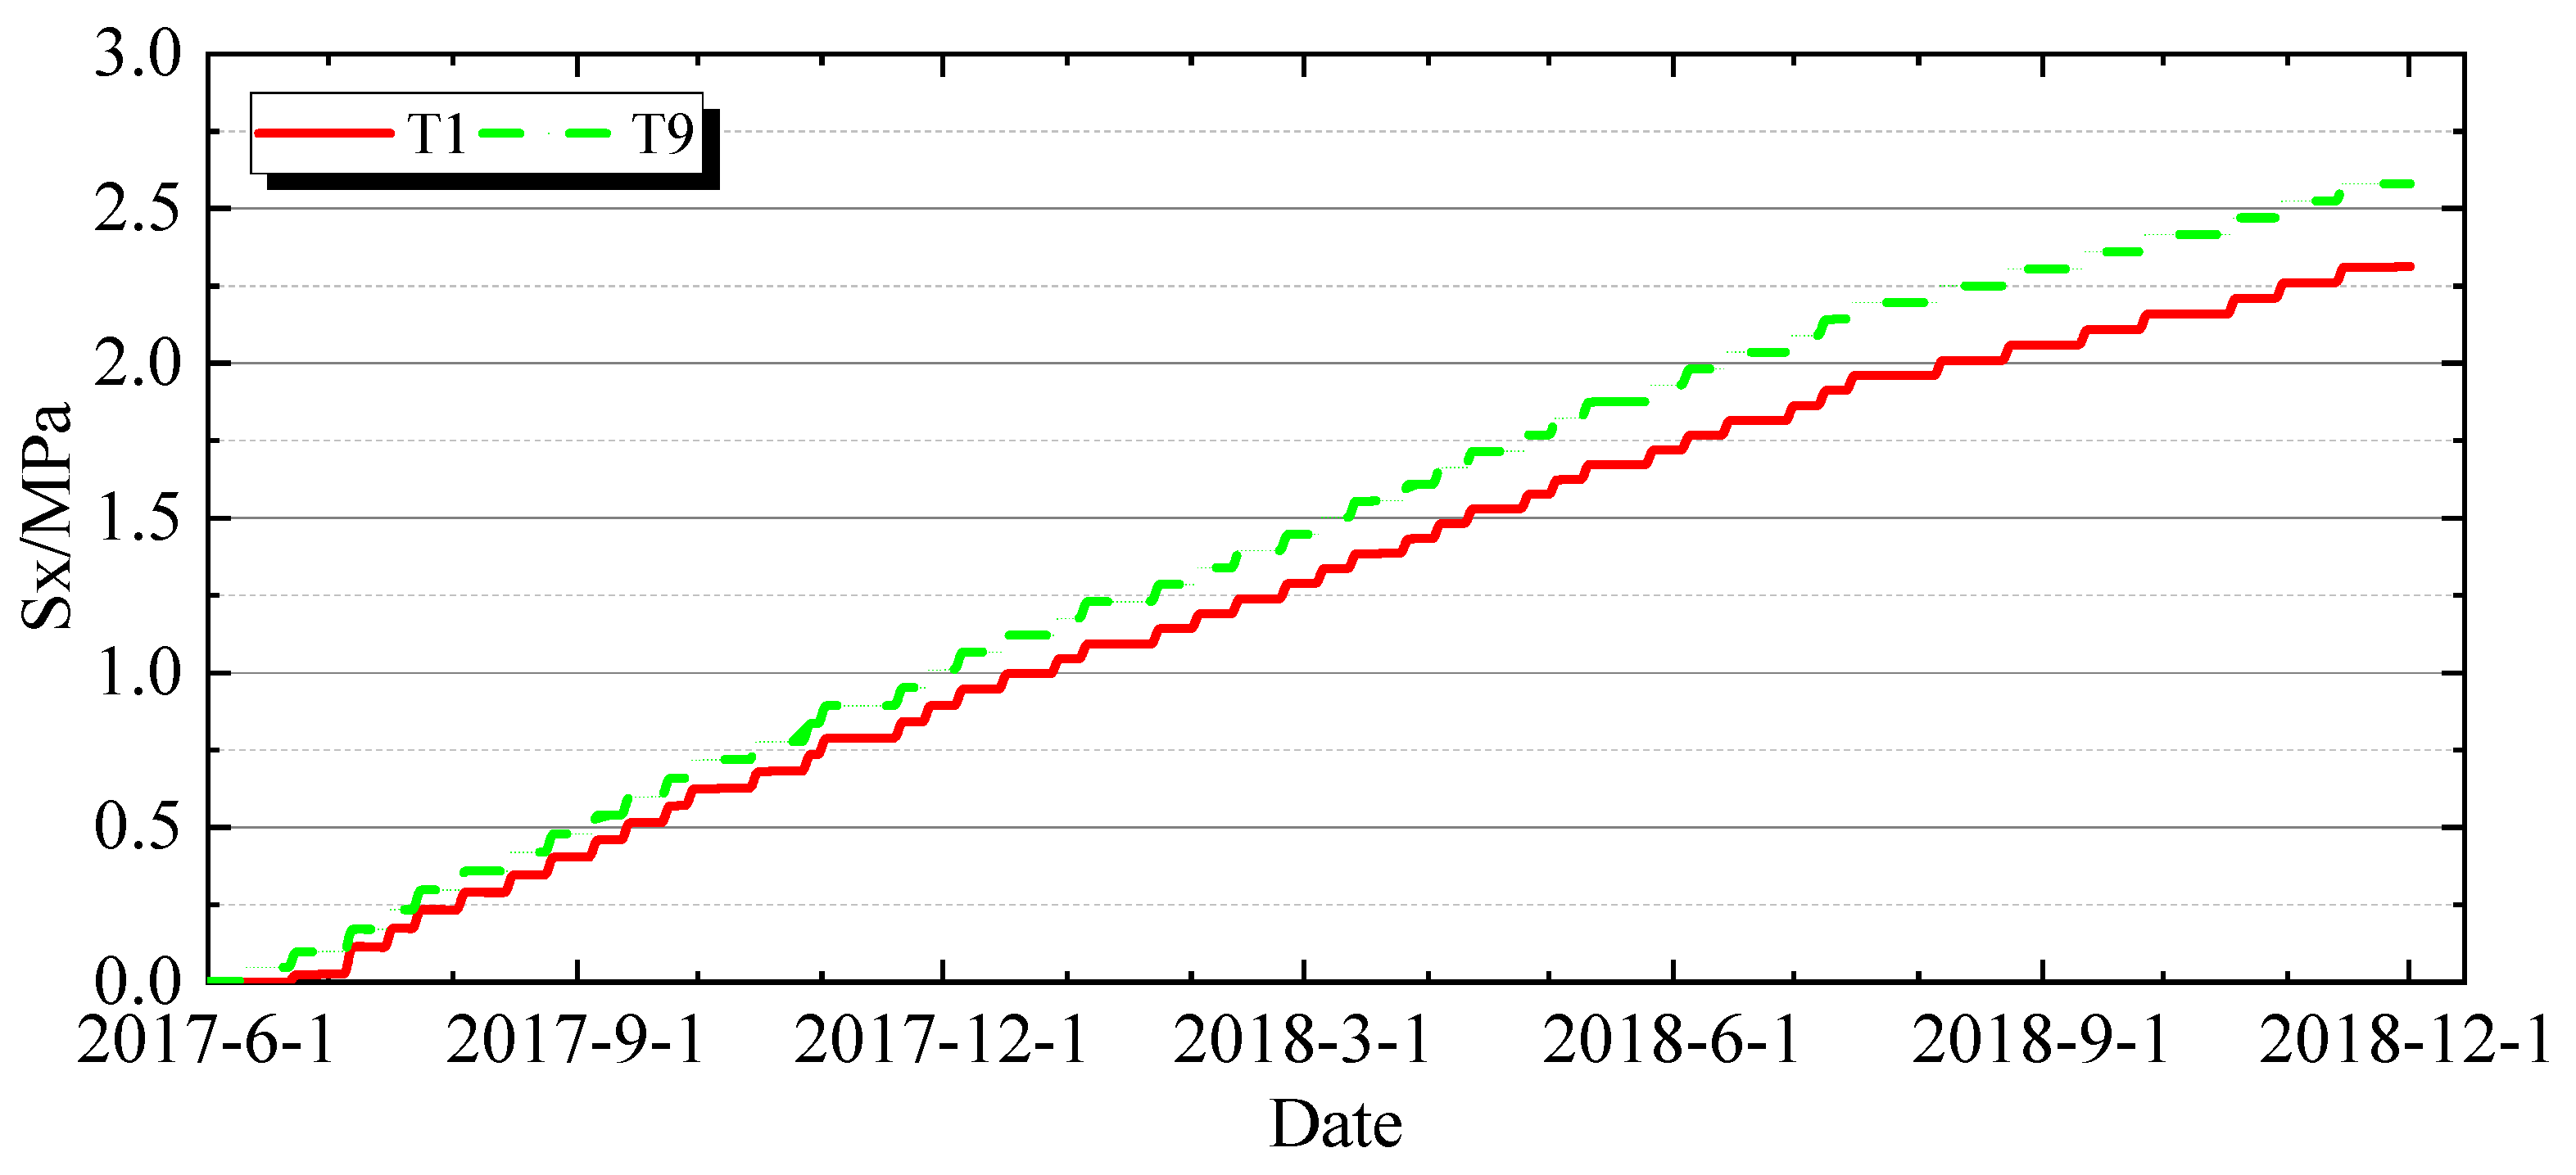
Comparing the vertical axial stress on the gallery floor surface with the hoop stress on the vault surface (see Figure 24), the stress caused by self-weight on the floor is greater than that on the vault. When pouring reaches an elevation of 870 m, the vertical axial stress on the floor surface is 2.58 MPa, while the hoop stress on the vault is 2.30 MPa.
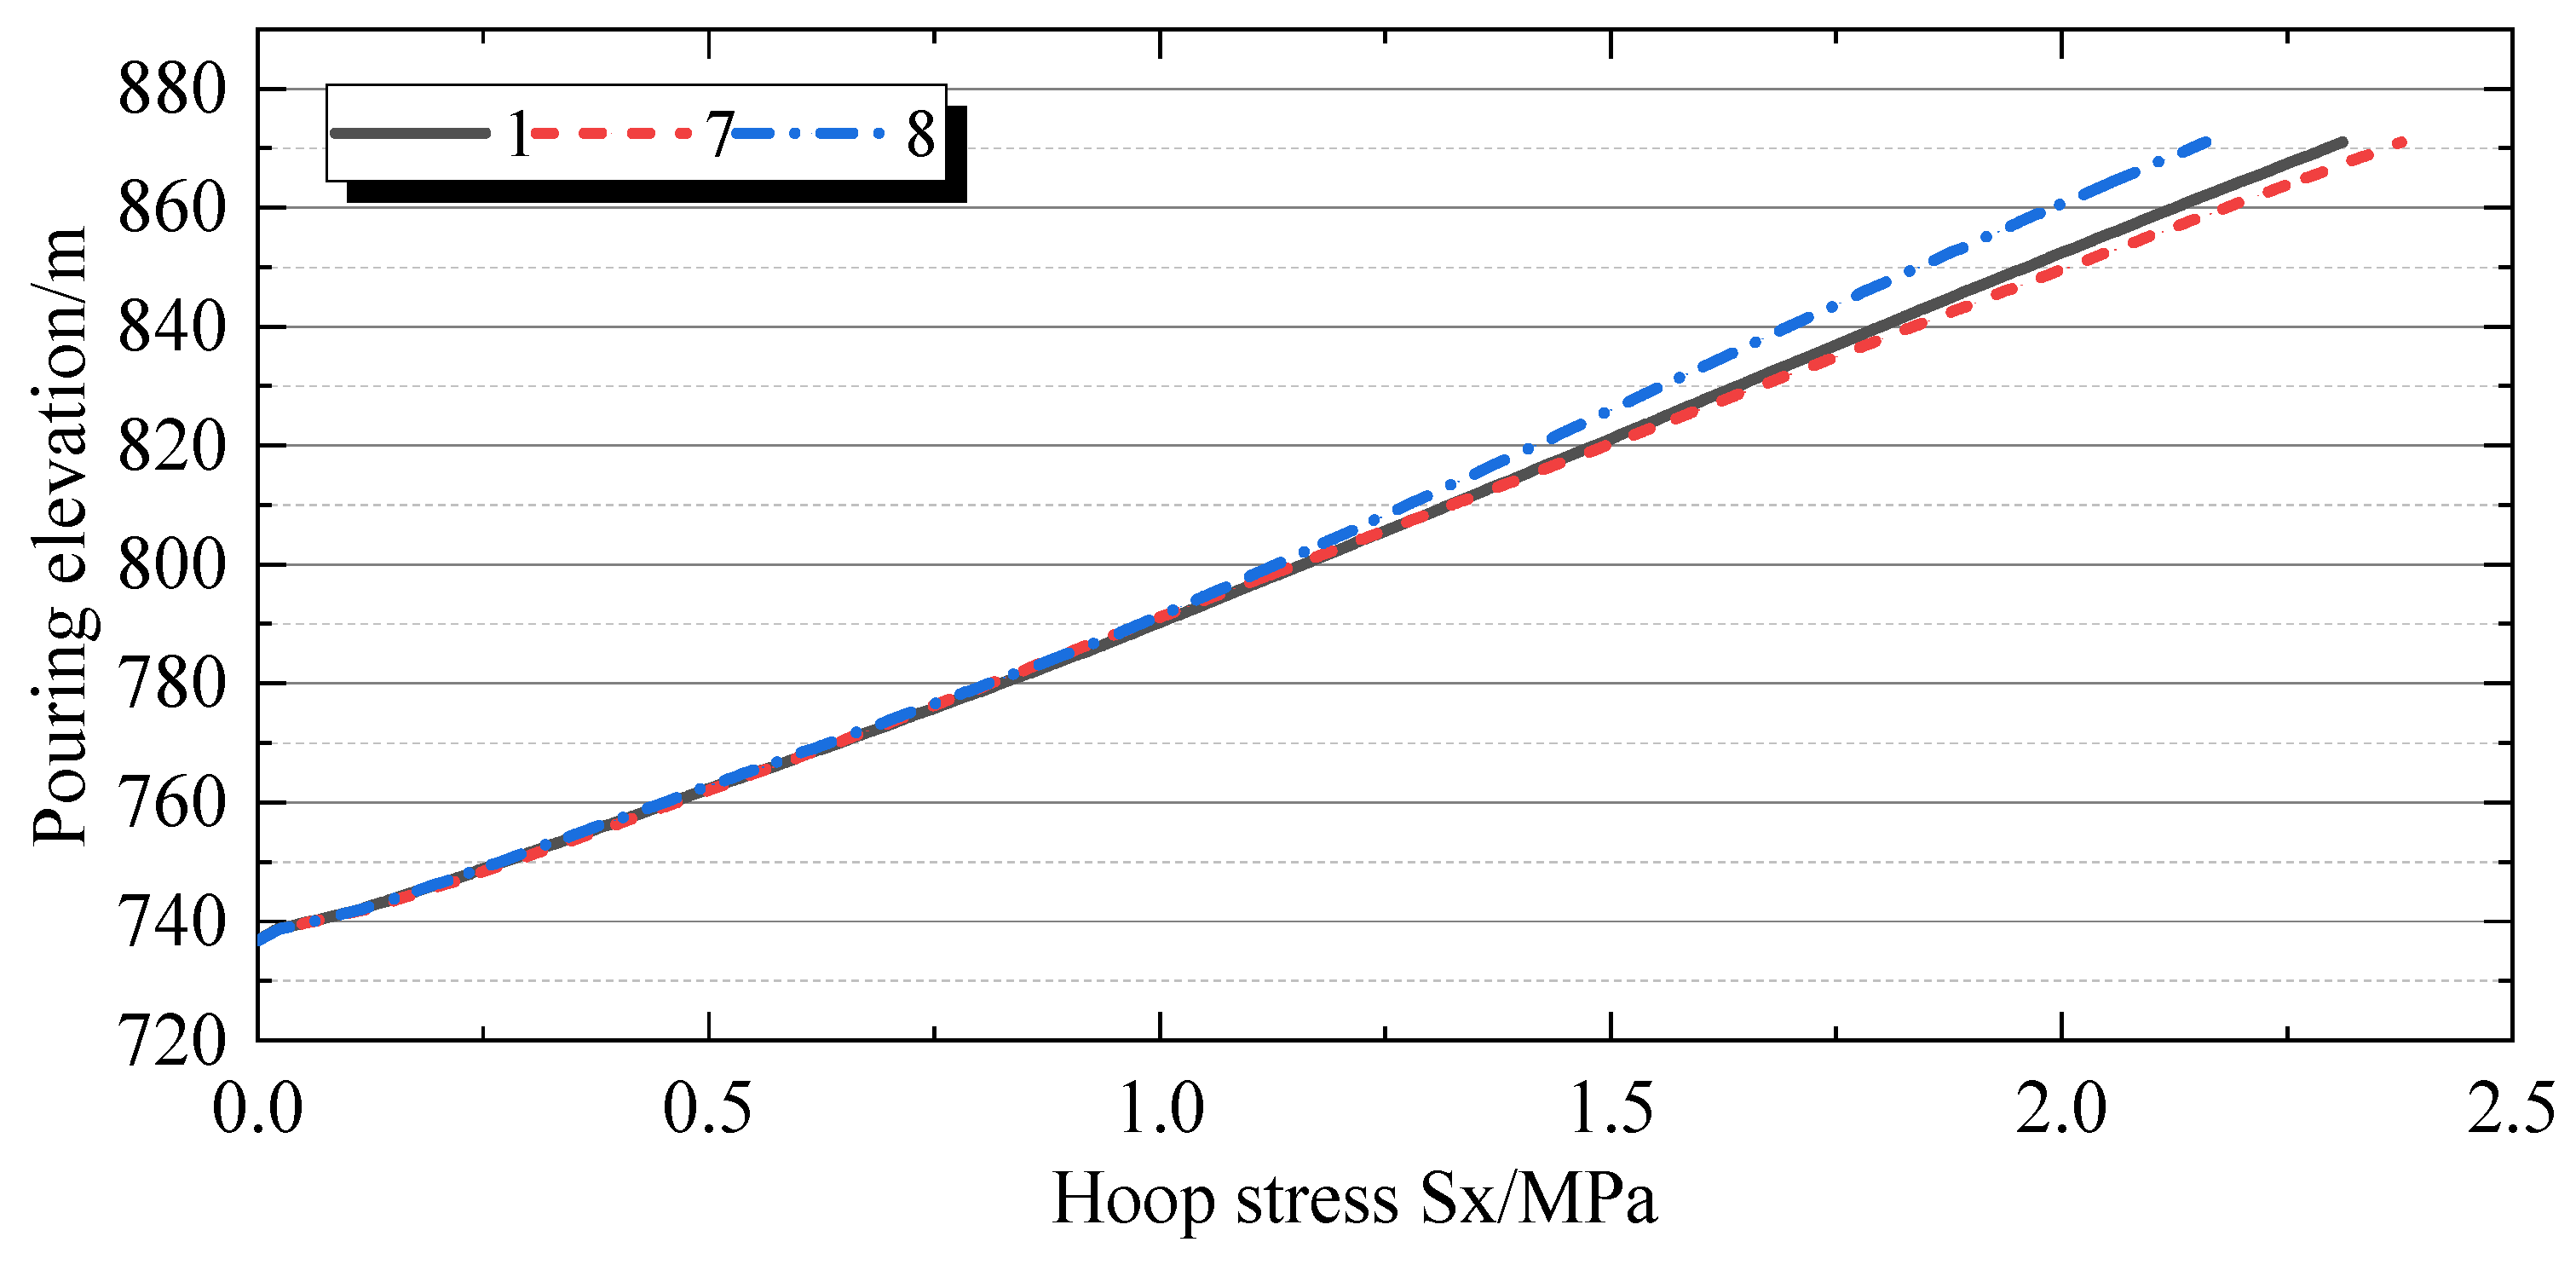
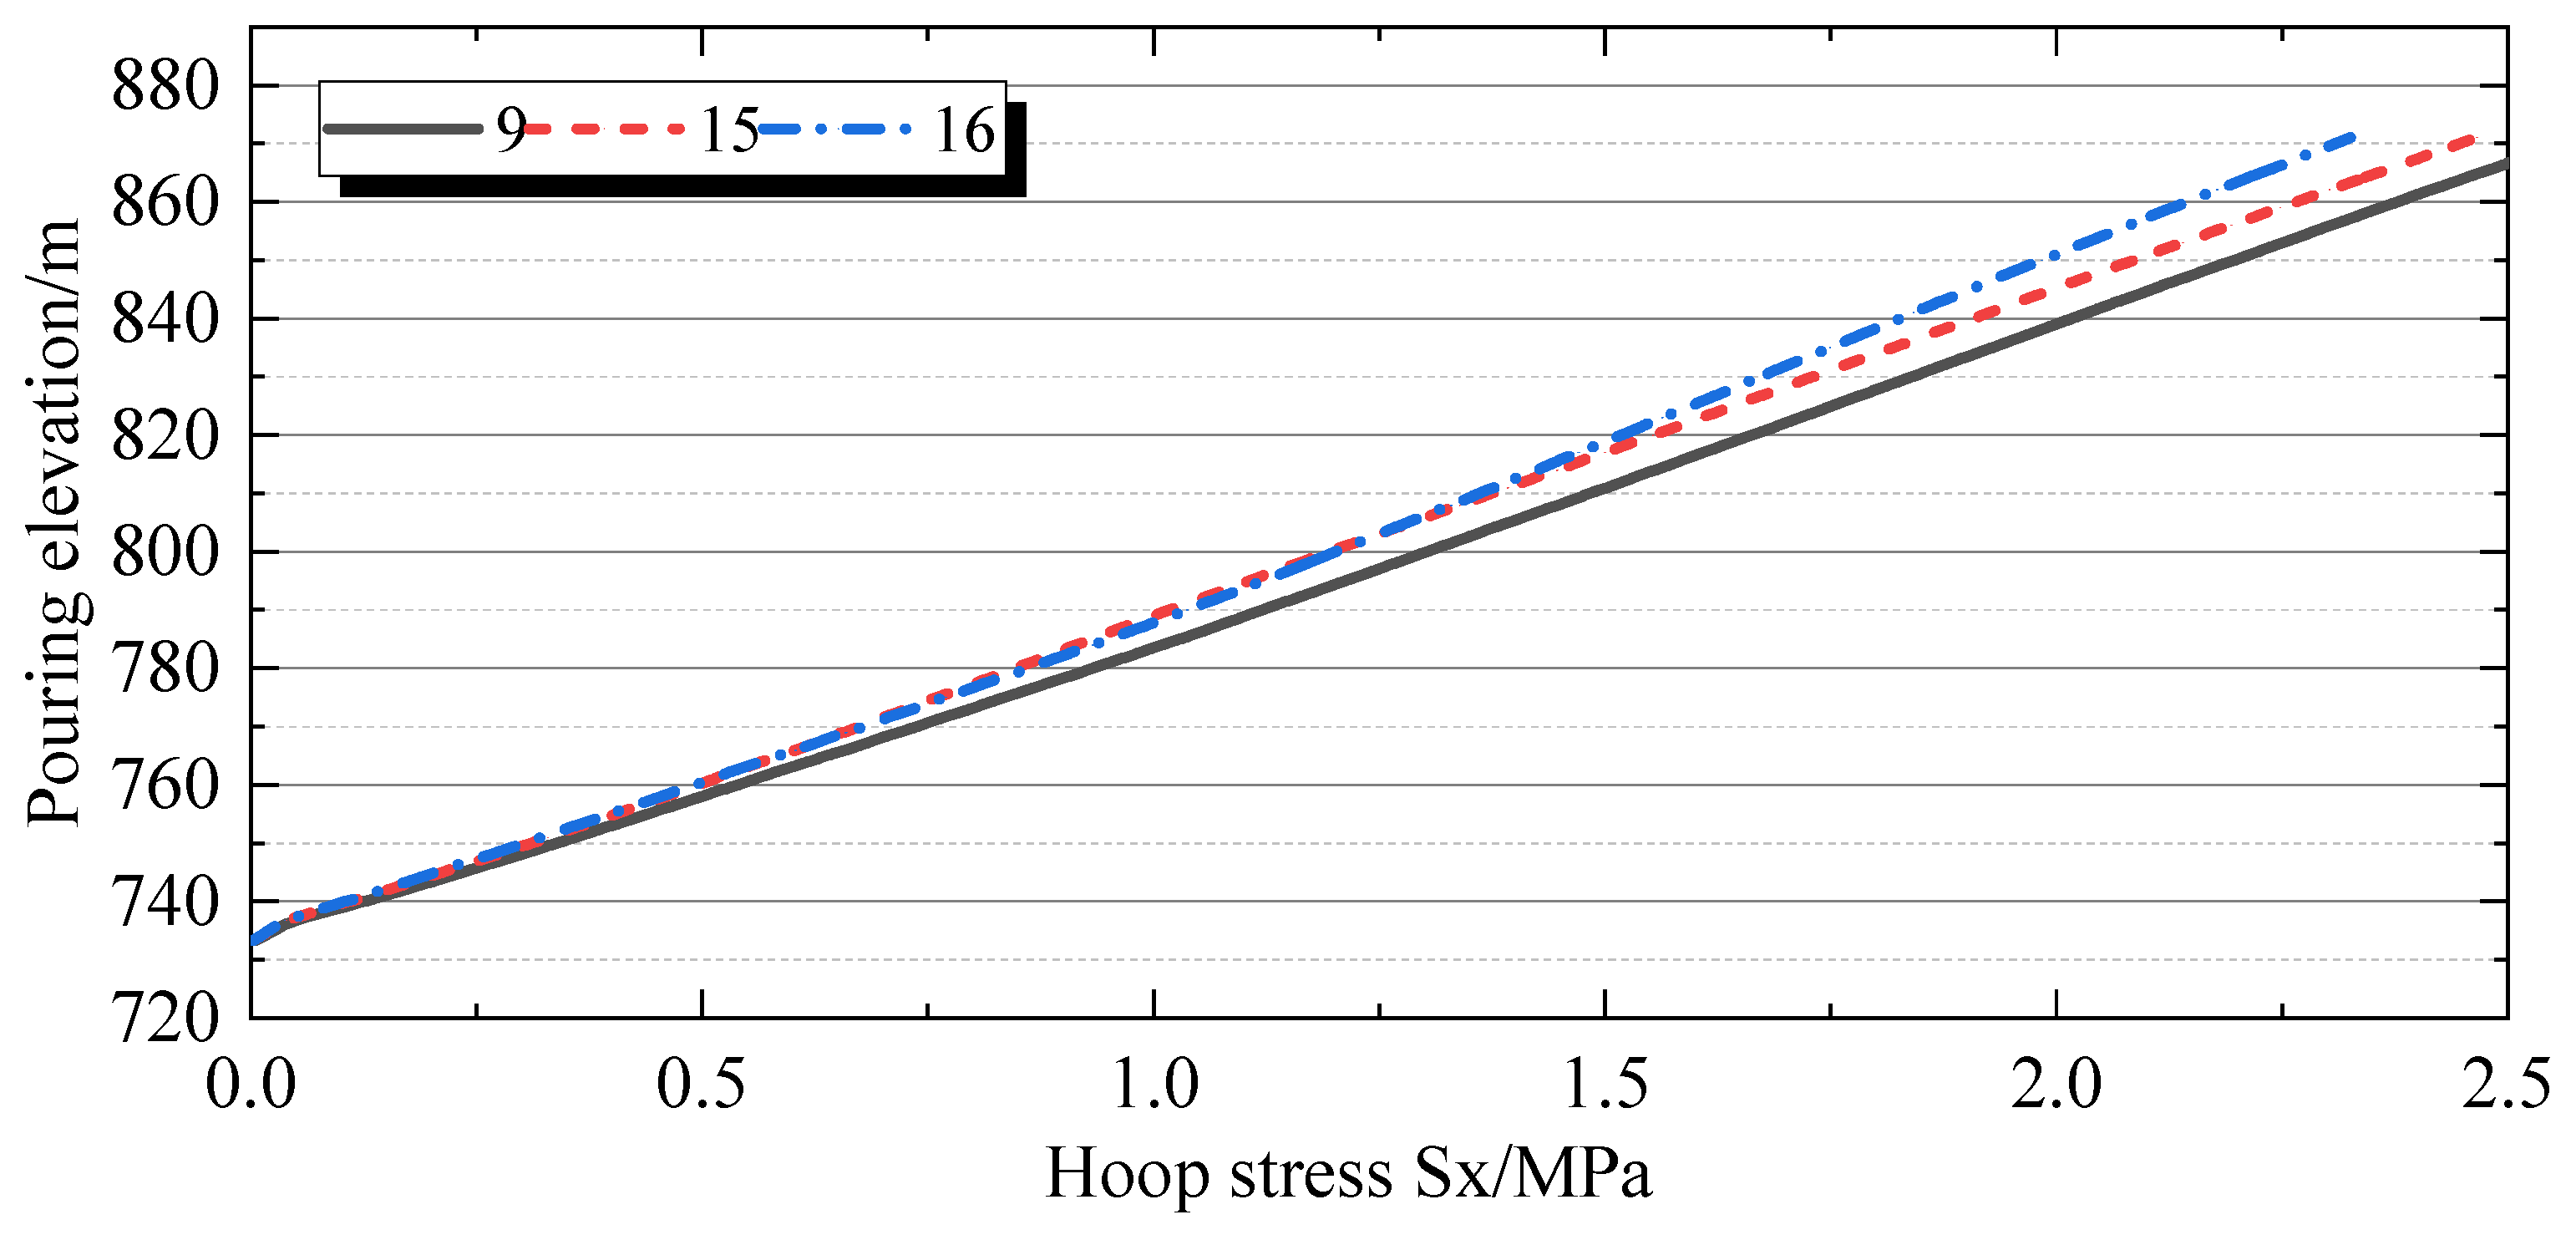
The variations in hoop stress on the vault surface and vertical axial stress on the floor surface with the pouring elevation are shown in Figure 25 and Figure 26. Before arch closure grouting of the gallery vault, as the pouring progresses, the hoop stress on the vault increases with the pouring elevation at a generally consistent rate. For every 1 m increase in pouring elevation, the hoop stress on the gallery vault increases by approximately 0.019 MPa. After arch closure grouting, for every 1 m increase in pouring elevation, the vault at the left end (T8) of the gallery experiences an increase in stress of about 0.0149 MPa, the vault at the middle (T1) of the gallery experiences an increase of about 0.0165 MPa, and the vault at the right end (T7) of the gallery experiences an increase of about 0.0172 MPa. The rate of stress increase caused by self-weight decreases from the right to the left and is lower than the rate of stress increase before arch closure. Clearly, due to the “arch” effect, the increase in stress caused by the self-weight of the newly poured concrete on the 733 gallery vault will further decrease as the concrete above the gallery is sealed by arch closure. Similarly to the vault, the rate of stress increase caused by the self-weight of the newly poured concrete at various locations on the gallery floor will also continuously decrease after each stage of arch closure.

4.3.2. Impact of Temperature Loads

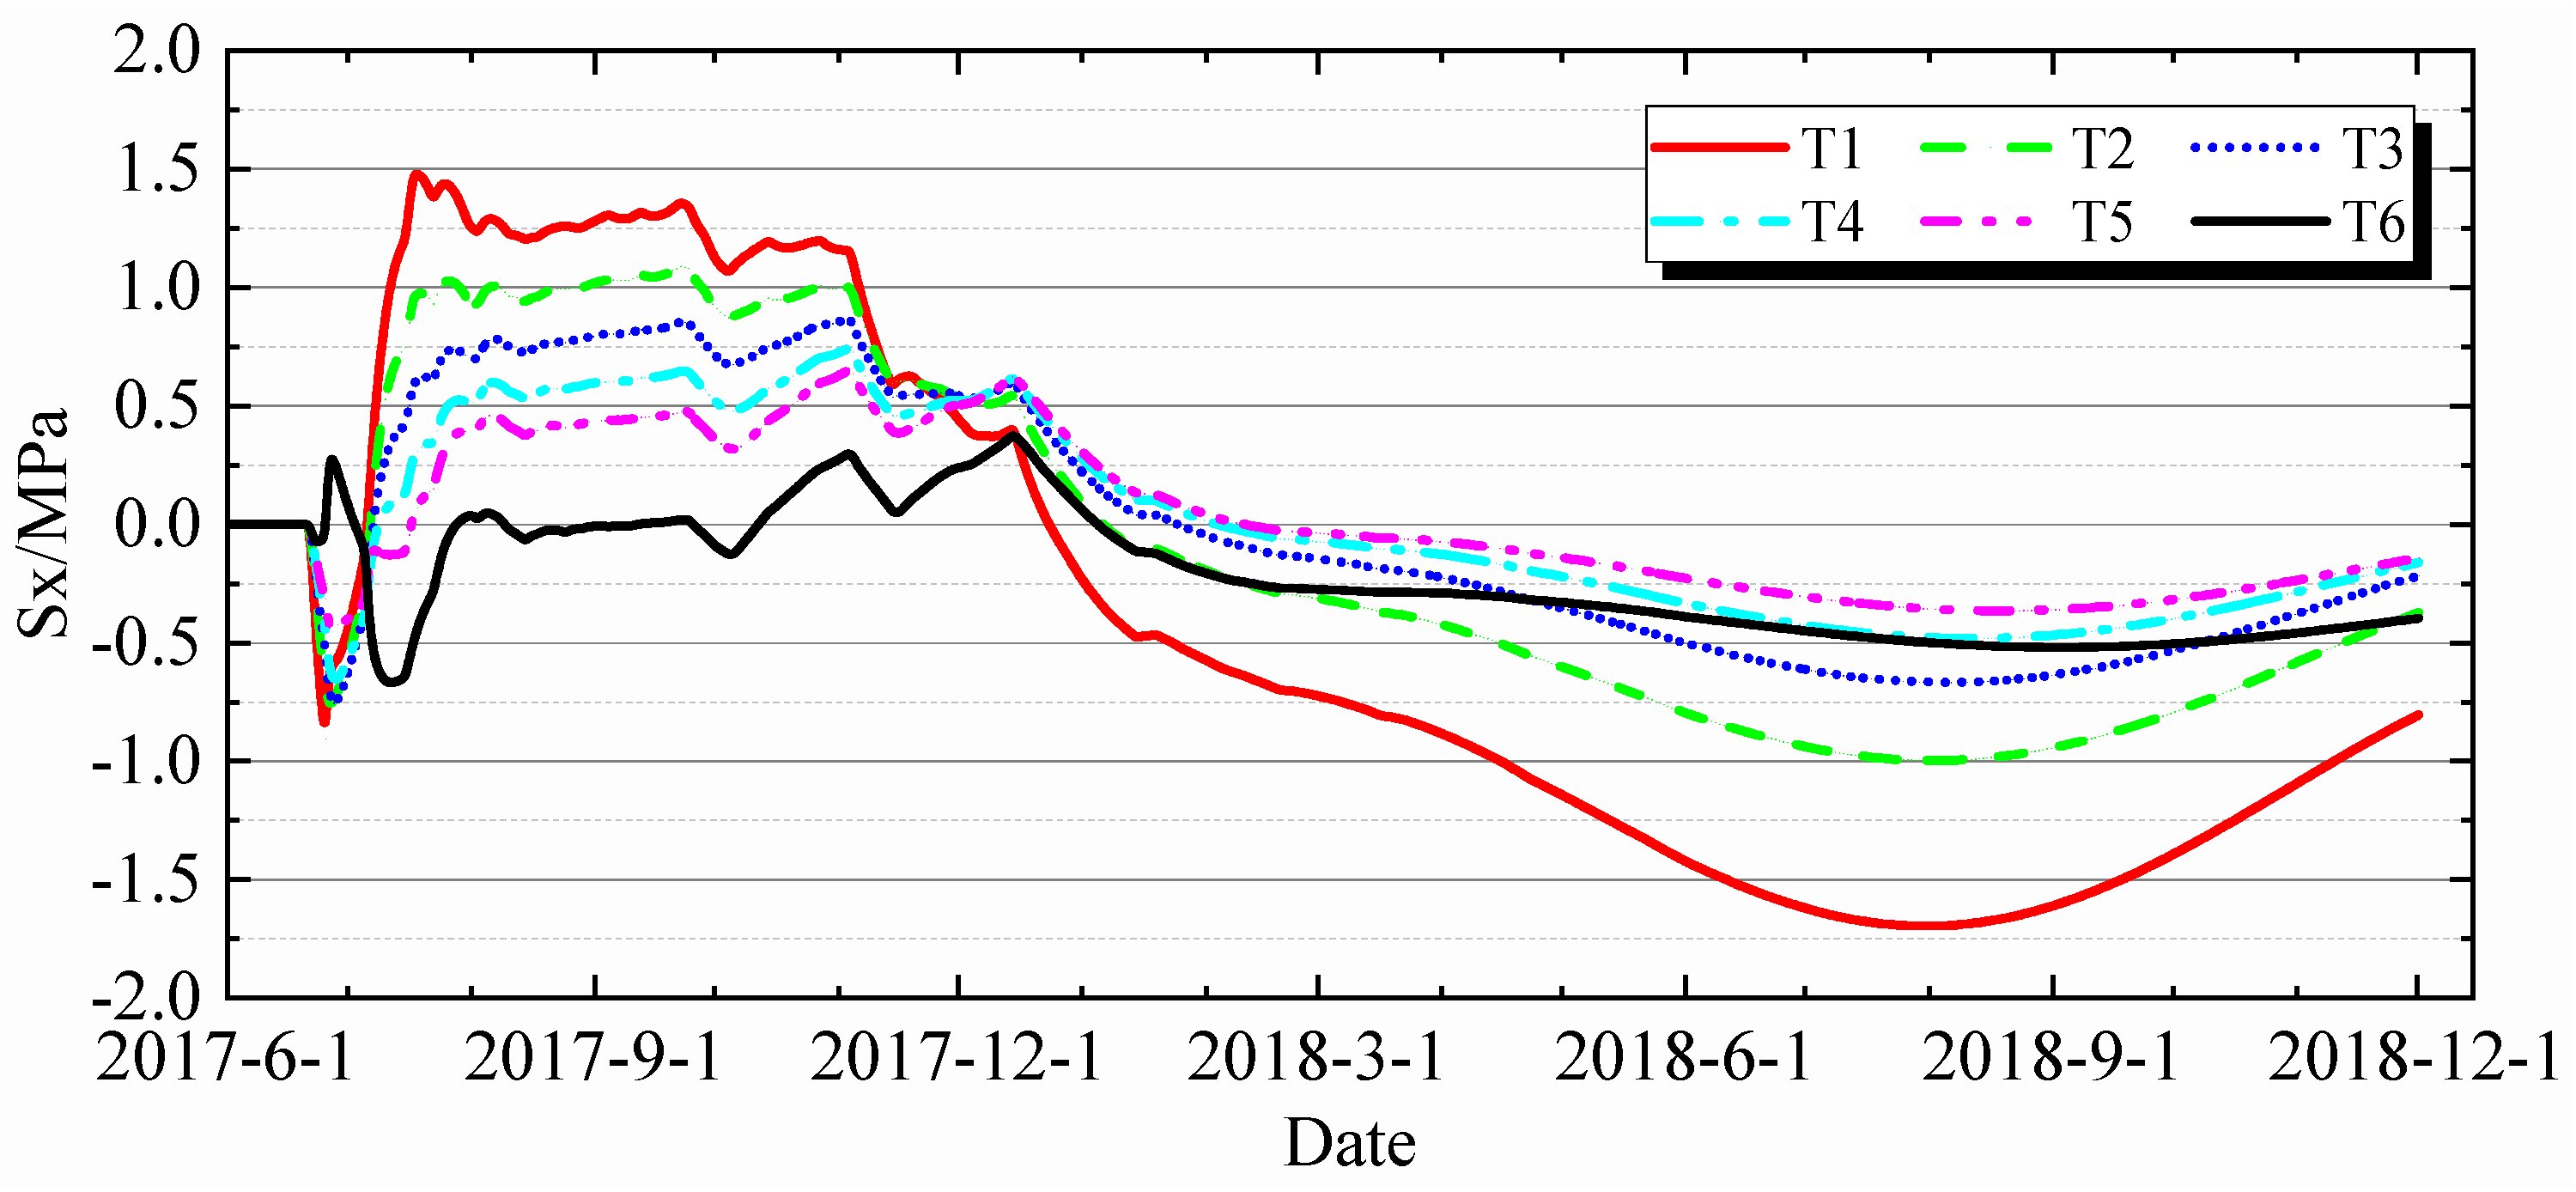
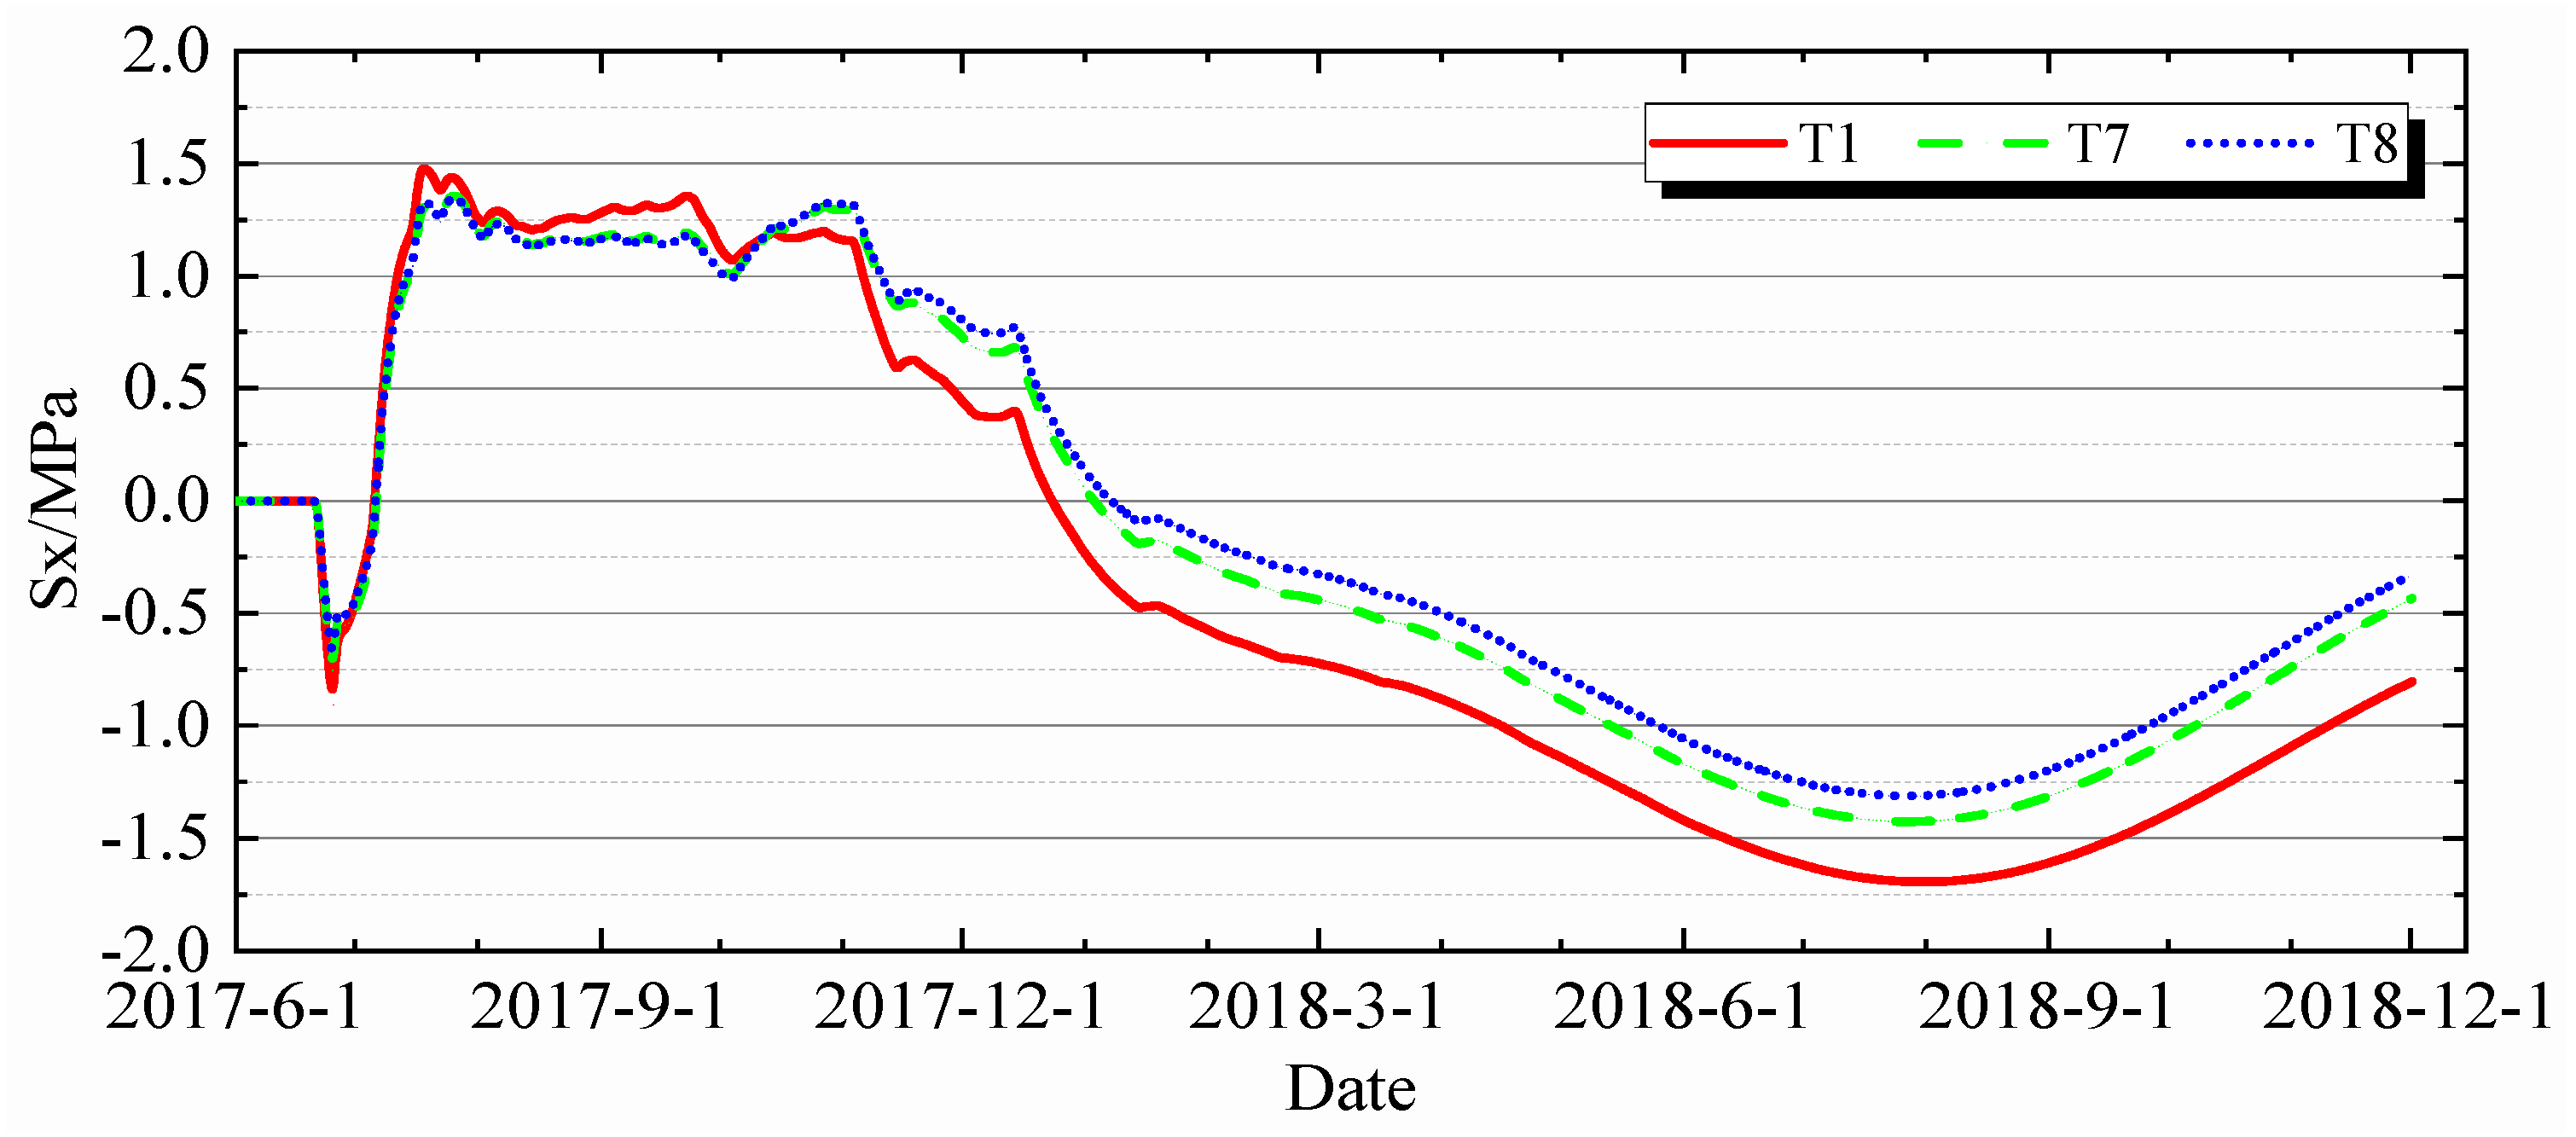
Under the condition of considering only temperature (Working Condition 2), the hoop stress history at different depths of the gallery vault is shown in Figure 27. The hoop temperature stress on the vault surface reaches its maximum of approximately 1.5 MPa at the end of the first-stage water cooling. Affected by the intermediate and late cooling stages, the surface hoop stress fluctuates significantly, and the hoop temperature stress on the vault decreases to −0.5 MPa due to the cooling and contraction of the upper and lower irrigation zones. After arch closure grouting, as the air temperature inside the gallery rises, the hoop stress continues to decrease to around −1.6 MPa. In late August 2018, as the temperature inside the gallery gradually decreases, the hoop stress rebounds, reaching −0.9 MPa by December 2018. The variation pattern of hoop stress at different depths of the vault is basically consistent. Under the action of temperature loads, along the axis direction of the gallery, on the vault surface, the hoop stress at both ends is consistent with that in the middle before the intermediate cooling stage (see Figure 28). After the intermediate cooling stage, especially after arch closure, the hoop stress at both ends gradually becomes greater than that in the middle. On 2 December 2018, the hoop stress at both ends was 0.5 MPa greater than that in the middle. Comparing the vault and the floor of the gallery (see Figure 29), under the action of temperature, the variation range of temperature stress on the floor is smaller than that on the vault. When pouring reaches an elevation of 870 m, the vertical axial stress caused by temperature on the floor surface is −0.4 MPa, while the hoop stress on the vault is approximately −0.9 MPa.

4.3.3. Impact of Air Temperature on the Gallery

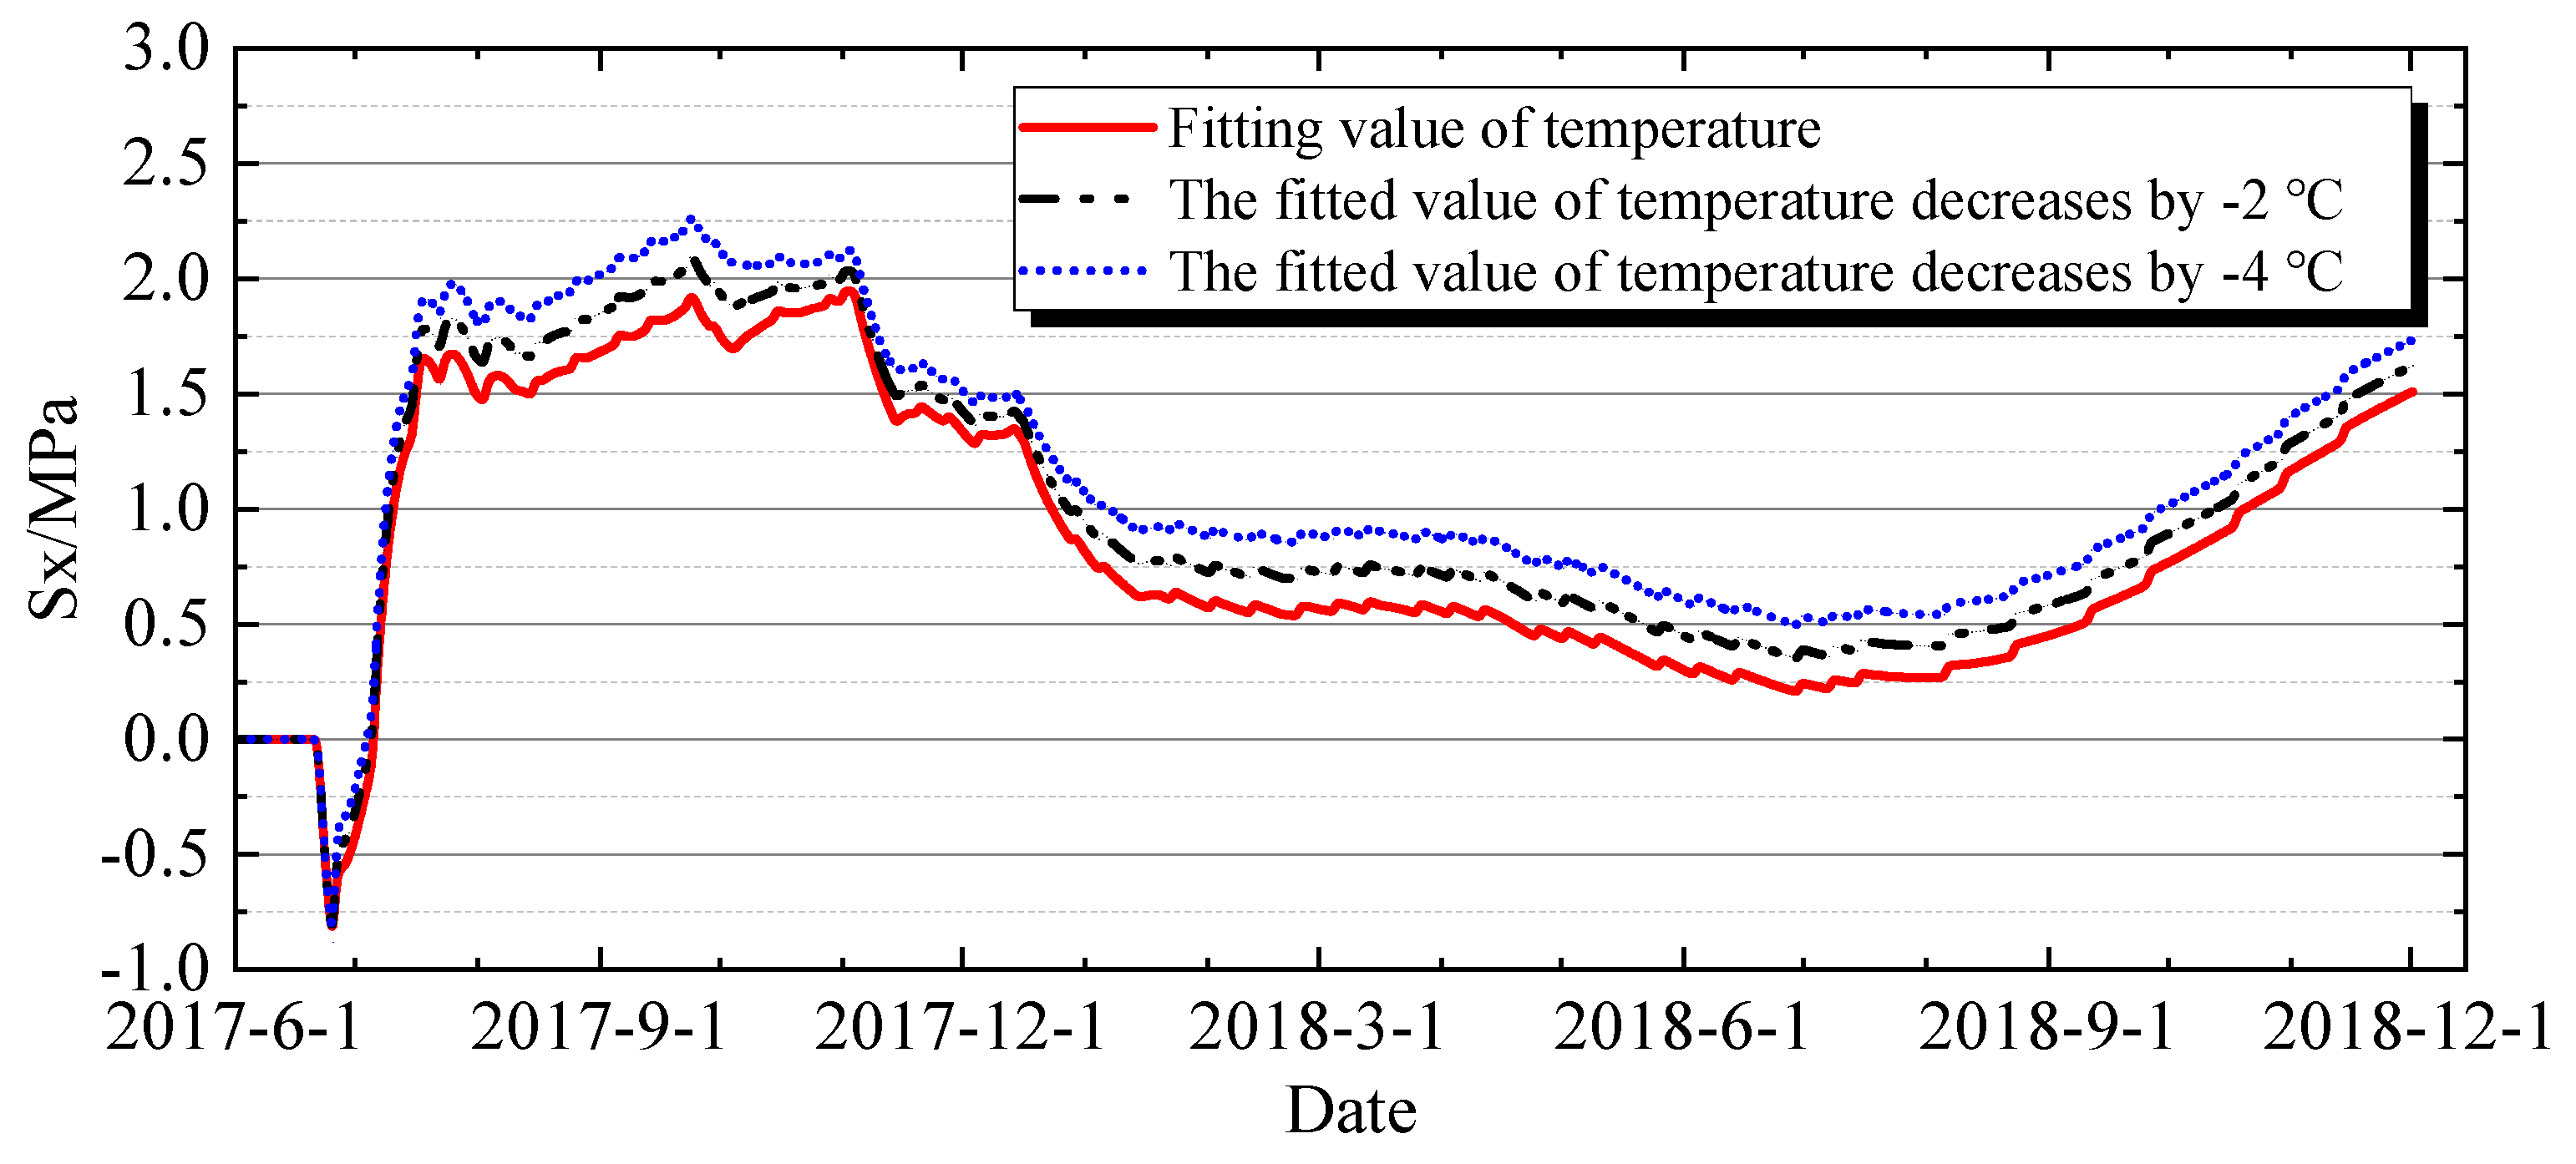
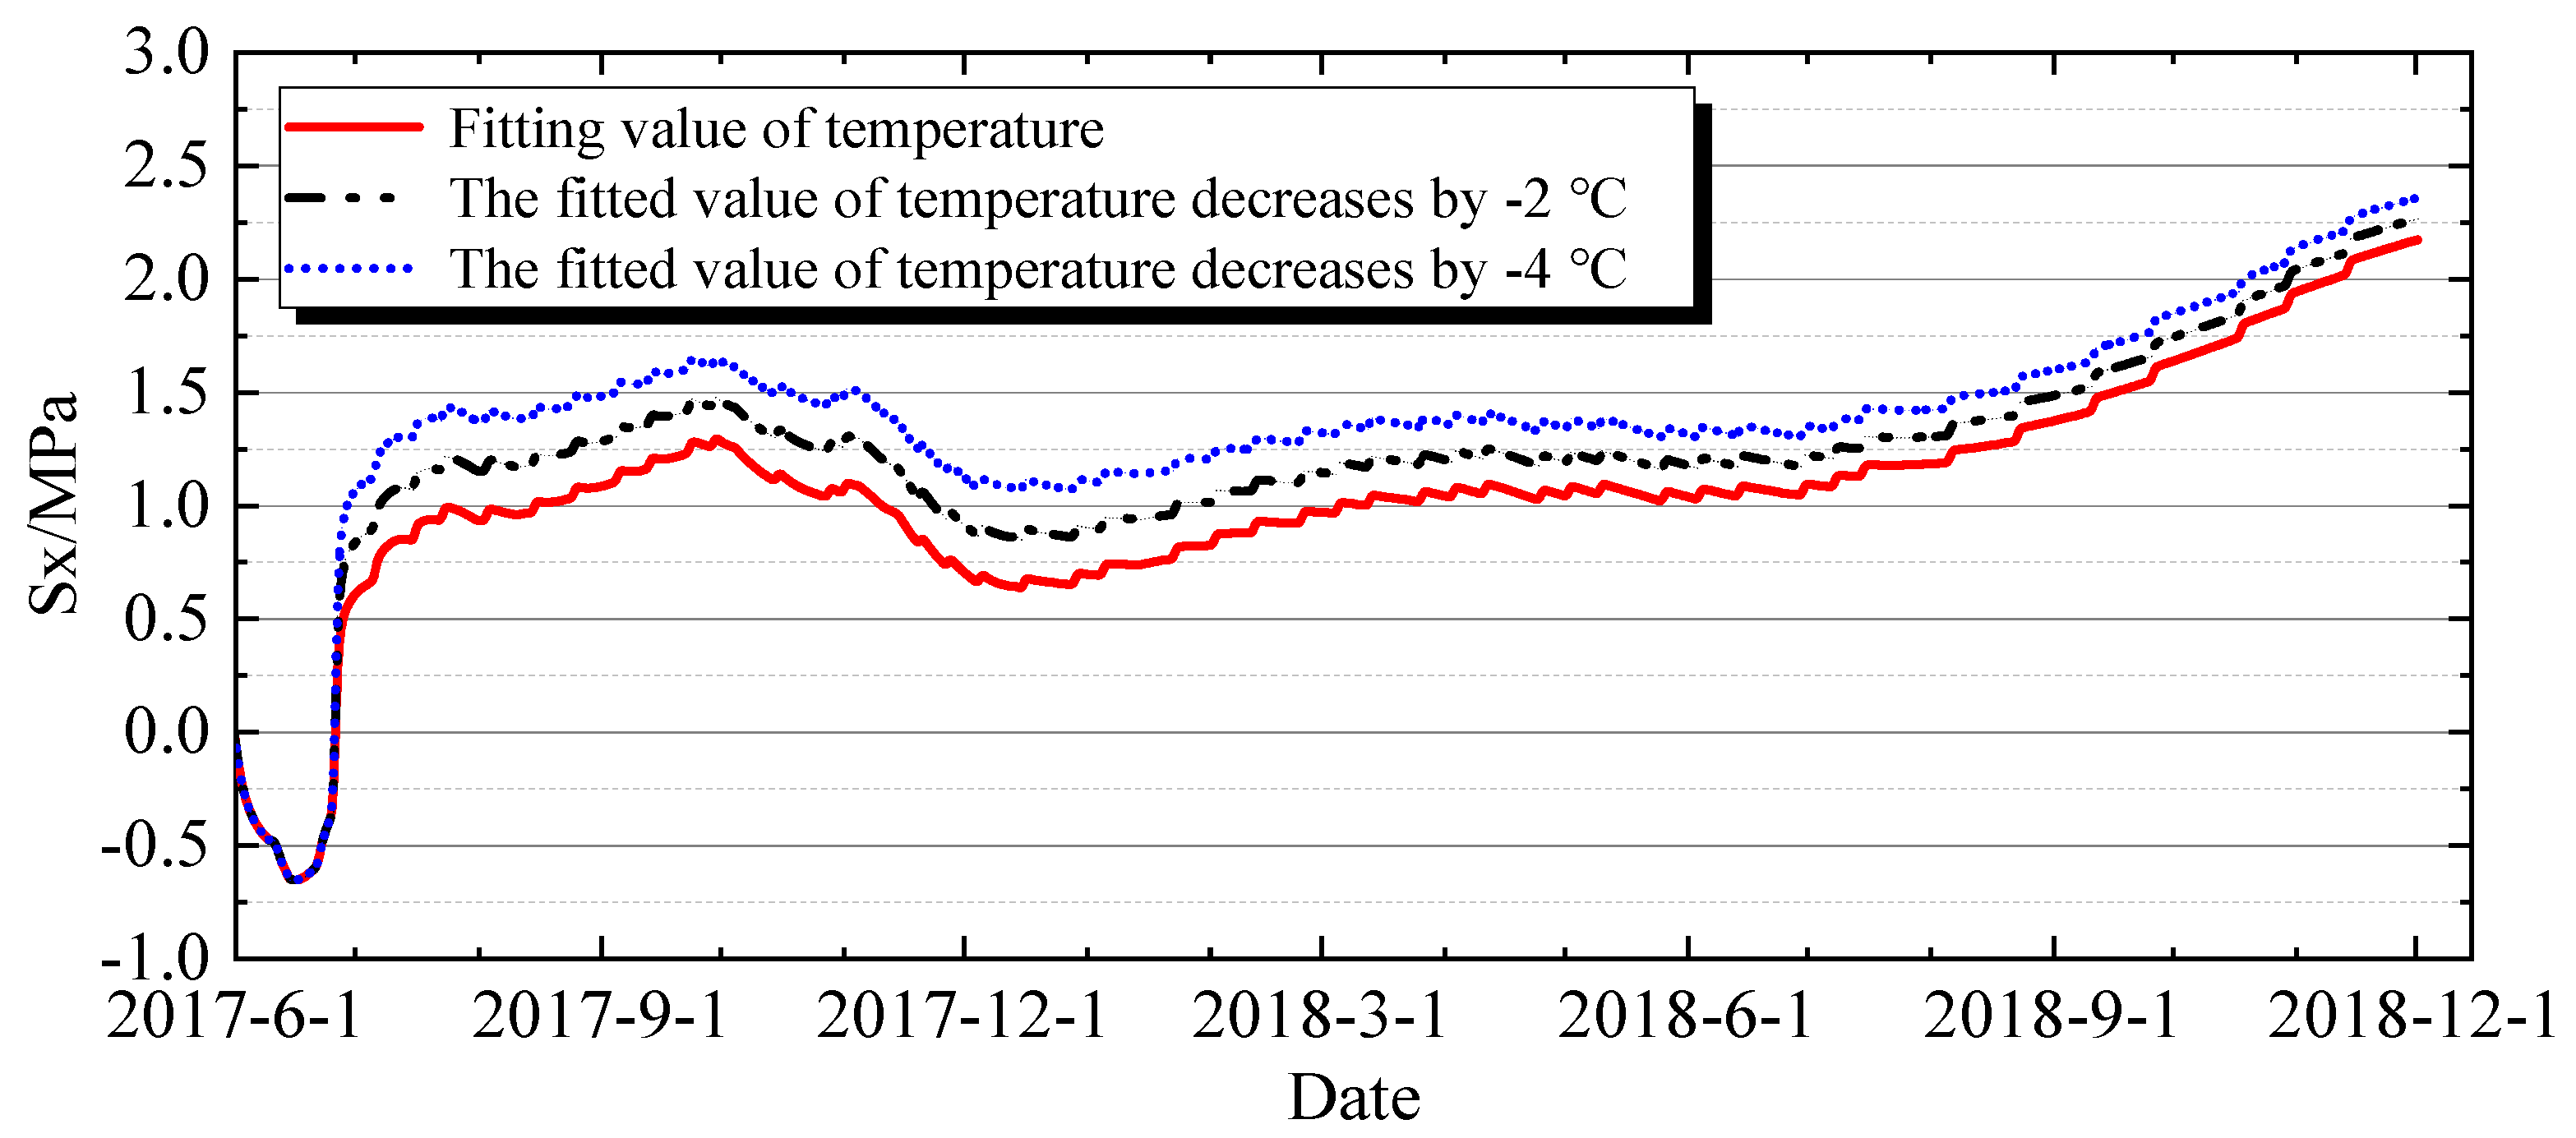
Under different temperature curve scenarios for the air temperature inside the gallery (Working Conditions 4 and 5), Figure 30 and Figure 31 depict the hoop stress history at different locations within the gallery. According to the calculations, the annual variation in air temperature inside the gallery has a significant impact on the surface stress. A 4 °C decrease in gallery air temperature results in an increase of approximately 0.25 MPa in the surface stress of both the gallery vault and the floor. In the case of short-term diurnal temperature variations within the gallery, considering that concrete is a poor conductor of heat, under the influence of short-term temperature fluctuations (such as diurnal temperature variations, sudden drops in air temperature, etc.), with a later-stage concrete elastic modulus of 35 GPa and a coefficient of thermal expansion of 7.1 × 10⁻⁶/°C, a temperature drop of 1 °C on the concrete surface generates approximately 0.24 MPa of tensile stress. Therefore, during the construction and operation periods, it is essential to avoid significant short-term temperature drops on the gallery surface as much as possible.

4.3.4. Impact of Wet-Screened and Fully Graded Aggregate Parameters on Thermal Stress

The super-high arch dam is constructed using C18035 Grade IV aggregate concrete with a maximum aggregate particle size of 120 mm. According to the Test Regulations for Hydraulic Concrete [29], in mechanical property tests of concrete, such as elastic modulus and strength tests, the wet-screening method is used to remove large aggregates exceeding 40 mm, and specimens of 150 mm size are molded for strength testing. Due to the differences in actual mix proportions between fully graded and wet-screened concretes, their mechanical properties also exhibit certain disparities, which should be taken into account in structural simulation analyses.
In recent years, extensive experimental studies on fully graded concrete have been conducted [17,30], and the existing strength relationships between four-graded and wet-screened concretes have been summarized. The experimental results indicate that as the maximum aggregate size increases, the concrete strength decreases. The strengths of four-graded concrete are all lower than those of wet-screened concrete, with the strength ratios of four-graded concrete to corresponding wet-screened concrete primarily varying within the range of 0.6 to 0.8. Considering the positive correlation between elastic modulus and strength, this analysis assumes that the elastic modulus ratios of four-graded concrete to wet-screened concrete also vary within the range of 0.6 to 0.8 (Working Conditions 6 and 7).
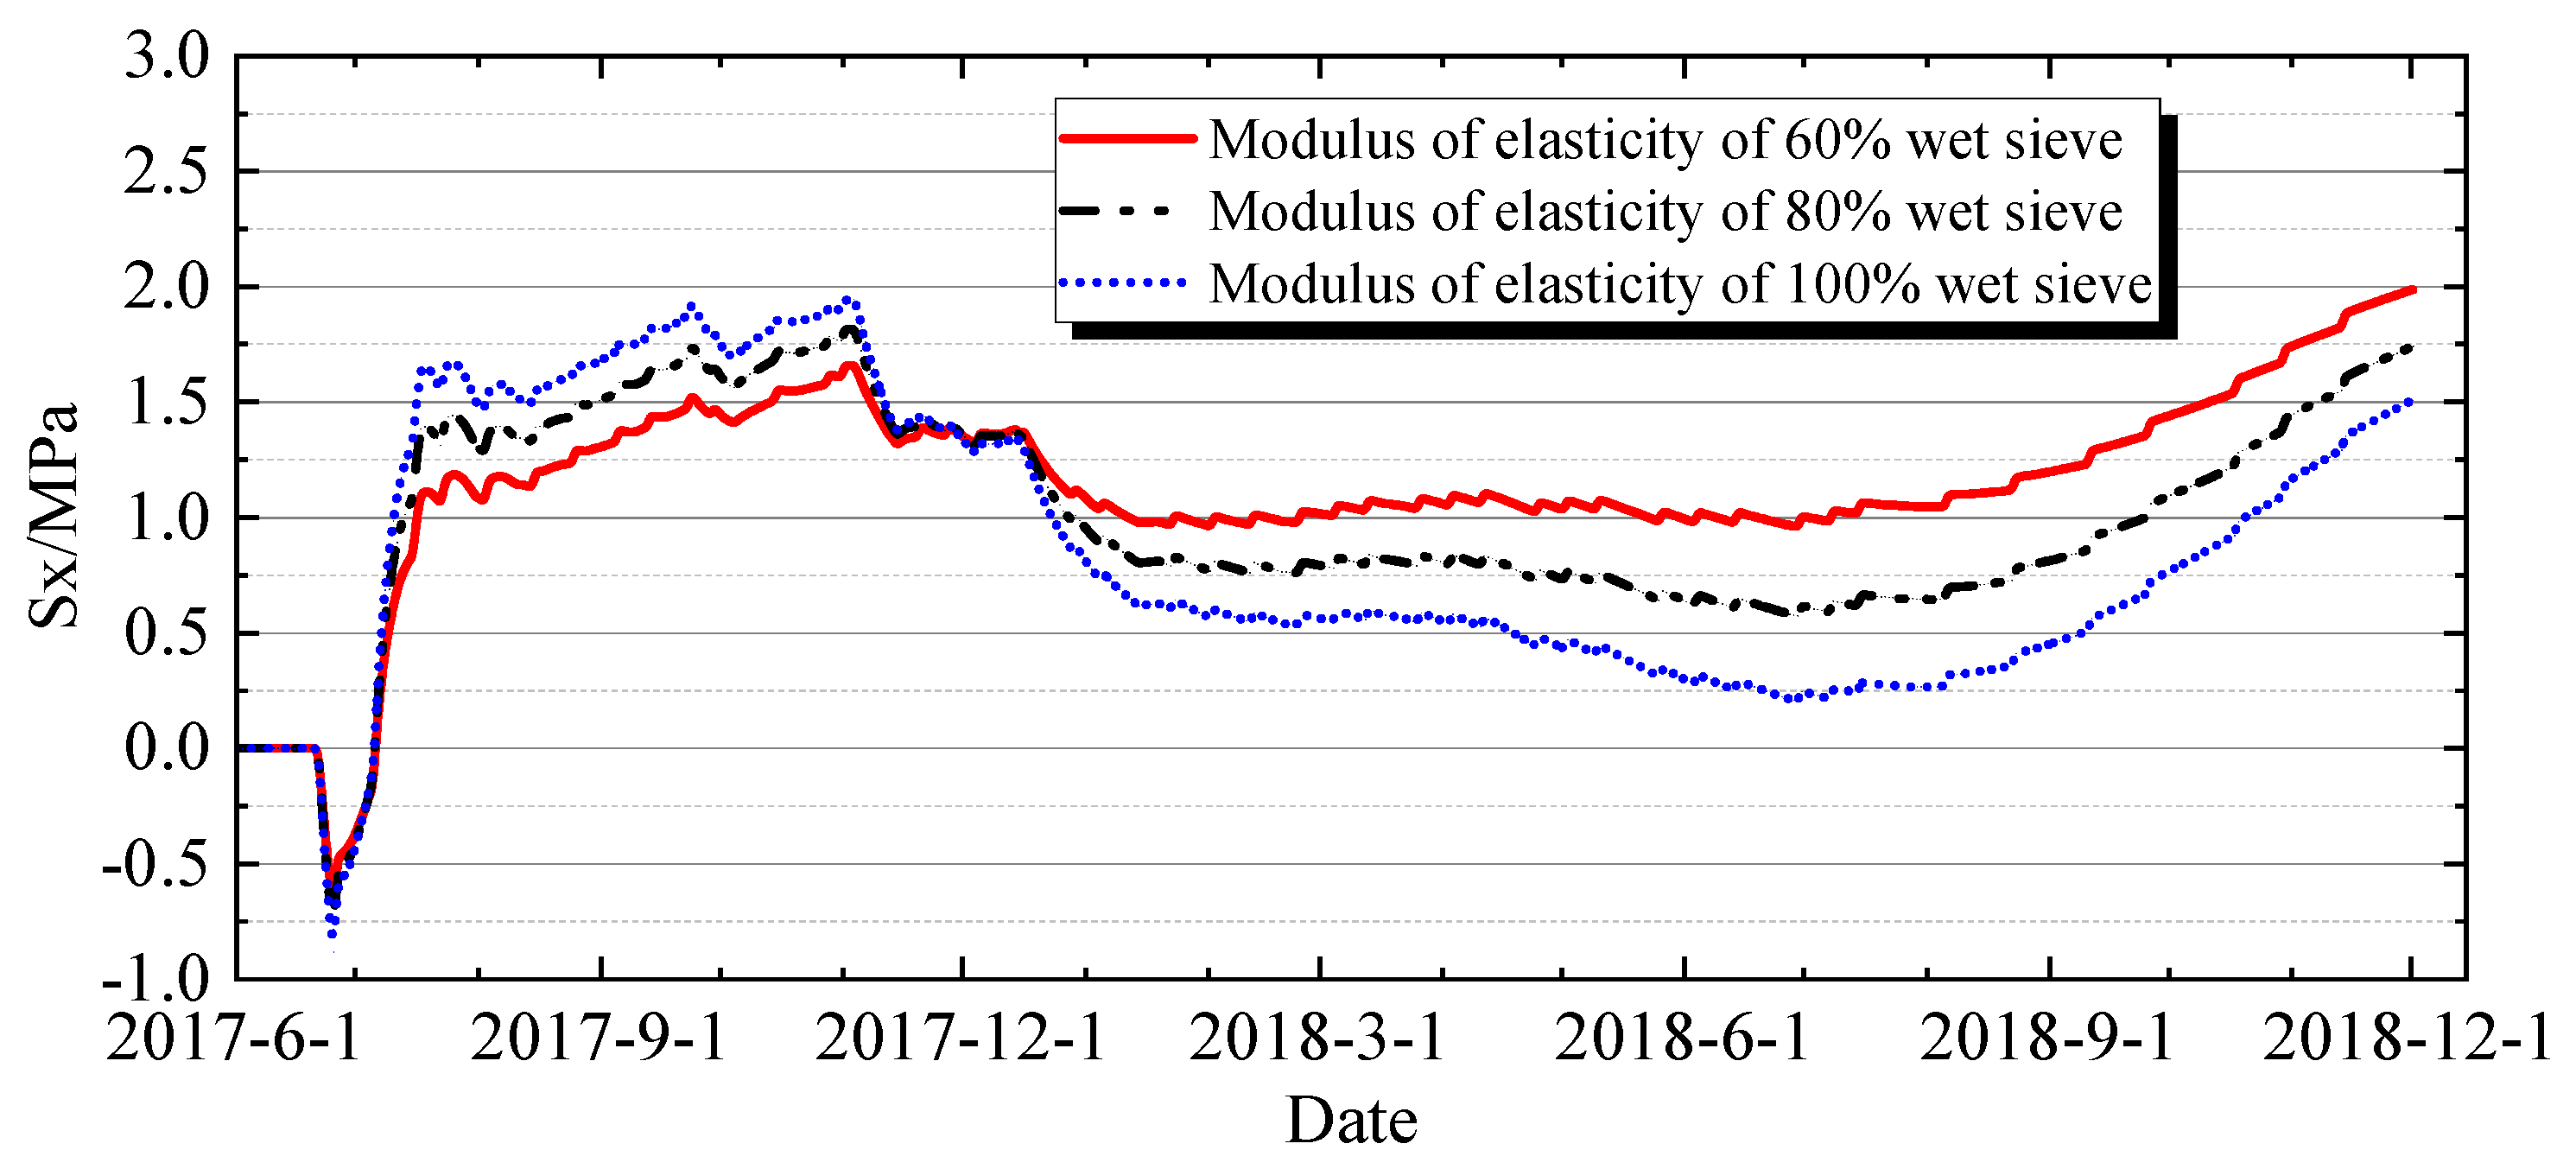
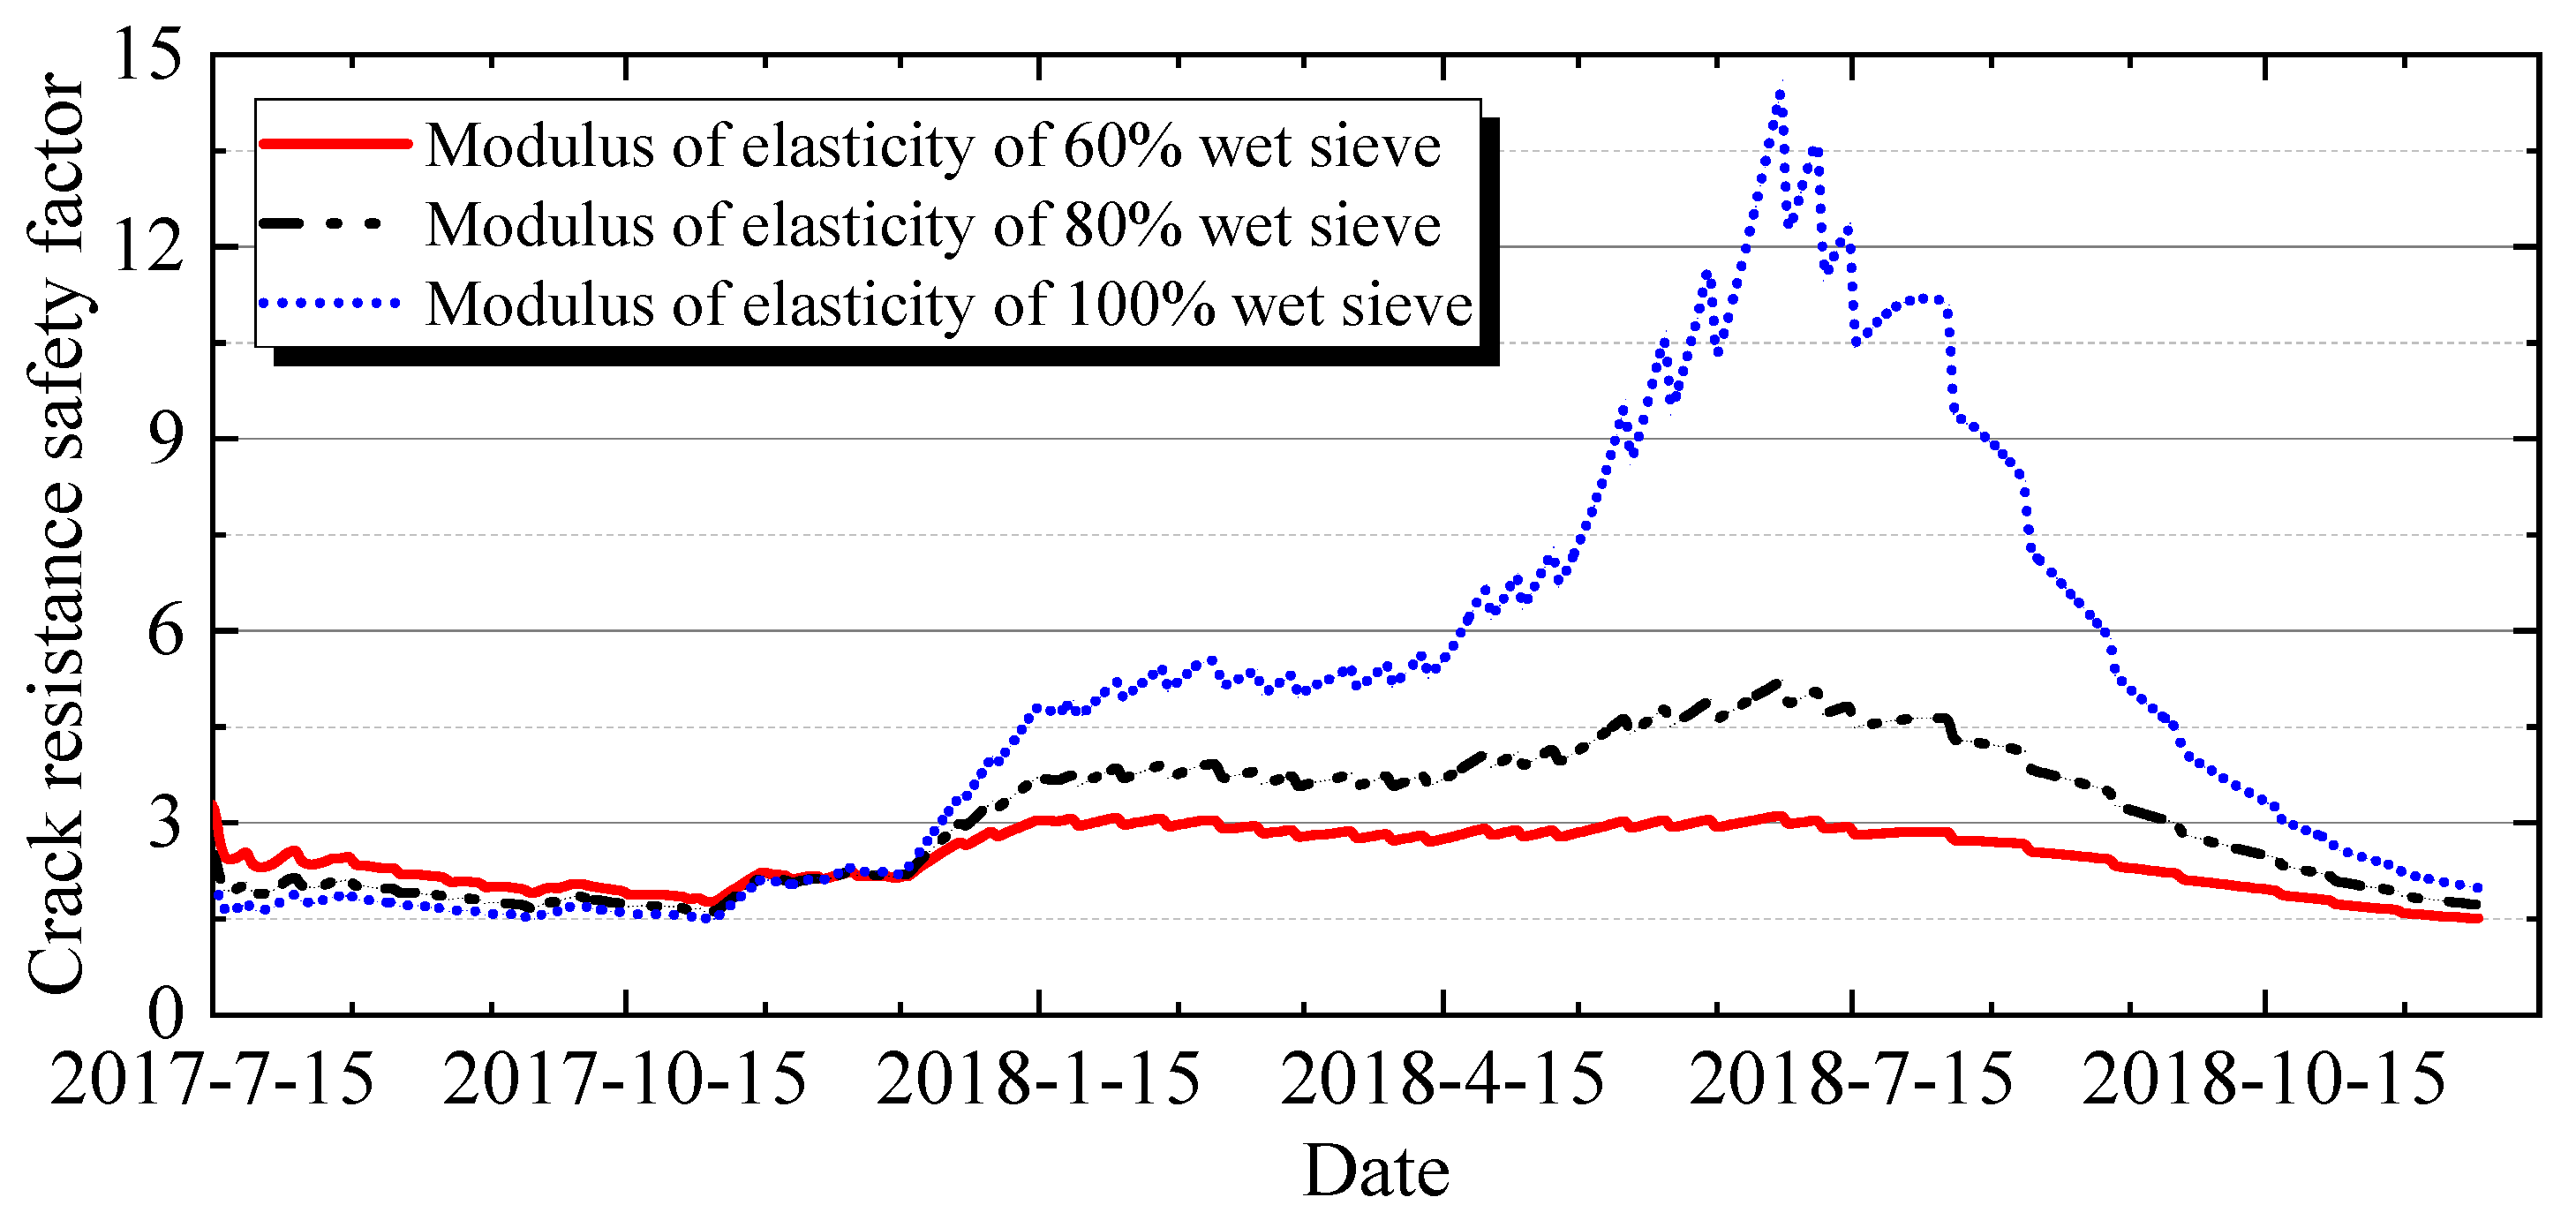
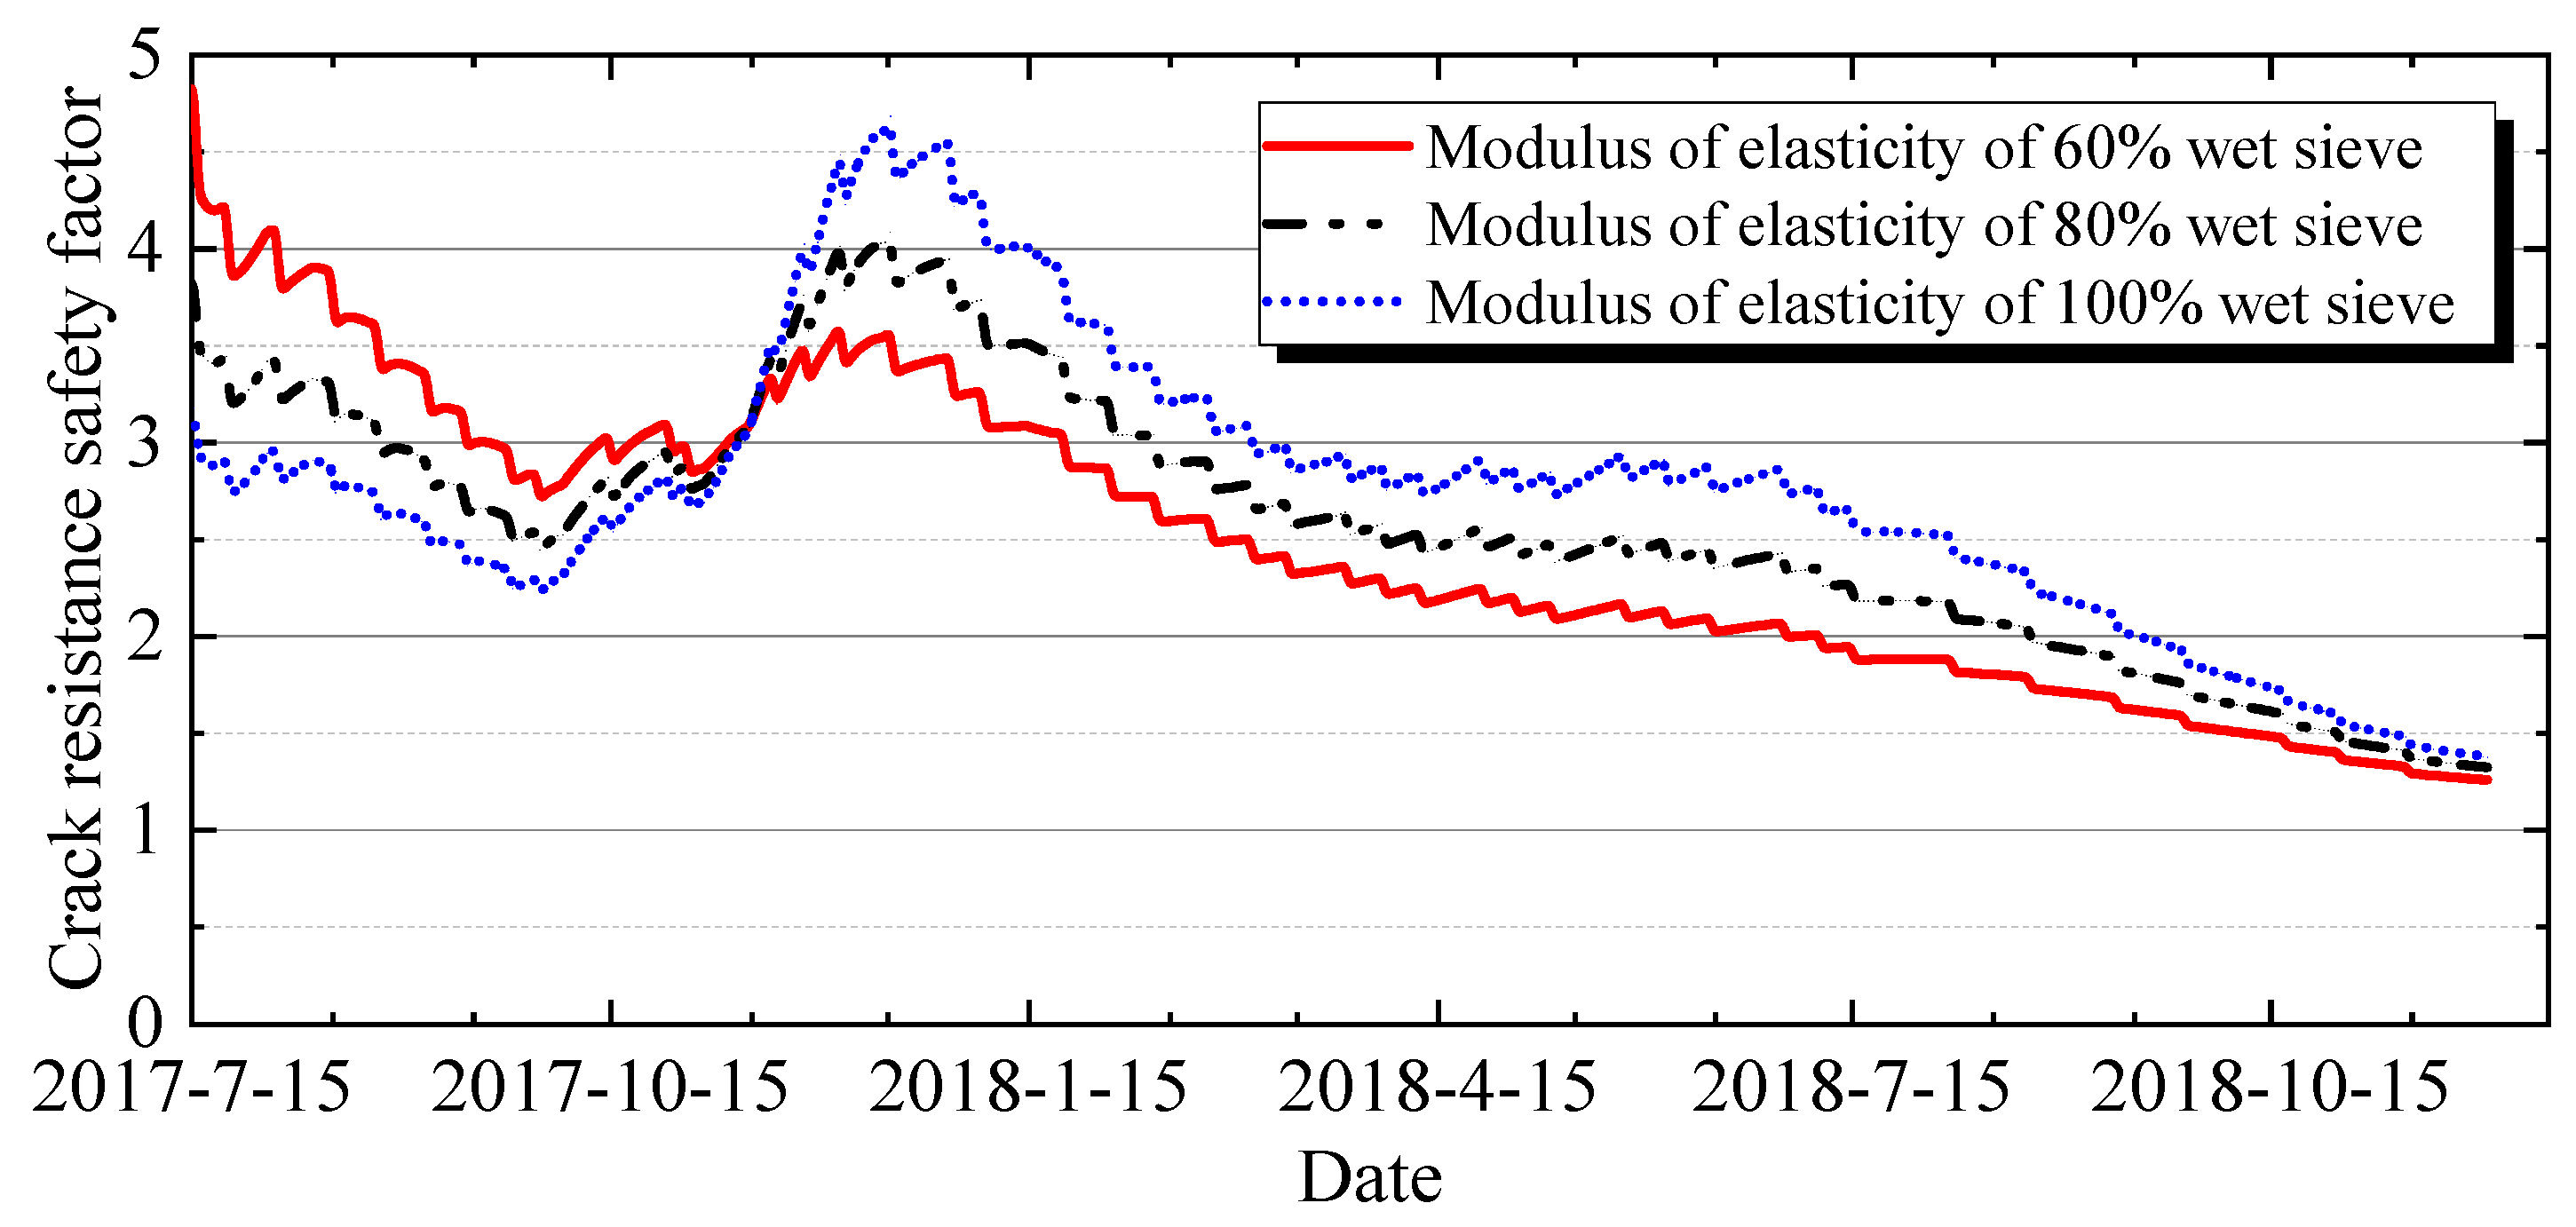
In the temperature and stress simulation calculations during the construction period, the impacts of the differences in mechanical properties between wet-screened and fully graded concretes are primarily reflected in two aspects: elastic modulus and strength. Figure 32 and Figure 33 depict the stress history on the vault and floor surfaces of the gallery under scenarios using 100%, 80%, and 60% of the wet-screened concrete’s elastic modulus, respectively. Before the mid-term cooling phase, the pouring elevation of the dam body is relatively low, and the influence of self-weight is minor. Consequently, the hoop stresses on the vault and floor surfaces of the gallery are mainly induced by temperature effects. Therefore, when considering the differences in material mechanical properties, a reduction in elastic modulus leads to a corresponding decrease in stress. After the arch closure grouting, as the pouring elevation of the dam body increases, the self-weight of the upper concrete becomes the primary factor inducing hoop tensile stresses on the vault and floor surfaces. Since the hoop stresses caused by self-weight are minimally affected by the concrete’s elastic modulus, the compressive stresses generated by the increase in air temperature inside the gallery after arch closure also decrease due to the reduced elastic modulus. Consequently, after considering both factors, the hoop stresses on the vault and floor of the gallery increase with the reduction in elastic modulus after grouting.
Furthermore, when considering the proportional reduction in both the elastic modulus and strength of fully graded concrete, Figure 34 and Figure 35 illustrate the changing history of the crack resistance safety factors on the vault and floor surfaces of the gallery. After the changes in the elastic modulus and strength of fully graded concrete, the crack resistance safety factors on the vault and floor of the gallery significantly decrease after arch closure, leading to an increased risk of cracking.

4.3.5. Impact of Cooling Water Pipes on the Top of the Gallery

Figure 36 and Figure 37 illustrate the hoop stress history at different positions of the vault under the assumption that no cooling water pipes are installed at the top of the gallery (Working Condition 8). Compared to the scenario where cooling water pipes are installed at the top of the gallery (Working Condition 6), in the absence of cooling water pipes at the top of the gallery, the hoop stress at the vault decreases by approximately 0.3 MPa (at T7 near the ends of the gallery) to 0.5 MPa (at T1 in the middle of the gallery) in the later stages. However, in the early stages, the hoop stress in the middle increases by 0.4 MPa, reaching 2.0 MPa, while the hoop stress at T7 near the end of the gallery adjacent to Dam Section 8# increases by approximately 0.7 MPa, reaching 2.1 MPa.
Therefore, if the cooling water pipes are absent at the top of Gallery 733, the risk of cracking at the top of the gallery significantly increases in the early stages, although the stresses are relatively lower in the later stages.

4.3.6. Impact of Pump Room and Collecting Well

The impact of the pump room and collecting well on the stresses within the gallery is analyzed from two aspects. Firstly, from a structural perspective, the influence of the presence of the pump room and collecting well on the gallery’s stresses is examined (Working Condition 9). Secondly, a simulation analysis is conducted to investigate the impact of temperature variations inside the pump room and collecting well on the gallery’s stresses (Working Condition 10).
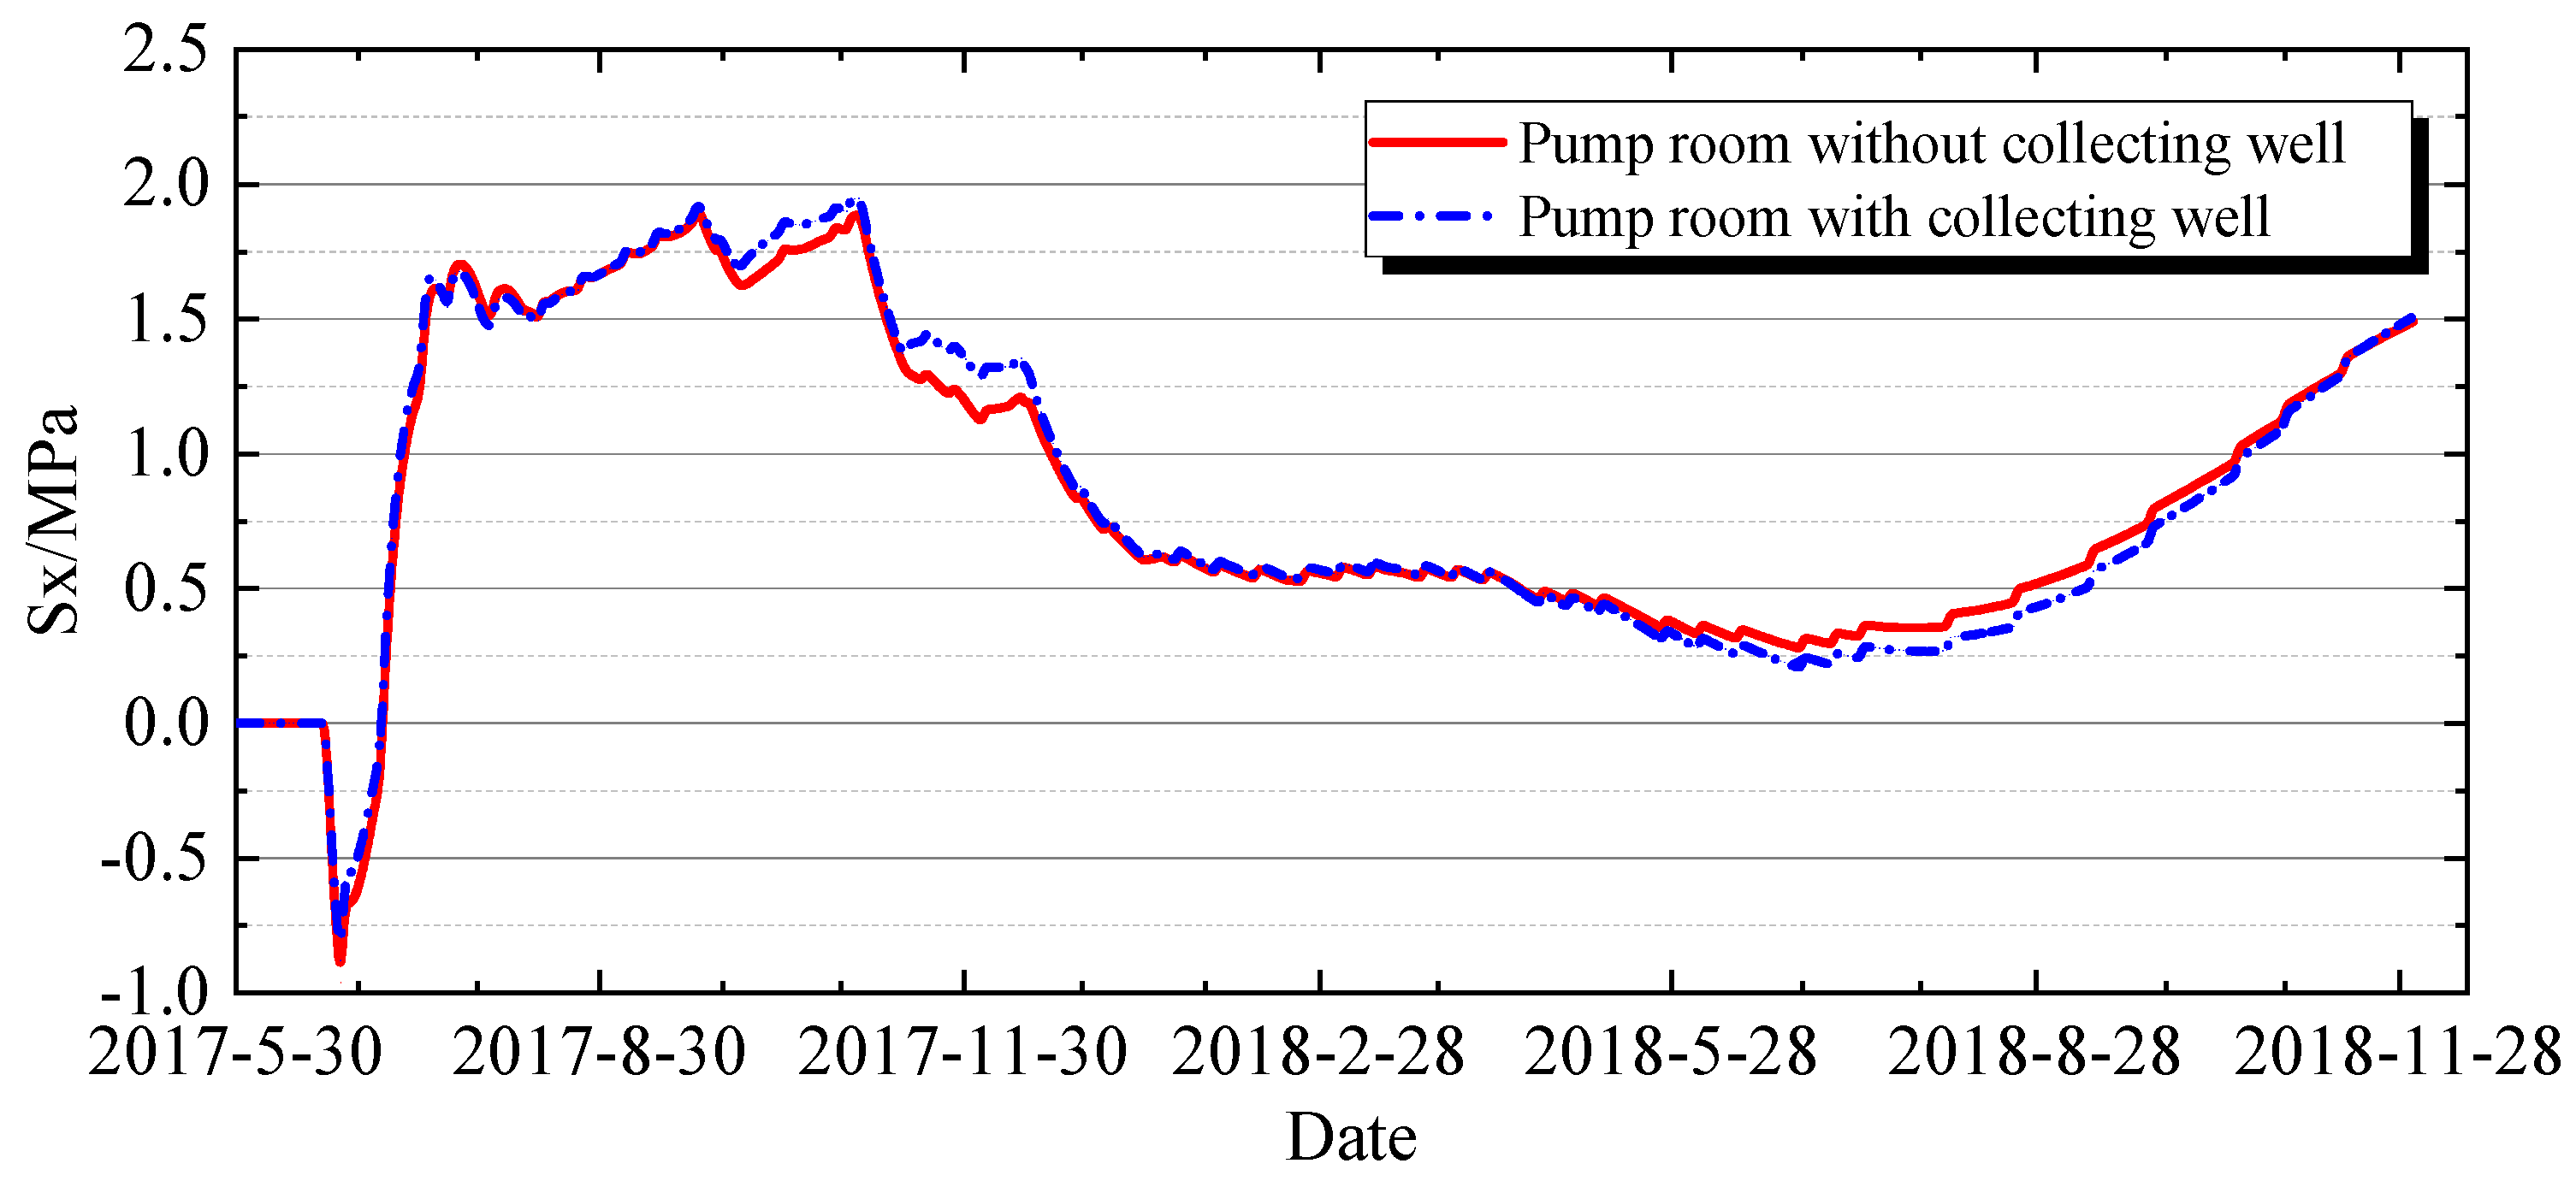
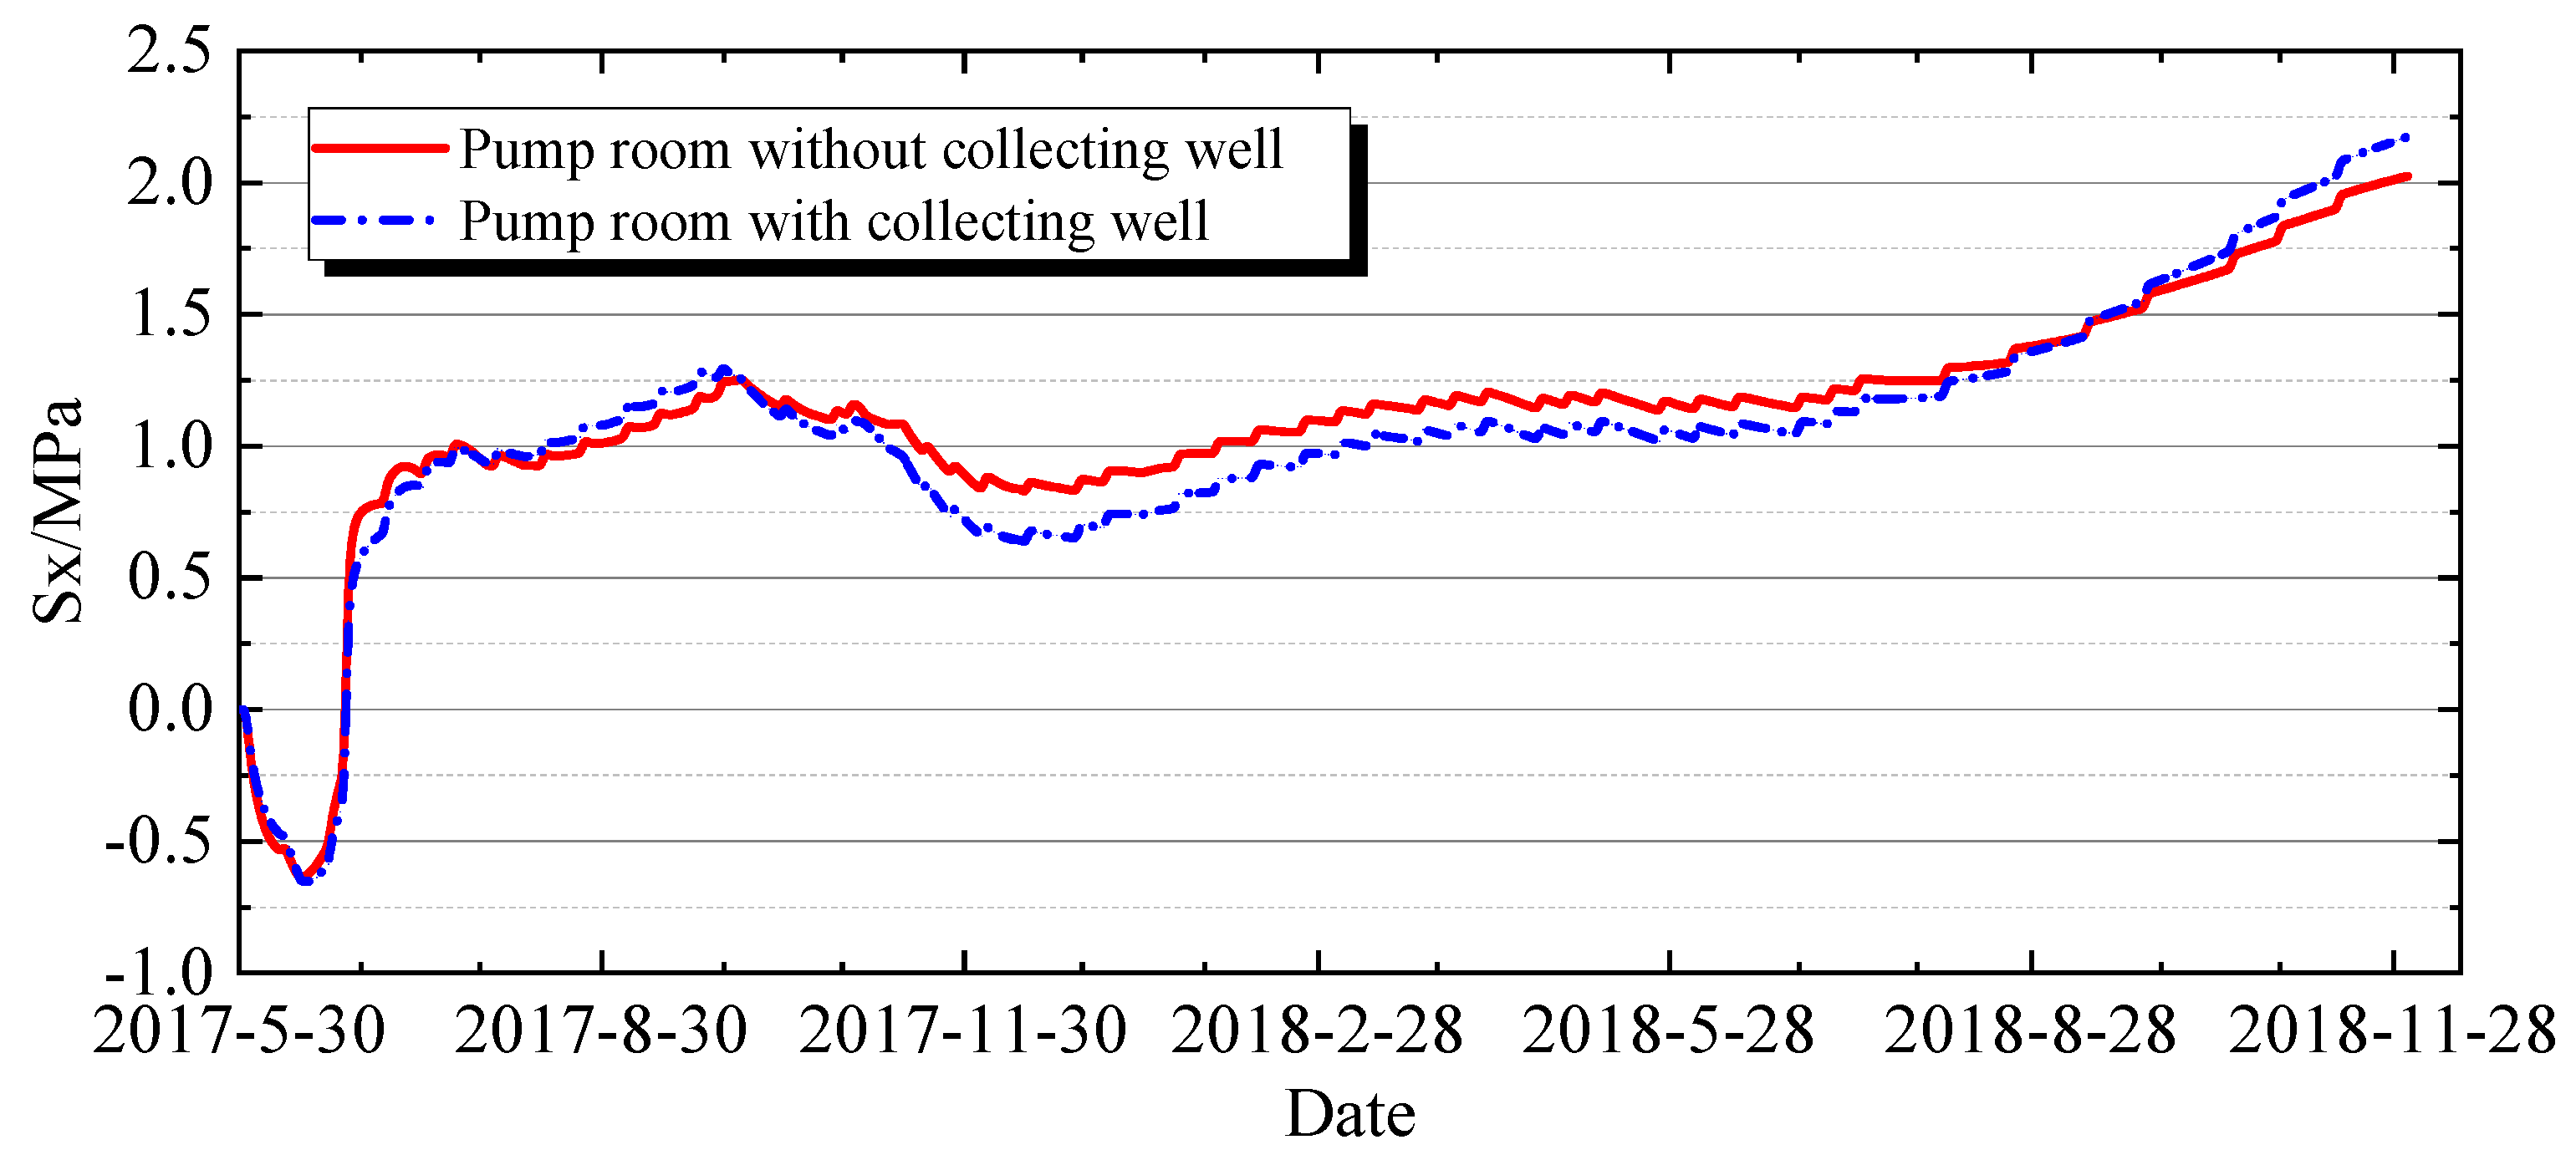
To facilitate the analysis of the influence of the collecting well and pump room on the stress characteristics of the gallery, the “cavities” of the collecting well and pump room are “filled” with solid elements in the finite element model shown in Figure 2. By comparing the hoop stresses on the vault and floor surfaces of the gallery (as depicted in Figure 38 and Figure 39), it can be observed that the stress history of the gallery vault remains largely consistent regardless of the presence or absence of the collecting well and pump room, with only minor differences of approximately 0.2 MPa in the floor surface stresses. The reason for this is that most of the “cavity” structures of the pump room and collecting well are located below the 733 m elevation gallery, and thus their presence or absence has a relatively small impact on the gallery’s stresses.
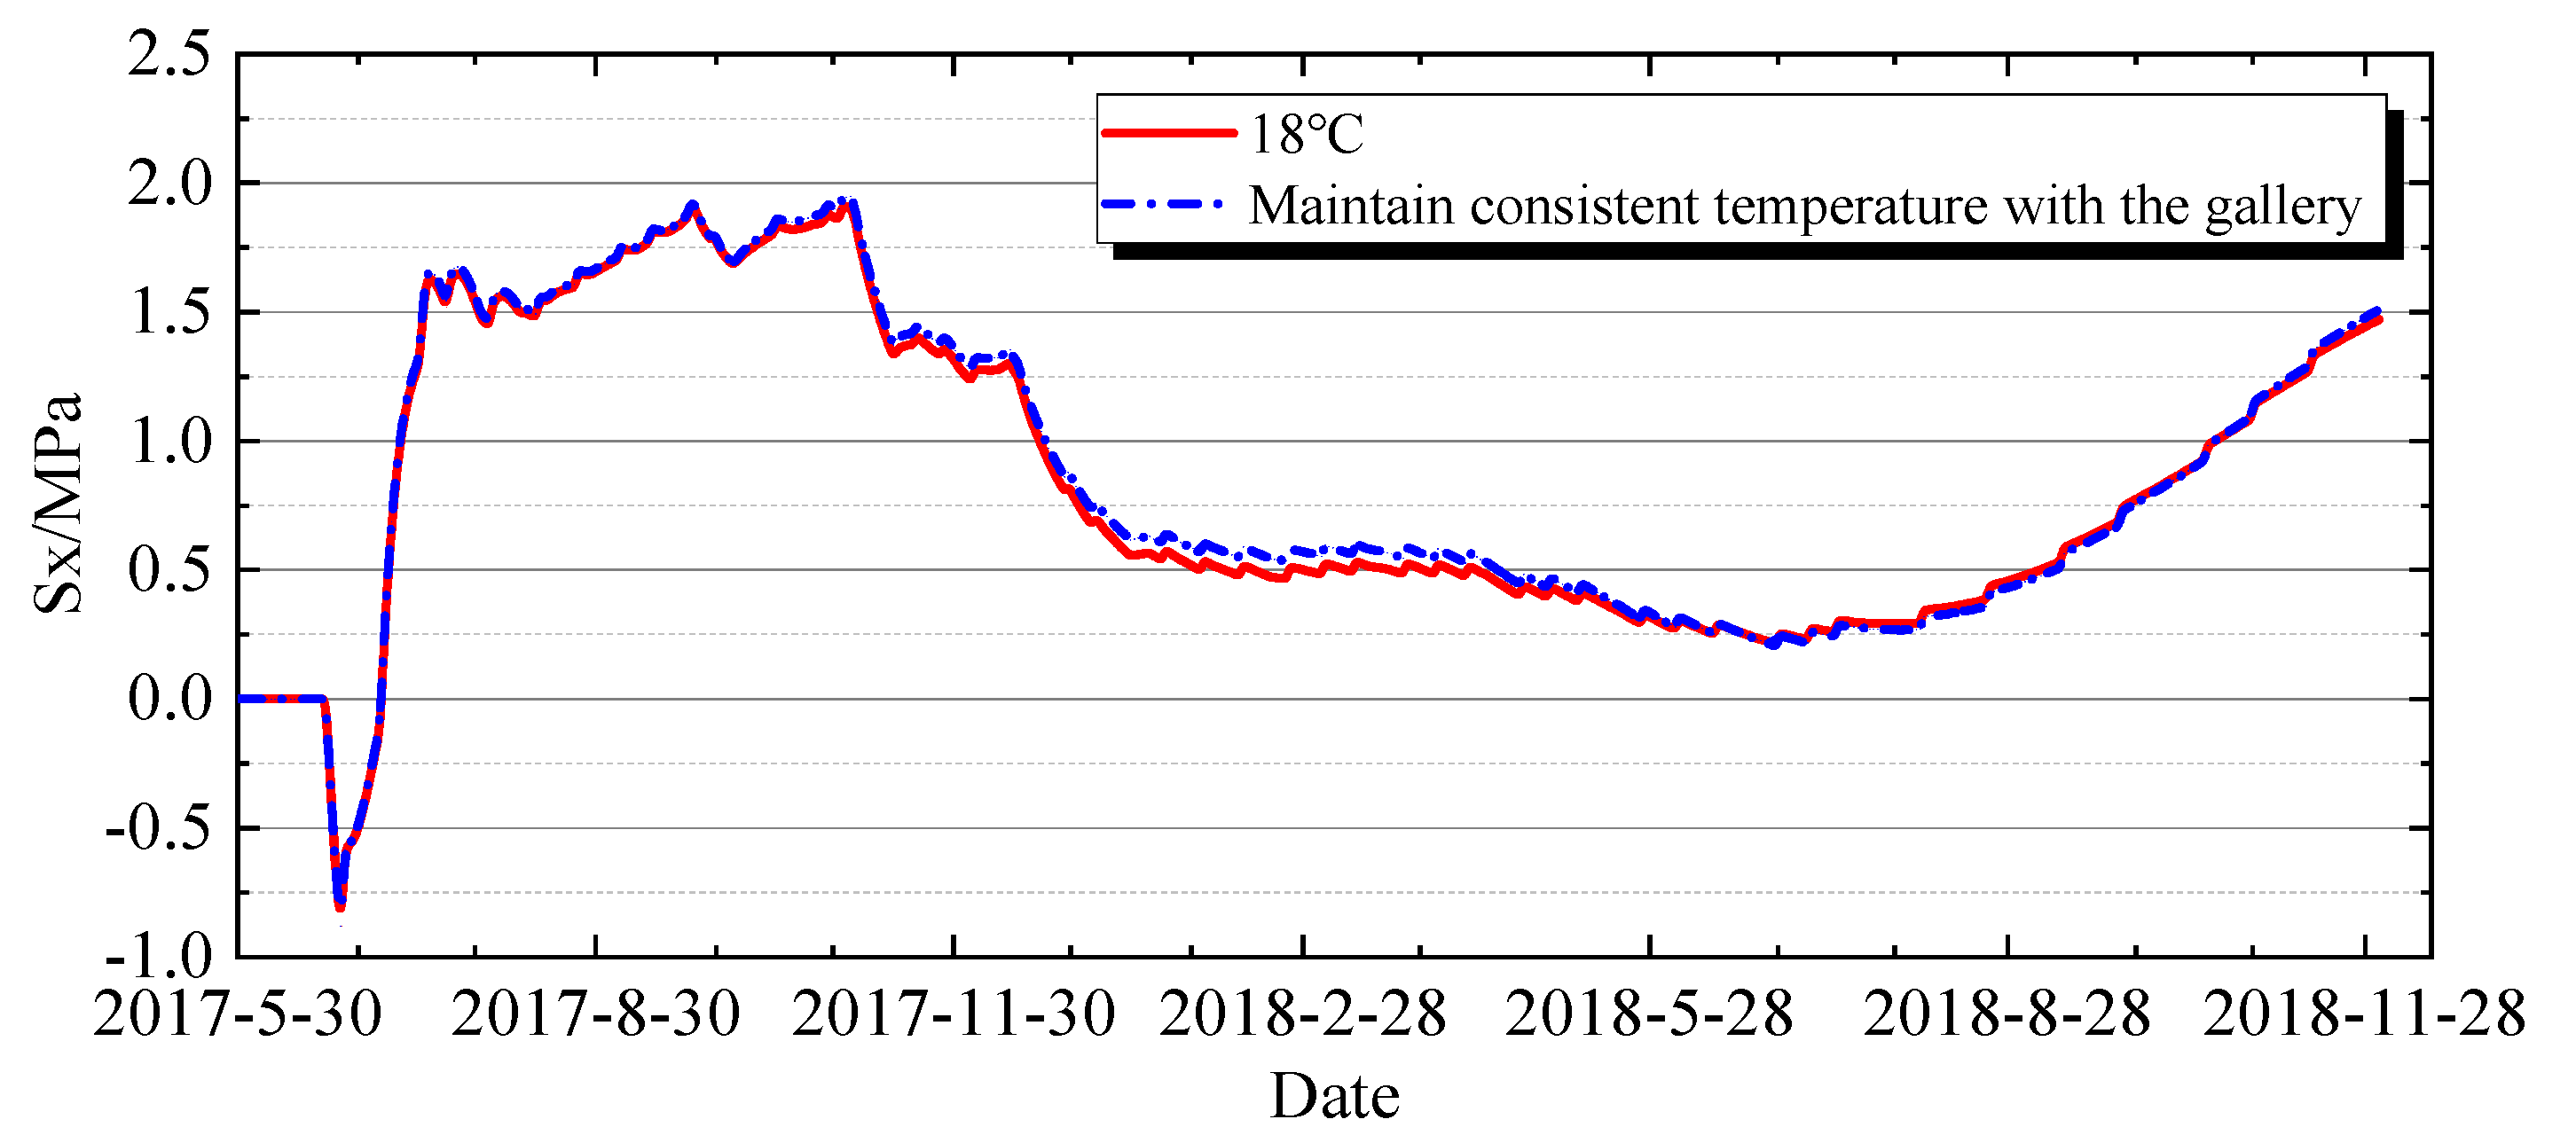
Regarding the influence of temperature within the collecting well and pump room, Figure 40 and Figure 41 depict the stress histories of the gallery vault and floor under different temperature settings inside the collecting well and pump room. Given the enclosed nature of the cavities in the collecting well and pump room, it is assumed that the temperature inside remains constant at 18 °C. By comparing the scenarios where the gallery’s air temperature is used versus the constant temperature, it is observed that the stresses remain largely consistent.
The aforementioned analysis indicates that the presence or absence of the collecting well and pump room, as well as temperature variations within them, have a limited impact on the stresses within the gallery.

5. Conclusions

A sensitivity analysis was conducted on the spatial and temporal distribution characteristics of stress and its influencing factors during the construction period of the gallery at an elevation of 733 m in dam Section 7# of a super-high arch dam. The main conclusions are as follows:
(1) The circumferential stress on the arch crown and bottom plate of the gallery is greater than the axial stress, and the large stress is concentrated on the surface of the arch crown and bottom plate. The stress rapidly decreases from the surface to the interior, and the depth of the cracking is limited. The stress in the middle of the arch before sealing is greater than that at both ends, and the stress at both ends after sealing exceeds that in the middle. The stress at both ends of the bottom plate surface is always greater than that in the middle. The maximum stress on the arch crown and bottom plate of the gallery is about 2.4 MPa, and the minimum crack resistance safety is about 1.02 and 1.2, respectively.
(2) The self-weight causes circumferential tensile stress on the surface of the gallery arch and bottom plate, and the circumferential stress increases with the elevation of the pouring. When poured to an elevation of 870 m, the circumferential stress caused by the self-weight on the arch crown of the gallery is 2.3 MPa. However, as the arch sealing elevation increases, the magnitude of stress increase decreases, and at a distance of 0.3 m from the surface of the arch crown, it decreases to 0.9 MPa.
(3) The average annual temperature in the gallery decreases by 4 °C, and the surface stress of the arch and bottom plate increases by about 0.25 MPa. The rise in the temperature of the concrete in the irrigation area where the gallery is located causes a decrease in the stress of the gallery, while, conversely, the stress rises. Early initial cooling causes significant tensile stress, and during the middle and later cooling periods, adjacent upper and lower irrigation areas shrink and “squeeze” due to cooling, resulting in a decrease in stress. The annual temperature change after arch sealing has a significant impact on the stress of the gallery, with temperature rise leading to a decrease in stress and temperature drop leading to an increase in stress.
(4) The stress of the arch crown and bottom plate of the gallery calculated using the mechanical parameters of fully graded concrete is smaller than that calculated by wet screening concrete before intermediate cooling and larger than that after intermediate cooling, resulting in a significant decrease in the crack resistance safety of the arch crown and bottom plate. Whether there are collection wells or pump rooms and the temperature changes inside the collection wells and pump rooms have limited impact on the stress of the gallery, with a difference of only about 0.2 MPa in the surface stress of the bottom plate.
(5) In the construction of the gallery, it is recommended to focus on strengthening the water cooling and “wintering period” insulation measures for the arch crown and bottom plate, and to use fully graded test parameters in simulation analysis to improve calculation accuracy and structural safety.

Author Contributions

Conceptualization, Z.X.; Methodology, Z.X. and M.Y.; Programming, Z.X. and M.Y.; Formal analysis, Z.X., M.Y. and J.P.; Investigation, Z.X., M.Y., H.X., J.P. and Q.C.; Writing—original draft, Z.X., M.Y. and H.X.; Writing—review & editing, M.Y. and H.X.; Funding acquisition, Z.X. and M.Y.; Data curation, M.Y., H.X., J.P. and Q.C.; Resources, Z.X. and M.Y.; Supervision, Z.X. and M.Y. All authors have read and agreed to the published version of the manuscript.

Funding

This work was financially supported by the National Natural Science Foundation of China (U2340229), the Natural Science Foundation of Hubei Province (JCZRQN202501191, CKSD2025453/CL), the Fundamental Research Funds for Central Public Welfare Research Institutes (CKSF2019394/GC, CKSF20241000/CL, CKSF20241023/CL).

Data Availability Statement

Data are contained within the article.

Acknowledgments

The authors acknowledge the financial support from the National Natural Science Foundation of China, Natural Science Foundation of Hubei Province, Central Public Welfare Research Institutes of China.

Conflicts of Interest

The authors declare no conflicts of interest.

References

  1. John, R.; Balakrishnan, S.D. Investigations on seismic response of Idukki Arch Dam considering concrete ageing. Innov. Infrastruct. Solut. 2025, 10, 404. [Google Scholar] [CrossRef]
  2. Pan, X.; Wang, G.; Lu, W.; Qi, Z.; Chen, M.; Yan, P. Fragility analysis of high arch dam against far-field underwater blast. Eng. Struct. 2024, 316, 118568. [Google Scholar] [CrossRef]
  3. Zhang, M.; Wang, X.; Liu, Y.; Wang, J.; Yi, K.; Yan, J.; Chen, H. Effect of attached outlets on the dynamic response of arch dams. Eng. Struct. 2024, 302, 117392. [Google Scholar] [CrossRef]
  4. Liu, J.; Wang, F.; Wang, X.; Hu, Z.; Liang, C. Temperature monitoring and cracking risk analysis of corridor top arch of Baihetan arch dam during construction period. Eng. Fail. Anal. 2025, 16, 108903. [Google Scholar] [CrossRef]
  5. Lin, P.; Shi, J.; Wei, P.; Fan, Q.; Wang, Z. Shallow unloading deformation analysis on Baihetan super-high arch dam foundation. Bull. Eng. Geol. Environ. 2019, 78, 5551–5568. [Google Scholar] [CrossRef]
  6. Lin, P.; Guan, J.; Peng, H.; Shi, J. Horizontal cracking and crack repair analysis of a super high arch dam based on fracture toughness. Eng. Fail. Anal. 2019, 97, 72–90. [Google Scholar] [CrossRef]
  7. Zhuang, D.; Ma, K.; Tang, C.; Cui, X.; Yang, G. Study on crack formation and propagation in the galleries of the Dagangshan high arch dam in Southwest China based on microseismic monitoring and numerical simulation. Int. J. Rock Mech. Min. Sci. 2019, 115, 157–172. [Google Scholar] [CrossRef]
  8. Lin, P.; Liu, H.; Li, Q.; Hu, H. Effects of Outlets on Cracking Risk and Integral Stability of Super-High Arch Dams. Sci. World J. 2014, 2014, 312827. [Google Scholar] [CrossRef] [PubMed]
  9. Luo, D.; Lin, P.; Li, Q.; Zheng, D.; Liu, H. Effect of the impounding process on the overall stability of a high arch dam: A case study of the Xiluodu dam, China. Arab. J. Geosci. 2015, 8, 9023–9041. [Google Scholar] [CrossRef]
  10. Yang, G.; Zhao, A.; Sun, J.; Niu, J.; Zhang, J.; Wang, L. Progressive failure process-considered deformation safety diagnosis method for in-service high arch dam. Eng. Fail. Anal. 2024, 163, 108570. [Google Scholar] [CrossRef]
  11. Yan, C.; Tu, J.; Liang, H.; Guo, S.; Li, D. Seismic failure analysis of a high arch dam-foundation multiple nonlinear coupling system. Soil Dyn. Earthq. Eng. 2024, 187, 109001. [Google Scholar] [CrossRef]
  12. Xin, J.; Tang, Q.; Zhou, J.; Zhou, Y.; Luo, C.; Jiang, Y. A novel method for calculating the ultimate bearing capacity of in-service RC arch bridges using sectional constitutive relation. Appl. Math. Model. 2025, 138, 115829. [Google Scholar] [CrossRef]
  13. Chen, Y.; Zhang, L.; Yang, B.Q.; Dong, J.; Chen, J. Geomechanical model test on dam stability and application to Jinping High arch dam. Int. J. Rock Mech. Min. Sci. 2015, 76, 1–9. [Google Scholar] [CrossRef]
  14. Ma, K.; Zhuang, D.; Tang, C.; Jin, F.; Tang, S. Study on formation causes of gallery cracks in Dagangshan high arch dam based on microseismic monitoring. Chin. J. Rock Mech. Eng. 2018, 37, 1608–1617. [Google Scholar]
  15. Wieland, M.; Kirchen, G.F. Long-term dam safety monitoring of Punt dal Gall arch dam in Switzerland. Front. Struct. Civ. Eng. 2012, 6, 76–83. [Google Scholar] [CrossRef]
  16. Dubey, C.S.; Venkatachalam, K.; Ratnam, M.; Shekhar, P. Causes of seepage water in drainage and grouting galleries of the Pandoh Dam, Central Himalaya. Bull. Eng. Geol. Environ. 2004, 63, 19–23. [Google Scholar] [CrossRef]
  17. Zhu, B.F. Thermal Stresses and Temperature Control of Mass Concrete; Water and Power Press: Beijing, China, 2012. [Google Scholar]
  18. Wang, W.; Ding, J.; Wang, G.; Zou, L.; Chen, S. Stability analysis of the temperature cracks in Xiaowan arch dam. Sci. China (Technol. Sci.) 2011, 54, 547–555. [Google Scholar] [CrossRef]
  19. Sheibany, F.; Ghaemian, M. Effects of Environmental Action on Thermal Stress Analysis of Karaj Concrete Arch Dam. J. Eng. Mech. 2006, 132, 532–544. [Google Scholar] [CrossRef]
  20. Pan, J.; Feng, Y.; Xu, Y.; Jin, F.; Zhang, C.; Zhang, B. Chemo-damage modeling and cracking analysis of AAR-affected concrete dams. Sci. China (Technol. Sci.) 2013, 56, 1449–1457. [Google Scholar] [CrossRef]
  21. Wei, P.; Lin, P.; Peng, H.; Yang, Z.; Qiao, Y. Analysis of cracking mechanism of concrete galleries in a super high arch dam. Eng. Struct. 2021, 248, 113227. [Google Scholar] [CrossRef]
  22. Satoru, I.; Mitsuo, N. Temperature Distribution Analysis of Concrete in Fill Dam Gallery. Bull. Univ. Osaka Prefect. Ser B Agric. Biol. 1986, 38, 35–43. [Google Scholar]
  23. Malla, S.; Wieland, M. Analysis of an arch-gravity dam with a horizontal crack. Comput. Struct. 1999, 72, 267–278. [Google Scholar] [CrossRef]
  24. Lin, P.; Ning, Z.; Shi, J.; Liu, C.; Chen, W.; Tan, Y. Study on the gallery structure cracking mechanisms and cracking control in dam construction site. Eng. Fail. Anal. 2021, 121, 105135. [Google Scholar] [CrossRef]
  25. Cavuslu, M. Evaluating the Relationship between Reservoir Level Changes and Earthquake Damage Responses of High Arch Dams: A 3D Numerical Study of Ermenek Arch Dam (220 m) in Turkey. Adv. Civ. Eng. 2023, 2023, 8944853. [Google Scholar] [CrossRef]
  26. Lin, S.; Xie, Z. A Jacobi_PCG solver for sparse linear systems on multi-GPU cluster. J. Supercomput. 2017, 73, 433–454. [Google Scholar] [CrossRef]
  27. Lin, S.; Xie, Z. A new recursive formula for integration of polynomial over simplex. Appl. Math. Comput. 2020, 376, 125140. [Google Scholar] [CrossRef]
  28. Yuan, M.; Zhu, X.; Han, L.; Qi, Y.; Xie, Z.; Qin, X.; Dong, Y. Research on the Full Life Cycle Deformation, Stress Response, and Dynamic Fatigue Performance of Concrete Structures in Pump Stations. Buildings 2024, 14, 4052. [Google Scholar] [CrossRef]
  29. SL/T 352-2020; Test Code for Hydraulic Concrete. China Water and Power Press: Beijing, China, 2020.
  30. Xie, Z. Study and Application of Several Key Algorithms for Hydraulic Concrete Temperature Control Simulation; Hohai University: Nanjing, China, 2012. [Google Scholar]
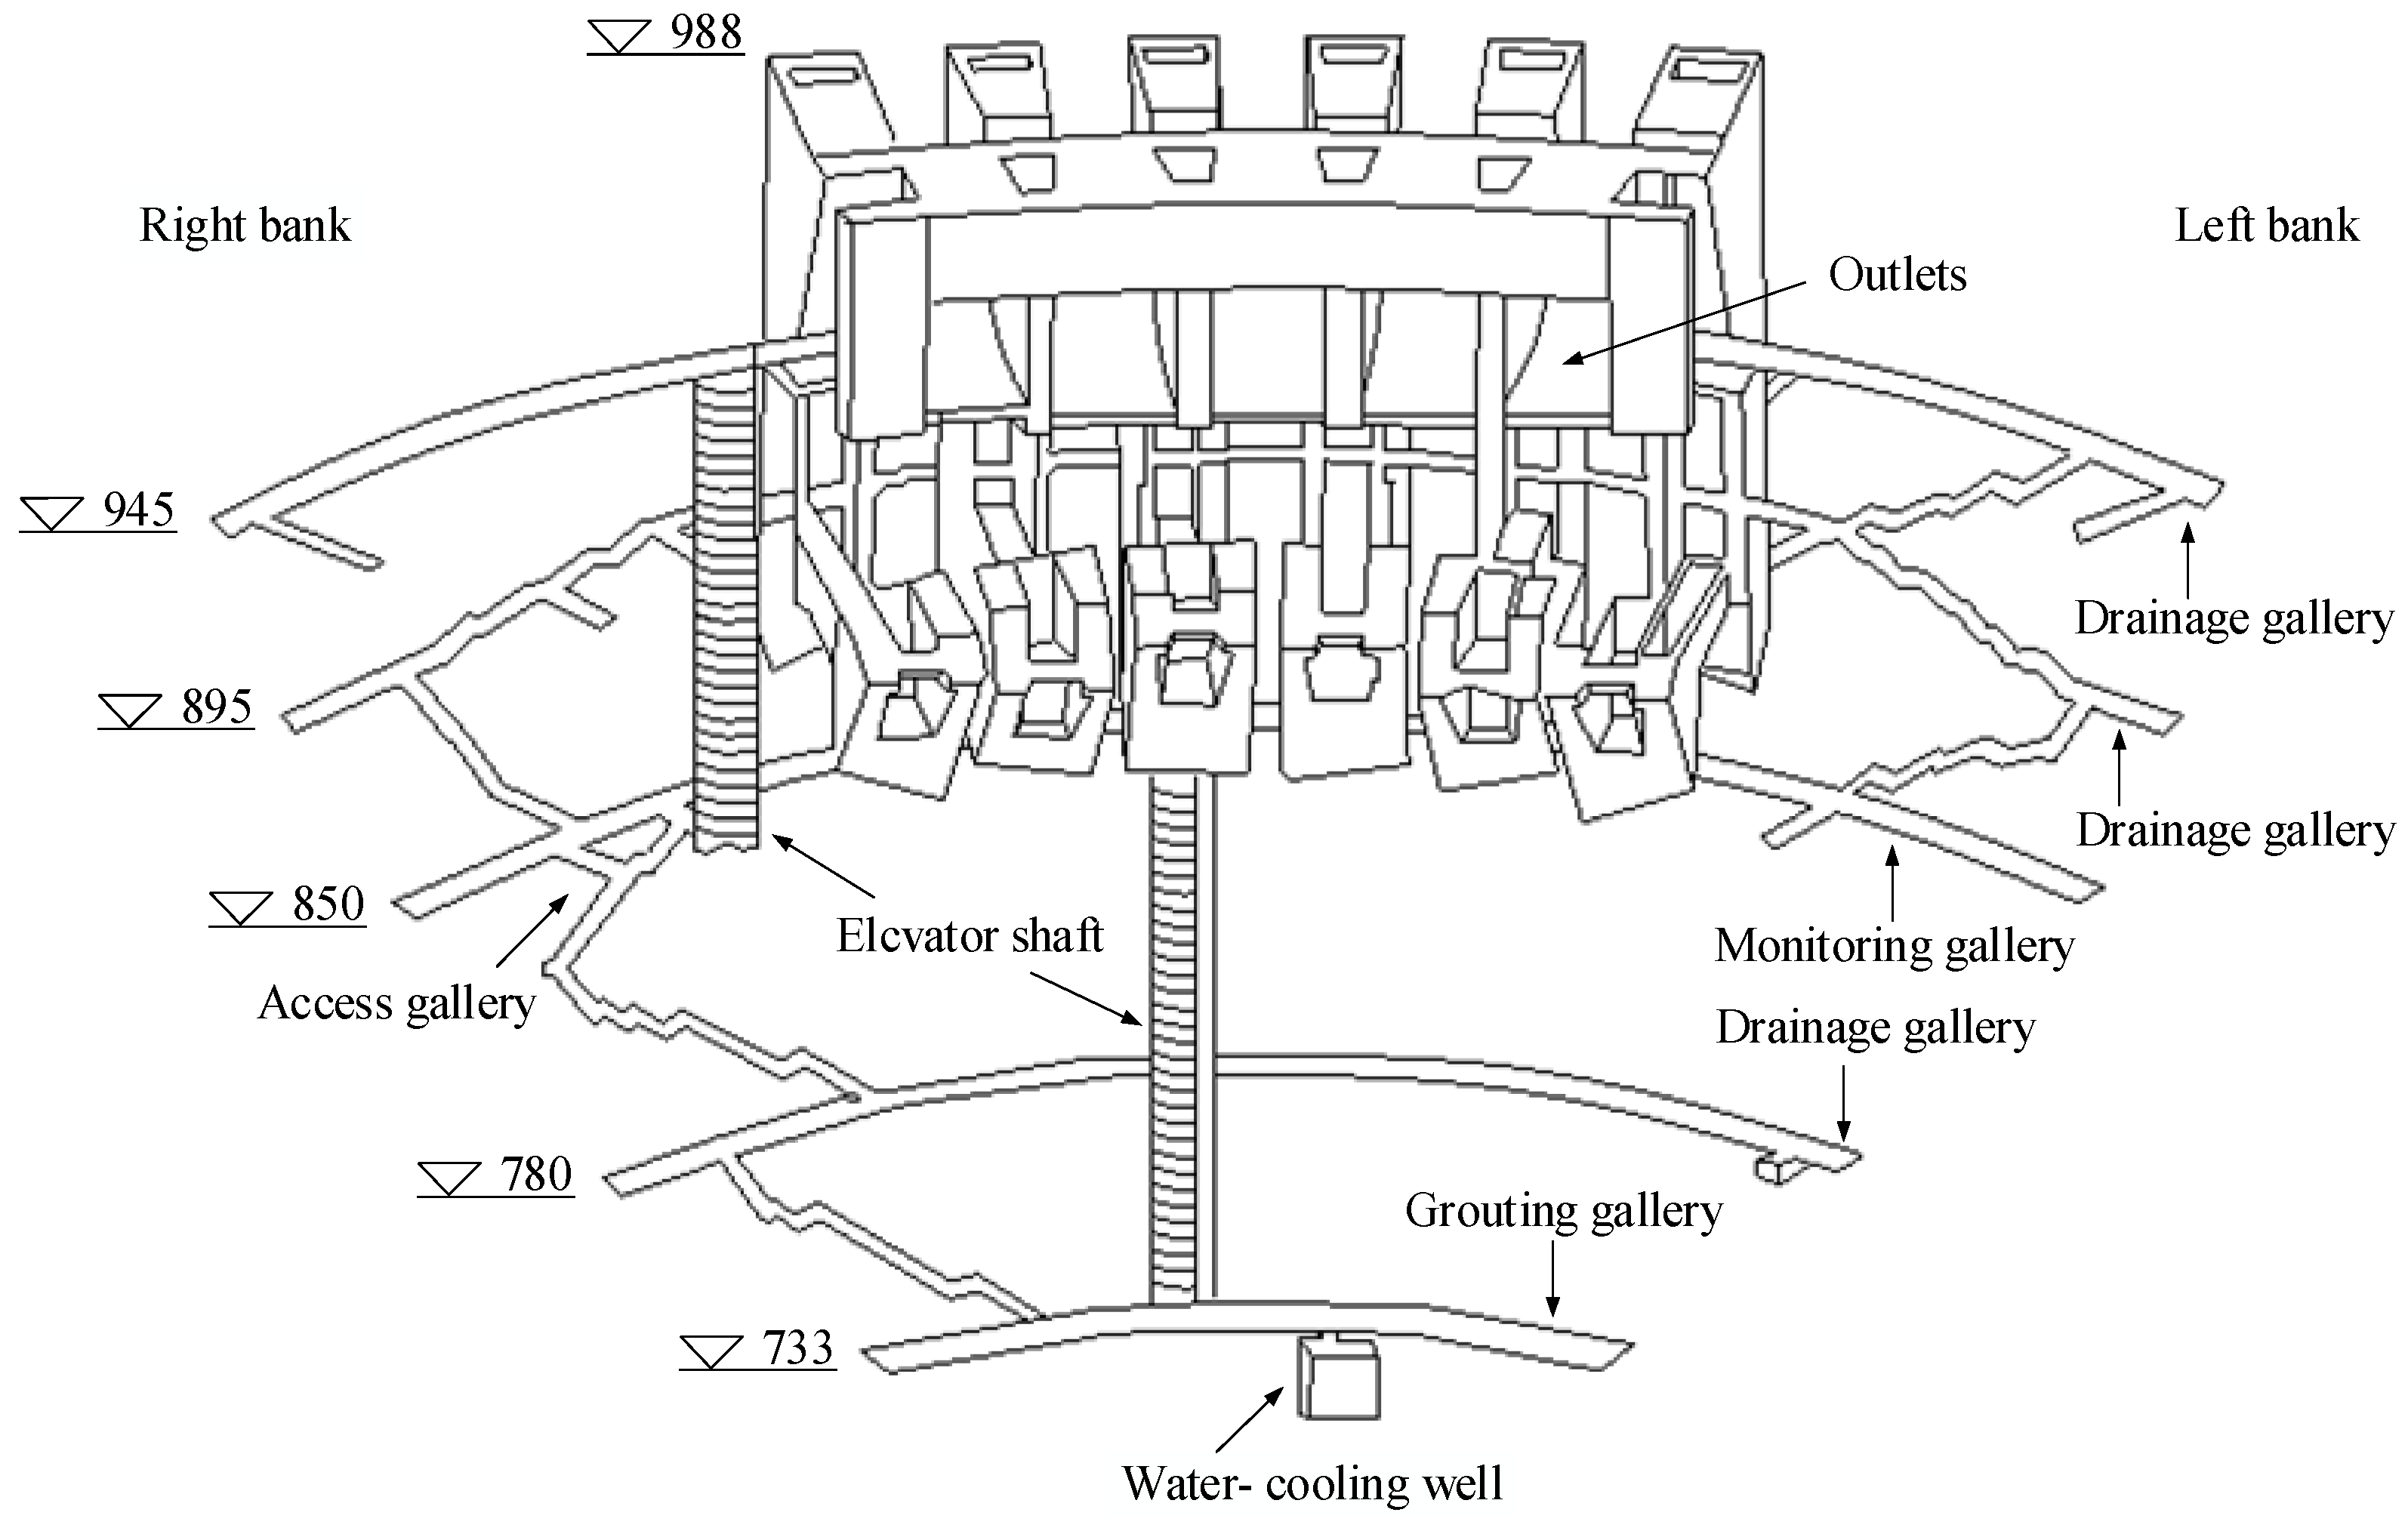
Figure 1. Layout of galleries and outlets in a super arch dam.
Buildings 15 03967 g001
Figure 2. The overall finite element model of dam 7#.
Buildings 15 03967 g002
Figure 3. Feature points of gallery. (a) Top of gallery; (b) Bottom of gallery.
Buildings 15 03967 g003
Figure 4. Average temperature history of each pouring layer.
Buildings 15 03967 g004
Figure 5. Temperature history at feature points in the gallery vault.
Buildings 15 03967 g005
Figure 6. Temperature history at feature points in the gallery floor slab.
Buildings 15 03967 g006
Figure 7. Comparison between measured and calculated temperatures of concrete in the 8th placement of dam Section 7#.
Buildings 15 03967 g007
Figure 8. Stress distribution in the gallery on 4 November 2017. (a) X-direction stress of vault; (b) Y-direction stress of vault; (c) X-direction stress of the floor; (d) Y-direction stress of the floor.
Buildings 15 03967 g008
Figure 9. Envelope diagram of the first principal stress σ1 and minimum crack resistance safety factor for the vault and floor slab. (a) Envelope diagram of the first principal stress σ1 (Unit: MPa); (b) Minimum crack-resistance safety factor; (c) Envelope diagram of the first principal stress σ1 (Unit: MPa); (d) Minimum crack-resistance safety factor.
Buildings 15 03967 g009
Figure 10. Stress history of point T1 on the surface of the gallery vault.
Buildings 15 03967 g010
Figure 11. Stress history of point T9 on the surface of the gallery floor.
Buildings 15 03967 g011
Figure 12. Stress history of hoop stress at feature points at different depths of the gallery vault.
Buildings 15 03967 g012
Figure 13. Variation in hoop stress along the elevation of the gallery vault at typical moments.
Buildings 15 03967 g013
Figure 14. Distribution of hoop stress at the gallery vault at typical moments before arch closure.
Buildings 15 03967 g014
Figure 15. Distribution of hoop stress at the gallery vault at typical moments after arch closure.
Buildings 15 03967 g015
Figure 16. Stress history of hoop stress at different feature points on the vault surface.
Buildings 15 03967 g016
Figure 17. History of vertical axial stress at feature points at different depths of the gallery floor slab.
Buildings 15 03967 g017
Figure 18. Variation in vertical axial stress along the elevation of the gallery floor slab.
Buildings 15 03967 g018
Figure 19. Axial distribution of vertical axial stress on the gallery floor slab at typical moments before arch closure.
Buildings 15 03967 g019
Figure 20. Axial distribution of vertical axial stress on the gallery floor slab at typical moments after arch closure.
Buildings 15 03967 g020
Figure 21. History of vertical axial stress at feature points in different locations on the floor slab.
Buildings 15 03967 g021
Figure 22. Hoop stress history of feature points at different depths on the gallery vault under self-weight.
Buildings 15 03967 g022
Figure 23. Hoop stress history of different feature points on the gallery vault under self-weight.
Buildings 15 03967 g023
Figure 24. A comparison of the hoop stress history on the gallery vault and the vertical axial stress history on the floor surface under self-weight.
Buildings 15 03967 g024
Figure 25. Hoop stress at feature points on the vault surface under different pouring elevations.
Buildings 15 03967 g025
Figure 26. Vertical axial stress at feature points on the floor surface under different pouring elevations.
Buildings 15 03967 g026
Figure 27. Hoop stress history of feature points at different depths of the vault under temperature loads.
Buildings 15 03967 g027
Figure 28. Hoop stress history of feature points on the vault surface under temperature loads.
Buildings 15 03967 g028
Figure 29. A comparison of the hoop stress history on the gallery vault and the vertical axial stress history on the floor under temperature loads.
Buildings 15 03967 g029
Figure 30. The impact of air temperature inside the gallery on the hoop stress of the vault surface.
Buildings 15 03967 g030
Figure 31. The impact of air temperature inside the gallery on the vertical axial stress of the floor surface.
Buildings 15 03967 g031
Figure 32. The impact of elastic modulus on the hoop stress of the vault.
Buildings 15 03967 g032
Figure 33. The impact of elastic modulus on the vertical axial stress of the floor.
Buildings 15 03967 g033
Figure 34. The history of crack resistance safety factor for the vault.
Buildings 15 03967 g034
Figure 35. The history of crack resistance safety factor for the floor surface.
Buildings 15 03967 g035
Figure 36. The impact of cooling water pipes at the gallery vault on the hoop stress of the vault (T1 in the middle of the gallery).
Buildings 15 03967 g036
Figure 37. The impact of cooling water pipes at the gallery vault on the hoop stress of the vault (T7 near the ends of the gallery).
Buildings 15 03967 g037
Figure 38. The impact of the collecting well and pump room on the hoop stress at the vault surface.
Buildings 15 03967 g038
Figure 39. The impact of the collecting well and pump room on the hoop stress at the floor surface.
Buildings 15 03967 g039
Figure 40. The impact of air temperature inside the collecting well and pump room on the vault stress.
Buildings 15 03967 g040
Figure 41. The impact of air temperature inside the collecting well and pump room on the floor stress.
Buildings 15 03967 g041
Table 1. Thermodynamic parameters of the foundation and concrete.
CategoryThermal Conductivity Coefficient
λ /
(kJ·m−1·h−1·°C−1)
Specific Heat
c /
(kJ·kg−1·°C−1)
Thermal Diffusivity
a /
(m2·h−1)
Linear Expansion Coefficient
α /
(10−6·°C−1)
Final Modulus of Elasticity
E 0 /
(MPa)
Poisson’s Ratio
μ
Foundation7.5980.8860.0032006.835,0000.2
C180357.7000.8390.0036567.136,5000.167
Table 2. Water cooling scheme.
Number of PeriodsWater Temperature (°C)Flow (m3/h)Duration (d)
Initial stage8~161.5~2.315
Intermediate stage141.230
Second stage9~101.530
Table 3. Insulation scheme.
Insulation AreaInsulation MaterialEquivalent Heat Transfer Coefficient
W/(m2·°C)
Insulation Time
Warehouse SurfaceInsulation Roll Material3.0Insulate immediately after pouring
Upstream and Downstream SurfacesPolyurethane/Styrofoam2.030 d
Galleries, etc.Insulation Roll Material5.0Consider it as exposed after closure
Table 4. Calculation conditions.
Conditions
Self-WeightCreepVault Water PipeExternal Ambient TemperatureGallery TemperatureElastic ModulusCollecting Well and Pump RoomDescribe
1××
2
3
4Item ⑤ reduce by 2 °C
5Item ⑤ reduce by 4 °C
660% of item ⑥
780% of item ⑥
8×Item ③ is not considered
9Item ⑧ remains constant at 18 °C
10×Item ⑧ filling of cavity entities
Disclaimer/Publisher’s Note: The statements, opinions and data contained in all publications are solely those of the individual author(s) and contributor(s) and not of MDPI and/or the editor(s). MDPI and/or the editor(s) disclaim responsibility for any injury to people or property resulting from any ideas, methods, instructions or products referred to in the content.