Article

Design Optimization of Composite Grey Infrastructure from NIMBY to YIMBY: Case Study of Five Water Treatment Plants in Shenzhen’s High-Density Urban Areas

School of Architecture and Urban Planning, Shenzhen University, Shenzhen 518060, China
*
Author to whom correspondence should be addressed.
These authors contributed equally to this work.
Buildings 2025, 15(21), 3966; https://doi.org/10.3390/buildings15213966
Submission received: 23 September 2025 / Revised: 25 October 2025 / Accepted: 29 October 2025 / Published: 3 November 2025

Abstract

Against the backdrop of Shenzhen’s high-density urban environment, the multifunctional design of water purification plants offers dual benefits: providing residents with urban green spaces while simultaneously mitigating NIMBY sentiments due to their inherent characteristics. Unlike traditional urban development, Shenzhen’s water purification plants integrate into residents’ daily lives. Therefore, optimizing the built environment and road network structure to enhance residents’ perceptions of proximity benefits while reducing NIMBY (Not In My Backyard effect) sentiments holds significant implications for the city’s sustainable development. To address this question, this study adopted the following three-step mixed-methods approach: (1) It examined the relationships among residents’ YIMBY (Neighboring Benefits Effect) and NIMBY perceptions, perceptions of park spaces atop water purification plants, and perceptions of accessibility through questionnaire surveys and structural equation modeling (SEM), establishing a scoring framework for comprehensive YIMBY and NIMBY perceptions. (2) Random forest models and Shapley Additive Explanations (SHAP) analysis revealed nonlinear relationships between the built environment and composite YIMBY and NIMBY perceptions. (3) Spatial syntax analysis categorized the upgraded road network around the water purification plant into grid-type, radial-type, and fragmented-type structures. Scatter plot fitting methods uncovered relationships between these road network types and resident perceptions. Finally, negative perceptions were mitigated by optimizing path enclosure and reducing visual obstructions around the water purification plant. Enhancing neighborhood benefits—through improved path safety and comfort, increased green spaces and resting areas, optimized path networks, and diversified travel options—optimized the built environment. This approach proposes design strategies to minimize NIMBY perceptions and maximize YIMBY perceptions.

1. Introduction

1.1. Research Background and Significance

In the rapid urbanization of Shenzhen’s high-density urban areas, the exploration of efficient land use integration and multifunctional spatial models to address land scarcity has triggered a balancing act between NIMBY and YIMBY effects. This focuses on optimizing built environment design within limited spaces, primarily achieved by reducing NIMBY perceptions of water purification plants through physical barriers (e.g., optimizing path enclosure) while enhancing park appeal via safe and comfortable access routes for residents visiting parks above the plants, thereby amplifying proximity benefits. This ultimately enables systematic, comprehensive optimization of both proximity and NIMBY perceptions. The trend toward integrated water infrastructure in Shenzhen has evolved through the following three distinct phases: Phase One (1980s): Early water purification plants constructed on wasteland. Accelerated industrialization outpaced sewage treatment capacity, leading to urban encroachment around purification plants and triggering NIMBY effects. Phase Two (Early 21st Century): Urban development shifted from low-density to high-density. Increasing population density and concentrated community facilities brought purification plants closer to residential areas, reigniting NIMBY concerns. This phase spurred demand for functionally integrated water purification plants, accompanied by renewed NIMBY effects. The third phase addresses the established model of multi-functional water treatment plants outlined in relevant planning documents (“The Shenzhen Sewage Pipeline Network Construction Plan (2015–2020)” and “The Shenzhen Urban Planning Standards and Guidelines (2019 Revised Edition)” both stipulate that sewage treatment plants should prioritize underground or semi-underground construction models. They explicitly require that the space above such facilities be developed into public amenities such as parks, green spaces, or sports grounds to enhance the living environment of surrounding areas), while simultaneously tackling the challenge of transitioning from NIMBY to YIMBY acceptance to enhance the living environment in surrounding areas.

1.2. Definition of Related Concepts

① Functionally Integrated Water Purification Plant: From an architectural perspective, “integration” represents a design philosophy that combines multiple functions to fulfill both engineering production requirements and the daily needs of urban public spaces [1]. This approach creates spatially integrated designs for urban underground sewage treatment plants with diverse layout configurations (Figure 1).
② Neighborhood avoidance: “Neighborhood avoidance facilities” generally refer to those whose siting process faces opposition due to concerns about pollution, noise, or other negative impacts on nearby residents. The “NIMBY effect” describes residents’ rejection of such facilities stemming from anxiety over potential adverse effects, leading to resistance or protests. This study focuses on NIMBY perceptions specifically persisting after functional optimization of facilities [2,3,4].
③ Neighborhood Benefits: This study centers on the public activity spaces and park-like green areas within the upper zones of functionally integrated water purification plants. Specifically, it examines the positive neighborhood benefits perceived by surrounding residents following the functional integration of such facilities [5].
④ Built Environment: This refers to the physical spatial environment shaped by human activities (such as walking, cycling, resting, and exercising in the park areas above the composite water treatment plant), encompassing elements like buildings, roads, public facilities, green spaces, and their spatial arrangements [6].

1.3. Research Objectives

This study focuses on residents’ comprehensive perceptions of NIMBY and YIMBY attitudes toward multi-functional water purification plants. Its core lies in dissecting residents’ perceptions and evaluations of multi-functional water purification plants and their surrounding environments in daily life, with particular emphasis on exploring the relationship between built environment elements near such plants and residents’ experiences. It investigates which built environment factors enhance or mitigate residents’ NIMBY or NIMBY-positive sentiments toward water purification plants. The study innovatively dissects the nonlinear relationship between the built environment and NIMBY perceptions. Employing machine learning nonlinear analysis methods, it examines the association between the built environment surrounding water purification plants and residents’ comprehensive NIMBY perceptions. For each built environment element, it provides corresponding optimal value ranges, offering a novel theoretical perspective for related fields. Finally, it proposes specific strategies for optimizing environmental elements and road network spatial structures, aiming to provide practical guidance for the planning and design of surrounding areas.

1.4. Research Review

A literature analysis of domestic and international studies on the NIMBY effect reveals the following two key findings: first, existing research on integrating water treatment plants into urban parks remains notably scarce. Second, few models have combined perceived perceptions with built environment characteristics in this context. These findings lay the groundwork for analyzing the perceived effects of NIMBY facilities in high-density environments and developing optimization strategies.
Domestically, Yang Xuefeng employed structural equation modeling (SEM) in a study of Hangzhou’s waste incineration plants, finding that residents’ acceptance of NIMBY facilities largely depends on their perceived benefits and trust. Therefore, during facility siting and construction, efforts should focus not only on minimizing negative environmental impacts, but also on addressing residents’ psychological concerns [7]. Bai Yang et al., through questionnaire surveys, entropy weight analysis, kernel density analysis, and location-allocation modeling, studied waste treatment facilities in Huizhou City. They found that NIMBY effects are more likely to occur in economically developed, densely populated areas. This implies that infrastructure planning must balance reducing construction and transportation costs with minimizing public resistance [8]. Zhou Xuemei selected Qingdao West Coast Sewage Treatment Plant as a case study. By constructing a model and conducting visualization analysis using ArcGIS 10.2, she found that the plant negatively impacts surrounding residential property values. For every 1 km reduction in distance, the average residential price decreases by 0.46%, with an influence radius of 0.8 km [9]. Sun Meng employed questionnaire surveys and characteristic price models to investigate the factors influencing residents’ attitudes toward sewage treatment plants as NIMBY facilities in Xi’an and their spatial impact range. The study identified risk perception, knowledge perception, and public trust as key determinants of resident attitudes. Model calculations confirmed that the actual impact radius of sewage treatment plants on surrounding residences was 1600 m. The study proposed measures to mitigate NIMBY sentiments and principles for differentiated compensation for residents within the 300 to 1600 m range [10]. Overseas researchers such as Salvatore Vergine conducted field studies examining community acceptance of wind power projects, focusing on the impacts of climate change perceptions, local attachment, and environmental attitudes. Their findings revealed a positive correlation between future climate change perceptions and project acceptance [11]. According to Robert, the siting controversy surrounding hazardous waste facilities (HWFs) primarily stems from residents’ deep concerns about potential future environmental and health risks. Faced with the long-term impacts of such facilities, public fear and uncertainty intensify. Simultaneously, the lack of timely and transparent communication and information exchange between government and the public exacerbates this disconnect. This communication breakdown fails to effectively address public concerns, leading to heightened community resistance and conflict over HWF siting [12]. Pei-Ing Wu employed the spatial Dobbin utility pricing model and local polynomial regression to investigate whether the total benefits of urban open spaces and farmland in a Taiwanese city increase or decrease when located near NIMBY or NIMBY facilities. He proposed that urban planning should rationally allocate NIMBY and NIMBY facilities based on regional characteristics (such as urbanization levels and land types) to avoid negative impacts on open space and farmland values (Figure 2). When the distance from a residence to the nearest urban open space falls within the influence range of a NIMBY or YIMBY facility, the benefits of urban open space to the residence may either increase or decrease; when the distance from a residence to the nearest urban open space falls within the influence zone of a NIMBY or NIMHO facility, the benefits of urban open space to the residence may either increase or decrease [13].
Research on NIMBY perceptions both domestically and internationally has evolved from early studies focusing on public attitudes toward NIMBY facilities near residential areas—such as power plants and sewage treatment plants—to multidimensional interpretations of individual social perceptions. Recent developments include a 2024 study by Mengjia Liu et al. [14] investigating Chinese public acceptance of open-air sewage treatment plants and its influencing factors. Data analysis was conducted using 3000 online questionnaires, with hypothesis testing performed via structural equation modeling (SEM). The results revealed that compared to traditional sewage treatment plants, open-air facilities garnered high preference from the vast majority of respondents (92.3%). In October 2024, Xiao, ZP (Xiao, Zuopeng) et al. [15] utilized real-time population access big data to map spatial disparities in community park visits within Shenzhen. Employing an interpretable machine learning approach combining random forests with SHAP (Shapley Additivity Propensity) to reveal the relative importance of built environment attributes, the study examined nonlinear associations and interaction effects on park visits [13]. Other recent studies have also integrated methods such as questionnaires, structural equation modeling, and GIS to analyze the impact of NIMBY effects on resident attitudes and spatial distribution across dimensions like perceived benefits, perceived risks, and perceived trust. These studies propose strategies to mitigate NIMBY effects, including optimizing facility layout and strengthening public trust. This review utilizes the unique case of a water treatment plant converted into a dual-purpose facility (treatment + park). It advances the field by refining the integrated “SEM + Random Forest/SHAP + Spatial Syntax” methodology. Theoretically, it supplements the research framework through the integration of perceived integration, built environment, and NIMBY–YIMBY concepts. Practically, it provides actionable guidance for urban planning strategies.

2. Materials and Methods

2.1. Research Framework for the Nonlinear Relationship Between YIMBY and NIMBY Perceptions and the Built Environment

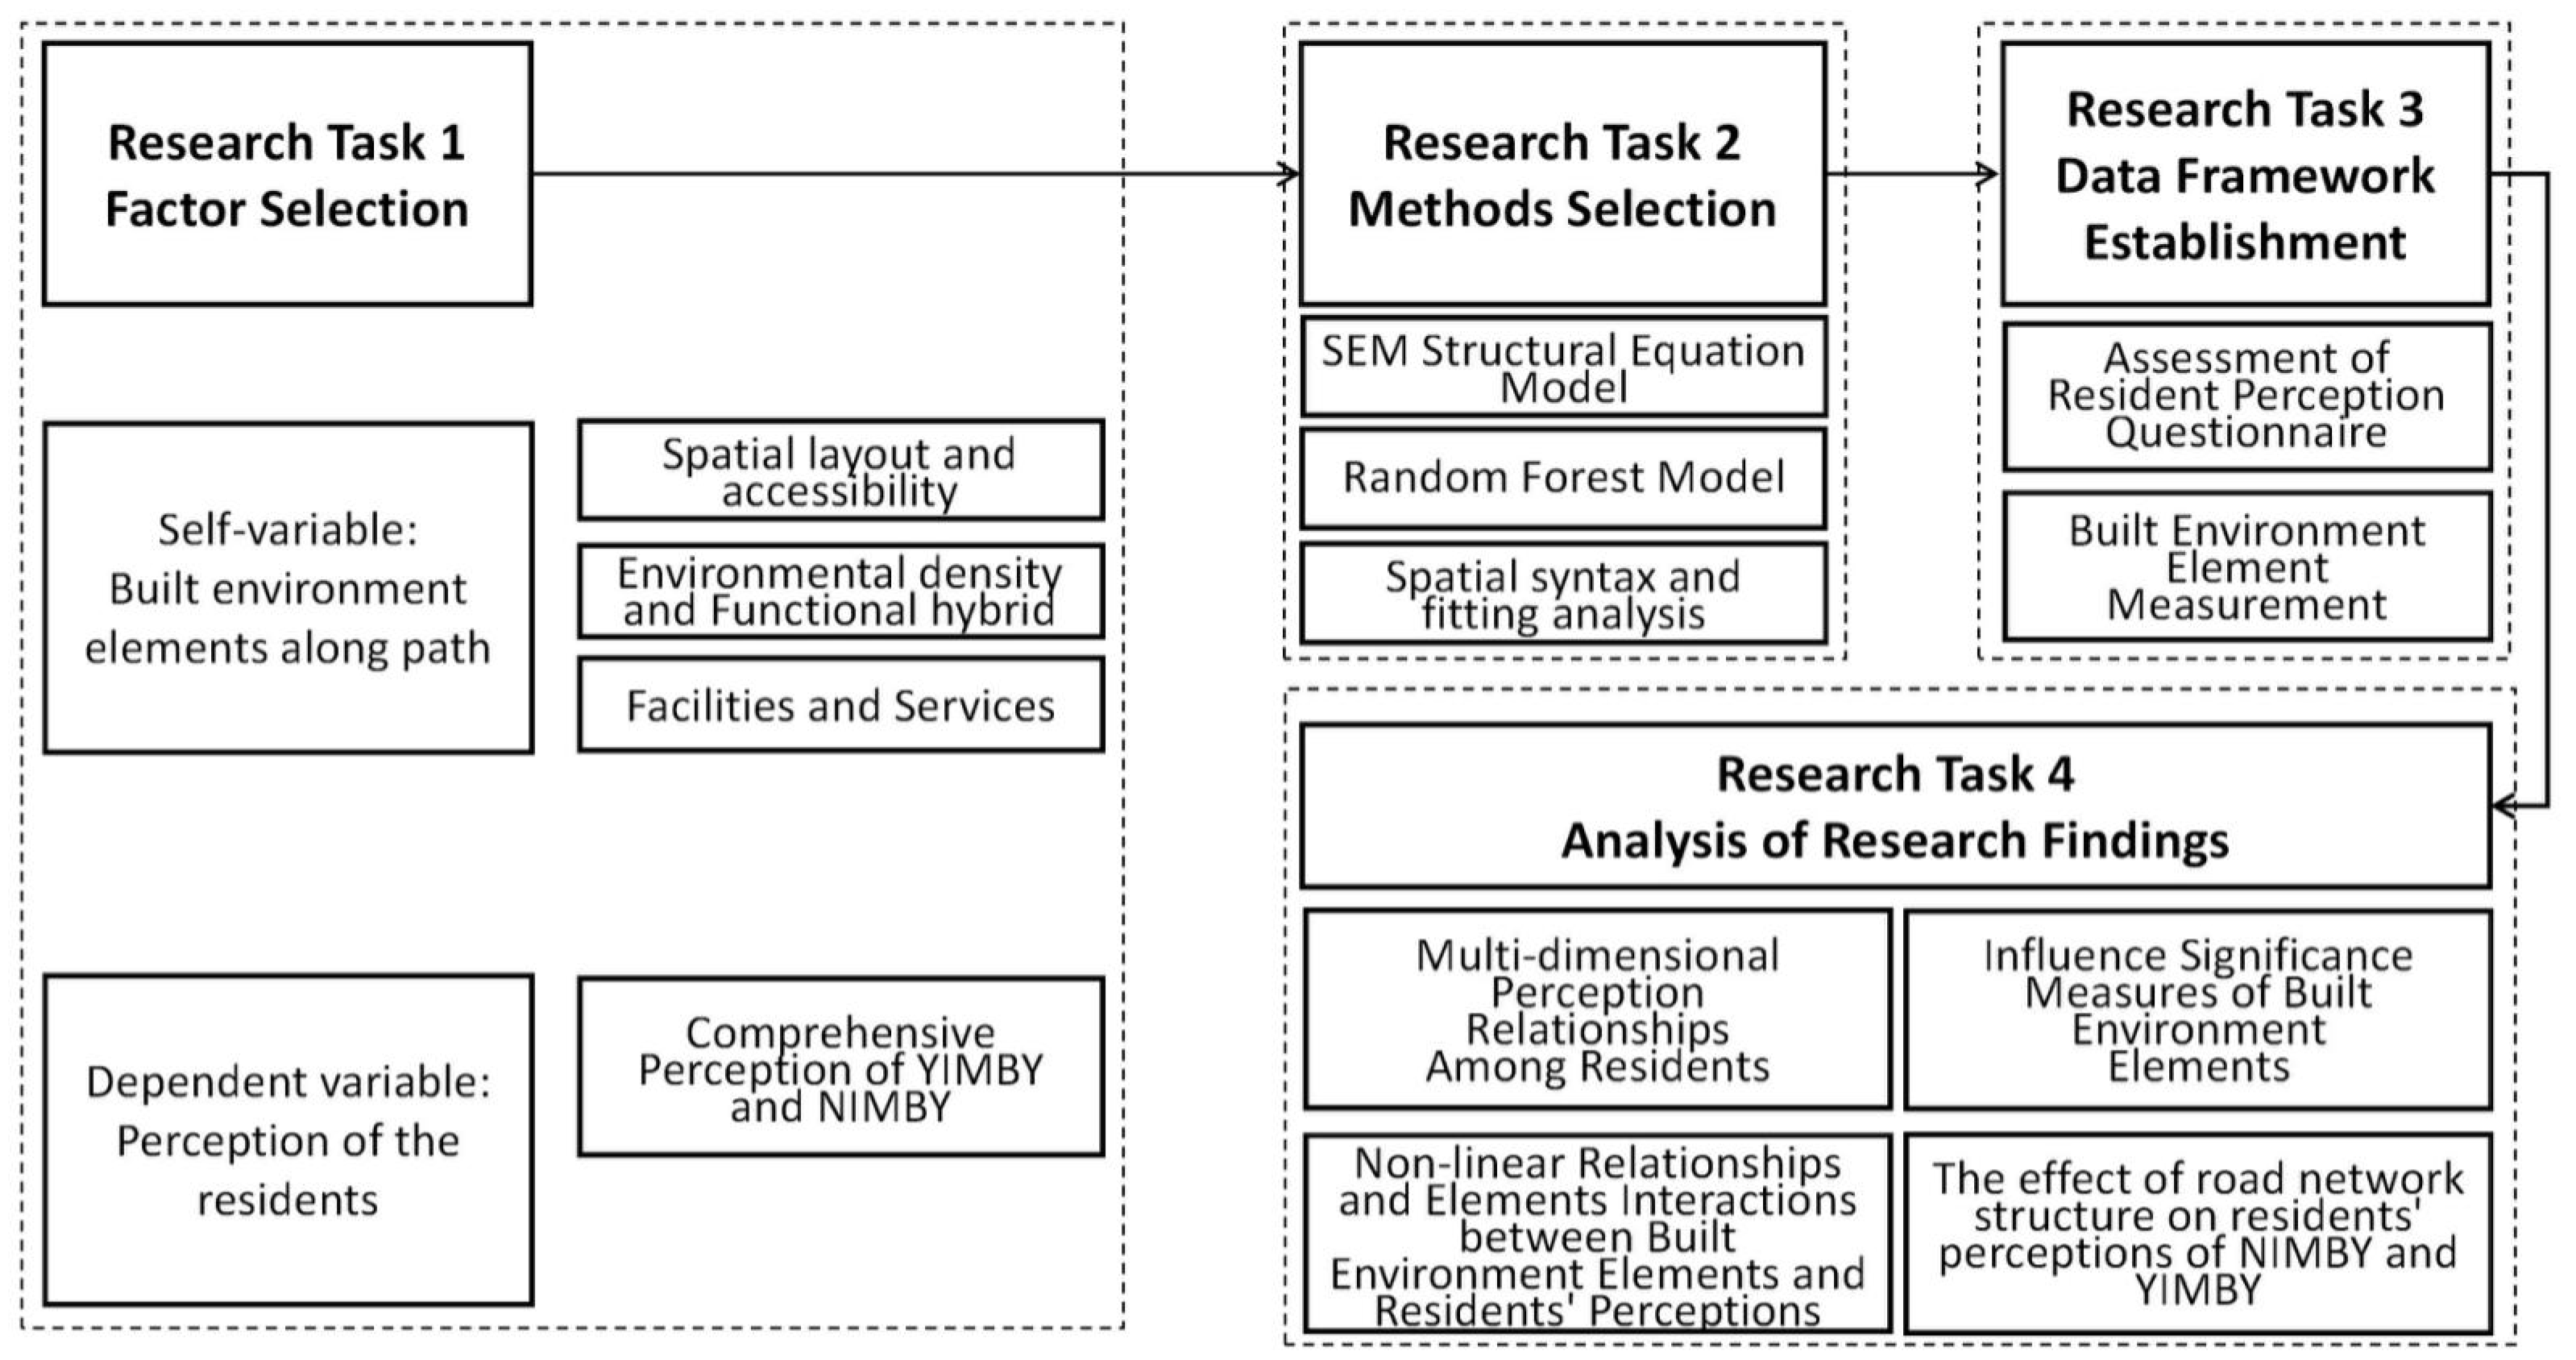
This study progresses from qualitative to quantitative analysis, advancing from assessing the current state to examining underlying mechanisms. The research pathway exploring the nonlinear relationship between the built environment and residents’ YIMBY and NIMBY perceptions comprises the following four tasks (Figure 3). The decision-making framework in this study first employs structural equation modeling (SEM) to construct latent structural relationships between YIMBY and NIMBY perceptions. This clarifies the mediating role of spatial perception and accessibility perception within the overall resident perception mechanism, laying the theoretical foundation for subsequent empirical analysis of built environment factors’ influence pathways. Second, building upon the SEM framework, the study further incorporates specific built environment variables through Random Forest and SHAP analyses. This includes analysis of the importance of the following key indicators for spatial layout and accessibility (as defined in Task 1’s three-category independent variables): angle stride depth, straight-line distance, actual distance, and detour rate; environmental density and functional mix indicators, including functional mix, street-front commercial rate, path building density, and enclosure rate; facility and service indicators such as green space pass rate, convenience store POI density, food and beverage POI density, and distance-to-nearest-park ratio. This approach identifies key factors influencing resident perceptions through machine learning, reveals nonlinear and interactive relationships among variables, and provides data support and indicator-based optimization for built environment improvements. Finally, spatial syntax analysis and scatterplot fitting are applied to path characteristics within key variables. This typologically analyzes the influence patterns of angular stride depth on resident perceptions across different road network structures. Through spatial structure categorization and trend fitting, these methods supplement and deepen conclusions from the first two approaches, forming a layered, progressive integrated research framework.
1. Research Task 1 involves factor selection. Based on the relevant literature and after defining independent and dependent variables, residents’ comprehensive perceptions are selected as the dependent variable. The following three categories of indicators serve as independent variables: spatial layout and accessibility along the path from residential areas to water purification plants, environmental density and functional mix, and facilities and services.
2. Research Task 2 involves method selection. This aims to choose an appropriate approach to explore the nonlinear influence mechanism between residents’ comprehensive perceptions and path built environment factors. It investigates the significance of path built environment factors’ impact, their effective range, and threshold characteristics, while also examining the relationship between road network structure types near water purification plants and residents’ YIMBY and NIMBY perceptions. Therefore, SEM structural equation modeling is selected to reveal the relationships among residents’ multi-dimensional perceptions, forming the basis for constructing a YIMBY and NIMBY integrated perception scoring system. Random forest is employed to quantify nonlinear relationships between residents’ integrated perceptions and the built environment, while spatial syntax and scatter plot fitting serve as methods for qualitative and quantitative analysis of road network structures.
3. Research Task 3 establishes a framework based on the data required for YIMBY and NIMBY comprehensive perception assessment and path built environment factors, clarifying data sources and processing methods to provide a data foundation for empirical research.
4. Analysis of research findings specifically includes exploring residents’ perceptions across different dimensions along pathways, measuring the significance of built environment factors’ influence, identifying nonlinear relationships between built environment factors and residents’ perceptions, along with interactions among factors, and assessing how road network structure types affect residents’ perceptions of NIMBY and NIMTO. Additionally, corresponding urban planning optimization strategies will be proposed based on the quantitative evaluation.

2.2. Research Subjects

2.2.1. Selection of Water Purification Plants and Scope of Study

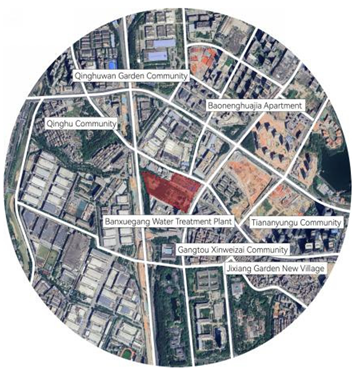
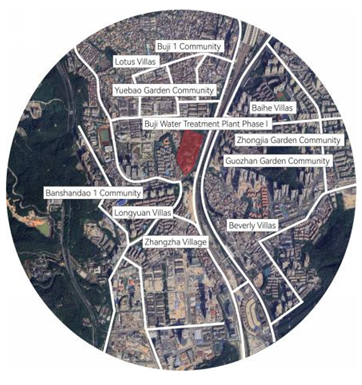
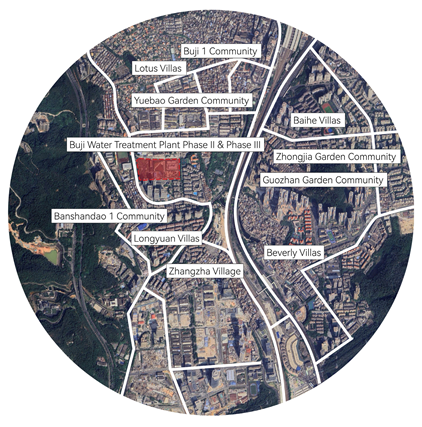
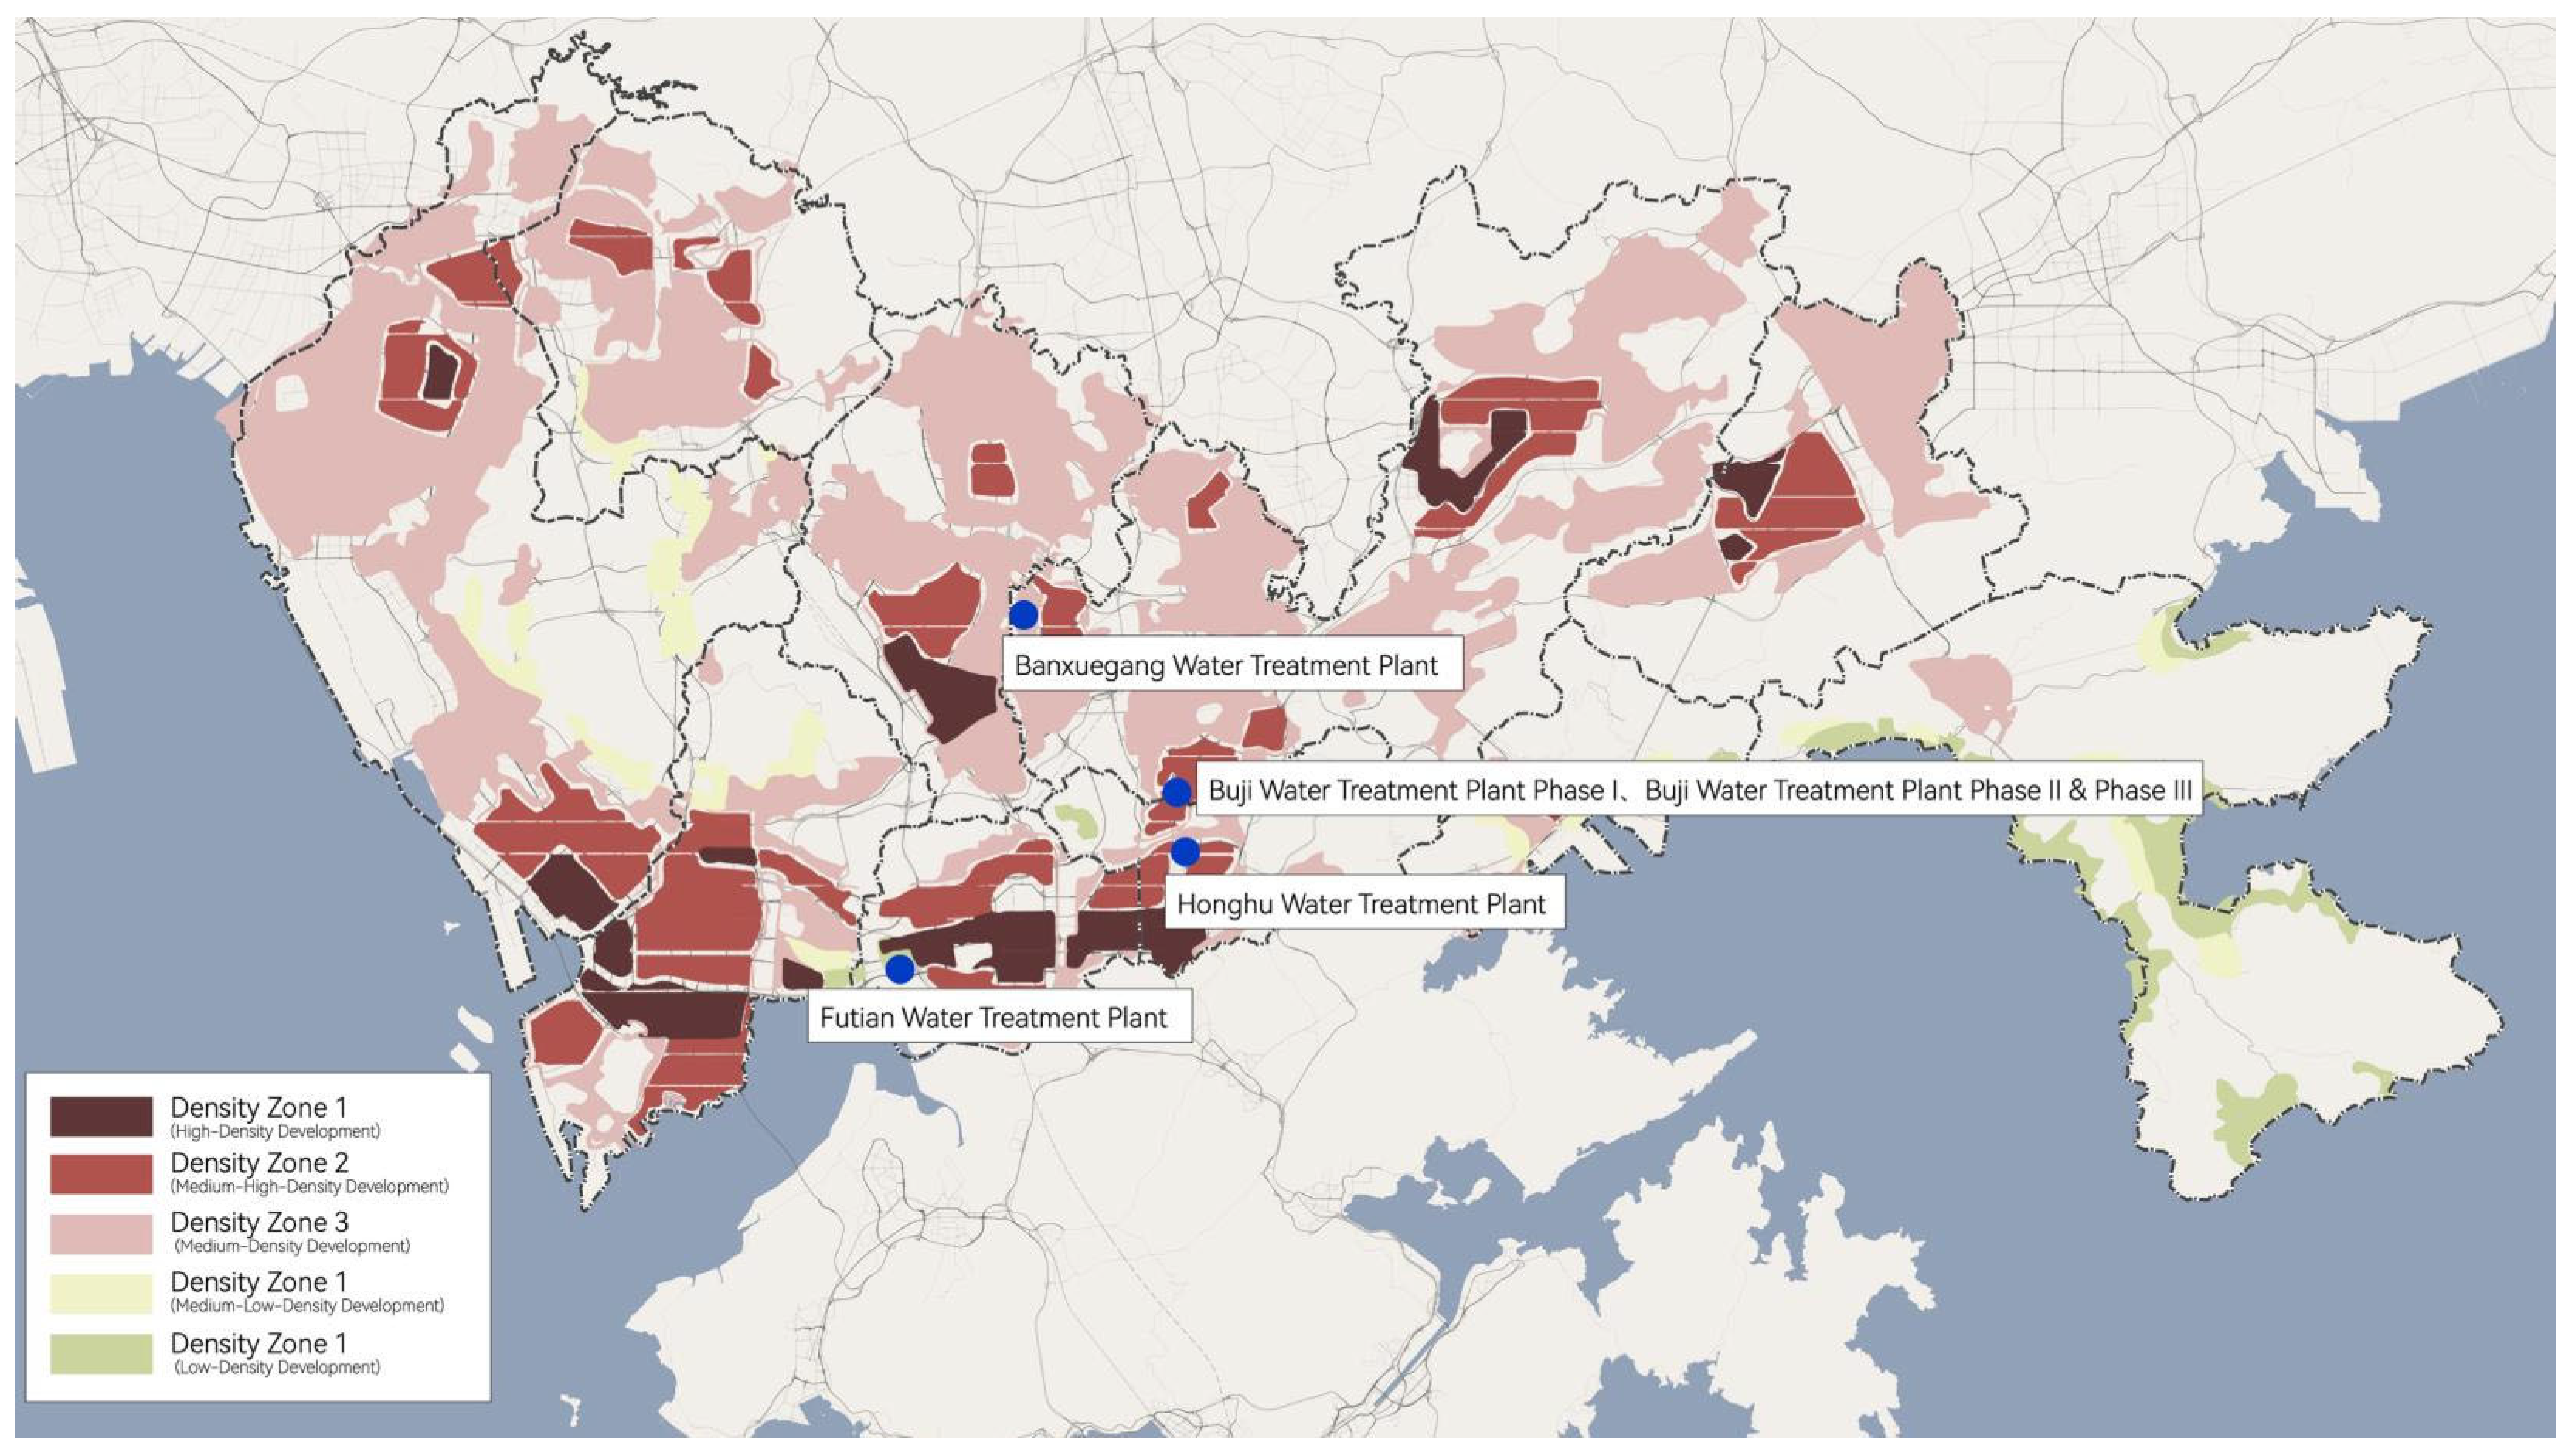
Given that infrastructure integration represents a future design trend, water purification plants were selected based on their functional integration. All water purification plants in Shenzhen were screened (primarily based on the following three criteria: location in medium-to-high-density development zones, integrated functional design, and presence of an elevated park). Shenzhen has 45 water purification plants, of which 12 are functionally integrated. Ultimately, five plants were selected that meet the criteria of being located in medium-to-high-density development zones (Figure 4), featuring integrated functional design, having upper parks already open for use, and exhibiting NIMBY effects (Appendix A Table A1). The study examined their YIMBY and NIMBY perceptions, identifying representative cases where optimized environmental design reduced residents’ NIMBY perceptions while enhancing YIMBY perceptions. Findings from this area hold significant implications for optimizing urban spatial layouts and improving residents’ quality of life. The study adopts a pedestrian perspective from residential areas to the upper parks of water purification plants, examining how the built environment within walking distance influences the combined perception of YIMBY and NIMBY effects. Integrating residents’ 15 min walking life circles and the public’s NIMBY perception distance toward water purification plants, a research area with a 1600 m radius centered on the plants was delineated [10].

2.2.2. Selection of Questionnaire Survey Participants

The questionnaire survey participants in this study comprised residents residing within a 1600 m radius of five multi-functional water purification plants located in medium-to-high-density areas of Shenzhen within the study scope (relevant research has obtained ethical approval). The selection of survey participants was primarily based on the following criteria: (1) Residential Scope: The target group was restricted to residents within a 1.6 km radius of the water purification plants, with primary modes of travel to the parks above the plants being walking or cycling. This ensured they could directly perceive the impacts of the facilities and their surrounding environments, guaranteeing the validity of the survey results. (2) Diversity: Respondents encompassed varied genders, ages, occupations, and residency durations to gather diverse perceptual data and enhance representativeness. (3) Surveying these core groups comprehensively reflects residents’ perceptions of NIMBY and YIMBY effects near multi-functional water purification plants, while providing empirical support for subsequent spatial optimization and built environment enhancement.

2.3. Establishing a Perception Evaluation System for Shenzhen’s Multi-Functional Water Purification Plant Among Residents

2.3.1. Principles for Selecting Evaluation Indicators

Evaluation indicators are closely aligned with the core research objective: assessing the impact of the water purification plant and its surrounding built environment on residents’ NIMBY and YIMBY perceptions. The questionnaire design was progressively supplemented and optimized through resident surveys, employing Likert scales for scoring to ensure consistency and comparability of the results.

2.3.2. Questionnaire Design and Logical Structure

The questionnaire comprises the following three logical layers: ① Respondent Information Layer, ② Perception Layer, and ③ Open-Ended Layer. The latter collects residents’ suggestions for optimizing the built environment to gather richer subjective feedback.

2.3.3. Establishment of the Evaluation System

Drawing on the relevant literature, we constructed measurement indicators for NIMBY perception (Table 1), YIMBY perception (Table 2), perception of the park space above (Table 3), and accessibility perception (Table 4). These indicators comprehensively evaluate residents’ perceptions of the water purification plant across the following four dimensions: NIMBY, YIMBY, spatial perception, and accessibility. Utilizing these metrics allows for separate assessments of the plant’s negative effects, positive effects, residents’ spatial perception of the park above the plant, and their perception of path accessibility.
Based on the above summary, the resident perception evaluation system for Shenzhen’s multi-functional water purification plant is as follows (Table 5):

2.4. Indicator System and Quantification Methods for Built Environment Factors Affecting Resident Perception

To systematically analyze how the built environment along the path from residential areas to the park above the water purification plant influences residents’ perceptions, the impact factors of the built environment are categorized into the following three types: Environmental Density and Functional Mix (evaluating the functional distribution and development intensity of areas surrounding the route) and Facilities and Services (analyzing the ecological quality of the route environment and the impact of service accessibility on residents’ walking experience) (Table 6).

2.5. Questionnaire Data Analysis and Construction of the NIMBY and YIMBY Comprehensive Perception Evaluation System

2.5.1. Reliability and Validity Analysis

(1) Reliability Analysis: This study employed Cronbach’s alpha coefficient—a commonly used reliability metric—as the key indicator. Based on 248 valid questionnaires, SPSS 22.0 software was utilized to examine all measurement items (Table 7 and Table 8).
In the study, the overall reliability coefficient of the questionnaire was 0.838, with all dimension reliability coefficients exceeding 0.7 (see table for details), indicating a good reliability quality of the research data. Regarding the perceived accessibility dimension, the figure highlights the need for particular attention to the impact of the “Perceived Accessibility D2” item. After removing this item, the dimension’s reliability coefficient increased from 0.755 to 0.794, indicating that the overall reliability of the dimension improved following its deletion. Therefore, it is recommended to remove the “Perceived Accessibility 2” item to enhance the reliability of this dimension. After deleting the Perceived Accessibility D2 item, the reliability coefficients for the Perceived Accessibility dimension are as shown in the table below (Table 9).
In the reliability analysis following item deletion, the reliability coefficient for the perceived accessibility dimension reached 0.794, further validating the data’s reliability and consistency. The removal of other items did not significantly improve the reliability coefficient, thus rendering further deletions unnecessary. The corrected item-total correlations (CITC values) for all items exceeded 0.4, indicating strong inter-item correlations. This confirms the scale’s high reliability and suitability for subsequent analysis.
(2) Validity Analysis: This study employs validity analysis to assess the effectiveness of the questionnaire tool design in reflecting the theoretical framework and constructs of the research, evaluating whether it adequately captures each measurement dimension. To evaluate the scale’s ability to capture latent variables, Campbell and Fiske introduced the concepts of convergent and discriminant validity. Factor analysis is widely used to validate the structural validity of questionnaires, with KMO values and Bartlett’s sphericity test serving as prerequisites for conducting factor analysis. Factor analysis is categorized into exploratory factor analysis (EFA) and confirmatory factor analysis (CFA). In this study, exploratory factor analysis (EFA) was employed to verify whether the dimensions of the questionnaire design aligned with the intended structure. According to SPSS test results, the overall KMO value for the scale was 0.858, and Bartlett’s sphericity test yielded a chi-square value of 2263.609 with a significance level below 0.001 (Table 10). These findings indicate that the scale meets the prerequisites for factor analysis regarding construct validity, confirming that the questionnaire design effectively reflects the latent dimensions being measured.
This study employed principal component analysis to extract factors, and through maximum orthogonal rotation, identified factors with eigenvalues greater than 1. The specific results are shown in (Table 11). A total of four factors with eigenvalues greater than 1 were extracted. The cumulative variance explained by the first four principal components was 60.031%, exceeding 60%. This indicates that the first four factors effectively reflect the main information in the data, highly consistent with the variables set in the questionnaire, and the factor structure is reasonable.
Based on the results in Table 12, it can be observed that the factor loadings for all measurement indicators exceed 0.5, while cross-loadings remain below 0.4. A total of 21 indicators were extracted and categorized into the following four factors: Factor 1 corresponds to NIMBY perception, Factor 2 to NIMBY benefit perception, Factor 3 to spatial perception, and Factor 4 to accessibility perception. These measurement indicators are concentrated within their respective factors, indicating that the scale possesses good construct validity. It effectively measures the intended perceptual dimensions, demonstrating sound validity for the questionnaire, which can proceed to the next stage of data analysis.

2.5.2. Descriptive Analysis of Questionnaire Data

(1) Questionnaire Recovery: To ensure data objectivity and validity, an anonymous pre-survey was conducted to refine the questionnaire before the formal survey. A total of 275 questionnaires were distributed across all sample sites, with 248 valid responses ultimately obtained. The sample size met the research requirements, and the respondents’ basic information provided comprehensive foundational data for subsequent analysis. Analysis of travel patterns revealed that the built environment along walking routes is closely linked to residents’ park usage experiences and perceptions.
(2) Descriptive Statistics Analysis by Dimension: Based on valid samples from five water purification plants and questionnaire data from 106 distinct residential areas, descriptive statistical analysis was conducted across different dimensions, as follows: ① Analysis of NIMBY Perception Mean and Standard Deviation (Figure 5). Overall, the Buji Phase 1 Water Purification Plant recorded the highest average NIMBY perception score at 16.58 points, while the Futian Water Purification Plant had the lowest average score at 15.06 points. Among NIMBY perceptions, the public perceived the greatest traffic pressure from the parks above the water purification plants, while the lowest perception was for sanitary pollution caused by the plants. Residents near the Banxuegang Water Purification Plant showed the greatest variation in perceptions across different dimensions, while those near the Futian Water Purification Plant showed the least variation. Among all perception dimensions, residents near water purification plants showed the greatest variation in perceptions of psychological discomfort caused by the plants, while the least variation was observed in perceptions of the plants’ impact on property values. ② Analysis of Neighborhood Benefit Perception Averages and Standard Deviations (Figure 6). Overall, the Banxuegang Water Purification Plant had the highest average neighborhood benefit perception score at 22.39 points, while the Futian Water Purification Plant had the lowest average score at 20.74 points. Public perception of the quality-of-life enhancement brought about by parks above water purification plants was strongest, while perception of the environmental benefit enhancement from these parks was weakest. Residents near the Buji Phase 2 Treatment Plant exhibited the greatest variation in perceptions across different dimensions of neighborhood benefits, while those near the Banxuegang Water Purification Plant showed the least variation. Among all perception dimensions, residents near the treatment plants reported the greatest variation in evaluations of the visual and environmental enhancements brought by the parks above the plants, while the least variation was observed in perceptions of the parks’ impact on economic and land value appreciation. ③ Analysis of Spatial Perception Mean and Standard Deviation (Figure 7). Overall, the Banxuegang Water Purification Plant had the highest average spatial perception score at 20.46 points, while the Buji Phase 1 Water Purification Plant had the lowest average spatial perception score at 18.48 points. The public rated the static gathering spaces at the water purification plant upper park the highest, while the spatial and elevation design received the lowest evaluation. Residents near the Honghu Water Purification Plant exhibited the greatest variation in perceptions across different spatial dimensions, while those near the Buji Phase 2 Plant showed the least variation. Among all perception dimensions, residents near the purification plants showed the greatest variation in evaluations of the aesthetics and comfort of the parks atop the plants, while the least variation was observed in evaluations of the environmental quality and convenience of these parks. (4) Analysis of Accessibility Perception Averages and Standard Deviations (Figure 8). Overall, the Honghu Water Purification Plant had the highest average accessibility perception score at 13.96 points, while the Buji Phase 1 Water Purification Plant had the lowest average score at 12.01 points. Among accessibility perceptions, the public rated the route convenience to the Upper Park of the water purification plant highest, while comfort of the route to the Upper Park received the lowest evaluation. Residents in different areas surrounding various water purification plants reported varying perceptions of accessibility to the Upper Park. These perceptions may influence residents’ visit frequency, thereby affecting their perceptions of the locational benefits and drawbacks of functionally integrated water purification plants. Residents near the Banxuegang Water Purification Plant exhibited the greatest variation in perceptions across accessibility dimensions, while those near the Futian Water Purification Plant showed the least variation. Among all perception dimensions, residents near the plants differed most significantly in their evaluations of path comfort to the upper park, while showing the least variation in their assessments of path convenience.

2.5.3. Correlation Analysis

(1) Correlation Analysis of NIMBY Perception: This study conducts correlation analysis on the four perception dimensions within the survey data. The sign of the p-value [−1, 1] is used to test the significance of the correlation coefficient, determining the mutual relationships and their closeness among these dimensions. This analysis advances subsequent research on optimizing YIMBY and NIMBY perceptions (Table 12 and Table 13). Correlation analysis reveals a significant negative relationship between NIMBY perception and spatial perception, with a p-value of −0.137. This indicates that residents who perceive negative impacts from water purification plants tend to underestimate the quality and design of park spaces, while those who evaluate park spatial quality more highly perceive fewer negative impacts.
(2) Analysis of Perceived Neighborhood Benefits: The analysis of residents’ perceived neighborhood benefits is shown in Table 14. According to the results of the correlation analysis, the p-values of 0.483 and 0.485 are both positive, indicating that perceived neighborhood benefits exhibit a highly positive correlation with both perceived spatial quality and perceived accessibility. In other words, the higher residents rate the spatial quality of the park above the water purification plant, the stronger their perception of the benefits brought by the plant and its park (such as improved quality of life and community interaction). Similarly, the strong positive correlation between neighborhood benefits perception and accessibility perception indicates that residents perceive more positive benefits from the water purification plant and its overlying park when they find the pathways to the park more convenient.

2.5.4. SEM Structural Equation Modeling Analysis

To reveal causal relationships and mediating effects among variables, structural equation modeling will be employed to provide a more systematic theoretical framework for understanding the complex interplay between perceived accessibility, spatial perception, perceived benefits, and perceived nuisance.
  • Structural Equation Model Construction and Hypotheses for NIMBY Perception:
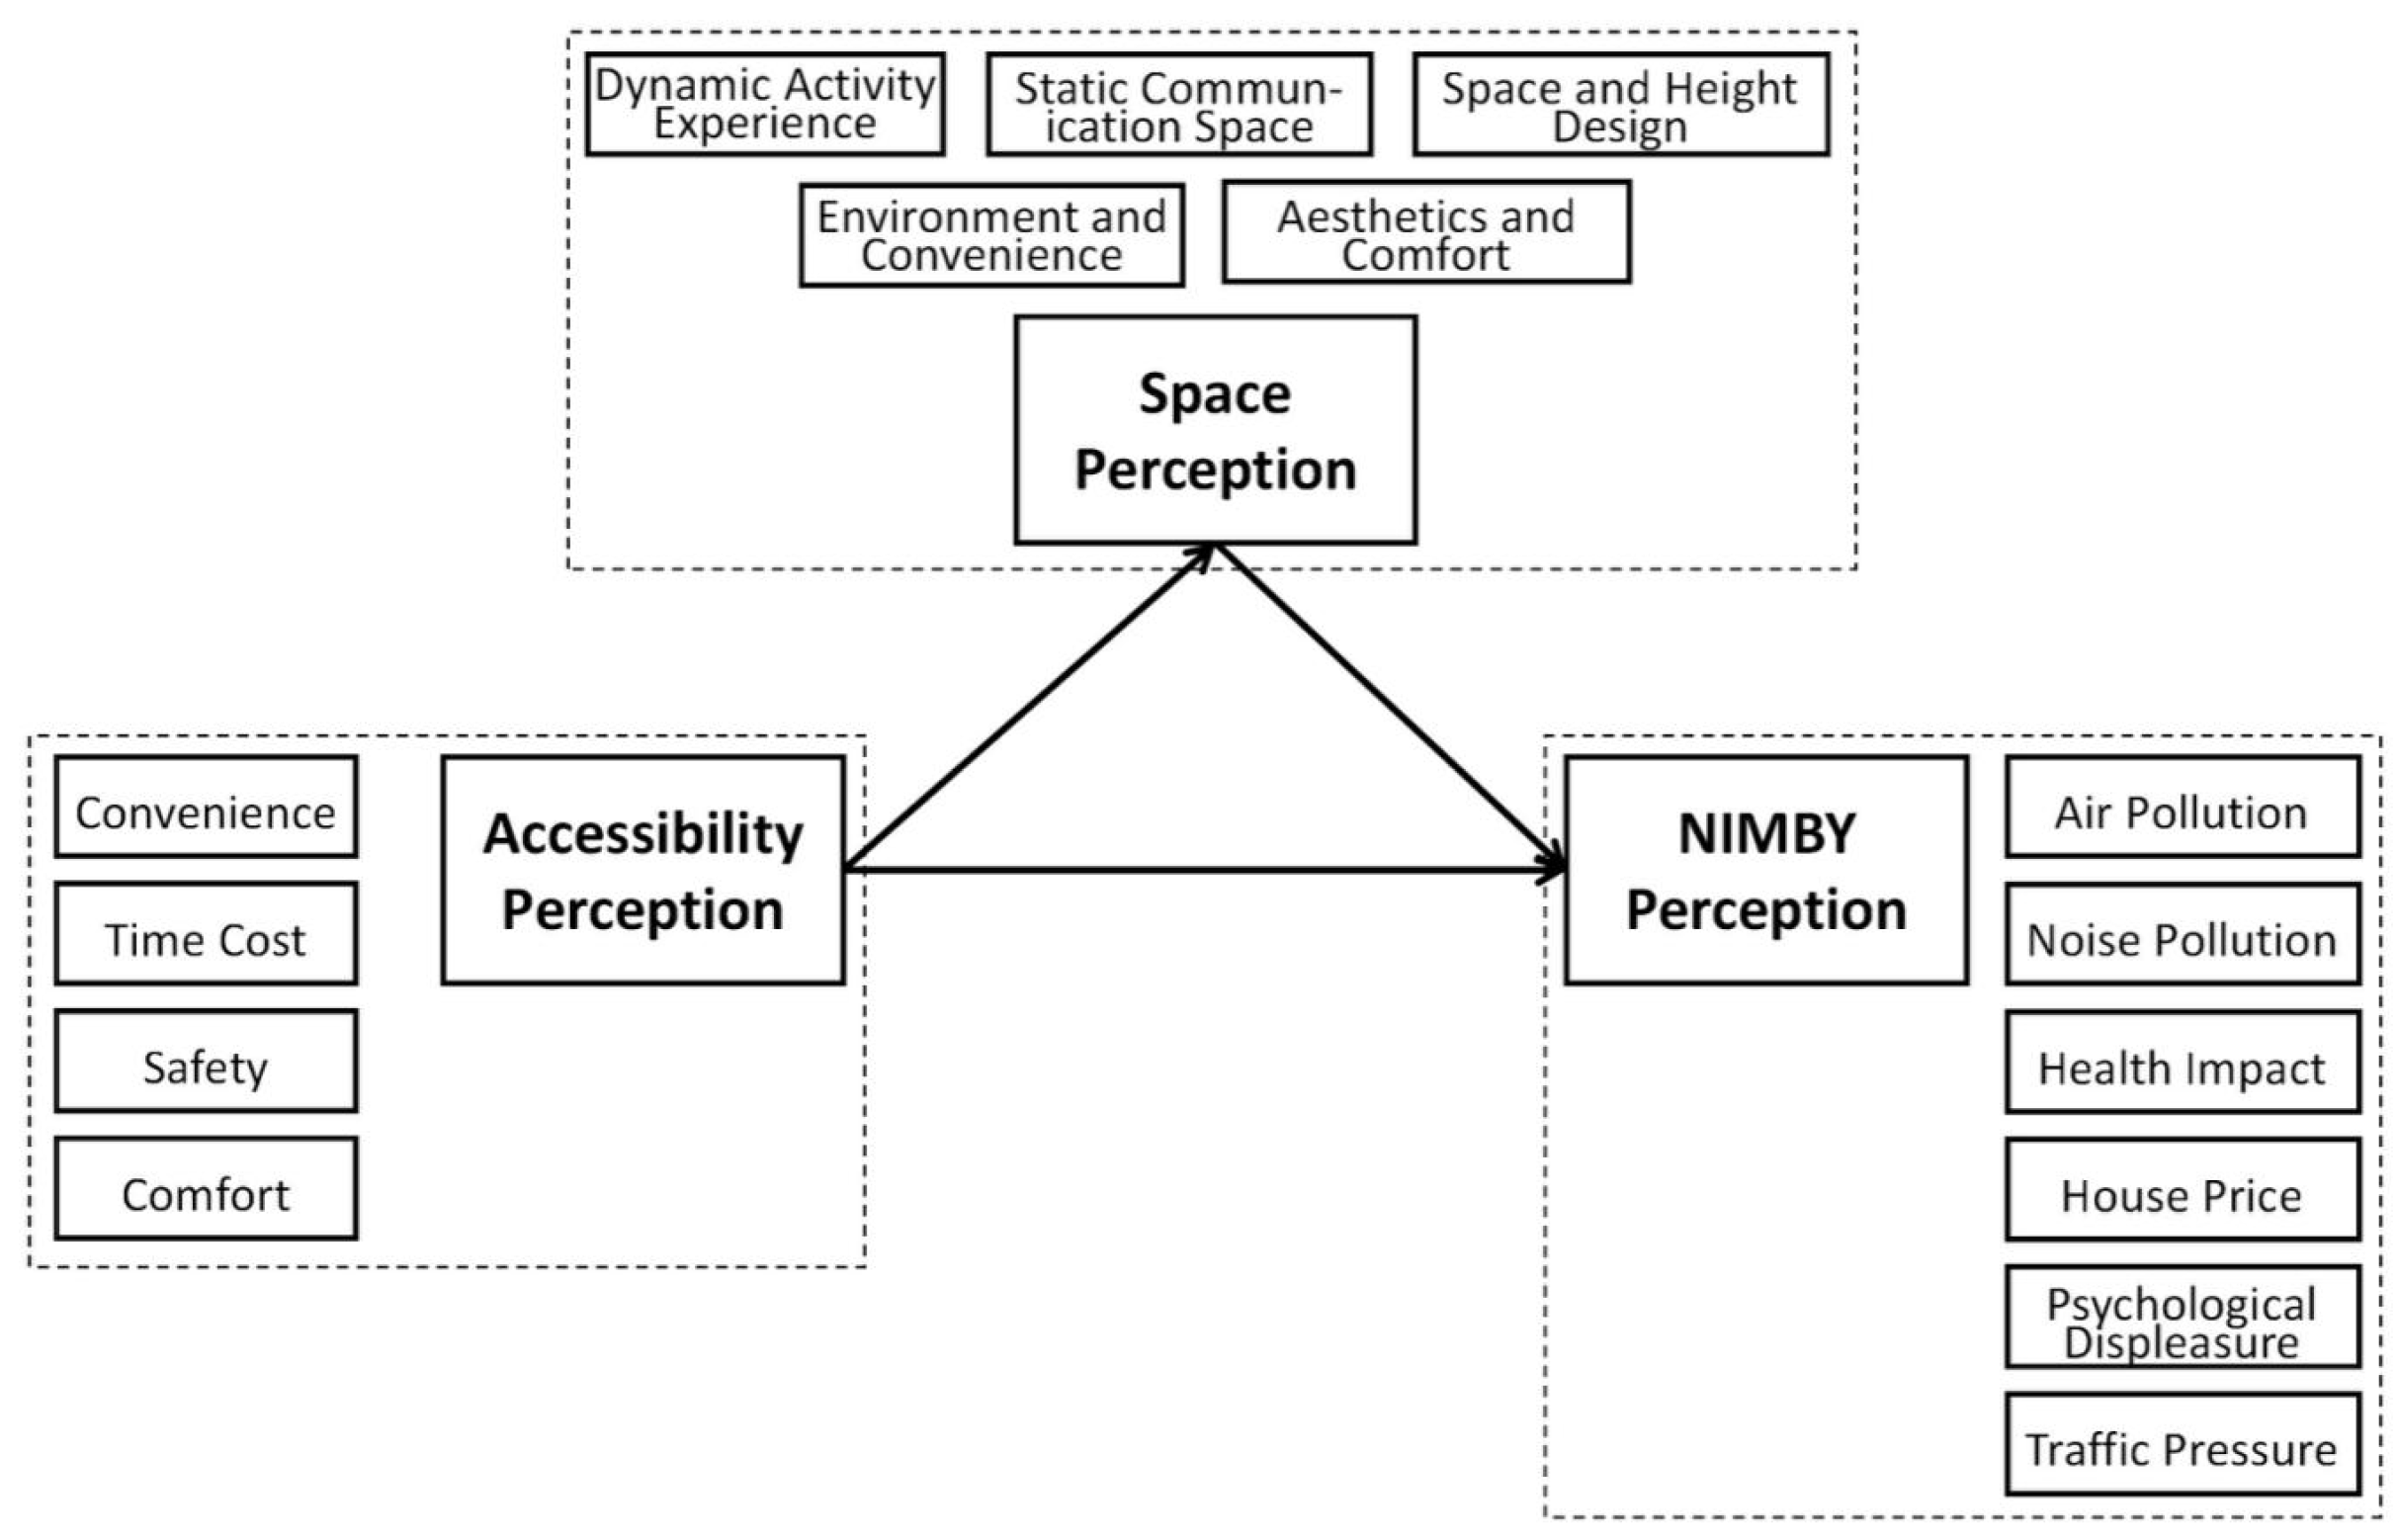
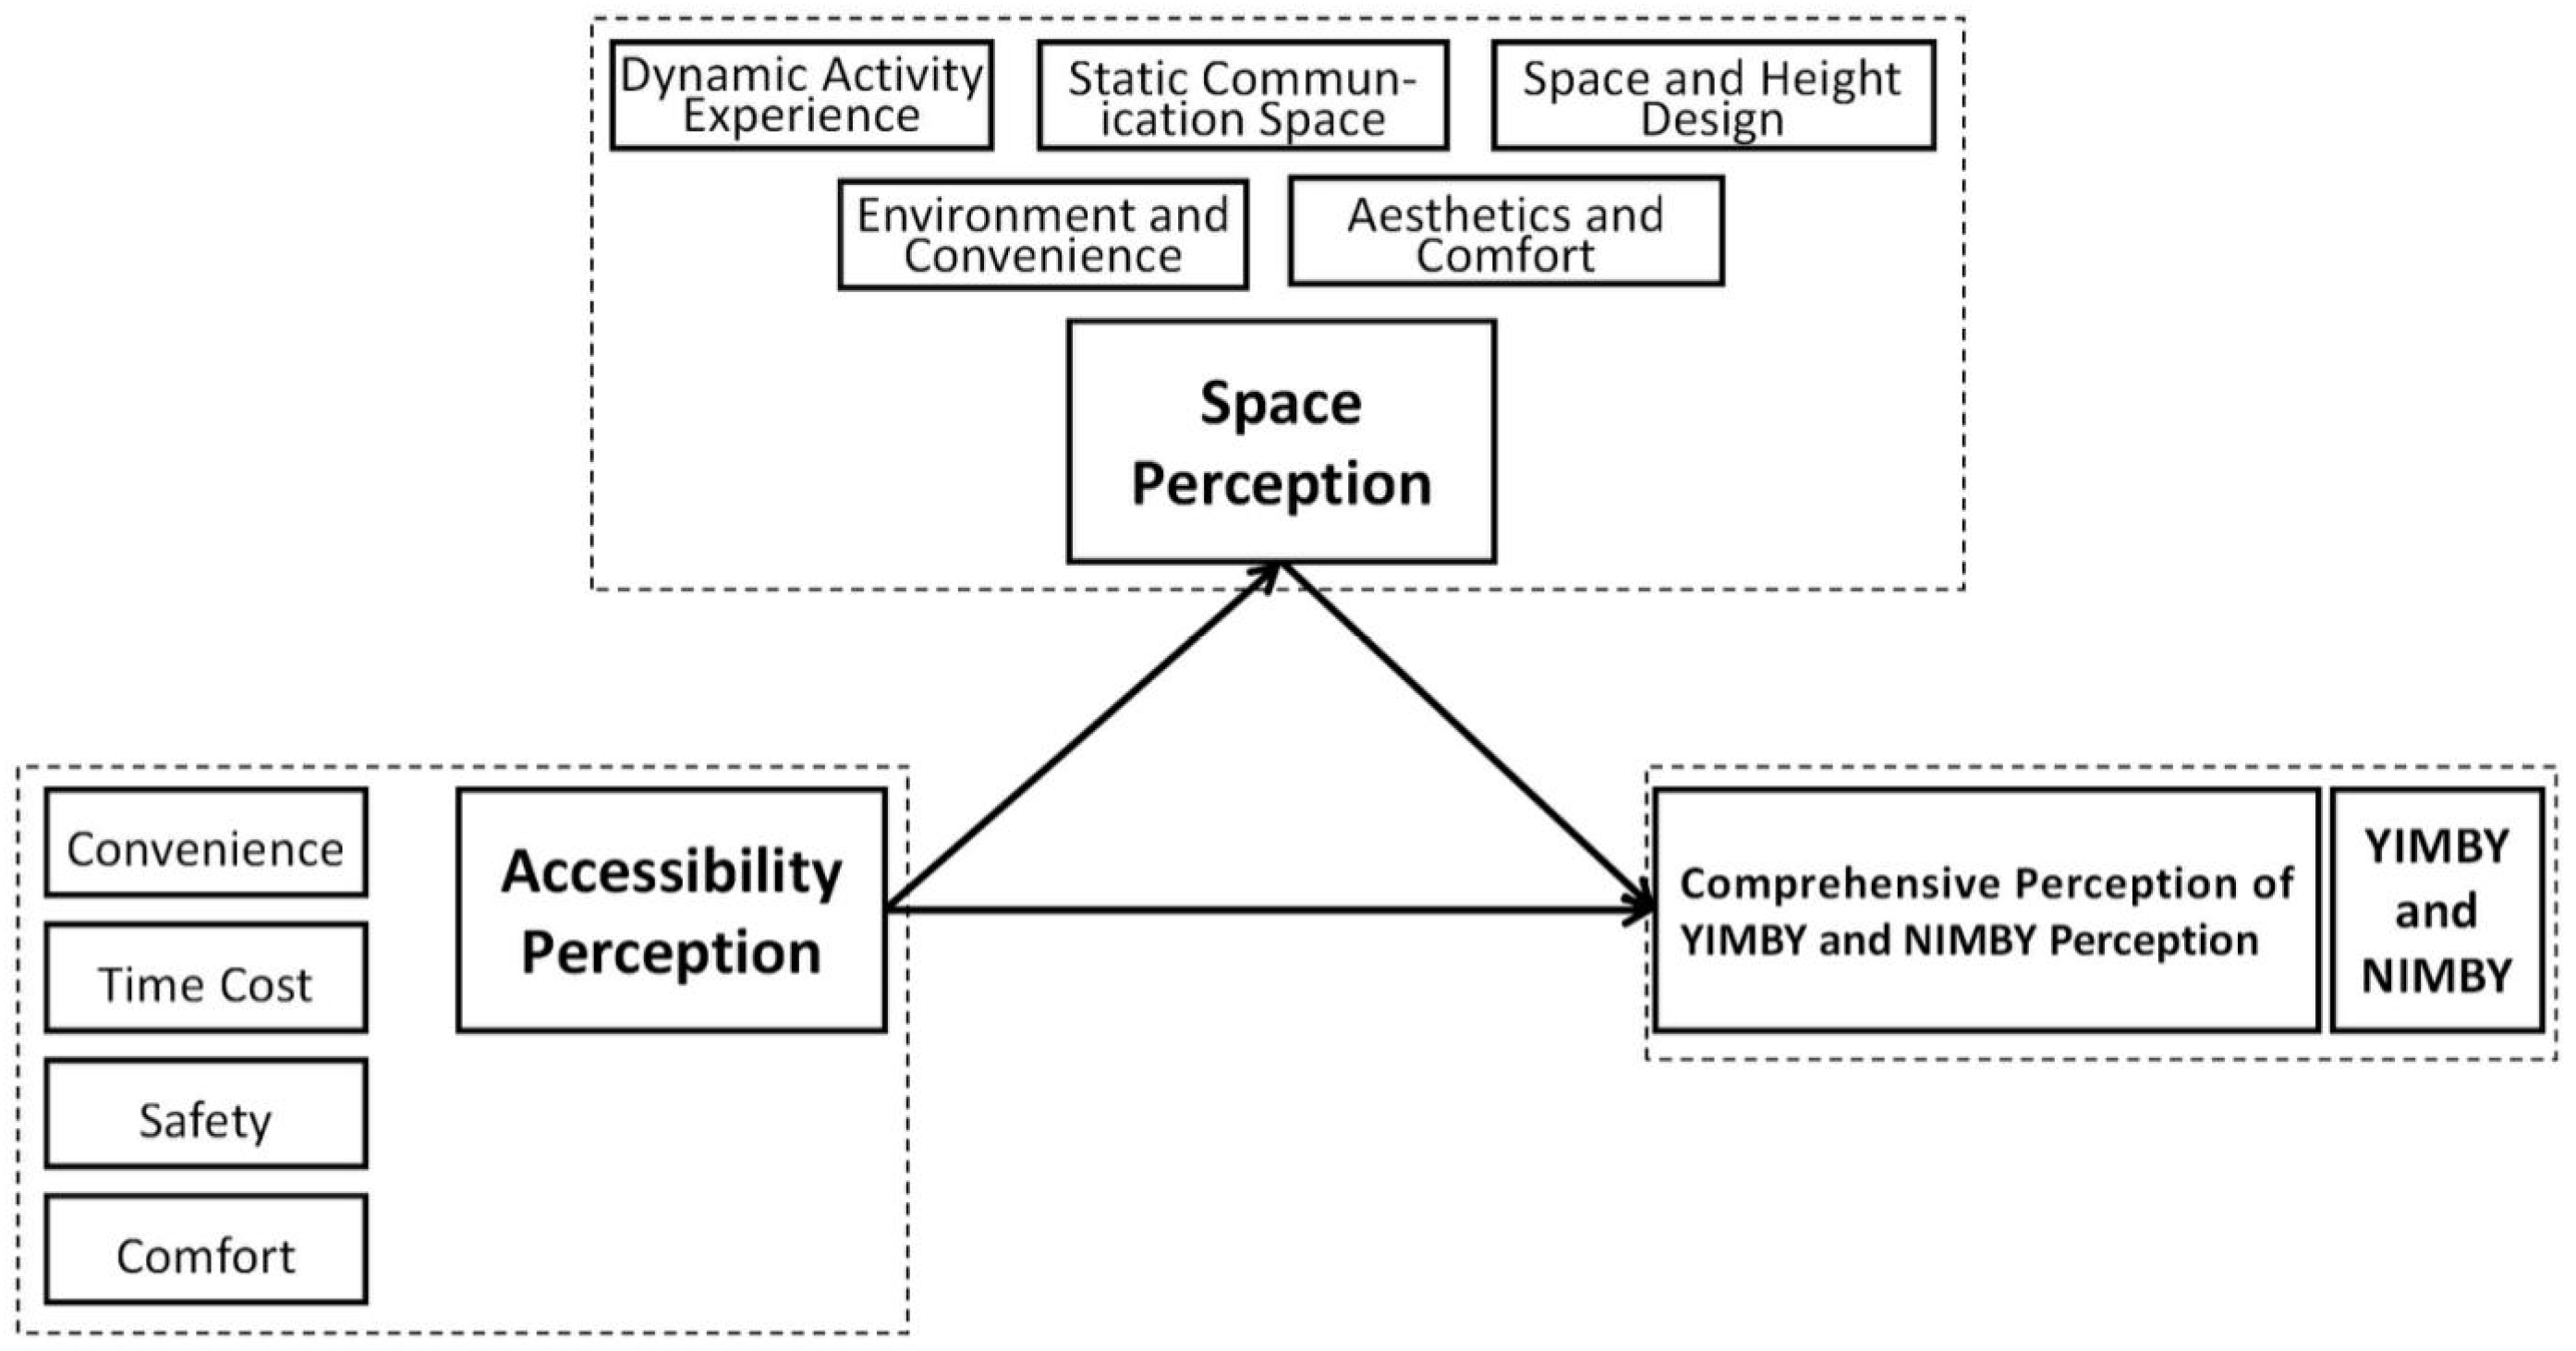
Based on environmental behavior theory and correlation analysis of NIMBY perception, a structural equation model for NIMBY perception was constructed to explore the relationships among perceived accessibility, spatial perception, and NIMBY perception. Drawing from environmental behavior theory’s insights on how environmental factors influence residents’ perceptions, this study proposes the following hypotheses (Figure 9):
Hypothesis 1:
Perceived accessibility directly influences NIMBY perception.
Hypothesis 2:
Spatial perception mediates the relationship between perceived accessibility and NIMBY.
Hypothesis 3:
Spatial perception has a significant direct effect on NIMBY.
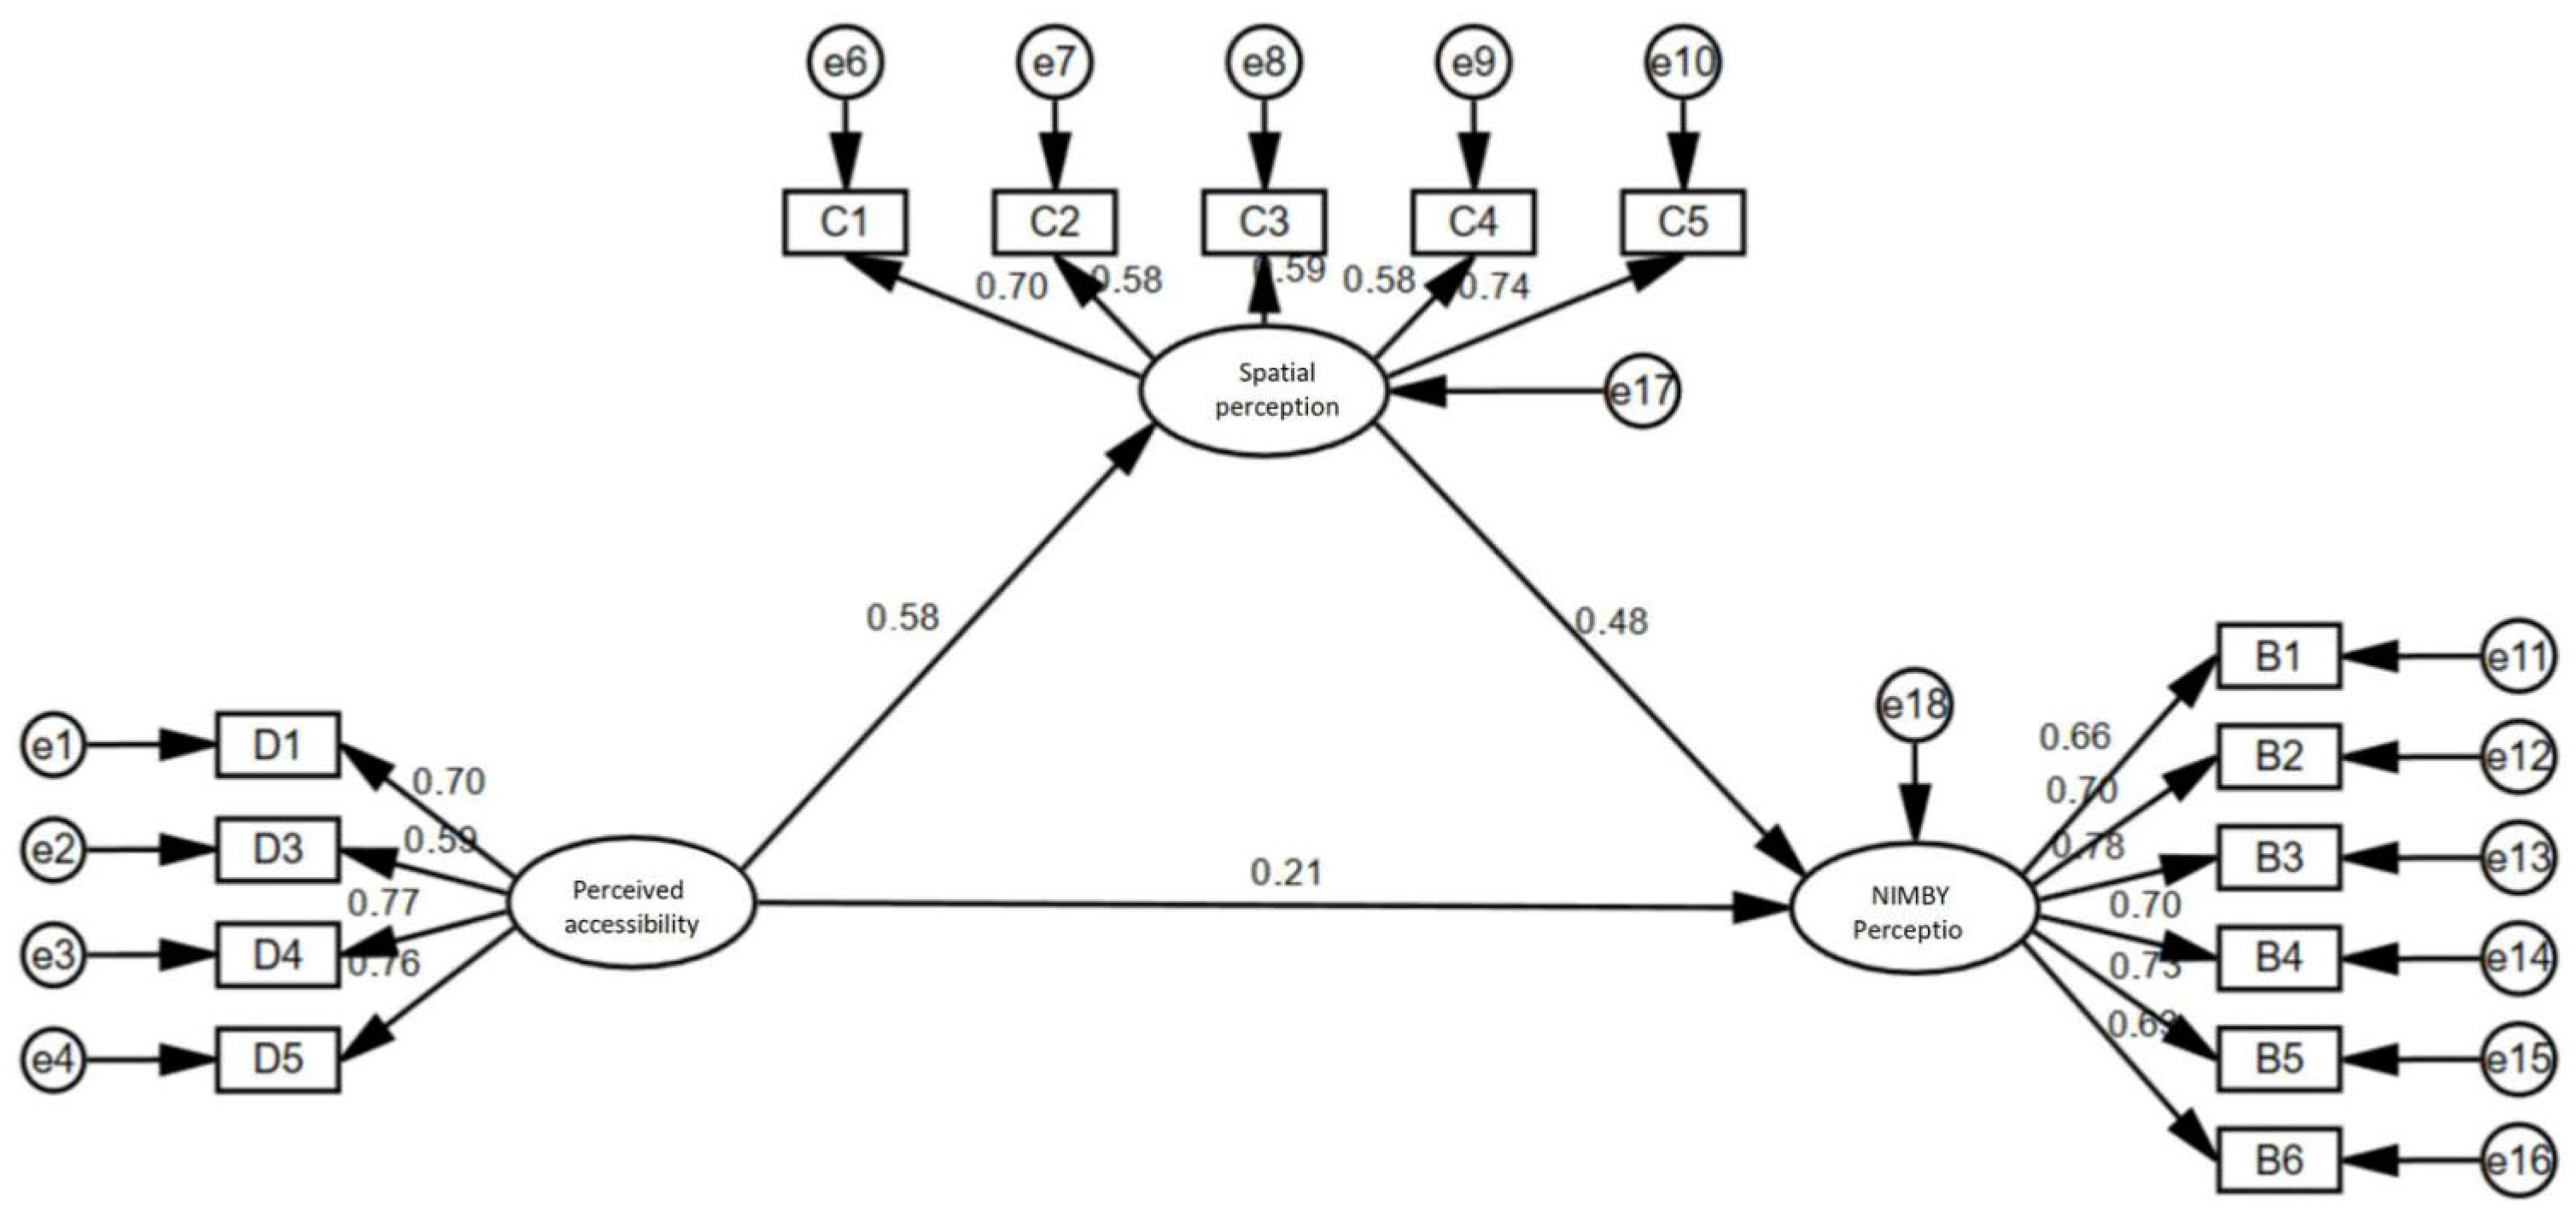
(1) Fit Evaluation of the Structural Equation Model for NIMBY Perception: The fit of the structural equation model for NIMBY perception is shown in Table 15, indicating that the model performs well.
As shown in the table, the CMIN/DF ratio is 2.033, which is below the standard value of 3, indicating that the model fits well overall. The RMSEA is 0.065, lower than the recommended standard of 0.08, suggesting that the model fits well. Additionally, the GFI, TFI, and CFI values are 0.907, 0.921, and 0.935, respectively, all exceeding 0.9 and meeting the excellent standard. Therefore, all fit indices comply with general standards, confirming the structural equation model’s satisfactory fit for further path analysis and mediation effect testing. The final structural equation model and model fit results are presented below (Figure 10):
(2) Path Analysis and Results of the Structural Equation Model for NIMBY Perception: Path analysis within the structural equation model for NIMBY perception revealed the influence relationships among variables (Table 16).
In path analysis, the standardized path coefficient between perceived accessibility and spatial perception was 0.565, with a critical ratio (C.R.) of 6.493 and a significance level of p < 0.05. This indicates that perceived accessibility significantly positively influences spatial perception. Subsequently, the effect of spatial perception on perceived NIMBY was analyzed. The standardized path coefficient was −0.163, with a C.R. value of −1.625 and a significance level of p = 0.104. Since p > 0.05, this path did not reach statistical significance, indicating that spatial perception does not significantly influence NIMBY perception. Finally, the effect of accessibility perception on NIMBY perception was examined. The standardized path coefficient was −0.007, with a C.R. value of −0.076 and a significance level of p = 0.939. Similarly, this failed to reach statistical significance, indicating that accessibility perception does not significantly influence NIMBY perception. Overall, accessibility perception exhibits a significant positive effect on spatial perception, while neither spatial perception nor accessibility perception demonstrates a significant relationship with NIMBY perception.
Mediating Effect Test of Structural Equation Model for NIMBY Perception: To validate the mediating role of spatial perception between accessibility perception and NIMBY perception, this study employed Bootstrap sampling to test the mediating effect (Table 17). The 95% confidence interval calculated via Bootstrap sampling indicates a significant effect if the interval does not include 0. If the total effect, indirect effect, and direct effect all hold, the mediation is partial mediation. If the total effect and indirect effect hold but the direct effect does not, the mediation is full mediation. It is evident that none of the effects (direct, indirect, or total) reached statistical significance. Therefore, we can conclude that spatial perception did not significantly mediate the relationship between accessibility perception and NIMBYism.
2.
Structural Equation Modeling Analysis of YIMBY Perception
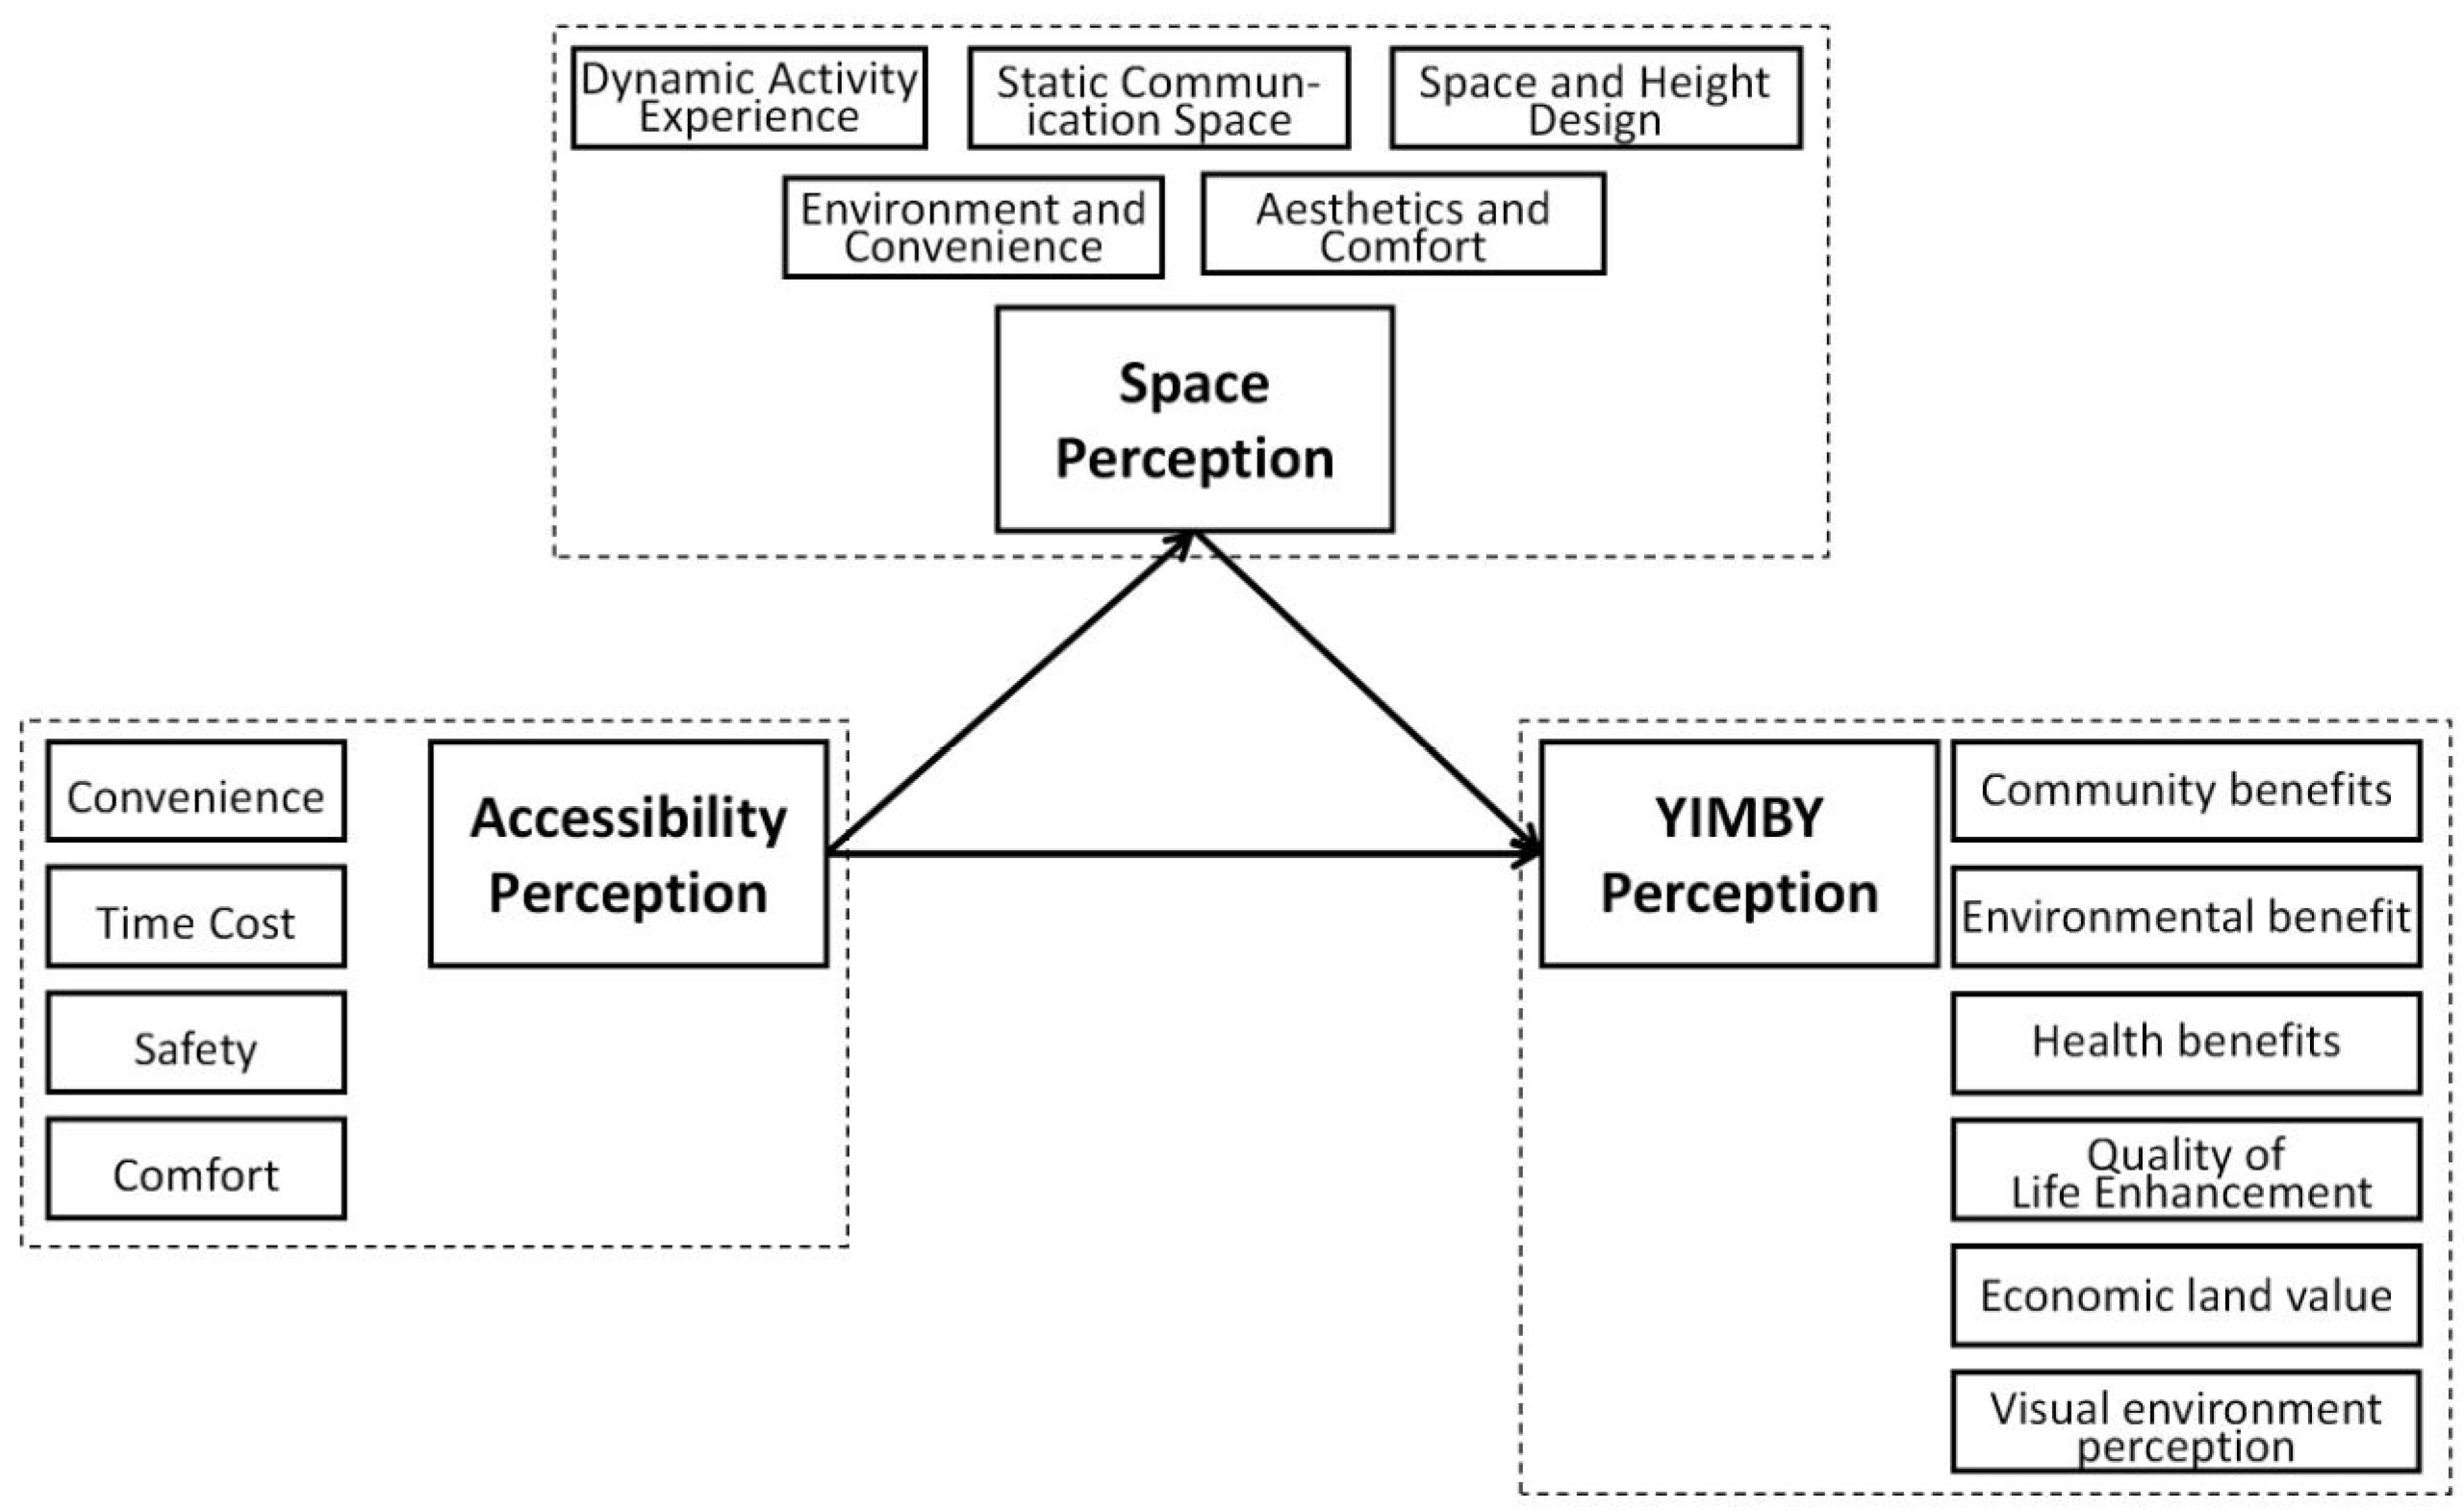
(1) Construction and Hypotheses of the Structural Equation Model for YIMBY Perception: Based on environmental behavioral theory and correlation analysis of neighborhood benefit perception, this study constructed a structural equation model for YIMBY perception to explore the relationships among perceived accessibility, spatial perception, and YIMBY perception (Figure 11):
Hypothesis 1:
Perceived accessibility directly influences YIMBY perception.
Hypothesis 2:
Spatial perception mediates the relationship between perceived accessibility and YIMBY perception.
Hypothesis 3:
Spatial perception has a significant direct effect on YIMBY perception.
This structural equation model incorporates three primary variables—perceived accessibility, spatial perception, and YIMBY perception—to validate how perceived accessibility and spatial perception influence YIMBY perception through mediating pathways.
(2) The structural equation model for neighborly perception employed multiple fit indices to ensure the model adequately captured the actual data. The initial model fit evaluation results, as shown in (Table 18), present the preliminary fitting outcomes.
As shown in Table 18, the CMI/DF value is 2.953, which is below 3 and meets the recommended standard; however, the RMSEA is 0.089, exceeding the benchmark value of 0.08, indicating poor model fit. Additionally, the GFI (0.875), TFI (0.855), and CFI (0.880) values all fall below 0.9, failing to meet the criteria for excellent fit. Based on these results, the initial model’s fit does not reach an ideal level, necessitating model refinement.
As shown in the table, the CMIN/DF value is 2.953, which is less than 3 and meets the recommended standard; however, the RMSEA is 0.089, exceeding the benchmark value of 0.08, indicating poor model fit. Additionally, the GFI (0.875), TFI (0.855), and CFI (0.880) values all fall below 0.9, failing to meet the criteria for excellent fit. Based on these results, the initial model’s fit did not reach an ideal level, necessitating model modification. To improve model fit, the model was revised using the Modified Index (MI). Following the modifications, the final model’s fit improved significantly, with the specific results presented in (Figure 12) and (Table 19).
(1) Path analysis and results of the structural equation model for YIMBY perceptions (Table 20): The path coefficient for the influence of accessibility perception on spatial perception was 0.413, with a standardized path coefficient of 0.578 and a C.R. value of 6.608 (p < 0.05). This indicates that accessibility perception has a significant positive effect on spatial perception. Influence of spatial perception on perceived neighborhood benefits: Path coefficient = 0.448, standardized path coefficient = 0.522, C.R. value = 4.822, p < 0.05. This indicates that spatial perception exerts a significant positive influence on perceived neighborhood benefits. Perceived accessibility on perceived YIMBYism: Path coefficient = 0.118, standardized path coefficient = 0.193, C.R. value = 2.149, p = 0.032, indicating that perceived accessibility has a significant positive effect on perceived YIMBY.
(2) Mediating Effect Test of the Structural Equation Model for YIMBY Perception: The mediating effect was tested using Bootstrap sampling. The 95% confidence interval calculated via Bootstrap sampling indicates a significant effect if the interval does not include 0. If the total effect, indirect effect, and direct effect all hold, partial mediation occurs. If the total effect and indirect effect hold but the direct effect does not, full mediation occurs. If the total effect, indirect effect, and direct effect are all significant, partial mediation occurs. If the total effect and indirect effect are significant but the direct effect is not, full mediation occurs. According to mediation testing criteria, if the total effect and indirect effect are significant but the direct effect is insignificant, this indicates full mediation. Therefore, spatial perception significantly mediates the effect of accessibility perception on perceived proximity benefits.

2.5.5. Construction and Feature Analysis of the YIMBY and NIMBY Integrated Perception Scoring Model

  • Score System Construction:
(1) To comprehensively evaluate residents’ overall perceptions of water purification plants and their surrounding environments, this study proposes a scoring formula: Pro-Neighbor Perception divided by NIMBY Perception. The following formula calculates a composite perception ratio by dividing Pro-Neighbor Perception (positive externalities) by NIMBY Perception (negative externalities):
YIMBY   and   NIMBY   Perception = YIMBY   perception NIMBY   perception
The core function of this formula lies in quantifying residents’ acceptance of public facilities through the ratio of YIMBY to NIMBY perceptions. When this ratio exceeds 1, it indicates that the community’s positive impacts outweigh negative ones. Higher values signify stronger resident endorsement, while ratios below 1 warrant closer examination of the causes behind resident resistance. Dividing the YIMBY perception score by the NIMBY score avoids potential data distortion from direct subtraction. This approach also enables comparisons between different areas surrounding multi-functional water purification plants through standardized data processing.
(2) We verify the impact of accessibility on the integrated perception of YIMBY and NIMBY based on structural equation modeling. This study reconstructs the SEM model with the scores of YIMBY perception/NIMBY perception (integrated perception of YIMBY and NIMBY) as the dependent variable. It focuses on analyzing the influence of spatial perception and accessibility perception on this integrated perception, revealing its underlying mechanisms to provide theoretical support for policy formulation.
(3) We establish a structural equation model and hypotheses for the integrated perception of YIMBY and NIMBY (Figure 13) based on the influence of environmental factors on residents’ perceptions.
Hypothesis 1:
Perceived accessibility exerts a direct effect on the integrated perception of YIMBY and NIMBY.
Hypothesis 2:
Spatial perception mediates the relationship between perceived accessibility and the composite perception of YIMBY and NIMBY.
Hypothesis 3:
Spatial perception exerts a significant direct effect on the composite perception of YIMBY and NIMBY.
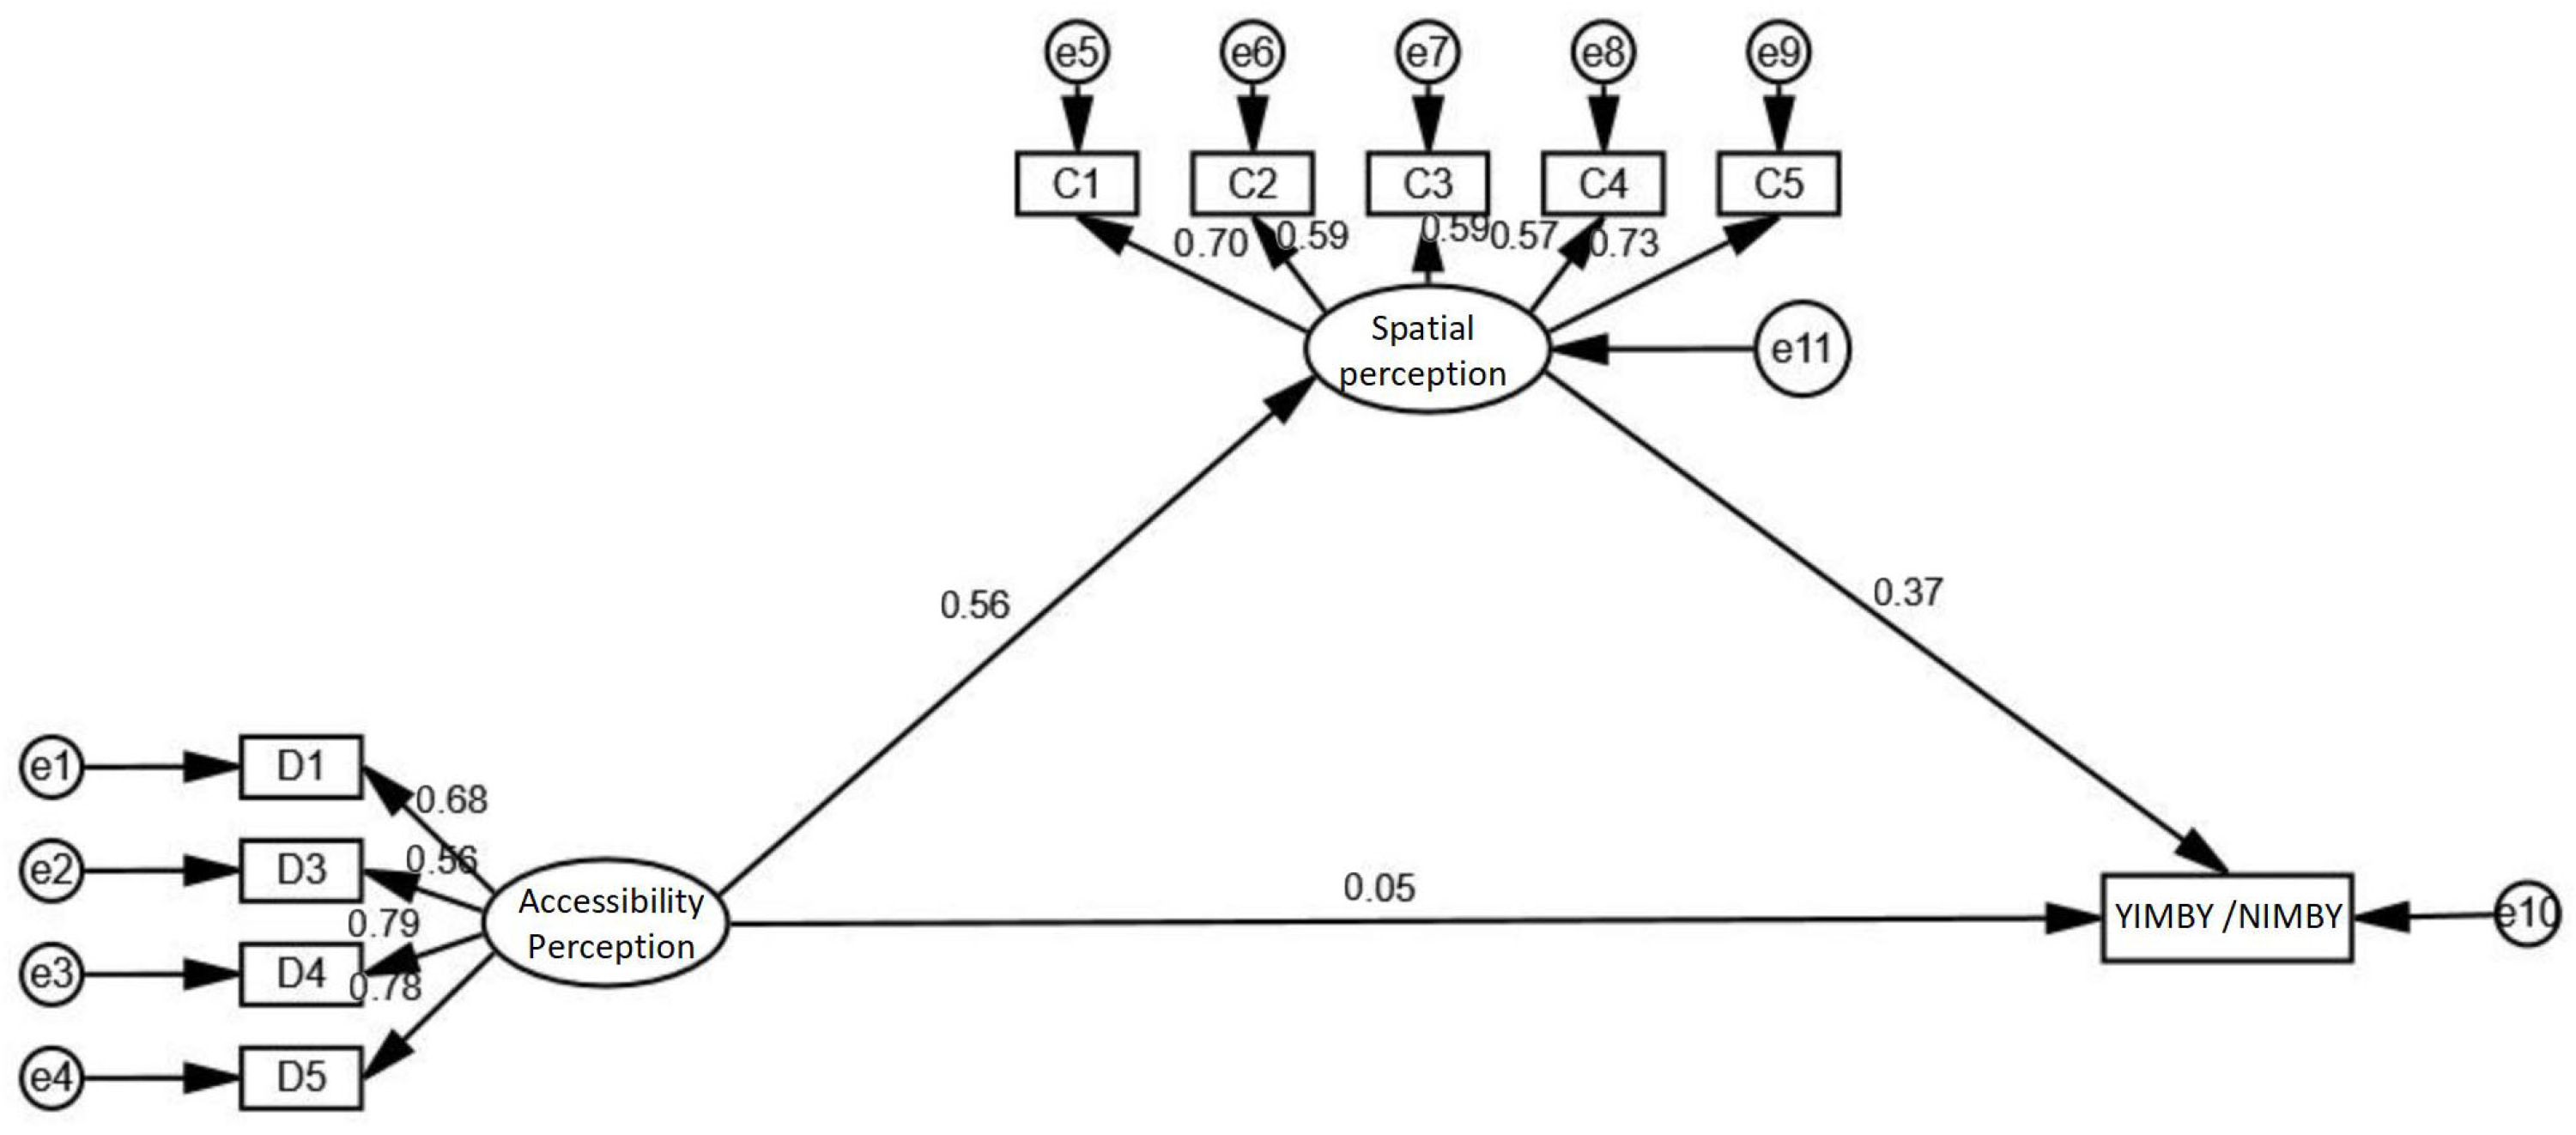
(4) A structural equation model fit assessment is performed for the integrated perception of YIMBY and NIMBY. In this study, multiple fit indices were employed to evaluate the structural equation model fit. As shown in Table 21, the CMIN/DF value was 2.5473, below the threshold of 3, while the RMSEA value was 0.079, below 0.08. Additionally, the GFI (0.931), TFI (0.902), and CFI (0.928) values all exceeded 0.9, meeting the excellent standard. The model can be further utilized for path analysis and mediation effect testing. The final structural equation model and model fit results are shown in Figure 14.
(5) Path analysis and the results of the structural equation model for integrated perception of NIMBY and YIMBY reveal the influence relationships among variables (Table 22). The standardized path coefficient for the effect of accessibility perception on spatial perception is 0.563, with a C.R. value of 6.234 and p < 0.05, indicating that accessibility perception significantly positively influences spatial perception. The effect of spatial perception on the composite perception of YIMBY and NIMBY: The standardized path coefficient was 0.368, with a C.R. value of 3.974 and p < 0.05. This indicates that spatial perception exerts a significant positive influence on the composite perception of YIMBY and NIMBY. Standardized path coefficient: 0.053; C.R. value: 0.607; p = 0.544. This indicates that perceived accessibility does not exert a significant influence on NIMBY and YIMBY perceptions. In summary, perceived accessibility significantly and positively influences spatial perception but does not directly affect composite perception. Conversely, spatial perception significantly and positively influences composite perception.
(6) A mediating effect test of the structural equation model for YIMBY and NIMBY perceptions was conducted. To verify the mediating role of spatial perception between accessibility perception and NIMBY perception, the mediating effect was tested using Bootstrap sampling (Table 23). As demonstrated in the aforementioned study, spatial perception significantly and fully mediated the influence of accessibility perception on the combined perception of YIMBY and NIMBY.
2.
Structural Equation Modeling Analysis of Integrated Perceptions of YIMBY and NIMBY
Previous findings revealed that spatial perception fully mediated the influence of accessibility perception on perceived neighborhood benefits, yet did not significantly mediate between accessibility perception and perceived neighborhood disadvantages. However, when neighborhood benefits and disadvantages were considered holistically—by constructing an integrated perception metric of neighborhood benefits divided by disadvantages—the mediating effect of spatial perception reemerged. This indicates that the composite perception of NIMBY and YIMBY better reflects residents’ genuine attitudes toward facilities, with spatial perception serving as a crucial bridge in this process. It also demonstrates that the composite perception formula—YIMBY divided by NIMBY—holds not only theoretical significance, but also provides essential guidance for optimizing built environments along pathways.
3.
Distinct Perception Patterns of YIMBY and NIMBY Among Different Water Purification Plants
Based on the comparative analysis of the YIMBY-to-NIMBY perception ratios for the five water treatment plants in the table, the following comparisons can be drawn (Table 24): In terms of average values, the Honghu Water Purification Plant exhibits the highest YIMBY-to-NIMBY ratio at 1.42, indicating that positive perceptions among residents in this area significantly outweigh negative ones. Conversely, the Buji Phase 1 Water Purification Plant recorded the lowest YIMBY-to-NIMBY ratio at 1.29, suggesting that positive and negative perceptions are roughly balanced in this area. Regarding standard deviation, the Banxuegang Water Purification Plant exhibited the highest standard deviation at 0.33, indicating significant variation in residents’ overall perceptions of both positive and negative impacts. Conversely, Buji Phase 1 Water Purification Plant exhibited the smallest standard deviation at 0.22, indicating relatively consistent perceptions among residents. Regarding maximum and minimum values, the Honghu Water Purification Plant recorded a maximum of 2.09 and a minimum of 0.83, reflecting substantial perception variation within the area. In contrast, the Futian Water Purification Plant exhibited a maximum value of 1.72 and a minimum value of 1.00, with values more concentrated than other regions’ extremes, indicating smaller variations in residents’ composite perceptions of YIMBY and NIMBY effects.
Descriptive analysis of the YIMBY-to-NIMBY ratio reveals significant variations in resident perceptions across different water purification plants. These differences provide a foundation for subsequent analysis of the nonlinear relationship between built environment and composite YIMBY and NIMBY perceptions. For example, the ratio is lowest in Phase 1 of Buji (1.29), indicating that residents’ positive and negative perceptions are roughly equal, while the ratio is highest in Honghu (1.42), where positive perceptions dominate. These variations validate that built environment factors may influence resident perceptions differently across regions. They also suggest research limitations: optimizing the built environment may affect residents’ perceptions of NIMBY and YIMBY through nonlinear pathways. This necessitates verifying whether a threshold effect exists—where significant shifts in perception occur only after environmental improvements reach a certain level.

3. Results

3.1. Nonlinear Relationship Between YIMBY and NIMBY Perceptions and the Built Environment

Based on the established research framework, this study adopts a holistic-to-local, general-to-specific approach. It begins with a comprehensive perspective, employing a random forest model to conduct an in-depth analysis of the nonlinear relationship between built environment factors and park usage activity levels.

3.1.1. The Relative Importance of Built Environment Indicators Influencing Residents’ Composite Perceptions of YIMBY and NIMBY

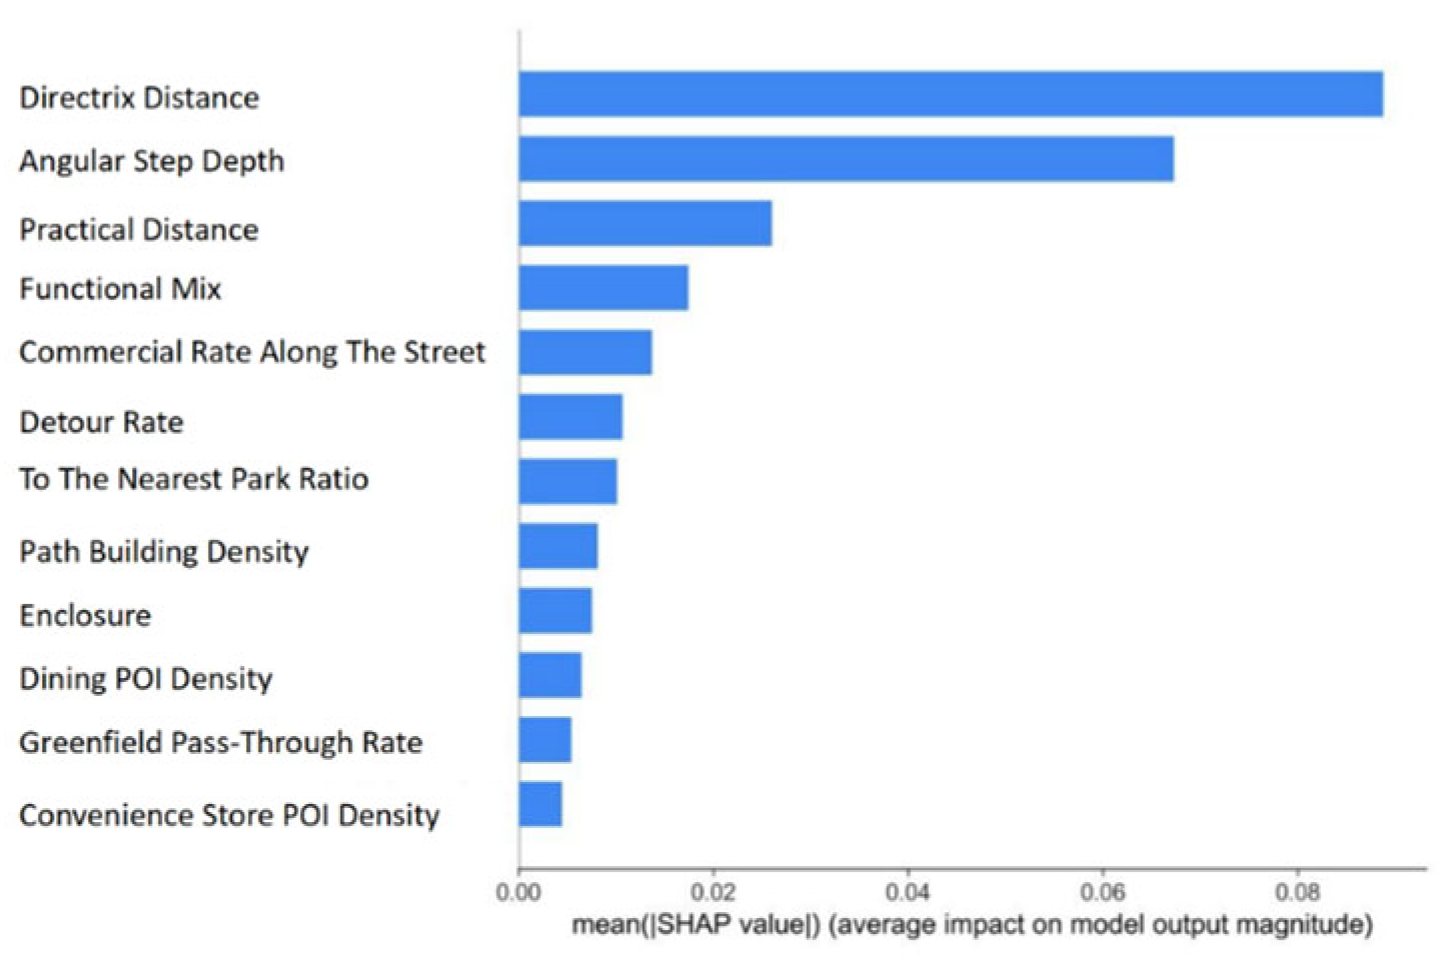
The SHAP explanation framework provides researchers with an effective method, as shown in (Figure 15 and Figure 16). The horizontal axis represents the mean absolute value of the SHAP value for each feature. A higher value indicates a more significant contribution of that feature to the model output. Analysis reveals the following: (1) Regarding spatial layout and accessibility metrics, among the indicators (angular step depth, straight-line distance, actual distance, and detour rate), importance is ranked as follows: straight-line distance > angular step depth > actual distance > detour rate. Optimizing the road network design to reduce detours and path turning angles can effectively enhance residents’ positive evaluations of the park. (2) Regarding environmental density and functional mix indicators, among the metrics (enclosure degree, path building density, functional mix, and street-front commercial rate), the order of importance is as follows: functional mix > street-front commercial rate > path building density > enclosure degree. Functional diversity indicates that moderate variety enhances residents’ positive perceptions of parks above water purification plants. Pathway building density and enclosure rate may boost overall neighborhood benefits/naysayers’ perceptions when either is excessively high or low, requiring context-specific analysis. (3) Facility and Service Indicators reveal the following ranking by importance: Proximity to Nearest Park > Restaurant POI Density > Green Space Accessibility > Convenience Store POI Density. Analysis of convenience store POI density and food and beverage POI density indicates that higher food density not only enhances neighborhood vitality, but also provides residents with more social venues. Analysis of green space pass-by rate shows that high green coverage improves residents’ path comfort and strengthens their positive perceptions.

3.1.2. Analysis of the Correlated Role of Built Environment Indicators in Residents’ YIMBY and NIMBY Perceptions

  • Spatial Layout and Accessibility Metrics
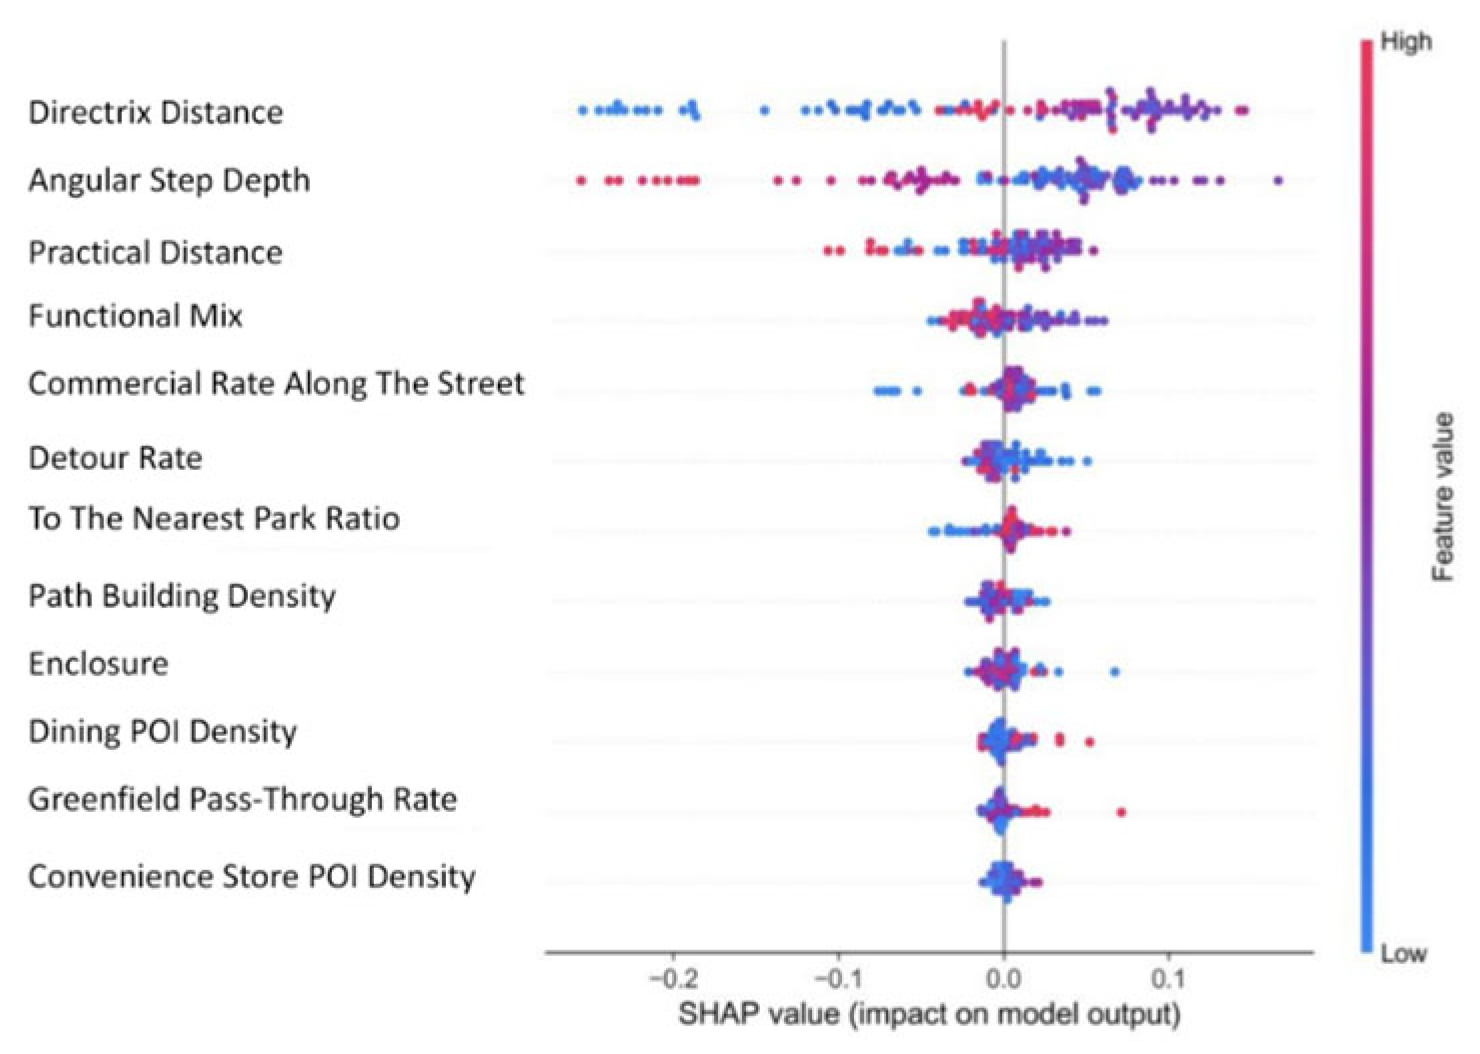
The SHAP model reveals complex nonlinear relationships between variables and the dependent variable, as well as potential threshold effects. (Figure 17) Based on the local explanatory plots for the inter-location and accessibility indicator variables, the following can be observed: (1) Areas within 0–500 m (straight-line distance) or 0–700 m (actual distance) from the water treatment plant’s upper park require focused efforts to mitigate NIMBY effects. For zones exceeding 1200 m (straight-line distance) or 1500 m (actual distance), prioritize enhancing accessibility to the upper park to strengthen perceived benefits. (3) Angular stride lengths between 0 and 3 m can enhance residents’ clear perception of paths and improve perceived neighborhood benefits. When turning angles exceed 3 degrees, the pedestrian network should be optimized to enhance path accessibility. Regarding detour rate indicators, efforts should focus on reducing detour rates and improving the accessibility of paths from residential areas to the park above the water purification plant.
2.
Environmental Density and Functional Mix Index
The local explanatory plot for the Environmental Density and Functional Mix Index variable is shown in (Figure 18). (1) Based on the above explanatory analysis, the functional mix in the vicinity of the water purification plant should be maintained around 0.2, prioritizing residential and commercial functions with industrial land use as a secondary component. Controlling the street-front commercial ratio around 0.1 is appropriate. An excessively low commercial proportion may diminish the area’s vitality and appeal, negatively impacting residents’ positive perceptions. Conversely, moderately increasing the street-front commercial share can enhance regional dynamism and improve residents’ positive environmental experiences.
3.
Facility and Service Indicators
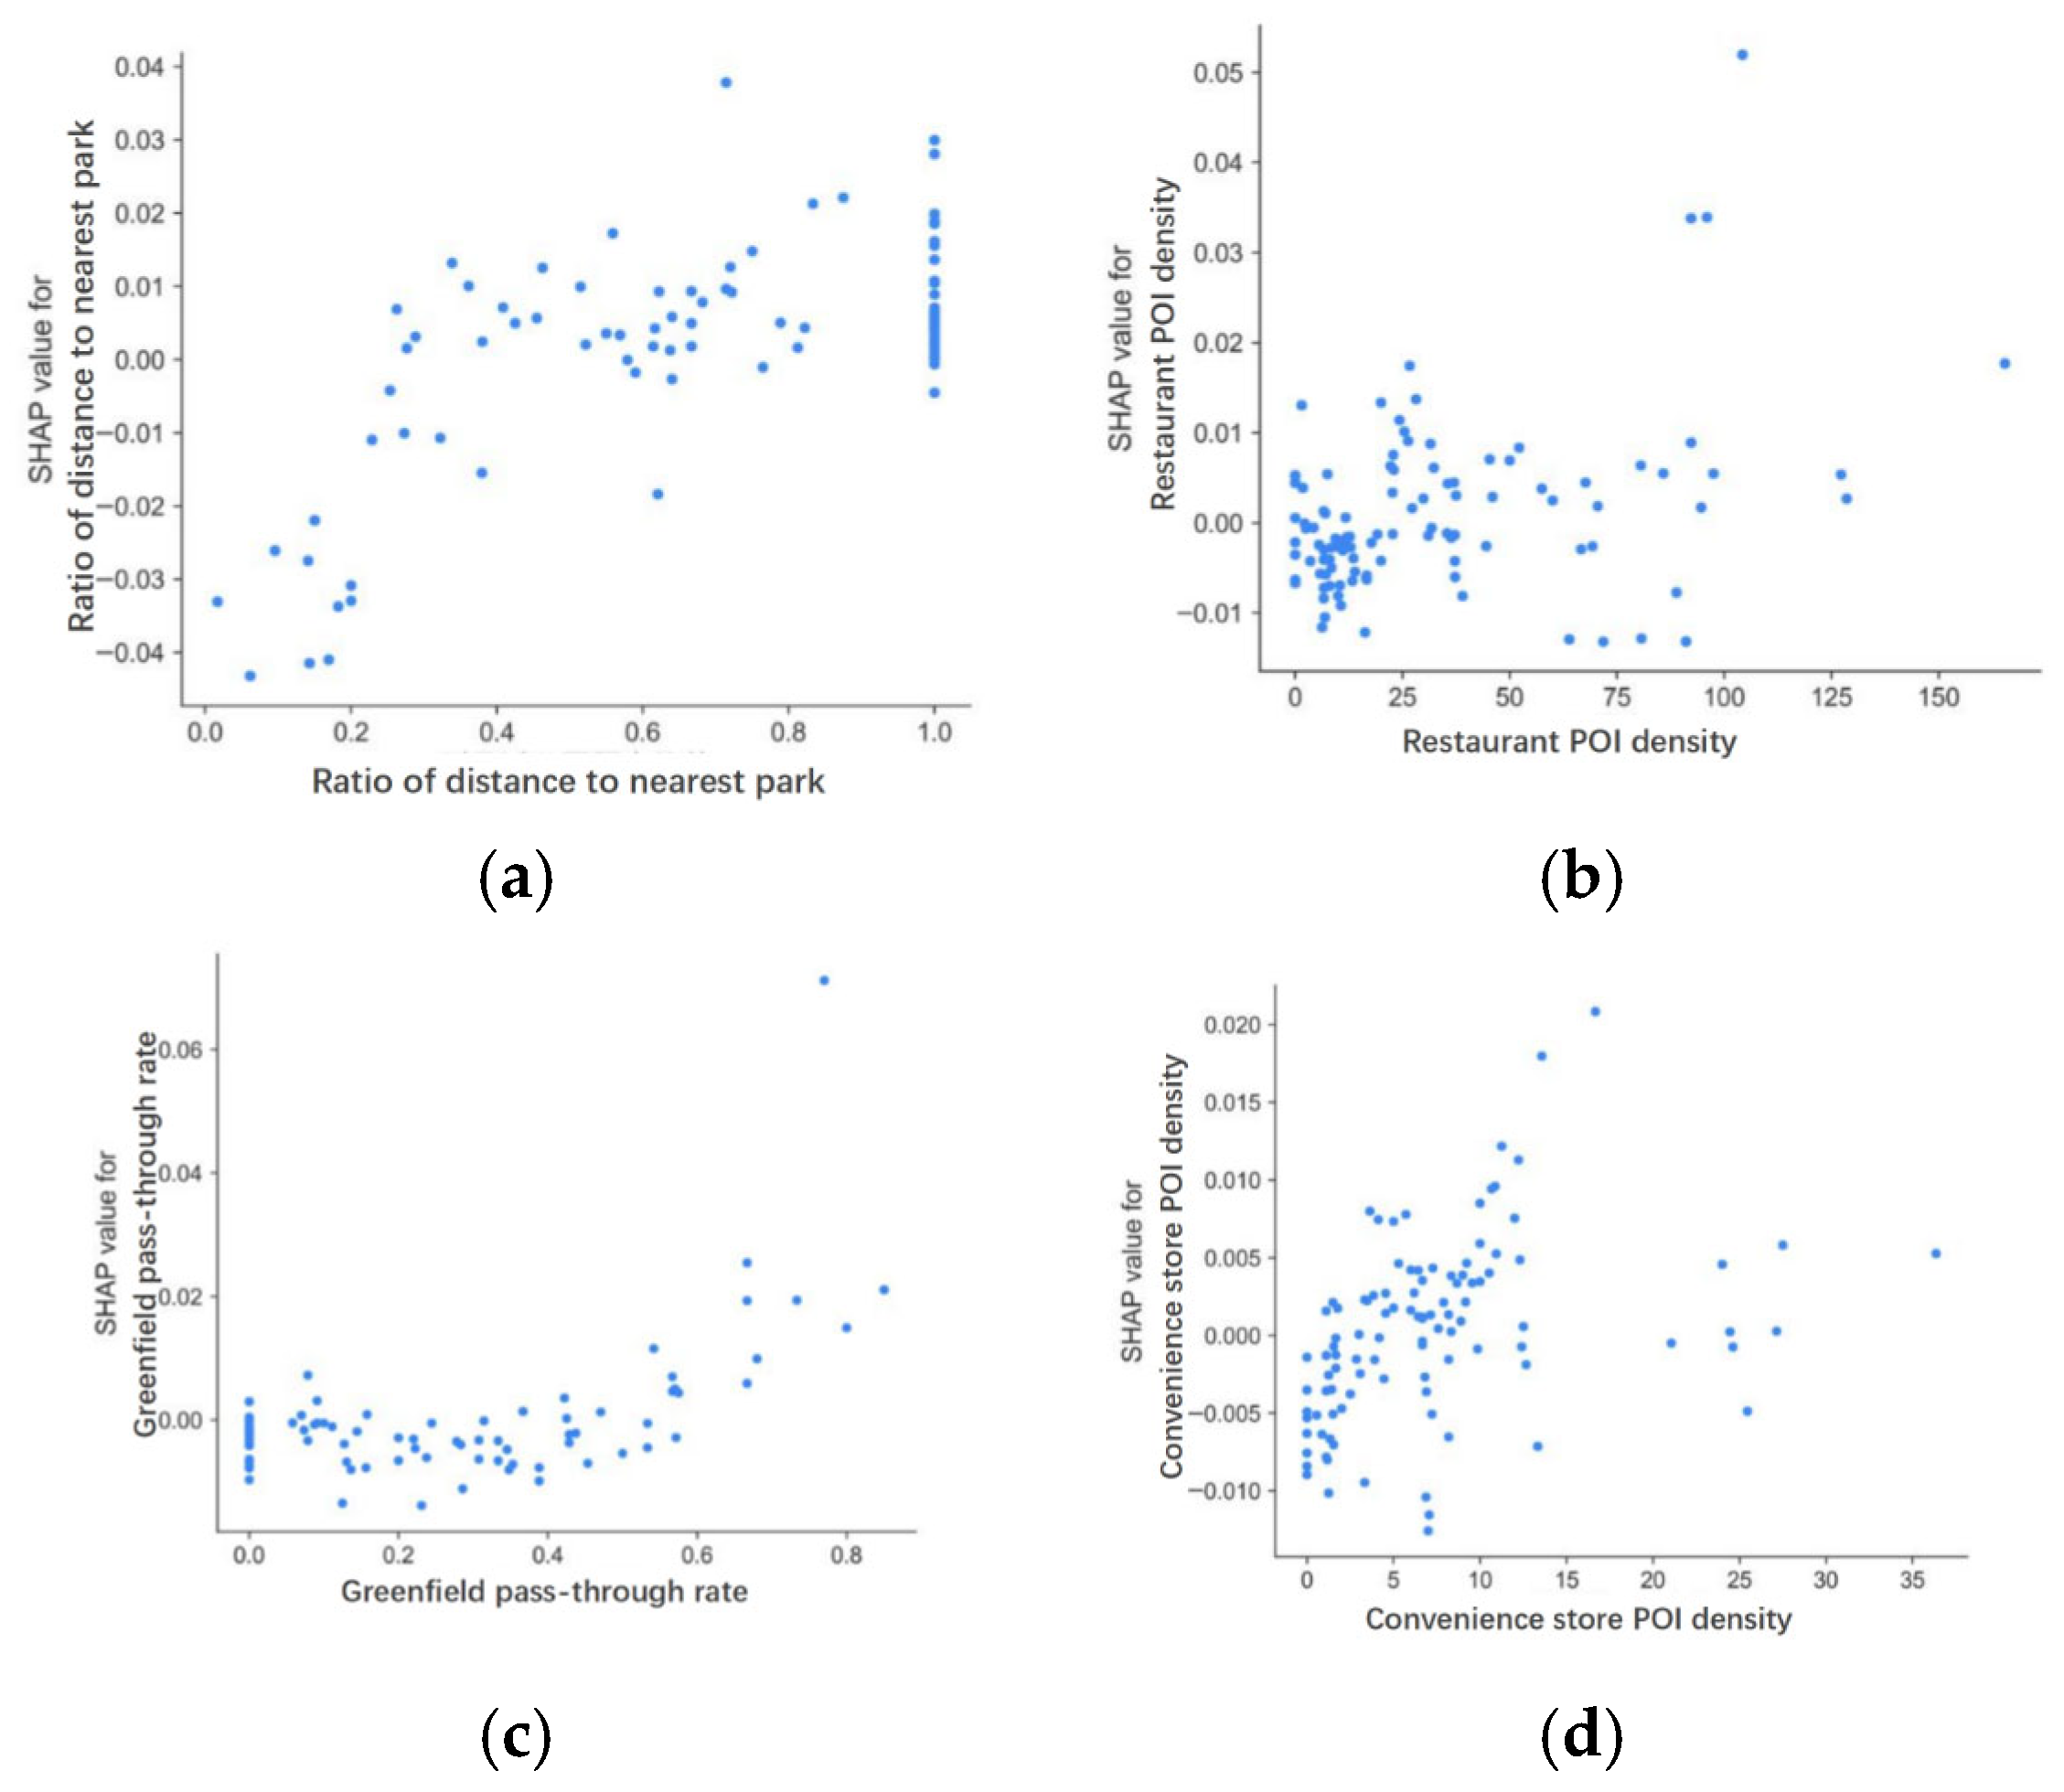
The local explanatory diagram for facility and service indicator variables is shown in (Figure 19).
Analysis of the above diagram reveals that when residents are closer to the water purification plant’s upper park than to other parks, they are more inclined to use the water purification plant’s upper park, thereby enhancing their overall perception of neighborhood benefits and neighborhood avoidance. Therefore, it is necessary to optimize the layout of urban parks and improve the accessibility of the water purification plant’s upper park. When the density of food service POIs exceeds 25 establishments per kilometer and convenience store POI density surpasses 5 establishments per kilometer, it not only boosts neighborhood vitality, but also enriches activity options along residents’ routes to the water purification plant park, thereby enhancing overall perceptions. Green space pass-through rate correlates positively with residents’ overall perception. In planning areas surrounding water purification plants, efforts should maximize the green space pass-through rate (>0.4) for residents accessing parks above the plants. This improves environmental quality and enhances residents’ travel experience and willingness to visit.

3.1.3. Interaction Analysis of Different Built Environment Indicators on Residents’ Comprehensive Perceptions of YIMBY and NIMBY

(1) The study calculates the interaction between linear distance (the most significant feature variable) and other built environment factors using SHAP Interaction Values, identifying influential variable combinations for in-depth analysis. The interaction analysis between spatial layout and accessibility indicators and straight-line distance is shown in (Figure 20). In the interaction between detour rate and straight-line distance, the SHAP value decreases rapidly as the detour rate increases. Furthermore, when the straight-line distance is less than 500 m, the SHAP value declines even more sharply with rising detour rates. Therefore, in short-distance areas, efforts should focus on minimizing detour rates and designing direct paths to enhance travel efficiency. Conversely, in long-distance areas, the inconvenience caused by detours can be mitigated by increasing public amenities and landscape nodes.
(2) The interaction analysis between environmental density, functional mix indicators, and straight-line distance is shown in Figure 21: the interaction analysis diagram of street-front commercial ratio with straight-line distance (a) indicates that within short distances, a high proportion of street-front commercial space may have negative impacts, whereas at greater distances, commercial facilities may exert more positive effects. The interaction analysis between enclosure level and linear distance (b) indicates that at the enclosure level, priority should be given to enhancing enclosure in nearby areas to reduce NIMBY perceptions. In distant areas, enclosure should be moderately controlled to maintain spatial openness and attractiveness. The interaction analysis between path building density and linear distance (c) suggests that in areas farther from water purification plants, path building density should be appropriately increased to promote functional mixing and enhance spatial quality.
(3) The interaction between facility/service indicators and straight-line distance and convenience store POI density vs. straight-line distance in Figure 22 (a) reveals that in more distant areas (>1000 m), increasing convenience store density yields a more pronounced effect on enhancing perceived neighborhood benefits. Analysis of the interaction between food and beverage POI density and straight-line distance (b) indicates that urban functional planning should prioritize increasing food and beverage facilities along the path to the water purification plant’s upper park in more distant areas. Analysis of the interaction between green space pass rate and straight-line distance (c) reveals that the perceived impact varies significantly depending on the distance from the water purification plant. The data indicates that in close-proximity areas, green space pass-through rates should be controlled to prevent excessive greening from diminishing the sense of enclosure. Conversely, in distant areas, green space density can be appropriately increased to enhance residents’ perception of neighborhood benefits.

3.2. Analysis of the Relationship Between YIMBY and NIMBY Perceptions and Road Network Structure Types

3.2.1. Spatial Syntax Analysis and Road Network Structure Classification

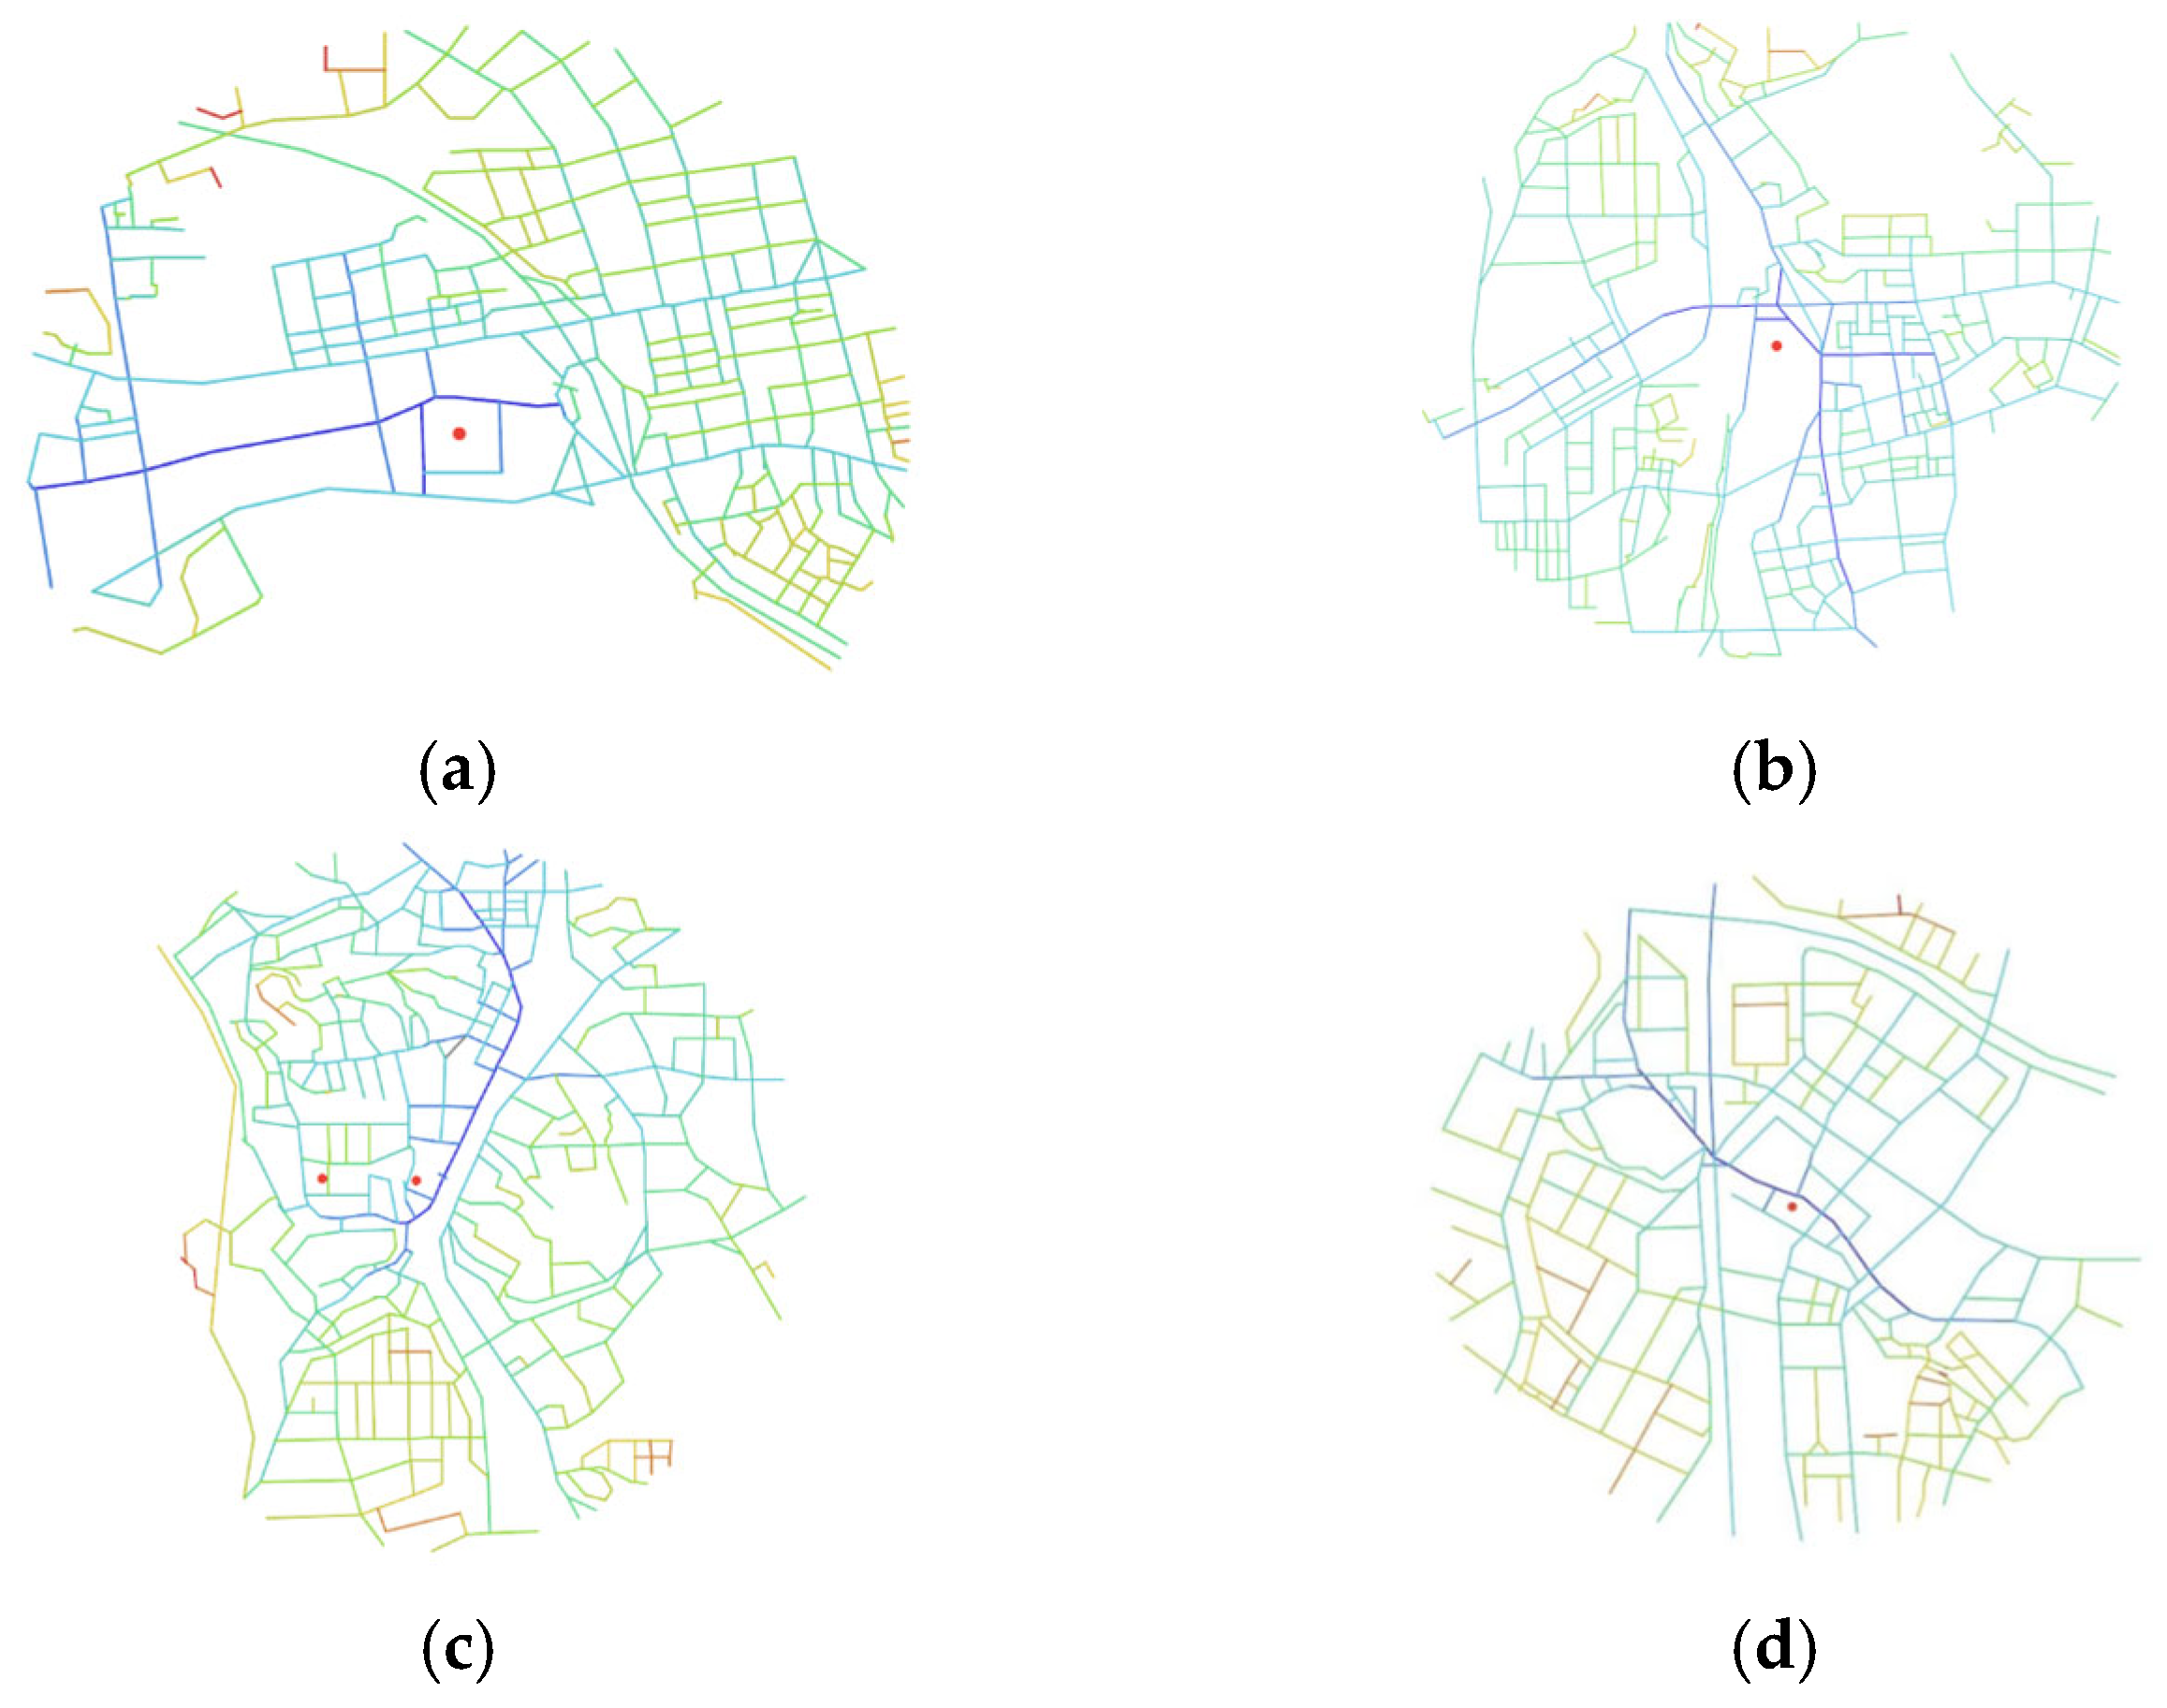
To further analyze how different road network structure types in areas surrounding water treatment plants influence residents’ YIMBY and NIMBY perceptions, the study calculated the Angular Step Depth values around water treatment plants using Depthmap. By integrating the spatial characteristics of different road network types, the road network structure within the study area was classified into multiple categories to better understand its impact on residents’ perceptions. The angular step depth maps of the road networks surrounding water treatment plants are shown in (Figure 23).
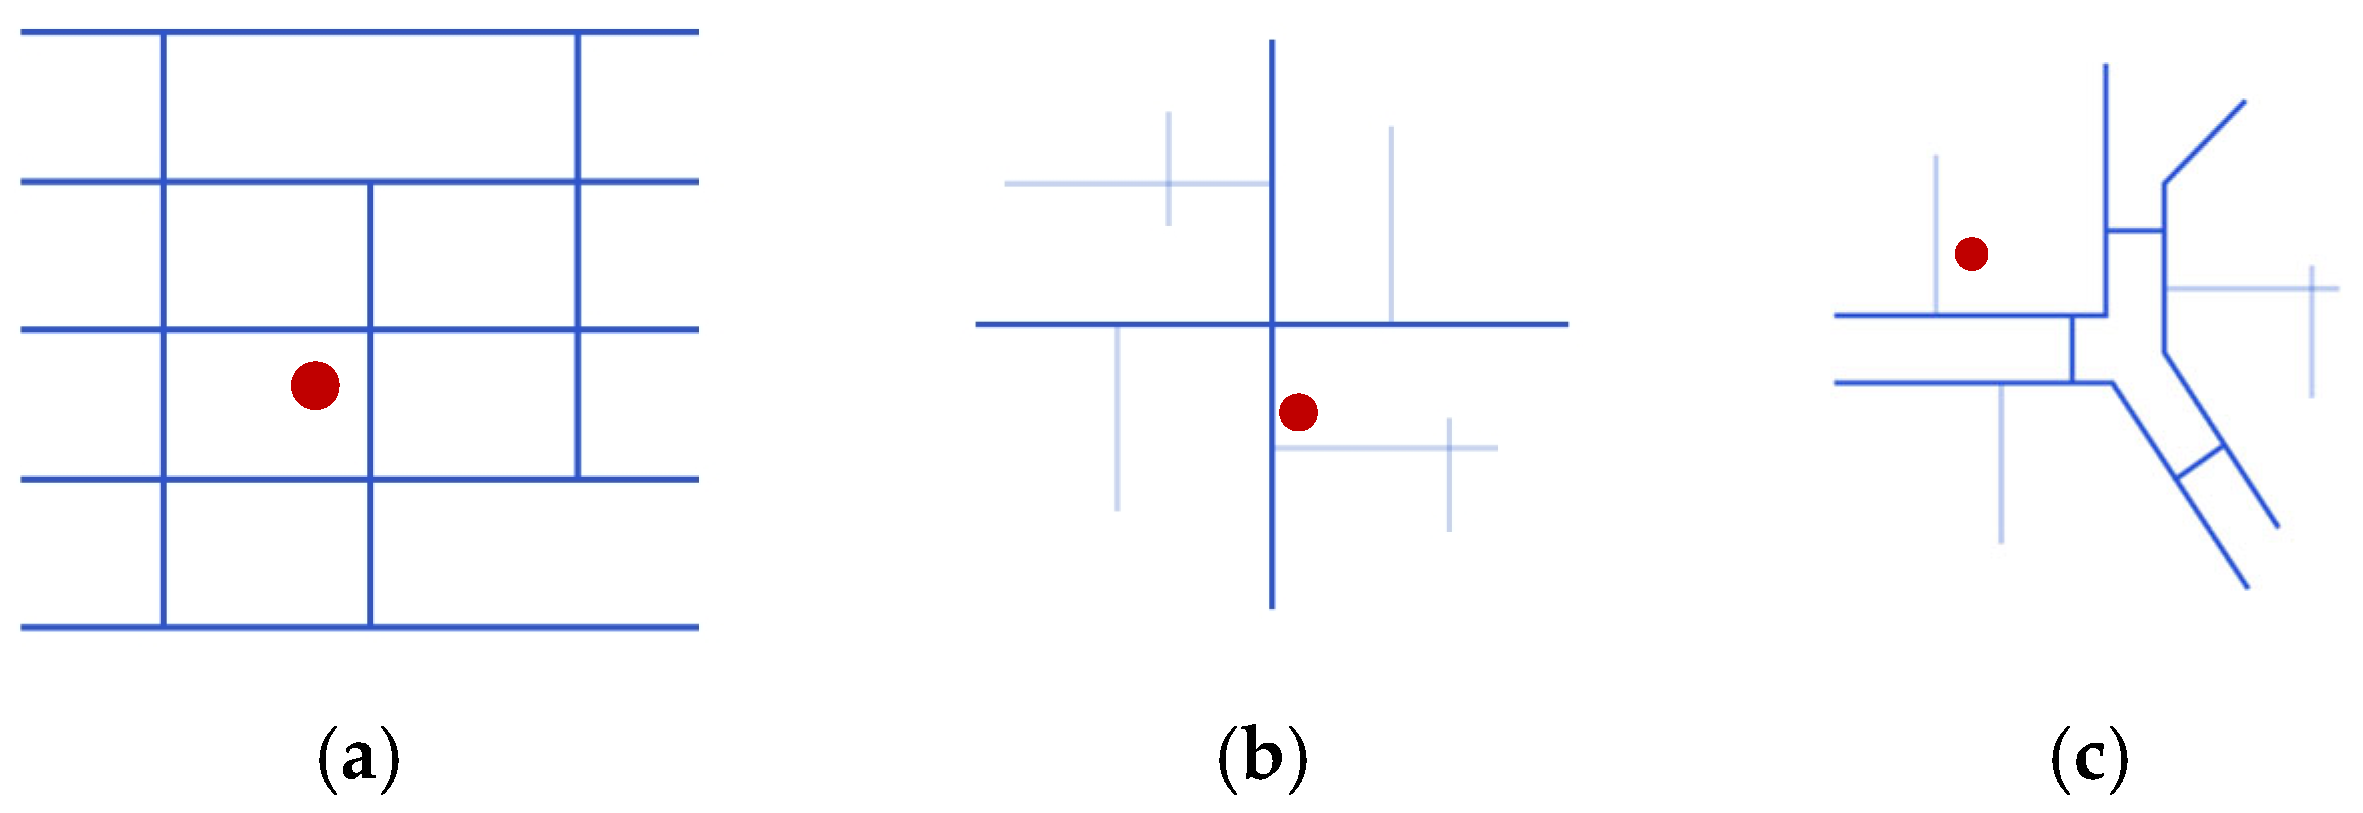
Based on the angular step depth spatial syntax network diagram of the water purification plant road network shown above, the structural forms of road networks near water purification plants can be categorized into the following types (Figure 24). (1) Grid-type Road Network: Futian Water Purification Plant. Spatial syntax analysis indicates this network possesses high accessibility and adaptability, effectively meeting the functional demands of urban development. (2) Radial Network: Spatial syntax analysis indicates that future urban planning and layout design for the Honghu and Banxuegang Water Purification Plants should consider the characteristics of this network structure. This will further optimize accessibility in central areas while addressing potential traffic congestion issues. (3) Fragmented Network: Spatial syntax analysis indicates that future planning for the Buji Water Purification Plant should focus on optimizing road connectivity between different zones. Enhancing the overall network’s cohesion will improve travel convenience and comfort for residents.

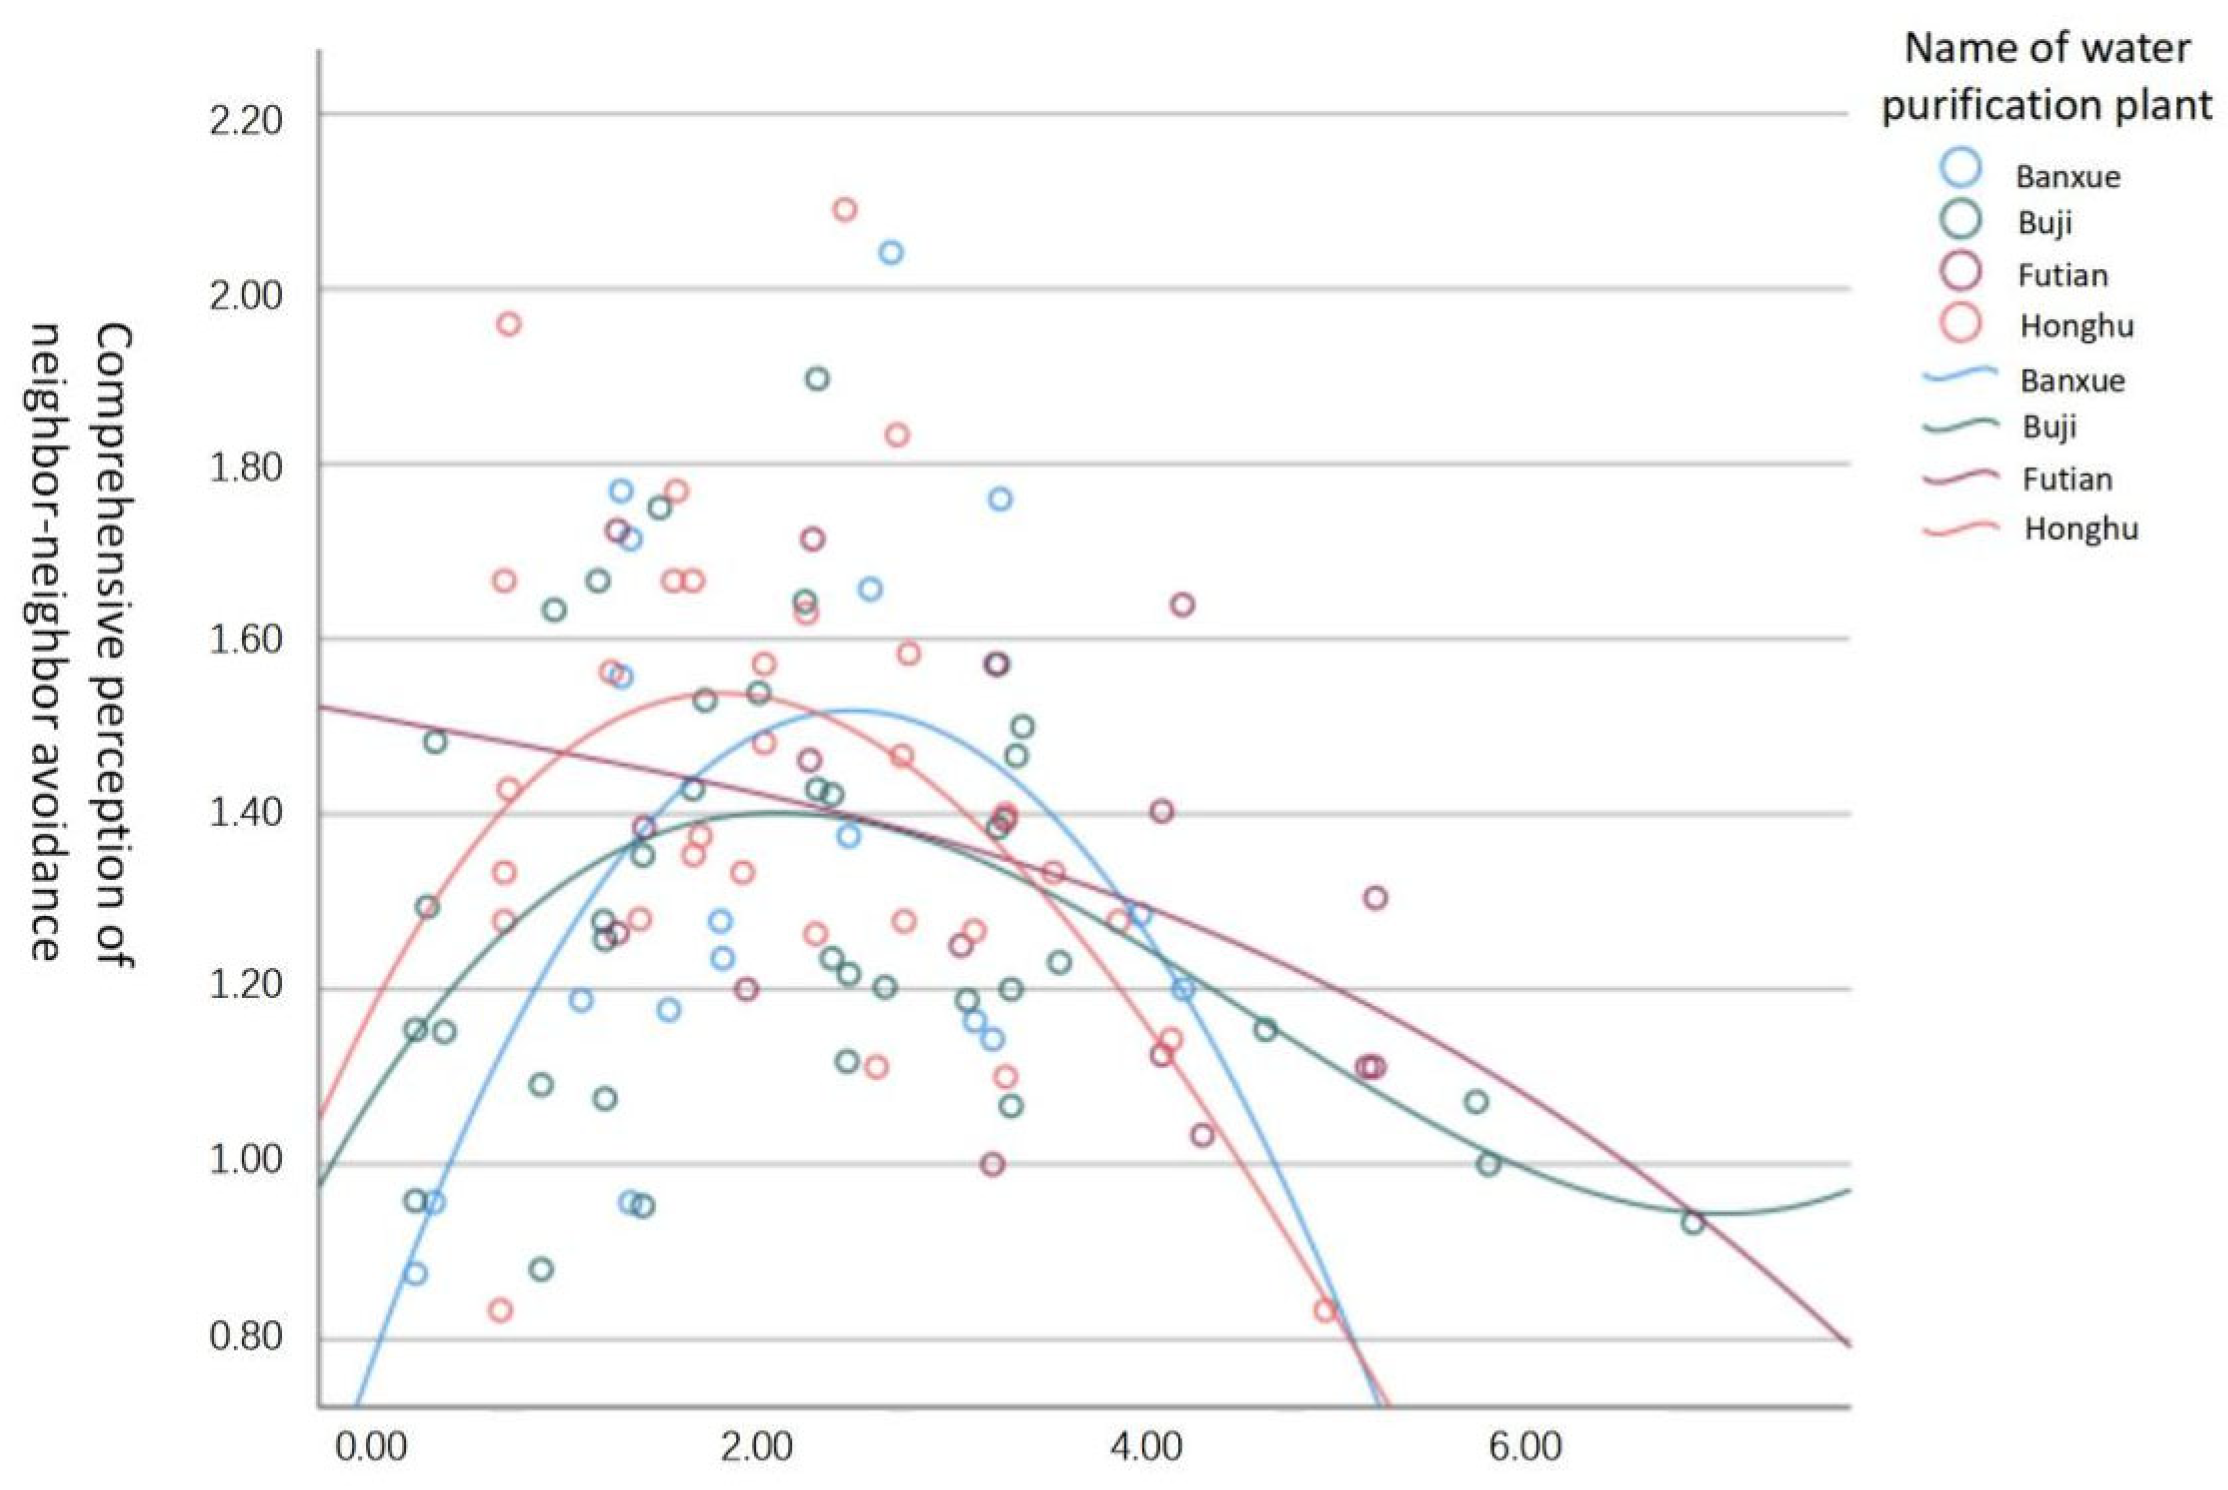
3.2.2. YIMBY and NIMBY Perception Synthesis and Angular Step Depth Fitting Analysis

By summarizing the road network types surrounding five water purification plants, scatter plot analysis was conducted using SPSS. Regression curve fitting was then applied to examine the relationship between YIMBY and NIMBY perception synthesis and road network angular step depth (Figure 25). Through graphical representations and curve models, we examined how different road network structures around water purification plants influence residents’ YIMBY and NIMBY perceptions. By analyzing the corresponding scatter plot fitting curves for three road network types (grid-type, radial-type, fragmented-type) and their effects on comprehensive perception, we determined how road network structure impacts residents’ YIMBY and NIMBY perceptions. (1) Grid-type road networks exhibit relatively balanced YIMBY and NIMBY perceptions among residents; (2) radial-type networks generate stronger neighborhood benefits perceptions in central areas but weaker perceptions in peripheral zones; and (3) fragmented networks, due to poor connectivity, result in overall lower levels of both YIMBY and NIMBY perceptions.

4. Conclusions

(1)
Strategy Enhancement Based on Integrated YIMBY and NIMBY Perceptions.
The research will contribute to other regions undergoing rapid, high-density urbanization like Shenzhen, where water purification plants are increasingly integrated with urban public spaces such as parks and green areas to form multifunctional facilities. The findings will effectively guide facility layout and design to avoid triggering residents’ NIMBY sentiments, demonstrating how rational urban planning can reduce negative perceptions, enhance acceptance of such facilities, and increase their usage frequency.
Regarding optimization strategies for multi-functional water purification plants and their surrounding areas, we state the following: ① To reduce NIMBY perceptions, strategies include spatial layout optimization, noise and odor mitigation, and community engagement. ② To enhance perceived neighborhood benefits, strategies include improving path accessibility and optimizing park functionality above the treatment plant—such as adding children’s play areas and science education facilities—to boost residents’ appreciation of the park’s value. ③ Finally, differentiated optimization strategies are proposed for the following three road network structures: grid-type, radial-type, and fragmented-type. For grid-type networks, perceived uniformity is enhanced primarily through improved design of the water purification plant and its overlying park (e.g., installing science exhibition galleries, children’s play areas, and multi-purpose activity spaces to boost the park’s functional diversity and appeal). Radial networks leverage enhanced connectivity of secondary paths (by installing convenience facilities like vending machines, shared bicycle parking points, and resting benches) and strengthening the functional diversity of main road areas (e.g., installing convenience stores and pavilions along main roads near water purification plants) to balance regional perception. Fragmented networks, meanwhile, rely on adding connecting pathways (addressing fragmentation caused by mountainous terrain by installing walkways or bike paths at junctions like residential–park interfaces and transportation hubs), strategically placing shared transportation options (such as optimizing parking locations for shared bicycles and e-bikes to provide convenient short-distance travel for residents), and enhancing rest nodes (e.g., installing viewing platforms, pavilions, and other resting points along long-distance paths, equipped with drinking fountains and vending machines to alleviate fatigue during walks). These strategies provide theoretical underpinnings and practical guidance for urban design around water purification plants and their surrounding areas, facilitating a win–win outcome of both social and economic benefits.
(2)
Key Findings and Research Limitations
Findings: ① This study explored the relationships among residents’ YIMBY and NIMBY perceptions, spatial perceptions of a water purification plant’s upper park, and accessibility perceptions through questionnaire surveys and structural equation modeling (SEM), establishing a scoring framework for integrated YIMBY and NIMBY perceptions. ② Random forest models and SHAP analysis revealed nonlinear relationships between built environment characteristics and residents’ composite YIMBY/NIMBY perceptions. ③ Spatial syntax analysis categorized road network structures around treatment plants into grid-type, radial-type, and fragmented-type. Scatter plot fitting methods demonstrated correlations between these network types and residents’ composite YIMBY/NIMBY perceptions. ④ Design strategies were proposed for the public spaces above multi-functional water purification plants within the built environment.
Research Limitations: ① The study primarily focused on multi-functional water purification plants in select high-density areas of Shenzhen. Conclusions are influenced by regional characteristics and may not be fully applicable to other cities or plant types. Future research could expand to include multiple cities and plant types. ② There was insufficient exploration of socio-psychological factors. The study primarily examined built environment impacts without fully incorporating psychological elements such as residents’ environmental cognition, sense of belonging, and values. Future research could integrate psychological tools to deeply analyze their influence mechanisms on YIMBY and NIMBY perceptions.

Author Contributions

Conceptualization, Z.Y., Y.Y. and Z.H.; methodology, Z.Y.; software, Z.Y. and Y.Y.; validation, Z.Y., Y.Y. and Z.H.; formal analysis, Z.Y.; investigation, Z.Y. and Y.Y.; resources, Z.Y. and Y.Y.; data curation, Z.Y. and Y.Y.; writing—original draft preparation, Z.Y., Z.H. and Y.Y.; writing—review and editing, Z.Y. and Y.Y.; visualization, Z.Y. and Y.Y.; supervision, Heng Liu and Y.Y.; project administration, H.L. and Y.Y.; funding acquisition, H.L. All authors have read and agreed to the published version of the manuscript.

Funding

This research was funded by NSFC Funding Program No. 52408029: Research on guidance and regulation index of developing three-dimensional railway transit block with public space vitality.

Institutional Review Board Statement

This study was conducted in accordance with the Declaration of Helsinki and approved by the Institutional Review Board (or Medical Ethics Committee of Shenzhen University Medical Department). Informed Consent Statement: This study involves human participants solely for the purpose of conducting an outdoor perceived comfort survey, aiming to collect subjective information from subjects. This study is a paid questionnaire experiment. Respondents complete the questionnaire anonymously, and no personal privacy issues are involved. Participants were informed of relevant details prior to the questionnaire and fully understood the experiment’s content and procedures. Therefore, no written informed consent form is required.

Data Availability Statement

The data supporting the reported results are not publicly available due to privacy and ethical restrictions. The data were stored on the second author’s personal computer and shared with the first author. They can only be made available upon a necessary and specific request.

Conflicts of Interest

The authors declare no conflicts of interest.

Appendix A

Table A1. Selection of functional complex water purification plant.
ProjectBasic InformationLocation
Honghu Water Purification PlantArea: Luohu District
Site Area: 3.24 hectares
Upper Space: Ecological Park + Science Exhibition Hall
Construction Model: Fully Underground Double-Layer Frame Structure
Location: Medium-to-High-Density Development Zone
Buildings 15 03966 i001
Futian Water
Purification Plant
Area: Futian District
Land area: 27.9 hectares
Upper space: park for cultural and
sports facilities
Mode of construction:
double-covered, semi-subterranean structure
Area: Middle- and High-Density
Development Zone
Buildings 15 03966 i002
Banxuegang Water
Purification Plant
Phase II
Area: Longgang District
Land area: 377,609,000 square meters
Upper space: municipal park
Mode of construction:
double-covered, semi-subterranean structure
Area: Medium-Density Development
Zone
Buildings 15 03966 i003
Buji Water Purification
Plant I
period
Area: Longgang District
Upper space: landscaped park
Construction mode: fully
underground structure
Area: Middle- and High-Density
Development Zone
Buildings 15 03966 i004
Buji Water Purification
Plant
II and III
Area: Longgang District
Land area: 4.927 hectares
Upper space: landscaped park
Mode of construction:
Semi-underground structure
Area: Mid-High-Density
Development Zone
Buildings 15 03966 i005

References

  1. Zhou, X. Research on Spatial Complexification Design of Urban Underground Sewage Treatment Plants. Master’s Thesis, South China University of Technology, Guangzhou, China, 2023. [Google Scholar] [CrossRef]
  2. O’Hear, M. Don’t Build It Near My House: The Strategic Significance of Facility Siting and Compensation; MIT Building and Planning Laboratory: Cambridge, MA, USA, 1977. [Google Scholar]
  3. Walker, R.A. The Theory of suburbia: Capitalism and the Construction of American Urban Space. In Urbanization and Urban Planning in Capitalist Society; Walker, R.A., Ed.; Routledge: London, UK, 2018; pp. 383–429. [Google Scholar]
  4. Gu, W. NIMBY Conflicts and Their Governance. Ph.D. Thesis, Nanjing University, Nanjing, China, 2011. [Google Scholar]
  5. Zhang, Y. A Study on the Accessibility of “Avoidance” and “Preference” in Urban Regional Green Spaces. Master’s Thesis, Xi’an International Studies University, Xi’an, China, 2018. [Google Scholar]
  6. Kokerman, M.K. The Impact of Location Factors on Housing Purchase Prices and Rents in the San Francisco Bay Area. Transp. Res. Rec. 1997, 1606, 40–50. [Google Scholar]
  7. Yang, X.; Sun, Z. Mechanism of NIMBY Effect in Environmental Facilities: An Analysis Based on the Yuhang Incident in Hangzhou. Reg. Econ. Rev. 2016, 143–150. [Google Scholar] [CrossRef]
  8. Bai, Y.; Huang, Y.; Chen, J.; Xie, K. Optimization of Plastic Waste Treatment Facility Layout in Huizhou City Based on POI Data and NIMBY Effects. J. Huizhou Univ. 2022, 42, 1–8. [Google Scholar] [CrossRef]
  9. Zhou, X. Study on the Impact of NIMBY Facilities on Surrounding Residential Prices Based on Spatial Analysis. Master’s Thesis, Qingdao University of Technology, Qingdao, China, 2023. [Google Scholar]
  10. Sun, M. Study on Factors Influencing Public Attitudes and Spatial Scope of NIMBY Facilities Based on the NIMBY Effect. Master’s Thesis, Xi’an University of Architecture and Technology, Xi’an, China, 2021. [Google Scholar] [CrossRef]
  11. Vergine, S.; del Pino Ramos-Sosa, M.; Attanasi, G.; D’Amico, G.; Llerena, P. Willingness to accept a wind power plant: A survey study in the South of Italy. Energy Policy 2024, 192, 114201. [Google Scholar] [CrossRef]
  12. Futrell, R. Framing processes, cognitive liberation, and NIMBY protests in the U.S. chemical weapons disposal conflict. Sociol. Inq. 2003, 73, 359–386. [Google Scholar] [CrossRef]
  13. Devine-Wright, P. Revisiting NIMBYism: The Role of Place Attachment and Place Identity in Explaining Local Protective Actions. J. Appl. Soc. Psychol. Community 2009, 19, 426–441. [Google Scholar] [CrossRef]
  14. Liu, M.; Song, Y.; Shi, S. Resolving the Dilemma of Sewage Treatment Plants: An Empirical Study on Public Acceptance of Open Sewage Treatment Plants. Clean Prod. 2024, 475, 143674. [Google Scholar] [CrossRef]
  15. Xiao, Z.; Zhang, C.; Li, Y.; Chen, Y. Community Park Visitation Behavior Determined by Built Environment Attribute Interactions: An explainable machine learning method. Appl. Geogr. 2024, 172, 103423. [Google Scholar] [CrossRef]
  16. Dong, Y. Research on the Impact Mechanism of Urban Park Vitality Based on Multi-source Data. Ph.D. Thesis, Nanjing Forestry University, Nanjing, China, 2023. [Google Scholar]
  17. Miedema, H.M.; Vos, H. Traffic Noise Exposure-Response Relationships. J. Acoust. Soc. Am. 1998, 104, 3432–3445. [Google Scholar] [CrossRef] [PubMed]
  18. Xie, D.X.; Wu, S.Q.; Chang, J. Spatial Distribution Characteristics of NIMBY Facilities and Their Relationship with Surrounding Residential Prices: A Case Study in Guangzhou. Adv. Geogr. Sci. 2023, 42, 42–52. [Google Scholar]
  19. Wolsink, M. Wind Power and the NIMBY Myth: The Limited Significance of Institutional Capacity and Public Support. Renew. Energy 2000, 21, 49–64. [Google Scholar] [CrossRef]
  20. Devine-Wright, P. Local Characteristics of Renewable Energy Development in the UK: Exploring Public Perceptions and Policy Implications. Local Environ. 2005, 10, 57–69. [Google Scholar] [CrossRef]
  21. Pasqualetti, M.J. Social Barriers to Renewable Energy Landscapes. Geogr. Rev. 2011, 101, 201–223. [Google Scholar] [CrossRef]
  22. Research on Urban Quality of Life: Theory, Methodology, and Empirical Studies; Springer Science+Business Media: Berlin, Germany, 2011.
  23. Loxley, A. Landscape and Aesthetic Philosophy: Does Landscape Quality Arise from the Landscape Itself or the Eye of the Beholder? Landsc. Urban Plan. 1999, 44, 177–198. [Google Scholar]
  24. Gehl, J. “Three Categories of Outdoor Activities,” “Life Between Buildings,” and “Outdoor Activities and the Quality of Outdoor Space”: Selected from Life Between Buildings: The Use of Public Space (1987). In The Urban Reader; Routledge: London, UK, 2011; pp. 586–608. [Google Scholar]
  25. Pikora, T.; Giles-Corti, B.; Bull, F.; Jamrozik, K.; Donovan, R. Establishing an evaluation framework for determinants of walking and cycling environments. Soc. Sci. Med. 2003, 56, 1693–1703. [Google Scholar] [CrossRef] [PubMed]
  26. Chiesura, A. The Role of Urban Parks in Sustainable Cities. Landsc. Urban Plan. 2004, 68, 129–138. [Google Scholar] [CrossRef]
  27. Han, R.; Yang, D.; Wei, Y. Study on the Impact of Street Walkability on the Functional Capacity of Older Adults: A Case Study of Dalian’s Main Urban Area. New Archit. 2023, 135–141. [Google Scholar]
  28. Huang, X.; Cao, X.; Yin, J. The Influence of Urban Rail Transit and Built Environment on Residents’ Walking Behavior. Acta Geogr. Sin. 2020, 75, 1256–1271. [Google Scholar]
  29. Qin, P.; Chen, Y.; Xu, J.; Wang, L. Analysis of Beijing Residents’ Travel Behavior: Estimation of Time Value and Transport Demand Elasticity. Econ. Geogr. 2014, 34, 17–22. [Google Scholar]
  30. Jacobsen, P.L. Safety in numbers: More walkers and bicyclists, safer walking and cycling. Inj. Prev. 2015, 21, 271–275. [Google Scholar] [CrossRef] [PubMed]
Figure 1. Schematic diagrams of different layout forms. (a) Fully underground layout (single-layer cover); (b) fully underground layout (double-story structure); and (c) semi-basement layout (double-story structure).
Buildings 15 03966 g001
Figure 2. Impact of NIMBY Facilities on Urban Open Space Benefits. The distance from the residence to the nearest urban open space falls within the influence zone of NIMBY or YIMBY facilities (left); The distance from the residence to the nearest urban open space lies outside the influence zone of NIMBY or YIMBY facilities (right).
Buildings 15 03966 g002
Figure 3. Research task on the nonlinear relationship between comprehensive perception of NIMBY and the built environment.
Buildings 15 03966 g003
Figure 4. Shenzhen water purification plant density zoning distribution map.
Buildings 15 03966 g004
Figure 5. Comparison of NIMBY perception mean values (a) and standard deviations (b) across five cases.
Buildings 15 03966 g005
Figure 6. Comparison of YIMBY perception mean values (a) and standard deviations (b) across five cases.
Buildings 15 03966 g006
Figure 7. Comparison of mean (a) and standard deviation in spatial perception (b) across five case studies.
Buildings 15 03966 g007
Figure 8. Comparison of the mean (a) and standard deviation (b) of the five cases’ perceptual scores.
Buildings 15 03966 g008
Figure 9. Schematic diagram of the perceived NIMBY structure hypothesis.
Buildings 15 03966 g009
Figure 10. Structural equation model of NIMBY perception.
Buildings 15 03966 g010
Figure 11. Schematic diagram of the YIMBY perception structural equation hypothesis.
Buildings 15 03966 g011
Figure 12. Revised model diagram of the YIMBY perception structural equation.
Buildings 15 03966 g012
Figure 13. Hypothesized structural equation model of the integrated perception of YIMBY and NIMBY.
Buildings 15 03966 g013
Figure 14. Hypothetical structural equation model of the integrated perception framework for NIMBY and YIMBY.
Buildings 15 03966 g014
Figure 15. Ranking of built environment factors by importance.
Buildings 15 03966 g015
Figure 16. Summary of localized interpretations of built environment factors.
Buildings 15 03966 g016
Figure 17. Localized explanation diagram of spatial layout and accessibility indicator variables.
Buildings 15 03966 g017
Figure 18. Localized explanatory plots of environmental density and functional mixing indicator variables.
Buildings 15 03966 g018
Figure 19. Localized interpretation of facilities and services indicator variables. (a) Ratio of distance to nearest park; (b) restaurant POI density; (c) greenfield pass-through rate; and (d) convenience store POI density.
Buildings 15 03966 g019
Figure 20. Interaction analysis of spatial layout and accessibility indicators with straight-line distance.
Buildings 15 03966 g020
Figure 21. Interaction analysis of environmental density and functional mix indicators with straight-line distance.
Buildings 15 03966 g021
Figure 22. Interaction analysis of facility and service indicators with straight-line distance.
Buildings 15 03966 g022
Figure 23. Water purification plant road network angular step depth self-mapping. The ‘red dot’ indicates the location of the water purification plant, and the colored line diagram represents the angular depth axial line map of space syntax. (a) Futian Water Purification Plant Angular Step Depth; (b) Honghu Water Purification Plant Angular Step Depth; (c) Buji Water Purification Plant Phase 1 + 2 Angular Step Depth; and (d) Banxuegang Water Purification Plant Angular.
Buildings 15 03966 g023
Figure 24. Road network types, the red dot indicates the location of the water treatment plant of this type, Color lines represent the road network structure. (a) Grid-type road network; (b) radial-type road network; and (c) segment-type road network.
Buildings 15 03966 g024
Figure 25. YIMBY and NIMBY perception integration with angular step depth scatter plot fitting.
Buildings 15 03966 g025
Table 1. Neighborhood awareness measurement scale.
Dimension NormDescriptive
Neighbor avoidance perceptionAir pollution [16]Air quality is affected by odors, dust, and harmful substances that may be emitted during the operation of the water purification plant
Noise pollution
[17]
Potential noise disturbance from the water purification plant and surrounding traffic, affecting residents’ sleep and quality of daily life
Health impactPotential problems of mosquito breeding, garbage dumping, etc., from water purification plants, affecting the health and sanitation of residents
Impact of house prices
[18]
The water purification plant may result in a decrease in home prices or limited appreciation in the neighborhood, reflecting the economic perceptions of residents
Psychological unhappiness
[19]
Negative emotions such as anxiety and anxiety caused by environmental problems (e.g., noise, air pollution, etc.) at the water purification plant
Traffic pressureIncreased traffic from the water purification plant could lead to congestion and affect residents’ accessibility
Table 2. Neighborhood perception measurement scale.
Dimension NormDescriptive
Sense of neighborhood
awareness
Community benefits
[20]
Facilities such as the Upper Water Purification Plant Park provide social spaces that promote neighborhood interaction and enhance residents’ sense of belonging to the community
Environmental benefit [21]The water purification plant improves water and air quality, freshens the surrounding environment, and increases residents’ sense of well-being
Quality of life [22]Green spaces and recreational spaces at the water purification plant promote the physical and mental health of residents, increase physical activity, and improve mental health
Health benefitsThe water purification plant will stimulate the economic development of the surrounding area, increase the value of land and real estate, and improve the economic interests of residents
Economy and land valuesFocus on aesthetic design and greening of parks to enhance residents’ preference and overall satisfaction with the environment
Visual and environmental sense
[23]
Landscaping and greening of the water purification plant improves the aesthetic value of the area and enhances the visual perception of the environment and the sense of well-being of residents
Table 3. Measurement scale for spatial perception in upper parks.
Dimension NormDescriptive
Upper Park Space
perception
Dynamic actives
[24]
Assess whether the parks provide sufficient space for exercise, such as trails and sports areas, to enhance residents’ freedom of movement
Static exchange sites
[25]
Focus on social spaces such as rest areas and seating in parks to promote resident interaction and community cohesion
Space and height difference
meter
Examine the design of park trails, such as flatness and slope, to ensure an accessible experience and comfortable travel environment
Environment and accessibilityAssessing the accessibility of park amenities
Aesthetics and comfort
[26]
Focus on aesthetic design and greening of parks to enhance residents’ preference and overall satisfaction with the environment
Table 4. Measurement scale for spatial perception.
Dimension NormDescriptive
Paths to
spatial perception
Convenience
[27]
Assesses the accessibility of paths and the clarity of paths during walks affects residents’
travel experience
Transportation
[28]
Concerns the traffic conditions of routes, good road traffic may increase the frequency of travel of residents
Time cost
[29]
Focuses on the psychological walking time from residential areas to parks, where shorter time costs the willingness of residents to travel
Security
[30]
Concerns the safety of paths, including pedestrian lanes and nighttime lighting
ComfortEvaluates the comfort and desirability of travel paths
Table 5. Shenzhen multi-functional water purification plant: resident perception evaluation measurement scale.
ThemeDimensionNormDescriptive
Shenzhen Functional Complex
Compatible water purification
Perception Evaluation of Chemical Plant Residents
Neighbor avoidance perceptionAir pollutionA1
Noise pollutionA2
Health contaminationA3
Impact of house pricesA4
Psychological unhappinessA5
Traffic pressureA6
Neighborhood perceptionCommunity benefit enhancementB1
Enhanced environmental benefitsB2
Quality of life enhancementB3
Enhanced health benefitsB4
Economic and land value enhancementB5
Visual and environmental perception enhancementB6
Water purification upper factory public
sense of garden space
awareness
Water purificationC1
Static communication placesC2
Space and height designC3
Environment and convenienceC4
Aesthetics and comfortC5
Paths to spatial perceptionConvenienceD1
TransportationD2
Time costD3
SafetyD4
ComfortD5
Table 6. Indicator system of built environment impact factors.
Primary IndicatorSecondary IndicatorsIndicator AbbreviationsDescription of IndicatorsQuantitative Approach
Spatial layout and accessibilityAngular ASDChanges in the angle of a path’s turns as a measure of its straightness and accessibility A S D = i = 1 n 1 ( 180 ° θ i )
Directrix EDShortest straight-line distance between origin and destination, reflecting the idealized accessibility of the route E D = ( x 2 x 1 ) 2 + ( y 2 y 1 ) 2
Practical distanceNDActual path length along the road network, reflecting the accessibility and time cost of actual travel by residents N D = d i
Detour rateDIThe ratio of the actual distance to the straight-line distance, indicating the degree of deviation or detour of the route D I = N D E D
Environmental density and functional mixEnclosureECThe extent to which streets and squares are defined by buildings, walls, greenery, and other urban aspects E C = H a v g W
Path building PBDRatio of building length along the path to the length of the path, reflecting development intensity P B D = L b L P
Environmental density and functional mixFunctional mixFMDThe ratio of the total floor area of buildings of different functions to the site area along the route, which measures the comprehensive intensity of land development F M D = i = 1 N p i × logP i
Commercial rate along the streetCDThe ratio of the length of commercial buildings along the pathway to the total length of the pathway indicates the commercial density along the pathway C D = L c o m L P a t h
Greenfield pass-through rateGPRThe proportion of green space along the path to the total path coverage, indicating the ecological quality of the path G P R = L g r e e n L p a t h
Facilities and ServicesConvenience Store POI Secret
degree (angles, temperature, etc.)
CSDNumber of convenience stores per unit area along the route, reflecting accessibility of amenities C S D = N s t o r e L p a t h
Restaurant POI DensityRDNumber of food and beverage facilities per unit area along the path, indicating the extent to which the path meets immediate consumption needs R D = N r e s t e r u a n t L p a t h
Distance ratio to the nearest parkDPRRatio of distance to nearest park to distance to park above water quality purification plant D P R = D R P D W P
Table 7. Overall reliability statistics of the questionnaire.
Cronbach AlphaItem Count (of a Consignment, etc.)
0.83822
Table 8. Reliability statistics for the four dimensions of the questionnaire.
DimensionItemCorrelation of
Corrected Entries to
Totals
Clone Bach After
Deletion of Items
Alpha
Dimensional
Reliability
Neighborhood
awareness
Neighborhood
Awareness A1
0.7430.8440.876
Neighborhood
Awareness A2
0.7350.846
Neighborhood
Awareness A3
0.7000.852
Neighborhood
Awareness A4
0.6320.863
Neighborhood
Awareness A5
0.6560.859
Neighborhood
Awareness A6
0.6220.865
Neighborhood
perception
Neighborhood
perception B1
0.6430.8250.851
Neighborhood
perception B2
0.6630.822
Neighborhood
perception B3
0.6840.818
Neighborhood
perception B4
0.6340.827
Neighborhood
perception B5
0.6380.827
Neighborhood
perception B6
0.5700.841
Spatial
awareness
Spatial perception C10.5770.7190.772
Spatial perception C20.5030.743
Spatial perception C30.5310.734
Spatial perception C40.5080.744
Spatial perception C50.6050.708
Accessibility
awareness
Accessibility
perception D1
0.6040.6850.755
Accessibility
perception D2
0.2760.794
Accessibility
perception D3
0.5540.700
Accessibility
perception D4
0.6130.676
Accessibility
perception D5
0.5880.686
Table 9. Reliability statistics of perceived accessibility.
Dimension (Math.)SubjectCorrected Line vs. Total
Correlate
Clone Bach Alpha After Deletion of ItemsDimensional Reliability
Accessibility
awareness
Accessibility perception D10.4370.7400.794
Accessible Sensory perception D30.4520.791
Accessible Sensory perception D40.6140.710
Accessible Sensory perception D50.6340.722
Table 10. KMO test and Bartlett sphere test.
KMO Sampling Adequacy MeasureBartlett’s Sphericity Test
Approximate Chi-Square Degrees of Freedom Significance
0.8582263.6092100.000
Table 11. Total variance explained.
Factor NumberCharacteristic RootExplanatory Rate of Variance Before RotationPost-Rotation Variance Explained
Characteristics RootsVariance Explanation
Rate %
Cumulative %Characteristics RootsVariance Explanation
Rate %
Cumulative %Characteristics RootsVariance Explanation
Rate %
Cumulative %
15.59626.64826.6485.59626.64826.6483.78318.01318.013
23.92318.68345.3313.92318.68345.3313.40416.21134.223
31.6527.86653.1971.6527.86653.1973.00514.30848.531
41.4356.83460.0311.4356.83460.0312.41511.49960.031
50.8874.22264.253------
60.7823.72367.976------
70.7703.66571.641------
80.6973.32174.962------
90.6313.00577.967------
100.6112.91080.877------
110.5002.37983.257------
120.4812.29085.546------
130.4392.09287.638------
140.4272.03289.670------
150.4091.94891.618------
160.3711.76693.384------
170.3491.66195.045------
180.3291.56896.613------
190.2601.24097.853------
200.2291.09098.942------
210.2221.058100.000------
Table 12. Table of factor loading coefficients after rotation.
Name (of a Thing)Factor Loading FactorCommonality (Common Factor Variance)
Factor 1Factor 2Factor 3Factor 4
A10.8220.094−0.107−0.0410.698
A20.8130.074−0.1080.0320.680
A30.7870.068−0.151−0.0220.647
A40.7450.1170.088−0.1110.589
A50.776−0.052−0.0070.0240.605
A60.746−0.048−0.016−0.0170.559
B10.1070.833−0.0640.1100.722
B20.0590.7990.0500.1930.682
B30.0060.6930.3360.1610.619
B4−0.0880.7040.2780.0830.588
B50.0480.6470.3600.1070.562
B60.1550.5910.3540.0710.504
C1−0.0400.1610.7080.1960.567
C2−0.1340.1250.6380.1310.458
C3−0.1070.2190.6190.0810.450
C40.0120.1140.7040.0530.512
C5−0.0540.1790.6870.2490.569
D10.0330.1490.3910.6690.623
D30.0970.3240.2490.5550.484
D4−0.0900.1170.1090.8490.754
D5−0.1110.1200.1100.8350.737
Table 13. Neighborhood awareness correlation analysis.
Neighborhood Awareness
Neighborhood perceptionCorrelation coefficient0.091
p-value0.151
Spatial awarenessCorrelation coefficient−0.137 *
p-value0.031
Perceived accessibilityCorrelation coefficient0.001
p-value0.986
“*” indicates significance, meaning there is a significant negative correlation between NIMBY perception and spatial perception.
Table 14. Neighborhood perception correlation analysis.
Neighborhood Perception
Spatial awarenessCorrelation coefficient0.483 **
p-value0.000
Perceived accessibilityCorrelation coefficient0.485 **
p-value0.000
“**” indicates significance, with a strong positive correlation observed between neighbor benefit perception and spatial/perceptible accessibility perception.
Table 15. Goodness-of-Fit measures for the perceived NIMBY structural equation model.
NormCMIN/DFRMSEAGFITFICFI
Best indicator<3<0.08>0.90>0.90>0.90
Measurement results2.0330.0650.9070.9210.935
Table 16. Neighborhood awareness structural equation model path analysis results.
TrailsEstimateS.E.C.R.pStd. Estimate
Spatial awareness<--- Perception of accessibility0.3910.0606.493***0.565
Neighborhood awareness<--- Spatial perception−0.2530.156−1.6250.104−0.163
Neighborhood awareness<--- Perception of accessibility−0.0080.105−0.0760.939−0.007
“***” indicates a significance level of p <0.05, suggesting that accessibility perception has a significant positive effect on spatial perception.
Table 17. Neighborhood aversion perception mediation effect test results.
Type of EffectTrailsEstimateLowerUpperp
Direct effectReachability perception → Neighborhood avoidance perception−0.008−0.2400.3330.956
Indirect effectReachability perception → Spatial perception → Neighborhood perception−0.099−0.3400.0280.130
Aggregate effectReachability perception → Neighborhood avoidance perception−0.107−0.2660.0880.262
Table 18. Initial Goodness-of-Fit metrics for YIMBY perception structural equation models.
NormCMIN/DFRMSEAGFITFICFI
Best indicator<3<0.08>0.90>0.90>0.90
Measurement results2.9530.0890.8750.8550.880
Table 19. Final revised model fit for YIMBY perception structural equation model.
NormCMIN/DFRMSEAGFITFICFI
Best indicator<3<0.08>0.90>0.90>0.90
Measurement results1.9490.0620.9150.9290.942
Table 20. Path analysis results of the YIMBY perception structural equation model.
TrailsEstimateS.E.C.R.pStd. Estimate
Spatial awareness<--- Perception of accessibility0.4130.0626.608***0.578
Neighborhood perception<--- Spatial perception0.4480.0934.822***0.522
Neighborhood perception<--- Perception of accessibility0.1180.0552.1490.0320.193
“***” indicates p < 0.05, indicating that accessibility perception has a significant positive effect on spatial perception.
Table 21. Initial model fit indices for the integrated structural equation model of NIMBY and YIMBY Perceptions.
NormCMIN/DFRMSEAGFITFICFI
best indicator<3<0.08>0.90>0.90>0.90
Measurement results2.5470.0790.9310.9020.928
Table 22. Path analysis results of the integrated perception structural equation model for NIMBY and YIMBY.
TrailsEstimateS.E.C.R.pStd. Estimate
Spatial awareness<--- Perception of accessibility0.5010.086.234***0.563
Neighborhood benefits/neighborhood avoidance<--- Spatial perception0.4270.1073.974***0.368
Neighborhood benefits/neighborhood avoidance<--- Perception of accessibility0.0550.090.6070.5440.053
“***” indicates p < 0.05, indicating that accessibility perception has a significant positive effect on spatial perception.
Table 23. Test results for the mediating effect of perceived neighborly benefits and NIMBYism.
Type of EffectTrailsEstimateLowerUpperp
Direct effectReachability Perception → Neighborhood Benefit/Neighbor Avoidance0.055−0.1990.2420.625
Indirect effectReachability Perception → Spatial Perception → Neighborhood Benefit/Neighbor Avoidance0.2140.1090.3870.000
Aggregate effectReachability Perception → Neighborhood Benefit/Neighbor Avoidance0.2680.1100.4320.002
Table 24. Analysis of Perceived NIMBY Relationships.
Water Purification PlantsAverage ValueStandard DeviationMaximum ValuesMinimum Value
Honghu Water Purification Plant1.420.292.090.83
Banxuegang Water Purification Plant1.350.332.040.88
Phuket Phase 1 Water Purification Plant1.290.221.670.88
Phuket Phase 2 Water Purification Plant1.320.291.900.93
Futian Water Purification Plant1.330.231.721.00
Disclaimer/Publisher’s Note: The statements, opinions and data contained in all publications are solely those of the individual author(s) and contributor(s) and not of MDPI and/or the editor(s). MDPI and/or the editor(s) disclaim responsibility for any injury to people or property resulting from any ideas, methods, instructions or products referred to in the content.