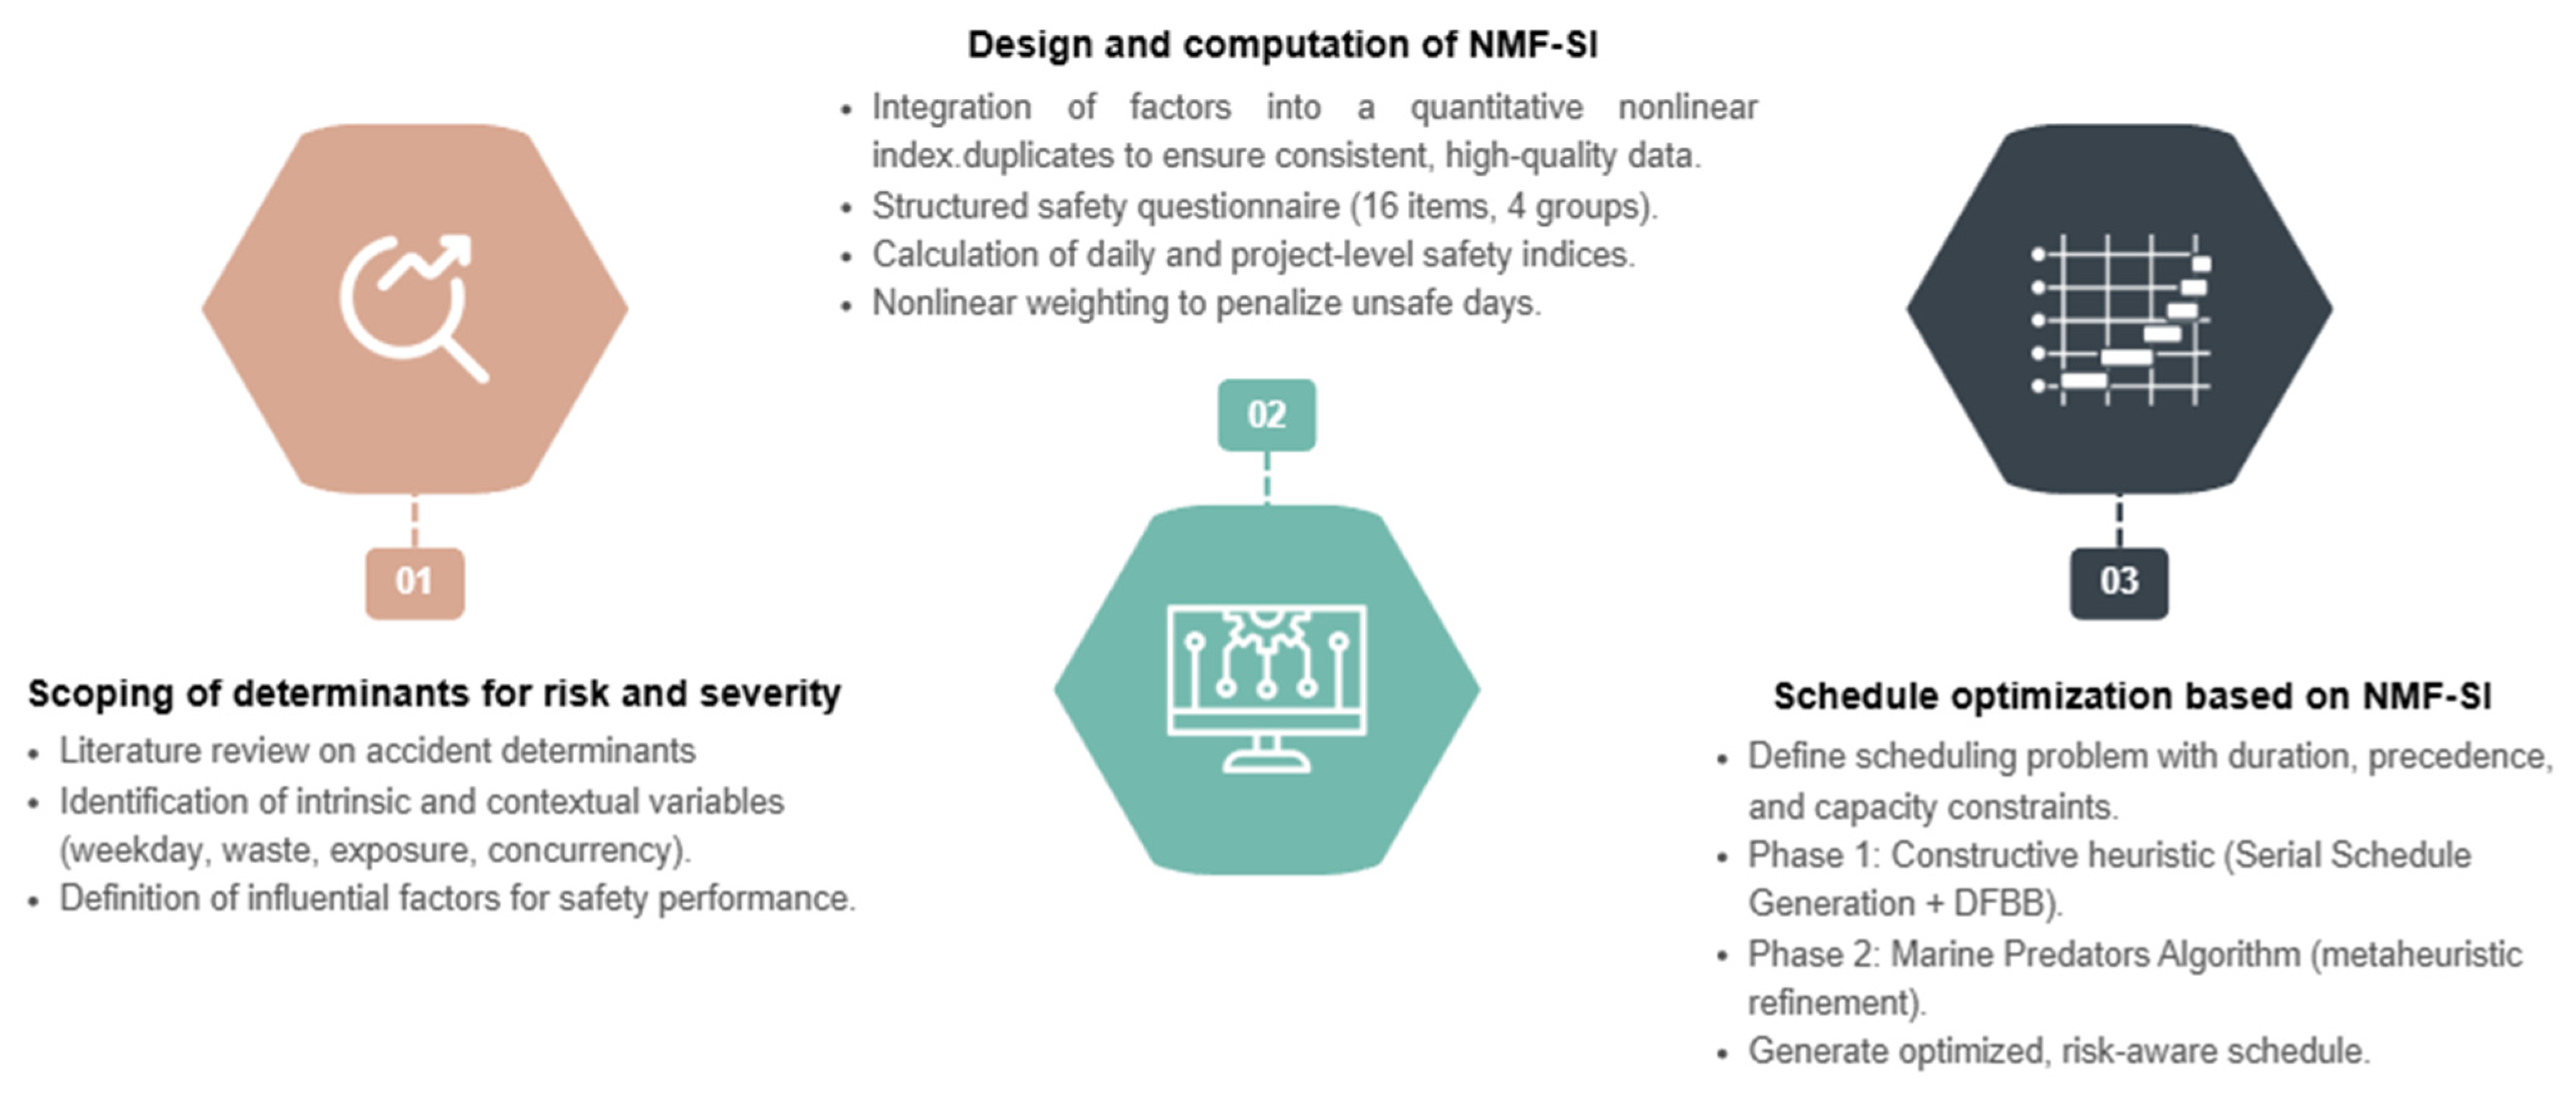
This study applies a structured methodology to better understand and enhance safety in construction projects. The process brings together three key elements: a review of accident determinants, the development of a safety index, and a scheduling model that balances risk with practical constraints. Combined, these steps offer clearer insight into how accidents arise, provide a consistent way to measure safety, and support planners in making informed decisions to reduce risks on site.
2.1. Scoping of Determinants for Risk and Severity
The first step focuses on reviewing recent studies to identify determinants of accident likelihood and severity in construction. The aim was to uncover variables that significantly influence occupational accidents, including those external to the specific technical risks associated with individual construction tasks. Similar approaches have been reported in the literature [
1,
3] which analysed occupational risk assessment models and safety management trends in the construction sector. By synthesizing these elements, this paper supports a more unified understanding of the operational context in which accidents occur and reinforces the need for safety assessment models that account for both intrinsic and contextual risk drivers [
4,
18]. This insight is essential in advancing the development of more robust and context-sensitive tools for risk assessment and safety management on construction sites [
5,
7,
19,
20].
The analysed literature consistently highlights several determinants that extend beyond the intrinsic hazards of specific activities and include contextual and environmental elements that shape overall accident dynamics. One of the most commonly reported factors is the day of the week [
16,
21], as studies have shown that accident frequency and severity can vary depending on the specific day, with certain days exhibiting a higher incidence of safety-related events [
22]. This temporal variability has been linked to changes in workforce fatigue, scheduling patterns, and environmental conditions, as highlighted in a study for modelling and forecasting occupational accidents of different severity levels in Spain [
23].
Another critical factor is waste generation, which has been associated with increased disorder and a higher likelihood of hazards arising in the work environment [
16,
17]. High levels of waste correlate with decreased mobility, reduced visibility, and greater physical obstructions, all of which contribute to a more hazardous site [
24,
25,
26]. Exposure variables such as the number of workers present and the duration of their daily activities further compound risk by increasing the probability of an incident occurring within a given timeframe [
15,
27,
28].
In addition, the concurrent execution of multiple tasks introduces complex interactions that do not follow predictable or linear relationships when analysed by risk-aware schedules, a situation further compounded by varying levels of manager supervision. As reported by the literature, overlapping activities can generate dynamic conditions, where the risk associated with one task may be amplified by the presence or requirements of another [
1,
3]. These interdependencies create compounded safety challenges that must be considered in any risk assessment, a point also emphasized in planning frameworks based on good practices [
29,
30,
31,
32].
Another key element is the effective implementation of safety measures, whose impact can be assessed through structured tools, such as validated questionnaires. An earlier investigation [
33] demonstrated that such instruments allow for the quantification of current safety practices, providing valuable insight into how well preventive strategies are applied on site. Previous studies have also shown that consistent enforcement of these measures has a measurable impact on reducing accident probability [
7,
9,
34]. The degree to which such measures are consistently implemented and maintained has a direct influence on overall risk levels.
Taken together, this comprehensive perspective on internal and external risk factors, supported by empirical evidence from diverse contexts, provides a foundation for developing more accurate, responsive, and context-aware safety evaluation methodologies in the construction sector.
2.2. NMF-SI Design
In order to move from the identification of risk determinants toward a practical application, it is necessary to establish a framework that can synthesize diverse factors into a single, comparable measure. Relying solely on qualitative evaluations often proves insufficient to capture the complexity of construction projects, where overlapping tasks, contextual conditions, and varying levels of safety compliance interact in nonlinear ways. The review of safety measures and the available instruments for assessing their implementation provides the conceptual framework upon which the development of more robust and responsive indices is grounded. To address this challenge, the NMF-SI is proposed as a quantitative and adaptive tool that integrates the previously identified factors in a structured manner, offering a mechanism that overcomes the limitations of purely qualitative approaches and enables a more objective and adaptable assessment at both the daily-activity and overall project-schedule levels. In doing so, it translates complex site dynamics into an interpretable metric that supports more objective decision-making in safety planning and management.
The NMF-SI is designed as a quantitative, schedule-aware safety index on [0, 1], where higher values indicate safer plans. Its purpose is to assess the safety at the daily-activity level and for the project schedule, replacing qualitative or subjective judgments with structured, data-driven evaluation, in line with previous studies [
1,
3]. This approach follows the logic of activity-based risk-assessment models [
15] and probabilistic safety-evaluation frameworks [
18,
20,
27,
35] that have demonstrated their ability to translate task-specific risks into measurable indicators.
The NMF-SI is computed from the set of planned activities, their schedule, and a structured on-site safety questionnaire which captures the degree of implementation and maintenance of preventive measures. For each day, a daily safety index is obtained by combining the likelihood of accidents and their potential severity associated with the scheduled activities, considering the determinants identified in the previous section. The schedule plays a major role, since modelling of days with multiple concurrent activities is critical to capture interactions under spatial and managerial constraints, which can amplify or attenuate risk [
24,
32,
33]. Accordingly, a nonlinear specification is adopted to reflect this effect. The specific influence of each variable on the NMF-SI will be detailed in
Section 2.2.1.
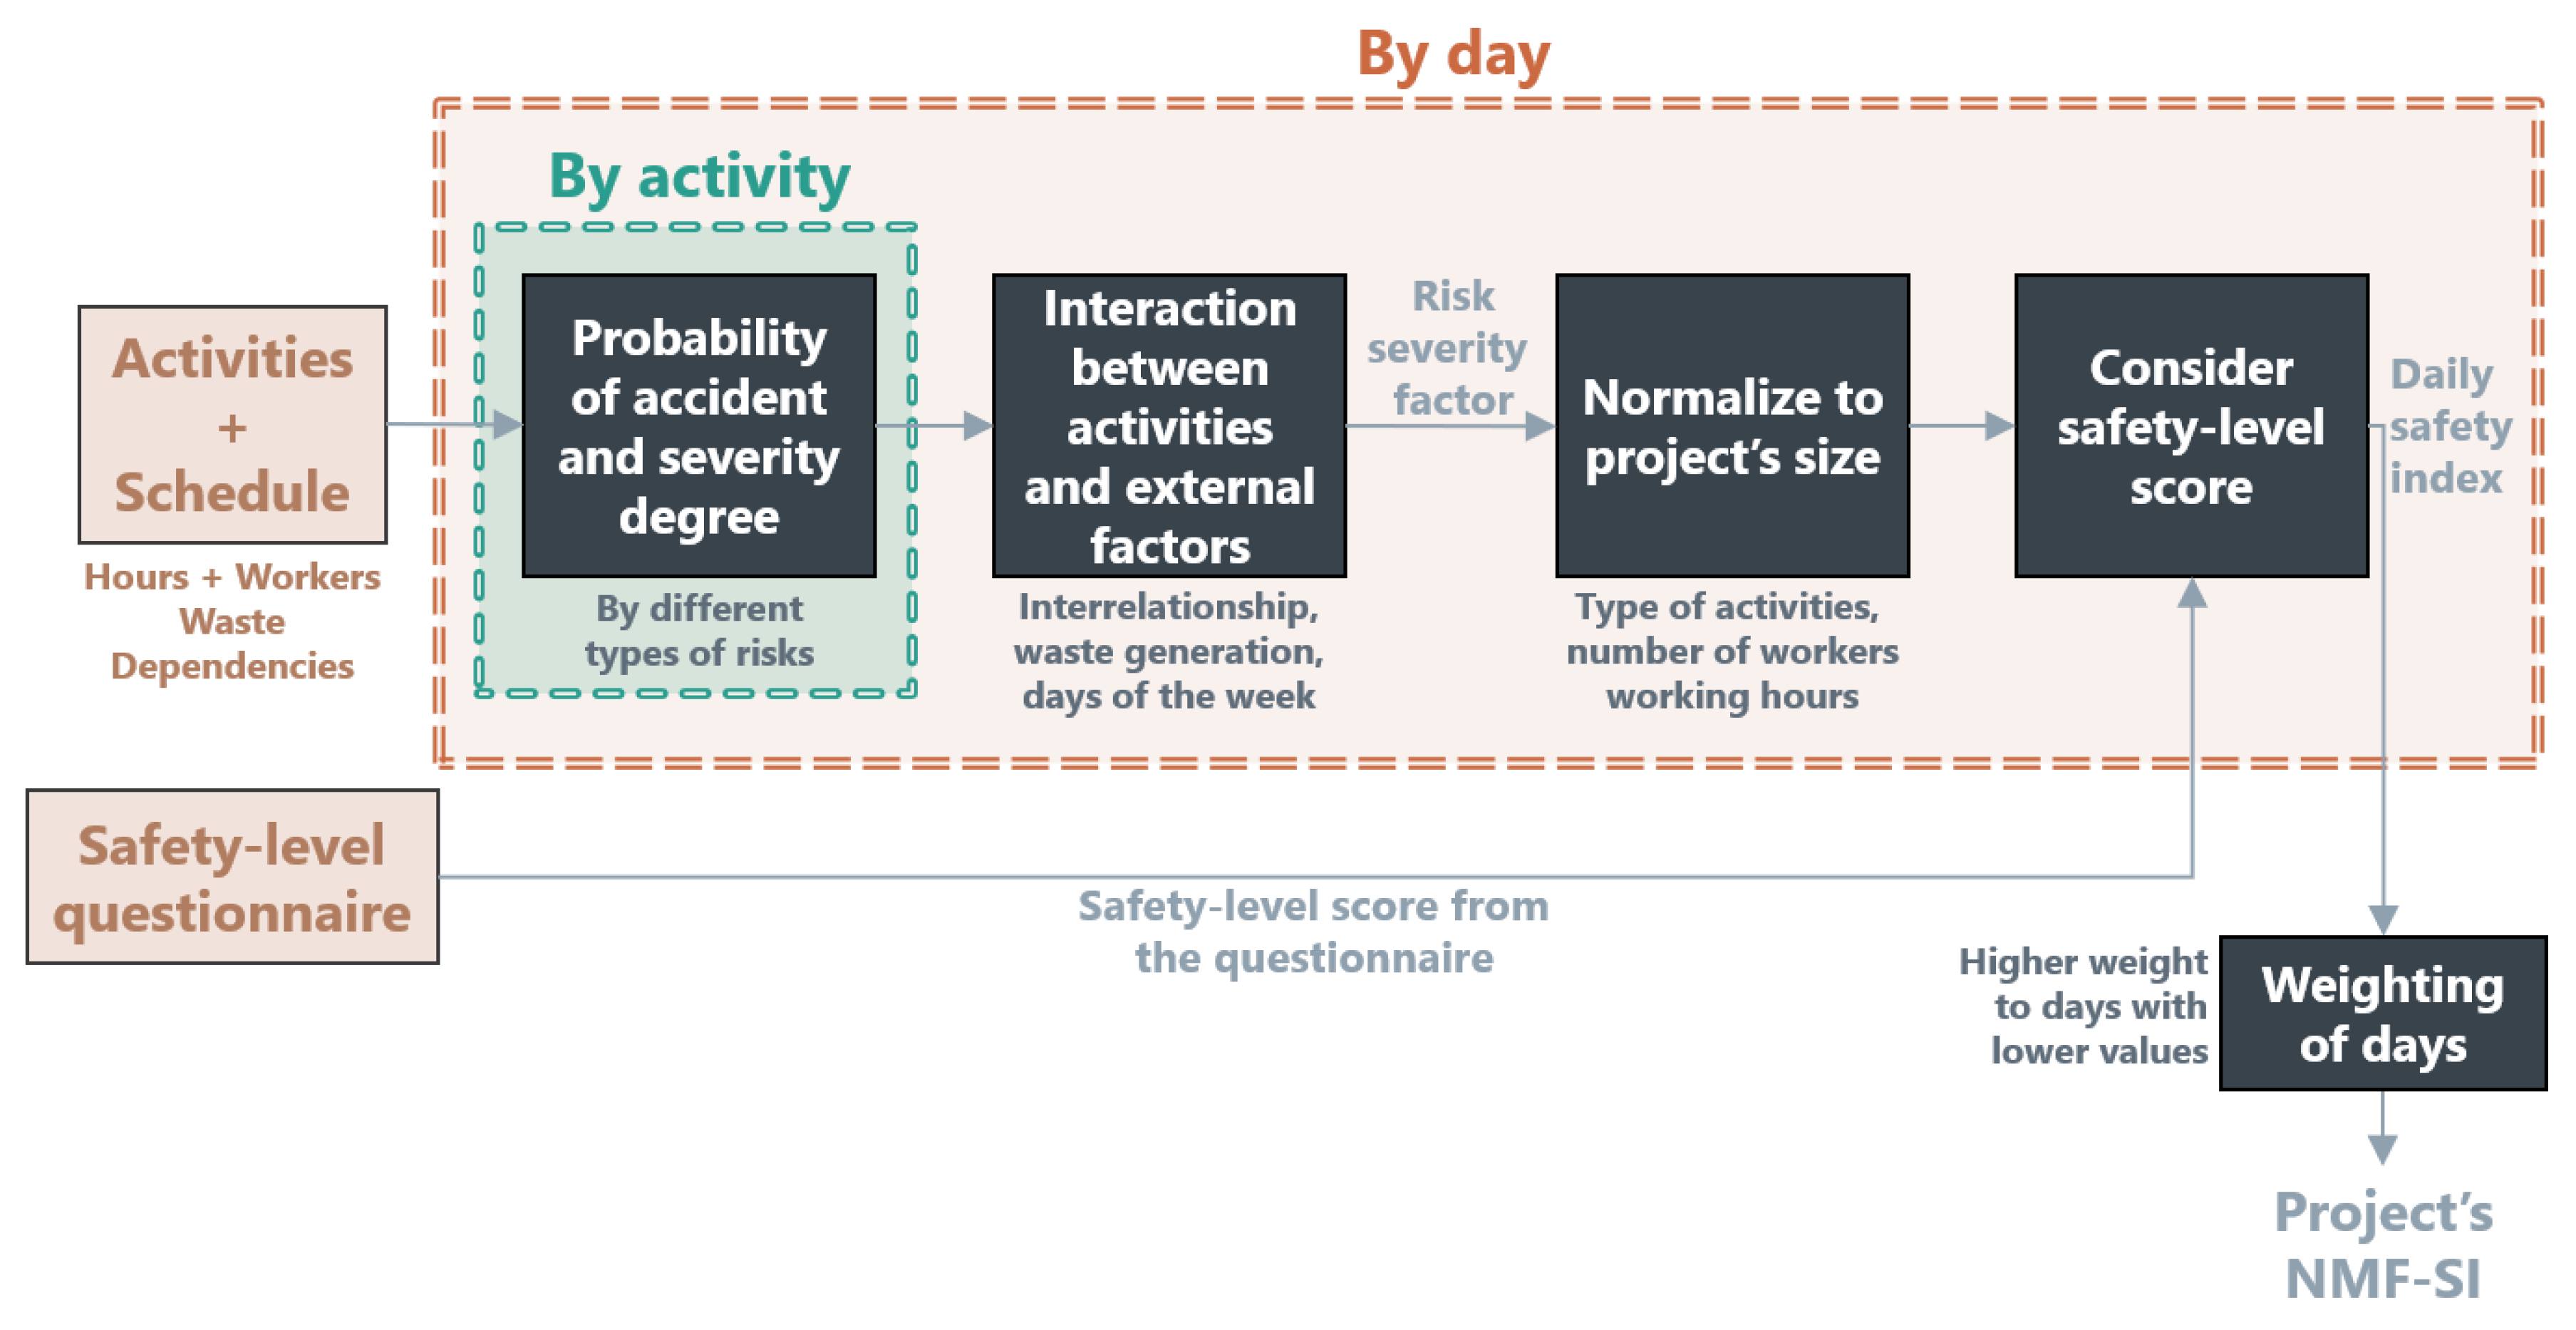
Figure 2 illustrates the NMF-SI diagram, representing the steps to calculate all the elements involved. First, activity-level accident probabilities and severities are estimated and aggregated into a daily risk-severity factor. This factor is then normalized to a common project scale and adjusted by the on-site safety-compliance score derived from the questionnaire, yielding the daily safety indices. Finally, these indices are weighted and aggregated to obtain the project-level NMF-SI.
By quantifying these diverse factors, the NMF-SI enables planners and safety managers to identify high-risk periods, evaluate the effectiveness of current safety protocols, and make informed decisions to mitigate hazards. This mirrors the preventive design principles outlined by existing studies [
7,
9,
34] where quantitative metrics guide proactive interventions. Ultimately, this index aims to support proactive safety management by translating complex site conditions and planning structures into a single, interpretable value that guides continuous improvement in construction safety performance.
2.2.1. Safety Measures and Best Practices on Construction Sites
In this step, a quantification of the extent of implementation and ongoing maintenance of safety measures on construction sites was undertaken using a structured questionnaire developed from established safety-management frameworks. Specifically, the questions and grouping procedure were directly adapted from the study “An occupational safety risk method at construction sites using fuzzy sets” by Gürcanli and Müngen [
20], as this work was identified in the state of the art review as the most comprehensive and methodologically appropriate reference for assessing construction site safety performance through structured questionnaires. This assessment instrument draws on recognized operational standards and integrates best practice principles [
21]. Accordingly, the questionnaire items and their organization into groups follow the same structure proposed by Gürcanli and Müngen [
21], which operationalizes the implementation of recommended safety practices on construction sites and assigns a score that contributes to the overall NMF-SI.
The assessment consists of 16 items that collectively cover critical dimensions of construction-site safety. Items 1–3, gathered in Group 1, address signalling and personnel competence, specifically the adequacy of equipment for flaggers, high-visibility apparel, and operator licensing and record control. Items 4–6, classified as Group 2, concern equipment identification and intrinsic safeguards, namely posting of load and speed limits, safe positioning or blocking of implements when idle or under maintenance, and the presence and upkeep of service, emergency, and parking brake systems. Items 7–13, forming Group 3, target site-wide operational safety: compliance of off-highway vehicle operations with standards, correct application of parking brakes and chocking on inclines, availability of audible warnings and backup alarms for machines with obstructed rear visibility, provision of rollover protective structures for relevant equipment, prevention of unauthorized access to hazardous work zones, roadway condition and traffic organization within the site, and measures that prevent rollovers on inclined or unstable surfaces. Items 14–16, identified as Group 4, are crane-specific controls, covering bearing capacity and stability of crane footings, exclusion of personnel from the crane’s slewing radius, and adherence to manufacturer specifications and load-handling controls [
19,
21].
Each item is rated on a 1 to 10 scale reflecting current on-site conditions; responses are then transformed into a single continuous indicator
via weighted normalization that emphasizes higher priority controls [
18] and remains robust to occasional missing answers provided that at least one item has been completed.
Let
if item
has a valid response and
otherwise, with per-item weights
and group weights
for
(and group membership
). Equation (1) expresses the total effective weight of all answered items (S). In this formulation,
indicates whether an item was answered,
represents the weight of the group to which item belongs, and
corresponds to the relative importance of each item.
To capture the weighted compliance total, Equation (2) combines item weights with normalized response scores. Here, the normalized score
expresses the fractional compliance of each answered item, ensuring comparability across the 1–10 rating scale.
The normalized questionnaire index is then obtained in Equation (3), defined as the ratio of weighted performance to effective weight mass; if no items are answered, a small constant is returned.
Group membership and group weights are
Per-item weights reflecting the relative criticality of each control are
This implementation yields a normalized, interpretable score
that increases with better safety performance and assigns disproportionately larger penalties to low compliance with high-priority items. The value of
will influence the final computation of the NMF-SI as detailed in subsequent sections. Because the mapping from the safety-practice score to the NMF-SI is nonlinear,
ensures that noncompliance with critical safety measures is penalized more severely, reinforcing its role in capturing overall safety performance [
21].
The proposed NMF-SI framework is conceived primarily for the planning phase of construction projects, supporting decision-making during schedule generation and optimization before execution begins. This aligns with the Prevention through Design (PtD) philosophy, embedding safety as a measurable design parameter. Nevertheless, the on-site compliance questionnaire enables calibration of the model using field data, facilitating a feedback loop during the execution phase.
2.2.2. Daily Risk and Severity Assessment of the Activities
This subsection details the computation of the daily safety index
, which represents the steps shown in
Figure 2. It is defined
as be the set of activities,
as the set of calendar days in the project, and
as the set of possible accidents on the construction site, following previous studies [
15,
19]. For each day
, let
denote the activities scheduled on
. Each scheduled activity
has workers involved
, assigned working hours
(otherwise
is not considered on
), and waste generated
. Moreover, each activity is categorized by type
, which determines the possible accident types
, their accident rates per worker-hour
and the severity associated with each
, consistent with [
19].
Step 1: Probability of accident occurrence and severity. In this step, a value is computed that combines the probability of at least one accident of type r on day d for activity i with its associated severity. The probability of at least one event is obtained via a Poisson model through Equation (6), where
is the rate of the distribution [
11,
12]:
where
This probability combined with the severity associated in Equation (7) to that type of accident yields the risk-severity factor
for each activity and date:
Step 2: Interaction between activities and external factors. A representative daily factor is obtained that summarizes interactions between activities and external drivers. First, aggregation by the worst case (maximum) across risk-severity factors
is used in Equation (8) to define risk-severity factor
for the day
:
Then, external influences are computed using Equations (9) and (10): a weekday factor
to capture the variability in accident frequency and severity on certain days of the week, with some days being prone to undesired events [
14,
15], and a waste factor
reflects higher risk on high-waste days [
14]:
where
is the ISO weekday index of day d (1 = Mon, …, 7 = Sun).
where
is the maximum waste generated by any activity in the project
.
Finally, these factors are incorporated multiplicatively through Equation (11) to obtain an adjusted risk-severity factor
:
Step 3: Normalization to project size. In this step, the adjusted risk-severity factor
is normalized with respect to the project, adjusting it according to the type of activities, the number of workers, and the scope of the project. The normalization constant
is defined in Equation (12) from the worst risk-severity factor for any of the activities performed in the project, nominal daily hours, total workforce, and maximum severity:
where
represents the nominal daily working hours;
is the total number of workers involved in the project;
The normalized daily risk-severity factor is then computed through Equation (13), where
is also clipped to prevent it from distorting the subsequent mapping to the daily safety index:
On this scale, represents the highest daily risk-severity ceiling compatible with the project size and smaller values indicate proportional fractions of that ceiling.
Step 4: Accounting for safety measures on-site. The daily safety index
is computed through Equation (14), considering the safety-level score obtained in the questionnaire
defined in the previous section. This formula applies a nonlinear mapping that penalizes low safety measures or high risk-severity factors:
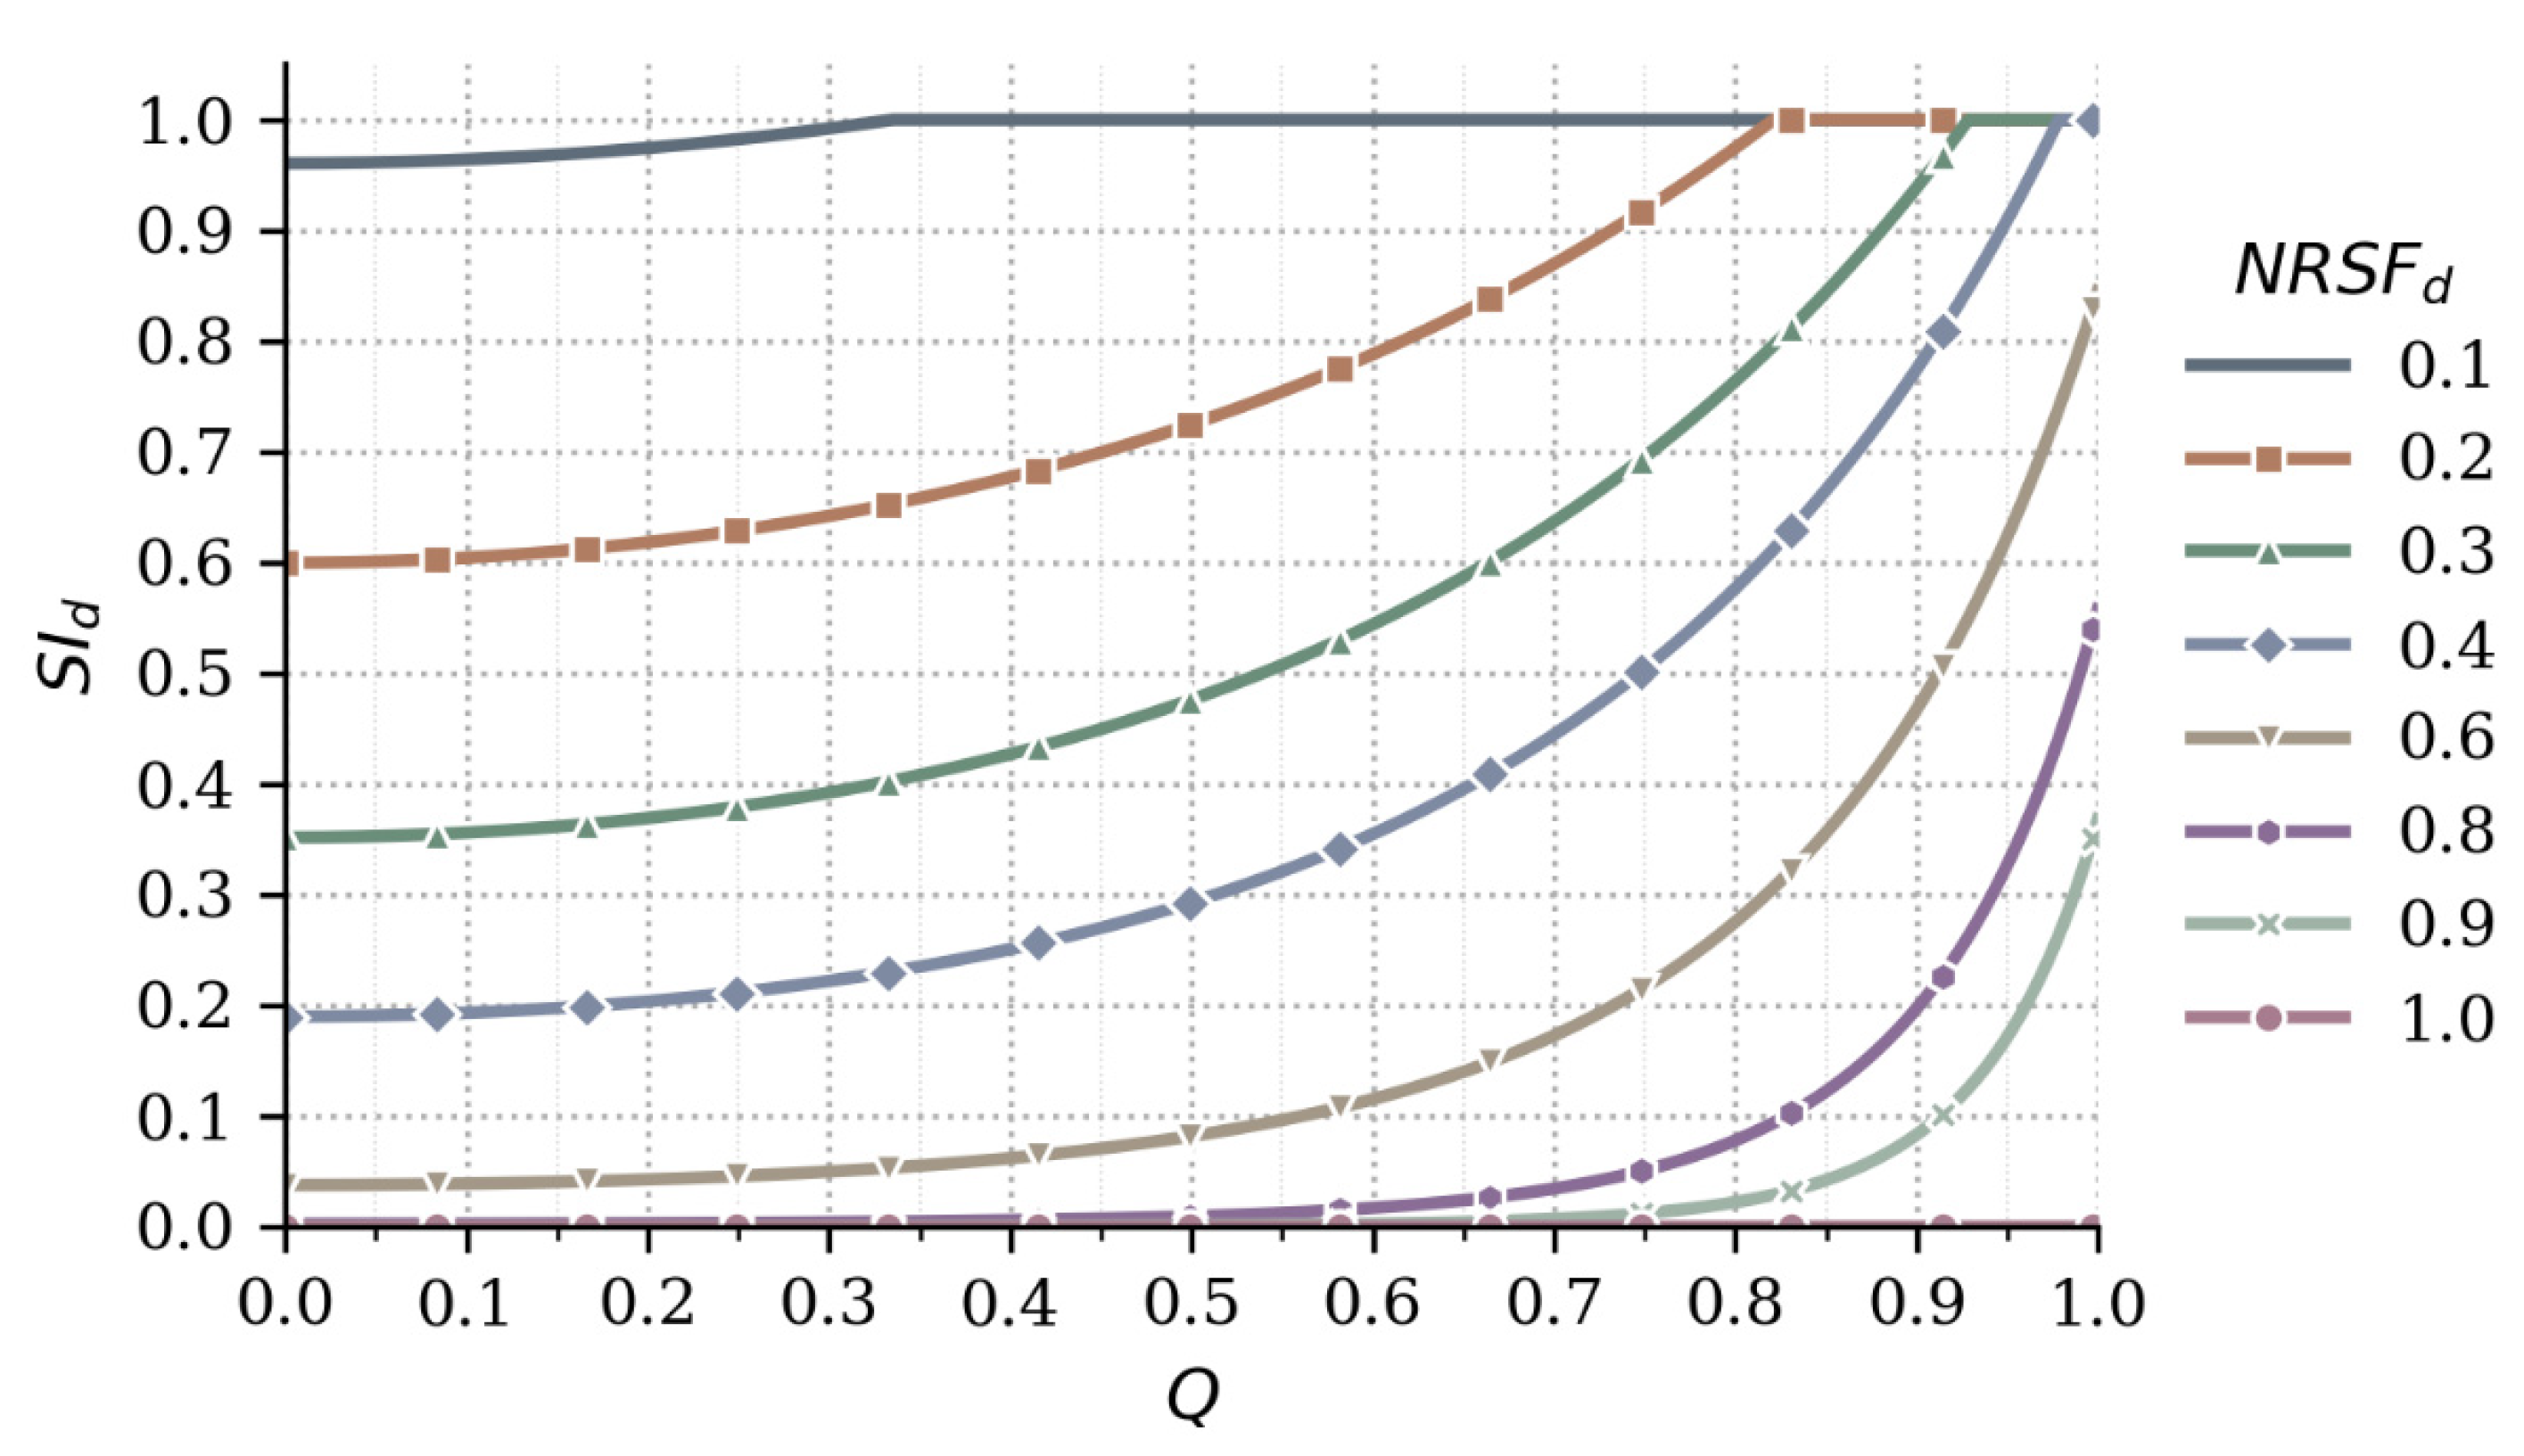
Figure 3 illustrates the joint effect of
and
on the daily safety index
. With inadequate protocols (low
),
remains low even for a modest
. Conversely, strong measures (high
) maintain high
with relatively high values of
. Nevertheless, a high normalized risk-severity factor
prevents the safety index
from being near 1, even when adequate protocols are applied (high
).
2.2.3. Weighting of Days and Overall Score
The project-level NMF-SI is computed through the aggregated daily safety levels
. However, to prioritize safety improvements, the index was designed to penalize unsafe days more strongly. A weighted average is implemented, with higher weights assigned to smaller
. First, a preliminary weight,
is computed as described in Equation (15):
Subsequently, the weights are normalized through Equation (16) to ensure a proportional contribution to the overall score, ensuring that the sum of all normalized weights over the evaluation period equals 1:
The weighted daily safety index for each day is then given by Equation (17):
Finally, the global NMF-SI of the project is computed as the sum of the weighted daily safety indices, Equation (18):
2.3. Schedule Optimization Based on NMF-SI
Once the NMF-SI was formalized as a quantitative index of project-schedule safety, planning task can be cast as an optimization problem. Given the complexity of the scheduling space and the nonlinear behaviour of the NMF-SI, particularly due to its emphasis on high-risk periods, a tailored optimization algorithm was designed to efficiently explore alternative scheduling configurations. The objective is to maximize the NMF-SI in the space of feasible schedules, while ensuring compliance with constraints such as task dependencies and workforce availability across subcontracted teams. The result sets a schedule with reasonable project duration, where the nonlinear behaviour of the index, placing greater emphasis on low-safety days, promotes activity shifts that equalize safety across the project, thus mitigating high-risk periods.
Throughout this section, is the set of subcontracted teams . Each activity has a fixed duration in days and resource demands by team and each team has a capacity . Moreover, precedence relations are defined only for a subset of ordered pairs so that if activity can start only after finishes. It may also include a minimum time lag between the activities .
The aim, defined in Equation (19), is to maximize the NMF-SI by selecting the start days
considering that activity
occupies the consecutive block of days
:
Subject to
Team capacities: for each day and team ,
The vector of the start days
induces a full schedule, denoted by
. Partial schedules used in the constructive phase of the optimization algorithm are denoted by
with
. In addition, the total completion of any complete schedule is written as
and will be computed following Equation (20):
To prevent artificial stretching of the schedule when optimizing the NMF-SI, the project duration is fixed to the constructive baseline total schedule length, denoted by
. This baseline is the minimal feasible duration when scheduling under precedence and team-capacity constraints, without considering the NMF-SI, and is computed through Equation (21), subject to the same constraints mentioned above:
This value will be a hard constraint when maximizing the NMF-SI because without this bound the index would tend to favour longer schedules that spread high-risk tasks more evenly, an outcome misaligned with realistic industrial timelines. Therefore, ensures the schedule is both operationally viable and temporally bounded.
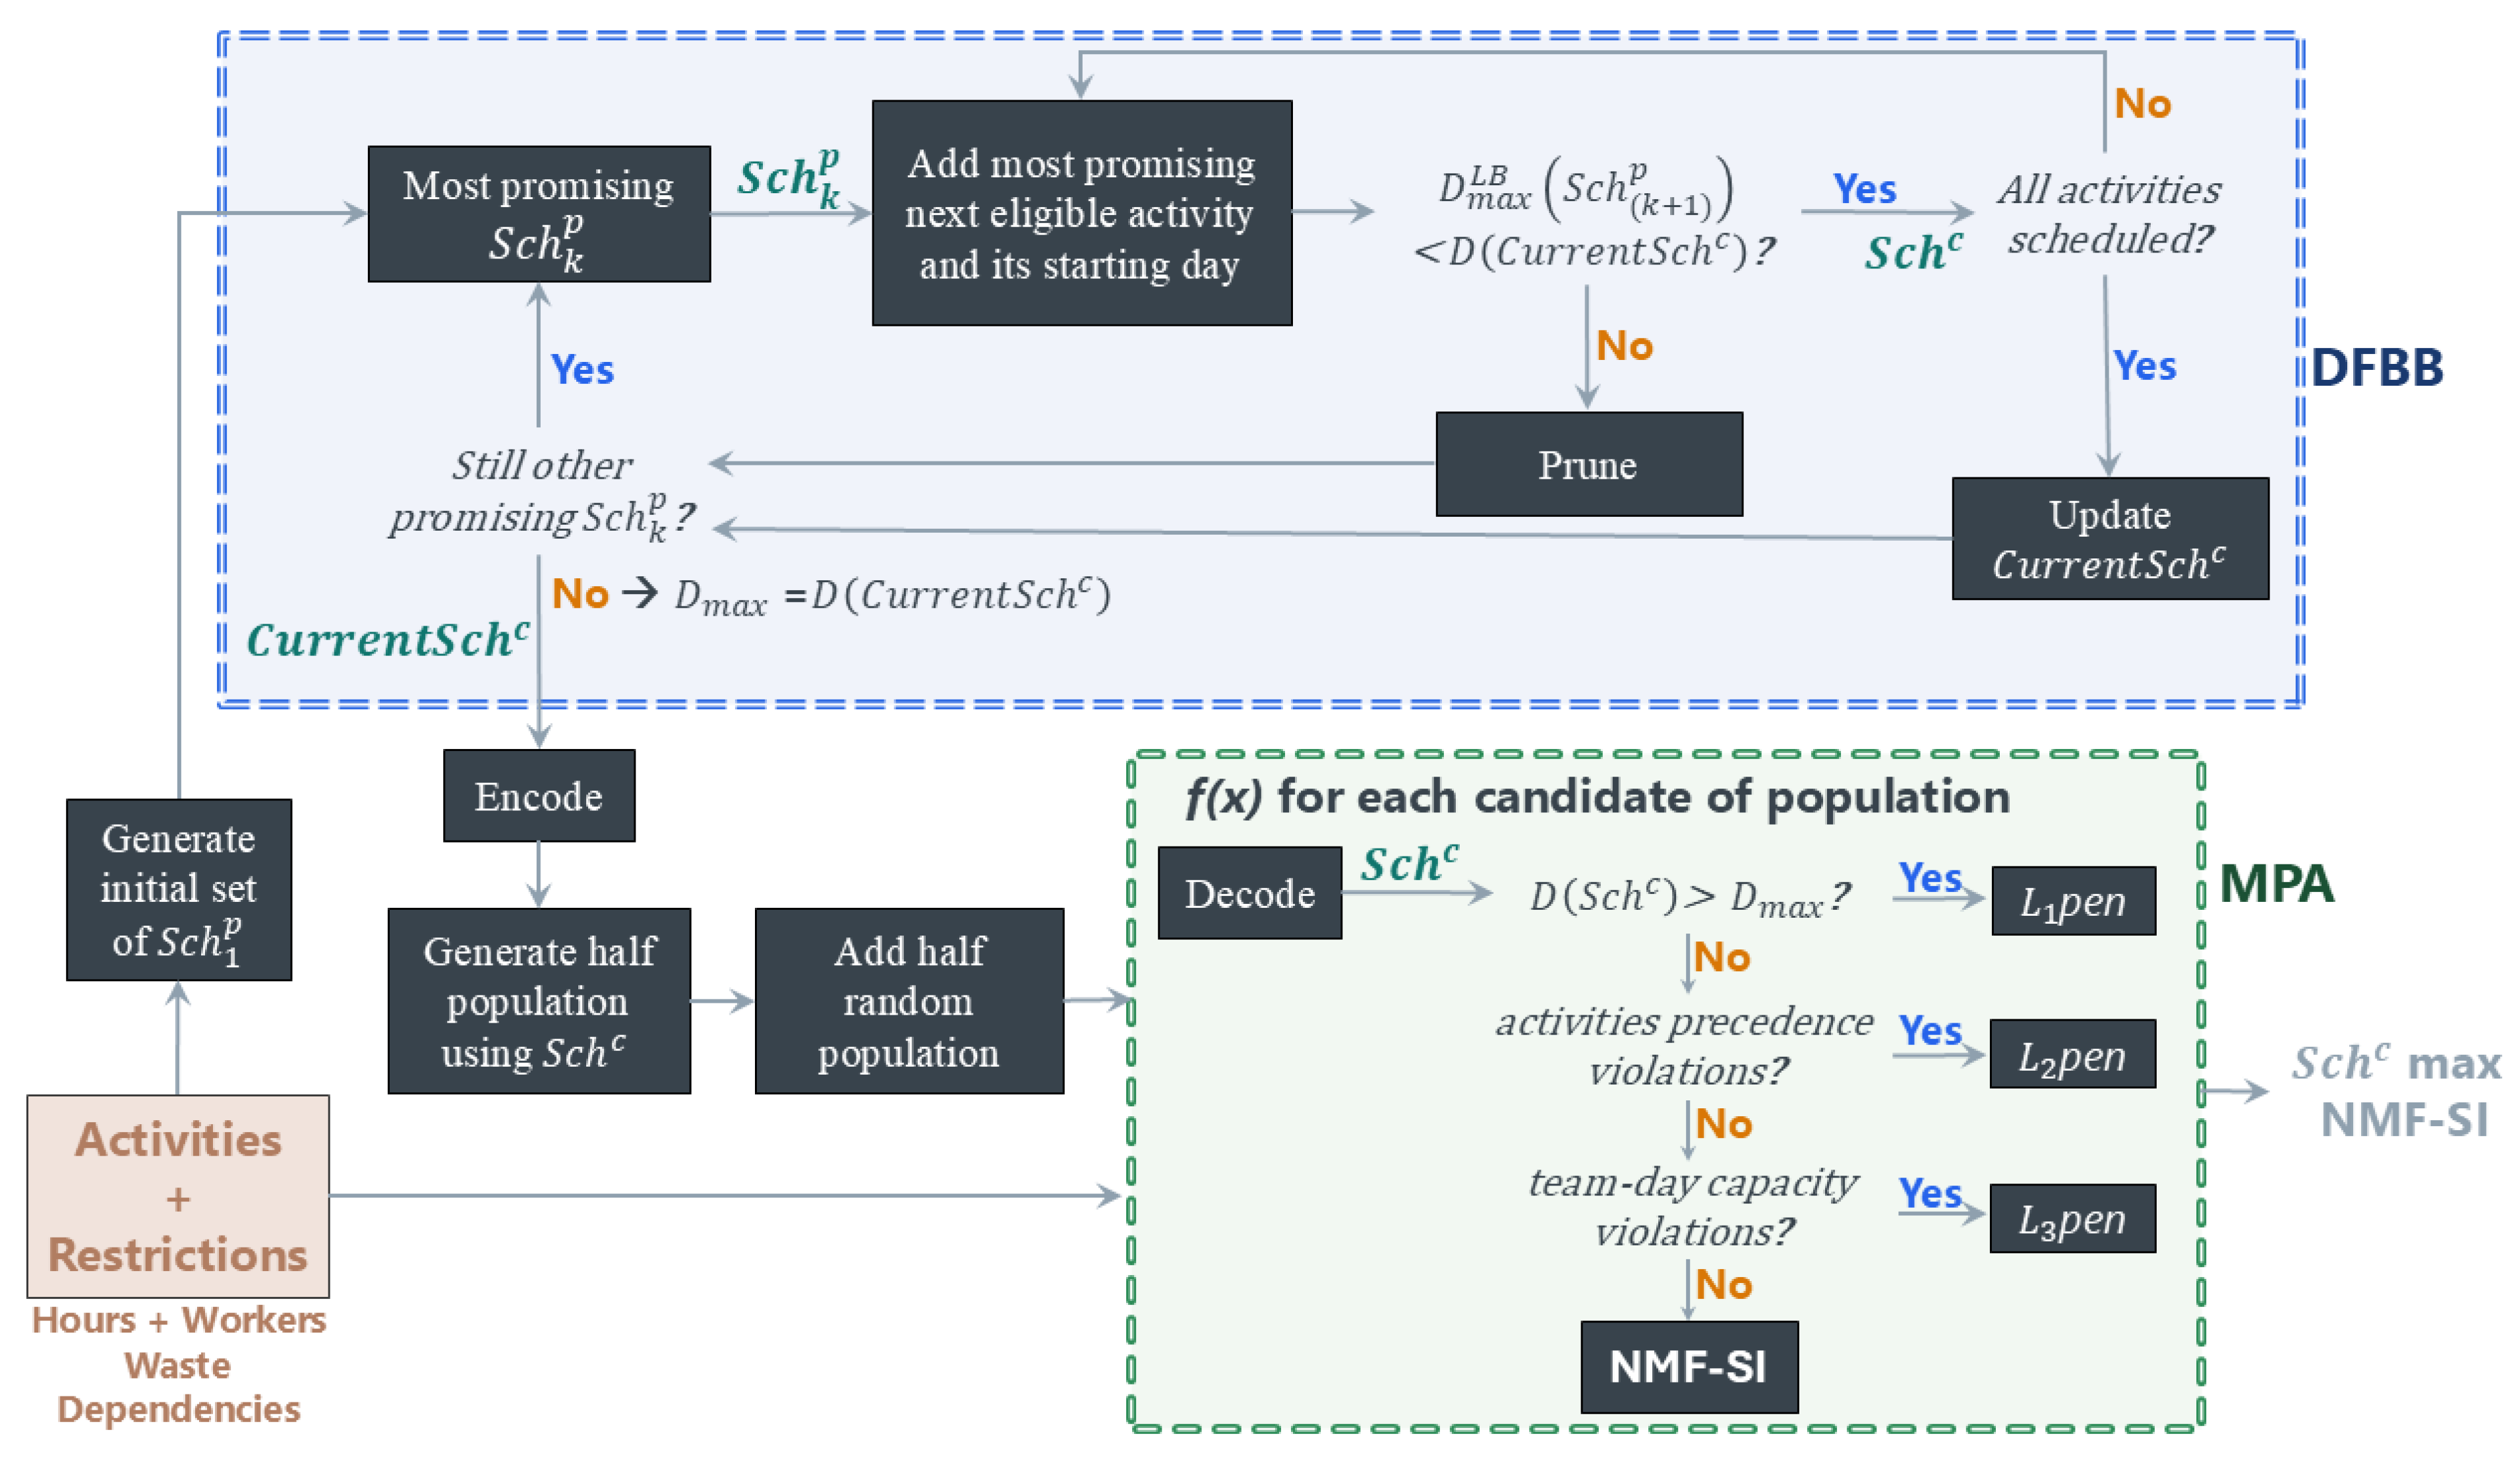
To address the problem efficiently, a hybrid optimization strategy was adopted, as shown in
Figure 4, which is a simplified flowchart of the optimization process, combining a constructive heuristic with a metaheuristic refinement phase. In phase 1, a Serial Schedule Generation Scheme (SSGS) is applied within the heuristic to obtain a complete schedule
that minimizes project duration. The search follows a Depth-First Branch-and-Bound (DFBB) exploration, where each node represents a partial schedule
(with
activities) and carries a lower bound on the overall project duration, denoted as
, estimated from (i) the current fixed placements, (ii) precedence with lags, (iii) residual team capacities, and (iv) remaining activities.
In DFBB, an incumbent full schedule , together with its duration , is defined and maintained after the initial depth-first descent from the root that reaches the first complete schedule. Branches are expanded by fixing the next eligible activity at its earliest feasible start that preserves precedence and day-wise team capacities, producing multiple new nodes with . Nodes are pruned whenever the lower bound duration carried in the node is greater than or equal to that duration ≥ . Whenever a newly completed schedule has a smaller duration, the incumbent is updated. The DFBB search continues until all branches are discarded, guaranteeing optimality. Finally, the maximum duration of the project is established as .
The outcome is a minimal-duration and operationally viable schedule . Importantly, NMF-SI is not optimized in this phase to avoid biasing the baseline toward stretched timelines; instead, is enforced as a hard duration cap in phase 2, and the resulting schedule is used as a reference to guide the initial steps of the metaheuristic search, thereby reducing the computational time.
In phase 2, the metaheuristic refines the start times of the activities to improve the NMF-SI, while preserving
and satisfying all operational constraints. The chosen metaheuristic algorithm is the Marine Predators Algorithm (MPA) [
36], introduced in 2020 and recognized in recent literature for its strong performance in complex, constraint-laden optimization problems [
37]. MPA is selected here because it requires very few hyperparameters, which simplifies tuning and avoids it becoming an optimization problem itself [
38].
The method is applied in a decoder-based manner well suited to discrete, constraint-laden scheduling. Each candidate solution is encoded as a start-day vector over all the activities, and feasibility is enforced by decoder checks, which flags them as infeasible. To steer the search effectively, fitness is designed as a penalized objective, where feasible schedules are scored by their NMF-SI (bounded in [0, 1]), whereas infeasible candidates receive a hierarchical penalty that yields a strictly negative score. Penalty is defined following the recommendation of literature [
39,
40] and experience from previous work, using ordered levels with continuous severities that quantify “distance from feasibility”. In decreasing importance, the levels are as follows: (L1) violation of the duration established in phase 1
to drive the algorithm to place all tasks within the restricted horizon; (L2) activities precedence violations to ensure dependencies are respected; and (L3) team-day capacity violations. The continuous component is computed as follows: for L1 and L2, the total number of violating days; for L3, the aggregated worker-day overload required to realize the schedule. Hierarchy is enforced via scaling coefficients
, such that any candidate violating the most important criteria is ranked below every candidate that satisfies it, and any precedence-violating candidate is ranked below every candidate that satisfies precedence, regardless of capacity surplus. Given that MPA is not gradient-based, the selection of these scaling factors is irrelevant, as long as the previous condition is satisfied.
As search operators, a moderate population size of 50 is selected to balance exploration and runtime, and the termination criterion is set to 500 epochs, which was sufficient to reach convergence in all tested instances. The initialization of population includes the baseline of phase 1 together with (i) jittered random variants in its neighbourhood and (ii) fully random solutions generated using standard initialization procedures described in the foundational works of the algorithm. The additional random solutions may include infeasible candidates, retained for diversity, which will be penalized through the decoder-based fitness.
Fixing prior to metaheuristic refinement sharply reduces the search space faced by the metaheuristic: instead of exploring schedules over an unbounded time horizon, the search is confined to rearrangements within a fixed planning horizon, which lowers dimensionality, curbs combinatorial blow-up, and accelerates convergence. This design also prevents the metaheuristic from “gaming” the objective by stretching the timeline to dilute risk, ensuring that safety improvements arise from better temporal allocation rather than longer projects. Moreover, seeding with the constructive baseline provides an immediately feasible anchor that guides early iterations and shortens time to quality. In practice, the hybrid scheme couples the speed and feasibility guarantees with the global search capability of MPA, yielding robust, computationally efficient optimization under realistic industrial constraints.


