Article

Research on Morphological Resilience and Assessment Methodology in Historic Districts: A Case Study of Jinan Historic Commercial District

1
School of Architecture and Urban Planning, Shandong Jianzhu University, Jinan 250101, China
2
School of Earth and Space Sciences, Peking University, Beijing 100091, China
3
Jinan City Planning and Design Institute, Jinan 250001, China
4
Architecture School, South China University of Technology, Guangzhou 510641, China
*
Author to whom correspondence should be addressed.
These authors contributed equally.
Buildings 2025, 15(21), 3899; https://doi.org/10.3390/buildings15213899
Submission received: 12 August 2025 / Revised: 7 October 2025 / Accepted: 17 October 2025 / Published: 28 October 2025
(This article belongs to the Section Architectural Design, Urban Science, and Real Estate)

Abstract

Current research on resilience in historic districts remains largely theoretical with limited quantitative methods. This study develops a quantitative assessment framework by integrating Conzenian urban morphology and resilience theory. Through delineating morphological regions and correlating them with resilience attributes, multiple indicators are quantified and integrated to generate morphological resilience zones. Applied to Jinan’s Historic Commercial District, the results reveal a clear spatial distribution of resilience levels—lowest along Weiliu Road, moderate around key intersections and historic areas, and highest in zones with public and well-preserved historic structures, showing an area ratio of approximately 5:8:1 across low, medium, and high resilience levels. The framework supports the classification of management units and targeted resilience strategies, demonstrating practical value for the refined conservation and management of historic districts.

1. Introduction

Historic districts serve as vital carriers of a city’s historical continuity, embodying regional cultural identity and traditional spatial patterns. However, frequent disruptions from uncertain factors pose significant challenges to preserving and sustaining their physical fabric, necessitating enhanced resilience. Current research on the resilience of historic districts remains largely qualitative and theory-driven [1], lacking systematic and reliable quantitative evaluation methods, particularly in assessing the physical-spatial dimension of resilience. Therefore, integrating the Conzenian urban morphology framework with resilience theory, this paper constructs a quantitative assessment framework for morphological resilience in historic districts [2]. Through an empirical study of Jinan’s Historic Commercial District, we aim to provide a reference for future morphological resilience research on historic districts in China.

1.1. Limitations of Traditional Expansion Planning and Risk Management in Building Resilience

While expansion planning facilitated rapid urban growth in the past, it has led to uncertainties including land resource waste, inefficient economic development, and environmental degradation [3]. These factors have increased socio-economic risks [1], making the traditional expansion model inadequate for current urban development needs. Translating urban resilience into planning and design faces two main challenges: (1) the lack of consensus on its definition has created conceptual ambiguity and implementation flexibility [4]; (2) the evaluation framework remains unclear without established assessment criteria. Furthermore, resilience planning must balance specific resilience (for sudden shocks) [5] and general resilience (for long-term stresses)-achieving this short-long-term equilibrium requires further research.

1.2. Research Gaps in Morphological Resilience of Historic Districts at Meso-Micro Scales

Current multi-scale frameworks assess resilience at regional, urban, and community levels by deconstructing it into interrelated components, then evaluating these through qualitative and quantitative data analysis [6]. However, as urban systems are fundamentally spatial in nature, such comprehensive approaches often fail to precisely capture how spatial elements evolve in terms of resilience from an urban design perspective [7]. Research and practical applications for effectively preserving and adapting historic districts’ spatial morphology remain limited, with particular gaps in quantitative resilience studies at meso-micro scales.

1.3. Feasibility of Assessing Morphological Resilience in Historic Districts

From a morphological perspective, Conzenian Urban Morphology Theory enables the decomposition of complex urban spatial structures into discrete elements, facilitating quantitative analysis. Resilience [8], as a multidimensional concept, can be integrated with traditional urban morphology analysis by selecting quantifiable indices corresponding to individual morphological elements, then applying weighted aggregation to assess morphological resilience [9].

1.4. International Case Comparison and Global Perspectives

To broaden the global perspective on resilience research of historic districts, it is necessary to refer to conservation practices from different geographical and cultural contexts. The city of Tyre in Lebanon, a UNESCO World Heritage site, offers a valuable international case with its sustainable restoration techniques for historic buildings. This case focuses on the structural maintenance and material sustainability of individual buildings, emphasizes the integration of traditional craftsmanship with modern technologies (such as GIS and BIM) in restoration, and highlights the role of community participation in long-term maintenance. This experience demonstrates a pathway to enhance the resilience of built heritage through technological integration and localized strategies under complex historical layers and ongoing environmental pressures, providing important references for understanding the diverse approaches to achieving resilience in historic districts across different contexts [10].
In addition, similar approaches have been applied in other regions, such as the use of diagnostic monitoring and adaptive reuse in European historic centers, and the integration of seismic reinforcement with heritage conservation in Mediterranean countries. These international examples underscore the importance of combining technical assessment with community engagement and policy support, reinforcing the need for a multi-dimensional resilience framework as proposed in this study.

2. Development of a Morphological Resilience Assessment Framework for Historic Districts

Guided by Conzenian Urban Morphology Theory, this study delineates morphological regions through the overlay of three fundamental elements. We establish correlations between these elements and resilience attributes, then quantify multiple resilience indicators [11]. By integrating these quantified resilience measures with the identified morphological regions, we derive “morpho-resilience zones”. This visually intuitive approach offers valuable insights for both spatial conservation and resilience assessment in historic districts [12].

2.1. Delineation of Morphological Regions

Conzenian morphology provides a systematic approach to deconstructing and analyzing urban form at meso-micro scales. This well-established theoretical framework has been effectively applied to the conservation and revitalization of historic urban districts. The concept of “morphological regions”-central to Conzenian urban morphology-is derived from three fundamental elements: (1) plan pattern (street systems, plots, and building footprints); (2) building fabric (focusing on three-dimensional spatial characteristics); and (3) land use (functional patterns of plots and buildings). The overlay of these three components forms the basis for delineating morphological regions [13].

2.2. Selection of Resilience Indicators

Urban systems should demonstrate both resistance to disturbances and capacity to recover stability when facing disruptive pressures [14]. Pressure refers to various internal and external disruptive forces or stressors that may impact urban systems, including both sudden shocks (e.g., natural disasters, economic crises) and chronic stresses (e.g., environmental degradation, socio-economic inequalities). These pressures challenge the stability and functionality of historic districts, testing their ability to resist, absorb, and recover from disturbances. This study selects five key resilience attributes-connectivity, modularity, diversity, robustness, and redundancy-as primary morphological resilience indicators [15], based on their relative importance, research relevance, and operational feasibility. Each primary indicator comprises secondary qualitative and quantitative measures (Table 1). It enable direct morphological analysis and quantification. These secondary indicators can be mathematically expressed and processed through GIS platforms for data computation and visualization [16]. Ultimately, these indicators are weighted and overlaid to generate a morphological resilience raster.
The equations provided quantify key resilience attributes. For instance, the Shape Index formula calculates plot irregularity, where higher values indicate more complex geometries that may influence functional adaptability. Similarly, public facility density measurements (Tn/Sn) help assess the distribution of essential services across the study area. These quantifiable metrics enable consistent application of the framework across different spatial contexts.

2.3. Establishing Conceptual Mapping

The five selected resilience attributes—connectivity, modularity, diversity, robustness, and redundancy—serve as indicators for assessing the resilience of streets, plots, and buildings in Conzenian micro-scale urban morphological analysis [17]. This framework establishes three primary morphological resilience dimensions: “street-network dimension,” “land dimension,” and “building dimension.” Under these dimensions, 15 secondary indicators are identified for direct morphological analysis and quantification, corresponding to the five resilience characteristics [18]. It illustrates the specific relationships between resilience attributes and morphological elements [19], ultimately forming a comprehensive morphological resilience evaluation system (Figure 1).

2.4. Sensitivity and Robustness Analysis of the Assessment Framework

To address the potential uncertainty in indicator selection and weighting, a sensitivity and robustness analysis was conducted. Recognizing that the weighting values derived from the Analytic Hierarchy Process (AHP) might influence the final resilience assessment results, we tested the sensitivity of the composite resilience score to variations in the weights of the five primary resilience attributes (connectivity, modularity, diversity, redundancy, and robustness).
It is acknowledged that the AHP method relies heavily on expert judgment for the pairwise comparisons, which may introduce a degree of subjectivity into the weighting process. To mitigate this limitation and enhance the objectivity of the results, several measures were implemented. First, a panel of experts with diverse backgrounds in urban planning, heritage conservation, and resilience theory was engaged to provide a balanced perspective. Second, the consistency ratio (CR) was strictly enforced (CR < 0.1) to ensure the logical coherence of each expert’s judgments, filtering out inconsistent responses. Despite these measures, the potential for subjectivity remains an inherent characteristic of the method.
A one-at-a-time (OAT) sensitivity analysis method was employed. Specifically, the weight of a single attribute was increased or decreased by 10% while proportionally adjusting the weights of the remaining four attributes to maintain a total sum of 1. The composite resilience grid was recalculated for each scenario. The results indicated that the overall spatial pattern of morphological resilience zones remained largely stable. However, the classification of specific marginal plots, particularly those located at the boundaries between low and medium resilience zones, was sensitive to changes in the weights of the most influential attributes—namely, robustness and diversity. This suggests that while the macro-level conclusions are robust, micro-level management decisions for borderline areas should consider this inherent uncertainty.
Furthermore, the robustness of the weighting choices was reinforced by the high consistency ratios (CR < 0.1) obtained from the expert questionnaires during the AHP process, indicating logically coherent judgments. Nevertheless, the selection of secondary indicators inherently involves a degree of subjectivity. Future research could employ more advanced techniques, such as Monte Carlo simulation, or alternative weighting methods like the entropy weight method to more comprehensively quantify uncertainty and reduce reliance on expert judgment.

2.5. Consideration of Temporal Dynamics

The assessment framework presented in this study provides a static snapshot of morphological resilience at a specific point in time. While this offers a crucial baseline for understanding the spatial distribution of resilience capacities, it does not explicitly address the temporal dynamics of resilience—that is, how these capacities evolve, degrade, or enhance in response to chronic stresses, sudden shocks, conservation interventions, or urban development over time.
Capturing these dynamics would require longitudinal data tracking changes in morphological elements (e.g., building conditions, land uses, street connectivity) and recurrent resilience assessments. Such an approach would reveal pathways of resilience evolution and the long-term effectiveness of management strategies. Acknowledging this limitation, the current static assessment constitutes the essential first step. Future research should aim to establish time-series data collection and employ dynamic modeling techniques to monitor and predict the temporal trajectories of morphological resilience, thereby transforming the framework from a diagnostic tool into a prognostic one for adaptive management.

3. Case Selection for Morphological Resilience Implementation in Historic Districts

3.1. Research Subject

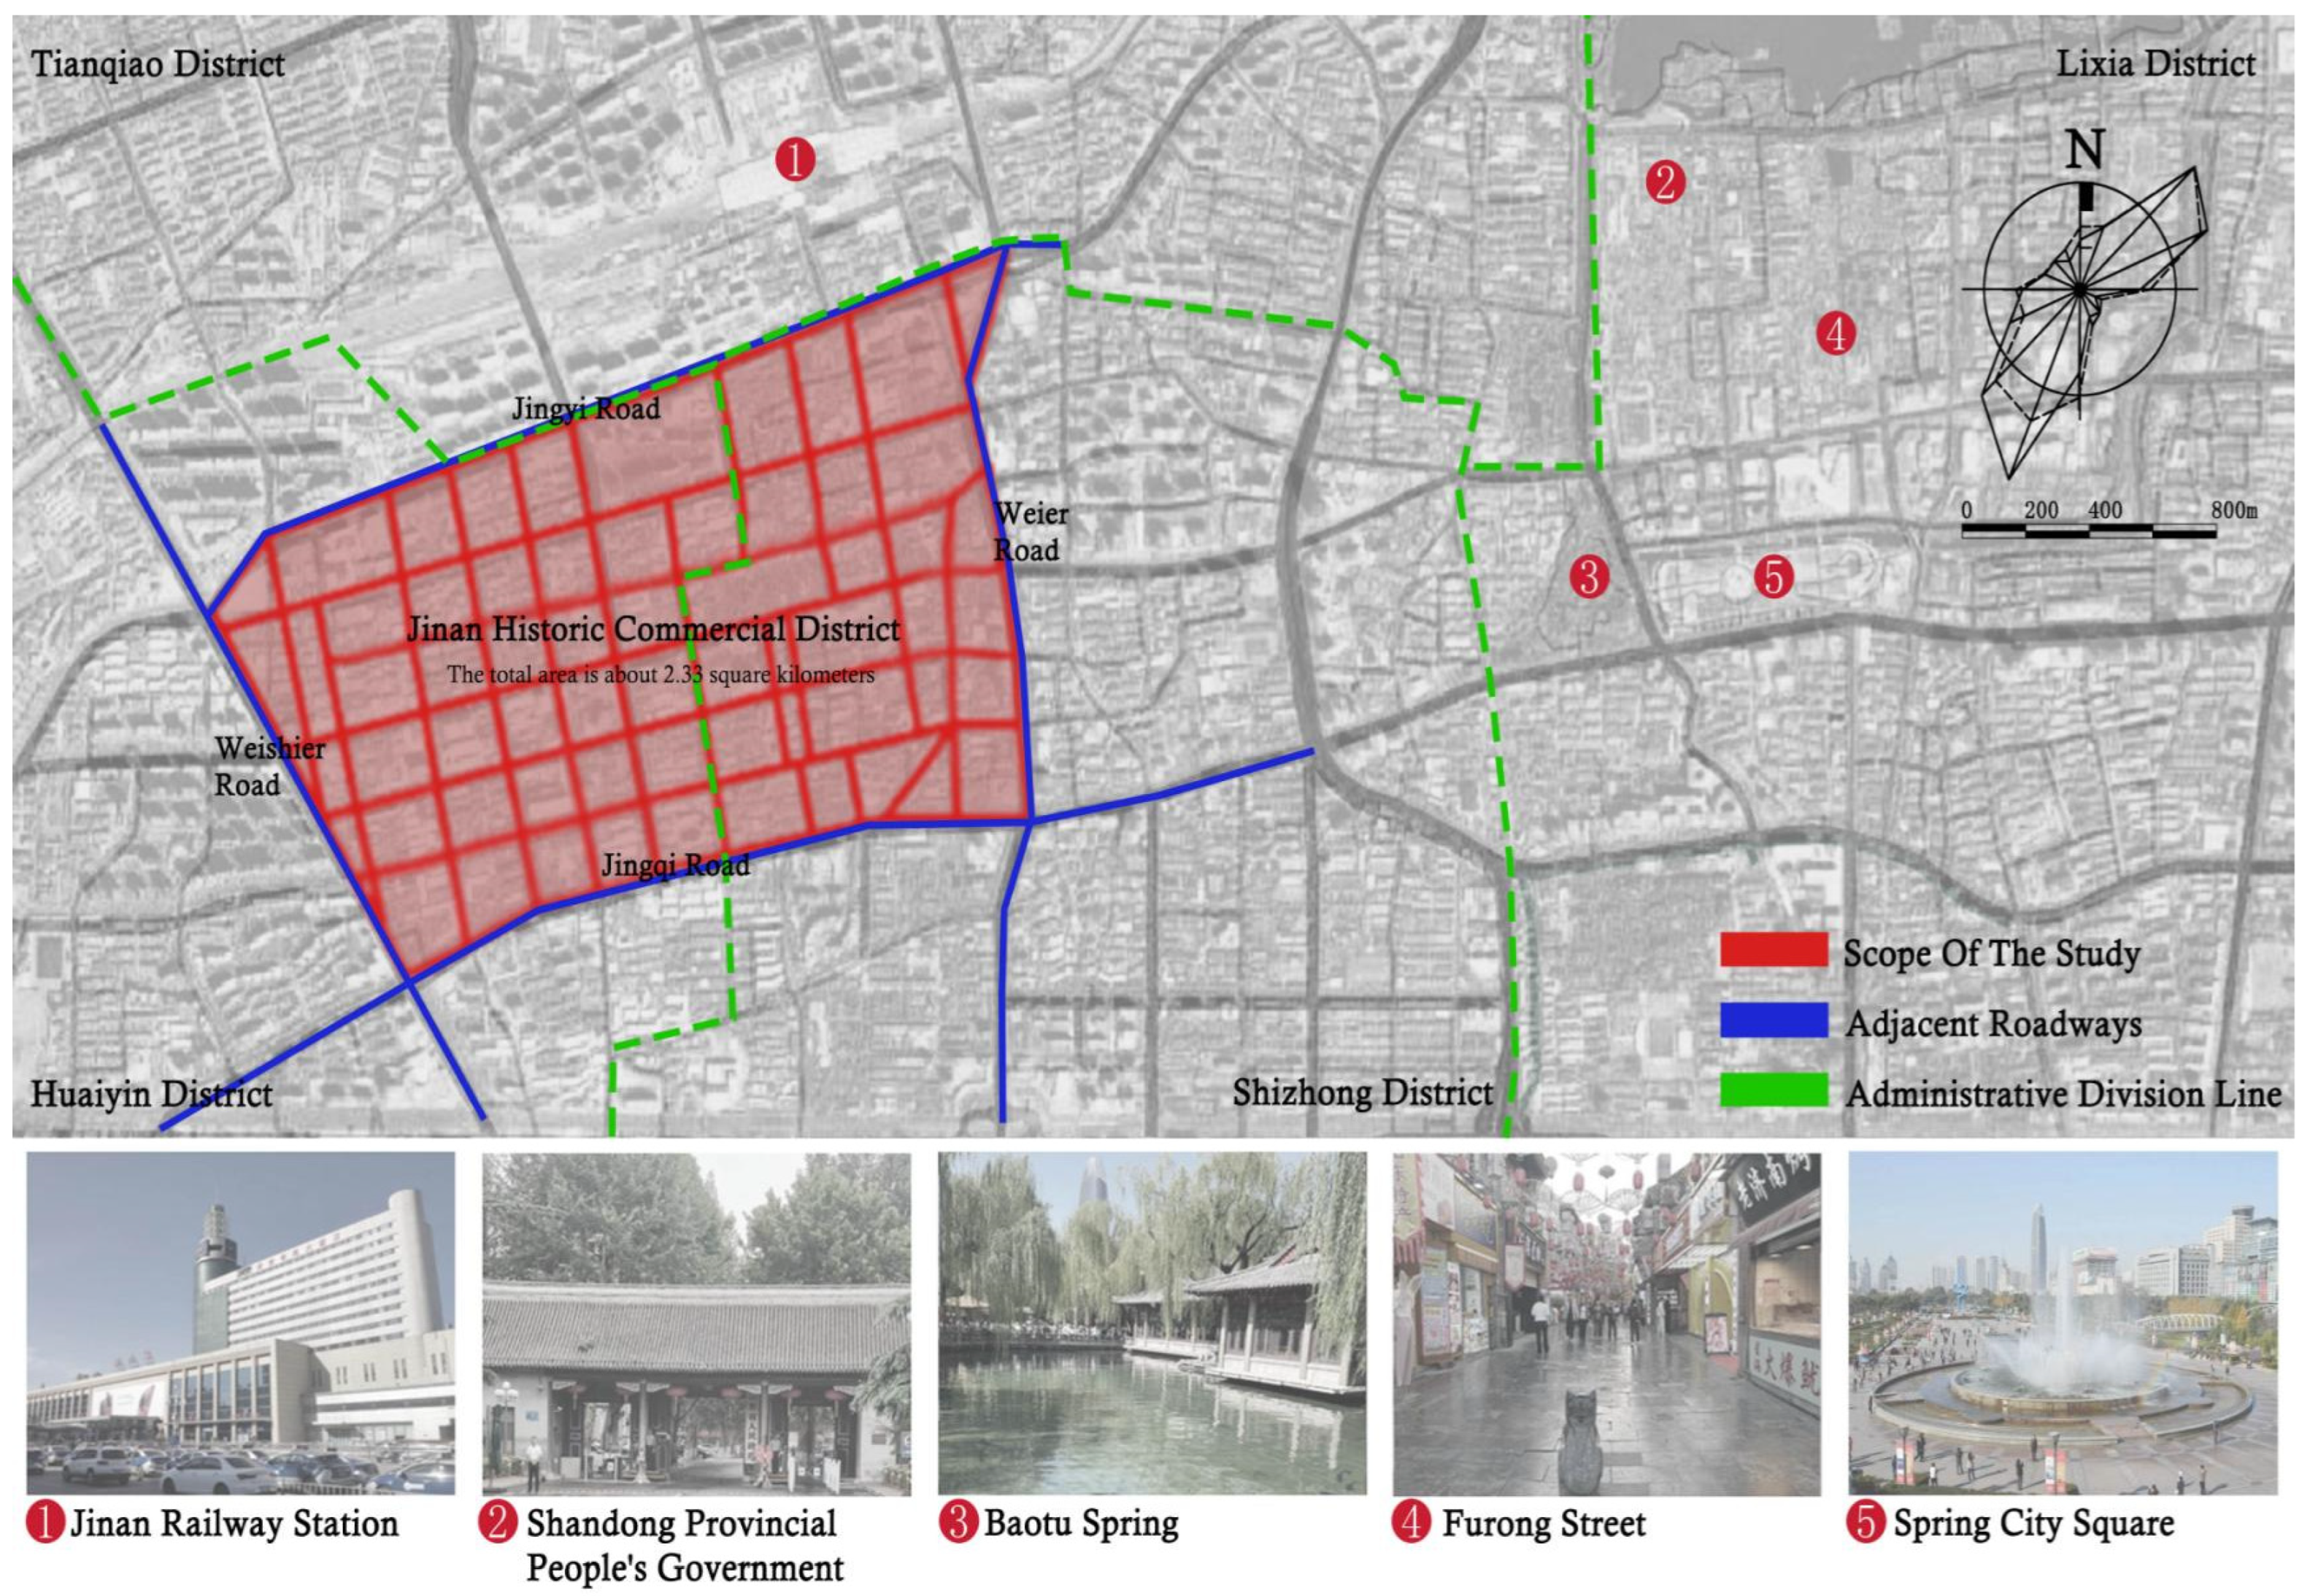
Jinan, designated as a National Historical and Cultural City by China’s State Council, features its former Commercial District as a pioneering self-opened treaty port from the late Qing Dynasty. This area encapsulates a century of urban development and economic transformation in modern Jinan. Our study focuses on this district, now located southwest of Jinan’s ancient city center and adjacent to the Jiaozhou-Jinan Railway to the north. The specific study area is bounded by Weier Road, Weishier Road, Jingyi Road, and Jingqi Road (Figure 2).
The rationale for selecting Jinan’s Historic Commercial District as the case study is grounded in its singular historical significance and morphological typicality. As one of the earliest self-opened treaty ports in the late Qing Dynasty, it embodies a unique fusion of indigenous commercial culture and foreign influences, resulting in a distinctive urban fabric that has evolved over a century. This district presents a complete spectrum of morphological elements—including well-preserved historical structures, varied plot patterns, and a hybrid street network—encapsulating the evolutionary trajectory of a commercial hub under colonial and modernizing influences. Its status as a designated National Historical and Cultural City underscores its conservation value, while ongoing urban development pressures render it a critical site for resilience assessment. Thus, it serves as an exemplary case for examining the interplay between morphological complexity and resilience capacity in historic commercial districts.

3.2. Morphological Zoning of the Commercial District

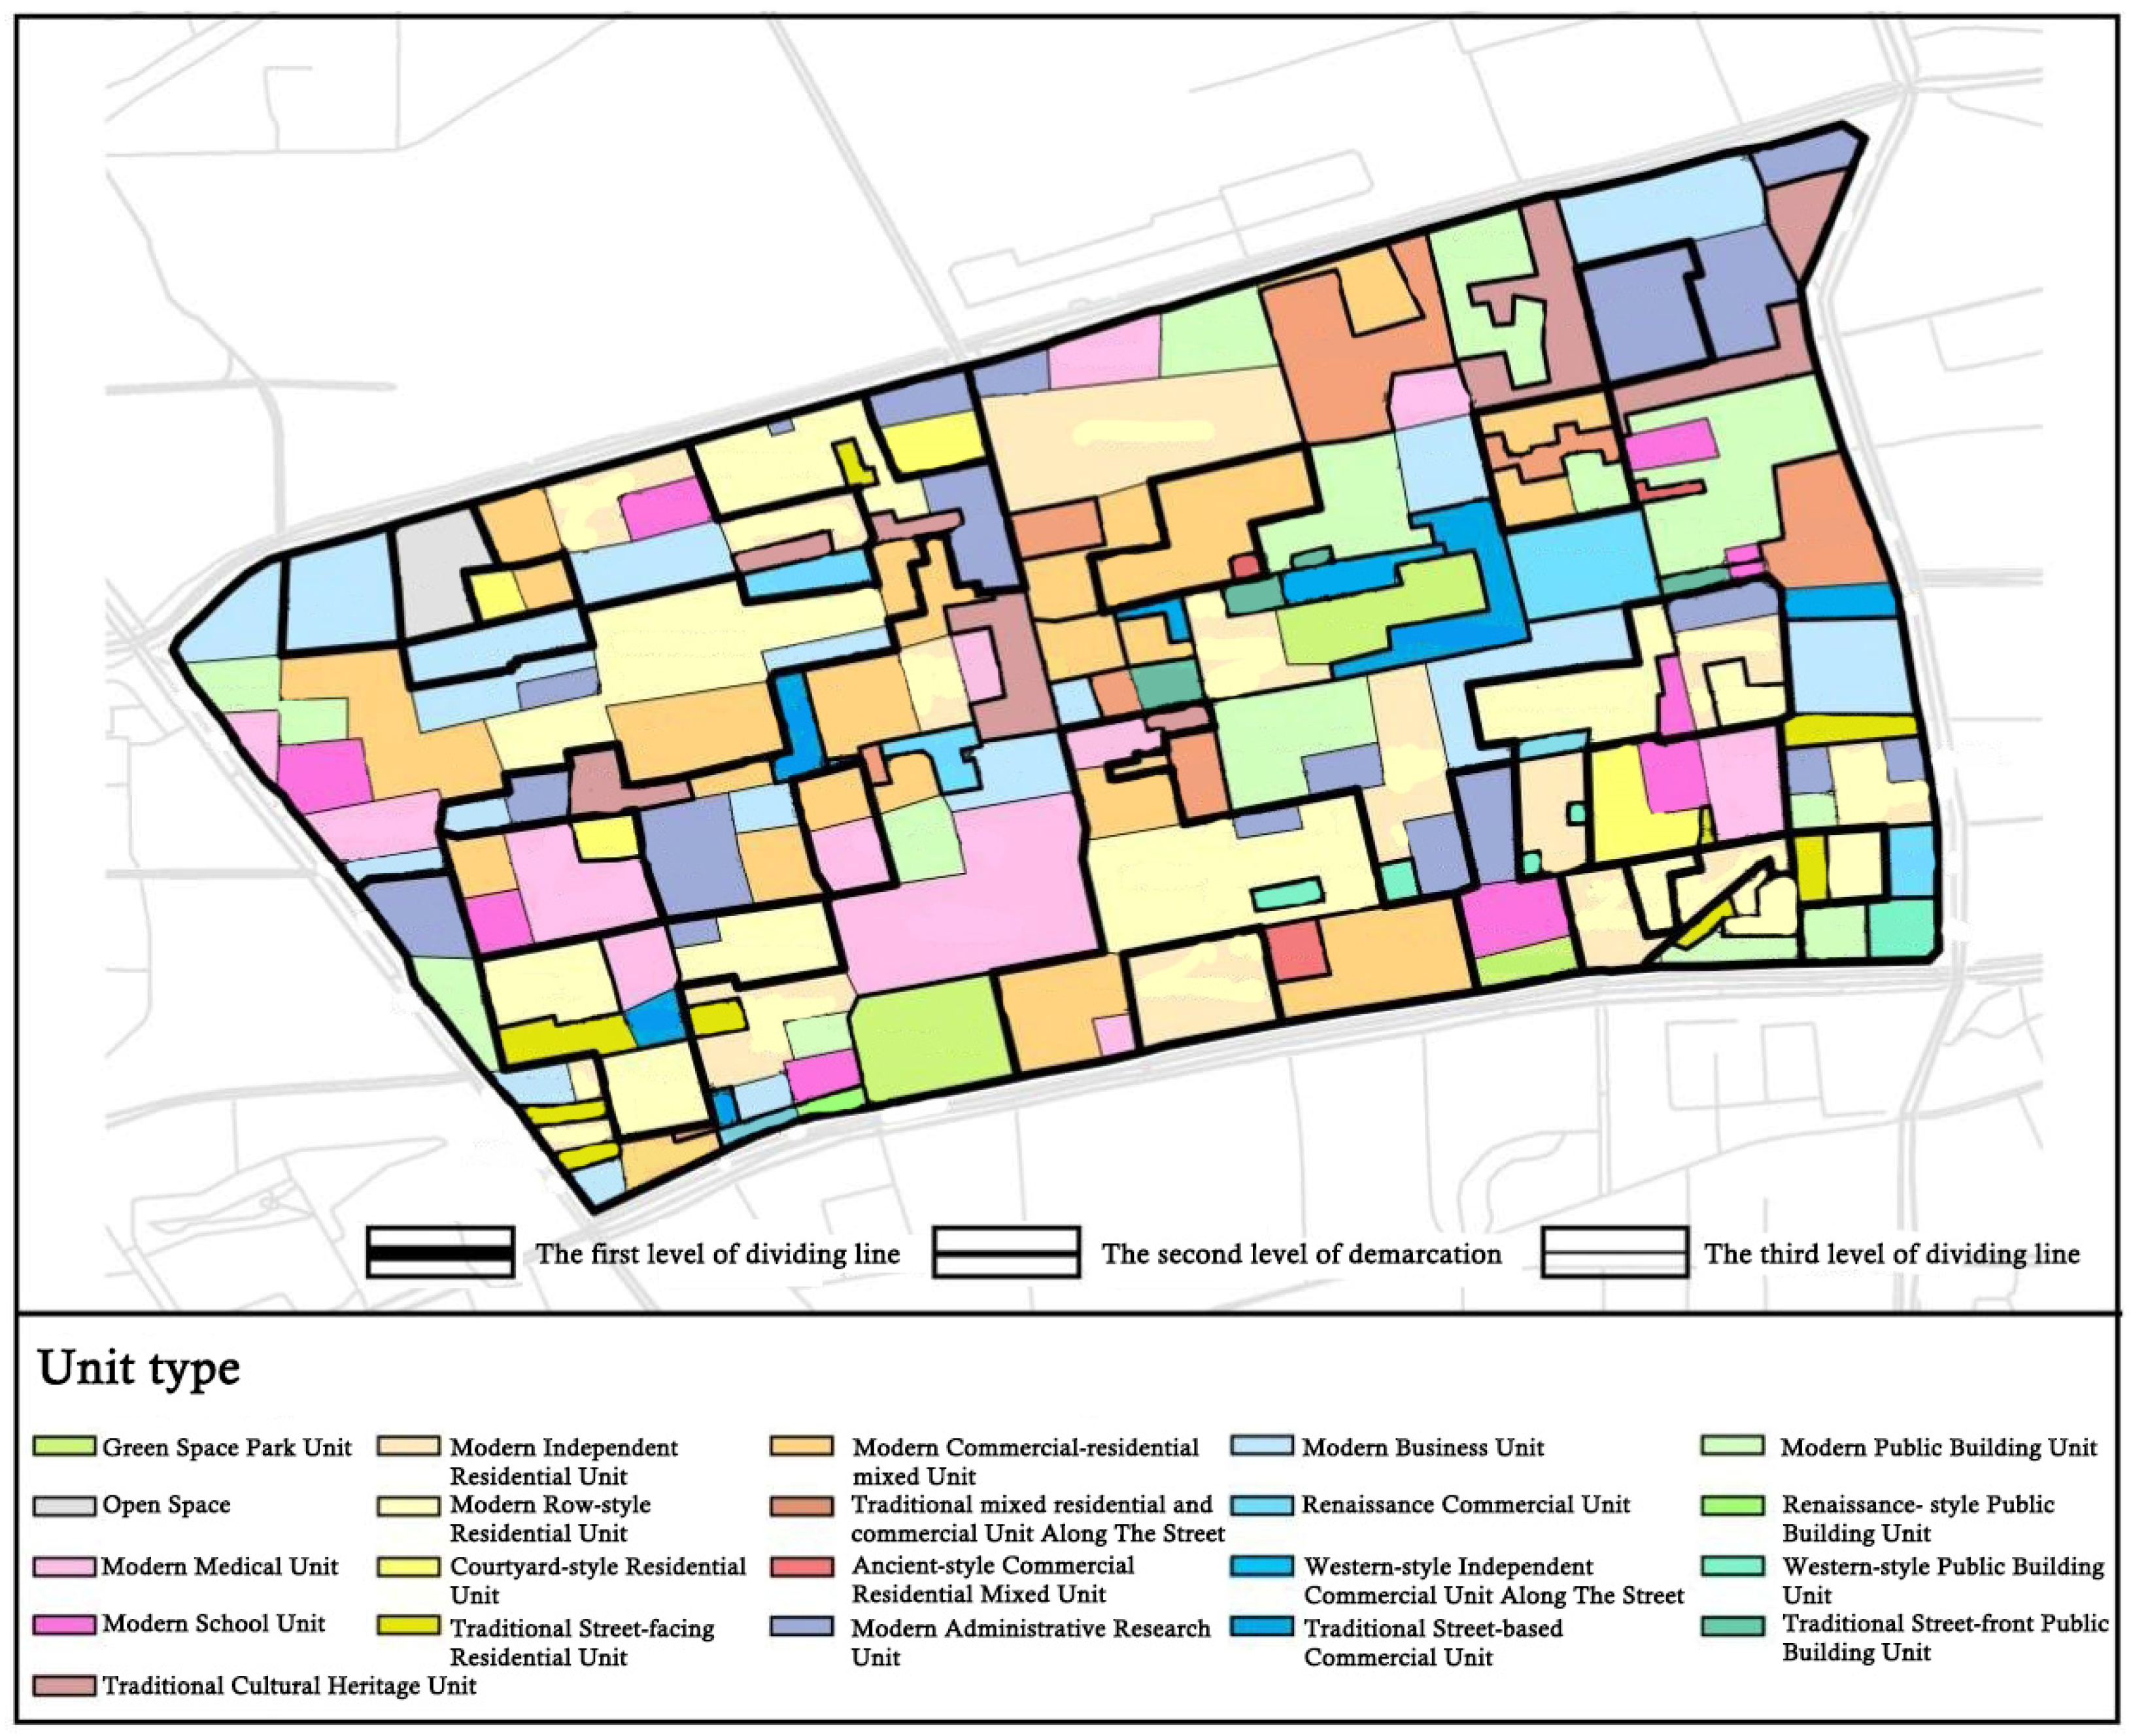
Based on Conzen’s tripartite urban morphological approach, we examine the Commercial District’s form through three aspects: spatial configuration (including street systems, plot divisions, and building footprints), architectural texture, and land use patterns [20]. By overlaying these morphological units, we delineate the district’s morphological regions. The zoning follows a three-tier hierarchy: Primary boundaries (4 regions) mark the most distinct morphological variations based on street patterns, plot configurations, and building footprint typologies. Secondary boundaries (11 units) consider architectural style and building height, including categories like modern detached units, traditional street-front units, and pseudo-historic independent units. Tertiary boundaries reflect the most dynamic factor-building function-yielding 21 total morphological units (Figure 3).

3.3. Quantitative Resilience Analysis of the Commercial District

The morphological resilience assessment evaluates three spatial dimensions (streets, land parcels, and buildings) through five primary indicators: connectivity, modularity, diversity, redundancy, and robustness [21,22,23]. Each primary indicator incorporates 2–5 secondary metrics that are quantified and then weighted to generate a composite resilience grid map [24]. This process involves the integration of both the Analytic Hierarchy Process (AHP) and Geographic Information System (GIS) methods.
AHP is indeed a method based on expert judgment and human decision-making integration. The rationale for adopting AHP in this study lies in its recognized effectiveness in handling multi-criteria decision-making problems involving qualitative and quantitative factors, particularly in contexts where empirical data alone are insufficient to determine objective weights. Given the complex and multidimensional nature of morphological resilience—which incorporates both spatial metrics and qualitative attributes—AHP provides a structured framework to systematically synthesize expert knowledge, field observations, and theoretical insights. This approach allows for the integration of diverse resilience indicators into a coherent weighting system, reflecting relative importance based on established criteria and consensus among specialists in urban morphology and historic conservation. To enhance transparency and reduce subjectivity, the AHP implementation in this study involved multiple experts in urban planning and resilience assessment. Pairwise comparison matrices were developed using the Saaty scale, and consistency checks were applied to ensure logical coherence in judgments. Furthermore, the AHP-derived weights were cross-validated with preliminary spatial analysis results to align expert evaluations with empirical spatial patterns. Thus, while AHP incorporates human decision-making, its structured and replicable nature makes it well-suited for resilience assessments where expert interpretation and prioritization are essential to capturing the nuanced interplay between morphological elements and resilience capacities.
The raster datasets for GIS interpolation were generated based on vector layers of morphological elements, including street networks, plot boundaries, and building footprints. These vectors were converted into raster format with a cell size of 5 × 5 m, determined through sensitivity analysis to balance spatial detail and computational efficiency. This resolution adequately captures the granularity of urban morphological features while maintaining analytical practicality.
Regarding the selection of interpolation technique, we employed Inverse Distance Weighting (IDW) for spatial interpolation of resilience indicators. IDW was chosen based on several considerations specific to our study context: (1) it preserves the accuracy of original measurement points, which is crucial for maintaining the validity of our field-collected data; (2) it appropriately represents the distance-decay effect of spatial influences, aligning with urban morphological principles where proximity influences are typically inversely related to distance; and (3) it provides a computationally efficient yet robust method for generating continuous surfaces from discrete point data, particularly suitable for the medium-scale analysis of historic districts.
Comparative analysis with other interpolation methods (including Kriging and Spline) confirmed that IDW produced the most coherent spatial patterns that aligned with morphological characteristics observed in field surveys. The resulting resilience surfaces effectively capture the spatial gradients and transitions between different morphological regions while minimizing artificial artifacts that might distort the resilience assessment.
(1)
Street Network Dimension
The resilience strength of street networks is characterized by connectivity, where highly connected streets in the Commercial District demonstrate greater resistance capacity [25] than less-connected tree-like street patterns.In urban historic district resilience assessment, connectivity shows an inverse relationship with resilience capacity. Using Depthmap, we analyzed five street network metrics (integration, choice, connectivity, synergy, and intelligibility), with values transformed through a distance decay model. GIS-based spatial interpolation then translated these street-level metrics into plot-level accessibility mapping across the district [26]. The resultant accessibility map displays a gradient from low (cool colors) to high (warm colors) accessibility (Figure 4). The accessibility values in Figure 4 are derived from a multi-step, quantitative spatial analysis based on Space Syntax theory, not merely proximity to wider streets. The process is as follows:
Metric Calculation using Depthmap Software: We used the street center-line map of the study area as input. Depthmap software then algorithmically calculated five key spatial configuration metrics for every street segment.
Integration: Measures the to-movement potential, or how easily a street can be reached from all others in the system.
Choice: Measures the through-movement potential, indicating the likelihood of a street being used as the shortest path between all pairs of segments.
Connectivity: The number of immediate connections a street segment has to others.
Synergy: The correlation between local and global integration, indicating how well the local street network is integrated into the overall system.
Intelligibility: The degree to which what is visible from a street (local connectivity) explains the overall layout (global integration).
Data Transformation via Distance Decay Model: The raw values from Depthmap, which are attributes of the street segments (axial lines), were not directly applicable to land plots. Therefore, we applied a Distance Decay Model. This GIS-based model calculates the influence of a street’s metric value on a specific land plot, with the influence decreasing as the distance between the plot and the street increases.
Spatial Interpolation and Composite Score in GIS: For each of the five metrics, a continuous raster surface was created using GIS interpolation techniques (specifically, Inverse Distance Weighting-IDW), translating the street-segment values and their distance-decay influence into a grid covering the entire study area. These five individual raster layers were then combined using a weighted overlay to generate a single, composite “Accessibility” score for every 5 × 5 m cell in the study area, resulting in the map shown in Figure 4. The resultant accessibility map displays a gradient from low (cool colors) to high (warm colors) accessibility. The region with the highest accessibility corresponds to the topological core of the street network, which analysis identifies as the most integrated and connected part of the system.
(2)
Land Dimension
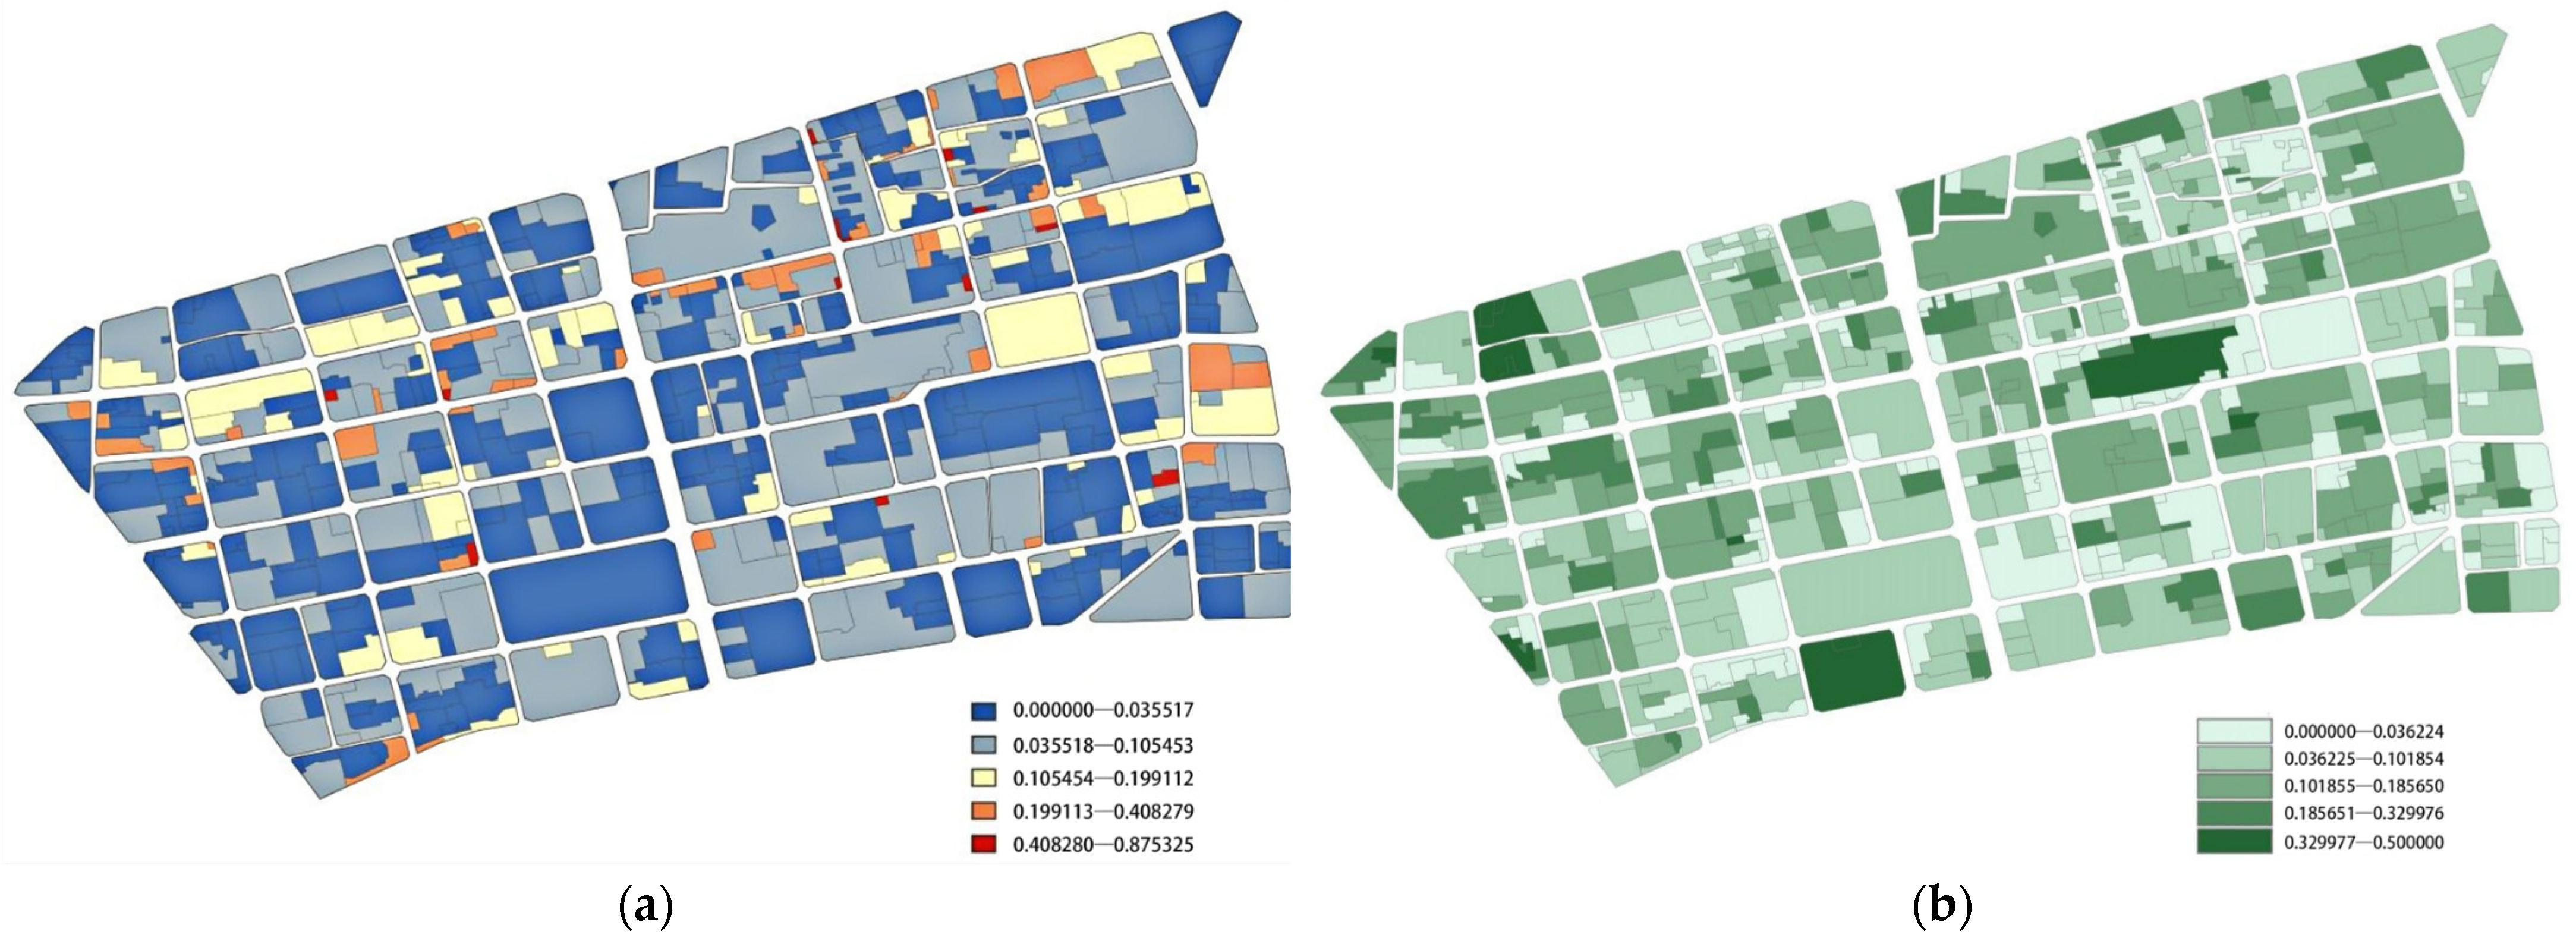
The land parcel resilience assessment employs three key indicators: modularity, diversity, and redundancy [27]. Modularity describes a system’s tendency to decompose into smaller units or aggregate into larger components [9]. Highly modular urban forms exhibit greater scalability and adaptive flexibility [28]. Our analysis reveals an inverse relationship between modularity and morphological resilience-higher modularity correlates with lower stress resistance. We evaluated parcel modularity using density, area, and shape index metrics [29]. The quantification follows these principles: A. Larger parcels indicate lower modularity and higher resilience; B. Higher shape index values suggest greater stability and long-term continuity. GIS reclassification of parcel density (Figure 5a), area (Figure 5b), and shape index (Figure 5c) generated the modularity assessment grids.
Diversity represents the most influential factor in urban fabric resilience [30]. We measure functional diversity through economic activity mixing, calculated using: Public facility density and facility mix ratio, derived from POI data collected via web-crawling technology. Higher values for both metrics indicate greater land use diversity. Both metrics show positive correlations with resilience-greater diversity enhances stress resistance. GIS-based weighted overlay of these metrics produced the land use diversity map (Figure 6a). The color gradient (blue to red) visualizes increasing facility concentration and functional mix, with warmer tones indicating higher diversity.
Redundancy refers to the availability of functionally similar components across scales [31], as well as the duplication of functions, ensuring backup systems can promptly compensate for disruptions and maintain operational capacity. Areas with high land redundancy can rapidly activate backup mechanisms during socio-environmental disturbances, better preserving urban functions and maintaining pre-existing operational patterns. Consequently, land redundancy positively correlates with morphological resilience. Green space ratio and vacant land rate were selected as redundancy metrics; both exhibit a proportional relationship with morphological resilience. Higher values of green space ratio and vacant land rate indicate greater land redundancy, enhancing a region’s resistance to external disruptions. GIS-based calculations (equally weighted formulas for green space and vacant land ratios) were used to generate the land redundancy map of the concession area (Figure 6b). In the map, a gradient from blue to red reflects higher green space/vacant land ratios, corresponding to elevated land redundancy.
(3)
Architectural Dimension
In the architectural dimension, robustness is used to measure the resilience of historic districts. Robustness refers to the ability of a building system to withstand internal and external shocks and stresses without significant loss or degradation of its primary functions. The structural integrity and material quality of buildings partly determine their stability when subjected to disturbances. Older buildings generally exhibit greater resistance to socio-environmental disruptions, reflecting higher stability. Here, building robustness is assessed using three indicators: structural type, age, and material quality. Buildings with higher-quality materials and longer construction histories demonstrate greater robustness and morphological resilience. Using GIS, we reclassified and weighted (2:5:3 ratio) spatial data on building structure, age, and quality to generate a robustness raster map of the concession area (Figure 7).
(4)
Comprehensive Morphological Resilience
Drawing on existing resilience assessments and expert interviews, this study quantifies indicator weights for street networks, land use, and architecture using the Analytic Hierarchy Process (AHP) [32]. GIS-based spatial analysis was then applied to integrate these weighted indicators, yielding a comprehensive evaluation of morphological resilience across the concession area.
This study established an evaluation framework for morphological resilience in the concession area using the Analytic Hierarchy Process (AHP), comprising 15 assessment indicators. We employed a 1–9 scale to construct judgment matrices, with relative weights of indicators at each level calculated.
The application of the 1–9 scale for constructing the pairwise comparison matrices in the Analytic Hierarchy Process (AHP) is clarified as follows. The fundamental scale of absolute numbers (1–9) was employed to quantify expert judgments on the relative importance between every two indicators within the same hierarchical level (e.g., among the five resilience attributes: connectivity, modularity, diversity, redundancy, robustness). Specifically:
A score of 1 indicated that two indicators were of equal importance. A score of 3 signified that one indicator was moderately more important than the other. A score of 5 represented strong importance. A score of 7 indicated very strong importance. A score of 9 denoted extreme importance. The intermediate values of 2, 4, 6, and 8 were used to express shades of judgment between these adjacent levels.
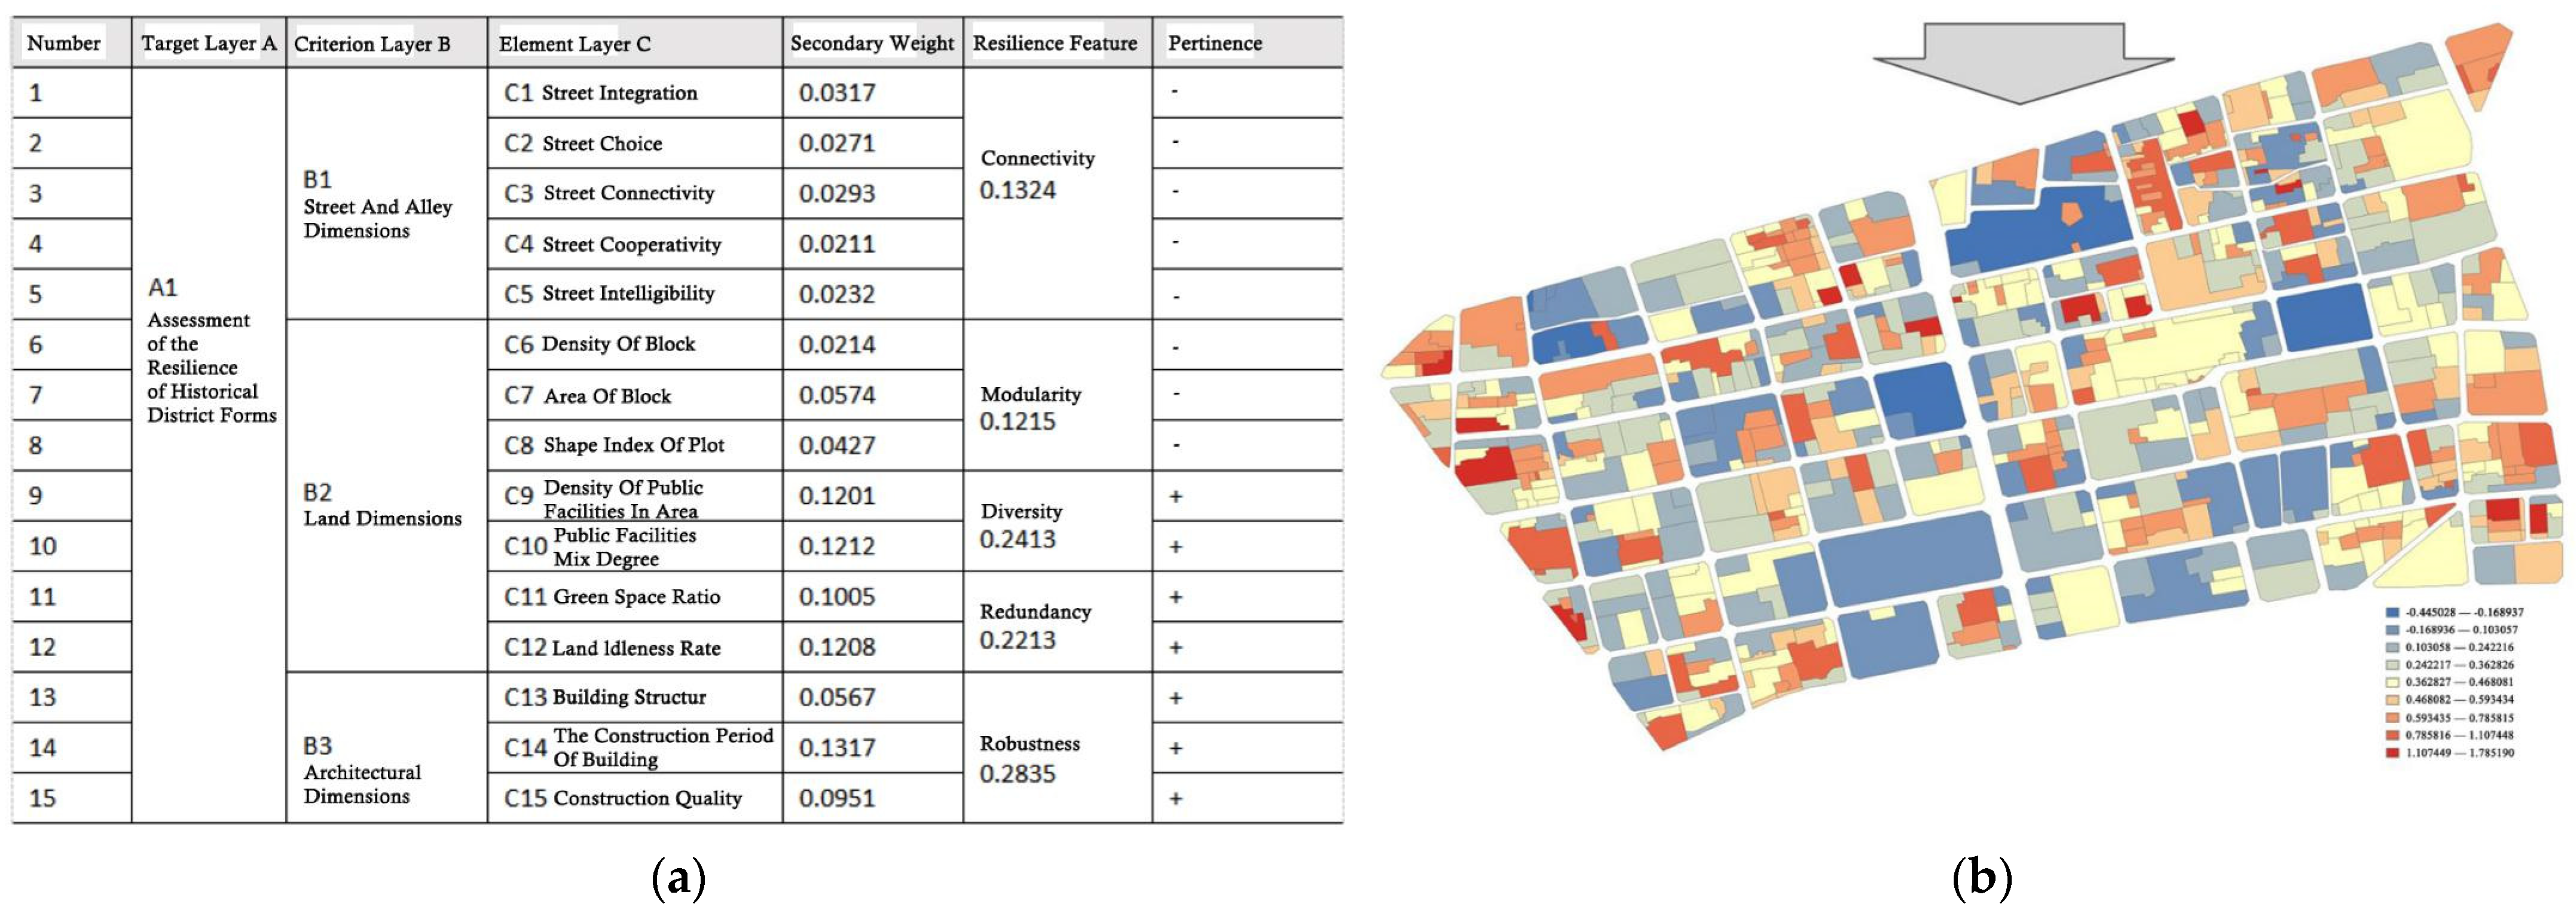
Experts in urban planning and resilience assessment were invited to perform these pairwise comparisons based on this scale. For example, if an expert judged ‘robustness’ to be strongly more important than ‘connectivity’ for the morphological resilience of historic districts, this relationship was assigned a value of 5 in the corresponding cell of the judgment matrix. These matrices were constructed, which subsequently calculated the eigenvector to derive the local weights for each indicator and performed a consistency check (Consistency Ratio < 0.1) to ensure the logical coherence of the expert judgments. This process objectively translated qualitative expert preferences into the quantitative weights presented in Figure 8a. Results indicate robustness (0.2835), diversity (0.2413), and redundancy (0.2213) carry higher weights in resilience attributes, while modularity (0.1215) and connectivity (0.1324) show relatively lower importance (Figure 8a).For GIS spatial analysis, we first determined positive/negative correlations between indicators and resilience performance, then applied weighted overlay to generate a comprehensive resilience distribution map (Figure 8b).The output visualization uses a color gradient where cool tones indicate lower resilience and warm tones denote higher resilience levels.
Overall, resilience levels are relatively low along both sides of Weiliu Road, moderate around the Jing’er Road/Weishi Road intersection and the Jingthree Road historic area, and particularly low in certain street-side residential zones. Areas exhibiting higher resilience primarily contain public buildings and well-preserved historic structures.

3.4. Morphological Resilience Zones in the Concession Area

Through GIS raster overlay analysis, we integrated the morphological zones with resilience assessment results to delineate morphological resilience zones (Fi). The resulting map introduces high, medium, and low resilience classifications as a fourth-tier categorization within the existing morphological zoning framework.
The map employs a multi-color scheme to distinguish morphological types, with color intensity within each hue representing resilience levels-lighter shades indicate lower resilience while darker shades denote higher resilience. The nine primary morphological resilience units are illustrated (Figure 9).
The zoning results reveal an approximate 5:8:1 area ratio of low, medium, and high morphological resilience levels in the concession area. Two key challenges emerge: (1) modern-style zones exhibit particularly low resilience, exacerbating urban landscape coordination issues; and (2) inconsistent conservation efforts have created significant resilience variations among traditional-style zones.

3.5. Sensitivity of Research Results to Spatial Resolution

The spatial resolution adopted in this study—5 × 5 m—was determined through iterative sensitivity analysis to balance the need for capturing morphological details and maintaining computational efficiency. This resolution significantly influences the research outcomes in the following aspects: Spatial Accuracy and Feature Representation: The 5-m resolution adequately captures key morphological elements typical in historic districts, such as individual buildings, narrow lanes, and small-scale open spaces. While higher resolutions (e.g., 1 m) could provide more detail, they introduce considerable computational overhead without substantially improving the accuracy of resilience assessment. Conversely, a coarser resolution (e.g., 10 m) would oversimplify spatial features and obscure important boundaries between morphological regions. Scale Appropriateness for Meso-Micro Analysis: This resolution is particularly suitable for meso-to-micro-scale urban morphological studies. It allows for the representation of intra-plot variations while remaining consistent with district-level analytical logic, thereby supporting meaningful cross-scale comparisons. Stability of Metric Computation: Key resilience metrics—such as street integration, plot shape index, and functional mix—exhibit high computational stability and comparability at the 5-m resolution. Comparative tests with finer resolutions confirmed no significant systematic bias introduced by scale effects. Alignment with Field Observations: The spatial patterns of morphological resilience derived at this resolution show strong consistency with field survey findings, confirming that the chosen resolution effectively reflects the actual spatial structure of the historic district. Sensitivity analyses confirmed that the selected resolution ensures scientific rigor while optimizing processing efficiency and the interpretability of visual outputs.

3.6. Positioning the Results Within Global Research Paradigms

When situated within the broader landscape of international research on urban resilience and historic district conservation, the results of this study demonstrate both alignment with and distinct advances beyond existing global scholarship:
① Theoretical Integration: Bridging Morphology and Resilience: While global research has often treated urban morphological analysis and resilience theory as separate domains, this study provides a novel operational framework that successfully integrates them. It moves beyond the conceptual discussions more common in Western literature by quantitatively linking specific morphological elements—plots, street networks, building fabrics—to the five core resilience attributes. This offers a more mechanistic understanding of how physical form contributes to resilience, a question less frequently addressed in empirical studies globally.
② Methodological Resolution and Specificity: Much of the pioneering work on urban form resilience, particularly in North American and European contexts, operates at the city or regional scale using aggregated data. A key differentiation of this research is its fine-grained, meso-micro scale analysis (5 × 5 m resolution) specifically tailored for the complex morphology of historic districts. This resolution allows for the capture of nuanced spatial features often homogenized in larger-scale studies, presenting a methodological advancement comparable to, yet more specialized than, recent high-resolution urban analyses in international literature.
③ Contextual Application beyond the Western Paradigm: The empirical application to Jinan’s Historic Commercial District addresses a significant gap in the global knowledge base. The majority of established urban morphology and resilience frameworks are derived from Western case studies (e.g., Italian piazzas, German altstadts, British cores). This study demonstrates and validates the adaptability of these theories to a non-Western, Chinese urban context, characterized by its unique plot patterns, street hierarchies, and socio-cultural dynamics. It thus contributes a crucial comparative perspective, enriching the global discourse with evidence from a under-represented urban typology.
④ Synthesis and Position: In summary, while the study’s foundation in Conzenian morphology and resilience theory is informed by global scholarship, its primary contributions lie in their novel integration, contextual application, and operationalization at a finely detailed scale. The results suggest that while the core principles of resilience may be universal, their morphological manifestations and the appropriate strategies for their enhancement are highly context-dependent. This work therefore both draws upon and adds significant value to the international body of research by providing a replicable, evidence-based methodology for enhancing resilience in historic urban settings outside the traditionally studied Western contexts.

4. Strategies for Morphological Resilience Conservation and Renewal in Historic Districts

The conservation of morphological features in the commercial port area is implemented through a systematic approach involving morphological resilience management units. These units are created by integrating morphological resilience zones with distinct character typologies, classified into five categories: preservation units, enhancement units, redevelopment units, open space units, and vacant land units. To strengthen the morphological resilience of the historic commercial port district, customized strategies are formulated according to the classification of these management units. This research specifically examines preservation, enhancement, and redevelopment units, offering tailored strategic recommendations.

4.1. High-Resilience Preservation Units

High-resilience preservation units in the commercial port area represent zones where all morphological resilience indicators consistently register high values. The primary management objective is to sustain their current optimal state [33]. At the streetscape level, these units demonstrate superior performance in land-use diversity, spatial redundancy, and structural robustness indices. However, spatial constraints have prevented the development of extensive green infrastructure, resulting in limited capacity for stormwater runoff mitigation through natural permeability. Consequently, replacing conventional hard paving with permeable surfaces and grass-pavement integration is advised. Architecturally, these units primarily comprise well-preserved historical and cultural heritage structures. A dual approach of “preventive conservation coupled with context-sensitive renewal” should be implemented, utilizing subtle intervention techniques to reinforce morphological resilience while preserving historical authenticity.

4.2. Medium-Resilience Enhancement Units

Medium-resilience enhancement units exhibit suboptimal performance across multiple morphological resilience indicators, necessitating comprehensive interventions for resilience improvement. The core strategy encompasses “spatial reorganization, structural augmentation, and functional reactivation” through carefully calibrated minimal interventions. For building systems, the introduction of green roof technologies serves dual purposes: reconstructing vertical hydrological resilience and seamlessly incorporating ecological solutions into architectural spaces with minimal visual impact. Historic structures within these units should undergo conservation-focused interventions with selective functional upgrades, maintaining architectural integrity while improving usability. At the urban infrastructure level, strategic redesign of circulation networks should prioritize optimized stormwater management, establishing permeable low-impact development systems to enhance overall district resilience.

4.3. Low-Resilience Redevelopment Units

Predominating in the commercial port area, low-resilience redevelopment units demonstrate critically deficient resilience metrics, demanding fundamental transformation. The comprehensive strategy combines “urgent structural stabilization, coordinated demolition-reconstruction, and systemic reorganization” through precisely targeted interventions. Urban infrastructure improvements should focus on removing unauthorized constructions while expanding vegetated buffer zones along transportation corridors. Architectural interventions must emphasize “authentic facade preservation” principles, with reconstructed elements carefully calibrated to maintain visual harmony with their historic context through stringent dimensional and stylistic controls.

5. Conclusions

This study introduces key innovations that advance the field by systematically integrating Conzenian urban morphology with resilience theory, translating abstract principles into quantifiable, high-resolution (5 × 5 m) morphological indicators. It further proposes a novel “Morpho-Resilience Zoning” framework, replacing aggregated statistical methods with a spatially explicit approach that visualizes resilience distribution at a meso-micro scale and enables differentiated conservation strategies for historic districts. It develops a quantifiable framework that integrates Conzenian urban morphology with resilience theory, successfully translating the theoretical concept of urban resilience into a practical spatial planning tool. Key findings from the application in Jinan’s Historic Commercial District reveal:
(1)
Spatially Explicit Results: The framework identifies a clear gradient of morphological resilience, culminating in a definitive area ratio of 5:8:1 for low, medium, and high resilience levels, providing a precise evidence base for prioritization.
(2)
Dominant Resilience Factors: Robustness (0.2835), diversity (0.2413), and redundancy (0.2213) are identified as significantly more critical for resilience than connectivity and modularity in this context.
(3)
Actionable Planning Zones: The creation of “morphological resilience zones” enables targeted conservation strategies by directly linking analysis to action, facilitating the classification of areas for preservation, enhancement, or redevelopment.
This study acknowledges several limitations. Data Availability and Granularity: The reliance on multi-source data, particularly historical building attributes and functional mix data, means variations in quality and resolution could affect the accuracy of resilience quantification. Context Specificity: The framework was developed for Jinan’s Historic Commercial District, and its application to other regions with different spatial structures or cultural values requires further adaptation. Dynamic Resilience: The analysis offers a static snapshot, whereas urban systems are dynamic; longitudinal studies are needed to track resilience evolution over time. Interdisciplinary Boundaries: The assessment focuses on spatial and physical indicators, without explicit integration of influential social, economic, and institutional dimensions.
This study proposes a quantitative framework for assessing morphological resilience in historic districts, yet several research avenues warrant further exploration: Dynamic Analysis: Extending the current static approach to track resilience evolution over time in response to socioeconomic, policy, or climate changes. Socio-Economic Integration: Incorporating social, economic, and institutional factors—such as community cohesion and economic diversity—into the resilience framework. Cross-Context Validation: Testing the methodology across varying historic district types, cultural settings, and spatial scales to enhance generalizability. Data Standardization: Utilizing larger, standardized datasets and advanced decision-making techniques to improve quantification accuracy.
Furthermore, the geographical focus of this study is limited to the Jinan Historic Commercial District. While this provides an in-depth analysis of a highly representative case, the findings and the specific weightings of resilience attributes may reflect contextual factors unique to this area, such as its specific historical development trajectory, spatial structure, and socio-economic conditions. To strengthen the generalizability and external validity of the proposed framework, future research should apply it to a diverse set of historic districts across different geographical and cultural contexts (e.g., port cities, inland cultural centers, districts with varying colonial histories). Comparative studies across cases would help identify universal principles versus context-specific factors influencing morphological resilience, ultimately leading to a more robust and adaptable assessment methodology.

Author Contributions

Conceptualization, X.Y. and Z.D.; methodology, X.Y. and Z.D.; software, X.Y.; validation, B.C.; investigation, X.Y.; writing—original draft, X.Y. and B.C.; writing—review and editing, L.G.; supervision, B.C. and L.G.; project administration, Z.D.; All authors have read and agreed to the published version of the manuscript.

Funding

This research was funded by the project of National Natural Science Foundation of “Key Research Project in Philosophy and Social Sciences of Jinan Municipalit” (JNSK2025B030); “Shandong Province Social Science Planning Research Project” (23DSHJ07); “National Natural Science Foudation of China” (51761135025), which are the highest level research project in China. This research was also funded by Science and Technology Plan Project of the Department of Housing and Urban Rural Development in Shandong Provincial (2020-r3-4, 2021-k2-8,2022-r1-1) and Quancheng Industry Leading Talent Support program (innovation team) project (2020).

Data Availability Statement

The original contributions presented in this study are included in the article. Further inquiries can be directed to the corresponding author.

Acknowledgments

The authors thank the support from School of Architecture and Urban Planning, Shandong Jianzhu University (Shandong University of Architecture and Engineering).

Conflicts of Interest

The authors declare no conflict of interest.

References

  1. Jiang, H.; Luo, X.; Gong, Y.; Li, Y.; Zhao, W. Status and Trends of the Application of Resilient Urban Governance Considering the Current State of Resilient City Government in Changsha as an Example. Buildings 2025, 15, 2322. [Google Scholar] [CrossRef]
  2. Xia, C.; Zhang, A.; Yeh, A.G.O. The Varying Relationships between Multidimensional Urban Form and Urban Vitality in Chinese Megacities: Insights from a Comparative Analysis. Ann. Am. Assoc. Geogr. 2021, 112, 141–166. [Google Scholar] [CrossRef]
  3. Alyami, S.H.; Abd El Aal, A.K.; Alqahtany, A.; Aldossary, N.A.; Jamil, R.; Almohassen, A.; Alzenifeer, B.M.; Kamh, H.M.; Fenais, A.S.; Alsalem, A.H. Developing a Holistic Resilience Framework for Critical Infrastructure Networks of Buildings and Communities in Saudi Arabia. Buildings 2023, 13, 179. [Google Scholar] [CrossRef]
  4. Amirzadeh, M.; Sobhaninia, S.; Sharifi, A. Urban resilience: A vague or an evolutionary concept? Sustain. Cities Soc. 2022, 81, 103853. [Google Scholar] [CrossRef]
  5. Nicolini, E. Urban Safety, Socio-Technical Solutions for Urban Infrastructure: Case Studies. Buildings 2024, 14, 1754. [Google Scholar] [CrossRef]
  6. Wang, B.; Han, S.; Ao, Y.; Liao, F. Evaluation and Factor Analysis for Urban Resilience: A Case Study of Chengdu–Chongqing Urban Agglomeration. Buildings 2022, 12, 962. [Google Scholar] [CrossRef]
  7. Sestras, P. Methodological and the on-site applied construction layout plan with batter boards stake-out methods comparison: A case study of Romania. Appl. Sci. 2021, 11, 4331. [Google Scholar] [CrossRef]
  8. Kim, M.; Ryu, H.; Kim, T.W. A typology model of temporary facility constraints for the automated construction site layout planning. Appl. Sci. 2021, 11, 1027. [Google Scholar] [CrossRef]
  9. Keeler, B.L.; Hamel, P.; McPhearson, T.; Hamann, M.H.; Donahue, M.L.; Prado, K.A.M.; Arkema, K.K.; Bratman, G.N.; Brauman, K.A.; Finlay, J.C.; et al. Social-ecological and technological factors moderate the value of urban nature. Nat. Sustain. 2022, 2, 29–38. [Google Scholar] [CrossRef]
  10. Awad, Z. Sustainable Restoration Techniques for Historic Buildings in Tyre City. Steps Civ. Constr. Environ. Eng. 2023, 1, 10–17. [Google Scholar] [CrossRef]
  11. Nava-Díaz, R.; Pineda-López, R.; Dorantes-Euan, A. Drivers of functional composition of bird assemblages in green spaces of a neotropical city: A case study from merida, Mexico. Trop. Conserv. Sci. 2020, 13, 1940082920923896. [Google Scholar] [CrossRef]
  12. Meyer, H.; Nijhuis, S. Delta urbanism: Planning and design in urbanized deltas comparing the Dutch Delta with the Mississippi River Delta. J. Urban. Int. Res. Place Mak. Urban Sustain. 2013, 6, 160–191. [Google Scholar] [CrossRef]
  13. Dai, W.; Sun, Y.; Meyer, H.; Bacchin, T.K. Resilient planning of delta cities under climate change. City Plan. Rev. 2017, 12, 26–34. [Google Scholar]
  14. Wu, J.G. Urban ecology and sustainability: The state-of-the-science and future directions. Landsc. Urban Plan. 2023, 125, 209–221. [Google Scholar] [CrossRef]
  15. Calderón-Contreras, R.; Quiroz-Rosas, L.E. Analysing scale, quality and diversity of green infrastructure and the provision of Urban Ecosystem Services: A case from Mexico city. Ecosyst. Serv. 2017, 23, 127–137. [Google Scholar] [CrossRef]
  16. Yu, L.; Chen, C.A. Hybrud ant lion optimizer with improved nelder-mead algorithm for the structural damage detection by improving weighted trace lasso regularization. Adv. Struct. Eng. 2020, 23, 468–484. [Google Scholar]
  17. Jenerette, G.D.; Harlan, S.L.; Stefanov, W.L.; Martin, C.A. Ecosystem services and urban heat riskscape moderation: Water, green spaces, and social inequality in Phoenix, USA. Ecol. Appl. 2011, 21, 2637–2651. [Google Scholar] [CrossRef] [PubMed]
  18. Dobbs, C.; Nitschke, C.R.; Kendal, D. Global drivers and tradeoffs of three urban vegetation ecosystem services. PLoS ONE 2014, 9, e1130. [Google Scholar] [CrossRef] [PubMed]
  19. Koohsari, M.J.; Sugiyama, T.A.; Mavoa, S.; Villanueva, K.; Badland, H.; Giles-Corti, B.; Owen, N. Street network measures and adults’ walking for transport: Application of space syntax. Health Place 2016, 38, 89–95. [Google Scholar] [CrossRef] [PubMed]
  20. Li, G.; Sun, S.; Fang, C. The varying driving forces of the urban expansion in China: Insights from a spatial-temporal analysis. Landsc. Urban Plan. 2020, 174, 63–77. [Google Scholar] [CrossRef]
  21. Vosp, C. Origin of the Dutch Coastal Landscape: Long-Term Landscape Evolution of the Netherlands During the Holocene, Described and Visualized in National, Regional and the Local Palaeogeographical Map Series; Utrecht University Publishing: Utrecht, NL, USA, 2015. [Google Scholar]
  22. Rigolon, A.; Browning, M.; Jennings, V. Inequities in the quality of urban park systems: An environmental justice investigation of cities in the United States. Landsc. Urban Plan. 2018, 178, 156–169. [Google Scholar] [CrossRef]
  23. Piazza, M.; Baldessari, C.; Tomasi, R. The Role of InPlane Floor Stiffness in the Seismic Behaviour of Traditional Buildings. In Proceedings of the 14th World Conference on Earthquake Engineering, Beijing, China, 12–17 October 2008. [Google Scholar]
  24. Montello, D.R. The Contribution of Space Syntax to a Comprehensive Theory of Environmental Psychology. In Proceedings of the 6th International Space Syntax Symposium, Istanbul, Turkey, 12–15 June 2007; Available online: http://www.researchgate.net/publication/228337808_The_contribution_of_space_syntax_to_a_comprehensive_theory_of_environmental_psychology (accessed on 7 June 2022).
  25. Lai, S.; Yan, Y.; Liu, G.; Pang, X.; Li, Y.Z. A review, evaluation and reflection of the Pearl River Delta regional plan. Urban Plan. Forum 2015, 264, 12–19. [Google Scholar]
  26. Liu, T.; Tong, D.; Li, G. City linkage based on city functional network: Taking the Zhujiang River Delta as an example. Sci. Geogr. Sin. 2015, 35, 306–313. [Google Scholar]
  27. Raymond, C.; Frantzeskak, N.; Kabisch, N. A framework for assessing and implementing the co-benefits of nature based solutions in urban areas. Environ. Sci. Policy 2017, 7, 15–24. [Google Scholar] [CrossRef]
  28. Berghauser Pont, M.; Stavroulaki, G.; Marcus, L. Development of urban types based on network centrality, built density and their impact on pedestrian movement. Environ. Plan. B Urban Anal. City Sci. 2022, 46, 159–164. [Google Scholar] [CrossRef]
  29. Zhang, R. Zhujiang Delta spatial reorganization for the new urbanization development. Planner 2023, 29, 27–31. [Google Scholar]
  30. Zhao, M.; Derudder, B.; Huang, J. Examining the Transition Processes in the Pearl River Delta Polycentric Mega-city Region through the Lens of Corporate Networks. Cities 2017, 60, 147–155. [Google Scholar] [CrossRef]
  31. Hillier, B. Studying cities to learn about minds: Some possible implications of space syntax for spatial cognition. Environ. Plan. B Plan. Des. 2012, 39, 12–32. [Google Scholar] [CrossRef]
  32. Flax, L.; Korthals Altes, R.; Kupers, R.; Mons, B. Greening schoolyards—An urban resilience perspective. Cities 2020, 106, 102890. [Google Scholar] [CrossRef]
  33. Li, X.; Lv, Z.; Zheng, Z.; Zhong, C.; Hijazi, I.H.; Cheng, S. Assessment of lively street network based on geographic information system and space syntax. Multimed. Tools Appl. 2017, 76, 17801–17819. [Google Scholar] [CrossRef]
Figure 1. Correlation between morphological elements and resilience attributes in historic districts (Source: self-down by the author).
Buildings 15 03899 g001
Figure 2. Study area (Source: self-down by the author).
Buildings 15 03899 g002
Figure 3. Morphological zoning of the Commercial District (Source: self-down by the author).
Buildings 15 03899 g003
Figure 4. Land accessibility of the Concession Area (Source: self-down by the author).
Buildings 15 03899 g004
Figure 5. (a) plot density; (b) plot area; (c) plot shape index (Source: self-down by the author).
Buildings 15 03899 g005
Figure 6. (a) Land diversity (Source: self-down by the author) (b) Land redundancy (Source: self-down by the author).
Buildings 15 03899 g006
Figure 7. Architectural robustness of the Concession Area (Source: self-down by the author).
Buildings 15 03899 g007
Figure 8. (a) Indicator weights in the morphological resilience evaluation system for hist-oric districts (Source: self-down by the author). (b) Composite morphological resilience grid map of the concession area (Source: self-down by the author).
Buildings 15 03899 g008
Figure 9. Color-coding scheme for principal morphological types in the concession area’s resilience zones (Source: self-down by the author).
Buildings 15 03899 g009
Table 1. Selection of morphological resilience assessment indicators.
Resilience AttributeDefinitionFactor IndicatorsIndicator DescriptionRelevance
ConnectivityThe ability of components in an urban system to link together. High connectivity facilitates flow and diffusion, while low connectivity aids memory retention.Street integrationMeasures how strongly a single space relates to the entire spatial system.
Street choiceEvaluates whether a street serves as the shortest path, indicating its potential as a route.
Street connectivityThe number of streets directly intersecting a given axis, reflecting visibility to other blocks.
Street synergyThe alignment between local and global spatial integration, showing how well parts of the system work together.
Street legibilityMeasures how easily users can infer the overall layout from local spatial structures.
ModularThe tendency of system components to split into smaller units or merge into larger wholes.Plot densityNumber of plots/plot area
Plot areaReflecting the size and
scale of the street block
Plot shape indexIndicates block irregularity: Shape Index = Perimeter/(4 × √Area).
DiversityThe capacity to support multiple simultaneous functions, particularly in infrastructure systems.Public facility
density
Number of public facilities per unit area
  F D I n = T n S n
 Tn is the number of
facilities in plot n, and Sn
is the area of plot n
+
Public facilities
mix
Types of public facilities
per unit area
  F M I n = i = 1 N n P i P n × I n P i P n
  N n  for all facility types in plot n, P i  for plot n
  i  Number of similar
Facilities,  P n  number of
facilities in plot n
+
RedundancyCritical urban components should have backups to maintain functionality during disruptions.Green space ratioThe ratio of green space
area to planned construction land area within the
planned construction land
area
  G A R = S i S t
  S i  green space area within a given plot of land,
St Total area of a given plot of land
+
Vacant land ratioThe proportion of land area within a certain region that has not been effectively
utilized or developed
relative to the total land area of that region.
  L I R = S r S t
  S r  for the area of idle
land within a given plot,
St total area of a given
plot of land
+
RobustnessThe system’s ability to withstand disturbances without failure or loss of function.Building structureStructural types of buildings+
Building ageThe initial construction date ofthe building+
Building qualityThe construction quality of buildings+
Disclaimer/Publisher’s Note: The statements, opinions and data contained in all publications are solely those of the individual author(s) and contributor(s) and not of MDPI and/or the editor(s). MDPI and/or the editor(s) disclaim responsibility for any injury to people or property resulting from any ideas, methods, instructions or products referred to in the content.