1. Introduction
Concrete, as one of the most widely used construction materials globally [
1,
2], exhibits highly complex mechanical behavior due to its intrinsic heterogeneity across multiple scales [
3,
4]. At the mesoscale, concrete is commonly idealized as a three-phase composite (coarse aggregate, mortar, and interfacial transition zone, ITZ) [
5], and its macroscopic response is strongly governed by meso-structural descriptors such as aggregate volume fraction, shape, spatial distribution/gradation, and ITZ properties [
6,
7]. Consequently, mesoscale modeling has emerged as an indispensable tool for elucidating the fundamental relationships between microstructure and macroscopic behavior, enabling more accurate predictions of concrete performance under various loading conditions.
The development of three-dimensional mesoscale models presents significant computational challenges, particularly in the efficient and realistic placement of aggregate particles without overlap. Broadly, image-based reconstructions [
8,
9,
10,
11] provide high-fidelity meso-structures but are costly and inflexible for parametric studies, whereas parameterized approaches [
12,
13,
14,
15,
16,
17,
18] stochastically place aggregates to match prescribed gradation, shape, and volume fraction. Within the latter, the widely used “take-and-place” method [
19] is computationally efficient but faces difficulties with realistic polyhedral aggregates because robust intersection tests between irregular convex polyhedra are expensive [
20].
Previous studies have attempted to address this issue through various approximation techniques. Some researchers [
21,
22,
23] have employed circumscribed sphere methods, which simplify the intrusion detection process by checking overlaps between bounding spheres encompassing each aggregate. While computationally efficient, this approach significantly compromises geometric accuracy and typically results in artificially low aggregate volume fractions. Other investigators [
24,
25,
26] have implemented volumetric intersection checks based on point-in-polyhedron tests and face intersection calculations. These methods provide greater accuracy but incur prohibitive computational costs that scale poorly with increasing model size and aggregate count.
The Gilbert–Johnson–Keerthi (GJK) algorithm [
27,
28] offers a promising alternative for efficient collision detection between convex objects. Originally developed for computer graphics and robotics applications, the GJK algorithm computes the minimum distance between convex sets through an iterative procedure that constructs simplices within the Minkowski difference in the two sets. Its computational efficiency stems from the use of support functions that identify extreme points along specified directions, avoiding the need for explicit calculation of the entire Minkowski difference [
29]. However, the standard GJK implementation remains computationally intensive for mesoscale concrete models containing thousands of aggregate particles, particularly when only binary collision detection (rather than exact distance computation) is required. Within this context, existing improvements to GJK in graphics and robotics—covering exact distance computation (e.g., GJK+EPA [
30]), continuous collision detection [
31], warm-starting [
32], and GPU batching [
33]—are largely designed for general-purpose scenes rather than the dense, high–volume-fraction take-and-place packing of convex polyhedral aggregates considered here; in particular, they do not emphasize (i) binary-only early termination tailored to packing feasibility, (ii) aggregate-specific support-map implementations for repeated queries during sequential placement, or (iii) simplex-aware direction-update policies tuned to the geometry encountered in this application, and there is limited evidence quantifying how such specializations impact practical generation of 3D concrete mesoscale models at ≥50% aggregate volume fraction. In parallel, GPU-parallel collision/packing [
34] and deep-learning-assisted mesoscale generation are emerging, but they typically rely on specialized hardware or target different workflows; our contribution is a lightweight, CPU-side algorithm that also serves as a building block for future GPU batching.
This study introduces a modified GJK algorithm specifically optimized for rapid collision detection in the context of mesoscale concrete modeling. The enhanced algorithm incorporates several key improvements: (1) simplified initialization and termination criteria tailored for binary collision checks; (2) optimized direction update strategies based on simplex dimensionality; and (3) efficient support function implementation leveraging vertex-based calculations for convex polyhedra. These modifications significantly reduce computational overhead while maintaining detection accuracy, enabling the generation of high-volume-fraction (50%) concrete models with polyhedral aggregates within practical timeframes. The proposed approach provides an efficient solution for rapid generation of realistic 3D mesoscale concrete models, facilitating more extensive parametric studies and advanced mechanical analyses that would be computationally prohibitive with traditional methods.
The novelty and objectives are as follows:
(1) Distinct focus: a GJK formulation specialized for dense, binary-only collision checks in take-and-place packing of convex polyhedral aggregates—distinct from prior GJK advances centered on exact distances or general-purpose scenes.
(2) Method integration: coupling the optimized GJK with the take-and-place pipeline to generate realistic 3D mesoscale concrete models at high aggregate volume fractions (≈50%).
(3) Validation: numerical simulations of uniaxial compression to evaluate both global mechanical response and local failure patterns against experimental observations.
(4) Parametric Investigation: utilizing the validated model to conduct a systematic analysis of the influence of key mesoscale parameters (aggregate volume fraction, ITZ thickness, and ITZ/Mortar strength ratio) on the macroscopic compressive response and failure mechanisms.
2. Methodology
This section presents the methodology for generating three-dimensional mesoscale concrete models with high aggregate volume fractions. The workflow combines aggregate and ITZ generation, sequential placement of aggregates, and a modified GJK algorithm for efficient collision detection. The improvements to the GJK algorithm represent the core contribution of this study, enabling direct generation of realistic 3D mesoscale concrete models at high volume fractions without additional settlement procedures.
2.1. Aggregate and ITZ Generation
The generation of the mesoscale model begins with the creation of individual aggregate particles and their surrounding ITZ according to specified gradation and volume fraction requirements.
The particle size distribution of aggregates is defined by the Fuller curve, a widely used grading function in concrete technology:
where
P(
d) is the cumulative volume percentage of aggregates passing sieve size
d,
dmax is the maximum aggregate size, and
n is the gradation index. For example, with
dmax = 20 mm and
n = 0.5, the cumulative proportions for the 5–20 mm range are shown in
Table 1.
The volume of aggregate within each size interval [
di,
di+1] is calculated as:
where
Vtotal is the specimen volume and
fv is the target aggregate volume fraction.
Individual convex polyhedral aggregates are generated using an ellipsoid-based approach with controlled randomization. For an ellipsoid, the three semi-principal axes are defined as
a,
b and
c, respectively. The values of
a,
b, and
c are determined based on statistical data of actual aggregates following Zhang et al. [
35]. Specifically, the longest axis 2
a is randomly generated within the size range of the corresponding aggregate grading to ensure consistency with aggregate size distribution; the intermediate axis 2
b is calculated from the experimentally measured aspect ratio using “
b =
a/aspect ratio”, where the aspect ratio is derived from image analysis of real aggregates; and the shortest axis 2
c is obtained from the measured height distribution of aggregates to ensure realistic thickness. This procedure allows the generated semi-principal axes to reflect both the natural variability and the typical proportions of real aggregates.
Subsequently, a set of
n vertices (ranging from 20 to 30 in this study [
18]) is generated on the ellipsoid’s surface. The shape of the convex polyhedron aggregates is controlled to avoid excessive distortion. Six fixed vertices are used to define each aggregate: [−
a, 0, 0], [
a, 0, 0], [0, −
b, 0], [0,
b, 0], [0, 0, −
c], and [0, 0,
c]. For the remaining vertices, the coordinates are calculated as follows:
where
θ and
ϕ are parameters describing the position of the vertices. In polar coordinates,
θ represents the angle relative to the
X-axis, and
ϕ is the angle between the vector from the North pole to the vertex and the
Z-axis. To prevent mesh distortion during mechanical analysis, the minimum vertex spacing is set as the lower limit of the aggregate size range divided by the vertex count.
To form the convex polyhedron, the convex hull algorithm is applied to the
n vertices. Each aggregate is then assigned a random initial orientation by transforming its vertices with a randomly generated 3D rotation matrix [
36]. The generation process of a convex polyhedron is illustrated in
Figure 1.
In mesoscale modeling, the ITZ plays a critical role due to its pronounced influence on the mechanical behavior of concrete [
37]. In practice, the ITZ thickness is typically 10–50 μm [
38,
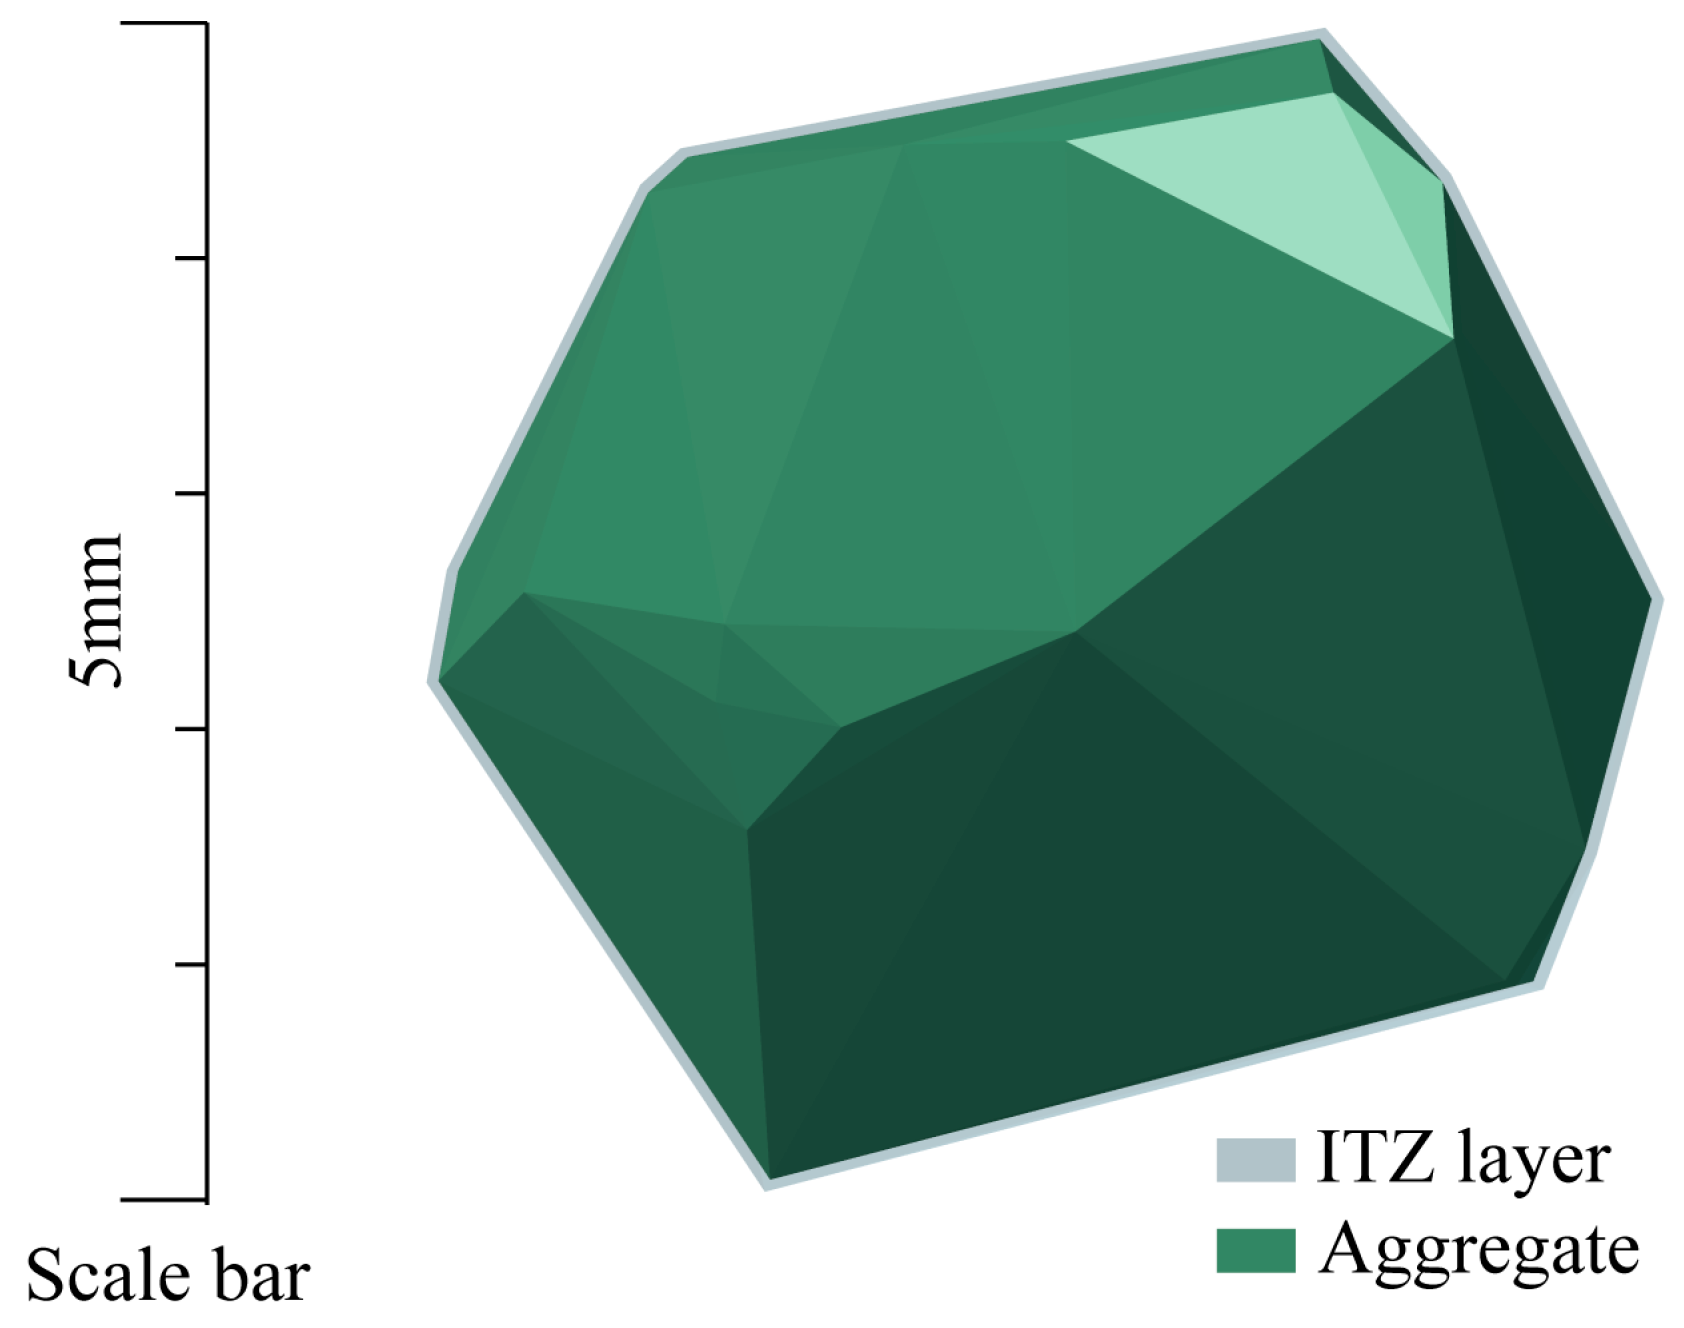
39], which is significantly smaller than the minimum finite element mesh size. Directly modeling ITZ at its true physical scale would require extremely fine meshing, leading to prohibitively high computational costs and potential numerical instability. In this study, the ITZ is represented by applying a geometric transformation to the aggregate polyhedra. Specifically, each aggregate is uniformly shrunk inward by a thickness δ, randomly chosen within 0.1–0.5 mm, to generate an inner “core aggregate.” The volume between the outer original surface and the inner shrunk surface is then designated as the ITZ layer (
Figure 2). This approach explicitly captures the ITZ as a distinct region with specific material properties, while maintaining computational tractability for finite element simulations. The chosen thickness range is consistent with previous mesoscale studies [
40,
41], balancing physical realism and numerical efficiency.
2.2. Aggregate Placement and Collision Detection Challenges
In this study, aggregates are placed using a size-prioritized “take-and-place” strategy, in which larger aggregates are deposited first to maximize spatial utilization and placement success. This approach reduces spatial constraints during the early stages of modeling, thereby creating more opportunities for the subsequent placement of smaller aggregates. The detailed aggregate placement procedure is as follows:
(1) Aggregate preparation and sorting
Based on the given aggregate grading and target volume fraction, a set of aggregates is generated and sorted in descending order of volume. Considering that some aggregates may fail to be placed due to spatial constraints at high volume fractions, the total initial aggregate volume fraction is set slightly higher than the target by approximately 2–3%. This value is determined through multiple trial-and-error tests to ensure that the final model achieves an aggregate volume fraction close to the target.
(2) Random generation of candidate positions and boundary constraints
Within the modeling domain (i.e., the specimen geometry), a candidate position is randomly generated for each aggregate. The position must satisfy two fundamental conditions: (1) the aggregate must be entirely contained within the specimen boundaries; (2) it must not penetrate or overlap with any previously placed aggregates.
(3) Collision detection and retry mechanism
If the current aggregate overlaps with previously placed aggregates, a new candidate position is randomly generated and checked again. Each aggregate is allowed a maximum of 100 placement attempts. If a suitable position is found within the allowed attempts, the aggregate is successfully placed; otherwise, it is discarded and the next aggregate is processed.
(4) Termination and volume fraction control
The above procedure continues until all aggregates have been attempted. By discarding aggregates that cannot be successfully placed, the final aggregate volume fraction in the model is maintained close to the target value.
For collision detection of convex polyhedral aggregates, conventional methods typically rely on precise geometric intersection tests. These approaches require traversal of all vertices, edges, and faces of the polyhedra and perform point–line–face checks between convex hulls, resulting in a computational complexity of O(n2), where n denotes the number of vertices per polyhedron. More critically, the number of collision checks grows quadratically with the number of aggregates: to place the k-th aggregate, intersections must be tested against the k–1 previously placed aggregates, yielding an overall complexity of O(N2), where N is the total number of aggregates. For large-scale engineering models containing thousands or even tens of thousands of aggregates, this computational burden becomes prohibitive.
This challenge is further amplified when aiming for morphological realism. Real concrete aggregates exhibit complex convex geometries with varying aspect ratios and surface features. While convex polyhedra provide a reasonable approximation, their mathematical complexity makes it difficult for conventional methods to balance computational efficiency with geometric accuracy. Although precise convex hull intersection methods offer high accuracy, they suffer from severe inefficiency when handling large numbers of aggregates, rendering the generation of high-volume-fraction 3D mesoscale models extremely time-consuming.
Therefore, there is an urgent need to develop efficient collision detection algorithms specifically designed for densely packed convex polyhedral aggregates. An ideal solution should: (1) maintain geometric accuracy comparable to precise intersection methods; (2) significantly improve computational efficiency, capable of handling thousands of aggregates; (3) exhibit scalability for models of varying sizes; (4) demonstrate robustness in handling complex geometries. To address these challenges, the following section introduces an improved GJK algorithm, which is optimized for high-volume-fraction concrete models. By enhancing the iteration process and update strategies for search directions, this method effectively mitigates the computational bottleneck associated with large-scale convex polyhedron collision detection.
2.3. Improved GJK Algorithm for Collision Detection
This section introduces the application of the GJK algorithm to collision detection and presents an enhanced version tailored for mesoscale concrete modeling. The discussion is organized into three parts: the classical GJK algorithm, the proposed enhanced GJK collision detection algorithm, and a comparative analysis between the two.
2.3.1. Classical GJK Algorithm
The GJK algorithm was originally proposed to compute the minimum distance between two convex bodies
A and
B. The key idea is to transform the distance computation into a closest-point problem between the origin and the boundary of the configuration space obstacle (
CSO) [
42], which is defined as the Minkowski difference:
It can be proven that if both
A and
B are convex sets, their Minkowski difference
A B is also convex (see
Figure 3). Consequently, the
CSO is itself a convex set. Based on this property, the minimum distance problem between
A and
B can be reformulated as finding the point on the
CSO that has the smallest norm, i.e., the point closest to the origin
O. For example,
Figure 3 illustrates the Minkowski difference for two convex polyhedra. In case (a), sets
A and
B intersect, and the origin lies inside the
CSO, indicating a collision. In case (b), sets
A and
B are disjoint, and the origin lies outside the
CSO, with the minimum distance from the origin
O to the
CSO corresponding to the shortest distance between the two objects.
To avoid explicitly constructing the entire CSO, the GJK algorithm incrementally builds a simplex W within the CSO to approximate the point nearest to the origin. Let the search direction be denoted as v, the current support point as s or p, and the simplex as W. The iterative process proceeds as follows:
Initialization: Choose an arbitrary initial direction v. Use the support function to compute the first support point s = support(A,B, v), and initialize the simplex as W = {s}.
Support point search: In each iteration, compute a new support point p = support(A,B, v) along the current direction v.
Origin check: If p⋅v < 0, the origin cannot lie inside the CSO, and the two convex bodies do not intersect; otherwise, add p to the simplex W.
Simplex update: Apply Johnson’s distance sub-algorithm (or equivalent geometric reasoning) to determine whether the origin lies within W: If the origin lies inside W, the two convex bodies intersect; If not, update the search direction v according to the position of the origin relative to the simplex, and continue with the next iteration.
The algorithm terminates under two possible conditions: If the simplex contains the origin, a collision is detected (A ∩ B ≠ ∅); If the iterations converge to a nonzero minimum distance, this distance corresponds to the shortest separation between A and B.
In summary, the classical GJK algorithm provides clear geometric intuition and is broadly applicable to distance computation between convex objects. However, when the objective is restricted to collision detection only, it exhibits computational redundancy, since each iteration requires both support point evaluations and nearest-point updates over simplex subsets, leading to relatively high computational cost.
2.3.2. Enhanced GJK for Collision Detection
While the classical GJK algorithm is highly effective for computing the exact minimum distance between two convex bodies, its iterative process involves repeated support point queries and distance minimization on simplex subsets. This makes the algorithm computationally expensive when the task is limited to binary collision detection (i.e., whether two bodies intersect). To address this limitation, an enhanced version of the GJK algorithm has been developed, focusing exclusively on collision detection rather than precise distance evaluation.
The enhanced GJK algorithm retains the core idea of incrementally expanding a simplex W within the CSO but simplifies the update rules to avoid redundant calculations. Specifically, it adopts an improved strategy for handling the simplex update step, which directly determines whether the origin lies within the evolving simplex. If so, a collision is declared immediately; if not, the algorithm continues with a new search direction.
The procedure of the enhanced GJK algorithm is an iterative search. This process can be logically separated into two main components: a high-level control loop that manages the search progression, and a low-level subroutine that performs the geometric analysis on the current simplex. For clarity, we present these components as distinct algorithms. Algorithm 1 details the main
GJK_Intersect function, which orchestrates the iterative search, calls the support function, and handles termination conditions. Algorithm 2 then specifies the
UpdateSimplex function, which is called within each iteration to analyze the current simplex (line, triangle, or tetrahedron), determine if it encloses the origin, and calculate the next optimal search direction.
| Algorithm 1: Enhanced GJK for collision detection (the pseudocode is as follows) |
| Input: Convex polyhedra A, B |
| Output: true if A and B intersect, false otherwise |
| function GJK_Intersect(A, B) |
| //Initialize simplex and search direction |
| simplex←∅ |
| v←InitialDirection(A, B) | //e.g., center(B) −center(A) |
| //Get the first support point to initialize the simplex |
| p←Support(A, B, v) |
| simplex. Add(p) |
| v←−p | //New direction toward the origin |
| loop |
| p←Support(A, B, v) | //Obtain a new support point |
| //If the new point fails to pass the origin, no collision (early exit) |
| if dot(p, v) < 0 then |
| return false | //No collision detected |
| end if |
| simplex. Add(p) |
| //Check if simplex contains origin and update search direction |
| if UpdateSimplex (simplex, v) then |
| return true | //Collision detected |
| end if |
| end loop |
| end function |
| Algorithm 2: UpdateSimplex function in the enhanced GJK algorithm (pseudocode) |
| Input: Current simplex, search direction v |
| Output: true if the simplex contains the origin, false otherwise |
| function UpdateSimplex(ref simplex, ref v) |
| //Determine simplex dimension and update search direction accordingly |
| n←simplex.size() |
| a←last point added to simplex |
| ao←−a | //Vector from point a to the origin |
| if n == 2 then | //Simplex is a line segment (a, b) |
| b←simplex [0] |
| ab←b−a |
| //Compute a perpendicular direction towards the origin |
| v←TripleProduct(ab, ao, ab) |
| else if n == 3 then | //Simplex is a triangle (a, b, c) |
| b←simplex [1] |
| c←simplex [0] |
| ab←b−a |
| ac←c−a |
| normal←cross(ab, ac) |
| //Ensure the normal points toward the origin |
| if dot(normal, ao) > 0 then |
| v←normal |
| else |
| v←-normal |
| end if |
| else if n == 4 then | //Simplex is a tetrahedron (a, b, c, v) |
| //Check if the origin lies inside the tetrahedron |
| if OriginInTetrahedron(simplex) then |
| return true | //Collision confirmed |
| else |
| //Reduce to the face closest to the origin and update direction |
| ReduceTetrahedron(simplex, v) |
| end if |
| end if |
| return false | //Collision not confirmed, continue iterating |
| end function |
Compared to the classical GJK algorithm, the enhanced version introduces the following improvements:
(1) reduced redundancy: by focusing exclusively on collision detection, the algorithm bypasses unnecessary computations of exact distances;
(2) improved simplex update: the UpdateSimplex function (detailed in Algorithm 2) adopts a more efficient rule set to eliminate irrelevant vertices and reorient the search direction. This accelerates convergence and ensures numerical stability;
(3) early termination: the check dot (p, v) < 0 (in Algorithm 1) provides a robust criterion to conclude immediately that no collision occurs, thus avoiding further iterations.
2.3.3. Comparative Analysis of the GJK Algorithm
To evaluate the performance advantages of the enhanced GJK algorithm in mesoscale modeling of high-volume-fraction concrete, efficiency tests were conducted. In the experiments, a single convex polyhedron was deliberately set to intersect with all N aggregates (N = 500–22,000) to provide a uniform testing condition. The total collision detection time was recorded. Both the classical GJK and the enhanced GJK were executed under identical initial conditions, with three different initial polyhedra employed to ensure robustness. This setup focuses on assessing the computational efficiency of the algorithms under consistent collision conditions. All algorithms were implemented in C++ using identical data structures and numerical precision settings to ensure a fair comparison. The codes were compiled with GCC 11.2 using the same optimization flags (-O3 -march = native -funroll-loops) and executed on a workstation equipped with an AMD EPYC 7261 8-core 2.50 GHz processor and 64 GB RAM (Lenovo (Beijing) Co., Ltd., Beijing, China).
The experimental results are shown in
Figure 4. The data clearly indicates that while the computation time for both algorithms increases approximately linearly with the number of aggregates, the enhanced GJK algorithm consistently outperforms the classical version. Across the tested range, the enhanced GJK shortens the time required for intersection detection by approximately 20–25%.
This advantage is particularly evident at larger scales. For instance, at the maximum aggregate count of approximately 22,000, the classical GJK required around 4.2 s, whereas the enhanced GJK completed the same task in about 3.2 s. This represents a significant speedup of approximately 1.31 times, corresponding to a 23.8% reduction in computational time. This improvement is primarily attributed to the streamlining of distance-related operations, which leads to fewer iterations and reduced geometric computations per query. Therefore, the enhanced GJK demonstrates higher efficiency, making it an ideal choice for the practical application of generating large-scale, high-volume-fraction concrete models.
2.4. 3D Mesoscale Modeling Example of Concrete
To verify the feasibility and efficiency of the proposed workflow, a 150 mm cubic concrete specimen was selected for mesoscale modeling. The aggregate gradation follows the Fuller curve (see
Table 1), with a target volume fraction of 50%, ensuring that the generated model realistically reflects the dense packing characteristics of concrete at the mesoscale.
The modeling process, scripted in Python(3.10.15), proceeds as follows: random convex polyhedral aggregates were generated according to the Fuller distribution, and the ITZ was represented by a uniform inward shrinkage of the aggregate geometry. The aggregates were then sequentially placed into the specimen using the take-and-place method, with random positions and orientations assigned to each aggregate. During placement, this Python framework employed the high-performance C++ implementation of the enhanced GJK algorithm for collision detection, which avoids overlaps while maintaining geometric robustness and improving computational efficiency.
Following this workflow, a mesoscale model that satisfies the prescribed gradation, volume fraction, and geometric features was successfully constructed.
Figure 5 presents a representative modeling result, where the random distribution of aggregates and their ITZ regions can be clearly observed. For full transparency, the key input parameters and the resulting output statistics for this model generation are summarized in
Table 2. The ability to generate a model with nearly 3800 aggregates in under 18 min, combined with a modest resource utilization (a peak memory usage of approximately 2.85 GB and single-threaded CPU usage of ~15.6%), demonstrates the high efficiency and robustness of the proposed approach for large-scale mesoscale concrete modeling.
3. Experimental Validation and Static Analysis
This section investigates the uniaxial compressive response of cubic concrete specimens through mesoscale numerical simulations. The results are compared with experimental data to validate the proposed model. Based on this validation, the internal damage evolution and crack propagation mechanisms of concrete are further analyzed to provide insights into its mesoscale failure process.
3.1. Mesoscale Model Development
A cubic concrete specimen with a side length of 150 mm and an aggregate volume fraction of 40% (consistent with the experimental conditions of Vonk et al. [
43]) was generated using the enhanced GJK-based method. To represent the heterogeneous structure of concrete, different constitutive models were assigned to each phase: (1) Mortar and ITZ: modeled using the concrete damage plasticity (CDP) model in ABAQUS(2021), which describes nonlinear damage evolution and crack propagation under both compression and tension. The ITZ is influenced by multiple factors and has a complex microstructure that is difficult to characterize precisely with current experimental techniques. Following reference [
44] and other studies [
41,
45], the ITZ strength is typically assumed to range from 0.5 to 0.9 of the mortar strength, which provides a rational basis for parameter selection. The specific values adopted in this study (see
Table 3) fall within this well-accepted spectrum. (2) Coarse aggregates: treated as linear elastic and assumed to remain intact during loading, owing to their much higher strength compared to mortar and ITZ. This assumption is further validated in
Section 3.3 through the analysis of aggregate stress distribution at the final damage state. The mechanical parameters adopted for each component are summarized in
Table 3 [
46].
3.2. Boundary Conditions and Meshing
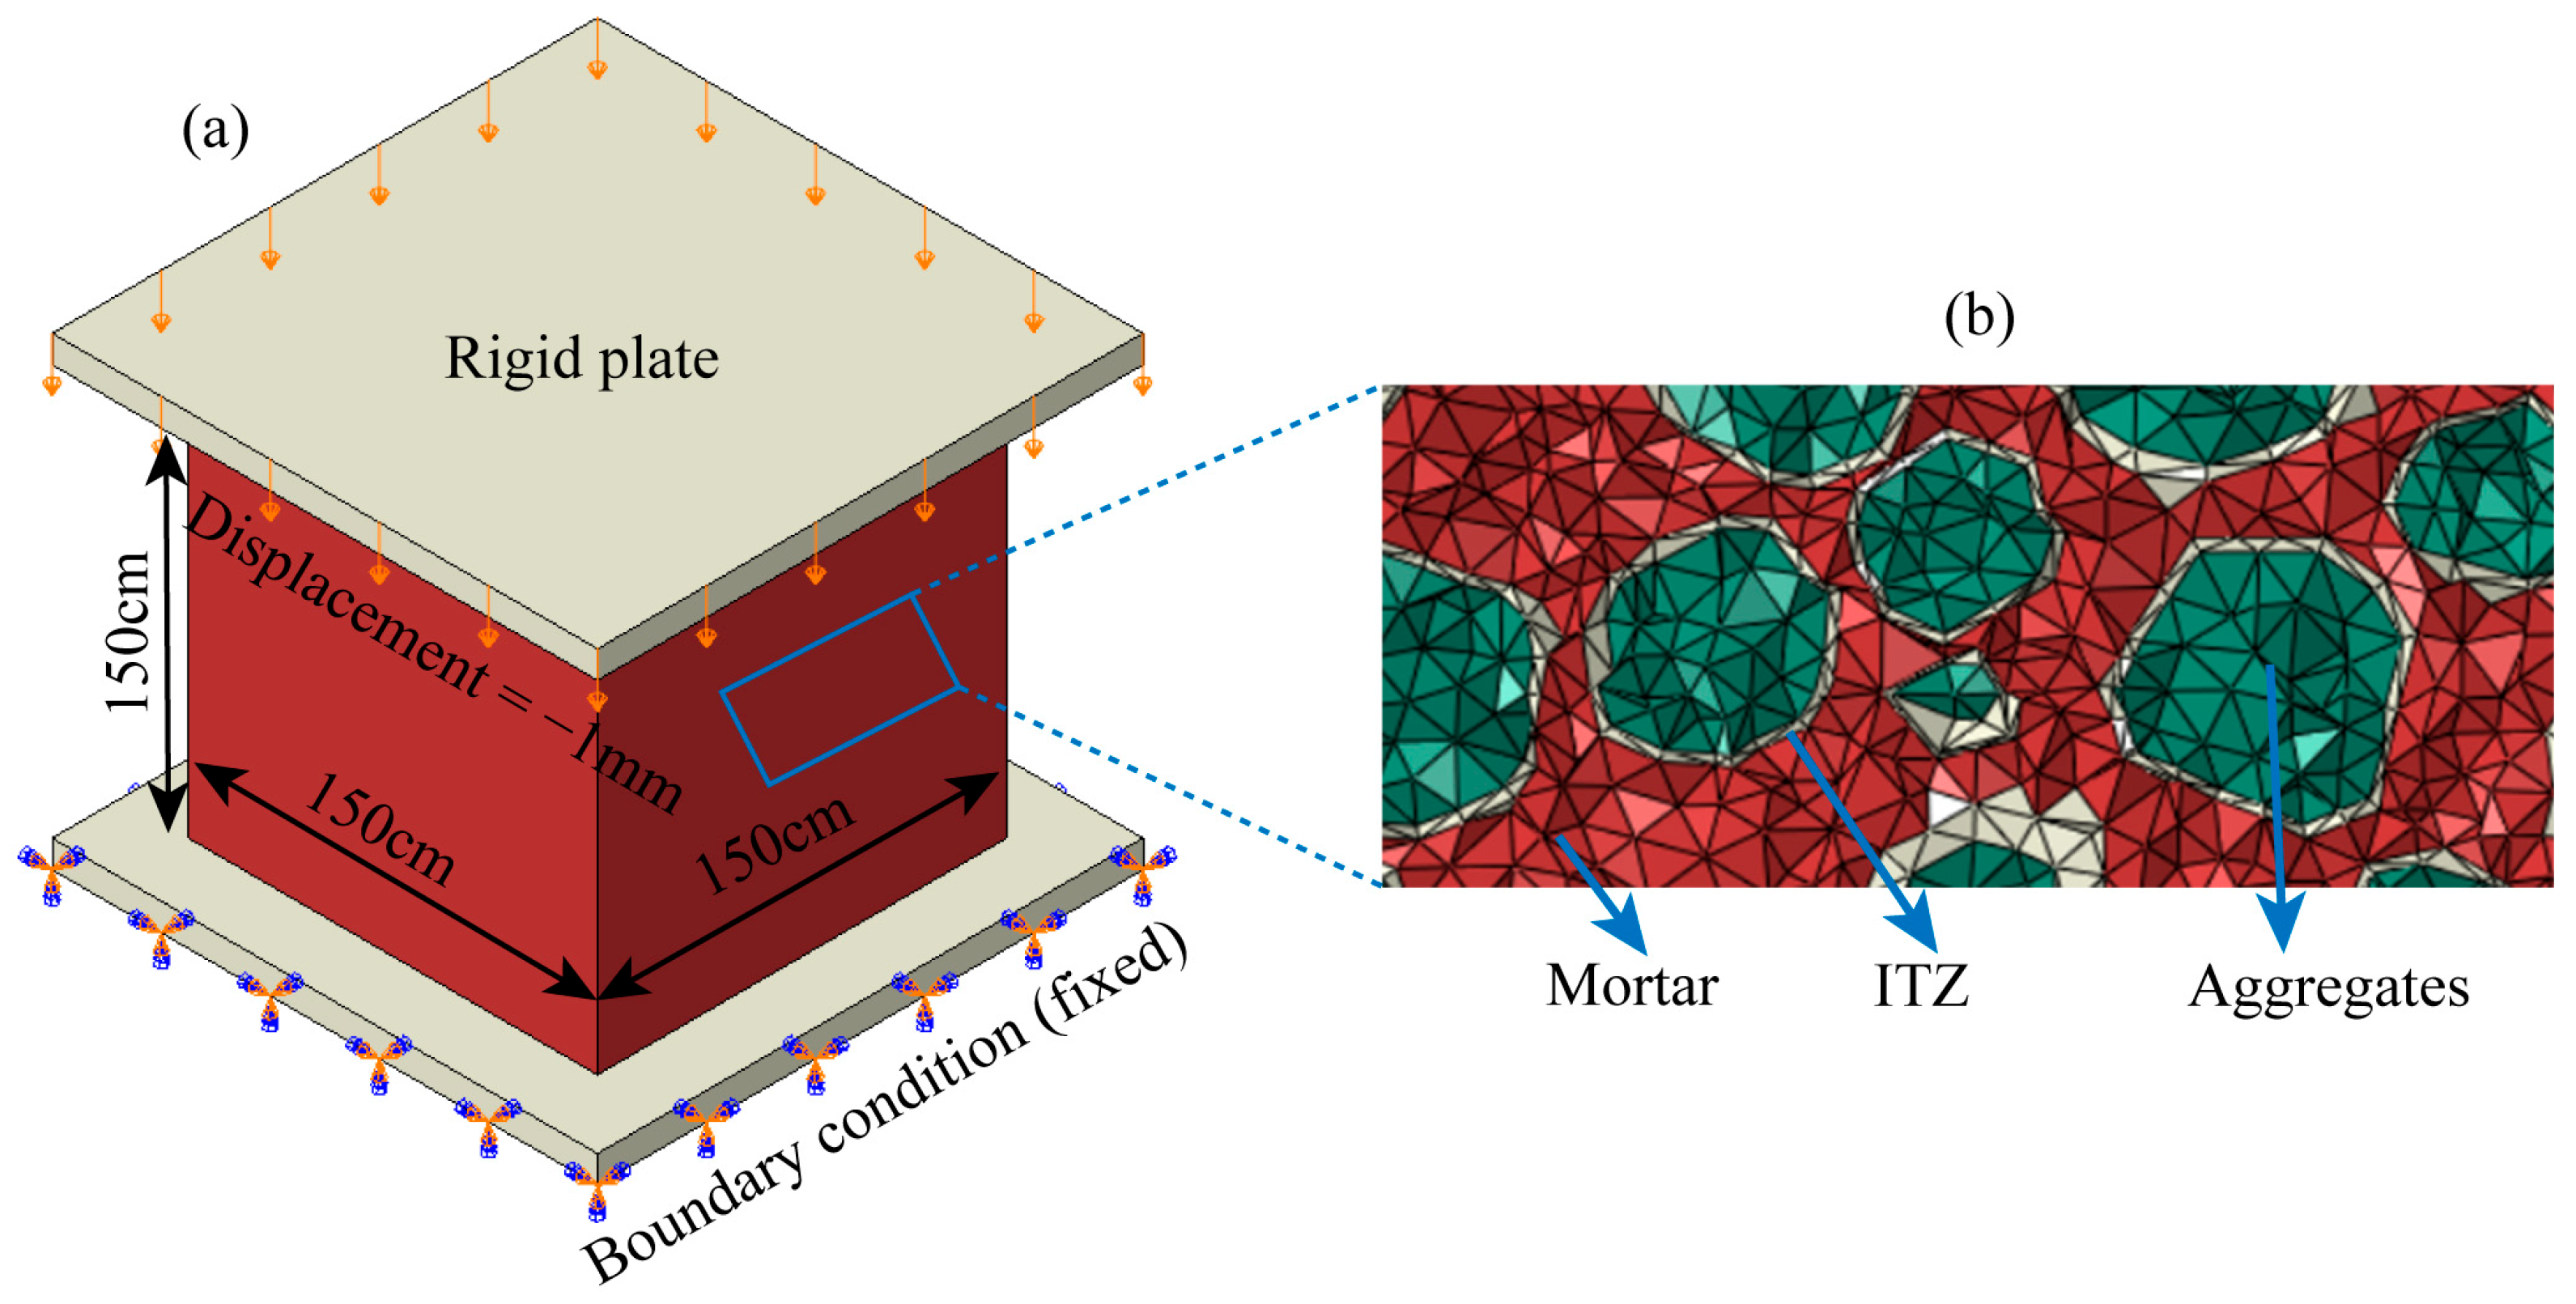
Uniaxial compression was applied through rigid plates at the top and bottom surfaces of the specimen. The bottom plate was fully constrained, while a quasi-static displacement load was imposed on the top plate. The frictional constraint between specimen and loading plate was set as 0.1. To maintain numerical stability and ensure convergence, the dynamic explicit solver was adopted.
The average stress and strain were defined as:
where
Fapplied is the applied load,
A is the specimen’s cross-sectional area, Δ
L is the axial displacement, and
L is the original specimen length. The boundary setup is illustrated in
Figure 6a.
For discretization, the specimen was meshed using an unstructured tetrahedral grid with an average element size of 2 mm. This resolution was sufficient to capture local stress concentrations and crack initiation around aggregate boundaries and ITZs. The heterogeneous meso-structure represented in the mesh is shown in
Figure 6b.
3.3. Stress–Strain Response
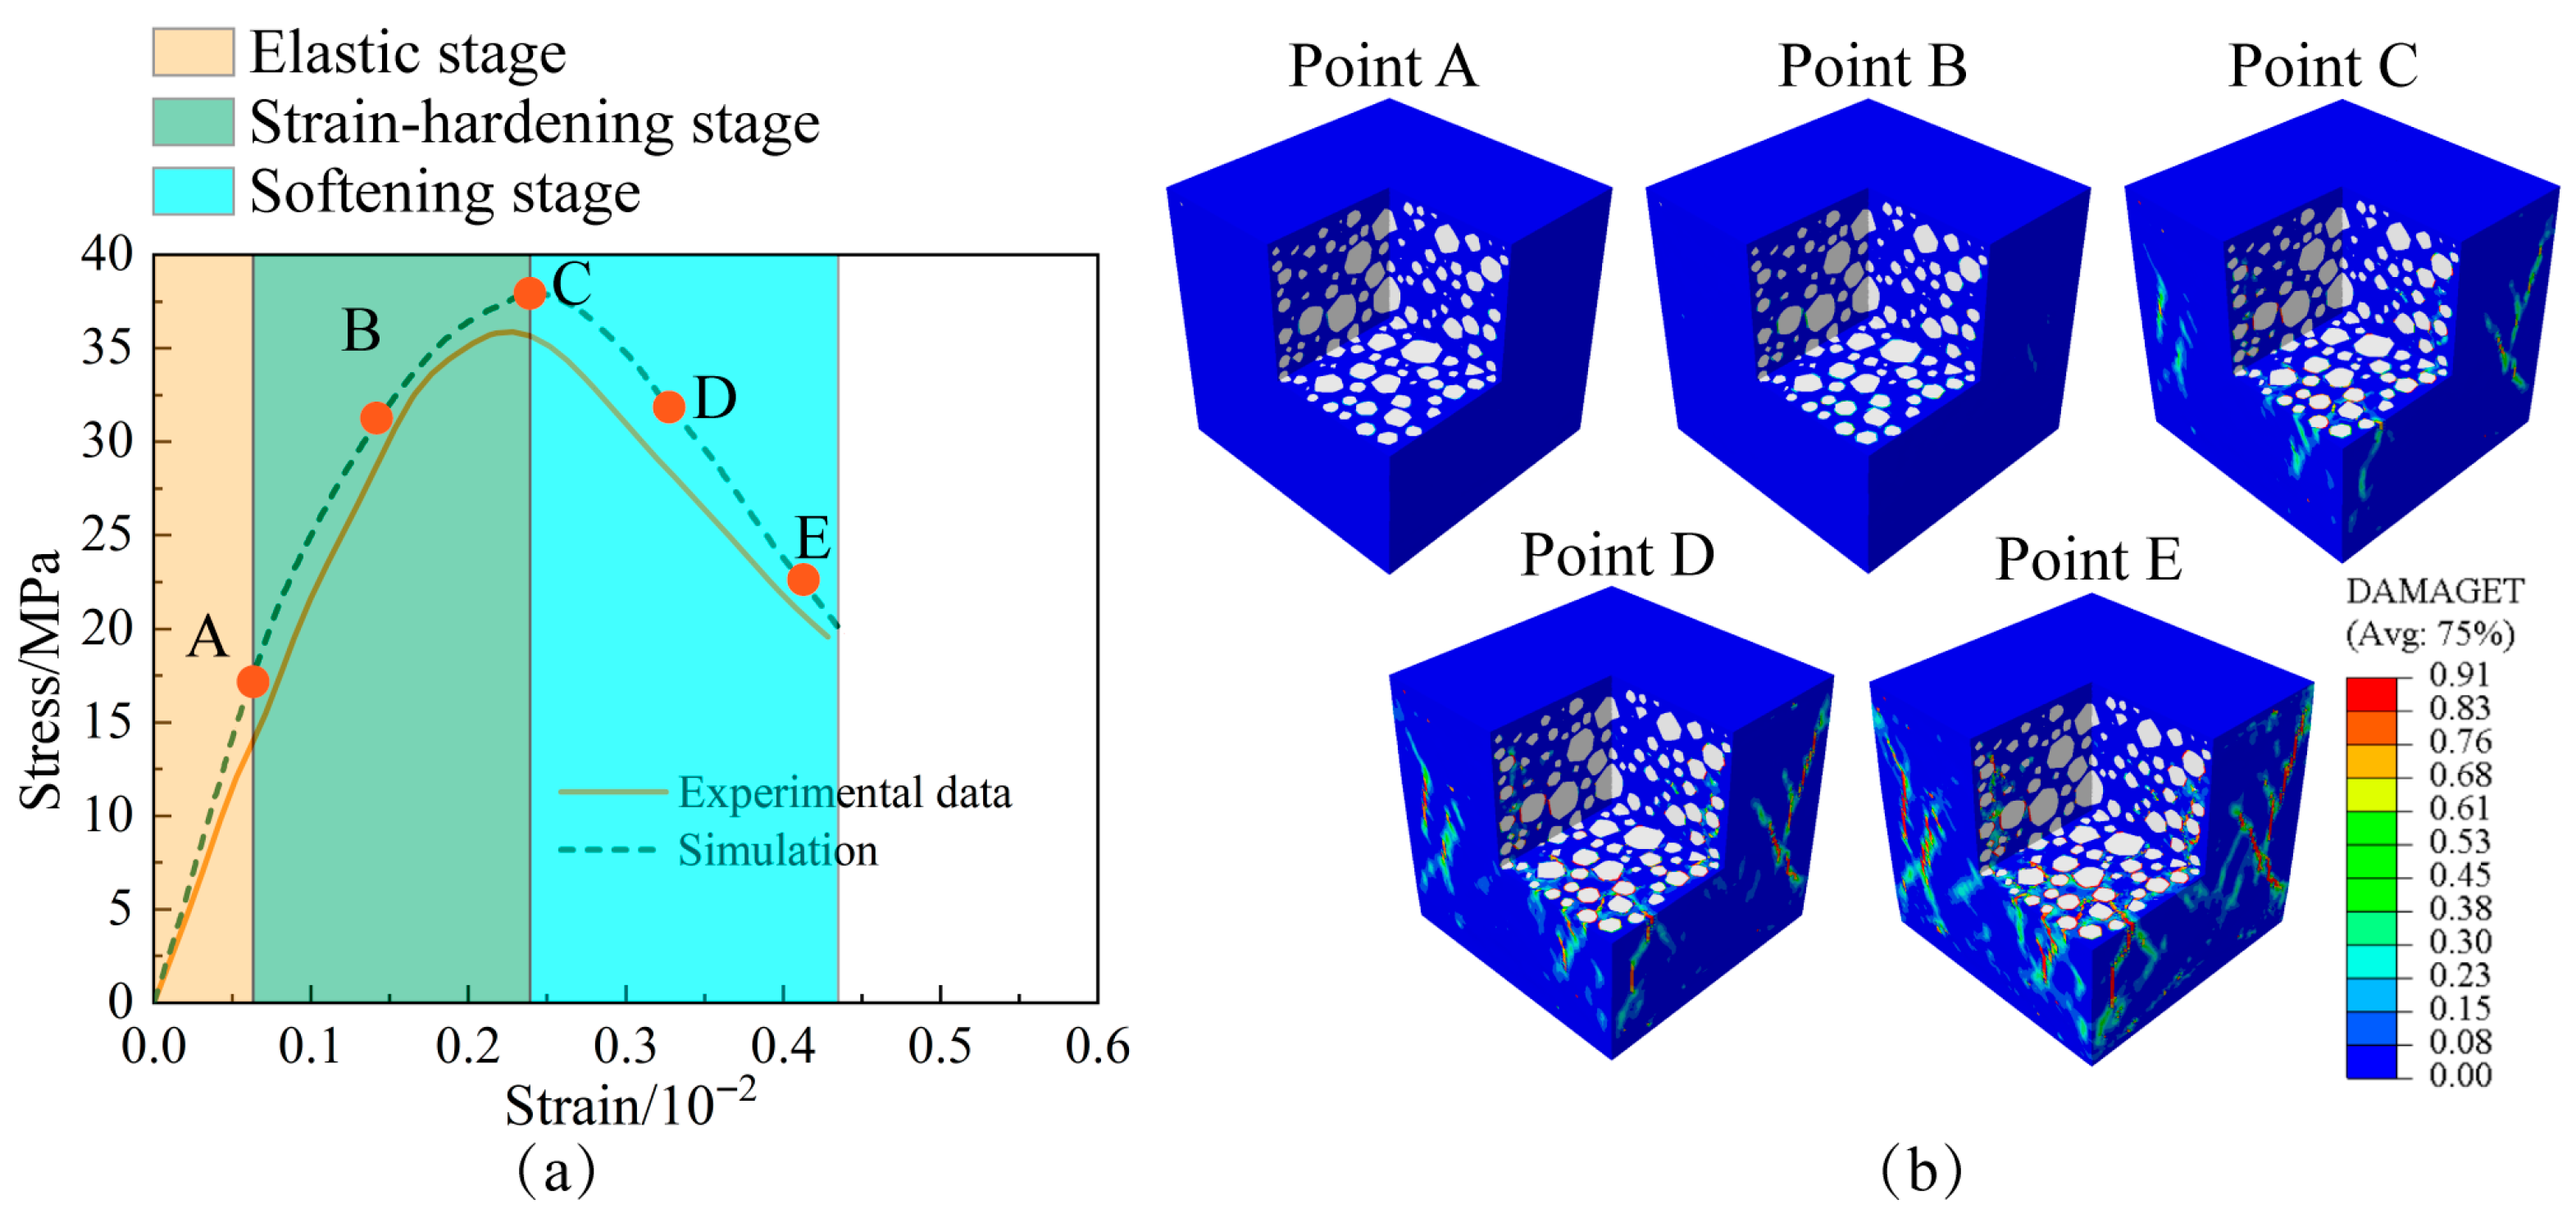
Figure 7 compares the stress–strain responses obtained from the mesoscale simulation and laboratory experiments [
43]. As shown in
Figure 7a, the mesoscale model successfully captures the characteristic three-stage behavior of concrete under uniaxial compression: the initial elastic stage (A–B), the strain-hardening stage leading to the peak stress (B–C), and the subsequent softening stage (C–E). To provide a detailed quantitative assessment, the key mechanical properties obtained from the simulation are compared with the experimental values in
Table 4. The simulated peak stress of 38.3 MPa shows good agreement with the experimental value of 35.6 MPa, corresponding to a relative error of 7.6%. Notably, larger discrepancies were observed for the elastic modulus and peak strain, with relative errors of 13.6% and 11.1%, respectively. Such deviations are common in mesoscale simulations and can be attributed to the model’s high sensitivity to the assumed ITZ properties and the complexities of damage localization. Nonetheless, the satisfactory agreement in peak strength—the most critical parameter for structural design—validates the capability of the proposed model to effectively capture the macroscopic mechanical response and failure behavior of concrete.
In addition to the macroscopic stress–strain curve, the simulation reveals the underlying damage evolution mechanisms that are difficult to observe directly in experiments. As illustrated in
Figure 7b, damage initiates during the strain-hardening stage (points A–C), where microcracks nucleate mainly along aggregate boundaries and within the ITZ. With further loading, these microcracks extend and gradually coalesce into localized crack bands (points D, E), ultimately triggering the macroscopic softening and failure of the specimen. This simulated failure process, characterized by ITZ-initiated cracking followed by the formation of dominant fracture bands, is consistent with widely reported experimental observations and validates the predictive ability of the proposed mesoscale model.
To further verify the assumption that aggregates remain elastic during loading, the stress levels within aggregate elements were examined.
Figure 8 displays the spatial distribution of the minimum principal stress (S, Min. Principal) at the final damage state (Point E). The stress values range from approximately −10 MPa to −95 MPa, with the majority of elements below −60 MPa, which are far below the typical crushing strength of natural aggregates (100–200 MPa). This confirms that aggregates remained in the elastic regime throughout the loading process.
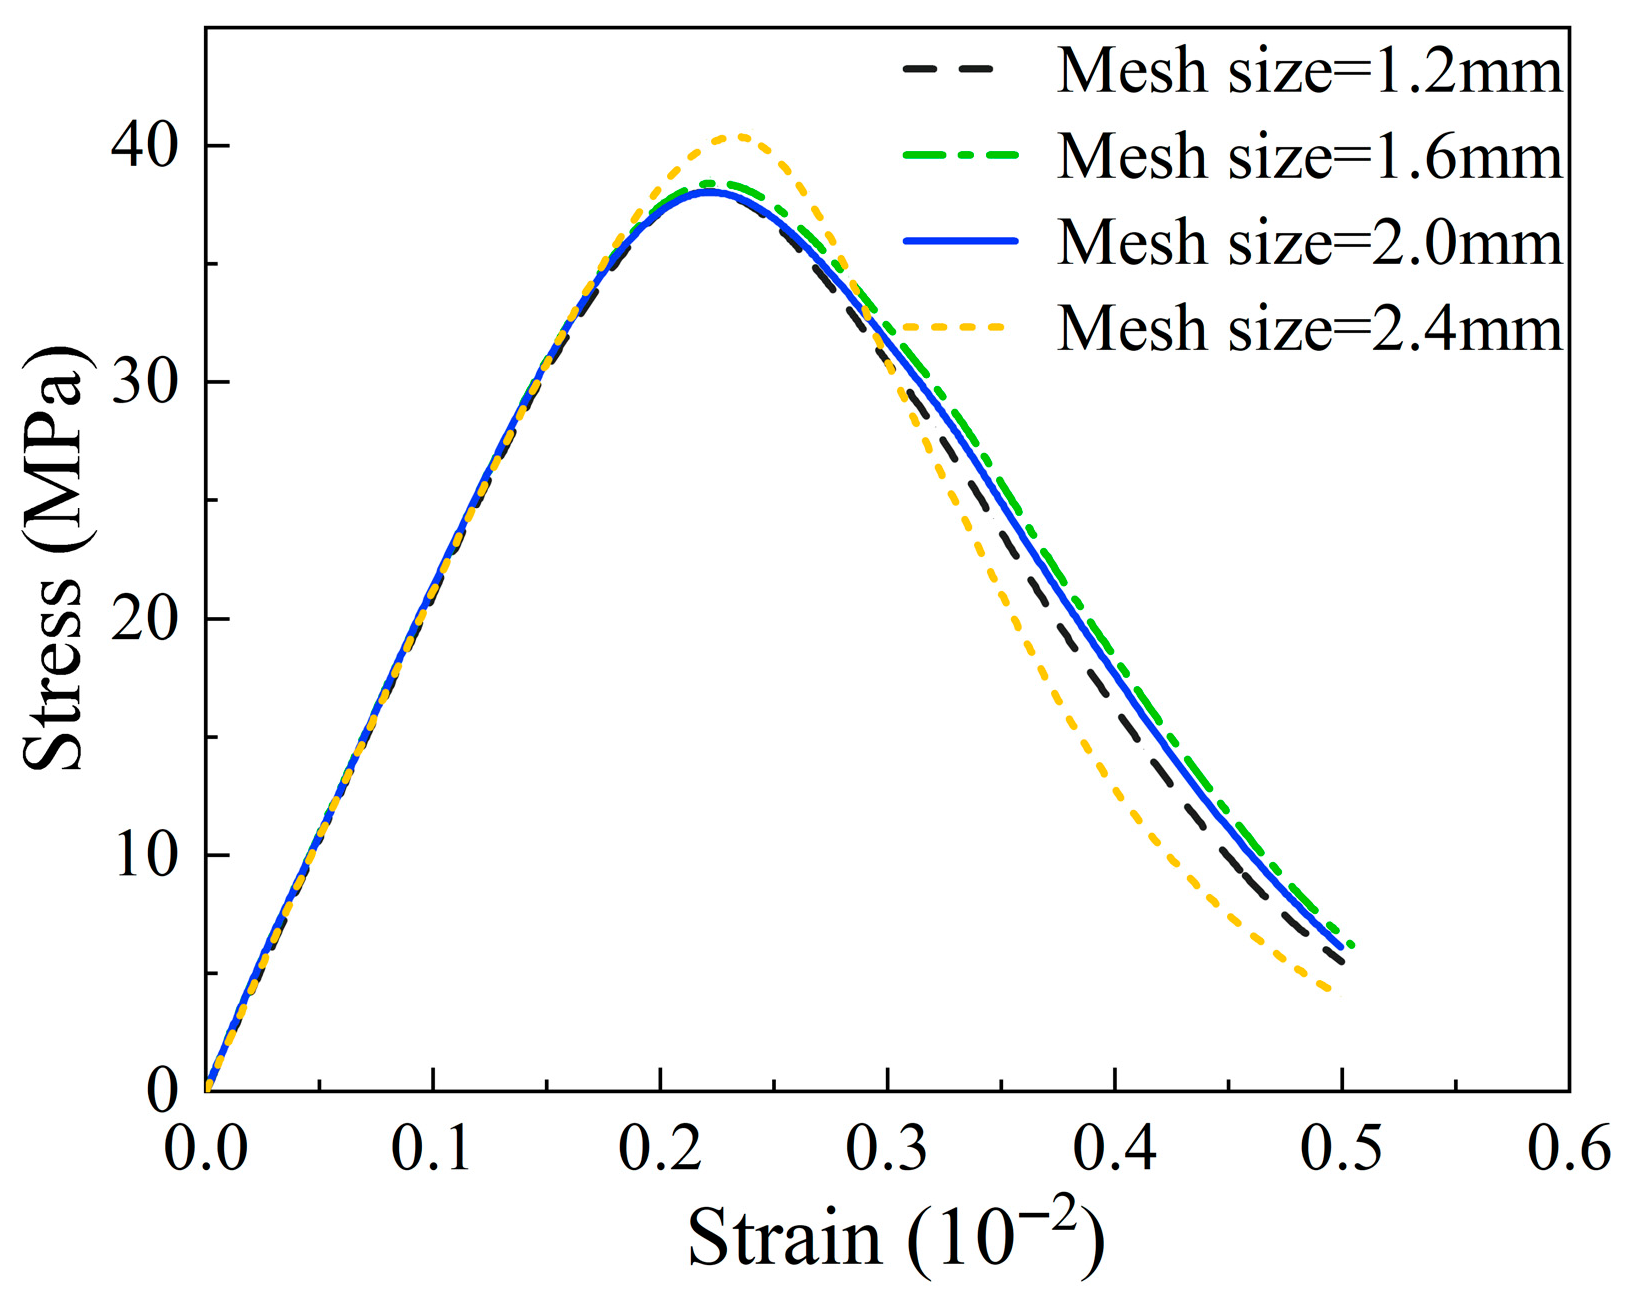
Finally, to confirm the reliability of the numerical results and justify the element size employed throughout this study, a mesh sensitivity analysis was conducted subsequent to the model validation. Four models with different average mesh sizes (1.2 mm, 1.6 mm, 2.0 mm, and 2.4 mm) were analyzed. The resulting stress–strain curves, presented in
Figure 9, reveal that the initial stiffness is largely independent of the mesh size. However, the coarsest mesh (2.4 mm) is observed to be a clear outlier, as it significantly overestimates the peak stress and exhibits a more brittle post-peak response. In contrast, the stress–strain curves for the 2.0 mm, 1.6 mm, and 1.2 mm meshes show excellent agreement, indicating that the numerical solution has converged.
While the results for these three finer meshes are nearly identical, the computational cost increased significantly with mesh refinement, taking approximately 6.5 h, 9.3 h, and 12.4 h for the 2.0 mm, 1.6 mm, and 1.2 mm meshes, respectively. Given this trade-off, the 2.0 mm mesh was selected as the optimal choice for the validation and parametric study, as it robustly justifies a balance between numerical accuracy and computational efficiency. This choice also minimizes the mesh dependency of the simulated damage evolution, ensuring the reliability of the failure analysis.
3.4. Failure Patterns
The mesoscale simulation further elucidates the failure mechanisms of concrete under uniaxial compression, with a particular focus on the influence of interfacial friction conditions between the specimen and the loading plates. To investigate this effect, the contact was modeled using an isotropic coulomb friction model, following the approach in Reference [
46]. Two distinct conditions were simulated: a “low-friction” condition with a friction coefficient of
μ = 0.1, and a “high-friction” condition with
μ = 0.6.
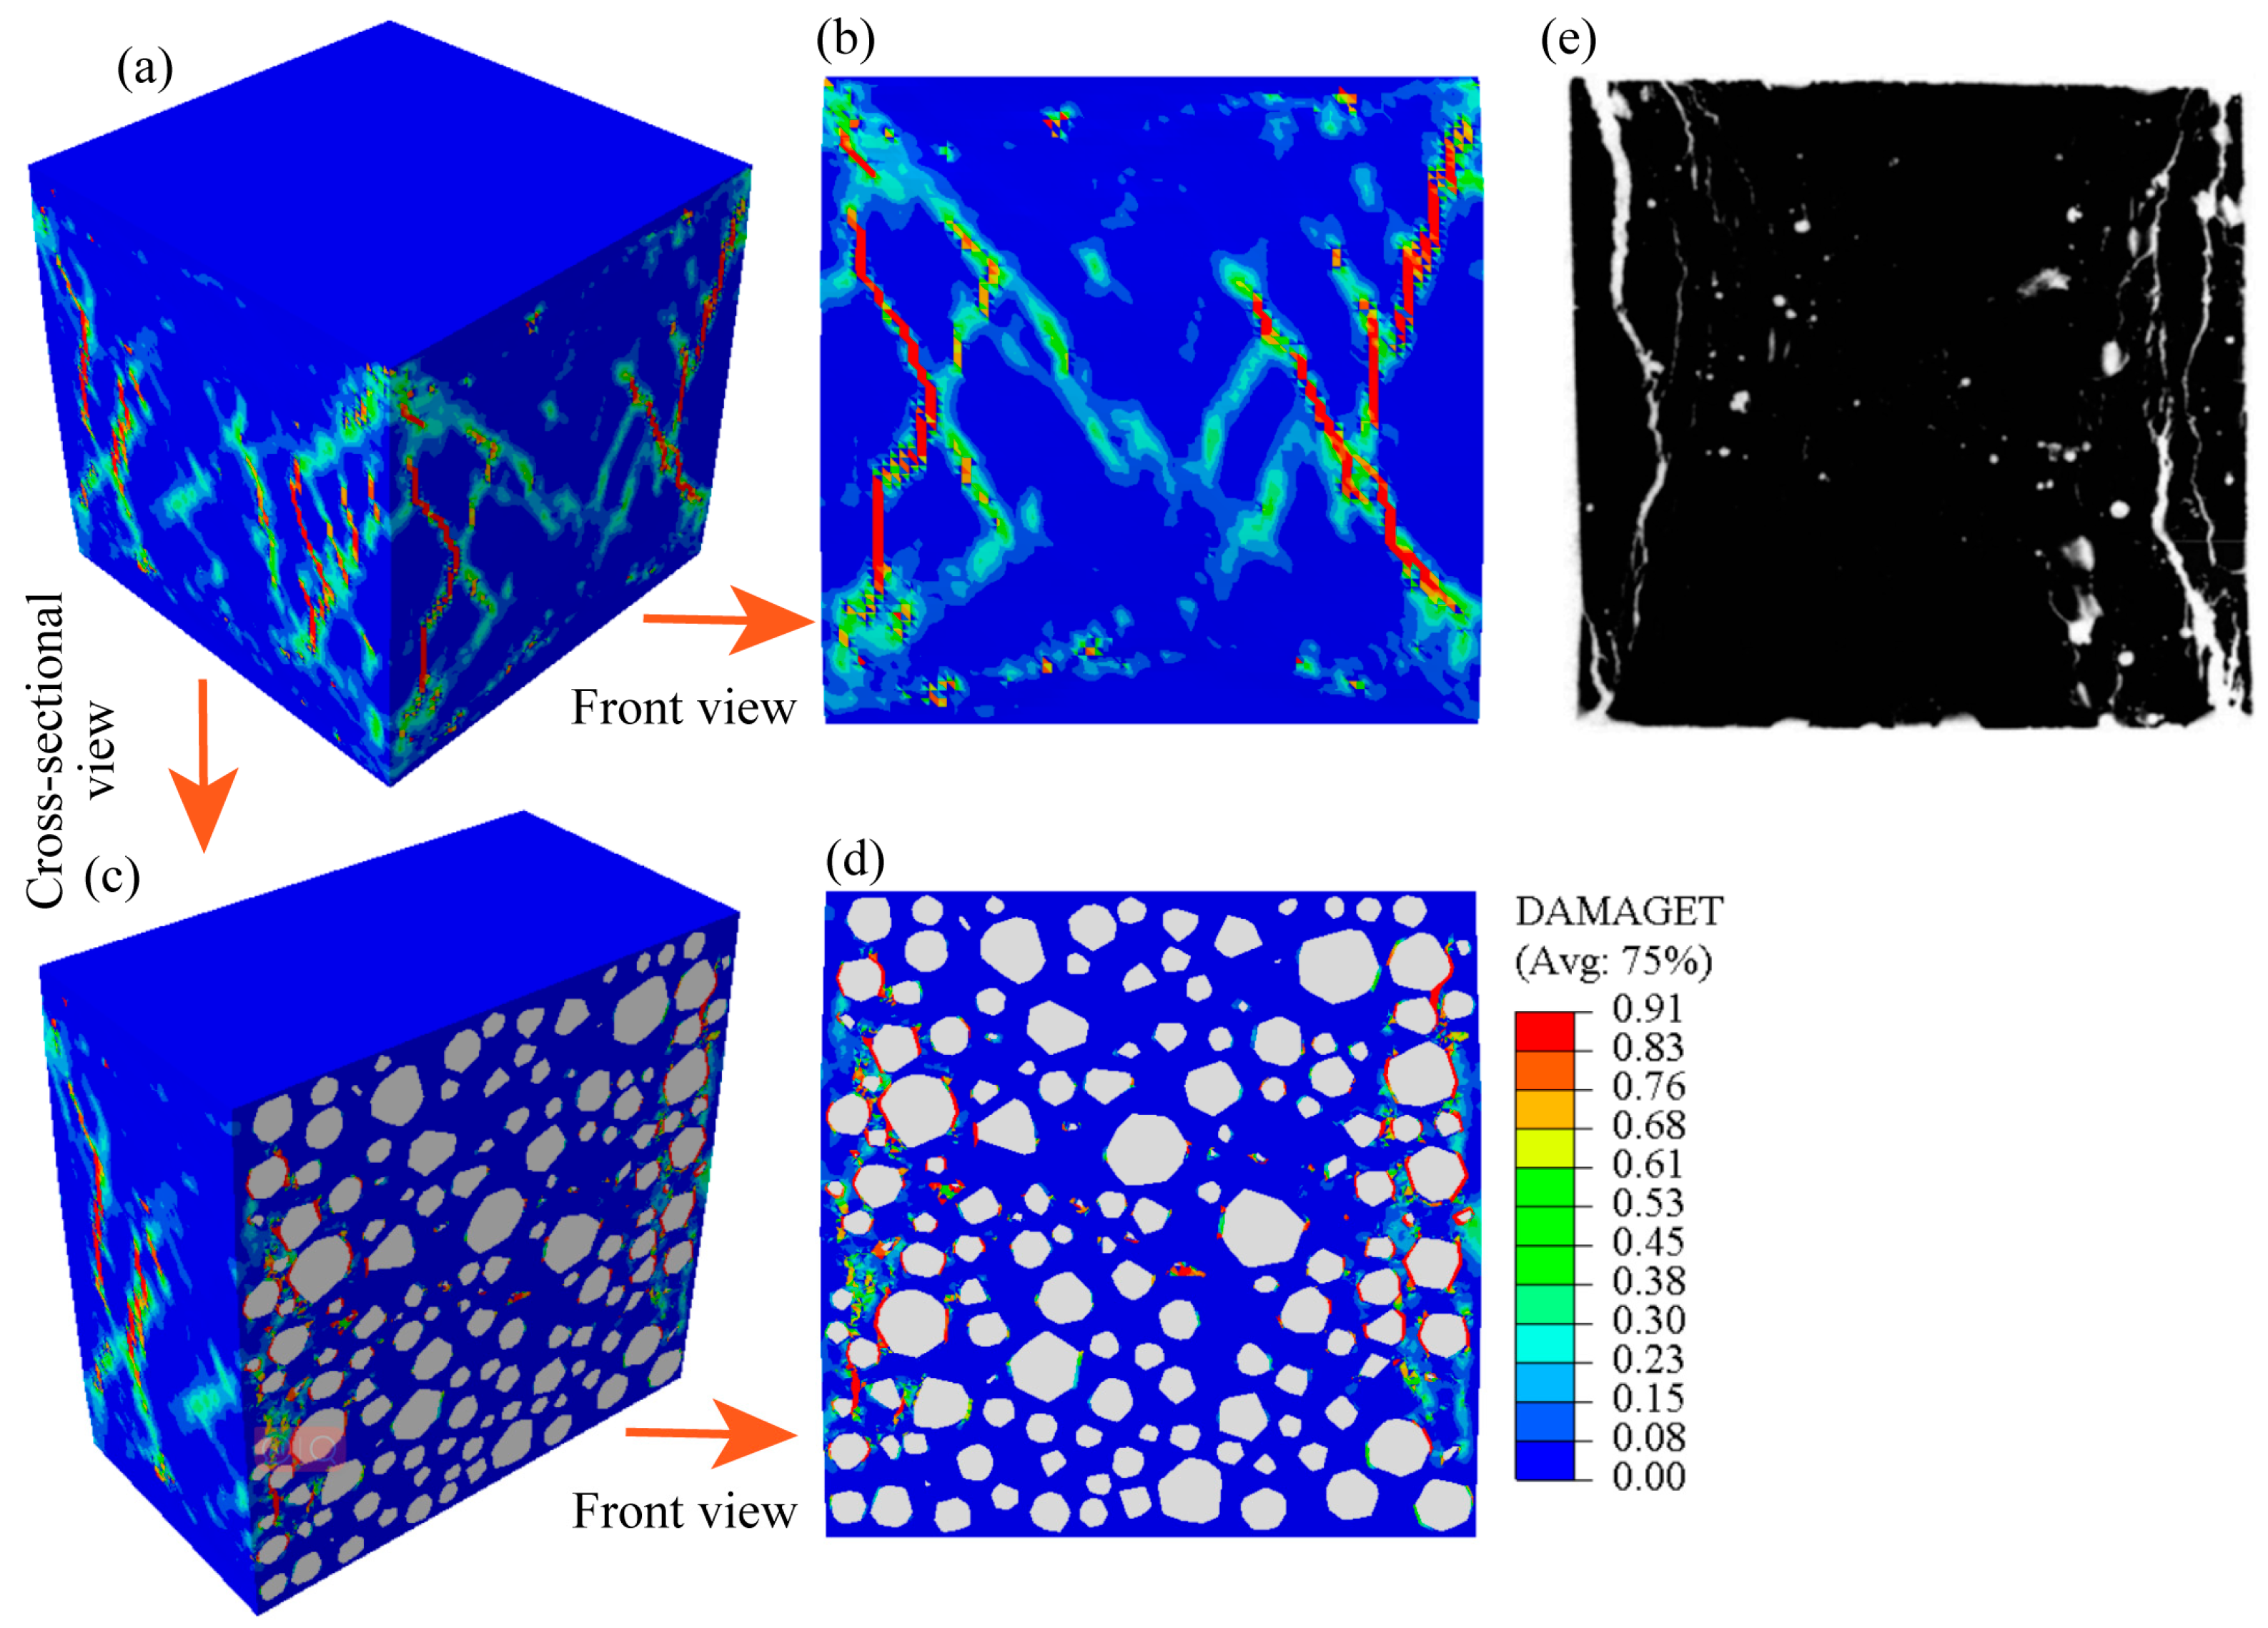
Figure 10 and
Figure 11 present a comparative analysis of the simulated damage distributions for both friction conditions against the corresponding experimental crack patterns.
Under high-friction boundary conditions (
Figure 10a–d), the failure is characterized by the formation of distinct diagonal shear bands traversing the cubic specimen. This shear-dominated failure mode is typical under constrained end conditions. As illustrated in the magnified views (
Figure 10b,d), microcracks initiate predominantly along aggregate boundaries and within the ITZs, eventually coalescing into continuous macroscopic shear bands. The damage distribution underscores the significant influence of aggregate heterogeneity, where stress concentrations around coarse aggregates promote crack initiation. The simulated failure pattern shows remarkable consistency with the experimental crack map [
43] (
Figure 10e), affirming the model’s capability to replicate shear-driven fracture processes.
In the low-friction case (
Figure 11a–d), the specimen exhibits a more diffuse and complex fracture network with numerous interconnected microcracks. Rather than a single predominant shear band, multiple branching cracks develop, resulting in a mesh-like fracture morphology. Detailed views of cross-sections (
Figure 11b,d) reveal extensive crack propagation through the mortar matrix and along ITZs. This distributed damage pattern aligns well with the experimental observation [
43] (
Figure 11e), confirming that reduced boundary friction facilitates a transition from localized shear failure to a more homogeneous, distributed cracking mode.
The simulated failure patterns not only agree well with experimental observations but also provide profound insights into the governing failure mechanisms and their practical implications. The model’s ability to reproduce the distinct transition from shear-cone failure under high friction to vertical splitting under low friction serves as a robust validation of its physical basis. This shift clearly delineates the role of confinement: the shear failure is a structure-property interaction where end-platen restraint induces a triaxial stress state, forcing failure along inclined planes in the less-constrained core. In contrast, the splitting failure reveals the material’s intrinsic tensile weakness under compression, a mechanism driven by lateral strains from Poisson’s effect that are amplified into localized tensile stresses by the stiffness mismatch at the ITZ. For practical design, these results provide a mechanistic explanation for how confinement, such as that provided by transverse reinforcement in columns, fundamentally improves structural ductility by shifting the failure mode away from brittle splitting. For material optimization, the crack paths that consistently initiate and propagate along the ITZ unequivocally identify it as the weak link in the composite system. This strongly suggests that enhancing the ITZ—for instance, through the use of supplementary cementitious materials—is a direct and effective pathway to tougher, stronger concrete.
5. Conclusions
This study presented an efficient framework for generating and validating high-volume-fraction 3D mesoscale concrete models. The main contributions and conclusions are drawn as follows:
1. On the methodological front, the enhanced GJK algorithm, optimized for binary collision checks, demonstrates superior computational efficiency over the classical version, reducing intersection detection time by approximately 20–25%. This improvement effectively alleviates a key bottleneck in the “take-and-place” generation of realistic 3D mesoscale models with aggregate volume fractions up to 50%.
2. The proposed framework is robustly validated against experimental data. The generated models accurately predict the macroscopic mechanical response of concrete under compression, capturing the characteristic elastic, strain-hardening, and softening stages, with the peak stress showing good agreement with experimental results (relative error ≈ 7.6%).
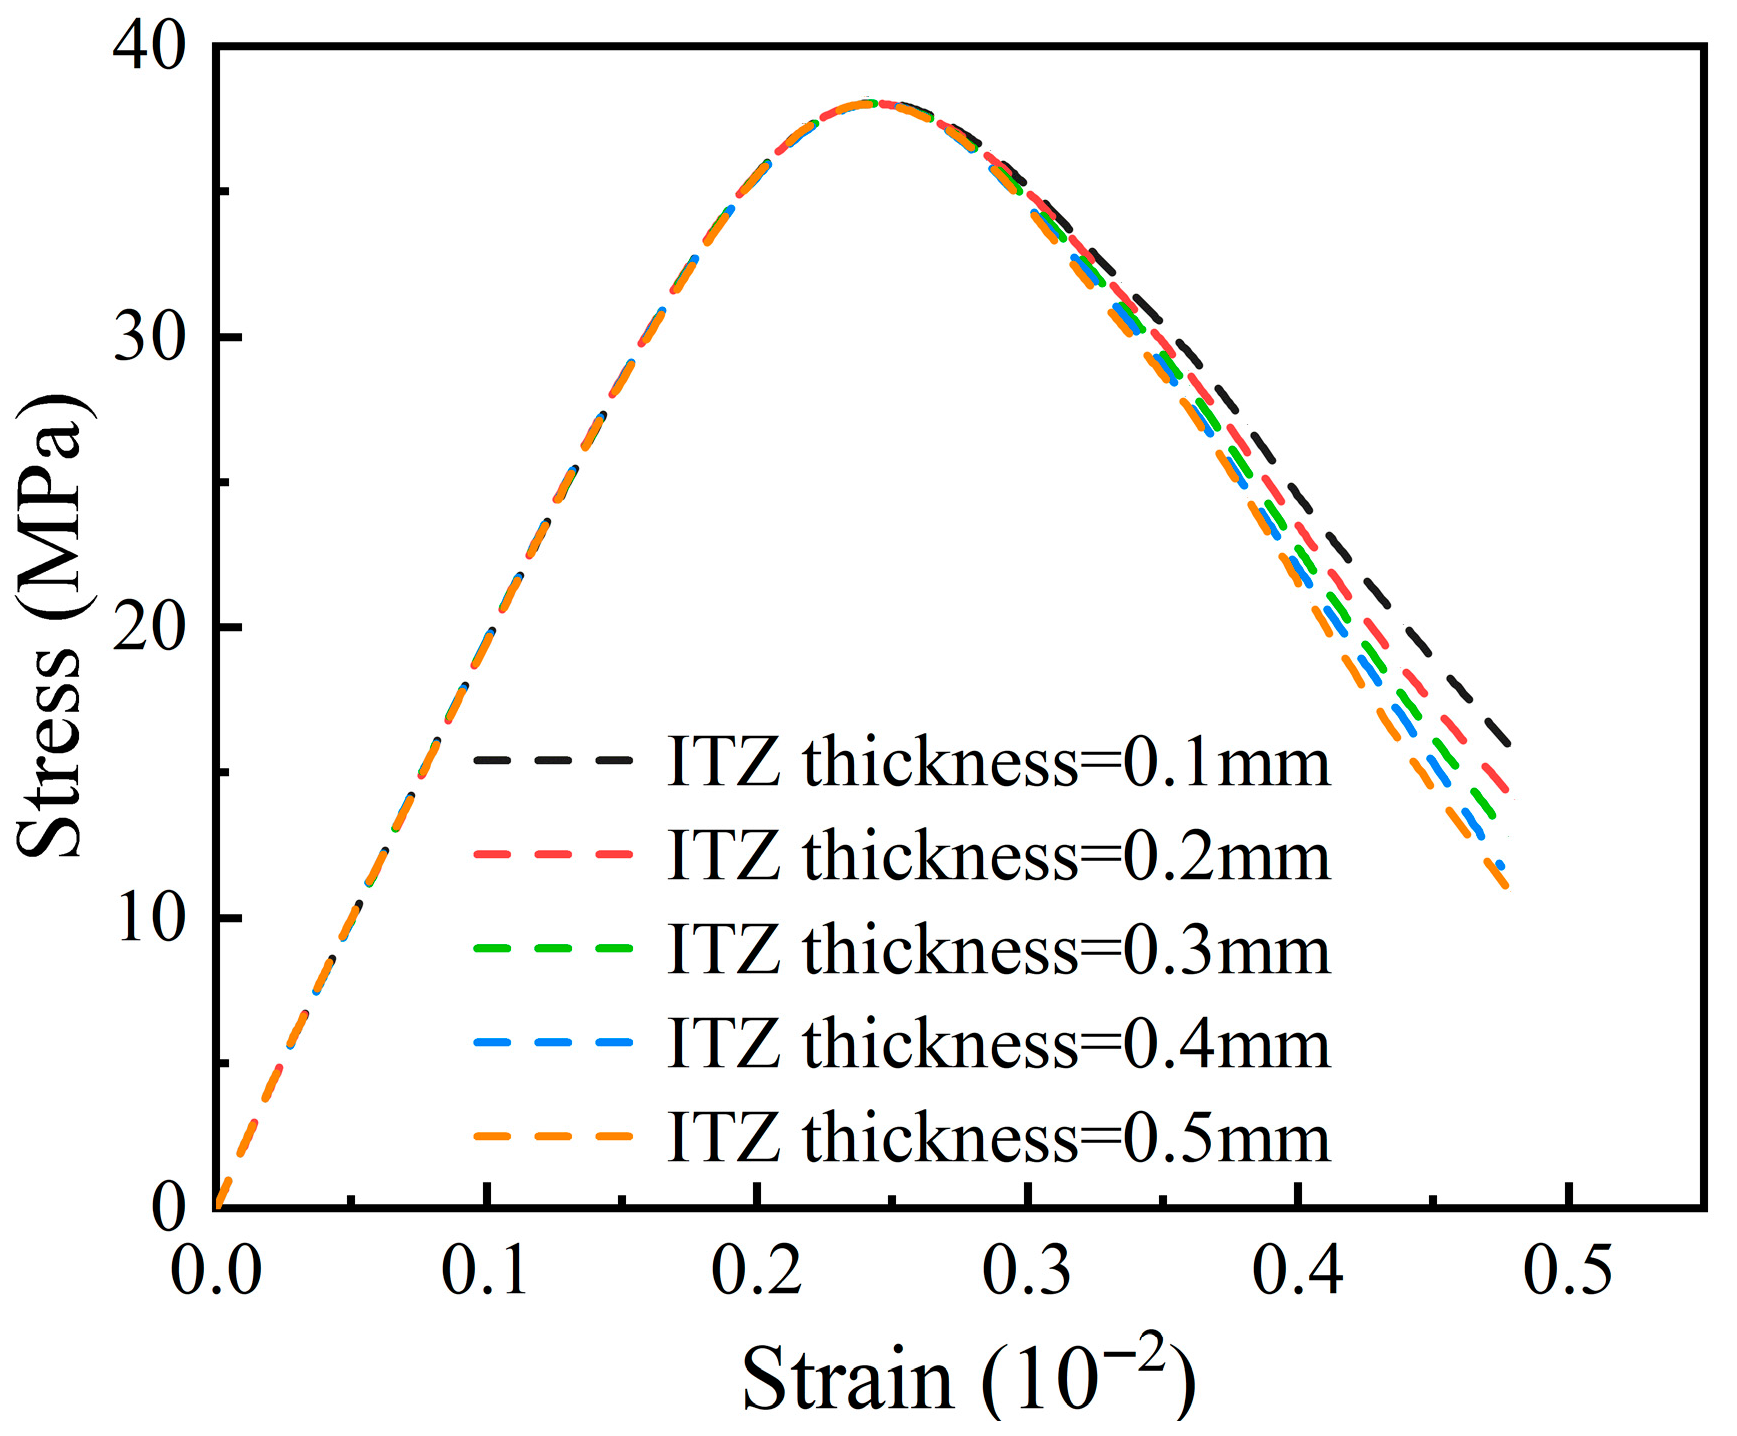
3. Regarding material behavior, the model provides profound insights into failure mechanisms by successfully reproducing the friction-dependent transition from shear-cone to vertical splitting failure. The simulations confirm that the ITZ acts as the primary path for crack initiation, and its thickness is a critical factor governing post-peak ductility.
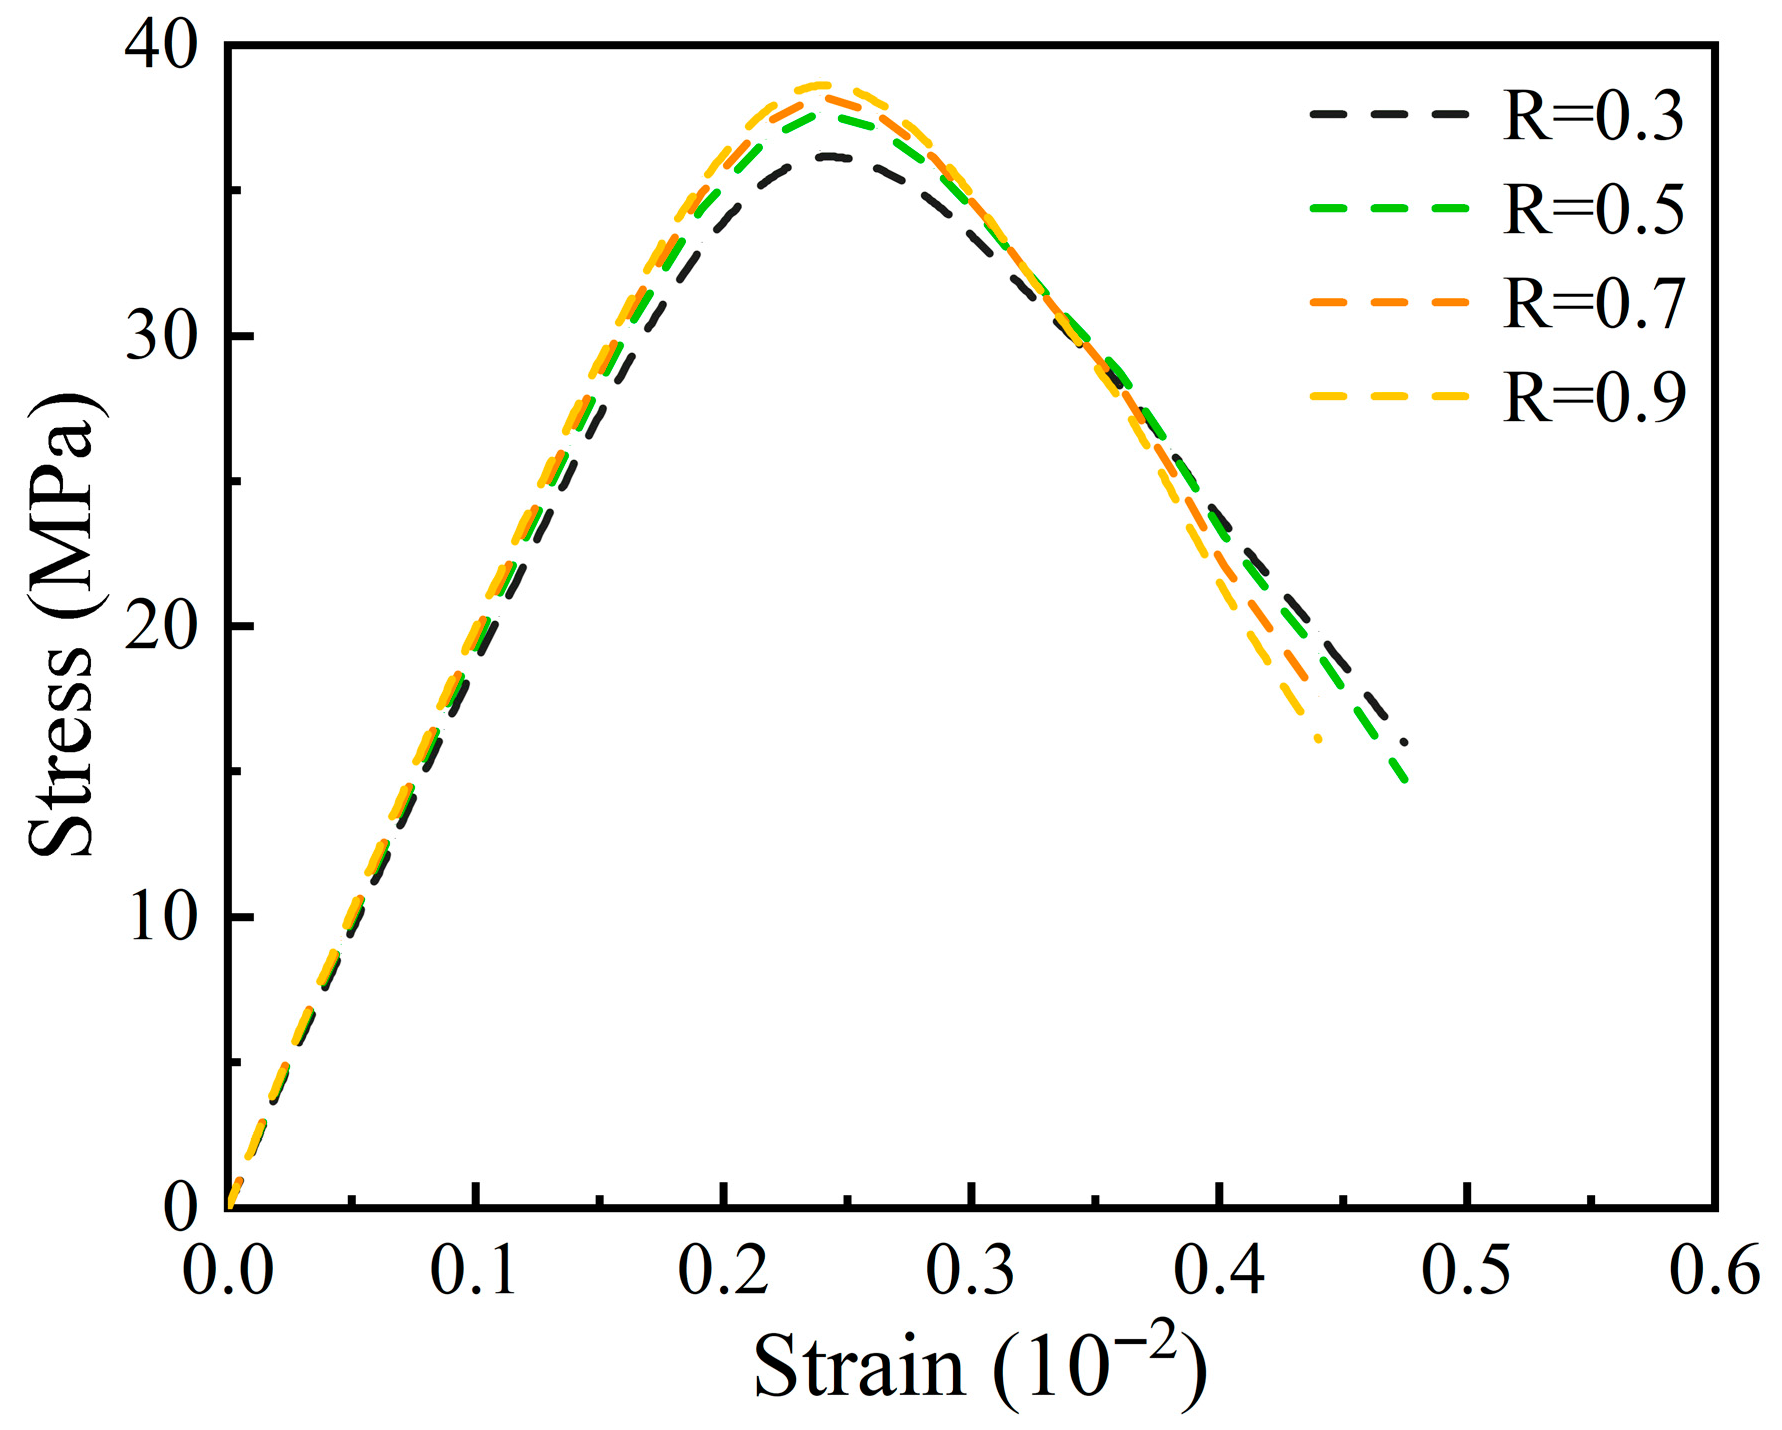
4. The parametric investigation systematically quantifies the influence of key mesoscale features on the compressive response. The study captures the dual effect of aggregate volume fraction on strength and highlights the strength-ductility trade-off associated with the ITZ/Mortar strength ratio, underscoring the importance of lateral confinement in compression.
The present study has certain limitations, such as the computational cost associated with extremely large-scale models and the idealized representation of the ITZ with a uniform thickness. Future work will aim to address these aspects. Key research directions will include (1) implementing parallel computing techniques (e.g., CUDA or MPI) to further accelerate the generation and simulation process; and (2) extending the framework to handle more complex aggregate morphologies and other heterogeneous materials.

