Abstract
Material handling (MH) plays a critical role in the performance, cost efficiency, and sustainability of high-rise construction projects. Despite its significance, MH practices in such projects remain challenged by complex vertical logistics, space constraints, fragmented supply chains, and increasing pressure to align with decarbonisation goals. This study applies a mixed-methods approach that integrates a systematic literature review, semi-structured expert interviews, and a SWOT–AHP (Strengths, Weaknesses, Opportunities, Threats—Analytic Hierarchy Process) model to identify and prioritise factors influencing MH optimisation in China’s high-rise construction sector. Eighteen factors were evaluated across four SWOT dimensions, and expert pairwise comparisons were aggregated using geometric means. The results revealed that Technological Adoption (S1) and Technological Advancements (O3) are the most critical enablers, while High Implementation Costs (W2) and Resource Scarcity (T3) are the most significant constraints. Interactions among these factors highlight the dual importance of internal digital capabilities and external technological trajectories in shaping MH strategies. Comparative analysis with practices in Europe, the United States, and the Middle East demonstrates that digitalisation, financial mechanisms, and policy incentives are globally consistent drivers of MH innovation. The findings advance theoretical understanding by integrating perspectives from the Resource-Based View, Technology-Organisation-Environment, and Institutional Theory, and they offer practical implications for policymakers and industry stakeholders seeking to align MH optimisation with China’s dual-carbon targets. This study contributes to the development of a comprehensive decision-support framework that enhances the sustainability, resilience, and efficiency of material logistics in high-rise construction projects.
1. Introduction
1.1. Background and Research Context
Material handling (MH) is one of the most fundamental yet complex operational processes in construction projects, directly influencing productivity, cost efficiency, safety performance, and environmental impact [1]. It encompasses the planning, transportation, storage, and control of materials and equipment throughout the construction life cycle, from procurement to on-site distribution. In the context of high-rise construction, MH complexity increases significantly due to vertical logistics constraints, limited staging areas, dynamic sequencing requirements, and the simultaneous coordination of multiple trades [2]. Inefficient MH practices have been linked to cost overruns, project delays, excessive material waste, and elevated carbon emissions, undermining both economic and sustainability objectives [3].
Globally, the construction sector accounts for around 37% of total energy-related carbon dioxide emissions, highlighting the urgent need to optimise operational processes, including MH, as part of broader decarbonisation strategies [4]. China, the world’s largest construction market, has pledged to achieve peak carbon emissions by 2030 and carbon neutrality by 2060. Optimising MH practices is therefore strategically aligned with China’s dual-carbon agenda by reducing material waste, improving logistics efficiency, and integrating low-carbon technologies [5]. Similar policy frameworks exist globally: the European Green Deal targets a 55% emissions reduction by 2030, the U.S. Inflation Reduction Act provides incentives for construction digitalisation and decarbonisation, and the Middle East’s national visions (e.g., Saudi Arabia’s Vision 2030) embed MH optimisation within broader sustainability transitions [6].
These global pressures are reshaping the role of MH from a tactical function into a strategic capability central to sustainability, resilience, and competitiveness. This shift is increasingly supported by digital transformation, as emerging technologies enhance planning precision, supply chain visibility, and decision-making agility. However, while MH digitalisation is progressing rapidly in some regions, implementation remains fragmented in many contexts due to high costs, organisational resistance, skill shortages, and regulatory barriers [7].
1.2. Digital Transformation in Material Handling
Recent advances in digital construction technologies have fundamentally transformed MH processes. Building Information Modelling (BIM) enables integrated material planning and logistics simulation, while the Internet of Things (IoT) and Radio-Frequency Identification (RFID) enable real-time tracking and inventory management. Artificial intelligence (AI) and predictive analytics improve material demand forecasting, while digital twins provide continuous feedback loops for optimising material flows throughout the construction life cycle.
For example, the Crossrail project in the United Kingdom and the Grand Paris Express in France reported significant efficiency gains by integrating BIM-based logistics platforms with supplier databases and 4D scheduling [8]. These systems reduced crane idle time, improved staging efficiency, and minimised double handling. Similarly, the Hudson Yards project in the United States used AI-enhanced BIM for automated crane scheduling and delivery sequencing, achieving a 20% reduction in logistics delays [9]. In the Gulf Cooperation Council (GCC) region, large-scale developments such as Saudi Arabia’s NEOM have embedded IoT-based MH solutions and digital twins to improve construction logistics and align with net-zero ambitions.
Despite these advances, adoption rates vary widely. Large contractors in advanced economies often possess the capital, technical expertise, and organisational maturity to integrate MH digitalisation. In contrast, small and medium-sized enterprises (SMEs) in developing contexts frequently face prohibitive costs, fragmented data ecosystems, and limited digital skills, leading to uneven implementation [10]. This unevenness suggests a need for structured decision-support frameworks to guide MH optimisation in different contexts and at varying levels of digital readiness.
1.3. Theoretical Perspectives
The importance of MH digitalisation and strategic integration can be explained through several complementary theoretical lenses. The Resource-Based View (RBV) posits that sustainable competitive advantage arises from resources that are valuable, rare, inimitable, and non-substitutable [11]. Digital capabilities—such as BIM expertise, data analytics, and IoT infrastructure—meet these criteria and can significantly enhance MH performance. Firms that effectively deploy these resources can differentiate themselves by delivering projects faster, cheaper, and with lower environmental impact. The Technology-Organisation-Environment (TOE) framework [12] further explains technology adoption dynamics by emphasising the interplay between technological readiness, organisational capacity, and external environmental pressures. For MH, this implies that successful digital transformation depends not only on technological availability but also on organisational structures, leadership commitment, workforce skills, and policy incentives.
Finally, Institutional Theory [13] highlights the role of coercive (regulatory), normative (professional), and mimetic (competitive) pressures in shaping organisational behaviour. Mandates such as BIM requirements in public procurement (e.g., EU Directive 2014/24/EU) or carbon disclosure regulations can accelerate MH digitalisation. Similarly, industry standards and competitive pressures can push firms to adopt advanced logistics systems to remain viable in increasingly sustainability-focused markets. Together, these perspectives provide a multidimensional understanding of MH optimisation, illustrating how internal resources, organisational dynamics, and external pressures converge to shape adoption and performance outcomes.
1.4. Literature Review
Material handling (MH) plays a critical role in the efficiency, cost-effectiveness, and sustainability of high-rise building construction, particularly in densely urbanised contexts like China. The proposed correction model can explain carbon emissions from material uplifting, foundation and scaffolding, with variations across building heights in China [14]. The complexity of MH in high-rise projects arises from vertical transport constraints, space limitations, and the need for precise coordination among multiple stakeholders. Recent studies have emphasised the integration of digital technologies (e.g., Building Information Modelling [BIM], Warehouse Management Systems [WMS], Internet of Things [IoT]) and sustainable practices to address these challenges [15,16,17].
To systematically prioritise strategic interventions for MH optimisation, this study integrates SWOT analysis—a strategic planning tool for identifying strengths, weaknesses, opportunities, and threats—with the Analytical Hierarchy Process (AHP)—a quantitative multi-criteria decision-making approach. This AHP-SWOT integration allows for the ranking of critical factors, offering actionable insights for industry stakeholders.
Using the defined search string, a total of 281 articles were initially identified. These articles underwent the multi-stage screening process, resulting in 48 articles to be ultimately selected for the literature study. The Systematic Literature Review (SLR) process is illustrated in Figure 1. To sum up, the synthesis found various MH factors in technological, organisational, economic, regulatory, and environmental dimensions. These were then categorised into preliminary SWOT components, which became the initial input for expert validation.
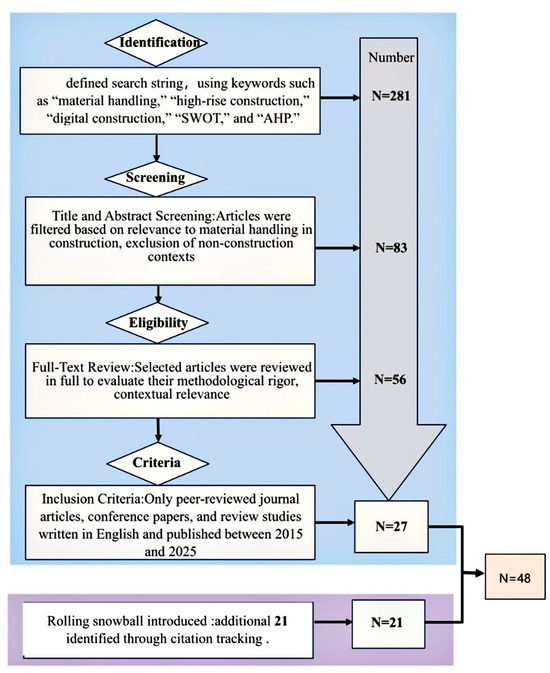
Figure 1.
Systematic review framework.
High-rise construction presents unique MH challenges, including: Vertical Transport Logistics—Efficient use of tower cranes, hoists, and lifts for moving materials [18]. Space Constraints—Limited on-site storage, necessitating just-in-time delivery strategies [19]. Coordination Complexity—Multiple trades requiring synchronised scheduling to avoid delays [20]. Studies in China have shown that improper MH planning can account for significant time and cost overruns in large-scale projects [21].
Digitalisation has emerged as a solution to MH inefficiencies. BIM-based logistics planning improves material flow visualisation and reduces handling errors [22]. IoT-enabled tracking systems enhance supply chain transparency, while AI-driven predictive analytics optimise delivery schedules [23,24]. However, barriers such as high implementation costs and fragmented adoption remain prevalent [25].
1.4.1. SWOT Framework in Construction Management
Strengths refer to internal capabilities that provide a competitive advantage in MH optimisation. Examples include technological readiness, skilled workforce, robust regulations, financial resources, and stakeholder collaboration [26,27,28]. Weaknesses denote internal limitations such as fragmented coordination, high technology costs, inconsistent compliance, and pressure from rapid urbanisation [29]. These factors can undermine MH efficiency and sustainability goals. Opportunities are external conditions that can be leveraged, including government-driven dual-carbon targets, rapid urbanisation, technological innovation, market competition, and green certification incentives [30,31,32]. Threats are external risks that may hinder optimisation, such as regulatory enforcement gaps, economic downturns, resource scarcity, and stakeholder conflicts [33,34,35].
1.4.2. Analytical Hierarchy Process (AHP) in Construction Research
The AHP, developed by Saaty in the 1970s, is a widely used Multi-Criteria Decision-Making (MCDM) method that decomposes complex problems into hierarchical structures, enabling systematic pairwise comparisons [36]. Its application in construction management includes: Risk assessment and mitigation planning [37]; Sustainability evaluation [38]; Selection of optimal technologies [39].
When combined with SWOT, AHP assigns quantitative weights to qualitative factors, enabling a prioritised ranking of strategic options. Previous studies have successfully applied AHP-SWOT to waste management planning [40], supply chain optimisation [41], and sustainable construction decision-making [42].
1.4.3. Research Gaps and Limitations of Existing Studies
While extensive literature exists on digital MH technologies and sustainable construction, there is a lack of integrated, quantitative frameworks specifically addressing MH optimisation in China’s high-rise buildings. Previous studies often treat SWOT qualitatively, which limits its strategic precision. Moreover, few studies combine expert knowledge, thematic analysis, and AHP-SWOT in the MH context, creating an opportunity for this research to fill the gap.
Although MH has been studied extensively, most existing research is descriptive rather than analytical and often addresses isolated components rather than the integrated system. Many studies focus on specific technologies (e.g., BIM or IoT) without analysing their interaction with organisational, strategic, and policy dimensions. Others evaluate MH efficiency but fail to prioritise the numerous factors influencing MH performance, which limits their practical applicability for resource allocation and strategic decision-making [43].
Furthermore, relatively few studies explicitly link MH optimisation with national or global decarbonisation goals, despite the critical role of logistics efficiency in reducing emissions. Existing AHP-based MH studies in Asia often lack critical comparative analysis and do not integrate findings with broader sustainability policies or international best practices. For instance, research in Singapore and Japan focuses heavily on process automation but provides limited insights into how these technologies interact with regulatory environments or carbon reduction frameworks [44]. Similarly, studies in Europe emphasise digital integration but rarely address financial and institutional mechanisms needed to support adoption in emerging markets.
This gap limits the generalisability and policy relevance of current knowledge. A comprehensive analysis that combines expert judgement with quantitative prioritisation, situates findings within broader policy contexts, and benchmarks them against global experiences is therefore essential. Such an approach would not only advance theoretical understanding but also provide actionable insights for stakeholders aiming to align MH optimisation with decarbonisation and digitalisation agendas.
1.4.4. Research Aim and Contribution
While material handling (MH) has been widely acknowledged as a key determinant of productivity and sustainability in high-rise construction, most existing studies remain fragmented, focusing either on isolated technological solutions or on operational practices without integrating them into a comprehensive optimisation framework. For example, previous research using AHP has prioritised individual factors such as crane scheduling, vertical logistics, or on-site storage efficiency, yet few have examined how these elements interact with organisational capabilities, regulatory contexts, and sustainability objectives. Furthermore, studies in Singapore, Japan, and Europe have demonstrated the potential of BIM and IoT for logistics planning, but they often neglect the influence of policy incentives or the barriers faced by SMEs in resource-constrained settings.
In response to the gaps identified above, this study aims to develop an integrated decision-support framework for MH optimisation in high-rise construction, combining systematic literature review, semi-structured expert interviews, and SWOT–AHP analysis. The objectives are threefold: (1) To identify and prioritise the critical factors influencing MH in China’s high-rise construction sector. (2) To contextualise these factors within China’s dual-carbon agenda and benchmark them against international practices. (3) To provide strategic recommendations that align MH optimisation with broader sustainability and digitalisation goals.
The study contributes to the literature by (1) offering a structured prioritisation of MH factors grounded in expert judgement and AHP analysis, (2) integrating digital, financial, and policy dimensions [45] often overlooked in prior studies, (3) situating MH optimisation within global sustainability frameworks, and (4) advancing theoretical understanding by linking findings to RBV, TOE, and Institutional Theory. These contributions support policymakers, industry leaders, and researchers in designing more effective strategies to improve MH performance and accelerate the transition toward sustainable, digitalised construction systems.
2. Methodology
This study adopted the mixed methods to explore and prioritise the key factors influencing material handling (MH) optimisation in high-rise construction projects in China. As illustrated in Figure 2, the research framework began with a systematic review of SLR-based literature analysis and expert interviews to formulate a SWOT-AHP analytical model and identify key elements (Expert choice 12.0 software for AHP) [46]. The research integrated three complementary stages:
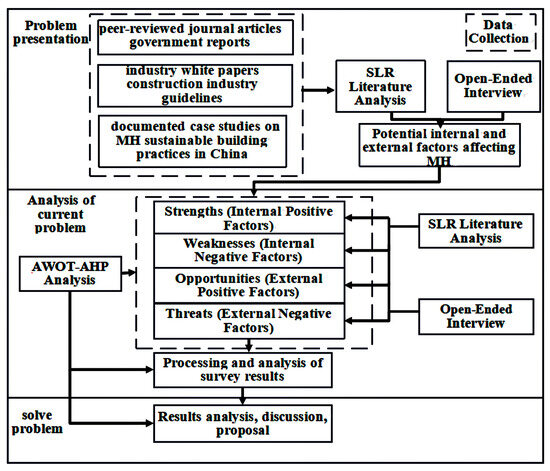
Figure 2.
Research Framework.
Systematic Literature Review (SLR): to identify and synthesise MH factors documented in peer-reviewed literature and industry reports.
Semi-Structured Expert Interviews: to refine and validate the factors and gather contextual insights from industry practice.
SWOT–AHP Analysis: to prioritise the identified factors and develop a decision-support framework.
This multi-stage approach ensured both of the breadth and depth of analysis, combining empirical evidence with expert judgement and quantitative prioritisation. The design of mixed-methods is widely recognised for its robustness in construction management research, particularly where the complex and multi-criteria decisions are involved [47].
2.1. Systematic Literature Review
A systematic literature review was conducted following the PRISMA protocol to ensure methodological rigour. Searches were performed in Scopus, Web of Science, and ScienceDirect databases covering the period of 2015–2025 using keywords such as “material handling,” “high-rise construction,” “digital construction,” “SWOT,” and “AHP.” Only the peer-reviewed journal articles, conference papers, and authoritative industry reports were included. After duplicate removal and relevance screening, 48 studies were selected for full-text review.
2.2. Data Collection
2.2.1. Secondary Data Collection
Secondary data referred to the information previously collected by the other researchers, institutions, or organisations and made available for subsequent studies [48]. While generally more accessible than primary data, it requires careful evaluation of context, methodology, and potential biases to ensure validity of research findings.
In this study, secondary data were used to identify potential internal and external factors influencing material handling (MH) in China’s high-rise building sector. Sources included peer-reviewed journal articles, government reports, industry white papers, construction industry guidelines, and documented case studies on material handling, high-rise construction logistics, and sustainable building practices in China [49].
The extracted information was systematically reviewed to generate an initial list of SWOT-based factors—Strengths, Weaknesses, Opportunities, and Threats—relevant to optimising MH performance. This preliminary factor list served as the foundation for both the expert interview phase and Analytical Hierarchy Process (AHP) questionnaire design.
2.2.2. Expert Interviews
To complement secondary data, semi-structured interviews were conducted with the selected industry professionals to gain deeper insights into contextual challenges, opportunities, and best practices in MH for high-rise buildings. The interview protocol covered:
Sampling Strategy and Participant Profile: Semi-structured interviews were conducted with 30 industry experts between April and August 2024. The participants were purposively sampled to ensure diverse perspectives and included project managers, construction engineers, logistics specialists, BIM coordinators, and policy advisors with 10–35 years of experiences in high-rise construction. All participants had direct involvement in MH decision-making, digital technology implementation, or sustainability strategy development.
Experts were drawn from major metropolitan regions in China (Beijing, Shanghai, Chongqing, and Guangzhou) as well as three international practitioners from Singapore and the United Arab Emirates to incorporate global perspectives. This geographical diversity strengthened the external validity of the findings and ensured that the prioritised factors reflect both the local and international realities.
Sampling adequacy was guided by the principle of thematic saturation, which occurs when additional interviews no longer yield new insights. Saturation was achieved by the 27th interview, and three additional interviews were conducted to confirm the stability of themes.
Interviews followed a semi-structured guide covering five thematic areas: (1) current MH practices, (2) technological adoption and barriers, (3) sustainability and regulatory pressures, (4) strategic opportunities, and (5) future trends. Transcripts were coded to identify key factors and refine the SWOT categories identified from the literature.
The SWOT framework was used to categorise the MH factors identified through literature and interviews into four dimensions:
Strengths (S): Internal capabilities that enhance MH effectiveness (e.g., digitalisation readiness, and skilled workforce). Weaknesses (W): Internal limitations constraining performance (e.g., high costs, and fragmented coordination). Opportunities (O): External conditions that can be leveraged (e.g., technological advancement, and policy incentives). Threats (T): External risks or barriers (e.g., resource scarcity, and regulatory uncertainty).
SWOT analysis provided a structured foundation for prioritisation by organising qualitative insights into strategic categories. However, SWOT by itself does not quantify the relative importance of each factor. To address this, the study applied the Analytic Hierarchy Process (AHP) in the subsequent stage.
All interviews were conducted after obtaining informed consent, in the form of face-to-face meetings, video calls, or telephone conferences, each lasting for approximately 45 to 60 min. The interview process was fully recorded and transcribed into texts for subsequent thematic analysis. The sampling strategy and interview content are presented in Table 1. Descriptive statistics of participant demographics and professional backgrounds can be seen in Table 2. The descriptive statistics of demographic characteristics can be obtained in Figure 3.

Table 1.
Interview content.
Table 2.
Descriptive statistics of participant demographics and professional backgrounds.
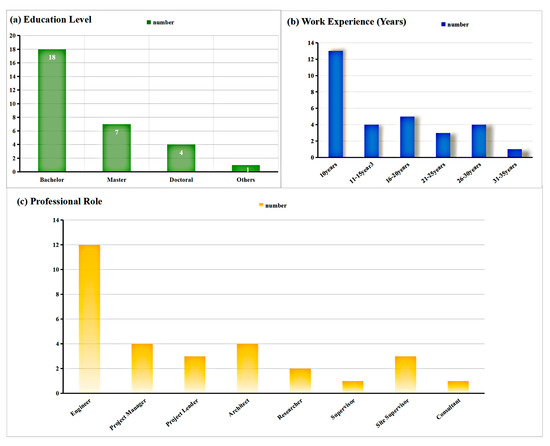
Figure 3.
Descriptive Statistics of Demographic Characteristics.
2.2.3. Reliability and Validity of Open-Ended Interview Data
To ensure the credibility and validity of the results, all interview data were coded following a predefined protocol and cross-checked by participants and peer auditors.
Reliability analysis:
The internal consistency of the items was assessed using Cronbach’s α coefficient. Cronbach’s alpha is a fundamental measure of internal consistency reliability, indicating the extent to which items within a construct measure the same underlying concept. It ranges from 0 to 1, with higher values reflecting greater consistency. In this study, Cronbach’s alpha was calculated for both constructs. The results demonstrated excellent internal consistency, with values of 0.904 for the current MH practices scale and 0.962 for the Key Elements for MH Implementation scale, both substantially exceeding the recommended threshold of 0.70. This confirms that the items within each construct are highly correlated and reliably measure their intended concepts, establishing a solid foundation for subsequent analysis. A value of α > 0.7 indicates acceptable reliability [50]. The α coefficient can be calculated using Equation (1) [51],
where k means number of items, means variance of item iii, means total score variance.
The internal consistency reliability of the research scales was assessed using Cronbach’s alpha, and the results are presented in Table 3. Both measurement scales demonstrated high reliability. The two-item scale for current MH practices exhibited excellent internal consistency (α = 0.904). Both items showed identically strong corrected item-total correlations (CITC = 0.825), confirming their robust relationship with the overall scale.
Table 3.
Reliability and item analysis of the measurement scales.
CITC (Corrected Item-Total Correlation) is a key indicator for assessing the internal consistency of a scale, reflecting the strength of the correlation between a specific item and the total score of the remaining items in the scale. In this study, the CITC values of all items (0.825–0.940) far exceeded the strict standard of 0.50, demonstrating a high correlation between each item and its corresponding construct.
For the three-item scale measuring Key Elements for MH Implementation, the overall reliability was superb (α = 0.962). A detailed item analysis revealed that all items possessed very high CITC values, substantially exceeding the rigorous threshold of 0.50. Specifically, the CITC for “technological adoption and barriers” was 0.932, for “strategic opportunities and future trends” was 0.940, and for “sustainability and regulatory pressures” was 0.894. A diagnostic check of the ‘alpha if item deleted’ statistic indicated that the removal of the “sustainability and regulatory pressures” item would result in a marginal increase in the alpha coefficient to 0.962. Despite this statistical suggestion, the item was retained. This decision was grounded in the fact that its CITC value (0.894) is exceptionally high and signifies a very strong association with the overall construct. Furthermore, its content is theoretically fundamental for a comprehensive operationalisation of the scale’s intended domain. Consequently, the final three-item scale was retained in its entirety, demonstrating both exceptional reliability and content validity for subsequent analyses.
This indicator is used to identify items that negatively affect the reliability of the scale. Item reduction should be considered in the following situations:—When the CITC value is below 0.50;—When deleting the item significantly improves the overall alpha coefficient of the scale. Data analysis in this study shows that all items meet the following conditions:—CITC indicators all exceed the excellent standard of 0.80;—Deleting any item does not increase the alpha coefficient (for example, the original alpha of the Key Elements scale is 0.962, and after deleting individual items, alpha ranges from 0.932 to 0.962). In summary, all items contribute positively to the reliability of the scale, and no deletion is necessary. If the CITC value falls below 0.5 in future studies, items will be optimised according to the above standards.
2.3. Validity Assessment of the Measurement Model
2.3.1. Preliminary Factorability Analysis
Prior to conducting factor analysis, the suitability of the data was assessed using the Kaiser-Meyer-Olkin (KMO) measure and Bartlett’s test of sphericity. The KMO statistic was 0.656, exceeding the conventional threshold of 0.60 for sampling adequacy. Bartlett’s test of sphericity was significant (χ2(10) = 135.040, *p* < 0.001), leading to the rejection of the null hypothesis that the correlation matrix is an identity matrix. These results collectively confirm that the correlations between items are sufficiently large and that the data are appropriate for proceeding with factor analysis (see Table 4).
Table 4.
Results of the Kaiser-Meyer-Olkin (KMO) test and Bartlett’s test of sphericity.
2.3.2. Convergent Validity Analysis
Convergent validity of the measurement model was assessed using confirmatory factor analysis (CFA). The composite reliability (CR) and average variance extracted (AVE) were computed to evaluate the internal consistency and convergent validity of the constructs.
CR is a more robust reliability measure that accounts for the varying factor loadings of individual items. Unlike Cronbach’s alpha, which assumes equal weighting, CR assigns greater weight to items with stronger factor loadings, providing a more accurate estimation of reliability. For this work, CR values for both constructs were exceptional—0.912 for current MH practices and 0.964 for Key Elements for MH Implementation—surpassing the 0.70 benchmark. These results validate the high internal consistency of the scales and align with modern psychometric standards, particularly in structural equation modelling, where CR is prioritised for its precision.
AVE evaluates convergent validity by measuring the average amount of variance that a construct captures from its items relative to the variance due to measurement error. An AVE value above 0.50 indicates that the construct explains more than half of the variance in its items. For this study, the AVE values for both constructs were robust: 0.840 for current MH practices and 0.898 for Key Elements for MH Implementation. These results not only exceed the 0.50 threshold but also provide strong evidence of convergent validity, confirming that the items effectively represent their intended constructs with minimal error.
To sum up, the of these three tests is highly appropriate for this questionnaire as they collectively address both reliability (Cronbach’s alpha and CR) and validity (AVE). The results uniformly demonstrate that the measurement model is both reliable and valid, with all key metrics exceeding rigorous academic standards. This comprehensive psychometric evaluation ensures the integrity of the data and supports the robustness of any subsequent inferential analyses derived from this questionnaire.
CR and AVE were calculated using the following Equations (2) and (3) [51],
where means standardised loading, means residual variance. Convergent validity is acceptable if CR > 0.7 and AVE > 0.5.
The results of the confirmatory factor analysis, summarised in Table 5, confirm the robustness of the measurement model. All standardised factor loadings were statistically significant and substantial, ranging from 0.909 to 0.966, exceeding the recommended threshold of 0.70 and thus demonstrating strong indicator reliability. The composite reliability (CR) values for both constructs were well above the 0.70 benchmark—0.905 for current MH practices and 0.963 for Key Elements for MH Implementation—indicating excellent internal consistency. Furthermore, the average variance extracted (AVE) for each construct significantly surpassed the 0.50 criterion (0.826 and 0.897, respectively), providing strong evidence of convergent validity by showing that the constructs account for a large portion of the variance in their respective indicators. In summary, the measurement model exhibits satisfactory reliability and validity, supporting its use in subsequent analyses.
Table 5.
Results of confirmatory factor analysis: reliability and validity.
2.3.3. Discriminant Validity
Discriminant validity was assessed using the Fornell-Larcker criterion. As shown in Table 6, the √AVE for each construct in the two-factor model substantially exceeds its correlation with the other construct (0.917 > 0.273; 0.948 > 0.273), confirming distinct constructs. In contrast, the single-factor model shows a critical violation, with its correlation to the Key Elements construct (0.930) exceeding its own √AVE (0.751). These results provide strong evidence for the discriminant validity of the two-factor model and support its selection for further analysis.
Table 6.
Assessment of discriminant validity: Fornell-Larcker criterion.
2.3.4. Interpretation of Open-Ended Interview Data
As given in Table 7, The presence of significant positive correlations among various factors provides strong support for achieving the research objectives.
Table 7.
Pearson correlation and significance analysis.
In summary, the open-ended interview data are consistent with the hypotheses of this study, and their reliability and validity meet the required standards. Therefore, these data can be integrated with the SLR-based literature analysis to construct the framework for the SWOT-AHP model.
2.4. Hierarchy Configuration
Based on the data derived from the SLR literature analysis and integrated with the outcomes of expert interviews, the hierarchical structure for the SWOT-AHP model was designed. As illustrated in Figure 4, it includes three levels. Specific items are presented in Table 8.
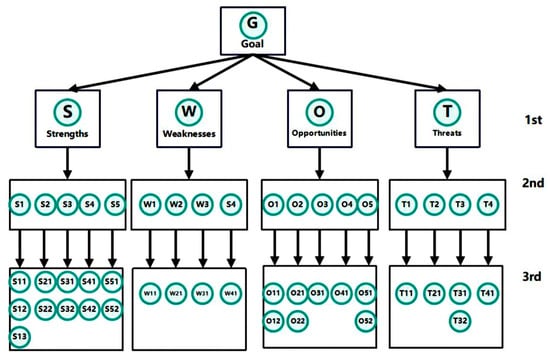
Figure 4.
This figure presents the hierarchical model of the SWOT-AHP framework.
Table 8.
Detailed information on factors affecting MH.
2.5. Conducting a SWOT-AHP Survey
2.5.1. Analytical Hierarchy Process (AHP) Questionnaire Survey
The Analytic Hierarchy Process (AHP), developed by Thomas L. Saaty in the 1970s, is a multi-criteria decision-making (MCDM) technique that simplifies complex problems by structuring them into a hierarchical framework. The method uses pairwise comparisons to evaluate the relative importance of decision criteria, producing quantitative weights for systematic decision-making.
In this study, the AHP is integrated with SWOT (AHP-SWOT) to prioritise the identified factors affecting MH optimisation. The AHP questionnaire hierarchy is structured as follows: Level 1: Four SWOT categories (Strengths, Weaknesses, Opportunities, Threats). Level 2: 4 or 5 factors under each SWOT category (validated through secondary data and thematic analysis). Experts are asked to compare each pair of factors using Saaty’s 1–9 intensity scale (Table 9).
Table 9.
Intensity scale for AHP [23].
2.5.2. Expert Sampling and Data Collection Procedure
A panel of 10–12 experts—including project managers, logistics planners, engineers, MH specialists, and policy advisors—is selected using purposive and snowball sampling. Participants receive an online survey link with detailed definitions and descriptions of each SWOT factor to ensure consistent interpretation. Pairwise comparison questionnaires were distributed to the same 30 experts involved in the interviews. Respondents compared the relative importance of each factor on a nine-point Saaty scale (1 = equal importance, 9 = extreme importance). A sample of 24 complete and valid responses was obtained (response rate: 80%).
2.6. Data Analysis: AHP-SWOT and Thematic Integration
2.6.1. Thematic Analysis
The thematic analysis of interviews provides qualitative validation and contextual detail for the SWOT factors. Themes emerging from the data are compared with the literature-derived list, ensuring that the final AHP model reflects both documented evidence and practical, on-the-ground realities.
2.6.2. AHP Computation
This study employs the SWOT–AHP integrated approach to systematically identify and prioritise critical factors influencing material handling in high-rise building construction. The procedure consists of four stages:
(a) Identification and classification of SWOT factors
Candidate factors were compiled from an extensive literature review and expert interviews, followed by screening to avoid duplication. The finalised factors were categorised into Strengths (S1–S5), Weaknesses (W1–W4), Opportunities (O1–O5), and Threats (T1–T4) group Structuring the SWOT hierarchy in AHP format.
(b) Construction of pairwise comparison matrices
Within each SWOT group, experts conducted pairwise comparisons using Saaty’s 1–9 scale [52]. Individual judgments were aggregated using the geometric mean, which is widely recommended in AHP applications for combining multiple expert inputs (see Equation (4) [53]),
where m is the number of experts and denotes the judgement of the k-th expert.
(c) Weight calculation and aggregation
Based on this, the weight vector w is derived by the eigenvector method, solving the following characteristic Equation (5) [53],
where λmax is the maximum eigenvalue of the judgement matrix.
The weight vector is then normalised to obtain the relative weights [53],
for hierarchical structures. For multi-level hierarchical structures, the local weights are aggregated to derive global weights at the top level [53],
where is the weight at level 1. To avoid bias between internal and external dimensions, equal weights (0.25 each) were assigned to the four top-level SWOT categories.
(d) Consistency check of the judgement matrix
To ensure the rationality of the judgement matrix, a consistency check is performed. The consistency index (CI) is defined as [54],
and the consistency ratio (CR) is calculated with reference to the random index (RI) [54],
where RI is the random index for a matrix of order nnn. A threshold of CR ≤ 0.10 indicated satisfactory consistency. Matrices meeting this criterion were accepted for subsequent global ranking. All pairwise matrices in this study achieved CR values between 0.03 and 0.08, confirming the reliability of expert judgments.
In the AHP phase, expert judgments were aggregated using the geometric mean, a widely accepted method for combining individual pairwise comparisons while preserving the proportionality of responses. Consistency ratios (CR) were calculated for all judgement matrices using Saaty’s method, with values ranging from 0.03 to 0.08—well below the 0.10 threshold—confirming the reliability and logical consistency of expert inputs. The integration of qualitative themes from interviews with literature-derived factors ensured that the final SWOT–AHP model reflected both empirical evidence and industry practice, strengthening the validity and applicability of the findings.
Through this process, the SWOT–AHP framework ensured that factor weights were derived in a transparent, systematic, and scientifically valid manner, allowing for robust prioritisation of strategic considerations in high-rise material handling [55].
2.7. Integration of Results
The final ranked list of SWOT-based factors—derived from AHP computations—is integrated with qualitative insights from thematic analysis. This mixed-methods integration ensures that priority rankings are both quantitatively robust and qualitatively grounded. The results serve as a strategic guide for decision-makers in optimising material handling in high-rise building projects in China, balancing technological, operational, regulatory, and sustainability considerations.
3. Results and Discussion
3.1. Priority Ranking of SWOT Factors Using AHP
3.1.1. Priority Ranking of SWOT Categories Using AHP
The analytic hierarchy process (AHP) was employed to determine the priority ranking of SWOT factors. The SWOT–AHP analysis produced a ranked list of 18 factors influencing material handling (MH) optimisation in high-rise construction. Pairwise comparisons and eigenvector calculations yielded both local weights (relative importance within each SWOT category) and global weights (overall importance across all factors). Consistency ratios (CR) for all comparison matrices ranged between 0.03 and 0.08, confirming an acceptable judgement consistency. The top-ranked factors demonstrate the strategic emphasis placed on digitalisation and technological readiness, while highlighting significant constraints related to cost and resource availability.
At the top level (4 × 4), the pairwise comparison of SWOT categories—Strengths, Weaknesses, Opportunities, and Threats—resulted in a uniform weight distribution (S = W = O = T = [0.25, 0.25, 0.25, 0.25]), reflecting a neutral stance. As presented in Table 10, the corresponding judgement matrix achieved a complete consistency, with λmax = 4.000, consistency index (CI) = 0.000 and consistency ratio (CR) = 0.000 (n = 4, RI = 0.89). These results indicate a perfect internal consistency, thereby confirming the validity and reliability of the matrix.
Table 10.
Pairwise comparison matrix of SWOT criteria (S, W, O, T).
3.1.2. Priority Ranking of Strength Factors (S1–S5)
At the sub-criteria level, the strength factors (S1–S5) were further evaluated using AHP. As shown in Table 11, the pairwise comparison matrix achieved a full consistency (λmax = 5.000, CI = 0.000, CR = 0.000, n = 5, RI = 1.12), thereby ensuring the reliability of the results. The derived local weights ranked the strength factors as follows: S1 (0.33) > S5 (0.22) > S3 (0.18) > S2 (0.16) > S4 (0.11). Based on the adjustment to the global level by multiplying with the category weight (0.25), the ranking remained unchanged, indicating robustness in the prioritisation. These results suggest that S1 emerged as the most influential strength factor, while S4 was comparatively less significant.
Table 11.
Pairwise comparison matrix of strength factors (S1–S5).
3.1.3. Priority Ranking of Weakness Factors (W1–W5)
The Weakness factors (W1–W5) were further evaluated using AHP. As shown in Table 12, the pairwise comparison matrix achieved full consistency (λmax = 4.000, CI = 0.000, CR = 0.000, n = 4, RI = 0.89), thereby ensuring the reliability of the results. The local weight ranking calculated is as follows: W2 (0.36) > W1 (0.28) > W4 (0.20) > W3 (0.16). When being adjusted to the global level by multiplying with the category weight (0.25), the ranking remained unchanged, indicating robustness in the prioritisation. These results suggest that W2 emerged as the most influential strength factor, while W3 was comparatively less significant.
Table 12.
Pairwise comparison matrix of weakness factors (W1–W5).
3.1.4. Priority Ranking of Opportunity Factors (O1–O5)
At the sub-criteria level, the Opportunity factors (O1–O5)were further evaluated using AHP. As shown in Table 13, the pairwise comparison matrix achieved full consistency (λmax = 5.000, CI = 0.000, CR = 0.000, n = 5, RI = 1.12), thereby ensuring the reliability of the results. The local weight ranking calculated is as follows: O3 (0.30) > O1 (0.22) > O5 (0.18) > O2 (0.16) > O4 (0.14). When adjusted to the global level by multiplying with the category weight (0.25), the ranking remained unchanged, indicating robustness in the prioritisation. These results suggest that O3 emerged as the most influential strength factor.
Table 13.
Pairwise comparison matrix of opportunity factors (O1–O5).
3.1.5. Priority Ranking of Threat Factors (T1–T4)
The Threat factors (T1–T4)were further evaluated using AHP. As shown in Table 14, the pairwise comparison matrix achieved full consistency (λmax = 4.000, CI = 0.000, CR = 0.000, n = 4, RI = 0.89), thereby ensuring the reliability of the results. The local weights T3 = 0.34, T2 = 0.28, T4 = 0.20, T1 = 0.18, These results suggest that T3 emerged as the most influential strength factor.
Table 14.
Pairwise comparison matrix of threat factors (T1–T4).
3.1.6. Global Priority Ranking of SWOT-Based Factors for MH Optimisation
Using the SWOT–AHP approach, the internal and external factors influencing material handling (MH) in Chinese high-rise buildings were quantitatively ranked. The priority weights were derived from expert pairwise comparisons, ensuring all consistency ratios (CR) remained below 0.1 in accordance with AHP standards.
The results (Table 15) reveal that Technological Adoption (S1) and Technological Advancements (O3) have the highest strategic importance, followed closely by High Implementation Costs (W2) and Resource Scarcity (T3). These four factors dominate the strategic landscape for MH optimisation in China’s high-rise sector, accounting for over 33% of the total priority weight.
Table 15.
Global priority ranking of SWOT-based factors for MH optimisation.
3.2. Interpretation of Findings
The high importance of S1 and O3 confirms a technology-led pathway for MH optimisation: BIM-enabled logistics planning, WMS-based inventory control, and IoT-assisted tracking reduce staging conflicts and crane idle time and improve schedule adherence. In parallel, W2 and T3 highlight that cost barriers and supply risks remain binding constraints—particularly for small and medium-sized contractors—suggesting the need for pooled financing and supplier diversification.
Policy levers are complementary: the 2022 Implementation Plan for Carbon Peaking [56] in Urban and Rural Development envisages widespread distributed solar, low-carbon construction processes, and efficiency upgrades by 2025 [57]; the General Codes for Civil Buildings [58] and for Building Energy Efficiency embed minimum performance requirements relevant to materials, envelopes, and site practices. Aligning MH investments with these instruments can unlock incentives and reduce risk.
The prioritisation results reveal that Technological Adoption (S1) is the most influential factor in MH optimisation (global weight: 0.083). This underscores the strategic importance of digital transformation in improving logistics efficiency, enhancing visibility, and enabling real-time decision-making. Similar conclusions have been reported in global studies, where BIM-IoT integration has reduced material losses and improved supply chain coordination by over 25%.
The second-ranked factor, High Implementation Costs (W2) (global weight: 0.090), reflects a major barrier to adopting digital MH solutions, particularly for small and medium-sized enterprises (SMEs). This finding aligns with international evidence showing that high capital and training costs limit BIM and IoT adoption, particularly in emerging markets [10].
Technological Advancements (O3) (global weight: 0.075) ranked third, indicating strong opportunities arising from the rapid evolution of construction technologies. Emerging tools such as AI-driven logistics platforms, predictive analytics, and digital twins offer significant potential to optimise MH processes [59]. However, realising these benefits depends on organisational readiness and the ability to integrate new tools into existing workflows.
Resource Scarcity (T3) (global weight: 0.085) emerged as a key external threat. Disruptions in global supply chains, geopolitical tensions, and fluctuating raw material availability pose substantial risks to project schedules and budgets. This result mirrors findings from European and Middle Eastern contexts, where resource volatility has driven construction firms to adopt predictive procurement systems and closed-loop material strategies [6].
3.3. Strategic Implications
The integration of the top-ranked SWOT factors into actionable strategies is summarised in Table 16. These recommendations target both immediate risk mitigation and long-term performance optimisation, with a focus on maximising the synergy between strengths and opportunities (SO strategies) while addressing critical weaknesses and threats (WT strategies).
Table 16.
Key insights and strategic recommendations based on top-ranked SWOT factors.
The results also suggest important interrelationships among the top-ranked factors, highlighting both synergies and trade-offs that must be managed strategically:
- S1 ↔ O3—Digital Synergy: The interplay between internal technological capabilities (S1) and external innovation trends (O3) indicates that firms must build foundational digital competencies to effectively exploit emerging technologies. Without internal readiness, rapid technological advancement may exacerbate capability gaps rather than close them.
- W2 ↔ O5—Cost–Incentive Nexus: High implementation costs (W2) may be mitigated by leveraging external incentives such as green certification schemes (O5) or government subsidies. This cost–incentive dynamic is evident in European contexts, where public funding programmes have accelerated BIM adoption among SMEs [8].
- T3 ↔ O1—Sustainability–Scarcity Alignment: Resource scarcity (T3) reinforces the strategic importance of sustainability initiatives such as China’s dual-carbon targets (O1). Circular economy practices, including material reuse and reverse logistics, can simultaneously mitigate scarcity risks and contribute to carbon reduction goals [5].
These interdependencies demonstrate that MH optimisation cannot be addressed through isolated interventions. Effective strategies require integrated approaches that align technological readiness, financial mechanisms, sustainability objectives, and policy support.
3.4. Summary of Strategic Direction
The SWOT–AHP findings advocate a dual-track strategy for MH optimisation in Chinese high-rise buildings (see Figure 5):
- Technology-led optimisation—Capitalise on S1 and O3 to accelerate the integration of digital tools, automation, and smart logistics into MH processes.
- Cost and risk management—Address W2 and T3 through financial innovation, collaborative models, and resilient supply chain practices.

Figure 5.
SWOT strategy analysis (SO–WO–ST–WT) for MH optimisation.
Figure 5.
SWOT strategy analysis (SO–WO–ST–WT) for MH optimisation.

This combined approach is expected to enhance efficiency, safety, and environmental performance in MH operations, positioning the industry to meet the demands of both rapid urban growth and sustainability commitments.
In terms of the regional context, Japan’s BIM uptake studies using SWOT–AHP emphasise standardisation and training as critical early enablers [22]. Singapore’s regulatory regime (e.g., BCA’s Green Mark and digital delivery mandates) has accelerated technology adoption by tying incentives to code compliance and whole-life performance. Malaysia’s CIDB and Green Building Index initiatives show a gradual move towards digital MH but with financing and capability gaps similar to Chinese SMEs. These comparisons suggest China’s combination of national codes and provincial pilots provides a strong platform; the main differentiators will be financing mechanisms for SMEs and the integration of MH data with carbon accounting and procurement.
When benchmarked globally, the prioritised factors identified in this study are consistent with findings from other regions but exhibit notable contextual variations. In Europe, technological adoption and cost barriers similarly dominate MH decision-making, but strong regulatory mandates—such as BIM requirements in public procurement—have accelerated digitalisation [8]. In the United States, cost remains a major constraint, but large-scale public investment in digital infrastructure and tax incentives have helped offset financial barriers [9].
In the Middle East, resource scarcity is particularly acute due to reliance on imported materials, leading to innovative solutions such as predictive procurement and digital supply chain modelling [6]. Meanwhile, in Japan and Singapore, emphasis is placed on workforce skills and regulatory enforcement, reflecting mature construction ecosystems with well-established digital capabilities [44].
These comparisons indicate that while certain MH factors are globally significant, their relative importance is shaped by national policy frameworks, market structures, and technological maturity. Understanding these contextual differences is essential for tailoring MH strategies to specific environments.
4. Discussion and Policy Implications
4.1. Digitalisation and Internal Capabilities (S1 + O3)
The prioritisation of Technological Adoption (S1) and Technological Advancements (O3) demonstrates that the digital transformation of MH systems is the most critical driver of performance improvement in high-rise construction. This finding aligns with global trends, where digital integration has redefined how materials are planned, transported, tracked, and managed throughout project lifecycles [2]. BIM-based logistics platforms, IoT-enabled real-time tracking, and AI-assisted scheduling systems have become essential for achieving efficiency, reducing waste, and enhancing coordination among multiple project stakeholders.
From the perspective of the Resource-Based View (RBV), digital capabilities represent strategic resources that are valuable, rare, and difficult to replicate [11]. Organisations with mature BIM infrastructure, advanced data analytics systems, and digital twin capabilities are better positioned to optimise MH processes and achieve superior project outcomes. These capabilities extend beyond technological tools; they also encompass the skills, organisational culture, and data governance structures needed to implement and sustain digital solutions [43].
Moreover, the synergy between S1 and O3 suggests that the greatest benefits arise when internal capabilities are aligned with external technological progress. Rapid advancements in AI, automation, and sensor technologies offer new opportunities to improve MH efficiency, but organisations must possess the absorptive capacity to integrate and apply these innovations [5]. Without adequate digital literacy, data infrastructure, and change management processes, firms risk underutilising new technologies or creating fragmented, non-interoperable systems.
Global case studies illustrate this interaction clearly. The Hudson Yards project in the United States combined BIM with AI-driven predictive scheduling to optimise material deliveries, reducing crane idle time by over 20% [9]. In Europe, the Crossrail project integrated BIM and IoT platforms with supplier data to enhance supply chain transparency, achieving significant reductions in material delays [8]. These examples show how digital tools amplify the impact of strategic capabilities and vice versa.
To replicate such success in China, construction firms should prioritise digital capability building as a strategic objective. This includes workforce training in BIM and data analytics, investment in interoperable platforms, and adoption of open data standards to ensure seamless communication across supply chains. Partnerships with technology providers and academic institutions can also accelerate knowledge transfer and innovation. Furthermore, pilot projects that demonstrate the tangible benefits of digital MH systems can help overcome resistance to change and build organisational momentum for broader adoption.
4.2. Economic and Financial Constraints (W2 + O5)
The second key finding concerns the prominence of High Implementation Costs (W2) as a barrier to MH optimisation. This factor reflects the significant capital investment required for hardware, software, and training, as well as the ongoing costs of system maintenance and data management. These financial burdens are particularly challenging for small and medium-sized enterprises (SMEs), which form a substantial portion of the construction sector in China and globally [7].
This challenge is not unique to China. Studies in Europe and North America consistently identify cost as a primary barrier to digital technology adoption [8]. In response, many governments have introduced financial support mechanisms to encourage digitalisation. For instance, the European Union’s Digital Europe Programme provides funding to SMEs for digital transformation projects, while the U.S. Inflation Reduction Act offers tax credits and direct subsidies for digital infrastructure investments [9]. These policies reduce upfront costs and shorten payback periods, making technology adoption more financially feasible.
The interaction between W2 and Green Certification Incentives (O5) highlights the potential for external incentives to mitigate financial barriers. Linking financial support to sustainability outcomes can simultaneously advance digitalisation and decarbonisation goals. For example, projects that implement BIM-based logistics systems or IoT-enabled energy monitoring could qualify for green building incentives, preferential financing, or tax benefits. This approach aligns with the Technology-Organisation-Environment (TOE) framework, which emphasises the importance of environmental pressures—including regulatory incentives—in shaping organisational adoption behaviour [12].
Collaborative financing models also offer promising solutions. Public–private partnerships (PPPs) can facilitate the development of shared digital logistics platforms that reduce individual firm costs while expanding sector-wide capacity. Pooled leasing of smart MH equipment—such as automated hoists and robotic delivery systems—can lower capital expenditures and spread risk across multiple projects [44]. These models are particularly relevant for China, where state-owned enterprises and public agencies play significant roles in infrastructure development and could act as anchor tenants in such partnerships.
Moreover, the financial challenge should be reframed not just as a cost issue but as an investment in long-term value creation. Digital MH systems generate savings through reduced waste, improved resource utilisation, and enhanced project predictability. They also position firms competitively for future regulatory requirements and client demands for low-carbon construction. Quantifying these long-term benefits and communicating them to decision-makers can shift organisational perspectives from cost avoidance to strategic investment.
4.3. Sustainability and Resource Challenges (T3 + O1)
The prioritisation of Resource Scarcity (T3) as a major threat highlights the vulnerability of MH systems to external supply disruptions, material shortages, and price volatility. These risks have intensified in recent years due to global events such as the COVID-19 pandemic, geopolitical conflicts, and the accelerating demand for construction materials driven by urbanisation and energy transitions [4]. In high-rise construction, where schedules are tightly coupled with material availability, such disruptions can lead to significant delays, cost overruns, and contractual disputes.
At the same time, Dual Carbon Targets (O1) represent a strategic opportunity to align MH practices with broader sustainability and decarbonisation agendas. Efficient MH can significantly reduce material waste, energy consumption, and associated emissions—all of which contribute to achieving carbon peaking and neutrality goals [5]. The interaction between T3 and O1 underscores the need to address resource scarcity and sustainability objectives simultaneously, rather than treating them as separate challenges.
One promising approach is the integration of circular economy principles into MH strategies. Practices such as material reuse, modular construction, and reverse logistics can reduce reliance on virgin materials, lower environmental impacts, and enhance supply chain resilience [6]. The European Commission’s Circular Economy Action Plan, for example, mandates material traceability and encourages digital material passports, which enable efficient tracking and reuse of construction components. Similar initiatives in Japan and Singapore have demonstrated how closed-loop supply chains can stabilise material supply and reduce carbon footprints [44].
Digital technologies are central to implementing such strategies. IoT sensors and blockchain-based tracking systems enhance transparency and traceability, enabling more effective material recovery and reuse. Digital twins can simulate alternative procurement scenarios, identify bottlenecks, and support proactive decision-making. AI-driven predictive analytics can forecast material shortages and price fluctuations, allowing contractors to adjust procurement strategies in advance [3].
From a policy perspective, linking MH optimisation to sustainability objectives can unlock new sources of support and legitimacy. Governments could integrate MH performance indicators—such as logistics energy intensity, waste reduction rates, and delivery optimisation metrics—into green building certification schemes and carbon reporting frameworks. This would not only incentivise firms to improve MH efficiency but also provide measurable evidence of progress toward national decarbonisation targets.
In China’s context, aligning MH optimisation with the country’s dual-carbon strategy offers significant potential for transformative change. By embedding MH considerations into carbon peaking roadmaps, urban development policies, and construction standards, policymakers can ensure that logistics efficiency becomes a core pillar of the nation’s sustainability transition. Industry stakeholders, meanwhile, can position MH optimisation as both a risk mitigation strategy and a source of competitive differentiation in a rapidly evolving market.
4.4. Policy and Governance Synergies (S3 + T1)
The interaction between Strong Regulatory Framework (S3) and Regulatory Enforcement Gaps (T1) reveals a paradox that characterises many construction markets, including China’s. While comprehensive regulatory structures for safety, environmental performance, and digital adoption exist, inconsistent enforcement and fragmented governance often limit their effectiveness [43]. This regulatory gap creates uncertainty, discourages investment in advanced MH systems, and leads to uneven implementation across projects and regions.
Globally, governments have played a decisive role in driving digitalisation and sustainability in construction. In the European Union, BIM adoption has been accelerated by mandates in public procurement (EU Directive 2014/24/EU), effectively creating a coercive institutional pressure that compels firms to develop digital capabilities [8]. Similarly, the United Kingdom’s “Digital Built Britain” strategy integrates MH optimisation into broader digital construction goals, setting clear standards and timelines for adoption. The United States links federal infrastructure funding to digital readiness benchmarks, incentivising firms to invest in digital systems to remain competitive [9].
China has taken important steps through initiatives such as the Implementation Plan for Carbon Peaking in Urban and Rural Development (2022) and GB/T 50378–2019 Green Building Evaluation Standard. However, MH optimisation is rarely addressed explicitly within these frameworks, and performance indicators for logistics efficiency, material waste reduction, or digital integration are often absent. This limits the ability of policy to influence MH practices directly and reduces accountability for progress.
Bridging this gap requires policy mainstreaming, where MH optimisation is integrated into national sustainability, digitalisation, and infrastructure development strategies. Regulatory standards should incorporate MH-related metrics—such as delivery efficiency, logistics energy intensity, and supply chain transparency—into green building codes and carbon disclosure requirements. This would link micro-level MH practices to macro-level sustainability goals, aligning incentives across the policy hierarchy.
Additionally, governance mechanisms should promote stakeholder coordination. Fragmented decision-making across contractors, suppliers, regulators, and clients remains a significant barrier to MH optimisation [60]. Establishing shared digital platforms for data exchange, adopting open data standards, and creating cross-sectoral coordination bodies can improve interoperability and decision-making efficiency. Procurement policies can further support collaboration by favouring contractors who demonstrate integrated MH strategies and strong supply chain partnerships.
Institutional theory provides a useful lens for understanding how such policies drive change. Coercive pressures (e.g., regulatory mandates), normative pressures (e.g., industry standards), and mimetic pressures (e.g., competitive benchmarking) interact to shape organisational behaviour [13]. When aligned effectively, these pressures create a reinforcing institutional environment that accelerates MH digitalisation and embeds it within the broader sustainability agenda.
4.5. Interrelationship Between SWOT
The interrelationships among the top-ranked factors reveal a complex but highly strategic landscape for material handling (MH) optimisation in high-rise construction. Technological Adoption (S1) and Technological Advancements (O3)together form a reinforcing synergy that underpins a technology-led pathway for improvement. While S1 reflects an organisation’s internal readiness—including BIM integration, IoT-enabled tracking, and data analytics capabilities—O3 represents the broader trajectory of technological innovation in the construction sector. The effectiveness of O3 is contingent upon the presence of S1; without foundational digital competencies, emerging technologies risk remaining underutilised or fragmented. This relationship underscores the importance of building absorptive capacity within construction firms to translate external innovation into operational performance gains, such as improved logistics coordination, reduced crane idle time, and enhanced supply chain visibility.
Conversely, the interaction between High Implementation Costs (W2) and Government Incentives (O5) highlights a critical cost–incentive dynamic. W2 poses a significant barrier to the adoption of digital MH solutions, particularly for SMEs, where capital constraints and uncertain return-on-investment timelines discourage investment. However, the strategic deployment of policy instruments such as tax credits, green financing, or digitalisation grants (O5) can directly mitigate this constraint. Evidence from European and North American contexts shows that financial incentives reduce payback periods and accelerate technology diffusion, suggesting that policy alignment is crucial for overcoming structural barriers in China’s MH landscape.
The interplay between Resource Scarcity (T3) and Dual-Carbon Economy (O1) further demonstrates how external threats and opportunities can be managed synergistically. Resource scarcity—driven by supply chain disruptions, material shortages, and geopolitical uncertainties—threatens project schedules and cost stability. Yet, by embedding circular economy strategies such as material reuse, reverse logistics, and digital material passports, firms can simultaneously address scarcity risks and advance decarbonisation objectives under O1. This dual alignment not only mitigates external vulnerabilities but also positions MH practices as a lever for achieving broader carbon reduction targets.
Finally, the relationship between Stakeholder Collaboration (S5) and Economic Pressures (T2) highlights the importance of network resilience during economic downturns. Collaborative procurement frameworks, shared logistics platforms, and integrated scheduling agreements can buffer projects against financial shocks and resource volatility, preserving operational continuity and sustainability commitments. Together, these relational dynamics demonstrate that MH optimisation is not solely dependent on individual factors but on how they interact to shape strategic decisions. Recognising and leveraging these interdependencies can help industry practitioners design more robust, context-sensitive strategies aligned with both the research objectives and the evolving demands of sustainable construction.
4.6. Strategic Roadmap and Theoretical Contributions
The findings of this study suggest that optimising MH in high-rise construction requires an integrated strategy that aligns technological capabilities, financial mechanisms, sustainability objectives, and governance frameworks. A strategic roadmap for industry and policymakers should therefore include the following priorities:
Digital Capability Building: Firms must invest in BIM, IoT, and AI competencies, supported by workforce training and organisational restructuring. Government support for R&D and pilot projects can accelerate technology diffusion, particularly among SMEs.
Financial Incentives and Collaborative Models: Targeted financial instruments—such as tax credits, green financing, and public co-funding—can lower cost barriers. Shared digital platforms and equipment leasing models can further reduce financial burdens and promote collaboration.
Circular Economy Integration: Embedding circular practices, including material passports, reverse logistics, and modular design, into MH strategies can mitigate resource scarcity risks while supporting carbon reduction goals.
Policy and Regulatory Alignment: Policies should explicitly address MH efficiency, set measurable performance targets, and incentivise collaboration and transparency. Regulatory consistency across jurisdictions will enhance predictability and encourage investment.
Stakeholder Ecosystem Development: Industry associations, research institutions, and government agencies should collaborate to develop standards, training programmes, and best practice frameworks that support MH optimisation across the construction value chain.
From a theoretical standpoint, this study contributes to construction management literature in several ways. First, it extends the Resource-Based View by demonstrating how digital capabilities act as strategic resources that underpin competitive advantage in MH optimisation. Second, it enriches the Technology-Organisation-Environment (TOE) framework by illustrating how external technological trajectories interact with organisational readiness and environmental pressures. Third, it applies Institutional Theory to explain how regulatory, normative, and mimetic forces shape MH adoption behaviour, highlighting the importance of policy coherence and enforcement.
By integrating these theoretical perspectives, the study moves beyond descriptive analyses of MH practices to provide a comprehensive explanatory model that links internal capabilities, external opportunities, and institutional environments. This theoretical synthesis not only enhances understanding of MH optimisation but also offers a foundation for future research on digital construction, supply chain resilience, and sustainability transitions.
Policy recommendations: (1) Link MH digitalisation to the Carbon Peaking Plan [61] deliverables. Projects that document MH-related energy and carbon reductions through digital tools should qualify for preferential approvals or incentives under the 2022 Implementation Plan. (2) Embed MH KPIs in GB/T 50378 and GB/T 50905 [48,62] audits: require traceable logistics records, waste minimisation plans, and JIT adherence. (3) Standardise MH data schemas so that BIM–WMS–IoT records can be submitted to authorities as evidence of green construction process control. (4) Expand green finance windows for SMEs to acquire smart MH equipment and software, indexed to verified performance improvements. (5) Encourage regional shared depots and consolidated deliveries in dense urban cores to reduce congestion, emissions, and hoist conflicts. (6) Establish special subsidies or tax credits for the digital transformation of small and medium enterprises and promote “technology clinics” or “incubation of benchmark enterprises” to help them acquire and develop key digital resources and capabilities. (7) Organise and perform the pilot demonstration projects and case base construction for specific technologies, so as to provide potential adopters with successful templates that can be copied and clear analysis of return on investment to reduce technical uncertainty.
5. Conclusions
This study set out to examine the critical factors influencing material handling (MH) optimisation in high-rise construction, with a focus on aligning operational strategies with China’s dual-carbon targets. The differences in MH optimisation between Chinese regions/metropolitan regions are very small due to the fact that China’s dual-carbon targets require the participation of all the people throughout the country. Using a mixed-methods approach combining a systematic literature review, semi-structured expert interviews, and SWOT–AHP analysis, the research identified and prioritised 18 factors across four strategic dimensions. The analysis revealed that Technological Adoption (S1) and Technological Advancements (O3) are the most influential enablers of MH optimisation, while High Implementation Costs (W2) and Resource Scarcity (T3) present significant barriers.
The findings demonstrate that MH optimisation is not merely an operational challenge but a strategic imperative linked to digital transformation, sustainability, and policy evolution. Digital capabilities emerge as vital internal resources that drive competitive advantage, while financial mechanisms, circular economy practices, and collaborative governance structures can help overcome structural barriers. Furthermore, integrating MH considerations into broader policy frameworks can align micro-level decisions with macro-level sustainability goals, enhancing the sector’s contribution to national carbon reduction commitments.
This study contributes to construction management literature by synthesising the Resource-Based View, Technology-Organisation-Environment framework, and Institutional Theory into a comprehensive model of MH optimisation. It also extends practical knowledge by offering a strategic roadmap that integrates technology, finance, sustainability, and governance dimensions.
Despite its contributions, the study has several limitations. First, the reliance on expert judgement introduces an element of subjectivity, as individual experiences, organisational contexts, and professional biases may have influenced the prioritisation of factors. Although measures such as consistency ratio checks were applied to mitigate this risk, future research could enhance robustness by incorporating larger, more diverse panels or triangulating expert assessments with quantitative project performance data. Second, while thematic saturation was achieved with 30 expert interviews, the relatively small sample size limits the generalisability of findings across different regions and market conditions. Expanding the geographic scope and stakeholder diversity in future studies would provide a richer understanding of MH dynamics in varied construction environments.
Furthermore, while the strategic recommendations presented here are valuable within the Chinese context, broader applicability requires consideration of how different regulatory regimes, market structures, and technological maturities shape MH optimisation globally. In Europe, for example, stringent BIM mandates and public procurement policies have accelerated digital integration, whereas in the Middle East, strategies often focus on mitigating severe resource constraints through predictive procurement and supply chain modelling. Southeast Asian contexts, such as Malaysia and Singapore, emphasise capacity-building, green certification incentives, and phased technology adoption as pathways to overcome financial and institutional barriers. By tailoring the proposed strategies—including shared digital platforms, circular material flows, collaborative procurement frameworks, and incentive-linked financing—to these varied contexts, stakeholders can enhance the practical relevance and impact of MH optimisation efforts.
In conclusion, this study advances both theoretical and practical understanding of MH optimisation in high-rise construction by integrating digitalisation, sustainability, financial innovation, and policy considerations into a unified decision-support framework. Future work should aim to validate and extend this framework through longitudinal data collection, hybrid multi-criteria decision-making methods, and cross-regional comparative analyses. Such efforts would deepen insights into how MH strategies evolve under different institutional and market conditions, thereby strengthening their contribution to the global transition toward sustainable, digitally enabled construction systems.
Author Contributions
Conceptualization, P.X.; Methodology, P.X.; Software, P.X.; Validation, P.X.; Formal analysis, P.X.; Investigation, P.X.; Resources, Y.S.L.; Data curation, Y.S.L.; Writing—original draft, Y.S.L.; Writing—review and editing, Y.S.L.; Visualization, Y.S.L.; Supervision, F.E.M.G.; Project administration, F.E.M.G. All authors have read and agreed to the published version of the manuscript.
Funding
This research was funded by [Research Project on Higher Education Teaching Reform in 2023 by Chongqing Education Commission, China] grant number [233403], [2023 Chongqing Education Commission Humanities and Social Sciences Research Planning Project, China] grant number [23SKGH326], and [Chongqing Education Science Planning Project from Chongqing Education Science Research Institute in China] grant number [K24YD2140080].
Data Availability Statement
The data that support the plots within this paper and other findings of this study are available from the corresponding author upon reasonable request.
Acknowledgments
The authors express gratitude to Chongqing Engineering Research Center of Structure Health Monitoring and Disaster Prevention in Full-Life-Cycle in Yangtze Normal University in China.
Conflicts of Interest
The authors declare no conflicts of interest.
References
- Yıldız, A.; Erdal, A.; Kaya, O. Material handling systems in high-rise construction: A review. J. Build. Eng. 2024, 89, 109973. [Google Scholar] [CrossRef]
- Zhang, N.; Sanjayan, J. Concrete 3D printing and digital fabrication technologies for bridge construction. Autom. Constr. 2025, 179, 106485. [Google Scholar] [CrossRef]
- Manekar, K.; Kulkarni, M.B.; Hasamnis, M.A. Smart sensing for cholesterol quantification: Integrating AI, IoT, and emerging technologies in coronary artery disease risk management. Microchem. J. 2025, 218, 115469. [Google Scholar] [CrossRef]
- Wang, H.; Li, Y.; Zhou, Q. Carbon reduction pathways in construction supply chains. Renew. Sustain. Energy Rev. 2021, 152, 111617. [Google Scholar] [CrossRef]
- Zhou, Q.; Wang, H.; Li, Y. Aligning construction logistics with China’s dual carbon strategy. Sustain. Cities Soc. 2023, 99, 104872. [Google Scholar] [CrossRef]
- Al-Harthy, A.; Al-Zahrani, M.; Rahman, M. Digital twins and predictive procurement in Middle Eastern megaprojects. J. Constr. Eng. Manag. 2024, 150, 04024113. [Google Scholar] [CrossRef]
- Elrifaee, M.; Zayed, T.; Ali, A.H.; Ibrahim, A.; Wang, R.D. A holistic evaluation of success factors for advancing IoT adoption through mitigating barriers in construction site safety. Internet Things 2025, 31, 101595. [Google Scholar] [CrossRef]
- Huang, J.; Abadi, M.; Yeow, J. Policy framework for facilitating reverse logistics in circular construction: An integrated Fuzzy-DEMATEL and system dynamics approach. Waste Manag. 2025, 204, 114963. [Google Scholar] [CrossRef]
- Nasser, A.; Brown, R.; Turner, M. AI-enhanced BIM for logistics optimisation in complex construction projects. Autom. Constr. 2024, 153, 104872. [Google Scholar] [CrossRef]
- Yilmaz, G.; Salter, L.; McFarlane, D.; Schönfuß, B. Low-cost (Shoestring) digital solution areas for enabling digitalisation in construction SMEs. Comput. Ind. 2023, 150, 103941. [Google Scholar] [CrossRef]
- Barney, J.B. Firm resources and sustained competitive advantage. J. Manag. 1991, 17, 99–120. [Google Scholar] [CrossRef]
- Tornatzky, L.G.; Fleischer, M. The Processes of Technological Innovation; Lexington Books: Lanham, MD, USA, 1990. [Google Scholar]
- DiMaggio, P.J.; Powell, W.W. The Iron Cage Revisited: Institutional Isomorphism and Collective Rationality in Organizational Fields. Am. Sociol. Rev. 1983, 48, 147–160. [Google Scholar] [CrossRef]
- Li, J.; Jones, P.; Lu, W.; Huang, J. The carbon exceedance of building tall: Towards a correction model for office buildings in China. Build. Environ. 2025, 287 Pt B, 113802. [Google Scholar] [CrossRef]
- Andiyappillai, N. Factors influencing the successful implementation of the warehouse management system (WMS). Int. J. Comput. Appl. 2020, 177, 21–25. [Google Scholar] [CrossRef]
- Dudhe, P.V.; Kadam, N.V.; Hushangabade, R.M.; Deshmukh, M.S. Internet of Things (IOT): An overview and its applications. In Proceedings of the 2017 International Conference on Energy, Communication, Data Analytics and Soft Computing (ICECDS), Chennai, India, 1–2 August 2017; pp. 2650–2653. [Google Scholar]
- Veiga, C.; Santos, M.C.; Águas, P.; Santos, J.A.C. Sustainability as a key driver to address challenges. Worldw. Hosp. Tour. Themes 2018, 10, 662–673. [Google Scholar] [CrossRef]
- Proverbs, D.G.; Holt, G.D.; Love, P.E.D. Logistics of materials handling methods in high rise in-situ construction. Int. J. Phys. Distrib. Logist. Manag. 1999, 29, 659–675. [Google Scholar] [CrossRef]
- Lindley, R.J. Just-in-Time in High Variety/Low Volume Manufacturing Environments; De Montfort University: Leicester, UK, 1995. [Google Scholar]
- Liu, J.S.; Sycara, K.P. Multiagent coordination in tightly coupled task scheduling. In Proceedings of the Second International Conference on Multi-Agent Systems, Minneapolis, MN, USA, 10–13 May 1996; pp. 181–188. [Google Scholar]
- Huo, T.; Ren, H.; Cai, W.; Shen, G.Q.; Liu, B.; Zhu, M.; Wu, H. Measurement and Dependence Analysis of Cost Overruns in Megatransport Infrastructure Projects: Case Study in Hong Kong. J. Constr. Eng. Manage. 2018, 144, 05018001. [Google Scholar] [CrossRef]
- Lwin, T. A Bim-Enabled Materials Flow Tracking Platform for the Construction Supply Chains of Modular Steel Projects. Ph.D. Thesis, Chulalongkorn University, Bangkok, Thailand, 2024. [Google Scholar]
- Louis, O.-B. Advanced supply chain analytics: Leveraging digital twins, IoT and blockchain for resilient, data-driven business operations. World J. Adv. Res. Rev. 2025, 25, 1777–1799. [Google Scholar] [CrossRef]
- Uche, N.; Moyosore, T. Leveraging Artificial Intelligence for predictive supply chain management, focus on how AI- driven tools are revolutionizing demand forecasting and inventory optimization. Int. J. Sci. Res. Arch. 2025, 14, 230–250. [Google Scholar] [CrossRef]
- Hong, T.; Li, C.; Yan, D. Updates to the China Design Standard for Energy Efficiency in public buildings. Energy Policy 2015, 87, 187–198. [Google Scholar] [CrossRef]
- Yuan, H.; Ferreira, F.A.F. Sustainable competitive advantage in maternal and child health institutions: A dynamic capability approach. Ann. Oper. Res. 2022, 346, 1869–1895. [Google Scholar] [CrossRef] [PubMed]
- Almashhadani, M.; Almashhadani, H.A. The influence of technological capacity and financial capacity on promoting firm competitiveness and firm performance. J. Humanit. Soc. Sci. Bus. 2023, 3, 125–141. [Google Scholar] [CrossRef]
- Sun, Y.; Jung, H. Machine Learning (ML) Modeling, IoT, and Optimizing Organizational Operations through Integrated Strategies: The Role of Technology and Human Resource Management. Sustainability 2024, 16, 6751. [Google Scholar] [CrossRef]
- Carruthers, J.I.; Ulfarsson, G.F. Fragmentation and Sprawl: Evidence from Interregional Analysis. Growth Change 2002, 33, 312–340. [Google Scholar] [CrossRef]
- Wang, L.; Wu, H.; Zhang, J. Green Public Procurement and Its Influence on Urban Carbon Emission Intensity: Spatial Spillovers Across 285 Prefectural Cities in China. Land 2025, 14, 1545. [Google Scholar] [CrossRef]
- Wang, L.; Zhang, T.; Li, C. Driving factors and spatiotemporal differentiation of coupling coordination between industrial structure upgrading and carbon emission efficiency in China’s eight economic regions. Environ. Dev. Sustain. 2025. [Google Scholar] [CrossRef]
- Qu, L.; Shi, J.; Yu, Z.; Bao, C. Understanding Paradigm Shifts and Asynchrony in Environmental Governance: A Mixed-Methods-Study of China’s Sustainable Development Transition. World 2025, 6, 90. [Google Scholar] [CrossRef]
- Kareem, S.; Fehrer, J.A.; Shalpegin, T.; Stringer, C. Navigating tensions of sustainable supply chains in times of multiple crises: A systematic literature review. Bus. Strategy Environ. 2024, 34, 316–337. [Google Scholar] [CrossRef]
- Hallegatte, S.; Rentschler, J. Risk management for development--assessing obstacles and prioritizing action. Risk Anal. 2015, 35, 193–210. [Google Scholar] [CrossRef] [PubMed]
- Khodjaeva, N.P.; Fayziev, V.B.; Amanov, B.K. The modern vector of the development of science. In Proceedings of the XVI International Scientific and Practical Conference, Philadelphia, PA, USA, 3–4 October 2024; pp. 8–10. [Google Scholar]
- Rezaei-Moghaddam, K.; Karami, E. A multiple criteria evaluation of sustainable agricultural development models using AHP. Environ. Dev. Sustain. 2007, 10, 407–426. [Google Scholar] [CrossRef]
- Aminbakhsh, S.; Gunduz, M.; Sonmez, R. Safety risk assessment using analytic hierarchy process (AHP) during planning and budgeting of construction projects. J. Saf. Res. 2013, 46, 99–105. [Google Scholar] [CrossRef]
- Jayawickrama, H.M.M.M.; Kulatunga, A.K.; Mathavan, S. Fuzzy AHP based Plant Sustainability Evaluation Method. Procedia Manuf. 2017, 8, 571–578. [Google Scholar] [CrossRef]
- Zhao, H.; Li, N. Performance Evaluation for Sustainability of Strong Smart Grid by Using Stochastic AHP and Fuzzy TOPSIS Methods. Sustainability 2016, 8, 129. [Google Scholar] [CrossRef]
- Abdel-Basset, M.; Mohamed, M.; Smarandache, F. An Extension of Neutrosophic AHP–SWOT Analysis for Strategic Planning and Decision-Making. Symmetry 2018, 10, 116. [Google Scholar] [CrossRef]
- Rakhman, A.; Sitinjak, T.J.R.; Sitinjak, T. Optimization of Warehouse Selection with SWOT and AHP Methods in the Pulogadung Industrial Area. Int. J. Soc. Sci. Bus. 2023, 7, 817–823. [Google Scholar] [CrossRef]
- Cuadrado, J.; Zubizarreta, M.; Rojí, E.; García, H.; Larrauri, M. Sustainability-Related Decision Making in Industrial Buildings: An AHP Analysis. Math. Probl. Eng. 2015, 2015, 157129. [Google Scholar] [CrossRef]
- Jun Liu, Qi Zhang, Mingyue Xie, Mingwei Lin, Zeshui Xu, A blockchain platform selection method with heterogeneous multi-criteria Decision-Making based on hybrid distance measures and an AHP-EWM weight method. Expert Syst. Appl. 2024, 256, 124910. [CrossRef]
- El-Hameed, A.K.A. Digital technologies as supporting tools for resource circularity in the construction industry: A review reflecting on the building lifecycle. J. Build. Eng. 2025, 114420. [Google Scholar] [CrossRef]
- Fareed, A.G.; De Felice, F.; Forcina, A.; Petrillo, A. Role and applications of advanced digital technologies in achieving sustainability in multimodal logistics operations: A systematic literature review. Sustain. Futures 2024, 8, 100278. [Google Scholar] [CrossRef]
- Jain, V.; Ajmera, P.; Davim, J.P. SWOT analysis of Industry 4.0 variables using AHP methodology and structural equation modelling. Benchmark. Int. J. 2021, 29, 2147–2176. [Google Scholar] [CrossRef]
- Getawa Ayalew, M. Combining SWOT and AHP for strategic decision-making in construction. Buildings 2024, 14, 1234. [Google Scholar] [CrossRef]
- GB/T 50905-2014; Code for Green Construction of Building. Ministry of Housing and Urban-Rural Development of the People’s Republic of China. General Administration of Quality Supervision Inspection and Quarantine of the People’s Republic of China: Beijing, China, 2014.
- GB 55031-2022; General Code for Civil Building. Ministry of housing and urban-rural development of the people’s Republic of China: Beijing, China, 2022.
- Youssef, N.; Saleeb, M.; Gebreal, A.; Ghazy, R.M. The Internal Reliability and Construct Validity of the Evidence-Based Practice Questionnaire (EBPQ): Evidence from Healthcare Professionals in the Eastern Mediterranean Region. Healthcare 2023, 11, 2168. [Google Scholar] [CrossRef]
- Malkewitz, C.P.; Schwall, P.; Meesters, C.; Hardt, J. Estimating reliability: A comparison of Cronbach’s α, McDonald’s ωt and the greatest lower bound. Soc. Sci. Humanit. Open 2023, 7, 100368. [Google Scholar] [CrossRef]
- Ligardo-Herrera, I.; Gómez-Navarro, T.; Gonzalez-Urango, H. Application of the ANP to the prioritization of project stakeholders in the context of responsible research and innovation. Cent. Eur. J. Oper. Res. 2018, 27, 679–701. [Google Scholar] [CrossRef]
- Grošelj, P.; Dolinar, G. Group AHP framework based on geometric standard deviation and interval group pairwise comparisons. Inf. Sci. 2023, 626, 370–389. [Google Scholar] [CrossRef]
- He, W.; Rodríguez, R.M.; Martínez, L. Average consistency index based consensus model for a group decision making problem dealing with ELICIT expressions. Comput. Ind. Eng. 2023, 184, 109511. [Google Scholar] [CrossRef]
- Wang, Y. A Multi-Perspective Analysis and Strategies Development of Mitigating the Housing Problem in Hong Kong Through Adopting Modular Integrated Construction to Build Transitional Houses. Ph.D. Thesis, The Hong Kong Polytechnic University, Hong Kong, China, 2023. [Google Scholar]
- Li, Y.; Ma, G. A Study on the High-Quality Development Path and Implementation Countermeasures of China’s Construction Industry toward the Carbon Peaking and Carbon Neutralization Goals. Sustainability 2024, 16, 772. [Google Scholar] [CrossRef]
- Kalantzopoulos, G.N.; Lundvall, F.; Checchia, S.; Lind, A.; Wragg, D.S.; Fjellvag, H.; Arstad, B. In Situ Flow MAS NMR Spectroscopy and Synchrotron PDF Analyses of the Local Response of the Bronsted Acidic Site in SAPO-34 during Hydration at Elevated Temperatures. Chemphyschem 2018, 19, 519–528. [Google Scholar] [CrossRef]
- Duwyn, J. Regional Roadmapfor Buildings and Constructionin China’s Greater Bay Area; Federal Ministryfor Economic Affairsand Climate Action: Berlin, Germany, 2023. [Google Scholar]
- Rangasamy, V.; Yang, J.-B. AI-driven generative design and optimization in prefabricated construction. Autom. Constr. 2025, 177, 106350. [Google Scholar] [CrossRef]
- Liu, X.; Antwi-Afari, M.F.; Li, J.; Zhang, Y.; Manu, P. BIM, IoT, and GIS integration in construction resource monitoring. Autom. Constr. 2025, 174, 106149. [Google Scholar] [CrossRef]
- Institute for Governance & Sustainable Development (IGSD). China’s New Urban and Rural Development Carbon-Peaking Plan Contributes to Energy-Efficiency Improvements & Measures to Curb Emissions of Non-CO2 Greenhouse Gases; IGSD China Briefings: Beijing, China, 2022. [Google Scholar]
- GB/T 50378-2019; Assessment Standard for GREEN Building. Ministry of Housing and Urban-Rural Development of the People’s Republic of China; State Administration for Market Regulation: Beijing, China, 2019.


Disclaimer/Publisher’s Note: The statements, opinions and data contained in all publications are solely those of the individual author(s) and contributor(s) and not of MDPI and/or the editor(s). MDPI and/or the editor(s) disclaim responsibility for any injury to people or property resulting from any ideas, methods, instructions or products referred to in the content. |
© 2025 by the authors. Licensee MDPI, Basel, Switzerland. This article is an open access article distributed under the terms and conditions of the Creative Commons Attribution (CC BY) license (https://creativecommons.org/licenses/by/4.0/).