Article

The Relationship Between Urban Perceptions and Bike-Sharing Equity in 15-Minute Metro Station Catchments: A Shenzhen Case Study

1
School of Architecture, Tianjin University, Tianjin 300072, China
2
Faculty of Architecture and City Planning, Kunming University of Science and Technology, Kunming 650032, China
3
School of Cultural Heritage, Northwest University, Xi’an 710127, China
*
Author to whom correspondence should be addressed.
Buildings 2025, 15(21), 3874; https://doi.org/10.3390/buildings15213874
Submission received: 29 September 2025 / Revised: 15 October 2025 / Accepted: 24 October 2025 / Published: 27 October 2025
(This article belongs to the Special Issue New Trends in Built Environment and Mobility)

Abstract

As cities worldwide strive to promote healthy and sustainable non-motorized transport, the equity of dockless bike-sharing has become a central issue in urban transport planning. This study investigates the relationship between human-scale urban environmental perceptions and the equity of bike-sharing usage within 15-minute cycling catchments of metro stations. Using Shenzhen, China, as a case study, we integrated bike-share trip records from August 2021 (around 43 million trips), population grid data, and Baidu Street View images analyzed with deep learning models. The study first quantified the spatial inequality of bike-sharing usage within each metro catchment area using a per capita trip Gini coefficient. Subsequently, we assessed the correlation between these equity metrics and human-scale urban qualities quantified from street-level imagery. The findings reveal significant intra-catchment usage disparities, with some central urban station areas showing relatively equitable bike-sharing distribution (Gini as low as 0.37), while others, particularly on the urban fringe, exhibit highly inequitable patterns (Gini as high as 0.93). Spearman correlation analysis showed that catchments perceived as “livelier” and more “interesting” had significantly lower Gini coefficients, whereas other perceptual factors such as safety, beauty and wealth showed no significant linear relationship with equity. A Random Forest model further indicated that “liveliness” and “lack of boredom” are the strongest predictors of usage equity, highlighting the critical role of vibrant street environments in promoting equitable access. These findings bridge the fields of transportation equity and urban governance, suggesting that improving the human-scale environment around transit hubs, thereby making streets more engaging, safe, and pleasant, could foster more inclusive and equitable use of bike-sharing.

1. Introduction

Shared micromobility services such as dockless bicycle-sharing have rapidly expanded in cities worldwide, offering convenient first/last-mile connections and environmental benefits. In China’s megacities, dockless bike-sharing systems have proliferated since 2016, reducing car dependence and providing flexible transit options. Despite these advantages, inequities in bike-share usage and access have been observed. Globally, studies report that disadvantaged communities often benefit less from bike-sharing services due to spatial and socio-economic disparities [1]. Equity in shared mobility has thus become a critical concern. Bike-share usage is not uniformly distributed, and certain groups or neighborhoods may be underserved [2]. This inequity in usage can hinder the full social benefits of these systems. For example, studies have quantified these differences, noting that stations located in American low-income areas are less likely to generate trips, and that cost of use is a major barrier for nearly half (48%) of low-income residents, compared to only 18% of high-income white residents [3,4,5]. However, most studies to date have focused on built environment and demographic factors, with limited attention to the human-scale urban experience that might affect how different areas utilize bike-sharing [6,7,8]. This gap suggests the need to explore additional influences on bike-share equity [9,10].
In Chinese cities, similar disparities are emerging alongside the bike-share boom. Recent work in Shenzhen—one of China’s largest bike-share markets—showed that the uneven distribution of dockless bikes is influenced by factors like transit availability (e.g., bus stop density), local income levels, and distance to the city center [11,12]. However, most studies to date have focused on built environment and demographic factors, with limited attention to the human-scale urban experience that might affect how different areas utilize bike-sharing [13]. While existing research has extensively explored the impact of the built environment on bike-sharing usage, this research gap highlights the need to explore other factors influencing bike-share equity.
Concurrently, the “15-minute city” has gained traction as an urban planning paradigm to enhance equity and livability [14,15]. The concept advocates that residents should have access to daily necessities and services within a 15-minute walk or bike ride from home [16,17]. This proximity-based approach aims to improve quality of life and reduce reliance on long motorized commutes, ensuring that no group is disadvantaged by where they live. Chinese cities like Shenzhen are exploring 15-minute neighborhood planning to address rapid urban growth and inequality in access to opportunities. In the context of bike-sharing, the 15-minute city concept underscores the importance of local accessibility as if every transit station’s vicinity provides safe, attractive cycling environments, more people can use bike-share for short trips and first/last-mile transit connections. Integrating equity goals with the 15-minute city framework means not only providing bikes and infrastructure but also ensuring that all portions of a station’s catchment area can equitably benefit from the bike-share service.
Traditional equity analyses, which typically rely on census data and GIS-based built environment metrics, often fail to capture the experiential qualities of the environment that influence travel behavior [18]. To address this gap, another emerging perspective is the incorporation of urban perception such as citizens’ eye-level perception of their surroundings into transportation equity analysis [19,20]. Advances in computer vision and street imagery now allow quantification of subjective qualities of urban spaces (such as how safe, lively, or beautiful a street looks) on a large scale [21]. Projects like MIT’s Place Pulse have shown that people’s perceptions of safety or vibrancy from street view images can be systematically measured and mapped [22]. This human-scale perceptions may influence mobility behavior. For instance, a neighborhood that looks lively and safe could encourage more widespread bike use, whereas a dull or unsafe-looking environment might deter certain groups from cycling beyond a small area [19]. Yet, a few studies have combined street-level perception data with mobility equity outcomes. This presents a novel angle to explore whether visual and experiential quality of urban space correlates with a fair distribution of bike-share usage.
This study aims to integrate these perspectives by examining bike-sharing usage equity within the 15-minute cycling catchment areas around metro stations in Shenzhen, China, in conjunction with urban perception scores derived from street-level imagery. We focus on Shenzhen’s metro station areas because they are hot-spots of bike-share activity. Over 90% of bike-share “hotspot” trips occur within 2 km of metro stations, and more than half of all bike-share trips in the city are to or from a transit stop [23]. By analyzing per capita bike-share usage distributions alongside street-view perception indicators, we seek to understand how the character of the urban perceived environment at the human scale might relate to the equity of shared mobility usage.
The contributions of this work are threefold. (1) we quantify the spatial inequality of bike-share usage in station catchment areas across different times (weekdays vs. weekends, morning peak vs. evening peak periods); (2) we incorporate street-level urban perception metrics (e.g., how safe, lively, and interesting the streetscapes appear) into the analysis of bike-share equity; and (3) we discuss implications for 15-minute city planning and equitable shared mobility, highlighting the need to consider human-scale urban quality in transport equity solutions. By combining mobility data with visual urban analytics, this study offers a novel interdisciplinary perspective to promote more equitable and inclusive bike-sharing usage in rapidly developing cities.

2. Study Area and Data

2.1. Study Area

Shenzhen is a leading megacity in southern China, with over 17 million residents and a well-developed urban rail network. As of August 2021, the Shenzhen Metro had 10 lines and around 300 stations (Figure 1a), carrying nearly 6 million passengers daily [11]. Dockless bike-sharing (operated by multiple companies) has been ubiquitous in Shenzhen since 2016, with an estimated 390,000 bikes and 1.38 million daily rides in 2021 [23]. Metro stations are focal points for bike-share usage, given the integration of biking for first/last-mile connectivity [18].
Shenzhen provides an ideal case for this study. As a first-tier megacity in China, it boasts a mature metro system and one of the world’s largest and most frequently used dockless bike-sharing ecosystems [12]. Its rapid and planned urbanization has produced a diverse range of urban environments, from hyper-dense, mixed-use cores to peripheral, single-function developments, offering a natural laboratory for examining variations in mobility patterns [11,24]. This context makes it an ideal setting to test the relationship between urban form, perception, and transport equity.
We therefore selected metro station service areas as the unit of analysis. For each metro station, we delineated a 15-minute cycling catchment area using an isochrone approach (Figure 1b). An isochrone map depicts the area reachable from a point within a specific time threshold, accounting for the actual street network and typical travel speeds, thereby reflecting real-world travel possibilities more accurately than a simple radius buffer. In practice, a 15-minute cycling distance corresponds to about a 3–4 km radius from the station (assuming an average cycling speed of ~15 km/h, adjusted for the street network). Figure 1a illustrates the spatial distribution of bike-share usage across Shenzhen, where usage is heavily concentrated in the dense central districts and along metro corridors, while far fewer trips occur in outlying areas. This confirms that most bike-share activity is closely linked to the metro network. Figure 1b shows an example of the 15-minute bike ride catchment areas (for one metro line), demonstrating the typical spatial extent of areas analyzed around each station.

2.2. Data Source

We utilized several datasets in this study, covering the metro system, population, bike-share usage, and street-level imagery.
First, it is metro network data. Spatial data for Shenzhen’s metro stations and rail lines were obtained from Gaode Map officialwebsite (Amap, https://www.amap.com/, accessed on 15 May 2025.) and verified against the official Shenzhen Metro website for accuracy. We compiled the geographic coordinates of all stations and the track alignments of all 10 metro lines that were in operation by August 2021 (to match the bike-share data timeframe; see Figure 1).
Second, it is population data. We acquired population distribution data from a 1 km × 1 km gridded population dataset for China (https://www.resdc.cn/, accessed on 5 May 2025). Each grid cell in this dataset provides the number of people living within that square kilometer. To integrate this with our finer analysis scale, we overlaid the population grid on the station catchments (divided into 250 m × 250 m cells) and downscaled the data. For each 1 km cell, we evenly apportioned its population into the 16 sub-cells (250 m each side) it contains. If a 1 km grid cell intersected a station catchment only partially, we allocated its population proportionally to the area of overlap with the catchment. This uniform downscaling assumption introduces some errors but given Shenzhen’s relatively even population distribution and lack of finer-resolution data, it provides a reasonable approximation of the population within each station area.
Third, it is bikeshare trip data. We obtained about 43 million anonymized records of dockless bike-sharing trips in Shenzhen for the month of August 2021 from Open Data Portal of Shenzhen Government. Each trip record includes the origin and destination coordinates and the timestamp of the trip. Before aggregation, we cleaned the trip data by removing anomalous records with excessively short (<1 min) or long (>3 h) durations, as well as those with missing coordinate information, to mitigate the influence of extreme values on the analysis. Using these data, we mapped all trip origins and destinations onto the 250 m grid cells within each metro station catchment. The total trips counted in each grid cell (origins plus destinations) represents the bike-share usage intensity in that location. We aggregated trips across all weekdays and all weekends separately, and calculated the average daily trips for a weekday, for Saturday, and for Sunday in each grid cell (e.g., if a station catchment saw N total trips during the 22 weekdays of August 2021, that averages to N/22 per workday). This yielded a spatial distribution of bike usage within each station area under different time conditions (weekday vs. weekend, and further by morning peak (7:00–9:00) vs. evening peak (17:30–19:30) periods as analyzed later).
Lastly is street view imagery data. We collected street-level panoramic images for Shenzhen via Baidu Street View. Focusing on images taken in 2021, we obtained approximately 26,500 street view photos citywide, over 90% of which lie within our metro station catchment areas (ensuring good coverage of the neighborhoods under study). We analyzed these images using deep learning techniques (described in the next section) to quantify various perceived qualities of the environment. In brief, our computer vision models produced scores for each image along six dimensions of urban perception: how safe, lively, beautiful, wealthy, boring, and depressing the streetscape appears. We normalized all perception scores to a [0,1] range and aggregated them to the station-catchment level by averaging the scores of all images within each catchment. Additionally, we computed a composite “positive perception” index for each area, combining the six metrics (with the negative attributes inverted) to summarize the overall visual appeal of the streetscape. These perception metrics serve as key independent variables in our subsequent analysis of bike-share usage equity.

3. Methods

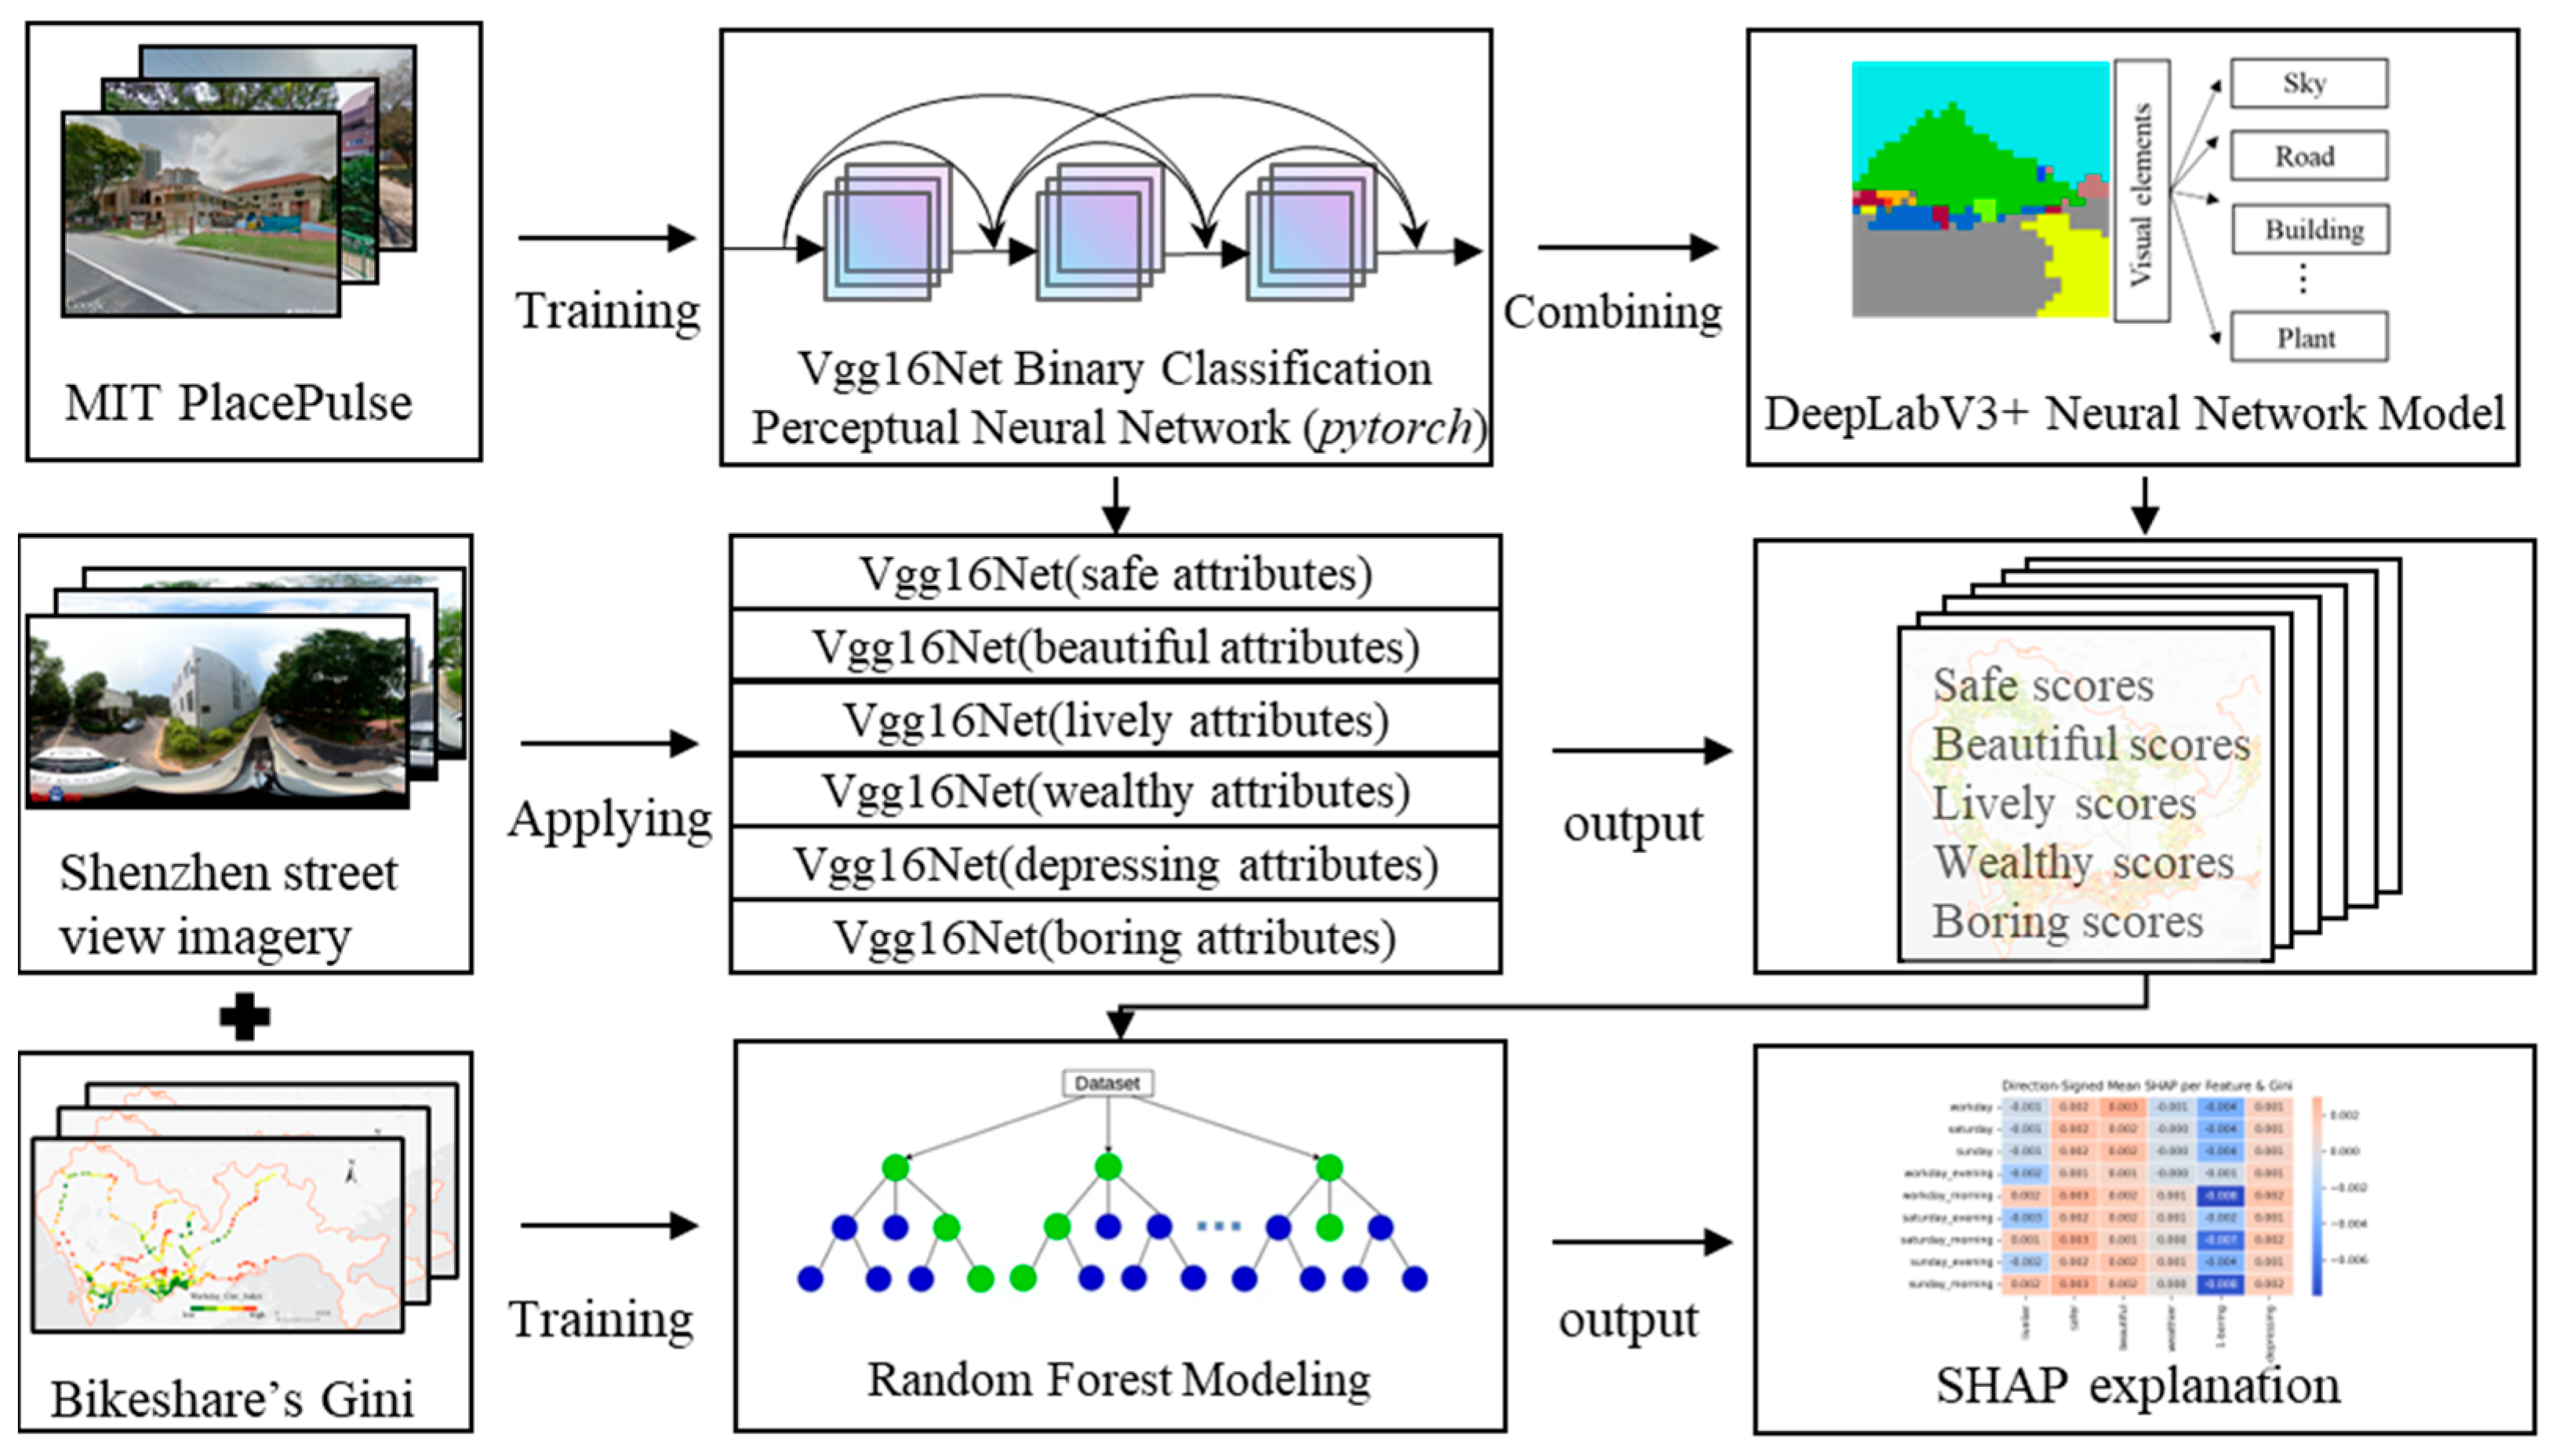
Our analysis involved multiple steps (see Figure 2), integrating spatial statistics with image-based machine learning. First, we assessed bike-share usage equity within each station catchment using a per capita usage metric and Gini coefficient. Next, we processed street-view images to quantify subjective urban perceptions for those areas. Finally, we examined the links between perception and equity through statistical correlation and a machine learning model. Details of these steps are outlined below.

3.1. Equity Analysis

To evaluate intra-catchment equity, we introduced a per capita bike-share usage metric and computed a Gini coefficient for each 15-min station catchment. Simply comparing raw bike trip counts across different parts of a catchment could be misleading, since areas with larger populations naturally tend to generate more trips. For example, a grid cell with a high population might have more total bike trips than a cell with few residents, yet on a per-person basis the less populated cell could exhibit higher usage frequency. To account for population differences, we calculated the per capita bike-share trip rate for each 250 m grid cell, defined as the total bike-share trips in that cell divided by the population of the cell. This metric represents the average bike-share usage frequency for an individual living in that grid. Using these per capita values, we then assessed the inequality of bike-share use within the station catchment by computing a population-weighted Gini coefficient. In this calculation, each resident of the catchment is treated as an individual data point whose “resource” level equals the per capita bike trips of their grid. We then constructed a Lorenz curve of cumulative bike usage versus cumulative population and derived the Gini index in the standard manner. A Gini value of 0 indicates perfect equality (every resident enjoys the same per-person bike usage rate), whereas a value closer to 1 indicates greater inequality (meaning bike usage is highly concentrated among certain sub-areas within the catchment).
The study selected the Gini coefficient as our primary equity measure due to its widespread use and intuitive interpretation in inequality research [2,25,26]. We acknowledge the existence of other metrics, such as the Theil index, which can be decomposed into within-group and between-group inequality. A preliminary analysis suggested that our main findings regarding spatial patterns of inequality are robust to the choice of metric. The formula is as follows [27]:
G p = 1 k = 1 n ( W k W k 1 ) ( Z k + Z k 1 )
where G p is the population-weighted Gini coefficient, and n is the total number of grid cells in the catchment. After sorting the cells by ascending per capita trip rate, W k is the cumulative proportion of the population up to cell k, and Z k is the cumulative proportion of total bike-share trips up to cell k.
We acknowledge that uniformly downscaling population data from 1 km to 250 m grids introduces a degree of spatial uncertainty. While this provides a reasonable approximation in a dense urban context like Shenzhen, future research could benefit from higher-resolution population data to refine the per capita usage estimates.

3.2. Streetview Image Processing and Urban Perception Scoring

Street-level images were analyzed using a two-stage computer vision workflow to extract urban perception metrics. First, we applied semantic segmentation to each street view image using the DeepLabV3+ model, initially developed by Chen and other scholars in 2018 [28]. DeepLabV3+ is a state-of-the-art convolutional neural network for image segmentation that uses atrous convolutions and an encoder–decoder architecture, enabling accurate parsing of urban scene elements. By identifying features such as buildings, roads, vegetation, and other streetscape elements in the images, this step provided a detailed characterization of the physical environment.
Next, to evaluate human perceptual qualities of the streetscape, we employed a deep convolutional neural network by torch 2.7.1+cu128 based on the VGG-16 architecture [29]. We trained this model using the MIT Place Pulse 2.0 dataset, which contains crowdsourced pairwise comparisons of urban street view images on various perception dimensions. Our model was configured to predict six specific perception attributes: safety, liveliness, beauty, wealth, depression (a measure of gloominess or lack of vibrancy), and boredom (lack of interestingness). We formulated the training task as a binary classification of paired images, where the network learns to identify which image in a given pair is “more” of a target attribute. During training, we used a cross-entropy loss function and iteratively updated the VGG-16 network’s weights. The final model performed well. On the validation set of the reserving method (accounting for 20% of the Place Pulse 2.0 dataset), the prediction accuracy of the six perception categories was around 78.84%, indicating that it can reliably identify the visual cues related to these human judgments.
After training, we applied the model to our collection of Shenzhen’s street view images to infer perception scores. To aggregate the pairwise comparisons into continuous scores, we utilized the Microsoft TrueSkill algorithm, which treats each image’s perception score as a latent variable that gets updated with each comparison result. This process yielded six perceptual scores for every street view image. We then averaged the scores of all images within each station catchment to obtain the representative perception metrics for the area. Although we computed a composite perception index Q p o s i t i v e i , our subsequent analysis primarily uses the individual perception dimensions rather than this composite measure. The formula is:
Q p o s i t i v e i = Q s a f e r i + Q l i v e l i e r i + Q b e a u t i f u l i + Q w e a l t h i e r i + ( 1 Q b o r i n g i ) + ( 1 Q d e p r e s s i n g i )

3.3. Correlation Analysis and Random Forest Regression

To investigate the relationship between urban perception and bike-share usage equity, we first conducted a Spearman rank correlation analysis. For each time period (weekday, Saturday, Sunday), we calculated Spearman’s correlation coefficient (ρ) between the station-level Gini coefficients and each of the six perception scores. Spearman’s ρ is a non-parametric measure that captures monotonic associations and is less sensitive to outliers or non-linearities than Pearson’s r, making it suitable for our variables. This analysis allowed us to identify which perceptual attributes are most strongly associated with higher or lower equity (Gini) values.
Beyond bivariate correlations, we developed a Random Forest regression model to examine the combined influence of all perception factors on usage inequality. In this model, the six perception metrics served as independent variables (features) and the Gini coefficient of bike-share usage for a station area was the dependent variable (target). We trained separate Random Forest models for different scenarios (e.g., overall workday Gini, Saturday Gini, Sunday Gini, as well as peak-period Gini values) to see if patterns held consistently across time.
The Random Forest is an ensemble of decision trees that can capture non-linear relationships and interactions among predictors [30]. We evaluated model performance using 5-fold cross-validation, reporting the mean absolute error (MAE) and coefficient of determination (R2) for each model. To ensure transparency and reproducibility, we detail the key hyperparameters and validation specifics in Table 1 below.
To interpret the model results, we employed SHAP (Shapley Additive exPlanation) values, which attribute portions of the prediction error to each feature based on cooperative game theory principles. SHAP analysis yields both a global importance ranking of features and insights into how each feature influences the predictions.

4. Findings

4.1. Spatial Inequality of Bikeshare Usage Across Station Catchments

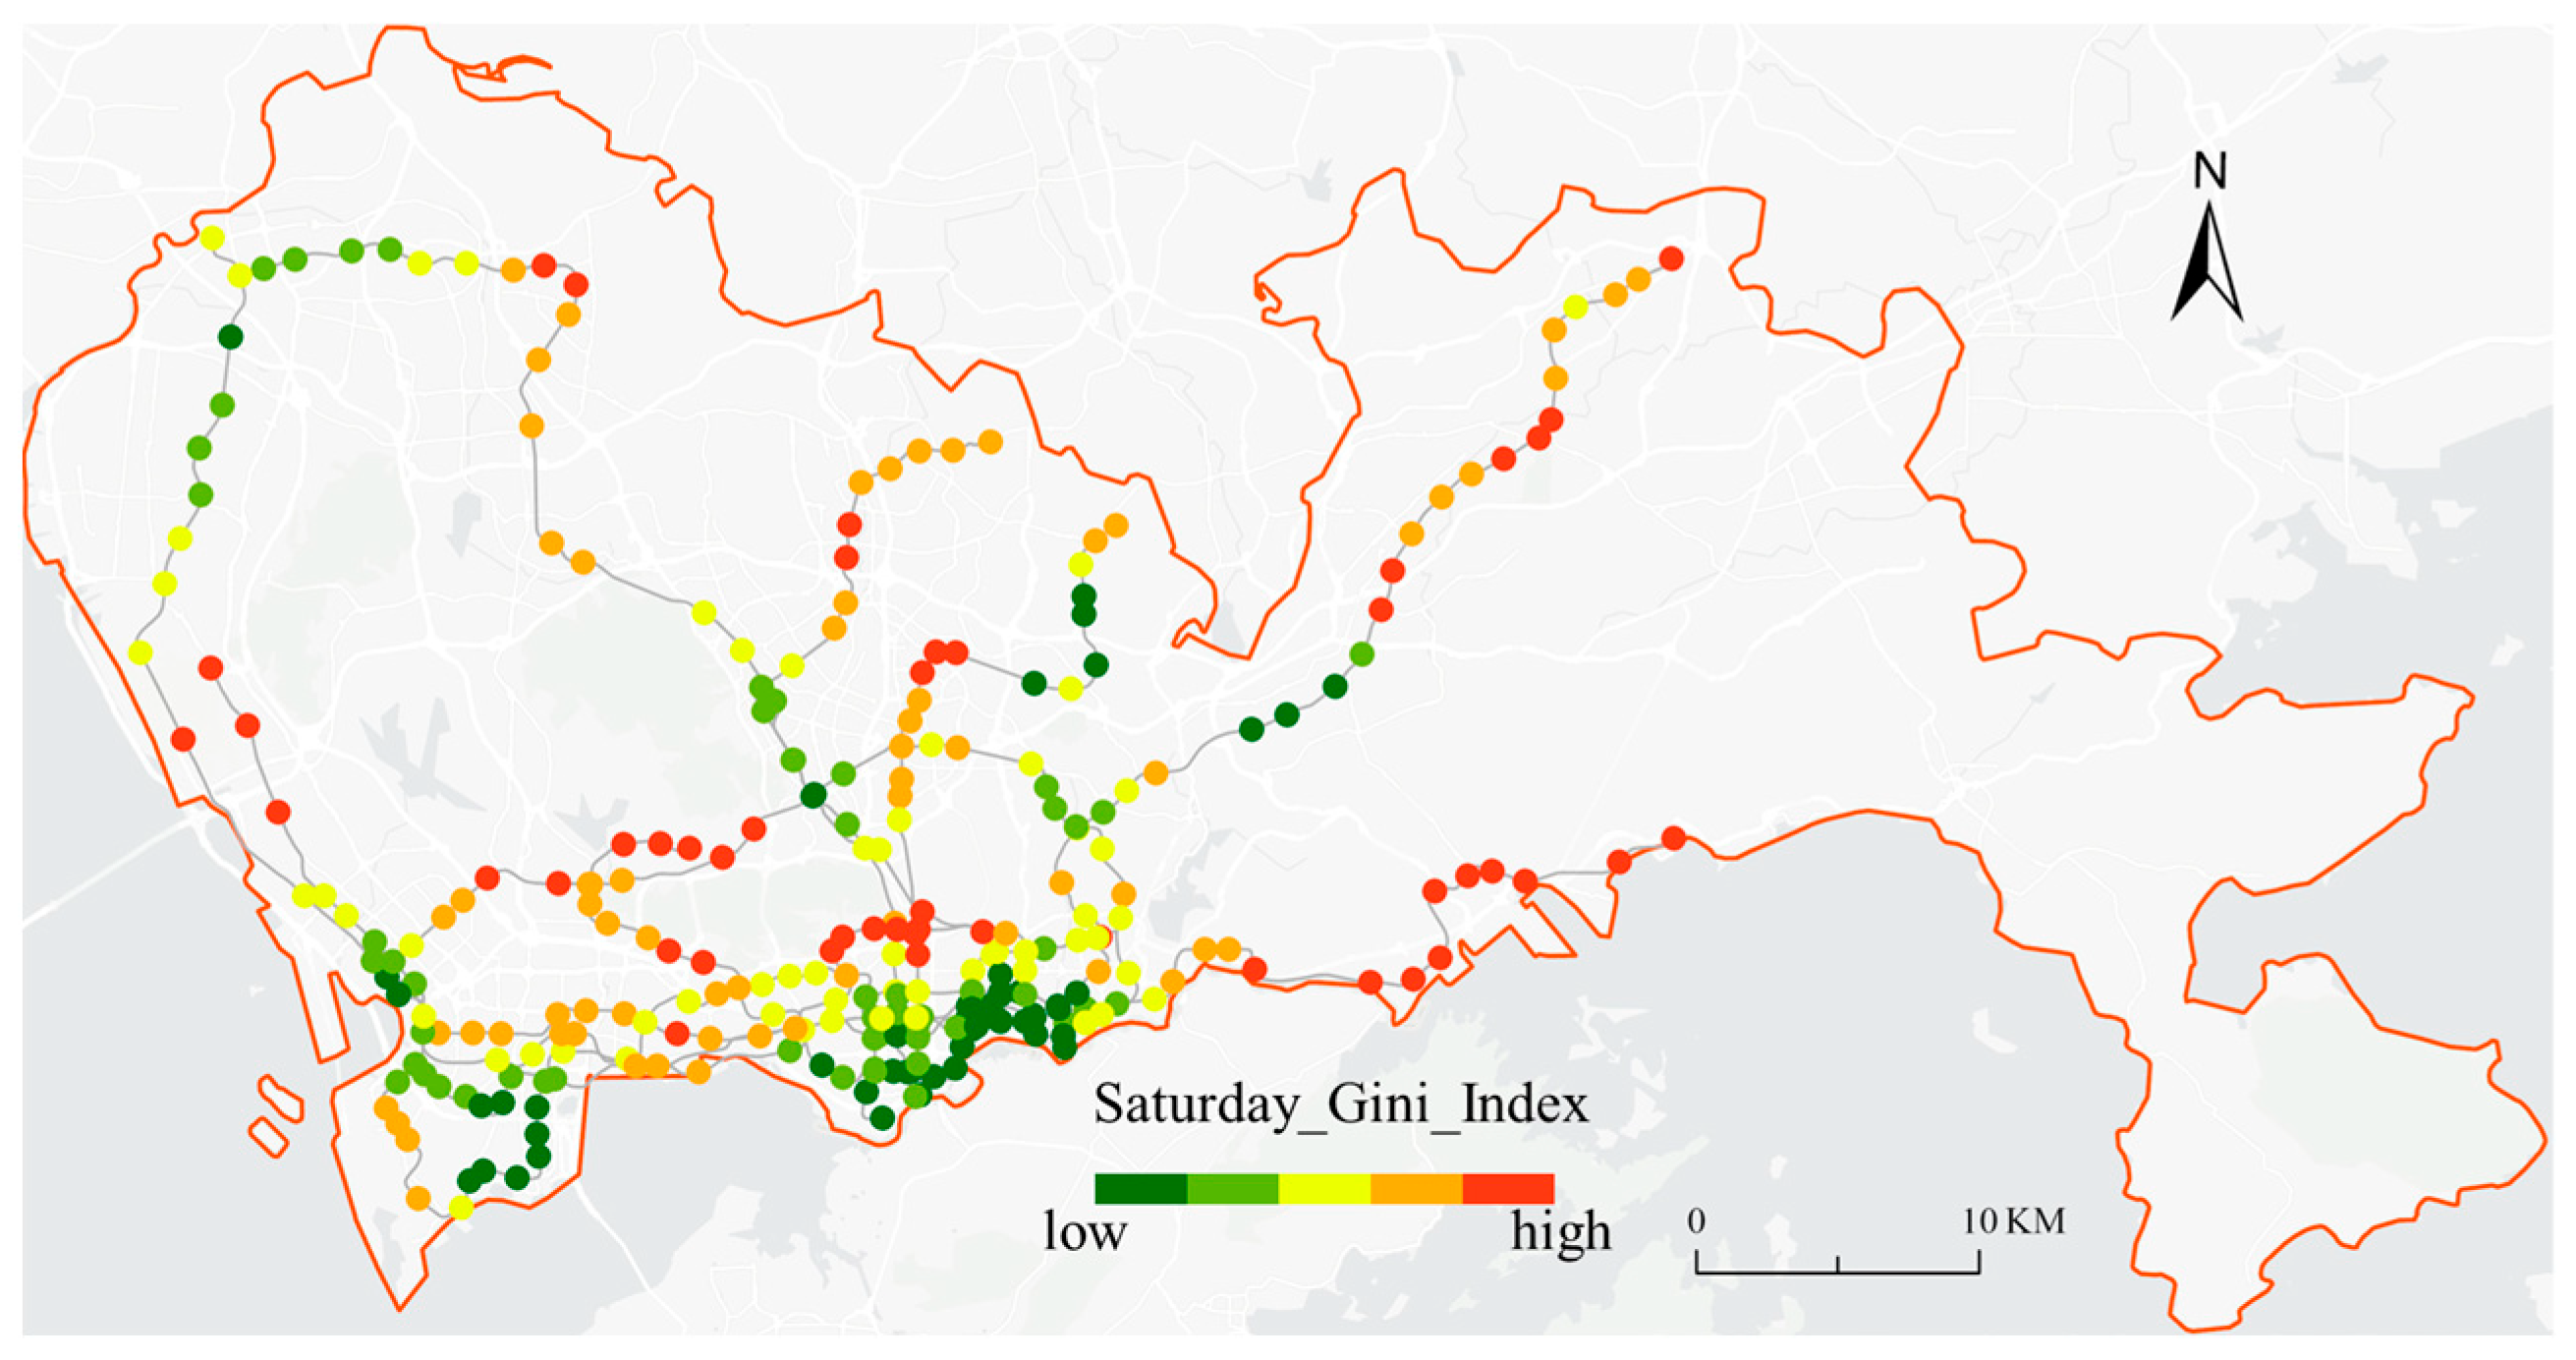
There is substantial variation in the Gini coefficients of per capita bike-share usage among Shenzhen’s metro station catchments (Figure 3). On weekdays, the station-level Gini values range from approximately 0.37 up to 0.93, indicating a broad spectrum from relatively equitable usage to highly concentrated usage. For context, a Gini of 0.37 means the distribution of bike trips per person is fairly even across the catchment, whereas 0.93 signifies extreme inequality (most trips emanate from a very small portion of the area).
Spatially, we observe that central urban stations tend to have lower Gini values (more equitable usage) while peripheral stations show higher Gini values (more inequitable). For example, stations in the downtown core (e.g., Futian and Luohu districts) often have Gini values in the 0.4–0.5 range, implying bike usage is spread across their dense residential and commercial grids rather than only at one hotspot. In contrast, stations at the urban fringe or in less developed areas, for instance, those at the far ends of Line 4 and Line 2 in the north and east, frequently exhibit Gini above 0.8 (Figure 3). Notably, the highest inequality was found at a few outlying stations such as Xikeng and Zhucun (the termini of Line 4) each have Gini around 0.93, and Xiaomeisha (the eastern beach-park terminus of Line 2) has a Gini over 0.90. In these areas, bike-share usage is essentially concentrated in one small zone (e.g., a park entrance or a single residential cluster) while the rest of the 15-minute catchment sees negligible use. On the other hand, some central stations like Huaqiang South (Huaqiangnan, a downtown commercial area) show Gini as low as 0.37, indicating a remarkably even distribution, likely because trip origins come from many different residential blocks and employment sites throughout the catchment.
Overall, an east–west divide is visible. Western Shenzhen as the more developed and populated districts such as Nanshan and Futian has many stations with low-to-moderate Gini, whereas the eastern parts including Yantian and eastern Longgang contain several high-Gini station areas (see Figure 3). This reflects broader urban-form differences. The west areas are mature, mixed-use neighborhoods, while the east has pockets of development separated by hills or industrial land, leading to more uneven bike-use patterns.
To statistically validate the observed spatial patterns of inequality, we conducted a Global Moran’s I analysis on the weekday Gini coefficients for all station catchments. The analysis yielded a Moran’s I of 0.53, with a z-score of 12.8 and a p-value < 0.001. This result indicates a statistically significant and strong positive spatial autocorrelation. It means that station catchments with high (or low) levels of inequality tend to cluster together spatially, providing robust statistical evidence for the core-periphery pattern we observed and confirming that this pattern is not due to random chance.
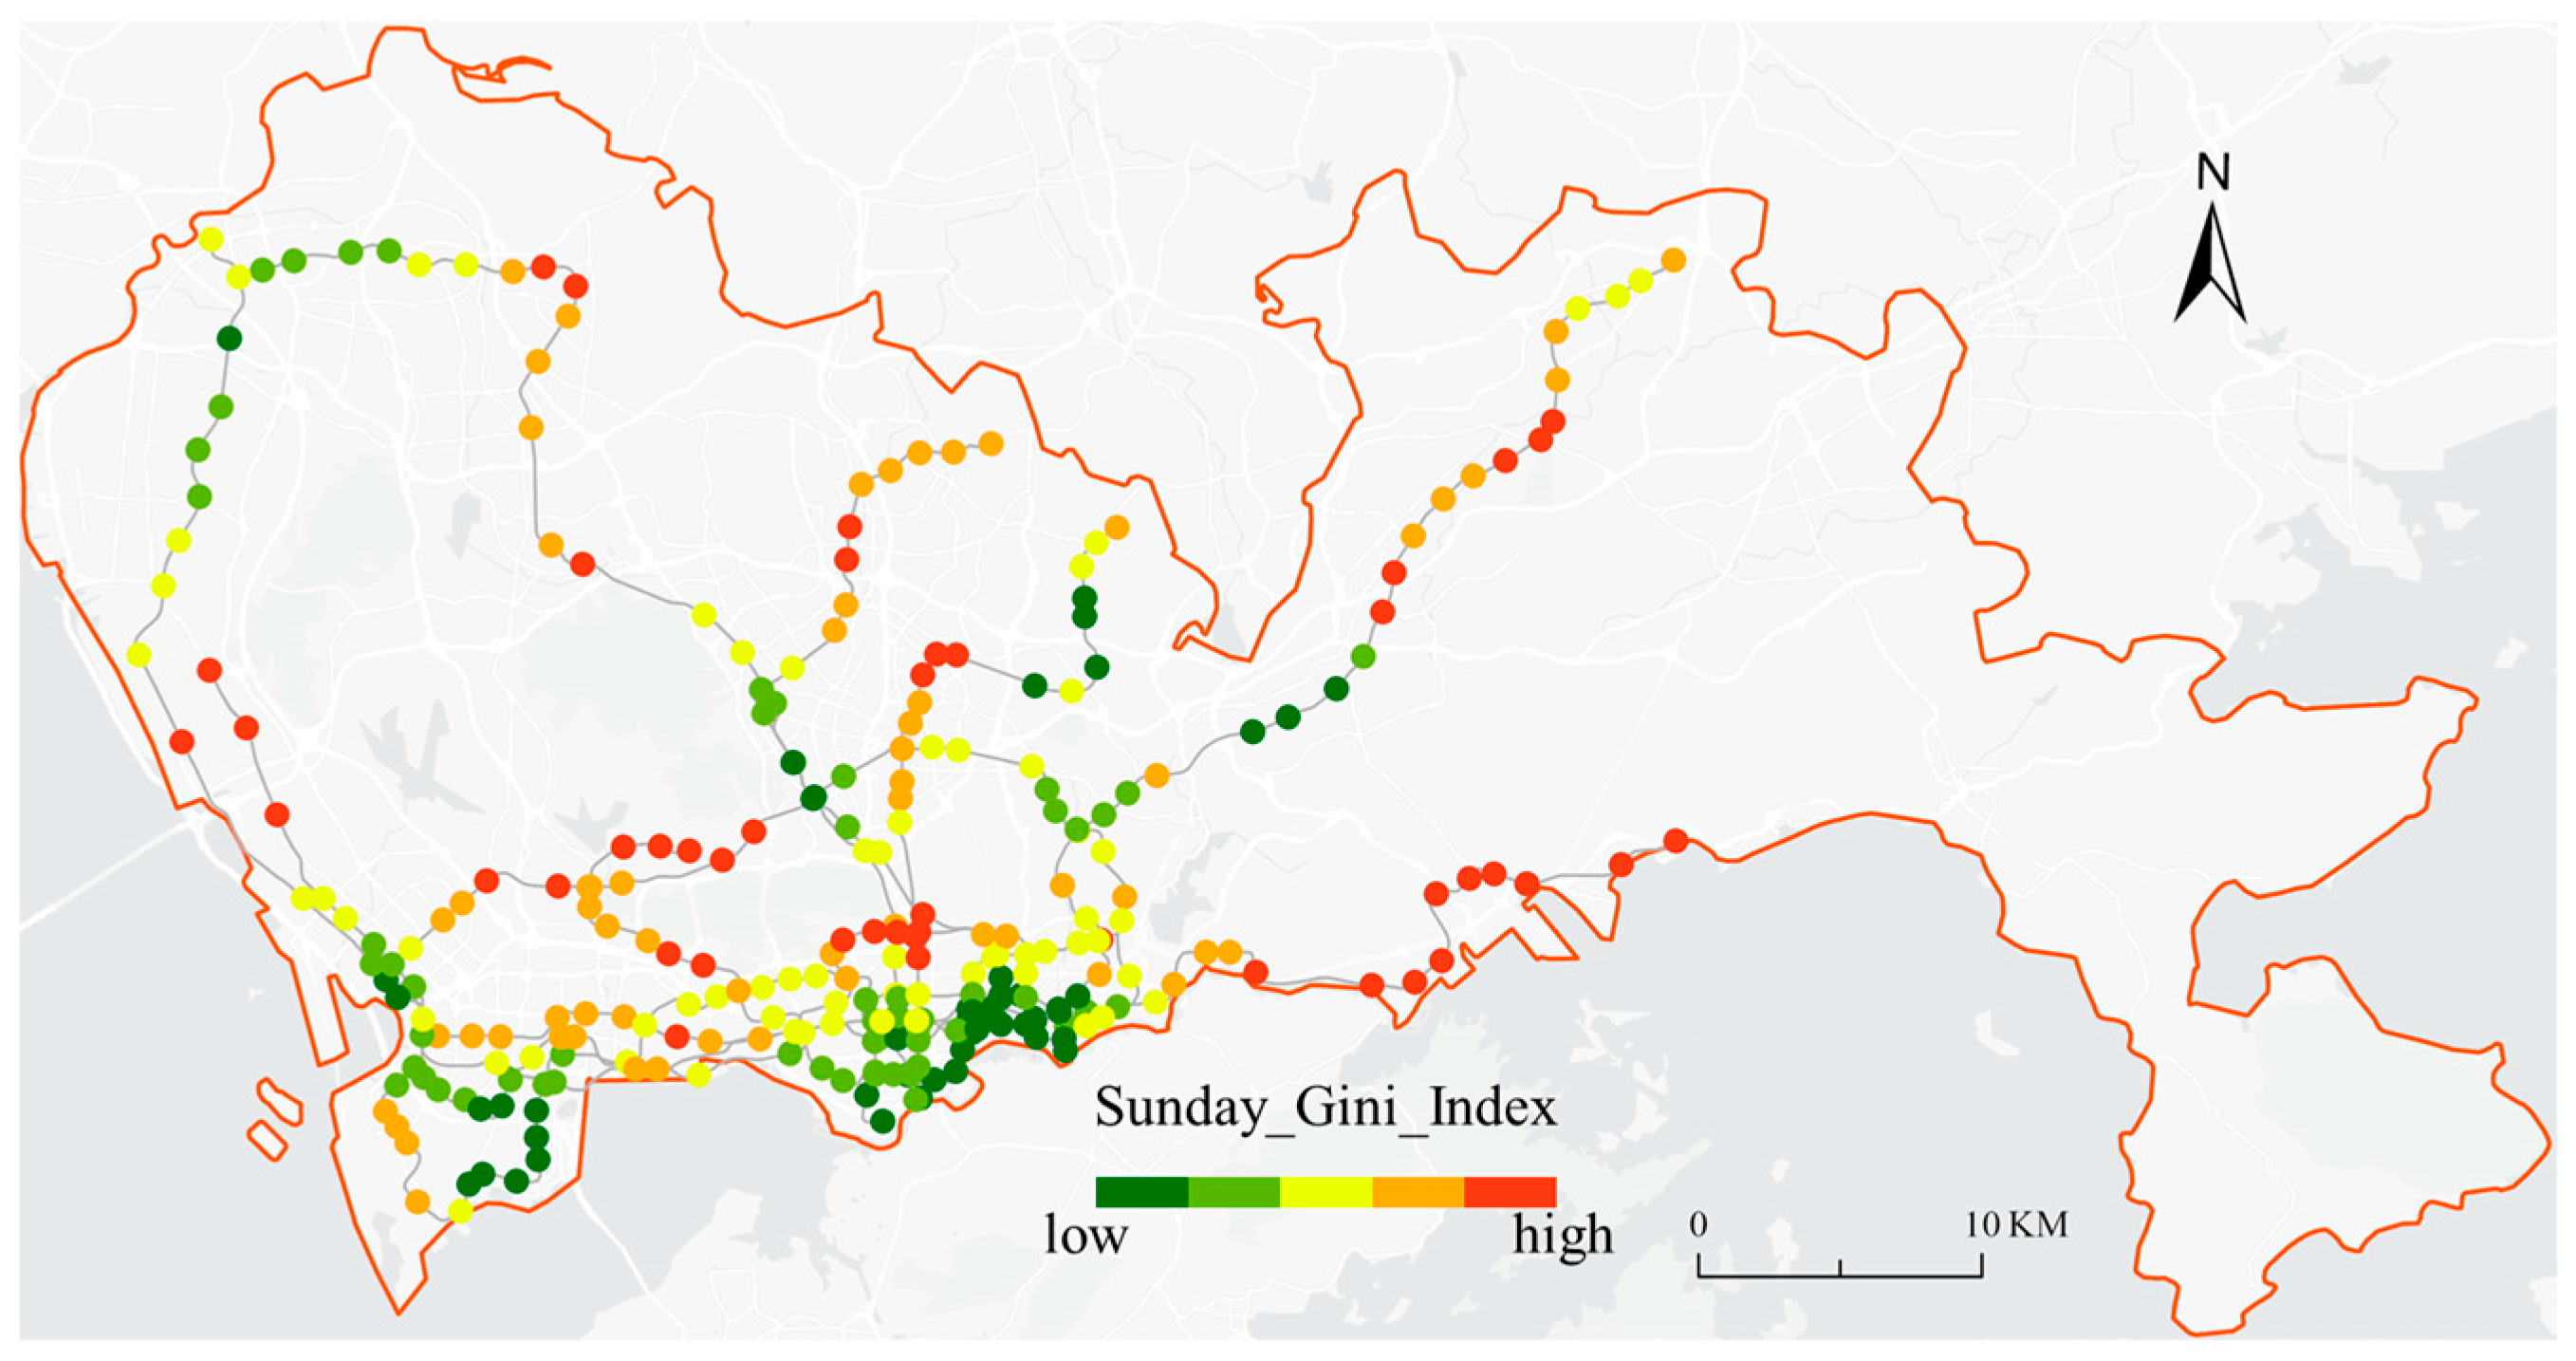
When comparing weekdays and weekends (Figure 4 and Figure 5 for Saturday and Sunday, respectively), the spatial pattern of inequality remains generally consistent. However, Gini values on weekends are slightly higher on average for many stations. The citywide mean Gini per station is about 0.616 on weekdays versus 0.620 on both Saturdays and Sundays showing a very subtle increase. In general, the rank order of stations by Gini does not change much from weekday to weekend, which means a station that is among the most inequitable on weekdays tends to remain so on weekends (and similarly for the most equitable). Therefore, while absolute Gini levels shift a bit, the spatial inequality pattern is robust across time. Figure 3, Figure 4 and Figure 5 illustrate these patterns, highlighting the cluster of high-inequity stations on the periphery and more equitable usage in central locations.

4.2. Spatial Distribution of Urban Perception Scores

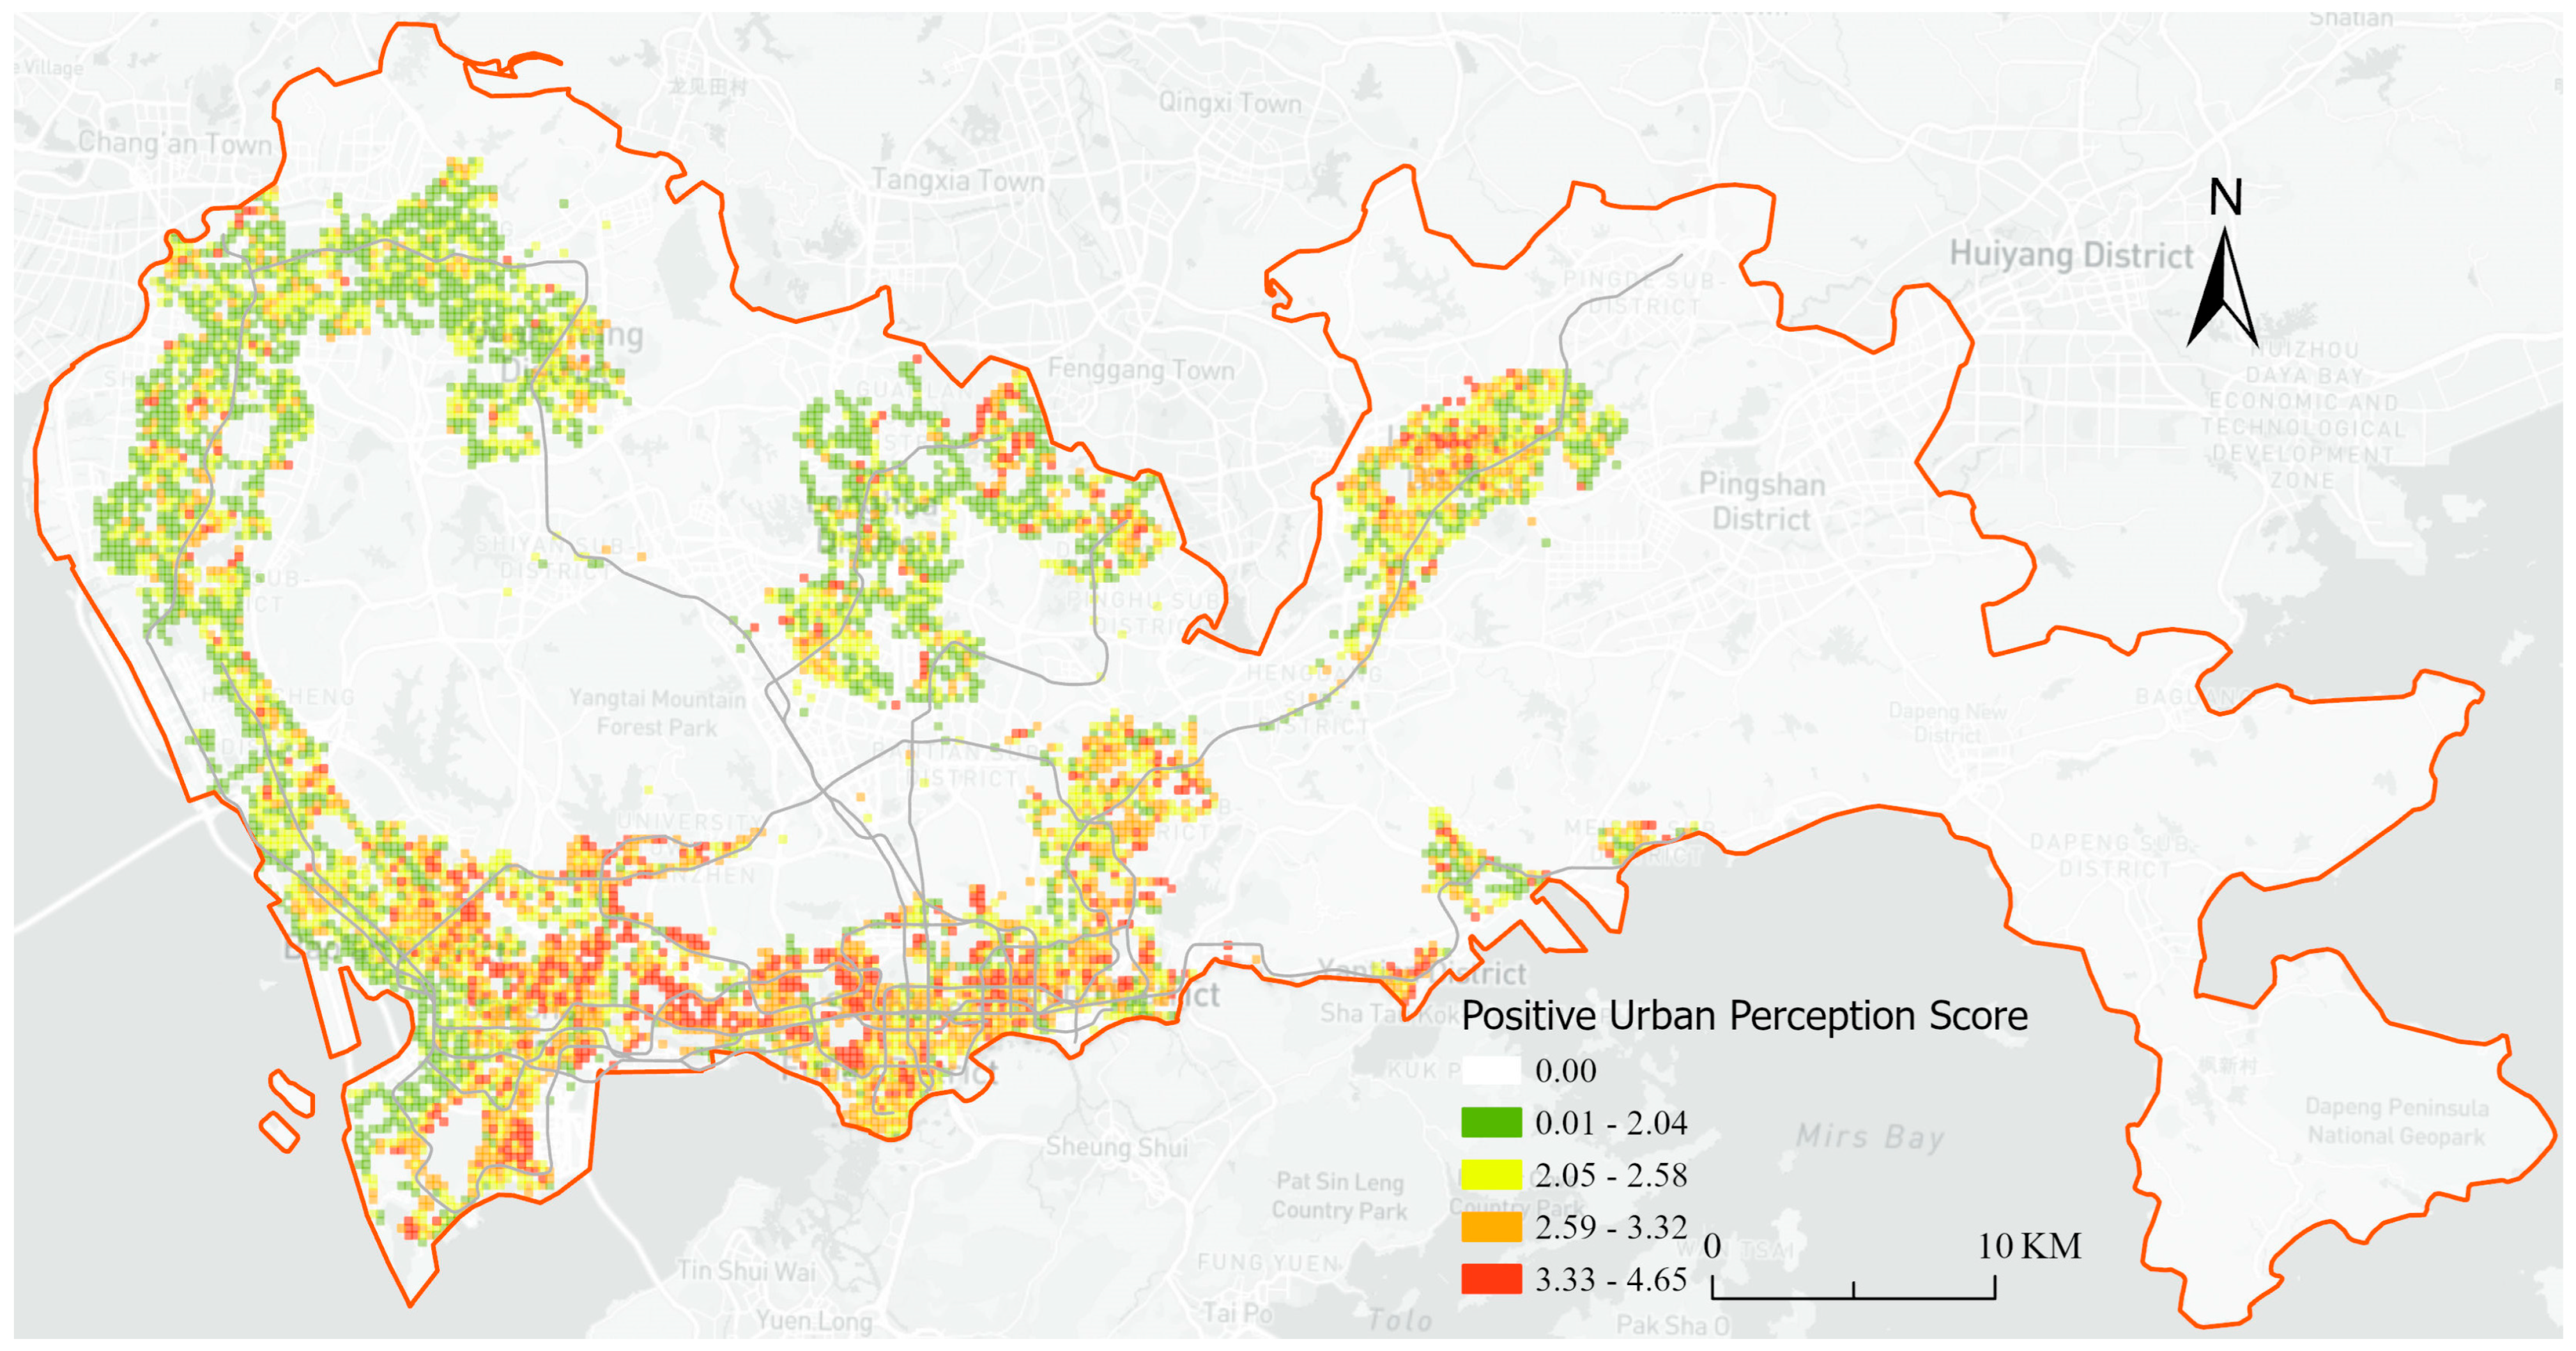
Station catchments also differ widely in their urban perception profiles (Figure 6). The composite “positive perception” index (combining all perception dimensions) ranges roughly from 1.7 up to 3.1 (on a 0–5 scale, with 5 being most positive) across the station catchments. This indicates that none of Shenzhen’s metro station environments are at the extreme ends of the perception spectrum (neither near 0 nor 5), but there is a clear spread of scores. Areas with higher perception scores are generally those known for aesthetic appeal or active street life, while low-scoring areas are often infrastructural or industrial in nature.
For example, the highest average perception score was recorded around Window of the World station (a major theme park area on Lines 1 and 2) about 3.05 out of 5 in our index. This catchment includes a popular tourist attraction, ample public spaces, and well-maintained commercial streets, yielding high marks especially in the “beautiful” and “lively” categories. Similarly, stations in the prosperous Nanshan Science and Technology Park area (e.g., Qiaoxiang on Line 2) also have high perception (3.0), reflecting green boulevards and modern urban design.
On the other hand, the lowest perception scores appear at stations like Airport North and Airport (the Line 11 airport terminals), which scored around 1.7–1.8. These areas are dominated by highways, wide roads, and fenced-off land—environments that people rate as less safe, less lively, and unattractive. Another low-scoring station is Heshuikou (Line 6), with an average perception of ~1.97, located in a peripheral area with sparse development. Broadly, the newer central districts (Futian, Nanshan, parts of Longhua) tend to show higher perception scores (often >2.5), while transit-adjacent industrial zones or far outskirts score lower (often <2.3).
This distribution is depicted in Figure 6, where clusters of high perceptual quality are visible around the downtown and coastal areas, versus low values near the airport and some far-flung suburban stops. An interesting observation is that perception scores do not strictly mirror socio-economic status or land value—for instance, an affluent gated community might not score well on “liveliness” if its streets are empty. In our data, attributes like liveliness and interestingness vary even within wealthy districts. Nonetheless, there is an overall alignment. Stations with visually appealing, walkable, and bustling street scenes scored better on the perception index, whereas those in dull or car-oriented environments scored worse. This sets the stage for examining whether and how these perception patterns relate to the bike-share usage equity patterns described earlier.

5. Discussion

5.1. Inequitable Bikeshare Usages in Metro Lines (Workday vs. Weekend, Morning Peak vs. Evening Peak)

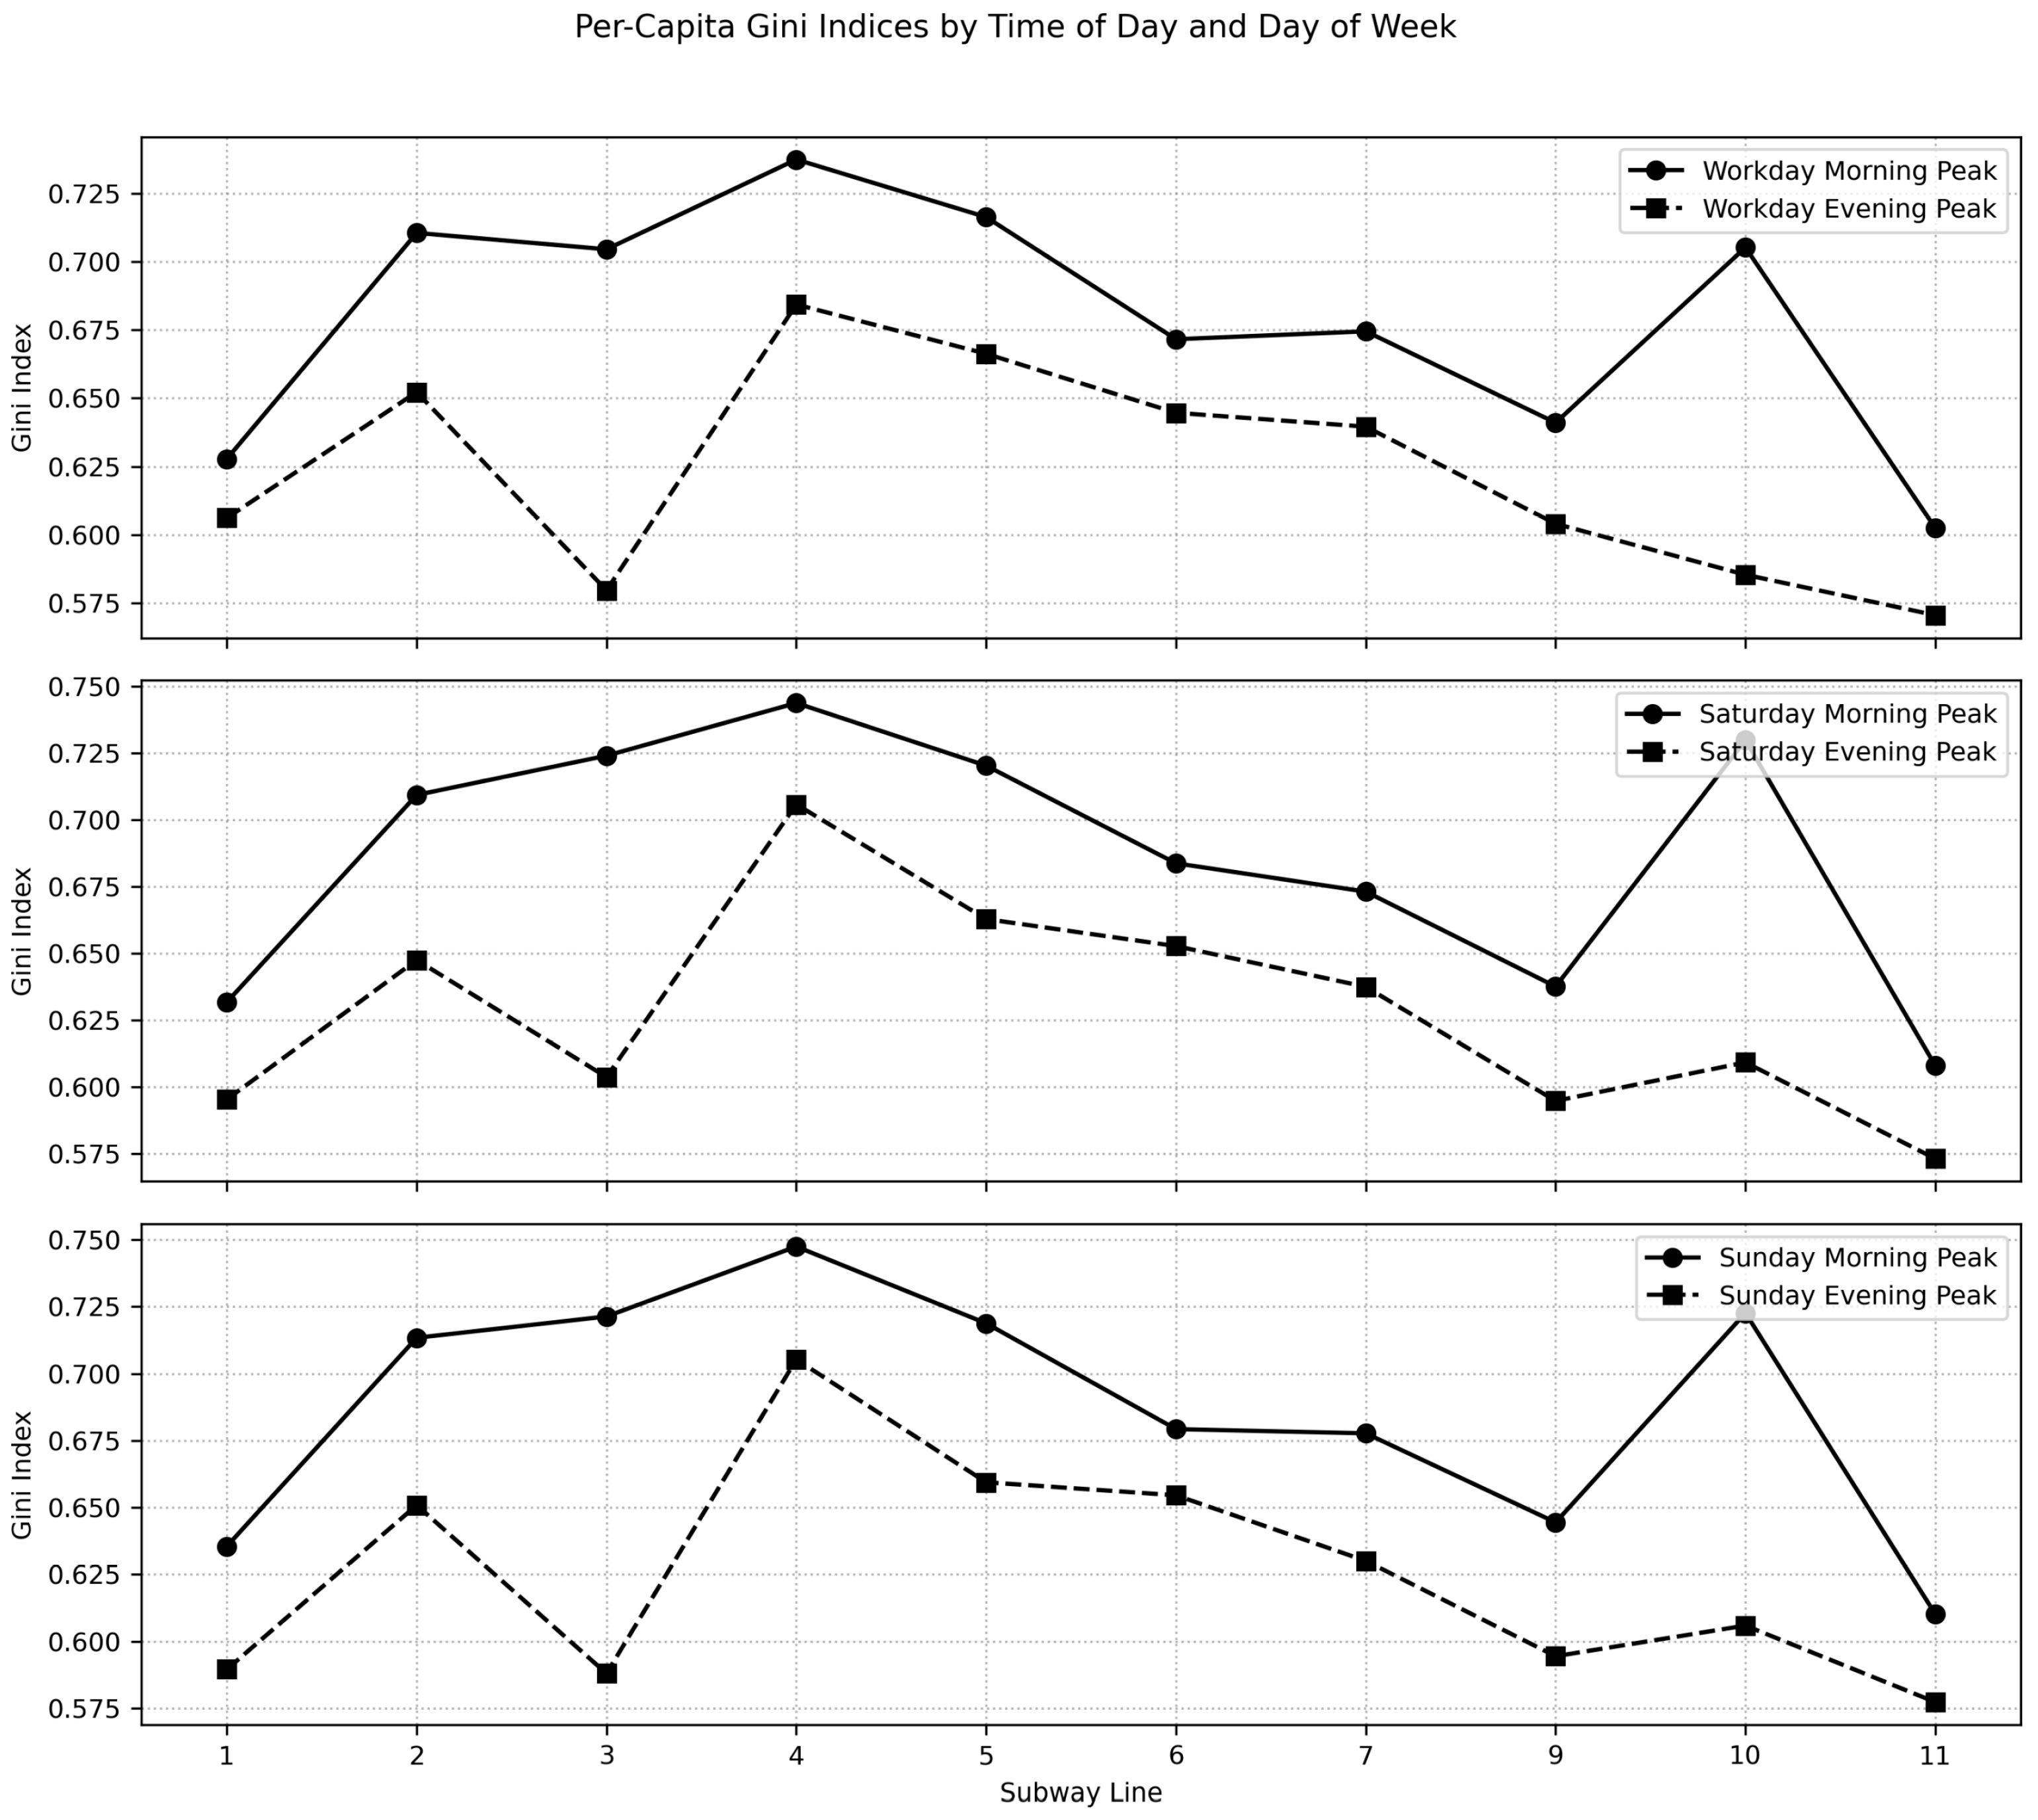
Analyzing bike-share equity by metro lines reveals notable temporal patterns. Figure 7 summarizes the Gini coefficients during morning and evening peak hours for each line, showing that morning peaks consistently have higher inequality than evening peaks on all lines.
This morning-evening disparity reflects the classic “first/last-mile” problem in transportation planning. On weekday mornings, trips are convergent, as many residents across a catchment cycle toward the single node of the metro station. This concentrates trip origins near the station, leading to higher Gini coefficients (more inequity). By evening, the pattern reverses into a divergent model, as people leaving the station disperse to numerous destinations, spatially balancing the usage distribution. For example, on Line 3, the average Gini in the morning peak is 0.72, which drops to 0.58 in the evening.
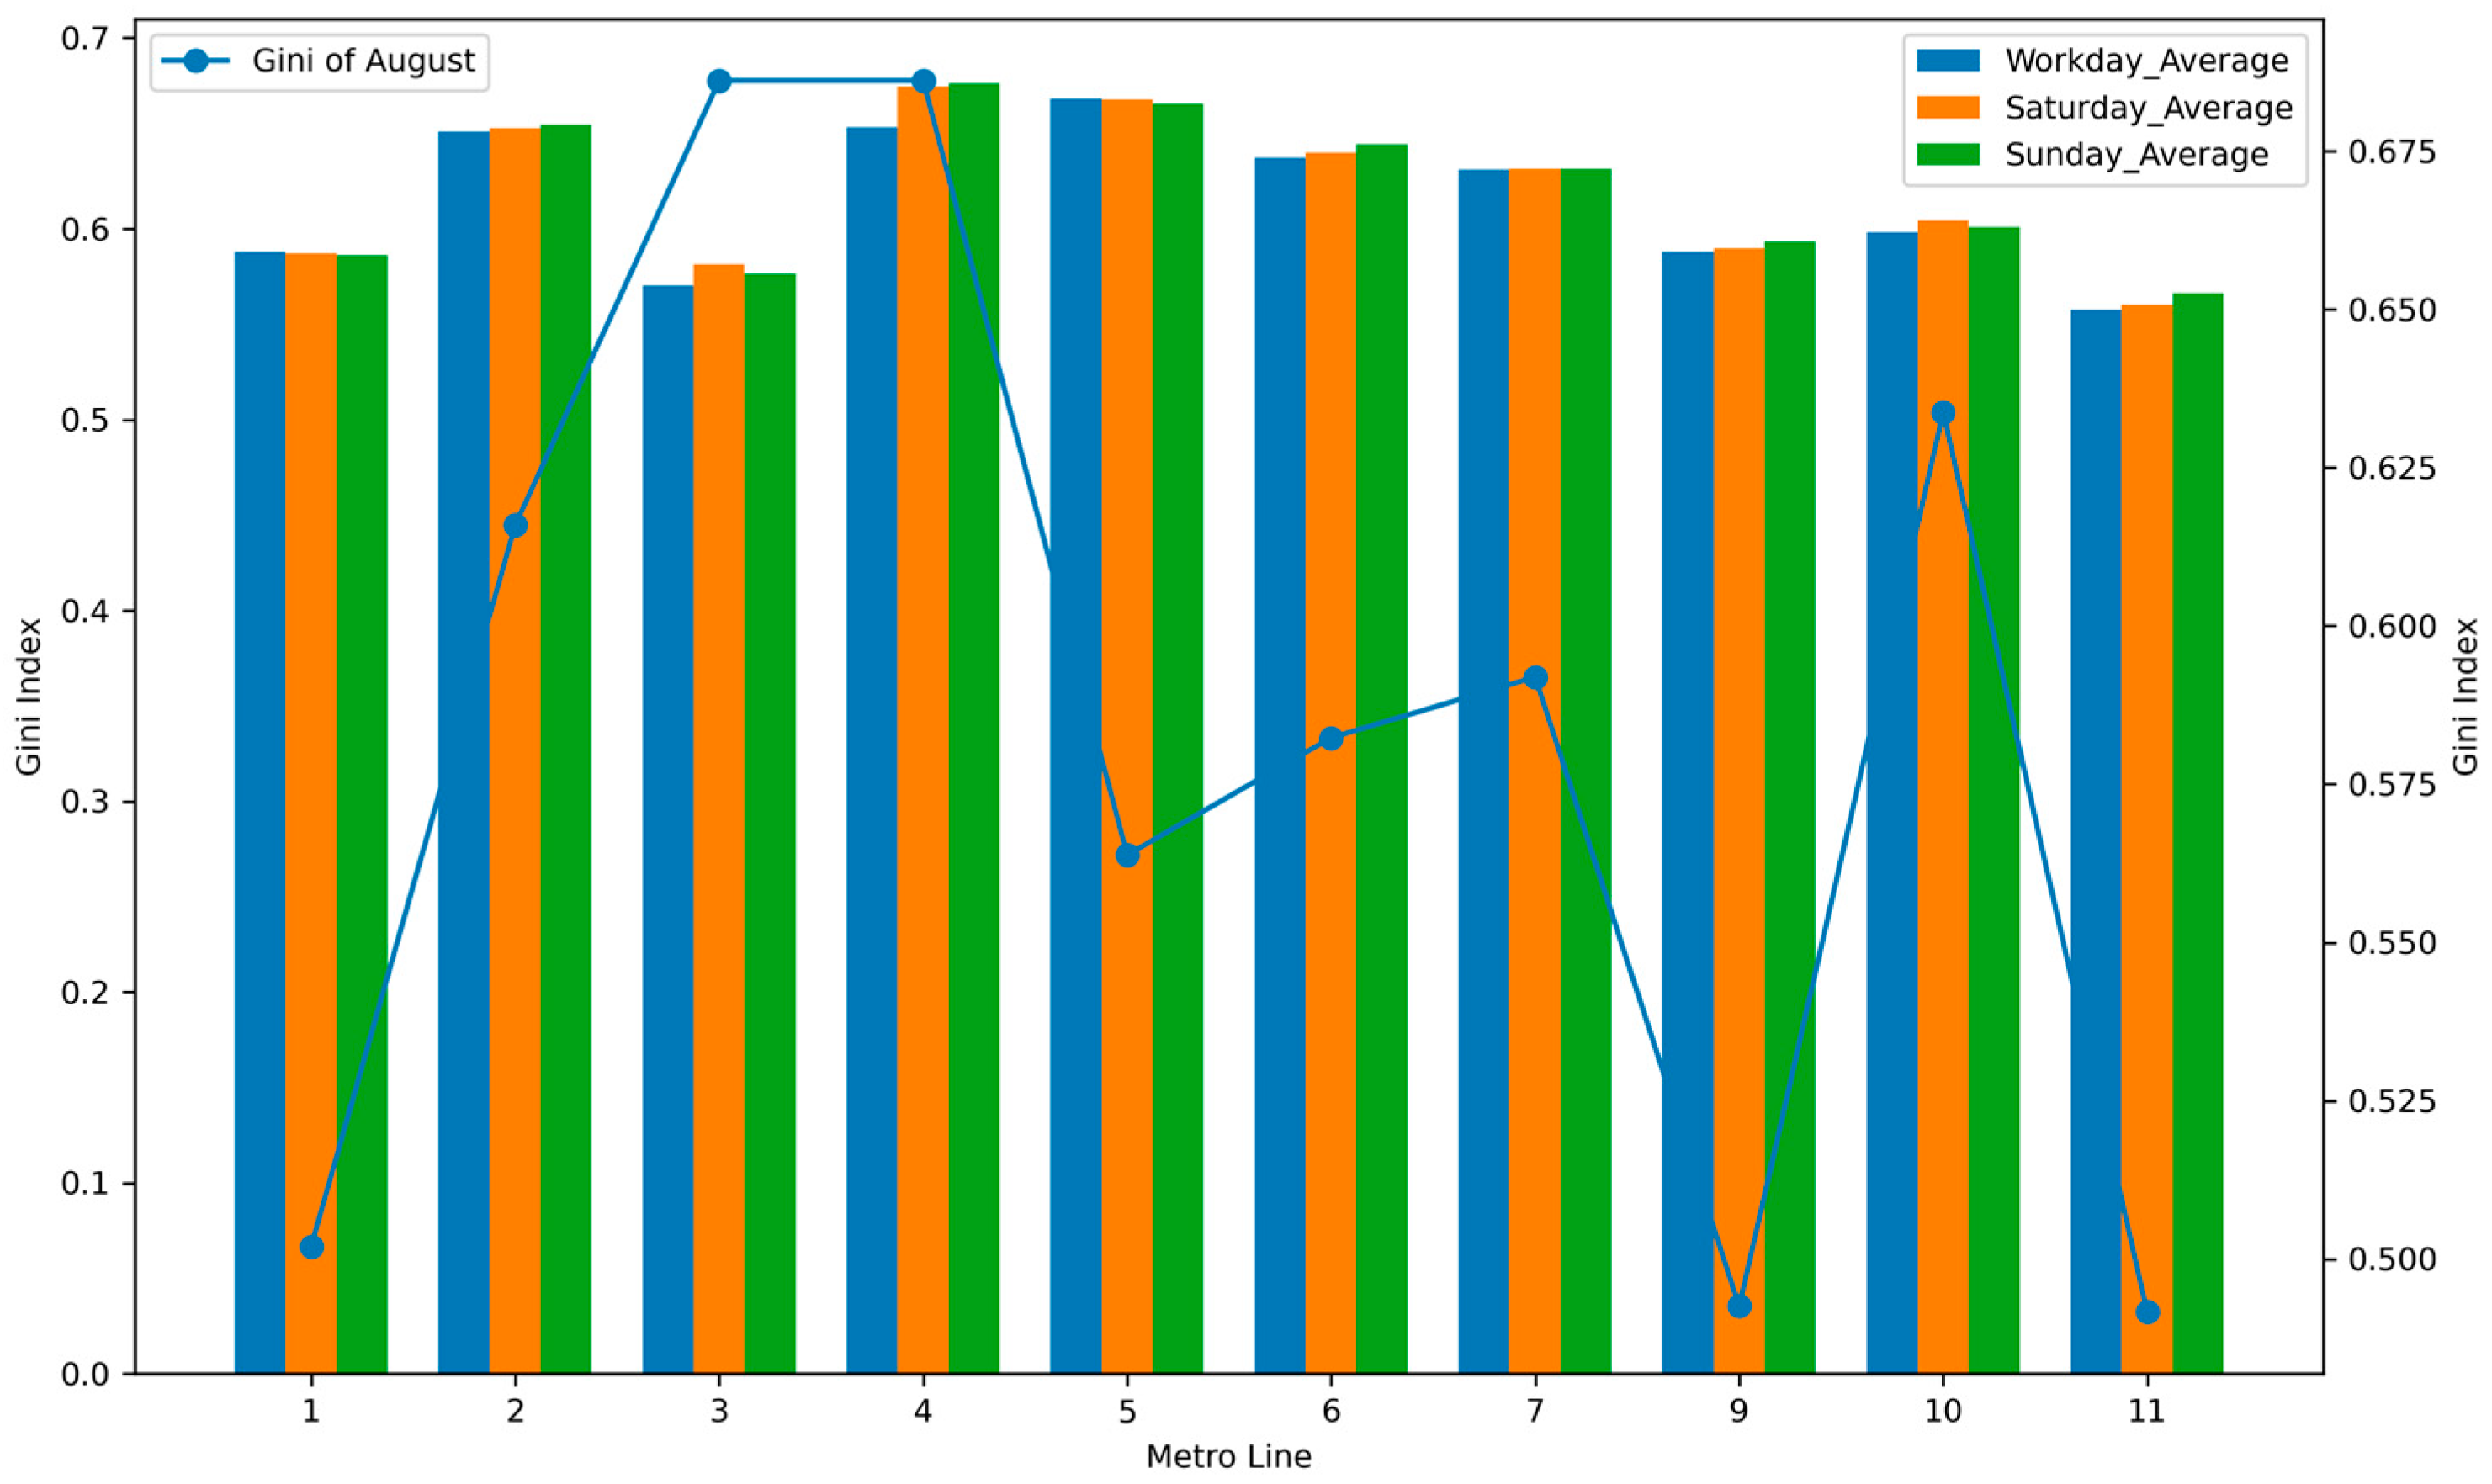
When comparing weekdays and weekends, the differences are smaller and more line-specific (Figure 8). Citywide, weekend Gini values are only slightly higher on average (0.620 on weekends vs. 0.616 on weekdays). However, certain lines deviate from this modest change. Line 4, which extends far north and includes tourist attractions, sees a noticeable increase in inequality on weekends (its stations’ average Gini rises from 0.65 on weekdays to 0.68 on weekends). Line 2 (leading to some coastal leisure areas) similarly has a minor uptick in weekend Gini (0.654 vs. 0.651 on weekdays). In contrast, core urban lines like Line 1, Line 3, and Line 11 maintain roughly the same or even slightly lower Gini on weekends. For instance, Line 1’s stations average around 0.586 on Sunday compared to 0.588 on weekdays (virtually unchanged). The reason could be that on weekends in the central city, bike-share usage is more evenly spread throughout the day and area (people taking varied leisure trips) as opposed to the intense station-focused commuting flows of weekdays. Meanwhile, lines serving special recreational destinations experience more unequal tourist flows on weekends (e.g., many bikes clustered at a beach park station while the rest of that line’s stations see normal usage). Figure 8 illustrates these trends, with each line’s bar showing that peripheral-oriented lines (4, 2) have a higher overall Gini on weekends, whereas lines through the dense core remain similar or improve slightly.
Importantly, different metro lines show consistently different equity levels overall. Lines that run through dense, inner-city areas such as Line 1 (Luobao Line) and Line 3 (Longgang Line) have among the lowest average Gini values across all time periods (around 0.55–0.60 for all-day usage). These lines serve neighborhoods like Futian CBD, Luohu, and older urban villages, where bike-share usage is broad-based as many residents in these catchments use bikes, not just those immediately near the stations. On the other hand, lines that include large suburban stretches such as Line 5, Line 6, and Line 7 exhibit higher inequality (mean Gini 0.63–0.67). Line 4 (Longhua Line) stands out with particularly high inequity (average station Gini ≥ 0.65, and it is the only line where the mean Gini exceeds 0.70 during some periods, notably weekend mornings). Line 4’s far-north terminus stations (e.g., Guangming, Guanlan) have very uneven usage, which drives up the line’s overall Gini. Line 11 (the airport express line) is an interesting case as its city-center stations have low Gini (0.56), but it also includes the airport zone which is a high-Gini outlier combined, Line 11’s average Gini is moderate. These line-level differences highlight that transit corridors serving different urban fabrics yield different equity outcomes. In practice, a metro line that goes through mixed-use “15-minute” neighborhoods will inherit more equitable bike-share usage patterns at its stations, whereas a line reaching into sprawled or single-use areas will see inequities at those endpoints. Planners can use this insight to target interventions for example, by boosting bike infrastructure or redistributing bikes in the specific high-Gini station areas on certain lines to improve equity where it is most needed [31].

5.2. Urban Perception and Usage Inequality: Correlation Insights

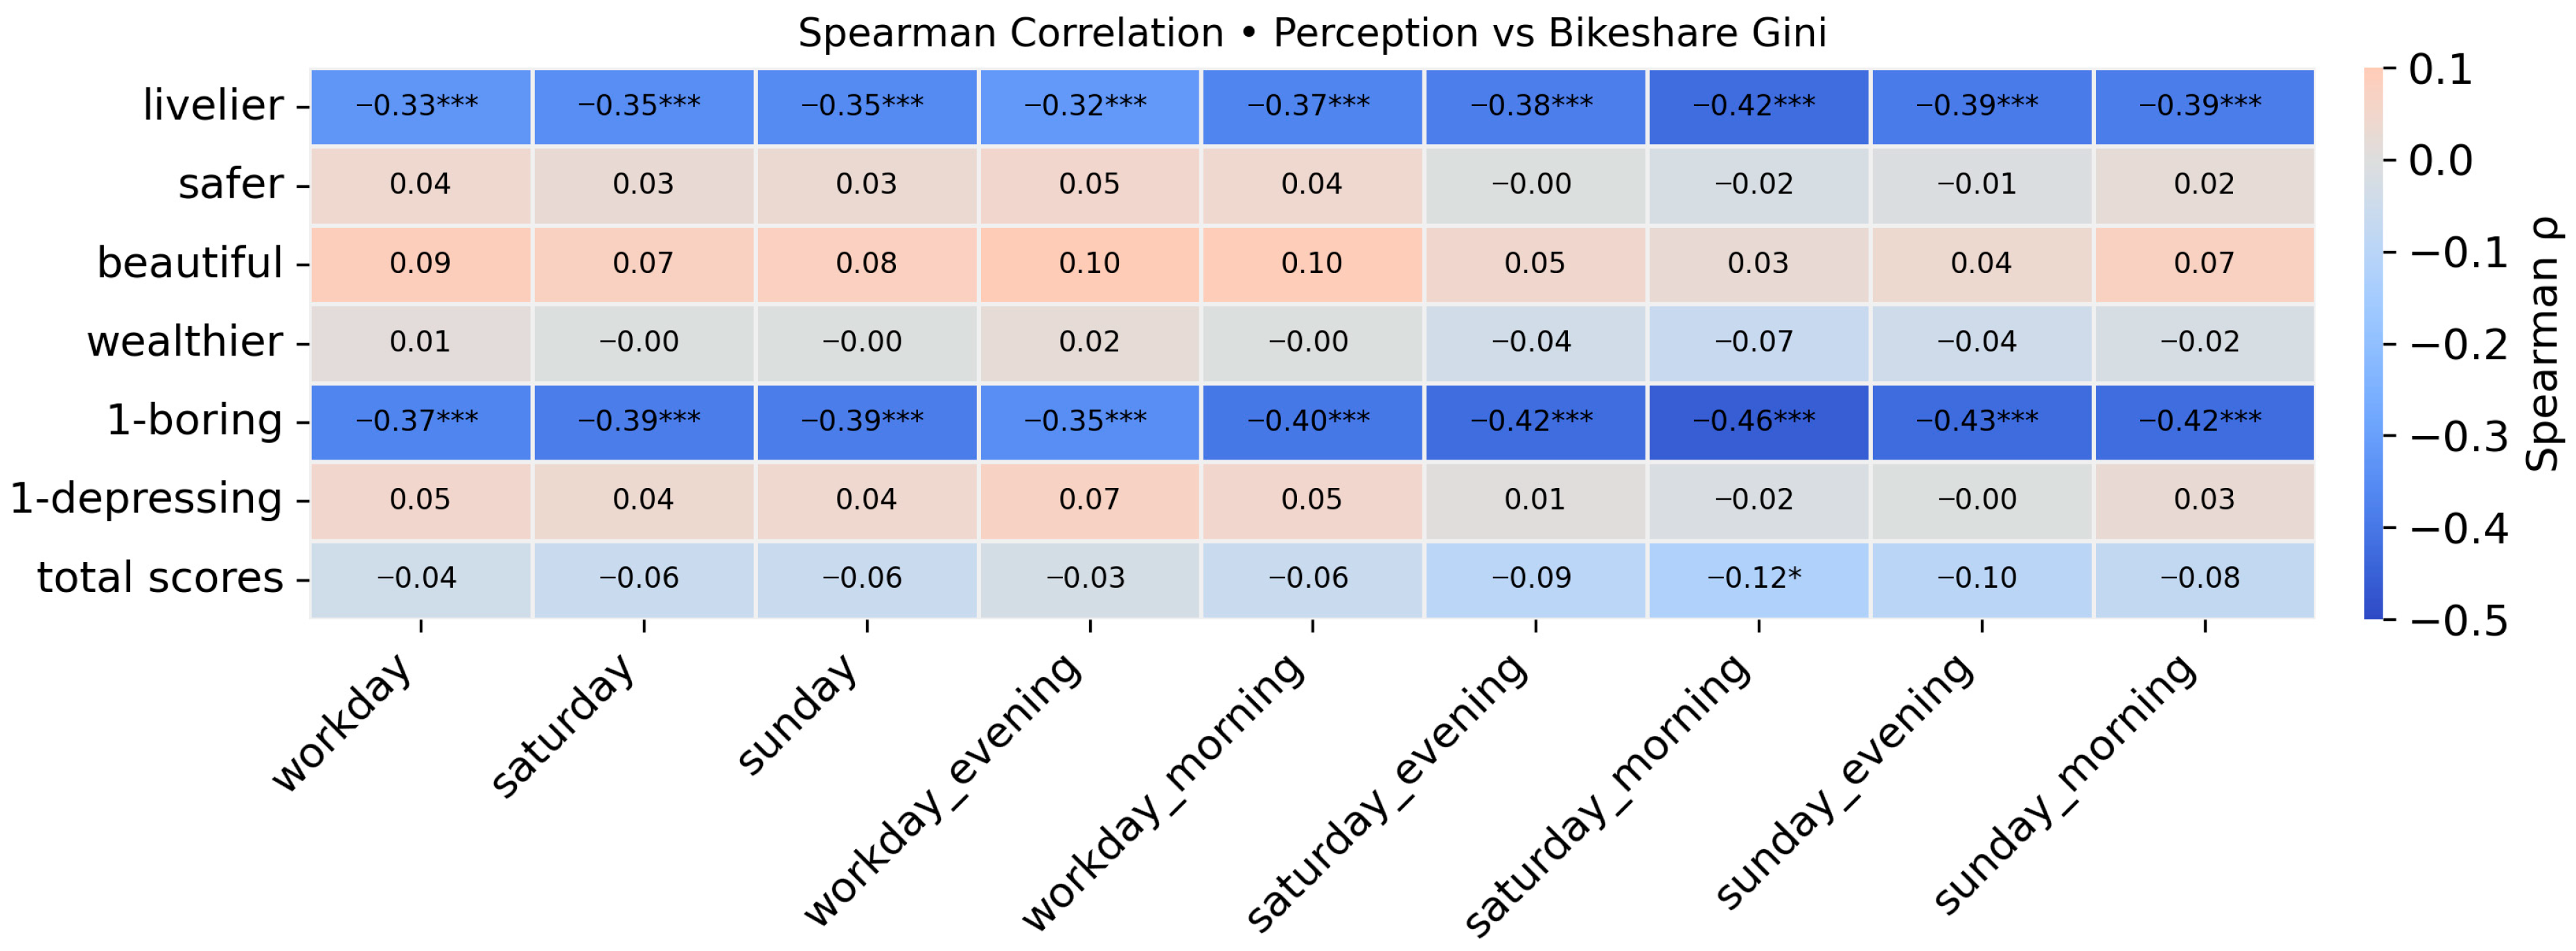
A central question in our study is whether the subjective qualities of the urban environment correlate with how evenly bike-share is used. Our Spearman rank correlation analysis (Figure 9) provides insight into this relationship.
Strikingly, we find a moderate negative correlation between the Gini coefficient and two perception attributes: “liveliness” and “interestingness” (the inverse of boredom). Spearman’s coefficient is about −0.35 for both the Lively score and the Not-Boring score with respect to the workday Gini as the strongest correlations observed. In practical terms, this means that station areas which look more lively and engaging in the street view images tend to have more equitable bike usage (lower Gini values). For example, a catchment full of street activity, diverse land uses, and people out and about is associated with a more uniform distribution of bike trips across its population. Conversely, areas that appear “boring” or lifeless see bike usage concentrated only in a small active portion, resulting in higher inequality. This finding aligns with urban planning intuition, which a lively, vibrant streetscape likely encourages people from all parts of the area to cycle, whereas a dull or uninviting environment might only see bike use near a single attractor.
This strong association can be explained by behavioral mobility theory [32]. A “vibrant” and “interesting” streetscape characterized by active storefronts, pedestrian traffic and mixed uses, creating what Jane Jacobs called “eyes on the street”. This sense of natural surveillance enhances perceived safety and social comfort, lowering psychological barriers to cycling for the wider population. In such an environment, cycling is not only a utilitarian behavior, but also a pleasant social experience, thus encouraging more trips to more diverse starting points in the service area. Conversely, “boring” environments lacking these cues of social presence may deter all but the most determined commuters and concentrate use in a few isolated hotspots.
By contrast, perceived safety and perceived wealth do not show a significant correlation with usage inequality. The Safety score is around +0.04, and the Wealthy-looking score is around 0.00. One might assume that safer-looking environments would foster more equitable usage, but in Shenzhen’s case, perceived safety was uniformly high in most areas and thus did not differentiate the outcomes. Similarly, wealthier or more upscale-looking areas are not necessarily more equitable in bike-share usage as wealth can cut both ways. Affluent residents might cycle less due to car ownership, or better infrastructure might encourage broader cycling as these effects can cancel out. The Beautiful score has a very weak positive correlation with Gini (about +0.08), hinting that extremely picturesque areas might coincide with slightly higher inequality. This could occur if a beautiful area (e.g., a scenic park) attracts disproportionate bike activity to one spot. However, this trend is not strong or consistent. The Not-Depressing (cheerfulness) score was also essentially uncorrelated (+0.04). Finally, the composite Total Perception index showed almost no correlation with Gini (coefficient around −0.05), indicating that overall positive perception of an area is not a straightforward predictor of bike-share equity as it is specific aspects like liveliness that matter.
It is important to approach these correlations with caution and acknowledge potential endogeneity. While our hypothesis is that a vibrant environment encourages more equitable bike use, a reverse relationship could exist where high levels of cycling and pedestrian activity cause an area to be perceived as more “lively.” However, because perceptual qualities are rooted in long-term built form (e.g., land-use mix, building facades), we argue that the environment is more likely a precursor to mobility behavior, though an interaction cannot be ruled out without longitudinal data.
Overall, these correlation results support the hypothesis that a vibrant urban environment promotes more equitable use of bike-sharing. In lively areas, there are multiple attractive origins and destinations for cycling, not just the metro station itself, which helps flatten the distribution of trips. A bustling, people-friendly atmosphere likely makes more residents willing to bike as it feels socially safe and enjoyable including those living farther from the station, thereby extending the reach of bike-share usage. Conversely, in a monotonous or uninviting environment, perhaps only the few people living or working immediately near the station (or another single facility) choose to use the bikes, leading to a highly concentrated pattern of use [33]. These insights point to the importance of urban vibrancy for mobility equity, an angle we further examine through modeling below.

5.3. Modeling Outputs of the Perception Influences

To further probe the perception–equity relationship, we developed a Random Forest regression model to predict station-level Gini using the six perception metrics as inputs (no single composite score, given its weak correlation). The model’s performance was modest but meaningful (Table 2) as it explained roughly 43–48% of the variance in Gini across stations for most time periods, with a cross-validated R2 around 0.44 for weekday overall Gini (and up to ~0.48 for Saturday morning), and a mean absolute error (MAE) on the order of 0.063–0.065. In practical terms, the model can predict a station area’s Gini to within about ±0.06 using perception features alone. Interestingly, the model performed slightly better for morning peak periods than for evenings (for example, R2 for the weekday morning model was 0.45, whereas for weekday evening it was only 0.35). This aligns with our earlier reasoning, which is the perceptual environment seems to influence where people choose to start bike trips in the morning more strongly, whereas evening bike trip patterns are more constrained by residential location (which perception cannot change).
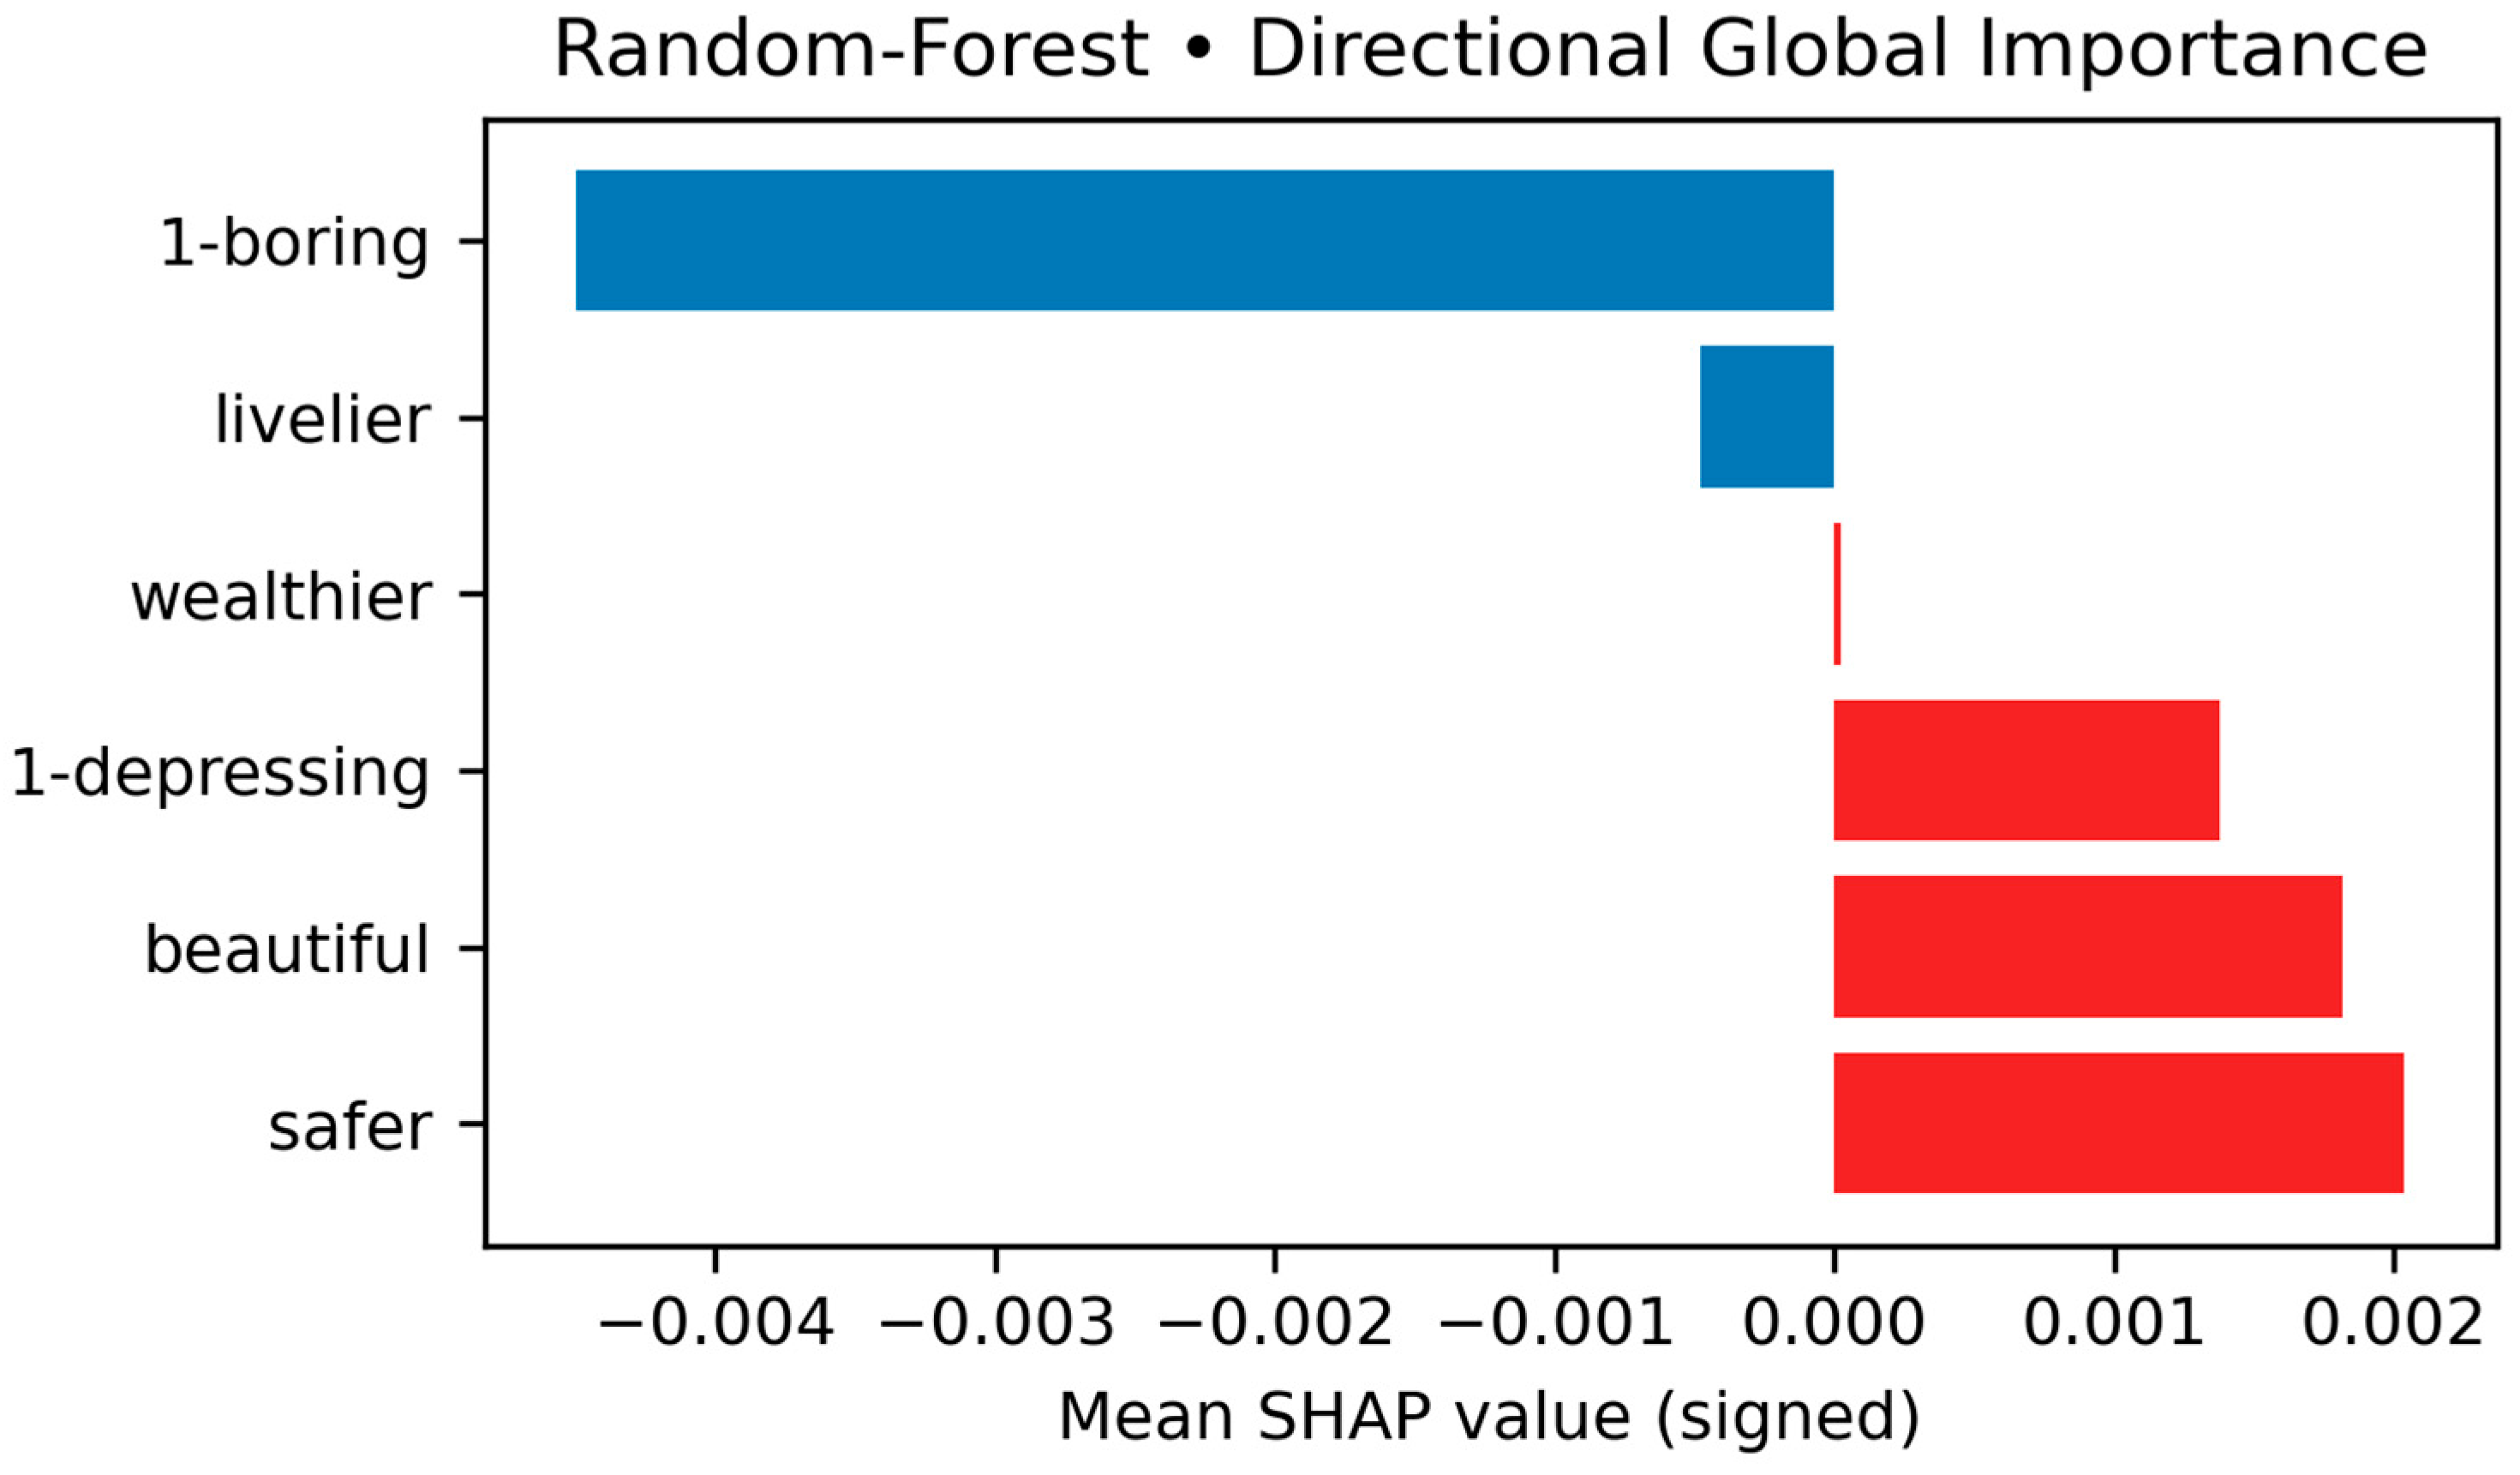
The feature importance analysis of the Random Forest (Figure 10) revealed which perceptual factors were most influential. The top two features were the Not-Boring score and the Beautiful score, followed by the Lively score as third. Together, these three accounted for over 70% of the model’s total importance (Not-Boring alone about 33%, Beautiful ~23%). The remaining features like Safe, Wealthy, and Not-Depressing contributed on the order of 7–9%. This ranking roughly mirrors the correlation findings in that the “interesting/lively” dimension is key. However, it is notable that Beauty emerged strongly in the model despite its low simple correlation with Gini. This suggests that the effect of a beautiful streetscape might be manifesting in combination with other factors in a non-linear way.
SHAP values provide further insight, but it must be emphasized that they reflect feature contributions and associations within the model, not real-world causal relationships. According to the SHAP analysis (Figure 11), stations with higher Not-Boring and Lively scores generally have negative SHAP contributions for the Gini prediction. The model predicts a lower Gini (more equity) when the environment is more interesting and vibrant. On the other hand, a higher Beautiful score is associated with a slight increase in the predicted Gini in our model. A hypothesis is that some of the most picturesque environments are special destinations (e.g., scenic parks) that concentrate bike activity in one part of the catchment.
In detail, a higher Beautiful score is associated with a slight increase in the predicted Gini (a positive SHAP contribution) in our model. In other words, holding other factors constant, the model often expects a very visually attractive area to have somewhat higher inequality. Why might a “beautiful” streetscape correspond to greater inequity? One hypothesis is that some of the most picturesque environments in our data are special destinations such as scenic parks or waterfronts that concentrate bike activity in one part of the catchment. For example, the Window of the World area is both lively and beautiful; its liveliness helps spread bike use, but its specific land use (a theme park) still causes many trips to cluster at one location. The model can pick up such nuanced patterns as an area that is beautiful but not lively perhaps a clean, manicured upscale enclave with little street life might yield a high Gini because only a small subset of people (those near a particular facility) use bikes. Meanwhile, an area that is beautiful and lively like a popular tree-lined shopping street can achieve low Gini. Thus, the model assigns a complex role to Beauty, although the magnitude of its effect is smaller than that of Not-Boring or Lively.
The Safety and Wealth perception features had relatively minor impacts on the model. SHAP values for the Safety score were very small and slightly positive on average (indicating that extremely safe-looking areas might coincide with marginally higher Gini, but with a negligible effect size). A speculative explanation is that in very safe, wealthy districts, fewer residents need or choose to cycle due to alternatives like cars, meaning those who do bike represent a smaller group, but our data does not strongly support any firm conclusion on this point, given the weak influence of these features.
Combining these insights, the model suggests that to predict a station’s bike-share equity, the most useful cues are how engaging and active the station’s environment appears. If an area scores high on “boring”, the model strongly expects high inequality as presumably because only a small part of a dull area generates most of the trips. If an area looks vibrant and interesting, the model leans toward predicting low inequality as a broader base of ridership. The fact that purely image-based features could achieve around 45% explanatory power is noteworthy. It underscores that human-scale urban design characteristics, as captured through street imagery, carry substantial information about mobility patterns and equity outcomes.
For practitioners, this implies that improvements which make station areas livelier and people-friendly might also improve equity in bike-share usage. For example, introducing street markets, sidewalk cafes, community events, or other activations that make a neighborhood more engaging could encourage a wider spread of bike use throughout the area—not just near the transit station. Similarly, ensuring that the urban environment is diverse and visually appealing rather than monotonous may help. This resonates with the 15-minute city principle as a vibrant, mixed-use neighborhood encourages local trips everywhere in the vicinity, rather than funneling activity to one central node.

5.4. Implications for Equitable Shared Mobility

Our findings carry several implications for urban mobility planning, particularly in the context of the 15-minute city paradigm.
First, simply having a bike-sharing service near transit stations is not enough to ensure equitable usage across the whole neighborhood. Within many station catchments we observed significant intra-area disparities as certain pockets benefit much less from the bike-share system than others [34]. To address this, planners should consider interventions targeted at those under-served zones. For example, improving bike lane connectivity deeper into neighborhoods (beyond just the immediate vicinity of the metro station) can help residents farther out access to the system. Likewise, bike redistribution efforts could place more bikes not only at station exits but also at key community nodes (schools, parks, housing complexes) within the catchment.
Second, the role of urban perception implies that the quality of place matters for transport equity. The soft attributes of the environment like how enjoyable, safe, or interesting it is to walk and cycle can influence whether people in all parts of an area engage in cycling. A 15-minute neighborhood ideally features pleasant, safe, and lively streets for active mobility; our study provides empirical support that such qualities correlate with more equitable outcomes. Cities should thus pursue human-centric urban improvements (better sidewalks, street lighting, active storefronts, greenery, public art, etc.) in station areas not only for aesthetics but as a strategy for inclusive mobility [35]. In effect, improving street-level perceptions of a place can be seen as an equity intervention. For instance, if our analysis identifies a particular station catchment as “boring” and having high bike usage inequality, city officials could organize street fairs or markets, support local shops, or encourage mixed land uses that bring life to currently quiet sections. Over time, such placemaking efforts could attract more consistent bike use across the whole area, distributing the benefits more broadly.
Third, our results underscore that the 15-minute radius concept should be approached with nuance: not all points within a 15-minute distance are equally accessible or appealing under current conditions. In Shenzhen, we found that perhaps only a 5-minute cycling sub-area around some stations is heavily utilized, while the outer portions of the catchment see minimal use. Bridging this gap is essential to truly realize the 15-minute city vision. This means ensuring continuity of bike-friendly infrastructure and a positive street environment throughout the entire catchment, so that distance from the station does not translate into disproportionate drop-offs in usage. It also means incorporating community input since perception is ultimately about how residents feel. Planners might use tools like the image-based perception scores to identify “cold spots” in a catchment (areas with poor perceived environment or low usage) and then engage the community to diagnose issues and co-create solutions. The overarching idea is to make every part of the 15-minute neighborhood inviting for cycling, not just the areas near transit.
Finally, the temporal patterns we observed suggest that addressing inequity during peak commute times may require specific measures. Morning peaks had particularly high spatial inequality in bike use, likely because so many riders converge toward the station at the same time. City authorities could manage this surge by providing more bike parking and designated drop-off points around stations to prevent clutter or bottlenecks that might discourage those from the periphery. In the evenings, ensuring ample bike availability not just at the station but in residential sections of the catchment (e.g., via satellite docking hubs or bike racks deeper in neighborhoods) can help returning commuters ride closer to home, spreading out the usage. While some first-mile/last-mile asymmetry is inevitable, cities might also explore staggering work start times or promoting local morning activities (like nearby co-working spaces or markets) so that not everyone is biking to the station at once. Such measures could mitigate the sharp morning inequalities and contribute to a more balanced usage of bike-share across both space and time.
Additionally, the transferability of this study’s findings, based on the high-density megacity of Shenzhen, requires further exploration. In lower-density, more car-dependent European or North American cities, factors like perceived safety might emerge as more significant predictors of cycling equity [36,37,38]. Furthermore, Shenzhen’s dockless system differs from the station-based systems common in many Western cities, which could also influence usage patterns [2]. Future comparative studies are necessary to test the universality of these perception-equity relationships across different urban and cultural contexts.

6. Conclusions

This study examined the relationship between bike-sharing usage equity and urban perception in the 15-minute cycling catchments around metro stations in Shenzhen. We quantified how inequitable bike-share trips are distributed among the population of each station area using per capita trip metrics and Gini coefficients, and we linked those equity measures to perception scores derived from Baidu street view images (capturing how safe, lively, beautiful, wealthy, etc., each area appears).
Our analysis yielded several key findings. First, there are significant spatial inequities, with central, high-density areas exhibiting relatively equitable usage patterns, while peripheral areas show high inequity. Second, temporal dynamics are unveiled, with usage inequality tending to be higher during morning peak hours. Third, urban perception matters. A novel contribution of this work is demonstrating that human perceptions of the built environment correlate with mobility equity. Station catchments that scored high on “liveliness” and “interestingness” tended to have significantly more equitable distribution of trips. Fourth, our integrated modeling showed that perception attributes can moderately predict the degree of usage inequity (around 0.4–0.5).
There are also implications for the 15-minute metro station catchments. Our results emphasize that achieving an equitable 15-minute city is not only about providing infrastructure (bikes, docks, lanes) but also about creating inviting and inclusive urban spaces. Station catchments that embodied 15-minute city ideals such as mixed-use, walkable, vibrant community inherently showed better shared-mobility equity [12]. This suggests investments in human-scale urban design and placemaking may translate into more egalitarian use of public transportation and shared bikes, which in turn support the sustainability and accessibility goals of the 15-minute city concept (reducing car dependence, etc.). Shenzhen’s case indicates that planners should identify high-inequity station areas and then consider improving the human-scale environment there as a strategy to broaden bike-share adoption in those communities.
Several limitations of this study should be noted. First, our analysis is cross-sectional (focused on August 2021), so we cannot definitively establish causality between perception and equity. Furthermore, the use of single-month data fails to capture seasonal variations (e.g., weather, holidays) that might influence cycling behavior. Longitudinal studies would help in untangling causality. Second, the reliability and validity of the perception scores warrant further field investigation. As several studies have supported the validation of the street image perceptions, we continue to take advantage of the urban perception dataset and toolkits [19,20,39]. Future research should validate these scores through surveys with local Shenzhen residents. Third, our equity metric does not account for demographic differences due to the lack of detailed data. We lacked disaggregated rider data to examine if inequality disproportionately affects certain groups (e.g., women, low-income residents). Future research could incorporate user demographics to explore who benefits from or is left behind by bike-sharing. Finally, future studies could explore alternative equity measures and apply this framework to different cities to understand the generalizability of these findings. Despite these limitations, our study offers a novel interdisciplinary approach to understanding shared mobility equity, encouraging a holistic perspective that marries hard transportation data with the “soft” attributes of urban design and human perception.
In conclusion, this study provides empirical evidence that combining human-scale urban perception data with mobility data yields valuable insights for equitable transport planning. We demonstrated a methodology to quantify bike-share usage inequality at a fine spatial scale and related it to visual qualities of the urban environment. The findings highlight a novel angle. The look and feel of a neighborhood can influence the equity of shared mobility usage. Planners and policymakers aiming for equitable access to bike-sharing should consider interventions both in the social infrastructure and the physical environment such as urban design enhancements [40]. A key takeaway is that a people-friendly street environment, one that is lively, engaging, and well-integrated is not just refinement, but can be a practical tool to democratize sustainable transport [7,25,38,41].

Author Contributions

Conceptualization, F.T., L.W. and Y.S.; methodology, F.T. and L.Z.; software, F.T., L.W., L.Z. and Y.S.; validation, Y.W., H.G., W.X. and Y.S.; formal analysis, F.T. and Y.S.; investigation, L.Z., Y.W., H.G. and W.X.; resources, F.T. and Y.S.; data curation, Y.S.; writing—original draft preparation, F.T.; writing—review and editing, Y.S.; visualization, F.T., L.W. and Y.S.; supervision, W.X.; project administration, F.T. All authors have read and agreed to the published version of the manuscript.

Funding

This research received no external funding.

Data Availability Statement

The original contributions presented in this study are included in the article. Further inquiries can be directed to the corresponding author.

Conflicts of Interest

The authors declare no conflicts of interest.

References

  1. Jin, S.T.; Sui, D.Z. Bikesharing and Equity: A Nationwide Study of Bikesharing Accessibility in the U.S. Transp. Res. Part A Policy Pract. 2024, 181, 103983. [Google Scholar] [CrossRef]
  2. Wang, B.; Guo, Y.; Chen, F.; Tang, F. The Impact of the Social-Built Environment on the Inequity of Bike-Sharing Use: A Case Study of Divvy System in Chicago. Travel Behav. Soc. 2024, 37, 100873. [Google Scholar] [CrossRef]
  3. Brown, A.; Manville, M.; Weber, A. Can Mobility on Demand Bridge the First-Last Mile Transit Gap? Equity Implications of Los Angeles’ Pilot Program. Transp. Res. Interdiscip. Perspect. 2021, 10, 100396. [Google Scholar] [CrossRef]
  4. McKane, R.G.; Hess, D. The Impact of Ridesourcing on Equity and Sustainability in North American Cities: A Systematic Review of the Literature. Cities 2023, 133, 104122. [Google Scholar] [CrossRef]
  5. Shaheen, S.; Cohen, A. Shared Ride Services in North America: Definitions, Impacts, and the Future of Pooling. Transp. Rev. 2019, 39, 427–442. [Google Scholar] [CrossRef]
  6. Duran, A.C.; Anaya-Boig, E.; Shake, J.D.; Garcia, L.M.T.; Rezende, L.F.M.D.; Hérick De Sá, T. Bicycle-Sharing System Socio-Spatial Inequalities in Brazil. J. Transp. Health 2018, 8, 262–270. [Google Scholar] [CrossRef]
  7. Fishman, E.; Washington, S.; Haworth, N. Bike Share’s Impact on Car Use: Evidence from the United States, Great Britain, and Australia. Transp. Res. Part D Transp. Environ. 2014, 31, 13–20. [Google Scholar] [CrossRef]
  8. Meredith-Karam, P.; Kong, H.; Stewart, A.; Zhao, J. Understanding and Comparing the Public Transit and Ride-Hailing Ridership Change in Chicago during COVID-19 via Statistical and Survey Approaches. Travel Behav. Soc. 2024, 37, 100838. [Google Scholar] [CrossRef]
  9. Ewing, R.; Cervero, R. Travel and the Built Environment: A Meta-Analysis. J. Am. Plan. Assoc. 2010, 76, 265–294. [Google Scholar] [CrossRef]
  10. Jiao, J.; Wang, F. Shared Mobility and Transit-Dependent Population: A New Equity Opportunity or Issue? Int. J. Sustain. Transp. 2021, 15, 294–305. [Google Scholar] [CrossRef]
  11. Zhou, Z.; Schwanen, T. Exploring the Production of Spatial Inequality in Dockless Bicycle Sharing in Shenzhen. J. Transp. Geogr. 2024, 119, 103955. [Google Scholar] [CrossRef]
  12. Fan, Y.; Wang, Y.; Yu, Y.; Liang, J. Shenzhen’s 15-Minute City Initiative: A Model for High-Quality Urban Development. Transp. Res. Part A Policy Pract. 2025, 199, 104547. [Google Scholar] [CrossRef]
  13. Li, Y.; Li, J.; Yu, Z.; Li, S.; Li, A. Exploring the Relationship between the Built Environment and Bike-Sharing Usage as a Feeder Mode across Different Metro Station Types in Shenzhen. Land 2025, 14, 1291. [Google Scholar] [CrossRef]
  14. Peng, C. Sustainable Urban Development in the Post-Pandemic Era: Smart Shenzhen Based on the 15-Minute City Concept. HSET 2024, 86, 139–145. [Google Scholar] [CrossRef]
  15. Liu, D.; Kwan, M.-P.; Wang, J. Developing the 15-Minute City: A Comprehensive Assessment of the Status in Hong Kong. Travel Behav. Soc. 2024, 34, 100666. [Google Scholar] [CrossRef]
  16. Moreno, C.; Allam, Z.; Chabaud, D.; Gall, C.; Pratlong, F. Introducing the “15-Minute City”: Sustainability, Resilience and Place Identity in Future Post-Pandemic Cities. Smart Cities 2021, 4, 93–111. [Google Scholar] [CrossRef]
  17. Chen, Y.; Yang, X.; Li, X.; Yang, L.; Cheng, S.; Tang, G.; Biljecki, F. Vertical 15-Minute City: Modeling Urban Density and Functional Mix with Multi-Source Geospatial Data. Cities 2026, 169, 106516. [Google Scholar] [CrossRef]
  18. Hamidi, Z.; Camporeale, R.; Caggiani, L. Inequalities in Access to Bike-and-Ride Opportunities: Findings for the City of Malmö. Transp. Res. Part A Policy Pract. 2019, 130, 673–688. [Google Scholar] [CrossRef]
  19. Tang, F.; Zeng, P.; Wang, L.; Zhang, L.; Xu, W. Urban Perception Evaluation and Street Refinement Governance Supported by Street View Visual Elements Analysis. Remote Sens. 2024, 16, 3661. [Google Scholar] [CrossRef]
  20. Guo, Y.; Wang, L.; Tang, F.; Xuan, H.; Chi, B. Commercial Gentrification of Metro Catchment: Lenses of Subjective Perception and Objective Nighttime Light. Res. Transp. Bus. Manag. 2025, 59, 101310. [Google Scholar] [CrossRef]
  21. Lei, Y.; Zhou, H.; Xue, L.; Yuan, L.; Liu, Y.; Wang, M.; Wang, C. Evaluating and Comparing Human Perceptions of Streets in Two Megacities by Integrating Street-View Images, Deep Learning, and Space Syntax. Buildings 2024, 14, 1847. [Google Scholar] [CrossRef]
  22. Wang, L.; Han, X.; He, J.; Jung, T. Measuring Residents’ Perceptions of City Streets to Inform Better Street Planning through Deep Learning and Space Syntax. ISPRS J. Photogramm. Remote Sens. 2022, 190, 215–230. [Google Scholar] [CrossRef]
  23. Wang, X.; Xue, R.; Lu, M.; Wu, J. Riders under the Heat: Exploring the Impact of Extreme Heat on the Integration of Bike-Sharing and Public Transportation in Shenzhen, China. ISPRS Int. J. Geo-Inf. 2024, 13, 438. [Google Scholar] [CrossRef]
  24. Liu, J.; Chau, K.W.; Bao, Z. Multiscale Spatial Analysis of Metro Usage and Its Determinants for Sustainable Urban Development in Shenzhen, China. Tunn. Undergr. Space Technol. 2023, 133, 104912. [Google Scholar] [CrossRef]
  25. Chen, Z.; Guo, Y.; Stuart, A.L.; Zhang, Y.; Li, X. Exploring the Equity Performance of Bike-Sharing Systems with Disaggregated Data: A Story of Southern Tampa. Transp. Res. Part A Policy Pract. 2019, 130, 529–545. [Google Scholar] [CrossRef]
  26. Hosford, K.; Winters, M. Who Are Public Bicycle Share Programs Serving? An Evaluation of the Equity of Spatial Access to Bicycle Share Service Areas in Canadian Cities. Transp. Res. Rec. 2018, 2672, 42–50. [Google Scholar] [CrossRef]
  27. Jang, S.; An, Y.; Yi, C.; Lee, S. Assessing the Spatial Equity of Seoul’s Public Transportation Using the Gini Coefficient Based on Its Accessibility. Int. J. Urban Sci. 2017, 21, 91–107. [Google Scholar] [CrossRef]
  28. Chen, L.-C.; Zhu, Y.; Papandreou, G.; Schroff, F.; Adam, H. Encoder-Decoder with Atrous Separable Convolution for Semantic Image Segmentation. In Computer Vision—ECCV 2018; Ferrari, V., Hebert, M., Sminchisescu, C., Weiss, Y., Eds.; Lecture Notes in Computer Science; Springer International Publishing: Cham, Switzerland, 2018; Volume 11211, pp. 833–851. ISBN 978-3-030-01233-5. [Google Scholar]
  29. Simonyan, K.; Zisserman, A. Very Deep Convolutional Networks for Large-Scale Image Recognition. arXiv 2015, arXiv:1409.1556. [Google Scholar] [CrossRef]
  30. Duan, J.; Zhao, Z.; Xu, Y.; You, X.; Yang, F.; Chen, G. Spatial Distribution Characteristics and Driving Factors of Little Giant Enterprises in China’s Megacity Clusters Based on Random Forest and MGWR. Land 2024, 13, 1105. [Google Scholar] [CrossRef]
  31. de Chardon, C.M. The Contradictions of Bike-Share Benefits, Purposes and Outcomes. Transp. Res. Part A Policy Pract. 2019, 121, 401–419. [Google Scholar] [CrossRef]
  32. Stanley, J.K.; Hensher, D.A.; Stanley, J.R. Place-Based Disadvantage, Social Exclusion and the Value of Mobility. Transp. Res. Part A Policy Pract. 2022, 160, 101–113. [Google Scholar] [CrossRef]
  33. Duran-Rodas, D.; Wright, B.; Pereira, F.C.; Wulfhorst, G. Demand And/oR Equity (DARE) Method for Planning Bike-Sharing. Transp. Res. Part D Transp. Environ. 2021, 97, 102914. [Google Scholar] [CrossRef]
  34. Bollenbach, L.; Kanning, M.; Niermann, C. Qualitative Exploration of Determinants of Active Mobility and Social Participation in Urban Neighborhoods: Individual Perceptions over Objective Factors? Arch Public Health 2024, 82, 183. [Google Scholar] [CrossRef] [PubMed]
  35. Guo, Y.; Yang, L.; Chen, Y. Bike Share Usage and the Built Environment: A Review. Front. Public Health 2022, 10, 848169. [Google Scholar] [CrossRef]
  36. Guo, Y.; He, S.Y. Perceived Built Environment and Dockless Bikeshare as a Feeder Mode of Metro. Transp. Res. Part D Transp. Environ. 2021, 92, 102693. [Google Scholar] [CrossRef]
  37. Su, L.; Yan, X.; Zhao, X. Spatial Equity of Micromobility Systems: A Comparison of Shared E-Scooters and Docked Bikeshare in Washington DC. Transp. Policy 2024, 145, 25–36. [Google Scholar] [CrossRef]
  38. Qian, X.; Niemeier, D. High Impact Prioritization of Bikeshare Program Investment to Improve Disadvantaged Communities’ Access to Jobs and Essential Services. J. Transp. Geogr. 2019, 76, 52–70. [Google Scholar] [CrossRef]
  39. Dong, L.; Jiang, H.; Li, W.; Qiu, B.; Wang, H.; Qiu, W. Assessing Impacts of Objective Features and Subjective Perceptions of Street Environment on Running Amount: A Case Study of Boston. Landsc. Urban Plan. 2023, 235, 104756. [Google Scholar] [CrossRef]
  40. Hosseinzadeh, A.; Karimpour, A.; Kluger, R. Factors Influencing Shared Micromobility Services: An Analysis of e-Scooters and Bikeshare. Transp. Res. Part D Transp. Environ. 2021, 100, 103047. [Google Scholar] [CrossRef]
  41. Qian, X.; Jaller, M.; Niemeier, D. Enhancing Equitable Service Level: Which Can Address Better, Dockless or Dock-Based Bikeshare Systems? J. Transp. Geogr. 2020, 86, 102784. [Google Scholar] [CrossRef]
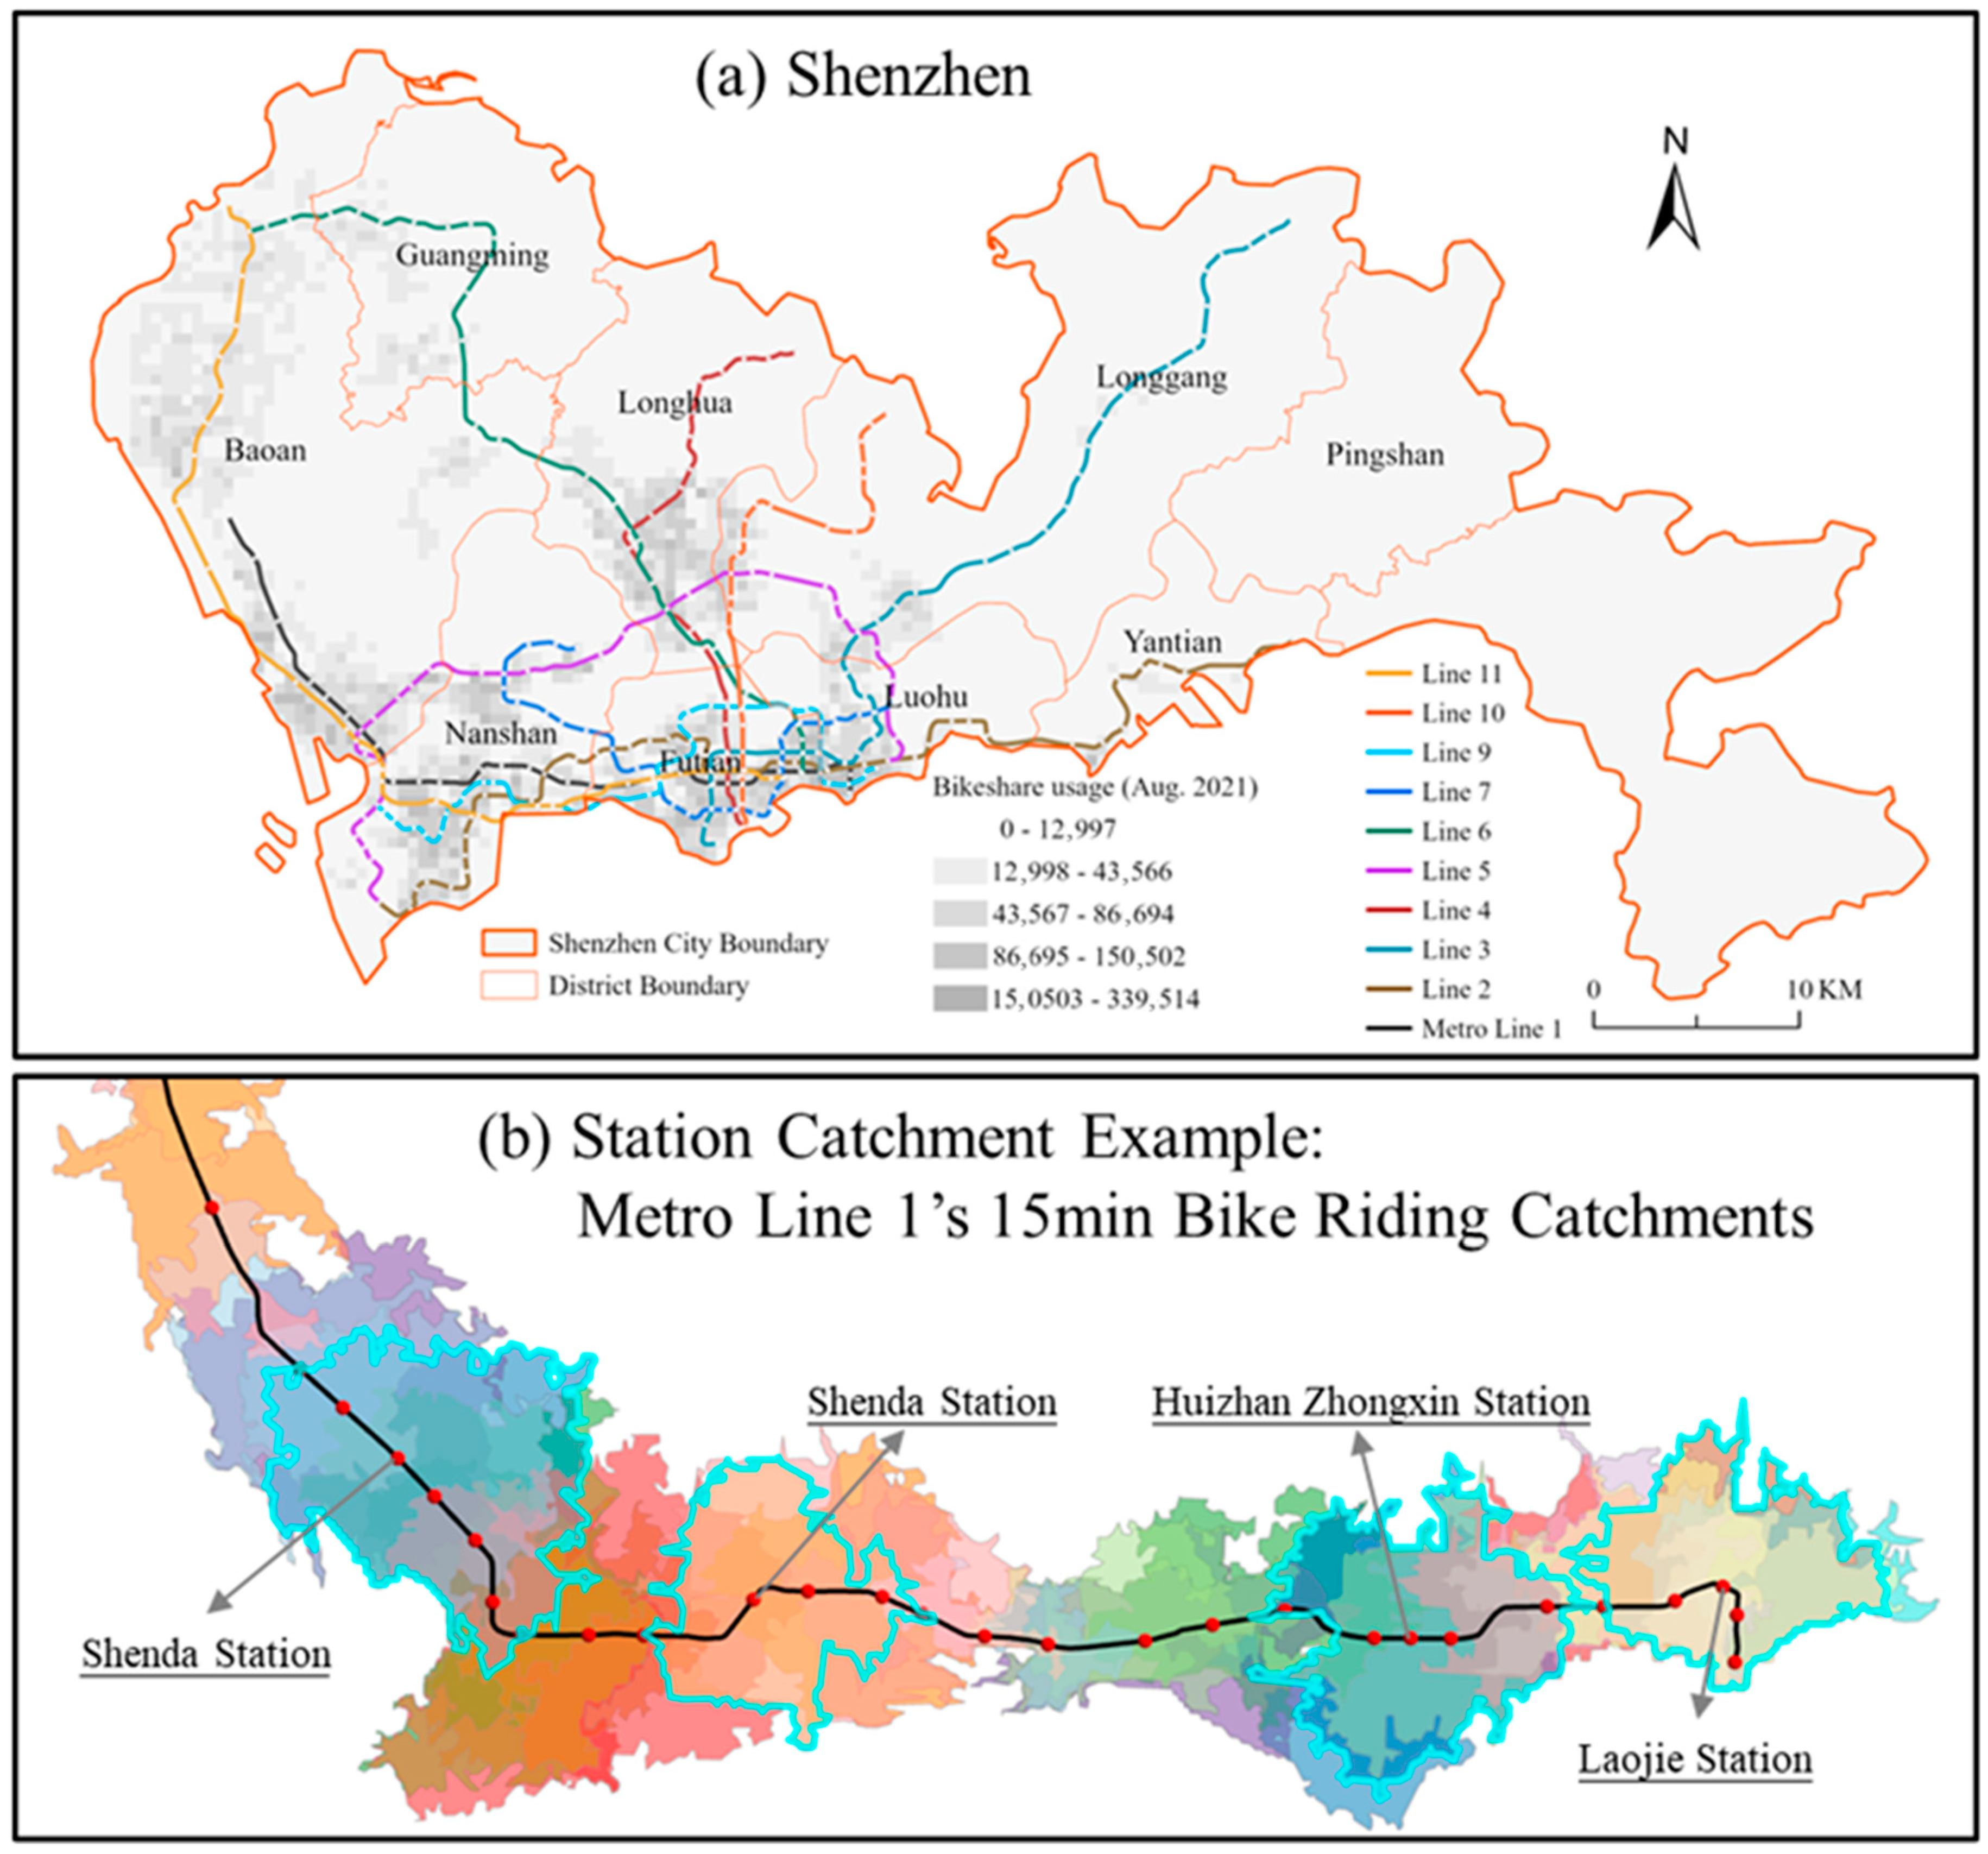
Figure 1. (a) The metro lines and bikeshare usage in Shenzhen City in August 2021; (b) the 15-minute bike riding catchment areas of metro line 1 as an example.
Buildings 15 03874 g001
Figure 2. The flowchart of the research.
Buildings 15 03874 g002
Figure 3. The Gini index distribution of bikeshare usage on workdays.
Buildings 15 03874 g003
Figure 4. The Gini index distribution of bikeshare usage in Saturday.
Buildings 15 03874 g004
Figure 5. The Gini index distribution of bikeshare usage on Sunday.
Buildings 15 03874 g005
Figure 6. The spatial distribution of positive urban perception score.
Buildings 15 03874 g006
Figure 7. The Gini coefficients of workday, Saturday and Sundays’ morning peak and evening peak of metro lines.
Buildings 15 03874 g007
Figure 8. The Gini coefficients of August, workday, Saturday and Sunday of metro lines.
Buildings 15 03874 g008
Figure 9. The heatmap correlation of urban perception scores and bikeshare Gini (note: ***, * represent the significance levels of 1%, 10%, respectively).
Buildings 15 03874 g009
Figure 10. The mean SHAP value of global importance.
Buildings 15 03874 g010
Figure 11. The mean SHAP value of per feature and Gini’s importance.
Buildings 15 03874 g011
Table 1. Random Forest Model Hyperparameters and Validation.
ParameterValueRationale
Number of Trees (n_estimators)500Standard value balancing performance and computational cost.
Max Depth (max_depth)10Tuned via grid search to prevent overfitting.
Cross-Validation5-foldEnsures robust evaluation of model performance (and MAE).
Overfitting CheckOut-of-Bag (OOB) ScoreOOB of 0.42 was very close to the cross-validated, indicating no significant overfitting.
Table 2. The MAE and R2 of Random Forest model output.
TargetMAER2
workday0.0630650.441215
saturday0.064370.435631
sunday0.0642730.428886
workday_evening0.0652570.346705
workday_morning0.0649730.447565
saturday_evening0.0670260.398089
saturday_morning0.0663610.482398
sunday_evening0.0662210.419583
sunday_morning0.065250.462872
Disclaimer/Publisher’s Note: The statements, opinions and data contained in all publications are solely those of the individual author(s) and contributor(s) and not of MDPI and/or the editor(s). MDPI and/or the editor(s) disclaim responsibility for any injury to people or property resulting from any ideas, methods, instructions or products referred to in the content.