Article

Seismic Performance of Corroded RC Bridge Piers Strengthened with UHPC Shells

1
Institute of Transportation, Inner Mongolia University, Hohhot 010070, China
2
Inner Mongolia Engineering Research Center of Testing and Strengthening for Bridges, Inner Mongolia University, Hohhot 010020, China
*
Author to whom correspondence should be addressed.
Buildings 2025, 15(21), 3863; https://doi.org/10.3390/buildings15213863 (registering DOI)
Submission received: 5 June 2025 / Revised: 24 August 2025 / Accepted: 8 September 2025 / Published: 26 October 2025
(This article belongs to the Section Building Materials, and Repair & Renovation)

Abstract

Previous studies have investigated the enhancement of the chloride-corrosion resistance of reinforced concrete piers using ultra-high-performance concrete (UHPC) shells. However, these studies did not consider the combined effects of retrofitting time, UHPC shell thickness, and axial loads applied to the piers. To address this research gap, this study conducted numerical simulations, analyzing the seismic performance of retrofitted piers under different UHPC layer thicknesses (30 to 50 mm), service lives (50 to 85 years), and axial compression ratios (8%, 16%, and 24%). First, we briefly outlined the material property degradation characteristics of bridge piers. Then, using rectangular piers as case studies, numerical simulations were conducted on the cyclic performance of corroded piers. The results demonstrated that the strength of piers retrofitted before 70 years, even using a 30 mm thick UHPC shell, was greater than that of pristine RC piers across all axial loadings. For piers retrofitted with a 50 mm thick UHPC shell, the SRPF and SRYF reached about 1.4 and 1.5, respectively. The energy dissipation capacity and stiffness of the UHPC-retrofitted piers increased with the increase in the UHPC thickness and axial compression ratio. The research results of this study offer a useful reference for the seismic retrofitting of corroded piers using UHPC.

1. Introduction

Long-term-service reinforced concrete (RC) bridges sometimes suffer from chloride-induced corrosion, leading to the degradation of the mechanical properties [1] and the bond strength [2] of concrete and reinforcement. As a result, the structural behavior of bridges deteriorates [3,4]. Earthquakes are among the most destructive natural disasters and pose a serious threat to the safety of bridge structures. Their destructive impact on the performance of corroded bridge structures is even greater. Therefore, the impact of corrosion should be considered in the seismic performance assessment of as-built bridges.
As a key component of a bridge, piers are susceptible to chloride ion corrosion. The mechanical performance of corroded bridge piers under simulated seismic loads has attracted the attention of many scholars. Vu and Li [5] conducted cyclic load tests on eight full-size reinforced concrete columns with different axial forces under different degrees of corrosion and verified that the deformation capacity of short columns and shear strength significantly degraded under high-corrosion and high-axial-pressure ratios. Yuan et al. [6] conducted an extensive numerical analysis and compared the seismic performance between corroded and non-corroded piers under bi-directional lateral cyclic loads. They proved that the peak strength of piers with 20% corrosion decreased by 23.6%, 28.9%, 24.2%, 25.8%, and 25.7%, respectively, under UN, RE, EP, AB, and SB load paths. Wang et al. [7] performed quasi-static experiments on a set of five hollow cylindrical piers, each exhibiting varying levels of corrosion and distinct connection techniques. The findings indicated that with the rise in the corrosion rate, there was a decline in the peak load, energy dissipation, and stiffness of the piers, with the reduction in stiffness being especially pronounced. Specifically, compared to the reference samples, the peak loads of the PBP samples with corrosion rates of 8.6% and 16.3% were reduced by 10.6% and 24.1%, respectively, while that of the CIP samples was reduced by 23.9%. Wu et al. [8] examined the seismic behavior of three PC bridge piers with corrosion levels of 0%, 20%, and 40% under quasi-static loading. The research illustrated that both PC0 and PC20 displayed comparable increases in displacement, whereas PC40 had noticeably larger increments. Regarding the ability to dissipate energy, both PC0 and PC20 showed similar effectiveness, exceeding the performance of PC40. According to the measured cyclic curve, Yuan et al. [9] discovered that if the AML of the corroded region is below 8.69, there is little noticeable change. However, a noticeable alteration occurs if the AML surpasses 17.59. The research conducted by Domaneschi et al. [10] gathered existing models on corrosion and chose a bridge overpass to conduct seismic analysis, examining how corrosion and seismic activity jointly affect bridge piers. Yuan et al. [11] introduced an approach to calculate the equivalent elastic modulus for non-uniformly corroded steel bars, taking into account the bond–slip effect. Their results also suggested that the bonding behavior between steel and concrete can notably diminish the energy dissipation ability and residual displacement of a corroded bridge pier. Kashani et al. [12] carried out cyclic tests on reinforced concrete (RC) columns, both corroded and non-corroded, using various reinforcement arrangements. The test findings indicated that corrosion had a more pronounced effect on the reduction in ductility of the specimens compared to the reduction in their strength. Mohsen Bagheri et al. [13] conducted a series of numerical simulations on two types of superstructures and six types of pile raft foundations and systematically investigated and verified that the soil–pile–structure interaction (SSPSI) had a significant impact on the seismic response of structures. In [7], a numerical model was developed using the OpenSees platform to forecast the seismic behavior of deteriorated bridge piers. The material degradation principle was established to model the impact of corrosion. The findings indicated that the suggested numerical approach efficiently captured the performance of bridge piers with various connection styles and degrees of corrosion. Crespi et al. [14] analyzed the impact of corrosion on the seismic performance of RC bridges, taking into account both ductile and brittle collapse mechanisms.
To enhance the seismic resilience of corroded bridge piers, some researchers have used fiber-reinforced polymers (FRPs), engineered cement-based composites (ECCs), and ultra-high-performance concrete (UHPC). Zhou et al. [15] employed FRPs and ECCs to reinforce coastal bridge piers, demonstrating a considerable improvement in their seismic performance. According to the findings from rapid corrosion evaluations and recurrent testing, Jia et al. [16] confirmed that employing CFRP sheaths can considerably enhance the displacement ductility and decrease the residual displacement of corroded piers. UHPC possesses exceptional strength and corrosion resistance, offering an efficient solution for reinforcing bridge piers affected by corrosion. Fu et al. [17] employed UHPC and HTRB600E high-strength steel bars to enhance the cross-section of cast-in-place square piers experiencing significant bending damage. Zhang and colleagues [18] focused on utilizing UHPC jackets to reinforce existing bridge piers made of reinforced concrete. The research demonstrated that the UHPC-N jacket enhanced the ductility of concrete, simultaneously mitigating the effect of initial concrete damage on the structure’s seismic performance. The studies in [19,20] evaluated and discussed how the corrosion levels and heights of UHPC jackets affect the mechanical properties and seismic behavior of pier columns. The findings indicated that the steel bars in the UHPC regions experienced a lower level of corrosion compared to those in the normal-strength concrete sections of the samples. The application of UHPC jackets altered the curvature distributions and damage patterns of the corroded RC piers, resulting in enhancements in strength and stiffness. The aforementioned studies offer significant insights into the seismic strengthening of corroded RC columns using UHPC shells. As shown in Figure 1, a UHPC shell enhances the mechanical properties, boosting the seismic resilience of corroded bridge piers. However, research on the seismic performance of UHPC shell-reinforced bridge piers remains limited in several aspects: there is a lack of data from bridge piers undergoing retrofitting at different service-life stages, the mechanisms of action for UHPC shells of varying thicknesses in the seismic retrofitting of corrosion-damaged piers require further investigation, and the impact of axial load ratios on the seismic performance of UHPC-retrofitted piers remains unclear. This study employs numerical simulations to evaluate the seismic performance of numerous bridge piers with diverse characteristics, providing substantial data samples for research on UHPC shell reinforcement. It also addresses the previous gaps in studies regarding axial load ratios, UHPC shell thickness variations, and other material properties of different pier types.
This study conducts numerical simulations to investigate the seismic performance of UHPC-wrapped bridge piers, considering the influence of axial compression ratios and corrosion levels. The research results provide a scientific foundation for the seismic retrofitting of RC bridge piers. Section 2 briefly introduces the degradation model of the mechanical properties of reinforcement and concrete and presents the constitutive model of UHPC. In Section 3, numerical simulation methods are used to analyze the cyclic performance of typical corroded bridge piers retrofitted with UHPC. Finally, Section 4 summarizes the main conclusions.

2. Corrosion and Material Properties

2.1. The Starting Time of the Corrosion

In an environment with high chloride ion content, the pier is threatened by corrosion. Chloride ions penetrate the concrete protective layer and gradually reach the surface of the steel bar. When the chloride ion content accumulates to a certain value, the passivation film of the steel bar is dissolved, and the steel bar begins to undergo chlorination corrosion. The initiation time for the corrosion process, referred to as tini, can be estimated using Equation (1) [21]:
t ini = c 2 4 D c e r f 1 C 0 C cr C 0 2
In this equation, c represents the thickness of the concrete protective layer, C0 denotes the stabilized chloride ion concentration, Dc is the diffusion coefficient for chloride ions, and Ccr stands for the threshold chloride ion concentration.

2.2. Deterioration of Steel Bars

As corrosion initiates, the steel bar’s cross-sectional area reduces. Considering the adverse effects of corrosion pits on the steel bar, the corroded cross-sectional area, Apit (t), of the steel bar can be expressed as shown in Equation (2) [22]:
A pit ( t ) = A 1 + A 2 , p ( t ) 2 2 d 0 π d 0 2 4 A 1 + A 2 , 2 2 d 0 p ( t ) d 0 π d 0 2 4 , p ( t ) > d 0
where the parameters A1 and A2 can be calculated using Formulas (3) and (4):
A 1 = 1 2 × 2 arcsin 2 p ( t ) 1 p ( t ) d 0 2 d 0 d 0 2 2 2 p ( t ) 1 p ( t ) d 0 2 d 0 2 p ( t ) 2 d 0
A 2 = 1 2 × 2 arcsin 2 p ( t ) 1 p ( t ) d 0 2 2 p ( t ) p ( t ) 2 2 p ( t ) 1 p ( t ) d 0 2 p ( t ) 2 d 0
where d0 represents the diameter of the steel bar prior to corrosion, and p(t) signifies the depth of the pitting corrosion affecting the reinforcement at time t, which can be calculated using Equation (5) [3]:
p ( t ) = 0.0116 i corr ( t t ini ) R pit
where Rpit represents the amplification factor associated with pit corrosion, and icorr denotes the corrosion current density.
As the geometric dimensions reduce, the mechanical characteristics of the reinforcing steel diminish, which is expressed in Equations (6) and (7) [23,24]:
f y ( t ) = 1 0.005 Q corr ( t ) f y 0
Q corr ( t ) = ( A pit ( t ) / A s 0 ) × 100
where Qcorr(t) represents the ratio of the mass loss of the corroded reinforcement, which originally had a cross-sectional area of As0 and an initial yield strength of fy0. fy(t) represents the tensile resistance of the compromised reinforcement.

2.3. Deterioration of Concrete

The deterioration of the reinforcement causes the concrete surface to crack. Consequently, the structural integrity of the concrete cover deteriorates. Based on existing studies [25,26], the following piecewise function is adopted to quantify the strength of the concrete cover:
f c ( t ) = f c 0 1 + K ε 1 ( w cr ( t ) ) / ε c 0 w cr ( t ) < 1   mm 0 w cr ( t ) 1   mm
In this equation, fc0 represents the original concrete’s compressive strength, and εc0 signifies the average tensile strain observed in damaged concrete with a crack width of ε 1 ( w cr ( t ) ) . The equation used to calculate wcr(t) is as follows (9) [25]:
w cr ( t ) = k w δ s ( t ) δ s 0 A s 0
The corrosion ratio of steel at the onset of concrete cracking is represented by δ s 0 , while δ s ( t ) represents the percent decrease in the cross-sectional area of the corroded steel.
Corrosion of the stirrups leads to a reduction in the confinement effect. The mechanical behavior of the degraded core concrete can be quantified by determining the yield stress and cross-sectional area of the corroded stirrups utilizing the Mander model [27].

2.4. Material Properties of UHPC

UHPC has better compressive and tensile behavior than normal concrete. To investigate the retrofitting efficiency of corroded bridge piers with UHPC shells, the mechanical properties of UHPC should be introduced. In [28], a piecewise function was used to describe the compressive behavior of UHPC. In this study, the constitutive model for concrete is also applied to UHPC. Furthermore, the fundamental physical properties of ultra-high-performance concrete include a compressive strength of 120 MPa, a peak strain of 0.003, an ultimate strain of 0.007, a density typically around 2500 kg/m3, and exceptional impermeability with a permeability coefficient generally below 1 × 10⁻¹² m/s, effectively resisting infiltration by corrosive media.

3. Illustrative Example of a Corroded Bridge Pier Retrofitted with a UHPC Shell

3.1. Description of the Bridge Pier

This research focuses on a representative bridge situated in California for examination [29]. Figure 2 illustrates the measurements of the bridge pier column. The pier column’s dimensions are as follows: the clear height of the abutment is 7.43 m, the width of the bridge deck is 9.78 m, and the cross-section size is 1829 mm × 1219 mm. The pier is equipped with 42 longitudinal bars with a diameter of 36 mm and stirrups with a spacing of 100 mm and a diameter of 14 mm. The initial yield strength of the stirrups and longitudinal steel bars is 465 MPa. The thickness of the concrete cover is 50.8 mm, and the compressive strength is 29.3 MPa. To examine how different UHPC protective layer thicknesses affect the performance of bridge piers, the thicknesses of the UHPC shells are set at 30 mm, 40 mm, and 50 mm, respectively. The compressive strength of the UHPC is 120 MPa. The bridge is located in a corrosive environment. Based on existing studies [30,31,32], the corrosion parameters are selected as follows: Ccr is 0.9 kg/m3, C0 is 2.95 kg/m3, Dc is 2 × 10⁻⁸ cm2/s, and Icorr is 3 μA/cm2. Rpit is set to 6 in this study.

3.2. Numerical Model of the Bridge Pier Under Cyclic Loading

In previous studies [20,33], numerical models of UHPC shell-strengthened and corroded pier columns were established using OpenSees software [34] and verified with experimental results. Although OpenSees software has relatively lower computational efficiency, it demonstrates strong nonlinear analysis capabilities, a comprehensive suite of unit and analysis functions, and is specifically designed for seismic engineering scenarios, making it well-suited for this research [35]. Therefore, this study utilizes the OpenSees platform to simulate the seismic performance of reinforced concrete piers. By applying time-dependent material degradation models for steel and concrete, along with constitutive models for ultra-high-performance concrete, we established a fiber-reinforced section model for rectangular piers, as shown in Figure 3. The Steel02 model was used to simulate steel reinforcement, while the Concrete01 model represented concrete and UHPC shells. The red dots on the right side of the diagram indicate nodes, and the green dots denote integration points. Axial loads and horizontal cyclic loads were applied at the top of the pier.
In this study, a unilateral cyclic load displacement test was adopted during the loading process. For the first eight displacement amplitudes, they were increased from 18.75 mm to 150 mm in increments of 18.75 mm. After that, the displacement amplitudes were increased in intervals of 37.5 mm until the pier failed. Each displacement amplitude was repeated twice.

3.3. Hysteresis Curves

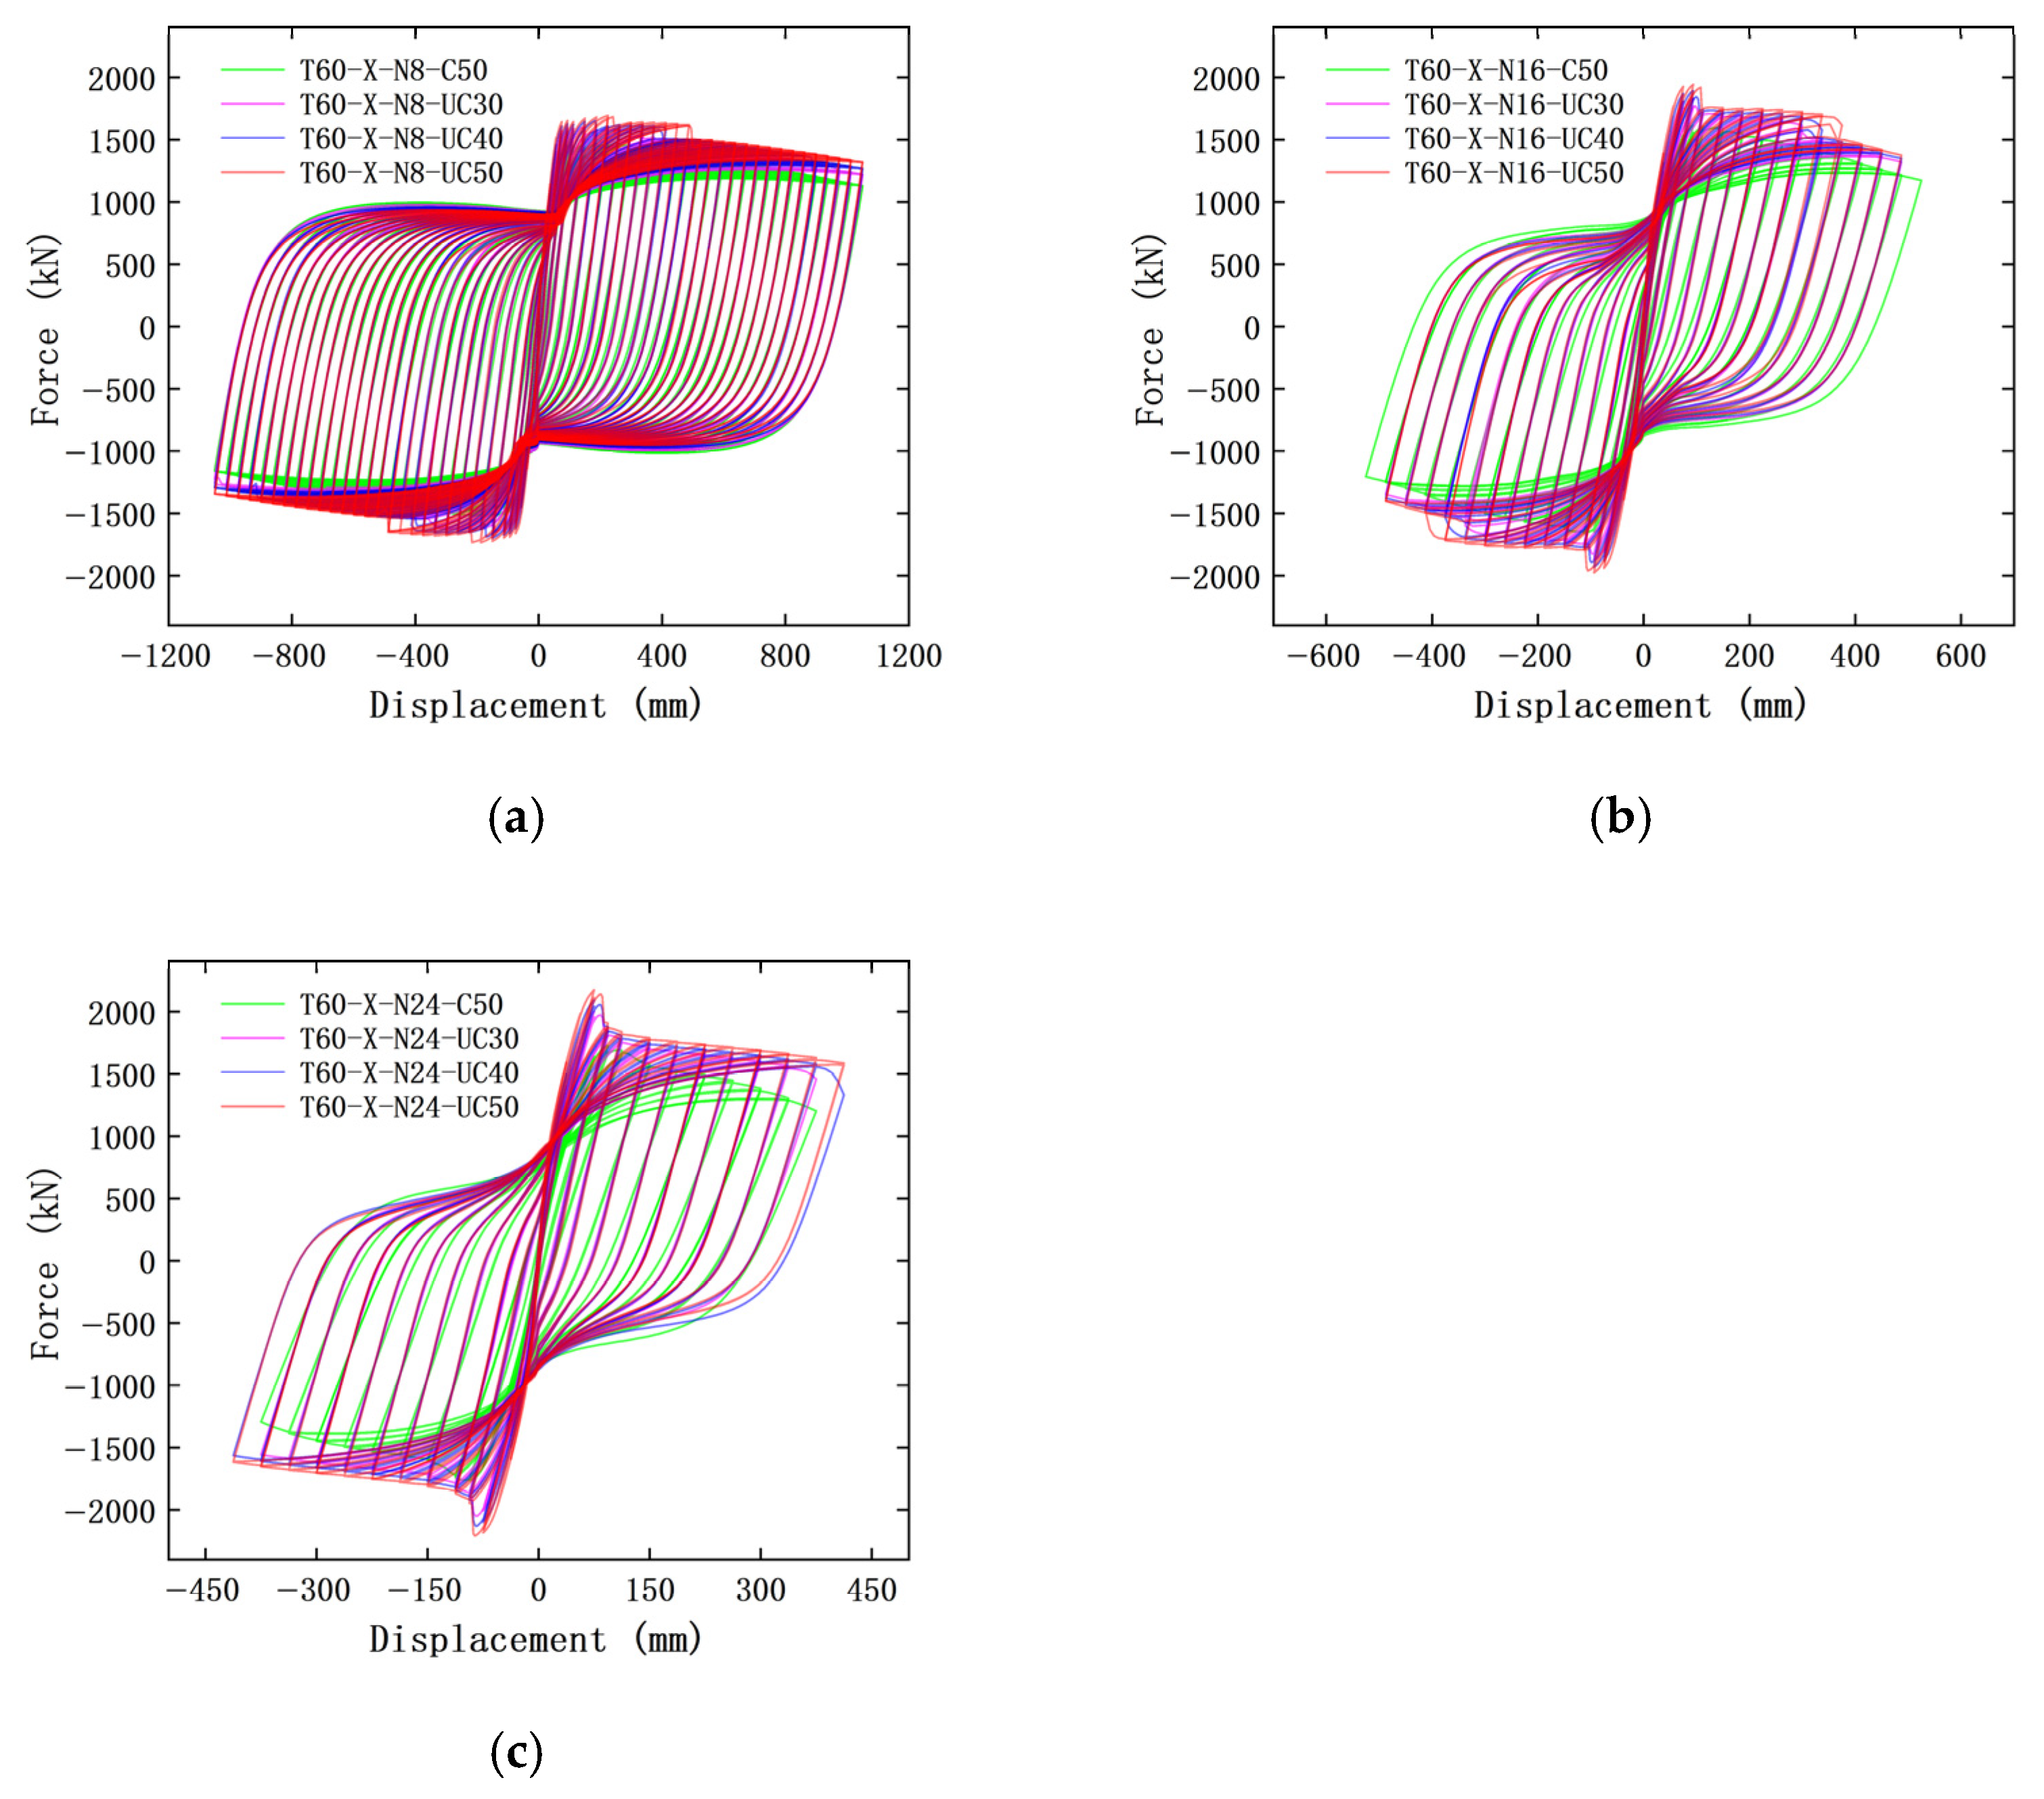
In order to study improvements in pier performance from using UHPC as a protective layer, hysteresis curves for axial compression ratios of 8%, 16%, and 24% under the combined effects of load and corrosion were obtained over service lives ranging from 0 to 90 years. When the service life is between 0 and 50 years, the performance degradation of the pier is not obvious. So, this study starts from 50 years and conducts simulation research at time intervals of 10 years. Due to space limitations, only the cyclic curves for three different axial compression ratios at a service life of 60 years are shown in Figure 4. According to Figure 4, the lateral force of the pier increases with increasing deformation, and the hysteresis performance varies with the axial compression ratio. It can be seen in Figure 4 that when the displacement is the same (e.g., 200 mm), a decrease in the axial compression ratio corresponds to a lower applied force and weaker hysteresis performance in terms of strength. In addition, Figure 4 shows that the hysteresis performance of the pier improves significantly when UHPC is used as the protective layer material. Moreover, as the thickness of the protective layer of the pier decreases, the area of the hysteresis shrinkage loop decreases and the strength is reduced.
In order to study improvements in seismic performance from using UHPC shells for piers with different levels of corrosion, hysteresis curves of piers with an axial compression ratio of 16% and a protective layer of either 50 mm ordinary concrete or 50 mm UHPC as the protective layer were obtained, as shown in Figure 5. As shown in Figure 5, the corrosion grade of bridge piers increases with service life. The peak forces of both types of piers decrease, and the corresponding displacements during loading also diminish. The area of the shrinkage loop decreases over time, while the strength declines progressively. However, within the 0–50-year service-life period, the reduction in the shrinkage loop area remains minimal, indicating no significant deterioration in the piers’ hysteresis performance. Furthermore, by comparing Figure 5a,b, we observe that the peak forces in the hysteresis curves of bridge piers with UHPC as the protective layer reach 2000 kN, which are significantly higher than those of piers with conventional concrete. Consequently, the area under the hysteresis curve of the former is notably larger than that of the latter. This demonstrates that the application of UHPC as a protective layer plays a significant role in enhancing the seismic performance of bridge piers.

3.4. Strength and Deformation Capacity

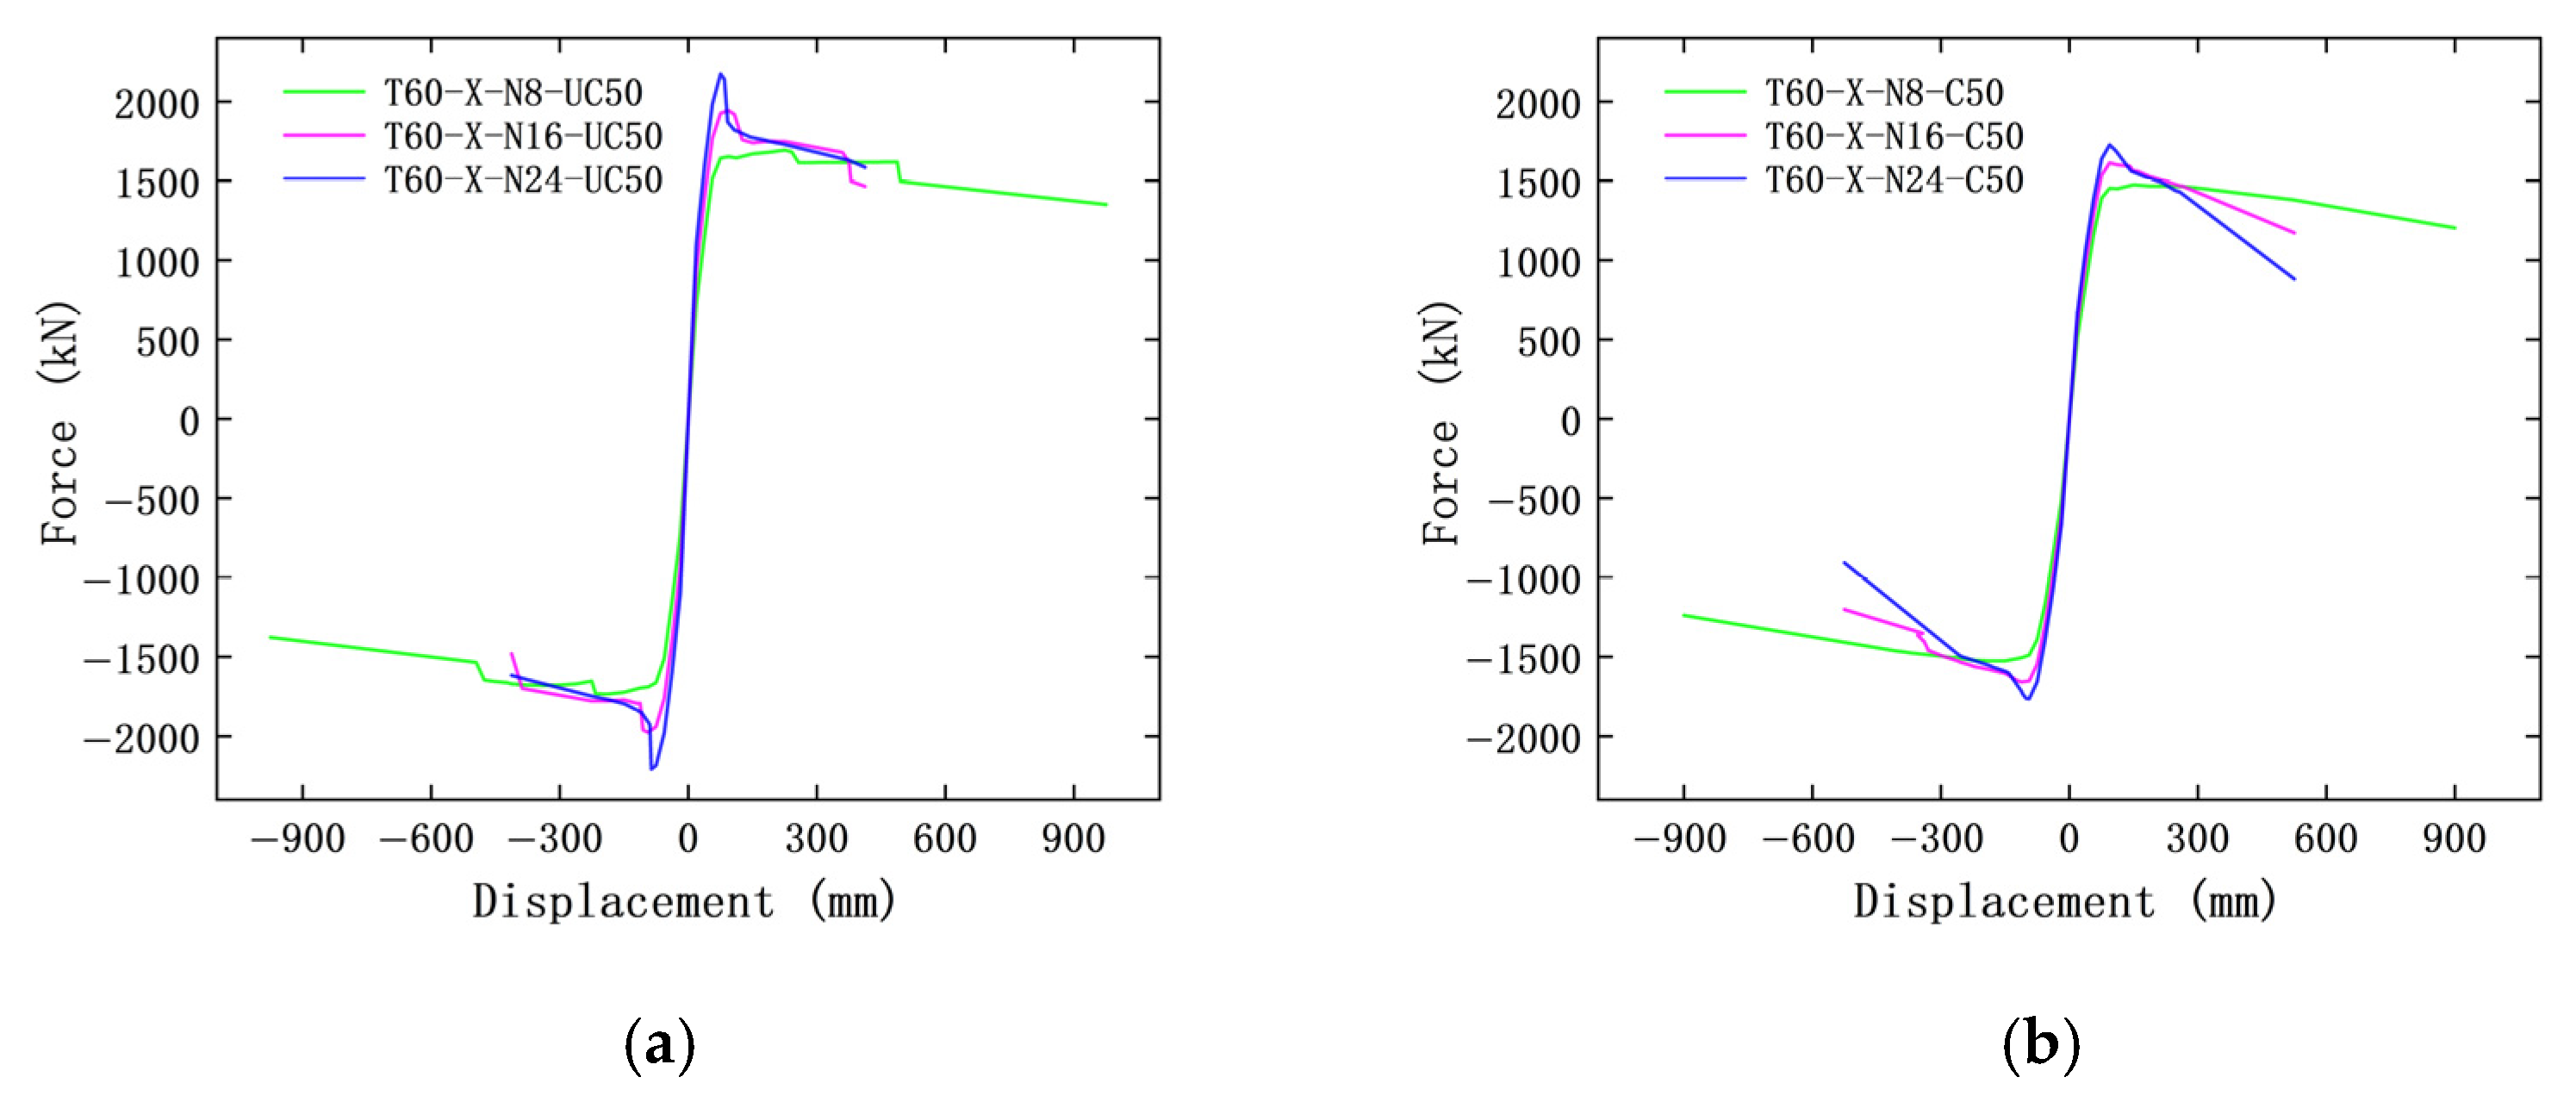
Based on the cyclic curves, the skeleton curves of the corroded bridge pier were determined. Figure 6 shows the skeleton curves for axial compression ratios of 8%, 16%, and 24% when the service life of the pier is 60 years. Taking the positive value of the skeleton curve displacement for analysis, it can be seen in Figure 6 that the use of UHPC as the protective layer significantly improves the strength of the bridge pier. By comparing a 50 mm UHPC shell cover with a 50 mm ordinary concrete cover as the protective layer, it is evident that the former results in greater pier strength. And as the thickness of the protective layer decreases, the peak force of the skeleton curve decreases, and the strength declines.
Similarly, in order to study the effect of time on the strength and deformation of bridge piers, hysteresis curves for bridge piers with an axial compression ratio of 16% and a protective layer of either 50 mm ordinary concrete or 50 mm UHPC were obtained, as shown in Figure 7. It can be seen in Figure 7 that, with the increase in time, the peak forces of the skeleton curves for these two types of bridge piers decrease, but the strength attenuation trends are basically the same.
Figure 8 shows the hysteresis curves for piers with either 50 mm ordinary concrete or 50 mm UHPC as the protective layer (service life of 60 years), illustrating how the axial compression ratio and the use of UHPC influence bridge pier performance. As can be seen in Figure 8, with the increase in the axial compression ratio, the peak forces of both skeleton curves increase. With the increase in the axial compression ratio, the downward trends of both skeleton curves become more pronounced, and the strength attenuation trends also increase with the increase in the axial compression ratio.
To evaluate the effect of increasing corrosion over time on pier performance, the residual yield force YF(t), residual peak force PF(t), and residual ultimate displacement UD(t) (displacement at the point of 85% peak force) were obtained over time using skeleton curves. Additionally, the scaled residual yield force SRYF(t), scaled residual peak force SRPF(t), and scaled residual ultimate displacement SRUF(t) were determined using the following equations:
S R Y F ( t ) = Y F ( t ) / F y
S R P F ( t ) = P F ( t ) / F p
S R U F ( t ) = U F ( t ) / D u
where Fy, Fp, and Du are the residual yield force, residual peak force, and residual final displacement of piers with a 50 mm ordinary concrete protective layer, an axial compression ratio of 16%, and a service life of 0 years.
The calculated results are shown in Figure 9. It can be seen in Figure 9 that, as the service life of the bridge pier increases, the SRYF and SRPF of the bridge pier do not change significantly when the service life is between 0 and 50 years. However, when the service life of the bridge pier is between 50 and 90 years, due to the increase in corrosion damage, the SRYF and SRPF of the bridge pier change significantly.
When using 50 mm ordinary concrete as the protective layer, the SRYF decreases from 1 to 0.807, representing a 19.3% reduction with an annual change rate of 0.483%. The SRPF drops from 1 to 0.813, representing an 18.7% decrease and an annual change rate of 0.468% (based on the 50–90-year period studied). For piers protected with a 50 mm ultra-high-performance concrete (UHPC) layer, the SRYF falls from 1.150 to 0.973, representing a 17.7% reduction with an annual change rate of 0.44%. The SRPF decreases from 1.157 to 0.991, marking a 16.6% reduction and an annual change rate of 0.415%. When the UHPC layer thickness reaches 40 mm, the SRYF drops from 1.125 to 0.950, representing a 17.5% decrease with an annual change rate of 0.438%, while the SRPF declines from 1.123 to 0.967, showing a 15.6% reduction and an annual change rate of 0.39%. For piers with a 30 mm UHPC layer, the SRYF decreases from 1.118 to 0.924, representing a 19.4% reduction with an annual change rate of 0.485%, whereas the SRPF falls from 1.113 to 0.938, representing a 17.5% decrease and an annual change rate of 0.437%.
In summary, when the service life of bridge piers is between 50 and 90 years, due to increased corrosion damage, the degree and trend of decreases are similar for the SRPF and SRPF.
A comparison of the SRYF and SRPF values of different types of piers is shown in Figure 9, The results indicate that when the protective layer material is the same, the SRYF and SRPF decrease as the thickness of the protective layer decreases. When the shell thickness is 50 mm, piers with UHPC as the protective layer have SRYF and SRPF values that are 15% and 16% higher than those of piers with ordinary concrete. For example, at a service life of 80 years, the SRYF and SRPF of the UHPC-protected pier are 1.024 and 1.037, respectively, which are still higher than those of the ordinary-concrete-protected pier at a service life of 0 years.
Even when the thickness of the protective layer is reduced, within a certain thickness range (Figure 9 shows the SRYF and SRPF values of piers with 30 mm and 40 mm UHPC as the protective layer), the SRYF and SRPF values of piers with UHPC as the protective layer are still higher than those of piers with ordinary concrete as the protective layer. The SRYF and SRPF values of piers with 40 mm UHPC as the protective layer are 1.051 and 1.056, respectively, when the service life is 70 years, and the SRYF and SRPF values of piers with 30 mm UHPC as the protective layer are 1.013 and 1.017, respectively, when the service life is 70 years, which are still higher than the values of piers with 50 mm ordinary concrete as the protective layer when the service life is 0 years. Therefore, it can be concluded that using UHPC as the protective layer has an important effect on improving the seismic performance of bridge piers. Figure 9c shows that the deformation capacity of corroded piers decreases due to corrosion. For retrofitted piers, the deformation capacity does not appear to decrease. The reason is that the UHPC shell improves the deformation capacity of the piers. The difference in mechanical behavior between ordinary concrete and UHPC also results in the irregular trend observed in UHPC-retrofitted bridge piers.
In a similar manner, to assess how the degree of corrosion affects pier performance with increasing axial compression ratio, the residual yield force YF(t), residual peak force PF(t), and residual ultimate displacement UD(t) (the displacement at 85% of the peak force) were determined using skeleton curves. The scaled residual yield force SRYF(t), scaled residual peak force SRPF(t), and scaled residual ultimate displacement SRUF(t) were then derived using Formulas (10)–(12), where Fy, Fp, and Du are the residual yield force, residual peak force, and residual ultimate displacement of piers with a 50mm ordinary concrete protective layer, an axial compression ratio of 8%, and a service life of 60 years.
Figure 10 shows the calculation results. From the line connecting the calculation results, it can be clearly concluded that the SRYF and SRPF values of the pier increase with increasing axial compression ratio. The SRYF and SRPF values of different types of piers are compared in the figure: when the protective layer material is the same, the SRYF and SRPF values decrease as the shell thickness decreases. When the thickness of the protective layer is 50 mm, the pier with UHPC as the protective layer has SRYF and SRPF values that are 16% and 13% lower than those of the pier with ordinary concrete as the protective layer under the same axial compression ratio. When the axial compression ratio of the UHPC-protected pier is 24%, the SRYF and SRPF values are 1.139 and 1.147, respectively, which are still lower than the SRYF and SRPF values of the ordinary-concrete-protected pier when the axial compression ratio is 8% (1.160 and 1.150).
Even when the thickness of the protective layer is reduced within a certain thickness range (Figure 10 shows the SRYF and SRPF values of piers with 30 mm and 40 mm UHPC as the protective layer), the SRYF and SRPF values of piers with UHPC as the protective layer are still significantly higher than those of piers with ordinary concrete as the protective layer. The SRYF and SRPF values of piers with 40 mm UHPC as the protective layer are 1.237 and 1.284, respectively, when the axial compression ratio is 16%, and the SRYF and SRPF values of piers with 30 mm UHPC as the protective layer are 1.197 and 1.240, respectively, when the axial compression ratio is 16%. These values are still higher than those of piers with 50 mm ordinary concrete as the protective layer when the axial compression ratio is 24%. Therefore, it can be concluded that using UHPC as the protective layer significantly improves the performance of bridge piers. In Figure 10, it can be seen that the SRUF value of the bridge pier generally shows a downward trend as the axial compression ratio increases, but there is no obvious regularity in the SRUF value of the bridge pier between different protective layer thicknesses and materials.

3.5. Energy Dissipation Capacity

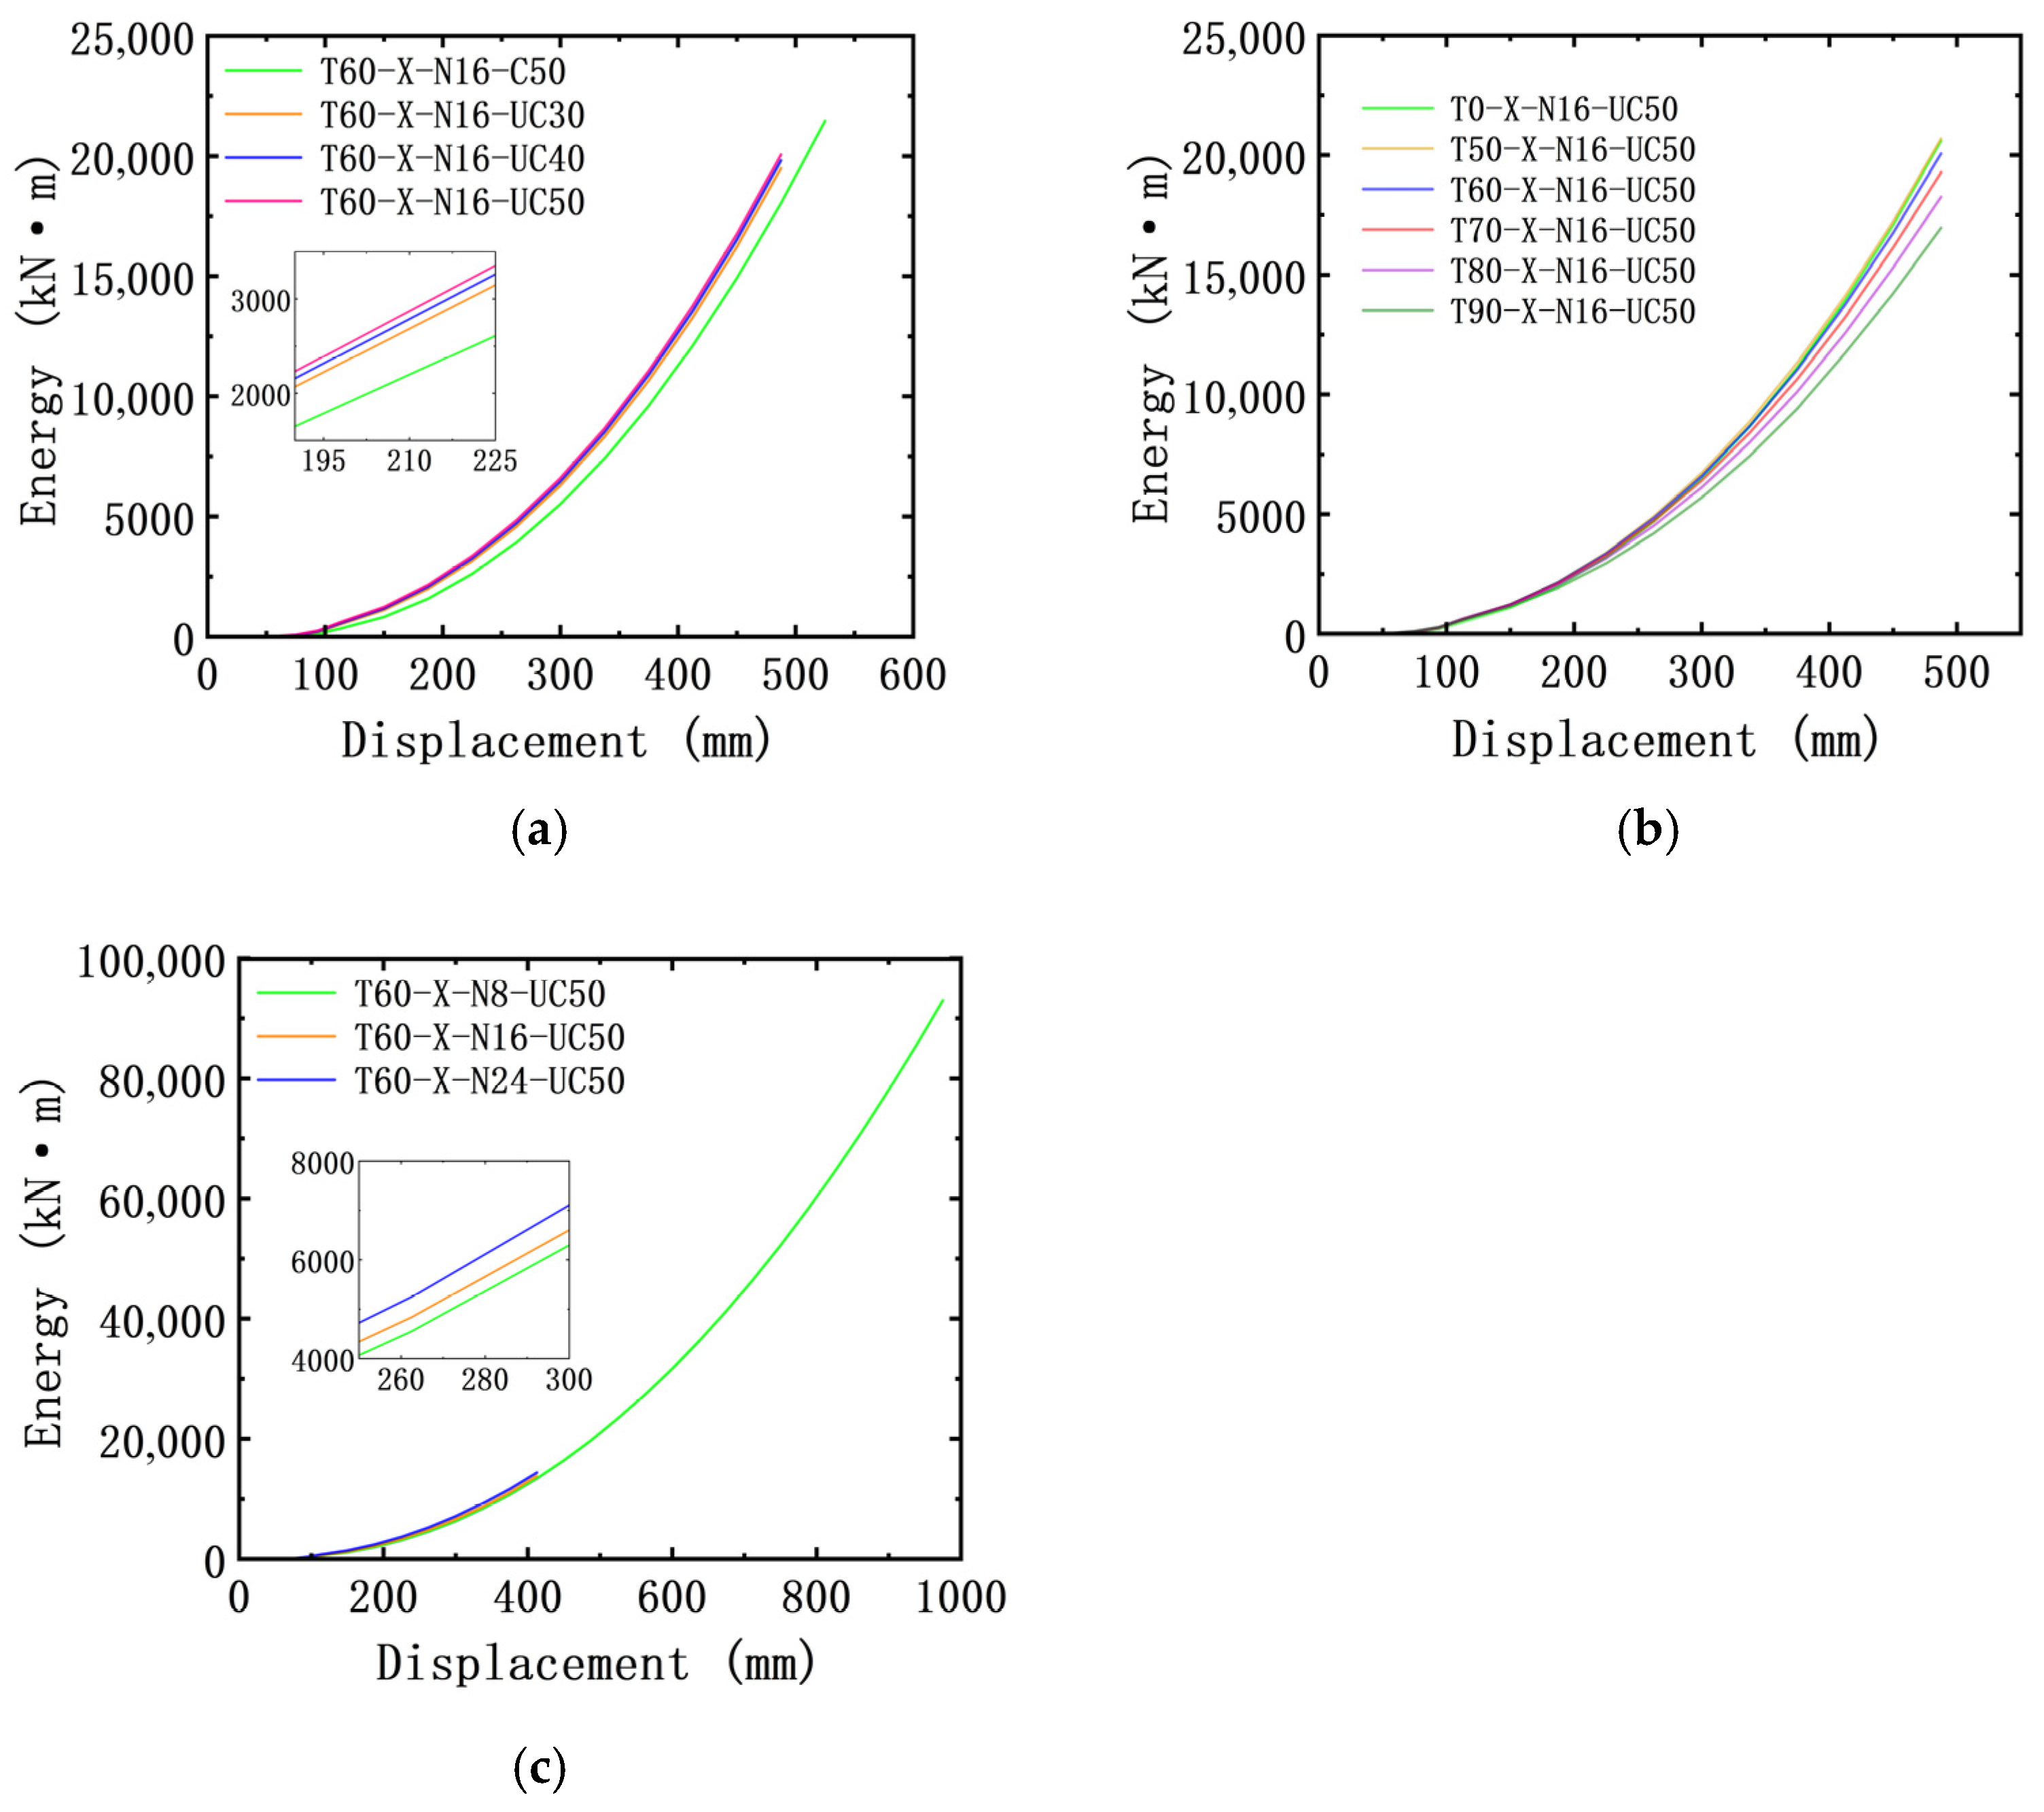
The ability of a pier structure to dissipate energy is indicated by the enclosed area within its hysteresis curve. Figure 11a presents a comparison of the cumulative energy dissipation for piers with various protective layer materials and thicknesses at an axial compression ratio of 16%. If the material used for the protective layer remains unchanged, a reduction in thickness leads to diminished energy dissipation capacity of the pier. When the protective layer is 50 mm thick, a pier with UHPC as the protective material is compared with one built using standard concrete. Using a displacement of 225 mm as an example, the cumulative energy dissipation of the former is calculated to be 3351.423 kN m, while that of the latter is 2608.567 kN m. The former is 1.28 times greater, showing a much higher ability to dissipate energy compared to the latter. Even when the thickness of the protective layer is decreased, as long as it remains within a specific range (Figure 11 presents the energy dissipation capacity of the pier with 30 mm and 40 mm UHPC as the protective layer), the energy dissipation capacity of a pier with UHPC as the protective material is markedly superior compared to the alternative. Applying UHPC as a protective covering can greatly enhance the efficiency of bridge piers.
To examine the impact of time on the energy dissipation capacity of bridge piers, a cumulative energy dissipation graph for piers with an axial compression ratio of 16% and a 50 mm thick UHPC protective layer was obtained, as illustrated in Figure 11b. The cumulative energy dissipation at a displacement of 487.5 mm was selected for quantitative analysis. The cumulative energy dissipation values of bridge piers for service lives of 0, 50, 60, 70, 80, and 90 years are 19,246.72725, 19,232.94322, 18,038.47589, 17,600.53771, 16,752.943, and 15,592.975 kN·m, respectively. From the above figure and the data, it can be seen that when the service life of these bridge piers is between 0 and 50 years, the energy dissipation capacity does not decrease significantly with increasing time. When the service life exceeds 50 years, the energy dissipation capacity decreases significantly with increasing time.
To study improvements in pier performance under the influence of the axial compression ratio and the use of UHPC as a protective layer, cumulative energy dissipation curve for a pier with a service life of 60 years and a protective layer of 50 mm UHPC was obtained, as shown in Figure 11c. A displacement of 262.5 mm was selected for quantitative analysis. When the axial compression ratios are 8%, 16%, and 24%, the cumulative energy dissipation values of the pier are 4551.040, 4835.252, and 5249.981 kN.m, respectively. When the axial compression ratios are 16% and 24%, the cumulative energy dissipation values are 1.062 and 1.153 times those at an axial compression ratio of 8%. From the figure and the above analysis, it can be seen that with an increase in the axial compression ratio, the energy dissipation capacity of the two skeleton curves increases.

3.6. Stiffness

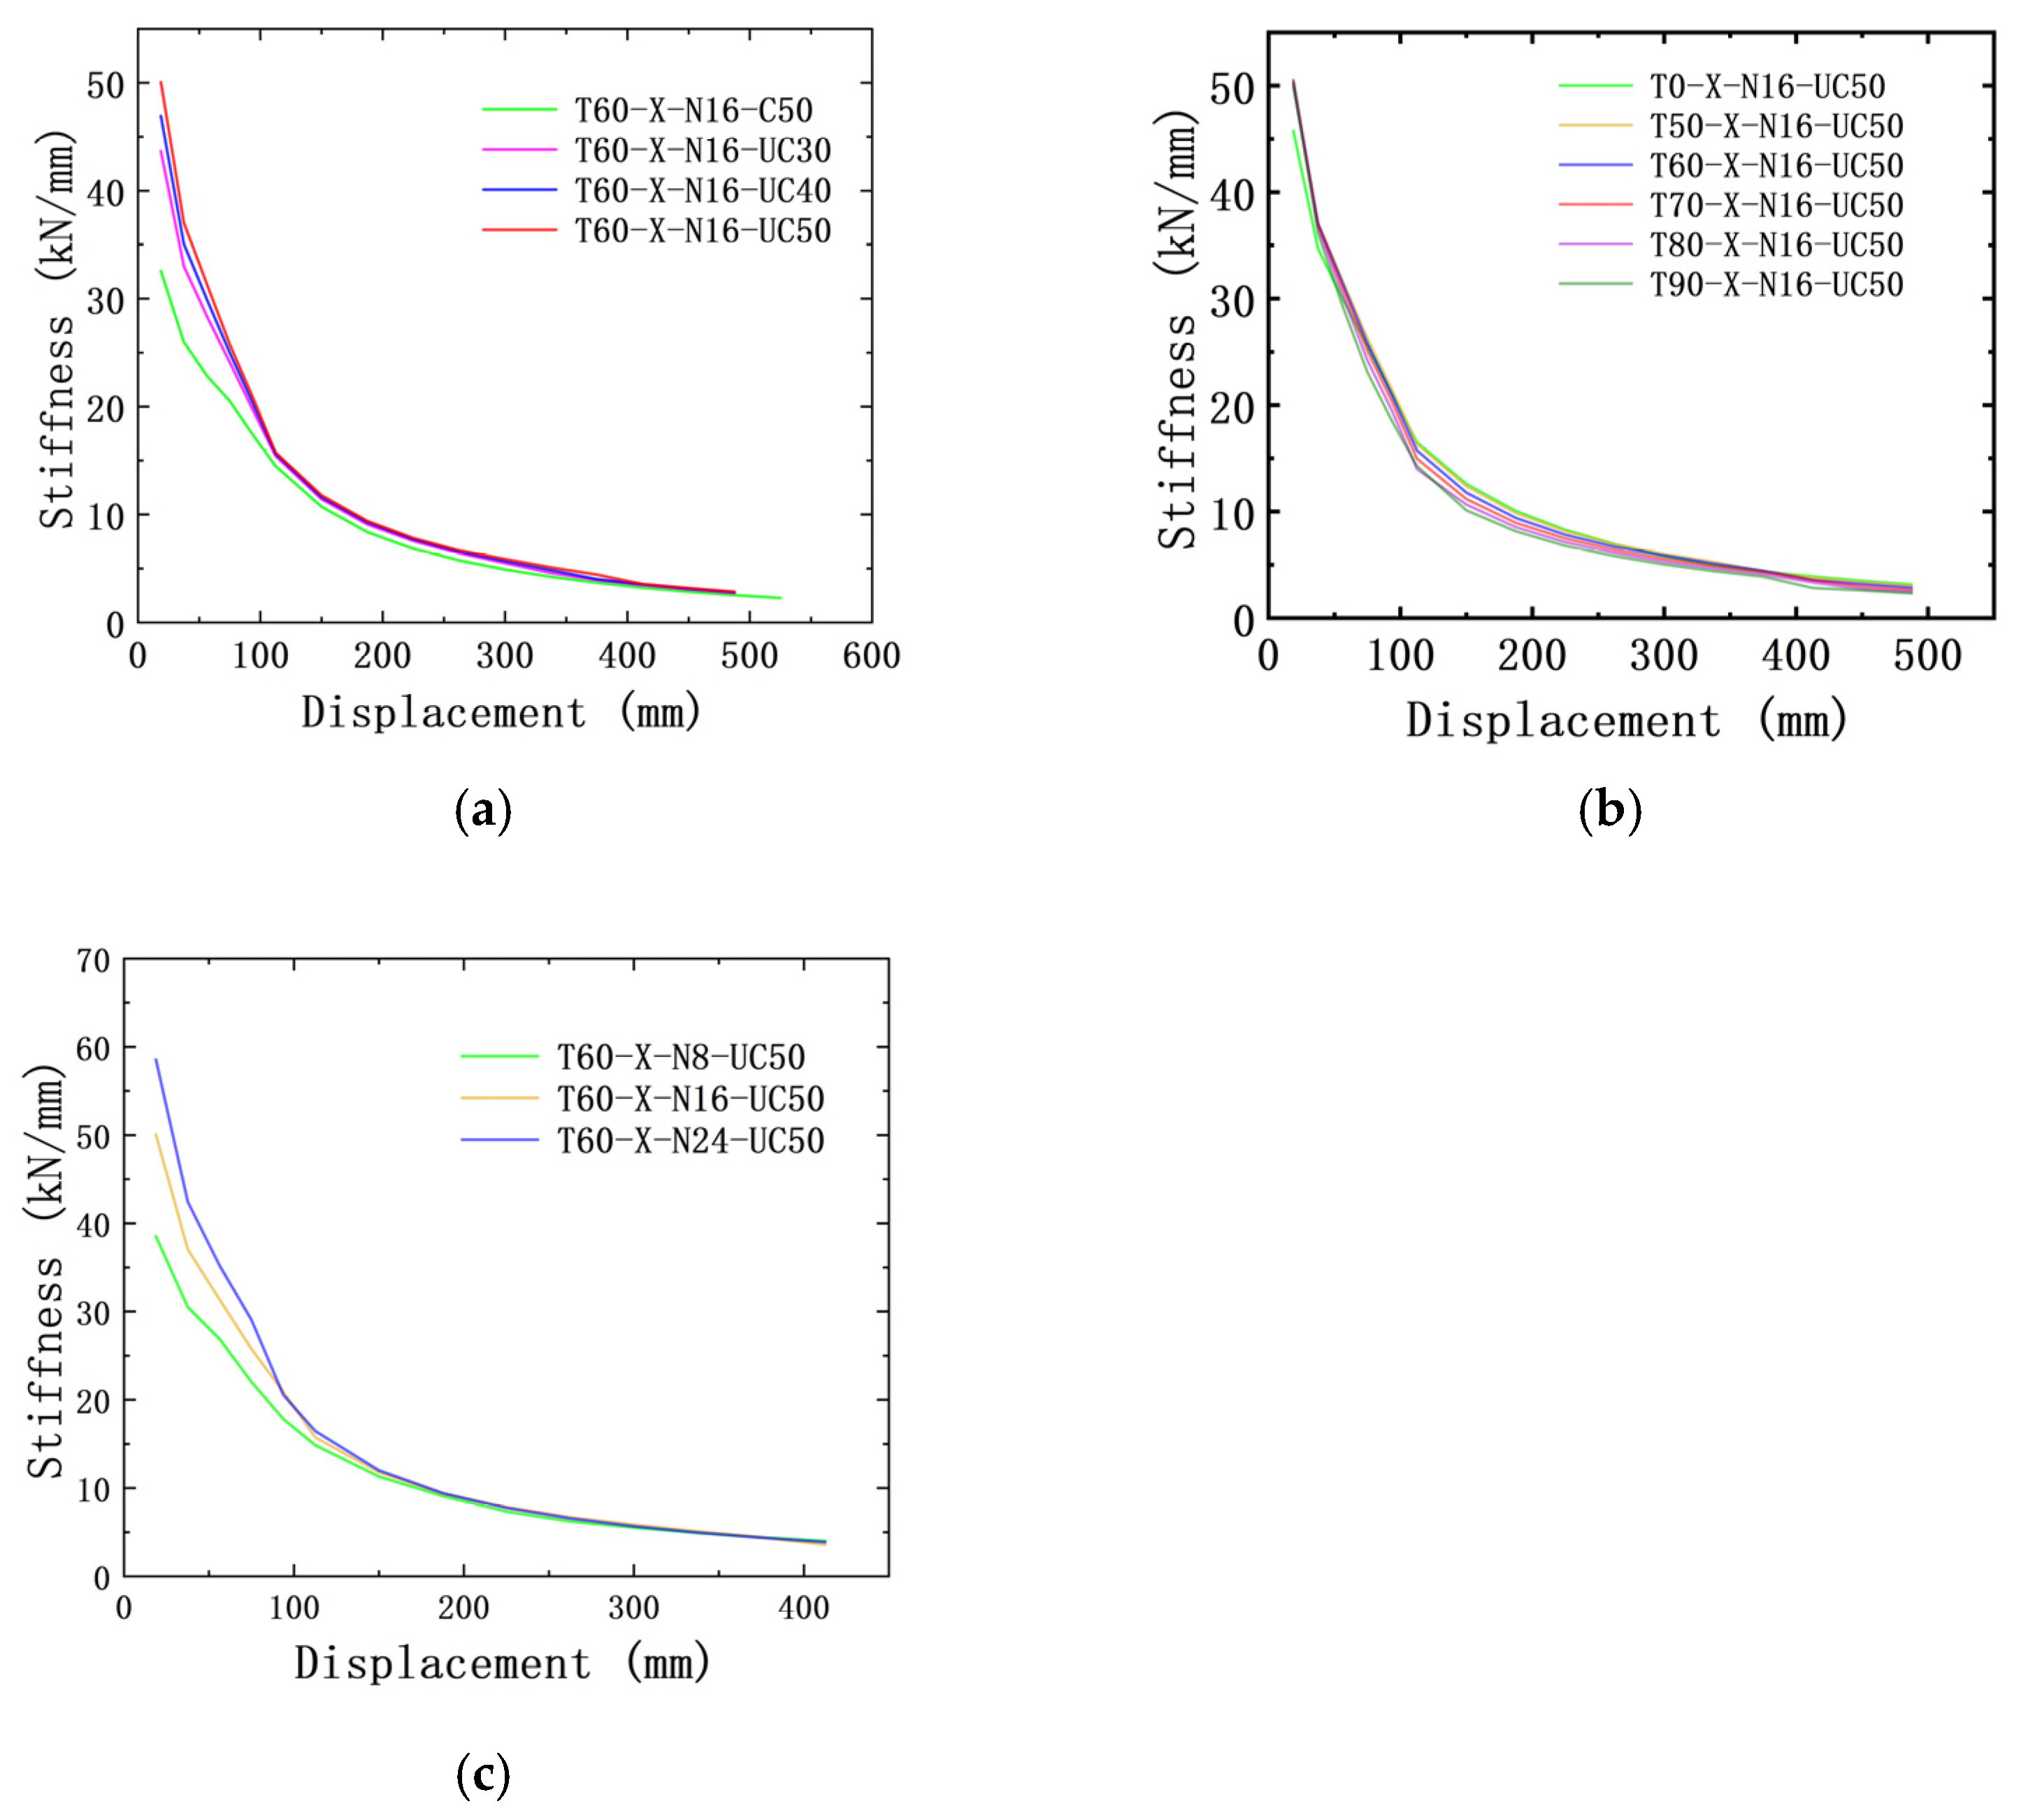
Stiffness is an important indicator for studying the performance of bridge piers. Figure 12a compares the stiffness of bridge piers with different protective layer types and thicknesses at an axial compression ratio of 16%. When the protective layer material is the same, the stiffness of the pier decreases as the protective layer thickness decreases. Using a displacement of 75 mm as an example, the stiffness of the bridge pier with 50 mm UHPC as the protective layer material is 22.034 kN/mm, and that of the one using 50 mm ordinary concrete is 18.516 kN/mm. The stiffness of the former is significantly higher than that of the latter. Even when the thickness of the protective layer is reduced within a certain range (Figure 12a shows the stiffness values of bridge piers with 30 mm and 40 mm UHPC as the protective layer), the stiffness of the bridge pier with UHPC as the protective layer material is still significantly higher than that of the one using ordinary concrete. Using UHPC as a protective layer has a significant effect on improving the overall stiffness performance of bridge piers.
Similarly, to study the influence of service life on the stiffness of bridge piers, stiffness curves for bridge piers with an axial compression ratio of 16% and a protective layer of 50 mm UHPC were obtained, as shown in Figure 12b. The stiffness at a displacement of 487.5 mm was selected for quantitative analysis. The stiffness values of the bridge piers are 8.289, 8.164, 7.836, 7.485, 7.146, and 9.799 kN·m for service lives of 0, 50, 60, 70, 80, and 90 years, respectively. From Figure 12b and the data, it can be seen that when the service life of these bridge piers is between 0 and 50 years, the stiffness decreases as the service life increases.
To study improvements in pier performance under the influence of the axial compression ratio and the use of UHPC as a protective layer, the stiffness curves for piers with a service life of 60 years and a protective layer of 50 mm UHPC were obtained, as shown in Figure 12c. It can be clearly seen in the figure that the greater the axial compression ratio of the pier, the greater the stiffness.

3.7. Equivalent Viscous Damping Coefficient

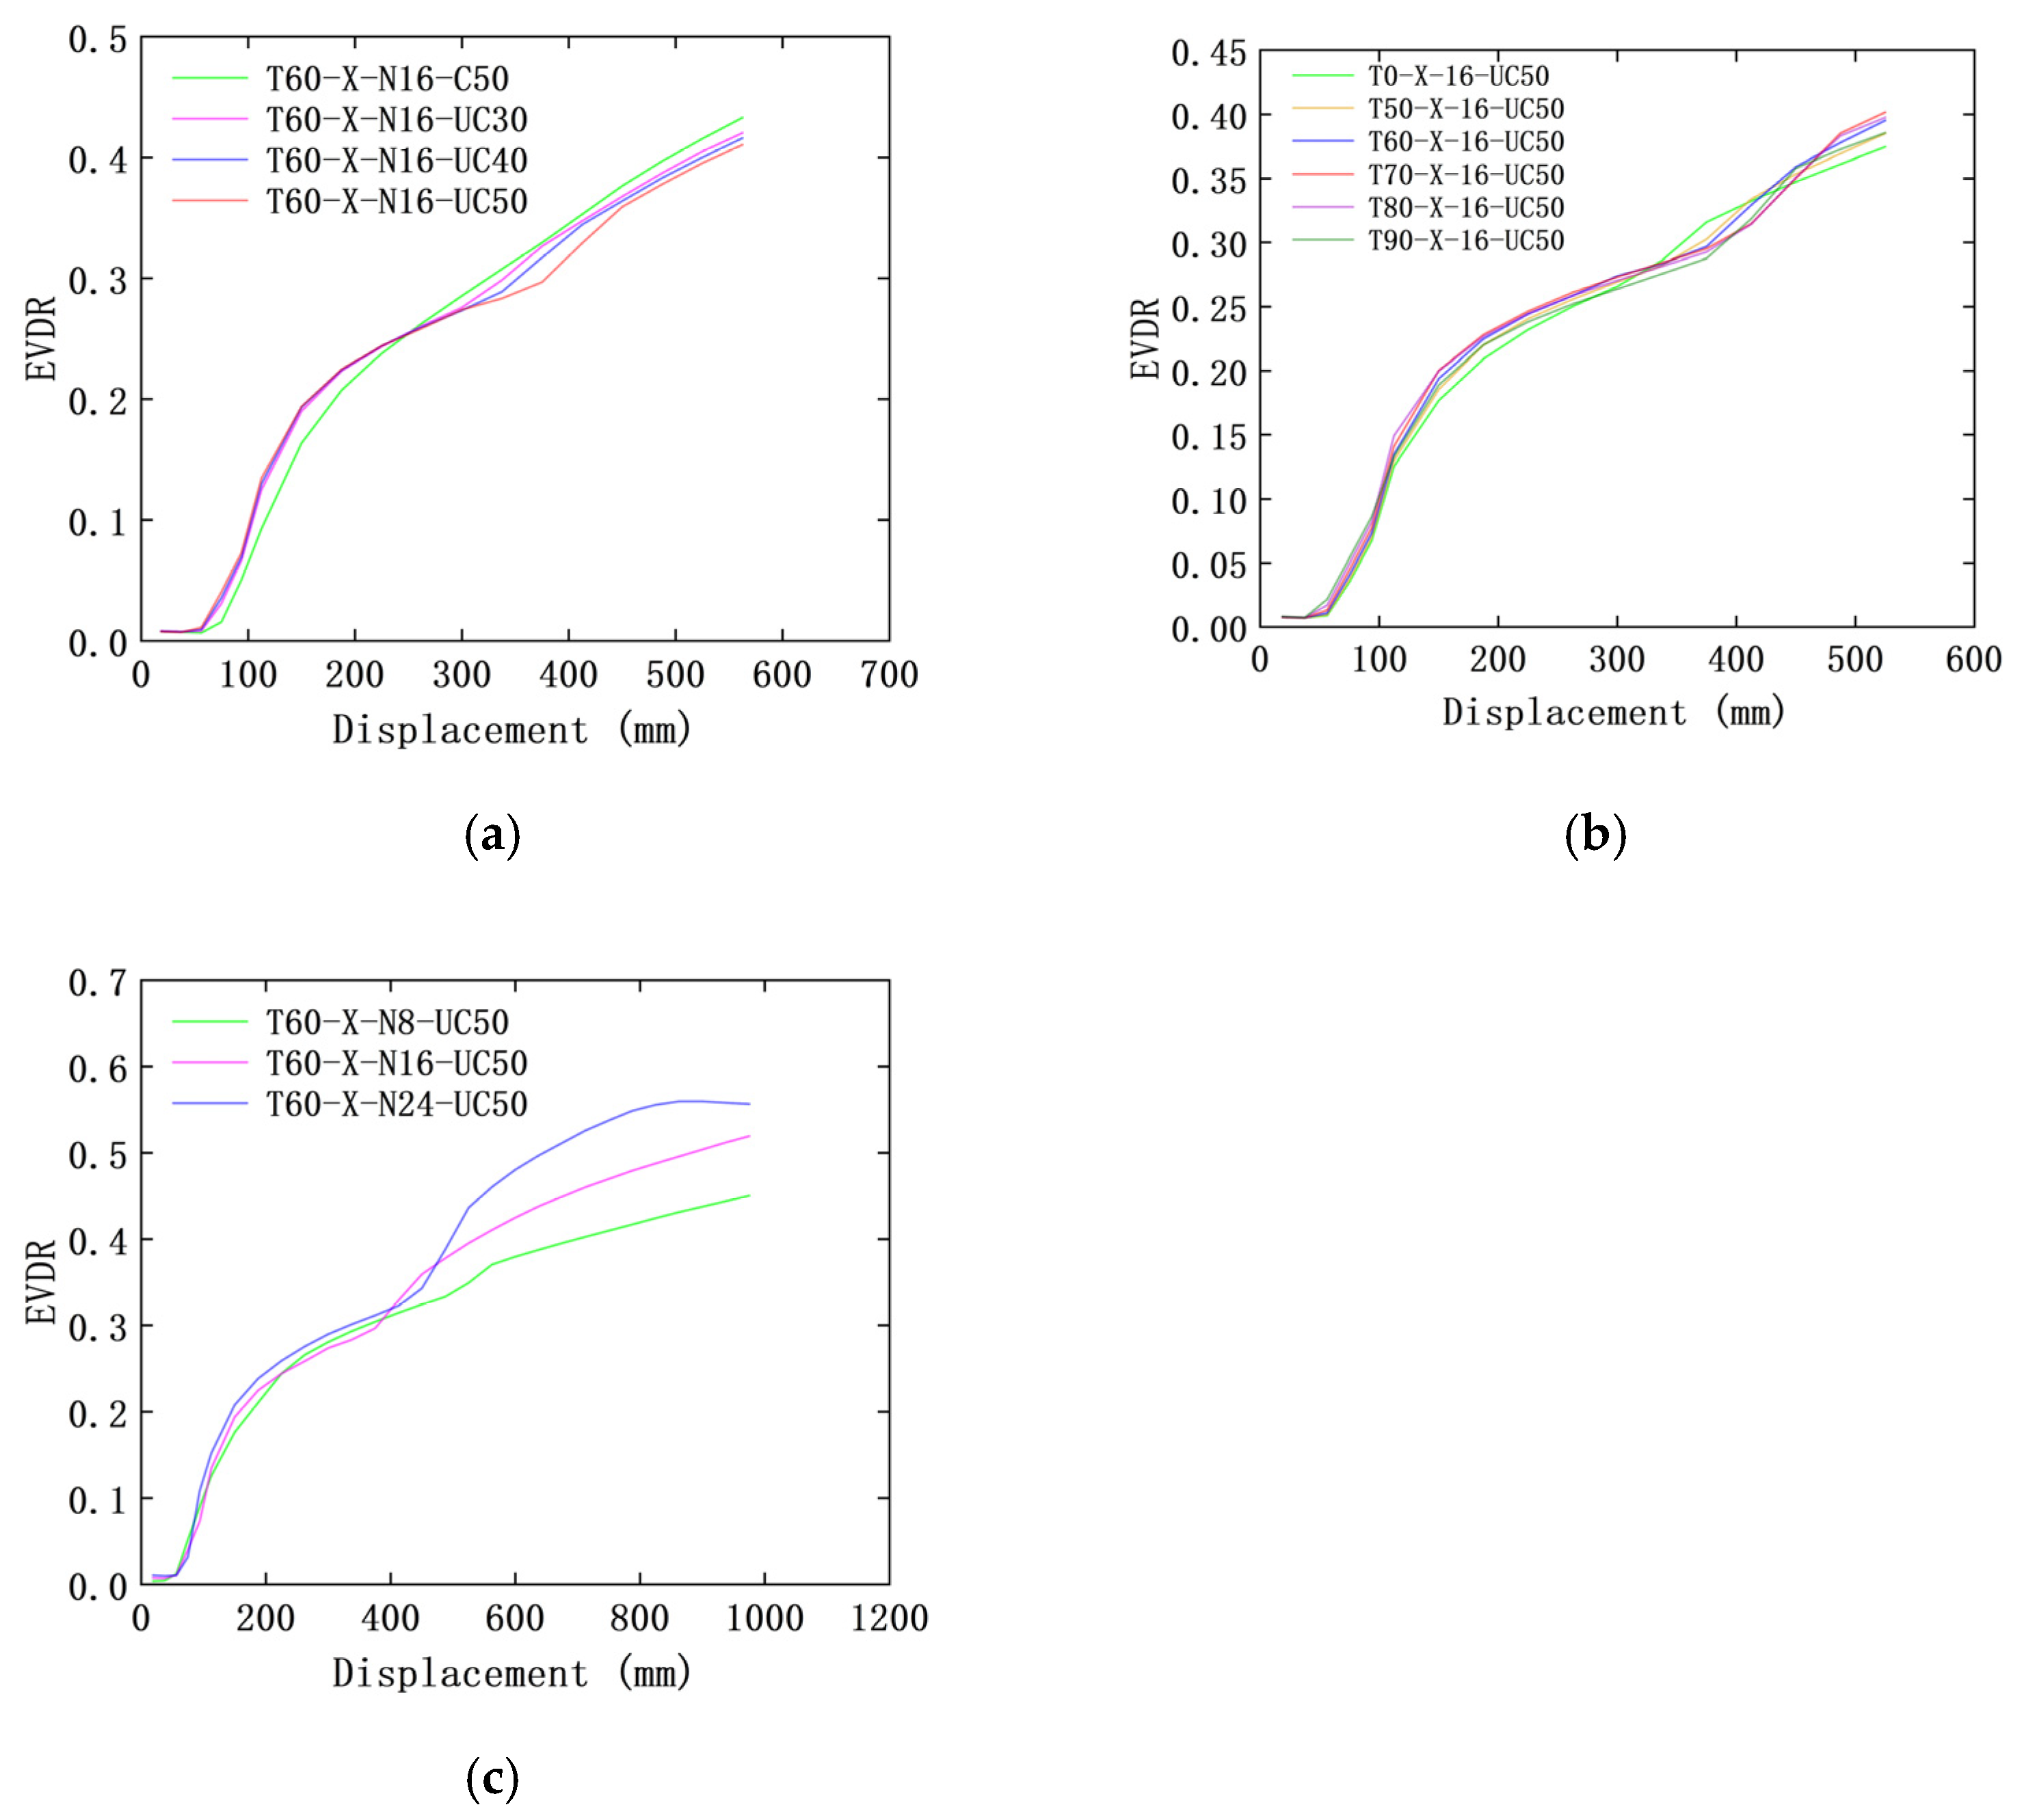
Finally, we analyzed the differences in the EVDR (equivalent viscous damping coefficient) between reinforced concrete of different shapes. The EVDR can be calculated from the dissipation energy and potential energy [36]. Figure 13a illustrates the impact of different protective layer types and thicknesses on pier EVDR under an axial compression ratio of 16%. The figure reveals that when the displacement is less than 200 mm, the UHPC shell significantly enhances the EVDR, while the thickness of the UHPC shell shows minimal influence on this parameter. When the displacement is 200–400 mm, the type and thickness of the concrete cover have no consistent influence on the EVDR. However, when the displacement exceeds 400 mm, the EVDR of piers with ordinary concrete covers is significantly higher than that of UHPC shell-reinforced concrete piers, and the EVDR decreases with the increase in UHPC shell thickness.
To investigate the influence of the EVDR on bridge piers over time, we analyzed the EVDR curves of piers with an axial compression ratio of 16% and protective layers composed of 50 mm UHPC (as shown in Figure 13b). Overall, the EVDR increases nonlinearly with displacement in each service period, but no clear pattern is observed in the EVDR with the increase in service life. In order to study improvements in bridge pier performance under the influence of the axial compression ratio and the use of ultra-high-performance concrete as a cover, the EVDR curve of a bridge pier with a 60-year service life and a 50 mm UHPC shell is shown in the figure. Analysis shows that under different axial compression ratios, the EVDR exhibits a nonlinear increasing trend with displacement. When the displacement is between 0 and 500 mm, there is no significant correlation between the EVDR and the axial compression ratio. However, when the displacement exceeds 500 mm, the EVDR of the bridge pier increases significantly with the increase in the axial compression ratio.

4. Conclusions

This study investigated the seismic performance of rectangular concrete piers affected by corrosion. Using a fiber section model, the cyclic characteristics of the piers were modeled and simulated, and comparisons were made across different corrosion levels, axial compression ratios, and UHPC shell thicknesses. Based on the results of the numerical simulations, the main conclusions are as follows:
(1) Utilizing UHPC as the material for protective layers on bridge piers greatly enhances their hysteresis behavior. However, reducing the thickness of the protective layer leads to a decline in the hysteresis curve area.
(2) A UHPC shell notably enhances the pier strength. However, as the thickness of the UHPC layer is reduced, the peak force of the skeleton curve decreases. As the retrofitting time and axial compression ratio increase, the strength of the pier decreases, and the strength degradation phenomenon becomes more pronounced with a higher axial compression ratio.
(3) When the service life of piers exceeds 50 years, the energy dissipation capacity decreases significantly with increasing time due to corrosion. The energy dissipation capacity of UHPC-retrofitted corroded piers increases with the increase in UHPC thickness and the axial compression ratio.
(4) The application of UHPC as a protective layer greatly enhances the stiffness of the bridge pier when the displacement amplitude is less than 100 mm. Increased axial load ratios and greater UHPC shell thicknesses lead to increased stiffness of retrofitted piers.
(5) When the displacement exceeds 400 mm, the EVDR of piers with ordinary concrete covers is significantly higher than that of piers with UHPC shells, and the EVDR decreases with increasing UHPC shell thickness.
It should be noted that this paper does not consider multi-dimensional seismic loads and uses too few simulation samples. In future work, we will focus on the seismic performance of UHPC-shell-retrofitted bridge piers under bilateral cyclic loads, considering more parameters, including material properties, loading protocols, and reinforcement ratios. Moreover, the seismic performance of bridge structures with UHPC-retrofitted corroded piers, considering varying soil profiles and pile group configurations, also deserves investigation.

Author Contributions

Conceptualization, W.Y.; methodology, W.Y.; software, W.Y. and Y.L.; investigation and formal analysis, Y.L.; supervision, W.Y.; writing—original draft preparation, W.Y.; writing—review and editing, Y.L., J.C., and B.Z. All authors have read and agreed to the published version of the manuscript.

Funding

This research was funded by the Start-up Funding for Young Academic Talents of Inner Mongolia University (10000-23112101/067), the Natural Science Foundation of the Inner Mongolia Autonomous Region of China (2025MS05016), and the Inner Mongolia Autonomous Region Transportation Technology Innovation Project (NJ-2024-22).

Data Availability Statement

The original contributions presented in the study are included in the article, further inquiries can be directed to the corresponding author.

Conflicts of Interest

The authors declare no conflicts of interest.

References

  1. Cairns, J.; Du, Y.; Law, D. Influence of corrosion on the friction characteristics of the steel/concrete interface. Constr. Build. Mater. 2005, 21, 190–197. [Google Scholar] [CrossRef]
  2. Zhou, H.J.; Liang, X.B.; Zhang, X.L.; Lu, J.L.; Xing, F.; Mei, L. Variation and degradation of steel and concrete bond performance with corroded stirrups. Constr. Build. Mater. 2017, 138, 56–68. [Google Scholar] [CrossRef]
  3. Yuan, W.T.; Fang, Q.H.; Dong, Z.X. Evaluation of Biaxial Strength Deterioration for Coastal Bridge Piers under Non-uniform Corrosion. KSCE J. Civ. Eng. 2021, 26, 1329–1343. [Google Scholar] [CrossRef]
  4. Cheng, H.; Wang, D.S.; Li, H.N.; Yan, X.C.; Yu, S. Transfer time of the MDP and its effect on the time-dependent lateral deformation capacity of coastal bridge piers. Structures 2021, 34, 3196–3205. [Google Scholar] [CrossRef]
  5. Vu, N.S.; Li, B. Seismic Performance Assessment of Corroded Reinforced Concrete Short Columns. J. Struct. Eng. 2018, 144, 04018018. [Google Scholar] [CrossRef]
  6. Yuan, W.T.; Wang, Y.R.; Zhou, P.; Yuan, W.; Yao, Y. Effect of Biaxial Loading Path on Seismic Performance of RC Bridge Piers with Corrosion Damage. KSCE J. Civ. Eng. 2023, 27, 5243–5255. [Google Scholar] [CrossRef]
  7. Wang, X.; Tong, T.; Liu, Z.; Bairán, J.M.; Wang, T.; Li, X. Experimental study on the seismic performance of precast and cast-in-place hollow circular piers under chloride-induced corrosion. Eng. Struct. 2025, 335, 120387. [Google Scholar] [CrossRef]
  8. Wu, X.T.; Yuan, W.T.; Guo, A.X. Experimental study on seismic performance of precast bridge piers with corrosion-damaged grouted sleeve connections. Structures 2025, 75, 108699. [Google Scholar] [CrossRef]
  9. Yuan, W.; Guo, A.X.; Li, H. Experimental investigation on the cyclic behaviors of corroded coastal bridge piers with transfer of plastic hinge due to non-uniform corrosion. Soil Dyn. Earthq. Eng. 2017, 102, 112–123. [Google Scholar] [CrossRef]
  10. Domaneschi, M.; De Gaetano, A.; Casas, J.; Cimellaro, G.P. Deteriorated seismic capacity assessment of reinforced concrete bridge piers in corrosive environment. Struct. Concr. 2020, 21, 1823–1838. [Google Scholar] [CrossRef]
  11. Yuan, W.T.; Guo, A.X.; Li, H. Equivalent elastic modulus of reinforcement to consider bond-slip effects of coastal bridge piers with non-uniform corrosion. Eng. Struct. 2020, 210, 110382. [Google Scholar] [CrossRef]
  12. Kashani, M.M.; Moodley, H.; Aminulai, H.O.; Afshan, S.; Crump, D. Experimental Investigation of Nonlinear Cyclic Behavior of Circular Concrete Bridge Piers with Pitting Corrosion. J. Bridge Eng. 2024, 29, 04024048. [Google Scholar] [CrossRef]
  13. Bagheri, M.; Jamkhaneh, M.E.; Samali, B. Effect of Seismic Soil–Pile–Structure Interaction on Mid- and High-Rise Steel Buildings Resting on a Group of Pile Foundations. Int. J. Geomech. 2018, 18, 04018103. [Google Scholar] [CrossRef]
  14. Crespi, P.; Zucca, M.; Valente, M.; Longarini, N. Influence of corrosion effects on the seismic capacity of existing RC bridges. Eng. Fail. Anal. 2022, 140, 106546. [Google Scholar] [CrossRef]
  15. Zhou, Y.W.; Wang, X.H.; Hu, B.; Sui, L.; Yuan, F. Seismic Retrofit of Nonuniformly Corroded Coastal Bridge Piers with FRP and Engineered Cementitious Composite Overlays. J. Compos. Constr. 2023, 27, 04022088. [Google Scholar] [CrossRef]
  16. Jia, J.F.; Zhao, L.Y.; Wu, S.W.; Bai, Y.; Wei, Y. Experimental investigation on the seismic performance of low-level corroded and retrofitted reinforced concrete bridge columns with CFRP fabric. Eng. Struct. 2020, 209, 110225. [Google Scholar] [CrossRef]
  17. Fu, T.; Li, Y.; Xu, L.W.; Wang, G.; Meng, L.; Sun, Z.; Xu, Y. Seismic performance and calculation method for plastic hinge length of RC pier reinforced with UHPC. Structures 2024, 69, 107569. [Google Scholar] [CrossRef]
  18. Zhang, J.W.; Li, Z.F.; Wang, F.; Zhuo, S.; Wang, T. Seismic Resilience Study of Piers Enhanced by Ultrahigh-Performance Concrete Jackets Based on Cyclic Loading Test and Static Push-Over Curves. Sci. Adv. Mater. 2022, 14, 1679–1691. [Google Scholar] [CrossRef]
  19. Yuan, W.T.; Wang, X.T.; Dong, Z.X.; Zhou, P.; Wang, Q. Cyclic loading test for RC bridge piers strengthened with UHPC jackets in the corrosive environment. Soil Dyn. Earthq. Eng. 2022, 158, 107290. [Google Scholar] [CrossRef]
  20. Yuan, W.T.; Wang, X.T.; Guo, A.X.; Li, C.; Dong, Z.; Wu, X. Cyclic performance of RC bridge piers retrofitted with UHPC jackets: Experimental investigation. Eng. Struct. 2022, 259, 114139. [Google Scholar] [CrossRef]
  21. Bhargava, K.; Mori, Y.; Ghosh, A.K. Time-dependent reliability of corrosion-affected RC beams. Part 3: Effect of corrosion initiation time and its variability on time-dependent failure probability. Nucl. Eng. Des. 2010, 241, 1395–1402. [Google Scholar] [CrossRef]
  22. Val, D.V. Deterioration of Strength of RC Beams due to Corrosion and Its Influence on Beam Reliability. J. Struct. Eng. 2007, 133, 1297–1306. [Google Scholar] [CrossRef]
  23. Du, Y.G.; Clark, L.A.; Chan, A.H.C. Residual capacity of corroded reinforcing bars. Mag. Concr. Res. 2005, 57, 135–147. [Google Scholar] [CrossRef]
  24. Finozzi, I.; Saetta, A.; Budelmann, H. Structural response of reinforcing bars affected by pitting corrosion: Experimental evaluation. Constr. Build. Mater. 2018, 192, 478–488. [Google Scholar] [CrossRef]
  25. Coronelli, D.; Gambarova, P. Structural Assessment of Corroded Reinforced Concrete Beams: Modeling Guidelines. J. Struct. Eng. 2004, 130, 1214–1224. [Google Scholar] [CrossRef]
  26. Biondini, F.; Vergani, M. Damage modeling and nonlinear analysis of concrete bridges under corrosion. In Bridge Maintenance, Safety, Management, Resilience and Sustainability, Proceedings of the Sixth International Conference of Bridge Maintenance, Safety and Management (IABMAS 2012), Stresa, Italy, 8–12 July, 2012; CRC Press: Boca Raton, FL, USA, 2012; pp. 949–957. [Google Scholar]
  27. Mander, J.; Priestley, M. Theoretical Stress-Strain model for confined concrete. J. Struct. Eng. 1988, 114, 1804–1826. [Google Scholar] [CrossRef]
  28. Silva, M.L.d.; Prado, L.P.; Félix, E.F.; Sousa, A.M.D.d.; Aquino, D.P. The Influence of Materials on the Mechanical Properties of Ultra-High-Performance Concrete (UHPC): A Literature Review. Materials 2024, 17, 1801. [Google Scholar] [CrossRef]
  29. Mangalathu, S.; Soleimani, F.; Jeon, J. Bridge classes for regional seismic risk assessment: Improving HAZUS models. Eng. Struct. 2017, 148, 755–766. [Google Scholar] [CrossRef]
  30. Stewart, M.G.; Wang, X.; Nguyen, M.N. Climate change impact and risks of concrete infrastructure deterioration. Eng. Struct. 2011, 33, 1326–1337. [Google Scholar] [CrossRef]
  31. Duprat, F. Reliability of RC beams under chloride-ingress. Constr. Build. Mater. 2006, 21, 1605–1616. [Google Scholar] [CrossRef]
  32. Vu, K.A.T.; Stewart, M.G. Structural reliability of concrete bridges including improved chloride-induced corrosion models. Struct. Saf. 2000, 22, 313–333. [Google Scholar] [CrossRef]
  33. Yuan, W.; Li, X.; Pang, X.; Tian, C.; Li, Z.; Zhou, P.; Wang, Y. Cyclic Behavior of Rectangular Bridge Piers Subjected to the Coupling Effects of Chloride Corrosion and Bidirectional Loading. Buildings 2023, 13, 425. [Google Scholar] [CrossRef]
  34. Mazzoni, S.; McKenna, F.; Scott, M.H.; Fenves, G.L. OpenSees Command Language Manual; (Open System for Earthquake Engineering Simulation—Home Page); University of California: Berkeley, CA, USA, 2007. [Google Scholar]
  35. Asgari, A.; Bagheri, M.; Hadizadeh, M. Advanced seismic analysis of soil-foundation-structure interaction for shallow and pile foundations in saturated and dry deposits: Insights from 3D parallel finite element modeling. Structures 2024, 69, 107503. [Google Scholar] [CrossRef]
  36. Rodrigues, H.; Varum, H.; Arêde, A.; Costa, A. A comparative analysis of energy dissipation and equivalent viscous damping of RC columns subjected to uniaxial and biaxial loading. Eng. Struct. 2012, 35, 149–164. [Google Scholar] [CrossRef]
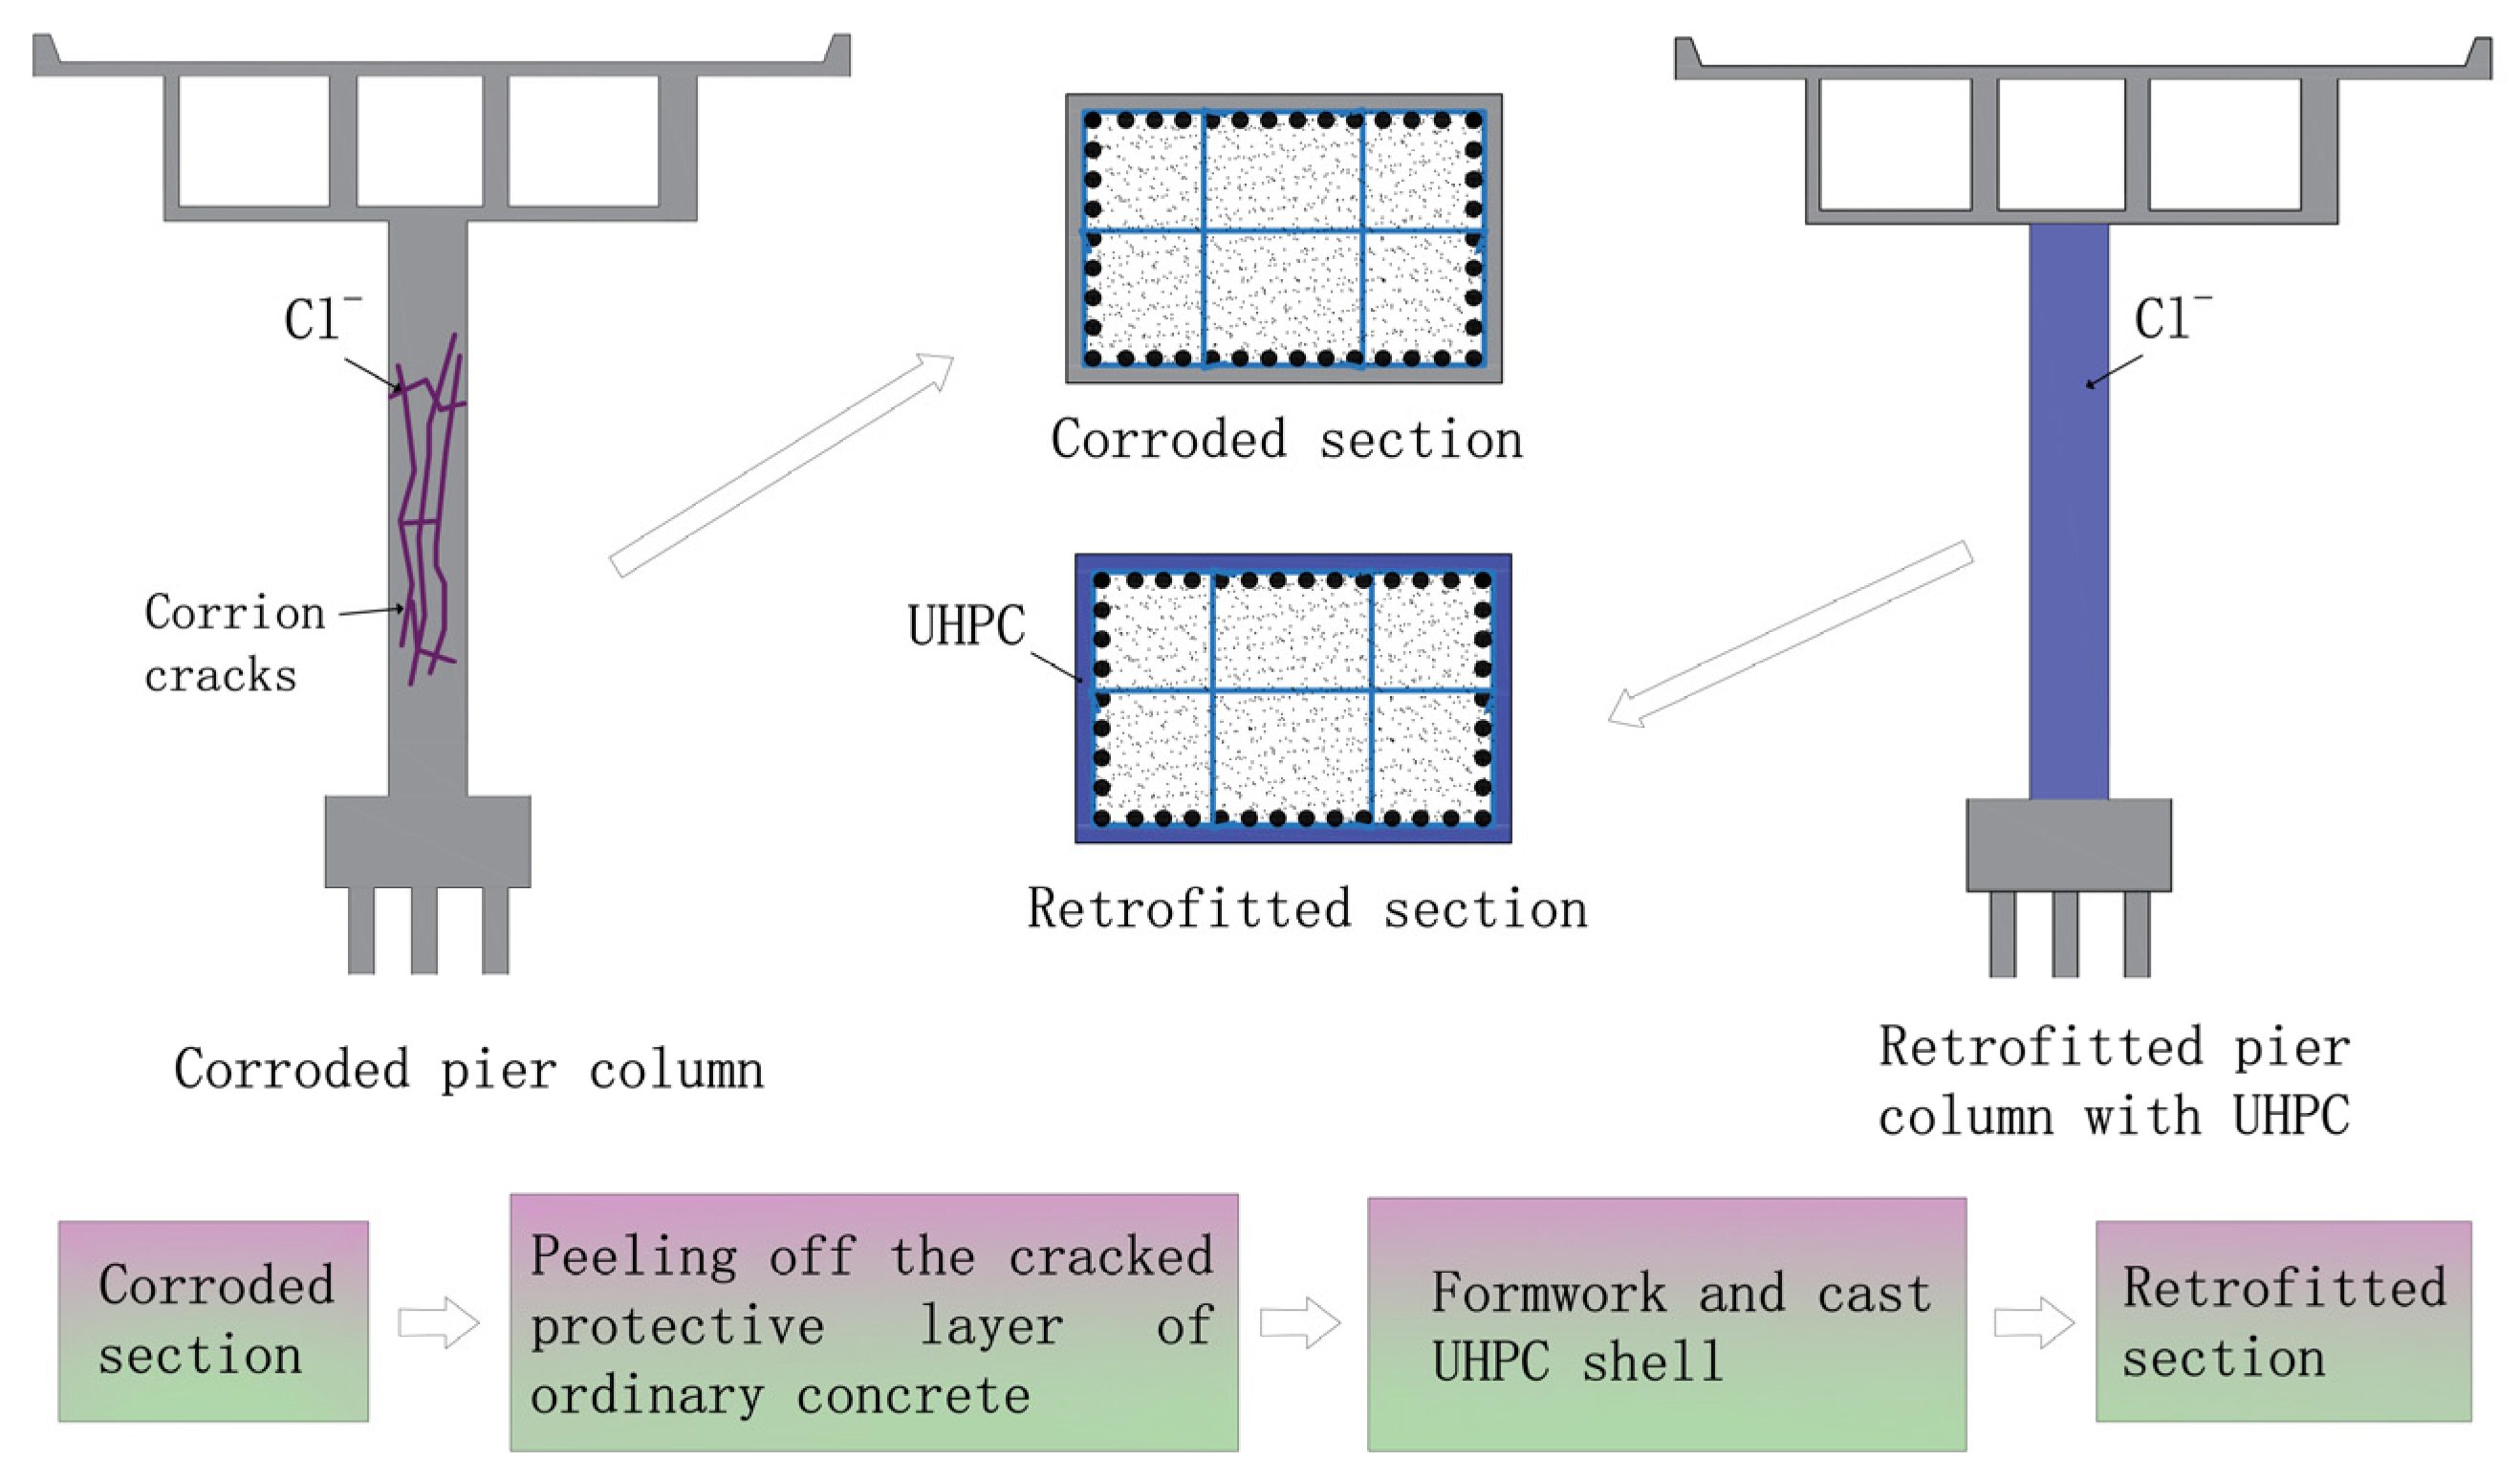
Figure 1. Schematic of a UHPC shell-retrofitted bridge pier.
Buildings 15 03863 g001
Figure 2. Schematic diagram of the size of the pier.
Buildings 15 03863 g002
Figure 3. Numerical model of the bridge pier.
Buildings 15 03863 g003
Figure 4. Hysteresis curves: (a) axial compression ratio of 8%; (b) axial compression ratio of 16%; (c) axial compression ratio of 24%.
Buildings 15 03863 g004
Figure 5. Hysteresis curves: (a) ordinary concrete cover; (b) UHPC cover.
Buildings 15 03863 g005
Figure 6. Skeleton curves: (a) axial compression ratio of 8%; (b) axial compression ratio of 16%; (c) axial compression ratio of 24%.
Buildings 15 03863 g006
Figure 7. Skeleton curves: (a) ordinary concrete cover; (b) UHPC cover.
Buildings 15 03863 g007
Figure 8. Skeleton curves: (a) ordinary concrete cover; (b) UHPC cover.
Buildings 15 03863 g008
Figure 9. Residual yield force, residual peak force, and residual ultimate displacement as a function of time: (a) residual yield force; (b) residual peak force; (c) residual ultimate displacement.
Buildings 15 03863 g009
Figure 10. Residual yield force, residual ultimate displacement, and residual peak force as a function of axial compression ratio: (a) residual yield force; (b) residual peak force; (c) residual ultimate displacement.
Buildings 15 03863 g010
Figure 11. Comparison of the accumulated energy dissipation of bridge piers: (a) different protective layer types and thicknesses; (b) different service lives; (c) different axial compression ratios.
Buildings 15 03863 g011
Figure 12. Comparison of stiffness of bridge piers: (a) different types and thicknesses of protective layers; (b) different service lives; (c) different axial compression ratios.
Buildings 15 03863 g012
Figure 13. Comparison of EVDR values of bridge piers: (a) different types and thicknesses of protective layers; (b) different service lives; (c) different axial compression ratios.
Buildings 15 03863 g013
Disclaimer/Publisher’s Note: The statements, opinions and data contained in all publications are solely those of the individual author(s) and contributor(s) and not of MDPI and/or the editor(s). MDPI and/or the editor(s) disclaim responsibility for any injury to people or property resulting from any ideas, methods, instructions or products referred to in the content.