1. Introduction
Recently, with the rapid pace of urbanization and the intensification of traffic congestion, rail transit systems have played an increasingly vital role in urban transportation networks [
1,
2,
3,
4]. Suspended monorail transit (SMT)—an emerging mode of urban transit—has been implemented in cities such as Wuppertal, Germany, and Wuhan, China, owing to its advantages of small turning radius, strong climbing ability, short construction period, and minimal land occupation [
5,
6]. In SMT systems, the track beam serves as the critical load-bearing component, and its fatigue performance directly determines structural safety and durability. Welded joints and structural details are highly susceptible to fatigue cracking owing to frequent vehicle loading [
7,
8,
9,
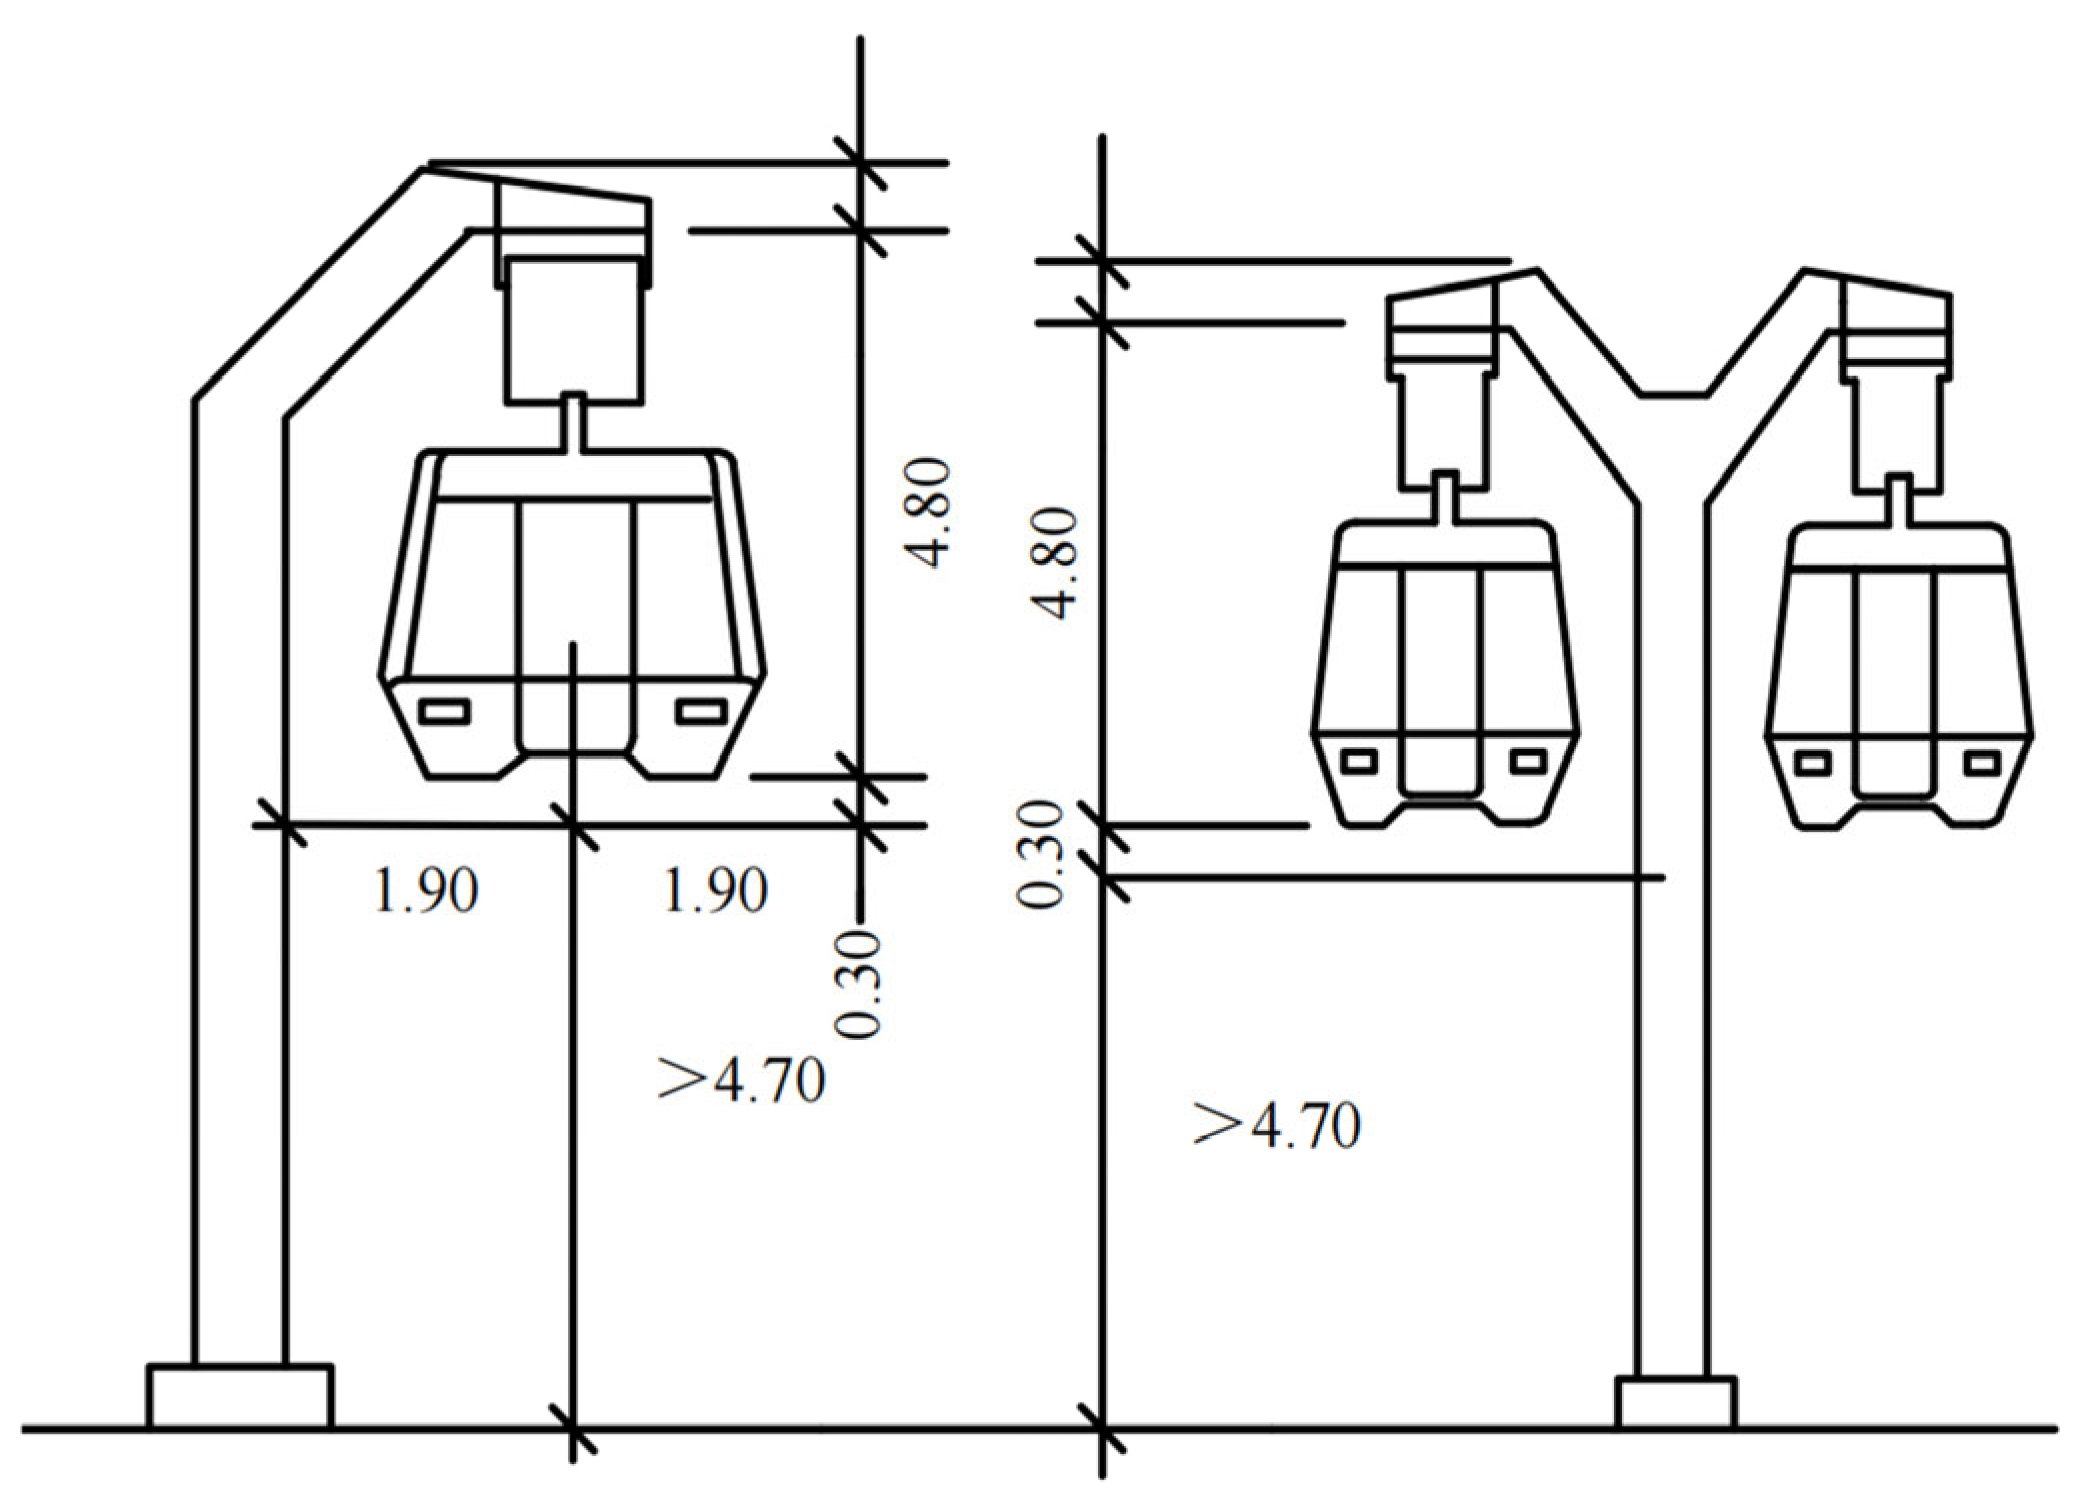
10], highlighting the necessity of in-depth studies on fatigue life and failure mechanisms. A representative suspended monorail transit system is shown in
Figure 1.
Extensive studies have been conducted worldwide on the fatigue performance of steel bridges and orthotropic steel bridge decks. It is well documented that fatigue cracks frequently initiate at rib-to-deck welds [
11,
12,
13,
14], rib-to-diaphragm connections [
15,
16,
17], and U-rib butt welds [
18,
19,
20,
21,
22]. A recent review summarized fatigue performance and life prediction methods for orthotropic steel decks [
23], highlighting the application of hot-spot stress approaches, nominal stress methods, and Miner’s linear damage accumulation theory. In addition, numerical investigations have proposed techniques for identifying fatigue-sensitive features in steel bridges [
24], providing insights into local stress distribution and crack initiation mechanisms. Collectively, these studies offer valuable theoretical references for fatigue analysis of suspended monorail track beams.
Studies on suspended monorail track beams remain relatively limited compared with the extensive fatigue research on steel bridges, with most focusing on dynamic responses. Cai et al. [
25,
26] developed finite-element-based vehicle–bridge coupled models and validated their accuracy through field measurements, while Jiang et al. [
27] employed UM–ANSYS co-simulation to examine the effects of track irregularities on system dynamics. In modeling wheel–rail interactions, most existing studies rely on point-contact or highway-based tire models, such as the linear FIALA model [
28]. To address these limitations, He et al. [
29] proposed a nonlinear surface-contact wheel–rail model, and Yang et al. [
30] optimized model parameters through full-scale tests to enhance force prediction accuracy. Furthermore, Bao et al. [
31,
32] demonstrated that crosswinds can substantially increase lateral loads on windward guide wheels, thereby amplifying dynamic stresses in welded zones. Additional studies explored wind–vehicle–bridge coupling effects [
33] and the influence of wind-barrier parameters on vehicle–bridge system responses [
34]. While these works provide important insights into the dynamic behavior of SMT systems, they devote relatively little attention to the fatigue performance of track beams.
In terms of experimental fatigue studies, several investigations have been conducted to examine the fatigue characteristics of suspended monorail track beams and related steel components. Yamasaki et al. [
7] performed fatigue tests on a 1:2 scaled curved track beam, identifying fatigue-prone locations and typical damage patterns under complex geometric conditions. Diao [
8] investigated the fatigue performance of T-welded joints in corrugated web beams, emphasizing the influence of local structural details on fatigue behavior. Gu et al. [
9] carried out fatigue tests on a 1:4 full-span scaled model under moving loads, providing insights into the global fatigue response of track beams subjected to cyclic loading. Zhang et al. [
10] combined finite element analysis with Eurocode-based assessment methods to evaluate and verify the fatigue strength of welds in suspended monorail systems. Collectively, these studies provide a valuable foundation for fatigue analysis of suspended monorail track beams; however, systematic experimental data remain scarce, and comprehensive validation that integrates experimental and numerical approaches is still lacking.
In summary, research on the fatigue performance of suspended monorail track beams still faces several critical limitations: (1) the lack of a systematic evaluation framework for accurately identifying fatigue-sensitive welded details; (2) insufficient validation that integrates scaled testing with finite element simulations; and (3) continued reliance on damage equivalent coefficient methods derived from standard load assumptions, without adequately accounting for actual traffic volume and train speed.
To address these gaps, this study conducts a comprehensive investigation into the fatigue behavior of suspended monorail track beams. The research integrates 1:4 scaled fatigue testing to identify critical fatigue details, finite element modeling with fatigue life prediction based on the IIW hot-spot stress method and Eurocode S–N curves, and the development of a modified damage equivalent coefficient method that incorporates traffic volume and speed corrections. In addition, the feasibility of employing scaled models as substitutes for full-scale models is systematically verified. The findings establish a theoretical framework and provide practical guidance for fatigue life prediction, design optimization, and code development of suspended monorail track beam structures.
2. Experimental Design and Loading Scheme
2.1. Specimen Design
The prototype track beam investigated in this study is a 25 m-span straight beam, designed to meet both the cross-sectional mechanical performance requirements and the geometric constraints necessary for suspended monorail vehicle operation. The beam features an open thin-walled steel box section reinforced with annular diaphragms and longitudinal stiffeners. The clear internal dimensions of the box section are 1100 mm × 780 mm, while the overall cross-sectional dimensions measure 1416 mm × 1088 mm, with a unit steel consumption of approximately 1.28 t/m.
Due to laboratory space constraints and the limited capacity of loading equipment, a 1:4 geometric scale model was fabricated (
Figure 2). The scaled beam has a total length of 6.39 m, a calculated span of 6.25 m, and a cross-section of 354 mm × 272 mm, with a unit steel consumption of approximately 0.32 t/m. The model was designed in accordance with similarity principles, ensuring geometric similarity at mid-span (all dimensions scaled by 1:4) and stress similarity under equivalent loading conditions. The similarity relationships of the key physical quantities are summarized in
Table 1.
The scale calibration between the prototype and the 1:4 test model followed the similarity principle. The applied load was determined based on the requirement of stress similarity, ensuring that the stress level and deformation pattern of the scaled model were consistent with those of the prototype structure under equivalent loading conditions.
Both the prototype and the scaled model were fabricated using Q345qd structural steel (yield strength: 345 MPa, elastic modulus: 206 GPa, density: 7850 kg/m3). The components were welded using submerged arc welding (SAW), with welding wires, fluxes, and electrodes selected based on welding procedure qualification tests and in full compliance with national standards.
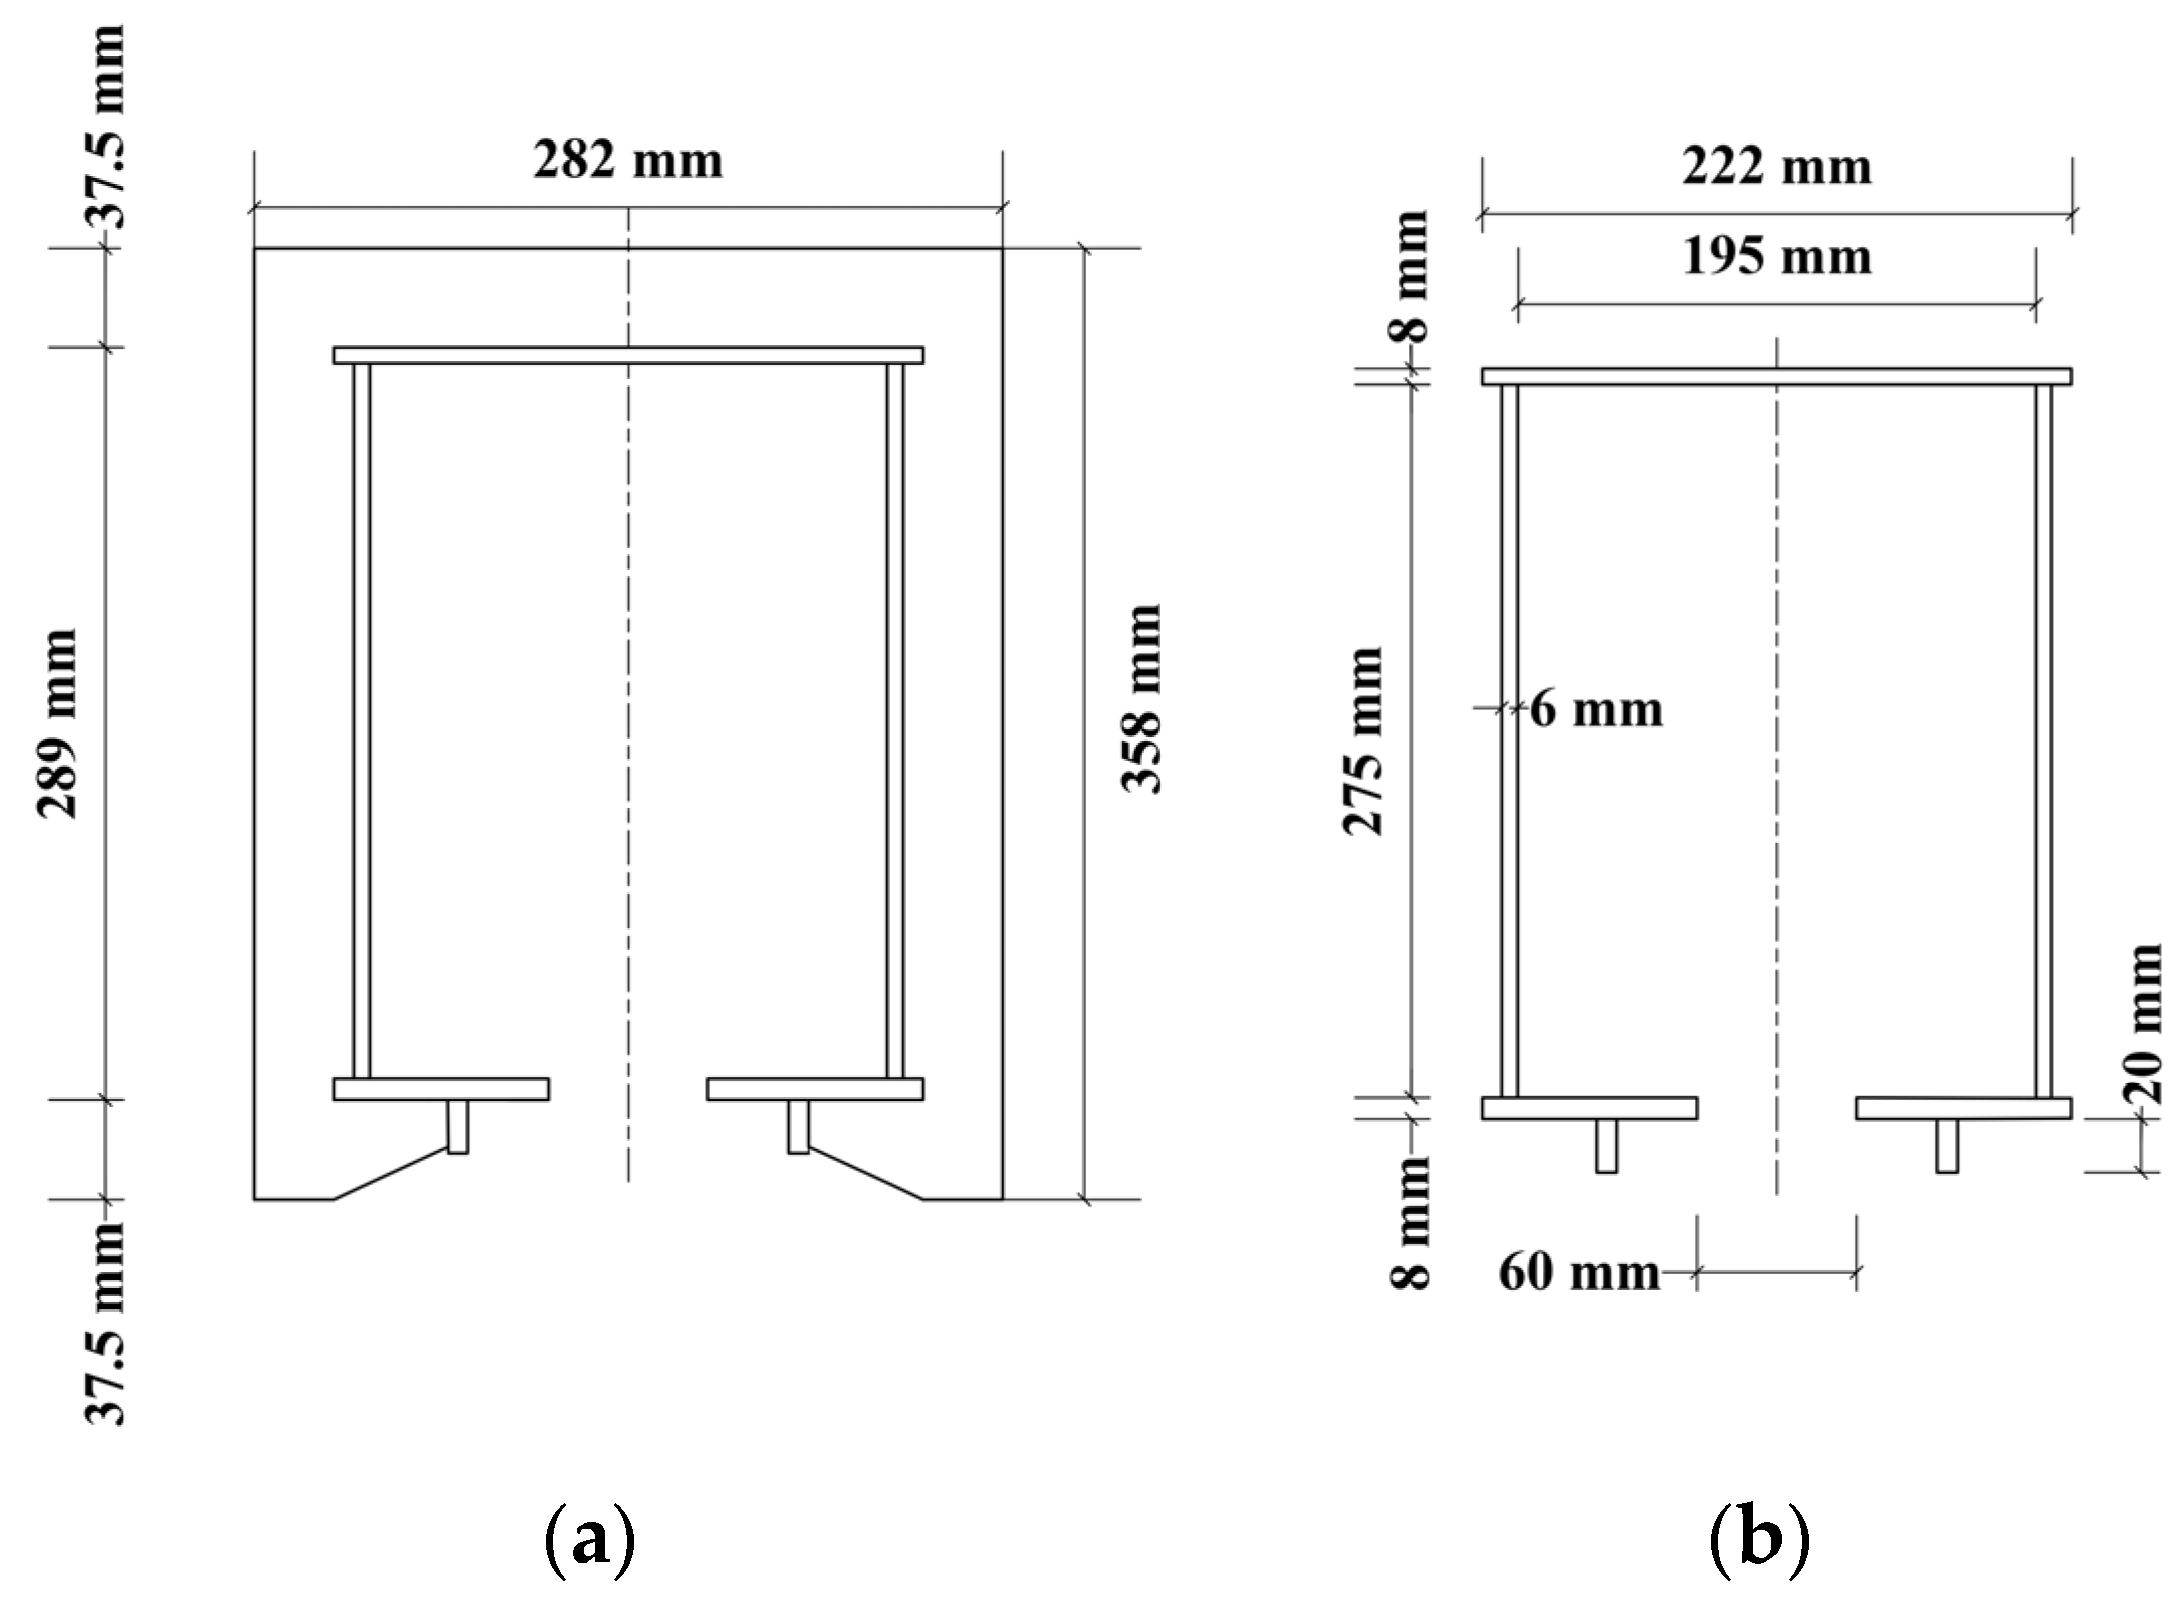
The scaled beam has a total length of 6.39 m, a calculated span of 6.25 m, and a cross-section of 354 mm × 272 mm. The top flange, bottom flange, and web plates of the prototype beam were 24 mm, 32 mm, and 24 mm thick, respectively, which were reduced to 6 mm, 8 mm, and 6 mm in the 1:4 scaled model. The detailed cross-sectional geometry is shown in
Figure 3.
2.2. Loading Scheme
Previous studies have demonstrated that the loading area, spacing between loading points, and load position significantly influence the stress distribution at fatigue-sensitive details. To better replicate actual wheel loads, a loading area of 40 mm (longitudinal) × 20 mm (transverse) was adopted in this study, following empirical research on wheel–rail contact effects [
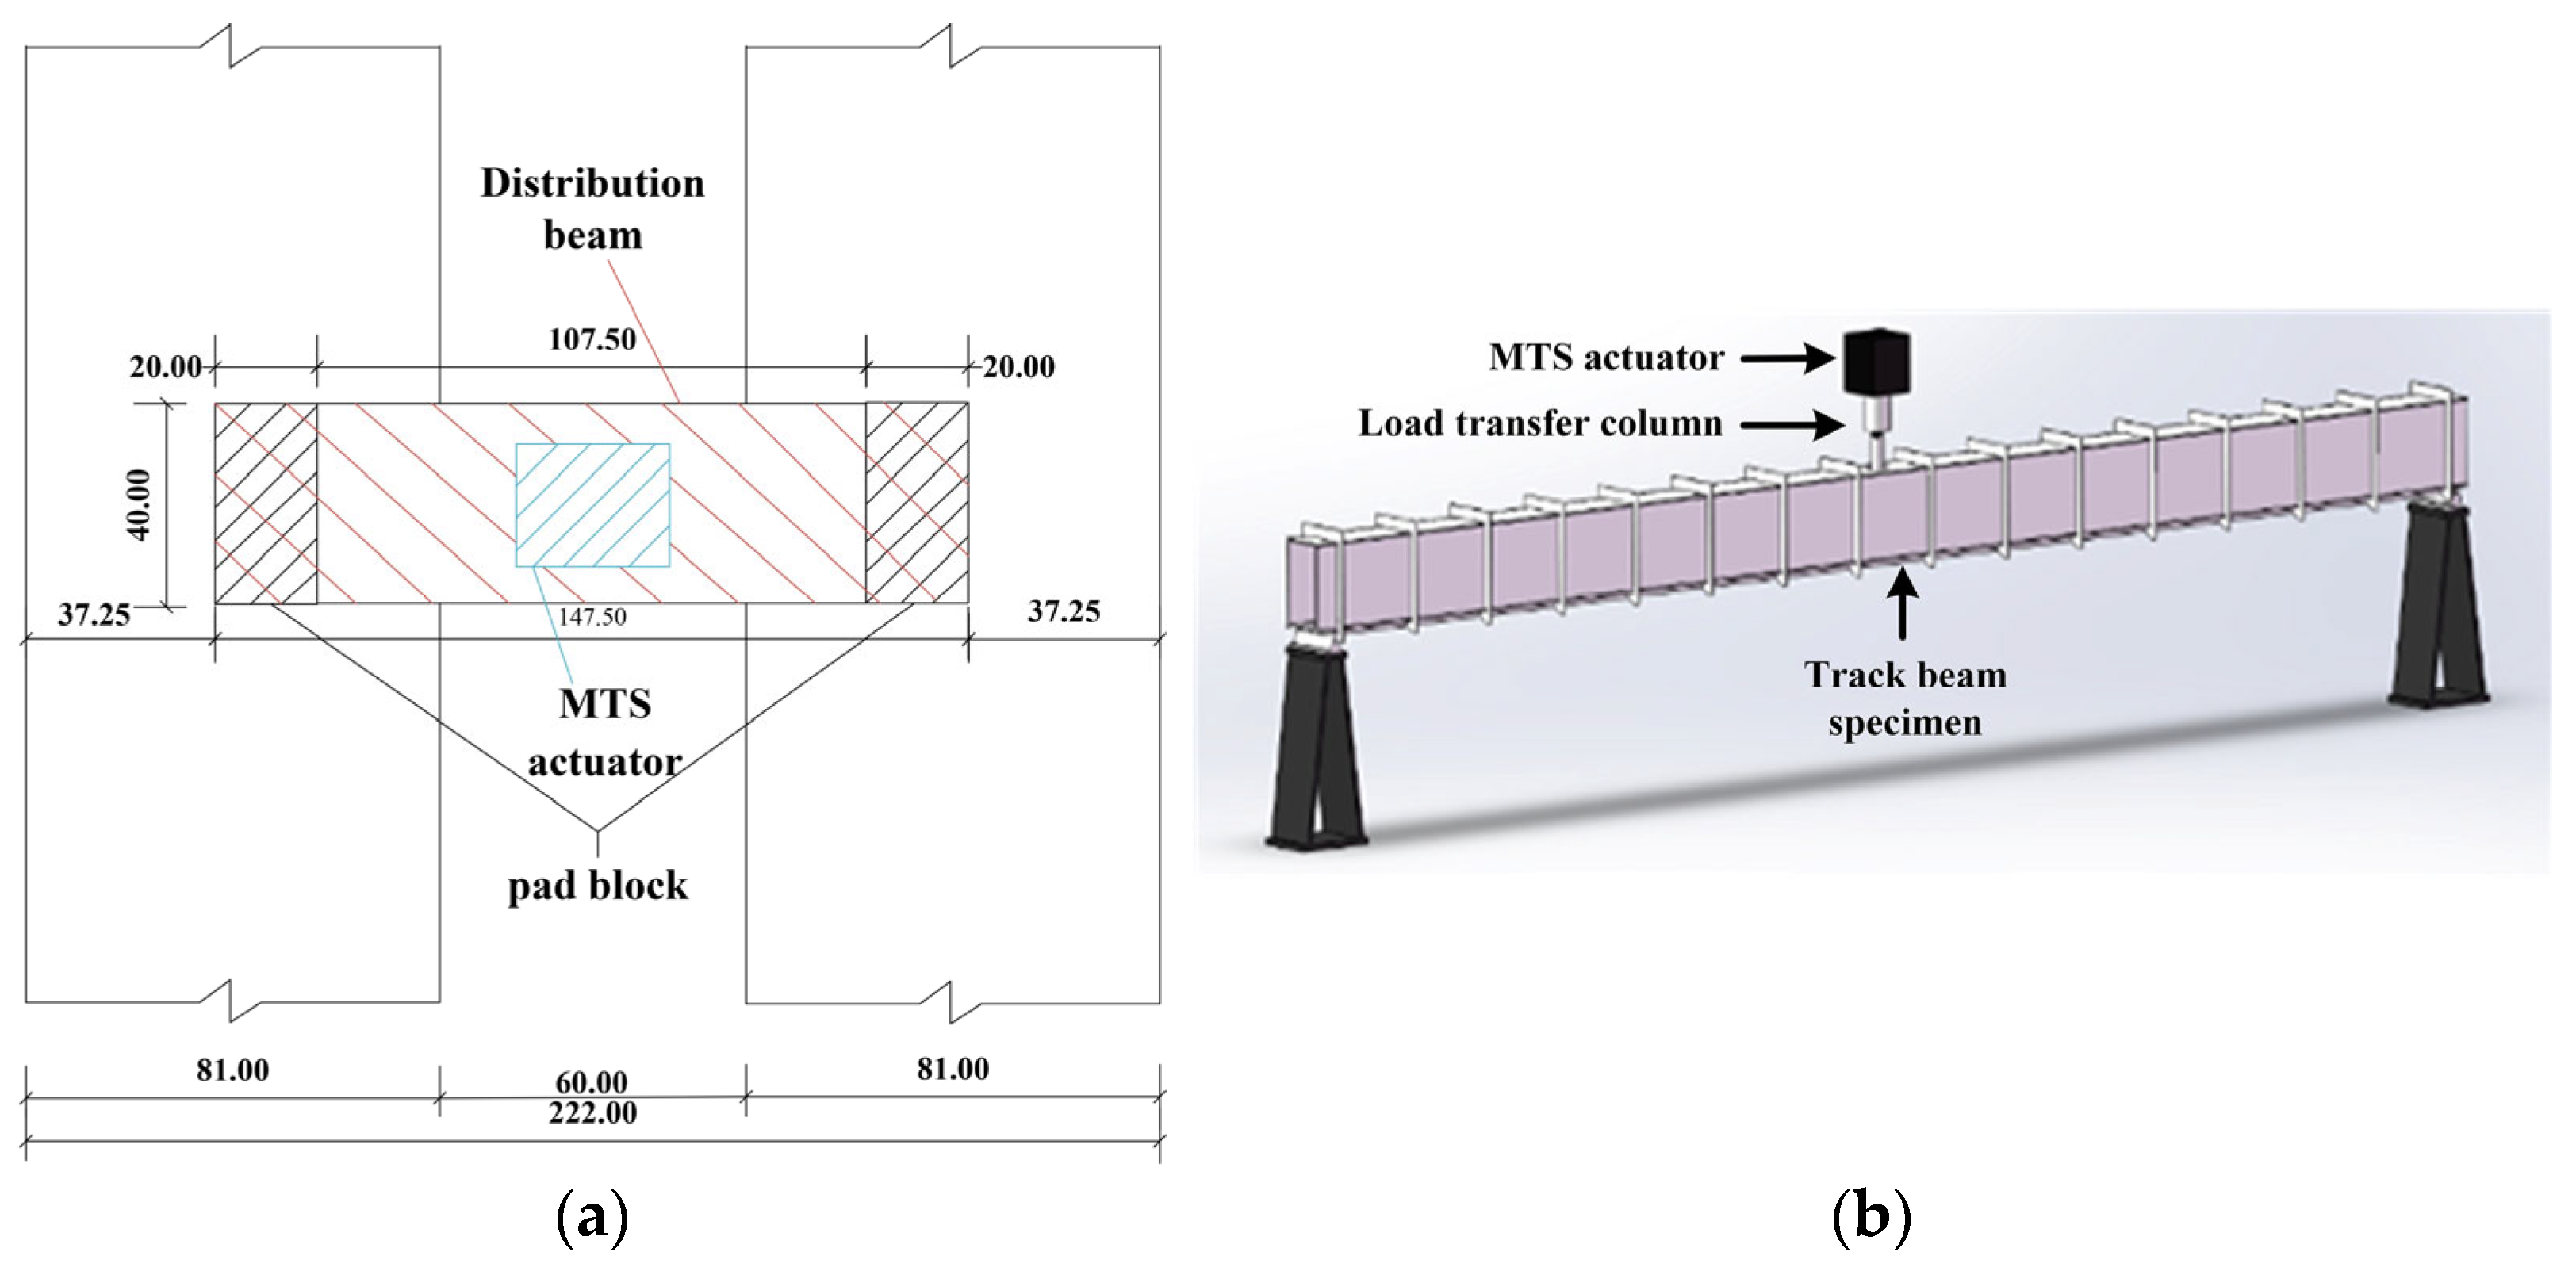
26]. A dual-point loading scheme was applied, with a center-to-center spacing of 127.5 mm (net spacing 107.5 mm). The load was introduced locally on the walking surface panel of the track beam to simulate wheel–track compressive contact, while distribution blocks beneath the spreader beam ensured uniform transfer of the load. The test model was simply supported at both ends.
The fatigue test was conducted using a servo-hydraulic MTS fatigue testing machine, with the actuator transferring the load to the walking surface panel of the box beam through a transfer column. The experimental setup is shown in
Figure 4. Under full passenger capacity, the designed maximum axle load of the track beam was 4.9 t, reducing to approximately 3.5 t under no-load conditions. To improve testing efficiency, an accelerated fatigue loading mode with an increased stress range was adopted. For the 1:4 scaled model, the applied load ranged from 5.3 kN (minimum) to 26.5 kN (maximum), corresponding to a mean load of 21.2 kN. To avoid resonance or excessive dynamic response while realistically simulating the cyclic stress behavior of the track beam and maintaining reasonable testing efficiency, the loading frequency was selected as 1.5 Hz, considering both the actual operating conditions of the suspended monorail system and the fundamental principles of fatigue testing.
Finite element analysis indicated that under the peak load of 26.5 kN, the maximum von Mises stress in the model reached 266 MPa, remaining below the material yield strength of 345 MPa and ensuring safe elastic loading. Prior to the formal test, two preloading cycles at 50% of the maximum load were applied to eliminate initial deformation and verify system performance. During fatigue testing, the machine was paused every 100,000 cycles to inspect critical structural regions for crack initiation or abnormal responses. The fatigue loading procedure is shown in
Figure 5.
2.3. Instrumentation Layout
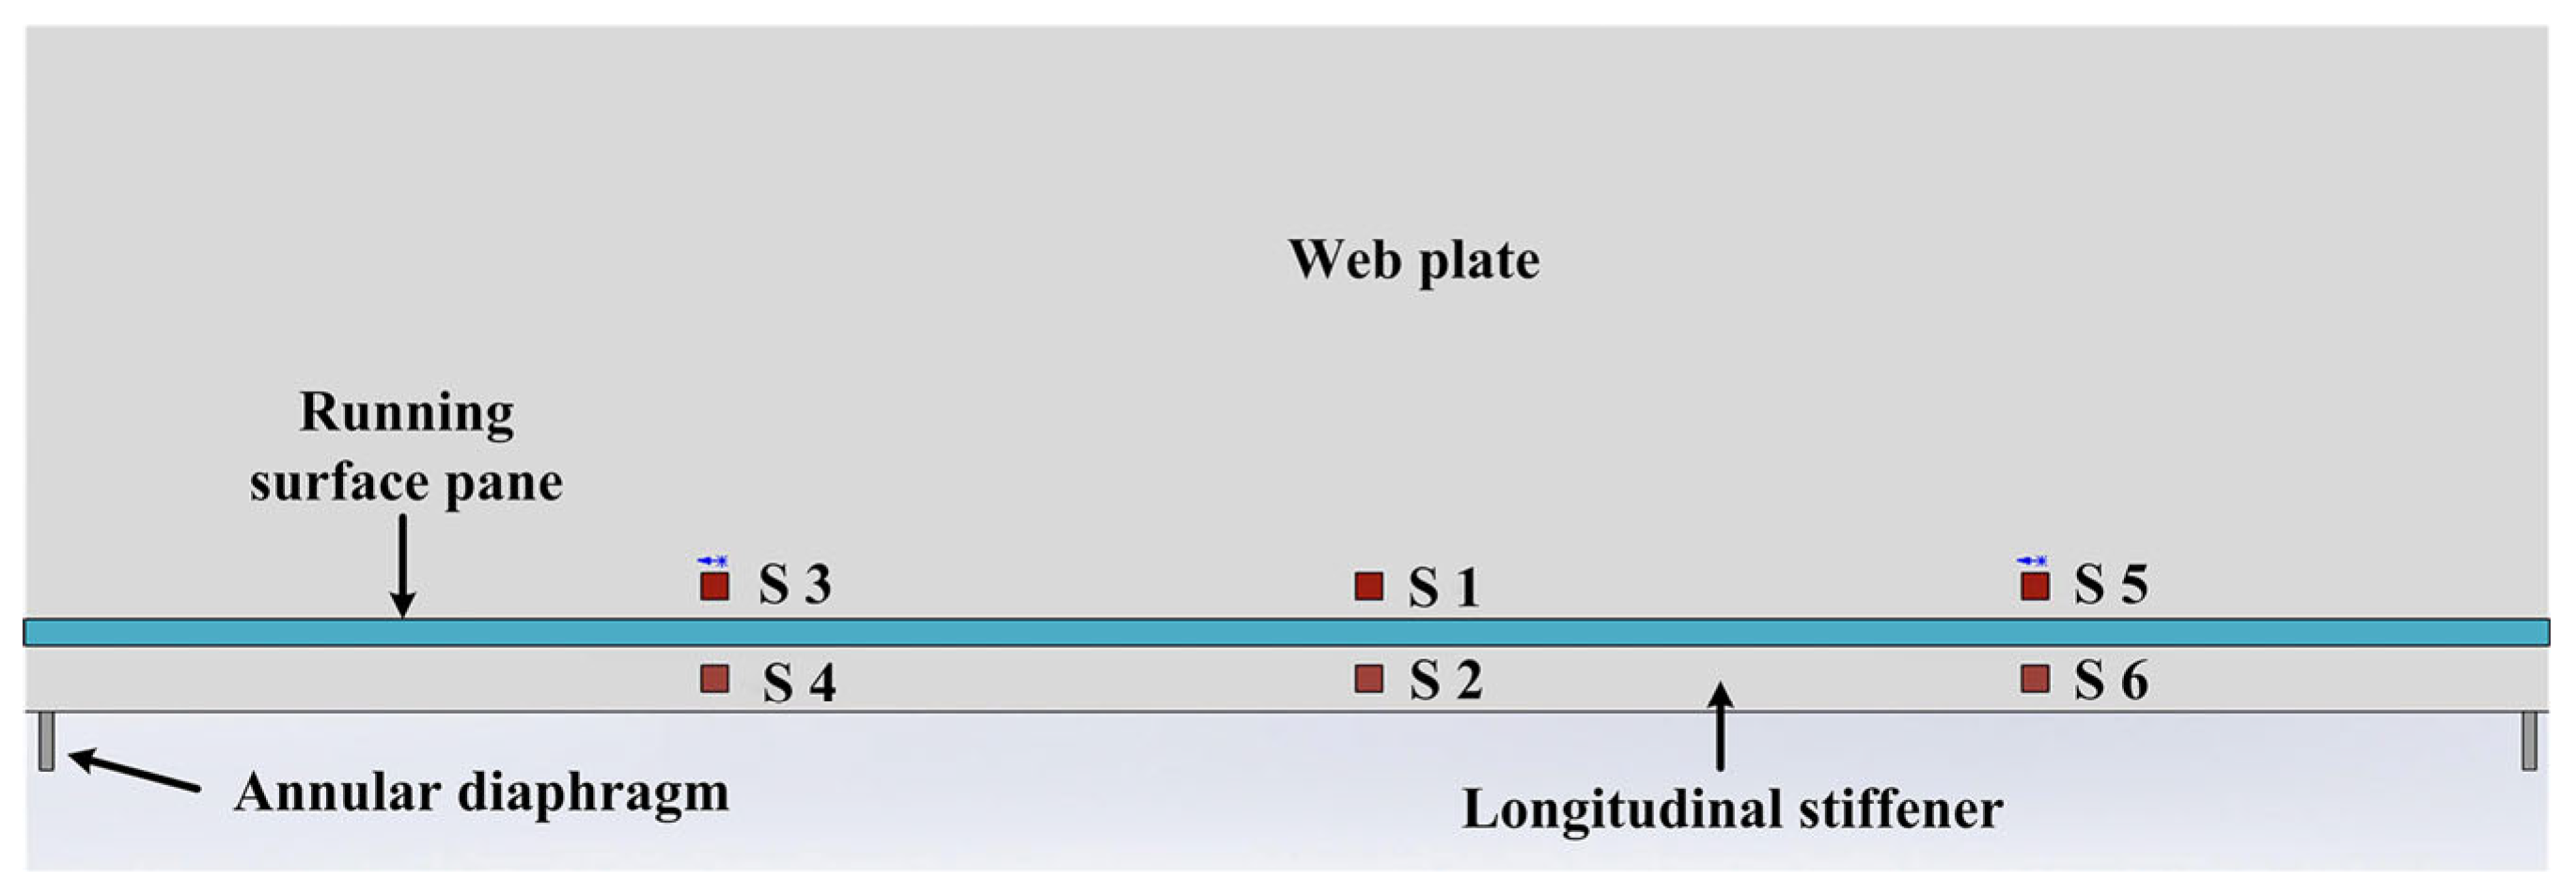
To ensure the reliability of the test results, a combined monitoring approach was employed, in which multiple measurement methods were used to cross-verify the same parameters. Based on the test loading scheme, strain gauges and a vibration testing system were installed at fatigue-prone locations of interest to monitor the initiation and propagation of fatigue cracks in critical structural details. Examples of sensor arrangements are illustrated in
Figure 6, while the layout of vibration testing sensors is presented in
Figure 7.
2.4. Model Validation Using Finite Element Simulation
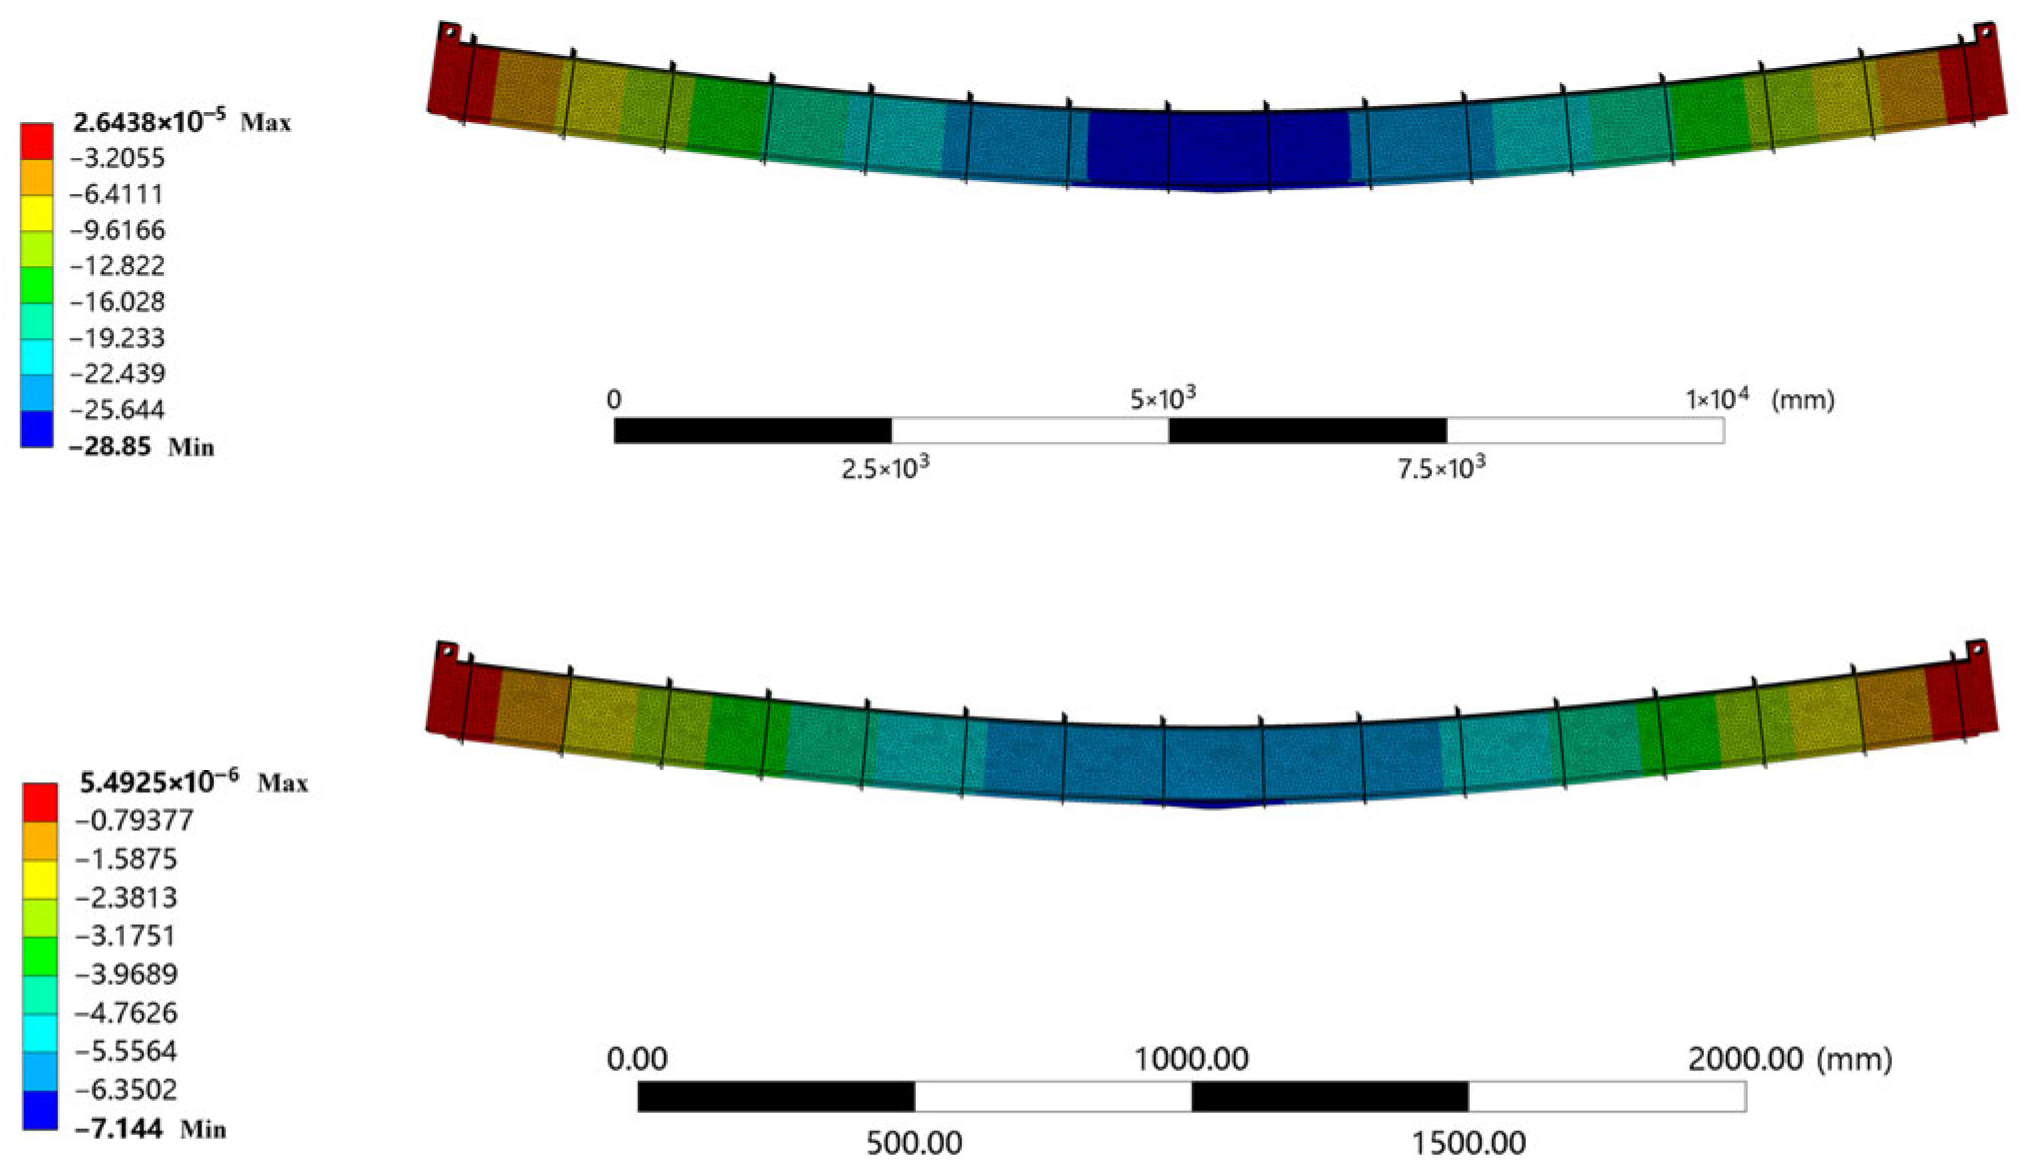
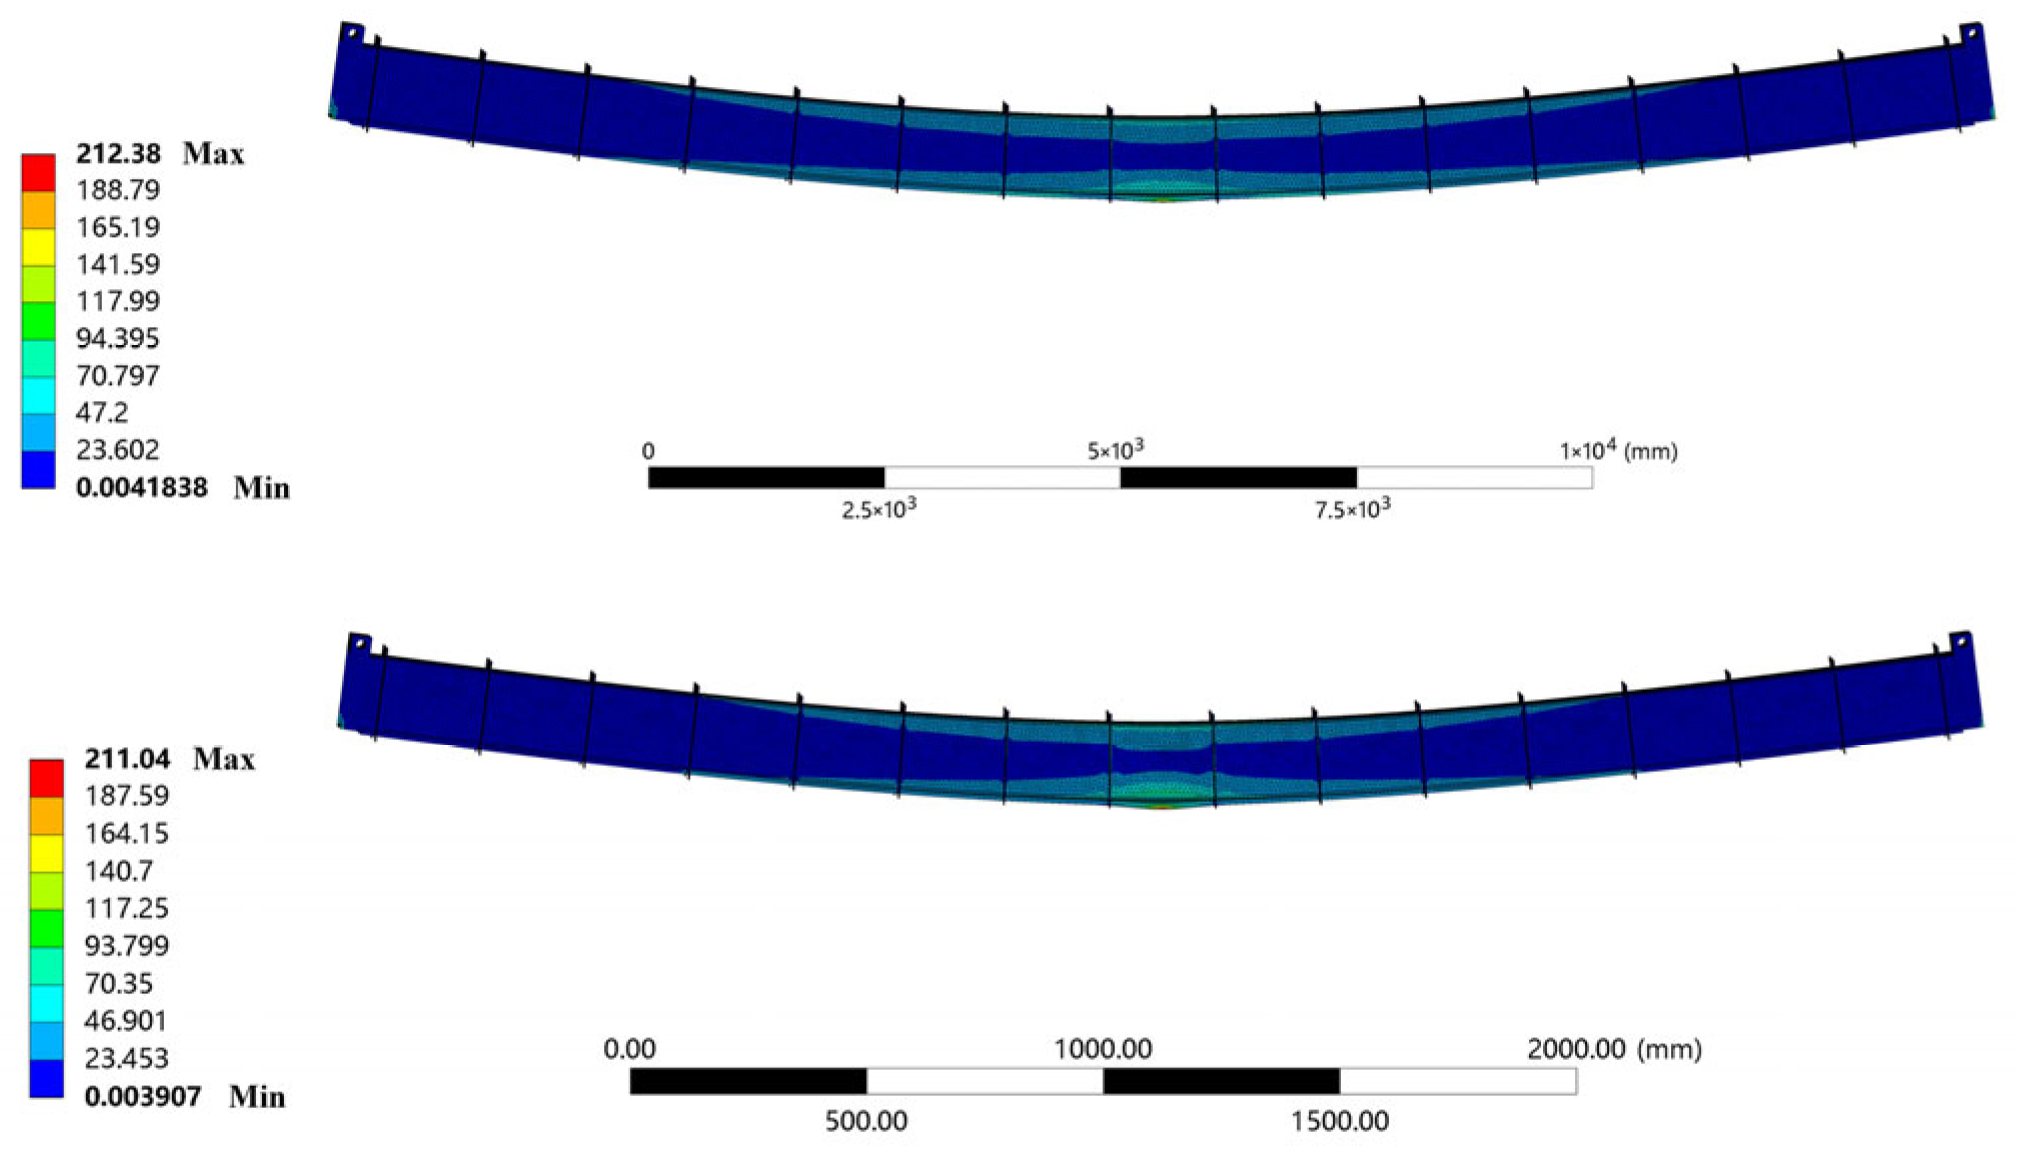
To capture the stress gradient variation within the weld toe transition zone, segmental finite element models of both the prototype and the 1:4 scaled track beams were developed using ANSYS Workbench 2023 R1. The beams were modeled with hexahedral solid elements to accurately represent the local stress distribution in the welded regions. Simply supported boundary conditions were applied at both ends, with vertical displacement constrained and one end fixed in the longitudinal direction to prevent rigid-body motion. The wheel loads, determined based on the similarity of physical quantities, were applied as uniformly distributed surface pressures of 16,000 N and 1000 N for the prototype and scaled models, respectively, simulating realistic wheel–rail contact behavior [
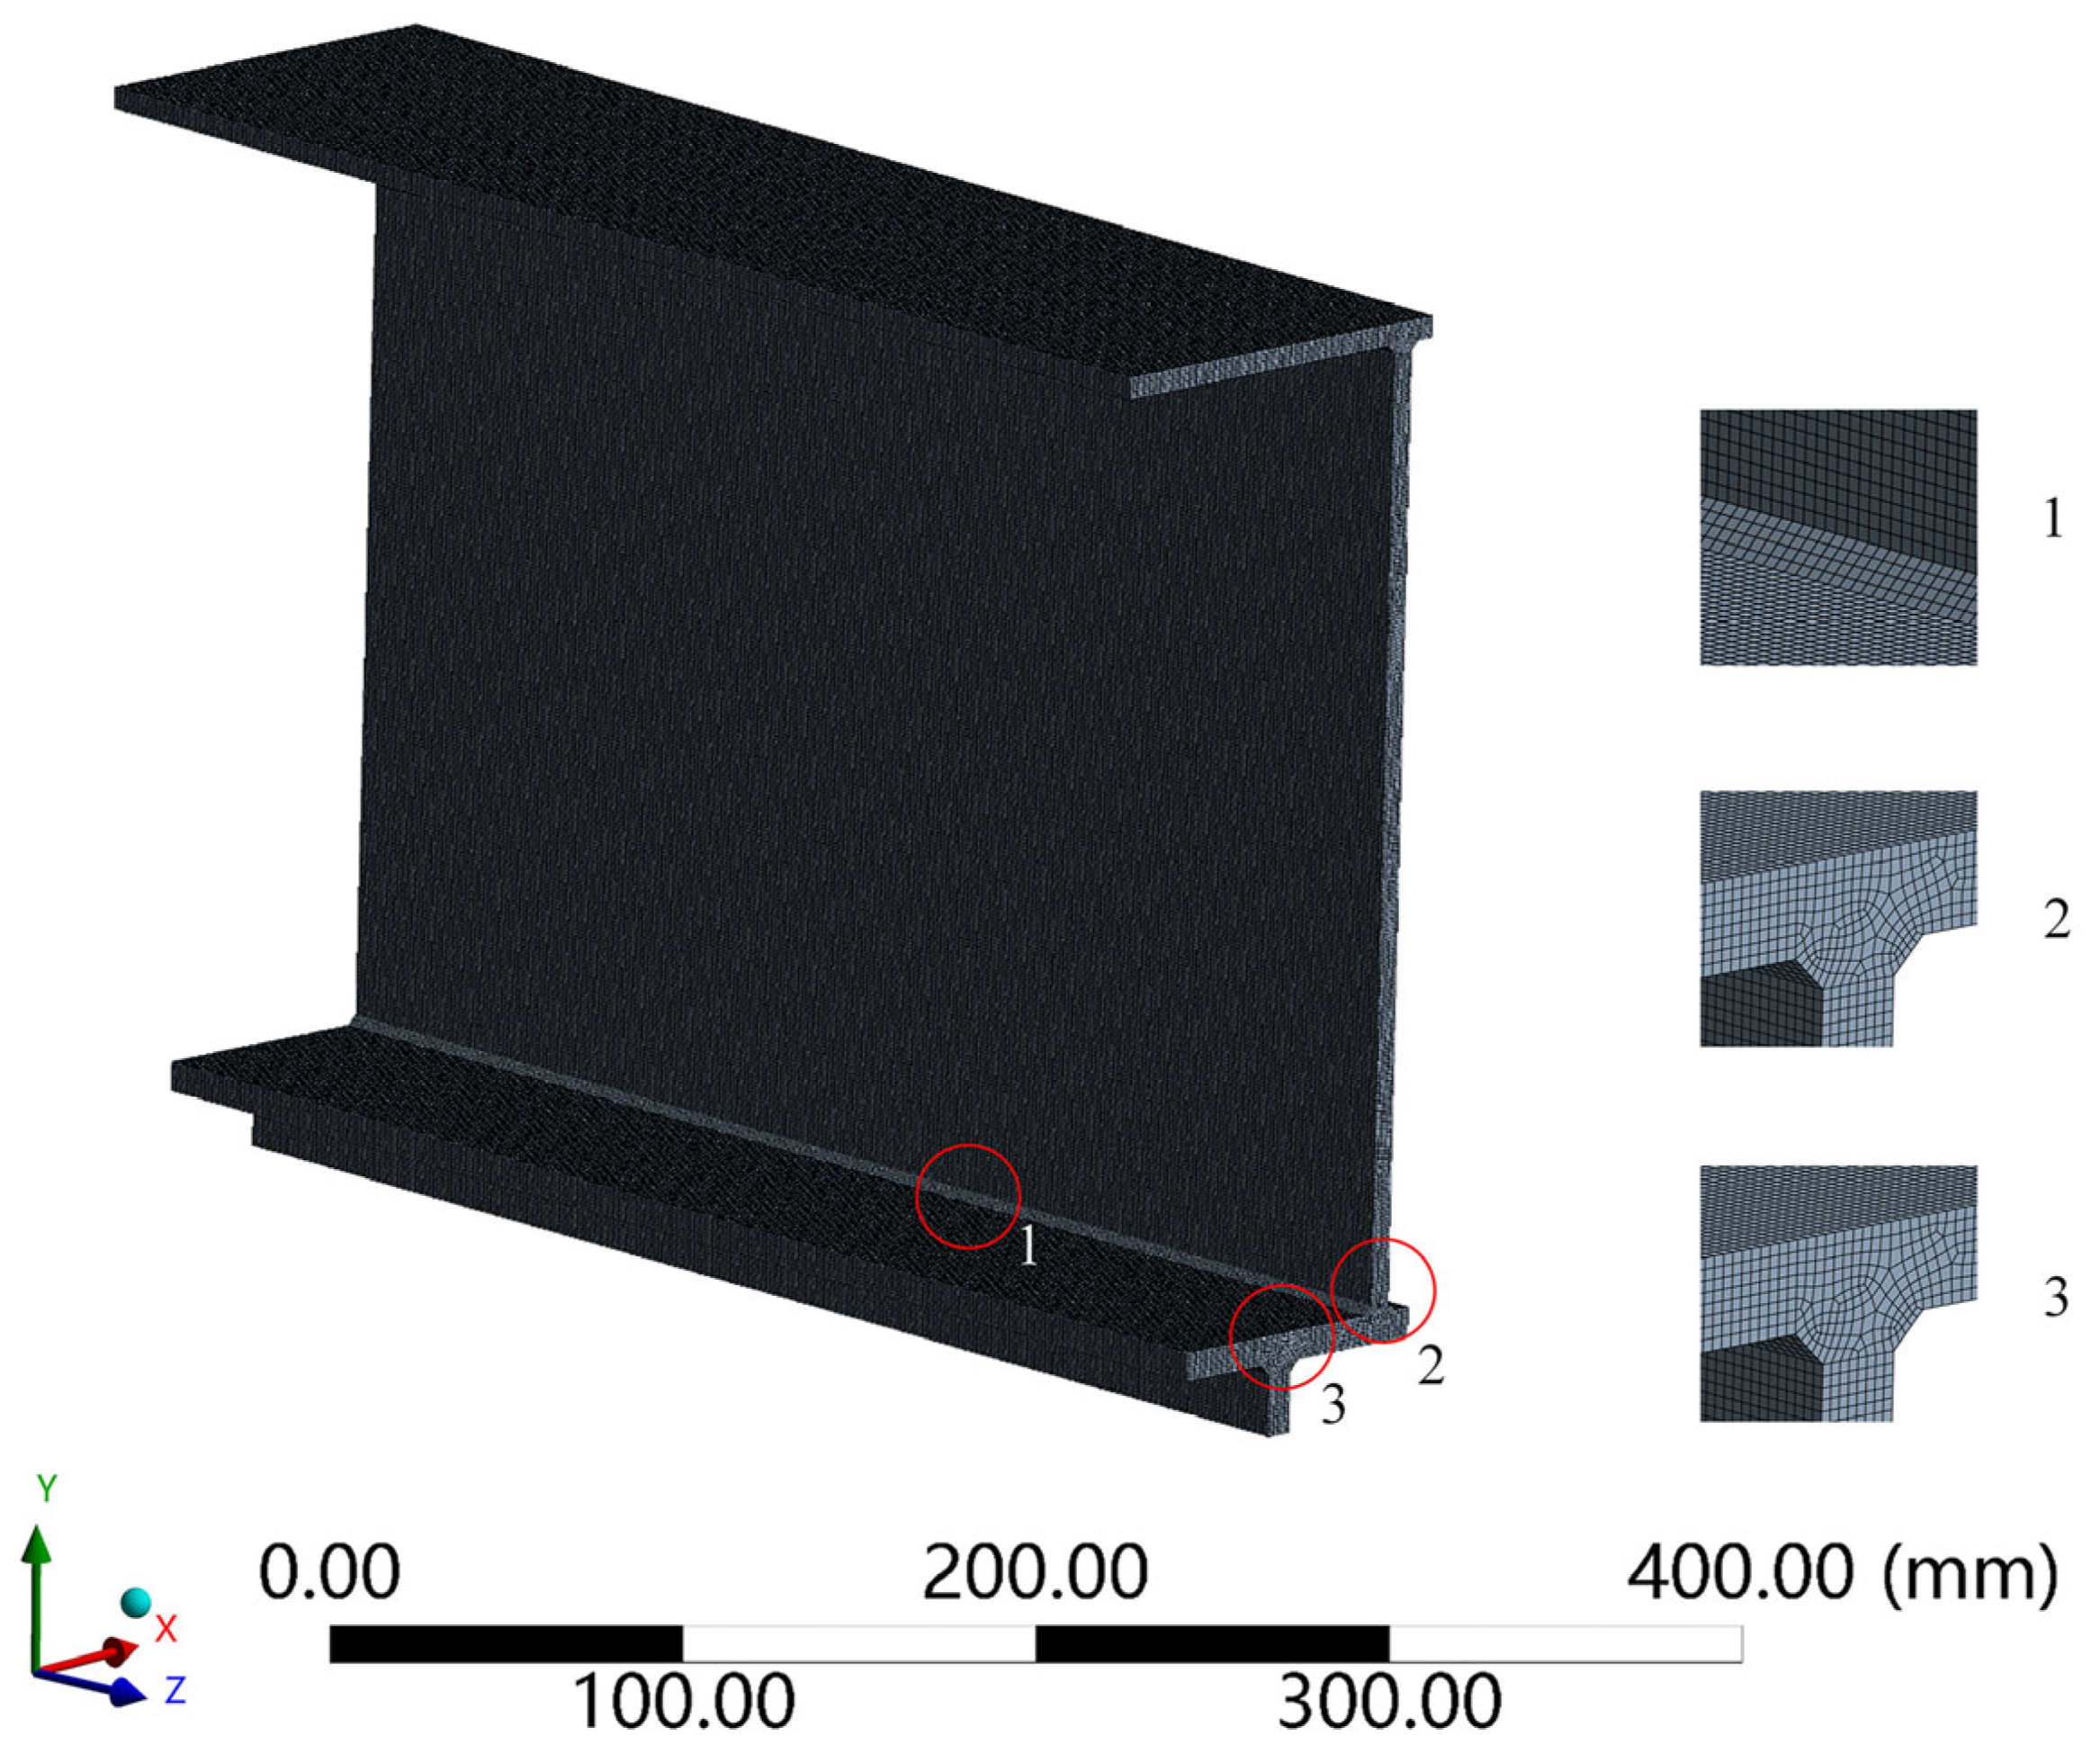
35]. A global mesh size of 1 mm was adopted for the scaled local model to enhance the accuracy of stress analysis, while the prototype local model employed a global mesh size of 4 mm to improve computational efficiency. The geometric configuration of the local model is shown in
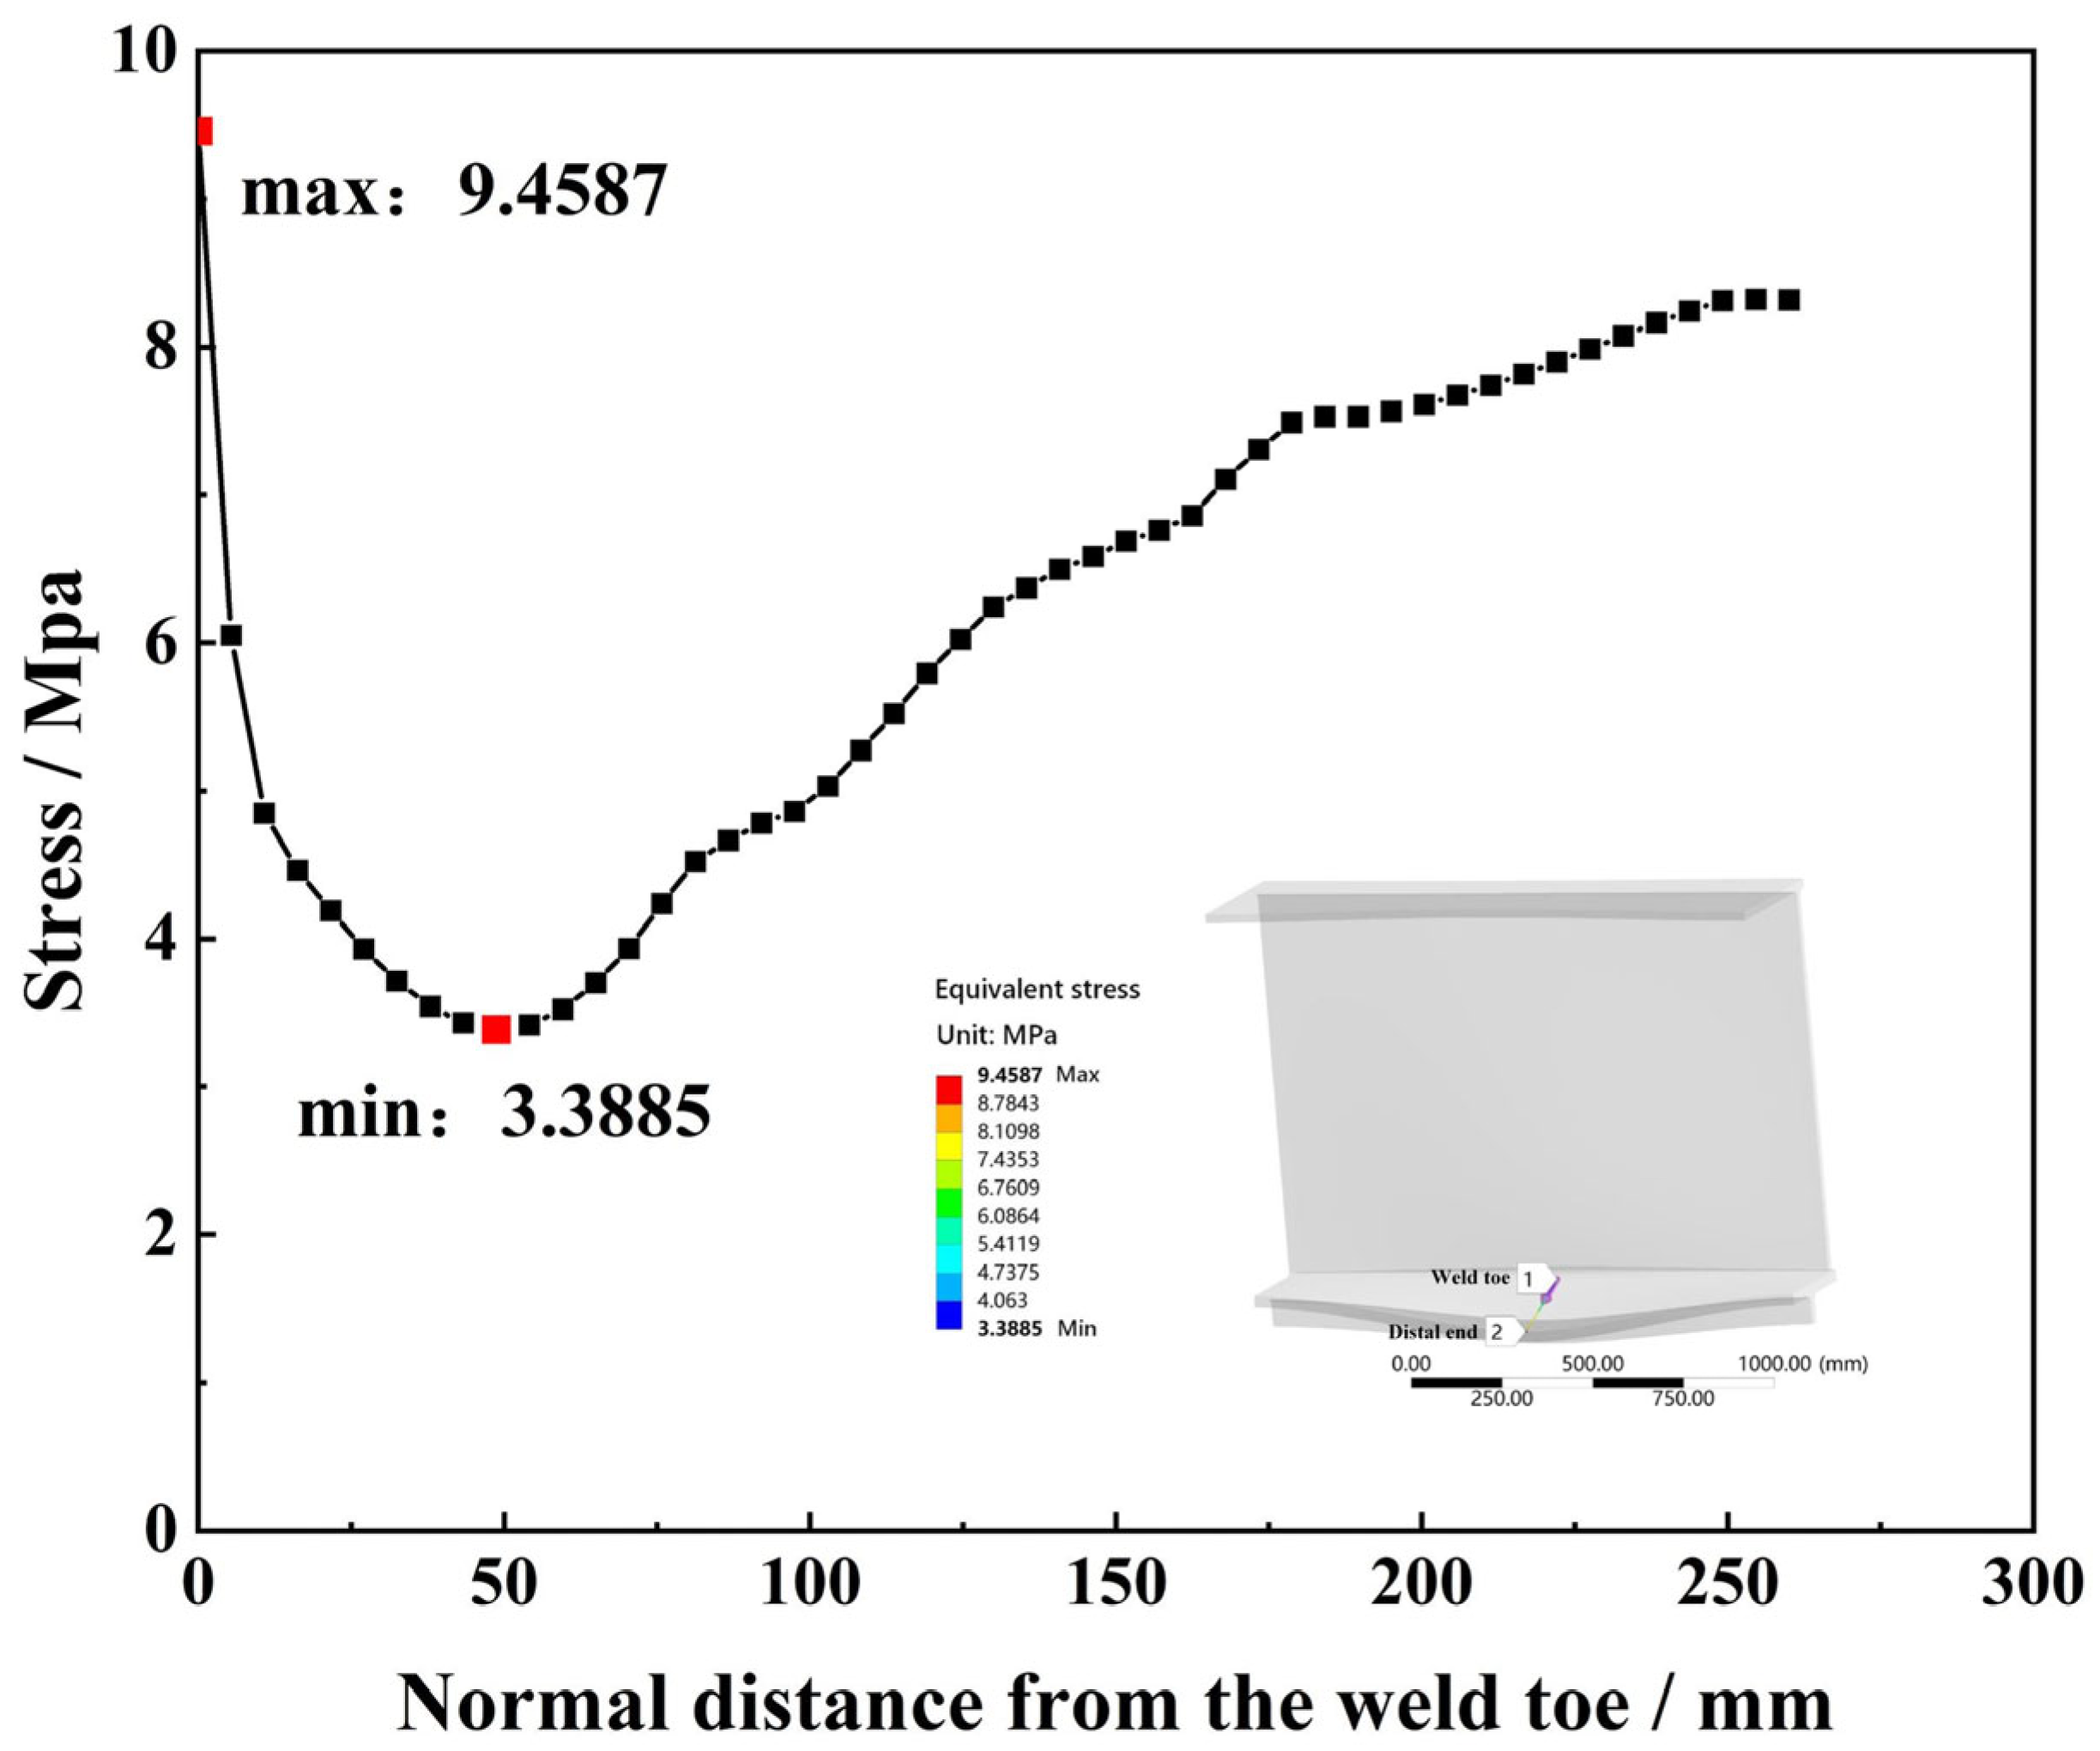
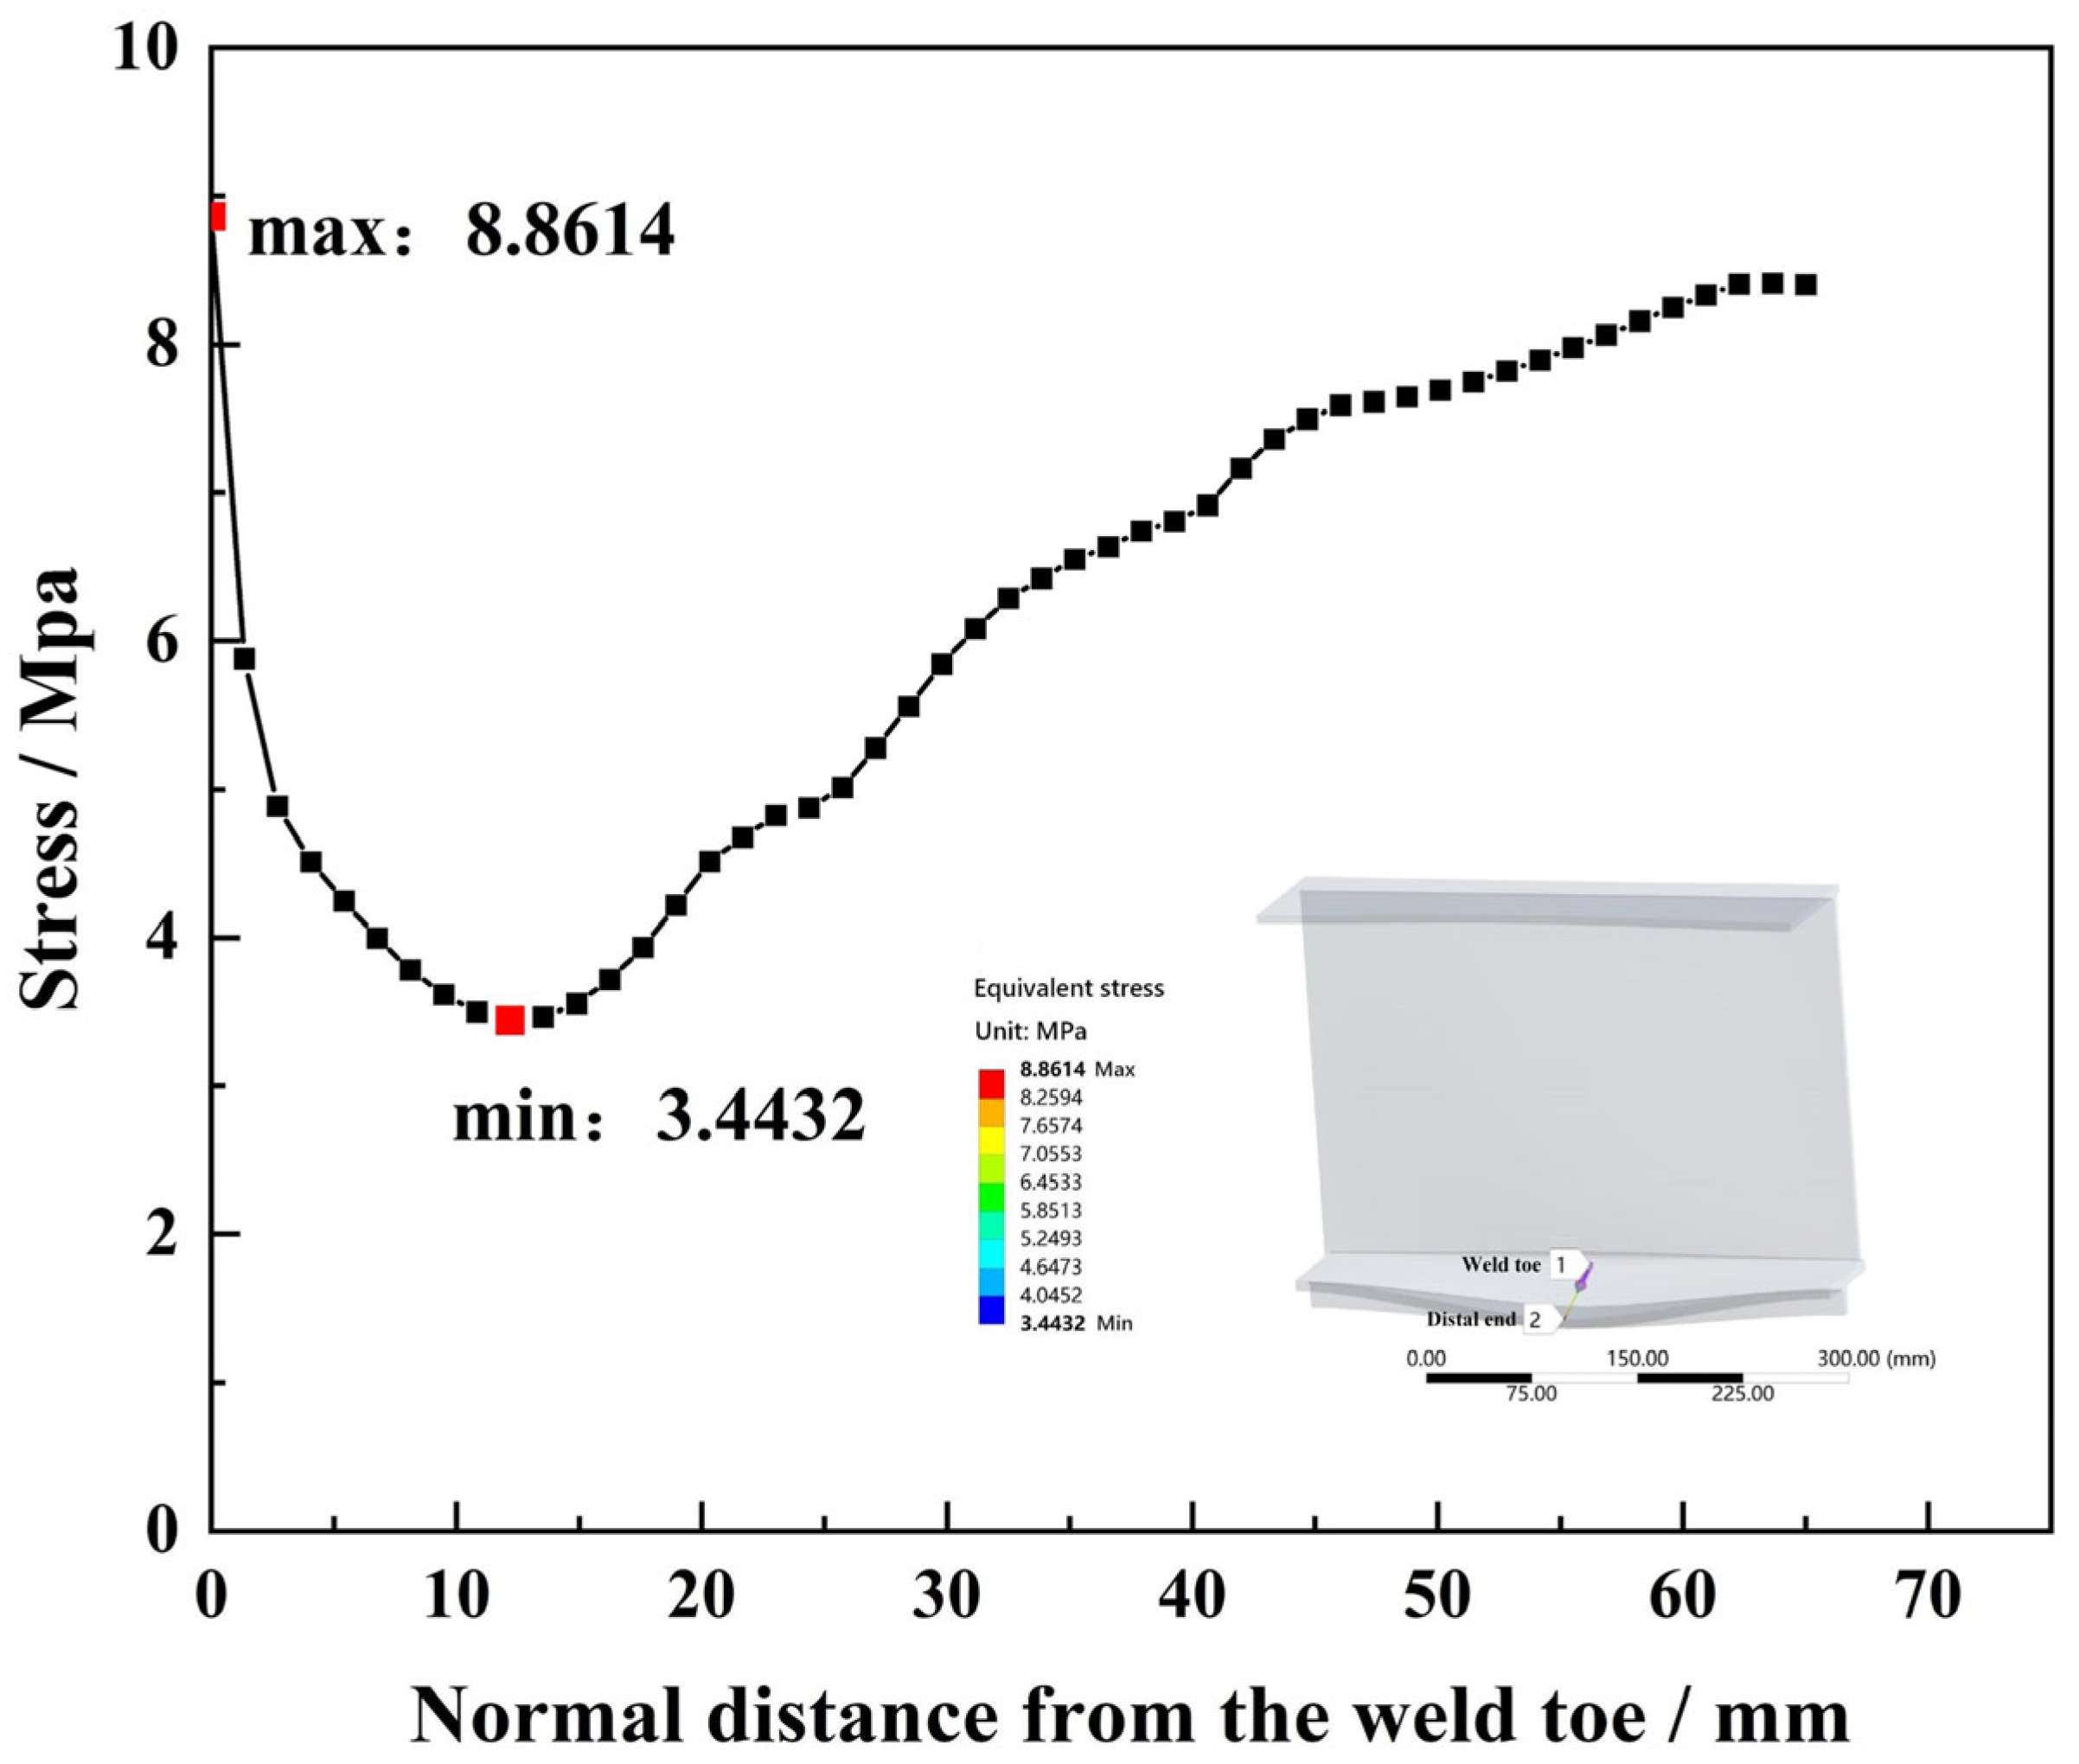
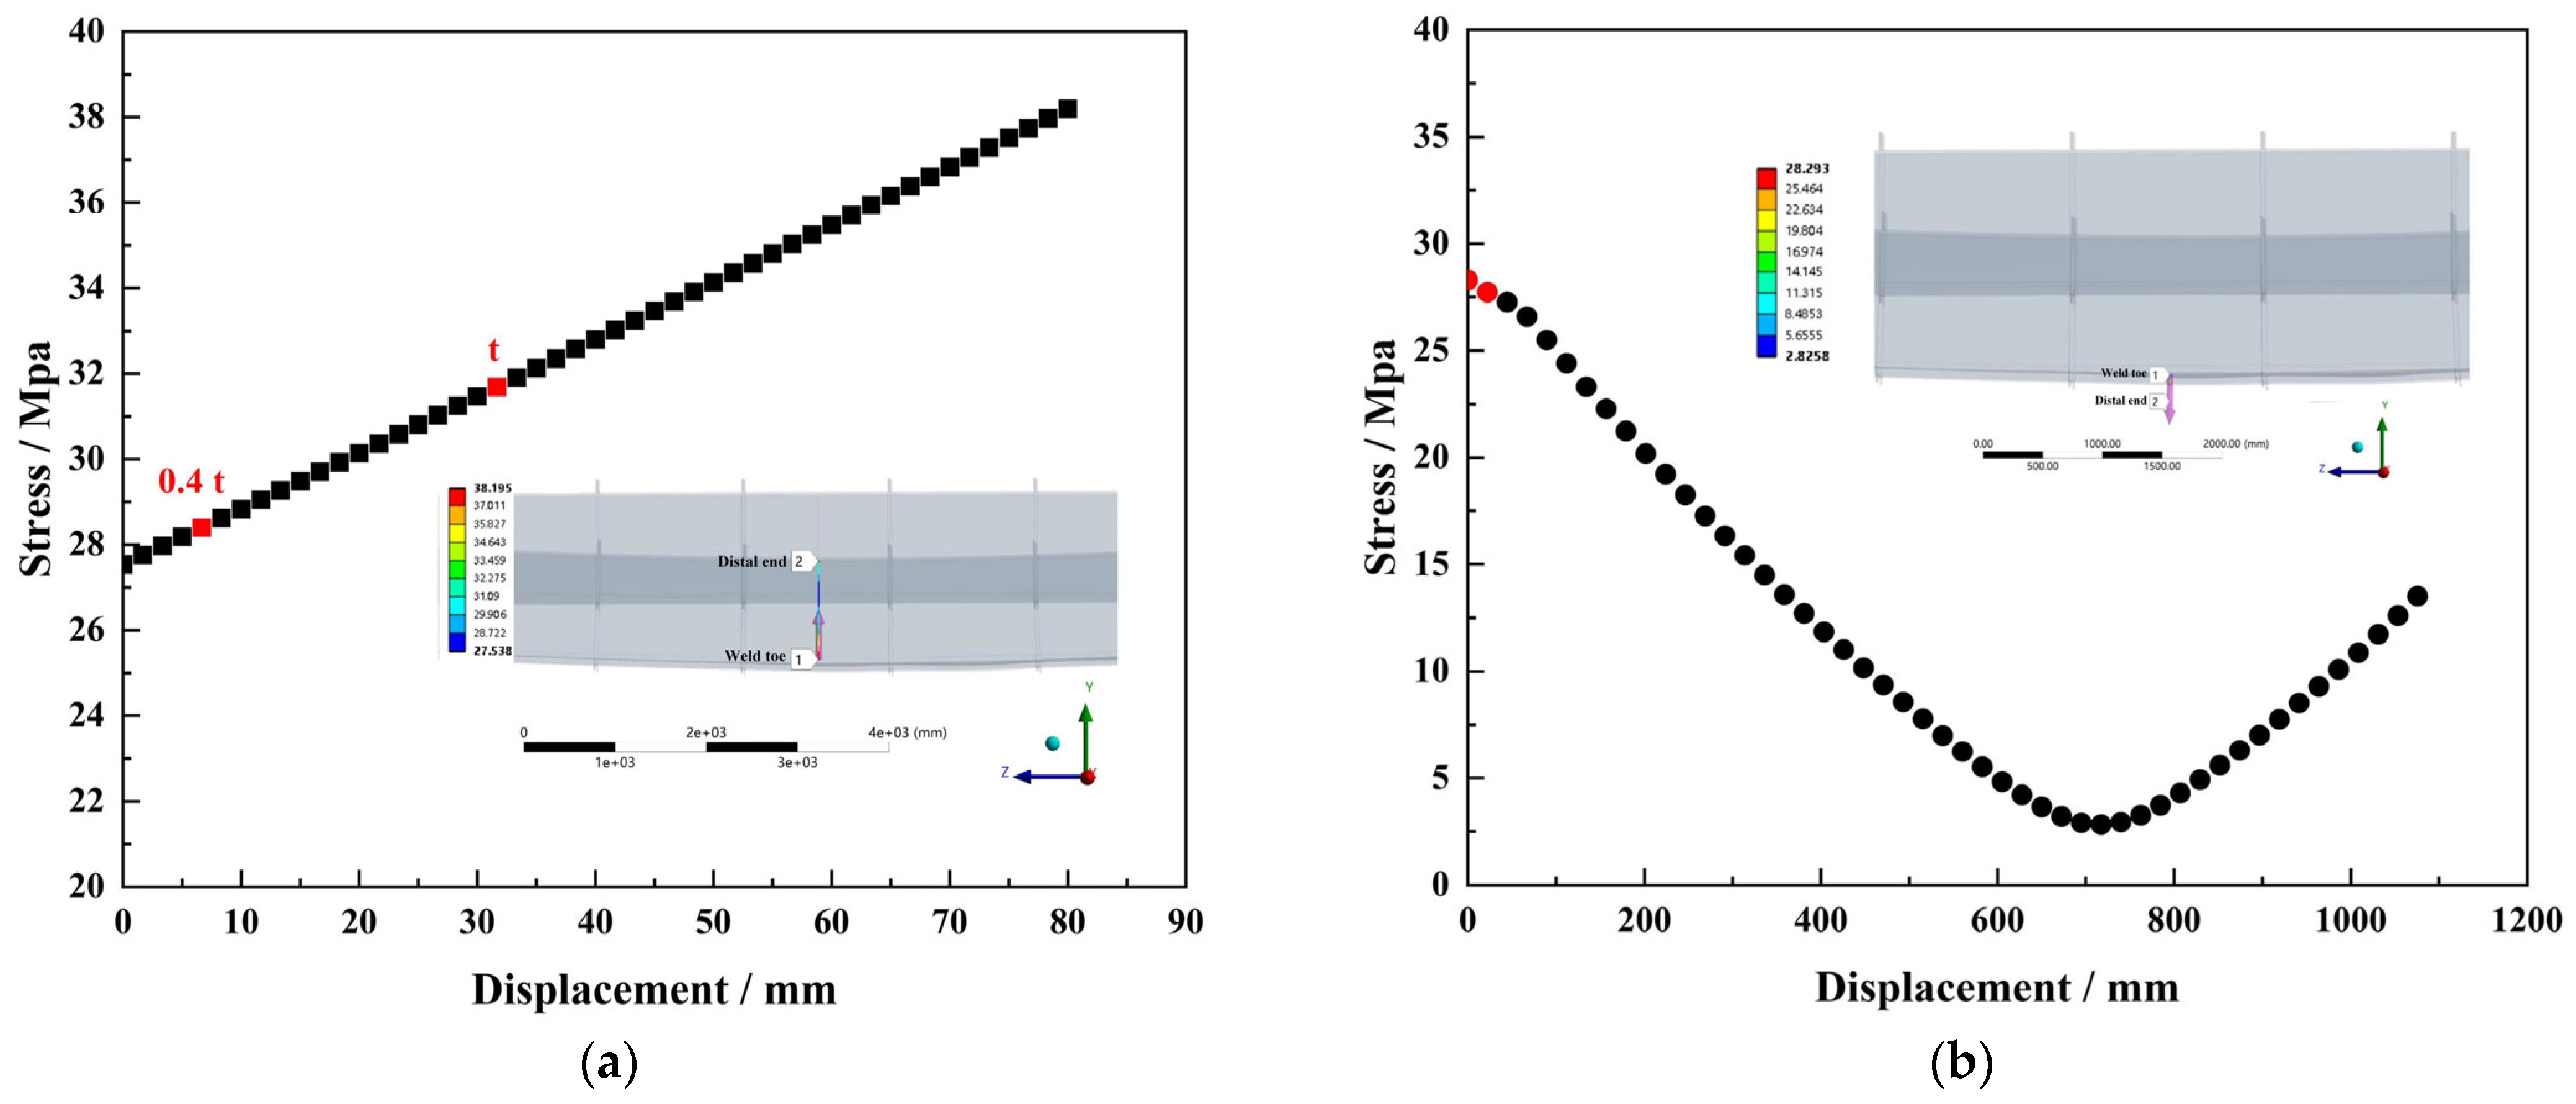
Figure 8. Both models exhibited consistent stress distribution patterns, confirming the reliability of the scaling method. The same material parameters (Q345qd) were assigned to both models to ensure consistency in mechanical behavior, verifying that stress variations mainly resulted from geometric scaling rather than material differences. Stress distribution data were extracted along the transverse direction of the running slab, and local stress gradient curves at the weld toe were obtained. The stress distribution results of the prototype and scaled models are presented in
Figure 9 and
Figure 10, respectively.
Further analysis of the path stress curves shows that along the normal distance from the weld toe (x = 0 mm), the local stress distribution trend of the scaled model closely matches that of the full-scale model. While the scaled model exhibits slightly lower stresses near the weld toe, this difference diminishes with increasing distance. Overall, the stress deviations between the two models are minor, with the maximum difference at the weld toe remaining within 7%.
When considering only the geometric characteristics of the weld, finite element analysis indicates that the stress concentration in the scaled structure is slightly lower than in the full-scale structure, though the difference remains minimal. Furthermore, the stress curves of both models nearly coincide at the stress measurement point, confirming that the scaled structural design has no significant effect on the stress magnitude of the specimens.
3. Test Results and Analysis
3.1. Experimental Observations
After 2 million fatigue loading cycles, two primary fatigue cracks were identified in the track beam specimen, designated as Crack #1 and Crack #2. The overall crack distribution is shown in
Figure 11.
Crack #1 was detected at approximately 1.45 million cycles at the junction between the longitudinal stiffener and the bottom surface of the lower flange plate near mid-span. The initiation point was located 30 mm to the right of the centerline, and the crack propagated in both upward and downward directions.
Crack #2 appeared at approximately 1.55 million cycles at the interface between the web and the top surface of the lower flange plate, also near mid-span. This crack initiated 48 mm to the right of the centerline and similarly propagated vertically.
The fatigue damage evolution of the specimen can be divided into four stages:
Initial undamaged stage: from the start of cyclic loading until the first visible crack appeared in the lower flange plate;
Flange-dominated cracking stage: from initiation of the first crack to complete fracture of the flange;
Transition stage of web crack initiation: from complete flange fracture to the initiation of the first visible crack in the web;
Web crack propagation stage: continuous development and extension of the web crack.
Fractographic observations revealed typical high-cycle fatigue features, including multiple parallel beach marks and a relatively smooth fracture surface near the crack initiation zone, gradually transitioning to a rougher morphology in the final fracture region. These features are consistent with fatigue failure under bending-dominated stress conditions.
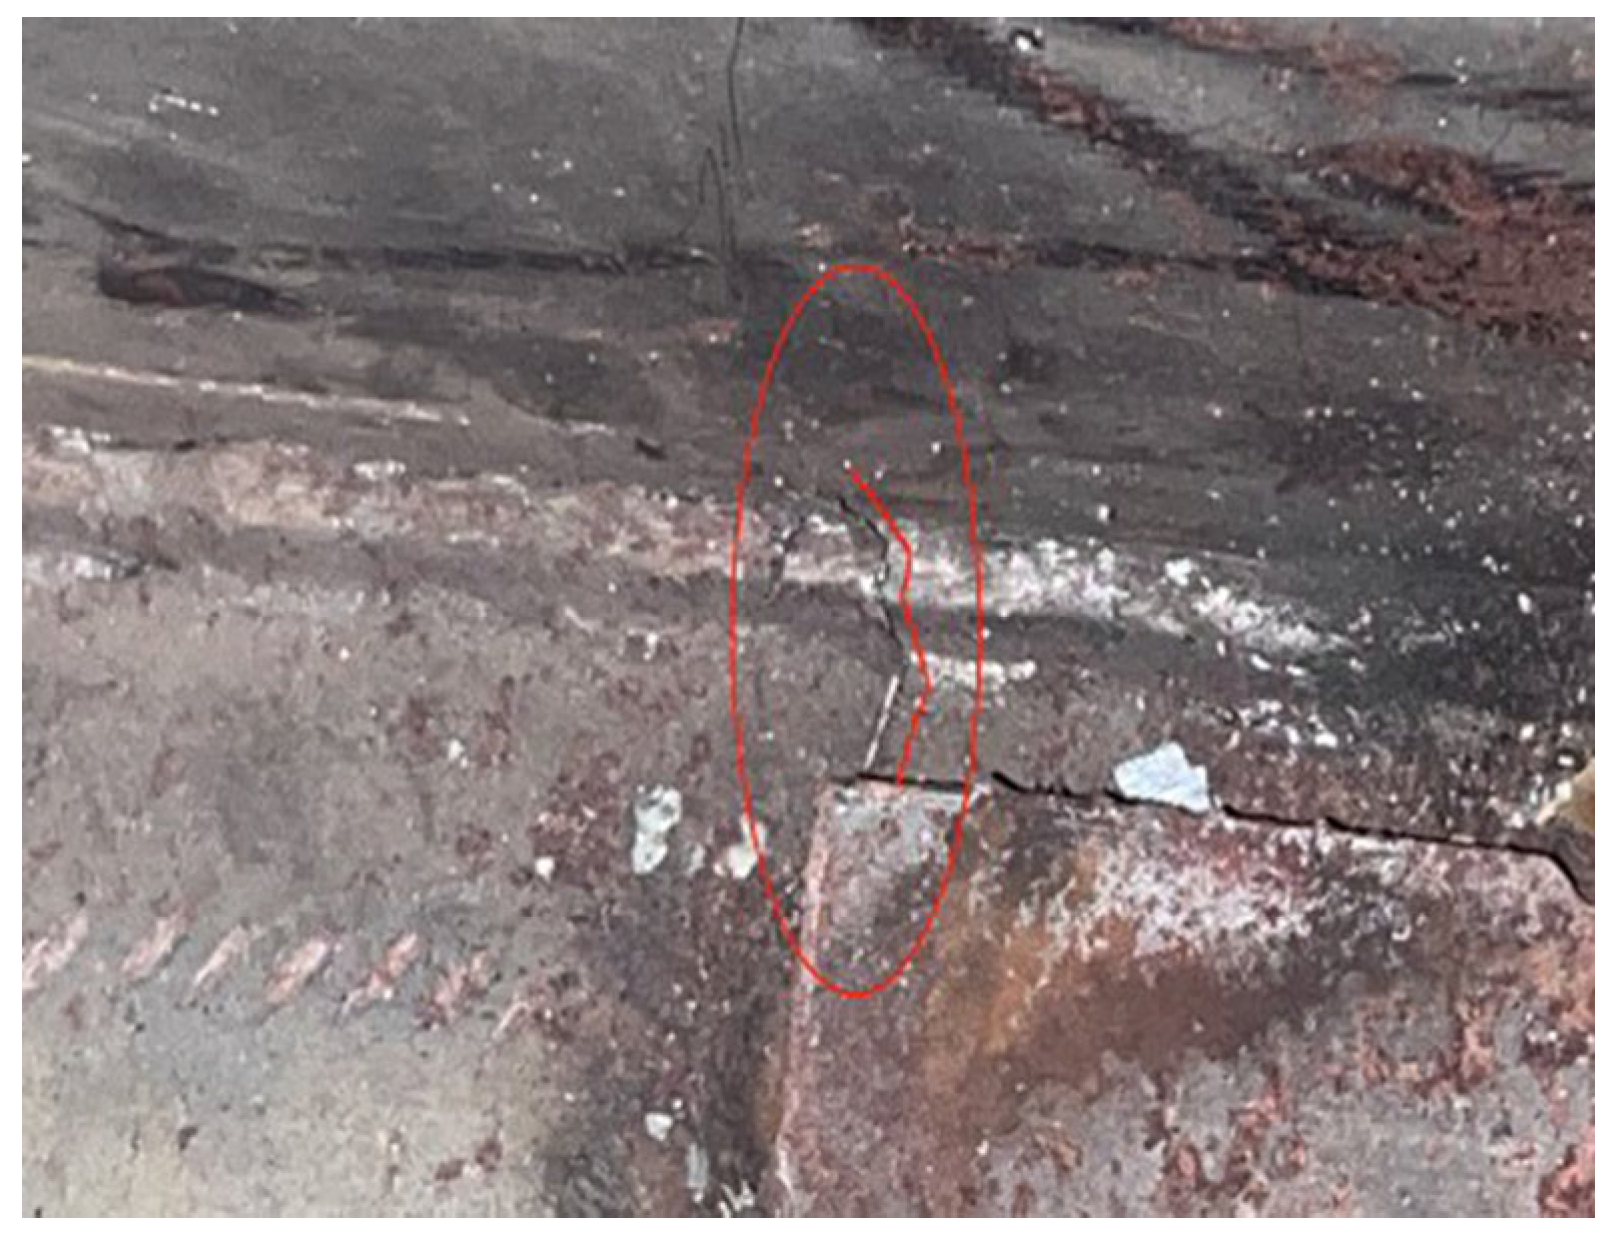
For safety reasons, the test was terminated before complete fracture of the web to avoid uncontrolled failure. Representative crack morphologies are illustrated in
Figure 12 and
Figure 13.
3.2. Experimental Results Analysis
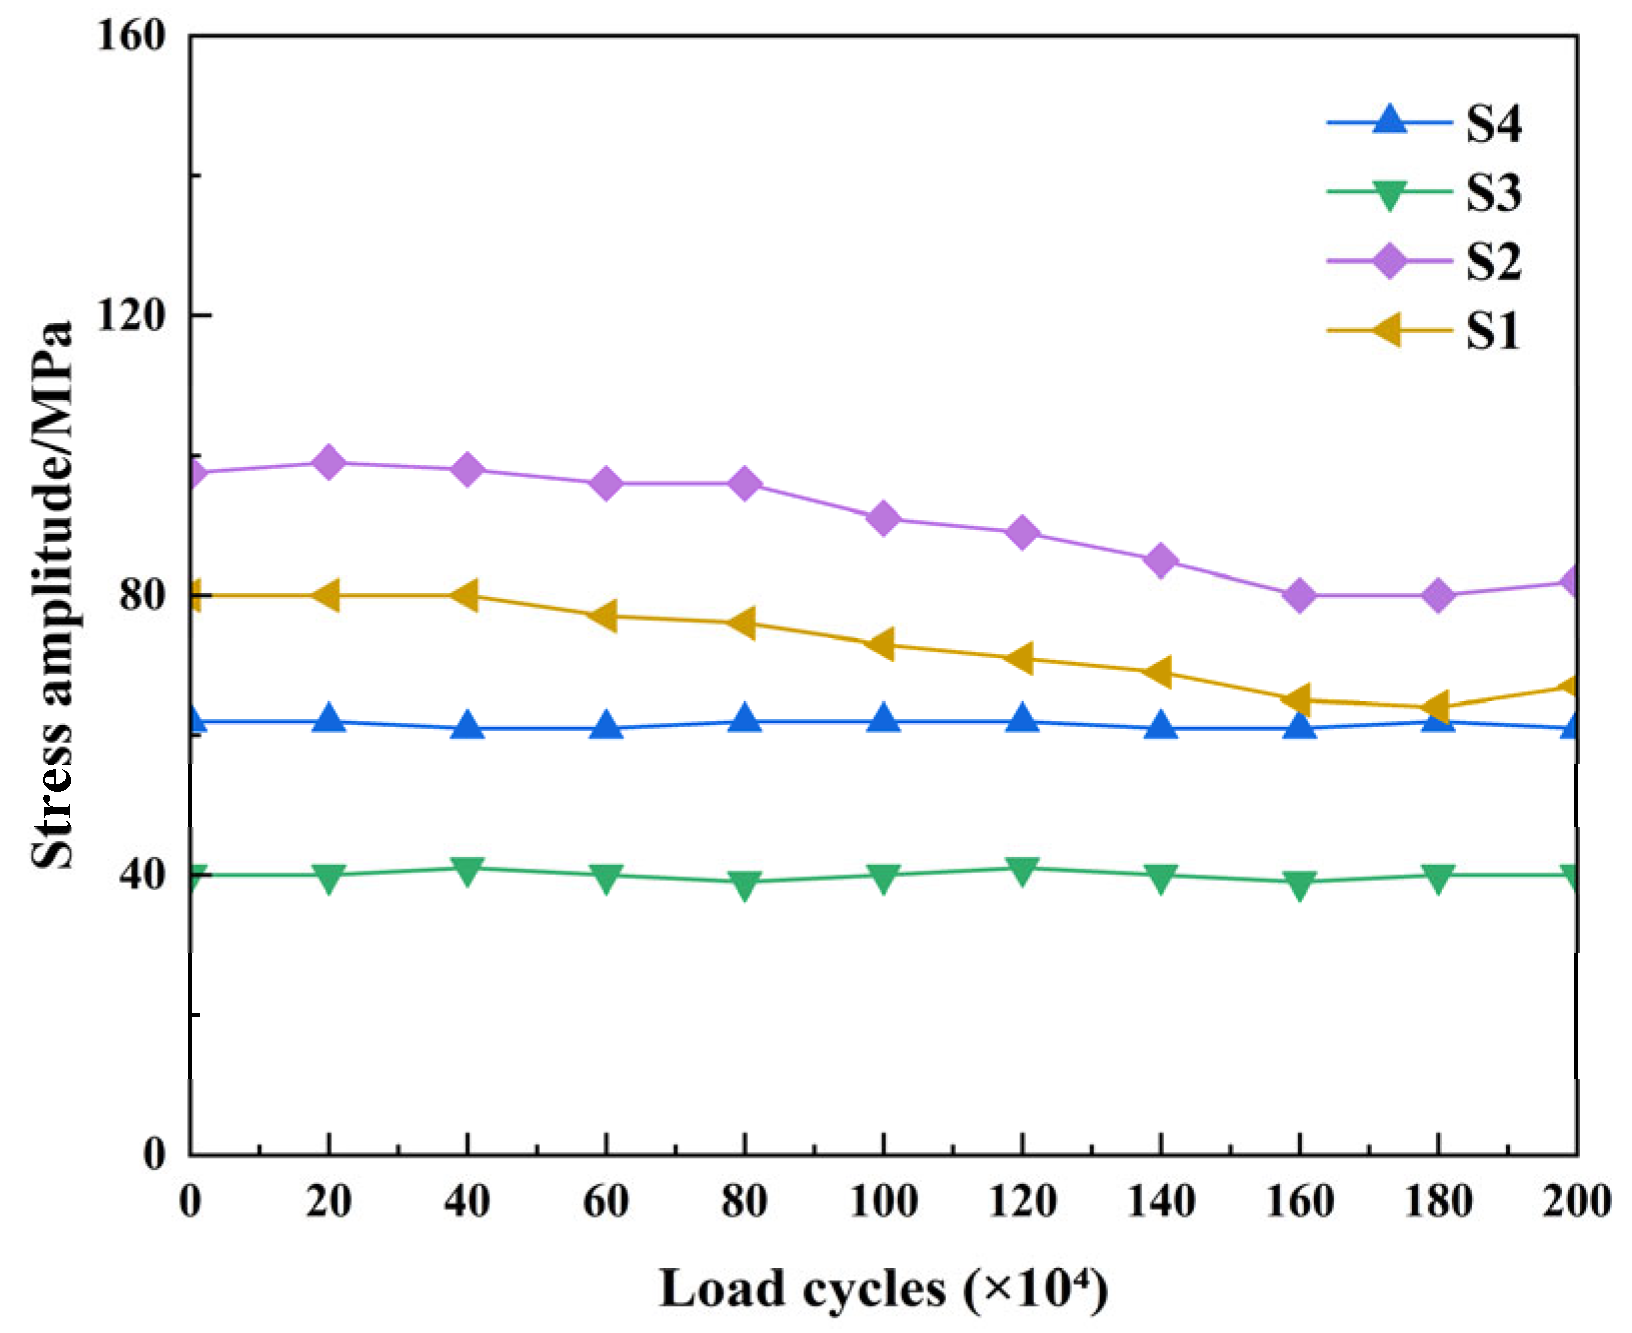
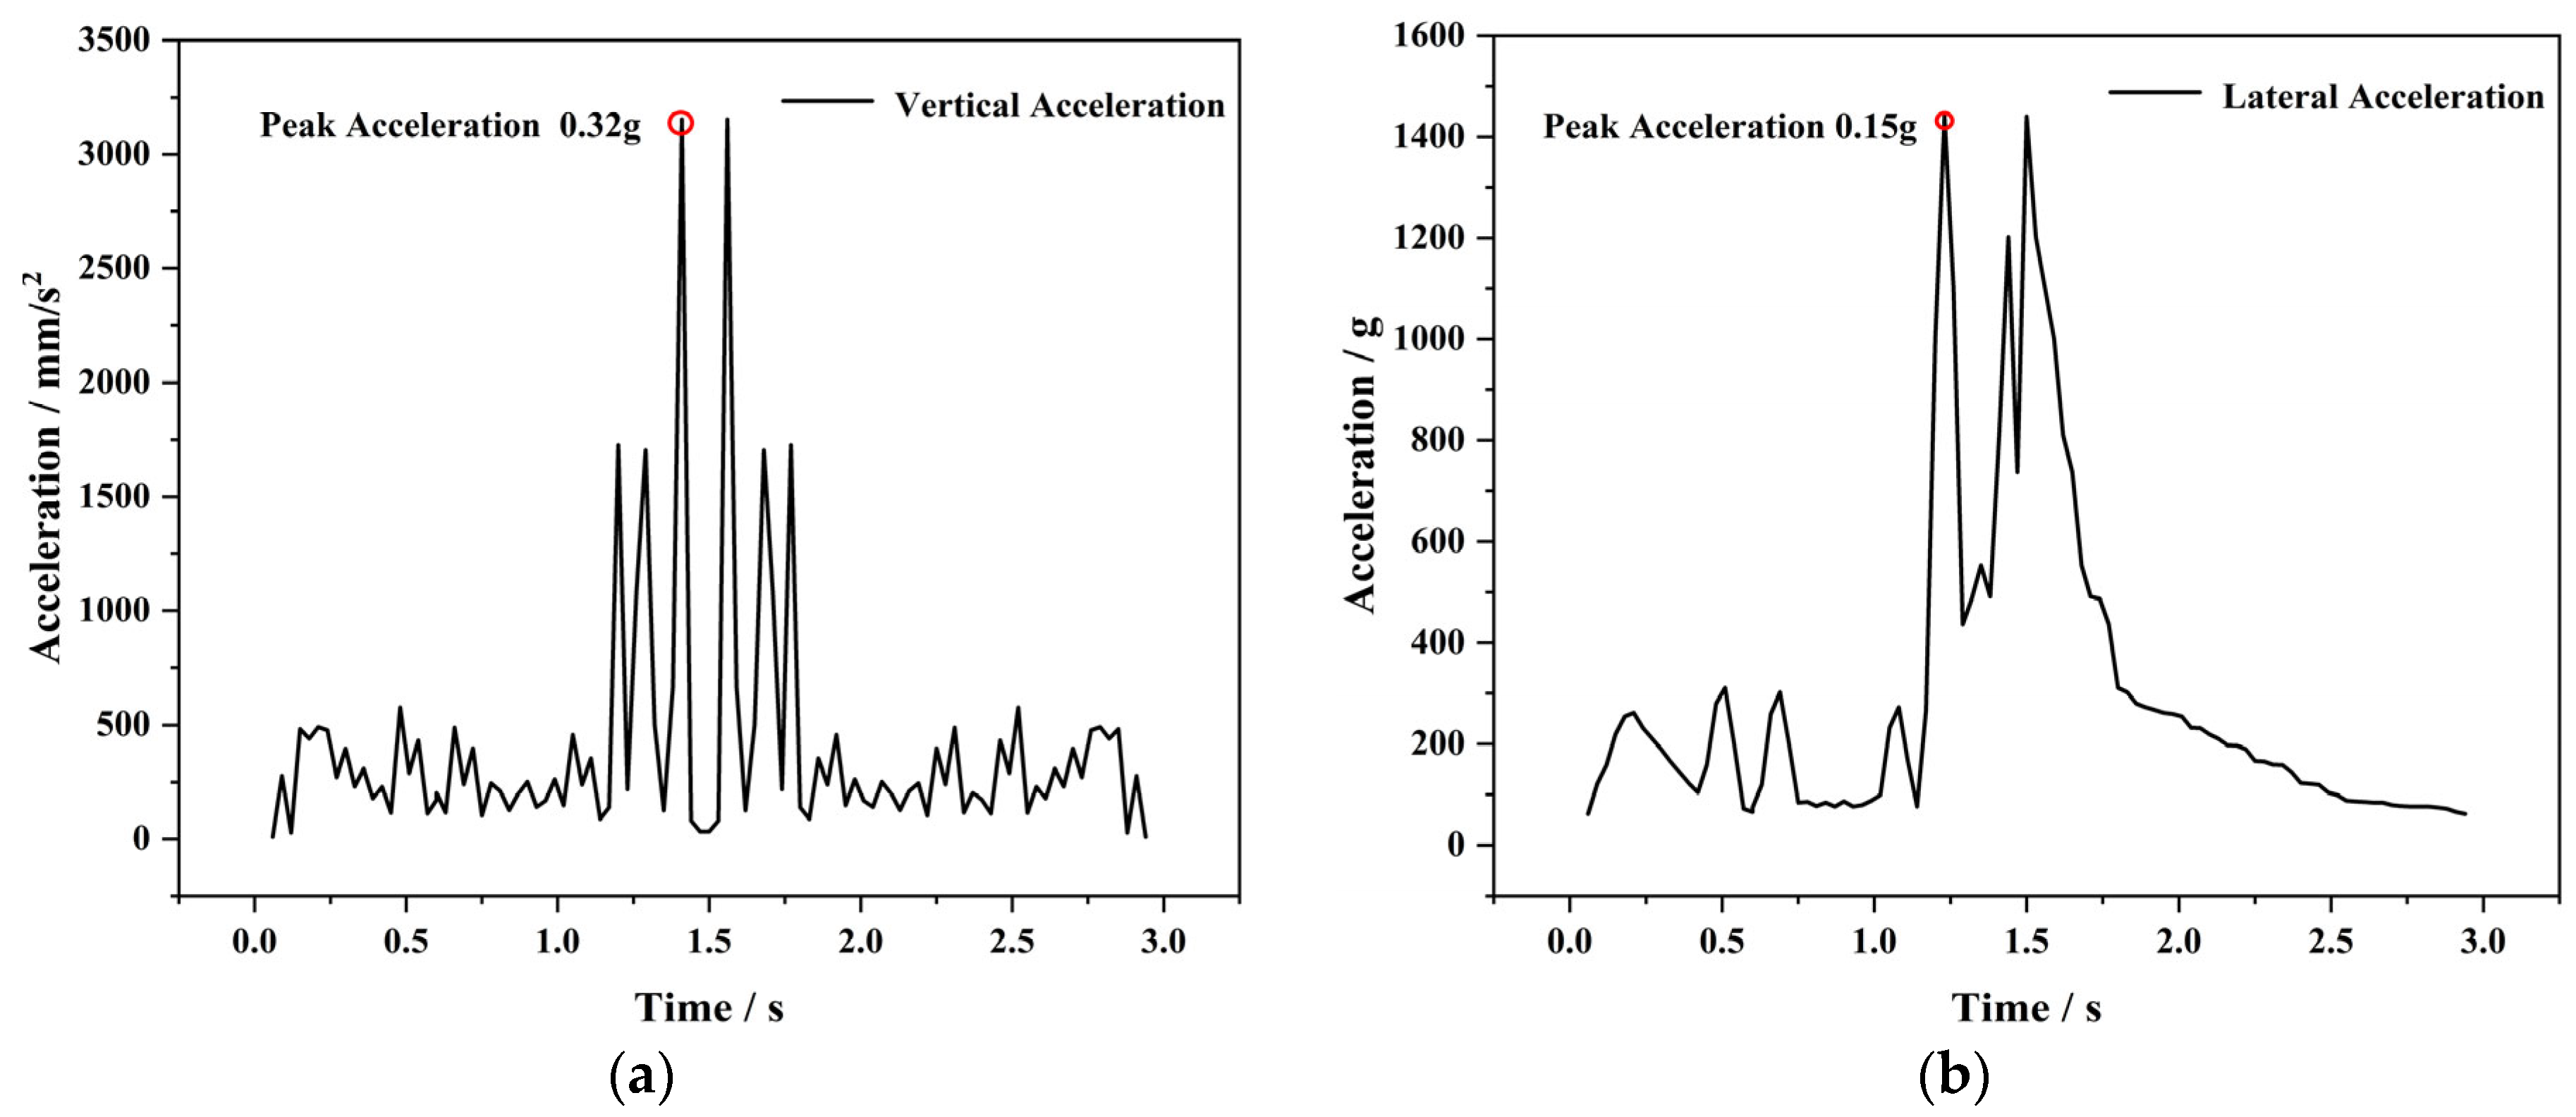
Based on the measurements from key strain gauges (S1, S2, S3, S4) and accelerometers, the initiation timing and stress amplitude evolution of each fatigue crack were analyzed. The variation curves of stress amplitude at these critical points during fatigue loading are shown in
Figure 14.
Before crack initiation (0 to approximately 0.7 million cycles), stress amplitudes at all measurement points remained largely stable, with only minor fluctuations, indicating that the overall structural stiffness had not degraded significantly. At points S1 and S2, stress amplitudes dropped by more than 10% around 1.5–1.6 million cycles, corresponding closely to the observed initiation of Crack #1 and Crack #2, respectively. This indicates that local fatigue damage had developed and the cracks had entered the propagation phase. In contrast, stress amplitudes at points S3 and S4 showed minimal variation throughout the loading process, confirming that no significant fatigue cracks formed at these locations.
The stress amplitude evolution after crack initiation can be summarized as follows:
Decreasing trend: Local stiffness reduction near the crack led to stress redistribution, resulting in a gradual decline in stress amplitude at the affected region as the number of load cycles increased;
Local increase phenomenon: At certain measurement points, a slight rise in stress amplitude was observed during the early stage before crack initiation, likely caused by local stress concentrations due to crack formation in adjacent regions;
No significant change regions: Measurement points located far from the cracks showed no notable variation in stress amplitude throughout the fatigue loading process, indicating a limited influence range of the cracks.
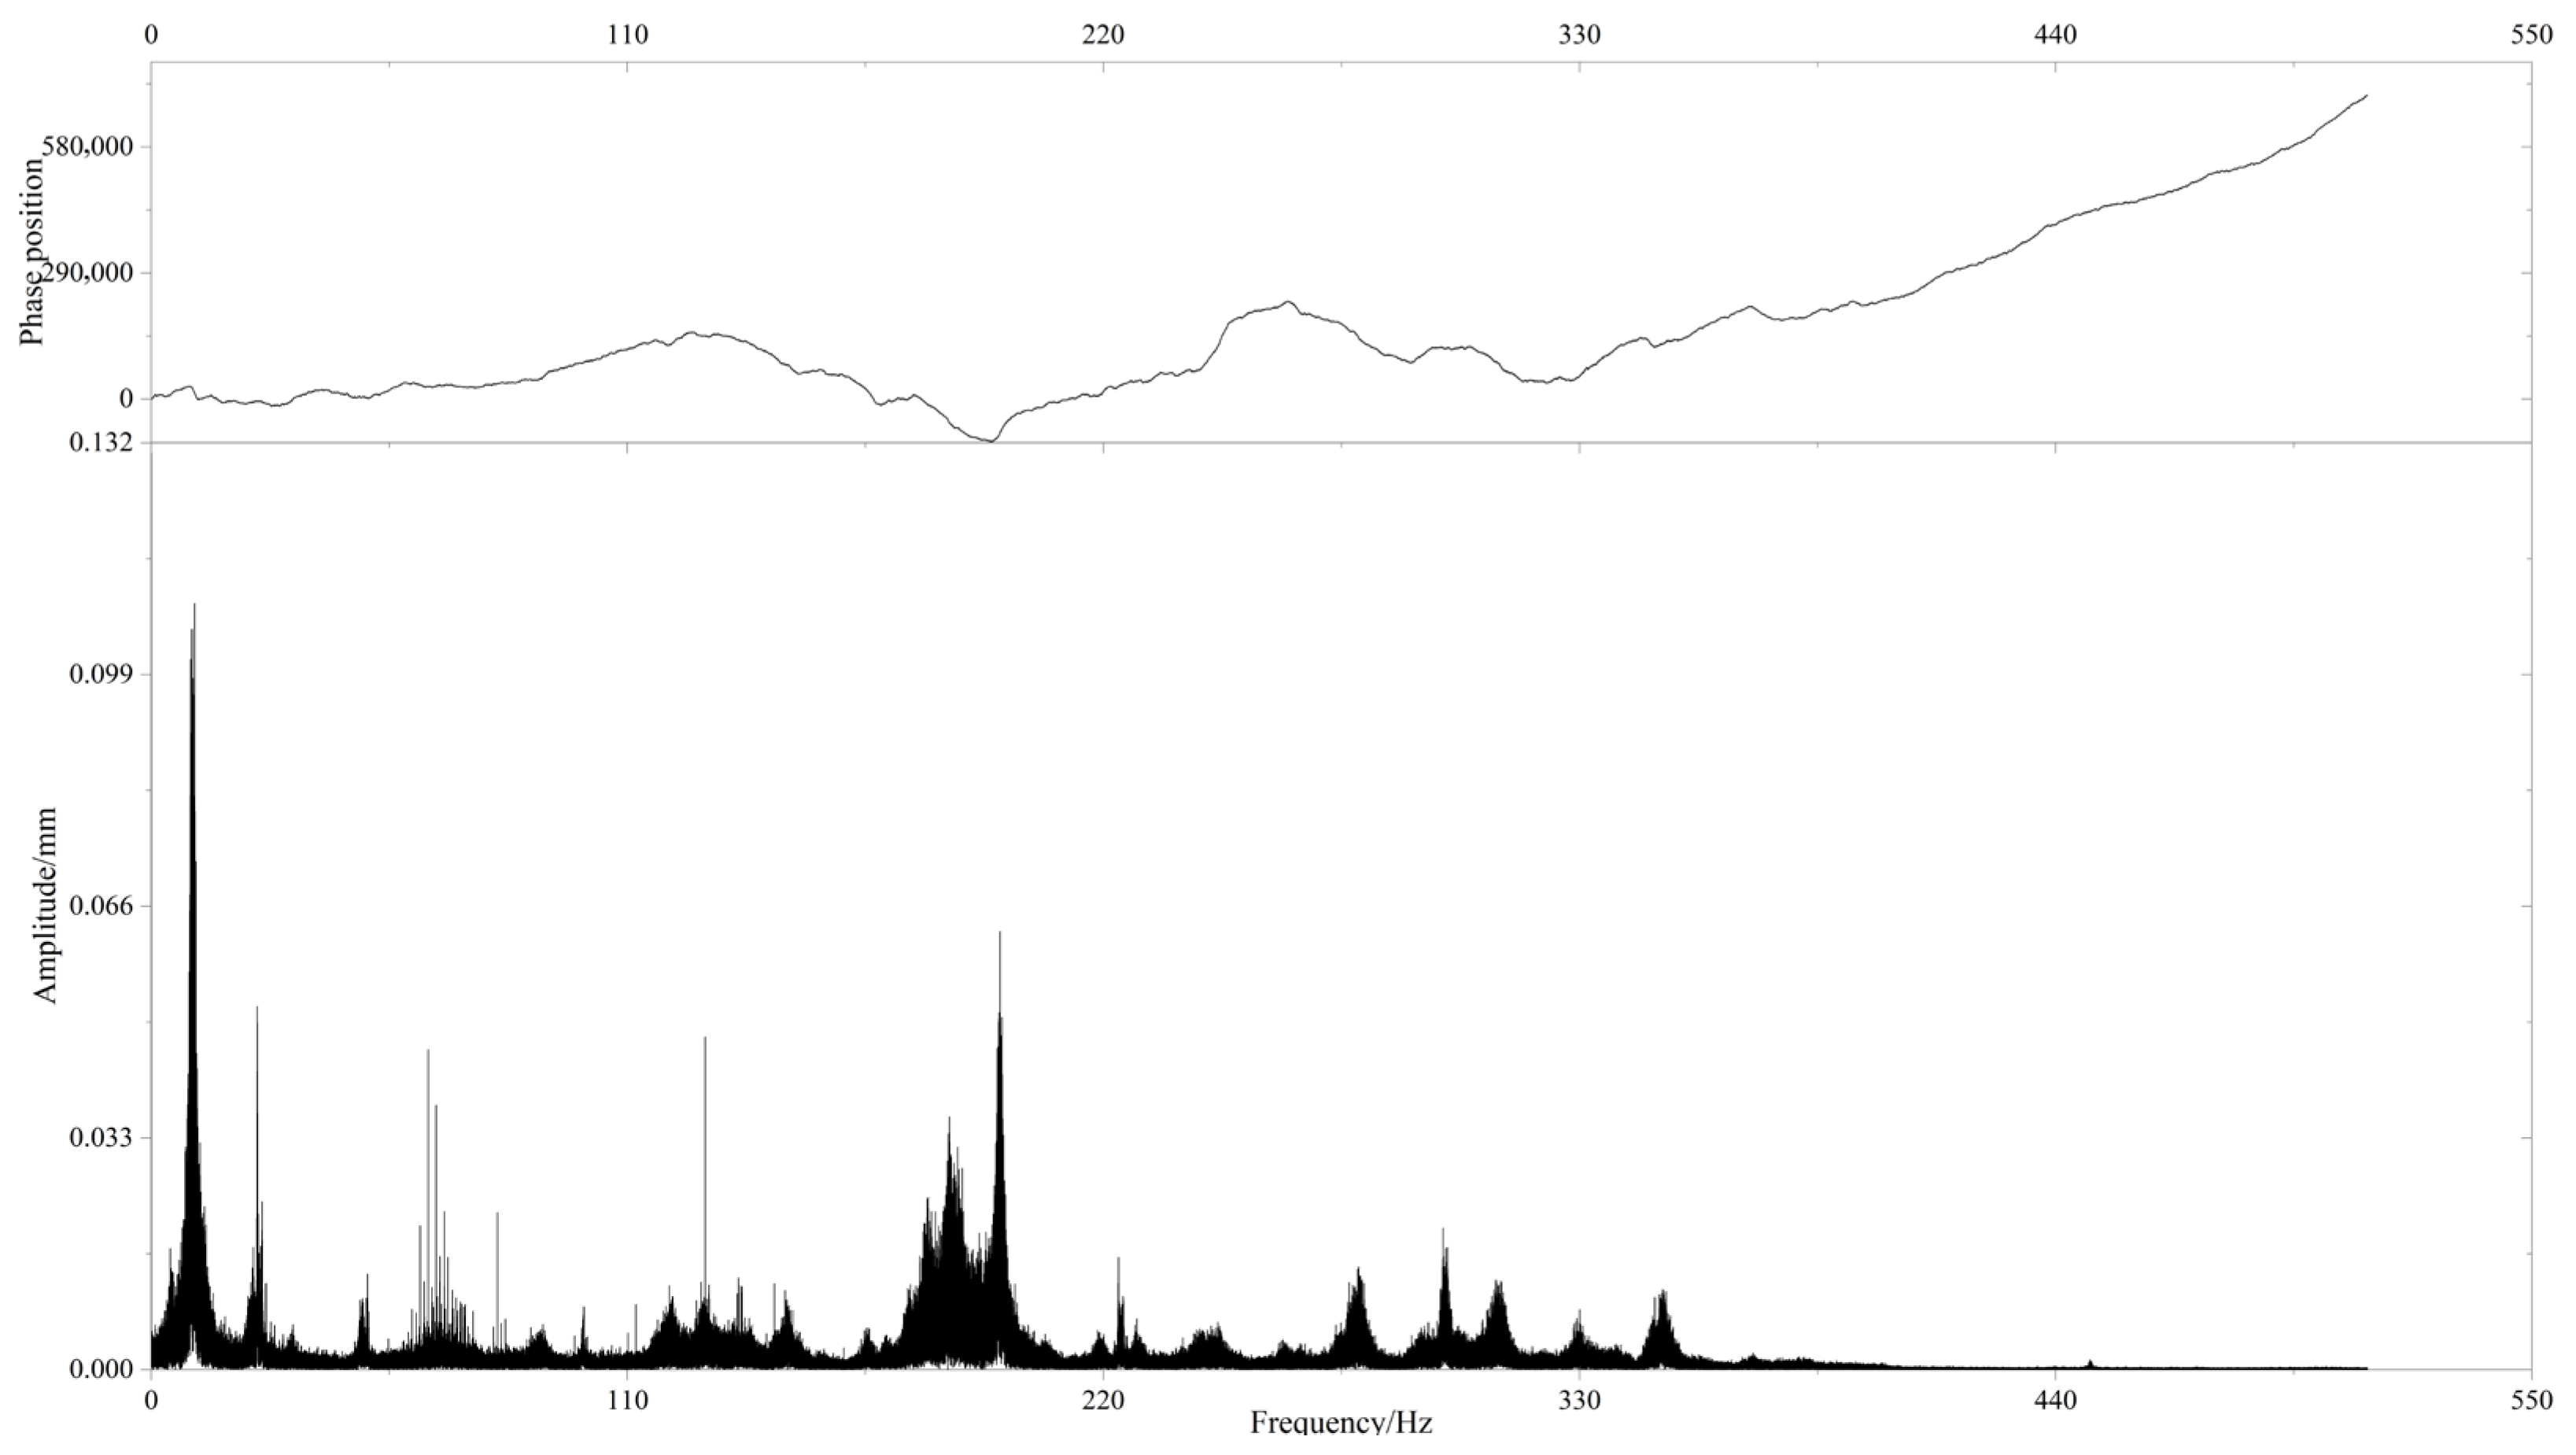
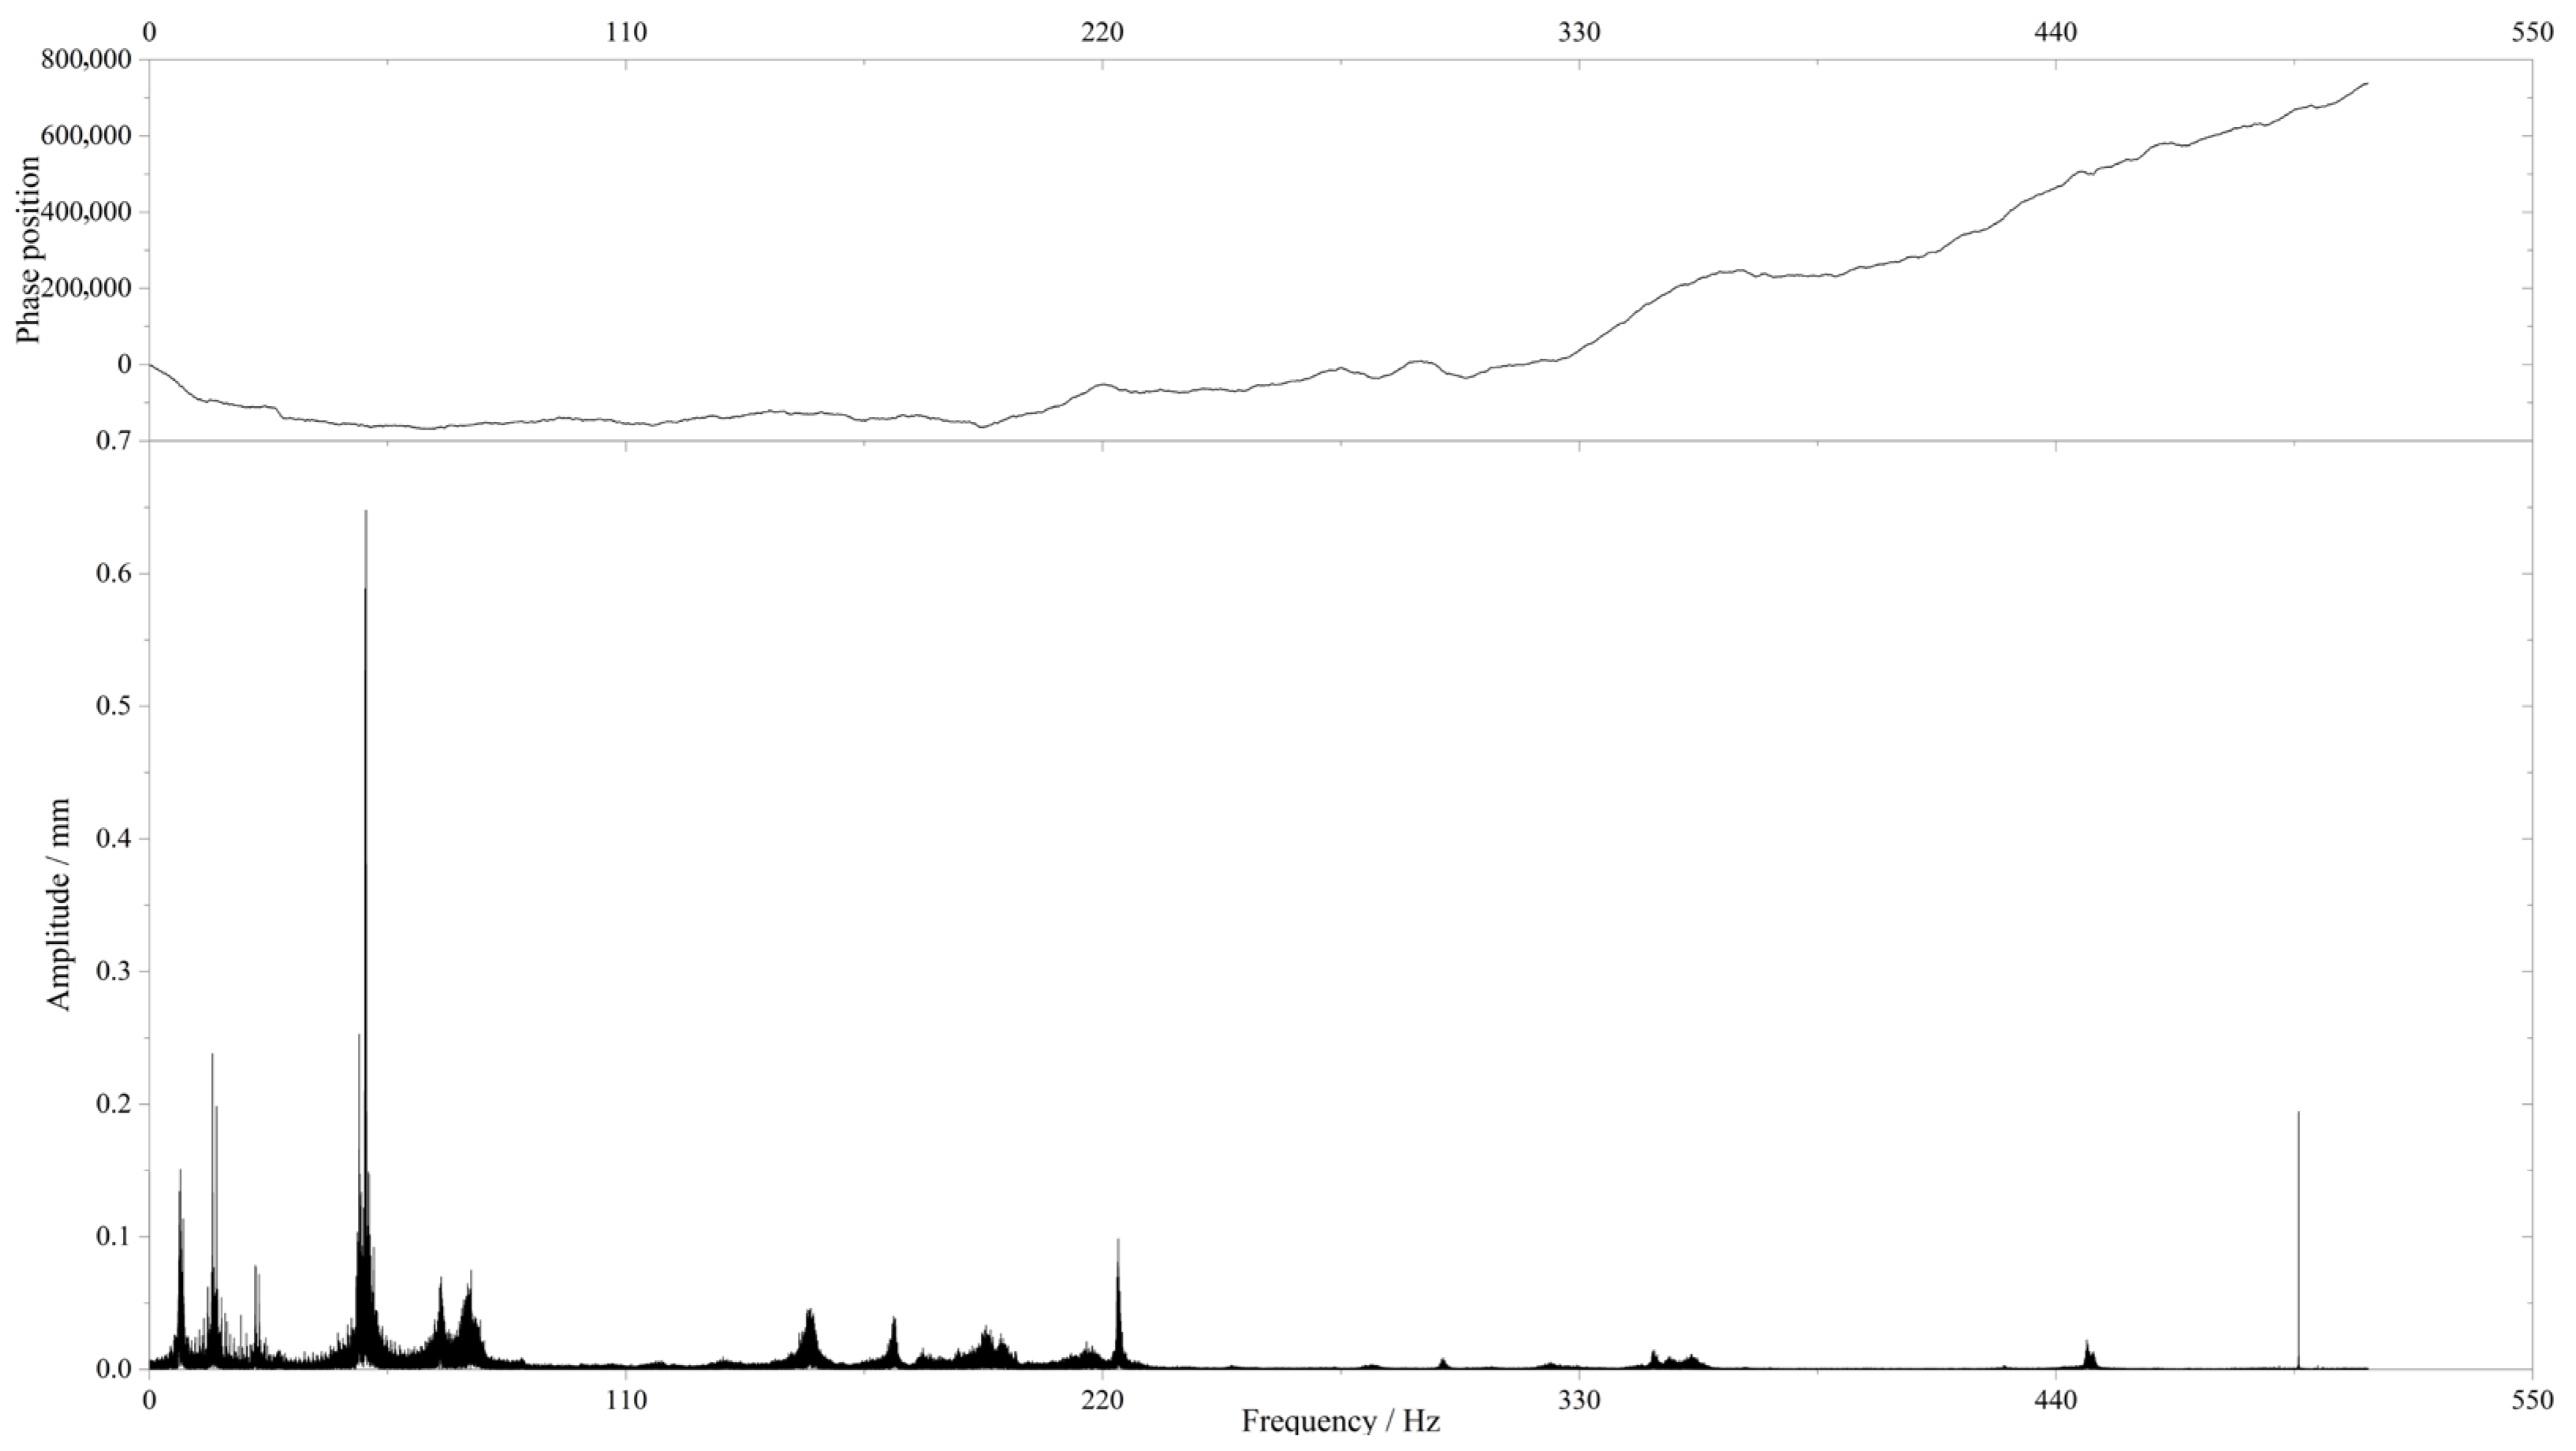
The modal analysis results are illustrated in
Figure 15 and
Figure 16. The modal characteristics in this study were obtained from measured dynamic response signals: accelerometers were placed at the mid-span of the specimen, and the test was paused at the initial loading stage (0 cycles), during the key crack initiation stage (approximately 1.5 million cycles), and at the end of the test (2 million cycles) to record free vibration decay signals. Frequency spectrum analysis was then used to extract the natural frequency and vibration amplitude variations. The results highlight that during the first 1.5 million cycles, the natural frequency at mid-span decreased from 10.04 Hz to 7.31 Hz, while the vibration amplitude increased from 0.11 mm to 0.15 mm, further confirming that structural damage had occurred at approximately 1.5 million cycles.
This approximately 3 Hz reduction in natural frequency is mainly attributed to localized stiffness degradation near the mid-span weld region rather than a significant loss of global section properties. As shown in the frequency spectra, the global resonance peaks remained nearly unchanged, whereas the local resonance peak originally located near 70 Hz in
Figure 15 shifted leftward to approximately 50 Hz in
Figure 16 as the crack propagated. This leftward shift reflects the sensitivity of local dynamic responses to stiffness deterioration in the cracked zone, while the overall modal behavior of the beam remained stable. Such a phenomenon agrees well with previous studies, which reported that local vibration and strain responses near cracks exhibit higher sensitivity to fatigue-induced stiffness loss than global frequency indicators [
24,
36].
Based on the percentage variations shown in
Figure 17a,b: For measurement point S1, the stress amplitude showed almost no change (0%) during the first 0–0.5 million cycles, indicating that the influence of crack initiation had not yet reached this location. From 0.5 to 1.5 million cycles, the stress amplitude gradually decreased (maximum reduction of 5.8%), which corresponds closely to the observed initiation of Crack #1 at approximately 1.5 million cycles. During the 1.5–2.0 million cycle stage, the stress amplitude first remained stable (0% change) and then showed a slight increase (+2.5%), possibly due to local load redistribution as the crack approached full penetration.
For measurement point S2, the stress amplitude exhibited a slight increase (+1.5% to +2.1%) during the first 0–0.5 million cycles, which is presumed to result from local stress concentration in the area adjacent to the measurement point prior to crack initiation. Between 0.5 and 1.5 million cycles, the stress amplitude decreased continuously (with a maximum reduction of 5.9%), consistent with the observed initiation of Crack #2 at approximately 1.6 million cycles. At 2.0 million cycles, the stress amplitude increased by 4.6%, suggesting that crack propagation had significantly reduced the local stiffness at this location, leading to rapid crack growth.
This analysis indicates that the evolution of stress amplitude before and after fatigue crack initiation follows a certain pattern: a slight increase may occur in the early stage before initiation, followed by a continuous decrease as stiffness is reduced after initiation, and a localized increase may appear in the final stage when the crack approaches full penetration. This pattern is consistent with the typical evolution characteristics of high-cycle fatigue cracks under the combined effects of local stiffness reduction and stress redistribution.
5. Fatigue Assessment of Track Beam Structure
5.1. Structural Damage Equivalent Coefficient Method
The damage equivalent coefficient method is based on the full life-cycle structural safety principle, which requires that an engineering structure maintain its fatigue safety threshold throughout its intended service life. Specifically, fatigue-induced failure caused by cumulative damage must be avoided during the design life period.
Within the fatigue performance assessment framework, the damage equivalent stress range
exhibits a defined linear relationship with the reference stress range
and the damage equivalent coefficient. This relationship can be mathematically expressed as:
where
denotes the damage equivalent coefficient,
represents the damage equivalent impact factor,
is the reference stress range, defined as the difference between the maximum and minimum stresses at the fatigue detail when the fatigue verification load is applied to the bridge structure.
The damage equivalent coefficient is influenced by multiple factors, which are denoted as
,
,
, and
, respectively. Accordingly, the overall damage equivalent coefficient
can be expressed by Equation (7) as follows:
In the equation, and in accordance with Eurocode provisions, the four parameters
,
,
, and
represent mutually independent influence factors. Specifically:
is the coefficient accounting for damage effects caused by different types of vehicle passage, which is related to the critical length of the influence line or the location of the most unfavorable effect;
is the coefficient that reflects the annual traffic volume;
is the coefficient corresponding to the design service life of the bridge;
is the coefficient used when the structural component is subjected to loads from multiple tracks. In addition,
denotes the maximum allowable value of determined based on the fatigue limit.
5.2. Calculation of Train Dynamic Amplification Factor
In engineering analysis and design, the force exerted by a train on a track beam is typically represented as the static load pattern multiplied by an appropriate dynamic amplification factor. This approach allows the dynamic effects to be incorporated into static load calculations.
According to the Code for Design of Railway Bridges and Culverts (TB 10002-2017) [
42], which specifies design requirements for high-speed and intercity railway bridges, the dynamic amplification factor should be calculated using Equation (8):
where
is the critical influence line length. When the critical influence length is less than 3.61 m, a minimum value of 3.61 m should be used, in which case the dynamic amplification factor is taken as 1.67.
The damage equivalent impact factor for urban rail steel bridges, calculated using Equation (8), is consistent with the value of
specified in EN 1991-2 [
43], which is based on the fatigue load model LM71.
To account for the average structural effect over the design service life of the bridge, the dynamic amplification factor caused by a single train passage on an urban rail steel bridge should be appropriately reduced. According to BS EN 1991-2 [
43], the dynamic factor
for actual operating trains should be calculated using Equation (9):
When
m:
When
m:
where
is the maximum permissible speed of the train.
5.3. Analysis of Damage Equivalent Coefficient Determination
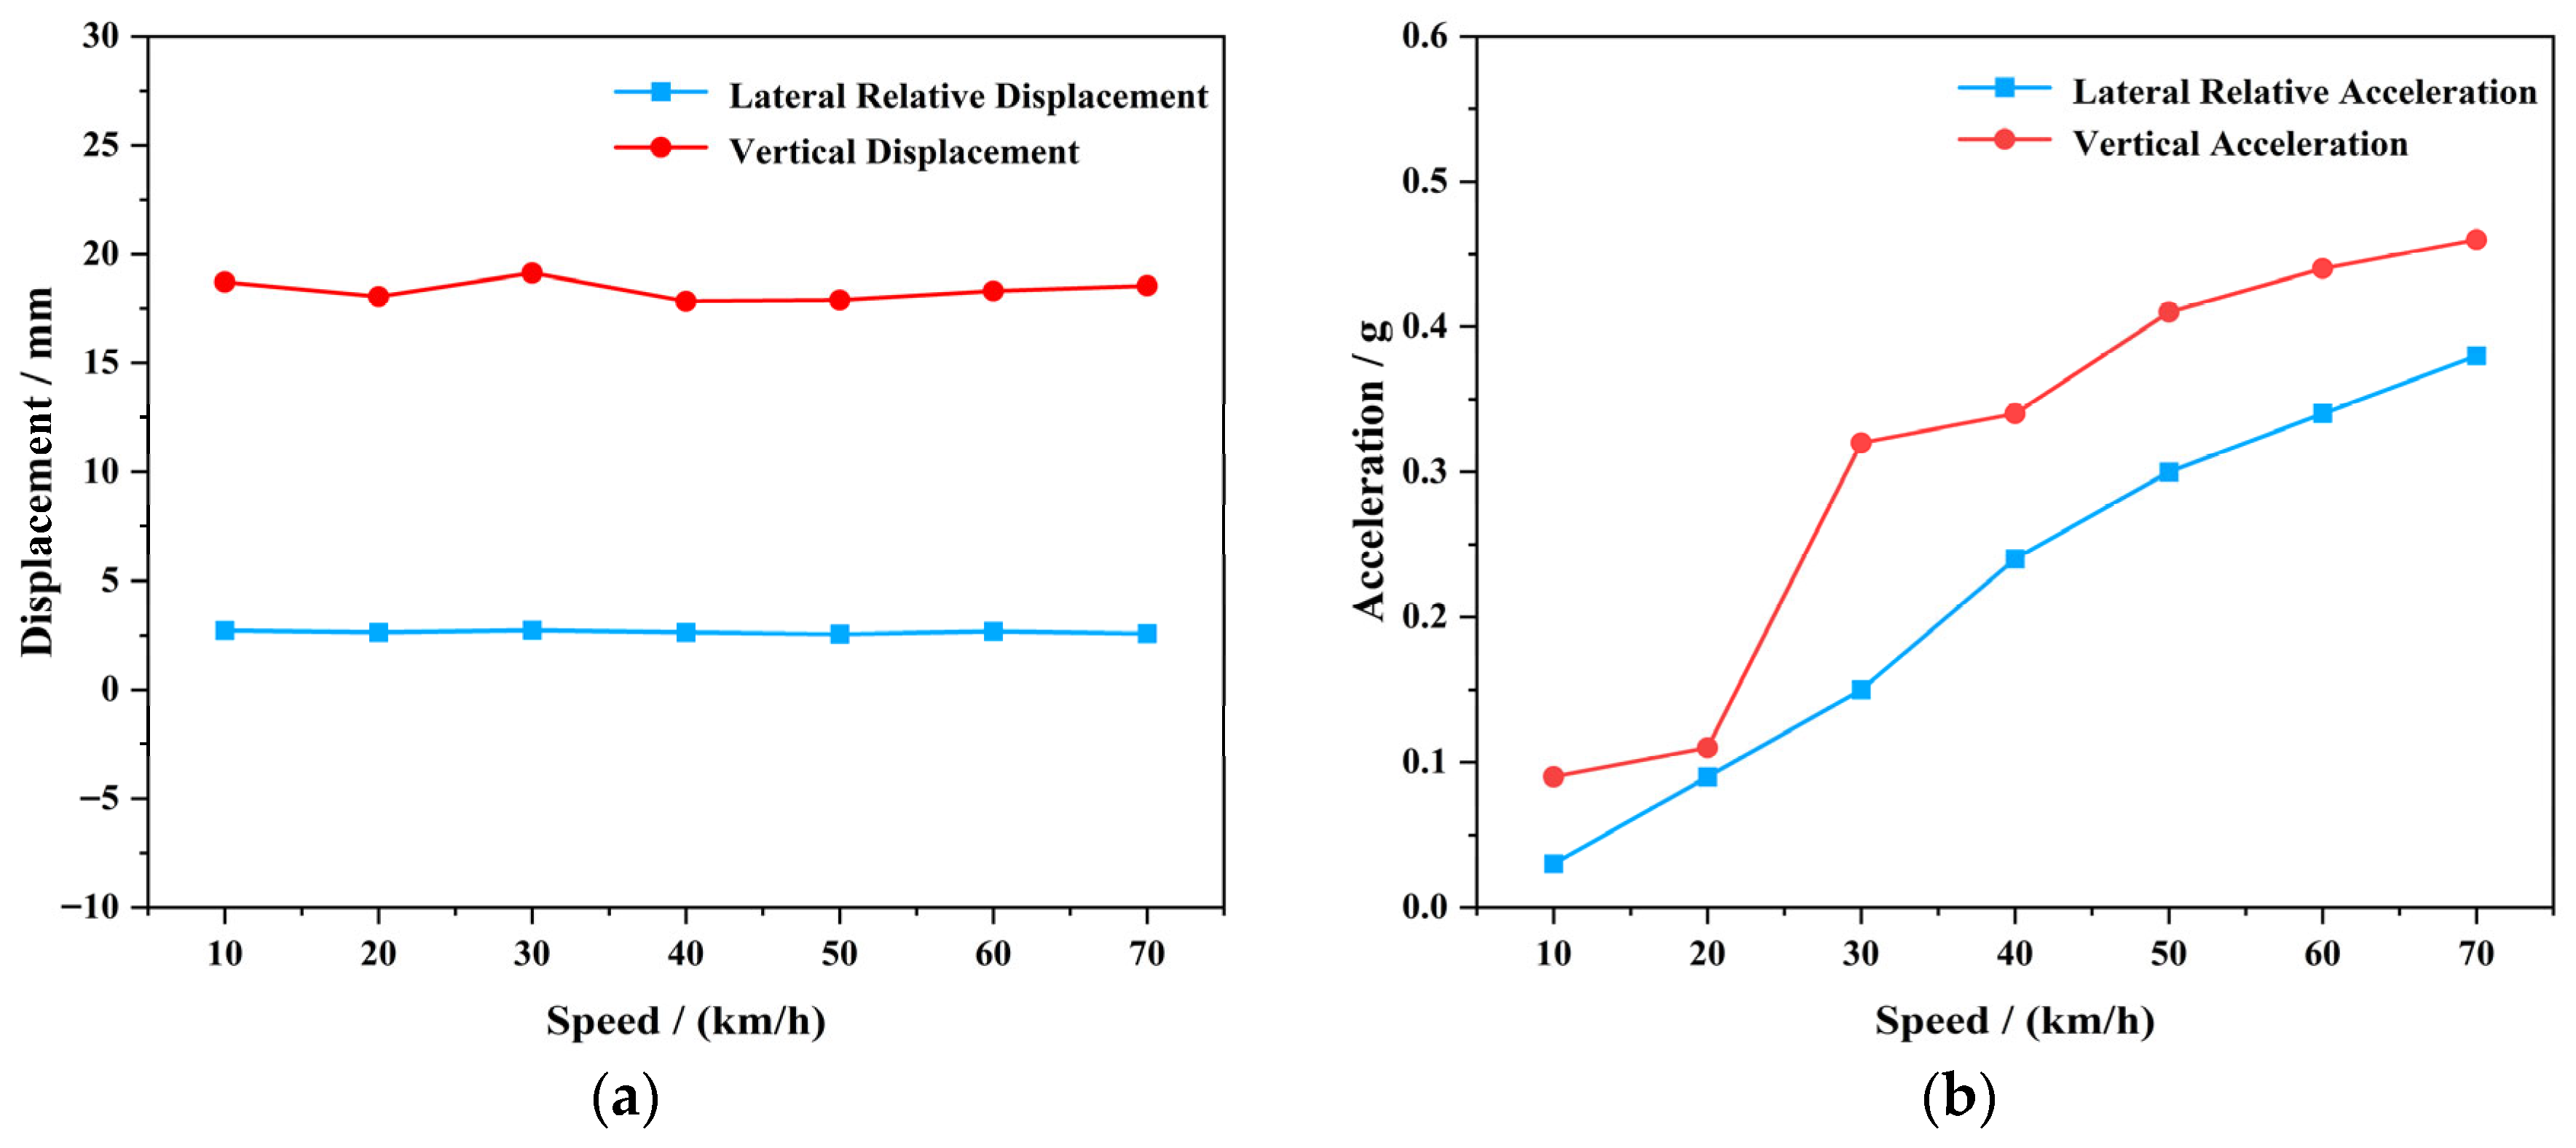
According to the relevant provisions of the Eurocode, each specific train formation corresponds to a uniquely defined maximum permissible speed. However, in actual urban rail transit operations, the maximum train speed often varies considerably under different service conditions [
44].
This variability introduces a potential discrepancy when directly applying the damage equivalent coefficient method from the Eurocode to fatigue damage assessment in urban rail systems. Consequently, direct adoption of the Eurocode approach may deviate from actual engineering conditions, potentially leading to underestimation or overestimation of fatigue effects.
In practice, it has been observed that even for the same type of train formation, the maximum permissible speed can vary across different lines. Therefore, when conducting fatigue damage assessment of track beam structures in suspended monorail transit systems, it is essential to fully account for the influence of the dynamic amplification factor .
To more precisely characterize the effect of train speed on the fatigue damage of track beams, it is essential to introduce a separate coefficient, the damage equivalent coefficient for scientific representation.
Considering the effect of
, Equation (7) is modified as:
Compared to Equation (7), Equation (14) demonstrates substantially greater adaptability and practical applicability. It not only meets the stringent requirements for maximum permissible train speed under varying urban rail transit operating conditions but also flexibly accommodates systems with different speed limitations.
This advantage endows Equation (14) with greater engineering value in urban rail transit, offering a more reliable foundation for ensuring both the safety and operational efficiency of train operations.
To determine the damage equivalent coefficient, Equation (6) can be rearranged and expressed as Equation (15):
5.4. Calculation of Damage Equivalent Coefficient
The coefficient accounts for the fatigue damage effect associated with the critical length of the influence line. Its value is closely related to the specific choice of this critical length. The coefficient is calculated using Equation (14).
The coefficient
represents the annual traffic volume adjustment factor. According to Equations (14) and (16), it can be initially determined that
. When using the bilinear (two-slope) S–N curve to calculate the equivalent stress range, the value becomes
. Given an annual traffic volume of
, the general expression for calculating
can therefore be derived as:
where
is the actual annual traffic volume,
is the reference (design) annual traffic volume.
The coefficient
is specifically used to account for the design service life of the bridge. According to Equations (14) and (15), the initial value is taken as
. Given that
and the design service life is
, it follows that
when using 100 years as the reference design life. Based on this, the general expression for calculating
can be derived as:
where
is the design service life of the bridge (in years).
The coefficient is applied when the structural component is subjected to more than one track. In this study, only single-track loading conditions are considered; therefore, .
The coefficient
accounts for the effect of the maximum permissible train speed. Taking 70 km/h as the reference speed, the coefficient can be determined using Equation (18):
where
is the dynamic amplification factor for an operating train with a maximum permissible speed
, under a given critical influence line length,
is obtained from Equations (9)–(13), and
is the reference dynamic factor when the maximum permissible train speed is 70 km/h, for which
.
According to Equation (15): when the total traffic volume within the design service life is taken as a reasonable value, ; when a design life of 100 years is adopted as the fatigue design basis, ; when the target bridge is subjected to single-track operation, ; and when the maximum allowable train speed is taken as a reasonable value, . Under these conditions, the value of and the corresponding obtained from Equation (15) represent the damage equivalent coefficient 44.
5.5. Fatigue Assessment Results Based on Eurocode and the Damage Equivalent Coefficient Method
To meet the fatigue-resistant design requirements of track beam structures in Chinese urban suspended monorail systems, this study focuses on critical fatigue details—specifically, the mid-span web-to-lower flange connection and the longitudinal rib-to-lower flange connection at the beam bottom. These details were identified as primary evaluation targets based on hotspot stress range data from previous experimental tests and numerical simulations.
Given the strong interdependence among train formation, traffic volume, maximum operating speed, and the current load model, these parameters must be considered as a coupled system. Their combined influence substantially affects fatigue damage accumulation in suspended monorail systems. Therefore, deriving the damage equivalent coefficient requires a comprehensive consideration of these interacting factors to ensure the resulting coefficients are directly applicable to Chinese urban suspended monorail systems.
Using both the Eurocode provisions and the damage equivalent coefficient method, the fatigue performance was evaluated. The specific assessment procedure and results are summarized as follows:
Train-Induced Dynamic Coefficient : 1.12.
Damage Equivalent Coefficient : ;
Damage Equivalent Coefficient : ;
Damage Equivalent Coefficient : ;
Damage Equivalent Coefficient : .
Damage equivalent coefficient at measuring point S1, located at the connection between the web and the bottom flange at mid-span of the track beam: .
Damage equivalent coefficient at measuring point S2, located at the mid-span bottom longitudinal stiffener-to-bottom flange connection of the track beam: .
Damage equivalent coefficient at measuring point S1, located at the mid-span web-to-bottom flange connection of the track beam: .
Damage equivalent coefficient at measuring point S2, located at the mid-span longitudinal stiffener-to-bottom flange connection of the track beam: .
Through the analysis presented in Chapter 6, the damage equivalent coefficient of the suspended monorail track beam structure, accounting for the influence of train speed, was determined. This approach enables a simplified yet effective evaluation of structural fatigue performance, offering valuable guidance for engineering applications and service life prediction.
6. Conclusions
In summary, this study investigated the fatigue performance of suspended monorail track beam structures through a combination of scaled fatigue testing and finite element simulations under representative operating conditions. Fatigue life predictions were conducted using the Eurocode S–N curves and Miner’s linear damage accumulation theory, while a damage equivalent coefficient method was proposed to incorporate actual traffic volume and train speed effects. Comparisons between experimental and numerical results confirmed the reliability and practical applicability of the proposed approach. The main conclusions are as follows:
Through 1:4 scaled fatigue testing and finite element analysis, the mid-span longitudinal stiffener–bottom flange weld toe and the mid-span web–bottom flange weld toe were identified as the primary fatigue-sensitive locations. Under the equivalent standard fatigue vehicle, the hotspot stresses at these locations were 28.48 MPa and 27.54 MPa, respectively;
The mid-span deflection of the scaled model under static and dynamic loading closely matches that of the full-scale model, and hotspot stresses obtained via the IIW linear extrapolation method differ from full-scale results by no more than 7%. This demonstrates that the scaled model can reliably substitute for the full-scale model in fatigue studies, reducing experimental costs and improving research efficiency;
Evaluations based on the Eurocode S–N curve and Miner’s linear damage accumulation theory indicate that, under 5 million equivalent fatigue cycles, the critical details exceed the 100-year design service life. The calculated equivalent fatigue lives for the actual bridge are approximately 2.39 × 10⁸ cycles at the S1 location and 5.95 × 10⁸ cycles at the S2 location, providing substantial safety margins for long-term operation;
The proposed damage equivalent coefficient calculation method, incorporating traffic volume and speed corrections, yields coefficients of 2.54 and 3.06 for the S1 and S2 locations, respectively. This approach effectively reflects real operational fatigue effects and offers a simplified yet efficient approach for evaluating suspended monorail track beam fatigue performance, providing important guidance for design, maintenance, and code development.
Although this study has systematically investigated the fatigue performance of suspended monorail track beam structures through fatigue testing, finite element analysis, and the damage equivalent coefficient method, several areas warrant further research. First, given the variability of train loads, train formations, and traffic volumes in actual operation, future studies should develop stochastic load spectra and perform probabilistic fatigue analyses to provide more realistic life predictions. Second, the effects of temperature fluctuations, environmental corrosion, and long-term service conditions on crack initiation and propagation require deeper investigation, which could be addressed through long-term monitoring and coupled environmental simulations. Additionally, welding geometry, residual stresses, and initial defects have a significant impact on hotspot stress distribution and fatigue life, and these factors should be incorporated into future simulations and experiments. Finally, with advances in structural health monitoring techniques, integrating machine learning and deep learning approaches to establish data-driven fatigue life prediction models will facilitate intelligent service life assessment and maintenance management of suspended monorail track beam structures.
