Article

Evaluation of the Consistency of Rock Joint Surface Morphology Based on Grayscale Surface-Differential Box Counting and Mechanical Tests

School of Civil Engineering, Qingdao University of Technology, Qingdao 266520, China
*
Author to whom correspondence should be addressed.
Buildings 2025, 15(21), 3861; https://doi.org/10.3390/buildings15213861 (registering DOI)
Submission received: 28 September 2025 / Revised: 23 October 2025 / Accepted: 24 October 2025 / Published: 25 October 2025
(This article belongs to the Section Building Structures)

Abstract

The accurate evaluation of the geometric morphology of rock and rock-like material joint surfaces was considered crucial for studying the mechanical properties of joint surfaces. A method based on grayscale surface and differential box-counting for evaluating the consistency of rock joint surface morphology was proposed in this study. The fractal dimensions of natural red sandstone joint surfaces and 3D printed restored joint surfaces were quantitatively identified. The consistency of the joint surface morphology of the samples was validated on both the image scale and the macroscopic mechanical scale using two approaches: CNN feature extraction and variable-angle shear tests. The validation results demonstrated a high degree of convergence, thereby confirming the accuracy of the proposed method. This study could provide a reference for the determination of the fractal dimension of joint surface morphology and the consistency research.

1. Introduction

Natural rock joints are recognized as the most common weak discontinuities in rock masses, significantly affecting various mechanical properties of the rock. The shear mechanical characteristics of rock masses are considered one of the most important indicators in engineering stability analysis, with extensive applications in geotechnical engineering stability research. The geometric morphology characteristics of rock joint surfaces are identified as important factors influencing rock shear strength. Therefore, accurately evaluating the geometric morphology of joint surfaces and ensuring consistency are considered key to studying the shear performance of rock joint surfaces.
A substantial amount of research has been conducted on the shear mechanical behavior of rock joint surfaces, and it has been found that the surface morphology characteristics of structural planes are closely related to their shear mechanical behavior [1,2,3,4]. Fathi et al. [5] developed an innovative approach to characterize joint roughness and elaborated on the role of asperities throughout different shearing stages. Replica joints underwent direct shear tests under a constant normal load (CNL), employing the proposed method to assess the distribution and dimensions of contact and damage regions. The results from this approach demonstrate that differentiating between merely contacted and damaged areas provides significant understanding of the shear mechanisms in rock joints. Wang et al. [6] utilized computed tomography (CT) and laser scanning techniques to investigate and quantify microcontact mechanisms on fractured rock surfaces during various shear testing phases. CT and laser scanning imagery identified multiple micro-contact patterns and fracture phenomena on the interacting rough surfaces, such as the shearing of micro-asperities, friction between large-scale rough surfaces, movement of worn debris, and the development and healing of hybrid cracks. The results suggested that the shear strength of jointed rocks significantly relies on the maximum contact area and surface roughness. Li et al. [7] performed double shear tests under constant normal load conditions on synthetic rock joints characterized by planar and uniform asperities with dip angles of 15° and 30°. Observations showed that the basic friction angles of rock joints and the shear strength of asperities rose with increasing shear rates when asperities were sheared off. Kwon et al. [8] examined the shear behavior of rectangular asperities on rock joints to reveal how asperity characteristics affect joint shear behavior. By performing force equilibrium analysis, the shear strength and failure mode of rectangular asperities were theoretically determined. Furthermore, the relationship between shear strength and shear displacement of a single asperity was established by accounting for shear mechanisms and asperity properties. Tang et al. [9] proposed a new empirical shear strength criterion to assess the peak shear strength of non-matching rock joints. This criterion integrates a joint contact state coefficient, defined based on normalized dislocation and a quantified 3D roughness metric of the joint surface. The computed values closely match experimental data, demonstrating that this criterion can accurately estimate the peak shear strength of rock joints under various contact conditions. Xu et al. [10] investigated the macro-meso fatigue damage mechanisms of rock joints with multiscale asperities using experimental and numerical CNL methods. The macro-meso fatigue damage failure modes of rock joints were classified into three main types: compacting-climbing, climbing-cyclic abrading-extruding-gnawing, and gnawing-sliding failure modes.
The concept of the joint roughness coefficient (JRC) was proposed by Barton [11,12], providing a general reference method for evaluating the roughness of joint surfaces. Zhang et al. [13] fabricated samples featuring rough joints using a three-dimensional (3D) engraving method to examine the shear mechanisms of rough joints with different morphologies. Numerical simulations and laboratory experiments were performed to assess the shear properties of three Barton profiles, which had JRC values of 2.8, 10.8, and 18.7, chosen as morphological prototypes, yielding consistent outcomes. Bao et al. [14] employed 3D laser scanning to digitize the joint sample morphologies and assessed the effect of sampling intervals on the JRC. These research results comprehensively showed that joint roughness significantly affects the macroscopic mechanical properties of jointed rock masses and is recognized as a key intrinsic factor influencing the shear strength of rock masses.
The tests for determining the physical and mechanical properties in rock mechanics are typically conducted as one-time experiments, making it difficult to perform repetitive tests. Some scholars proposed methods for preparing rock-like materials, aiming to achieve reproducibility of experiments by repeatedly preparing rock-like samples [15,16]. The rise in 3D printing provided a new approach for reproducing joint surfaces with complex geometries. A series of studies on the fabrication of rock joint samples using 3D printing technology were conducted by Ju et al. [17,18], Liu et al. [19], Jiang et al. [20,21], Jiang et al. [22], and Head et al. [23], resulting in numerous achievements. Consistency in joint morphology replication is critical. Specifically, consistency encompasses: (a) Geometric-Morphological Consistency, referring to the fidelity of the replica to the natural specimen in terms of macroscopic three-dimensional morphology, undulations, and profiles; (b) Micro-Feature Consistency, indicating the replication accuracy of complex characteristics at finer scales, such as surface texture and roughness; and (c) Mechanical Performance Consistency, which implies that high morphological similarity ultimately ensures the mechanical responses of the replicas under loading conditions are statistically equivalent to those of natural specimens. Ensuring the high consistency of 3D printed joint surfaces is crucial for the reliability of experimental results. It is necessary to verify the consistency of the geometric morphology characteristics of the joint surfaces through specific methods.
Although studies on the mechanical behavior of rock joints are extensive and 3D printing technology offers powerful support for creating reproducible samples, a systematic method for rapidly and quantitatively evaluating the morphological consistency between 3D-printed and natural joint surfaces is still lacking. Most existing research assumes the fidelity of replicas without a validated quantitative assessment step, which directly impacts the reliability of the experimental results. This study, therefore, aims to fill this gap by proposing an automated identification framework based on grayscale surface-differential box counting. We systematically validate the accuracy and effectiveness of this framework for consistency evaluation by integrating it with CNN feature extraction and macroscopic mechanical tests, thereby providing a theoretical basis and a practical tool for enhancing the scientific rigor and reliability of rock mechanics replication experiments.
In this study, fractal theory was applied to prepare real red sandstone shear joint surfaces, and 3D printing was used to reverse engineer the geometric morphology of the obtained joint surfaces. The consistency of the fractal dimensions of the 3D printed joint surfaces was verified using an improved differential box-counting (DBC) method based on the box-counting dimension. The consistency of joint surface morphology was validated at the image scale through feature extraction using a convolutional neural network. Variable-angle shear tests were conducted to determine the shear mechanical parameters of 3D printed rock-like sample joint surfaces and to verify the consistency of the joint surface morphology of the 3D printed samples on the macroscopic scale. The research findings can provide a reference for the determination of the fractal dimension of joint surface morphology and the consistency of the joint surface morphology of 3D printed rock-like samples.

2. Methods for Verifying the Consistency of Joint Surface Morphology

To obtain the three-dimensional geometric morphology of real red sandstone shear joint surfaces, a splitting test was conducted. The real shear surfaces were manually obtained and used as joint surfaces, providing a reference for the subsequent fabrication of 3D printed samples. To verify the degree of reproduction of joint surface morphology in 3D printed samples, an automatic fractal dimension identification method based on grayscale surface and differential box-counting was proposed. This method was used to test the consistency of joint surface morphology between red sandstone samples and 3D printed samples.

2.1. Acquisition of Real Joint Surface Morphology

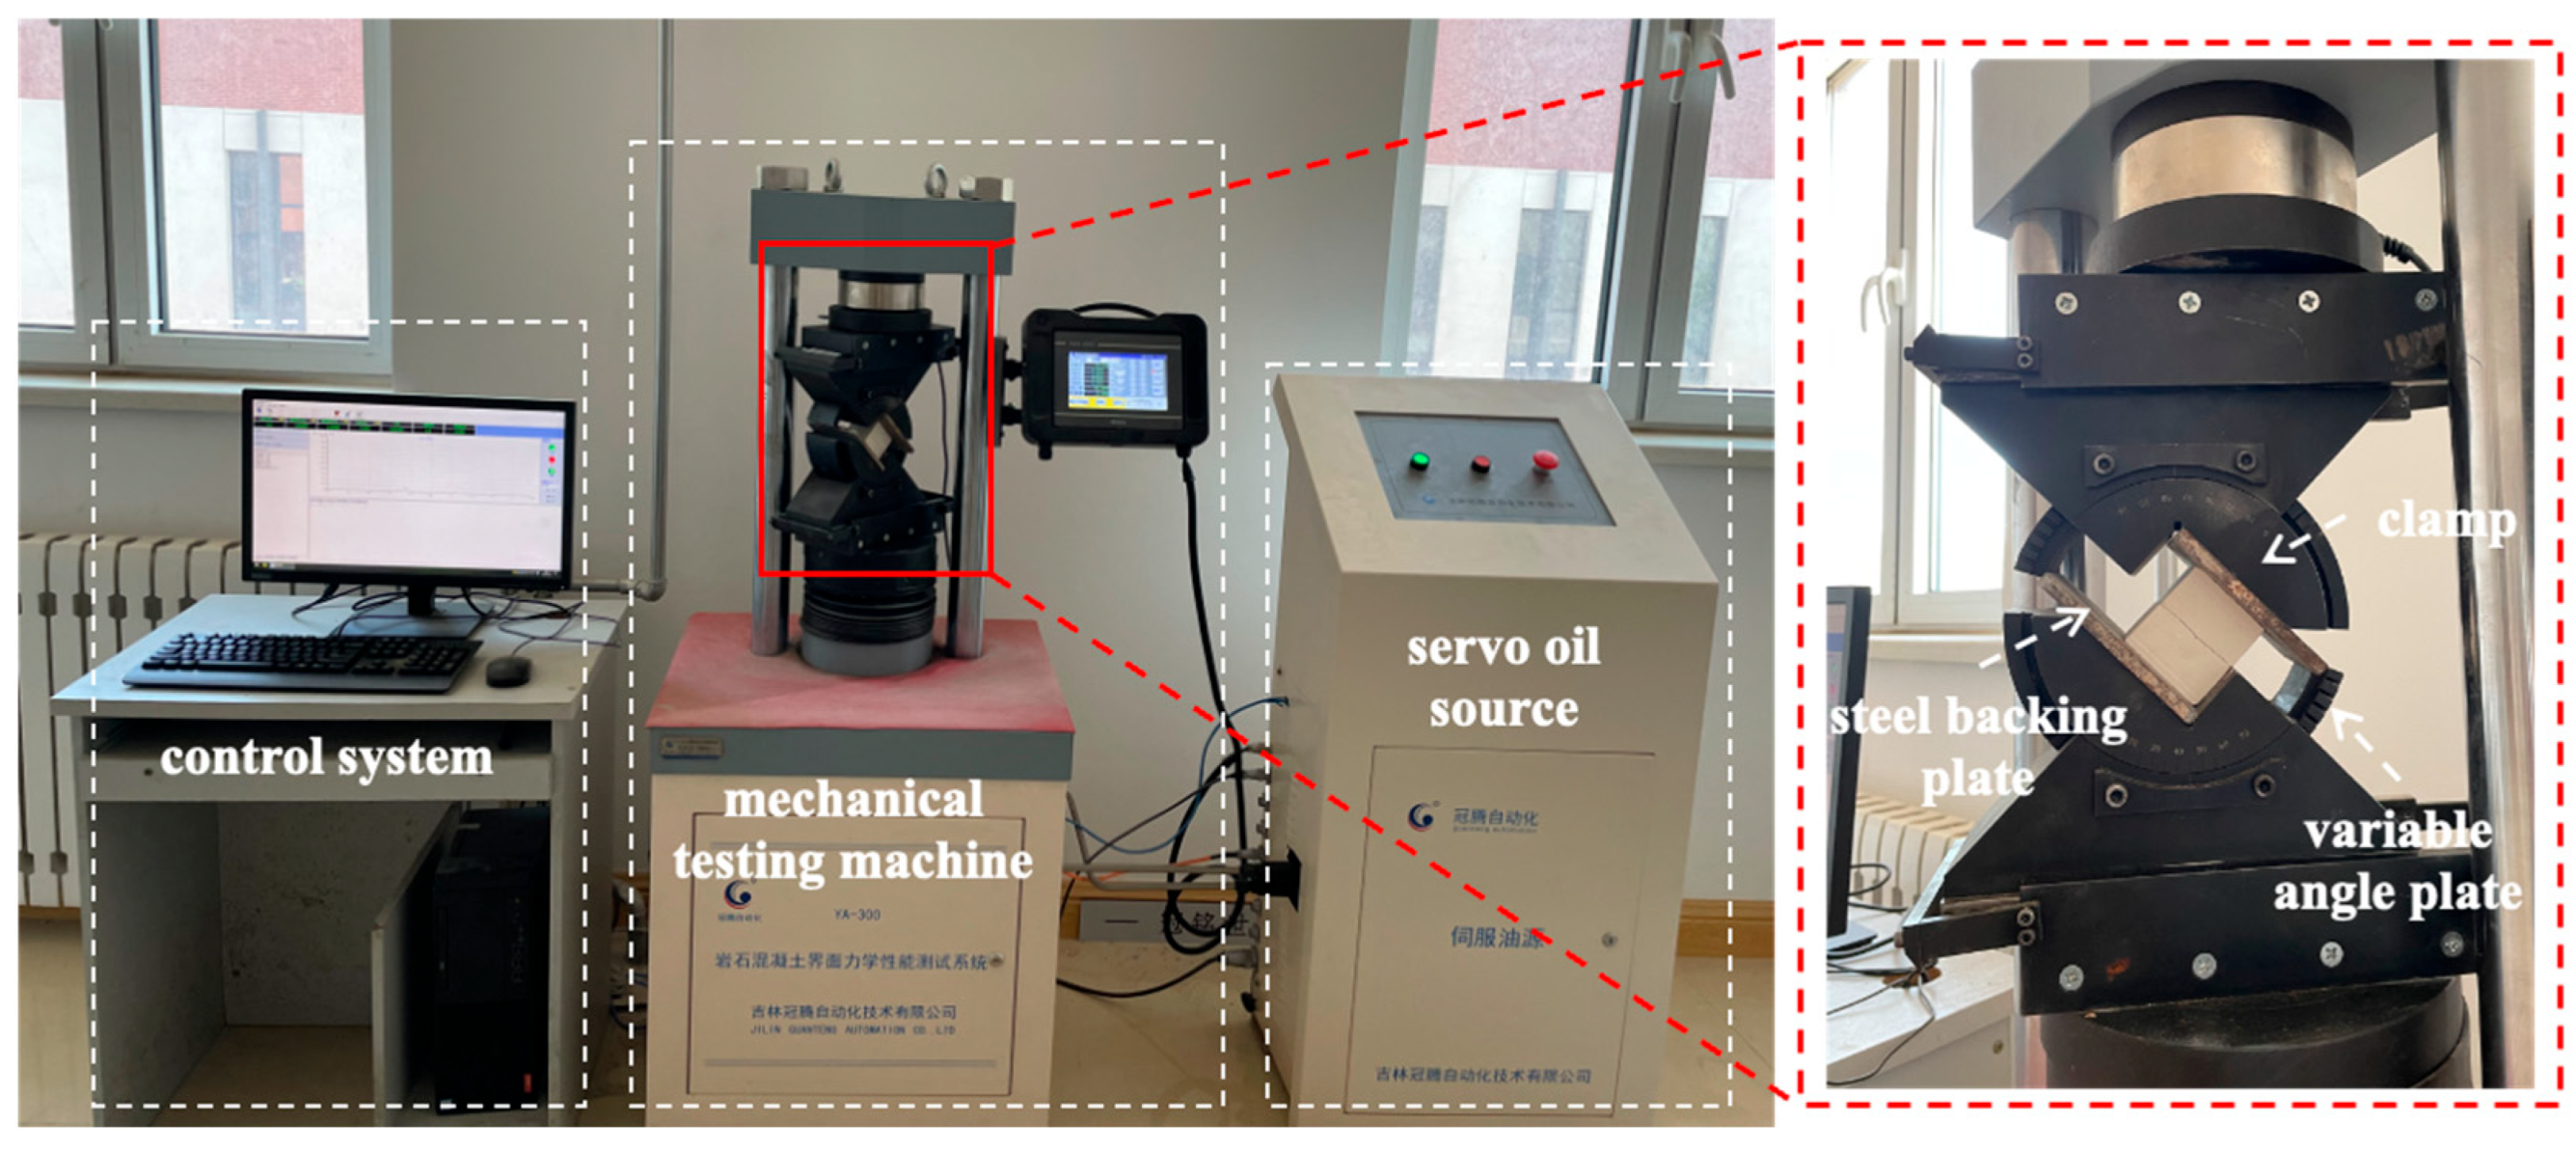
The splitting test was conducted using 50 mm × 50 mm × 50 mm cubic samples. Shear surfaces were obtained by applying axial loading through a line load fixture using a YA-300 mechanical testing machine (Guanteng Automation Technology Co., Ltd., Changchun, China). The cubic sample was placed in the fixture, and a normal load was applied at the center of the sample by the testing machine, splitting it into two parts, as shown in Figure 1.

2.2. Reproduction of Joint Surface Morphology

The joint surface morphology obtained from the splitting test needed to be imported into 3D printing using reverse engineering methods. An industrial 3D scanner was used to acquire the point cloud data of the joint surface. After denoising and filtering the point cloud data, it was encapsulated into an STL file and imported into 3D modeling software. Finally, the obtained joint surface model was imported into the 3D printing program to complete the reverse engineering of the joint surface geometry. The reverse engineering process of the joint surface geometry is shown in Figure 2.
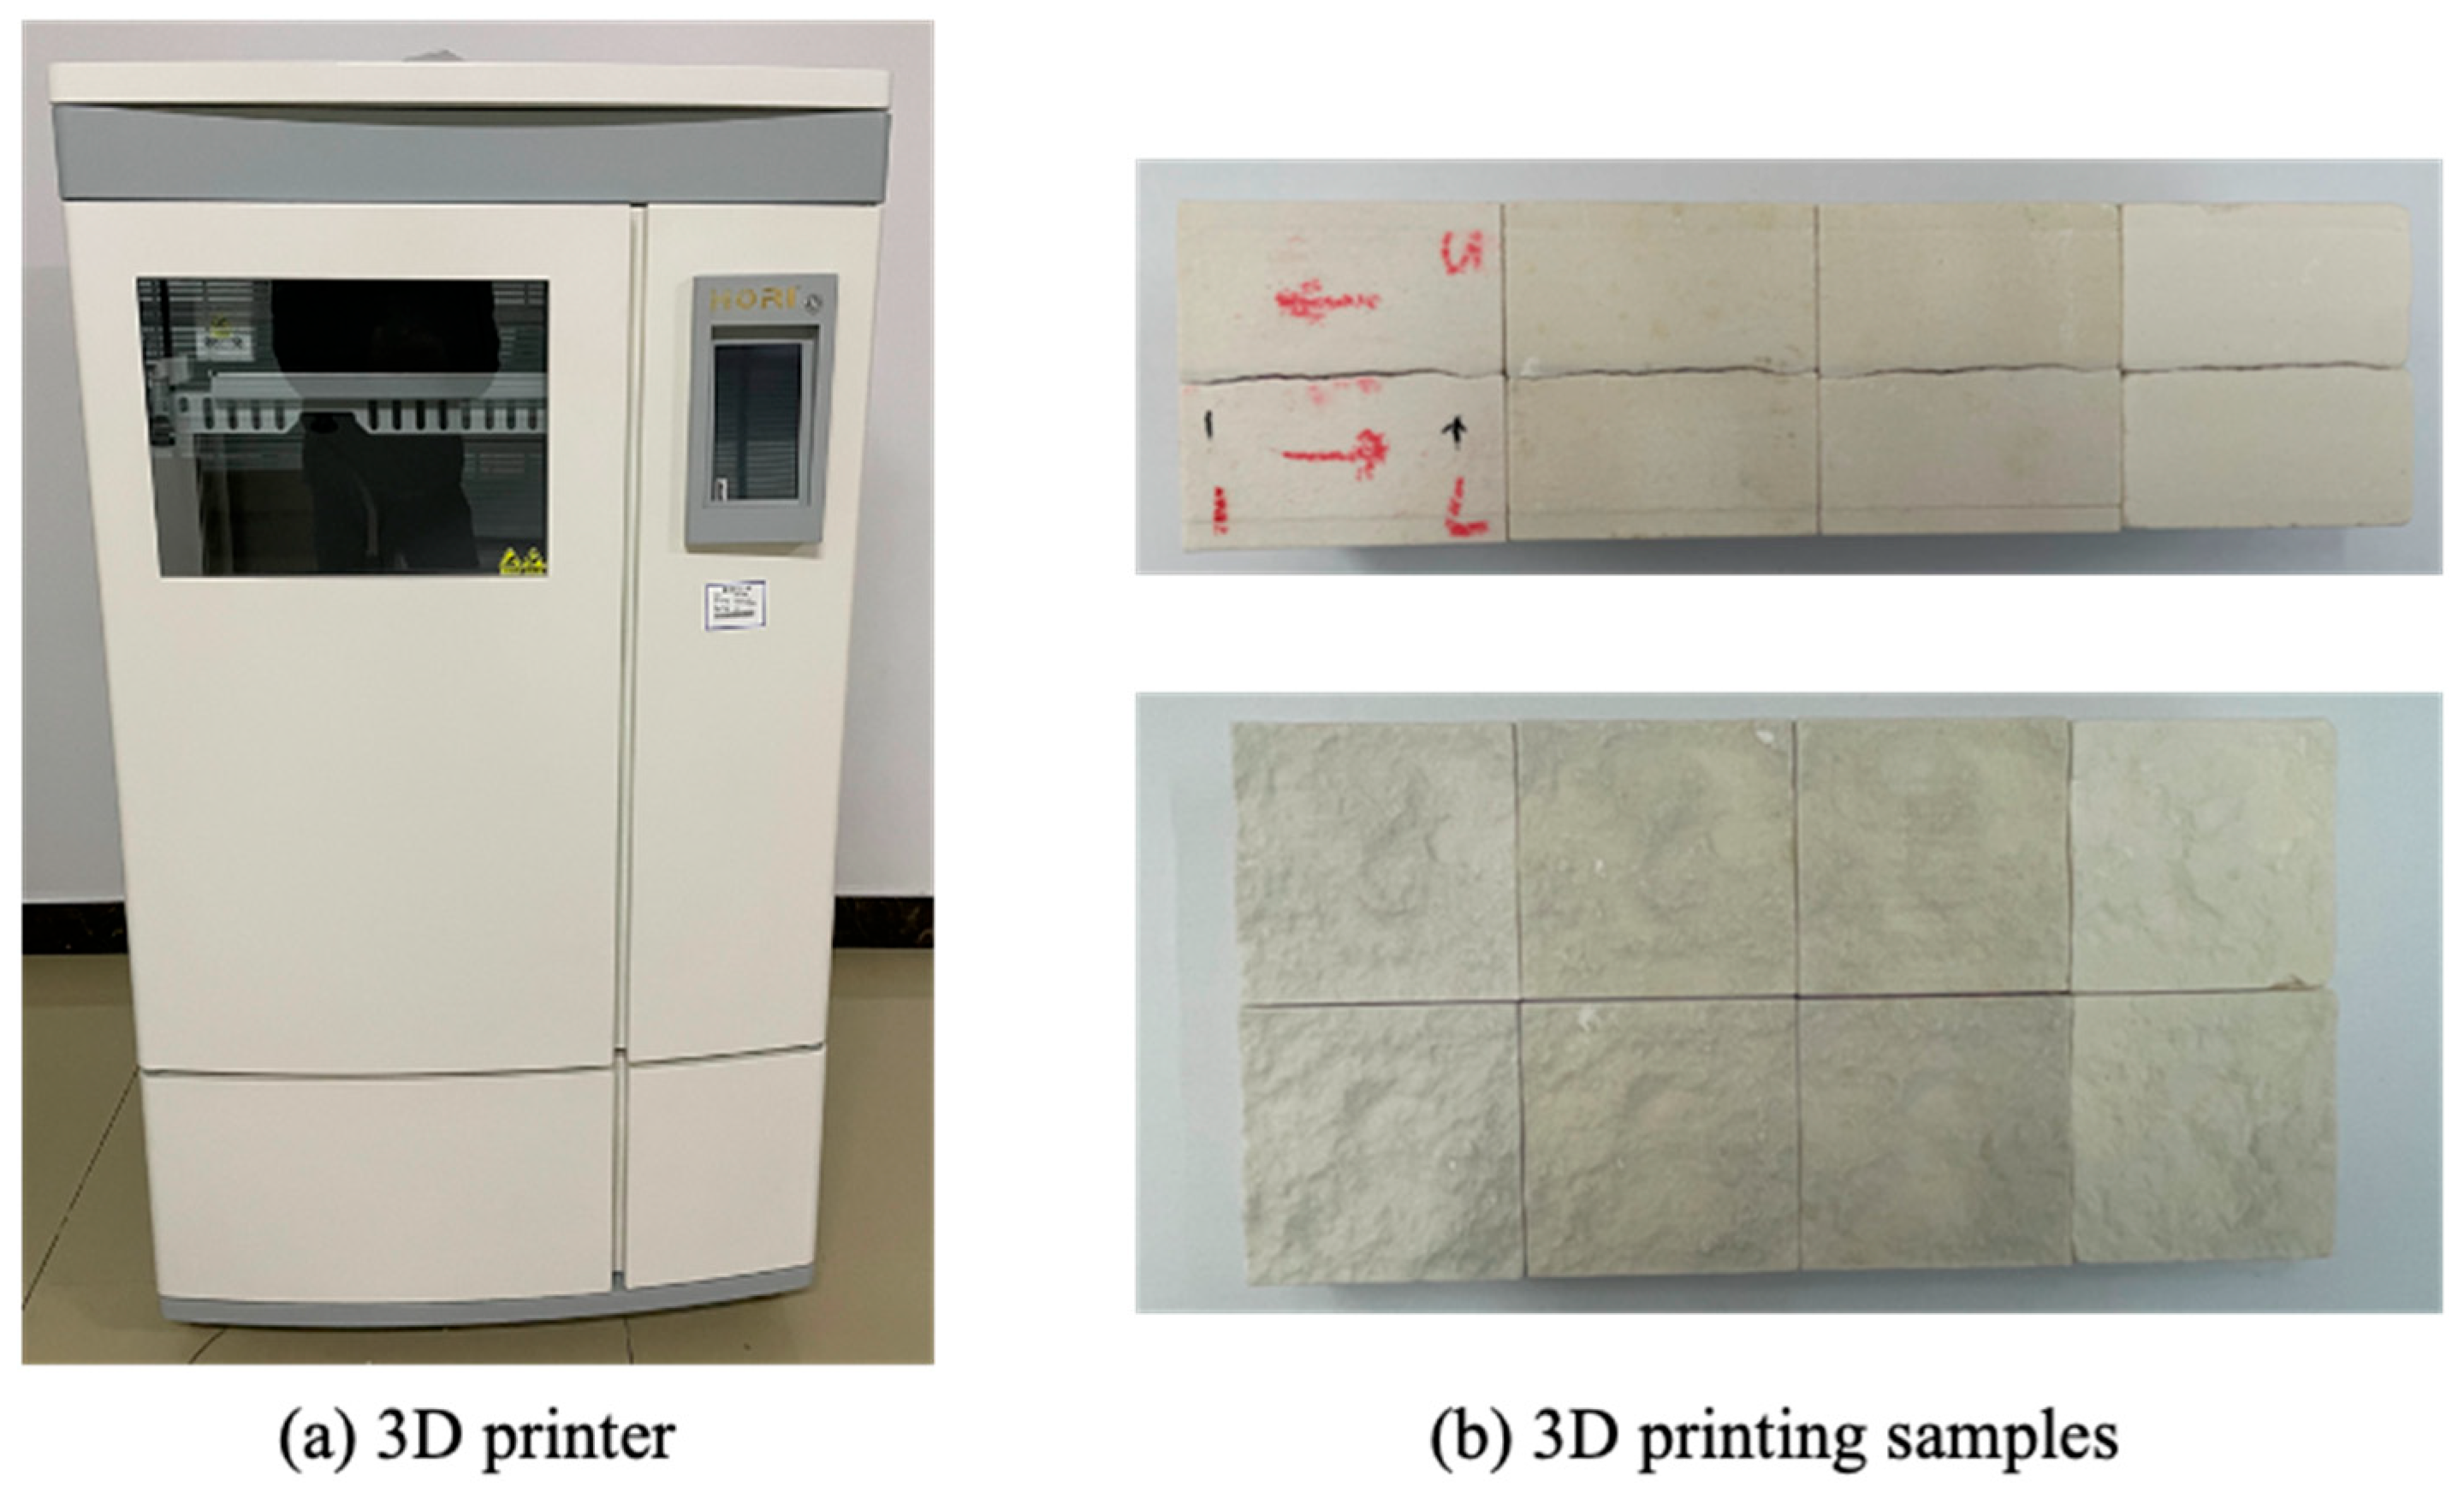
A gypsum powder 3D printer (Huitianwei Technology Co., Ltd., Beijing, China.) was used to produce the 3D printed samples. Multiple identical samples were created based on the same joint surface morphology, as shown in Figure 3. To ensure that the 3D printed samples had identical joint surface morphology and to guarantee the accuracy of the mechanical tests, the consistency of the joint surfaces of the samples needed to be verified.

2.3. Fractal Dimension Identification Method Based on Grayscale Surface and Differential Box-Counting

The morphology of joint surfaces is typically evaluated using roughness assessment methods [24]. Grasselli et al. have conducted extensive and in-depth studies on joint roughness characterization, driving the transition from traditional two-dimensional profile analysis towards three-dimensional surface analysis [25,26,27]. They introduced a physically meaningful three-dimensional directional roughness characterization method, which can objectively evaluate the anisotropy of surface roughness [28]. Additionally, fundamental issues such as scale dependence and critical effects of measurement resolution were analyzed, and practical techniques for characterizing directional roughness and aperture from rock cores were developed [29]. For evaluating joint surface roughness, the Joint roughness coefficient (JRC) value is usually estimated on a two-dimensional scale, while the fractal dimension (FD), a quantitative indicator reflecting the complexity, is commonly used on a three-dimensional scale. A certain relationship between JRC and FD was identified, and this relationship was studied [30,31,32,33]. On this basis, Li et al. proposed a new set of empirical equations for calculating fractal dimension, thereby avoiding subjectivity in identifying higher-order roughness [34]. Fractal Dimension (FD) is a concept used in geometry to offer a rational statistical measure of complexity in a mathematical pattern. It serves as an index to characterize fractal patterns or sets by measuring their complexity as a ratio of detail variation to scale variation [35]. Numerous methods were used to characterize the fractal dimension, including box-counting dimension [36], information dimension [37], correlation dimension [38], and Hausdorff dimension [39]. Fractal theory indicated that the surfaces of most natural objects are fractal in space, and the grayscale images of these surfaces are also fractal. This provided a theoretical basis for the application of fractal models in the field of image analysis. A three-dimensional image was obtained by plotting the grayscale surface of an image, where the value on the z-axis represented the grayscale value of the pixels. When viewed from directly above, the grayscale surface appeared identical to the original image. When observed from the side, the grayscale surface displayed the process of grayscale variation. Therefore, the complexity of the grayscale surface could be observed from the side view. The fractal dimension measured the roughness of the image, which corresponded to the complexity of the grayscale surface. A higher fractal dimension indicated a more complex surface and, consequently, a rougher image. Thus, the roughness of the joint surface was measured by assessing the complexity of the grayscale surface, represented by the fractal dimension.
An improved differential box-counting (DBC) method based on the box-counting dimension was adopted in this study [40]. A program for automatically identifying the fractal dimension of joint surface roughness was developed using MATLAB (R2024a). The program was used to quantitatively read the fractal dimensions of the joint surface morphology of real red sandstone and 3D printed samples, thereby verifying the consistency of the joint surfaces. Based on the box-counting dimension method, the fractal dimension was calculated using Equation (1):
D = log N r log 1 r
where D represents the fractal dimension, Nr is the number of boxes required to cover the surface, and r is the grid length.
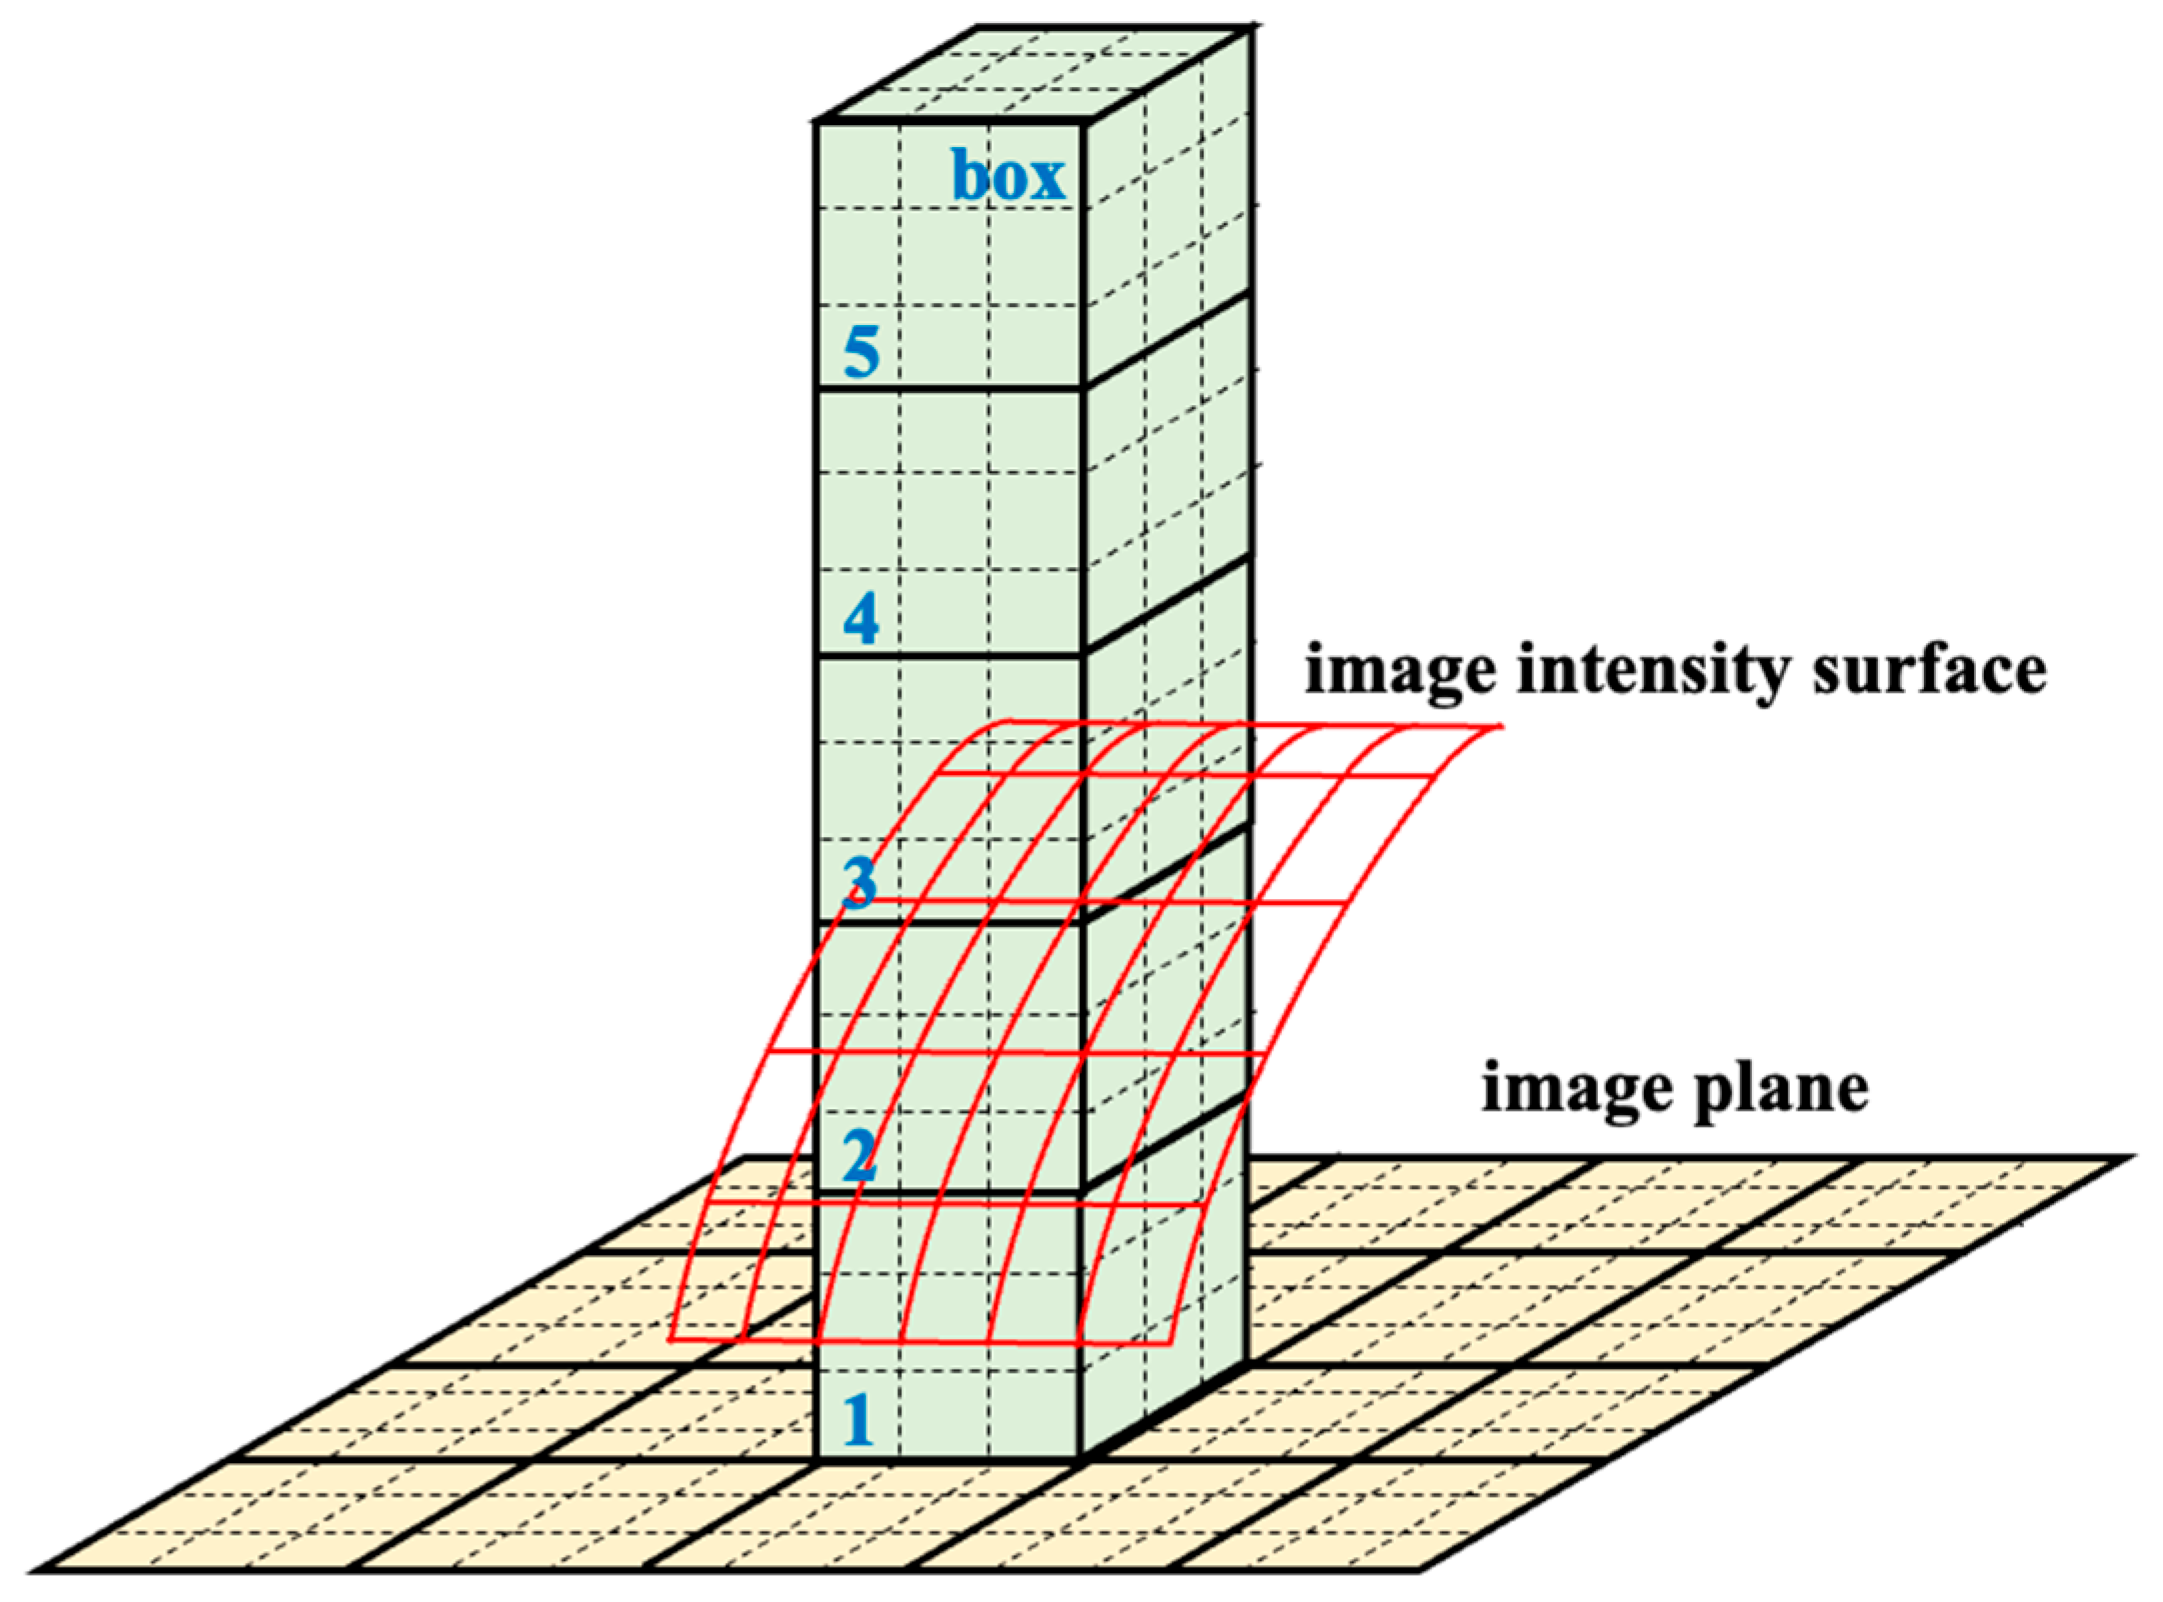
The DBC method determined the fractal dimension by calculating the number of boxes covering the entire surface for different grid sizes using the differential method. The fractal dimension of the three-dimensional surface was in the range of [2, 3), as shown in Figure 4. To facilitate calculation, the grid length was taken as integer powers of 2 in this study, specifically the powers of 1, 2, 3, 4, 5, 6, and 7. The number of boxes for each grid length was calculated, and the fractal dimension D was obtained through least squares fitting. The method for determining the fractal dimension is shown in Figure 5.
It is important to clarify that while the DBC method is a mature technique, the novelty of this study lies in its specific application and integration into an automated, multi-scale validation framework for assessing the morphological consistency of 3D-printed rock joints. Compared to traditional applications, our approach offers distinct advantages: (1) Enhanced Efficiency and Objectivity: We developed an automated MATLAB program that streamlines the calculation process, enabling rapid and repeatable analysis of multiple samples without operator bias. (2) Validated Engineering Accuracy: The method’s accuracy is not merely theoretical; it is empirically validated by demonstrating that the calculated fractal dimensions and their consistency directly correlate with both image-level features extracted by a CNN and, more importantly, with the consistency of macroscopic mechanical behavior observed in variable-angle shear tests. (3) Expanded Application Scope: We have repurposed the DBC method as a practical quality control tool for verifying the fidelity of replicas created using advanced manufacturing, a novel application of significant value to experimental rock mechanics.

2.4. Consistency Verification

According to the established automatic identification and calculation program for the fractal dimension of joint surface roughness, it was necessary to manually capture images of the cross-sections of both the original red sandstone sample and the 3D printed restored samples before identification. During photography, the camera lens should be kept as perpendicular to the shear joint surface as possible, and the sides should be parallel to the lens to retain all joint surface information to the greatest extent. The imaging device was a Nikon D3200 digital camera (Nikon (China) Co., Ltd., Shanghai, China) equipped with a 24.16-megapixel sensor and an AF-S 18–105 mm zoom lens (Nikon (China) Co., Ltd., Shanghai, China). During image acquisition, the camera was set to manual mode to maintain consistency in exposure parameters across all images. The focal length was fixed at 50 mm, and the aperture was set to f/11 to achieve sufficient depth of field, ensuring the entire rock joint surface remained within the sharp focal plane. Images were captured under controlled laboratory conditions with uniform lighting. The camera-to-rock surface distance was maintained at approximately 50 cm. Additionally, to improve the speed of the identification computation, the image size was adjusted to 256 × 256 pixels while ensuring maximum accuracy and information retention. Five sets of 3D printed samples were randomly selected as the fractal dimension consistency verification group. The images of the joint surface morphology of the red sandstone and 3D printed samples after pixel adjustment are shown in Figure 6. After the program calculation, the fractal dimensions of the joint surface roughness for the original rock samples and the 3D printed samples are shown in Table 1. The maximum error in the upper part of the fractal dimensions was 9.38%, the minimum error was 7.40%, and the average error was 8.58%. In the lower part, the maximum error was 8.66%, the minimum error was 7.76%, and the average error was 7.10%. According to reference [41], a relative error within 12% is acceptable. The small calculation errors indicate that the joint surface morphology of the 3D printed samples had good consistency.

3. Verification of CNN Feature Extraction

The aforementioned method obtained the fractal dimension of images by identifying the complexity of grayscale surfaces, constituting an image-based digital recognition approach. Consequently, at the image scale, convolutional neural network (CNN) methods can be employed to extract features from both the original red sandstone joint surfaces and the 3D-printed reconstructed joint surfaces, thereby assessing the key information contained within these image features. By constructing a CNN structure, feature vectors of the joint surface images were extracted, a cosine similarity matrix between the feature vectors was calculated, and the high-dimensional feature vectors resulting from image transformation were visualized. This facilitated an intuitive comparative verification of the consistency of the joint surfaces.

3.1. CNN Model Construction

To comprehensively extract the key features of joint surface images and encompass the morphological information inherent in the original images, a five-layer convolutional neural network (CNN) architecture consisting of four convolutional layers and one fully connected layer was constructed for feature extraction of the joint surface images. Specifically, convolutional layers 1, 2, and 3 employed 3 × 3 kernels with 2 × 2 max pooling windows, whereas convolutional layer 4 utilized a 3 × 3 kernel with a 1 × 1 adaptive average pooling window. All convolutional layers incorporated ReLU activation functions and were configured with a padding of 1 to maintain the spatial dimensions of the feature maps. The pooling layers progressively reduced the spatial dimensions of the feature maps, and ultimately, adaptive average pooling compressed the feature maps to 1 × 1, resulting in a 256-dimensional feature vector. This feature vector was subsequently processed through the fully connected layer to produce a final 128-dimensional feature representation. These features constitute compact, high-dimensional representations extracted from the input joint surface images, intended to describe the key information of each image. The established CNN architecture is illustrated in Figure 7.

3.2. Image Consistency Verification

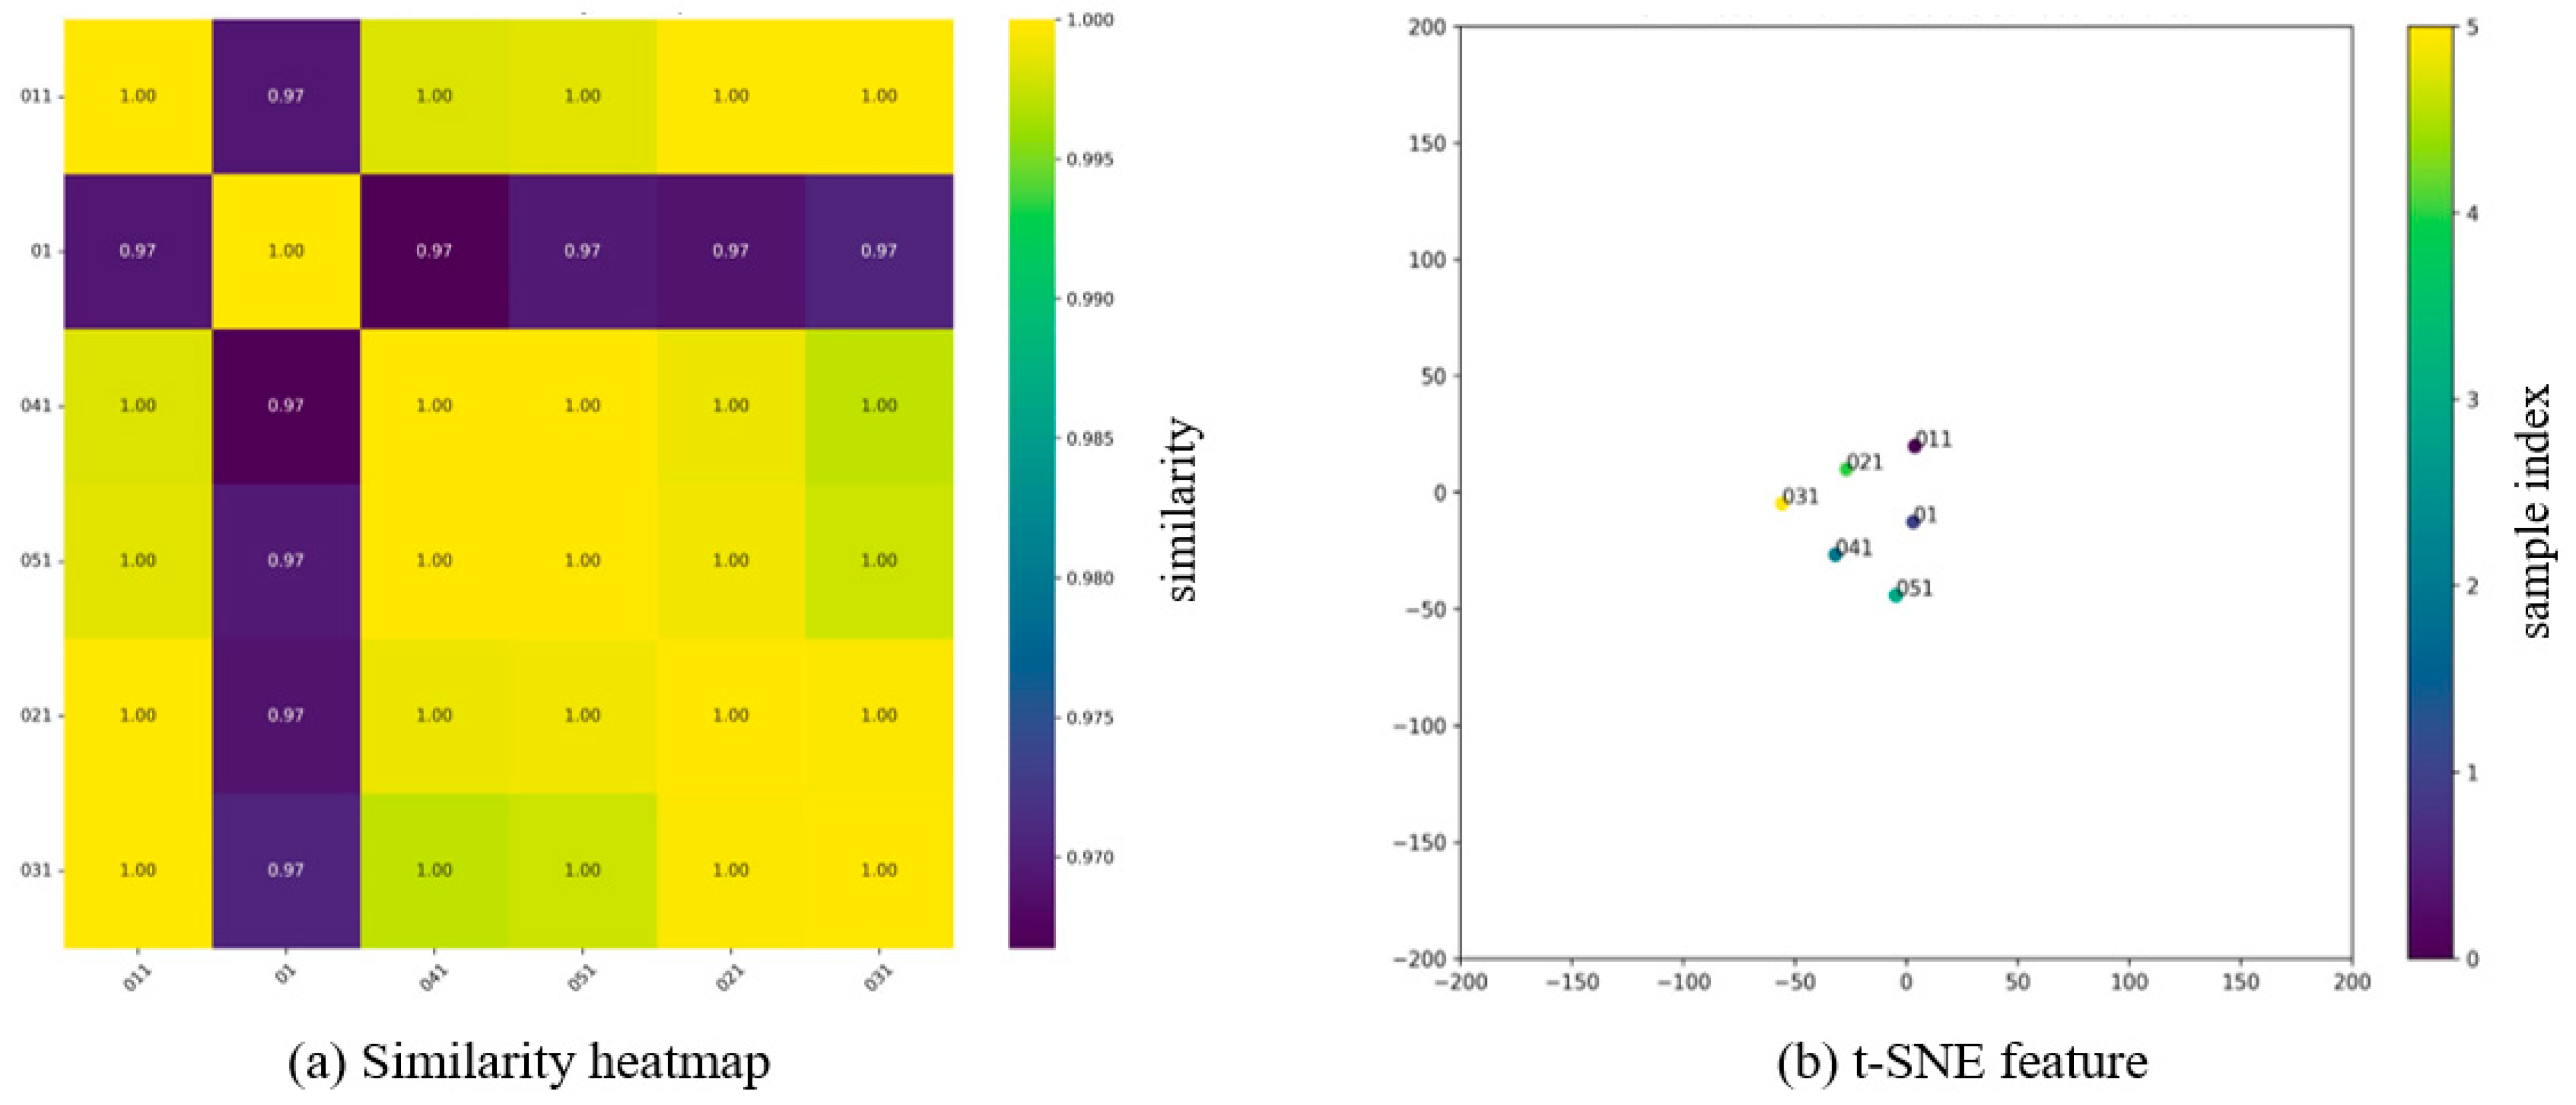
After processing with the CNN, high-dimensional feature vectors of the original red sandstone joint surface morphology and the 3D-printed joint surface morphology were obtained. Cosine similarity was employed to calculate the similarities between the joint surface morphologies of each image, and the feature vectors were utilized to construct a similarity matrix, thereby describing the degree of similarity between sample pairs. Furthermore, to more intuitively display the similarities between the high-dimensional feature vectors of each image, the t-SNE dimensionality reduction algorithm was applied to map the high-dimensional features to a two-dimensional plane, and scatter plots were used to illustrate the similarity distribution between samples. The similarity heatmaps and t-SNE feature maps of the original red sandstone joint surfaces and the 3D-printed joint surfaces are presented in Figure 8 and Figure 9, respectively.
In the similarity heatmap, the intensity of the color represents the similarity between different samples, with lighter colors indicating higher similarity. As illustrated in Figure 8a and Figure 9a, the morphological consistency of joint surfaces in both the upper and lower halves was relatively high, and the 3D-printed joint surface samples from both sections maintained consistent similarity. Notably, the consistency of the upper half was lower than that of the lower half, which corresponded with the consistency errors of the joint surfaces calculated using fractal dimension. The similarity between the 3D-printed joint surfaces of both sections and the original red sandstone joint surfaces remained above 0.95, indicating good consistency. The t-SNE algorithm was employed to project high-dimensional features onto a two-dimensional plane, with the coordinate values representing the positions of the samples in the two-dimensional space. The distances between points in the t-SNE feature map reflected the similarity between joint surface morphologies in different images; the closer the distance between two points, the higher their similarity. As shown in Figure 8b and Figure 9b, with samples 01 and 02 as centers, the points closest to sample 01 were sequentially 051, 011, 021, 041, and 031; the points closest to sample 02 were sequentially 042, 052, 012, 032, and 022. The relative distances between points indicated their similarity in the high-dimensional space, with shorter distances signifying more similar joint surface morphologies. The distribution results of the t-SNE feature map were consistent with the fractal dimension calculation results presented in Table 1. This consistency indicates that, at the image level, the evaluation of morphological consistency of joint surfaces based on grayscale surface-differential box dimension was highly consistent with the evaluation of morphological consistency based on CNN feature similarity.

4. Mechanical Experiment Verification

To further verify the consistency of the joint surface morphology of the 3D printed reverse-engineered samples, mechanical tests were conducted. These tests were used to validate the consistency of the 3D printed samples from a macroscopic mechanical performance perspective, thereby confirming the accuracy of the fractal dimension automatic identification method based on grayscale surface and differential box-counting.
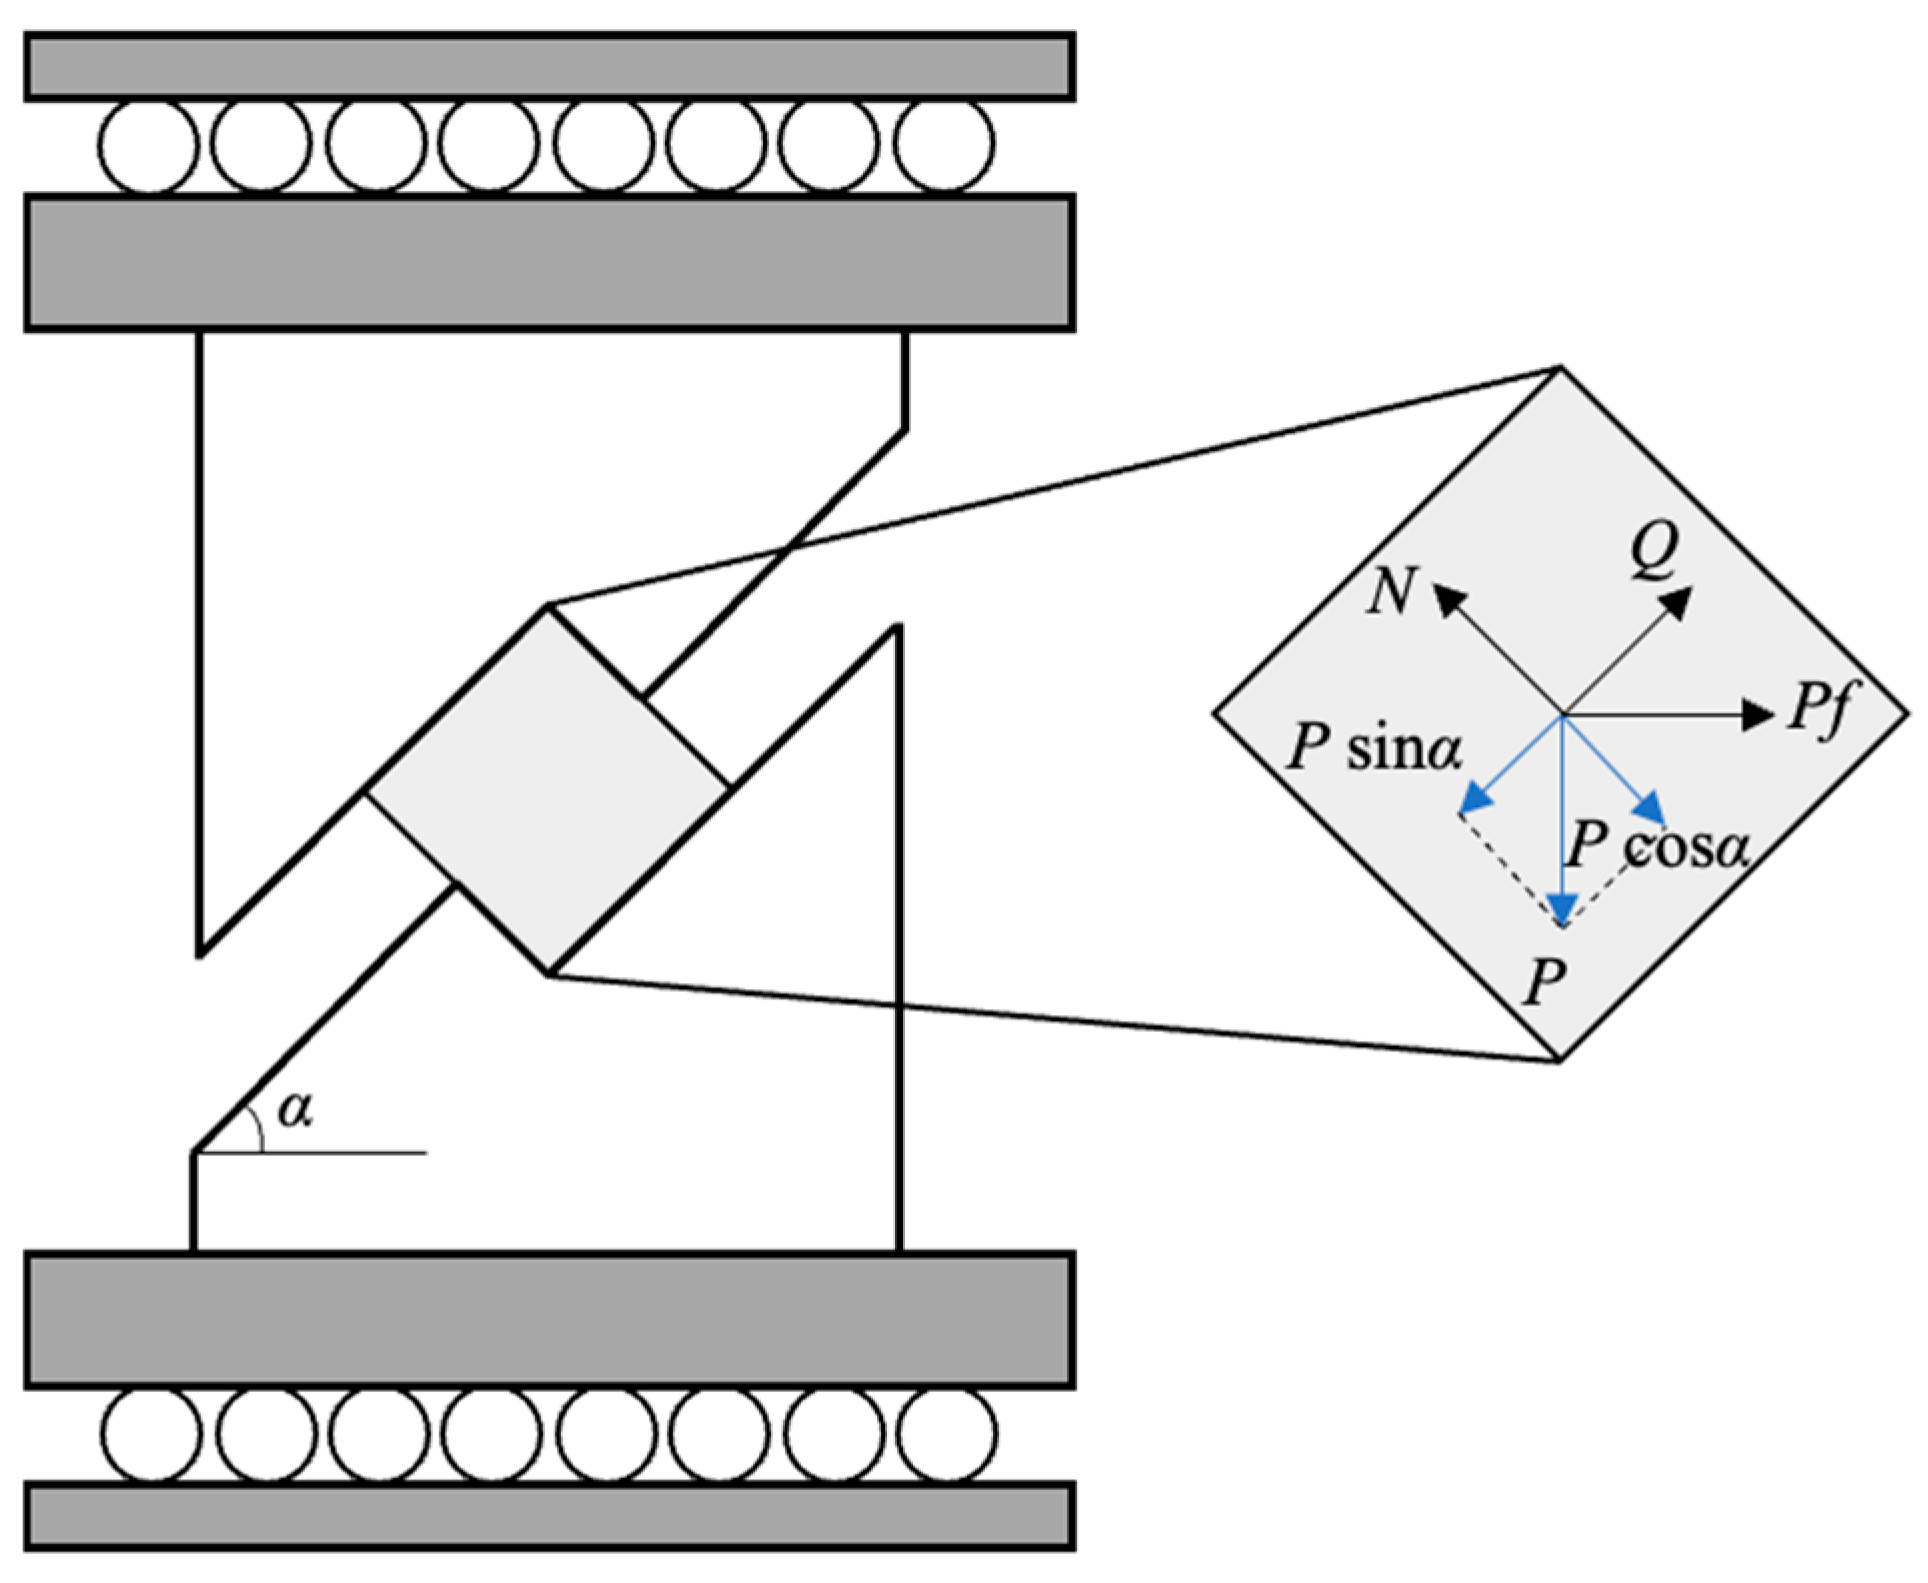
Variable angle shear testing was commonly used in rock mechanics to determine the cohesion c and internal friction angle φ of rock samples. Variable-angle shear tests were conducted by applying axial load through a testing machine using a set of rigid molds. The vertical load was decomposed into normal stress and shear stress through static equilibrium (Figure 10), causing the sample to fail in the direction of the shear angle set by the mold under the action of shear stress. The relationship between normal stress and shear stress along the failure surface of the sample was determined using variable-angle rigid molds in the experiment.

4.1. Experimental System

In this experiment, a testing system composed of a 300 kN rock mechanics testing machine and special variable-angle fixtures was used to apply axial load to the samples. The experimental system is shown in Figure 11. The variable-angle shear fixture consisted of a pair of adjustable rigid clamping plates, with upper and lower components capable of angle adjustment within the range of 0° to 75°, with a 5° adjustment interval. To ensure loading quality, the preset joint surface and axial angle α were set to 45°, and three 3D printed samples were randomly selected for testing.

4.2. Experimental Procedure

Before the experiment began, the sample was mounted into the fixture, and the fixture angle was adjusted to 45°. The top and bottom of the upper and lower clamping plates were placed horizontally at the center of the loading pressure plate of the testing machine. The spherical base was adjusted to ensure close contact between the variable-angle shear fixture and the loading pressure plate. To ensure loading stability, the prestress load was set to 0.5 kN, the cylinder control amount was set to 20%, and the loading rate was 0.75 kN/s. Loading was continued until the joint surface failed. The above experimental steps were repeated until the experiment was completed.

4.3. Experimental Results

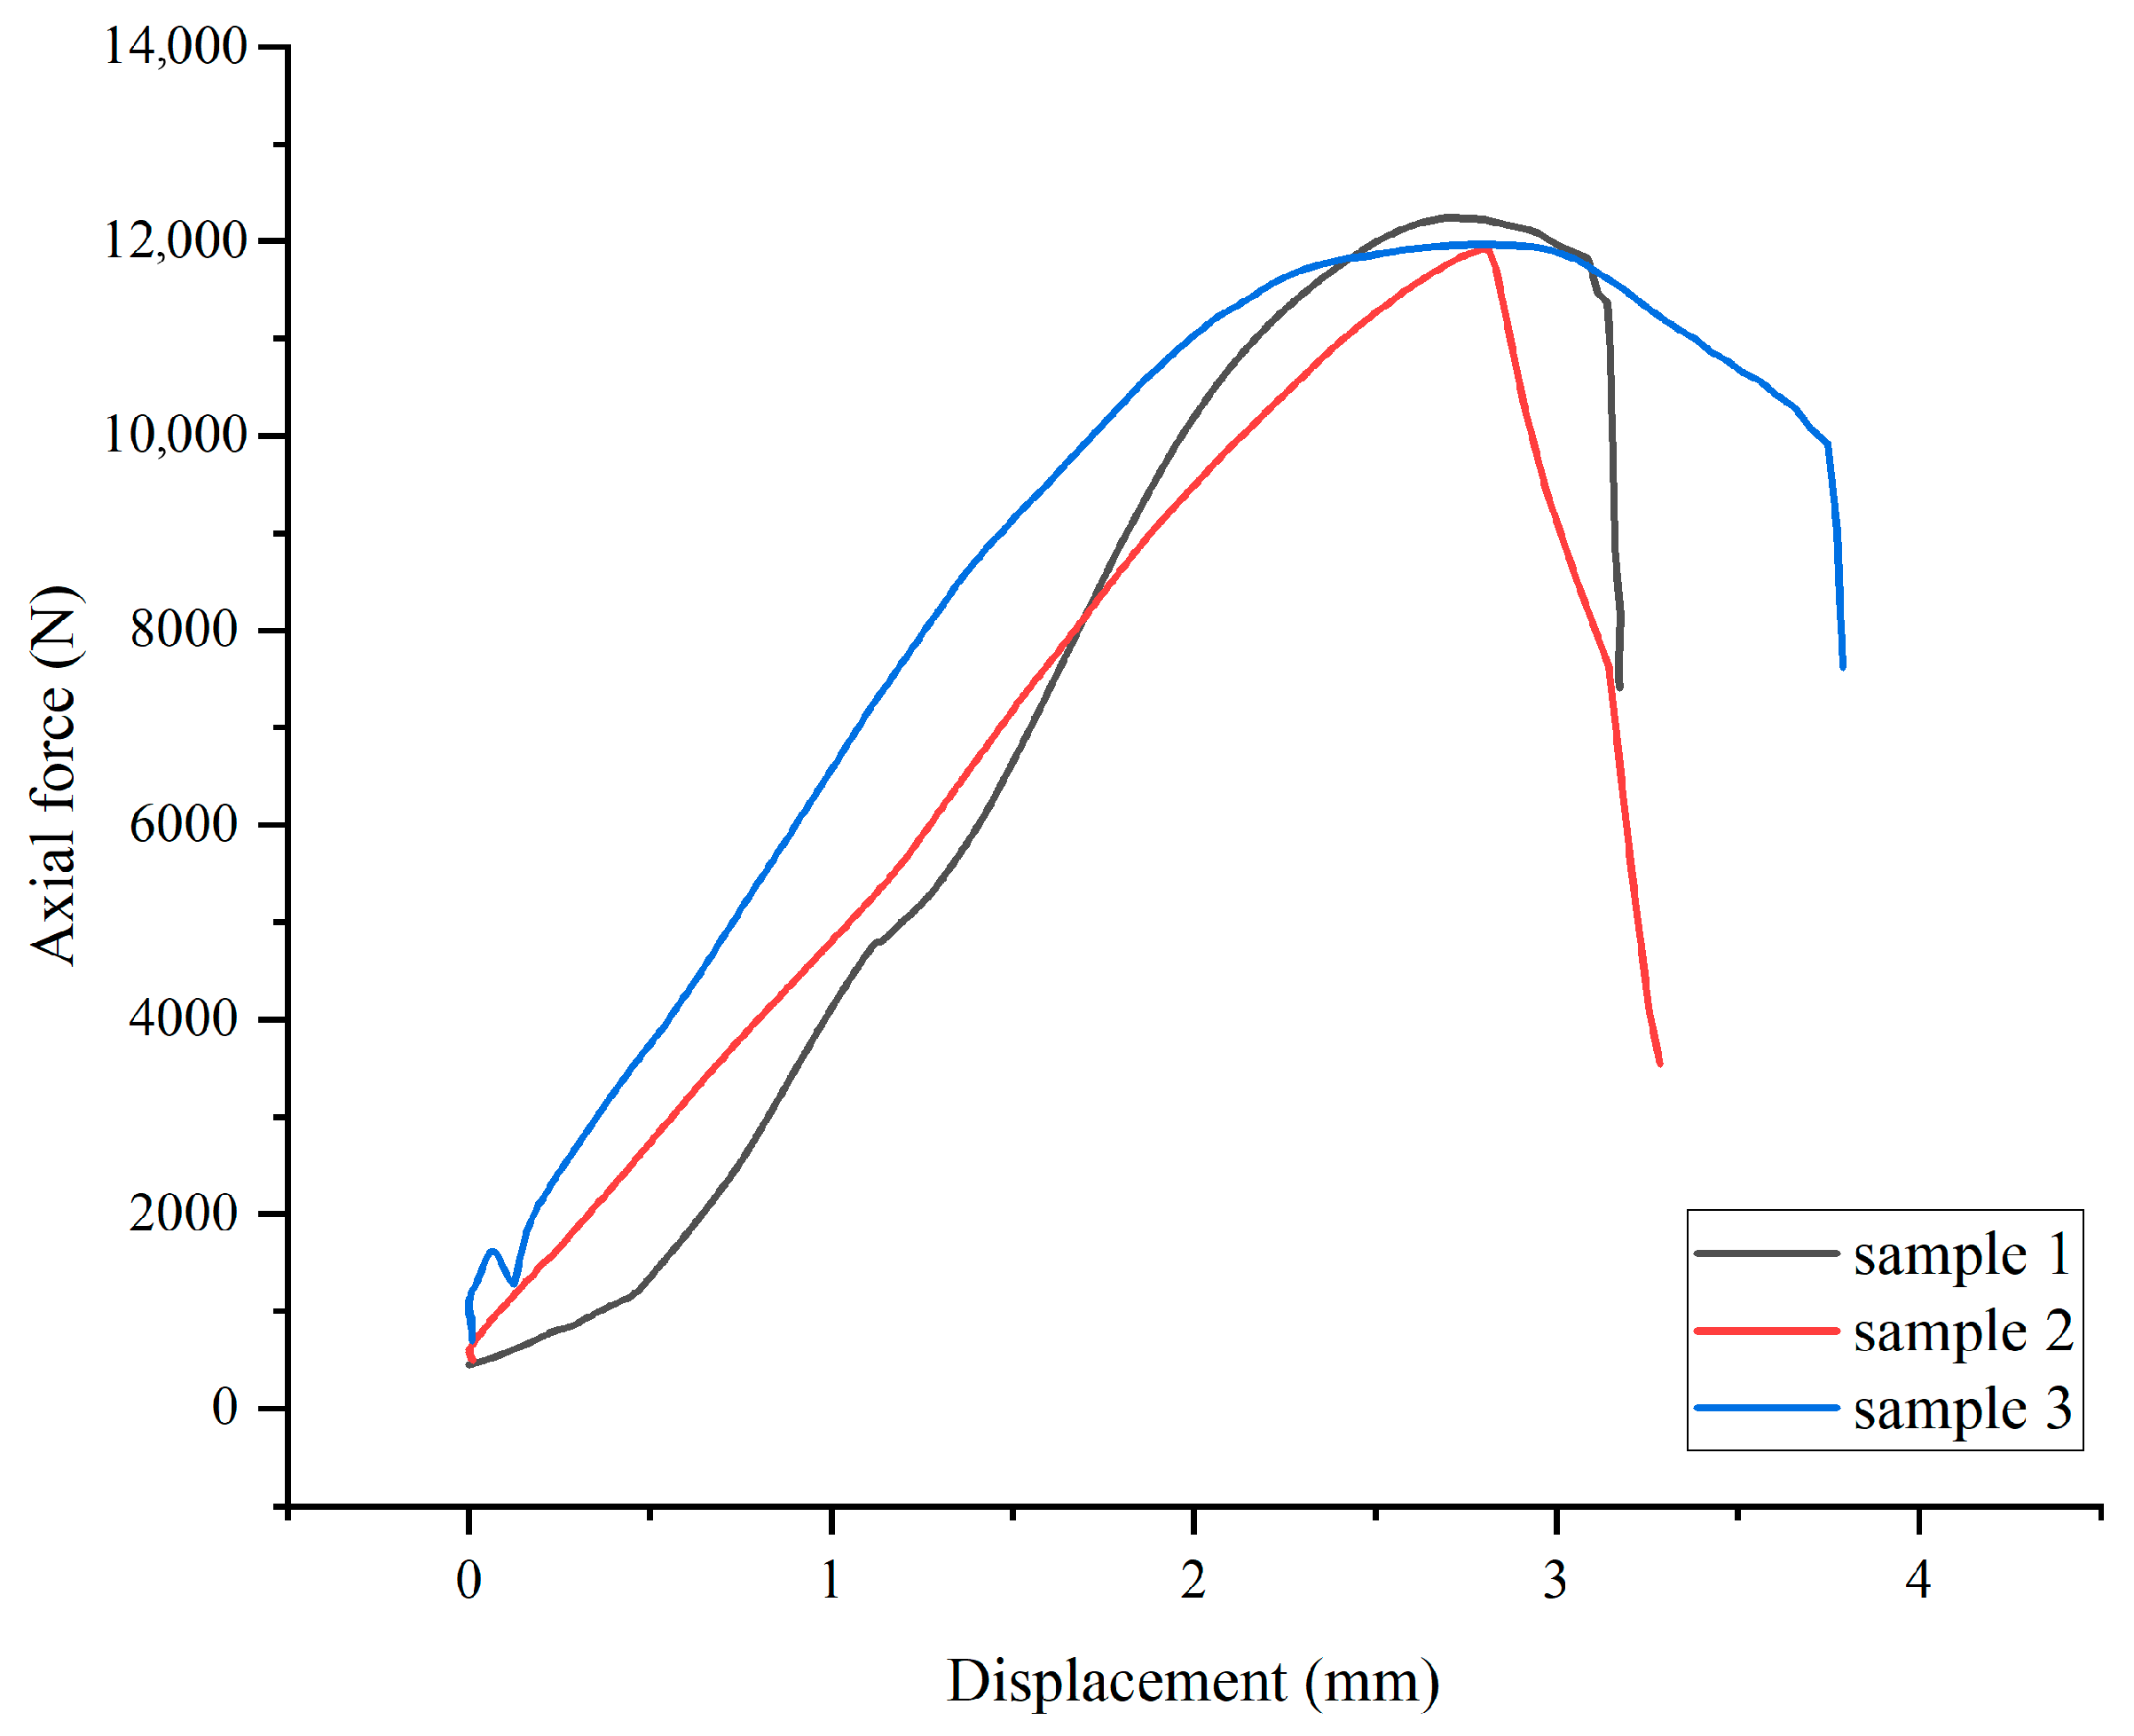
The load–displacement curves of the 3D printed samples reflected the macroscopic deformation and failure patterns of the samples and joint surfaces under shear and compressive stress. The load–displacement curves of the 3D printed samples are shown in Figure 12. As can be seen from the figure, the shapes of the load–displacement curves for the three samples were very similar. Generally, as the axial load increased, the axial displacement increased rapidly. After reaching the maximum load, the axial load decreased rapidly, and the axial displacement subsequently remained almost unchanged.
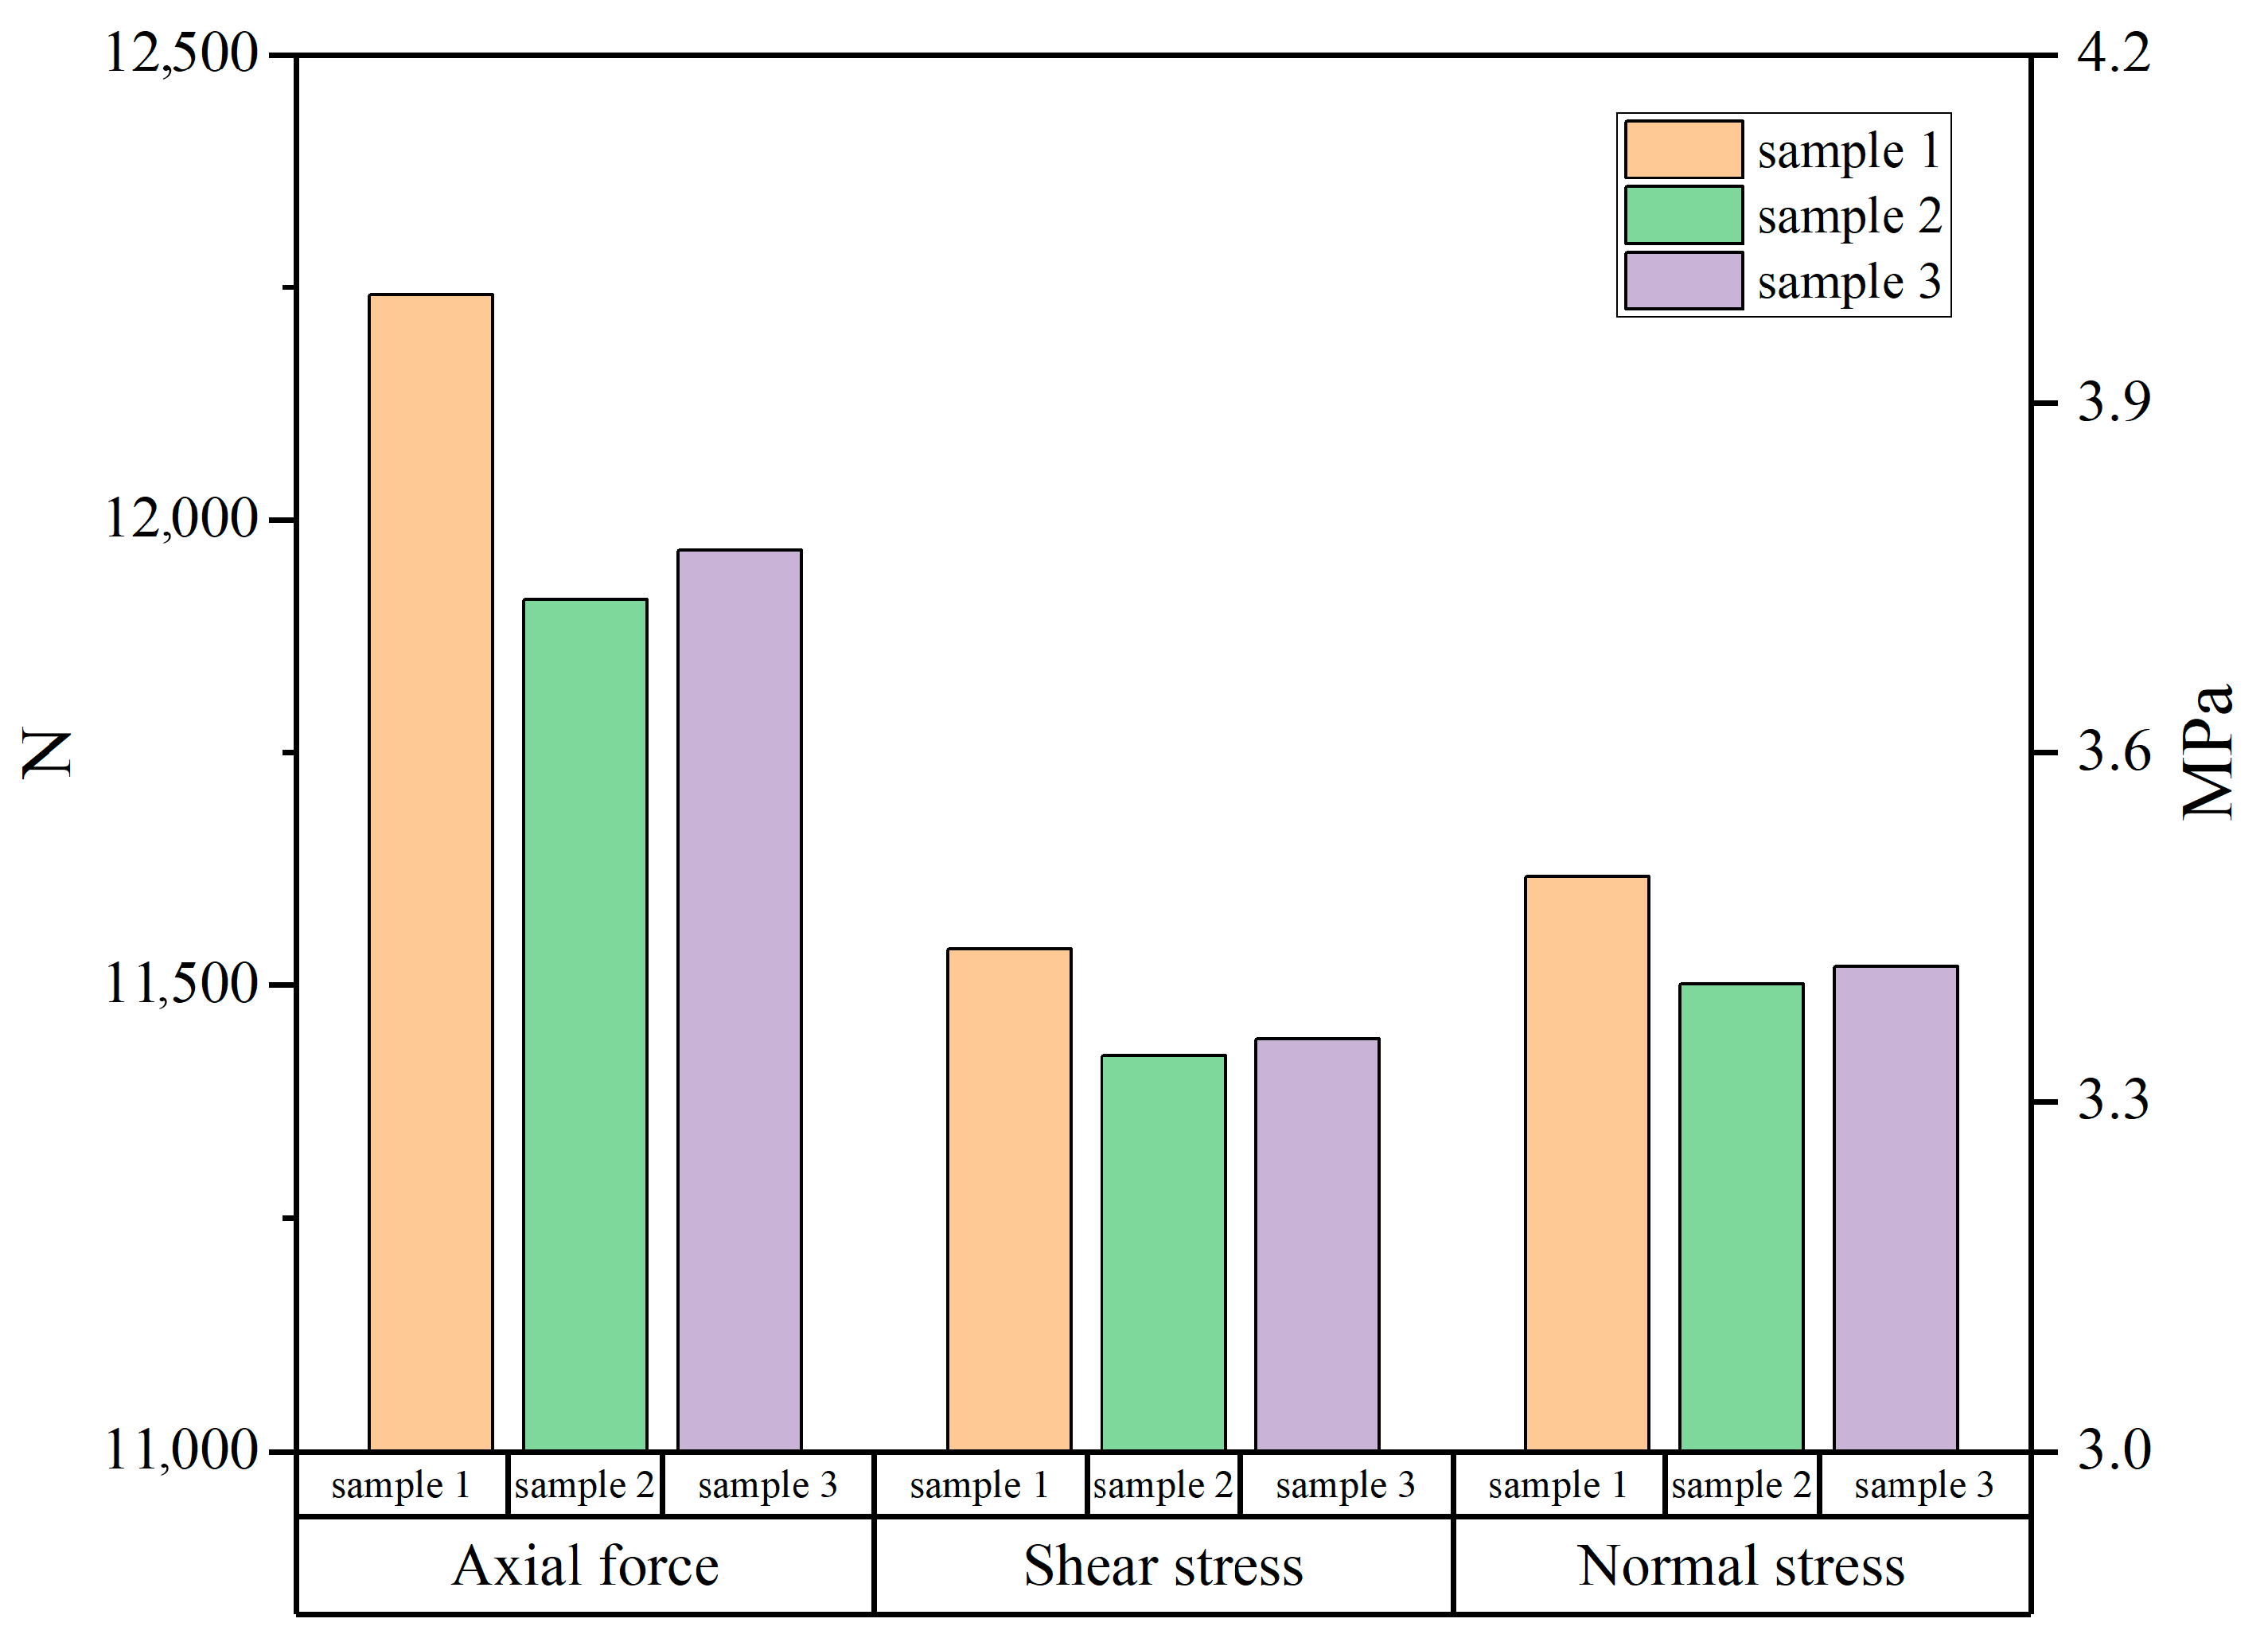
The maximum loads at failure for the three samples were approximately 12,241 N, 11,915 N, and 11,967 N, respectively. In the variable-angle shear test, the normal stress and shear stress acting on the shear surface can be calculated using Equations (2) and (3). Based on this, the maximum load at failure, as well as the normal stress and shear stress on the shear surface, can be determined for the samples, as shown in Figure 13. It can be observed that the differences in the maximum axial force, normal stress, and shear stress on the shear surface at failure for the three samples were all relatively small. Using the median value as a reference, the maximum error was approximately 2.29%.
τ = P A sin α f cos α
σ = P A cos α + f sin α
where τ represents the shear stress, MPa; σ represents the normal stress, MPa; P is the maximum load at failure of the sample, N; A is the area of the shear surface of the sample, mm2; α is the angle between the joint surface of the sample and the horizontal plane, °; f is the rolling friction coefficient, defined as f = 1/(n·d), where n is the number of rollers in the variable-angle shear fixture and d is the diameter of the rollers in mm. The variable-angle shear fixture used in this experiment had 11 rollers, each with a diameter of 10 mm.
Based on the above analysis, it can be concluded that the mechanical performance parameters of the shear surfaces in the variable-angle shear tests of the 3D printed samples exhibited good consistency, with the three mechanical indicators being very close. This indicates that the red sandstone joint surfaces reproduced by 3D printing had good consistency. Therefore, the proposed automatic fractal dimension identification method based on grayscale surface and differential box-counting can effectively evaluate the true consistency of joint surfaces.

5. Conclusions

This study addressed the issue of accurately evaluating the geometric morphology and consistency of rock joint surfaces by proposing an automatic fractal dimension identification method based on grayscale surface and differential box-counting. The accuracy of the proposed method was validated on both the image scale and the macroscopic mechanical scale through CNN feature extraction and variable-angle shear tests conducted on 3D-printed samples. The main conclusions of this paper are as follows:
(1)
By conducting red sandstone splitting tests, the real shear surfaces of red sandstone were obtained manually as joint surfaces. The joint surface morphology was reproduced using 3D printing technology, resulting in 3D printed samples based on the real joint surface morphology.
(2)
An automatic identification method for the fractal dimension of joint surfaces based on grayscale surface and differential box-counting was proposed, and a program was developed to automatically identify the fractal dimension of joint surface roughness. The fractal dimensions of the real red sandstone joint surface morphology and the 3D printed sample joint surface morphology were quantitatively identified, with average identification errors of 8.58% for the upper part and 7.10% for the lower part.
(3)
A CNN feature extraction method was employed to perform a feature similarity analysis on images of the original red sandstone joint surface morphology and the 3D-printed joint surface morphology at the image scale. The validation results indicated that the consistency of the joint surfaces in the upper half was lower than that in the lower half, which aligned with the joint surface consistency errors obtained from fractal dimension calculations. Additionally, the similarity distribution of each sample point’s distance to centers 01 and 02 was consistent with the fractal dimension calculation results.
(4)
The mechanical performance of the joint surfaces of the samples was tested using variable-angle shear tests. From the perspective of mechanical performance, the consistency of the joint surface morphology of the samples was reflected. The load–displacement curves, maximum load, normal stress, and shear stress on the shear surface of the samples all exhibited high convergence characteristics. Therefore, the proposed automatic fractal dimension identification method can effectively evaluate the true consistency of joint surfaces.
(5)
Applying this validated workflow to a wider range of natural joint surfaces with varying roughness, lithologies, and genetic origins represents a crucial and vital direction for our future research.

Author Contributions

Conceptualization, M.L.; Methodology, M.L.; Software, M.L.; Writing—original draft, M.L.; Writing—review and editing, Y.Z., Y.W.; Supervision, Y.Z.; Validation, Y.W. All authors have read and agreed to the published version of the manuscript.

Funding

This research was funded by Demonstration Project of Benefiting People with Science and Technology of Qingdao (grant number 23-2-8-cspz-13-nsh) and Shandong Provincial Natural Science Foundation (grant number ZR2023QE136).

Data Availability Statement

The data are available upon request from the authors.

Conflicts of Interest

The authors declare no conflicts of interest.

References

  1. Jafari, M.K.; Amini Hosseini, K.; Pellet, F.; Boulon, M.; Buzzi, O. Evaluation of shear strength of rock joints subjected to cyclic loading. Soil Dyn. Earthq. Eng. 2003, 23, 619–630. [Google Scholar] [CrossRef]
  2. Yang, Z.Y.; Taghichian, A.; Li, W.C. Effect of asperity order on the shear response of three-dimensional joints by focusing on damage area. Int. J. Rock Mech. Min. Sci. 2010, 47, 1012–1026. [Google Scholar] [CrossRef]
  3. Zhao, J. Joint surface matching and shear strength part A: Joint matching coefficient (JMC). Int. J. Rock Mech. Min. Sci. 1997, 34, 173–178. [Google Scholar] [CrossRef]
  4. Wang, L.C.; Zhu, L.; Cao, Z.Z.; Liu, J.; Xue, Y.; Wang, P.S.; Cao, X.S.; Liu, Y. Thermo-mechanical degradation and fracture evolution in low-permeability coal subjected to cyclic heating-cryogenic cooling. Phys. Fluids 2025, 37, 14. [Google Scholar] [CrossRef]
  5. Fathi, A.; Moradian, Z.; Rivard, P.; Ballivy, G.; Boyd, A.J. Geometric Effect of Asperities on Shear Mechanism of Rock Joints. Rock Mech. Rock Eng. 2016, 49, 801–820. [Google Scholar] [CrossRef]
  6. Wang, J.A.; Wang, Y.X.; Cao, Q.J.; Ju, Y.; Mao, L.T. Behavior of microcontacts in rock joints under direct shear creep loading. Int. J. Rock Mech. Min. Sci. 2015, 78, 217–229. [Google Scholar] [CrossRef]
  7. Li, H.H. Mechanical Responses of Rock Joints With Regular Asperities Under Various Shear Rates Investigated by Double Shear Test. J. Test. Eval. 2017, 45, 470–483. [Google Scholar] [CrossRef]
  8. Kwon, T.H.; Hong, E.S.; Cho, G.C. Shear behavior of rectangular-shaped asperities in rock joints. Ksce J. Civ. Eng. 2010, 14, 323–332. [Google Scholar] [CrossRef]
  9. Tang, Z.C.; Wong, L.N.Y. New Criterion for Evaluating the Peak Shear Strength of Rock Joints Under Different Contact States. Rock Mech. Rock Eng. 2016, 49, 1191–1199. [Google Scholar] [CrossRef]
  10. Xu, B.; Liu, X.R.; Zhou, X.H.; Xie, Y.K.; Suliman, L.; Liu, X.L.; Lin, G.Y.; Huang, J.H. Investigation on the macro-meso fatigue damage mechanism of rock joints with multiscale asperities under pre-peak cyclic shear loading. Soil Dyn. Earthq. Eng. 2021, 151, 16. [Google Scholar] [CrossRef]
  11. Barton, N. Review of a new shear-strength criterion for rock joints. Eng. Geol. 1973, 7, 287–332. [Google Scholar] [CrossRef]
  12. Barton, N.; Choubey, V. The shear strength of rock joints in theory and practice. Rock Mech. 1977, 10, 1–54. [Google Scholar] [CrossRef]
  13. Zhang, X.B.; Zhu, X.; Yao, C.; Ouyang, S.; Yang, J.H.; Jiang, Q.H. Investigation on the Shear Behavior of Rough Rock Joints Prepared by Three- Dimensional Engraving Technique. J. Test. Eval. 2022, 50, 1425–1440. [Google Scholar] [CrossRef]
  14. Bao, H.; Zhang, G.B.; Lan, H.X.; Yan, C.G.; Xu, J.B.; Xu, W. Geometrical heterogeneity of the joint roughness coefficient revealed by 3D laser scanning. Eng. Geol. 2020, 265, 9. [Google Scholar] [CrossRef]
  15. Babanouri, N.; Nasab, S.K.; Baghbanan, A.; Mohamadi, H.R. Over-consolidation effect on shear behavior of rock joints. Int. J. Rock Mech. Min. Sci. 2011, 48, 1283–1291. [Google Scholar] [CrossRef]
  16. Li, X.L.; Ren, Z.Y.; Cao, Z.Z.; Hao, R. Study on coal drawing parameters of deeply buried hard coal seams based on PFC. Sci. Rep. 2025, 15, 16. [Google Scholar] [CrossRef] [PubMed]
  17. Ju, Y.; Xie, H.P.; Zheng, Z.M.; Lu, J.B.; Mao, L.T.; Gao, F.; Peng, R.D. Visualization of the complex structure and stress field inside rock by means of 3D printing technology. Chin. Sci. Bull. 2014, 59, 5354–5365. [Google Scholar] [CrossRef]
  18. Ju, Y.; Wang, L.; Xie, H.P.; Ma, G.W.; Zheng, Z.M.; Mao, L.T. Visualization and Transparentization of the Structure and Stress Field of Aggregated Geomaterials Through 3D Printing and Photoelastic Techniques. Rock Mech. Rock Eng. 2017, 50, 1383–1407. [Google Scholar] [CrossRef]
  19. Liu, P.; Ju, Y.; Ranjith, P.G.; Zheng, Z.; Wang, L.; Wanniarachchi, A. Visual representation and characterization of three-dimensional hydrofracturing cracks within heterogeneous rock through 3D printing and transparent models. Int. J. Coal Sci. Technol. 2016, 3, 284–294. [Google Scholar] [CrossRef]
  20. Jiang, C.; Zhao, G.F. A Preliminary Study of 3D Printing on Rock Mechanics. Rock Mech. Rock Eng. 2015, 48, 1041–1050. [Google Scholar] [CrossRef]
  21. Jiang, C.; Zhao, G.F.; Zhu, J.B.; Zhao, Y.X.; Shen, L.M. Investigation of Dynamic Crack Coalescence Using a Gypsum-Like 3D Printing Material. Rock Mech. Rock Eng. 2016, 49, 3983–3998. [Google Scholar] [CrossRef]
  22. Jiang, Q.; Feng, X.T.; Song, L.B.; Gong, Y.H.; Zheng, H.; Cui, J. Modeling rock specimens through 3D printing: Tentative experiments and prospects. Acta Mech. Sin. 2016, 32, 101–111. [Google Scholar] [CrossRef]
  23. Head, D.; Vanorio, T. Effects of changes in rock microstructures on permeability: 3-D printing investigation. Geophys. Res. Lett. 2016, 43, 7494–7502. [Google Scholar] [CrossRef]
  24. Chen, F.; Yu, H.M.; Yang, Y.L.; Wu, D.Y. Influences of Roughness Sampling Interval and Anisotropy on Shear Failure Mechanism of Rock Joint Surface. Energies 2021, 14, 6902. [Google Scholar] [CrossRef]
  25. Magsipoc, E.; Zhao, Q.; Grasselli, G. 2D and 3D Roughness Characterization. Rock Mech. Rock Eng. 2020, 53, 1495–1519. [Google Scholar] [CrossRef]
  26. Magsipoc, E.; Grasselli, G. A local surface roughness mapping method for post-failure interpretation of brittle fracture propagation. Int. J. Rock Mech. Min. Sci. 2023, 172, 16. [Google Scholar] [CrossRef]
  27. Tatone, B.S.A.; Grasselli, G. Quantitative Measurements of Fracture Aperture and Directional Roughness from Rock Cores. Rock Mech. Rock Eng. 2012, 45, 619–629. [Google Scholar] [CrossRef]
  28. Tatone, B.S.A.; Grasselli, G. A new 2D discontinuity roughness parameter and its correlation with JRC. Int. J. Rock Mech. Min. Sci. 2010, 47, 1391–1400. [Google Scholar] [CrossRef]
  29. Tatone, B.S.A.; Grasselli, G. An Investigation of Discontinuity Roughness Scale Dependency Using High-Resolution Surface Measurements. Rock Mech. Rock Eng. 2013, 46, 657–681. [Google Scholar] [CrossRef]
  30. Turk, N.; Greig, M.J.; Dearman, W.R.; Amin, F.F. Characterization of rock joint surfaces by fractal dimension. In Proceedings of the 28th U.S. Symposium on Rock Mechanics (USRMS), Tucson, AZ, USA, 29 June–1 July 1987. [Google Scholar]
  31. Lee, Y.H.; Carr, J.R.; Barr, D.J.; Haas, C.J. The fractal dimension as a measure of the roughness of rock discontinuity profiles. Int. J. Rock Mech. Min. Sci. Geomech. Abstr. 1990, 27, 453–464. [Google Scholar] [CrossRef]
  32. Wakabayashi, N.; Fukushige, I. Experimental study on the relation between fractal dimension and shear strength. In Fractured and Jointed Rock Masses; CRC Press: Boca Raton, FL, USA, 1995; pp. 119–124. [Google Scholar]
  33. Xie, H.P. Fractal Description of Rock Joints. Chin. J. Geotech. Eng. 1995, 17, 18–23. [Google Scholar]
  34. Li, Y.R.; Huang, R.Q. Relationship between joint roughness coefficient and fractal dimension of rock fracture surfaces. Int. J. Rock Mech. Min. Sci. 2015, 75, 15–22. [Google Scholar] [CrossRef]
  35. Mandelbrot, B. How Long Is the Coast of Britain? Statistical Self-Similarity and Fractional Dimension. Science 1967, 156, 636–638. [Google Scholar] [CrossRef]
  36. Falconer, K. Fractal Geometry: Mathematical Foundations and Applications; John Wiley: Chichester, UK, 1990. [Google Scholar]
  37. Wu, Y.; Verdú, S. Rényi information dimension: Fundamental limits of almost lossless analog compression. IEEE Trans. Inf. Theory 2010, 56, 3721–3748. [Google Scholar] [CrossRef]
  38. Grassberger, P.; Procaccia, I. Measuring the strangeness of strange attractors. Phys. D Nonlinear Phenom. 1983, 9, 189–208. [Google Scholar] [CrossRef]
  39. Schleicher, D. Hausdorff dimension, its properties, and its surprises. Am. Math. Mon. 2007, 114, 509–528. [Google Scholar] [CrossRef]
  40. Sarkar, N.; Chaudhuri, B.B. An efficient differential box-counting approach to compute fractal dimension of image. IEEE Trans. Syst. Man Cybern. 1994, 24, 115–120. [Google Scholar] [CrossRef]
  41. Ban, L.R.; Qi, C.Z.; Chen, H.X.; Yan, F.Y.; Ji, C.M. A New Criterion for Peak Shear Strength of Rock Joints with a 3D Roughness Parameter. Rock Mech. Rock Eng. 2020, 53, 1755–1775. [Google Scholar] [CrossRef]
Figure 1. Red sandstone splitting test.
Buildings 15 03861 g001
Figure 2. Reverse process of joint surface geometric morphology.
Buildings 15 03861 g002
Figure 3. 3D printer and samples.
Buildings 15 03861 g003
Figure 4. Differential box-counting calculation principle.
Buildings 15 03861 g004
Figure 5. Calculation method for fractal dimension.
Buildings 15 03861 g005
Figure 6. Joint surface morphology after pixel adjustment.
Buildings 15 03861 g006
Figure 7. CNN structure.
Buildings 15 03861 g007
Figure 8. Similarity of original red sandstone joint surfaces.
Buildings 15 03861 g008
Figure 9. Similarity of 3D-printed joint surfaces.
Buildings 15 03861 g009
Figure 10. Principle of variable-angle shear test.
Buildings 15 03861 g010
Figure 11. Variable angle shear test system.
Buildings 15 03861 g011
Figure 12. Load-axial displacement curve.
Buildings 15 03861 g012
Figure 13. Mechanical parameters at sample failure.
Buildings 15 03861 g013
Table 1. Fractal dimension calculation results.
No.PartsFractal
Dimension
Relative
Error (%)
Average
Error (%)
Maximum
Error (%)
Minimum
Error (%)
011top2.28337.98
021top2.26348.79
031top2.24869.388.589.387.40
041top2.25009.33
051top2.29777.40
01top2.4777
012bottom2.31406.61
022bottom2.26328.66
032bottom2.27438.217.108.665.76
042bottom2.33515.76
052bottom2.32286.25
02bottom2.4814
Disclaimer/Publisher’s Note: The statements, opinions and data contained in all publications are solely those of the individual author(s) and contributor(s) and not of MDPI and/or the editor(s). MDPI and/or the editor(s) disclaim responsibility for any injury to people or property resulting from any ideas, methods, instructions or products referred to in the content.