1. Introduction
The global building energy demand continues to rise, driven by rapid urbanization, population growth, and economic development. Buildings are responsible for a significant portion of this demand, accounting for approximately 40% of global energy consumption due to their requirements for heating, cooling, lighting, and equipment operation. In Saudi Arabia, the situation is even more pronounced: buildings consume approximately 80% of the nation’s electricity, with residential and institutional sectors being the primary contributors. This high demand is largely attributed to the country’s harsh climate, which necessitates extensive use of air conditioning, and to the increasing number of buildings resulting from economic and population growth [
1,
2,
3]. More recent national data confirm these proportions. According to the Saudi Energy Efficiency Center [
4,
5], the building sector, including residential, educational, and institutional uses, accounts for nearly 79–81% of total electricity consumption in the Kingdom. Regional analyses by [
6,
7] further emphasize that energy use growth remains highest in the central, western, and eastern regions, where climatic extremes and population density drive cooling-dominated demand. These updated sources reinforce the urgency of typological and efficiency-focused studies addressing the educational building stock.
Within this context, educational buildings in Saudi Arabia, such as universities and schools, are emerging as major energy consumers. Studies have shown that university campuses, in particular, exhibit high electricity consumption intensities, with air conditioning systems accounting for the majority of usage, followed by lighting and other equipment [
8,
9]. As the educational sector continues to expand in both size and complexity, its contribution to national energy demand is expected to grow further.
Recognizing these challenges, Saudi Arabia has initiated several efforts to improve energy efficiency in its building sector. These include the implementation of energy conservation measures, retrofitting programs, and the adoption of sustainable building standards. For example, energy retrofitting of educational buildings has been shown to reduce annual energy consumption by up to 22.7%, with relatively short payback periods, making such interventions both effective and economically viable [
1,
8]. National policies and frameworks, such as Vision 2030 and the “Mostadam” rating system, also aim to promote sustainable development and energy-efficient technologies across the country [
2,
10].
Recent research in Saudi Arabia has increasingly emphasized the modeling and optimization of energy consumption in educational buildings, reflecting their strategic importance within national energy policy and sustainability initiatives. Advanced regression-based models, developed using extensive real operational data from schools, have demonstrated high predictive accuracy (over 90%) for energy consumption, enabling more effective budget planning and lifecycle management for educational facilities [
11]. Benchmarking studies in higher education institutions have identified air conditioning as the dominant energy consumer, and have proposed targeted energy conservation measures (ECMs) that can significantly reduce consumption and environmental impact, with payback periods as short as 4.1 years [
9]. Furthermore, techno-economic assessments and simulation-based analyses have validated the feasibility and environmental benefits of integrating photovoltaic (PV) systems in school and university buildings, showing substantial reductions in both operational costs and carbon emissions [
12,
13]. These advancements are supported by national programs such as the Saudi Energy Efficiency Program and align with the goals of Vision 2030, which advocates large-scale adoption of renewable energy and building retrofits [
14].
Despite these advances, there remains a notable research gap: while considerable attention has been given to residential and commercial buildings, limited work has focused specifically on the energy consumption patterns of educational buildings in Saudi Arabia, especially through the lens of building archetypes. Most existing studies address general strategies or focus on other building types, leaving a need for systematic analysis and classification of educational building archetypes to support targeted energy modeling and planning [
1,
9].
Recent advancements in geospatial analysis have enabled the development of robust typological frameworks for educational buildings at a national scale, but this is still limited in the Saudi educational sector at universities’ level. To address this gap, this study introduces a GIS-based methodology that systematically classifies campus buildings across Saudi public universities into a representative archetype, leveraging spatial, morphological, and institutional datasets. Such an approach aligns with global best practices, where integrating multi-source geospatial data and advanced classification techniques has proven effective for mapping building functions and forms over large areas, supporting applications in urban planning and city-scale energy modeling [
15]. By capturing the regional and functional diversity of campus structures, the resulting archetype framework provides a standardized national reference that can inform facility management, performance benchmarking, and strategic energy-efficiency planning. While the current focus is on typological characterization rather than detailed energy simulation, the framework establishes a foundational dataset and methodological structure. The objectives are as follows:
Collect and analyze campus-level data for all Saudi public universities, including institutional age, geographic region, urban context, and masterplan typology;
Classify university campuses into unique cells defined by the selected categorical variables to create a structured national inventory;
Quantify the prevalence of each archetype using a cumulative weighting factor and rank-based analysis to reveal dominant and recurring patterns;
Identify a representative college building archetype that can serve as a reference for future energy performance analysis, benchmarking, and planning;
The central research question guiding this study is as follows:
This groundwork is essential for future research, as an archetype development has been shown to significantly enhance the accuracy and relevance of subsequent environmental and energy modeling studies, ultimately supporting more sustainable policy and operational decisions in the educational sector [
16]. This study will contribute to knowledge by bridging the gap between existing data and the need for a standardized college building benchmark and provides a robust foundation for college building evaluation.
It is important to note that this study’s primary objective is typological classification for managerial, planning, and benchmarking purposes rather than quantitative energy-performance simulation. The research provides a macro-level overview of recurring architectural patterns across Saudi universities, producing an organized typology that future environmental and energy modeling work can build upon. This distinction ensures that the current analysis remains focused on the spatial and morphological characterization of the educational building stock while establishing a foundational dataset for later integration with detailed thermal and energy analyses.
While the preceding section outlined Saudi Arabia’s energy-efficiency context and policy motivations, the following
Section 2 turns to the theoretical and typological foundations underpinning the study. This separation clarifies that national energy initiatives and sustainability programs establish the contextual rationale for the research, whereas archetype theory and building-typology literature define the analytical framework through which educational buildings are systematically classified. Establishing this distinction enhances coherence and ensures a logical progression from policy motivation to methodological theory.
2. Background
Building archetypes are foundational to architectural theory and practice, serving as reference models for recurrent spatial, formal, and cultural patterns. Archetypes are understood as prototypical forms or typologies that recur across cultures and eras, embodying both functional needs and symbolic meanings [
17,
18]. They provide continuity in the built environment, linking collective memory and enduring design principles with opportunities for innovation.
Classical theory positions archetypes as timeless reference models. For example, Rossi described them as recurring typologies structuring urban memory, while others emphasized their mediating role between form, function, and cultural context [
17]. More recent scholarship highlights the multidisciplinary nature of archetypes, integrating anthropometry, environment, history, and technology to define architectural identity. The work of architects like Louis Kahn demonstrates how archetypes connect modern design with historical traditions, using them as conceptual tools to create unique and meaningful places [
17].
Archetypes often serve as formal and spatial prototypes, such as the house, temple, courtyard, or dome, that persist in both vernacular and sacred architecture, reflecting symbolic traditions and climatic adaptation [
19,
20]. Steadman introduced the idea of the “archetypal building” as a conceptual model from which real buildings are derived through systematic transformation, shaped by constraints like lighting, geometry, and human use [
21]. These forms are not only functional but also carry deep cultural and psychological resonance, as seen in the recurring motifs of sacred buildings across civilizations [
20].
Archetypes also reflect cultural and regional identity. In the Middle East, enduring forms such as courtyards and iwans link contemporary architecture to historical precedents, while in Saudi Arabia, educational campuses blend imported modernist templates with locally adapted typologies [
17,
20]. This duality allows for systematic analysis of recurring building designs in rapidly evolving contexts.
Ro conclude this section, building archetypes are central to architectural theory, functioning as both practical prototypes and carriers of cultural meaning. Their enduring relevance lies in their ability to bridge tradition and innovation, shaping the built environment across time and place.
The theoretical review of archetypes presented above establishes the conceptual foundation for this study. By synthesizing prior typology-based approaches, this research applies those principles to Saudi higher-education buildings through a GIS-driven framework. The reviewed theories on classification logic, representativeness, and morphological grouping directly inform the study’s research aim, to develop a reproducible national typology that supports facility management, energy benchmarking, and future simulation studies.
2.1. Educational Buildings
Educational buildings present unique challenges for archetype modeling due to their complex spatial layouts, high occupancy densities, and variable operational schedules. Developing robust archetypes for these facilities is essential for accurate energy modeling and effective policy design [
22,
23].
Educational archetypes are typically classified by plan form (e.g., courtyard, linear, cluster) and construction vintage, reflecting changes in codes, HVAC adoption, and materials over time [
22]. Archetype-based models allow researchers to generalize energy behavior across large stocks, enabling scalable assessments without modeling each building individually [
22,
23]. Recent reviews highlight that the choice of modeling approach—code-based, data-driven, or hybrid—should be tailored to data availability and research objectives [
22].
In this study, archetype modeling refers to the analytical process of representing groups of educational buildings through generalized prototypes that capture their shared spatial, morphological, and operational attributes. This concept directly intersects with educational buildings, which exhibit recurring functional layouts and design patterns shaped by standardized planning and policy frameworks in Saudi Arabia. By linking archetype theory with the empirical classification of educational facilities, the research defines educational building archetypes not as abstract typologies but as data-driven, representative models that can inform benchmarking, retrofit prioritization, and future energy modeling applications.
Key Insights from Recent Research
Studies show that energy use intensity varies significantly by building function and discipline, with research buildings and science facilities typically consuming more energy than academic offices or health buildings [
23].
Hierarchical and Bayesian calibration of archetypes reduces uncertainty in large institutional stocks, improving predictive accuracy for diverse educational environments [
24,
25].
Rigid assumptions about occupancy scheduling can distort energy predictions by 8–10%. Integrating stochastic or survey-based occupancy data is critical for operational realism [
22,
26].
Automated archetype generation using Artificial Intelligence and Geographic Information System datasets enables campus-specific models that reflect cultural and regional distinctions, even when institutional records are incomplete [
26,
27].
In Saudi Arabia and similar regions, ministries often commission repeated educational building designs. Archetype analysis is well-suited to capture these patterns, ensuring that simulations prioritize the most prevalent and impactful designs [
27].
2.2. Buildings Archetypes in Saudi Arabia
The use of building archetypes is increasingly important in Saudi Arabia due to the country’s heavy reliance on air conditioning and rapid urban expansion. Archetype-based modeling enables structured generalization of energy performance across large building stocks, while accounting for differences in construction, climate, and operation [
1,
28].
Early Saudi research focused on the residential sector [
29,
30]. Krarti et al. developed bottom-up archetypical housing energy models stratified by region and construction vintage, demonstrating that tailored insulation and HVAC upgrades could reduce residential energy consumption by up to 50% [
1,
10]. Alrashed and Asif introduced a five-zone climatic classification system, supporting archetypes that reflect regional cooling intensity. More recently, comprehensive frameworks have categorized housing stock by type, vintage, and other variables, using statistical weighting and chi-square analysis to identify representative archetypes [
28].
Despite advances in the housing sector, research on educational building archetypes in Saudi Arabia remains limited. Mohammed et al. developed a regression-based model for 350 schools, identifying building age and HVAC system size as dominant predictors of energy demand, but did not establish typological archetypes [
11]. Recent studies on educational buildings have focused on energy retrofitting and performance benchmarking, highlighting the need for archetype-based approaches to support large-scale energy efficiency improvements [
8,
9]. Therefore, this study contributes to existing knowledge by extending college building archetype to Saudi public universities, using categorical variables such as year of construction, region, urban context, plan typology, and design pattern. The approach adapts statistical rigor from existing data of the higher educational sector, addressing a major research gap and providing a foundation for campus-scale and national policy simulations.
3. Data Sources and Analysis
This study investigates the morphological and operational characteristics of college buildings within Saudi Arabia’s public university system to determine the presence of recurring architectural archetypes. While campus layouts display considerable variety, a notable repetition of identical college building designs was observed across multiple institutions, suggesting the use of reproducible spatial models that maintain coherent formal logic across diverse settings.
In architectural typology, an archetype is defined as a reproducible spatial model that appears in different contexts while retaining a consistent organizational structure [
31,
32,
33,
34]. This research operationalizes the concept at the college building scale, focusing on plan types that are replicated across various institutional and geographic environments, rather than at the broader campus master plan level.
The analysis encompasses all 29 public universities in Saudi Arabia, with each institution’s main campus serving as the primary unit of analysis. For multi-campus universities, the dominant site was coded, while distinct typologies at satellite campuses were noted but not classified separately. The classification process prioritized official documentation, supplemented by secondary data sources for validation and context.
Primary data:
Secondary data sources:
This multi-source approach aligns with best practices in recent research, which emphasizes the importance of combining on-site measurements, user surveys, and official documentation to assess building performance and typological patterns in Saudi higher education settings [
31,
32,
33].
3.1. Population
Saudi Arabia, the largest nation on the Arabian Peninsula, is characterized by a rapidly expanding and unevenly distributed population across its 13 administrative regions.
Table 1 shows that as of mid-2024, the Kingdom’s total population reached approximately 35.3 million, marking a significant increase of 1.6 million people compared to the previous year. The Saudi citizens constitute 55.6% (19.6 million) of the population, while non-Saudi residents account for 44.4% (15.7 million). Notably, non-Saudis contributed 75.6% of the net population growth from 2023 to 2024, representing the Kingdom’s continued reliance on expatriate labor to support economic development and diversification [
5,
37].
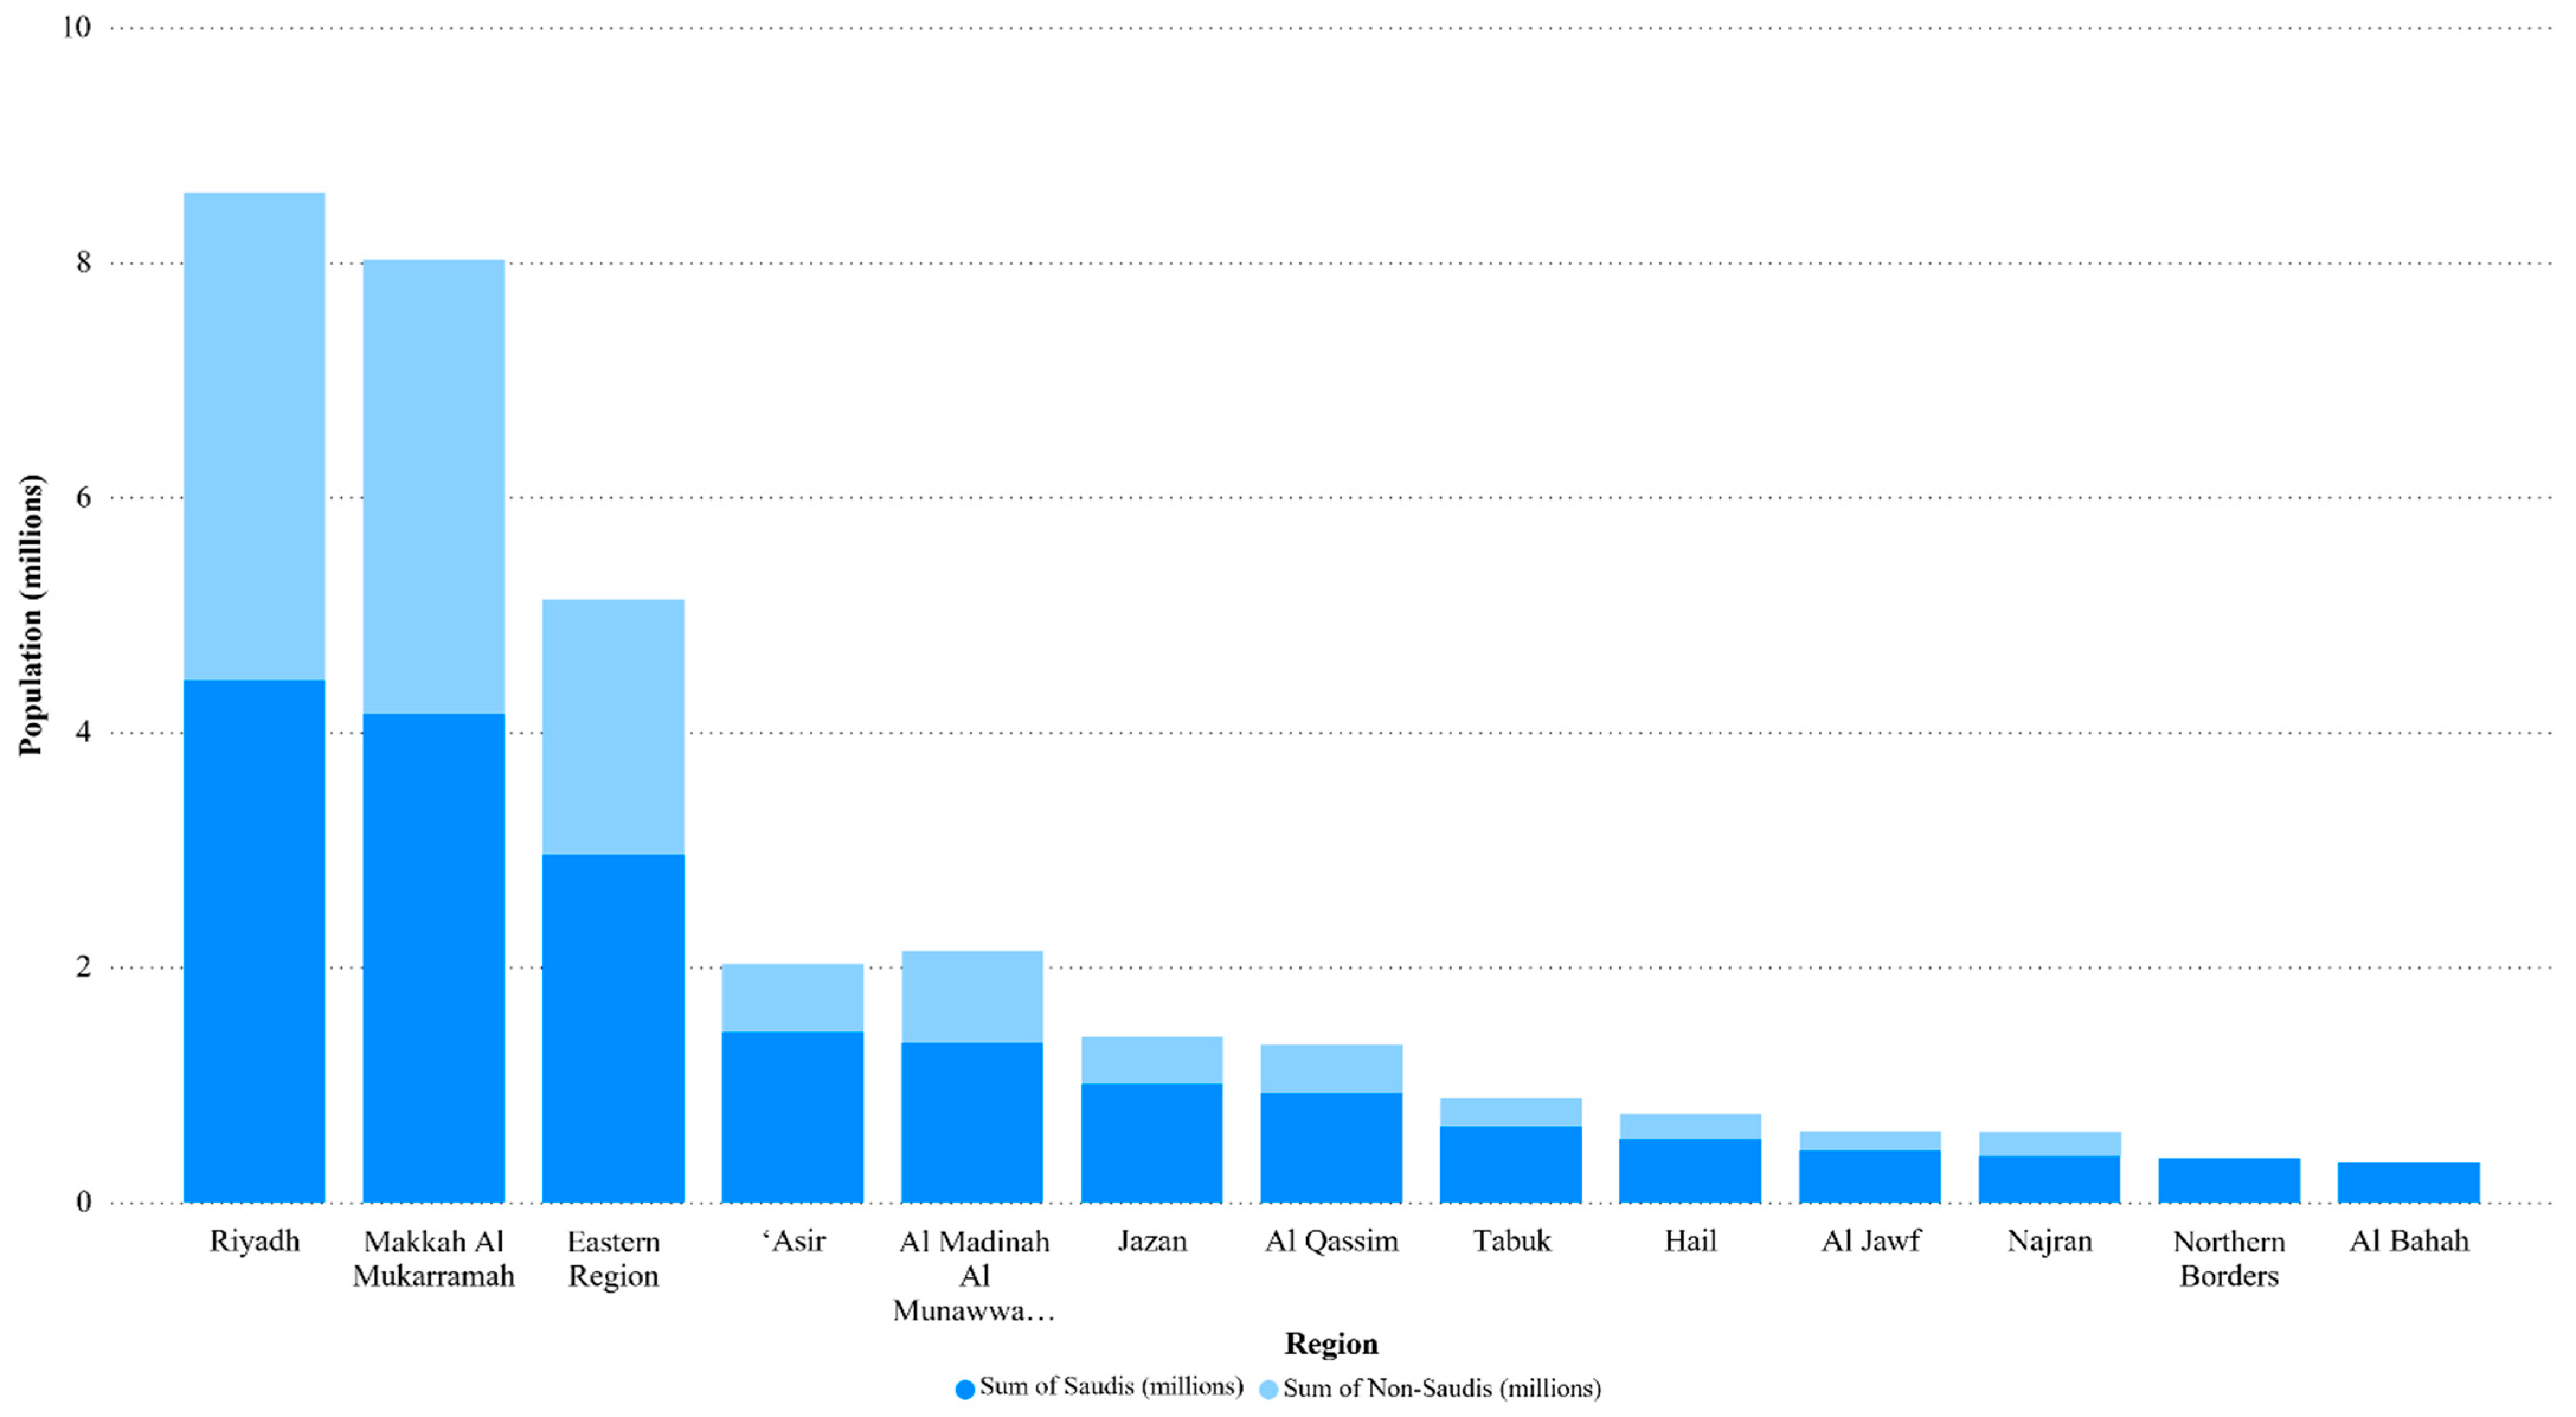
Figure 1 shows that population is highly concentrated in the Riyadh (8.6 million), Makkah (8.5 million), and Eastern Province (5.1 million) regions, which together host the majority of residents. In contrast, regions such as Najran (0.6 million) and the Northern Borders (0.37 million) remain sparsely populated. This pronounced demographic imbalance has significant implications for higher education planning, public service provision, and regional development strategies. Recent research highlights that 70% of universities are concentrated in the Central and Eastern regions, leaving the Northern and Southern areas with limited access to higher education opportunities. Strategic redistribution of educational institutions in underserved regions has been shown to enhance access, reduce unemployment, and promote balanced regional growth [
38].
Figure 2 presents the distribution of student enrolment across Saudi Arabia’s 29 public universities. The data reveal a marked concentration of students in a few large-scale institutions, with King Abdulaziz University, Imam Abdulrahman Bin Faisal University, and Umm Al-Qura University each exceeding 80,000 students. These mega-universities account for a significant share of national enrolment. A second tier—including King Khalid University, Taibah University, King Saud University, and Jazan University—hosts between 50,000 and 70,000 students. Most other public universities accommodate 20,000–40,000 students, providing substantial but more regionally focused capacity. Specialized institutions, such as King Fahd University of Petroleum and Minerals and King Abdullah University of Science and Technology, serve smaller student populations, reflecting their niche academic missions [
37,
39].
Overall, the Saudi higher education system serves over 1.6 million students, positioning it as one of the largest in the Middle East. The contrast between mega-universities and smaller, specialized campuses highlights the need for differentiated approaches to infrastructure planning, resource allocation, and sustainability strategies to address both regional disparities and the demands of a diverse student population [
37,
38].
3.2. Data Classification
In this study, both categorical and continuous data were systematically classified into five principal groups: building age, urban context, region, masterplan typology, and college building design pattern. The classification process was guided by the availability and completeness of the data; records with missing or incomplete information were excluded to ensure the reliability of subsequent analyses. To ensure accuracy and consistency across the dataset, all records were subjected to a structured validation process. University building information was cross-verified with official Ministry of Education statistics, campus master plans, and satellite imagery to confirm footprint geometry and building use. Inconsistencies were corrected using corroborated data sources, and unverifiable entries were excluded. This multi-layered verification ensured that the dataset maintained both spatial accuracy and institutional representativeness before typological analysis.
This approach is consistent with best practices in building stock [
40] and facility management research [
41], where robust data classification and the handling of missing data are critical for better decision-making. By establishing clear classification criteria and discarding incomplete entries, the dataset supports transparent, replicable, and meaningful analysis of university building characteristics.
The compiled dataset in this study focuses on categorical, morphological, and contextual descriptors that are consistently available across universities (age band, region, urban context, masterplan typology, and college building design pattern). Parameters that are essential for detailed energy simulation such as HVAC/system type, heating/cooling equipment, floor-to-floor height, glazing ratio, and insulation/material properties, are not included at this stage because they are not systematically reported in publicly accessible institutional records and could not be validated at scale with sufficient completeness. These variables are explicitly planned for integration in the next phase, when environmental and envelope datasets will be linked to the typological framework to support operational energy modeling use cases.
3.2.1. Building Age
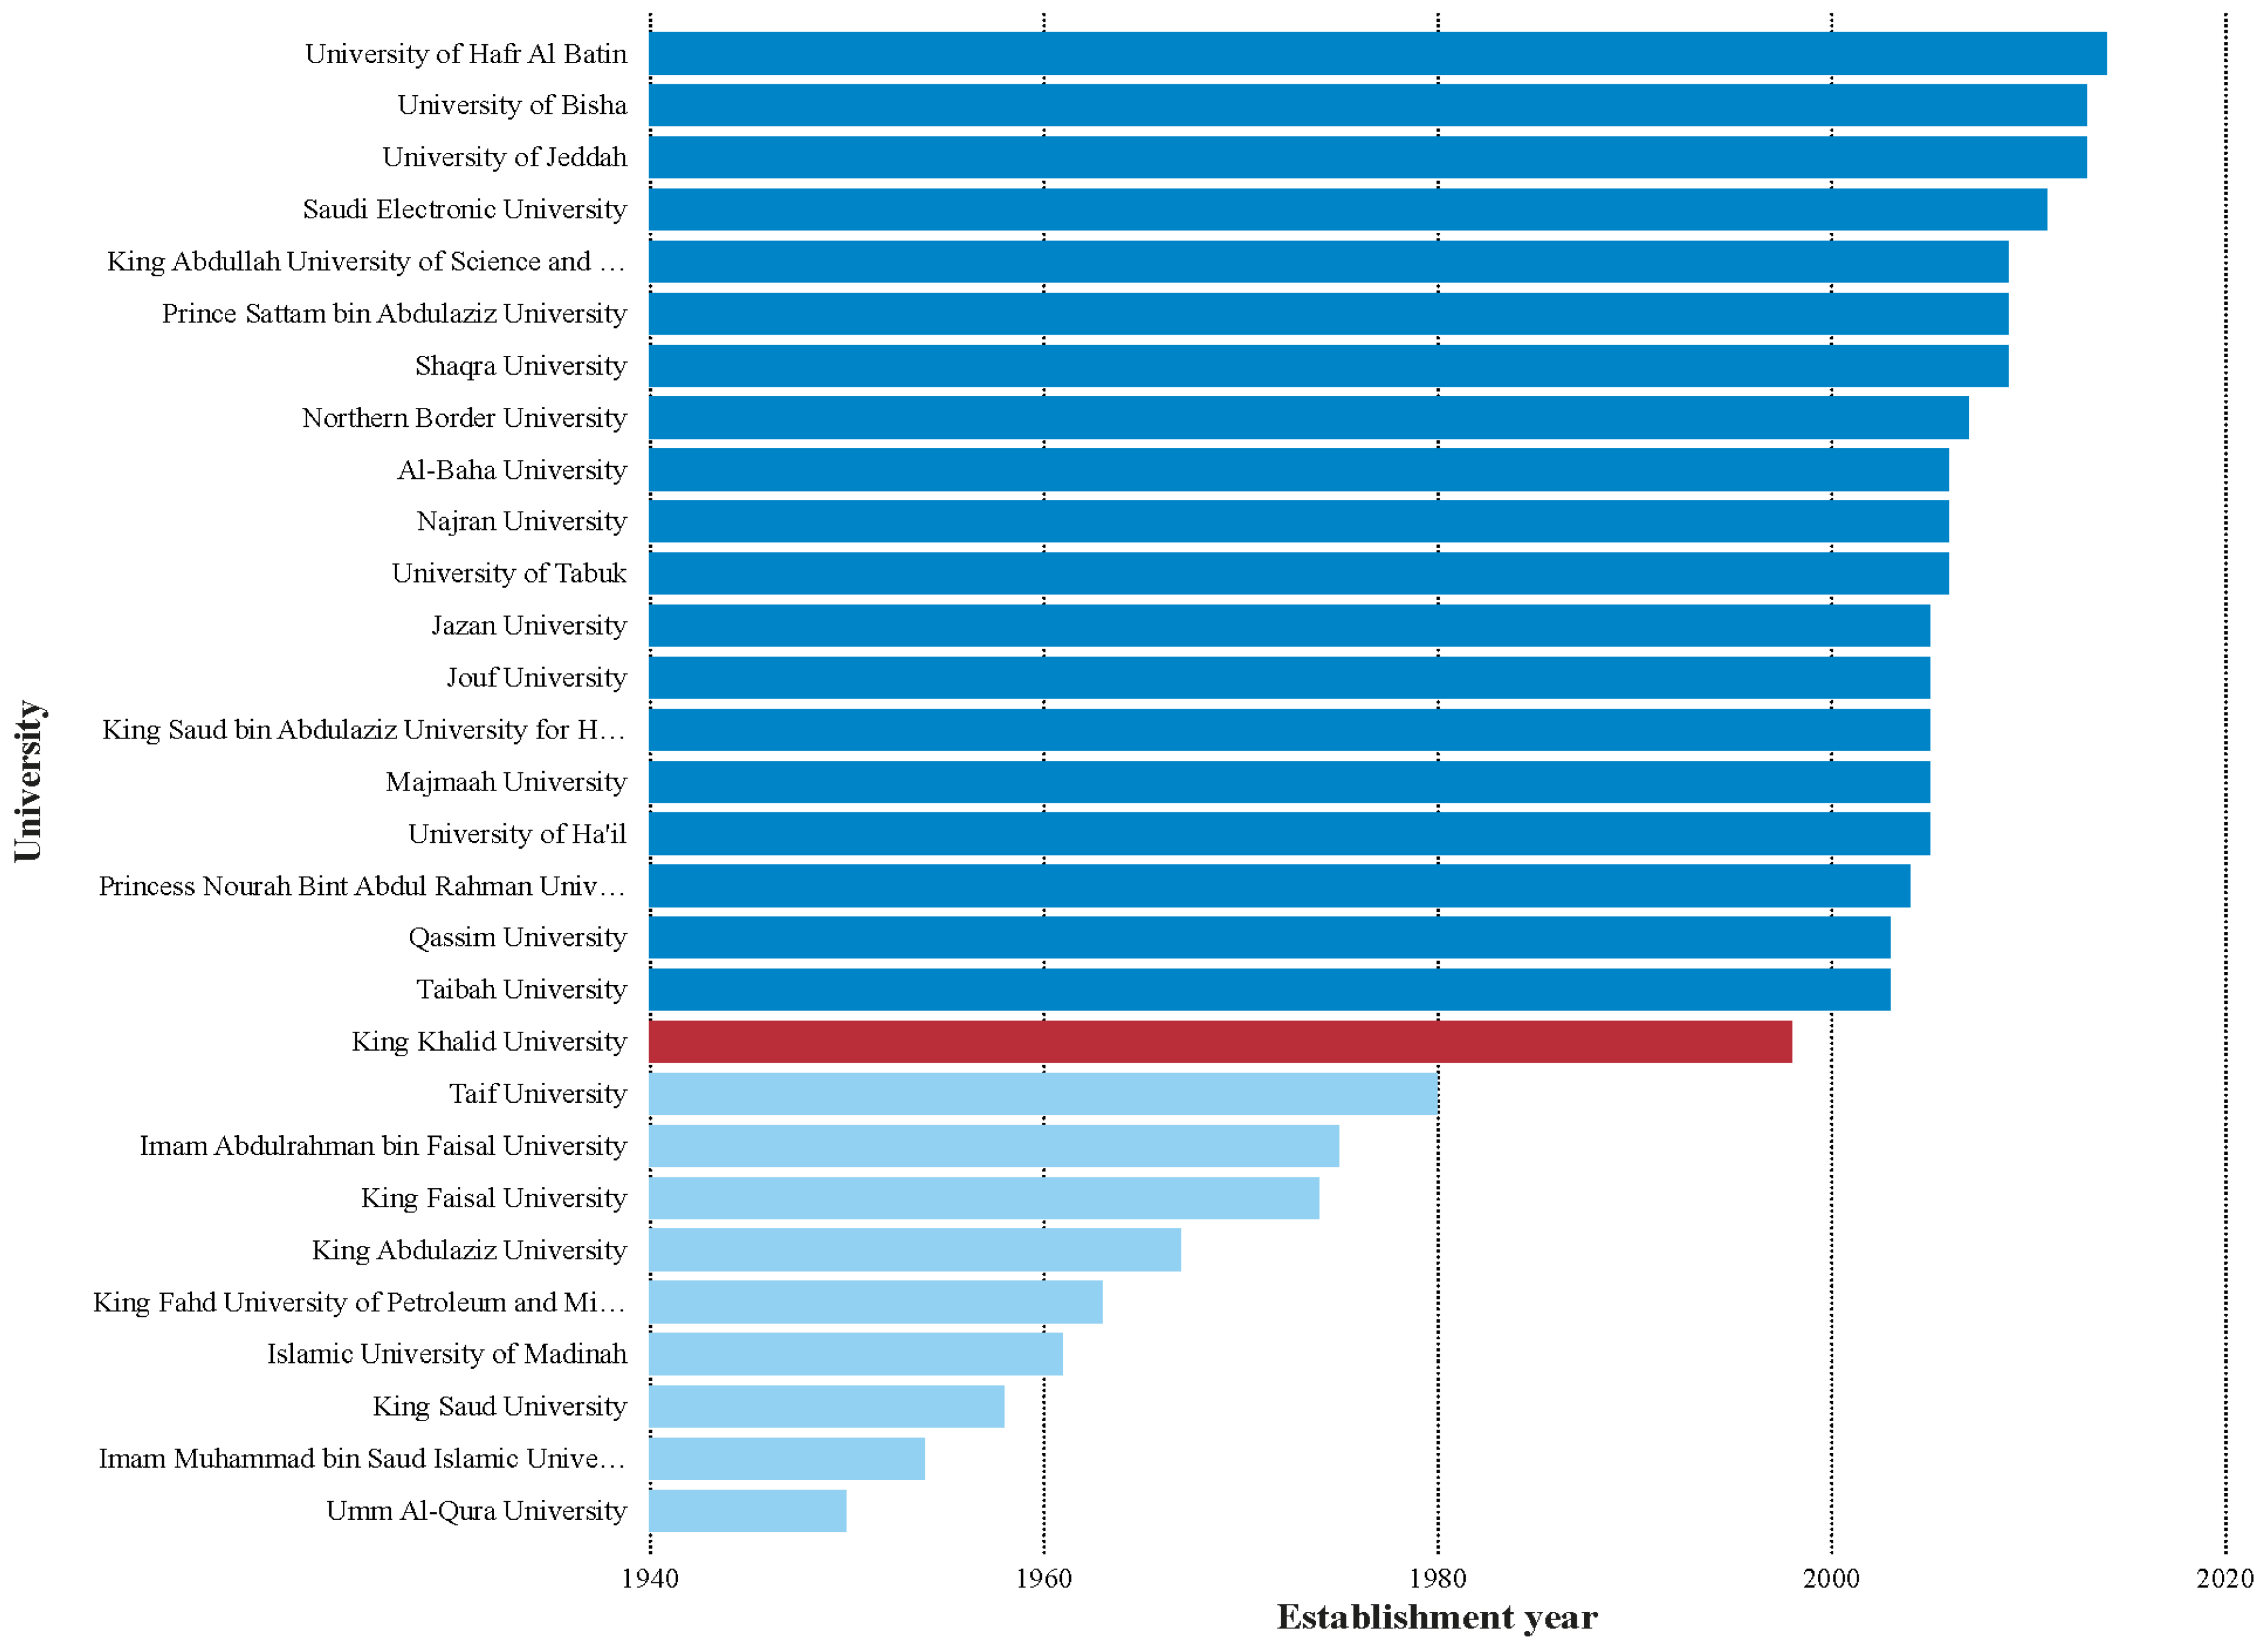
The chronological establishment of Saudi Arabia’s 29 public universities shown in
Figure 3 reveals distinct phases in the evolution of the Kingdom’s higher education system. The foundational phase, prior to 1990, saw the creation of a small number of institutions such as Umm Al-Qura University and King Saud University, reflecting a period of selective and gradual sector development [
42]. A subsequent slowdown between 1980 and 2000, marked by the establishment of only King Khalid University (dark red color), coincided with national economic challenges, including the oil price collapse, fiscal constraints, and the Gulf War, which limited public investment in large-scale educational expansion [
42].
A dramatic shift occurred after 2000, with a rapid and deliberate expansion in university establishments. This surge was driven by improved fiscal conditions from rising oil revenues and a strategic national pivot toward human capital development and economic diversification [
43,
44]. Major government-led initiatives, such as the Higher Education Expansion Plan and the King Abdullah Project, catalyzed this growth by investing heavily in university infrastructure, faculty development, and regional accessibility [
39,
43]. The period from the 2000s to 2010s accounts for over half of all public university foundations, highlighting a state-led push to rapidly expand higher education capacity in response to demographic pressures and the goals of a knowledge-based economy [
43,
44].
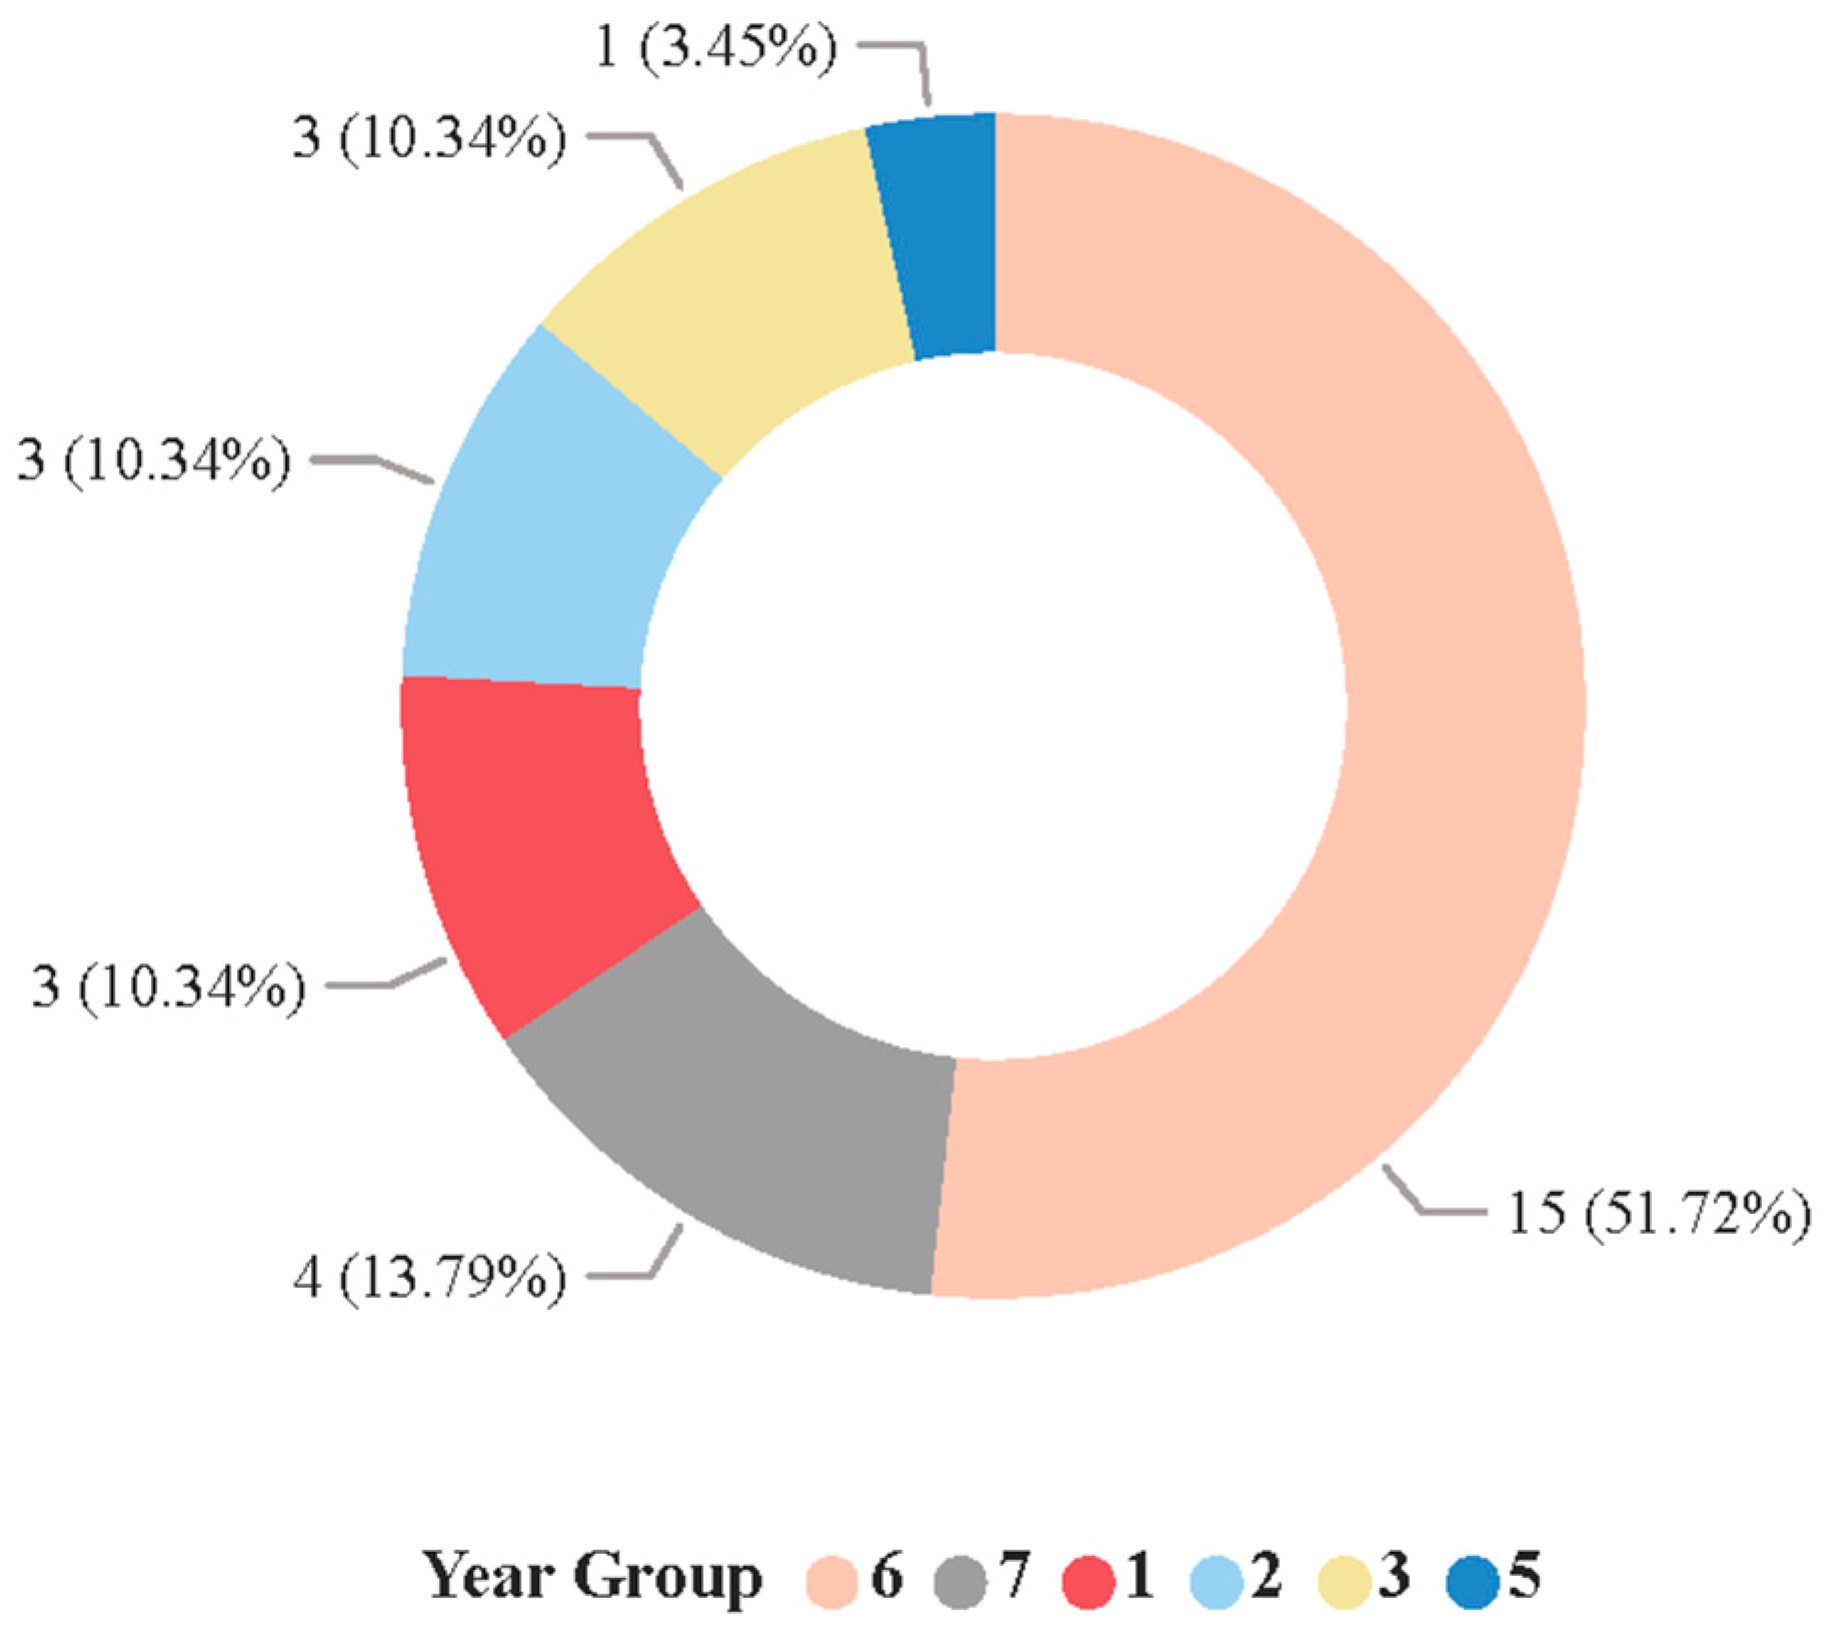
Figure 4 classifies the universities establishment year by seven age groups.
The temporal clustering of university establishments also implies a reliance on repeatable master-planning models and standardized design prototypes, characteristic of centrally coordinated infrastructure rollouts [
44]. Such standardization facilitated the efficient delivery of new campuses on a scale, but also introduced challenges related to contextual adaptation and long-term sustainability.
3.2.2. Urban Context
Figure 5 categorizes the spatial siting of Saudi public university campuses relative to their surrounding urban fabric, revealing an almost even split between dense urban cores (37.9%), suburban or edge-of-city locations (37.9%), and low-density or remote settings (24.1%). This distribution reflects a diversity of planning approaches, ranging from infill urban development to greenfield expansion, shaped by regional priorities and land availability.
The siting of a campus within the urban fabric plays a critical role in shaping its accessibility, sustainability, and operational efficiency. Campuses located in dense urban cores typically benefit from enhanced public transport access, proximity to services, and compact microclimates, which can support walkability and reduce transportation emissions [
45,
46]. In contrast, suburban and edge-of-city campuses often face greater challenges related to accessibility, infrastructure provision, and increased energy demands, particularly for cooling and transportation, due to their separation from established urban networks [
46,
47]. Remote campuses, while offering opportunities for large-scale development, may struggle with limited infrastructure and reduced integration with city life [
48,
49].
The urban context is thus a vital parameter in campus performance modeling and environmental simulation. International research highlights that campus spatial organization, whether compact and integrated or dispersed and peripheral, directly affects walkability, energy consumption, and the quality of campus life [
45,
46,
47]. Effective planning should leverage the advantages of urban integration while addressing the unique challenges of suburban and remote sites through targeted strategies in resource optimization and sustainable mobility.
3.2.3. Region
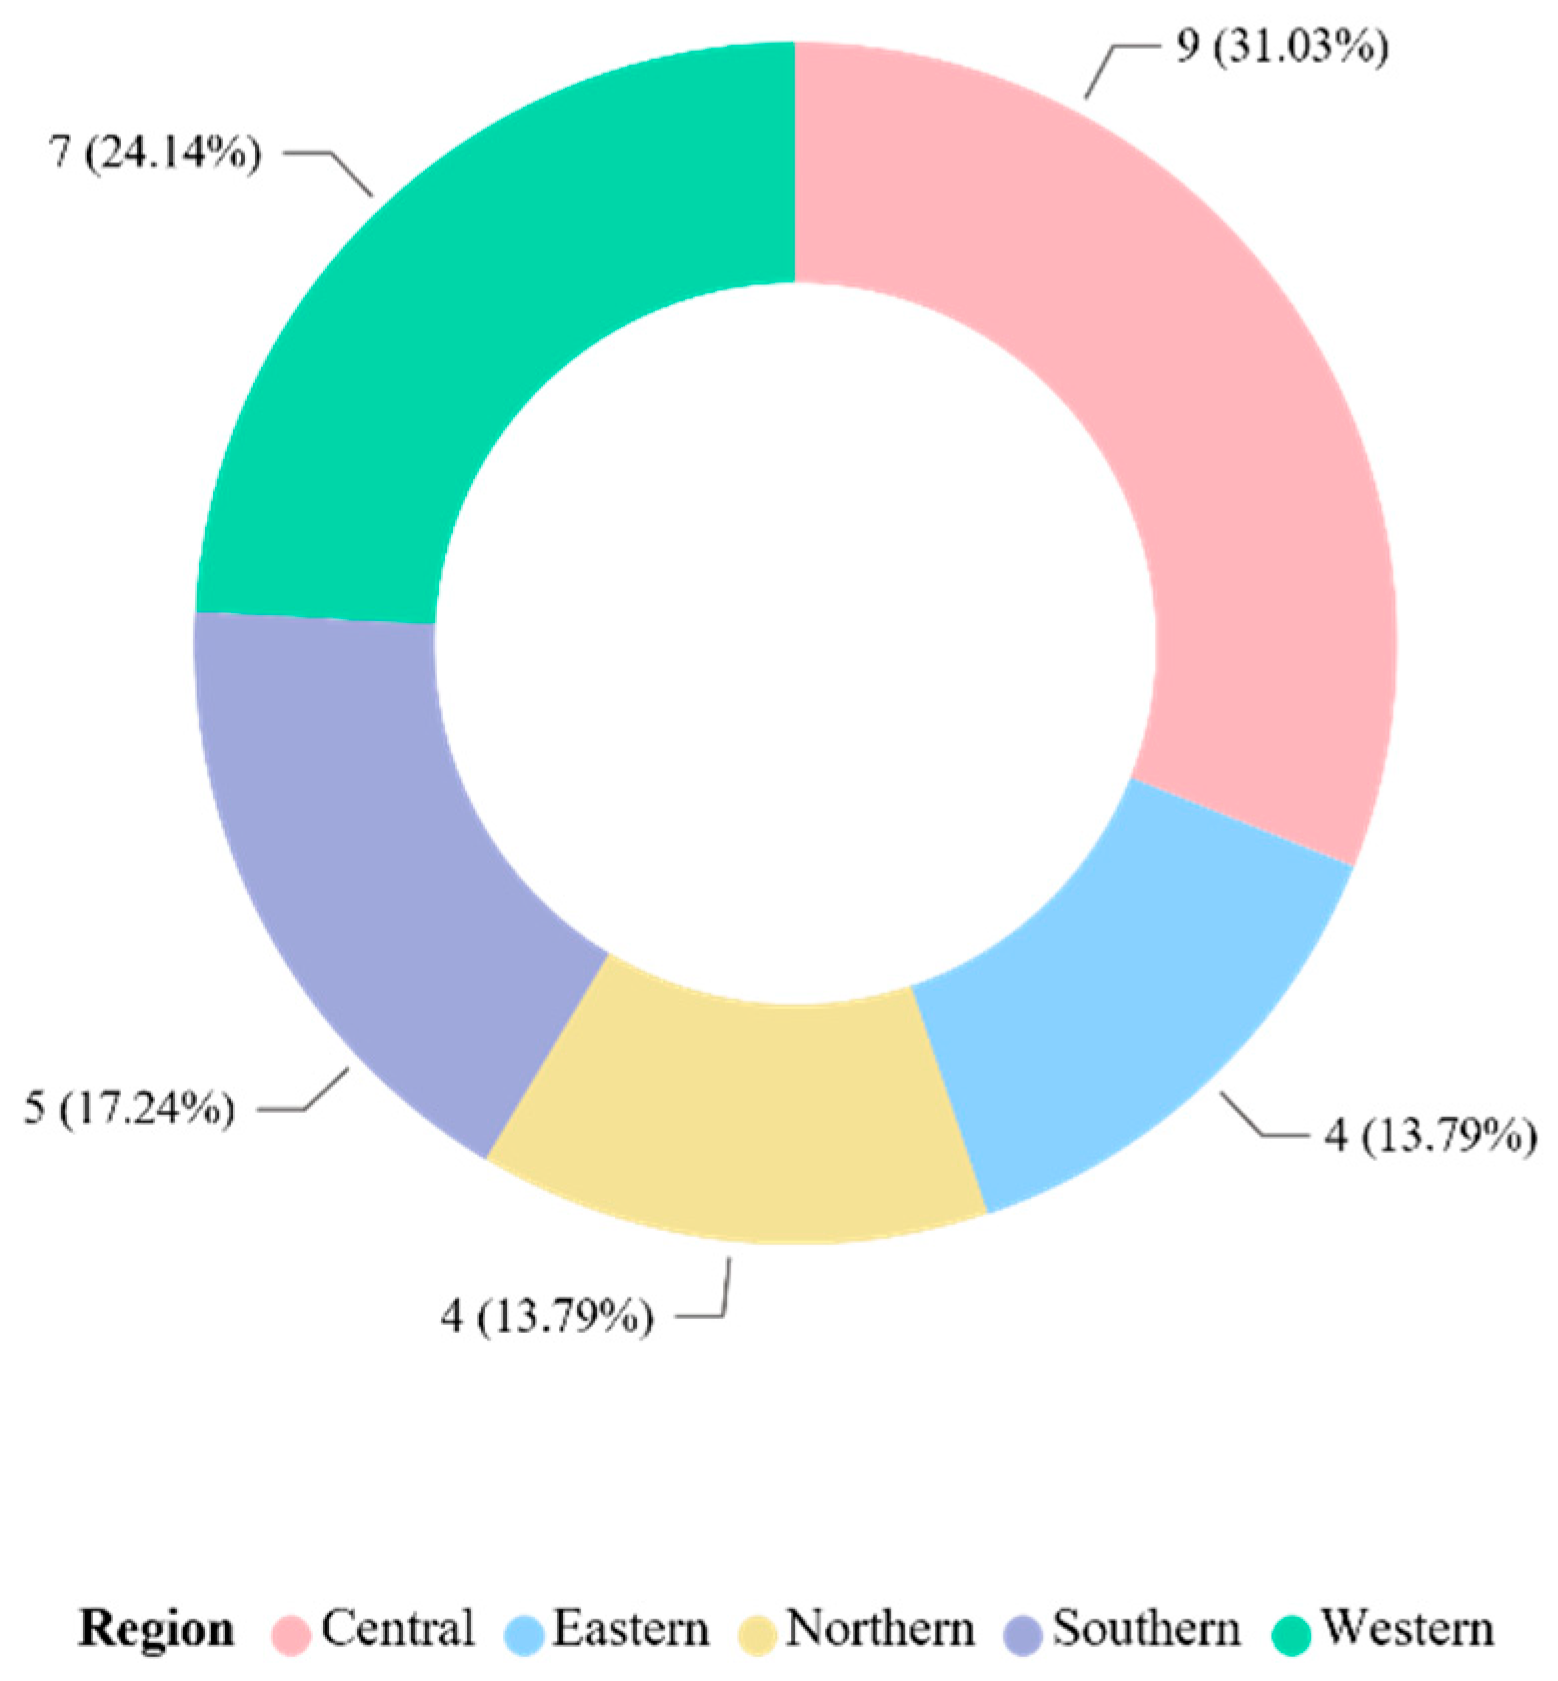
Figure 6 illustrates the geographic distribution of Saudi Arabia’s public universities across the Kingdom’s five main administrative regions, with the Central region hosting the largest share (31%), followed by the Western (24.1%), Eastern (17.2%), and the less represented Northern and Southern regions (each 13.8%). This distribution is not only a reflection of demographic and policy-driven decisions but also establishes a critical framework for climate-sensitive building design.
The regional allocation of universities aligns with distinct climatic zones, each characterized by variations in temperature, humidity, solar exposure, and wind conditions. For example, campuses in Riyadh’s hot-dry climate face different environmental challenges than those in the milder highlands of Abha or the humid coastal areas of the Eastern region. This diversity necessitates context-sensitive design strategies, particularly in building envelope design, passive cooling, and energy consumption patterns, to ensure optimal performance and sustainability [
50,
51].
Recent research highlights that sustainable campus design in Saudi Arabia must address these regional climatic differences to enhance student well-being, resource efficiency, and environmental performance [
50]. Studies also emphasize the importance of integrating local climate data and adaptive design solutions, such as orientation, shading, and green roofs, to reduce energy demand and improve IEQ in different regions [
51]. Furthermore, the spatial distribution of universities has implications for regional equity, economic development, and environmental impact, showing the need for strategic planning that balances access with sustainability goals [
38,
52].
According to the Saudi Building Code [
53], each administrative region aligns with a distinct climatic zone, including variations in temperature extremes, humidity, solar exposure, and wind conditions. This regional variation reinforces the necessity for moving beyond one-size-fits-all planning, advocating for climate-responsive and contextually adapted educational building designs across Saudi Arabia’s diverse environments.
3.2.4. Masterplan Typology
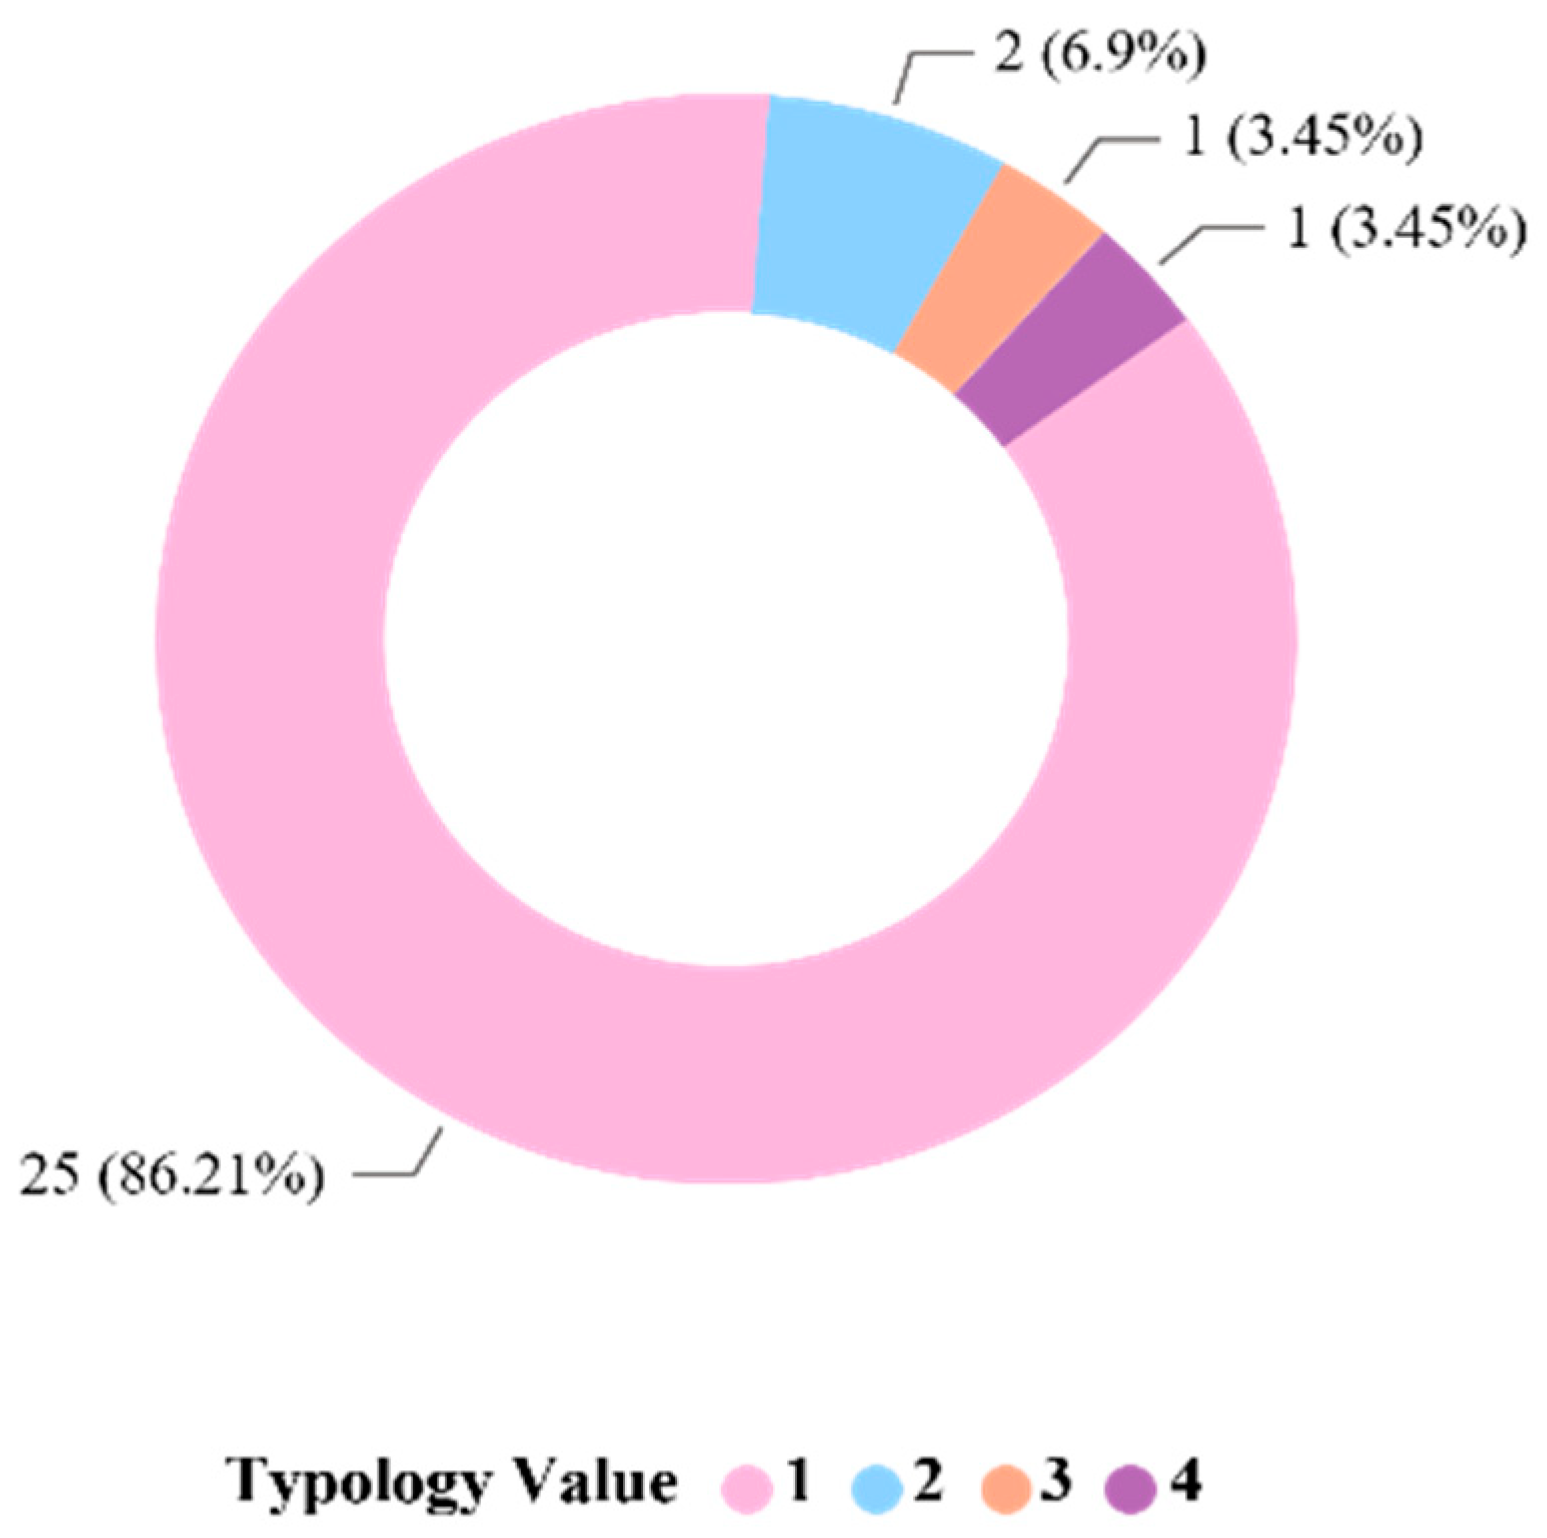
Figure 7 categorizes the 29 Saudi public university campuses by master-plan typology, revealing a striking predominance of a single spatial model. The courtyard masterplan (Typology Group 1) accounts for 86.2% of campuses (25 out of 29), while the linear masterplan (Typology Group 2) is present in only 6.9% (2 campuses). Cluster and varied masterplans (Typology Groups 3 and 4) are each represented by just one campus (3.5%).
This pronounced homogeneity underscores the widespread adoption of a standardized spatial prototype in Saudi campus design, with the courtyard model serving as the default template. The prevalence of the courtyard form is rooted not only in regional architectural traditions but also in its proven climatic adaptability—facilitating shading, natural ventilation, and microclimate regulation, which are critical in hot-arid environments [
50,
54]. Such standardization is characteristic of centralized, policy-driven planning approaches, where uniformity is leveraged to expedite project delivery, reduce costs, and streamline construction across multiple sites [
55].
The dominance of a single master-planning typology provides a robust foundation for archetype-based modeling, enabling a small set of representative campus plans to effectively simulate spatial and environmental performance across the national university system. However, this uniformity also highlights the need for greater contextual adaptation and climate-responsive strategies, as emphasized in recent research on sustainable campus development in Saudi Arabia [
50,
55].
3.2.5. Dominant Typologies and Spatial Contexts
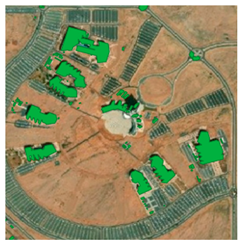
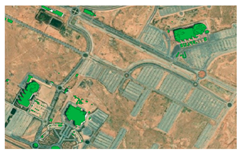
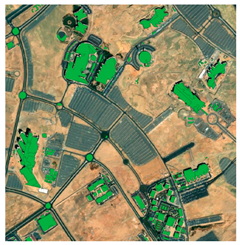
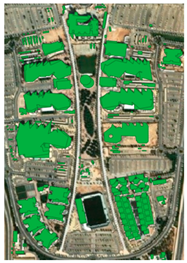
The majority of universities established in the 2000s (age group 6) are distributed across various climatic zones and predominantly utilize the courtyard typology, a pattern that computational analysis has shown to be closely linked to spatial parameters such as visibility, density, and connectivity, reflecting both design limitations and contextual requirements [
56].
Table 2 shows these masterplans are most often paired with low-dense urban or suburban-edge contexts, indicating a preference for layouts that balance open space with building density. In contrast, older universities like King Saud and King Abdulaziz also employ the courtyard model but are situated in more urban-dense environments, suggesting a shift in spatial planning as campuses and urban areas evolve. This architectural continuity aligns with global trends, where university masterplan typologies are transforming to support broader institutional missions, digital integration, and greater societal impact, with future universities emphasizing innovation, integration, and sustainable development [
48]. The repeated use of the courtyard typology across different regions and time periods highlights the influence of climatic adaptation and cultural factors, while variations in context demonstrate responsiveness to local urban development and campus expansion needs.
3.2.6. College Building Design Pattern
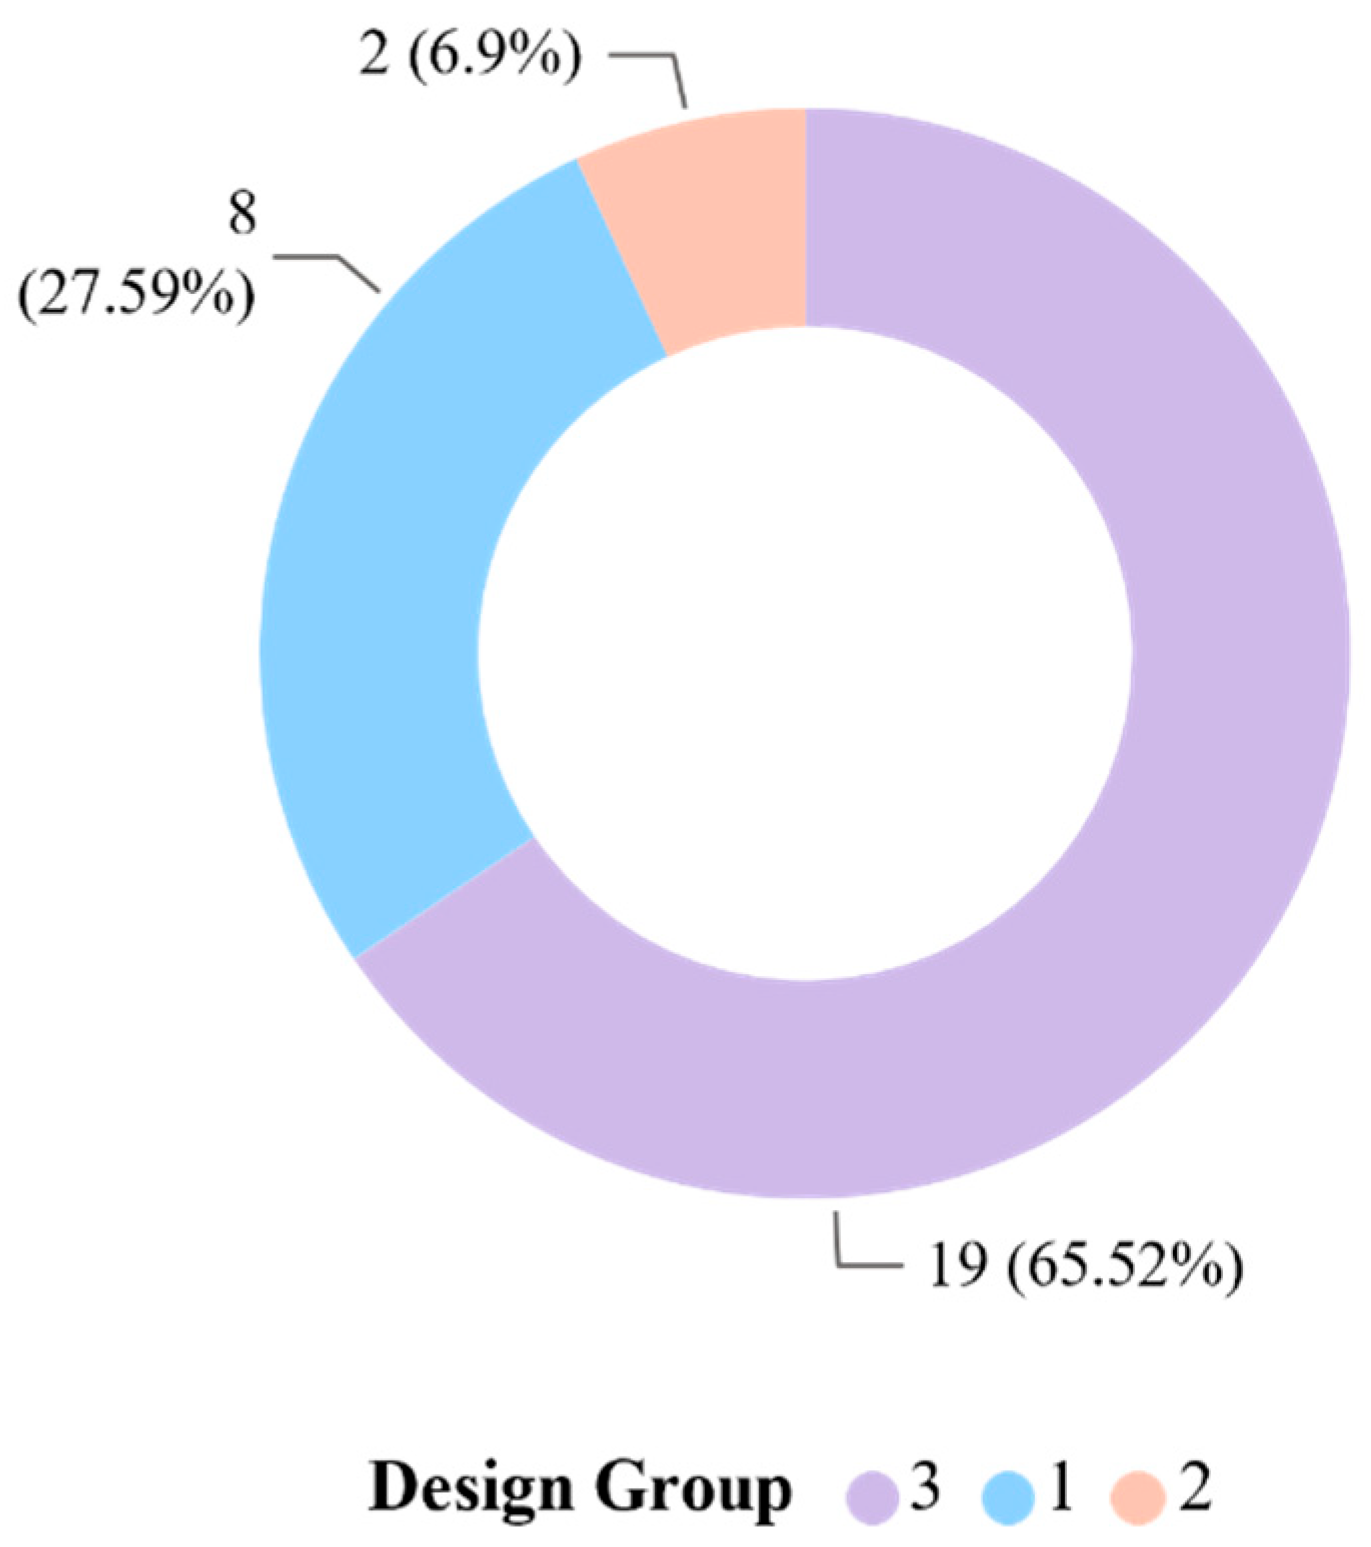
Figure 8 presents a categorical analysis of 29 Saudi public university college buildings, organizing them into three overarching design groups based on shared characteristics in site planning, massing logic, and morphological structure. This classification highlights the dominance of specific spatial templates in the national development of higher education facilities. The results reveal a pronounced concentration within Group 1, which encompasses 65.5% of universities (19 out of 29) and is characterized by a unique design typology. Notably, universities established after 2000 overwhelmingly fall into Group 2, comprising 27.6% (8 universities), and are defined by the adoption of identical college building design models, reflecting a strong trend toward standardization in recent campus planning. Group 3, representing only 6.9% (2 universities), includes semi-identical design approaches.
The college building pattern indicates the increasing architectural uniformity among Saudi public universities built in the 21st century. The uniformity leveraged to streamline planning processes, reduce construction costs, and ensure consistent quality control at scale [
50]. Such standardization is a hallmark of large-scale national education initiatives, particularly in rapidly developing contexts, and has been observed to facilitate efficient campus expansion and resource allocation [
50]. However, while this approach supports operational efficiency, it may also limit opportunities for contextual adaptation and innovation in response to diverse climatic and cultural settings [
50,
58].
These findings provide a robust, quantitative foundation for the selection of representative college building archetypes in this research. By identifying the prevalence and distribution of dominant design groups, this classification enables targeted modeling and simulation of key performance indicators, such as IEQ, energy demand, and sustainability compliance, under real regional conditions. Ultimately, the analysis affirms that Saudi Arabia’s recent higher education expansion has relied heavily on prototypical college building forms, offering a defensible basis for further investigation into the performance, adaptability, and sustainability of these archetypes.
3.3. Summary
Collectively,
Figure 3,
Figure 4,
Figure 5,
Figure 6,
Figure 7 and
Figure 8 and
Table 2 demonstrate that the design of educational buildings in Saudi Arabia is dominated by a limited set of highly repeatable spatial and architectural archetypes. Most educational facilities, particularly those constructed after 2000, employ standardized design template, most notably, prototype college building designs, that are replicated across diverse regions and urban contexts, often with minimal adaptation to local climate or site conditions [
59]. This uniformity is largely the result of centralized, policy-driven planning strategies aimed at accelerating educational infrastructure rollout and ensuring efficiency and cost-effectiveness at scale [
59,
60]. While this approach has facilitated rapid expansion, it has also led to the widespread adoption of courtyard-based and other archetypal layouts, regardless of regional climatic or cultural variation.
The prevalence of these repeatable design patterns provides a robust, quantitative foundation for the classification and modeling of educational building archetypes. Such classification is essential for evaluating key performance indicators, including indoor environmental quality (IEQ), energy demand, particularly for cooling purposes, and compliance with sustainable design standards under real regional conditions [
33,
59]. However, the literature also highlights the need for greater contextual adaptation and climate-responsive strategies within this system, as the current reliance on uniform prototypes may limit the potential for optimized energy performance and occupant comfort [
33,
59,
60]. This analysis thus establishes a defensible, data-driven basis for future research and simulation targeting the performance and sustainability of Saudi educational building archetypes.
4. Methodology
This study adopts a sequential mixed-methods design to systematically characterize educational college building archetypes and identify the most prevalent types within Saudi public universities. The approach integrates qualitative and quantitative phases to ensure both depth and generalizability, consistent with best practices in mixed-methods research [
61,
62,
63,
64]. Campuses maps were generated using Quantum Geographic Information System (QGIS) version 3.34 [
57], employing multiple data layers and advanced cartographic techniques to enhance visualization and analysis. All statistical analyses and data visualizations were performed using MATLAB R2023b [
65], with different final tables and figures exported to Microsoft Excel (Microsoft 365) [
66] and Power BI version 2.132 [
67].
The combination of QGIS, MATLAB, and Power BI was adopted to ensure comprehensive spatial, statistical, and visual analysis. QGIS was used for geospatial mapping, coordinate referencing, and visualization of typological distributions. MATLAB supported the quantitative and statistical processing of datasets, including grouping, weighting, and clustering functions. Power BI provided a dynamic environment for integrating outputs and visualizing comparative results through interactive dashboards. Together, these tools created a coherent analytical workflow—linking spatial representation, quantitative modeling, and data visualization—to support a reproducible, multi-layered typological assessment.
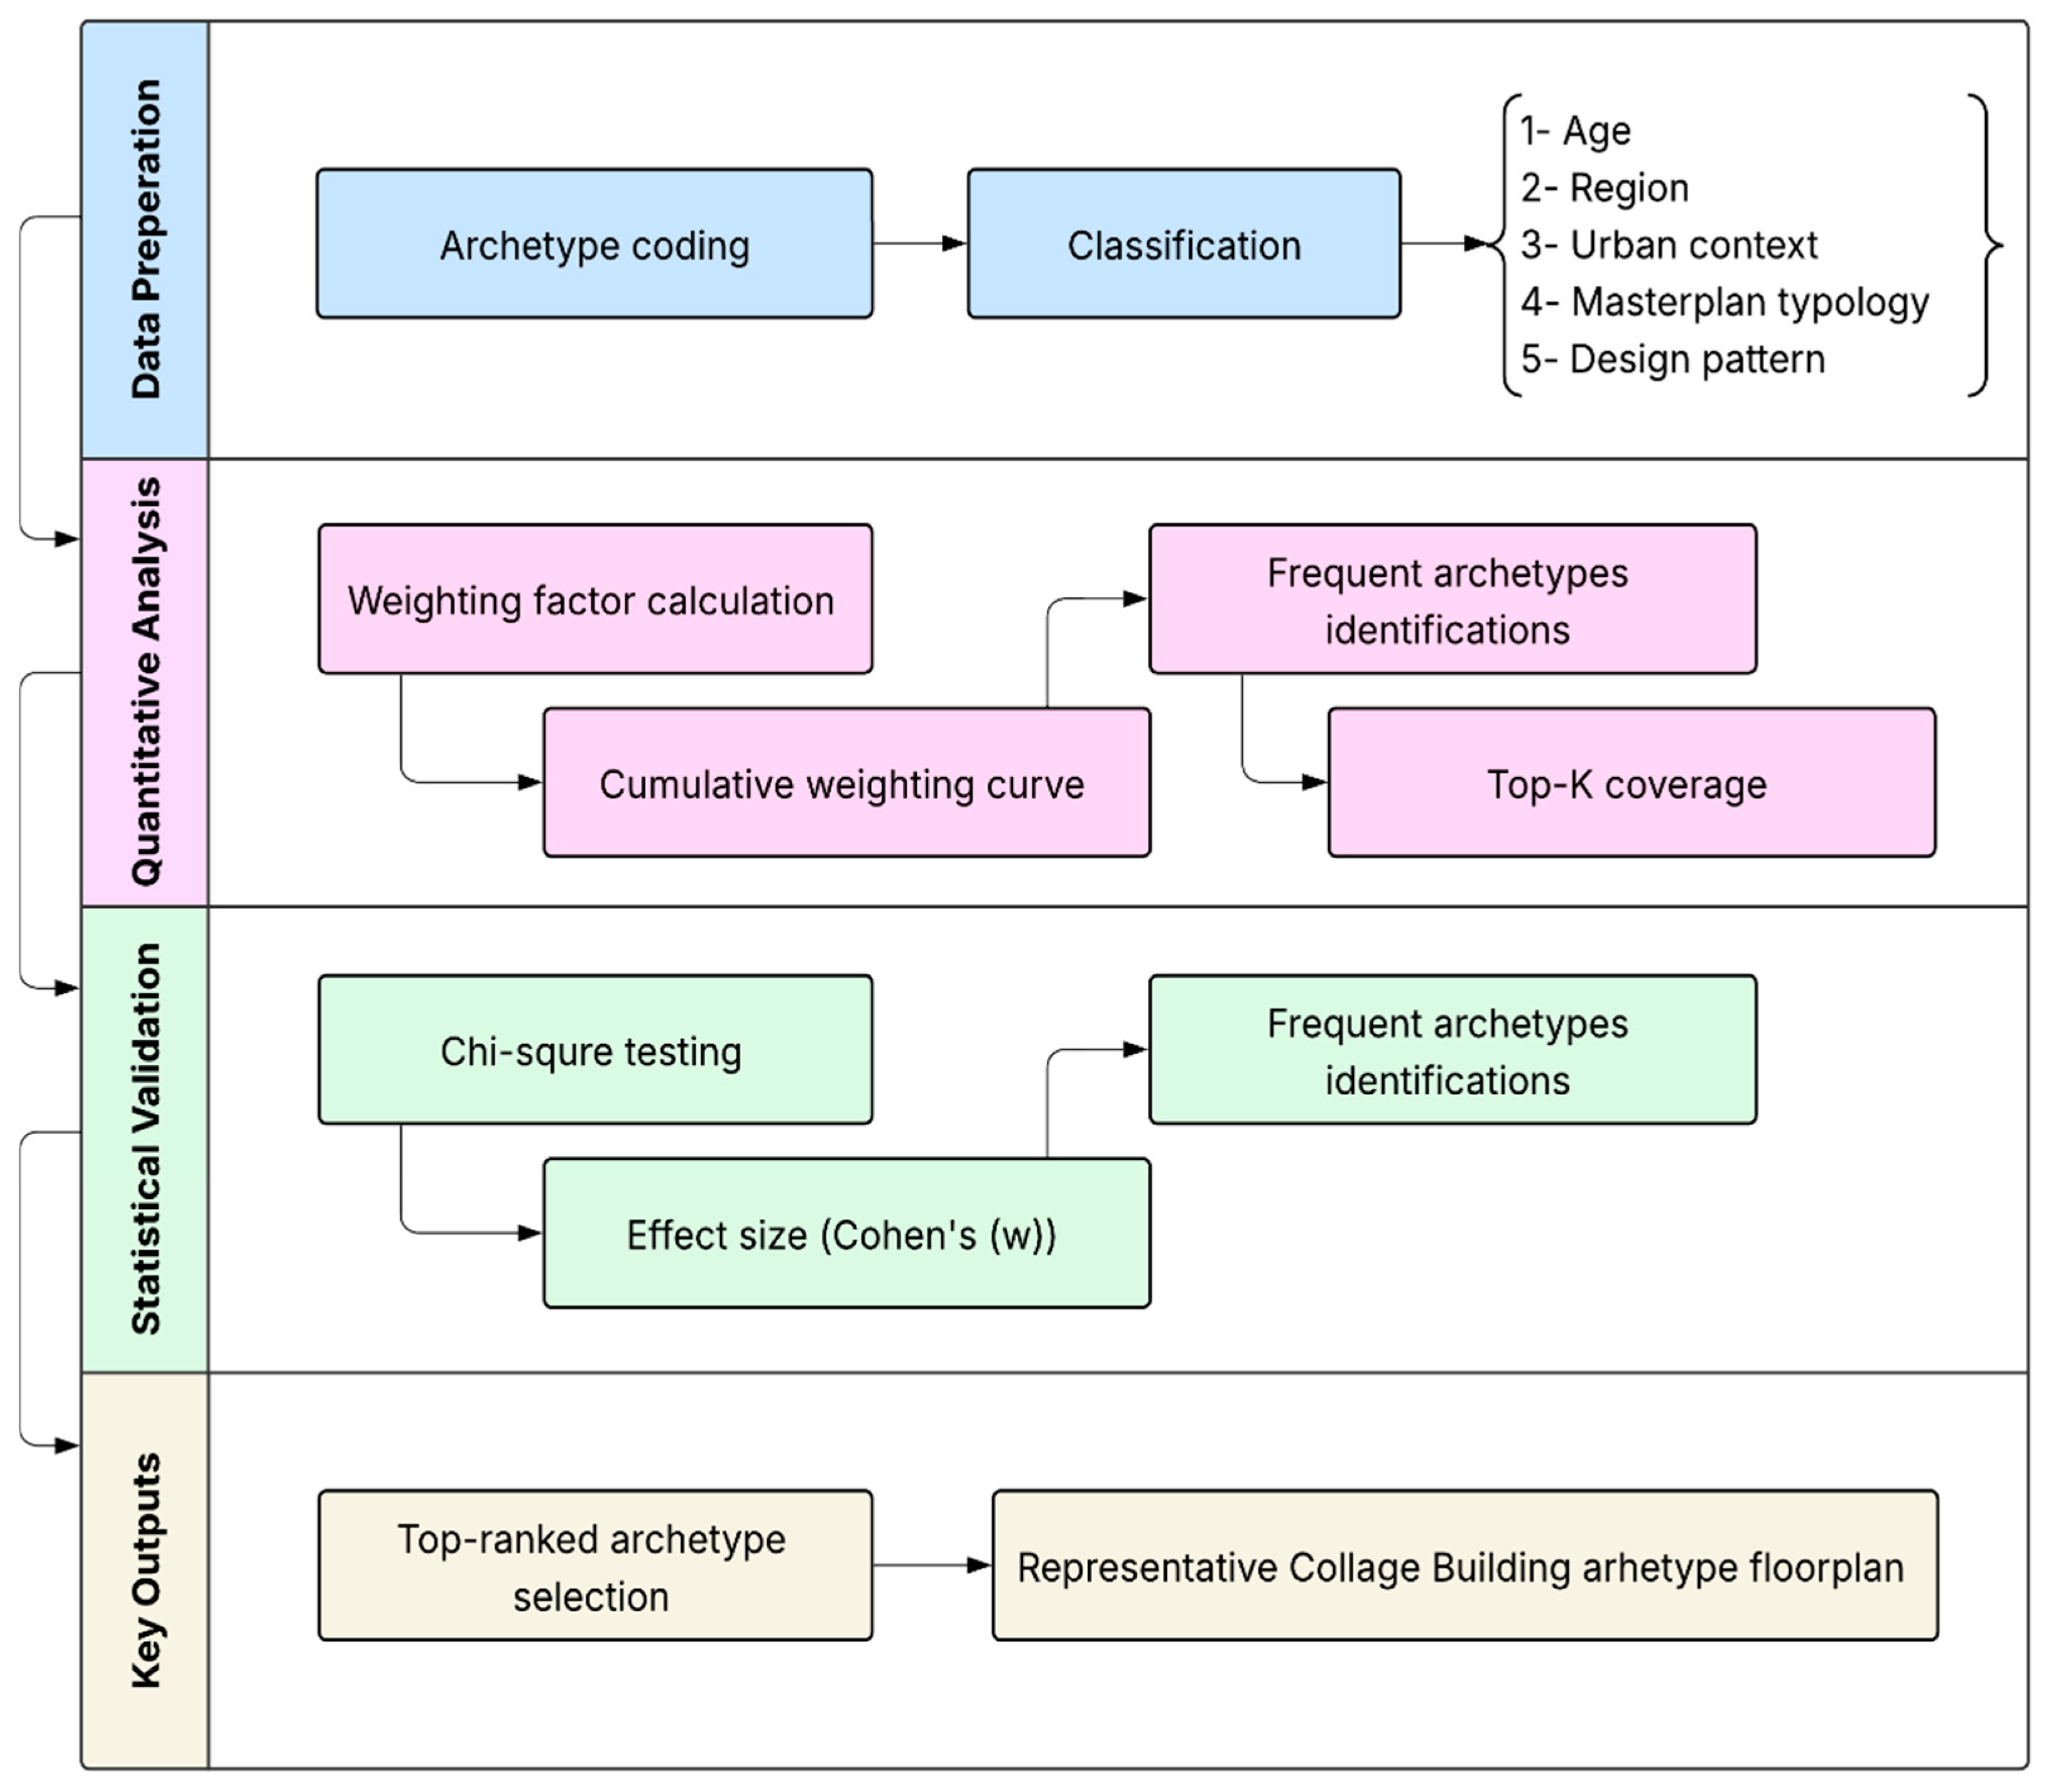
Figure 9 illustrates the overall methodological workflow adopted in this study to develop the archetypes framework. The process begins with data preparation, where university campuses are coded and classified by age, region, urban context, masterplan typology, and design pattern. This is followed by quantitative analysis, including weighting factor calculation, generation of the cumulative weighting curve, and Top-K coverage to identify frequent archetypes. Statistical validation is then performed using chi-square testing and effect size measures to confirm representativeness. The workflow concludes with the selection of top-ranked archetypes and the presentation of the most representative college building archetype floorplan.
This methodology provides a rigorous framework for developing a college building archetype that reflects the dominant trends in Saudi public university campuses, supporting future research in energy modeling and sustainable design.
4.1. Scope and Unit of Analysis
The study encompasses 29 public universities in Saudi Arabia. The unit of analysis is the college building archetype. Where a university has multiple campuses, the dominant (main) campus is used for classification. This focus ensures comparability and relevance, as recommended in archetype and building stock studies [
68,
69].
4.2. Data Curation
Data sources include institutional lists, campus documents, and spreadsheet records, which are consolidated into a unified analysis code. Each combination is assigned to categorical variables. Records are rigorously screened for completeness and internal consistency; ambiguous entries are cross-verified across sources. The final dataset forms a cross-classified matrix of potential archetype cells, supporting robust pattern identification and generalization [
40,
68,
69]. The qualitative data have been arranged as follows:
Attribute Identification: Key building attributes, such as establishment year, urban context, region, masterplan typology, and architectural design pattern, are identified through document analysis, expert consultation, and review of university records [
40,
63];
Attribute Discretization: Each attribute is discretized into predefined classes (construction year intervals, regional clusters, urban density classes, masterplan typologies, and design pattern categories) to enable systematic comparison and coding [
40,
62,
63];
Coding Rules: Explicit coding rules are developed a priori to ensure consistency and reproducibility in mapping each building to a unique archetype cell [
40,
62,
63].
These records were selected after screening for completeness and reliability, as other available sources were either incomplete or lacked sufficient detail for inclusion, such us, flooring areas or floorplans. No statistical imputation was performed for missing key attributes; instead, entries with incomplete or inconsistent information were excluded after cross-verification to preserve internal validity. The final sample covers all 29 public universities and spans the Kingdom’s major climatic regions and urban context classes, providing a nationally representative basis for typological analysis while maintaining transparent data provenance.
4.3. Data Classifiation
Figure 10 shows the data classification framework used in this study. The collected information was systematically classified into predefined categorical variables to enable consistent analysis and cross-comparison. Each university was assigned to categories based on year of construction, geographic region, urban context, masterplan typology, and college building design pattern. These categories were established through document review and verification to ensure clarity and reproducibility.
Table A1 in
Appendix A provides more details about the data classification.
4.4. Quantitative Weighting and Statistical Analysis
The quantitative data have been analyzed as follows:
The full cross-product of combinations was calculated using Equation (1) and yielded 1260 potential cells (7 (
) × 5 (
) × 3 (
) × 4 (masterplan
) × 3 (
)). Not all cells are occupied; occupied cells receive weights as described next.
4.5. Weighting Scheme and Ranking Metric
To quantify how representative each college building archetype is within the national stock, a cumulative weighting factor (CWF) is calculated for each occupied cell. This approach is consistent with established building stock modeling and archetype analysis methods [
10,
40].
Each archetype cell (j) is assigned a normalized weight (
), representing the proportion of all observed campuses that fall into that cell. The weights are normalized so that the sum across all occupied cells equals 1 (so
), as shown in Equation (2).
where (
is the number of campuses in cell (
), and (N) is the total number of archetypes in the dataset.
Cells are ranked from most to least representative based on their normalized weights. The monotone rank metric is expressed as a CWF percentage (0–100%), showing the share of the national stock captured as more archetypes are included. The cumulative sum of weights is plotted to visualize how quickly the most common archetypes account for the majority of the building stock. So, the cumulative curve is then expressed by Equation (3).
where (
k) is the number of occupied cells. Plotting the CWF(
k) curve identifies a minimal set of archetypes that represent most of the national stock, a method used in energy modeling and retrofit prioritization [
10,
40]. To formalize the per-rank increment used in weighting and ranking scheme, Equation (4) is used after sorting cells by rank (from most to least representative):
The per-rank ensures that each increment is non-negative, and plateaus (where the cumulative value does not increase) are handled by assigning a zero increment. The same construction applies to any subset (e.g., Identical design subset), using its own cumulative column and forward-filling to handle plateaus. This approach is consistent with rank-based weighting and cumulative distribution methods in multi-attribute decision-making and building stock modeling [
40,
70]. The per-rank increment (
) is particularly useful for binning, thresholding, or identifying dominant archetypes in the national stock.
Cumulative Weighting Scheme and Ranking Metric
To summarize the concentration of archetype representation without assuming a specific distribution, the ranked list of archetype cells is partitioned into ten equal bins, each representing a 10% increment of the cumulative national stock share as described in Equation (5). For each bin (
b) (where
b {1, …, 10}), the observed share (
) is calculated as the sum of the per-rank increments (
) for all cells (
j) that fall within bin (
b):
Under a uniform null hypothesis (i.e., if the distribution were perfectly even), each bin is expected to hold
= 100% of the stock. This non-parametric binning approach is widely used in multi-attribute decision-making and ranking analyses to provide interpretable summaries of concentration and dominance [
70,
71,
72]. The binning procedure involved four steps as follows:
- Step 1:
Rank Ordering; all archetype cells are sorted in descending order by their normalized weight (share of national stock).
- Step 2:
Cumulative share calculation; for each cell, the cumulative share is calculated as the sum of weights up to that rank.
- Step 3:
Bin Assignment; the cumulative share axis [0, 100%] is divided into ten bins [0, 10], (10, 20], …, (90, 100]%. Each cell is assigned to the bin corresponding to its cumulative share.
- Step 4:
Observed Share per Bin; for each bin [1, …, 10], the observed share is the sum of weights of all cells whose cumulative share falls within that bin.
4.6. Statistical Tests and Effect Sizes
The chi-square goodness-of-fit test is used to determine whether the observed distribution of shares across ten bins significantly deviates from the expected uniform distribution (where each bin would contain 10% of the total stock if the distribution were perfectly even) [
40,
73,
74]. The test statistic is calculated by applying Equation (6):
where (T) is the total percentage (i.e., the total is treated as 100 to keep the test on an interpretable scale). Degrees of freedom (
) are 9 with reported
p-values to indicate whether the observed distribution significantly differs from uniform. The effect size is then applied using scale-free effect size Cohen’s (
) following Equation (7):
The selection of the weighting, chi-square, and effect size analyses is intended to ensure that the typological outcomes are statistically defensible and interpretable for planning applications. The weighted-factor scheme quantifies the relative importance of geometric and functional attributes in shaping national-scale archetypes; the chi-square test determines whether observed concentrations differ significantly from uniform expectations, confirming that the typological structure is non-random; and the effect size metric (Cohen’s ) converts statistical significance into practical magnitude, indicating the strength of deviation across ranked bins. Together these procedures provide a transparent and reproducible link between descriptive stock data and decision-oriented insights, allowing planners to identify dominant archetypes for benchmarking, retrofitting prioritization, and policy formulation.
Both the Total and Identical design cumulative series were calculated. A contingency table was then developed to formally test whether the distribution of design types differs across bins. A chi-square test of independence is then used to assess whether the distribution of design types is independent of bin membership, a standard approach for categorical data analysis [
75,
76,
77].
To identify the most influential archetypes, the cumulative share of the top (
K) ranked cells is employed using Equation (8):
where (
) is the per-rank increment for cell (
j). This metric translates statistical concentration into actionable short-lists, supporting targeted modeling and policy interventions.
4.7. Integration and Reporting
Triangulation: Findings from both phases are integrated to ensure robust characterization and defensible selection of representative archetypes, supporting advanced simulation and benchmarking [
40,
61,
62].
Transparency: All coding decisions and analytical steps are fixed a priori and reported in detail to enhance transparency and reproducibility [
62,
63].
5. Results
5.1. Data Characterisrics
This subsection summarizes the scope and representativeness of the analyzed dataset, including university coverage, regional distribution, and typological diversity.
5.2. Sample and Coverage
The cross-classification of Saudi public university college buildings identified 1260 unique archetype combinations. This analysis set draws from all 29 public universities and includes observations distributed across the administrative/climatic regions and the three urban context classes, ensuring that the reported distributions reflect national coverage rather than a single-region sample.
Figure 11 illustrates how the cumulative share of the national college building stock increases as these archetypes are sequentially added from the most to the least common.
The cumulative weighting function for the total stock (black solid line) rises steeply: the top 10% of archetype combinations account for approximately 60% of all buildings, and by 20%, coverage nears 90%. Beyond the halfway point (50% of combinations), the curve plateaus, indicating that nearly the entire stock is represented. This pronounced right-skewed distribution demonstrates that a small subset of frequently repeated campus building configurations dominates the national inventory, a pattern consistent with Pareto-type concentration observed in college building stock studies in Saudi Arabia and also globally [
41,
69].
The series for strictly identical designs (blue dashed line) follows a similar, though slightly lower, trajectory. It reaches about 60% coverage within the first decile, climbs to ~90% by the second quintile, and approaches full coverage (98–100%) after about half the combinations are included. This indicates that while identical design alone covers a substantial portion of the stock, a small number of semi-identical or unique variants are needed to achieve complete national representation.
Such concentration supports the use of a compact set of archetypes for energy modeling and benchmarking, rather than treating each building as a unique case. This approach aligns with international best practices, where representative archetypes are used to efficiently capture the diversity and energy performance of large building stocks [
40].
5.3. Typological Outcomes
The following analysis examines the statistical differentiation among identified archetypes using rank-bin weighting, chi-square testing, and effect size evaluation to quantify distributional patterns.
5.4. Interpreting the Binned Table: Chi-Square Test and Effect Size
Table 3 summarizes the results of the binning methodology using the chi-square test and effect size to assess the distribution of college building archetypes. The chi-square test indicated significant associations between building typology and climatic zone distribution, confirming representativeness across the national dataset, consistent with the typological validation approaches adopted by [
78,
79]. The effect size analysis highlighted the strong influence of floor area and compactness ratio on archetype differentiation, reflecting the same weighting logic applied in archetype sensitivity studies such as [
78,
80]. For each 10% rank bin, the observed percentages for both total and identical-design buildings are compared to the expected uniform value (10%). The table also reports the chi-square contribution from each bin, quantifying how much each deviates from the uniform expectation, and provides cumulative coverage percentages. The chi-square test reveals a highly skewed distribution: the first bin alone accounts for a disproportionately large share of the stock (e.g., 75.95% for total observed), resulting in a very high chi-square contribution (434.91 for total, 283.45 for identical design). Subsequent bins contribute much less, and cumulative coverage quickly approaches 100%. This pattern indicates a strong departure from uniformity, with a small number of archetypes dominating the stock, a result consistent with the expected behavior of binned data in such contexts [
40,
73,
81].
In addition to descriptive interpretation, the statistical procedures applied in this study are reported in the Results to provide full analytical transparency. Specifically, the chi-square goodness-of-fit test was used to evaluate whether the observed archetype distribution differs significantly from a uniform expectation, while the effect size metric (Cohen’s
w) quantifies the magnitude of this deviation. Weighted-factor analysis identified the most influential variables contributing to archetype differentiation, following established archetype-based methodologies [
40,
73,
81].
Table 3 summarizes these results and their statistical implications.
These statistical outputs confirm that the archetype classifications are not random but statistically significant, reinforcing the robustness of the typological framework and supporting its suitability for future benchmarking and modeling applications.
Effect size, as measured by the chi-square statistic, is substantial in the initial bins, reflecting the magnitude of concentration. Importantly, effect size is independent of sample size and provides an objective measure of how much the observed distribution diverges from the expected uniform distribution [
82]. However, recent research cautions that binning choices and the use of sample versus true standard deviations can bias the mean and variance of the chi-square statistic, especially in finite samples, and these corrections should be considered for accurate interpretation [
81].
Overall, the table demonstrates that the college building stock is highly concentrated in a few archetypes, with statistical tests confirming significant and meaningful deviation from uniformity. The statistical differentiation of educational building archetypes in this study follows established archetype-based analytical approaches used in prior energy and typological modeling literature [
78,
79,
80].
5.5. Top-K Coverage (Fine-Grain Ranks)
The Top-K coverage analysis, as detailed in
Table 4, demonstrates that a very small subset of archetype combinations accounts for a disproportionately large share of the college building stock at the Saudi public universities. Specifically, the top 10 individual ranks (representing just 0.79% of all 1260 combinations) cover 22.85% of the total stock. Expanding to the top 20 ranks increases coverage to 35.17%, and the top 50 ranks (4% of combinations) encompass 53.98% of the stock. As more archetypes are included, coverage rises rapidly: the top 126 ranks (10% of combinations) account for 75.95% of the stock, and the top 252 (20%) cover 89.40%. This pattern confirms a pronounced concentration where a limited number of archetypes dominate the national inventory.
To statistically assess this concentration, a chi-square goodness-of-fit test was conducted against the null hypothesis of a uniform 10% distribution across ten bins. The results, summarized in
Table 5, are highly significant: for the total stock, χ
2(9) = 498.24 (
p = 1.37 × 10
−101, Cohen’s w = 2.23), and for identical designs, χ
2(9) = 363.89 (
p = 6.84 × 10
−73, Cohen’s w = 1.91). Both
p-values are far below conventional significance thresholds, and the very large effect sizes (Cohen’s w > 0.8 is considered large) indicate that the observed deviation from uniformity is not only statistically significant but also practically dominant. These findings are robust and align with established research, which shows that the chi-square test is effective for detecting strong departures from expected distributions, especially in cases of highly concentrated data [
83,
84]. The results provide compelling evidence for using a compact set of archetypes in modeling and policy applications.
5.6. Implication for Prioritization
Combining the bin shares and fine-grained Top-K results, it is clear that the Saudi public university building stock is highly concentrated within the top 10–20% of archetype ranks. Both the total stock and the identical-design subset display this pronounced head-heavy pattern, where a small number of archetypes account for the majority of buildings. As a result, prioritizing modeling, calibration, and policy analysis efforts on these top-ranked archetypes, including those with identical designs, enables stakeholders to capture the majority of stock behavior while minimizing analytical complexity.
This approach aligns with best practices in building stock management and energy policy, where focusing on the most prevalent or highest-impact segments yields the greatest returns for resource allocation and intervention strategies [
85]. By concentrating efforts on the dominant archetypes, decision-makers can efficiently target upgrades, renovations, or policy measures, ensuring that interventions are both cost-effective and broadly representative of the national stock. This targeted prioritization is especially valuable for large-scale energy modeling, benchmarking, and the design of incentive programs, as it maximizes impact without the need for exhaustive, case-by-case analysis.
5.7. The Identical Design Floorplans
To strengthen the implications of this research, it is valuable to explicitly include the role of identical design floorplans in the analysis. The identical-design subset, which exhibits the same highly concentrated, head-heavy distribution as the total stock, offers unique opportunities for streamlining modeling and policy interventions. Because these floorplans represent repeated, standardized layouts across multiple campuses, focusing on them allows for even greater efficiency in both data collection and intervention strategies.
Including identical design floorplans in prioritization means that a relatively small number of archetype models can be used to represent a large portion of the building stock with high fidelity. This approach is supported by recent research, which highlights the benefits of leveraging standardized or repeated floorplans for rapid dataset generation, improved modeling accuracy, and scalable policy implementation [
40,
86]. For example, semi-automated or graph-based modeling methods can efficiently map and analyze these repeated layouts, enabling more targeted and cost-effective retrofitting or renovation programs [
87]. Additionally, focusing on identical designs can facilitate the use of automated tools for floorplan analysis and inventory characterization, further reducing complexity and resource requirements [
86].
The significance of identical design floorplans is especially notable in the context of universities constructed after 2000. The most frequently occurring college building design, favored by newer universities, exemplifies this trend.
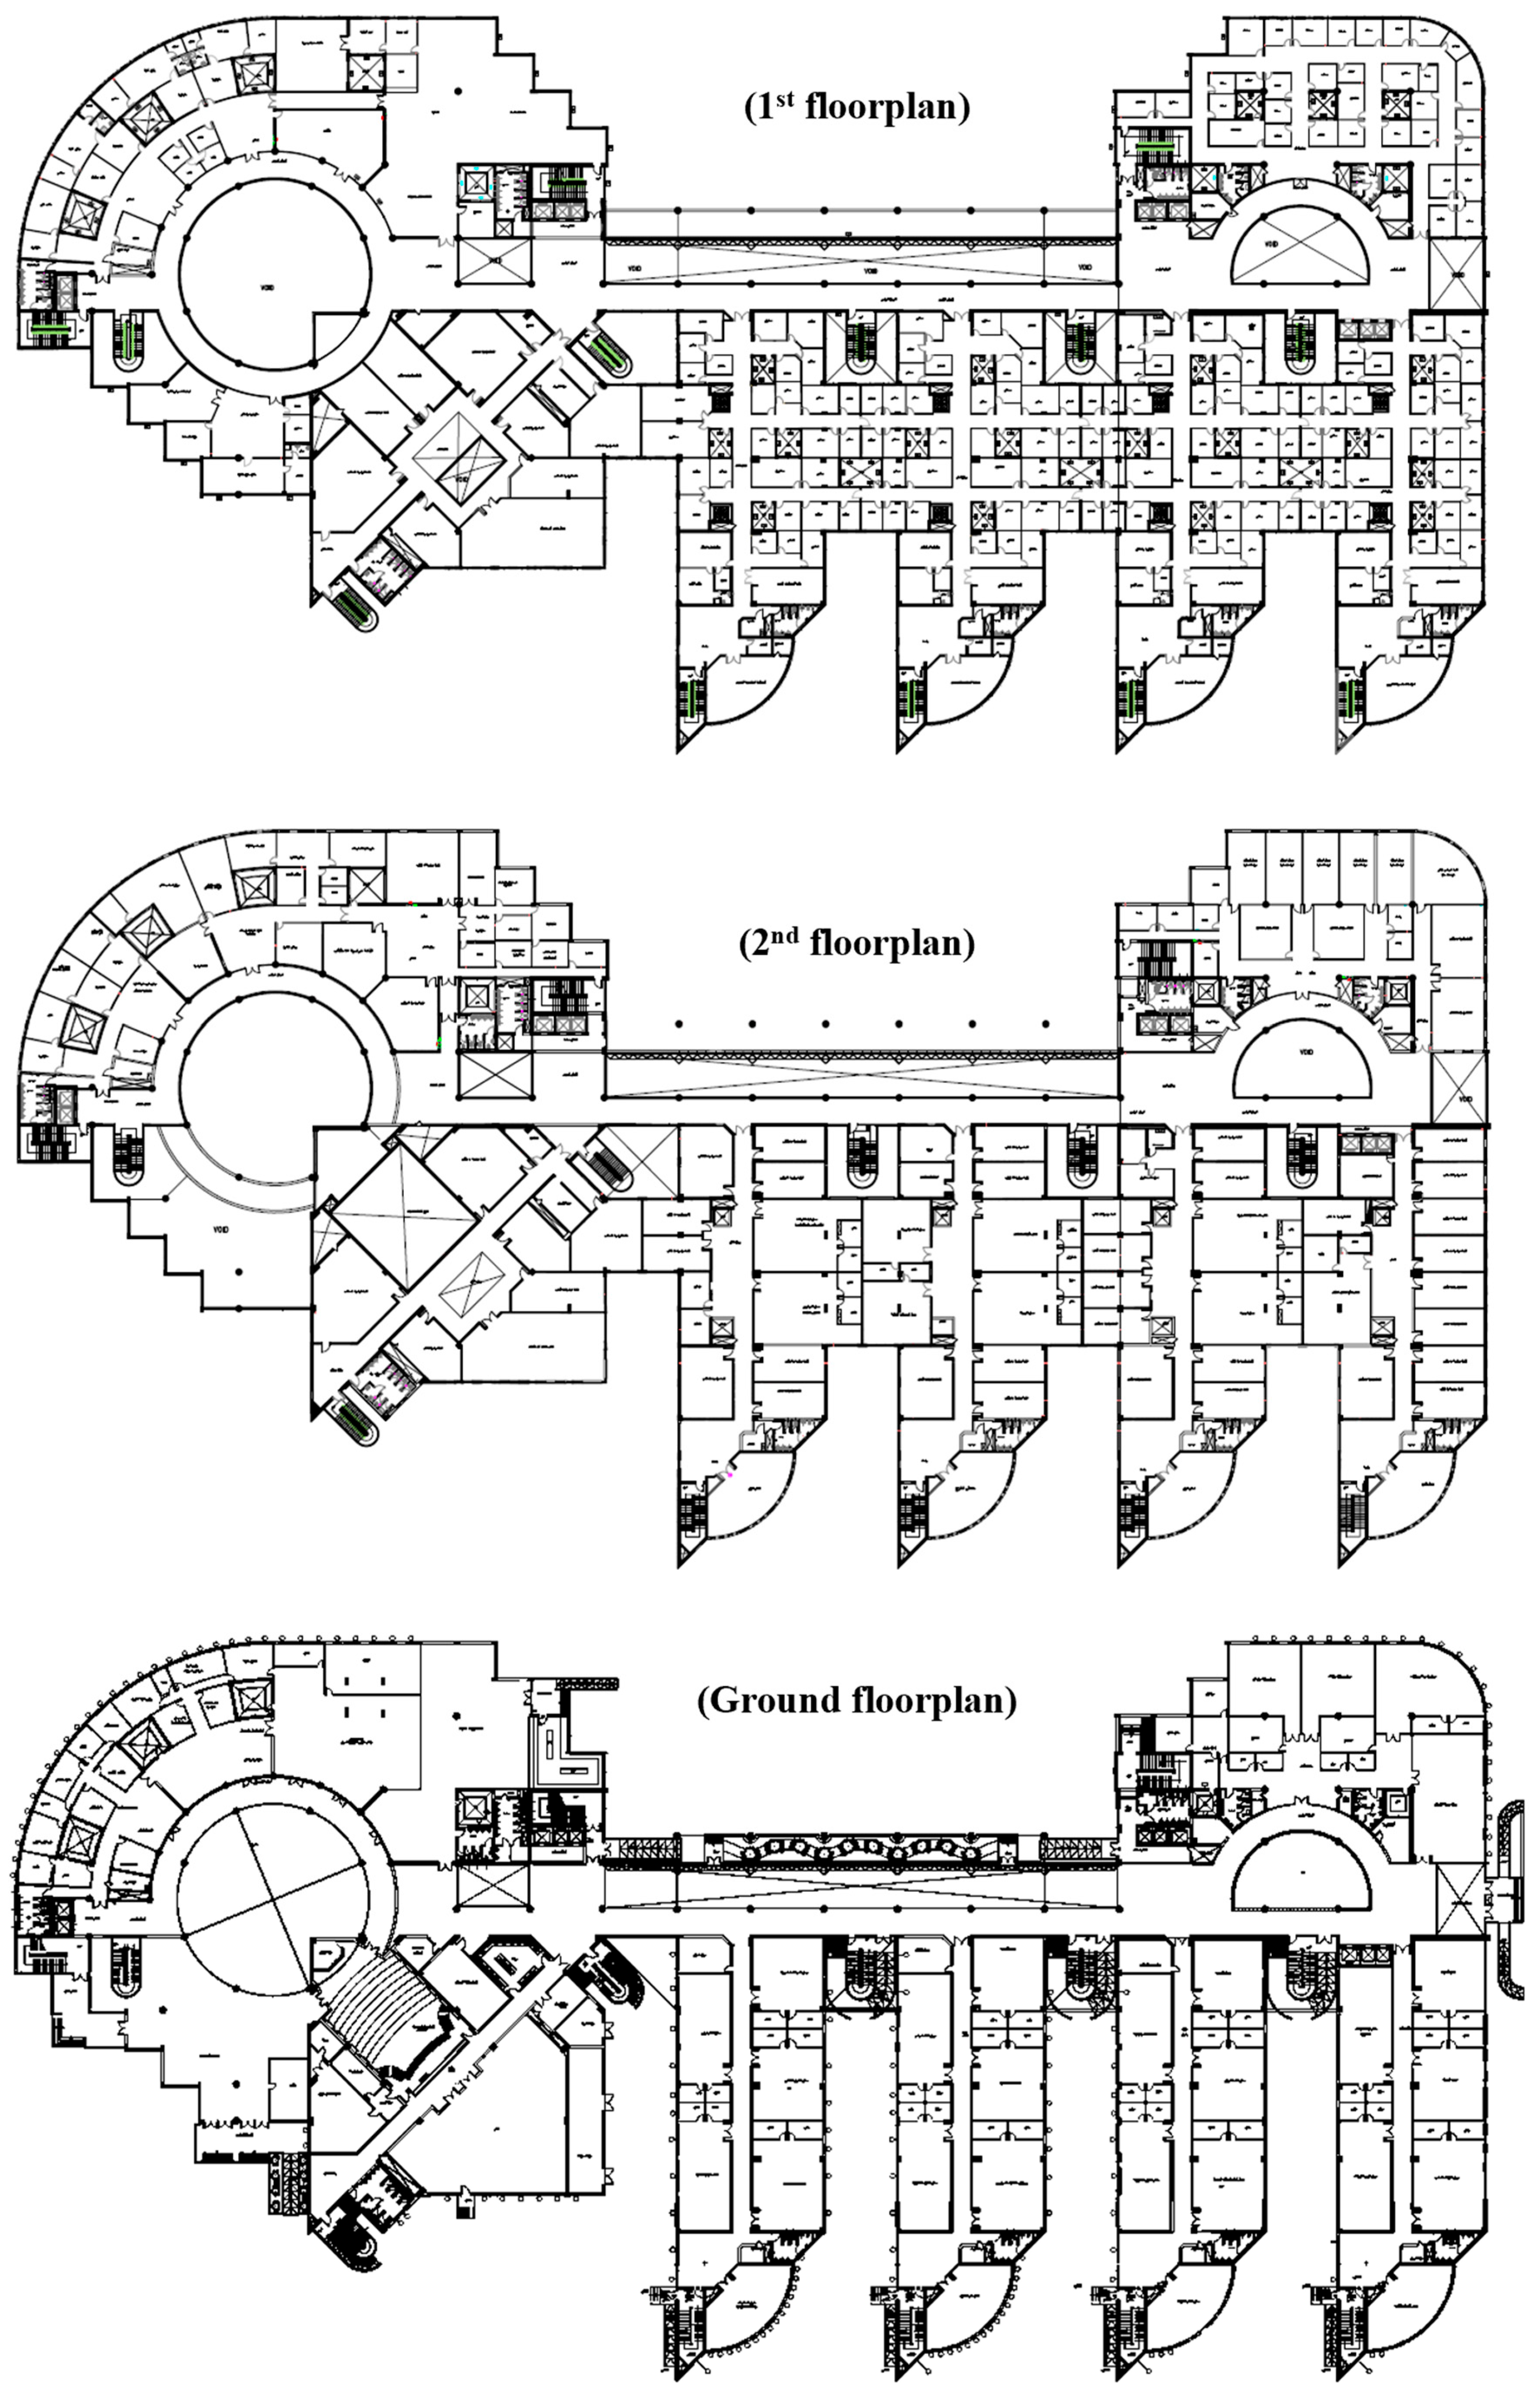
Figure 12 presents the identical college building design and is obtained from Jazan University [
88]. The floorplans feature a three-floor, spine-and-fingers layout with rounded terminal volumes. A central corridor (“spine”) connects a series of uniform classroom/lab wings (“fingers”), with rotunda-like blocks at each end serving as lobby and service hubs. The ground floor is dominated by open rooms and service suites, while the upper floors transition to more cellular teaching and office spaces, maintaining strong modular repetition and robust egress through multiple stair cores.
This high regularity and modularity are characteristic of template (“identical”) college buildings used across multiple campuses, making them particularly well-suited for stock-level archetype modeling and standardized retrofit packages. By focusing on these repeated floorplans, stakeholders can streamline data collection, improve modeling accuracy, and efficiently implement policy interventions. This approach is supported by research emphasizing the value of standardized layouts for benchmarking, facility management, and strategic planning in higher education buildings [
89,
90].
In summary, prioritizing both the most prevalent archetypes and the subset of identical design floorplans, especially those adopted in post-2000 university construction, maximizes the impact of modeling and policy actions while minimizing effort and complexity. This dual focus ensures interventions are both representative and scalable, supporting efficient progress toward sustainability and performance goals.
6. Discussion
6.1. Stock Structure
The Saudi public university system demonstrates a distinct two-cohort structure: a small group of legacy institutions established in the mid-20th century and a much larger cohort resulting from rapid expansion after 2000. This pattern is reflected in the rank-based analysis, where the majority of the building stock is concentrated within a limited set of archetype cells, while the remainder contributes minimally. The 10% rank-bin analysis makes this explicit: the top bin alone contains a dominant share of the stock, and by the top two bins, coverage approaches the system total. These findings are both statistically robust (with extremely small
p-values) and practically significant (Cohen’s w far exceeding conventional thresholds for large effects), confirming that the observed concentration is substantive and not an artifact of sample size. This aligns with broader trends in built environment stock studies, where stock mass is often found to be unevenly distributed across archetypes or typologies, especially in rapidly urbanizing or expanding contexts [
91,
92].
Table 6 compares the Saudi and the global building stock distribution patterns.
6.2. Role of Identical Desing
The subset of buildings with identical designs exhibits the same head-heavy distribution as the total stock, highlighting the operational importance of standardized college building forms. This has two key implications. First, design measures, such as envelope, HVAC, and operational schedules, developed for these repeated forms can be widely propagated across the stock, maximizing impact. Second, data collection efforts are leveraged: a small number of well-instrumented, identical sites can serve as reference archetypes, enhancing transferability and representativeness [
18,
40]. This approach is consistent with best practices in building stock modeling, where archetype-based methods are used to efficiently characterize and manage large, heterogeneous portfolios [
91,
92]. Further, a stricter test of whether identical designs are over-represented in top bins relative to non-identical types can be conducted using χ
2 independence tests and Cramér’s V, for which the current analytical pipeline is prepared.
6.3. Prioritization for Modeling and Policy
Given that much of the cumulative stock weighting lies in the top ranks, a focused simulation set can capture the majority of campus stock behavior with far fewer scenarios. In practice, targeting the top 10–20% of ranks provides broad coverage for calibration, baseline estimation, and retrofit scenario testing [
96]. This prioritization is highly attractive for program design: metering, audits, and early pilots can be concentrated where returns to information are highest, while lower-rank cells can be addressed through parameter borrowing or meta-models. Similar prioritization frameworks have been successfully applied in other building stock studies to optimize resource allocation and intervention strategies [
97].
The following discussion interprets the typological outcomes in relation to their broader implications for campus planning, energy management, and national sustainability policy.
6.4. Spatial Considerations
The spatial clustering of universities along the central (Riyadh) and western (Makkah–Jeddah–Madinah) corridors mirrors national patterns of population density and transportation infrastructure. For energy policy, this geographic coincidence of high stock mass and grid demand suggests that efficiency or demand-response programs targeted at these corridors are likely to yield disproportionate system benefits. This spatial targeting approach is supported by international research, which highlights the value of aligning building stock interventions with regional demand and infrastructure patterns [
91].
Beyond the statistical distribution of archetypes, the results reveal clear spatial and morphological logics underlying Saudi university campus design. Institutions located in hot-humid regions such as Jazan tend to adopt compact, low-rise, courtyard-centered masterplans that limit envelope exposure and encourage cross-ventilation, whereas campuses in hot-arid regions such as Riyadh and Qassim often feature dispersed layouts with shaded connectors, transitional courtyards, and deeper setbacks to reduce direct solar gain. These variations illustrate how university planning reflects regional climatic adaptation and traditional design strategies, linking the typological findings to functional planning logic rather than numerical distribution alone.
6.5. Methodological Contribution
This study formalizes a categorical archetype framework that is resilient to missing granular data. By codifying evidence into a cross-classified space, assigning normalized weights, and evaluating concentration using 10% rank-bins, chi-square tests, and effect sizes, the approach provides a transparent and reproducible pathway from heterogeneous records to actionable short-lists. Reporting Top-K coverage alongside test statistics bridges the gap between statistical significance and operational relevance, advancing the methodological rigor of building stock analysis. This aligns with recent calls in the literature for more standardized, data-driven, and scalable approaches to building stock modeling and policy design [
91,
97].
The identified archetypes provide a practical foundation for multiple applications across energy management and planning. For energy benchmarking, each archetype serves as a standardized baseline for comparing building-performance data across campuses and climatic regions. For retrofitting prioritization, the ranking framework highlights high-exposure or envelope-intensive archetypes, particularly those in hot-humid and hot-arid zones, that should be targeted first for efficiency upgrades. For policy and planning, the typological classification supports evidence-based guidelines aligned with Saudi Vision 2030 and the Saudi Building Code, enabling planners and institutions to develop consistent standards for sustainable campus design and facility management.
6.6. Limitations and Robustness
The findings of this study are subject to several methodological and data-related limitations that should be acknowledged. The analysis relied on discrete classification bands for variables such as construction period, region, urban context, masterplan typology, and design pattern. While discretization facilitates comparability, it may simplify the underlying variability within each category. In addition, the study employed a rank-based representativeness metric and a 10-bin analytical resolution, both of which influence the sensitivity of the statistical outcomes. To ensure consistency and minimize bias, all classification and coding rules were defined a priori, and scale-independent effect sizes were emphasized. Sensitivity analyses with finer binning confirmed the qualitative trend of strong head concentration, supporting the robustness of the results.
It is also important to note that the cumulative weighting used in this study represents building stock presence rather than actual energy consumption. Translating these typological findings into absolute energy-use metrics will require additional parameterization in future work, incorporating variables such as climate, operational schedules, and HVAC system characteristics. These limitations are consistent with those commonly recognized in building stock and energy modeling research, where discretization, scenario selection, and data incompleteness are typical sources of uncertainty. Nevertheless, the methodological framework remains robust and provides a transparent foundation for future energy-performance benchmarking and national-scale simulation studies.
6.7. Implications and Future Work
For national planning, the findings support a tiered strategy: develop high-fidelity models and retrofit solutions for the top-ranked identical forms, deploy calibrated variants to other high-rank cells, and address the long tail with simplified templates. Future work should include independence testing between design type and rank bin, incorporate additional weighting factors such as enrollment or floor area, and link archetype models to measured energy data where available. These steps will further refine targeting and enhance the efficiency and impact of concentrated modeling approaches, as recommended in recent studies on robust building performance assessment and scenario-based planning [
98,
99].
All analytical steps, including weight normalization, ranking, incremental differences, 10% rank-binning, chi-square (χ
2) testing, effect size () calculation, and Top-K coverage are reproducible and can be replicated from the described methodology and codebase. The computational workflow was scripted in Matlab [
65], with final tables and figures exported to Excel [
66] and Power BI [
67] for visualization and reporting. The use of a fixed bin count (T = 100) ensures clarity in results, while effect size metrics such as Cohen’s (w) remain invariant to scale. This approach aligns with best practices in building performance simulation and computational research, where transparent documentation of code, software versions, and workflow is essential for scientific integrity and future validation [
100].
7. Conclusions
This study established a GIS-based typological framework for Saudi public university buildings that systematically links spatial, morphological, and functional characteristics. The findings reveal that a small number of dominant archetypes account for most of the educational building stock, demonstrating a highly concentrated typological pattern across climatic regions. While the current framework focuses on geometric and contextual parameters, it provides the foundation for future integration of environmental and energy datasets. The next phase will incorporate HVAC configuration, glazing and insulation properties, and infiltration rates, extending the typology to a comprehensive energy modeling platform. By providing a transparent and reproducible structure, this work contributes to evidence-based planning and supports Saudi Vision 2030 objectives for sustainable higher-education infrastructure.
The findings reveal a pronounced concentration of stock representation in the highest ranks. In the full sample of 1260 combinations, the top decile (0–10% of ranks (126 combinations)) accounts for approximately 76% of cumulative weighting, and the top two deciles cover about 89% (252 combinations). Fine-grained metrics show that the top 10, 20, and 50 individual ranks capture 22.9%, 35.2%, and 54% of the stock, respectively. The subset of buildings with identical designs exhibits a similar head-heavy pattern, with 63% in the top decile and 88% in the top two deciles. Chi-square goodness-of-fit tests against a uniform distribution are highly significant, with very large effect sizes, confirming that the observed concentration is both statistically and substantively meaningful.
These results have direct operational implications. Because most of the stock mass is concentrated in a small set of repeated forms, focusing modeling, calibration, metering, and retrofit design on the top 10–20% of ranks, especially those with identical designs, can efficiently capture the majority of stock behavior. This enables more rapid campus energy assessments and targeted efficiency or demand management interventions, particularly in the central and western corridors where university buildings and energy loads are clustered.
Methodologically, this work contributes a portable, data-sparse-tolerant pipeline, incorporating categorical coding, cumulative weighting, Top-K coverage, and 10% rank-bin tests with effect sizes, that can be adopted by other public-sector building portfolios. The workflow is reproducible and can be replicated from the described the original script.
Limitations include reliance on categorical discretization, a monotonic rank metric, and bin resolution; cumulative weighting reflects stock presence rather than absolute energy use. Future research should explicitly test composition (identical vs. non-identical designs across bins) using independence tests, integrate measured energy or floor-area/enrollment weighting to estimate absolute impacts, and regionalize parameters for high-leverage corridors. Despite these caveats, the core conclusion is robust: a small, well-defined set of archetypes drives the educational building stock, and prioritizing these forms offers the most efficient path to actionable energy policy and planning.
