Article

Decoding Construction Accident Causality: A Decade of Textual Reports Analyzed

School of Economics and Management, Chang’an University, Xi’an 710064, China
*
Author to whom correspondence should be addressed.
Buildings 2025, 15(21), 3859; https://doi.org/10.3390/buildings15213859 (registering DOI)
Submission received: 16 September 2025 / Revised: 21 October 2025 / Accepted: 23 October 2025 / Published: 25 October 2025
(This article belongs to the Special Issue Digitization and Automation Applied to Construction Safety Management)

Abstract

Analyzing accident reports to absorb past experiences is crucial for construction site safety. Current methods of processing textual accident reports are time-consuming and labor-intensive. This research applied the LDA topic model to analyze construction accident reports, successfully identifying five main types of accidents: Falls from Height (23.5%), Struck-by and Contact Injuries (22.4%), Slips, Trips, and Falls (21.8%), Hot Work & Vehicle Hazards (18.1%), and Lifting and Machinery Accidents (14.2%). By mining the rich contextual details within unstructured textual descriptions, this research revealed that environmental factors constituted the most prevalent category of contributing causes, followed by human factors. Further analysis traced the root causes to deficiencies in management systems, particularly poor task planning and inadequate training. The LDA model demonstrated superior effectiveness in extracting interpretable topics directly mappable to engineering knowledge and uncovering these latent factors from large-scale, decade-spanning textual data at low computational cost. The findings offer transformative perspectives for improving construction site safety by prioritizing environmental control and management system enhancement. The main theoretical contributions of this research are threefold. First, it demonstrates the efficacy of LDA topic modeling as a powerful tool for extracting interpretable and actionable knowledge from large-scale, unstructured textual safety data, aligning with the growing interest in data-driven safety management in the construction sector. Second, it provides large-scale, empirical evidence that challenges the traditional dogma of “human factor dominance” by systematically quantifying the critical role of environmental and managerial root causes. Third, it presents a transparent, data-driven protocol for transitioning from topic identification to causal analysis, moving from assertion to evidence. Future work should focus on integrating multi-dimensional data for comprehensive accident analysis.

1. Introduction

The construction industry is recognized as one of the most dangerous industries worldwide due to its unique characteristics, exposing workers to numerous injuries. These characteristics include complex work environments, intricate construction methods, temporary workplaces and organizations, diverse tasks, and the use of heavy machinery and equipment [1,2]. Common causes of injuries in the construction industry include operating powerful machines, working at heights, handling heavy objects, and working outdoors in extreme weather conditions [3]. Injuries can lead to loss of life, chronic pain, psychological distress, loss of income, and significant medical expenses for workers and their families, disrupting construction schedules, and imposing substantial social and economic burdens on employers [4,5,6]. The construction industry is plagued by two primary categories of safety and health issues: acute accidents and chronic occupational diseases. Construction accidents encompass a wide range of immediate incidents, including falls, struck-by objects, electrocutions, and caught-in/between events, which often result in severe injuries or fatalities. In parallel, occupational diseases represent a significant, though often less immediately visible, burden on worker health, such as silicosis from prolonged dust exposure, hearing loss due to chronic noise, and musculoskeletal disorders from repetitive tasks. While both are critical, this research focuses specifically on accident reports because they provide rich, narrative data on the immediate circumstances and latent causes of acute incidents, which is the primary objective of the topic modeling analysis. The reporting frameworks and data characteristics for occupational diseases typically differ and warrant separate, focused investigation.
Given the severity and frequency of construction injuries, the industry must learn from past accidents [7,8,9]. The rapid growth of construction data driven by digitalization has led to the accumulation of extensive construction injury data. Current research often focuses on analyzing structured data [10,11,12,13,14,15], but the analysis of unstructured textual data, which can provide deeper insights, is limited by the interpretability of existing methods [10,16,17]. Accident reports typically contain a large amount of unstructured natural language data that hides crucial information [18,19,20,21]. Therefore, there is an urgent need for new methods that can automatically analyze accident text reports to ensure objective and comprehensive analysis. By using text analysis methods, the hidden information can be uncovered, enhancing the understanding of accident causes [22,23,24].
Supervised learning algorithms are increasingly used for automated systems. However, their need for labeled data creates high human and time costs [25]. Topic modeling offers an alternative. It uses unsupervised learning to discover topics [26]. BERT is a pre-trained language model. It processes text by capturing word and sentence-level representations [27]. BERT uses Masked Language Modeling and Next Sentence Prediction [28]. Pre-training allows BERT to handle various natural language processing (NLP) tasks. These include text classification, sentiment analysis, and question answering [4]. BERT shows strong performance in many NLP tasks. In contrast, LDA (Latent Dirichlet Allocation) is different. It is a text clustering algorithm based on a bag-of-words model [11]. LDA assumes that documents contain hidden topics. It uses these topics to describe the document collection. LDA builds topics by treating each word as an independent feature. It then represents documents using these topic mixtures for clustering or classification [29]. Compared to LDA, BERTopic often performs better for fine-grained topics [30]. It captures stronger paragraph-level semantic links. Pre-trained models like BERTopic have advantages in text representation. However, LDA’s primary value lies in meeting core construction accident analysis needs [31,32,33,34,35]:
(1)
Knowledge Traceability: LDA’s “topic–keyword” distributions map directly to construction terms. This aligns perfectly with safety construction logic.
(2)
Long-term Robustness: Terminology evolves in long-term datasets. LDA’s bag-of-words approach is more resilient to term changes than semi-supervised or supervised methods (like pre-trained models), which require constantly updated labeled datasets.
(3)
Low-Resource Needs: Labeling costs for semi-supervised or supervised methods are too high for large datasets. Graph neural networks heavily depend on accurate entity relationship extraction. These methods demand significant hardware and time. LDA, conversely, enables rapid large-scale accident type and key factor surveys with low computing resources. This makes LDA more suitable for industrial use.
LDA achieves higher coherence scores than BERTopic in large-scale, domain-specific studies [36]. Its knowledge traceability, long-term robustness, and low-resource needs make LDA better suited for analyzing large-scale construction accident report dataset.
Although significant progress has been made in the field of NLP, the selection of the most appropriate method for this research must primarily consider the specific requirements of the analysis of construction safety accident reports. The core task of this research is to extract potential risk patterns that can be directly interpreted and acted upon by security experts from a decade-long, large-scale (n = 17,710) domain-specific text. This requires the model not only to have the ability to handle large-scale data but also to possess extremely strong interpretability, robustness to changes in industry terms, and low computational costs.
Based on the above requirements, supervised learning models are costly due to their reliance on a large amount of manually labeled data and have difficulty discovering new patterns beyond the scope of report description. Meanwhile, advanced models based on pre-trained semantic embedding, such as BERTopic, although performing well in general domains, have a ‘black box’ feature that weakens the traceability of the results and have weak adaptability to the long-term evolution of terms in the field of building safety [36]. In contrast, the unsupervised nature of the LDA topic model meets the demand for exploring unknown patterns. More importantly, its unique “document–topic–keyword” probabilistic generation structure can produce highly interpretable topic results that are directly mapped to the construction safety knowledge [7,31]. LDA is based on the bag-of-words assumption, which makes it more robust to the long-term evolution of vocabulary and has high computational efficiency, making it highly suitable for promotion and application in the industrial sector [32].
Therefore, this research adopts the LDA topic model as the core analysis method, aiming to leverage its core advantages in interpretability, robustness, and low-resource requirements [33,34] to achieve the fundamental goal of transparently decoding the causal relationship of construction accidents from massive unstructured texts.
The main objective of this research is to uncover the topic distribution within construction injury reports to deepen the understanding of key factors affecting construction safety [37,38,39]. This analysis can help identify common types of accidents, potential risk factors, and preventive measures, which are crucial for improving safety on construction sites [40]. This research uses data to precisely extract the five major types of accidents through structured output and quantifying their distribution. The findings ultimately reveal the paramount importance of environmental control and management systems, offering novel insights for safety enhancement.
The structure of this paper is as follows: First, the research background and related work are introduced (Section 1), followed by a detailed description of data sources, data characteristics, data preprocessing, and TF-IDF analysis (Section 2). Section 3 presents the process of LDA topic modeling and analyzes the main topics and causes of construction accidents. Section 4 discusses the significance and contributions of this research. Section 5 presents the conclusions drawn from the research and future research.

2. Research Methods

As mentioned in the Introduction, while BERT and other pre-trained models offer advanced text representation capabilities, this research employs LDA topic modeling due to its suitability for large-scale, domain-specific text analysis. The comparative advantages of LDA, including knowledge traceability, long-term robustness, and low-resource needs, make it the preferred method for this research. Therefore, Section 2 focuses on the methods used in this research, as shown in Figure 1.

2.1. Text Preprocessing

To prepare the unstructured text data for analysis, a comprehensive preprocessing pipeline was implemented using Python 3.11 and the scikit-learn and NLTK libraries. The steps were as follows:
  • Text Cleaning: All text was converted to lowercase. Punctuation, numbers, and special characters were removed.
  • Tokenization: Text was split into individual words.
  • Stop-word Removal: A standard English stop-word list from the NLTK library was used. Furthermore, a custom, domain-specific stop-word list was developed by reviewing high-frequency but low-information words in the corpus. This combined list was applied to filter out noise.
  • Lemmatization: Words were reduced to their base or dictionary form using the WordNet lemmatizer from NLTK to consolidate different inflections of the same word.
  • Vocabulary Pruning: The vocabulary was pruned based on document frequency. Terms that appeared in fewer than 10 documents (min_df = 10) or in more than 70% of the documents (max_df = 0.7) were excluded to remove rare terms and overly common, non-discriminatory words.
  • Feature Selection with TF-IDF: The preprocessed text was vectorized using TF-IDF. The top 2000 features with the highest TF-IDF scores across the corpus were selected for the final vocabulary to reduce dimensionality and computational cost while retaining the most discriminative terms for topic modeling.
In LDA topic modeling, TF-IDF analysis can be used as a preprocessing step to extract and select feature words, thereby improving the effectiveness of topic modeling. TF-IDF is a statistical method used to assess the importance of a word in a document. It consists of two parts: term frequency (TF) and inverse document frequency (IDF).
TF measures the frequency of a term within a document. It is calculated as the ratio of the number of times a term appears in a document N1 to the total number of terms in the document N2. IDF measures the rarity of a term across the corpus of documents. It is calculated as the logarithm of the total number of documents in the corpus M1 divided by the number of documents in which the term appears M2. IDF = log (Total number of documents in the corpus)/(Number of documents in the corpus that contain the term). The formula for calculating the TF-IDF score for a term in a document is given as:
T F I D F = N 1 N 2 l o g ( M 1 M 2 )
TF-IDF calculates the importance of each word in a document to select words that contribute significantly to distinguishing document topics and reduce the impact of noise words. When processing large-scale text data, using all words directly would lead to high dimensionality. TF-IDF helps in selecting important words, reducing dimensionality, and thereby enhancing the efficiency and effectiveness of LDA modeling. It assigns a weight to each word, focusing more on words that have high discriminative power in subsequent LDA modeling.

2.2. LDA Topic Modeling

LDA is a generative probabilistic model used to discover latent topics within a collection of text data. LDA does not require pre-labeled data [7,35]. It assumes that each document is generated by a mixture of multiple topics, and each topic is generated by a probability distribution over a set of words.
For each document d, a topic z is drawn from the topic distribution θd. A word w is then drawn from the word distribution ϕz corresponding to topic z. The topic distribution θd for each document and the word distribution ϕz for each topic are controlled by the Dirichlet distribution parameters α and β, respectively. For each word w in document d, a topic zd,n is drawn from the topic distribution θd, and a word w is drawn from the word distribution ϕzd,n. The joint probability distribution of the document collection D is given by:
P ( D α , β ) = d = 1 M θ d P θ d α n = 1 N d Z d , n P z d , n θ d P w d , n ϕ z d , n , β d θ d
Here, M is the total number of documents, and Nd is the number of words in document d.
The LDA model was implemented using the Gensim library in Python. Parameter estimation was performed using the online variational Bayes inference algorithm, which is scalable for large datasets. We used asymmetric priors for the document–topic distribution (α) and symmetric priors for the topic-word distribution (β), as these are common defaults that often yield good results. The model was trained for 100 passes (iterations) with a random seed (random_state) set to 100 to ensure the reproducibility of the results presented. The model was considered to have converged when the change in the variational lower bound fell below a predefined tolerance threshold. While the topics presented were stable and semantically coherent for the fixed seed, a comprehensive analysis of topic stability across multiple random initializations is a valuable direction for future work.

2.3. LDA Result Evaluation Metrics

  • Coherence
Topic coherence measures the semantic similarity between high-scoring words within a topic, reflecting the topic’s interpretability. Coherence scores range from 0 to 1, with higher values indicating more coherent topics. A score above 0.5 is generally considered acceptable, but the ideal value depends on the dataset and application. This research uses the C_V coherence measure, which is based on a sliding window and normalized pointwise mutual information (NPMI) of word pairs. The formula for calculating topic coherence is as follows:
Coherence = 1 k t = 1 k 1 i < j s i m ω i , ω j
Here, k is the number of topics. ωi and ωj are words in topic t. sim(ωi, ωj) is the semantic similarity score between words ωi and ωj. The Gensim library’s implementation was used with a sliding window size of 110. The semantic similarity score sim(ωi, ωj) is calculated using NPMI over the entire corpus.
2.
Perplexity
Perplexity measures how well a probability model predicts a sample. In topic modeling, lower perplexity indicates better generalization performance. Perplexity scores can range from 0 to infinity, with lower values being better. However, perplexity alone is not always reliable for model selection, as it may favor models with more topics that overfit the data.
Perplexity = 2 1 N d = 1 N l o g P w d
Here, N represents the number of documents in the dataset. P(wd) denotes the likelihood W probability of document d according to the model.
3.
Mean Intertopic Distance
Intertopic Distance is a crucial metric in LDA topic modeling that measures the similarity or dissimilarity between topics. In theory, a larger Intertopic Distance indicates more distinct differences between topics.
Mean   Intertopic   Distance = 1 k ( k 1 ) i = 1 k j i d i s t a n c e ( i , j )
Topic overlap implies that certain topics contain similar words, leading to semantic closeness between these topics. Even if the Intertopic Distance scores are not low, overlapping topics can still occur. In such cases, it is necessary to integrate other metrics and methods for a comprehensive assessment.
The Intertopic Distance visualized in this research is calculated based on the Jensen-Shannon divergence between the word distributions of every pair of topics. This distance is then projected into a two-dimensional space using multidimensional scaling (MDS) to create the plot by the pyLDAvis library.
4.
Topic Similarity
Topic similarity is computed as the total cosine similarity among all topics to assess the degree of overlap between them. The calculation formula is as follows:
total _ similarity = i = 1 k 1 j = i + 1 k c o s θ i j
Here, θ i j represents the cosine similarity between the feature word probability vectors of the i-th and j-th topics. k denotes the total number of topics.
A high value of total similarity indicates significant similarity and overlap between topics. Conversely, a low total similarity suggests that topics are relatively independent with minimal overlap.

3. Case Study

3.1. Data Description

The dataset used in this research was provided by construction companies operating a comprehensive range of construction contracting and services. The dataset is therefore highly representative of the industry. The dataset comprises a total of 25,980 construction accident reports, including residential, commercial, and infrastructure projects. Lengthy accident reports often contain a significant amount of noise vocabulary unrelated to construction accidents, while overly brief reports are likely to lack key factors. After inspecting the dataset, it was found that reports over 100 words often contain redundant descriptions. Conversely, accident reports with less than 20 words often only describe the injured parts without describing the causes of the accident or external factors. To ensure the quality and relevance of the dataset for topic modeling, the following filtering criteria were applied:
(1)
Reports exceeding 100 words were excluded to minimize noise and irrelevant narrative contents.
(2)
Reports shorter than 20 words were excluded to ensure sufficient contextual information for meaningful analysis.
This filtering process resulted in the exclusion of 8270 reports, retaining 17,710 valid construction accident reports as the final dataset for this research. These event description reports are unstructured textual data consisting of sentences or paragraphs that provide detailed descriptions of the injury circumstances and causes.
The final dataset of 17,710 reports has an average length of 42 words per report. The reports primarily describe the accident nature, involved objects, cause actions, and immediate context, providing rich textual content for extracting latent topics and causal factors.

3.2. Determination of the Number of Topics

Using the LDA model to perform topic modeling on accident reports, the metric results under different numbers (from 2 to 20) of topics are shown in Table 1.
The optimal number of topics for an LDA model is usually determined by balancing multiple metrics, including Coherence Score, Perplexity Score, Intertopic Distances Mean, and Topic Similarities. A very low number of topics might render this research meaningless, so the case of having only 2 topics is not considered. Here is an analysis based on the data from Table 1:
(1)
Coherence Score: A higher score indicates better semantic coherence of the topics. The data shows that the scores fluctuate across different numbers of topics.
(2)
Perplexity Score: Perplexity increases with the number of topics, which is normal because more topics can capture more details in the data but also increase the model’s complexity.
(3)
Mean Intertopic Distances: A higher value indicates better distinction between topics.
(4)
Topic Similarity: This value increases with the number of topics, which might mean that the distinctions between topics become blurrier as the number of topics increases.
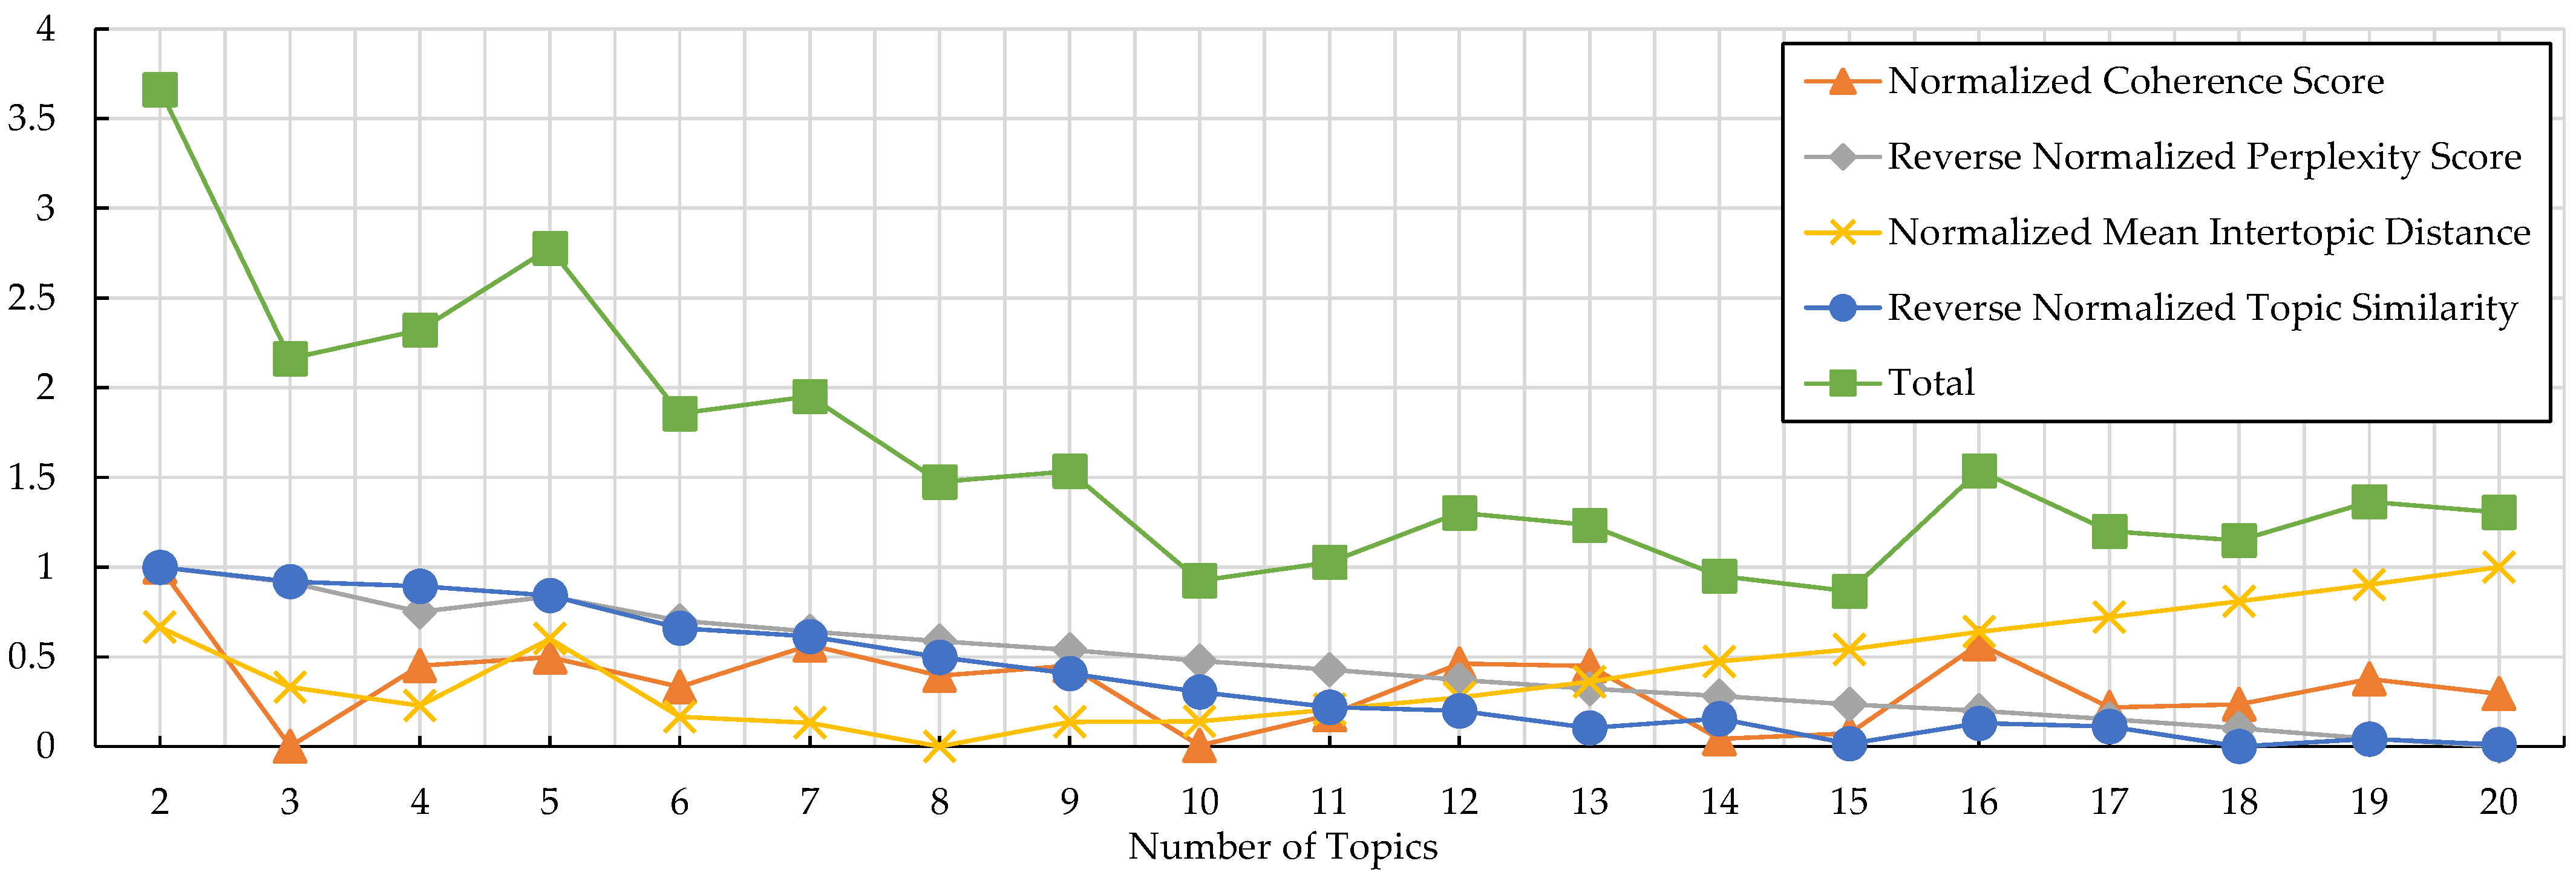
To quantitatively synthesize these competing objectives, a composite score was calculated for each k by summing the normalized coherence, reverse-normalized perplexity, normalized mean intertopic distance, and reverse-normalized topic similarity. This composite score, representing an overall model quality balance, reached its global maximum at k = 5 (Score = 2.78), as indicated in Figure 2.
While k = 3 achieved the lowest perplexity (1015.8), it produced overly broad topics that mixed distinct accident types, reducing practical utility, this is also the reason why k = 2 is not chosen. Conversely, k = 16 achieved the highest coherence (0.6217) but resulted in fragmented topics with substantial overlap (topic similarity = 8.3551) and poor interpretability. The k = 5 model represented the optimal balance, with relatively high coherence (0.6186), manageable perplexity (1140.1), good topic separation (mean intertopic distance = 5.3395), and moderate topic similarity (1.9337). Therefore, k = 5 was selected as it represents a balance, achieving high semantic coherence and good topic distinction while maintaining relatively low model complexity and overlap. Considering the coherence score and intertopic distances mean, 5 topics might be a better choice. It provides a balance point, achieving a high coherence score and good topic distinction while maintaining relatively low perplexity.
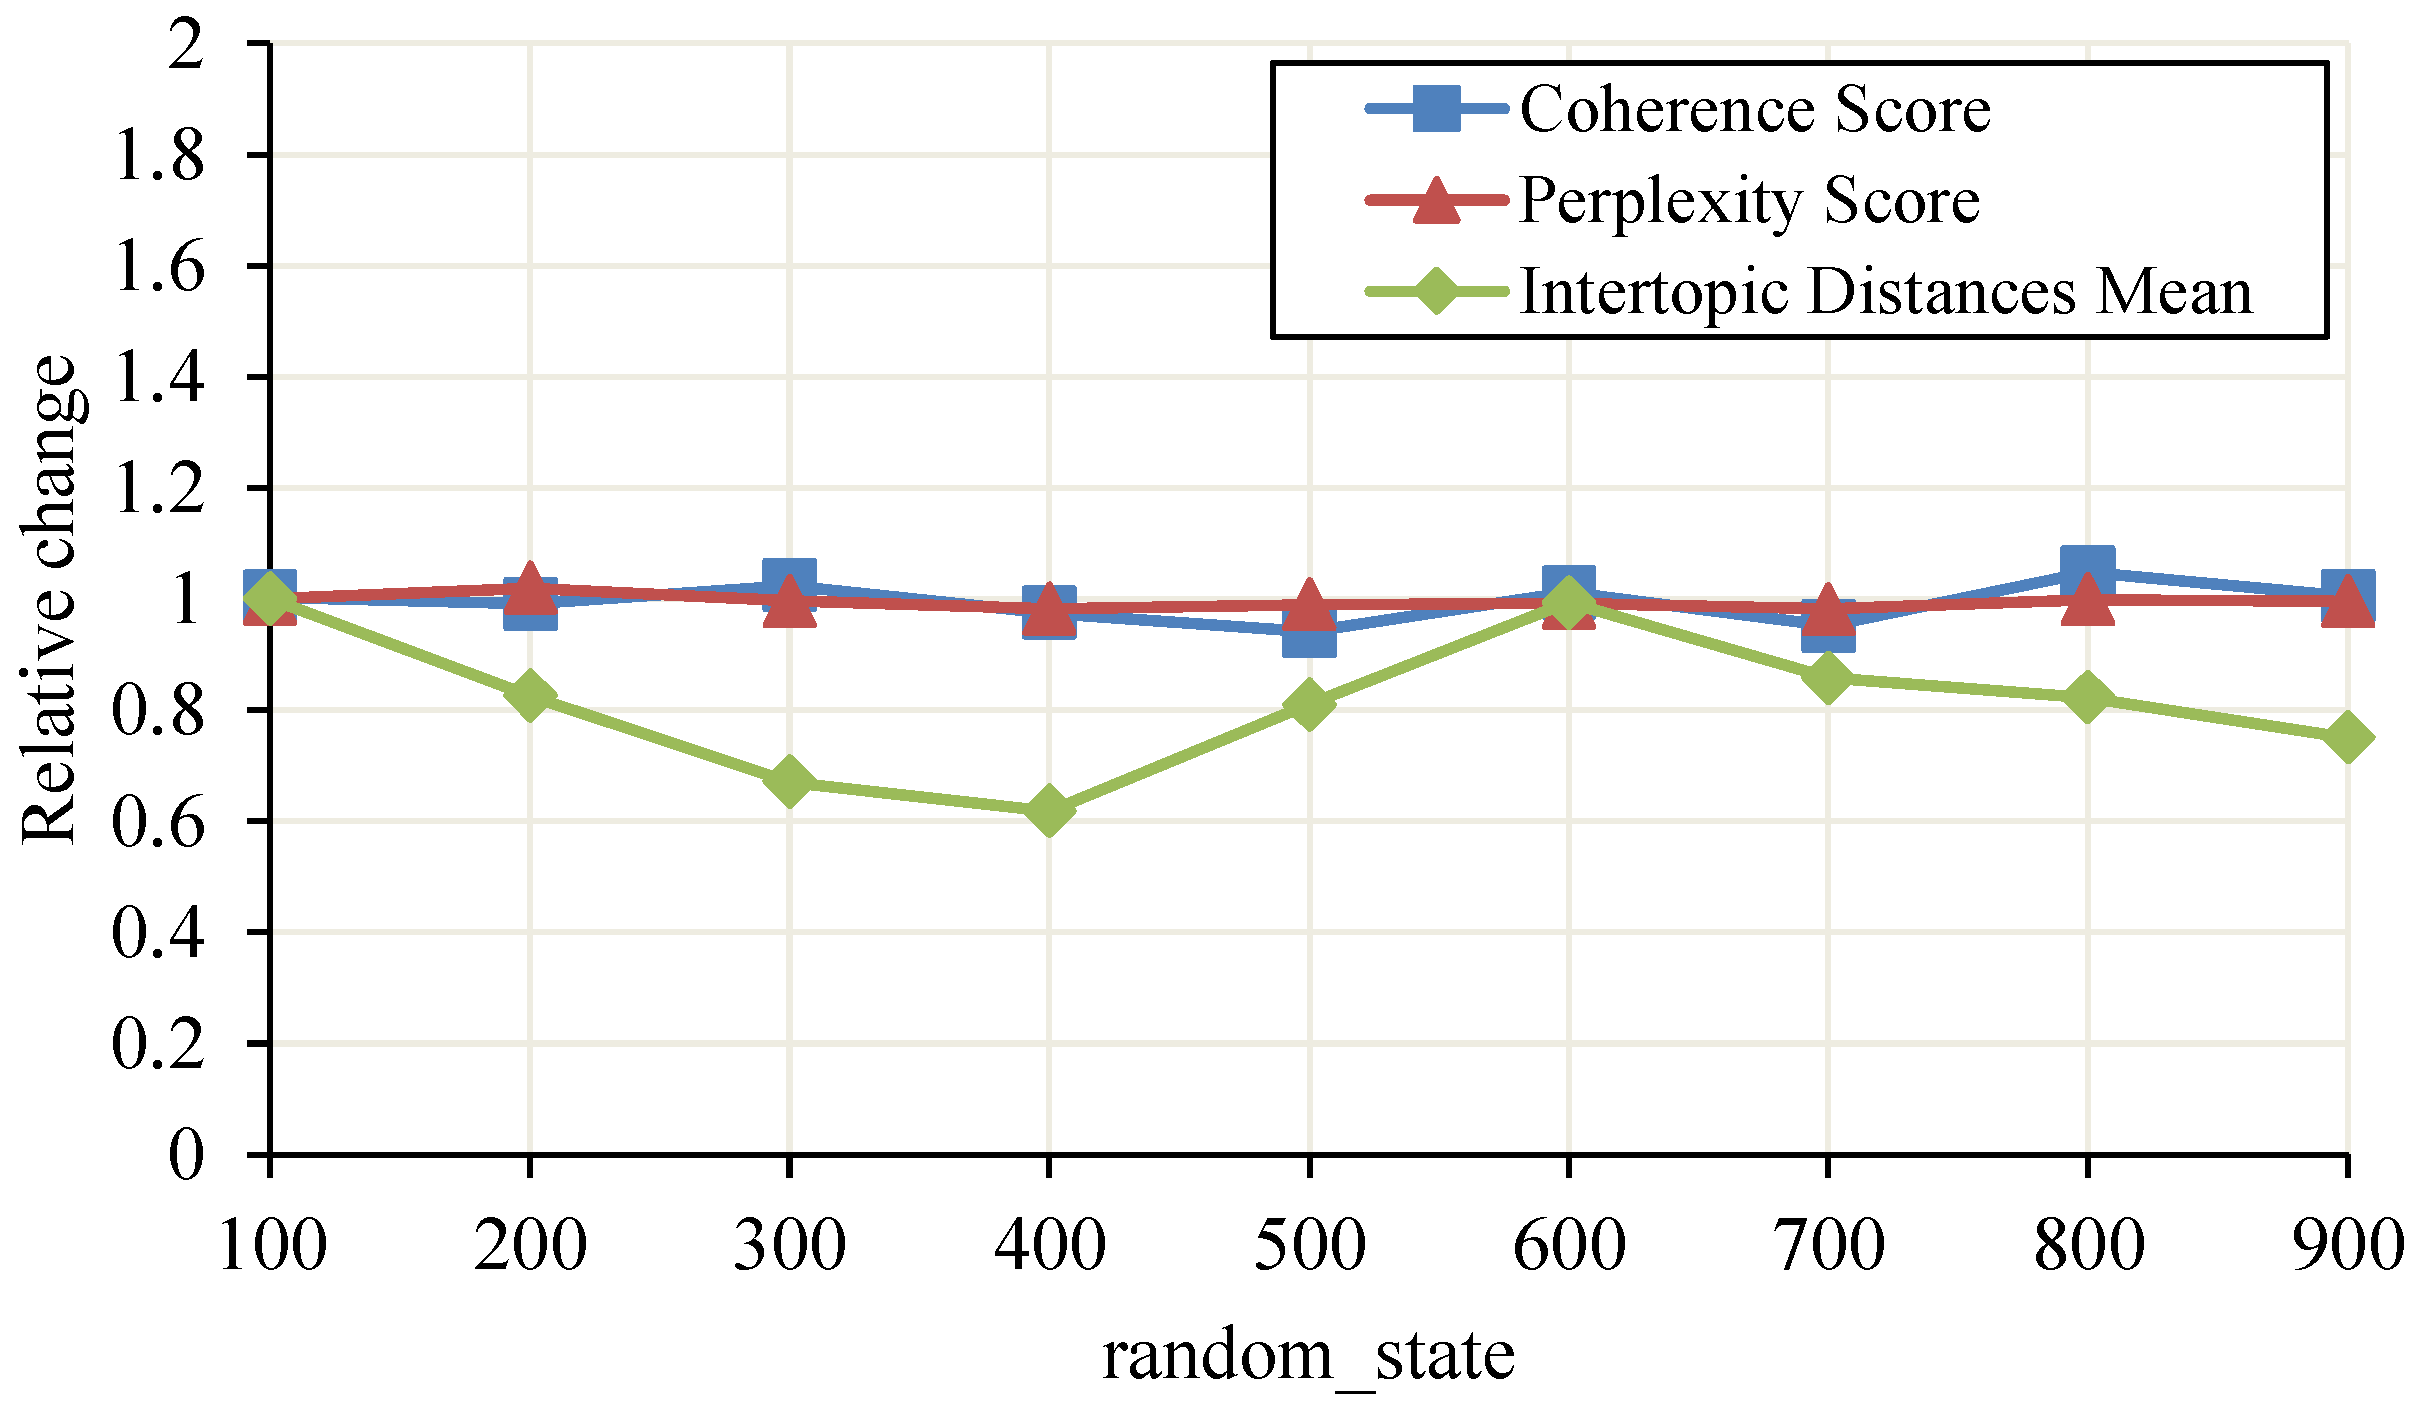
To demonstrate topic robustness, compare the number of topics k = 5 and the random seed (random_state) from 100 to 900. Take the result of random_state = 100 as the comparison benchmark and observe the relative changes. The results are shown in Figure 3. The evaluation metrics of the topic modeling results with different seed numbers are relatively stable. And the result with a seed number of 100 has the highest intertopic distance mean.

3.3. Results of Topic Modeling

Conducting LDA topic modeling with five topics on the dataset, the following topic distributions were obtained.
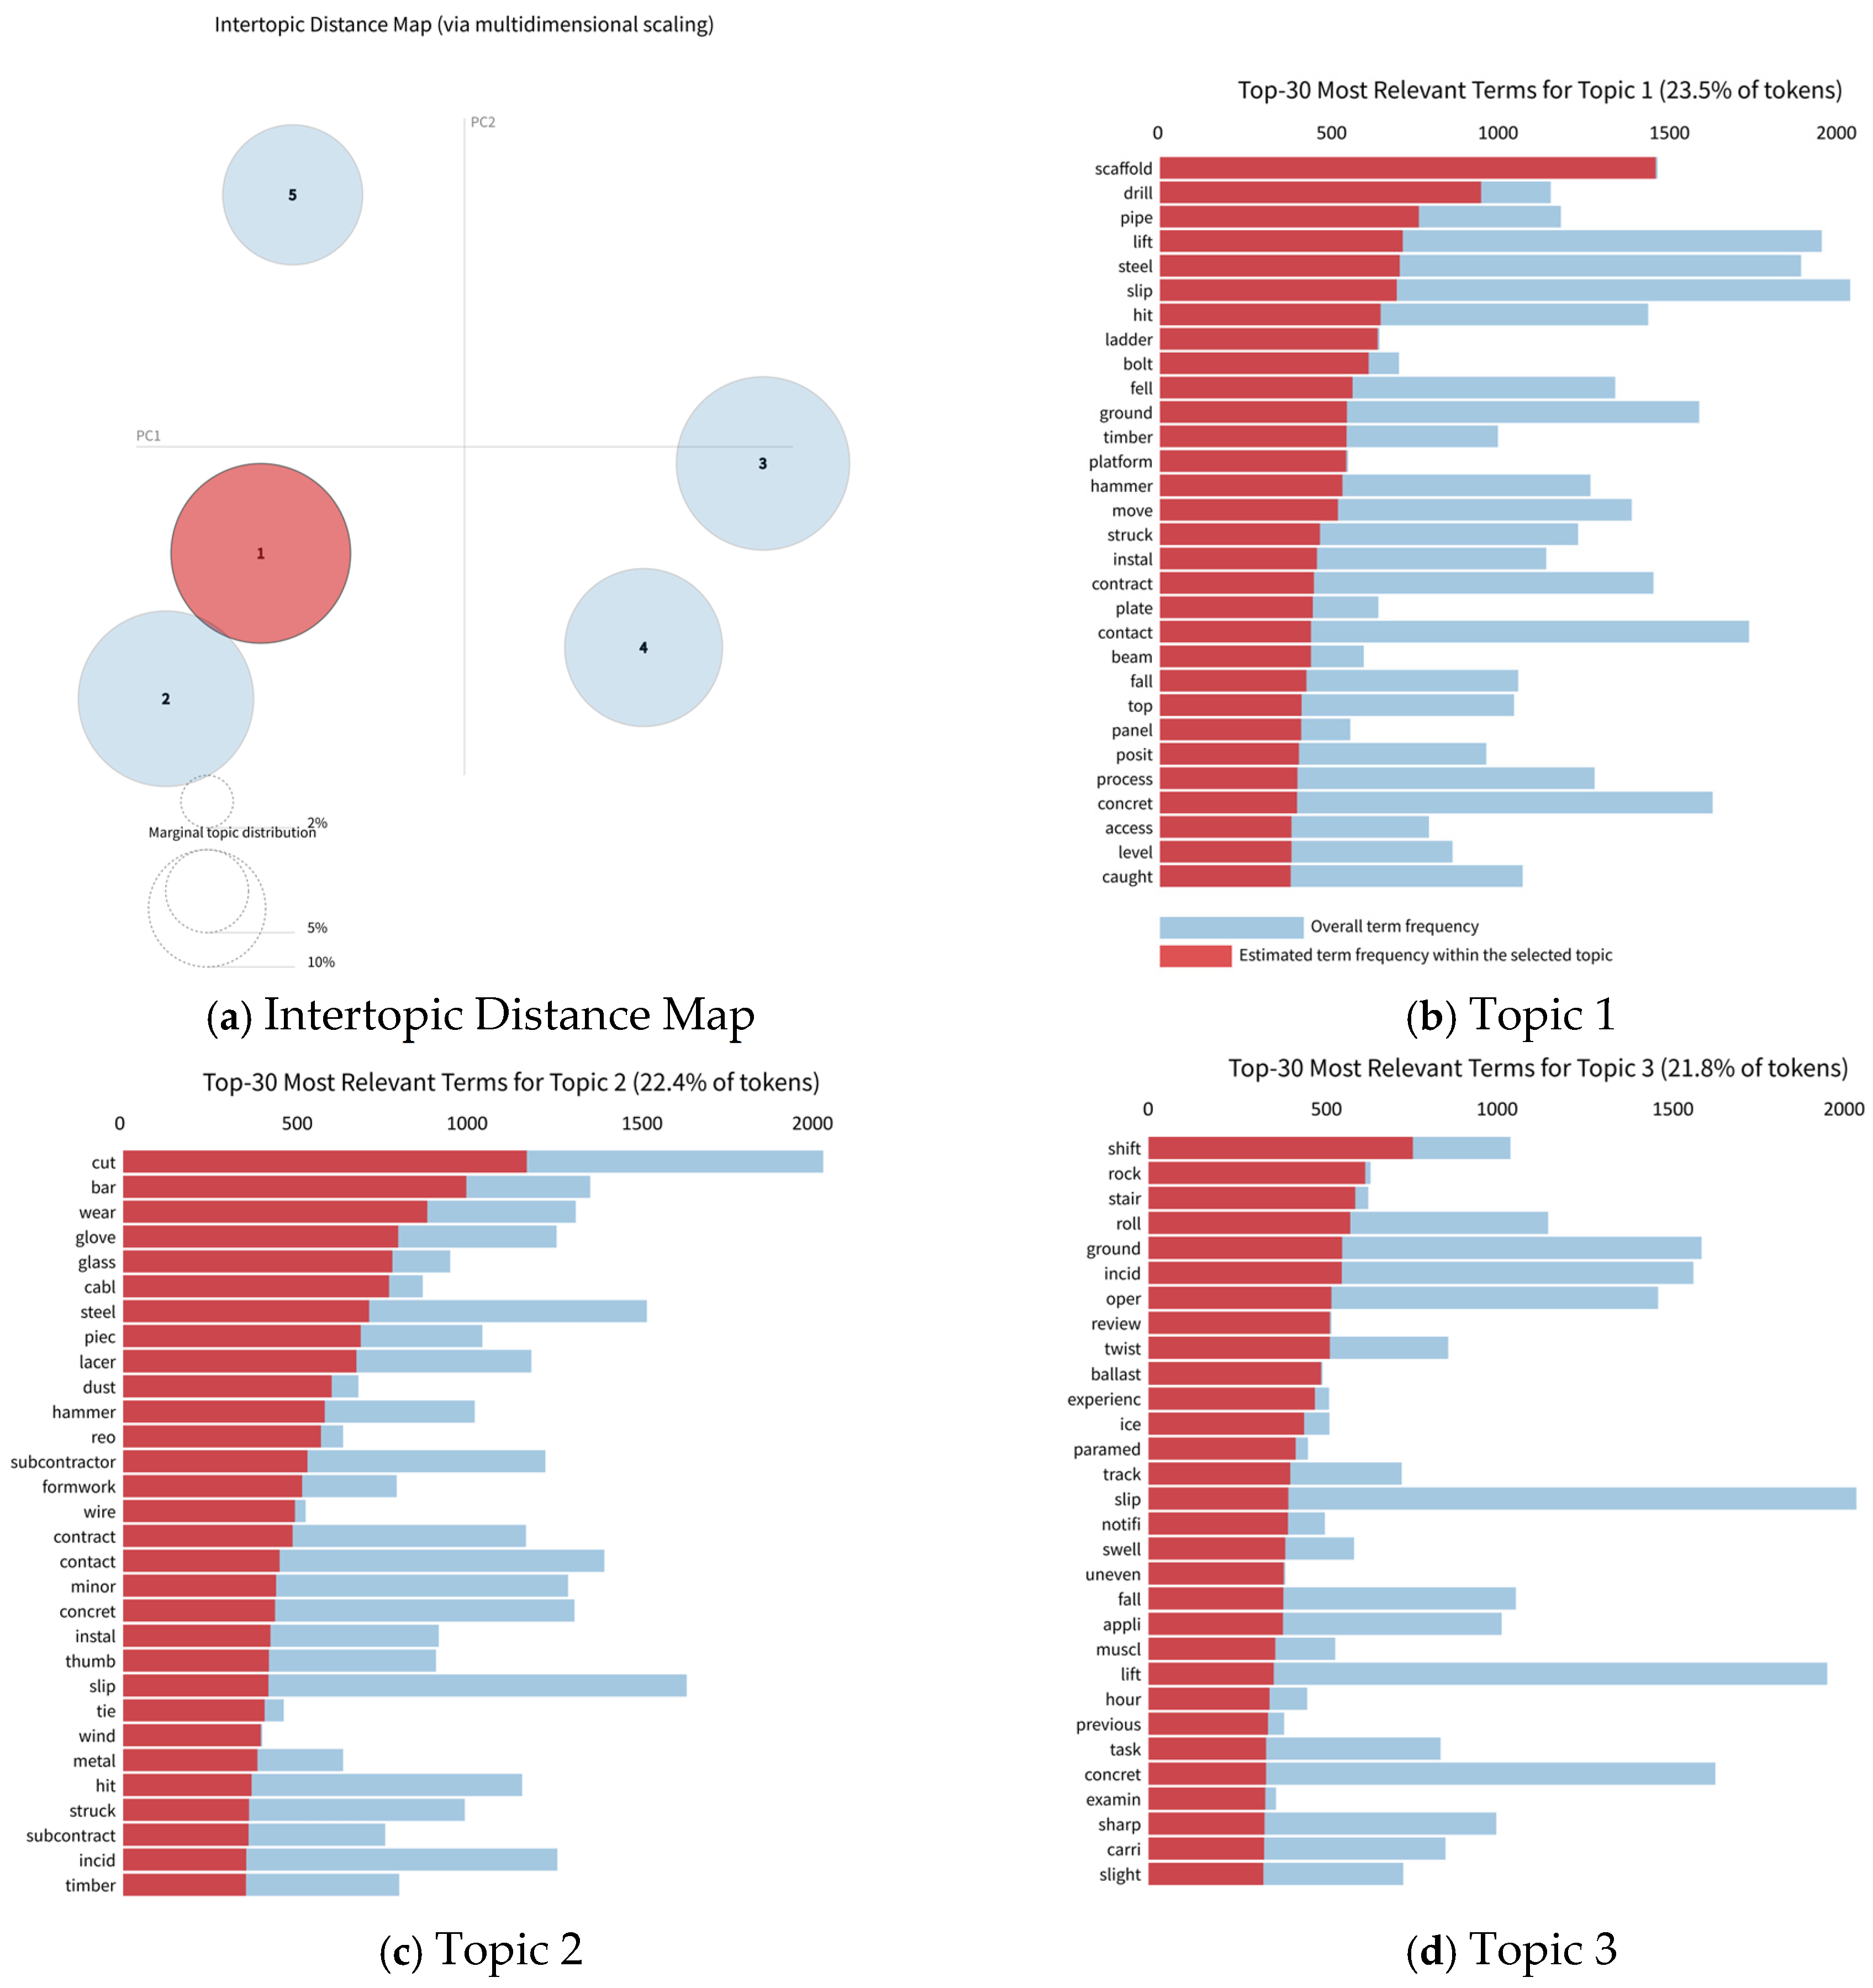
Table 2 lists the top-30 most relevant terms for each topic, along with their proportions and the number of reports per topic. The terms within each topic show high semantic coherence, as they are closely related to the accident type. For example, Topic 1 includes terms like ‘scaffold’, ‘ladder’, and ‘fall’, which are all associated with falls from height. The low overlap between topics’ terms further confirms the model’s ability to capture distinct accident patterns.
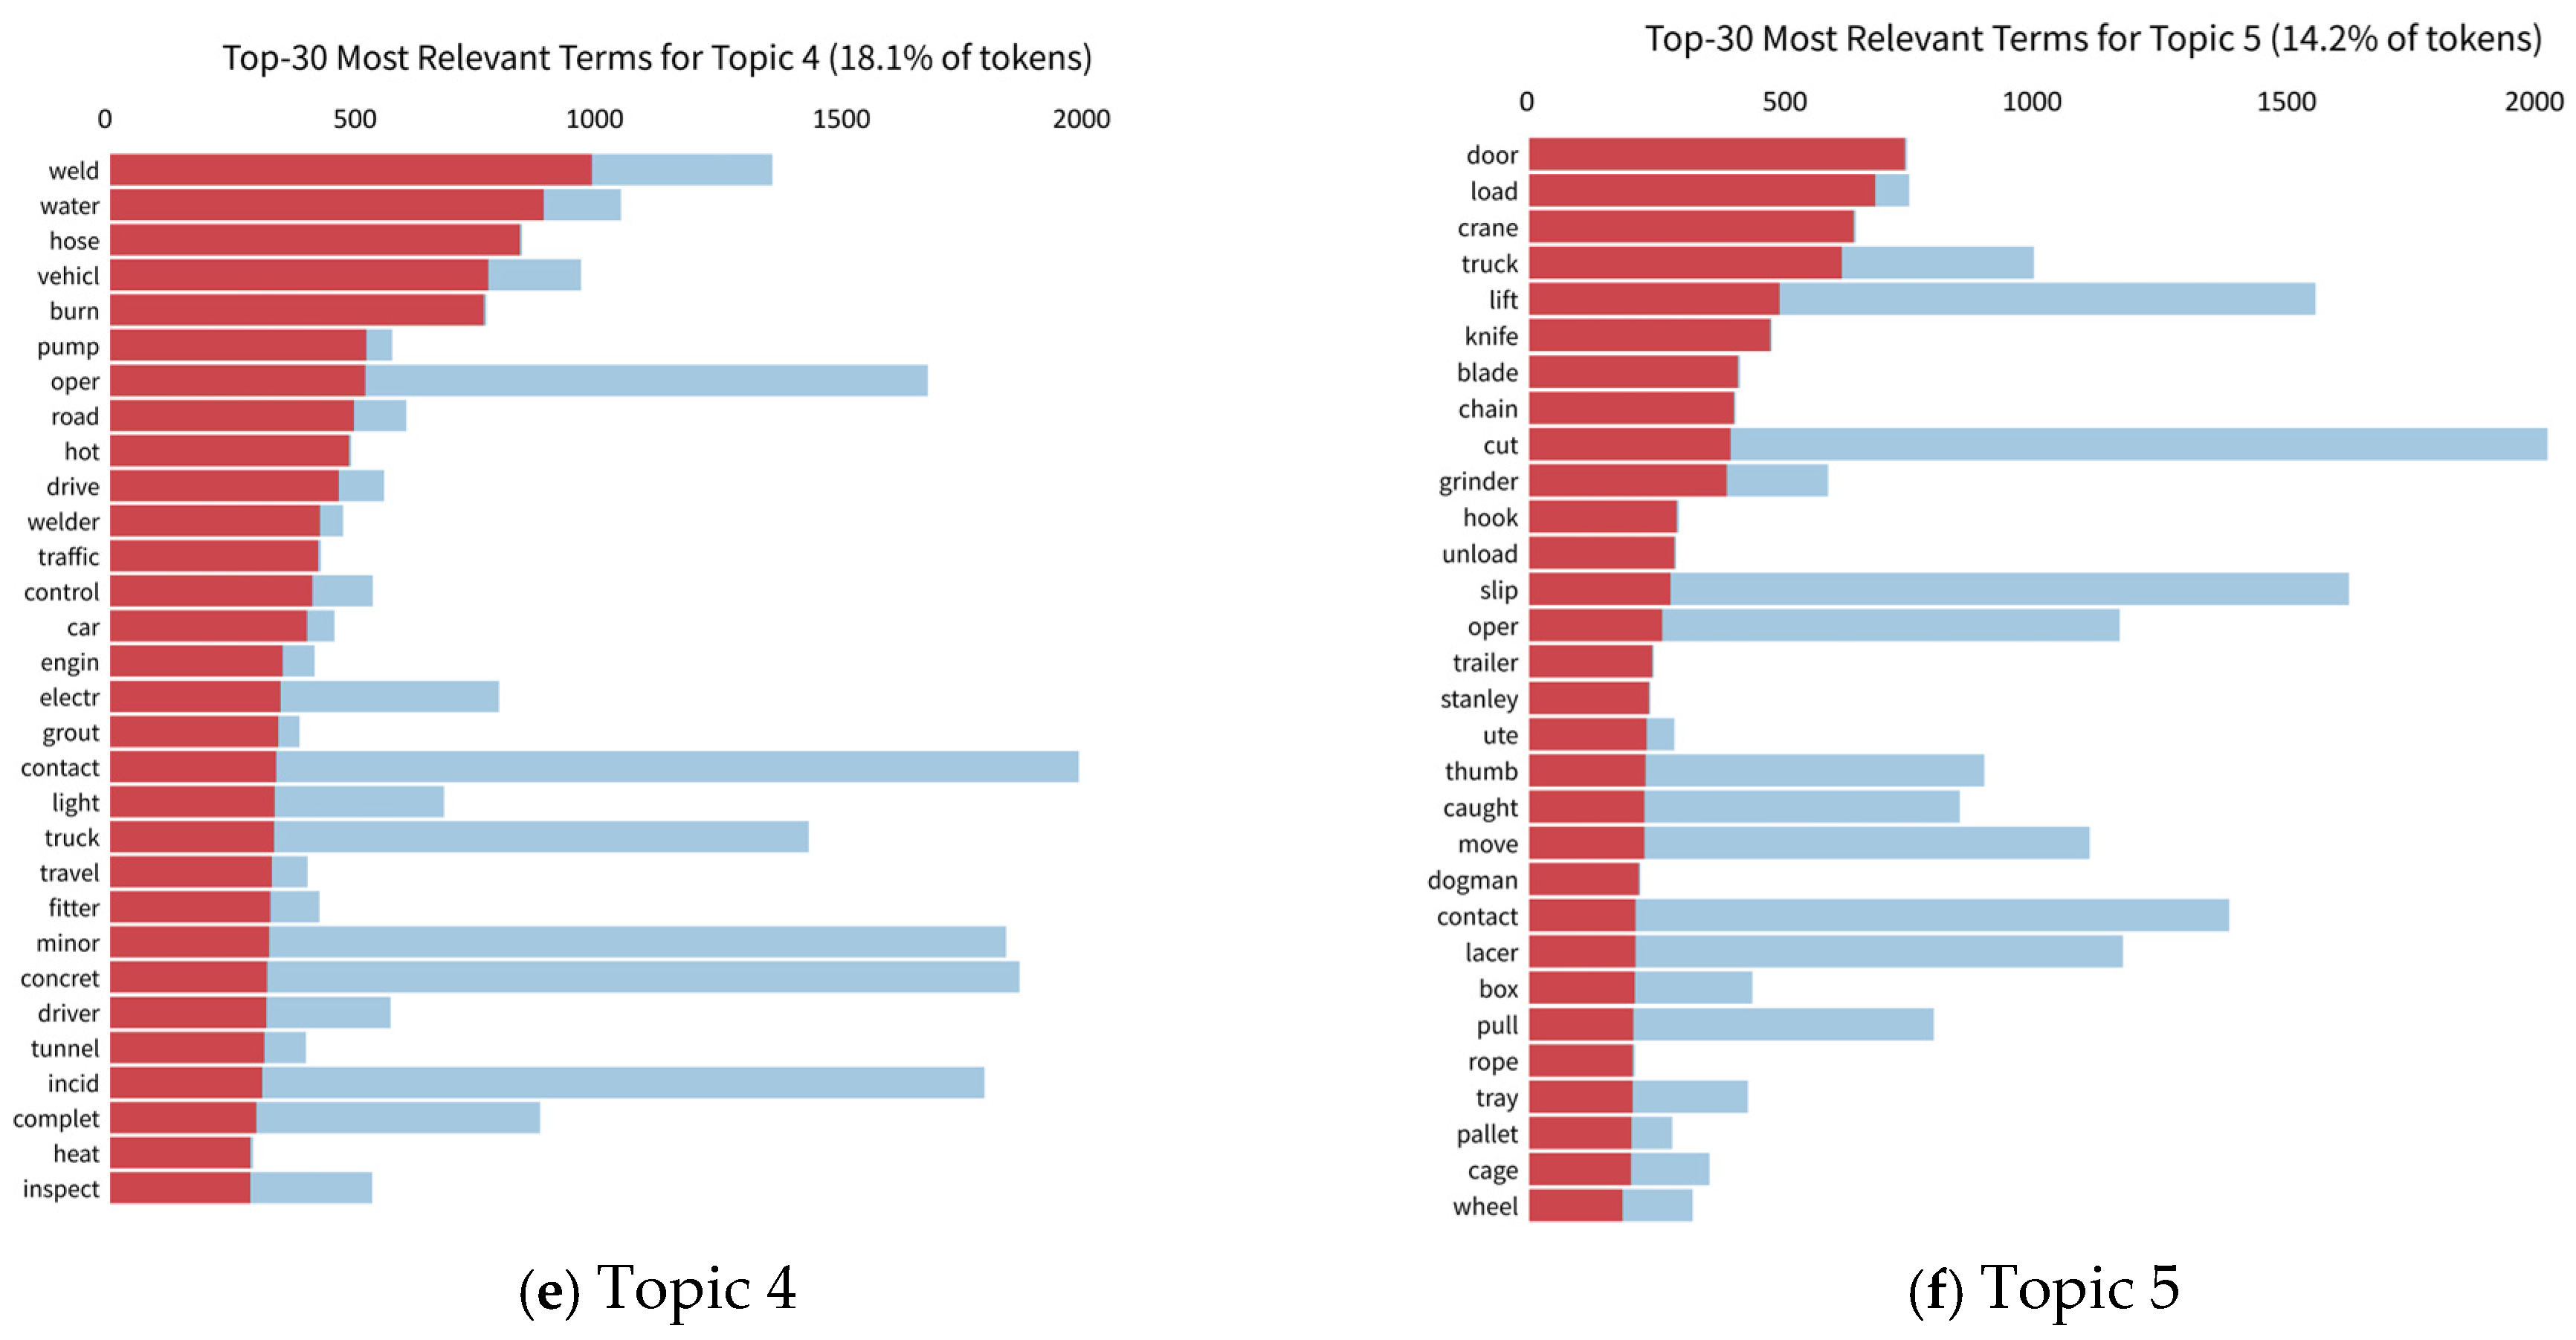
To further enhance the interpretability of the identified topics and provide a comprehensive visualization of the LDA model output, we employed the pyLDAvis library to generate an interactive topic visualization. Figure 4 presents the pyLDAvis output, which offers two complementary perspectives on the five-topic model. Figure 4 visualizes the intertopic distance map for the five-topic LDA model. In Figure 4a, each circle represents a topic, and the distance between circles reflects the semantic dissimilarity between topics. The lack of overlap indicates that the topics are well-separated and distinct, which is desirable for interpretability. The right panel provides detailed term analysis for individual topics. When selecting a specific topic, this panel shows the top-30 most relevant terms with two important metrics: (1) the overall term frequency within the corpus (blue bars), and (2) the term frequency within the selected topic (red bars).

3.4. Analysis of Characteristics of Construction Accidents

To interpret the LDA topics, the top keywords for each topic were analyzed and mapped to construction safety knowledge. This process involved collaboration with domain experts to ensure accurate classification. The following descriptions explain how each topic’s keywords correspond to specific accident types:
Topic 1 is predominantly associated with accidents occurring during working at height. The frequent occurrence of terms such as “scaffold”, “ladder”, and “fall” indicates that a significant portion of the accidents involve falling or slipping from heights, striking against objects, and issues related to the stability of scaffolding and ladders. The inclusion of terms like “beam”, “platform”, and “install” suggests that these incidents often occur during the installation or maintenance of structural components. Based on the above, Topic 1 can be named as “Falls from Height”.
Topic 2 centers around injuries that occur due to cutting, welding, and contact with sharp or abrasive materials. Keywords such as “cut”, “laceration”, “glove”, and “glass” point towards common injuries like cuts and abrasions. The presence of terms related to protective equipment and materials indicates that these injuries frequently happen during handling or processing of construction materials. Based on the above, Topic 2 can be named as “Struck-by and Contact Injuries”.
Topic 3 includes accidents that occur at ground level, involving operational errors and slips. Terms like “ground”, “slip”, “uneven”, and “fall” suggest incidents due to uneven surfaces or tripping hazards. The frequent mention of “muscle”, “twist”, and “lift” implies a high incidence of musculoskeletal injuries, often resulting from improper lifting or falls. Based on the above, Topic 3 can be named as “Slips, Trips, and Falls”.
Topic 4 focuses on accidents related to welding and other hot work. Terms such as “weld”, “burn”, “hot”, and “welder” highlight common hazards associated with welding operations, including burns and fires. The occurrence of “vehicle”, “road”, and “traffic” indicates that these accidents can also involve vehicles, either stationary or moving, in the vicinity of welding operations. Based on the above, Topic 4 can be named as “Hot Work & Vehicle Hazards.” Topic 4 appears to combine two potential sub-topics: hot work hazards and vehicle-related risks. There are several factors justify maintaining this combined topic: (1) In construction sites, hot work operations frequently occur in proximity to vehicle traffic areas, creating combined risk scenarios; (2) The LDA model naturally grouped these terms together, indicating their statistical association in the corpus; (3) From a safety management perspective, both hazard types share common control measures related to area segregation and personal protective equipment. While finer-grained separation is possible with more topics, the k = 5 configuration provides the optimal balance between granularity and interpretability for practical safety applications.
Topic 5 primarily deals with accidents involving lifting and hoisting operations. Key terms like “crane”, “truck”, “lift”, and “unload” suggest that many of these incidents occur during the movement of heavy materials. The inclusion of “knife”, “blade”, and “cut” points to the use of cutting tools in conjunction with lifting operations, leading to lacerations and other injuries. Based on the above, Topic 5 can be named as “Lifting and Machinery Accidents”.
This research identified five main classifications of accidents using the LDA model: “Falls from Height”, “Struck-by and Contact Injuries”, “Slips, Trips, and Falls”, “Hot Work & Vehicle Hazards”, And “Lifting and Machinery Accidents”. Each topic is composed of a set of highly related terms, indicating that the LDA model is effective in extracting latent topics and revealing accident types. The topic distribution reflects the proportion of each type of accident in the entire dataset. “Falls from Height” (23.5%) and “Struck-by and Contact Injuries” (22.4%) occupy a large proportion, indicating that these types of accidents are relatively common in construction. “Slips, Trips, and Falls” (21.8%), “Hot Work & Vehicle Hazards” (18.1%), and “Lifting and Machinery Accidents” (14.2%) also account for a certain proportion, showing the hazards present in different types of operations.
To ground these topic interpretations in the actual textual data, Table 3 provides anonymized exemplar snippets from reports that were assigned with high probability to each topic. These real-world examples demonstrate how the keyword patterns identified by LDA manifest in actual accident narratives.

3.5. Analysis of Major Causes of the Accidents

To move from topic identification to causal analysis, a structured, evidence-based procedure was employed. This process combined automated topic modeling with a systematic expert judgment protocol to ensure both scalability and domain validity. The top keywords for each LDA topic were interpreted as causal indicators. The prevalence of each cause was quantified by calculating the number of reports within a topic that contained its representative keywords. This frequency provides tangible, reproducible evidence. Furthermore, the analysis is grounded in existing literature to contextualize these data-driven findings within academic discourse [7,11,38].
The assignment of causes to the five topics followed a structured expert coding protocol conducted by a single domain expert with over 30 years of experience in construction safety. The protocol was as follows:
  • Input Preparation: The expert was provided with two key inputs for each of the five LDA topics:
    (1)
    The top-30 most relevant keywords (from Table 2).
    (2)
    The interpretative topic name (from Section 3.4).
  • Coding Framework: The expert was instructed to map the keywords to causal factors within the predefined 4M1E (Man, Machine, Material, Method, Environments) framework. Clear definitions for each category were provided. Method encompasses management and procedural factors like training, planning, and supervision.
  • Systematic Coding Process: For each topic, the expert:
    (1)
    Identified Causal Indicators: Reviewed the keyword list to identify terms that served as indicators for potential 4M1E causes. For example, in Topic 1, scaffold, ladder >Machine; fall > Man/Environment; the prevalence of such incidents > Method: Inadequate planning/training.
    (2)
    Assigned Causes: Based on the semantic meaning and contextual interpretation of these keyword clusters, the expert assigned all relevant 4M1E causes to the topic.
    (3)
    Documented Rationale: The expert documented the primary keywords justifying each cause assignment.
This structured protocol ensures transparency and replicability by clearly outlining the rules and evidence base for each decision.
The results, synthesized in Table 4, deliver an evidence-based narrative: while environmental and human factors are frequent direct triggers, deficiencies in the “Method” dimension are quantitatively demonstrated to be the most pervasive root cause. Table 4 includes:
(1)
The specific causes identified for each topic.
(2)
Representative Keywords that formed the basis for the expert’s judgment.
(3)
The Frequency of Reports in each topic containing at least one of the representative keywords for a given cause. This frequency serves as a robust, data-driven indicator of the pervasiveness of each causal factor.
The frequency data in Table 4, when interpreted alongside existing research, allows for conclusive insights:
The Primacy of Management System (Method) Failures: The causes “Inadequate Training” and “Poor Task Planning” exhibit remarkably high frequencies (75% in Falls from Height, 77.9% in Lifting & Machinery Accidents). This quantitative evidence solidifies their role as the fundamental root causes. This finding aligns with and extends the work of [38], who emphasized the role of management deficiencies in accident causation, and [42], who linked inadequate training directly to unsafe acts.
Environment as the Key Catalyst: “Unsafe Ground/Surfaces” is the most frequent direct cause in Slips, Trips, and Falls (82.9%). This data challenges the “human factor dominance” view [11,41] and underscores that controlling the physical environment is a critical line of defense, a factor whose significance is sometimes underemphasized in traditional analyses [3].
A Systemic View of Causation: The evidence supports a model where Method (root causes) enables Environmental and Machine hazards, which in turn lead to Man errors. For instance, the high frequency of “Incorrect Tool Use” (77.5% in Struck-by injuries) can be seen as a symptom of the root cause “Inadequate Training”. This systemic perspective is consistent with construction safety research, which traces the origins of accidents to latent organizational failures [7,38]. Data provides large-scale empirical support for this theory in the construction context.

4. Results and Discussion

4.1. Accident Classification by Results of Topic Modeling

This research successfully applied the LDA topic model to analyses 17,710 construction accident reports. It identified five core accident topics: Falls from Height (23.5%), Struck-by and Contact Injuries (22.4%), Slips, Trips, and Falls (21.8%), Hot Work & Vehicle Hazards (18.1%), Lifting and Machinery Accidents (14.2%).
These five topics cover construction’s most common and critical accident types. The balanced proportions of topics show safety hazards are multi-faceted, not concentrated in one type. Figure 2 shows the topics are well-separated in semantic space with minimal overlap. Table 2 confirms highly cohesive keywords within each topic and low overlap between topics. This proves LDA captured distinct latent topic structures in the reports. It ensures the results are interpretable and reliable. Each topic’s top keywords map directly to expertise and industry terms. This demonstrates LDA’s strong knowledge traceability for construction accident reports analysis.
The classification quantifies accident frequency by types. Falls from Height and Struck-by and Contact Injuries have the highest proportions. This highlights them as priority hazard for safety management. It can provide a data-driven basis for safety resource allocation.

4.2. Accident Causal Factors Classifications

Based on topic keywords and domain knowledge, this research categorized the root causes of accidents into five dimensions (Table 4): Man, Machine, Material, Method, and Environment. This reveals how key factors operate. Analysis shows the Environment dimension involved the most factors and had the widest impact. Environmental conditions like strong winds, slippery uneven ground, poor ventilation, presence of flammables, and work area obstructions directly or indirectly increased risks across nearly all accident types. This highlights environment’s core role in causing accidents. It underscores that construction sites’ dynamic, complex, and uncontrollable outdoor environments are major contributors.
The Man dimension involved 5 factors: neglecting safety rules, inattention, incorrect tool use, Insufficient or inappropriate PPE, and poor communication. Unsafe acts are direct triggers of accidents. Lack of protection worsens accident outcomes. Communication failures are especially critical in coordinated tasks like lifting.
The Method dimension listed 2 factors: poor task planning and inadequate training. However, their impact is profound. Poor task planning causes disorganized work areas, inefficient processes, and missing safety assessments. This creates hidden dangers. Inadequate training directly leads to workers lacking safety knowledge, weak risk awareness, poor skills, and bad emergency response. It is the root cause of unsafe acts within the Man dimension.
This above analysis reveals environment factors’ prominence in construction accident causation. Method factors often create conditions for environmental hazards and human errors, representing management gaps. Machine failures and material hazards are direct physical causes.

4.3. Comparison with Other Research

This research concludes that “environmental factors are the primary triggers, while management failures reflected in the Method dimension are the root cause”. This differs from many traditional studies emphasizing “human factors (Man) as dominant” [11,41,42]. Sarkar and Maiti [40] conducted a science mapping review of the literature and found that human error is often cited as the main cause. Similarly, Luo et al. [41] used convolutional neural networks to analyze accident reports and highlighted human factors. However, text mining approach in this research reveals the underlying environmental and management factors, which are less visible in structured data analysis. This alignment with recent studies that emphasize systemic factors, such as Gadekar and Bugalia [10] who used semi-supervised LDA, supports findings of this research.
This research uses unsupervised LDA topic modeling on large-scale, unstructured accident reports. These reports describe not only the immediate event, but also background conditions. LDA effectively captures these recurring contextual factors. It reveals their importance as underlying conditions. Text mining uncovers deep, indirect causes often missed or merged in traditional statistical analysis.
This research does not deny human factors’ importance, which is still the second-largest trigger category found in this research. It offers a broader view. Hazardous environments greatly increase worker error likelihood or consequence severity. For example, inattention on a flat, dry, well-lit surface may be harmless. The same inattention on a dark, slippery surface can cause a severe accident.
Management as the root cause, “Inadequate training” and “poor task planning” represent management system failures. Unsafe worker acts and environmental hazards largely stem from inadequate management controls. Blaming accidents mainly on human errors masking management’s fundamental responsibility for accident prevention. Text mining here clearly traces defects back to the management level.
The conclusions are not contradictory but complementary. Traditional studies accurately identify the “direct trigger”. This research reveals the fundamental conditions enabling these triggers by text mining. It stresses the critical importance of environmental control and systematic management for accident prevention in complex construction settings. This provides a richer explanation for “why errors occur” and “why environments become hazardous”.
This research’s LDA-based text mining methods excel at capturing environmental context and management system descriptions within reports. This led to the conclusion emphasizing environmental factors and management as the root causes. It provides a supplement and contextual interpretation to the “human factor dominance” theory.

4.4. Practical Significance

The findings of this research offer practical insights for construction accident control with significant practical application value. Firstly, the quantified accident topic distributions provide a data-driven basis for resource allocation. For instance, training programs can be tailored to address high-risk areas like falls from height (23.5%) and struck-by injuries (22.4%). Secondly, the identification of environmental and management root causes suggests that interventions should focus on improving site conditions and strengthening management systems. For example, regular site inspections can target uneven surfaces, obstructions, and poor ventilation, while management should enhance task planning and training protocols.
Moreover, the findings emphasize the need for a paradigm shift from blaming human errors to addressing systemic issues. Construction companies should adopt a holistic approach that combines environmental control and equipment maintenance to reduce accidents effectively.

4.5. Limitations

This research has several limitations. First, the use of proprietary data from select global companies may introduce selection bias, and the filtering of reports by length, while necessary for data quality, could have excluded relevant cases. Second, the LDA model, while effective, is based on a bag-of-words assumption that ignores word order and deeper semantic relationships. Third, the mapping from topics to root causes, though structured and expert-validated, inherently involves interpretation. Finally, due to data confidentiality agreements, the original reports and analysis code cannot be made publicly available, which might limit the full reproducibility of the research.

5. Conclusions

This research applied the LDA topic model to analyze 17,710 construction accident reports, successfully identifying and quantifying five primary accident types: Falls from Height (23.5%), Struck-by and Contact Injuries (22.4%), Slips, Trips, and Falls (21.8%), Hot Work & Vehicle Hazards (18.1%), and Lifting and Machinery Accidents (14.2%). The analysis, grounded in a hybrid methodology that combined quantitative keyword frequency analysis with expert validation, revealed that environmental factors were the most prevalent direct causes, while deficiencies in the “Method” dimension (e.g., inadequate training and poor task planning) were identified as the most pervasive root causes, indicative of underlying management system failures.
The main theoretical contributions of this research are threefold. First, it demonstrates the efficacy of LDA topic modeling as a powerful tool for extracting interpretable and actionable knowledge from large-scale, unstructured textual accident dataset, aligning with the growing interest in data-driven safety management in the construction sector [37]. Second, it provides large-scale, empirical evidence that challenges the traditional dogma of “human factor dominance” by systematically quantifying the critical roles of environmental and managerial root causes. Third, it presents a transparent, data-driven protocol for transitioning from topic identification to causal analysis, moving from assertion to evidence.
Based on the findings, the following practical recommendations are proposed to reverse the current situation and proactively enhance construction safety:
(1)
Prioritize Environmental Control: Safety management protocols and site inspections should be systematically strengthened to identify and mitigate environmental hazards. Particular attention should be paid to maintaining even and dry working surfaces, ensuring clear access routes free of obstructions, and controlling exposure to extreme weather and poor ventilation. This focus is crucial, as the physical work environment is a primary, though often less emphasized, catalyst for accidents [38]. A deeper understanding of site-specific hazards can be achieved by considering the construction typology, as different structural types present unique hazard profiles [43].
(2)
Strengthen Management Systems: Construction companies should critically review and enhance their management practices, with a specific focus on implementing more effective and regular safety training programs that are tailored to the specific hazards identified. They should enforce rigorous task planning and risk assessment procedures before the commencement of work, especially for high-risk activities like lifting operations and hot work. Psychosocial health hazards should be proactively managed through holistic hazard management interventions. This expands the traditional concept of safety to include worker well-being, which is crucial for sustainable accident prevention [44].
(3)
Leverage Data-Driven Monitoring: It is recommended that organizations integrate text mining models, such as the LDA framework demonstrated here, into their safety reporting systems. This enables the automated, real-time classification of new incident and near-miss reports, facilitating proactive risk identification and timely intervention.
Future research should focus on integrating multi-dimensional data sources, such as environmental sensor data, weather conditions, and detailed worker biometrics, to achieve a more holistic and dynamic risk analysis framework. Furthermore, exploring the integration of more advanced NLP models with domain knowledge graphs could enhance the precision of root cause extraction.

Author Contributions

Conceptualization, P.X.W.Z.; Data curation, Y.W.; Funding acquisition, P.X.W.Z.; Investigation, Y.W. and P.X.W.Z.; Methodology, Y.W.; Project administration, P.X.W.Z.; Supervision, P.X.W.Z.; Validation, Y.W.; Visualization, Y.W.; Writing—original draft, Y.W.; Writing—review & editing, P.X.W.Z. All authors have read and agreed to the published version of the manuscript.

Funding

This research is supported by the National Natural Science Foundation of China (72371036), and Fundamental Research Funds for the Central Universities of Chang’an University (300102234302).

Data Availability Statement

The data presented in this study are available on request from the corresponding author. The data are not publicly available due to the request of the data provider and privacy.

Conflicts of Interest

The authors declare no conflicts of interest. The funders had no role in the design of the study; in the collection, analyses, or interpretation of data; in the writing of the manuscript; or in the decision to publish the results.

Abbreviations

The following abbreviations are used in this manuscript:
LDALatent Dirichlet Allocation
BERTBidirectional Encoder Representations from Transformers
NLPNatural Language Processing
TF-IDFTerm Frequency-Inverse Document Frequency

References

  1. Xu, X.; Zou, P.X.W. Discovery of new safety knowledge from mining large injury dataset in construction. Saf. Sci. 2021, 144, 105481. [Google Scholar] [CrossRef]
  2. Guo, B.H.; Zou, Y.; Fang, Y.; Goh, Y.M.; Zou, P.X.W. Computer vision technologies for safety science and management in construction: A critical review and future research directions. Saf. Sci. 2021, 135, 105130. [Google Scholar] [CrossRef]
  3. Alkaissy, M.; Arashpour, M.; Golafshani, E.M.; Hosseini, M.R.; Khanmohammadi, S.; Bai, Y.; Feng, H. Enhancing construction safety: Machine learning-based classification of injury types. Saf. Sci. 2023, 162, 106102. [Google Scholar] [CrossRef]
  4. Alsharef, A.; Albert, A.; Awolusi, I.; Jaselskis, E. Severe injuries among construction workers: Insights from OSHA’s new severe injury reporting program. Saf. Sci. 2023, 163, 106126. [Google Scholar] [CrossRef]
  5. Baker, H.; Hallowell, M.R.; Tixier, A.J.-P. AI-based prediction of independent construction safety outcomes from universal attributes. Autom. Constr. 2020, 118, 103146. [Google Scholar] [CrossRef]
  6. Bugalia, N.; Tarani, V.; Kedia, J.; Gadekar, H. Machine learning-based automated classification of worker-reported safety reports in construction. J. Inf. Technol. Constr. 2022, 27, 926–950. [Google Scholar] [CrossRef]
  7. Chen, S.; Sun, M.; Chen, Y.; Nie, B.; Li, Z.; Liu, W. Causal analysis of construction safety accidents in hydropower projects based on unsupervised LDA. China Saf. Sci. J. (CSSJ) 2023, 33, 79–85. [Google Scholar] [CrossRef]
  8. Pan, X.; Zhong, B.; Sheng, D.; Yuan, X.; Wang, Y. Blockchain and deep learning technologies for construction equipment security information management. Autom. Constr. 2022, 136, 104186. [Google Scholar] [CrossRef]
  9. Lisboa, P.; Saralajew, S.; Vellido, A.; Fernández-Domenech, R.; Villmann, T. The coming of age of interpretable and explainable machine learning models. Neurocomputing 2023, 535, 25–39. [Google Scholar] [CrossRef]
  10. Gadekar, H.; Bugalia, N. Automatic classification of construction safety reports using semi-supervised YAKE-Guided LDA approach. Adv. Eng. Inform. 2023, 56, 101929. [Google Scholar] [CrossRef]
  11. Do, Q.; Le, T.; Le, C. Uncovering Critical Causes of Highway Work Zone Accidents Using Unsupervised Machine Learning and Social Network Analysis. J. Constr. Eng. Manag. 2024, 150, 04023168. [Google Scholar] [CrossRef]
  12. Feng, D.; Chen, H. A small samples training framework for deep Learning-based automatic information extraction: Case study of construction accident news reports analysis. Adv. Eng. Informatics 2021, 47, 101256. [Google Scholar] [CrossRef]
  13. Galassi, A.; Lippi, M.; Torroni, P. Attention in Natural Language Processing. IEEE Trans. Neural Networks Learn. Syst. 2021, 32, 4291–4308. [Google Scholar] [CrossRef] [PubMed]
  14. Kang, K.S.; Koo, C.; Ryu, H.G. An interpretable machine learning approach for evaluating the feature importance affecting lost workdays at construction sites. J. Build. Eng. 2022, 53, 104534. [Google Scholar] [CrossRef]
  15. Kim, J.; Lee, G.; Lee, S.; Lee, C. Towards expert–machine collaborations for technology valuation: An interpretable machine learning approach. Technol. Forecast. Soc. Chang. 2022, 183, 121940. [Google Scholar] [CrossRef]
  16. Li, X.; Zhu, R.; Ye, H.; Jiang, C.; Benslimane, A. MetaInjury: Meta-learning framework for reusing the risk knowledge of different construction accidents. Saf. Sci. 2021, 140, 105315. [Google Scholar] [CrossRef]
  17. Martínez-Rojas, M.; Antolín, R.M.; Salguero-Caparrós, F.; Rubio-Romero, J.C. Management of construction Safety and Health Plans based on automated content analysis. Autom. Constr. 2020, 120, 103362. [Google Scholar] [CrossRef]
  18. Liao, C.W.; Chiang, T.L. Occupational injuries among non-standard workers in the Taiwan construction industry. J. Saf. Res. 2022, 82, 301–313. [Google Scholar] [CrossRef]
  19. Qiao, J.; Wang, C.; Guan, S.; Shuran, L. Construction-Accident Narrative Classification Using Shallow and Deep Learning. J. Constr. Eng. Manag. 2022, 148, 04022088. [Google Scholar] [CrossRef]
  20. Shin, J.; Joung, J.; Lim, C. Determining directions of service quality management using online review mining with interpretable machine learning. Int. J. Hosp. Manag. 2024, 118, 103684. [Google Scholar] [CrossRef]
  21. You, K.; Zhou, C.; Ding, L. Deep learning technology for construction machinery and robotics. Autom. Constr. 2023, 150, 104852. [Google Scholar] [CrossRef]
  22. Liu, J.; Luo, H.; Liu, H. Deep learning-based data analytics for safety in construction. Autom. Constr. 2022, 140, 104302. [Google Scholar] [CrossRef]
  23. Suvorova, A. Interpretable Machine Learning in Social Sciences: Use Cases and Limitations. In Digital Transformation and Global Society; Springer: Cham, Switzerland, 2021. [Google Scholar] [CrossRef]
  24. Zhang, Z.; Li, Y.; Yang, S.; Zhang, Z.; Lei, Y. Code-aware fault localization with pre-training and interpretable machine learning. Expert Syst. Appl. 2024, 238, 121689. [Google Scholar] [CrossRef]
  25. Luo, X.; Li, X.; Goh, Y.M.; Song, X.; Liu, Q. Application of machine learning technology for occupational accident severity prediction in the case of construction collapse accidents. Saf. Sci. 2023, 163, 106138. [Google Scholar] [CrossRef]
  26. Farea, A.; Tripathi, S.; Glazko, G.; Emmert-Streib, F. Investigating the optimal number of topics by advanced text-mining techniques: Sustainable energy research. Eng. Appl. Artif. Intell. 2024, 136, 108877. [Google Scholar] [CrossRef]
  27. Wu, W.; Wen, C.; Yuan, Q.; Chen, Q.; Cao, Y. Construction and application of knowledge graph for construction accidents based on deep learning. Eng. Constr. Arch. Manag. 2025, 32, 1097–1121. [Google Scholar] [CrossRef]
  28. Cao, K.; Chen, S.; Yang, C.; Li, Z.; Luo, L.; Ren, Z. Revealing the coupled evolution process of construction risks in mega hydropower engineering through textual semantics. Adv. Eng. Inform. 2024, 62, 102713. [Google Scholar] [CrossRef]
  29. Zepeda-Martínez, D.; Guzman-Ponce, A.; Valdovinos-Rosas, R.M.; Delgado-Hernández, D.J. Pattern Recognition in Road Safety: Uncovering the Latent Causes of Accidents on Mexico’s Federal Highways. In Pattern Recognition; Springer: Cham, Switzerland, 2024. [Google Scholar] [CrossRef]
  30. Zhou, Y.; Liao, L.; Gao, Y.; Wang, R.; Huang, H. TopicBERT: A Topic-Enhanced Neural Language Model Fine-Tuned for Sentiment Classification. IEEE Trans. Neural Netw. Learn. Syst. 2023, 34, 380–393. [Google Scholar] [CrossRef]
  31. Maali, O.; Ko, C.-H.; Nguyen, P.H. Applications of existing and emerging construction safety technologies. Autom. Constr. 2024, 158, 105231. [Google Scholar] [CrossRef]
  32. Mostofi, F.; Toğan, V. Construction safety predictions with multi-head attention graph and sparse accident networks. Autom. Constr. 2023, 156, 105102. [Google Scholar] [CrossRef]
  33. Wu, Z.; Xie, P.; Zhang, J.; Zhan, B.; He, Q. Tracing the Trends of General Construction and Demolition Waste Research Using LDA Modeling Combined With Topic Intensity. Front. Public Health 2022, 10, 899705. [Google Scholar] [CrossRef]
  34. Wang, L. Research on the mining of ideological and political knowledge elements in college courses based on the combination of LDA model and Apriori algorithm. Appl. Math. Nonlinear Sci. 2022, 8, 2345–2356. [Google Scholar] [CrossRef]
  35. Sievert, C.; Shirley, K.E. LDAvis: A method for visualizing and interpreting topics. In Proceedings of the Workshop on Interactive Language Learning, Visualization, and Interfaces, Baltimore, MD, USA, 27 June 2014. [Google Scholar] [CrossRef]
  36. Jin, X.; Zhou, W.; Zhu, Q.; Wang, W.; Xu, G. Research on the analysis and application of technological supply and demand structure based on LDA and BERTopic models. Cogn. Robot. 2025, 5, 260–275. [Google Scholar] [CrossRef]
  37. Liu, Y.; Wang, J.; Tang, S.; Zhang, J.; Wan, J. Integrating Information Entropy and Latent Dirichlet Allocation Models for Analysis of Safety Accidents in the Construction Industry. Buildings 2023, 13, 1831. [Google Scholar] [CrossRef]
  38. Zhou, K.; Wang, J.; Ashuri, B.; Chen, J. Discovering the Research Topics on Construction Safety and Health Using Semi-Supervised Topic Modeling. Buildings 2023, 13, 1169. [Google Scholar] [CrossRef]
  39. Tian, D.; Li, M.; Ren, Q.; Zhang, X.; Han, S.; Shen, Y. Intelligent question answering method for construction safety hazard knowledge based on deep semantic mining. Autom. Constr. 2023, 145, 104670. [Google Scholar] [CrossRef]
  40. Sarkar, S.; Maiti, J. Machine learning in occupational accident analysis: A review using science mapping approach with citation network analysis. Saf. Sci. 2020, 131, 104900. [Google Scholar] [CrossRef]
  41. Luo, X.; Li, X.; Song, X.; Liu, Q. Convolutional Neural Network Algorithm–Based Novel Automatic Text Classification Framework for Construction Accident Reports. J. Constr. Eng. Manag. 2023, 149, 04023128. [Google Scholar] [CrossRef]
  42. Elvik, R. Risk factors as causes of accidents: Criterion of causality, logical structure of relationship to accidents and completeness of explanations. Accid. Anal. Prev. 2024, 197, 107469. [Google Scholar] [CrossRef]
  43. Suárez Muntaner, M.R.; González García, M.d.l.N.; Carpio de los Pinos, A.J. Correlation Between Construction Typology and Accident Rate—Case Study: Balearic Islands (Spain). Buildings 2025, 15, 3486. [Google Scholar] [CrossRef]
  44. Biggs, A.; Kellner, A.; Robertson, A.; Mason, J.; Townsend, K.; Page, S.J.; Thompson, N.; Loudoun, R. Managing Psychosocial Health Risks in the Australian Construction Industry: A Holistic Hazard Management Intervention. Buildings 2025, 15, 3475. [Google Scholar] [CrossRef]
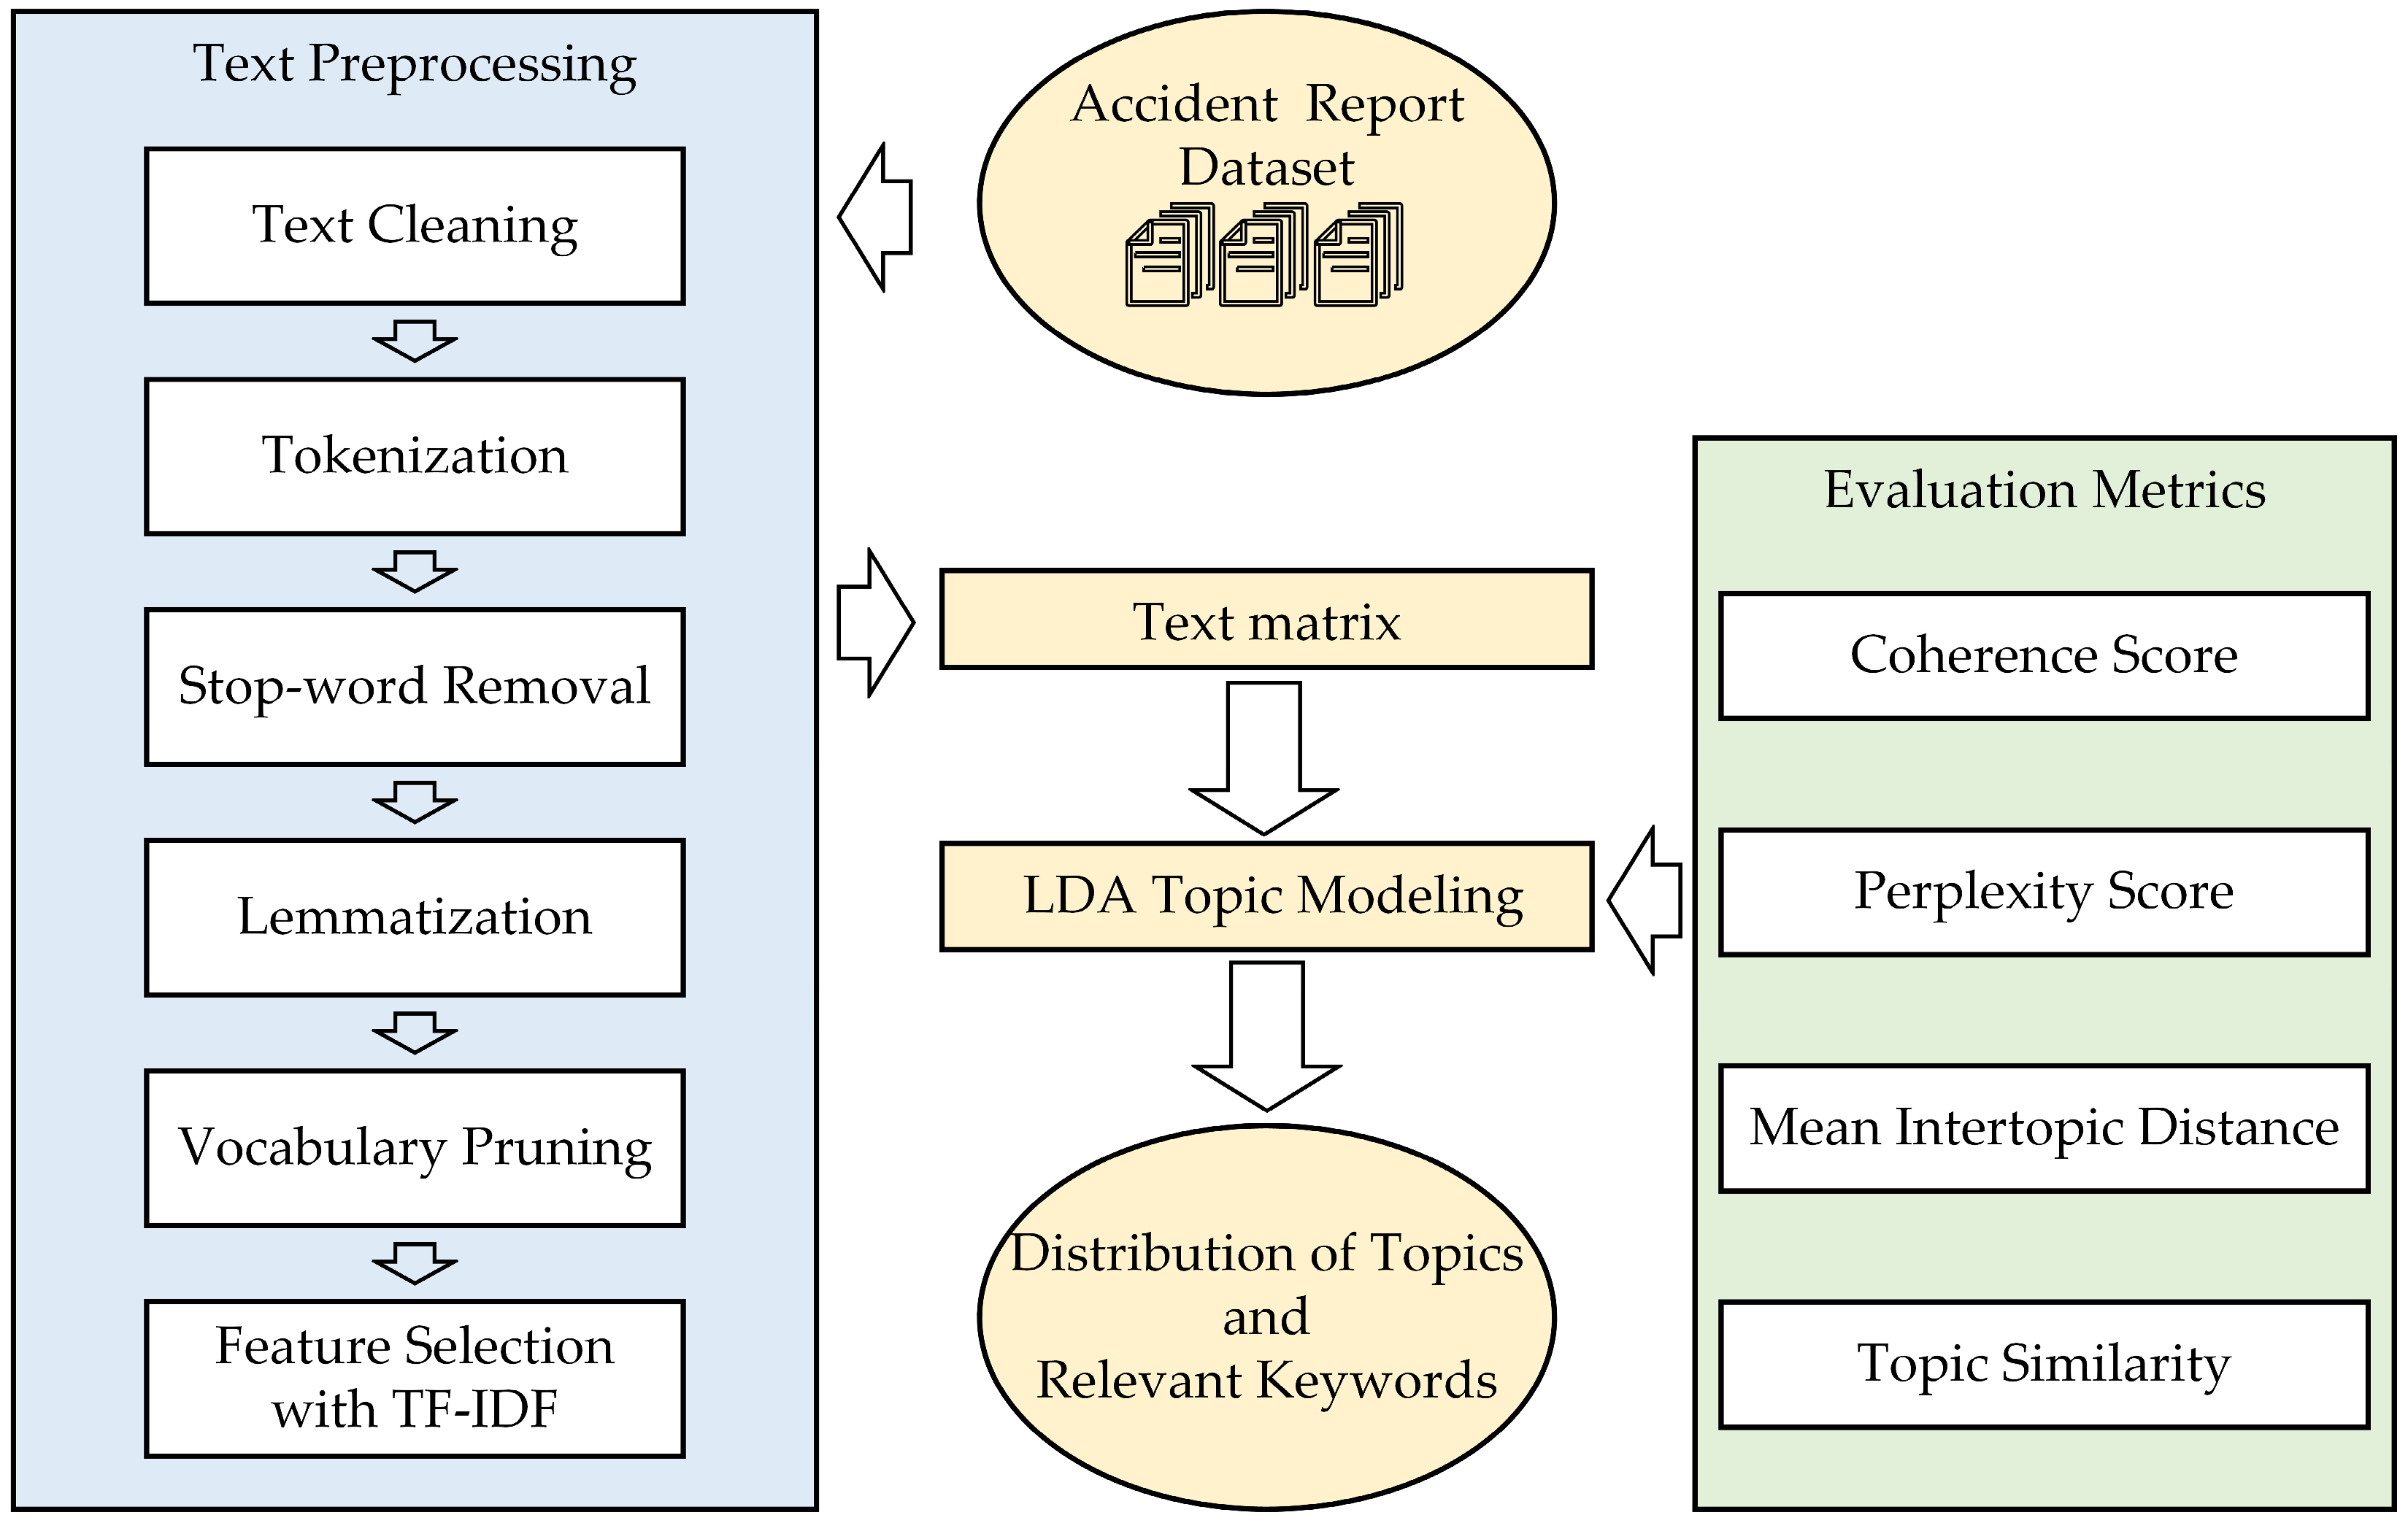
Figure 1. Methods used in this research.
Buildings 15 03859 g001
Figure 2. Evaluation Metrics of Different Topics Numbers.
Buildings 15 03859 g002
Figure 3. Evaluation Metrics of Different random_state (k = 5).
Buildings 15 03859 g003
Figure 4. Intertopic Distance Map with Top-30 Most Relevant Terms.
Buildings 15 03859 g004aBuildings 15 03859 g004b
Table 1. Metric Scores for Different Numbers of Topics.
Number of TopicsCoherence ScorePerplexity ScoreMean Intertopic Distance Topic Similarity
20.6391 873.6293 5.5552 0.5039
30.5984 1015.8064 4.4010 1.2283
40.6167 1282.8267 4.0516 1.4563
50.6186 1140.1378 5.3395 1.9337
60.6119 1364.5221 3.8384 3.5774
70.6214 1459.9610 3.7194 3.9868
80.6144 1551.6287 3.2641 5.0436
90.6168 1630.4531 3.7385 5.8385
100.5986 1731.4846 3.7452 6.7750
110.6055 1809.9245 3.9726 7.5319
120.6172 1905.0969 4.2061 7.7238
130.6166 1985.1457 4.5078 8.5683
140.6001 2053.0309 4.8993 8.1139
150.6014 2129.0086 5.1314 9.3624
160.6217 2186.7517 5.4654 8.3551
170.6072 2263.0824 5.7551 8.5070
180.6080 2345.2944 6.0608 9.5089
190.6137 2440.1065 6.3793 9.1289
200.6104 2511.4314 6.7178 9.4164
Table 2. Distribution of Topics and Relevant Keywords, and Report Counts.
TopicProportionNumber of ReportsTop-30 Most Relevant Terms (Words Are Presented in Their Root Form)
123.5%4162scaffold, drill, pipe, lift, steel, slip, hit, ladder, bolt, fell, ground, timber, platform, hammer, move, struck, instal, contract, plate, contact, beam, fall, top, panel, posit, process, concret, access, level, caught
222.4%3967cut, bar, wear, glove, glass, cabl, steel, piec, lacer, dust, hammer, reo, formwork, wire, contract, contact, minor, concret, instal, thumb, slip, tie, wind, metal, hit, struck, subcontract, incid, timber,
321.8%3861shift, rock, stair, roll, ground, incid, oper, review, twist, ballast, experienc, ice, paramed, track, slip, notifi, swell, uneven, fall, appli, muscl, lift, hour, previous, task, concret, examin, sharp, carri, slight,
418.1%3205weld, water, hose, vehicl, burn, pump, oper, road, hot, drive, welder, traffic, control, car, engin, electr, grout, contact, light, truck, travel, fitter, minor, concret, driver, tunnel, incid, complet, heat, inspect,
514.2%2515door, load, crane, truck, lift, knife, blade, chain, cut, grinder, hook, unload, slip, oper, trailer, stanley, thumb, caught, move, dogman, contact, lacer, box, pull, rope, tray, pallet, cage, wheel
Table 3. Exemplar Anonymized Report Snippets for Each Topic.
Topic NameExemplar Snippets (Anonymized)
1. Falls from HeightWorker was descending from scaffold platform when foot missed ladder rung, fell approximately 3 m to concrete ground level, sustaining back injuries.
Employee stepping backwards on formwork installation lost balance and fell through opening between beams, estimated 4 m drop to lower level.
While installing steel beams at height, worker slipped on wet surface and fell from edge protection, landing on material pile below.
2. Struck-by & Contact InjuriesWorker cutting rebar with grinder when cutting disc shattered, sending fragment that struck safety glasses and caused facial laceration.
Employee handling glass panels when sharp edge contacted bare hand through torn glove, resulting in deep cut requiring stitches.
While hammering formwork ties, metal chip flew off and struck worker’s forearm, causing contusion and minor bleeding.
3. Slips, Trips, & FallsWorker carrying materials down stairs slipped on wet patch, twisted ankle while trying to maintain balance, fell on concrete steps.
Employee walking across uneven ground surface tripped on loose rubble, fell forward and sustained wrist injury from impact.
Operator exiting machinery cab slipped on icy step, fell to ground level and suffered muscle strain in lower back.
4. Hot Work & Vehicles HazardsWelder performing overhead welding when hot slag fell inside collar, causing burn to neck and shoulder area.
Vehicle reversing in work area struck pump hose, causing pressurized hot water release that burned nearby worker’s legs.
Grout pump operator contacted live electrical cable while positioning equipment near traffic route, received electrical shock.
5. Lifting & Machinery AccidentsCrane operator lifting precast panel when load shifted unexpectedly, causing chain to snap and strike ground crew member.
Worker using angle grinder to cut metal door frame when blade binding occurred, tool kicked back and lacerated operator’s thumb.
During unloading of truck, pallet shifted on forklift tines and fell, crushing worker’s foot against loading dock edge.
Table 4. Quantified Major Causes of Construction Accidents.
TopicCategoryCauseRepresentative KeywordsReports with Keyword(s) (n, %)
1. Falls from HeightMethodInadequate Training & Planning [7,38,41]scaffold, ladder, platform3120 (75.0%)
MachineDefective/Unstable Equipment [10,40]scaffold, ladder, platform3120 (75.0%)
EnvironmentElevated, Unprotected Workspace [3,42]fall, height, top3658 (87.9%)
2. Struck-by & Contact InjuriesManIncorrect Tool Use/Inattention [11,41]cut, hammer, hit3075 (77.5%)
MethodInadequate Procedures/PPE Enforcement [10,41]glove, cable, wire2895 (73.0%)
MaterialSharp/Flying Objects [3,40]bar, glass, wire3251 (82.0%)
3. Slips, Trips, & FallsEnvironmentUnsafe Ground Conditions [3,42]slip, ice, uneven3201 (82.9%)
MethodPoor Housekeeping & Planning [7,38]ground, uneven, task2895 (75.0%)
4. Hot Work & Vehicles HazardsMethodLack of Controlled Work Systems [10,40]weld, burn, traffic2685 (83.8%)
EnvironmentPresence of Ignition Sources/Traffic [3,42]weld, burn, vehicl2805 (87.5%)
5. Lifting & Machinery AccidentsMethodInadequate Training & Planning [7,38,41]crane, load, oper1958 (77.9%)
MachineEquipment Failure [40]crane, chain, hook1608 (63.9%)
ManCommunication Error [11,41]signal, oper1432 (56.9%)
Disclaimer/Publisher’s Note: The statements, opinions and data contained in all publications are solely those of the individual author(s) and contributor(s) and not of MDPI and/or the editor(s). MDPI and/or the editor(s) disclaim responsibility for any injury to people or property resulting from any ideas, methods, instructions or products referred to in the content.