Article

Research on Cooling-Load Characteristics of Subway Stations Based on Co-Simulation Method and Sobol Global Sensitivity Analysis

1
Suzhou Rail Transit Group Co., Ltd., Suzhou 215004, China
2
Beijing Key Laboratory of Green Built Environment and Energy Efficient Technology, Beijing University of Technology, Beijing 100124, China
3
School of Transportation, Southeast University, Nanjing 211189, China
4
School of Energy Science and Engineering, Central South University, Changsha 410083, China
*
Author to whom correspondence should be addressed.
These authors contributed equally to this work.
Buildings 2025, 15(21), 3858; https://doi.org/10.3390/buildings15213858
Submission received: 29 September 2025 / Revised: 19 October 2025 / Accepted: 23 October 2025 / Published: 25 October 2025

Abstract

As high-energy-consumption underground public space, subway stations are responsible for a particularly significant proportion of air-conditioning energy use, especially during the cooling season, making the investigation of cooling-load characteristics highly important. However, the determination of independent influencing factors in different situations has not yet reached a consensus, and the role of interaction effects is lacking, which hinders the development of energy-saving strategies. For this purpose, this study proposes a sensitivity analysis framework based on 10 typical influencing factors from thermal parameters, meteorological parameters, internal heat disturbances, and indoor environmental setpoints. An input set was generated by integrating equal-step parameter discretization and Saltelli quasi-MonteCarlo sampling. A database containing 11,264 samples was constructed through an EnergyPlus–Python co-simulation method. Based on the Sobol global sensitivity analysis, the key influencing factors of subway station cooling load were identified and quantified, and the impact of these 10 factors was systematically analyzed. Results show that occupant density (SiT = 0.5605) and fresh air volume (SiT = 0.4546) are the dominant factors, contributing more than 50% of the load variance. In contrast, the characteristics of an underground structure significantly weaken the influence of the building-envelope heat transfer coefficient (SiT = 0.1482) and soil temperature (SiT = 0.0884). Furthermore, five groups of strong interaction effects were identified in this study, including occupant density–fresh air volume (Sij = 0.1094), revealing a nonlinear load response mechanism driven by multi-parameter coupling. This research provides a theoretical foundation and quantitative tool for the refined design and optimized dynamic coupled operation of underground transportation hubs.

1. Introduction

1.1. Research Background

With the continuous progression of society, people have placed higher demands on the speed and safety of urban transportation [1]. As a vital component of modern urban public transportation systems, the subway plays an indispensable role due to its convenience, efficiency, environmental friendliness, and relatively low impact on surface traffic [2,3]. By the end of 2024, a total of 58 cities in China had opened 361 urban rail transit lines, encompassing 5609 subway stations and exceeding 12,160 km in length [4]. Alongside the rapid expansion of subway system, subway stations have become one of the major contributors to societal energy consumption. The energy intensity of subway stations can exceed 200 kWh/m2, which is 2 to 4 times that of conventional public buildings [5]. Among energy-consuming systems, air-conditioning (AC) systems account for 30% to 50% of the total energy consumption (including train traction energy). Given the large number of subway stations, even a minor reduction in the energy use of AC systems could lead to substantial energy savings. Typically, air-conditioning-system energy consumption is closely correlated with the load [6,7]; as heating is rarely provided in subway stations, the energy consumption of AC systems is primarily attributable to handling cooling loads. Therefore, analyzing the cooling-load characteristics is of significant importance.
China proposed the carbon peaking and carbon neutrality strategy in 2020, bringing energy conservation and emission reduction in the transportation sector to the forefront. As a critical part of urban public transportation, subway systems have received significant attention. The Energy Saving and Carbon Reduction Action Plan for 2024–2025 [8] issued in 2024 clearly involves advocating for advancing low-carbon transportation infrastructure, promoting the electrification of transportation hubs like subway stations, and ensuring that advanced technologies account for 80% of key energy-consuming equipment, such as subway station cooling systems. Furthermore, General Technical Conditions for Energy-saving Control System of Ventilation and Air Conditioning in Urban Rail Transit Stations [9] states that subway stations should adopt intelligent group control, frequency conversion regulation, dynamic load forecasting, and other technologies to achieve the goal of reducing the energy consumption of the air-conditioning system by more than 20%.

1.2. Literature Review

This section systematically reviews and summarizes existing research from two aspects: factors influencing building loads and sensitivity analysis methodologies. It highlights the differences in load characteristics between above-ground buildings and underground subway stations and provides a comprehensive overview of major global sensitivity analysis methods and their current applications in the field of building energy performance.

1.2.1. Research on Influencing Factors of Building Load

The energy consumption characteristics of subway stations are different from those of general underground buildings; subway energy use primarily comprises station building energy consumption and train traction energy consumption. As this study focuses on the factors influencing the energy consumption of subway station air-conditioning systems, traction-related aspects are not considered. For public areas within subway stations, passenger flow has a more significant impact on the energy use of environmental control equipment [10]. Additionally, environmental factors such as temperature and precipitation play critical roles [11], since high temperature and humidity will lead to an increased cooling load, thereby elevating energy demand for environmental control. Su et al. [12] developed a subway station energy benchmark based on integrating simulation and multiple linear regression. This model demonstrates the significance of environmental factors.
However, operational data indicate that current subway stations suffer from suboptimal air-conditioning system design and inefficient operation. Li et al. [13] conducted field measurements on air-conditioning equipment in subway stations to address the problems of excessive equipment selection, the results showed that the actual cooling load was only 42.33% of the designed load, indicating a serious overestimating. Furthermore, air-conditioning systems in subway stations are typically configured according to the long-term extreme peak-hour scenarios, with summertime setpoint temperature are often too low, resulting in energy waste [14]. During peak hours, cooling loads from passengers and ventilation increase by 100% and 42%, respectively, compared to off-peak hours [15]. The over-sizing phenomenon arises from the static worst-case scenario method algorithm in summer under current design standards: station hall design temperatures are set 2–3 °C below the outdoor dry-bulb temperature, while platform temperatures are set 1–2 °C lower than the station hall. The outdoor design dry-bulb temperature allows for up to 30 non-guaranteed hours during subway evening peak periods, which tends to inflate load estimations. Meanwhile, occupant density and fresh air volume are taken as the maximum values, ignoring their changing patterns.
Existing research indicates that a clear understanding of the composition and influencing mechanisms of cooling loads in subway stations remains lacking. Hu et al. [16] identified the optimal input parameters for subway station cooling load from 15 candidates including system variables, meteorological conditions, time, indoor parameters, and historical load. The results showed that all parameters expect meteorological conditions were included in optimal combination. The relationship between cooling load and input parameters is not simply additive. Zhang et al. [17] found that electrical equipment load accounting for the highest proportion at 42%. Meanwhile, other research [18] demonstrated that train frequency, passenger volume, and outdoor temperature are the major factors causing fluctuations in subway station electricity consumption.
In recent years, scholars conducting research on building load have paid close attention to the influence of factors such as building-envelope performance, intelligent shading, building orientation, and the synergy of light and heat on the building’s cooling load. Lian et al. [19] developed a real-time load-forecasting model by incorporating occupancy and meteorological data in dynamic building environments, achieving a mean absolute percentage error (MAPE) of only 6%. In 2025, Guan et al. [20] conducted a numerical simulation-based study on three representative office buildings in Chengdu, analyzing the contribution of the building envelope to cooling load under intermittent operation of air-conditioning systems. Their results demonstrated that enhancing the thermal performance of building envelopes, along with optimized operational strategies, can significantly reduce cooling demand. Also in 2025, Ao et al. [21] proposed an integrated lighting–thermal design optimization method for office buildings using the Rhino–Grasshopper platform. By optimizing variables such as building orientation, window-to-wall ratio, and the heat transfer coefficient of exterior walls, their study explored synergies between building energy load reduction and visual comfort. Furthermore, Lian et al. [22] established a data-driven framework for dynamic load prediction based on an EnergyPlus simulation database and LightGBM algorithm, analyzing five categories of influencing factors, building physical parameters, weather conditions, internal disturbances, operational schedules, and indoor control parameters.
Compared to the emphasis on the building envelope in above-ground buildings, underground buildings pay more attention to dynamic factors such as ventilation disturbances and personnel situation, particularly in transportation facilities. Yu et al. [23] conducted an empirical study on the impact of train-induced airflow (TIA) on the cooling load of subway stations. The study showed that traditional estimation methods may underestimate cooling demand, and they proposed incorporating TIA into load models to improve the assessment accuracy. Kong et al. [24] developed a probabilistic model for the cooling load of subway stations through Latin hypercube sampling and the Monte Carlo algorithm, followed by uncertainty and sensitivity analyses. Their results indicated that the load is primarily influenced by outdoor temperature and equipment parameters—markedly different from the envelope-dominated feature of above-ground buildings. However, this study was limited to equipment management areas and did not account for passenger factor.
The shift in focus is fundamentally driven by the diminished influence of external conditions and the inherent stability of the building envelope and surrounding soil. Compared to above-ground structures, both the magnitude and fluctuation of heat transfer through the envelope are significantly decreased. Several related studies have substantiated this phenomenon. Jiang et al. [25] systematically investigated the spatial distribution characteristics of the thermal environment in public areas of an underground station, finding that the effective penetration depth of outdoor temperature fluctuations is limited to the entrance and exit zones. Ren et al. [26] conducted a theoretical analysis of heat and moisture transfer in underground ventilation corridors. Their numerical simulations revealed that incoming air temperature and velocity are the most influential factors on the corridor’s cooling and dehumidification efficiency, while the corridor wall temperature has a relatively minor impact. Akram et al. [27] studied an underground factory using Fluent for numerical heat transfer simulations. The results demonstrated that, unlike its above-ground counterpart, the underground factory remains unaffected by surface climate conditions, and heat transfer through the envelope is small. Wang et al. [15] analyzed the load composition in a subway station, concluding that the load from the fresh air system is a significant component, accounting for 31.52% of the total load. Heat transfer through the envelope and from tunnels only contributed 10.5%. Another study shows [28] that heat transfer through the building envelope accounted for 2% of the total load, with equipment heat dissipation being the primary source. Similarly, a study [29] found that heat gain through the envelope constituted only 1% of the total cooling load, while heat generated by occupants accounted for a substantial 44%.
Ahn et al. [30] developed a metro station energy benchmark regression model for 157 metro stations in Seoul, considering variables such as climate, building year, building area, operation time, and passenger flow to assess energy usage. Guan et al. [31] studied 341 stations in five climate zones in China and determined that the air conditioning system and lighting were the main drivers of non-traction energy use. Ren et al. [32] proposed an integrated methodology coupling passenger flow simulation with building energy modeling to develop a occupancy-adaptive control model. It could save maximum 24.4% of cooling energy in a certain subway station in Hong Kong. Additionally, Su and Li [33] conducted a sensitivity analysis on the air-conditioning energy consumption of a subway station, indicating that humidity, outdoor temperature, and fresh air volume have the strongest impact. Nevertheless, existing studies often rely on limited data from partial scenarios, failing to cover the full range of parameters, which can compromise the accuracy and applicability of their findings.

1.2.2. Sensitivity Analysis Methods

Sensitivity analysis is a method used to evaluate the extent to which input parameters influence output results. It enables the identification and quantification of the impact of key parameters on a certain outcome and rank them [34]. Sensitivity analysis is primarily categorized into global sensitivity analysis and local sensitivity analysis [35]. Global sensitivity analysis evaluates the importance of each input parameter by simultaneously varying all input parameters across their entire ranges, so its results are more reliable compared with local sensitivity.
Global sensitivity analysis includes four common methods: regression-based, variance-based, screening-based, and metamodel-based model, as summarized in Table 1. Regression-based sensitivity analysis is straightforward and easy to interpret, making it one of the most widely used methods. Its core principle involves fitting a regression model between input parameters (X1, X2, …, Xn) and output variables (Y1, Y2, …, Yn), and analyzing the sensitivity indicators to determine the degree of influence of the parameters. Screening-based methods are generally used in cases where the input data is complex and large. Its advantage is that it can filter out parameters irrelevant to the output, emphasizing qualitative analysis, and rapidly ranking parameters by importance, while a key limitation is their inability to precisely quantify the magnitude of the impact. The Morris method is the most common screening-based method, employing measures μ and σ to evaluate parameters. Here, μ represents mean coefficient value, directly reflecting the influence intensity of parameter, σ represents standard deviation of effects, used to evaluate the relationship between input parameters or the degree of nonlinearity. Variance-based sensitivity analysis quantifies the importance of input parameters by measuring how much each parameter’s uncertainty contributes to the total variance of the output. The most representative methods in this category are the Sobol method and the Fourier Amplitude Sensitivity Test (FAST). Metamodel-based sensitivity analysis method consists of two stages: first, build an input–output surrogate model (e.g., machine learning model), and then performing sensitivity analysis on the surrogate model. Methods such as MARS (Multivariate Adaptive Regression Splines) and ACOSSO (Adaptive Component Selection and Smoothing Operator) use such approximations to significantly improve computational efficiency while maintaining analytical accuracy. These methods are particularly suitable for handling complex simulation models with high computational time.
Sensitivity analysis generally consists of five basic steps [38]: (1) Determine the studied parameters based on the research objectives, (2) define the probability density functions of input parameters, (3) select an appropriate sampling method to generate a data sample library for the model, (4) input the sample set library into the calculation model to be studied and obtain output samples, and (5) perform sensitivity analysis on the input and output results to identify key parameters and rank their importance. Among them, the most critical step in conducting sensitivity analysis is to determine the input ranges and define the probability distribution of the inputs [35]. When exploring variations in energy use in buildings, continuous uniform distributions, normal distributions, and Monte Carlo methods are typically employed to define the distributions of input factors [39,40,41].
In the field of building load and energy consumption analysis, previous researchers have extensively used sensitivity analysis to predict and evaluate different types of buildings, including residential buildings, apartment buildings, and office buildings. These applications of sensitivity analysis cover upgrading the thermal performance of building envelopes, building energy retrofits, optimization of building heating and cooling systems, and investigation of factors influencing building energy loads. Neale et al. [42] used both Morris and Sobol method to perform sensitivity analysis and ranking, identifying the most influential parameters on building energy consumption. The results showed that the sensitivity results of the two methods were very similar. Ebrahimi-Moghadam et al. [43] conducted sensitivity analysis on design variables related to building system performance to facilitate energy retrofitting in buildings. Tootkaboni et al. [44] evaluated the impact of building envelope on climate adaptability based on Sobol sensitivity analysis. The results showed that ventilation cooling and super-selective glass windows were powerful factors affecting the cooling load, which proved the important role of sensitivity analysis in optimizing building cooling and heating systems. Tajuddeen et al. [45] used Morris method to conduct a sensitivity analysis on 29 independent design parameters of an office building in Africa, and found that the parameter settings of the east wall is the key influencing factor for the cooling load in summer. Zhu et al. [46] proposed a new Monte Carlo method based on building performance simulation and further applied a tree-structured Gaussian process metamodel combined with standardized regression coefficient (SRC)-based global sensitivity analysis to identify major factors affecting building heating and cooling loads.Pang et al. [47] conducted a large-scale Monte Carlo simulation using EnergyPlus for a domestic hot water system, selecting 151 input parameters and 8 output parameters across five typical cities in the United States. Subsequently, they calculated the PEAR and Sobol indices and found that the maximum capacity and efficiency of the main water heater were the two most important factors affecting domestic hot water usage. Delgarm et al. [48] employed one-factor-at-a-time (OFAT) and Sobol sensitivity analysis method to identify the key factors influencing energy performance of buildings in Iran. Under four predominant climate conditions, parameters including building orientation, window size, glass characteristics, and envelope characteristics were evaluated. The results highlighted glass characteristics as the most critical factor affecting energy performance. Zhang et al. [49] introduced a novel sensitivity analysis procedure using Bayesian Adaptive Spline Surfaces (BASS) for building energy sensitivity assessment, enabling assessment across multiple time scales. Gauch et al. [50] used variance-based sensitivity analysis to examine the importance of input parameters on annual heating and cooling loads in multi-story buildings. Their study found that building compactness and window-to-wall ratio were the most important factors. These studies demonstrate that sensitivity analysis has been extensively applied in various aspects of building performance. However, the same factors often have different degrees of influence on different buildings.
When conducting sensitivity analysis, regression-based methods are usually chosen for the model is simple and linearly monotonic. For models that are nonlinear or the monotony cannot be determined with a small number of input parameters (<20), variance-based sensitivity analysis methods, such as Sobol and FAST methods are appropriate. In case the number of input parameters is large, sensitivity analysis methods based on meta-models or screening should be considered. Current studies often focus on the Morris screening method for the selection and allocation of input parameters. Although the Morris method has a low computational cost, it cannot distinguish between independent and interaction effects. The relationship between building-load input variables and building load is nonlinear and interactive. Thus, the variance-based Sobol method is selected to evaluate the sensitivity of each input parameter. To efficiently generate input variable combinations, the Saltelli quasi-Monte Carlo sampling method was applied, ensuring uniform coverage of the parameter space.
This study aims to address the current lack of research on subway station cooling loads and to fully leverage the unique environmental characteristics of underground spaces for reducing summer cooling demand. To achieve this aim, this study sets the following research tasks: (1) establish a simulation cooling-load database in several situations; (2) quantify the effect of various influencing factors; (3) identify dominant factors and interactions.
A novel integrated method combining co-simulation and global sensitivity analysis was proposed. This method uses Saltelli quasi-Monte Carlo sampling to extract parameter combinations of various load-influencing factors, and utilizes an EnergyPlus–Python co-simulation to generate a simulation database. Subsequently, Sobol global sensitivity analysis is used to extract key characteristic variables that affect subway station loads, revealing the coupled influencing mechanisms of subway station energy loads. Distinguished from previous studies, this study employs Saltelli sampling method to efficiently generate a high-fidelity simulation database. In the sensitivity analysis, this study uses Sobol global sensitivity analysis method to quantify the interaction effects which are often not mentioned in prior sensitivity analysis. The proposed method is applied and validated using a real subway station in Suzhou as a case study. As an integrated co-simulation and sensitivity analysis framework, it is validated in the specific context of a subway station. However, its core principles—constructing a large load database under numerous conditions, systematically ranking the influencing factors, and evaluating the interaction effects—are universally applicable. This method provides a flexible and powerful analytical foundation for identifying the load drivers and optimizing strategies in underground transportation hubs across diverse global climates and operational conditions.

2. Materials and Methods

This study proposes a research method for studying the air-conditioning load characteristics of subway stations based on simulated databases and Sobol global sensitivity analysis. The specific technical route is shown in Figure 1, and it consists of the following five core steps:
(1)
Parameter determination
Determine the types of input and output parameters. Based on the characteristics of subway station, four categories of key input parameters are determined: thermal parameters, meteorological parameters, internal disturbances, and control conditions.
(2)
Variable values
Determine the range and step size of the values of the influencing factors according to design codes, relative standards, and existing research.
(3)
Saltelli quasi-Monte Carlo sampling
A uniformly distributed sample of input parameter is generated to cover the multi-dimensional parameter space.
(4)
EnergyPlus–Python co-simulation
Build a subway station model and calculate the load in batches.
(5)
Sobol global sensitivity analysis
Quantify the degree of influence of each parameter and the impact of interaction effects.

2.1. Saltelli Quasi-Monte Carlo Sampling Method

Monte Carlo is a widely used numerical computation method based on probability and statistics. Its core principle lies in using randomness to solve deterministic problems. The method is mathematically founded on the Law of Large Numbers, which states that as the number of random experiments approaches infinity, the sample mean converges to the expected value, as shown in Equation (1).
lim N 1 N i = 1 N f ( X i ) = E [ f ( X ) ]
For a large and simple input and output sample set, the Monte Carlo method can utilize randomness to approximate a mathematical model from a large number of samples. Different from the classical Monte Carlo method, the randomness of the sampling in the Saltelli method is essentially quasi-random based on a deterministic low-difference sequence. The Monte Carlo samples are randomly distributed in the parameter space when sampling, which can easily lead to clustering or gap. In contrast, the Saltelli method sampling uses a seemingly random but special method to fill the entire parameter space, ensuring that samples are uniformly distributed on each direction of projections of parameter space. This strategy avoids issues such as clustering or voids, and has a faster convergence speed.
When conducting sensitivity analysis using the Sobol method, the sampling method of Saltelli can significantly reduce the required number of samples while completely preserving the complex interactions among parameters, making it a crucial step in generating input parameters. However, due to its unique random process, the Saltelli method has relatively strict requirements for the number of samples. When used for Sobol variance-based sensitivity analysis, the sample size N should satisfy the following Equation (2) [51].
N = 2 ( 2 m + 2 )
where n is the minimum number of evaluations (often taken as 2p), and m is the number of input parameters in model.
A large sample size generally leads to higher accuracy of the Sobol index. When the base sample size reaches or exceeds 512, the error of the Sobol index can be controlled within 5% [11]. It is a common choice for high-precision variance-based sensitivity analysis.

2.2. Sobol Global Sensitivity Analysis Theory

The Sobol method was first proposed in 1993, it decomposes the calculation model into 2n additive components. This decomposition idea is applicable to independent input variables. Assuming that f2(X) is integrable and input parameters are uniformly distributed variables within [0, 1], the expression of the model decomposition is as Equation (3) [52].
f ( X ) = f 0 + i = 1 n f i ( X i ) + 1 i j n f i j ( X i , X j ) + + f ( 1 , 2 , , n ) ( X 1 , , X n )
where f(X) is the mathematical representation of the output parameter under study, X = (X1, X2, …, Xn) is a random vector comprising n input parameters, and f0 is a constant term whose value should be equal to the expected value of f(X).
For the overall model f(X), when all the input parameters follow a uniform distribution within the range of [0, 1], the total variance V can be used to represent the degree of influence of all input parameters on the output parameter, as shown in the following Equation (4).
V = Ω f 2 ( X ) d X f 0 2
Among them, the first-order partial variance Vi represents the degree of influence of a single input parameter Xi on the output parameter, while the higher-order partial variance Vi,j,…,n represents the degree of influence of the interaction among multiple input parameters on the output parameter. The calculation method for these variances is as follows:
V i = 0 1 f i 2 ( X i ) d X i
V i , j , , n = 0 1 0 1 f i , j , , n 2 ( X i , X j , , X n ) d X i d X j d X n
The sensitivity index of Xi for each order is the ratio of the partial variance containing Xi to the total variance V, its calculation method is as Equation (7).
S i , j , , n = V i , j , , n V
In the calculation result, Si is the first-order sensitivity of Xi, indicating the degree of change in the output parameter when a single input parameter Xi changes. Sij is the second-order sensitivity index of two different input parameters Xi and Xj, reflecting the degree of influence that the interaction between the two input parameters has on the output. The larger the value, the stronger the interaction between the two parameters.
For the second-order interaction effect index Sij of parameters Xi and Xj, its relative contribution rate can be expressed as Equation (8).
R i j = S i j k = 1 n S i k
The total sensitivity index SiT for a given input parameter Xi is defined as the sum of all sensitivity indices of all order effect indices involving Xi, represented as Equation (9).
S i T = i { i 1 , , i z } S i 1 i z
To calculate the Sobol index, the most common approach is based on the original model, which performs direct simulations at relatively low computational cost when the number of parameters is small. In recent years, a novel method based on surrogate model has been proposed and widely used [53,54]. This method constructs a data-driven approximate mathematical model to replace the original model, it significantly reduces the computing time especially for complex simulations. However, the accuracy of this method heavily depends on the train quality and the model structure, so it is generally lower than that of the original model.
In this study, the Saltelli quasi-Monte Carlo sampling method was applied to directly conduct Sobol analysis using the original model. This strategy avoids the errors introduced during the development and training of surrogate models, thereby improving the reliability of the sensitivity analysis index.

2.3. Co-Simulation Method for the Subway Station Cooling Load

This study adopts an EnergyPlus–Python co-simulation method. The ideal air-conditioning system module in the EnergyPlus 23.2.0 was used to construct the air-conditioning cooling-load calculation model for the subway station. The parameters of the EnergyPlus model were automatically adjusted according to the predefined variable range and discrete method through Python programming, thereby obtaining scientific and reasonable simulation data samples, thereby obtaining scientific and reasonable simulation data sample set. This co-simulation method efficiently generated a comprehensive and scientific cooling-load array, which servers as the basis for the study.

3. Establishment of the Cooling-Load Simulation Database

3.1. Baseline Model of the Case Subway Station

3.1.1. Basic Information of the Case Subway Station

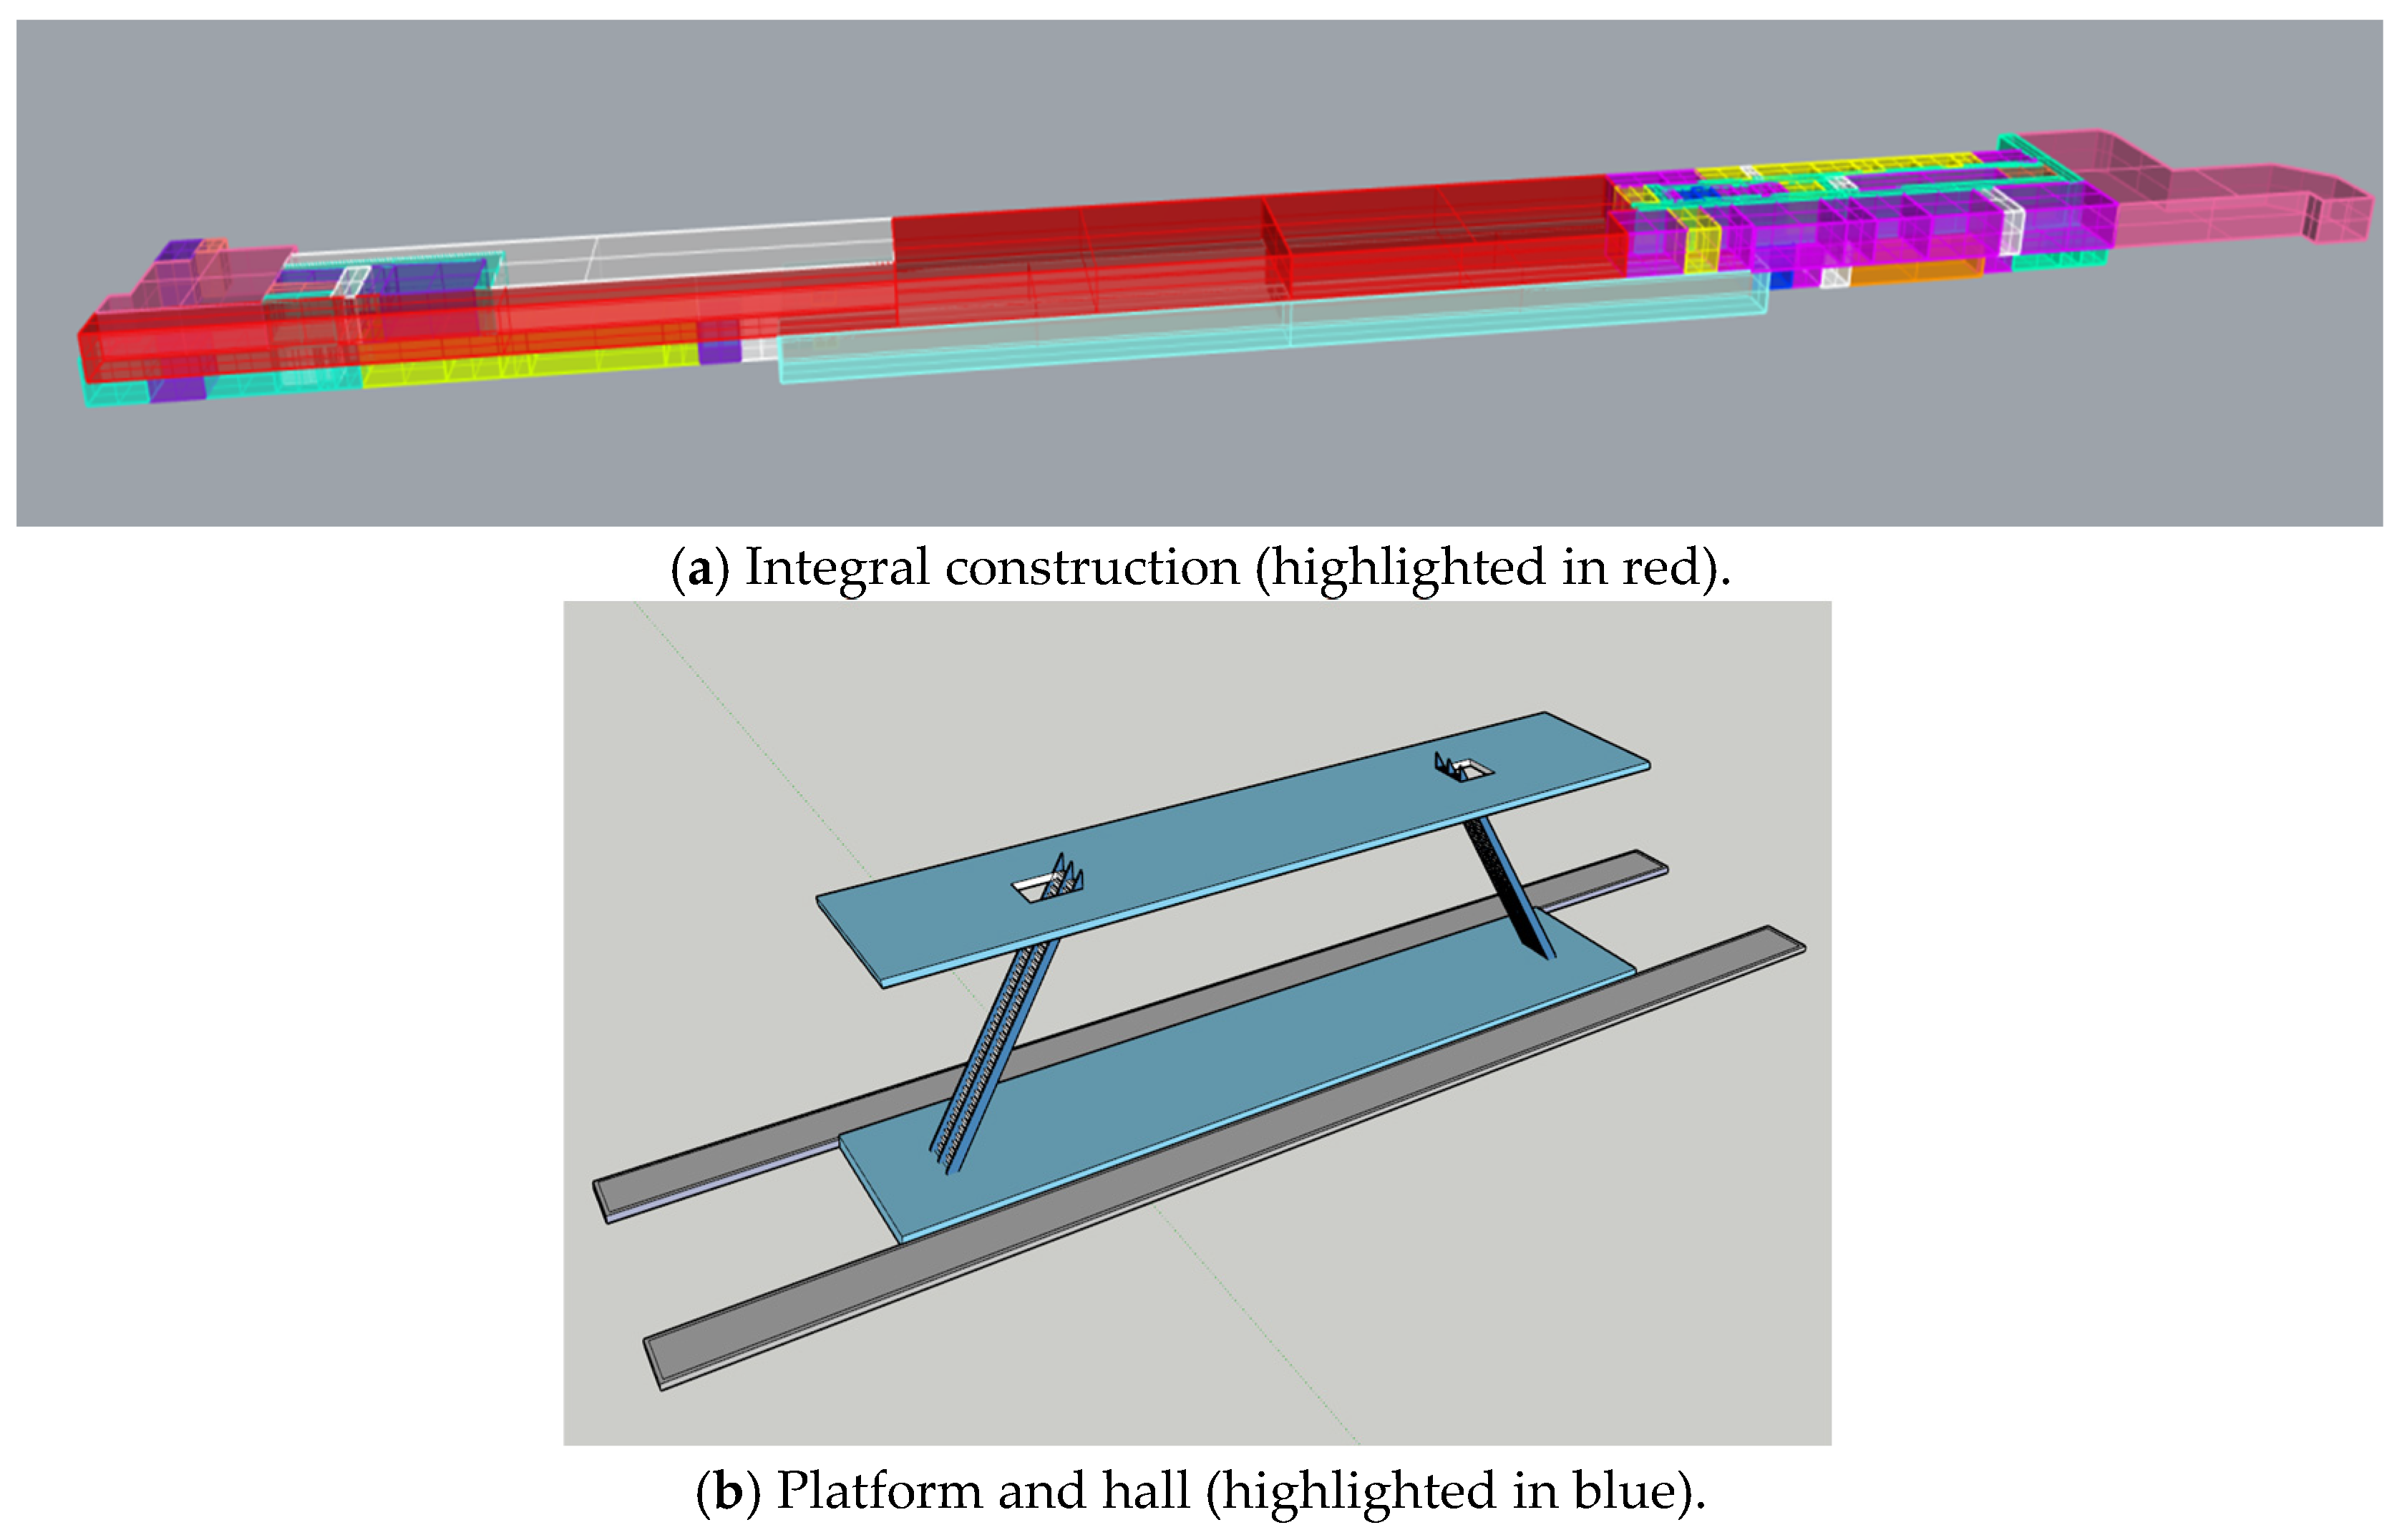
This study develops an EnergyPlus benchmark model based on a certain subway station in Suzhou. The station is a typical two-level underground island platform station with a total floor area of 3960 m2. The spatial layout is shown in Figure 2. The station is equipped with comprehensive monitoring systems, providing historical records of meteorological data, energy consumption, indoor environmental parameters, and the cooling output of the conditioning system. Suzhou is located in a hot summer and cold winter climate zone; the annual outdoor dry-bulb temperature and relative humidity of Suzhou is as shown in Figure 3.

3.1.2. Verification of Simulation Results for the Case Station

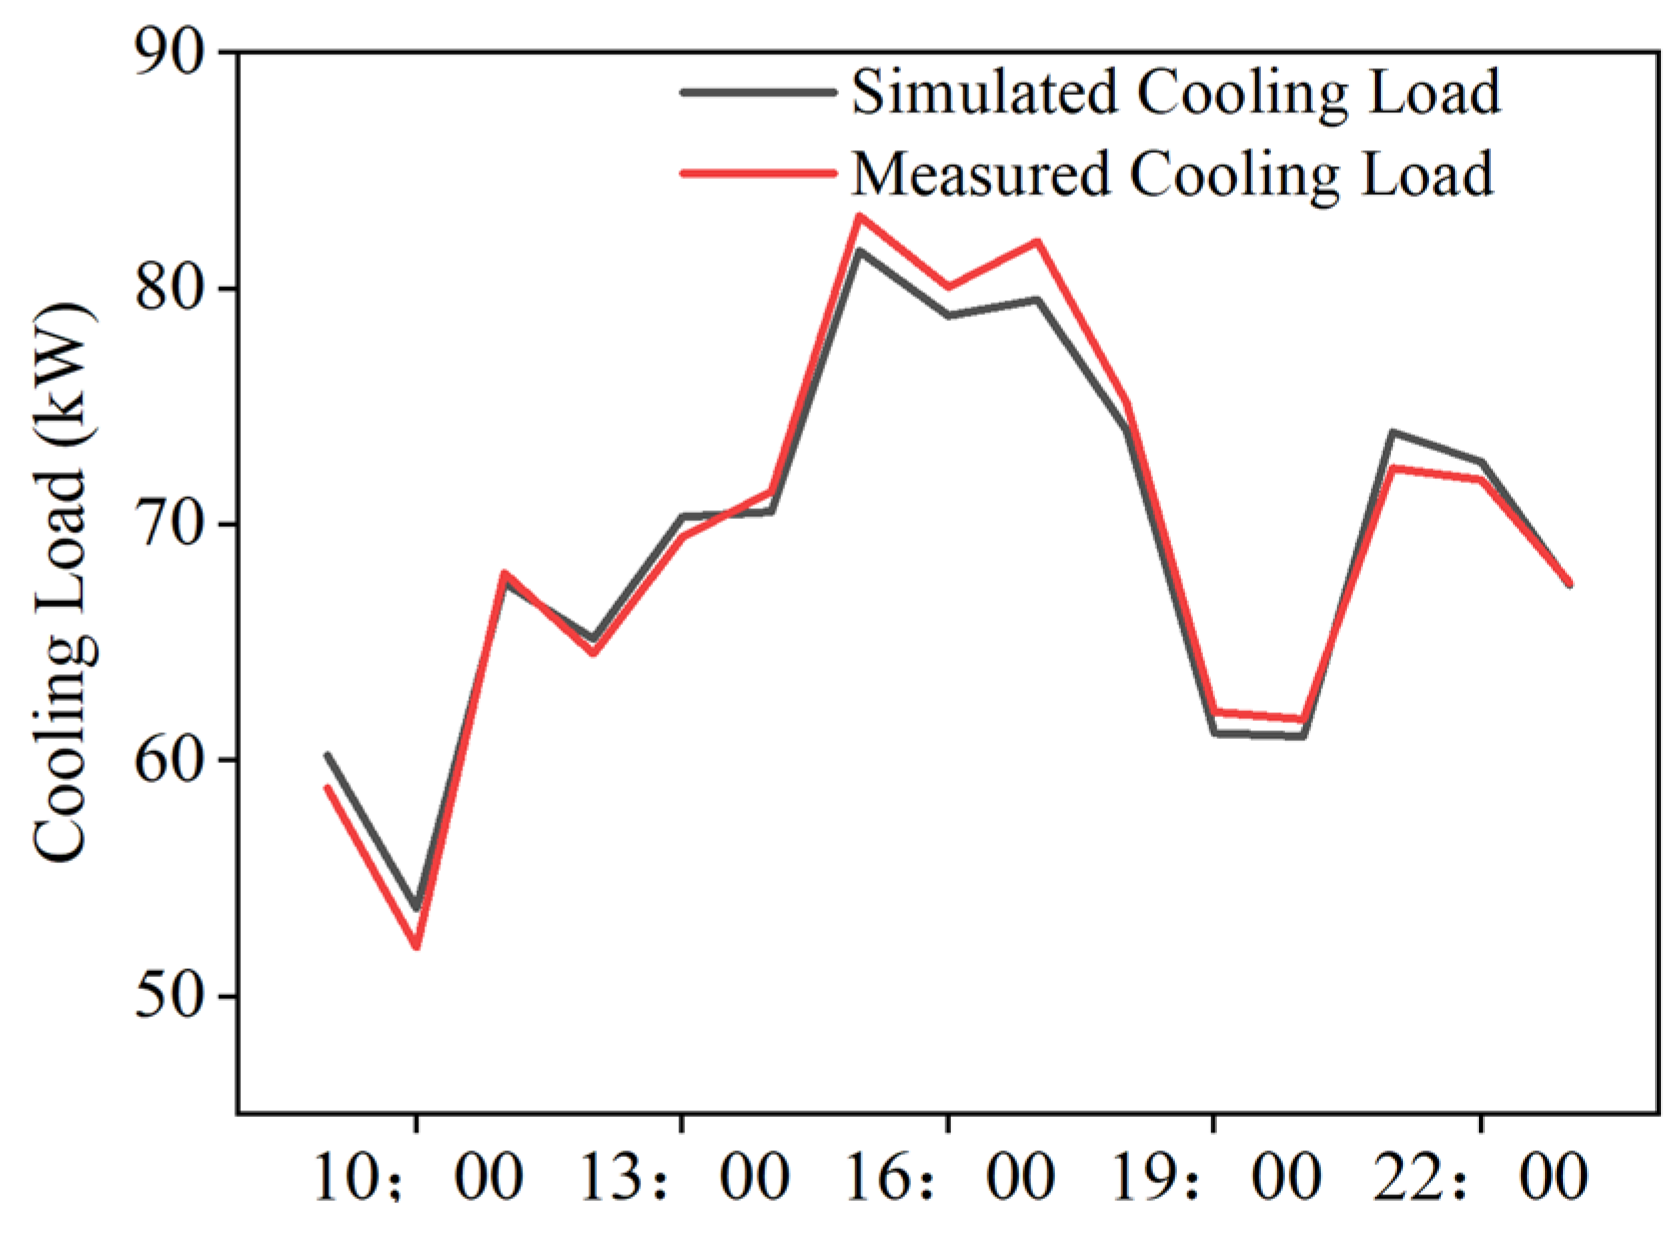
In this study, an ideal air conditioning system module in the EnergyPlus 23.2.0 software was used to simulate the air-conditioning load of the subway station. Input parameters were set based on the field measured data and the given building envelope and internal disturbance information in the subway station construction drawings, and the hourly load simulation results of the subway station for the entire year were obtained from the calculation model. The model results were verified based on the actual measured cooling load on 21 July. The station is equipped with meters, which record the supply temperature, return temperature, and flow rate of chilled water. The actual measured cooling load is calculated through these records.
Figure 4 compares the daily variation profiles of the measured and simulated cooling loads on a representative day. The relative error between the two sets of data is 3.2%, confirming the high accuracy of the simulation model.

3.2. Input Parameter Range and Distribution

Before applying a Sobol variance-based sensitivity analysis method to identify key influential inputs and parameter interactions in the load model. It is essential that the distribution patterns and value ranges of the input parameters must be determined first. Based on the previously discussed research summary on the mechanism and influencing factors of air-conditioning load, four categories of influencing parameters are identified for subway station loads, including thermal properties of the building envelope, meteorological parameters, internal load disturbances, and indoor environmental control conditions. Since the study mainly focuses on underground subway stations, there are no windows and exterior walls adjacent to soil rather than air, which is a key distinction from above-ground buildings. Therefore, the influence of solar radiation on the exterior walls can be ignored and the main thermal parameter is the building-envelope heat transfer coefficient. Meteorological parameters include outdoor dry-bulb temperature, air relative humidity, and soil temperature. Internal load disturbances include occupant density, equipment power density, and lighting power density. The body’s heat dissipation of people is approximately taken as 120W per person [55], with the latent heat accounting for 30% of the total. Indoor environmental control conditions include temperature setpoint, humidity, and fresh air volume.
The probability distributions of input parameters are related to the purpose of sensitivity analysis. Defining the reasonable range in variable discretization ranges can improve the applicability of the simulation database. Therefore, it is necessary to determine the discrete intervals for each variable [22]. To ensure the generated database is both representative and practical, the discrete ranges for each variable were determined according to engineering standards, historical data, or typical design practices. For instance, the range of outdoor dry-bulb temperature was derived from typical year meteorological data, while the range of occupant density was derived from historical passenger flow records. Meanwhile, to effectively maintain unbiased sampling, all input parameters are selected as discrete uniformly distributed variable. To avoid sparse distribution in the sample space, the step size should not be too large. The specific variable categories, step sizes, discrete ranges, and value determination basis are shown in Table 2. Figure 5 shows the discrete value levels of all input parameters.

3.3. Saltelli Sampling Implementation

In order to ensure the accuracy and reliability of the Sobol global sensitivity analysis results, the input parameter sample size should not be less than 5000 sets [62,63]. According to Equation (8), when the number of input parameters is 10, the sample size should be 22 × 2n. Balancing the accuracy requirements of the Sobol analysis and the complexity of the input samples, n was set to 11, yielding a total of 11,264 sample sets. Figure 6 shows the three-dimensional parameter space distribution of the samples obtained through the Saltelli sampling. The projections onto any two-dimensional distribution plane exhibit a uniform discrete distribution without clustering or gaps, which proves the spatial uniformity of the Saltelli quasi-Monte Carlo sampling.

3.4. Generation of Simulated Database

The simulation process involved a total of 11,264 input parameter combinations. Using a traditional single-simulation method would have resulted in prohibitively high computational time costs. Thus, in this study, the automatic simulation method of EnergyPlus–Python was adopted, which automatically executes simulations according to the predefined variable combinations to efficiently generate the database. The entire data generation process was conducted on a computer equipped with an i7 processor and required approximately 1 h.

4. Result

This section applies Sobol global sensitivity analysis to quantify the influence degree of each input parameter on subway station cooling load and ranks these parameters based on their importance. Additionally, the top five parameter combinations with the strongest interaction effects were identified through the analysis.

4.1. Single-Parameter Sensitivity Analysis Results

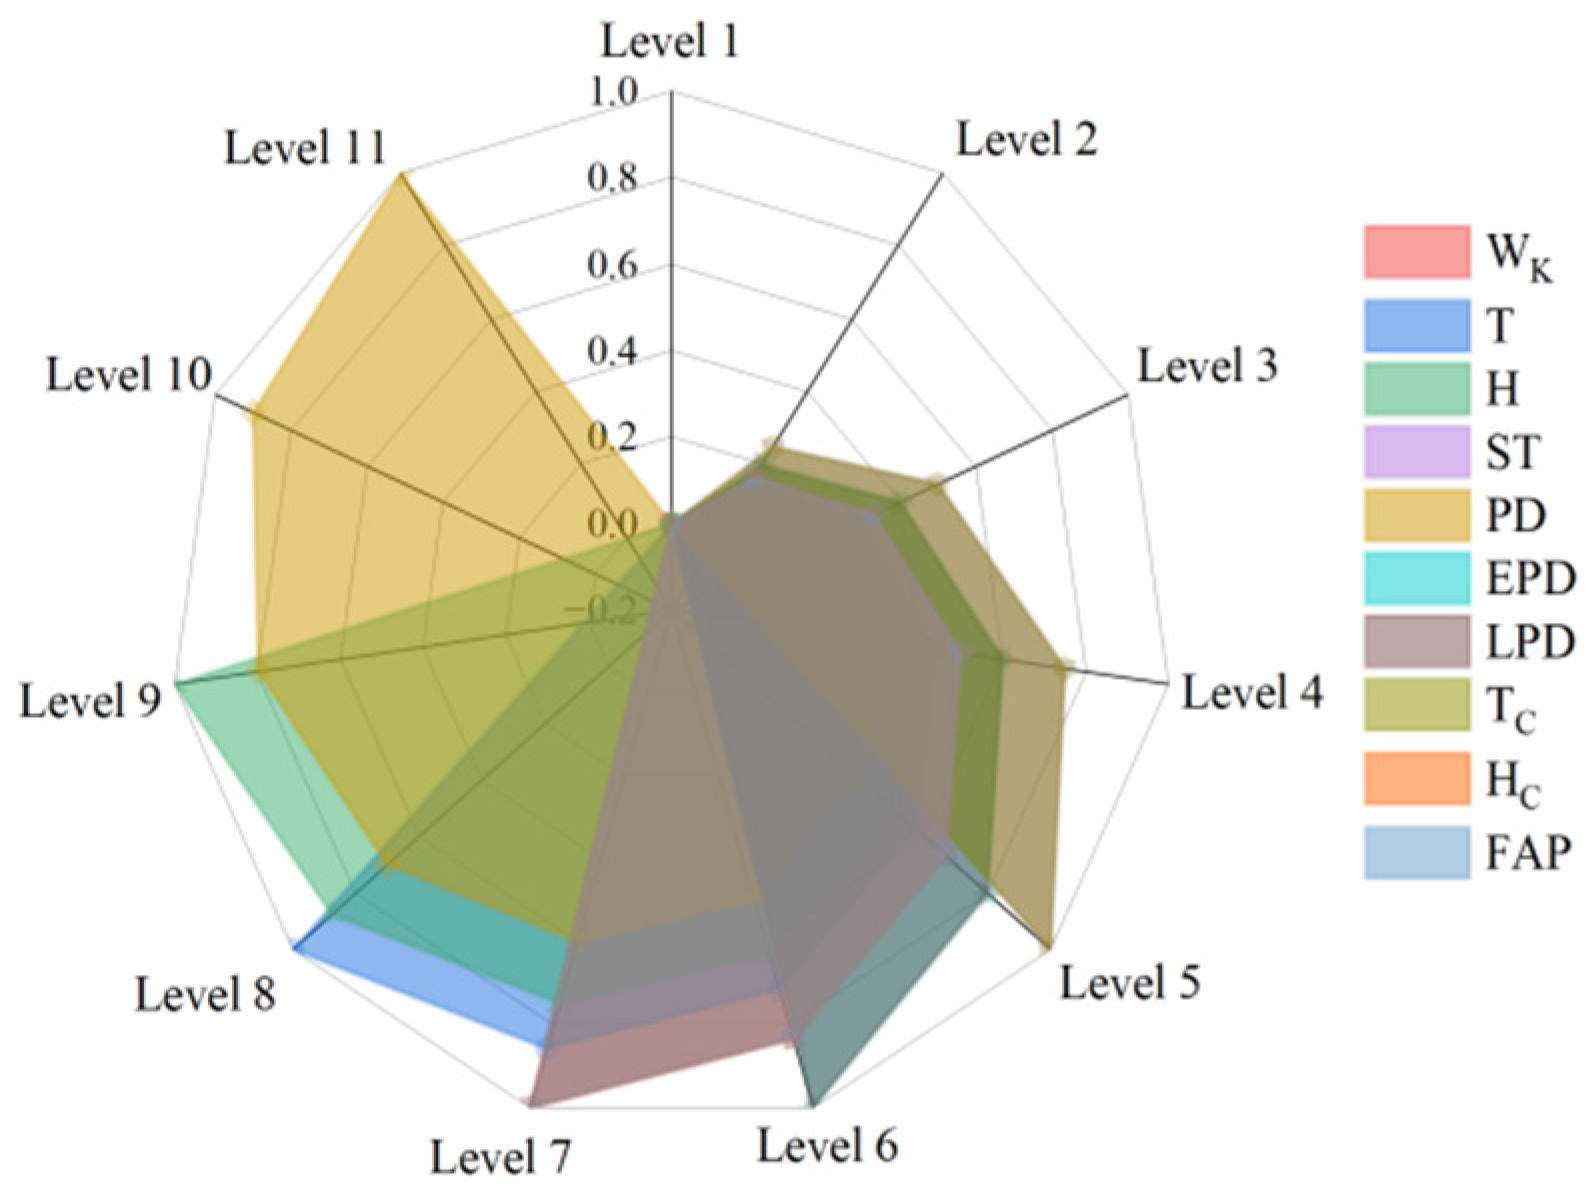
Table 3 and Figure 7 presents the sensitivity analysis calculation results of the input parameters for the total cooling load based on the Sobol method. In practical engineering applications, the total-effect index captures both independent influence of each parameter and its interaction effects with other inputs, which can better reflect the actual influence of the input parameters. As shown in the figure, among all the input parameters, the order of the total load impact of the subway station is as follows: occupant density > fresh air volume > outdoor relative humidity > outdoor temperature > station set temperature > lighting power density > equipment power density > station set humidity > building-envelope heat transfer coefficient > soil temperature. Overall, the total-effect index ranges from 0.0881 to 0.5605, while the first-order index varies between 0.0151 and 0.2471, all of which fall within expected and reasonable intervals.
The dominant parameters (with SiT > 0.4) influencing the total cooling load are occupant density and fresh air volume. Occupant density exhibits the highest total-effect index (0.5605) and first-order index (0.2471), making it the most influential independent variable. The thermal impact of occupants arises from a typical temperature difference of approximately 10 °C between the human body and indoor air, leading to significant heat release. In addition, the human body generates latent load through breathing and sweating, resulting in an approximately linear increase in total load with rising occupant density. The influence of the fresh air volume is slightly lower than occupant density, with a total-effect index of 0.4546 and a first-order index of 0.1196. Fresh air volume directly determines the total fresh air load. Furthermore, it also increases the cooling load through strong coupling effects with occupant density.
Among all the secondary input parameters (0.15 < SiT < 0.4), outdoor relative humidity has the highest total effect index (SiT = 0.3642), while its first-order index is only 0.0950, relatively low compared with total effect index. When the moisture content of outdoor air is high, it can lead to a significant increase in latent heat load. The next most influential parameter is the outdoor dry-bulb temperature (SiT = 0.2768). Although subway station is not directly exposed to the external atmosphere, outdoor dry-bulb temperature still has a significant influence on the station’s total cooling load through the temperature difference in fresh air. However, its influence is significantly reduced compared to above-ground buildings. The sensitivity of the air-conditioning setpoint temperature is closely followed by the outdoor dry-bulb temperature, with a total effect index of 0.2069. As the most frequently used adjustment object, a lower setpoint temperature increases the fresh air cooling load. Meanwhile, reducing the setpoint temperature also reduces the temperature difference between the station interior and the surrounding soil, heat transfer through the building envelope is reduced. These synergistic effects collectively determine the total influence of setpoint temperature. Both lighting power density and equipment power density also have a influence on the cooling load, with their total-effect indices exceeding 0.15. The two parameters’ impact is primarily through sensible heat. Their heat dissipation increases when the their power density increases, giving them a significant independent influence. Their first-order indices are 0.0961 and 0.1022, respectively, which is the most independently influential among all secondary parameters.
Low sensitivity parameters (SiT < 0.15) include the building-envelope heat transfer coefficient and the soil temperature. The total-effect index and first-order index for the building-envelope heat transfer coefficient are only 0.1482 and 0.0294, respectively. It indicates that building-envelope heat transfer coefficient has little effect on the total cooling load. This phenomenon can be attributed to the unique thermal characteristics of underground buildings. The surrounding soil has high temperature stability, which is a little lower than the indoor temperature. This results in a stable and small heat exchange, which greatly diminishes the sensitivity of the building-envelope heat transfer coefficient. And soil temperature has a narrower range of variation than other parameters due to the high stability, which may limit its sensitivity.

4.2. Parameter Interaction Effects

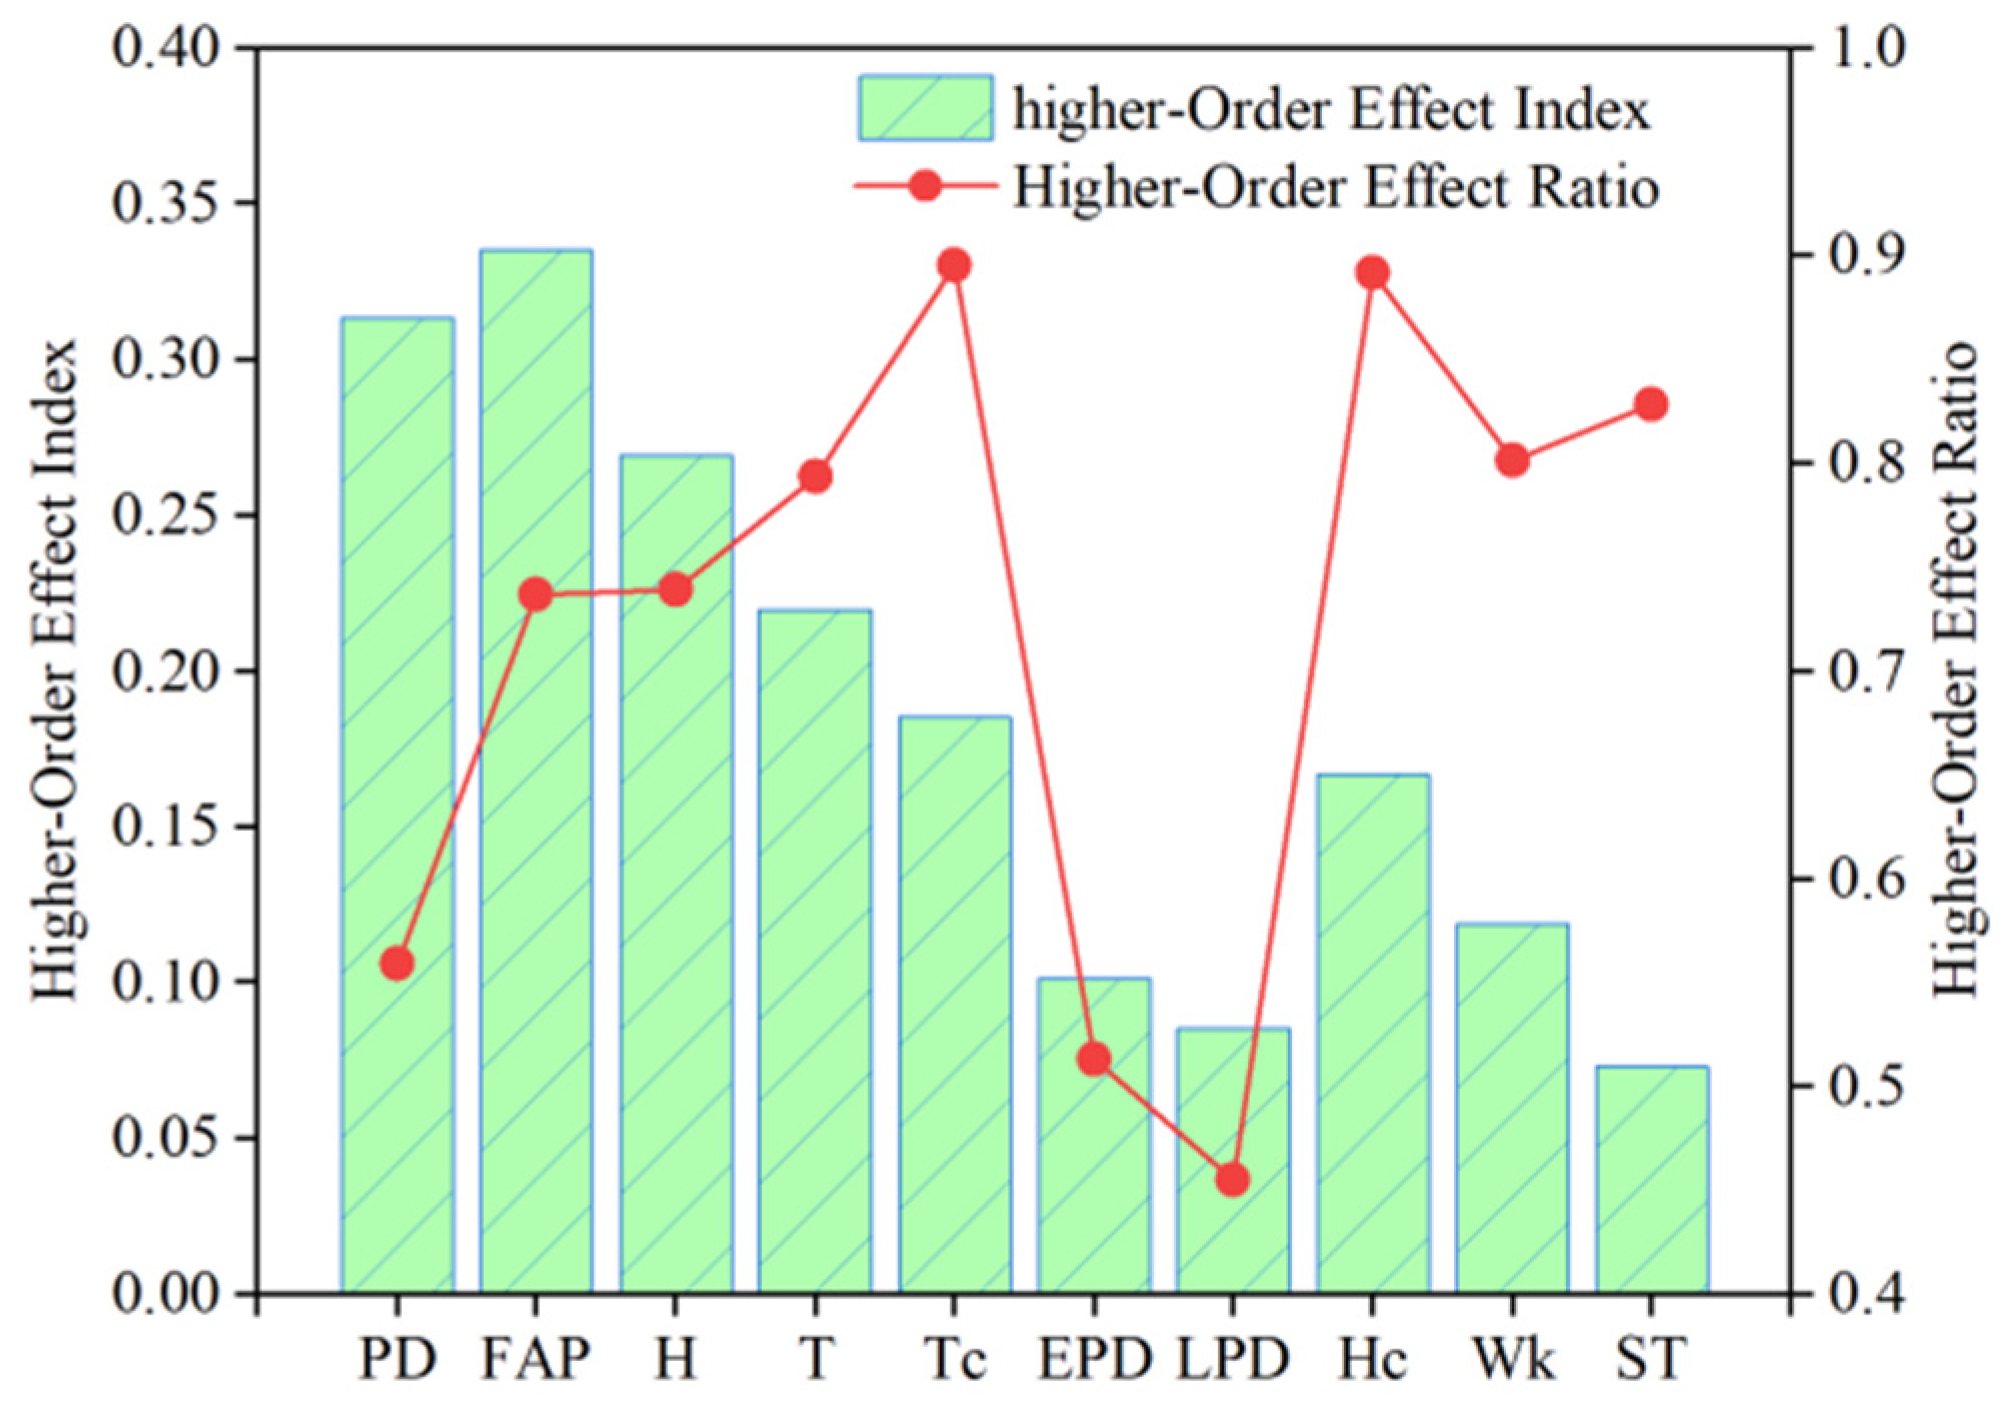
As shown in Figure 8, the difference between SiT and Si values is relatively large for each input parameter, reflecting the significant influence of interaction effects on the total cooling load. For a certain parameter, A larger value of S i T S i S i T indicates that the main influence of this input parameter is primarily attributed to its interaction with other input parameters. In the total cooling-load model, the average S i T S i S i T reached 0.72, demonstrating highly significant interaction effects. It is therefore essential to pay more attention to the high-order effect index between input parameters. This helps to explore the collaborative effect between input parameters and prevents the failure of energy-saving strategies caused by ignoring the interaction effect.
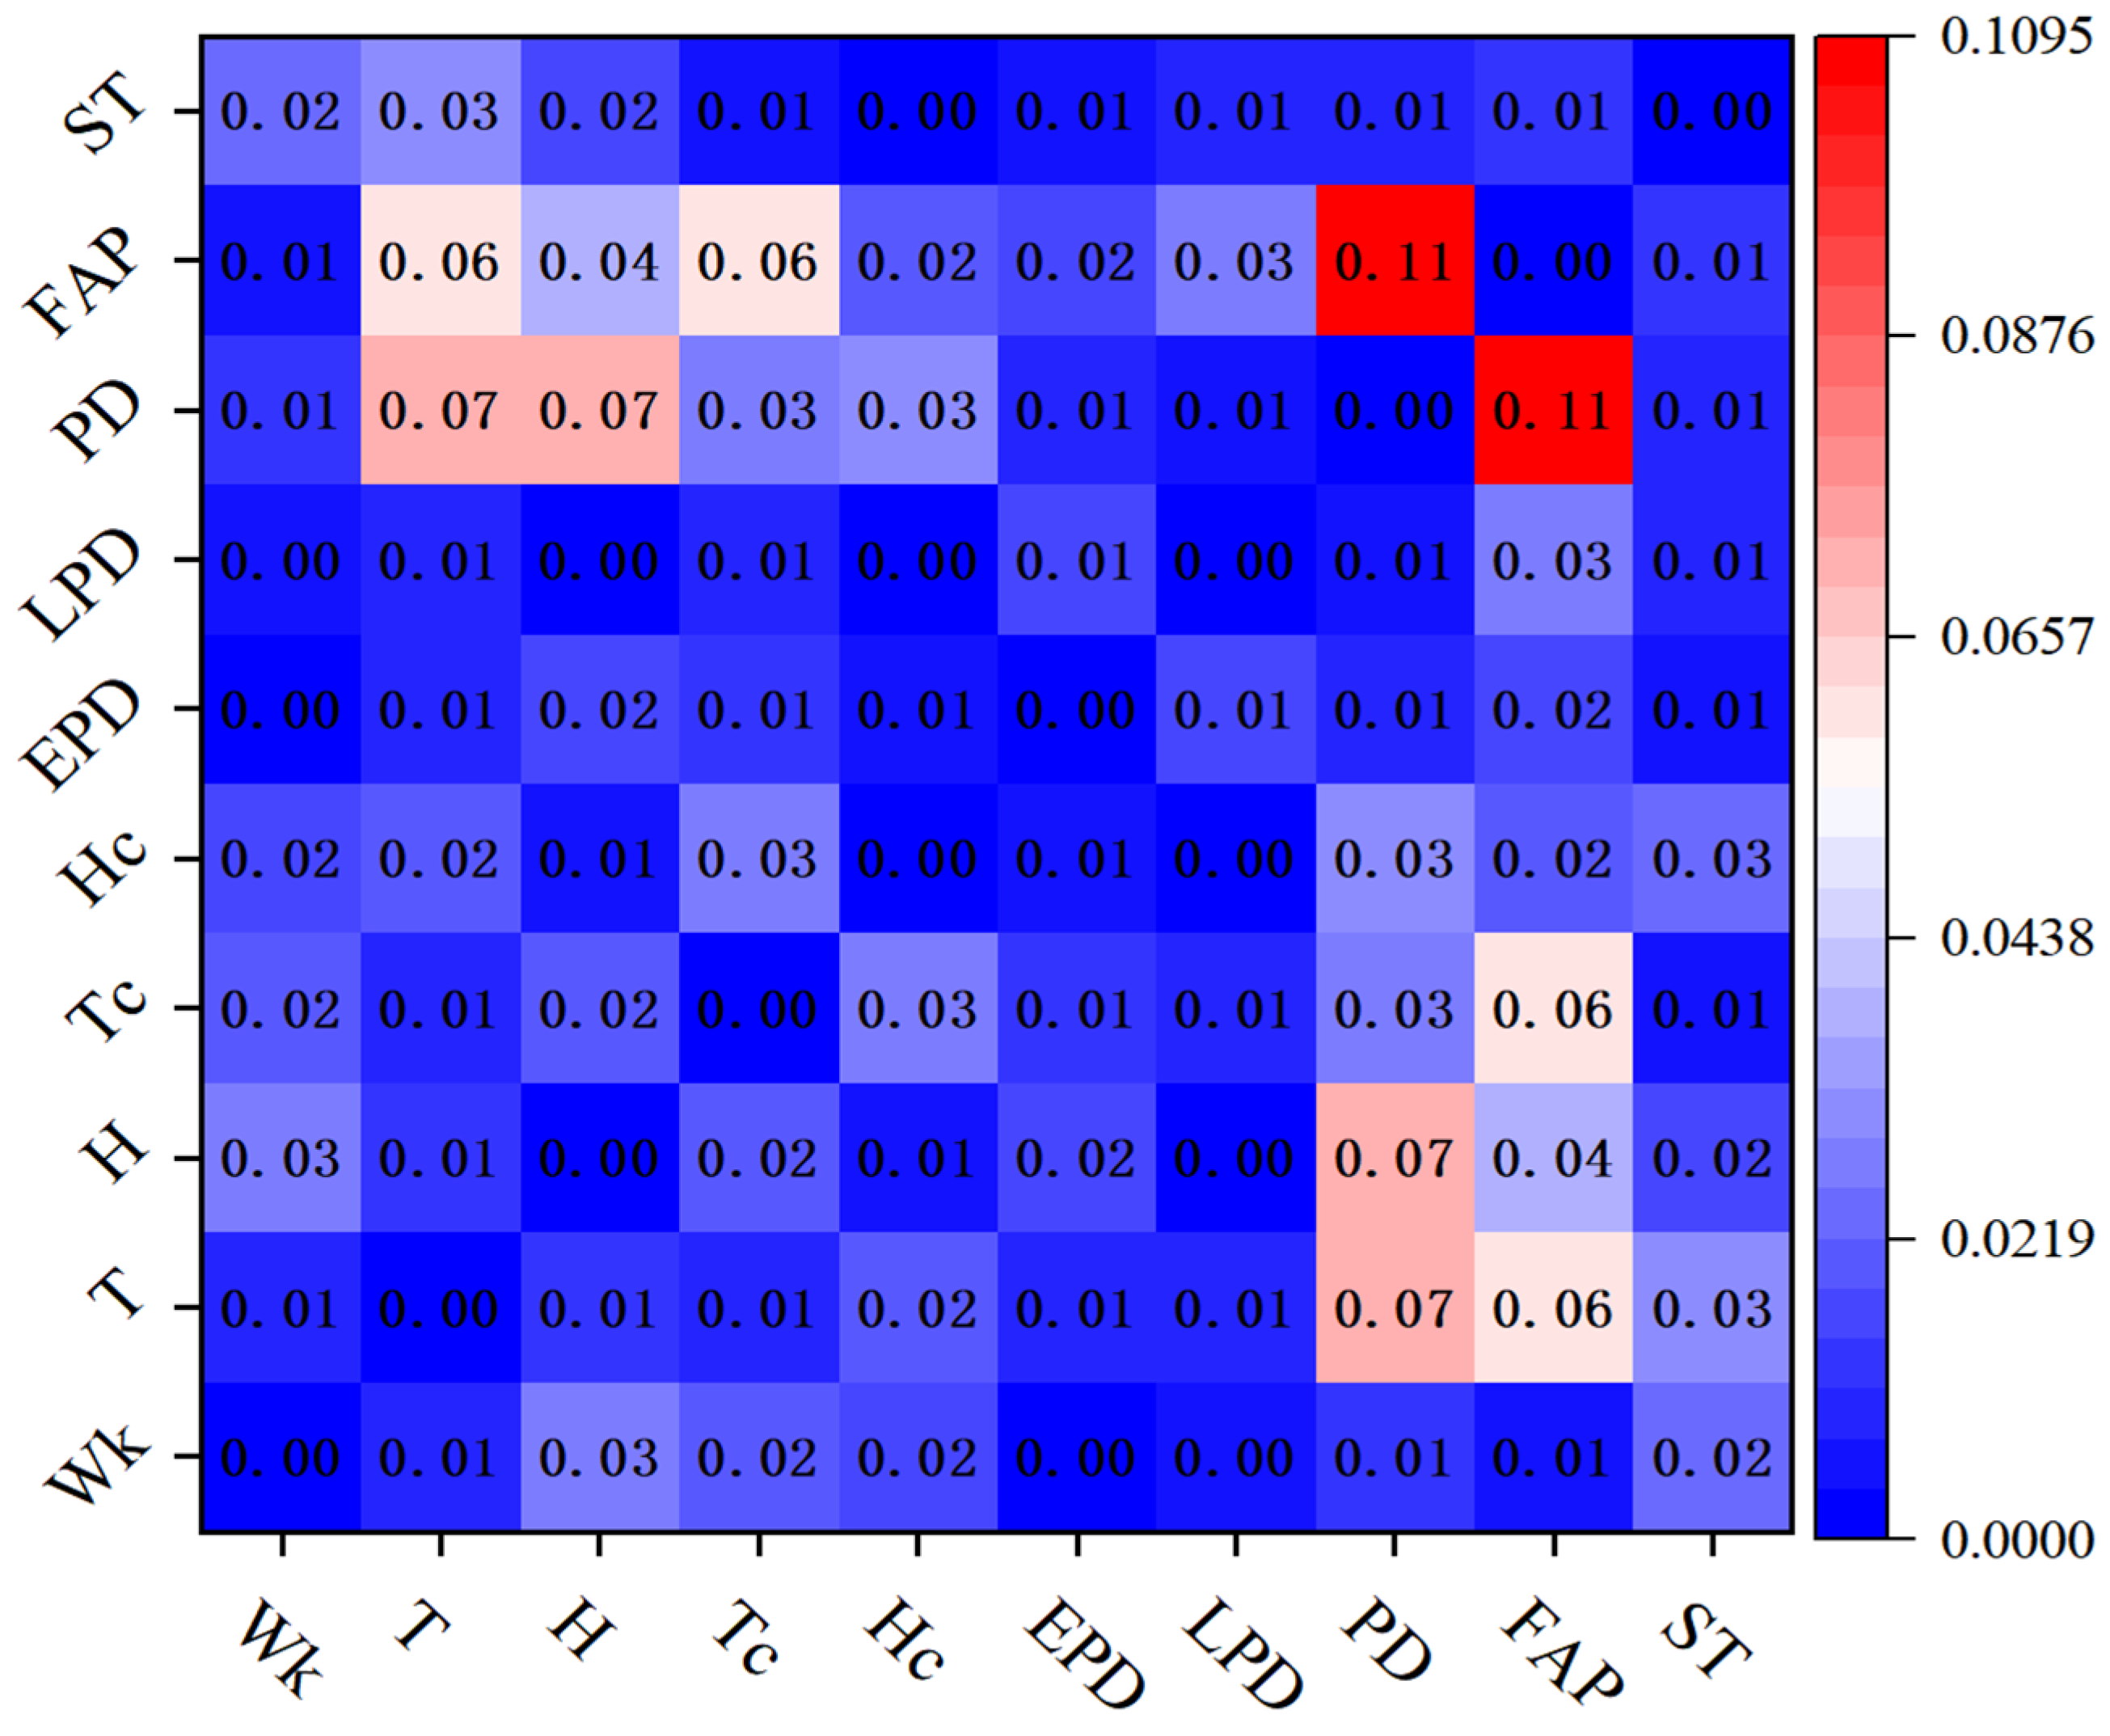
Based on the Sobol variance decomposition theory, the total energy model theoretically has tenth order sensitivity index. Among them, the second-order effect index Sij represents the contribution of the interact effect of two input parameters to the output variance, which is most important and meaningful. When the number of input parameters is less than 15, the second-order effect index Sij can approximately explain 85% to 92% of the total interaction effect contribution. Figure 9 shows the second-order interaction effect between parameters, where red shades indicate stronger interactive contributions.
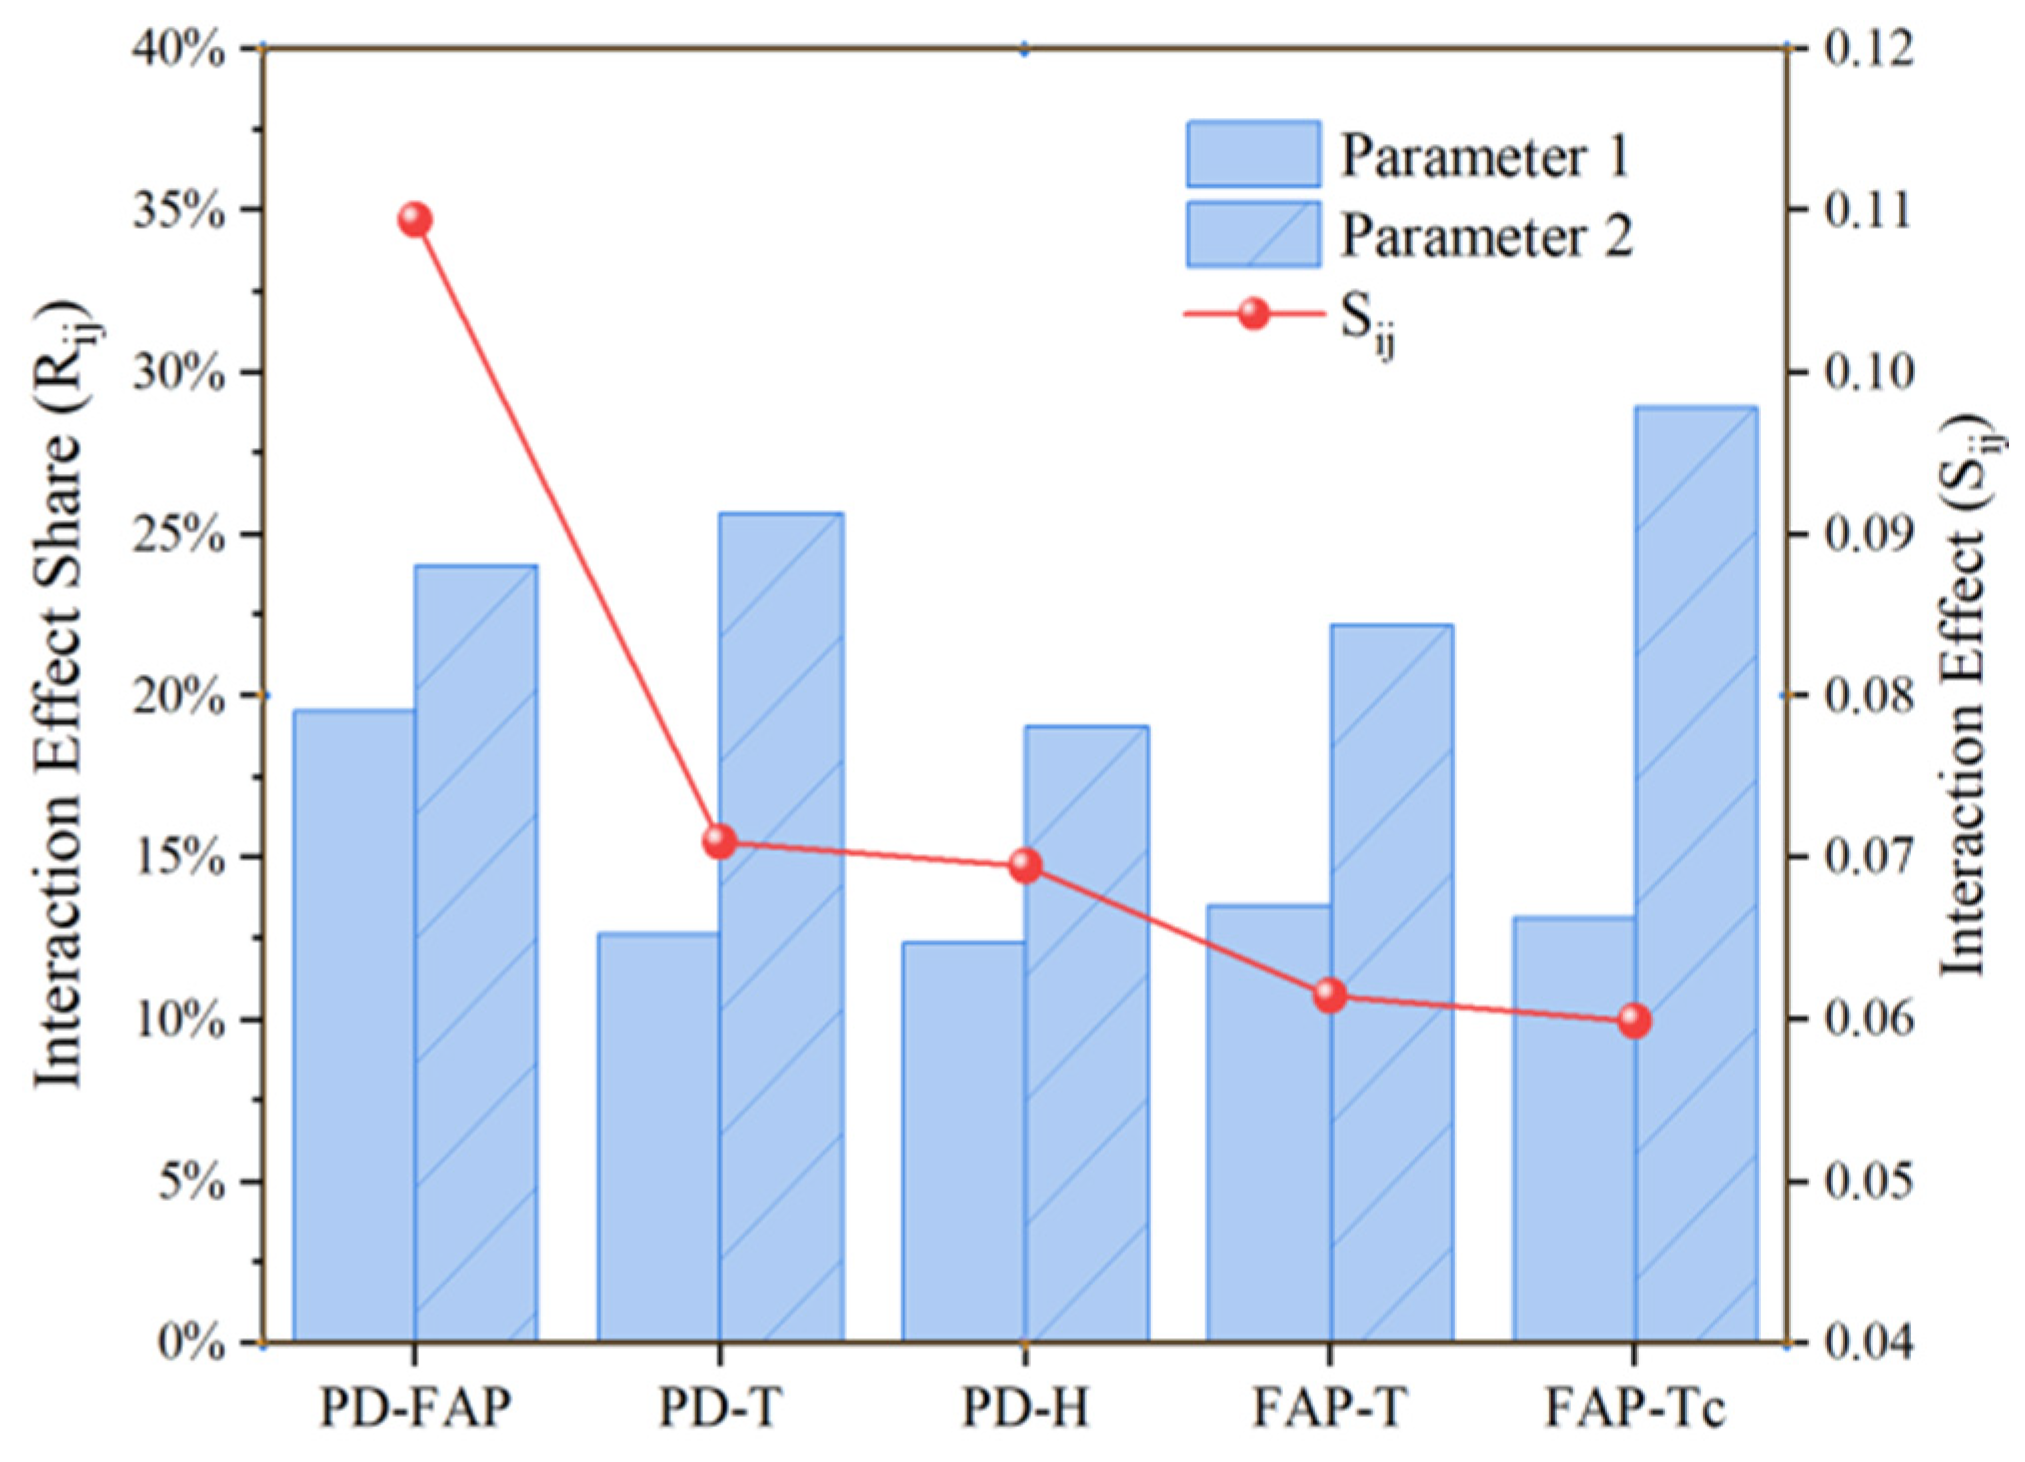
Figure 10 displays the top five parameter combinations with the highest second-order effect index. All five combinations include either occupant density or fresh air volume, and these interaction effect coefficients all exceed 0.05, exerting a practical influence on the total cooling load.
As shown in Figure 11a, the second-order interaction effect coefficient between occupant density and fresh air volume is the largest, reaching 0.1094. Its coupling effect is derived from the nonlinear in total fresh air volume; the fresh air load surged while occupant density and fresh air volume rise simultaneously. The second-order interaction effect index between outdoor temperature and occupant density is 0.07098 (as shown in Figure 11b), and its coupling effect mainly comes from the increase in sensible heat load. If the outdoor temperature is high, the temperature difference between indoor and outdoor increases, further amplifying the total cooling load. The second-order interaction effect index of outdoor humidity and occupant density is 0.06947. The source of this coupling is the increased humidity, which causes a significant increase in the total dehumidification load. In addition, the second-order interaction effect index of outdoor temperature, air-conditioning setpoint temperature, and fresh air volume are also all over 0.55, and their coupling origins are similar, relying on the significant increase in fresh air load caused by their respective changes to affect the total load.
According to the results of Sobol variance-based sensitivity analysis, the composition of the total cooling load in subway station is different from the conventional buildings due to its unique environment and building envelope. During the initial design phase of subway stations, the occupant density and the fresh air volume should be given more attention, reducing their values within a reasonable range. In contrast, there is no need to overly control the building-envelope heat transfer coefficient. For parameters that have a certain influence and are relatively independent, such as lighting equipment, adjustments can be made independently based on cooling-load requirements. In addition to direct controlling individual parameters, applying dynamic strategies for coupling effects can also significantly reduce the total cooling load. For example, the strong interaction effect between occupant density and fresh air volume can be diminished by establishing control over fresh air volume, or optimizing the air distribution position and precisely delivering the air to areas with high occupant density.

5. Discussion

Based on the co-simulation and Sobol global sensitivity analysis, this study systematically quantifies the influence strength of various parameters on the subway station cooling load, revealing the dual dominance of occupant density and fresh air volume alongside significant interaction effects. Compared to previous studies, this study incorporates soil temperature as a variable, employs Saltelli quasi-Monte Carlo method to generate a cooling-load database, and introduces interaction effects into the sensitivity analysis.

5.1. Influence Factors and Comparative Analysis

Occupant density and fresh air volume were identified as the dominant factors, which redefines energy-saving priorities for underground spaces. This finding aligns with the conclusions of Ahn et al. [30] and Guan et al. [31] regarding the importance of passenger flow and ventilation systems. Furthermore, the low sensitivity of the building envelope challenges conventional design paradigms, suggesting a reallocation of resources towards managing dynamic loads. However, this study provides a quantitative ranking of all influencing factors, offering an intuitive and comparable hierarchy for guiding optimization efforts.

5.2. Significance of Interaction Effects

As listed in Table 4, previous sensitivity studies in this field have primarily focused on identifying the most influential factors and parameter ranking, while dedicated investigations into interaction mechanisms have been lacking. The exceptionally strong interaction between PD and FAP uncovered in this study provides the key to explaining many practical energy management challenges. When these two parameters change simultaneously, they produce a nonlinear amplification effect on cooling load—a crucial mechanistic insight that remained obscured in earlier studies using regression or local sensitivity methods. This finding explains why isolated parameter adjustments often yield limited energy savings, pointing to the necessity of developing integrated control strategies that account for these coupling relationships.

6. Conclusions

This study establishes a novel framework that use equal-step discretization and Saltelli quasi-Monte Carlo sampling to establish a simulation database containing 11,264 parameter combinations for subway station cooling-load analysis, along with the EnergyPlus–Python co-simulation approach. The Sobol global sensitivity analysis is applied to systematically quantify the influence degree of each influencing parameter of the subway station, including independent contributions and interaction effects. The results reveal a significant dual-dominance characteristic in the total cooling load of the subway station. Furthermore, interaction effects between parameters have a significant impact on the load, indicating that single-parameter optimization strategies may have limitations. The main conclusions are as follows.
(1)
Based on the total sensitivity index, the ranking of the importance of factors influencing the cooling load in subway stations is as follows: occupant density > fresh air volume > outdoor relative humidity > outdoor dry-bulb temperature > air-conditioning setpoint temperature > lighting power density > equipment power density > air-conditioning setpoint humidity > building-envelope heat transfer coefficient > soil temperature. Among them, occupant density (SiT = 0.5605) fresh air volume (SiT = 0.4546) are the dominant factors influencing the total cooling load. These two parameters contribute approximately 50% of the total load variance together.
(2)
Among meteorological parameters, outdoor relative humidity (SiT = 0.3642) and outdoor dry-bulb temperature (SiT = 0.2768) affect the load by changing the enthalpy value of fresh air. However, their influence is significantly weaker compared to above-ground buildings. This is mainly due to the low and stable soil temperature in the external environment of the underground building envelope. The influence of the building-envelope heat transfer coefficient (SiT = 0.1482) and soil temperature (SiT = 0.0881) is very limited.
(3)
Passenger density (Si = 0.2471) is the most influential independent parameter, driving load variations through passenger heat and moisture dissipation. Lighting power density (Si = 0.1022) and equipment power density (Si = 0.0961) as stable internal heat sources, also exhibit significant independent influences. Although the total effect of fresh air volume and outdoor meteorological parameters is high, their first-order effect index are relatively low, indicating that their independent effects are limited, and the load influence is highly dependent on the interactions with other parameters.
(4)
Five significant second-order interactions were identified according to the Sobol sensitivity analysis, including occupant density and fresh air volume (Sij = 0.1094), occupant density and outdoor dry-bulb temperature (Sij = 0.07098), fresh air volume and outdoor dry-bulb temperature (Sij = 0.06947), fresh air volume and outdoor relative humidity (Sij = 0.06145), air-conditioning setpoint temperature and fresh air volume (Sij = 0.05985). These interactions reveal the nonlinear load response characteristics when multiple parameters change in concert.
Through the parameter sensitivity ranking and interaction effect analysis above, this study reveals the influencing mechanism of cooling loads in subway stations, providing a theoretical basis and quantitative tool for the refined design and operation optimization strategies of underground transportation hubs. This study outlines clear scientific prospects for advancing energy efficiency in subway station and can be used under any climate. Moreover, this study also lays a foundation for future endeavors; specifically, the formulation of specific energy-saving optimization strategies.
This study focuses on the influence of static parameters and does not account for highly dynamic transient disturbances, such as train-induced piston wind. In addition, the findings have not yet been translated into a comprehensive control strategy. Thus, incorporating these dynamic factors into the framework and formulating corresponding control strategies will be a key focus of future work.

Author Contributions

Conceptualization, Y.J.; methodology, W.T.; software, Q.L.; validation, L.Z. and J.W.; formal analysis, W.T.; investigation, M.L., B.D. and J.W.; resources, Z.L., M.L. and B.D.; data curation, Z.L. and W.T.; writing—original draft preparation, Z.L. and W.T.; writing—review and editing, Q.L. and Y.J.; visualization, Q.L.; supervision, Y.J.; project administration, M.L. and L.Z.; funding acquisition, Y.J. All authors have read and agreed to the published version of the manuscript.

Funding

This research was funded by the National Key R&D Program of China [Grant No. 2023YFC3806404] and Suzhou Rail Transit Group Co., Ltd. And the APC was funded by [Grant No. 2023YFC3806404].

Data Availability Statement

The data presented in this study are available on request from the corresponding author. The data are not publicly available due to privacy.

Conflicts of Interest

Author Zhirong Lv, Minfeng Li, and Baoshan Dai were employed by the company Suzhou Rail Transit Group Co., Ltd. The remaining authors declare that the research was conducted in the absence of any commercial or financial relationships that could be construed as a potential conflict of interest. The authors declare that this study received funding from Suzhou Rail Transit Group Co., Ltd. The funder had the following involvement with the study: collection, analysis, interpretation of data.

References

  1. Schwanitz, S.; Wittkowski, M.; Rolny, V.; Samel, C.; Basner, M. Continuous assessments of pressure comfort on a train—A field-laboratory comparison. Appl. Ergon. 2013, 44, 11–17. [Google Scholar] [CrossRef]
  2. Mohammadi, A.; Amador-Jimenez, L.; Nasiri, F. A multi-criteria assessment of the passengers’ level of comfort in urban railway rolling stock. Sustain. Cities Soc. 2020, 53, 101892. [Google Scholar] [CrossRef]
  3. Niu, J.; Zhou, D.; Liang, X.; Liu, T.; Liu, S. Numerical study on the aerodynamic pressure of a metro train running between two adjacent platforms. Tunn. Undergr. Space Technol. 2017, 65, 187–199. [Google Scholar] [CrossRef]
  4. China Association of Metros. 2024 Annual Statistics and Analysis Report on Urban Rail Transit. 2024. Available online: https://www.camet.org.cn/xytj/tjxx/660844283682885.shtml (accessed on 28 March 2025).
  5. Su, X.; Huang, Y.; Wang, L.; Tian, S.; Luo, Y. Operating optimization of air-conditioning water system in a subway station using data mining and dynamic system models. J. Build. Eng. 2021, 44, 103379. [Google Scholar] [CrossRef]
  6. Yang, G.; Zhai, X. Optimal design and performance analysis of solar hybrid CCHP system considering influence of building type and climate condition. Energy 2019, 174, 647–663. [Google Scholar] [CrossRef]
  7. Yang, G.; Zhai, X. Optimization and performance analysis of solar hybrid CCHP systems under different operation strategies. Appl. Therm. Eng. 2018, 133, 327–340. [Google Scholar] [CrossRef]
  8. State Council of the People’s Republic of China. *Energy Conservation and Carbon Reduction Action Plan for 2024–2025. 2024. Available online: http://www.gov.cn/zhengce/content/2024-05/23/content_6954682.htm (accessed on 23 May 2024).
  9. GB/T 45902-2025; General Technical Requirements for Energy-Saving Control Systems of Ventilation and Air Conditioning in Urban Rail Transit Stations. Standardization Administration of the People’s Republic of China: Beijing, China, 2025. Available online: https://std.samr.gov.cn/gb/search/gbDetailed?id=E711ED782A31B4BAE05397BE0A0AED40 (accessed on 30 June 2025).
  10. Mastrucci, A.; Pérez-López, P.; Benetto, E.; Leopold, U.; Blanc, I. Global sensitivity analysis as a support for the generation of simplified building stock energy models. Energy Build. 2017, 149, 368–383. [Google Scholar] [CrossRef]
  11. Saltelli, A.; Annoni, P.; Azzini, I.; Campolongo, F.; Ratto, M.; Tarantola, S. Variance based sensitivity analysis of model output. Design and estimator for the total sensitivity index. Comput. Phys. Commun. 2010, 181, 259–270. [Google Scholar] [CrossRef]
  12. Su, Z.; Li, X. Energy benchmarking analysis of subway station with platform screen door system in China. Tunn. Undergr. Space Technol. 2022, 128, 104655. [Google Scholar] [CrossRef]
  13. Li, H.; Tang, B.; Che, L.; Liu, J.; Su, X. Energy Saving Potential of Air Conditioning System of Equipment Stations in Metro Systems. Procedia Eng. 2017, 205, 3519–3524. [Google Scholar] [CrossRef]
  14. Jiao, H.; Feng, H.; Wei, D.; Ran, Y.; Hu, Z. Energy saving control for the subway station air conditioning systems based on reinforcement learning. Control. Decis. 2021, 37, 3139–3148. (In Chinese) [Google Scholar]
  15. Wang, J.; Yin, Y.; Wei, Z.; Zhai, X. Cooling load analysis based on theory-based models and field tests for VAC system in subway station: A case study. Energy 2025, 314, 134219. [Google Scholar] [CrossRef]
  16. Hu, Y.; Qin, L.; Li, S.; Li, X.; Zhou, R.; Li, Y.; Sheng, W. Adaptive corrected parameters algorithm applied in cooling load prediction based on black-box model: A case study for subway station. Energy Build. 2023, 297, 113429. [Google Scholar] [CrossRef]
  17. Zhang, H.; Li, Z.; Fan, X.; Duan, D.; Zheng, W. Air-conditioning load characteristics and grey box predicting model in subway stations. J. Build. Eng. 2024, 91, 109656. [Google Scholar] [CrossRef]
  18. Guan, B.; Liu, X.; Zhang, T.; Wang, X. Hourly energy consumption characteristics of metro rail transit: Train traction versus station operation. Energy Built Environ. 2023, 4, 568–575. [Google Scholar] [CrossRef]
  19. Lian, H.; Wei, H.; Wang, X.; Chen, F.; Ji, Y.; Xie, J. Research on Real-Time Energy Consumption Prediction Method and Characteristics of Office Buildings Integrating Occupancy and Meteorological Data. Buildings 2025, 15, 404. [Google Scholar] [CrossRef]
  20. Guan, Y.; Hu, C.; Meng, X. Formation analysis of cooling load from envelopes under air-conditioning intermittent operation. Sol. Energy 2025, 292, 113428. [Google Scholar] [CrossRef]
  21. Ao, J.; Du, C.; Bellamy, L.; Li, B. Integration of thermal-daylighting climate subzones and energy efficiency design optimization for office buildings. J. Build. Eng. 2025, 99, 111669. [Google Scholar] [CrossRef]
  22. Lian, H.; Ji, Y.; Niu, M.; Gu, J.; Xie, J.; Liu, J. A hybrid load prediction method of office buildings based on physical simulation database and LightGBM algorithm. Appl. Energy 2025, 377, 124620. [Google Scholar] [CrossRef]
  23. Yu, Y.; You, S.; Zhang, H.; Wei, S.; Liu, T.; Guo, X.O.; Luo, N.; Chen, W. An empirical study estimating train-induced airflow rate and its effect on the cooling load of underground stations. J. Build. Eng. 2025, 105, 112413. [Google Scholar] [CrossRef]
  24. Kong, G.; Hu, S.; Yang, Q. Uncertainty method and sensitivity analysis for assessment of energy consumption of underground metro station. Sustain. Cities Soc. 2023, 92, 104504. [Google Scholar] [CrossRef]
  25. Jiang, X.; Ding, Y.; Zhang, D.; He, Y.; Yan, H.; Yao, Y.; Hou, Y. How does heat move seasonally in deep-buried underground stations? Insights into the “Source-Path-Sink” mechanism from Chongqing. Build. Environ. 2025, 283, 113369. [Google Scholar] [CrossRef]
  26. Ren, T.; Li, M.; Wang, D.; Yang, J.; Kong, L.; He, L. Theoretical and numerical studies of heat and humidity transfer in underground ventilation corridor. Int. J. Heat Fluid Flow 2025, 112, 109765. [Google Scholar] [CrossRef]
  27. Akram, M.W.; Guo, H.; Hu, W. Numerical simulation of heat transfer through rock envelope of a plant factory in an underground mine tunnel. Energy Built Environ. 2025, in press. [Google Scholar] [CrossRef]
  28. Yin, H.; Yang, C.; Yi, L.; Yu, J.; Wu, Y.; Deng, Y.; Tang, Z. Ventilation and air conditioning system of deep-buried subway station in sub-tropical climates: Energy-saving strategies. Appl. Therm. Eng. 2020, 178, 115555. [Google Scholar] [CrossRef]
  29. Bi, H.; Zhou, Y.; Liu, J.; Wang, H.; Yu, T. Load forecast and fuzzy control of the air-conditioning systems at the subway stations. J. Build. Eng. 2022, 49, 104029. [Google Scholar] [CrossRef]
  30. Ahn, J.; Cho, S.; Chung, D.H. Development of a statistical analysis model to benchmark the energy use intensity of subway stations. Appl. Energy 2016, 179, 488–496. [Google Scholar] [CrossRef]
  31. Guan, B.; Liu, X.; Zhang, T.; Xia, J. Energy consumption of subway stations in China: Data and influencing factors. Sustain. Cities Soc. 2018, 43, 451–461. [Google Scholar] [CrossRef]
  32. Ren, Z.; Kim, J.I.; Kim, J. Assessment methodology for dynamic occupancy adaptive HVAC control in subway stations integrating passenger flow simulation into building energy modeling. Energy Build. 2023, 300, 113667. [Google Scholar] [CrossRef]
  33. Su, Z.; Li, X. Extraction of key parameters and simplification of sub-system energy models using sensitivity analysis in subway stations. Energy 2022, 261, 125285. [Google Scholar] [CrossRef]
  34. Sanchez, D.G.; Lacarrière, B.; Musy, M.; Bourges, B. Application of sensitivity analysis in building energy simulations: Combining first- and second-order elementary effects methods. Energy Build. 2014, 68, 741–750. [Google Scholar] [CrossRef]
  35. Saltelli, A.; Ratto, M.; Andres, T.; Campolongo, F.; Cariboni, J.; Gatelli, D.; Saisana, M.; Tarantola, S. Global Sensitivity Analysis the Primer; John Wiley: Hoboken, NJ, USA, 2008. [Google Scholar]
  36. Pianosi, F.; Beven, K.; Freer, J.; Hall, J.W.; Rougier, J.; Stephenson, D.B.; Wagener, T. Sensitivity analysis of environmental models: A systematic review with practical workflow. Environ. Model. Softw. 2016, 79, 214–232. [Google Scholar] [CrossRef]
  37. Morris, M.D. Factorial Sampling Plans for Preliminary Computational Experiments. Technometrics 1991, 33, 161–174. [Google Scholar] [CrossRef]
  38. Tian, W. A review of sensitivity analysis methods in building energy analysis. Renew. Sustain. Energy Rev. 2013, 20, 411–419. [Google Scholar] [CrossRef]
  39. Mechri, H.E.; Capozzoli, A.; Corrado, V. USE of the ANOVA approach for sensitive building energy design. Appl. Energy 2010, 87, 3073–3083. [Google Scholar] [CrossRef]
  40. Tian, W.; de Wilde, P. Uncertainty and sensitivity analysis of building performance using probabilistic climate projections: A UK case study. Autom. Constr. 2011, 20, 1096–1109. [Google Scholar] [CrossRef]
  41. Wilde, P.; Tian, W. Identification of key factors for uncertainty in the prediction of the thermal performance of an office building under climate change. Build. Simul. 2009, 2, 157–174. [Google Scholar] [CrossRef]
  42. Neale, J.; Shamsi, M.H.; Mangina, E.; Finn, D.; O’Donnell, J. Accurate identification of influential building parameters through an integration of global sensitivity and feature selection techniques. Appl. Energy 2022, 315, 118956. [Google Scholar] [CrossRef]
  43. Ebrahimi-Moghadam, A.; Farzaneh-Gord, M.; Abadi, M.K. Sensitivity analysis and working fluid selection for a biogas-fueled hybrid energy system based on nearly zero energy building concept: A case study. J. Clean. Prod. 2024, 435, 140499. [Google Scholar] [CrossRef]
  44. Tootkaboni, M.P.; Ballarini, I.; Corrado, V. Towards climate resilient and energy-efficient buildings: A sensitivity analysis on building components and cooling strategies. Build. Environ. 2025, 270, 112473. [Google Scholar] [CrossRef]
  45. Tajuddeen, I.; Rodrigues, E. A Morris sensitivity analysis of an office building’s thermal design parameters under climate change in sub-Saharan Africa. Build. Environ. 2024, 262, 111771. [Google Scholar] [CrossRef]
  46. Zhu, L.; Zhang, J.; Gao, Y.; Tian, W.; Yan, Z.; Ye, X.; Sun, Y.; Wu, C. Uncertainty and sensitivity analysis of cooling and heating loads for building energy planning. J. Build. Eng. 2022, 45, 103440. [Google Scholar] [CrossRef]
  47. Pang, Z.; O’Neill, Z. Uncertainty quantification and sensitivity analysis of the domestic hot water usage in hotels. Appl. Energy 2018, 232, 424–442. [Google Scholar] [CrossRef]
  48. Delgarm, N.; Sajadi, B.; Azarbad, K.; Delgarm, S. Sensitivity analysis of building energy performance: A simulation-based approach using OFAT and variance-based sensitivity analysis methods. J. Build. Eng. 2018, 15, 181–193. [Google Scholar] [CrossRef]
  49. Zhang, H.; Tian, W.; Tan, J.; Yin, J.; Fu, X. Sensitivity analysis of multiple time-scale building energy using Bayesian adaptive spline surfaces. Appl. Energy 2024, 363, 123042. [Google Scholar] [CrossRef]
  50. Gauch, H.L.; Dunant, C.F.; Hawkins, W.; Serrenho, A.C. What really matters in multi-storey building design? A simultaneous sensitivity study of embodied carbon, construction cost, and operational energy. Appl. Energy 2023, 333, 120585. [Google Scholar] [CrossRef]
  51. Mavromatidis, G.; Orehounig, K.; Carmeliet, J. Uncertainty and global sensitivity analysis for the optimal design of distributed energy systems. Appl. Energy 2018, 214, 219–238. [Google Scholar] [CrossRef]
  52. Homma, T.; Saltelli, A. Importance measures in global sensitivity analysis of nonlinear models. Reliab. Eng. Syst. Saf. 1996, 52, 1–17. [Google Scholar] [CrossRef]
  53. Shi, Q.; Xu, Z.; Lv, X.; Zhang, P. Parameter sensitivity analysis of SWMM Model based on local and global methods. Water Resour. Hydropower Eng. 2025, 1–23. Available online: https://link.cnki.net/urlid/10.1746.TV.20241227.1138.002 (accessed on 28 March 2025). (In Chinese).
  54. Xiang, X.; Ao, T.; Xiao, Q.; Li, X.; Zhou, L.; Chen, Y.; Bi, Y.; Guo, J. Parameter Sensitivity Analysis of SWAT Modeling in the Upper Heihe River Basin Using Four Typical Approaches. Appl. Sci. 2022, 12, 9862. [Google Scholar] [CrossRef]
  55. ISO 7730:2005; Ergonomics of the Thermal Environment—Analytical Determination and Interpretation of Thermal Comfort Using Calculation of the PMV and PPD Indices and Local Thermal Comfort Criteria. International Organization for Standardization: Geneva, Switzerland, 2005.
  56. GB 50176-2016; Ministry of Housing and Urban-Rural Development of the People’s Republic of China. Code for Thermal Design of Civil Buildings. China Architecture & Building Press: Beijing, China, 2016.
  57. National Renewable Energy Laboratory. EnergyPlus Weather Data [Data set]. U.S. Department of Energy. 2023. Available online: https://energyplus.net/weather (accessed on 1 April 2005).
  58. Zhang, Z.; Shi, X.; Yu, D.; Wang, H.; Zhao, Y.; Sun, W.; Huang, B. Seasonal variation and regional differentiation of soil temperature in China. Acta Pedol. Sin. 2009, 46, 227–234. (In Chinese) [Google Scholar]
  59. GB 50189-2015; Ministry of Housing and Urban-Rural Development of the People’s Republic of China. Design Standard for Energy Efficiency of Public Buildings. China Architecture & Building Press: Beijing, China, 2015.
  60. GB/T 16275-2008; Standardization Administration of the People’s Republic of China. Classification and Terminology for Urban Rail Transit. Standards Press of China: Beijing, China, 2008.
  61. GB 50137-2013; Ministry of Housing and Urban-Rural Development of the People’s Republic of China. Code for Design of Urban Rail Transit. China Architecture & Building Press: Beijing, China, 2013.
  62. Wang, Z.; Jia, S.; Dai, Z.; Yin, S.; Zhang, X.; Yang, Z.; Thanh, H.V.; Ling, H.; Soltanian, M.R. Environmental risk evaluation for radionuclide transport through natural barriers of nuclear waste disposal with multi-scale streamline approaches. Sci. Total Environ. 2024, 953, 176084. [Google Scholar] [CrossRef] [PubMed]
  63. Liu, Y.; Zhang, Z.; Zhang, Z.; Liu, G.; Fang, Y.; Song, Y.; Li, J.; Sun, K.; Feng, Y. Coupled LCA, AHP- and Monte Carlo sensitivity analysis: A comprehensive assessment of estrogen-containing municipal wastewater treatment by AO and AAO processes. Chem. Eng. J. 2025, 511, 161922. [Google Scholar] [CrossRef]
Figure 1. Technology roadmap for the proposed cooling-load analysis methodology.
Buildings 15 03858 g001
Figure 2. Schematic diagram of the public area of the subway station.
Buildings 15 03858 g002
Figure 3. Hourly outdoor dry-bulb temperature and humidity in Suzhou.
Buildings 15 03858 g003
Figure 4. Comparison between calculated load and actual load on 21 July.
Buildings 15 03858 g004
Figure 5. Discrete value levels for all input parameters.
Buildings 15 03858 g005
Figure 6. Three-dimensional projections of the Saltelli sample distribution.
Buildings 15 03858 g006
Figure 7. Input parameter first-order and total effect Sobol index.
Buildings 15 03858 g007
Figure 8. Input parameter interaction effect index and its proportion to the total effect.
Buildings 15 03858 g008
Figure 9. Second-order interaction effect heatmap.
Buildings 15 03858 g009
Figure 10. Top five parameter combinations with the highest second-order interaction effect index.
Buildings 15 03858 g010
Figure 11. Schematic diagram of the two strongest parameter coupling effects.
Buildings 15 03858 g011
Table 1. Classification and feature comparison of global sensitivity analysis methods.
CategoryMethodSignificanceMathematical Expression
Regression-based sensitivity method [36]PEARMeasures the linear correlation coefficient between the output variable Y and a single input parameter Xi Suitable for linear regression models. ρ X i , Y = cov ( X i , Y ) σ X i σ Y
SRCComputes the strength of correlation between Y and Xj via a linear regression model. Applicable to linear models. Y = β 0 + j β j X j + ε
PCCPartial Correlation Coefficient; quantifies the independent linear influence of Xj on Y through regression, ignoring interactions among input parameters. ρ X , Y Z = ρ X , Y ρ X , Z ρ Z , Y ( 1 ρ X , Z 2 ) ( 1 ρ Y , Z 2 )
Screening-based sensitivity method [37]MorrisA model-agnostic method that computes partial derivatives of the model at uniformly distributed points across the input parameter space and averages these derivatives as an indicator of each parameter’s influence. E E i ( x ) = f ( x 1 , , x i + Δ , , x k ) f ( x ) Δ
Variance-based sensitivity analysis method [11]SobolA model-independent method based on variance decomposition; quantifies the contribution of input parameters to output uncertainty. Capable of accurately distinguishing main effects, interaction effects, and total effects. V a r ( Y ) = i V i + i < j V i j + i < j < l V i j l + + V 12 k
Metamodel-based sensitivity analysis methodMARSMultivariate Adaptive Regression Splines; combines spline regression with stepwise model fitting and recursive partitioning./
Table 2. Parametric configuration for subway station load influence factors.
SortParameterLabelValue RangeDiscrete StepUnitSelection Basis
Basic thermal parameters of the stationHeat transfer coefficientWk0.1–1.90.3W/(m2·K)[56]
Meteorological informationDry-bulb temperatureT26–402°C[57]
Relative humidityH20–10010/
Soil temperatureST18–262°C[58]
Internal load disturbanceOccupant densityPD0–5000500p/hFrom history data
Equipment power densityEPD5–305W/m2[59]
Lighting power densityLPD0–153W/m2[60]
Indoor environment controlTemperatureTc26–301°C[61]
Relative humidityHc40–705/
Fresh airFAP0–305m3/(h·p)
Table 3. Sobol index for each parameter.
LabelSiSiTSiTSi
PD0.24710.56050.3134
FAP0.11960.45460.335
H0.0950.36420.2692
T0.05720.27680.2196
Tc0.02170.20690.1852
EPD0.09610.19730.1012
LPD0.10220.18760.0854
Hc0.02020.18690.1667
Wk0.02940.14820.1188
ST0.01510.08810.073
Table 4. Comparison of key aspects in subway station cooling-load studies.
AspectThis StudyYu et al. [23]Kong et al. [24]Ahn et al. [30]
Key FindingsQuantified parameter ranking
Strong interaction effects identified
Train-induced airflow significantly impacts loadOutdoor temperature and equipment parameters dominatePassenger flow as a key variable in multi-factor benchmark model
SignificanceSystematic quantification and ranking
Interaction effects introduced
Corrects inaccuracies in traditional design methodsHighlights load driver differences by functional zoneEstablishes a energy benchmark regression model
AdvantagesComprehensive and quantitative method
Novel insight into interaction mechanisms
Strong empirical evidence (field measurements)Considers parameter uncertainty Based on extensive operational data (157 stations)
DisadvantagesExcludes dynamic disturbances
No specific control strategy
Single-factor focus, lacks multi-factor comparisonExcludes passenger factorsCannot reveal physical mechanisms or interactions
Disclaimer/Publisher’s Note: The statements, opinions and data contained in all publications are solely those of the individual author(s) and contributor(s) and not of MDPI and/or the editor(s). MDPI and/or the editor(s) disclaim responsibility for any injury to people or property resulting from any ideas, methods, instructions or products referred to in the content.