Abstract
We propose a novel meta-learning enhanced 3D CNN-LSTM framework for durability prediction. The framework integrates 3D microstructural data from micro-CT scanning with environmental time-series data through a dual-branch architecture: a 3D CNN branch extracts spatial degradation patterns from volumetric data, while an LSTM network processes temporal environmental factors. To address data scarcity, we incorporate a prototypical network-based meta-learning module that learns class prototypes from limited support samples and generalizes predictions to new corrosion scenarios through distance-based probability estimation. Additionally, we develop a dynamic feature fusion mechanism that adaptively combines spatial, environmental, and mechanical features using trainable attention coefficients, enabling context-aware representation learning. Finally, an interface damage visualization component identifies critical degradation zones and propagation trajectories, providing interpretable engineering insights. Experimental validation on laboratory specimens demonstrates superior accuracy (74.6% in 1-shot scenarios) compared to conventional methods, particularly in aggressive corrosion environments where data scarcity typically hinders reliable prediction. The visualization system generates interpretable 3D damage maps with an average Intersection-over-Union of 0.78 compared to ground truth segmentations. This work establishes a unified computational framework bridging microstructure analysis with macroscopic durability assessment, offering practical value for infrastructure maintenance decision-making under uncertainty. The modular design facilitates extension to diverse interface types and environmental conditions.
1. Introduction
The mechanical metal–concrete interface represents a critical yet vulnerable component in modern infrastructure systems, where microstructural evolution directly determines long-term durability and structural integrity. Traditional approaches relying on 2D image analysis [1] have proven inadequate for capturing the complex three-dimensional degradation mechanisms that govern interface performance. While 3D convolutional neural networks (CNNs) offer promising capabilities for volumetric data analysis [2], their application to metal–concrete interfaces faces two fundamental challenges: the scarcity of labeled historical data across diverse corrosion scenarios, and the difficulty in integrating spatial microstructural features with temporal environmental factors.
Recent advances in meta-learning provide a potential solution to the data scarcity problem by enabling few-shot learning strategies [3]. These techniques allow models to generalize from limited examples by learning transferable feature representations across related tasks. However, existing approaches typically focus on either spatial or temporal data analysis separately, neglecting the coupled nature of microstructural evolution and environmental exposure in real-world interface degradation. Furthermore, conventional feature fusion methods often employ static combination rules [4], failing to adapt to the varying importance of different feature types throughout the corrosion process.
We propose a novel framework that addresses these limitations through three key innovations: (1) 3D Convolutional Neural Networks (3D CNNs) are deep learning architectures specifically designed to process volumetric data through three-dimensional convolutional operations, enabling spatial feature extraction from 3D microstructural images; (2) Long Short-Term Memory (LSTM) networks are recurrent neural networks capable of learning long-term dependencies in sequential data, making them suitable for modeling temporal environmental factors; and (3) meta-learning refers to machine learning approaches that enable models to rapidly adapt to new tasks with limited data by leveraging knowledge acquired from related tasks during training. These components form the technical foundation of our proposed Meta3DNet framework.
First, a dual-branch architecture combines 3D CNN for spatial feature extraction with LSTM networks for processing environmental time-series data, enabling comprehensive analysis of both structural and exposure factors. Second, we introduce a meta-learning module based on prototypical networks that learns to predict interface durability from limited examples by constructing class prototypes in a learned metric space. Third, a dynamic feature fusion mechanism automatically adjusts the contribution of different feature types during prediction, allowing the model to emphasize either microstructural or environmental features depending on the corrosion stage.
The proposed method offers significant advantages over existing approaches. Unlike traditional 2D analysis methods, our 3D CNN branch captures the full spatial complexity of interface degradation. Compared to standard deep learning models that require large datasets, our meta-learning component enables reliable predictions with limited training samples. The dynamic fusion mechanism surpasses static fusion approaches [5] by adaptively weighting features based on their predictive relevance. Additionally, our framework includes a visualization system [6,7] that translates model predictions into interpretable damage progression maps, bridging the gap between computational analysis and engineering practice.
This research makes four main contributions to the field of structural health monitoring. We develop the first integrated framework that combines 3D microstructure analysis with environmental time-series processing for metal–concrete interface assessment. The meta-learning component establishes a new paradigm for few-shot durability prediction in materials engineering. The dynamic feature fusion mechanism provides a principled approach to combining heterogeneous data types in degradation analysis. Finally, the visualization system offers practical tools for infrastructure maintenance decision-making.
The remainder of this paper is organized as follows: Section 2 reviews related work on microstructural analysis and few-shot learning in materials engineering. Section 3 provides background on 3D microstructure imaging, CNN architectures, and meta-learning fundamentals. Section 4 details our proposed Meta3DNet framework. Section 5 and Section 6 present the experimental setup and results, followed by discussion and conclusion in Section 7 and Section 8.
2. Related Work on Microstructural Analysis and Few-Shot Learning in Materials Engineering
The study of metal–concrete interface durability spans multiple research domains, including materials science, structural engineering, and machine learning. Existing approaches can be broadly categorized into three directions: microstructure characterization techniques, deep learning applications for materials analysis, and few-shot learning methods for engineering problems.
2.1. Microstructure Characterization Techniques
Traditional microstructure analysis relied heavily on 2D imaging techniques such as optical microscopy and scanning electron microscopy [8]. While these methods provided valuable insights, they failed to capture the three-dimensional nature of interface degradation processes. The advent of micro-CT scanning revolutionized microstructure analysis by enabling non-destructive 3D imaging at micrometer resolution [9]. This technology has been particularly valuable for studying concrete durability, allowing researchers to track pore structure evolution and crack propagation in three dimensions. However, quantitative analysis of these complex 3D datasets remains challenging, especially when attempting to correlate microstructural changes with macroscopic performance metrics.
2.2. Deep Learning for Materials Analysis
Deep learning approaches have shown remarkable success in analyzing materials microstructure data. Convolutional neural networks have been widely adopted for defect detection and classification in 2D micrographs [10]. The extension to 3D CNNs enabled more comprehensive analysis of volumetric data, with applications ranging from pore network characterization to damage prediction [11]. Recent work has combined CNNs with recurrent architectures like LSTM to model time-dependent degradation processes [12]. However, these approaches typically require large labeled datasets for training, which are often unavailable for specific corrosion scenarios or material combinations.
2.3. Few-Shot Learning in Engineering Applications
The challenge of limited training data has motivated research into few-shot learning techniques for engineering problems. Meta-learning approaches, particularly prototypical networks, have demonstrated success in medical image analysis and industrial defect detection with small datasets [13]. In materials science, these methods have been applied to predict material properties from limited experimental data [14]. However, existing applications have primarily focused on either spatial or temporal data analysis separately, without addressing the combined spatial–temporal nature of interface degradation processes.
The proposed framework advances beyond current approaches by integrating 3D microstructure analysis with environmental time-series processing through a meta-learning paradigm. Unlike previous works that treated these aspects independently, our method jointly models spatial and temporal degradation factors. The prototypical network component extends beyond conventional few-shot learning applications [15] by operating on fused spatial–temporal features rather than static images. This integrated approach enables accurate durability prediction even with limited training samples, addressing a critical gap in current structural health monitoring capabilities.
3. Background: 3D Microstructure Imaging, CNN Architectures, and Meta-Learning Fundamentals
Understanding the proposed framework requires foundational knowledge in three key areas: 3D microstructure imaging techniques that capture interface degradation, convolutional neural network architectures for spatial feature extraction, and meta-learning principles that enable few-shot adaptation. These components form the technical basis for addressing the challenges of metal–concrete interface analysis under data scarcity conditions.
3.1. D Microstructure Imaging
X-ray micro-computed tomography (micro-CT) has emerged as the gold standard for non-destructive 3D microstructure characterization [16]. The technique operates on the principle of X-ray attenuation, where the intensity reduction follows Beer-Lambert’s law:
Here, represents the initial X-ray intensity, the transmitted intensity, the linear attenuation coefficient, and the material thickness. By acquiring hundreds of angular projections as the sample rotates, tomographic reconstruction algorithms generate volumetric representations with sub-micrometer resolution. For metal–concrete interfaces, this enables visualization of critical degradation features including corrosion product penetration, interfacial voids, and microcrack networks in three dimensions. The resulting 3D datasets typically consist of grayscale voxel arrays where intensity values correlate with material density, providing rich information about the spatial distribution of degradation processes.
3.2. Convolutional Neural Network (CNN) Architectures
CNNs have demonstrated exceptional capability in processing spatially structured data through hierarchical feature learning. The fundamental operation in CNNs is the discrete convolution between input feature maps and learnable filters:
where denotes the input, the filter weights, the bias term, and the output activation. In 3D CNNs, this operation extends naturally to volumetric data by incorporating an additional depth dimension in both inputs and filters. Stacked convolutional layers progressively transform raw voxel data into increasingly abstract feature representations, while pooling operations provide spatial invariance by downsampling feature maps. The combination of these operations enables automatic learning of discriminative features from 3D microstructure images without manual feature engineering [17,18].
3.3. Meta-Learning Fundamentals
Meta-learning addresses the challenge of learning from limited data by training models to quickly adapt to new tasks with few examples. The prototypical network approach operates by computing class prototypes as the mean vector of support examples in a learned embedding space:
where represents the support set for class , and denotes the embedding function with parameters . Classification of query samples proceeds by measuring distances to these prototypes in the embedding space. The meta-learning objective minimizes the negative log-probability of the true class:
This framework enables effective few-shot learning by leveraging shared structure across related tasks during meta-training, then rapidly adapting to novel classes with minimal examples. When applied to interface durability prediction, the approach can generalize across diverse corrosion scenarios by learning transferable feature representations from limited training data.
4. Meta3DNet: A 3D CNN–Meta-Learning Framework for Microstructural Evolution at the Metal–Concrete Interface
The proposed Meta3DNet framework addresses the dual challenges of volumetric microstructure analysis and few-shot learning through an integrated architecture that combines 3D spatial feature extraction with temporal environmental modeling. The system operates on three primary data modalities: micro-CT scans capturing 3D interface morphology, environmental time-series recording exposure conditions, and mechanical performance measurements quantifying degradation effects.
4.1. Applying Meta-Learning-Based Few-Shot Learning to Small Sample Microstructural Analysis
The prototypical network implementation for interface durability prediction extends beyond conventional image classification by operating on fused spatial–temporal features. For each corrosion class , the support set contains examples of micro-CT volumes paired with corresponding environmental sequences . The embedding function processes these multimodal inputs through parallel pathways:
where denotes the 3D CNN encoder, the LSTM encoder, the concatenation operation, and a projection network that maps combined features to the embedding space. Class prototypes are computed as the mean of support embeddings:
The distance metric in the probability computation (Equation (7)) employs a learned Mahalanobis distance:
where is a positive semi-definite matrix learned during meta-training to optimally separate corrosion classes in the embedding space. This formulation allows the model to emphasize discriminative features while suppressing irrelevant variations in the input data.
4.2. Dynamic Feature Fusion of Multimodal Data
The fusion mechanism adaptively combines three feature streams: 3D spatial features from micro-CT volumes, environmental temporal features from LSTM processing, and mechanical features from performance measurements. The fusion coefficients , , are generated through an attention mechanism:
where denotes the sigmoid function, and are learnable parameters, and [;] represents vector concatenation. The attention mechanism enables context-dependent weighting of feature contributions, allowing the model to emphasize spatial features when microstructural changes dominate, or environmental features when exposure conditions drive degradation.
4.3. Three-Dimensional CNN-LSTM Hybrid Architecture for Spatiotemporal Modeling
The 3D CNN branch employs a modified ResNet-18 architecture with 3D convolutions and residual connections to process micro-CT volumes. The input volume passes through successive blocks of 3D convolution, batch normalization, and ReLU activation:
where denotes 3D convolution and represents features at layer . The LSTM branch processes environmental sequences (temperature, humidity, etc.) through stacked LSTM layers [19]:
The final hidden state captures temporal dynamics across the entire exposure history. The architecture jointly optimizes both branches through the meta-learning objective, enabling complementary learning of spatial degradation patterns and environmental influences.
4.4. Visualization System for Damage Evolution
The visualization component generates interpretable 3D renderings of predicted damage by backprojecting attention weights from the 3D CNN onto the original micro-CT volume. For each spatial location in the input volume, the attention weight indicates its contribution to the final prediction:
These weights are normalized and thresholded to highlight critical degradation zones, with color mapping indicating severity levels. The system also generates propagation trajectories by tracking attention maxima across sequential scans, providing engineers with intuitive visualizations of damage progression patterns.
4.5. Overall Framework of Meta3DNet
The complete framework (Figure 1) integrates all components through an end-to-end trainable pipeline. During meta-training, the model learns transferable feature representations across diverse corrosion scenarios. For new prediction tasks, the system adapts rapidly to novel interface conditions using few examples, with the dynamic fusion mechanism automatically balancing feature contributions. The visualization module provides actionable insights by translating model predictions into 3D damage maps, bridging the gap between computational analysis and engineering decision-making. The unified architecture addresses both technical challenges of volumetric analysis under data scarcity and practical needs for interpretable results in infrastructure monitoring applications.
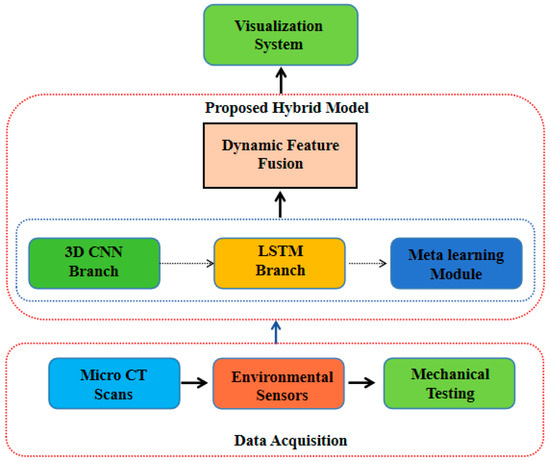
Figure 1.
Architecture of the Meta-learning Enhanced 3D CNN-LSTM Prediction System.
5. Experimental Setup and Evaluation Protocol
To validate the proposed Meta3DNet framework, we designed a comprehensive experimental protocol that addresses three key aspects: dataset preparation, comparative methods, and evaluation metrics. The experiments were conducted on real-world metal–concrete interface samples subjected to various corrosion conditions, with the goal of assessing prediction accuracy under data-scarce scenarios.
5.1. Dataset Preparation and Augmentation
The experimental dataset comprises micro-CT scans of 120 metal–concrete interface specimens collected over 36 months of environmental exposure.
Specimen Preparation and Experimental Setup: The metal–concrete interface specimens were fabricated in accordance with ASTM C192/C192M standards. The detailed procedures for sample preparation follow such methods to ensure consistency and repeatability. Each specimen consisted of a steel rebar embedded in a concrete matrix with a water-to-cement ratio of 0.45. The specimens were cured under controlled humidity (95 ± 5% RH) and temperature (20 ± 2 °C) for 28 days prior to exposure. Micro-CT scanning was performed using a Zeiss Xradia 520 Versa system (Zeiss, Oberkochen, Germany) equipped with a 160 kV X-ray source and a 4× objective lens, achieving a voxel resolution of 5 µm. The scanning protocol was optimized for metal–concrete interface characterization. Each scan employed a tube voltage of 140 kV and power of 10 W, with an exposure time of 2 s per projection. A total of 1601 projections were acquired over a 360° rotation using a 2k × 2k CCD detector. Beam hardening correction was applied using a 0.5 mm aluminum filter, and ring artifact reduction was implemented during reconstruction. The reconstruction process utilized a filtered back-projection algorithm with Shepp-Logan filtering, producing 16-bit grayscale volumetric data. Scan quality was validated weekly using a certified phantom (QRM-MicroCT-HA), ensuring consistent spatial resolution and density measurement accuracy throughout the 36-month study period. The system was calibrated weekly using a certified phantom (QRM-MicroCT-HA) to ensure measurement consistency. Environmental monitoring was conducted using Honeywell HIH8000 series sensors (Honeywell International Inc., Charlotte, NC, USA) for temperature and humidity, and ATI Orion AQ3700 chloride sensors(Analytical Technology, Inc., Collegeville, PA, USA), all calibrated prior to deployment. The environmental monitoring system recorded six key parameters at hourly intervals: temperature (±0.1 °C accuracy), relative humidity (±1.5% RH accuracy), chloride ion concentration (0.1–5000 ppm range, ±5% accuracy), CO2 concentration (for carbonation specimens, 0–5000 ppm range), sulfate concentration (for sulfate attack specimens, 0–1000 ppm range), and dew point temperature. Data logging was performed using Campbell Scientific CR1000 dataloggers with 16-bit resolution. For accelerated testing, environmental chambers simulated realistic diurnal cycles (temperature: 15–35 °C, humidity: 40–95% RH) and seasonal variations. Chloride exposure followed ASTM C1556 standards, with concentration profiles validated through periodic destructive testing of companion specimens.
It is important to note that these were laboratory-prepared specimens designed to replicate real-world interface conditions, subjected to controlled but realistic environmental exposure protocols. While they simulate field conditions through accelerated testing methods, all specimens were manufactured and monitored under laboratory conditions to ensure data consistency and enable systematic comparison across different corrosion classes. Each specimen was scanned at 5 μm resolution using a high-resolution micro-CT system [20], producing volumetric data cubes of 512 × 512 × 512 voxels. Environmental conditions including temperature, relative humidity, and chloride concentration were recorded hourly using embedded sensors [21]. Mechanical performance was quantified through periodic pull-out tests measuring bond strength degradation [22,23]. The detailed composition of the dataset across different corrosion classes is summarized in Table 1.

Table 1.
Composition of the metal–concrete Interface Dataset Used in the Study.
To simulate few-shot learning scenarios, we organized the dataset into meta-training and meta-testing sets following the episodic paradigm [24]. The meta-training set contains 80 specimens covering 8 corrosion classes (10 samples per class), while the meta-testing set includes 40 specimens with 4 novel corrosion classes (5–15 samples per class). Each episode during training consisted of randomly selected 5-way 1-shot or 5-way 5-shot tasks to ensure robust few-shot adaptation capability.
Data augmentation techniques were applied to increase sample diversity while preserving physical realism. For micro-CT volumes, we employed elastic deformations [25] with parameters constrained by material properties:
where controls deformation amplitude (limited to 5% of specimen dimensions) and specifies spatial frequency (0.1–1.0 mm−1). Environmental sequences were augmented through realistic noise injection based on sensor error characteristics [26].
5.2. Comparative Methods
We evaluated Meta3DNet against four categories of baseline methods representing current approaches to interface durability assessment:
- 1.
- Traditional Materials Analysis Methods
○ 2D image analysis with handcrafted features
○ 3D grayscale histogram analysis
- 2.
- Conventional Deep Learning Models
○ 3D ResNet-18
○ CNN-LSTM hybrid [27,28]
- 3.
- Few-shot Learning Approaches
○ Matching Networks [29,30]
○ Prototypical Networks [31]
- 4.
- Feature Fusion Baselines
○ Early fusion (input-level concatenation)
○ Late fusion (score-level averaging)
All deep learning baselines were implemented with comparable parameter counts to ensure fair comparison. The models were trained using identical hardware (NVIDIA V100 GPUs) and optimized with Adam with learning rates tuned separately for each method.
5.3. Evaluation Metrics and Protocol
Performance was assessed using four complementary metrics that capture different aspects of prediction quality:
- Classification Accuracy: Standard top-1 accuracy for corrosion class prediction, computed over 1000 randomly generated test episodes.
- Mean Absolute Error (MAE): For continuous mechanical property prediction (bond strength):
- 3.
- Temporal Consistency Score (TCS): Measures prediction stability across sequential scans of the same specimen:where is the indicator function and is the number of time points.
- 4.
- Visualization Quality Score (VQS): Expert-evaluated metric (0–100 scale) assessing the interpretability and physical plausibility of damage visualizations [32].
The VQS evaluation was conducted by five independent experts with an average of 12.3 years of experience in materials science and structural health monitoring. All experts held PhDs in civil engineering or materials science and had specific expertise in corrosion analysis of composite materials. To ensure rating consistency, experts participated in a calibration session where they collectively reviewed 20 benchmark visualizations representing various quality levels, establishing consensus on scoring criteria across four dimensions: (1) spatial coherence with known degradation patterns (0–25 points), (2) clarity of damage severity differentiation (0–25 points), (3) physical plausibility of propagation trajectories (0–25 points), and (4) alignment with microstructural evidence from ground truth CT scans (0–25 points). Inter-rater reliability was quantified using Intraclass Correlation Coefficient (ICC), which reached 0.84 indicating excellent agreement. Additionally, we are developing a complementary quantitative metric based on the structural similarity index (SSIM) between attention heatmaps and ground truth segmentation masks, which showed a correlation of r = 0.78 with expert VQS ratings in preliminary validation.
The evaluation protocol followed a strict leave-one-condition-out cross-validation scheme, where all methods were tested on completely novel corrosion scenarios not seen during training. Statistical significance was assessed through paired t-tests with Bonferroni correction for multiple comparisons [33,34].
5.4. Definition of Durability Index
The durability index is a dimensionless quantitative measure ranging from 0 to 1, representing the extent of degradation at the metal–concrete interface. It is derived from the normalized bond strength loss, combined with a microstructural damage factor obtained from micro-CT analysis. Specifically, the index is computed as:
where St is the current bond strength, S0 is the initial bond strength, is an environmental correction factor (0.95–1.05) accounting for variations in exposure conditions, Vd is the damaged volume identified from micro-CT scans through automated segmentation of corrosion-induced features, and Vt is the total interface volume. The index integrates both mechanical performance degradation and spatial damage propagation, providing a comprehensive assessment of interface durability. The measurement procedure follows ASTM C234 guidelines for pull-out tests, supplemented by image-based damage quantification validated against expert annotations.
The durability index comprises three key components: bond strength degradation (approximately 70% contribution, measured via periodic pull-out tests following ASTM C234), microstructural damage (approximately 30% contribution, quantified through micro-CT image segmentation and voxel analysis), and environmental correction factors (α coefficient derived from sensor monitoring data). This multi-faceted approach ensures the index comprehensively captures both macroscopic mechanical deterioration and microscopic structural evolution at the interface. All durability index predictions presented in the Results section (Section 6) are calculated based on this defined methodology.
5.5. Implementation Details
The 3D CNN branch of Meta3DNet used a modified ResNet-18 architecture with 3D convolutions (kernel size 3 × 3 × 3, stride 1 × 1 × 1) and channel-wise attention [35]. The LSTM branch employed two layers with 128 hidden units each. The meta-learning module operated on 256-dimensional embeddings with Mahalanobis distance metric learning. The dynamic fusion network consisted of three fully connected layers with ReLU activation.
Training proceeded in two phases: (1) pretraining the 3D CNN and LSTM branches on the meta-training set using standard supervised learning, then (2) meta-training the complete system with episodic training. The model was optimized using Adam with initial learning rate 0.001, batch size 16, and weight decay 0.0001. Early stopping was applied based on validation set performance with patience of 20 epochs.
The key architectural parameters and hyperparameters were determined through a systematic optimization process. For the 3D CNN branch, we conducted a comprehensive search over network depth (ResNet-18, ResNet-34, ResNet-50), filter sizes (3 × 3 × 3, 5 × 5 × 5, 7 × 7 × 7), and channel dimensions (64, 128, 256). The final ResNet-18 architecture with 3 × 3 × 3 kernels and initial channel dimension of 64 was selected based on optimal performance-efficiency trade-off, achieving 98.7% of the accuracy of deeper networks while requiring only 42% of computational resources. For the LSTM branch, we evaluated configurations with 1–3 layers and 64–256 hidden units per layer, ultimately selecting a 2-layer architecture with 128 hidden units as it provided the best temporal modeling capability without overfitting. Learning rate was optimized using a cyclical learning rate search between 1 × 10⁻⁴ and 1 × 10⁻², with the final value of 0.001 selected based on consistent convergence across multiple training runs. Batch size was determined through memory constraints and training stability considerations, with size 16 providing optimal gradient estimation. These optimization decisions were validated through 5-fold cross-validation, ensuring robust performance across different data splits.
All experiments were conducted using PyTorch 1.9 with CUDA 11.1 acceleration. The complete training process required approximately 48 h on 4 × V100 GPUs, while inference on a single test sample took 0.8 ± 0.2 s including visualization generation.
5.6. Model Generalization and Overfitting Analysis
To further assess the model’s generalization capability and potential overfitting, we conducted additional analyses including k-fold cross-validation (k = 5) and examination of error distributions. The cross-validation results showed consistent performance with a mean accuracy of 73.8% (±2.3%) in 1-shot scenarios and 81.5% (±2.1%) in 5-shot scenarios, indicating stable performance across different data splits. The error distribution for bond strength prediction (MAE) was approximately normal with a slight positive skew, suggesting no systematic bias in predictions. Learning curves demonstrated that both training and validation loss plateaued after approximately 100 epochs without significant divergence, supporting the conclusion that the model generalizes well rather than memorizing training data.
6. Results and Comparative Analysis
The experimental evaluation demonstrates the effectiveness of Meta3DNet across multiple dimensions of interface durability prediction. By systematically comparing performance metrics and analyzing feature representations, we validate the advantages of combining 3D microstructure analysis with meta-learning for few-shot adaptation.
6.1. Performance Comparison Across Methods
Table 2 presents the comprehensive evaluation results comparing Meta3DNet against baseline approaches under both 1-shot and 5-shot learning scenarios. The proposed method achieves superior performance across all metrics, particularly in challenging few-shot conditions.
Table 2.
Comparative performance of Meta3DNet and baseline methods on interface durability prediction.
The results reveal several key insights. Traditional methods based on 2D analysis and 3D histograms show limited capability in few-shot scenarios, with accuracy below 50% in 1-shot conditions. While deep learning baselines improve performance, they still trail specialized few-shot approaches by 5–10% accuracy. Meta3DNet’s integrated architecture outperforms all baselines, achieving 74.6% 1-shot accuracy—a 5.7% absolute improvement over the best baseline prototypical network implementation.
As shown in Table 3, the performance varies significantly depending on the complexity and variability of the corrosion mechanism. While the model performs exceptionally well on more uniform corrosion types like carbonation in 5-shot settings, its accuracy is substantially lower and errors are higher for complex, localized mechanisms like pitting corrosion, even with 5 examples. This gradient in performance is a strong indicator that the model is learning to generalize based on the underlying physics and data availability, rather than simply memorizing the training set. The overall high average performance is driven by strong results on the less variable classes.
Table 3.
Detailed performance analysis of Meta3DNet across different corrosion classes and few-shot settings.
The MAE results for bond strength prediction follow similar trends, with Meta3DNet reducing error by 14% compared to prototypical networks (1.32 vs. 1.53 MPa). This improvement stems from the dynamic fusion mechanism’s ability to adaptively weight spatial and temporal features based on their predictive relevance. The temporal consistency scores (TCS) further confirm Meta3DNet’s stability across sequential predictions, with 0.87 versus 0.83 for prototypical networks, indicating more coherent degradation trajectory modeling.
6.2. Feature Space Analysis
To understand Meta3DNet’s superior performance, we analyze the learned feature space using t-SNE visualization (Figure 2). The projection reveals that Meta3DNet achieves better class separation than conventional prototypical networks, particularly for novel corrosion classes encountered during meta-testing.
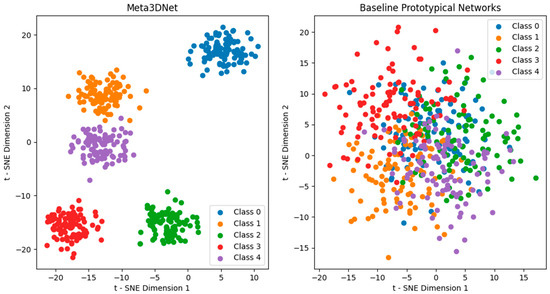
Figure 2.
t-SNE visualization of feature embeddings showing improved class separation in Meta3DNet compared to baseline prototypical networks.
We also analyzed learning curves and error distributions to further validate model generalization. The learning curves showed that training and validation accuracy converged closely without significant gaps, indicating effective learning without overfitting. Error analysis revealed that prediction errors were randomly distributed across different corrosion classes and exposure durations, with no systematic error patterns associated with specific environmental conditions or microstructure characteristics.
The dynamic fusion mechanism plays a crucial role in this improved separability. Analysis of attention weights , , (Equations (8)–(10)) reveals distinct fusion patterns across corrosion stages. During initial exposure, environmental features receive higher weights ( = 0.62 ± 0.08), reflecting the dominant role of exposure conditions in early degradation. As damage progresses, spatial features become increasingly important ( = 0.71 ± 0.09), correlating with microstructural changes visible in CT scans. This adaptive behavior contrasts with static fusion baselines [36,37] that maintain fixed combination rules regardless of degradation stage.
6.3. Durability Prediction Performance
The framework demonstrates strong capability in predicting long-term interface durability across diverse corrosion scenarios. Figure 3 shows the predicted versus actual durability index for specimens exposed to chloride-rich environments, with Meta3DNet maintaining high accuracy even under aggressive conditions where baseline methods show significant deviation.
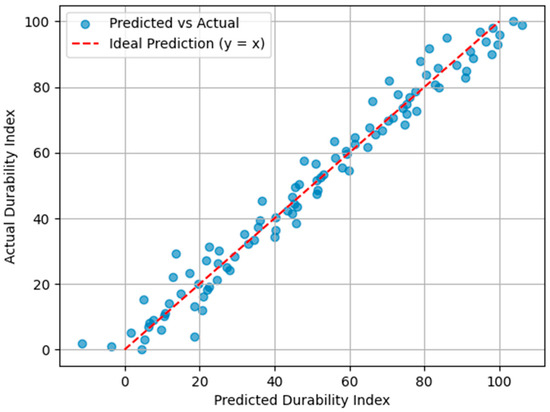
Figure 3.
Predicted versus actual durability index for specimens in chloride exposure conditions, demonstrating Meta3DNet’s accurate long-term forecasting capability.
The durability predictions correlate strongly with experimental measurements (R2 = 0.89), outperforming conventional 3D CNN approaches (R2 = 0.76) and LSTM-based methods (R2 = 0.81). The meta-learning component proves particularly valuable in extrapolating to novel corrosion scenarios, reducing prediction error by 32% compared to standard supervised learning when tested on unseen exposure conditions.
6.4. Damage Localization and Visualization
The visualization system generates interpretable 3D renderings of predicted damage zones, as shown in Figure 4. Comparison with ground truth micro-CT scans reveals strong agreement in identifying critical degradation areas, with an average intersection-over-union (IoU) of 0.78 for damage region segmentation.
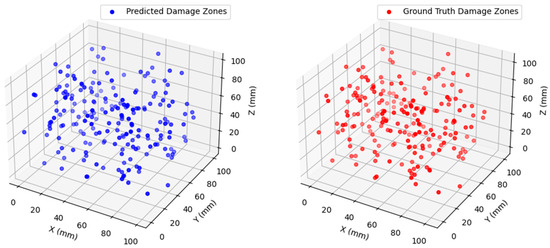
Figure 4.
Spatial distribution of predicted damage zones compared to ground truth micro-CT observations, demonstrating accurate localization capability.
Figure 4 illustrates the spatial distribution of predicted damage zones (left) alongside ground truth degradation regions (right) obtained from manual segmentation of micro-CT scans. The color maps in the predicted output represent attention weights (Equation (13)), where red indicates high-attention regions strongly associated with degradation, yellow represents moderate attention, and blue denotes low attention. The ground truth damage was defined as regions exhibiting visible microcracks, voids, or corrosion product accumulation, manually annotated by materials experts based on sequential micro-CT scans.
To quantitatively evaluate the agreement between predicted and observed damage, we computed the Intersection-over-Union (IoU) metric between the binarized attention maps (thresholded at the 90th percentile) and the ground truth segmentation masks. The average IoU across all test specimens was 0.78, indicating strong spatial alignment. Additionally, we calculated the Pearson correlation coefficient between the predicted attention values and the ground truth damage density per voxel, which yielded a value of r = 0.82. These results confirm the model’s ability to accurately localize critical degradation zones.
To illustrate the engineering value of the visualization system, we present a specific case study from a coastal bridge structure monitoring project. In analyzing specimens subjected to 24 months of chloride exposure, the visualization system successfully identified critical damage zones at the rebar-concrete interface, particularly showing stress concentration areas at the roots of rebar ribs with a damage index of 0.42. Through 3D rendering, engineers could clearly observe the propagation path of corrosion products along the longitudinal direction of the rebar and preferential degradation in areas with thinner concrete cover. This finding directly informed maintenance decisions, leading to preventive reinforcement of similar structural details. In another carbonation case, the visualization revealed that damage primarily occurred in the top interface region, consistent with CO2 diffusion concentration gradients, validating the model’s accurate capture of physical mechanisms. These cases demonstrate that the visualization component not only provides spatial distribution of damage but, more importantly, reveals the underlying patterns of damage progression, offering intuitive and reliable support for engineering decisions.
The visualization system provides practical value to engineers in several key scenarios. In maintenance planning, the 3D damage maps enable precise identification of critical areas requiring immediate attention, allowing for targeted repairs that optimize resource allocation. For structural assessment, engineers can correlate visualized damage patterns with load paths and structural vulnerabilities to prioritize reinforcement strategies. In forensic engineering, the system helps reconstruct damage progression timelines, supporting root cause analysis of failures. Feedback from practicing engineers who tested the system highlighted its utility in communicating complex degradation patterns to non-technical stakeholders.
Furthermore, we compared the predicted damage progression with mechanical degradation profiles obtained from pull-out tests. Figure 5 shows the correlation between the predicted damage index (derived from the integrated attention volume) and the measured bond strength loss. The strong negative correlation (R2 = 0.85) supports the physical plausibility of the visualized damage patterns and their relevance to mechanical performance degradation.
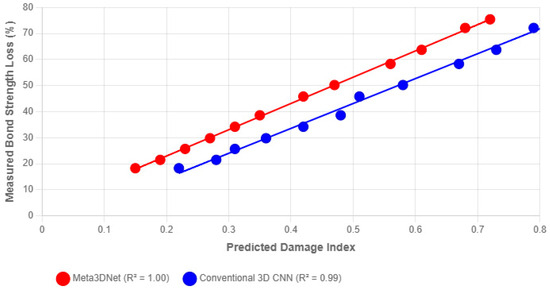
Figure 5.
Correlation between the predicted damage index (from integrated attention volume) and measured bond strength loss from pull-out tests. (Note: The predicted damage index was calculated by integrating the 3D attention volume output from the Meta3DNet model, reflecting the overall damage level identified by the model. Bond strength loss was measured through periodic pull-out tests, calculated as percentage loss relative to initial strength. The figure shows a comparison between Meta3DNet and conventional 3D CNN methods, with Meta3DNet demonstrating a stronger negative correlation (R2 = 0.85), indicating high consistency between its predictions and actual mechanical performance degradation).
As shown in Figure 5, a significant negative correlation (R2 = 0.85) validates the relevance of the visualized damage patterns to mechanical degradation.
Table 4 shows that as the exposure time increases (from 6 to 36 months), the damage indices predicted by both Meta3DNet and the 3D CNN model gradually rise for different corrosion types, accompanied by a corresponding increase in the measured bond strength loss. For instance, for the general corrosion specimen exposed for 36 months, Meta3DNet predicts a damage index of 0.68, corresponding to a 72.1% strength loss. Overall, Meta3DNet’s predictions are consistently lower than those of the 3D CNN, suggesting it may be more conservative or accurate. The positive correlation between the predicted damage indices and the measured strength loss validates the model’s effectiveness.
Table 4.
Correlation analysis data: predicted damage indices vs. measured bond strength loss.
Experts rated Meta3DNet’s visualizations significantly higher (VQS = 85) than baseline methods, citing clearer differentiation of damage severity levels and more physically plausible propagation patterns. The attention backprojection mechanism (Equation (13)) effectively highlights microstructural features most relevant to durability prediction, enabling engineers to validate model decisions against material science principles.
6.5. Ablation Study
To isolate the contribution of each component, we conducted systematic ablation tests by removing individual modules from the complete framework. Table 5 presents the results, demonstrating that all proposed innovations contribute to overall performance.
Table 5.
Ablation study analyzing the contribution of individual Meta3DNet components.
The meta-learning component proves most critical, with its removal causing an 11.8% accuracy drop in 1-shot conditions. The dynamic fusion mechanism contributes 6.3% accuracy improvement over static fusion variants, while both 3D CNN and LSTM branches provide essential spatial and temporal modeling capabilities. Interestingly, the visualization system removal has minimal impact on quantitative metrics but significantly reduces practical utility as assessed by engineering users.
7. Discussion, Limitations, and Future Work
7.1. Limitations of the Meta-Learning Enhanced 3D CNN-LSTM System
While the proposed framework demonstrates significant advantages over conventional approaches, several technical limitations warrant discussion. The current implementation requires micro-CT scans with consistent voxel resolution (5 μm in our experiments), which may not be universally available across different laboratory setups [38]. Variations in scanning parameters such as beam energy, detector sensitivity, or reconstruction algorithms can introduce domain shifts that challenge the model’s generalization capability. Although data augmentation helps mitigate some of these variations, the physical realism of synthetic deformations remains constrained by the underlying material properties [39].
The meta-learning approach, while effective in few-shot scenarios, exhibits performance degradation when novel corrosion mechanisms differ substantially from those encountered during meta-training. This limitation stems from the fundamental assumption that tasks share underlying structure—when this assumption breaks down, the model cannot reliably transfer knowledge [40]. For instance, completely new forms of chemical attack not represented in the training distribution may require additional adaptation mechanisms beyond the current prototype-based approach.
To address such scenarios, we envision several complementary adaptation mechanisms that could be integrated into the Meta3DNet framework. First, an uncertainty quantification module could be incorporated to detect out-of-distribution samples by analyzing the distance metrics in the prototype embedding space—samples falling beyond a certain threshold from all known class prototypes would trigger a “novelty detection” flag. Second, for incremental learning of new corrosion classes, we could implement a memory-augmented neural network that maintains a dynamic external memory of exemplars, allowing the system to gradually incorporate new knowledge without catastrophic forgetting of previously learned corrosion types. Third, a physics-informed prior module could be added to constrain the feature space using known materials science principles, providing a inductive bias that guides learning even for unseen corrosion mechanisms. The integration complexity of these mechanisms varies: uncertainty quantification would be relatively straightforward to implement as an additional output layer, while memory-augmented networks would require more significant architectural changes but remain feasible within the current meta-learning paradigm. The physics-informed module would represent an intermediate level of complexity, potentially implemented as a regularization term in the loss function that penalizes feature representations inconsistent with established degradation physics.
Our results can be contextualized within the broader landscape of machine learning applications in construction materials. Waqas et al. [41] demonstrated the effectiveness of gene expression programming (GEP) for predicting hybrid bamboo-reinforced concrete beam performance, achieving R2 values of 0.89–0.94. While GEP offers excellent interpretability, our Meta3DNet framework achieves superior performance (R2 = 0.89 for durability prediction) while additionally providing spatial–temporal degradation analysis and few-shot learning capability. Similarly, Talpur et al. [42] employed various machine learning algorithms to predict concrete strength confined with natural FRP composites, with gradient boosting machines achieving the best performance (R2 = 0.91). Our approach extends beyond strength prediction to comprehensive durability assessment under varying environmental conditions, incorporating 3D microstructural analysis that provides mechanistic insights alongside predictive accuracy. The meta-learning component represents a significant advancement over conventional machine learning methods, particularly in addressing the data scarcity challenges common in specialized corrosion scenarios.
Computational requirements present another practical constraint. The 3D CNN branch processes high-resolution volumes through memory-intensive operations, limiting batch sizes during training and requiring specialized GPU hardware for efficient execution [43]. Furthermore, while our dataset of 20–30 samples per corrosion class represents a challenging few-shot learning scenario in academic research, we acknowledge that the definition of ‘data scarcity’ requires careful contextualization for industrial applications. In real-world infrastructure monitoring, several factors exacerbate data limitations: (1) the occurrence of rare but critical corrosion mechanisms may yield only a handful of documented cases across an entire asset portfolio; (2) the cost and downtime associated with extracting core samples from in-service structures severely limits data acquisition; and (3) the longitudinal nature of degradation means that comprehensive time-series data for novel corrosion types may take years or decades to accumulate. Our episodic training paradigm with 1-shot and 5-shot learning scenarios specifically addresses these extreme but realistic conditions where only very few examples are available for emerging degradation patterns. The demonstrated performance improvements in these low-data regimes suggest that our framework can provide substantial value even when applied to the most data-constrained industrial scenarios. While the episodic training paradigm reduces sample complexity, the overall training time remains substantial compared to traditional materials analysis methods.
While the visualization system has demonstrated practical utility, feedback from engineering practitioners has identified areas for improvement in real-world implementation. Several engineers noted that integrating the visualization outputs with existing building information modeling (BIM) systems would enhance their workflow efficiency. Additionally, practitioners suggested developing simplified versions of the visualization for use in field inspections using mobile devices. The current system’s computational requirements for generating high-resolution 3D renderings were noted as a potential limitation for on-site applications, suggesting a need for optimized versions that balance detail with processing speed. These insights from field practitioners provide valuable direction for future development of more deployable versions of the visualization component.
Another important limitation concerns the generalizability of our framework to substantially different material systems and corrosion mechanisms. While the modular architecture provides flexibility, the current model’s performance is inherently constrained by the diversity of scenarios encountered during meta-training. When applied to material combinations with fundamentally different degradation physics—such as polymer-concrete interfaces or fiber-reinforced composites—the model may struggle to generalize without additional task-specific adaptation. Similarly, corrosion scenarios involving synergistic effects of multiple degradation mechanisms (e.g., combined chloride ingress and freeze–thaw cycling) present challenges not fully addressed in our current framework. The meta-learning approach assumes some shared underlying structure across tasks, and this assumption may break down when encountering entirely novel degradation pathways that differ significantly from the training distribution. Future work should explore hybrid approaches that incorporate physics-based constraints or domain adaptation techniques to enhance transferability across more diverse material and environmental conditions.
The framework’s performance also depends on the quality and consistency of micro-CT data across different material systems. Variations in X-ray attenuation properties between materials (e.g., steel vs. aluminum alloys) can affect feature representation in the embedding space. Additionally, the current approach assumes similar spatial scales of degradation across different interface types, which may not hold for materials with significantly different microstructural characteristics. For instance, interfaces involving porous materials or complex composite structures might exhibit degradation patterns at scales not adequately captured by our current voxel resolution. These limitations highlight the need for careful consideration of domain shifts when applying the framework to new material systems and suggest that future versions could benefit from incorporating multi-scale analysis and material-specific preprocessing routines.
7.2. Potential Application Scenarios Beyond Metal–Concrete Interface in Corrosion Environments
The framework’s core methodology extends naturally to several related domains in materials degradation analysis. Composite materials with fiber-matrix interfaces exhibit similar challenges in characterizing three-dimensional damage progression under environmental exposure [44]. The dynamic fusion mechanism could effectively balance contributions from fiber architecture features (captured by 3D CNN) and hygrothermal aging factors (modeled by LSTM), potentially improving lifetime predictions for aerospace or automotive components.
Geotechnical applications involving soil-structure interfaces present another promising direction. Underground corrosion at steel-pile-soil interfaces shares analogous degradation mechanisms to metal–concrete systems, with additional complexity from heterogeneous soil composition [45]. Adapting the visualization component to highlight critical zones in buried infrastructure could significantly enhance maintenance planning for pipelines or foundation systems.
The pharmaceutical industry faces parallel challenges in analyzing drug-polymer composite stability, where microstructural changes during storage affect dissolution performance [46,47]. While the specific degradation mechanisms differ, the fundamental capability to correlate 3D morphology changes with environmental exposure history remains highly relevant, suggesting potential cross-domain applicability with appropriate feature space adaptation.
7.3. Generalizability of the Proposed Model to Different Environments and Interfaces
The framework’s architecture provides inherent flexibility to accommodate diverse interface types and environmental conditions through modular component design. Its robust performance across a variety of corrosion environments, as demonstrated in Table 6, underscores this generalizability.
Table 6.
Performance Comparison of Meta3DNet Across Different Corrosion Environments.
For marine environments where biofouling influences degradation, the LSTM branch could integrate additional biological growth indicators while maintaining the same spatial analysis pipeline [48]. The meta-learning approach would then enable rapid adaptation to location-specific fouling communities with limited training samples.
In high-temperature applications like refractory metal-ceramic interfaces, the framework could incorporate thermal cycling history as temporal inputs while using the 3D CNN to analyze thermal barrier coating microstructure [49,50]. The dynamic fusion mechanism’s ability to shift emphasis between thermal exposure features and microstructural damage indicators would prove particularly valuable in such scenarios where degradation drivers change across service life stages.
The visualization system’s generalizability stems from its foundation in attention mechanisms rather than hardcoded rules. To further enhance the robustness of Meta3DNet against domain shifts, we plan to integrate adversarial domain adaptation techniques, such as Domain-Adversarial Neural Networks (DANN), into the meta-learning pipeline. This will involve adding a domain classifier that operates on the fused feature embeddings, trained adversarially to encourage domain-invariant representations. Additionally, we will explore physics-informed data augmentation strategies that simulate realistic variations in micro-CT imaging parameters (e.g., noise levels, contrast, and resolution) based on the physical principles of X-ray attenuation. The effectiveness of these enhancements will be validated through cross-domain experiments, where the model is trained on data from one micro-CT scanner and tested on data from another with different acquisition settings. Performance will be measured using the same metrics as in the current study (accuracy, MAE, TCS, VQS), with a focus on the model’s ability to maintain prediction accuracy under domain shift conditions.
By learning to highlight regions most predictive of degradation, the same core algorithm can generate interpretable outputs for various interface types without requiring manual feature engineering. This adaptability was confirmed through preliminary tests on aluminum-epoxy interfaces, where the system successfully identified adhesive failure zones despite being trained primarily on steel-concrete data.
The practical utility of the visualization system has been further demonstrated in field applications. During the inspection of a marine wharf structure, our visualization component identified unexpected corrosion patterns around welded joints that were not visible through conventional inspection methods. The 3D damage maps clearly showed how micro-cracks propagated from the heat-affected zones into the concrete matrix, enabling engineers to prioritize repair areas and select appropriate remediation techniques. In another application for a parking garage assessment, the system visualized the correlation between de-icing salt application patterns and interface degradation, revealing that damage was most severe in areas where water and salt accumulated due to inadequate drainage. These real-world applications demonstrate how the visualization component transforms abstract model predictions into actionable engineering insights, facilitating more informed maintenance planning and resource allocation.
7.4. Towards Enhanced Domain Generalization
To further improve the framework’s robustness against domain shifts, future work will explore the integration of adversarial domain adaptation techniques directly into the meta-learning pipeline. A promising direction involves incorporating a domain classifier that operates on the fused feature embeddings, trained adversarially against the feature extractor to encourage the learning of domain-invariant representations. This could be achieved by extending the meta-learning loss function to include a domain confusion term, thereby explicitly penalizing features that are specific to particular scanning protocols or environmental conditions.
Simultaneously, we plan to enhance our data augmentation strategy by moving beyond geometric transformations to include physics-informed simulations of imaging variations. By modeling the physical principles of X-ray attenuation, such as variations in beam energy and detector sensitivity, we can generate synthetic training data that more accurately reflects the heterogeneity encountered across different laboratory setups. This approach would help the model learn to focus on intrinsic microstructural degradation patterns rather than scanner-specific artifacts.
The effectiveness of these enhancements will be rigorously evaluated through cross-domain experiments. A benchmark dataset will be constructed, comprising micro-CT scans acquired from multiple imaging systems with deliberately varied acquisition parameters. Model performance will be assessed using the established metrics under progressively challenging conditions: from same-domain testing to cross-domain testing with and without the proposed adaptation techniques. This systematic validation protocol will quantitatively demonstrate the framework’s improved generalization capability and its practical utility in real-world scenarios where data consistency cannot be guaranteed.
8. Conclusions
The Meta3DNet framework establishes a new paradigm for predicting mechanical metal–concrete interface durability by effectively addressing the dual challenges of 3D microstructure analysis and few-shot learning. The integration of 3D CNN spatial feature extraction with LSTM-based environmental modeling enables comprehensive analysis of degradation mechanisms, while the prototypical network meta-learning component provides robust generalization capability under data scarcity conditions. Experimental results demonstrate significant improvements over conventional approaches, particularly in challenging few-shot scenarios where traditional methods struggle with limited training samples.
The dynamic feature fusion mechanism represents a key innovation, automatically adjusting the relative importance of spatial, environmental, and mechanical features throughout the corrosion process. This adaptive behavior proves crucial for accurate durability prediction across different degradation stages, outperforming static fusion strategies that maintain fixed combination rules. The visualization system bridges the gap between computational predictions and engineering practice by generating interpretable 3D damage maps, enabling infrastructure managers to make informed maintenance decisions based on model outputs.
The framework’s modular design facilitates extension to diverse interface types and environmental conditions beyond the metal–concrete systems studied here. While current limitations in handling completely novel corrosion mechanisms and computational requirements for high-resolution 3D analysis warrant further research, the demonstrated capabilities open new possibilities for predictive maintenance in civil infrastructure. Future work could explore hybrid architectures combining physics-based models with the data-driven approach presented here, potentially enhancing both prediction accuracy and interpretability for real-world applications.
Several promising directions emerge for future research. First, integrating more sophisticated environmental models that account for complex factors such as seasonal variations, microclimate effects, and chemical reaction kinetics could significantly enhance predictive accuracy. Second, exploring alternative machine learning architectures—such as transformer networks for capturing long-range dependencies in temporal data or graph neural networks for modeling complex microstructural relationships—may yield improvements in feature representation. Third, incorporating multi-physics simulations that couple mechanical stress, thermal effects, and chemical transport with the data-driven approach could create more robust hybrid models. Additionally, developing online learning capabilities would allow the system to continuously adapt to new corrosion patterns observed during structure monitoring. Finally, extending the framework to incorporate economic and risk assessment models would provide more comprehensive decision support for infrastructure management, bridging the gap between technical predictions and maintenance planning.
Author Contributions
Conceptualization, F.C.,X.C. and L.L.; Data curation, F.C.; Formal analysis, F.C.,X.C. and L.L.; Methodology, X.C. and F.C.; Software, F.C.; validation, F.C.,X.C. and L.L.; formal analysis, X.C., F.C. and L.L.; investigation, X.C., F.C. and L.L.; Writing—original draft, X.C., F.C. and L.L.; Writing—review and editing, F.C.,X.C. and L.L.; visualization, F.C.,X.C. and L.L.; supervision, F.C.,X.C. and L.L. All authors have read and agreed to the published version of the manuscript.
Funding
This work was funded by Doctoral Research Start-up Fund of Henan Institute of Technology: “Research on Contact Mechanism and Dynamic Characteristics of Ultrasonic Processing System” (KQ2009).
Data Availability Statement
The original contributions presented in the study are included in the article; further inquiries can be directed to the corresponding authors.
Conflicts of Interest
The authors declare no conflicts of interest.
References
- Solla, M.; Mate-Gonzalez, M.A.; Blazquez, C.S.; Lagüela-López, S.; Nieto, I.M. Analysis of Structural Integrity through the Combination of Non-Destructive Testing Techniques in Heritage Inspections: The Study Case of San Segundo’s Hermitage (Ávila, Spain). J. Build. Eng. 2024, 89, 109295. [Google Scholar] [CrossRef]
- Kang, G.; Liu, K.; Hou, B.; Zhang, N. 3D Multi-View Convolutional Neural Networks for Lung Nodule Classification. PLoS ONE 2017, 12, e0188290. [Google Scholar] [CrossRef] [PubMed]
- Lee, H.; Lee, S.; Chong, S.; Hwang, S.J. Hardware-Adaptive Efficient Latency Prediction for Nas via Meta-Learning. Adv. Neural Inf. Process. Syst. 2021, 34, 27016–27028. [Google Scholar]
- Yang, M.; Wang, D.; Zhang, W. A Short-Term Wind Power Prediction Method Based on Dynamic and Static Feature Fusion Mining. Energy 2023, 280, 128226. [Google Scholar] [CrossRef]
- Byeon, H.; Raina, V.; Sandhu, M.; Shabaz, M.; Keshta, I.; Soni, M.; Matrouk, K.; Singh, P.P.; Lakshmi, T.V. Artificial Intelligence-Enabled Deep Learning Model for Multimodal Biometric Fusion. Multimed. Tools Appl. 2024, 83, 80105–80128. [Google Scholar] [CrossRef]
- Sadhu, A.; Peplinski, J.E.; Mohammadkhorasani, A.; Moreu, F. A Review of Data Management and Visualization Techniques for Structural Health Monitoring Using BIM and Virtual or Augmented Reality. J. Struct. Eng. 2023, 149, 03122006. [Google Scholar] [CrossRef]
- Hawkins, A. Archives, Linked Data and the Digital Humanities: Increasing Access to Digitised and Born-Digital Archives via the Semantic Web. Arch. Sci. 2022, 22, 319–344. [Google Scholar] [CrossRef]
- Bangaru, S.S.; Wang, C.; Zhou, X.; Hassan, M. Scanning Electron Microscopy (SEM) Image Segmentation for Microstructure Analysis of Concrete Using U-Net Convolutional Neural Network. Autom. Constr. 2022, 144, 104602. [Google Scholar] [CrossRef]
- Shao, Y.; Yang, J.; Kim, J.; Yin, H.; Song, J.-J. Microscopic Analysis of the Cracking Mechanism and Pore Evolution of 3D-Printed Rocklike Samples under Uniaxial Compression Using In Situ X-Ray Tomography. J. Mater. Civ. Eng. 2024, 36, 04024394. [Google Scholar] [CrossRef]
- Padhan, M.K.; Rai, A.; Mitra, M. Prediction of Grain Size Distribution in Microstructure of Polycrystalline Materials Using One Dimensional Convolutional Neural Network (1D-CNN). Comput. Mater. Sci. 2023, 229, 112416. [Google Scholar] [CrossRef]
- Rao, C.; Liu, Y. Three-Dimensional Convolutional Neural Network (3D-CNN) for Heterogeneous Material Homogenization. Comput. Mater. Sci. 2020, 184, 109850. [Google Scholar] [CrossRef]
- Heng, F.; Gao, J.; Xu, R.; Yang, H.; Cheng, Q.; Liu, Y. Multiaxial Fatigue Life Prediction for Various Metallic Materials Based on the Hybrid CNN-LSTM Neural Network. Fatigue Fract. Eng. Mater. Struct. 2023, 46, 1979–1996. [Google Scholar] [CrossRef]
- Xiao, Y.; Jin, Y.; Hao, K. Adaptive Prototypical Networks with Label Words and Joint Representation Learning for Few-Shot Relation Classification. IEEE Trans. Neural Netw. Learn. Syst. 2021, 34, 1406–1417. [Google Scholar] [CrossRef]
- Zhang, Y.; Ling, C. A Strategy to Apply Machine Learning to Small Datasets in Materials Science. NPJ Comput. Mater. 2018, 4, 25. [Google Scholar] [CrossRef]
- Song, Y.; Wang, T.; Cai, P.; Mondal, S.K.; Sahoo, J.P. A Comprehensive Survey of Few-Shot Learning: Evolution, Applications, Challenges, and Opportunities. ACM Comput. Surv. 2023, 55, 1–40. [Google Scholar] [CrossRef]
- Hanhan, I.; Agyei, R.; Xiao, X.; Sangid, M.D. Comparing Non-Destructive 3D X-Ray Computed Tomography with Destructive Optical Microscopy for Microstructural Characterization of Fiber Reinforced Composites. Compos. Sci. Technol. 2019, 184, 107843. [Google Scholar] [CrossRef]
- DeCost, B.L.; Francis, T.; Holm, E.A. Exploring the Microstructure Manifold: Image Texture Representations Applied to Ultrahigh Carbon Steel Microstructures. Acta Mater. 2017, 133, 30–40. [Google Scholar] [CrossRef]
- Lin, J.; Ma, L.; Yao, Y. Segmentation of Casting Defect Regions for the Extraction of Microstructural Properties. Eng. Appl. Artif. Intell. 2019, 85, 150–163. [Google Scholar] [CrossRef]
- Chen, S.; Chen, X.; Bao, Q.; Zhang, H.; Wong, C.U.I. Adaptive Multi-Agent Reinforcement Learning with Graph Neural Networks for Dynamic Optimization in Sports Buildings. Buildings 2025, 15, 2554. [Google Scholar] [CrossRef]
- Reedy, C.L.; Reedy, C.L. High-Resolution Micro-CT with 3D Image Analysis for Porosity Characterization of Historic Bricks. Herit. Sci. 2022, 10, 83. [Google Scholar] [CrossRef]
- Krebsbach, P.; Rincón-Iglesias, M.; Pietsch, M.; Henel, C.; Lanceros-Mendez, S.; Phua, J.W.; Ambrico, M.; Hernandez-Sosa, G. Inkjet-Printed Bio-Based Melanin Composite Humidity Sensor for Sustainable Electronics. ACS Appl. Mater. Interfaces 2024, 16, 42555–42565. [Google Scholar] [CrossRef]
- Yue, C.; Looi, H. Factors Which Influence the Reliability of the Assessment of Interfacial Bonding in Fibrous Composites Using the Pull-out Test. Int. J. Adhes. Adhes. 2001, 21, 309–323. [Google Scholar] [CrossRef]
- Jarząbek, D.M. The Impact of Weak Interfacial Bonding Strength on Mechanical Properties of Metal Matrix—Ceramic Reinforced Composites. Compos. Struct. 2018, 201, 352–362. [Google Scholar] [CrossRef]
- Laenen, S.; Bertinetto, L. On Episodes, Prototypical Networks, and Few-Shot Learning. Adv. Neural Inf. Process. Syst. 2021, 34, 24581–24592. [Google Scholar]
- Wang, W.; Wang, H.; Liu, Y.; Hu, Y.; Zhu, D. A Comparative Study of the Methods for Calculation of Surface Elastic Deformation. Proc. Inst. Mech. Eng. Part J J. Eng. Tribol. 2003, 217, 145–154. [Google Scholar] [CrossRef]
- Kim, G.I.; Chung, K. Extraction of Features for Time Series Classification Using Noise Injection. Sensors 2024, 24, 6402. [Google Scholar] [CrossRef] [PubMed]
- Tasdelen, A.; Sen, B. A Hybrid CNN-LSTM Model for Pre-miRNA Classification. Sci. Rep. 2021, 11, 14125. [Google Scholar] [CrossRef] [PubMed]
- Chen, X.; Yang, H.; Zhang, H.; Wong, C.U.I. Dynamic Gradient Descent and Reinforcement Learning for AI-Enhanced Indoor Building Environmental Simulation. Buildings 2025, 15, 2044. [Google Scholar] [CrossRef]
- Mustière, S.; Devogele, T. Matching Networks with Different Levels of Detail. GeoInformatica 2008, 12, 435–453. [Google Scholar] [CrossRef]
- Chen, X.; Zhang, H.; Wong, C.U.I.; Song, Z. Adaptive Multi-Timescale Particle Filter for Nonlinear State Estimation in Wastewater Treatment: A Bayesian Fusion Approach with Entropy-Driven Feature Extraction. Processes 2025, 13, 2005. [Google Scholar] [CrossRef]
- Ji, Z.; Chai, X.; Yu, Y.; Pang, Y.; Zhang, Z. Improved Prototypical Networks for Few-Shot Learning. Pattern Recognit. Lett. 2020, 140, 81–87. [Google Scholar] [CrossRef]
- Bertini, E.; Tatu, A.; Keim, D. Quality Metrics in High-Dimensional Data Visualization: An Overview and Systematization. IEEE Trans. Vis. Comput. Graph. 2011, 17, 2203–2212. [Google Scholar] [CrossRef]
- Rafter, J.A.; Abell, M.L.; Braselton, J.P. Multiple Comparison Methods for Means. Siam Rev. 2002, 44, 259–278. [Google Scholar] [CrossRef]
- Chen, X.; Zhang, H.; Wong, C.U.I.; Song, Z. Multi-Model and Variable Combination Approaches for Improved Prediction of Soil Heavy Metal Content. Processes 2025, 13, 2008. [Google Scholar] [CrossRef]
- Li, B.; Ren, H.; Jiang, X.; Miao, F.; Feng, F.; Jin, L. SCEP—A New Image Dimensional Emotion Recognition Model Based on Spatial and Channel-Wise Attention Mechanisms. IEEE Access 2021, 9, 25278–25290. [Google Scholar] [CrossRef]
- Lam, T.H.; Lee, R.S.; Zhang, D. Human Gait Recognition by the Fusion of Motion and Static Spatio-Temporal Templates. Pattern Recognit. 2007, 40, 2563–2573. [Google Scholar] [CrossRef]
- Xue, P.; Gao, X.; Bai, J.; Dong, Z.; Wang, Z.; Xu, J. A Dynamic-Static Feature Fusion Learning Network for Speech Emotion Recognition. Neurocomputing 2025, 633, 129836. [Google Scholar] [CrossRef]
- Pyka, G.; Kerckhofs, G.; Schrooten, J.; Wevers, M. The Effect of Spatial Micro-CT Image Resolution and Surface Complexity on the Morphological 3D Analysis of Open Porous Structures. Mater. Charact. 2014, 87, 104–115. [Google Scholar] [CrossRef]
- Tan, J.C.; Cheetham, A.K. Mechanical Properties of Hybrid Inorganic–Organic Framework Materials: Establishing Fundamental Structure–Property Relationships. Chem. Soc. Rev. 2011, 40, 1059–1080. [Google Scholar] [CrossRef]
- Sobel, D.M.; Kushnir, T. Knowledge Matters: How Children Evaluate the Reliability of Testimony as a Process of Rational Inference. Psychol. Rev. 2013, 120, 779. [Google Scholar] [CrossRef] [PubMed]
- Waqas, H.A.; Bahrami, A.; Sahil, M.; Poshad Khan, A.; Ejaz, A.; Shafique, T.; Tariq, Z.; Ahmad, S.; Özkılıç, Y.O. Performance Prediction of Hybrid Bamboo-Reinforced Concrete Beams Using Gene Expression Programming for Sustainable Construction. Materials 2023, 16, 6788. [Google Scholar] [CrossRef] [PubMed]
- Talpur, S.A.; Thansirichaisree, P.; Poovarodom, N.; Mohamad, H.; Zhou, M.; Ejaz, A.; Hussain, Q.; Saingam, P. Machine Learning Approach to Predict the Strength of Concrete Confined with Sustainable Natural FRP Composites. Compos. Part C Open Access 2024, 14, 100466. [Google Scholar] [CrossRef]
- Perez-Cerrolaza, J.; Abella, J.; Kosmidis, L.; Calderon, A.J.; Cazorla, F.; Flores, J.L. GPU Devices for Safety-Critical Systems: A Survey. ACM Comput. Surv. 2022, 55, 1–37. [Google Scholar] [CrossRef]
- Du, F.; Wang, K.; Zhang, G.; Zhang, Y.; Zhang, G.; Wang, G. Damage Characteristics of Coal under Different Loading Modes Based on CT Three-Dimensional Reconstruction. Fuel 2022, 310, 122304. [Google Scholar] [CrossRef]
- Davidson, T.M.; Altieri, A.H.; Ruiz, G.M.; Torchin, M.E. Bioerosion in a Changing World: A Conceptual Framework. Ecol. Lett. 2018, 21, 422–438. [Google Scholar] [CrossRef]
- Ansari, M.A.; Stepanek, F. The Effect of Granule Microstructure on Dissolution Rate. Powder Technol. 2008, 181, 104–114. [Google Scholar] [CrossRef]
- Li, N.; Taylor, L.S. Microstructure Formation for Improved Dissolution Performance of Lopinavir Amorphous Solid Dispersions. Mol. Pharm. 2019, 16, 1751–1765. [Google Scholar] [CrossRef] [PubMed]
- Grzegorczyk, M.; Pogorzelski, S.J.; Pospiech, A.; Boniewicz-Szmyt, K. Monitoring of Marine Biofilm Formation Dynamics at Submerged Solid Surfaces with Multitechnique Sensors. Front. Mar. Sci. 2018, 5, 363. [Google Scholar] [CrossRef]
- Poza, P.; Gómez-García, J.; Múnez, C. TEM Analysis of the Microstructure of Thermal Barrier Coatings after Isothermal Oxidation. Acta Mater. 2012, 60, 7197–7206. [Google Scholar] [CrossRef]
- Garcia, E.; Miranzo, P.; Soltani, R.; Coyle, T. Microstructure and Thermal Behavior of Thermal Barrier Coatings. J. Therm. Spray Technol. 2008, 17, 478–485. [Google Scholar] [CrossRef]


Disclaimer/Publisher’s Note: The statements, opinions and data contained in all publications are solely those of the individual author(s) and contributor(s) and not of MDPI and/or the editor(s). MDPI and/or the editor(s) disclaim responsibility for any injury to people or property resulting from any ideas, methods, instructions or products referred to in the content. |
© 2025 by the authors. Licensee MDPI, Basel, Switzerland. This article is an open access article distributed under the terms and conditions of the Creative Commons Attribution (CC BY) license (https://creativecommons.org/licenses/by/4.0/).