Abstract
With rapid urbanization and intensifying climate change impacts, the thermal comfort performance of semi-outdoor spaces has emerged as a critical issue in sustainable urban design and housing development. However, the unique void decks of residential environments remain underexplored in the existing literature. This study addresses the knowledge gap by investigating how morphological characteristics influence microclimatic conditions and user satisfaction in high-density subtropical residential environments. Field measurements and questionnaire surveys were conducted across 18 void decks in four representative Shenzhen communities during summer 2024, examining air temperature, relative humidity, wind velocity, mean radiant temperature, and UTCI alongside users’ thermal perceptions. Hierarchical cluster analysis identified three distinct typologies based on spatial attributes: North–South-Ventilated (NS-VD), Single-Directional (SD-VD), and Oblique-Oriented (OO-VD). Ridge regression analysis revealed seven critical configuration variables—height-to-depth ratio, orientation, angle with wind, number of open sides, sky view factor, green view factor, and height from ground—collectively explaining 51.2% of UTCI variation. The results were as follows: (1) we identified morphological typologies and quantify microclimate variations across spatial configurations; (2) established quantitative relationships between objective thermal metrics and subjective thermal perceptions; and (3) developed evidence-based design recommendations for enhancing thermal environments in subtropical residential contexts. The findings support climate-responsive design for high-density residential environments by providing a scientific basis for optimizing microclimates and enhancing community vitality.
1. Introduction
1.1. Background
With rapid urbanization and intensifying climate change impacts, the thermal comfort performance of semi-outdoor spaces has emerged as a critical issue in sustainable urban design and housing development. In hot–humid regions, semi-outdoor spaces (SOS)—such as verandas, porches, galleries, balconies, forecourts, corridors, passages, loggias, pilotis, void decks, etc.—represent transitional environments that mediate between fully conditioned indoor settings and exposed outdoor conditions, providing shade, ventilation, and opportunities for social interaction [1]. These spaces reduce environmental stress from heat and humidity while also fostering residents’ well-being and social connection as essential communal areas [2]. In southern China, particularly in Shenzhen City, a distinctive form of semi-outdoor space has emerged in residential developments, the void deck, created by elevating the ground floor of high-rise housing blocks [3]. This architectural strategy addresses dampness and pest control while providing shaded, accessible, and flexible communal spaces [2,4]. As an extension of the home, void decks support diverse social and recreational activities in dense, subtropical cities, creating an essential element of neighborhood life [5,6]. A variety of factors influence the utilization of these spaces, with thermal comfort being a critical determinant of participation in outdoor activities [7,8,9].
Despite the growing recognition of the importance of semi-outdoor environments, existing research has primarily concentrated on other spatial typologies [10,11,12,13,14,15,16,17,18]. These studies highlight the potential of SOS to improve thermal comfort across diverse climatic zones and building functions. However, their findings cannot be directly transferred to the high-density, high-rise residential context of subtropical Asia, where void decks constitute both a climatic adaptation and a socio-spatial necessity. This mismatch between existing knowledge and the unique characteristics of residential void decks underscores a critical research gap. Despite regulatory efforts to promote the incorporation of void decks in the residential developments of southern China [19], several critical research gaps remain. In particular, the thermal performance of void decks remains insufficiently defined, their spatial configurations have not been systematically examined, and the links between architectural design, microclimatic modification, and user comfort remain unclear. Addressing these issues is vital for developing climate-responsive design strategies tailored to subtropical high-rise housing. Further research is needed to explore architectural interventions capable of enhancing the thermal performance of void deck spaces through refined design strategies. Accordingly, this study investigates the microclimatic conditions, thermal comfort performance, and spatial attributes of void deck environments in Shenzhen. By integrating environmental measurements with user-based evaluations, the research aims to provide evidence-based insights into how void deck design can enhance thermal resilience, resident comfort, and the livability of dense urban housing in hot–humid regions.
1.2. Literature Review
Semi-outdoor spaces (SOS) function as transitional environments that maintain substantial exposure to outdoor conditions while filtering extreme environmental factors [20,21]. Recent taxonomies classify semi-outdoor spaces by spatial characteristics and building integration. Gamero-Salinas et al. [1] identified five types of semi-outdoor spaces (SOS) in tropical high-rise buildings, namely perimeter buffers, sky terraces, horizontal breezeways, breezeway atria, and vertical breezeways. Research across diverse climatic contexts reveals significant variations in thermal performance among different semi-outdoor configurations. Mediterranean courtyards [22], tropical school corridors, East Asian sky gardens [23], or healthcare gardens in temperate regions [24] demonstrate that spatial morphology critically influences microclimatic conditions. However, comparative analyses specifically addressing void deck performance remain limited. While Xie et al. [14] examined overhead public spaces in Shenzhen’s hot–humid climate, systematic investigations of residential void decks across different spatial configurations are notably absent. Critical research gaps emerge when contrasting these findings with void deck environments. Unlike sky terraces and balconies that primarily serve individual units [23,25], void decks function as communal spaces serving entire residential communities [3]. The ground-level positioning and elevated building configuration create unique microclimatic conditions that distinguish void decks from other semi-outdoor typologies, yet this distinction remains underexplored in existing literature.
Shade is an essential solution for mitigating heat exposure in increasingly warm cities, whereby the implementation of a void deck in limiting exposure to direct sunlight constitutes one of the most effective and economically viable approaches for reducing heat-related health risks in outdoor environments [23]. Morphological parameters significantly influence thermal comfort in semi-outdoor environments. Tao et al. [26] established relationships between void area, void-to-solid ratio, ceiling height, height-to-depth ratio, and orientation on thermal conditions across various semi-open spaces in Singapore. Diz-Mellado et al. [21] demonstrated that height-to-depth ratios particularly influence wind speed enhancement and thermal comfort improvement in semi-outdoor environments. Recent investigations reveal that spatial openness parameters critically determine thermal performance. Gamero-Salinas et al. [27] identified porosity, openness, and exposure as fundamental factors associated with thermal performance in tropical high-density environments, establishing clustering patterns based on these characteristics. Su et al. [28] further demonstrated that outdoor morphological parameters enable simulation-based optimization of thermal comfort in residential areas. However, existing studies predominantly focus on institutional and commercial buildings rather than residential contexts [10,11,12,13,14,15,16,17,18]. Standard storeys in Chinese residential buildings typically feature multiple housing units arranged around a vertical circulation core [24]. The void deck layout largely mirrors the spatial organization of the standard storey, with the key morphological parameters of building width, depth, overhead form, height, enclosure position, and openness [4,6,25]. The specific relationship between void deck spatial configurations and thermal comfort performance in high-density residential environments requires systematic investigation, particularly considering the unique social and functional requirements of these spaces [29].
Contemporary thermal comfort evaluation integrates objective environmental measurements with subjective human response assessments [30]. Objective indices including Universal Thermal Climate Index (UTCI) [31,32], Physiological Equivalent Temperature (PET) [33], and wet-bulb globe temperature (WBGT) [34] provide standardized thermal stress evaluations by integrating fundamental meteorological parameters: air temperature, relative humidity, wind velocity, and mean radiant temperature [35]. UTCI demonstrates particular advantages for outdoor thermal comfort assessment due to its comprehensive heat exchange mechanism consideration and validated physiological accuracy [36,37]. Chen et al. [38] recently calibrated UTCI scales for hot–humid climates through comprehensive field surveys, enhancing its applicability in subtropical contexts. However, UTCI applications in residential semi-outdoor environments remain limited compared to its extensive use in urban outdoor spaces [36]. Subjective assessment methodologies employ standardized parameters including thermal sensation vote (TSV), thermal comfort vote (TCV), and thermal satisfaction (TSAT) to capture occupant perceptions [39,40]. Recent studies emphasize the importance of integrating instantaneous assessments with overall satisfaction evaluations [41]. Yang et al. [39] critically reviewed subjective information integration in thermal comfort evaluation, highlighting methodological considerations for field investigations. Few studies have systematically integrated objective thermal metrics with subjective user perceptions across diverse spatial configurations in residential semi-outdoor environments. Acero et al. [3] conducted comparative measurements between outdoor and semi-outdoor spaces in tropical Singapore, establishing baseline thermal comfort relationships. However, their investigation focused primarily on commercial and institutional buildings rather than residential void decks. Recent work by Li et al. [42] assessed thermal and environmental perceptions in Hong Kong’s residential public spaces using walking-based methodologies, yet their focus remained on fully outdoor environments rather than semi-outdoor transitional spaces. The integration of spatial morphological analysis with thermal comfort assessment in residential void deck contexts represents a significant knowledge gap.
Despite extensive methodological development and spatial parameter investigations, the integrated relationship between morphological design variables, objective thermal performance, and subjective user experiences in residential void deck environments remains insufficiently understood. This gap is particularly pronounced in subtropical contexts where void decks serve critical social functions alongside climate mitigation roles [14,29]. The absence of systematic field investigations combining spatial analysis, environmental monitoring, and occupant perception surveys in residential void deck environments hinders evidence-based design optimization strategies.
This study investigates climate-responsive design method in 18 residential void decks in subtropical Shenzhen, China, bridging a key knowledge gap and providing evidence-based design strategies by linking spatial morphology, thermal performance, and user satisfaction. Unlike previous studies that examined spatial determinants and thermal comfort indices separately, this research establishes systematic relationships between morphological parameters, UTCI-based objective thermal performance, and subjective user experiences through field measurements and resident surveys during summer conditions. The specific objectives are to: (1) identify morphological typologies and quantify microclimate variations across spatial configurations; (2) establish quantitative relationships between objective thermal metrics and subjective thermal perceptions; and (3) develop evidence-based design recommendations for enhancing thermal environments in subtropical residential contexts. This investigation addresses the morphological-thermal-perceptual integration gap in residential semi-outdoor spaces to inform sustainable housing development in rapidly urbanizing subtropical regions. The findings support climate-responsive design for high-density residential environments by providing a scientific basis for optimizing microclimates and enhancing community vitality.
2. Materials and Methods
2.1. Site Study
Shenzhen, a coastal metropolis in southern China (113°46′–114°37′ E, 22°27′–22°52′ N), is characterized by a subtropical monsoon climate regime. Long-term climatological data (1991–2020) indicate annual mean temperature and relative humidity values of 23.3 °C and 74%, respectively (Figure 1). The extended summer period (>6 months) features mean July temperatures of 29.0 °C with predominantly southerly wind patterns. Shenzhen is the most densely populated city in China, with the average floor area ratio (FAR) rising from 2.4 to 5. High-rise housing has consequently become the dominant residential form [43]. In compliance with Chinese residential construction practices and daylighting regulations, buildings are typically oriented along the north–south axis, with some rotated toward the southeast or southwest to improve solar access. To examine the spatial and microclimatic characteristics of void decks (VDs) in high-density housing, four residential estates completed after 2000 were selected as case studies: Shangxuan Estate (SE), Longhai Estate (LE), Tangxuan Estate (TE), and Huafu Estate (HE) (Table 1, Figure 2). These estates represent a range of FAR values from 2.0 to 5.2 and include three main residential building typologies: slab, slab–tower, and tower. Key geometric variables differ across the cases, including height from ground, interval space, Orientation, and other factors. Vertical circulation cores are commonly positioned along the northern side or central zone of the buildings, dividing void decks into discrete spatial units. As shown in Table 2 and Figure 3, this study examined 18 void deck units with distinct spatial morphological characteristics across four residential communities.
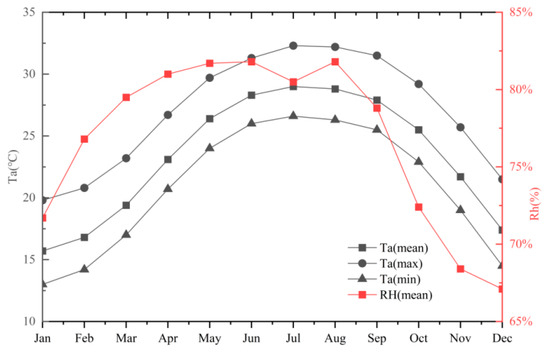
Figure 1.
Monthly means of Ta (Mean), Ta (Max), Ta (Min), and RH (Mean) in Shenzhen. Data Source: Meteorological Bureau of Shenzhen Municipality.

Table 1.
Morphological parameters of selected residential areas.
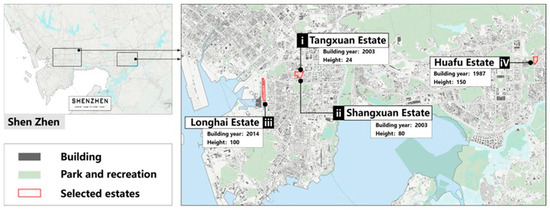
Figure 2.
Location of selected residential areas in Shenzhen City.
Table 2.
Sky view and panoramic images of the 18 void decks (VD).
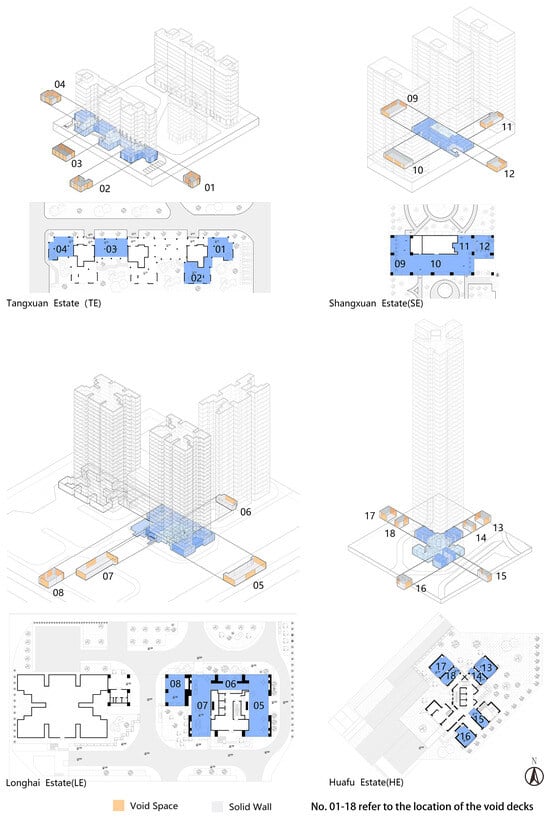
Figure 3.
Void decks feature of the selected residential areas.
Based on the morphological characteristics of the selected void decks, twelve spatial attributes were systematically identified and quantified to investigate aspect ratio, orientation, degree of enclosure, vegetation coverage and positioning, etc. (Table 3). Geometric variables were computed using three-dimensional simplified models of all 18 void deck units, derived from architectural drawings (floor plans and sections) and verified through field observations. Spatial attribute values and environmental conditions were obtained through comprehensive site measurements, supplemented by high-resolution spatial documentation using an Insta360 X3 panoramic camera system (Insta360 Innovation Technology Co., Ltd., Shenzhen, China) for geometric verification and environmental context recording.
Table 3.
Spatial attributes of the selected void decks.
A hierarchical cluster analysis was conducted on the 18 void deck units using their spatial morphological attributes, resulting in three typologically distinct clusters (Figure 4). The analysis indicated that the optimal cluster configuration comprised three groups (n = 3). Cluster 1 is distinguished by expansive open spaces featuring north–south cross-ventilation corridors, namely North–South Ventilated Void Deck (NS-VD). Cluster 2 encompasses medium-sized open spaces characterized by single-directional exposure (either southerly or northerly orientation) with limited natural ventilation flow, namely Single-Directional Void Deck (SD-VD). Cluster 3 comprises compact spaces with oblique openings and constrained spatial dimensions, namely the Oblique-oriented Void Deck (OO-VD). Based on the site calculation, the comparison of spatial attributes for each cluster is presented in Appendix A.1.
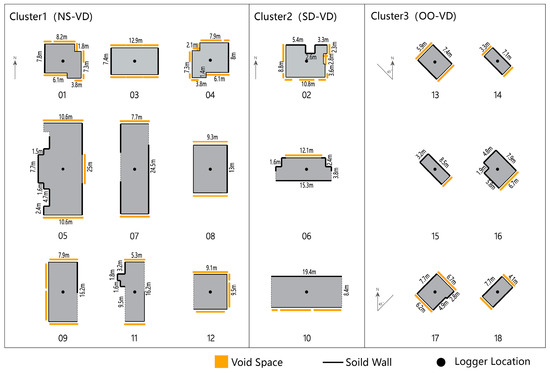
Figure 4.
Three clusters of selected void decks.
2.2. Microclimate Measurement
In this study, thermal environmental parameters were measured using a Delta OHM 32.3 TD instrument (Senseca Italy Srl, Padova, Italy), with the measurement range and accuracy strictly complying with ASHRAE Standard 55 [47] and ISO 7726 [48]. The core parameters recorded included air temperature (Ta), globe temperature (Tg), air velocity (Va), and relative humidity (RH) (Table 4). These indicators were subsequently used to compute the real-time mean radiant temperature (Tmrt) and Universal Thermal Climate Index (UTCI). The calculation of Tmrt is presented in Equation (1) [48] while the calculation of UTCI is presented in Equation (2) [32].
where Tmrt is the mean radiant temperature (°C); Tg is the globe temperature (°C); Va is the wind speed (m/s); and ε is the global emissivity coefficient (ε = 0.95) (ISO 7726 [48]; ASHRAE [47]).
where UTCI is Universal Thermal Climate Index (°C); Ta is the air temperature (°C); Tmrt is the mean radiant temperature (°C); Va is the wind speed (m/s); Pa is the water vapor pressure (Pa). The offset, i.e., the deviation of UTCI from air temperature, depends on the actual values of air and mean radiant temperature (Tmrt), wind speed (Va) and humidity, expressed as water vapor pressure (Pa) or relative humidity (RH) [32].
Table 4.
Description of Experimental Instruments.
Prior to data collection, the instrument was carefully calibrated, and measurements were conducted under conditions free from noticeable heat or cold sources to minimize potential bias. For consistency, measurement points were positioned in proximity to respondents, with the device placed at the geometric center of each overhead space and mounted on a tripod at a height of 1.5 m above ground level.
The empirical studies were conducted in Shenzhen during the summer season from 8 July to 26 August 2024, which represent characteristic summer high-temperature conditions of subtropical monsoon climate zones (Figure 1). Measurements across 18 void deck spaces in the four residential communities were conducted exclusively during clear summer days with daily temperatures ranging from 26 °C to 37 °C, avoiding rainy conditions or extreme weather events to minimize confounding effects on experimental data. Thermal measurements at each monitoring point were performed continuously from 9:00 to 18:00, encompassing a 9 h measurement period with data collection at 30 min intervals. Therefore, each void deck record 18 data sets and a total of 324 data sets were collected per monitoring point per day (Table 5).
Table 5.
Mean values of thermal comfort parameters in selected void desks in Shenzhen.
2.3. Occupants Survey
A structured self-administered questionnaire survey was implemented concurrently with microclimate monitoring to evaluate users’ subjective assessments of environmental quality. The participant cohort consisted of regular occupants from the selected residential communities who frequently utilized the void deck spaces for leisure activities and neighborhood interaction. Data collection was temporally synchronized with thermal measurements through on-site administration of paper-based survey instruments. The questionnaire comprised three distinct sections: Part 1 collected demographic information, including gender, age, place of origin, annual residence duration in Shenzhen, as well as behavioral patterns encompassing activity duration and typologies within void deck spaces. Part 2 assessed thermal environment perception through two validated metrics: Thermal Satisfaction Vote (TSV), and Thermal Comfort Vote (TCV). Thermal Satisfaction Votes were evaluated using the ASHRAE 7-point standard scale, with values ranging from −3 to +3 representing very cold (−3), cold (−2), cool (−1), neutral (0), warm (+1), hot (+2), and very hot (+3). TCV assessments employed five-point rating scales. Part 3 evaluated the Overall Environmental Quality (OEQ) and the multi-dimensional environmental satisfaction issues, including Area Satisfaction Vote (ASV), Height Satisfaction Vote (HSV), Ground Paving Quality Satisfaction Vote (GPQSV), Open Space Ratio Satisfaction Vote (OSRSV), Landscape Satisfaction Vote (LSV), Rest and Activity Facilities Satisfaction Vote (RAFSV), as well as the Thermal Satisfaction Vote (TSAT). The details of the sample questionnaire are presented in Table 6.
Table 6.
The questionnaire information of participants.
A total of 300 copies of questionnaires were randomly distributed, and 279 responses with completed and qualified data were collected (Table 7). Among the respondents, 52.33% were female and 47.67% were male. Age-group statistics showed that 2.15% were minors under 18 years, 69.89% were working-age adults between 19 and 59 years, and 27.96% were older adults aged 60 years and above. The survey results further indicated that over 85% of the participants resided in Shenzhen for more than six months annually, thereby experiencing the hot summer season.
Table 7.
Demographic information of the participants from the selected residential areas.
The reliability and validity of the questionnaire were tested prior to analysis. Cronbach’s α coefficients for all dimensions exceeded 0.7, with an overall value of 0.793, indicating satisfactory internal consistency. Validity tests showed a KMO value of 0.852, and Bartlett’s test of sphericity was statistically significant (p < 0.001). All interviews were conducted by graduate students in architecture. Most questionnaires were administered face-to-face, during which interviewers read the items aloud, provided clarifications, and verified responses. Completed questionnaires were reviewed with respondents immediately to ensure accuracy. The study complied with the Declaration of Helsinki and received approval from the Clinical Medical Ethics Committee of Shenzhen University Medical School (Approval No. PN-202500089). Participation was voluntary, with respondents free to withdraw at any time. Incomplete questionnaires were excluded, and informed consent was obtained from all participants.
Survey data revealed distinct preferences for void deck utilization based on outdoor activity duration. Among residents spending less than 2 h daily in outdoor activities, 58.42% selected void decks compared to only 26.52% choosing alternative open spaces. For residents with 2–4 h outdoor durations, void deck selection decreased to 27.24%, with further reductions observed among those spending longer periods outdoors. Temporal analysis indicated concentrated usage during afternoon and evening hours, with 26.88–40.5% of users accessing void decks between 2:00 PM and 8:00 PM. Morning and midday utilization remained limited, accounting for less than 20% of usage patterns. Investigation of summer thermal comfort adaptation strategies revealed that 67.38% of residents prioritized seeking shaded environments, while 28.67% employed clothing adjustments and 25.45% utilized physical cooling methods such as hand fans. These findings underscore the critical importance of shade provision in void deck spaces for residential thermal comfort management (Figure 5).
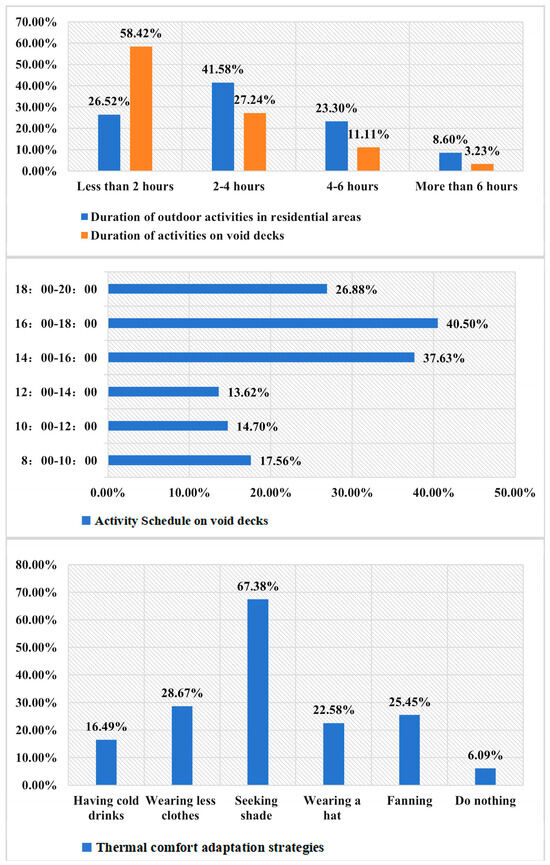
Figure 5.
The stay duration, schedule and climate adaptive behaviors of the occupants.
3. Results
3.1. Microclimate Condition
3.1.1. Comparison Between Diverse Typologies
A comparative analysis of meteorological parameters across the clusters is summarized in Table 8. Significant differences were observed among the three spatial clusters in terms of representative microclimatic indicators, including air temperature (Ta), relative humidity (RH), air velocity (Va), mean radiant temperature (Tmrt), and the Universal Thermal Climate Index (UTCI). Specifically, Cluster 3 exhibited the highest Ta (33.23 °C) and RH (64.81%), while Cluster 1 recorded the lowest values (Ta: 31.88 °C; RH: 60.72%), with significant differences observed (p < 0.01). Cluster 2 demonstrated the highest Va (1.602 m/s) compared to Cluster 3 (0.594 m/s), with all clusters differing significantly. In terms of Tmrt, Cluster 3 showed the highest mean value (33.469 °C), while Cluster 1 presented the lowest (32.225 °C), again with significant differences across all three clusters. Consequently, Cluster 3 showed the highest UTCI (35.65 °C), while Cluster 2 achieved the lowest (32.62 °C), with significant inter-cluster differences (p < 0.01).
Table 8.
Comparison of meteorological parameters between the diverse clusters.
3.1.2. Correlation of Microclimate Parameters
Pearson correlation coefficients were employed to examine the relationships between meteorological parameters and the Universal Thermal Climate Index (UTCI), quantifying their correlation strengths. Table 9 presents comprehensive details of inter-variable correlations. Results demonstrated that UTCI in Shenzhen residential void decks exhibited strong, significant positive correlations with air temperature (Ta) (r = 0.709) and mean radiant temperature (Tmrt) (r = 0.581). Conversely, UTCI showed a significant negative correlation with air velocity (Va) (r = −0.522), while no significant correlation was observed with relative humidity (RH). Mean radiant temperature (Tmrt) demonstrated strong positive correlations with Ta (r = 0.894) and moderate positive correlations with Va (r = 0.232), while exhibiting a significant negative correlation with RH (r = −0.432). Hence, Tmrt is primarily influenced by ambient air temperature and solar radiation exposure. Void decks with greater elevation heights receive increased solar radiation, which simultaneously enhances air velocity through thermal buoyancy effects and reduces relative humidity levels through enhanced evaporation processes.
Table 9.
Correlation analysis of meteorological parameters (N = 324).
3.2. Thermal Perception and Environmental Satisfaction
3.2.1. Thermal Perception
Thermal neutrality is characterized as the thermal state where metabolic heat production is neither increased nor decreased due to environmental thermal stress [49]. Mean thermal sensation votes (MTSV) and mean thermal comfort votes (MTCV) were calculated for each 1 °C UTCI interval and fitted using linear and binomial regression models, respectively. Based on the linear regression analysis of MTSV values across comfort levels, the neutral UTCI for Shenzhen’s summer conditions was determined to be 28.42 °C. The neutral UTCI range, defined as the UTCI range where MTSV values fall between −0.5 and +0.5 [15], was established at 26.99–29.86 °C for the study population. The linear regression slope between MTSV and UTCI was 0.3477, corresponding to a sensitivity of 2.876 °C UTCI per TSV unit (Figure 6).
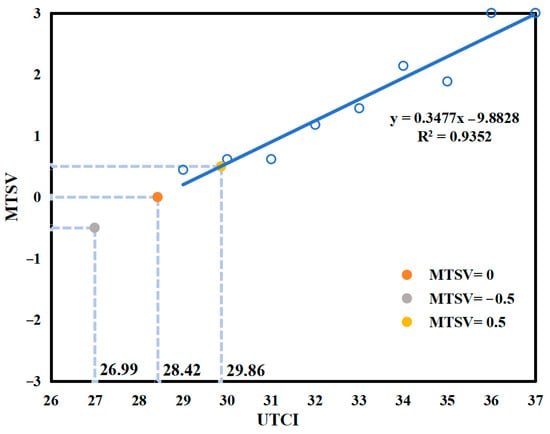
Figure 6.
The correlation between UTCI and MTSV.
As UTCI increased, mean thermal comfort votes (MTCV) demonstrated a corresponding decline (Figure 7). Binomial regression analysis revealed that thermal comfort neutrality (MTCV = 0) was achieved at a UTCI of 31.6 °C. Respondents reported “moderate” thermal comfort conditions at this threshold (MTCV = 0, UTCI = 31.6 °C). The findings indicate that thermal discomfort predominated across most measurement conditions, with occupants experiencing marginal comfort only when UTCI remained below 31.6 °C. Critical thermal discomfort thresholds were identified at 35.09 °C UTCI for “uncomfortable” conditions and 36.49 °C UTCI for “very uncomfortable” conditions.
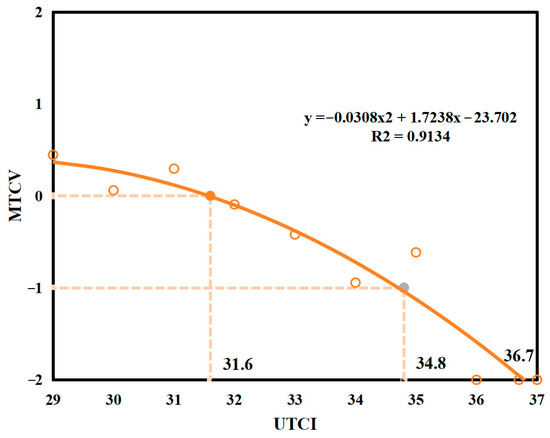
Figure 7.
The correlation between UTCI and MTCV.
A binomial regression analysis between mean thermal sensation votes (MTSV) and mean thermal comfort votes (MTCV) demonstrated an inverse relationship, whereby thermal comfort decreased as thermal sensation intensity increased (Figure 8). At the thermal comfort neutral point (TCV = 0), corresponding thermal sensation was slightly warm (TSV = 1.01). The results indicate that during summer high-temperature conditions, occupants maintained acceptable thermal comfort levels despite experiencing slightly warm thermal sensations, suggesting adaptation to the local climatic conditions.
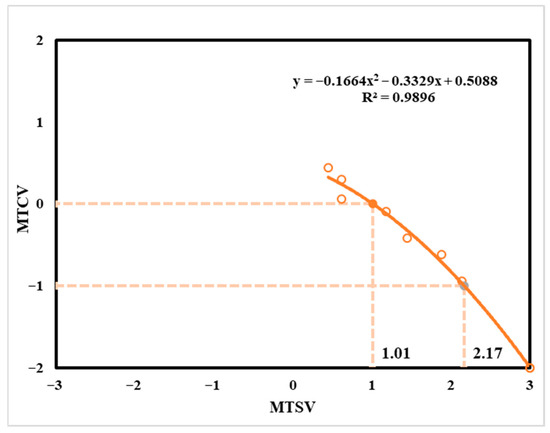
Figure 8.
The correlation between MTSV and MTCV.
3.2.2. Environmental Satisfaction
Environmental quality assessment across multiple spatial dimensions revealed significant differences among the three clusters (Table 10). Cluster 1 and Cluster 2 demonstrated similar Area Satisfaction Votes (ASV ≈ 1.0), while Cluster 3 showed neutral satisfaction (ASV ≈ 0), with significant differences between Cluster 3 and both other clusters. Height Satisfaction Vote (HSV) was highest in Cluster 2 (0.917) and lowest in Cluster 3 (0.722), though differences were not statistically significant. Ground Paving Quality Satisfaction Vote (GPQSV) showed that Cluster 2 had the highest rating (0.771) and Cluster 1 had the lowest (0.68), with no significant inter-cluster differences. Open Space Ratio Satisfaction Vote (OSRSV) was highest in Cluster 1 (0.837) and lowest in Cluster 3 (≈0), with significant differences between Cluster 3 and the other clusters. Landscape Satisfaction Vote (LSV) and Rest and Activity Facilities Satisfaction Vote (RAFSV) both showed that Cluster 1 achieved the highest ratings (0.796 and 0.483, respectively) and Cluster 3 achieved the lowest (0.481 and 0.25, respectively), with significant differences between these clusters. Unlike the Thermal Satisfaction Vote (TSV) and Thermal Comfort Vote (TCV), which reflect momentary thermal comfort, the thermal satisfaction evaluation represents the long-term thermal environment in the void deck. This study shows that Cluster 1 has the highest average thermal satisfaction (TSAT) at 0.599, while Cluster 3 has the lowest average TSAT at 0.167, with significant differences between Cluster 1 and Cluster 3, and Cluster 2 and Cluster 3. Finally, in terms of overall evaluation, Cluster 1 had the highest average Quality of Environmental Quality (QEQ) at 0.803, indicating satisfaction, while Cluster 3 had the lowest average QEQ at 0.389, with significant differences observed between the two clusters.
Table 10.
Comparison of environmental satisfaction between the diverse clusters.
3.2.3. Correlation Analysis
This section employs Pearson’s correlation coefficient to examine the correlation and strength of the relationship between the variables of Thermal Perceptions and Environmental Satisfaction. Table 11 provides detailed information regarding the correlations between these variables. Based on the analysis of the interrelationships between the form of void decks and microclimatic differences, all spatial environmental factors exhibit significant correlations. Specifically, significant positive correlations with large effect sizes (r = 0.5) were found between OEQ and ASV, OSRSV and ASV, as well as LSV and OSRSV. Regarding thermal satisfaction (TSAT), the highest correlation was observed with OEQ (r = 0.473), while all other spatial environmental factors exhibited moderate positive correlations (r ≥ 0.3). From the perspective of the Thermal Sensation Vote (TSV), weakly significant negative correlations were found with HSV and GPQSV. Additionally, TSV showed a significant negative correlation with TSAT (r = −0.295). Analyzing from the viewpoint of Thermal Comfort Vote (TCV), a strong, significant positive correlation was observed with OEQ (r = 0.299), while weak positive correlations were found with HSV and OSRSV. Furthermore, TCV exhibited a strongly significant positive correlation with TSAT (r = 0.403), but a significant negative correlation with TSV (r = −0.344).
Table 11.
Correlation analysis between thermal perception and environmental perception (N = 279).
3.3. Regression of Spatial Attributes
To assess multicollinearity among the overhead layer geometric variables, variance inflation factor (VIF) and correlation analyses were performed prior to estimating regression coefficients. As significant collinearity was detected among several variables, ridge regression was employed to examine the relationships between microclimate and geometric parameters. Ridge regression was employed as a regularized linear regression technique to address multicollinearity concerns inherent in ordinary least squares estimation [50]. Ridge regression, an enhanced least squares method incorporating regularization terms into ordinary linear regression, not only minimizes fitting errors but also improves model generalization by mitigating interference from inter-variable correlations [51]. Model performance depends critically on the ridge parameter K (ranging from 0 to 1), whose optimal selection is essential [52]. Ridge regression models were established to examine relationships between five microclimatic variables (Ta, RH, Va, Tmrt, and UTCI) and ten geometric parameters. The optimal K value (K = 0.2) was determined based on the stabilization point in ridge trace plots. All five models demonstrated statistical significance (F-test, p < 0.001 ***) with no multicollinearity issues detected (all VIF < 5).
Appendix A (Table A2, Table A3, Table A4, Table A5 and Table A6) presents geometrical configuration correlation analyses for the development of five predictive models: Model 1 (Ta), Model 2 (RH), Model 3 (Va), Model 4 (Tmrt), and Model 5 (UTCI). As shown in Table 12, ridge regression analysis revealed significant influences of geometric variables on environmental factors. For air temperature (Ta), environmental factors, including Orientation and SVF, explained 24.8% of the variance (adjusted R2 = 0.248). Mean radiant temperature (Tmrt) demonstrated higher predictability, with HDR, Orientation, GVF, SVF, and HFG accounting for 36.6% of the variance (adjusted R2 = 0.366). Relative humidity (RH) showed moderate predictability, with eight geometric variables (HDR, WDR, Orientation, AW, NOS, SVF, GVF, HFG) explaining 28.0% of the variance. Air velocity (Va) exhibited the strongest model performance, with geometric factors (HDR, Orientation, AW, NOS, GVF, SVF, HFG, BS) explaining 76.1% of the variance (adjusted R2 = 0.761). Model 5 demonstrated that void deck morphological characteristics significantly influence UTCI, with nine variables (HDR, WDR, Orientation, AW, NOS, GVF, SVF, HFG, BS) explaining 51.2% of UTCI variation (adjusted R2 = 0.512). AW and SVF exhibited positive correlations with UTCI, while the remaining indicators showed negative correlations.
Table 12.
Summary of the Models having the environmental factors as dependent variables.
The analysis confirmed previous research findings regarding the strong association between Ta and Tmrt, with both variables sharing common geometric predictors [15]. Orientation and SVF demonstrated positive correlations with both Ta and Tmrt. Additional predictors for Tmrt included HDR and HFG. The moderate explanatory power for RH (28.0%) may be attributed to the uniform ground-level positioning of void deck spaces, resulting in limited spatial variation in humidity patterns. Multiple variables significantly influenced Va, with HFG, HDR, AW, Orientation, and NOS showing the strongest effects.
4. Discussion
4.1. Association Between Spatial Attributes and Microclimate Performance
4.1.1. Void Deck Typological Classification and Microclimatic Performance
This study classified Shenzhen void decks into three distinct typologies: North–South Ventilated Void Deck (NS-VD) is known as Cluster 1, Single-Directional Void Deck (SD-VD) is named Cluster 2, and Cluster 3 regards the Oblique-oriented Void Deck (OO-VD). Field measurements revealed significant differences in microclimatic parameters (Ta, RH, Va, Tmrt, and UTCI) among the three clusters (Table 8). Overall, Cluster 1 demonstrated the most favorable microclimatic indicators, while Cluster 3 exhibited the poorest performance; however, Cluster 2 achieved the lowest UTCI values. Specifically, Cluster 3 recorded Ta values 1.354 °C higher than Cluster 1, RH values 4.092% higher, and Tmrt values 1.244 °C higher. Conversely, Cluster 2 demonstrated Va values 1.008 m/s higher than Cluster 3. Correlation analysis (Table 9) revealed positive relationships between UTCI and both Ta and Tmrt, while demonstrating negative correlations with Va. This explains why Cluster 3, characterized by high Ta, high Tmrt, and low Va, exhibited the highest UTCI values [31,53]. Despite Cluster 1 having lower mean air temperature (Ta) and mean radiant temperature (Tmrt), the significantly higher wind speed (Va) of Cluster 2 resulted in lower UTCI values. This demonstrates the variable influence of microclimatic parameters on UTCI, a dynamic thermophysiological model of human heat balance [37]. Generally, higher Ta and Tmrt increase heat loads and UTCI, while greater Va enhances heat dissipation and evaporation, offsetting thermal gains [32]. Humidity also modulates UTCI, with higher vapor pressure reducing evaporative efficiency and increasing UTCI, and drier air amplifying the cooling effect of wind [38,54]. Therefore, despite higher Ta and Tmrt, confirms that Va can dominate under hot–humid subtropical conditions, highlighting the complex sensitivities within the UTCI framework.
International UTCI classifications categorize thermal conditions as follows: no thermal stress (9–26 °C), moderate heat stress (26–32 °C), strong heat stress (32–38 °C), very strong heat stress (38–46 °C), and extreme heat stress (>46 °C) [32]. The neutral UTCI of 28.42 °C identified in this study positions Shenzhen’s residential void decks within the “moderate heat stress” category according to standardized classifications, yet residents reported thermal neutrality (MTSV = 0) at this threshold. This discrepancy illuminates the limitations of universal thermal indices when applied to culturally and climatically adapted populations inhabiting semi-outdoor transitional spaces [38,55]. According to the on-site measurement, the neutral UTCI range of 26.99–29.86 °C determined for Shenzhen exceeds the conventional thermal stress range by approximately 3–4 °C, consistent with documented patterns of thermal adaptation in hot–humid climates [56]. Comparative research in Chinese coastal cities demonstrates neutral UTCI values ranging from 24.1 °C to 26.0 °C in different urban settings, indicating regional variations in thermal adaptation thresholds [57,58]. Studies confirm that Asian populations exhibit neutral temperatures elevated compared to European-derived standards, attributable to physiological acclimatization, behavioral adaptation strategies, and differential thermal comfort expectations shaped by long-term climatic exposure [2,15]. The extended summer season in Shenzhen (>6 months annually, mean July temperature 29.0 °C) facilitates long-term acclimatization processes that elevate thermal tolerance thresholds beyond those observed in temperate regions [13,59].
4.1.2. Morphological Characteristics and Thermal Comfort Relationships
When considering the spatial environmental morphology of the different types of void decks, significant differences were observed in spatial configuration, including Height-to-depth ratio (HDR), width-to-depth ratio (WDR), Orientation, Angle with the wind (AW), Open space ratio (OPR), Number of open sides (NOS), Green view factor (GVF), Sky view factor (SVF), while no statistically significant differences were found in terms of height from the ground (HFG) or interval space (IS) (Appendix A). Cluster 1, characterized by larger areas and multiple openings creating north–south ventilation corridors, exhibited the smallest height-to-depth ratio (HDR). Cluster 2, with moderate area and openness ratios oriented either northward or southward without cross-ventilation potential, demonstrated the largest HDR values. Cluster 3 constraints smaller spatial areas, fewer openings, and non-cardinal orientations, contributed to elevated Ta and Tmrt values. Given Shenzhen’s prevailing southerly summer winds, Cluster 3 reduced Va resulted in the highest UTCI values, confirming the critical role of spatial configuration in thermal performance optimization [60,61].
Cluster 2, with its single-directional exposure and optimized height-to-depth ratio (HDR), achieves the best objective thermal comfort performance, reflected by the lowest UTCI values. This result aligns with the well-established principle that higher air velocity, such as in Cluster 2, significantly contributes to lower thermal stress, as increased air movement promotes evaporation and heat dissipation from the body [32]. However, despite the favorable objective thermal conditions, Cluster 2 falls short in terms of subjective satisfaction. This discrepancy can be attributed to the limitations of spatial configurations that restrict personal thermal control, such as the absence of cross-ventilation and limited adaptability in the design [1,27]. Thus, although the environmental metrics favor Cluster 2, the lack of choice and control over microclimates likely diminishes residents’ overall satisfaction with the space.
4.2. Evaluation of Thermal Perceptions and Overall Environmental Quality
4.2.1. Adaptation in Thermal Perception
The Universal Thermal Climate Index (UTCI), which integrates air temperature (Ta), air velocity (Va), vapor pressure (Pa), and mean radiant temperature (Tmrt), represents one of the most comprehensive indicators for assessing thermal stress in actual environmental conditions [53,62]. This study, using high-density residential communities in Shenzhen as representative cases, determined the summer neutral UTCI for void deck spaces to be 28.42 °C through regression analysis of mean thermal sensation votes (MTSV) against UTCI. Existing research demonstrates a latitudinal gradient in summer neutral UTCI, increasing from northern China (Zhangjiakou: 23.6 °C [63]) to southern regions (Shanghai: [64]; Shenzhen: 27.2 °C [65]; Hong Kong: 22.7–35.43 °C [42,62,66]), reflecting regional climatic adaptation.
In our research, the findings indicate that summer neutral UTCI in Shenzhen’s residential semi-outdoor spaces (28.42 °C) exceeds the European standard of 26 °C [21]. First, Shenzhen’s climatic context, characterized by extended summer seasons (>6 months annually, mean July temperature 29.0 °C), fosters enhanced thermal tolerance and climatic adaptation among residents [67]. Second, field measurements were conducted during peak summer months when residents demonstrate heightened thermal tolerance under hot conditions [59], explaining the higher neutral UTCI observed in this study relative to other local research [65] and most investigations in neighboring Hong Kong. Third, Shenzhen’s location in the Lingnan hot–humid region of southern China has cultivated centuries-old traditions of utilizing semi-outdoor spaces—including arcade streets, courtyards, balconies, and void decks—for summer heat mitigation [68,69]. Shade-seeking behavior remains the predominant thermal adaptation strategy (Table 5), and this cultural heritage contributes to residents’ elevated acceptance of outdoor thermal conditions.
4.2.2. Variations in Environmental Satisfaction
This study evaluated environmental satisfaction for spatial elements in void decks across typical high-density residential communities in Shenzhen through questionnaire surveys. Results demonstrated that users exhibited significant differences in their assessments of Overall Environmental Quality (OEQ) among the three void deck typologies, as well as significant variations in five environmental factors: Area Satisfaction Vote (ASV), Open Space Ratio Satisfaction Vote (OSRSV), Landscape Satisfaction Vote (LSV), Rest and Activity Facilities Satisfaction Vote (RAFSV), and thermal satisfaction (TSAT). Conversely, Height Satisfaction Vote (HSV) and Ground Paving Quality Satisfaction Vote (GPQSV) showed no statistically significant differences among clusters. Participants rated Cluster 1 highest for OEQ, with significant differences compared to the lowest-scoring Cluster 3, indicating that north–south ventilated, highly open, and larger void decks provide superior user experiences compared to obliquely ventilated, smaller spaces with inferior facilities. Additionally, Cluster 1 achieved the highest scores for OSRSV, LSV, and RAFSV, while Cluster 2 demonstrated the highest ratings for ASV, HSV, and GPQSV. Cluster 3 consistently recorded the lowest satisfaction scores across multiple spatial elements, including ASV, OSRSV, LSV, and RAFSV.
This study emphasized the significant correlations between spatial environmental factors and thermal perception assessments. Previous research indicates that although visual perception dominates environmental evaluation [42,70], thermal comfort remains the primary consideration for residents when selecting outdoor activity locations [13,71,72]. While Cluster 2 achieved the lowest UTCI (32.62 °C), residents rated Cluster 1 highest in both thermal satisfaction (TSAT) and overall environmental quality (OEQ). This divergence reflects that objective thermal indices quantify instantaneous physiological stress but do not capture long-term multi-sensory experiences [42]. Correlation analysis (Table 11) confirmed OEQ associated most strongly with comprehensive long-term thermal satisfaction (TSAT) (r = 0.473) rather than momentary Thermal Sensation Vote (TSV). Residents prioritized spatial openness, cross-ventilation corridors, landscape quality, and social usability—all more prominent in Cluster 1—over marginal UTCI advantages, highlighting the need to integrate objective thermal performance with subjective psychosocial indicators in semi-outdoor residential design [3,4]. In the Shenzhen context, where residents display higher thermal tolerance and adaptation [8,67], the holistic qualities of NS-VDs likely outweighed the marginal UTCI advantage of SD-VDs. This highlights the necessity of integrating objective thermal performance with subjective psychosocial indicators in semi-outdoor residential design [3,16].
4.3. Spatial Configuration for Thermal Comfort Promotion
4.3.1. The Comparison of Spatial Configuration
Multivariate ridge regression analysis revealed that spatial configuration exerts significant influences on thermal comfort, explaining 24.8%, 28.0%, 76.1%, 36.6%, and 51.2% of the variance in Ta, RH, Va, Tmrt, and UTCI, respectively. The regression relationships between individual spatial configuration parameters and microclimatic variables are summarized in Table 13. The research expands on previous research by identifying a broader set of spatial environmental factors—height-to-depth ratio (HDR), orientation, angle with wind (AW), number of open sides (NOS), sky view factor (SVF), Green view factor (GVF), and height from ground (HFG)—significantly impacting microclimatic conditions and UTCI in void decks. These factors explain performance variations among the three void deck clusters. HDR positively influenced RH, Va, and Tmrt while negatively affecting UTCI, with no Ta impact. Conversely, WDR showed negative correlations only with RH and UTCI. Although increased HDR enhances RH and Tmrt, concurrent air velocity enhancement produces net UTCI reduction, aligning with established research [1,25]. HDR positively influenced RH and Tmrt while negatively affecting UTCI, with no Ta impact. Although HDR enhances RH and Tmrt, concurrent air velocity enhancement produces a net UTCI reduction, consistent with established findings that elevated void decks receive greater solar radiation and stronger buoyancy-driven airflow [13]. Conversely, WDR showed a negative correlation only with RH, with no significant associations observed for other microclimatic parameters, aligning with previous research on ventilation patterns [73].
Table 13.
The regression relationships between spatial configuration and microclimatic variables.
This study employed two complementary indicators—Orientation and Angle with Wind (AW)—to analyze the influence of void deck orientation on thermal environmental parameters. Results demonstrated that Orientation exerted positive effects on Ta, Va, and Tmrt while showing negative correlations with RH and UTCI. Conversely, AW exhibited positive influences on RH and UTCI but negative effects on Va. These findings indicate that as void deck orientation shifts from north-facing to south-facing directions, increased solar exposure duration elevates spatial Ta, Va, and Tmrt while reducing RH and UTCI values [4]. The results confirm that wind direction serves as the primary determinant of airflow incidence angle and wind velocity, thereby influencing ventilation performance [25]. Semi-outdoor spaces designed in accordance with prevailing wind directions can maximize wind speed enhancement [74,75]. Analysis reveals that south-facing orientations increase Ta and Tmrt but simultaneously enhance air velocity due to Shenzhen’s prevailing southerly winds, resulting in net UTCI reduction and improved thermal comfort. While south-facing void decks experience higher thermal loads, alignment with prevailing wind patterns generates compensatory cooling effects through enhanced air movement. This demonstrates the critical importance of climate-responsive design strategies that leverage local meteorological conditions to optimize thermal comfort in semi-outdoor spaces.
Void deck openness was assessed using Open Space Ratio (OSR) and Number of Open Sides (NOS). While previous research demonstrated positive correlations between OSR and airflow parameters [26,76], this study found no significant OSR effects on microclimatic variables, likely due to similar opening ratios across study sites. Conversely, NOS exhibited significant positive effects on air velocity and negative correlations with RH and UTCI, indicating that multiple openings enhance wind velocity and reduce thermal stress more effectively than increased opening area. These findings demonstrate that opening quantity surpasses opening ratio in importance, with cross-ventilation configurations providing substantial microclimatic improvements during summer conditions [27], challenging conventional assumptions about opening area optimization in favor of strategic opening placement for enhanced thermal comfort.
Due to structural limitations, including ceiling height and load-bearing constraints, GVF in this study was predominantly contributed by surrounding residential landscaping rather than internal vegetation. Results showed that void decks with enhanced openness configurations achieved higher GVF values. Despite increased thermal radiation exposure leading to elevated Tmrt, the compensatory effects of enhanced air velocity outweighed radiative heat gains, producing net UTCI reductions and improved thermal comfort conditions [1,77]. Height from Ground (HFG) exhibited positive correlations with Va and Tmrt while showing negative relationships with RH and UTCI, where increased elevation reduces obstruction and enhances air velocity, though no significant HFG-Ta relationship was observed, possibly due to the limited elevation range (0–15 m) examined [24]. Sky View Factor (SVF) demonstrated positive correlations with Ta, Tmrt and UTCI, while showing negative correlations with RH and Va, consistent with established research [47]. Further, interval space (IS) showed positive correlations with Va and negative correlations with UTCI. These findings indicate that more open void deck environments with greater elevation and spatial separation from surrounding buildings enhance air movement despite potentially increasing solar radiation exposure, resulting in net UTCI reduction and improved thermal comfort performance.
4.3.2. Optimal Void Deck Typologies for Diverse Microclimates
The three void deck typologies demonstrated differential thermal effectiveness across distinct microclimatic scenarios (Table 14). According to Shenzhen Meteorological Bureau statistics from 1990 to 2020, annual sunshine hours averaged 1853.0 h, with July reaching 214.8 h of sunshine. Under clear sky conditions with high solar radiation, Cluster 1 (NS-VD) achieved optimal performance (mean Tmrt = 32.23 °C) through enhanced ventilation volume from higher ceiling heights (HDR = 0.31) and cross-ventilation via bilateral north–south corridors [78]. This configuration proved superior during low wind conditions (mean Va = 0.836 m/s) and high humidity periods (mean RH = 60.72%), where enhanced openness (OSR = 2.67) and multiple ventilation pathways (NOS = 0.59) facilitated pressure-driven airflow and moisture dissipation when both convective and evaporative cooling efficiency were compromised [79].
Table 14.
Performance Matrix of Void Deck Typologies Under Different Microclimatic Conditions.
Under moderate wind and thermal stress conditions (UTCI > 32 °C), Cluster 2 (SD-VD) demonstrated optimal thermal mitigation (mean UTCI = 32.62 °C, 3.03 °C lower than Cluster 3) through superior height-to-depth ratio (HDR = 0.50) that maximized vertical circulation [16]. Strategic southerly or northerly orientation aligned with prevailing winds concentrated airflow via the Venturi effect, achieving mean velocities of 1.602 m/s—90% higher than Cluster 1 despite single-sided ventilation [80]. This configuration sustained stable performance across diurnal wind fluctuations through local wind acceleration within the occupied zone [25].
These performance patterns provide clear criteria for typology selection: Cluster 1 is optimal for sites experiencing frequent high solar radiation, elevated humidity, or low wind conditions, as it enhances cross-ventilation and openness [81]. Cluster 2 is ideal for sites subject to moderate thermal stress and consistent wind direction, where an optimized height-to-depth ratio (HDR) and strategic orientation compensate for limited openings by concentrating airflow [82]. The consistently poor performance of Cluster 3 suggests that oblique orientations with excessive enclosure should be avoided, unless site constraints prevent alternative configurations [83].
5. Conclusions
This study conducted comprehensive investigations of 18 void deck spaces across four representative high-density residential communities in Shenzhen, southern China. Based on spatial environmental characteristics, three distinct typologies were identified—North–South Ventilated Void Deck (NS-VD), Single-Directional Void Deck (SD-VD), and Oblique-Oriented Void Deck (OO-VD)—and were comparatively analyzed in terms of microclimatic parameters, UTCI-based thermal comfort, morphological characteristics, and environmental evaluation. The analysis established quantitative relationships between spatial configurations and thermal performance, demonstrating how specific environmental variables enhance thermal comfort through solar protection and air movement optimization. These findings not only clarify the mechanisms by which void deck typologies influence thermal and environmental satisfaction, but also provide evidence-based design strategies for creating thermally comfortable semi-outdoor spaces in high-density residential developments, thereby promoting resident well-being and advancing urban sustainability. The principal findings are as follows:
1. Typological thermal divergence: Three void deck typologies—North–South Ventilated (NS-VD), Single-Directional (SD-VD), and Oblique-Oriented (OO-VD)—exhibited significant microclimatic differences. While Cluster 1 demonstrated lower Ta and RH, Cluster 2 achieved the lowest UTCI (32.62 °C) through a superior height-to-depth ratio (HDR = 0.50) and enhanced air velocity (Va = 1.602 m/s). Summer neutral UTCI for Shenzhen void decks was determined at 28.42 °C (neutral range: 26.99–29.86 °C), exceeding European and northern Chinese cities due to climatic adaptation.
2. Thermal environmental–satisfaction correlation: Despite the optimal objective thermal performance of Cluster 2, residents rated Cluster 1 highest in overall environmental quality (OEQ), with OEQ correlating most strongly with long-term thermal satisfaction (TSAT) (r = 0.473) rather than momentary thermal sensation, highlighting the importance of integrating spatial openness, landscape quality, and social usability alongside thermal metrics.
3. Spatial configuration predictors: Seven critical parameters significantly influence void deck thermal performance: HDR, Orientation, Angle with Wind (AW), Number of Open Sides (NOSs), Green View Factor (GVF), Sky View Factor (SVF), and Height from Ground (HFG), collectively explaining 24.8–76.1% of microclimate variance and 51.2% of UTCI variation, providing quantitative frameworks for climate-responsive design optimization in high-density subtropical residential environments.
This research provides evidence-based design guidelines for void deck spaces in subtropical high-density residential environments. First, spatial selection criteria: Prioritize ground-level locations with minimal wind angle deviations, multiple open sides, elevated heights from ground level, and increased spacing from adjacent buildings to optimize natural ventilation and thermal performance. Second, thermal comfort optimization strategies: Enhance thermal comfort and reduce UTCI through maximizing void deck height, optimizing height-to-width ratios, minimizing sky view factor, and integrating peripheral vegetation. Third, an integrated design approach: Overall void deck quality requires comprehensive consideration of spatial area, openness degree, landscape environment, facility configuration, and thermal comfort optimization, recognizing that multiple interdependent factors determine environmental performance.
This research addresses a critical knowledge gap by providing empirical evidence on thermal comfort performance and user satisfaction in residential void deck spaces within subtropical Asian high-density contexts. Shenzhen’s humid subtropical climate, characterized by oceanic influences, urban heat island effects, and monsoon patterns, presents distinct thermal challenges inadequately addressed by existing Mediterranean, tropical, or temperate climate research, yielding novel insights for climate-responsive sustainable housing design in high-density metropolitan environments. There are also limitations in this study: (1) While the 18 void deck spaces across four Shenzhen communities represent typical high-density residential developments, broader community typologies require investigation. (2) Data collection during July-August only, without winter or transitional season measurements, constrains assessment of seasonal variations and long-term thermal adaptation patterns. Building upon these empirical findings on void deck thermal comfort in subtropical residential contexts, three critical research frontiers warrant systematic investigation. First, we recommend developing morphology-informed multi-objective design tools and guidelines, which involve integrating spatial parameters (e.g., height-to-depth ratio, orientation, openness, sky view factor, and vegetation) with thermal comfort, air movement, visual privacy, daylighting, and social factors into parametric design workflows validated by field data. Second, we recommend developing spatio-temporal probabilistic comfort models for semi-outdoor residential spaces, moving beyond static UTCI thresholds to incorporate probabilistic distributions of thermal comfort and discomfort across time, considering weather extremes, urban morphology, and occupant behavior. Third, we recommend examining personalization and adaptation in residential semi-outdoor spaces by investigating how individual acclimatization, clothing, thermal perception, occupancy, and privacy expectations affect the relationship between subjective satisfaction and objective thermal measurements in high-density void decks.
Author Contributions
Conceptualization, S.C.; methodology, S.C. and F.X.; software, S.C. and J.F.; validation, F.X.; formal analysis, S.C. and F.X.; investigation, J.F. and Q.H.; writing—original draft preparation, S.C., F.X. and J.F.; writing—review and editing, F.X.; visualization, J.F. and Q.H.; supervision, S.C. and F.X. All authors have read and agreed to the published version of the manuscript.
Funding
This research was funded by the Guangdong Philosophy and Social Science Planning Project Grants, GD25CYS62 and GD25CGG33; the 14th Five-Year National Key R&D Program Project, grant number 2023YFC3807404 and 2023YFC3807403; and the National Natural Science Foundation of China, grant number 52178020.
Data Availability Statement
The original contributions presented in this study are included in the article, further inquiries can be directed to the corresponding author.
Acknowledgments
The authors gratefully acknowledge the institutional support provided by the State Key Laboratory of Subtropical Building and Urban Science, Center for Human-Oriented Environment and Sustainable Design, School of Architecture and Urban Planning. Special appreciation is extended to graduate students from the School of Architecture and Urban Planning, Shenzhen University, for their valuable assistance in field data collection. The authors express sincere gratitude to residents of the four representative residential communities for their cooperation and participation throughout the research process.
Conflicts of Interest
The authors declare no conflicts of interest.
Abbreviations
| Ta | Air temperature (°C) |
| RH | Relative humidity (%) |
| Va | Wind speed (m/s) |
| Tmrt | Mean radiant temperature (°C) |
| UTCI | Universal Thermal Climate Index |
| TSV | Thermal sensation vote |
| TCV | Thermal comfort vote |
| TSAT | Thermal satisfaction |
| MTSV | Mean TSV |
| TCV | Mean TCV |
| OEQ | Overall environmental quality |
| ASV | Area sensation vote |
| HSV | Height sensation vote |
| GPQSV | Ground paving quality sensation vote |
| OSRSV | Open space ratio sensation vote |
| LSV | Landscape sensation vote |
| RAFSV | Rest and activity facilities sensation vote |
Appendix A
Appendix A.1. Hierarchical Clustering

Figure A1.
Dendrogram showing identified clusters.
Figure A1.
Dendrogram showing identified clusters.

Table A1.
Mean values of spatial attributes for each cluster.
Table A1.
Mean values of spatial attributes for each cluster.
| Variables | Cluster Typology (Mean Value ± Standard Error) | F | p | ||
|---|---|---|---|---|---|
| Cluster 1 (NS-VD) | Cluster 2 (SD-VD) | Cluster 3 (OO-VD) | |||
| Area | 128.11 ± 51.84 | 77.80 ± 49.16 | 33.25 ± 8.64 | 117.380 | 0.000 ** |
| Height-to-depth ratio (HDR) | 0.31 ± 0.16 | 0.50 ± 0.06 | 0.44 ± 0.03 | 80.976 | 0.000 ** |
| width-to-depth ratio (WDR) | 0.75 ± 0.45 | 1.17 ± 0.72 | 0.56 ± 0.17 | 32.295 | 0.000 ** |
| Orientation | 0.00 ± 0.00 | 54.00 ± 66.51 | 45.00 ± 0.00 | 83.883 | 0.000 ** |
| Angle with the wind(AW) | 22.50 ± 0.00 | 31.50 ± 18.10 | 67.50 ± 0.00 | 563.979 | 0.000 ** |
| Open space ratio(OSR) | 2.67 ± 0.47 | 1.80 ± 0.75 | 1.50 ± 0.50 | 130.060 | 0.000 ** |
| Number of open sides(NOS) | 0.59 ± 0.18 | 0.33 ± 0.13 | 0.21 ± 0.06 | 193.757 | 0.000 ** |
| Green view factor (GVF) | 0.37 ± 0.20 | 0.28 ± 0.14 | 0.04 ± 0.06 | 99.443 | 0.000 ** |
| Sky view factor (SVF) | 0.13 ± 0.11 | 0.11 ± 0.05 | 0.26 ± 0.16 | 44.101 | 0.000 ** |
| Height from ground (HFG) | 7.67 ± 6.15 | 7.80 ± 4.78 | 8.00 ± 0.00 | 0.111 | 0.895 |
| Interval space (IS) | 42.22 ± 38.50 | 45.00 ± 20.85 | 45.00 ± 25.18 | 0.311 | 0.733 |
** p < 0.01.
Appendix A.2. Ridge Regression
Table A2.
Ridge regression measuring the influence of geometrical variables on Ta (Model 1).
Table A2.
Ridge regression measuring the influence of geometrical variables on Ta (Model 1).
| Variables | Unstandardized Coefficients | Standardized Coefficient | t | p-Value (p) | VIF | |
|---|---|---|---|---|---|---|
| Coefficients | Std. Error | |||||
| (Intercept) | 31.209 | 0.693 | - | 45.014 | 0.000 ** | - |
| HDR | −0.033 | 0.589 | −0.004 | −0.057 | 0.955 | 2.545 |
| WDR | −0.256 | 0.151 | −0.131 | −1.699 | 0.09 | 2.483 |
| Orientation | 0.25 | 0.078 | 0.29 | 3.187 | 0.002 ** | 3.447 |
| AW | 0.135 | 0.166 | 0.071 | 0.811 | 0.418 | 3.193 |
| NOS | −0.066 | 0.104 | −0.047 | −0.632 | 0.528 | 2.274 |
| OSR | −0.736 | 0.497 | −0.15 | −1.481 | 0.14 | 4.269 |
| GVF | 1.018 | 0.55 | 0.195 | 1.851 | 0.065 | 4.61 |
| SVF | 3.465 | 0.783 | 0.396 | 4.423 | 0.000 ** | 3.33 |
| HFG | 0.029 | 0.018 | 0.133 | 1.585 | 0.114 | 2.933 |
| IS | −0.002 | 0.002 | −0.069 | −0.97 | 0.333 | 2.115 |
| R2 | 0.248 | |||||
| Adjusted R2 | 0.224 | |||||
| F | F (10,313) = 10.350, p = 0.000 | |||||
| K | 0.2 | |||||
** p < 0.01.
Table A3.
Ridge regression measuring the influence of geometrical variables on RH (Model 2).
Table A3.
Ridge regression measuring the influence of geometrical variables on RH (Model 2).
| Variables | Unstandardized Coefficients | Standardized Coefficient | t | p-Value (p) | VIF | |
|---|---|---|---|---|---|---|
| Coefficients | Std. Error | |||||
| (Intercept) | 72.601 | 3.779 | - | 19.209 | 0.000 ** | 2.545 |
| HDR | 10.438 | 3.211 | 0.249 | 3.251 | 0.001 ** | 2.483 |
| WDR | −5.006 | 0.822 | −0.46 | −6.092 | 0.000 ** | 3.447 |
| Orientation | −1.726 | 0.427 | −0.36 | −4.042 | 0.000 ** | 3.193 |
| AW | 3.068 | 0.905 | 0.291 | 3.392 | 0.001 ** | 2.274 |
| NOS | −2.959 | 0.566 | −0.378 | −5.224 | 0.000 ** | 4.269 |
| OSR | 4.201 | 2.708 | 0.154 | 1.551 | 0.122 | 4.61 |
| GVF | −15.66 | 2.997 | −0.538 | −5.225 | 0.000 ** | 3.33 |
| SVF | −9.402 | 4.27 | −0.193 | −2.202 | 0.028 * | 2.933 |
| HFG | −0.344 | 0.098 | −0.288 | −3.504 | 0.001 ** | 2.115 |
| IS | −0.018 | 0.013 | −0.093 | −1.339 | 0.182 | 2.545 |
| R2 | 0.28 | |||||
| Adjusted R2 | 0.257 | |||||
| F | F (10,313) = 12.164, p = 0.000 | |||||
| K | 0.2 | |||||
* p < 0.05 ** p < 0.01.
Table A4.
Ridge regression measuring the influence of geometrical variables on Va (Model 3).
Table A4.
Ridge regression measuring the influence of geometrical variables on Va (Model 3).
| Variables | Unstandardized Coefficients | Standardized Coefficient | t | p-Value (p) | VIF | |
|---|---|---|---|---|---|---|
| Coefficients | Std. Error | |||||
| (Intercept) | −2.38 | 0.294 | - | −8.084 | 0.000 ** | - |
| HDR | 3.645 | 0.25 | 0.642 | 14.572 | 0.000 ** | 2.545 |
| WDR | 0.017 | 0.064 | 0.012 | 0.269 | 0.788 | 2.483 |
| Orientation | 0.315 | 0.033 | 0.486 | 9.47 | 0.000 ** | 3.447 |
| AW | −0.587 | 0.07 | −0.412 | −8.338 | 0.000 ** | 3.193 |
| NOS | 0.43 | 0.044 | 0.406 | 9.75 | 0.000 ** | 2.274 |
| OSR | 0.178 | 0.211 | 0.048 | 0.843 | 0.4 | 4.269 |
| GVF | 1.266 | 0.233 | 0.322 | 5.426 | 0.000 ** | 4.61 |
| SVF | −2.005 | 0.333 | −0.304 | −6.027 | 0.000 ** | 3.33 |
| HFG | 0.154 | 0.008 | 0.952 | 20.111 | 0.000 ** | 2.933 |
| IS | 0.007 | 0.001 | 0.258 | 6.413 | 0.000 ** | 2.115 |
| R2 | 0.761 | |||||
| Adjusted R2 | 0.753 | |||||
| F | F (10,313) = 99.622, p = 0.000 | |||||
| K | 0.2 | |||||
** p < 0.01.
Table A5.
Ridge regression of geometrical variables on Tmrt (Model 4).
Table A5.
Ridge regression of geometrical variables on Tmrt (Model 4).
| Variables | Unstandardized Coefficients | Standardized Coefficient | t | p-Value (p) | VIF | |
|---|---|---|---|---|---|---|
| Coefficients | Std. Error | |||||
| (Intercept) | 29.275 | 0.693 | - | 42.257 | 0.000 ** | - |
| HDR | 1.926 | 0.589 | 0.235 | 3.272 | 0.001 ** | 2.545 |
| WDR | −0.254 | 0.151 | −0.12 | −1.686 | 0.093 | 2.483 |
| Orientation | 0.253 | 0.078 | 0.27 | 3.227 | 0.001 ** | 3.447 |
| AW | 0.168 | 0.166 | 0.081 | 1.013 | 0.312 | 3.193 |
| NOS | 0.064 | 0.104 | 0.042 | 0.613 | 0.54 | 2.274 |
| OSR | −0.094 | 0.496 | −0.018 | −0.189 | 0.85 | 4.269 |
| GVF | 1.28 | 0.549 | 0.225 | 2.33 | 0.020 * | 4.61 |
| SVF | 5.003 | 0.783 | 0.525 | 6.392 | 0.000 ** | 3.33 |
| HFG | 0.08 | 0.018 | 0.342 | 4.439 | 0.000 ** | 2.933 |
| IS | 0.002 | 0.002 | 0.064 | 0.976 | 0.33 | 2.115 |
| R2 | 0.366 | |||||
| Adjusted R2 | 0.346 | |||||
| F | F (10,313) = 18.059, p = 0.000 | |||||
| K | 0.2 | |||||
* p < 0.05 ** p < 0.01.
Table A6.
Ridge regression of geometrical variables on UTCI (Model 5).
Table A6.
Ridge regression of geometrical variables on UTCI (Model 5).
| Variables | Unstandardized Coefficients | Standardized Coefficient | t | p-Value (p) | VIF | |
|---|---|---|---|---|---|---|
| Coefficients | Std. Error | |||||
| (Intercept) | 36.367 | 0.803 | - | 45.314 | 0.000 ** | - |
| HDR | −2.302 | 0.682 | −0.213 | −3.376 | 0.001 ** | 2.545 |
| WDR | −1.044 | 0.174 | −0.372 | −5.984 | 0.000 ** | 2.483 |
| Orientation | −0.215 | 0.091 | −0.174 | −2.367 | 0.019 * | 3.447 |
| AW | 1.329 | 0.192 | 0.488 | 6.918 | 0.000 ** | 3.193 |
| NOS | −0.923 | 0.12 | −0.457 | −7.672 | 0.000 ** | 2.274 |
| OSR | −0.435 | 0.575 | −0.062 | −0.756 | 0.45 | 4.269 |
| GVF | −1.518 | 0.636 | −0.202 | −2.386 | 0.018 * | 4.61 |
| SVF | 6.697 | 0.907 | 0.532 | 7.385 | 0.000 ** | 3.33 |
| HFG | −0.17 | 0.021 | −0.55 | −8.141 | 0.000 ** | 2.933 |
| IS | −0.012 | 0.003 | −0.256 | −4.453 | 0.000 ** | 2.115 |
| R2 | 0.512 | |||||
| Adjusted R2 | 0.497 | |||||
| F | F (10,313) = 32.859, p = 0.000 | |||||
| K | 0.2 | |||||
* p < 0.05 ** p < 0.01.
References
- Gamero-Salinas, J.; Kishnani, N.; Monge-Barrio, A.; López-Fidalgo, J.; Sánchez-Ostiz, A. The influence of building form variables on the environmental performance of semi-outdoor spaces. A study in mid-rise and high-rise buildings of Singapore. Energy Build. 2021, 230, 110544. [Google Scholar] [CrossRef]
- Hou, G.; Kuai, Y.; Yin, L.; Li, Y.; Shu, P. A comprehensive review of thermal comfort related design strategy of semi-outdoor transitional spaces. Energy Build. 2025, 345, 116116. [Google Scholar] [CrossRef]
- Acero, J.A.; Ruefenacht, L.A.; Koh, E.J.Y.; Tan, Y.S.; Norford, L.K. Measuring and comparing thermal comfort in outdoor and semi-outdoor spaces in tropical Singapore. Urban Clim. 2022, 42, 101122. [Google Scholar] [CrossRef]
- Chew, L.W.; Norford, L.K. Pedestrian-level wind speed enhancement with void decks in three-dimensional urban street canyons. Build. Environ. 2019, 155, 399–407. [Google Scholar] [CrossRef]
- Naghibi, M.; Faizi, M. Temporary reuse in leftover spaces through the preferences of the elderly. Cities 2022, 127, 103769. [Google Scholar] [CrossRef]
- Qi, J.; Mazumdar, S.; Vasconcelos, A.C. Understanding the Relationship between Urban Public Space and Social Cohesion: A Systematic Review. Int. J. Community Well-Being 2024, 7, 155–212. [Google Scholar] [CrossRef]
- Huang, J.; Zhou, C.; Zhuo, Y.; Xu, L.; Jiang, Y. Outdoor thermal environments and activities in open space: An experiment study in humid subtropical climates. Build. Environ. 2016, 103, 238–249. [Google Scholar] [CrossRef]
- Elnabawi, M.H.; Hamza, N. Outdoor Thermal Comfort: Coupling Microclimatic Parameters with Subjective Thermal Assessment to Design Urban Performative Spaces. Buildings 2020, 10, 238. [Google Scholar] [CrossRef]
- Ji, Y.; Feng, X.; Zhao, H.; Xu, X. Study on the elderly’s perception of microclimate and activity time in residential communities. Build. Environ. 2024, 266, 112125. [Google Scholar] [CrossRef]
- Golden, C.D.; Childs, M.L.; Mudele, O.E.; Andriamizarasoa, F.A.; Bouley, T.A.; De Nicola, G.; Fontaine, M.A.; Huybers, P.J.; Mahatante, P.T.; Rabemananjara, R.; et al. Climate-smart public health for global health resilience. Lancet Planet. Health 2025, 9, 101293. [Google Scholar] [CrossRef]
- Tao, Y.; Zhao, F.; Xue, M.; Jiang, B.; Lau, S.S.; Zhang, L. Factors Influencing Seating Preferences in Semi-Outdoor Learning Spaces at Tropical Universities. Buildings 2023, 13, 982. [Google Scholar] [CrossRef]
- Othman, N.E.; Zaki, S.A.; Rijal, H.B.; Ahmad, N.H.; Razak, A.A. Field study of pedestrians’ comfort temperatures under outdoor and semi-outdoor conditions in Malaysian university campuses. Int. J. Biometeorol. 2021, 65, 453–477. [Google Scholar] [CrossRef]
- Xue, F.; Gou, Z.; Lau, S.S.Y. Green open space in high-dense Asian cities: Site configurations, microclimates and users’ perceptions. Sustain. Cities Soc. 2017, 34, 114–125. [Google Scholar] [CrossRef]
- Xie, X.; Liao, H.; Wang, R.; Gou, Z. Thermal Comfort in the Overhead Public Space in Hot and Humid Climates: A Study in Shenzhen. Buildings 2022, 12, 1454. [Google Scholar] [CrossRef]
- Sadakorn, W.; Tetiranont, S.; Prasittisopin, L.; Kaewunruen, S. Assessing thermal comfort in hot and humid (tropical) climates: Urban outdoor and semi-outdoor conditions in waiting areas of railway stations. Build. Environ. 2025, 267, 112240. [Google Scholar] [CrossRef]
- Gamero-Salinas, J.; Kishnani, N.; Monge-Barrio, A.; López-Fidalgo, J.; Sánchez-Ostiz, A. Evaluation of thermal comfort and building form attributes in different semi-outdoor environments in a high-density tropical setting. Build. Environ. 2021, 205, 108255. [Google Scholar] [CrossRef]
- Tan, S.Y. The Practice of Integrated Design: The Case Study of Khoo Teck Puat Hospital, Singapore. Master’s Thesis, University of Nottingham, Singapore, 2012. [Google Scholar]
- Zhou, Y.; Zhu, J.; Ni, E.; Hu, Y. Evaluation and Optimization of Outdoor Thermal Comfort of Block-Style Commercial Complex in Hot Summer and Cold Winter Regions of China. Buildings 2025, 15, 929. [Google Scholar] [CrossRef]
- Wang, Y.; Shaw, D. The complexity of high-density neighbourhood development in China: Intensification, deregulation and social sustainability challenges. Sustain. Cities Soc. 2018, 43, 578–586. [Google Scholar] [CrossRef]
- Spagnolo, J.; de Dear, R. A field study of thermal comfort in outdoor and semi-outdoor environments in subtropical Sydney Australia. Build. Environ. 2003, 38, 721–738. [Google Scholar] [CrossRef]
- Diz-Mellado, E.; Nikolopoulou, M.; López-Cabeza, V.P.; Rivera-Gómez, C.; Galán-Marín, C. Cross-evaluation of thermal comfort in semi-outdoor spaces according to geometry in Southern Spain. Urban Clim. 2023, 49, 101491. [Google Scholar] [CrossRef]
- Nikolopoulou, M.; Lykoudis, S. Thermal comfort in outdoor urban spaces: Analysis across different European countries. Build. Environ. 2006, 41, 1455–1470. [Google Scholar] [CrossRef]
- Li, Y.; Du, H.; Sezer, C. Sky Gardens, Public Spaces and Urban Sustainability in Dense Cities: Shenzhen, Hong Kong and Singapore. Sustainability 2022, 14, 9824. [Google Scholar] [CrossRef]
- Zhen, M.; Zhou, J.; He, Y.; Geng, Z.; Shang, D.; Zhang, M.; Nan, K. Study on thermal comfort and optimization strategies in outdoor open spaces of hospitals in cold regions of China during summer. Urban Clim. 2024, 58, 102135. [Google Scholar] [CrossRef]
- Omrani, S.; Garcia-Hansen, V.; Capra, B.R.; Drogemuller, R. On the effect of provision of balconies on natural ventilation and thermal comfort in high-rise residential buildings. Build. Environ. 2017, 123, 504–516. [Google Scholar] [CrossRef]
- Tao, Y.Q.; Lau, S.S.Y.; Gou, Z.H.; Zhang, J.; Tablada, A. An investigation of semi-outdoor learning spaces in the tropics: Spatial settings, thermal environments and user perceptions. Indoor Built Environ. 2019, 28, 1368–1382. [Google Scholar] [CrossRef]
- Gamero-Salinas, J.; Kishnani, N.; Sánchez-Ostiz, A.; Monge-Barrio, A.; Benitez, E. Porosity, openness, and exposure: Identification of underlying factors associated with semi-outdoor spaces’ thermal performance and clustering in tropical high-density Singapore. Energy Build. 2022, 272, 112339. [Google Scholar] [CrossRef]
- Su, Y.; Li, Z.; Meng, Q.; Zhao, Q.; Wu, X.; Liu, Q.; Wu, Z.; Wang, C. Simulation and optimization of thermal comfort in residential areas based on outdoor morphological parameters. Build. Environ. 2023, 245, 110837. [Google Scholar] [CrossRef]
- Weng, J.; Luo, B.; Xiang, H.L.; Gao, B. Effects of Bottom-Overhead Design Variables on Pedestrian-Level Thermal Comfort during Summertime in Different High-Rise Residential Buildings: A Case Study in Chongqing, China. Buildings 2022, 12, 265. [Google Scholar] [CrossRef]
- Li, J.; Sun, R.; Chen, L. A review of thermal perception and adaptation strategies across global climate zones. Urban Clim. 2023, 49, 101559. [Google Scholar] [CrossRef]
- Applications of the Universal Thermal Climate Index UTCI in Biometeorology: Latest Developments and Case Studies; Krüger, E.L., Ed.; Springer: Cham, Switzerland, 2021; p. 228. [Google Scholar]
- Bröde, P.; Fiala, D.; Błażejczyk, K.; Holmér, I.; Jendritzky, G.; Kampmann, B.; Tinz, B.; Havenith, G. Deriving the operational procedure for the Universal Thermal Climate Index (UTCI). Int. J. Biometeorol. 2012, 56, 481–494. [Google Scholar] [CrossRef]
- Ribeiro, K.F.A.; Justi, A.C.A.; Novais, J.W.Z.; Santos, F.M.d.M.; Nogueira, M.C.d.J.A.; Miranda, S.A.; Marques, J.B. Calibration of the Physiological Equivalent Temperature (PET) index range for outside spaces in a tropical climate city. Urban Clim. 2022, 44, 101196. [Google Scholar] [CrossRef]
- Liu, Y.; Song, C.; Ye, S.; Lv, J.; Gao, P. Daily Max Simplified Wet-Bulb Globe Temperature and its Climate Networks for Teleconnection Study, 1940–2022. Sci. Data 2025, 12, 584. [Google Scholar] [CrossRef]
- Jian, H.; Yan, Z.; Fan, X.; Zhan, Q.; Xu, C.; Bei, W.; Xu, J.; Huang, M.; Du, X.; Zhu, J.; et al. A high temporal resolution global gridded dataset of human thermal stress metrics. Sci. Data 2024, 11, 1116. [Google Scholar] [CrossRef]
- Li, N.; Guo, Z.; Geng, W.; Li, L.; Li, Z. Design strategies for renovation of public space in Beijing’s traditional communities based on measured microclimate and thermal comfort. Sustain. Cities Soc. 2023, 99, 104927. [Google Scholar] [CrossRef]
- Fiala, D.; Havenith, G.; Bröde, P.; Kampmann, B.; Jendritzky, G. UTCI-Fiala multi-node model of human heat transfer and temperature regulation. Int. J. Biometeorol. 2012, 56, 429–441. [Google Scholar] [CrossRef]
- Chen, W.-A.; Fang, P.-L.; Hwang, R.-L. Calibrating the UTCI scale for hot and humid climates through comprehensive year-round field surveys to improve the adaptability. Urban Clim. 2025, 59, 102267. [Google Scholar] [CrossRef]
- Yang, Y.; Lyu, J.; Lian, Z.; Xie, Y.; Jiang, Y.; Lin, J.; Niu, J. Subjective information in thermal comfort evaluation methods: A critical review. Energy Build. 2024, 325, 115019. [Google Scholar] [CrossRef]
- Schweiker, M.; André, M.; Al-Atrash, F.; Al-Khatri, H.; Alprianti, R.R.; Alsaad, H.; Amin, R.; Ampatzi, E.; Arsano, A.Y.; Azar, E.; et al. Evaluating assumptions of scales for subjective assessment of thermal environments—Do laypersons perceive them the way, we researchers believe? Energy Build. 2020, 211, 109761. [Google Scholar] [CrossRef]
- Wang, Y.; Yin, L.; Dong, Q.; Fei, F.; Yao, W.; Sun, J.; Jiang, Z. From thermal demand characterization to accurate evaluation: Exploring seasonal differences in outdoor thermal comfort of the elderly in China’s communities. Urban Clim. 2024, 58, 102220. [Google Scholar] [CrossRef]
- Li, Y.; Li, Z.; Ren, C. Diversity of summertime thermal and environmental perceptions in residential public spaces: A walking-based assessment in Hong Kong’s public housing estates. Build. Environ. 2025, 271, 112594. [Google Scholar] [CrossRef]
- Cui, G.; Wang, M.; Fan, Y.; Xue, F.; Chen, H. Assessment of Health-Oriented Layout and Perceived Density in High-Density Public Residential Areas: A Case Study of Shenzhen. Buildings 2024, 14, 3626. [Google Scholar] [CrossRef]
- Fukawa, Y.; Watanabe, Y.; Ogawa, Y.; Hisayama, R.; Nomoto, A.; Nakano, J.; Nakagawa, J.; Tanabe, S.-i. Effects of various environmental grades on thermal comfort in semi-outdoor spaces. Jpn. Archit. Rev. 2023, 6, e12414. [Google Scholar] [CrossRef]
- Amirtham, L.R.; K C, K.A. Impact of semi-private open spaces on outdoor thermal comfort in a residential neighbourhood in warm humid climate. Geol. Ecol. Landsc. 2024, 9, 921–932. [Google Scholar] [CrossRef]
- Zhang, W.; Zeng, H. Spatial differentiation characteristics and influencing factors of the green view index in urban areas based on street view images: A case study of Futian District, Shenzhen, China. Urban For. Urban Green. 2024, 93, 128219. [Google Scholar] [CrossRef]
- ANSI/ASHRAE Standard 55; Thermal Environmental Conditions for Human Occupancy. ASHRAE: Peachtree Corners, GA, USA, 2023.
- ISO 7726; Ergonomics of the Thermal Environment—Instruments for Measuring Physical Quantities. ISO: Geneva, Switzerland, 1998.
- Cheung, P.K.; Jim, C.Y. Determination and application of outdoor thermal benchmarks. Build. Environ. 2017, 123, 333–350. [Google Scholar] [CrossRef]
- Miller, A.; Panneerselvam, J.; Liu, L. A review of regression and classification techniques for analysis of common and rare variants and gene-environmental factors. Neurocomputing 2022, 489, 466–485. [Google Scholar] [CrossRef]
- Muniz, G.; Kibria, B.M.G. On Some Ridge Regression Estimators: An Empirical Comparisons. Commun. Stat.-Simul. Comput. 2009, 38, 621–630. [Google Scholar] [CrossRef]
- Tao, Y.; Zhang, Z.; Ou, W.; Guo, J.; Pueppke, S.G. How does urban form influence PM2.5 concentrations: Insights from 350 different-sized cities in the rapidly urbanizing Yangtze River Delta region of China, 1998–2015. Cities 2020, 98, 102581. [Google Scholar] [CrossRef]
- Binarti, F.; Koerniawan, M.D.; Triyadi, S.; Utami, S.S.; Matzarakis, A. A review of outdoor thermal comfort indices and neutral ranges for hot-humid regions. Urban Clim. 2020, 31, 100531. [Google Scholar] [CrossRef]
- Vatani, J.; Golbabaei, F.; Dehghan, S.F.; Yousefi, A. Applicability of Universal Thermal Climate Index (UTCI) in occupational heat stress assessment: A case study in brick industries. Ind. Health 2016, 54, 14–19. [Google Scholar] [CrossRef]
- Lam, C.K.C.; Lau, K.K.-L. Effect of long-term acclimatization on summer thermal comfort in outdoor spaces: A comparative study between Melbourne and Hong Kong. Int. J. Biometeorol. 2018, 62, 1311–1324. [Google Scholar] [CrossRef]
- Potchter, O.; Cohen, P.; Lin, T.P.; Matzarakis, A. Outdoor human thermal perception in various climates: A comprehensive review of approaches, methods and quantification. Sci. Total Environ. 2018, 631–632, 390–406. [Google Scholar] [CrossRef]
- Xu, T.; Yao, R.; Du, C.; Li, B. Outdoor thermal perception and heatwave adaptation effects in summer—A case study of a humid subtropical city in China. Urban Clim. 2023, 52, 101724. [Google Scholar] [CrossRef]
- Nguyen, A.T.; Singh, M.K.; Reiter, S. An adaptive thermal comfort model for hot humid South-East Asia. Build. Environ. 2012, 56, 291–300. [Google Scholar] [CrossRef]
- Cheng, V.; Ng, E.; Chan, C.; Givoni, B. Outdoor thermal comfort study in a sub-tropical climate: A longitudinal study based in Hong Kong. Int. J. Biometeorol. 2012, 56, 43–56. [Google Scholar] [CrossRef]
- Xu, X.; Wu, Y.; Wang, W.; Hong, T.; Xu, N. Performance-driven optimization of urban open space configuration in the cold-winter and hot-summer region of China. Build. Simul. 2019, 12, 411–424. [Google Scholar] [CrossRef]
- Chen, W.; Zhang, J.; Liu, S.; Liang, S.; Zhang, Y.; Fu, S. The spatial configuration of buildings: A vital consideration impossible to ignore in regulating urban land surface temperature? Evidence from 35 Chinese cities. Sci. Total Environ. 2023, 865, 160946. [Google Scholar] [CrossRef] [PubMed]
- Huang, T.; Li, J.; Xie, Y.; Niu, J.; Mak, C.M. Simultaneous environmental parameter monitoring and human subject survey regarding outdoor thermal comfort and its modelling. Build. Environ. 2017, 125, 502–514. [Google Scholar] [CrossRef]
- Li, L.; Wang, Z.; Zhen, M.; Nan, K. Study on outdoor thermal comfort of older people in age-friendly communities in cold regions. Energy Build. 2025, 329, 115265. [Google Scholar] [CrossRef]
- Wei, R.; Yan, J.; Cui, Y.; Song, D.; Yin, X.; Sun, N. Studies on the Specificity of Outdoor Thermal Comfort during the Warm Season in High-Density Urban Areas. Buildings 2023, 13, 2473. [Google Scholar] [CrossRef]
- He, Y.E.; Zhong, H.F.; Fan, Y.; Lau, S.S.Y.; Cui, G.X. A calibration framework for outdoor thermal comfort index and neutral range: Application in subtropical hot-humid campus. Indoor Built Environ. 2025, 34, 554–568. [Google Scholar] [CrossRef]
- Cheung, P.K.; Jim, C.Y. Subjective outdoor thermal comfort and urban green space usage in humid-subtropical Hong Kong. Energy Build. 2018, 173, 150–162. [Google Scholar] [CrossRef]
- Cao, B.; Luo, M.; Li, M.; Zhu, Y. Thermal comfort in semi-outdoor spaces within an office building in Shenzhen: A case study in a hot climate region of China. Indoor Built Environ. 2018, 27, 1431–1444. [Google Scholar] [CrossRef]
- Yin, S.; Xiao, Y. Scale Study of Traditional Shophouse Street in South of China Based on Outdoor Thermal Comfort. Procedia Eng. 2016, 169, 232–239. [Google Scholar] [CrossRef]
- Zhang, Z.; Zhang, Y.; Jin, L. Thermal comfort in interior and semi-open spaces of rural folk houses in hot-humid areas. Build. Environ. 2018, 128, 336–347. [Google Scholar] [CrossRef]
- Spence, C. Senses of place: Architectural design for the multisensory mind. Cogn. Res. Princ. Implic. 2020, 5, 46. [Google Scholar] [CrossRef]
- Lai, D.; Zhou, C.; Huang, J.; Jiang, Y.; Long, Z.; Chen, Q. Outdoor space quality: A field study in an urban residential community in central China. Energy Build. 2014, 68, 713–720. [Google Scholar] [CrossRef]
- Xue, F.; Gou, Z.; Lau, S. The Green Open Space Development Model and Associated Use Behaviors in Dense Urban Settings: Lessons from Hong Kong and Singapore. Urban Des. Int. 2017, 22, 287–302. [Google Scholar] [CrossRef]
- Wen, C.Y.; Juan, Y.H.; Yang, A.S. Enhancement of city breathability with half open spaces in ideal urban street canyons. Build. Environ. 2017, 112, 322–336. [Google Scholar] [CrossRef]
- Berkovic, S.; Yezioro, A.; Bitan, A. Study of thermal comfort in courtyards in a hot arid climate. Sol. Energy 2012, 86, 1173–1186. [Google Scholar] [CrossRef]
- Loche, I.; Bre, F.; Gimenez, J.M.; Loonen, R.; Neves, L.O. Balcony design to improve natural ventilation and energy performance in high-rise mixed-mode office buildings. Build. Environ. 2024, 258, 111636. [Google Scholar] [CrossRef]
- Taleghani, M.; Kleerekoper, L.; Tenpierik, M.; van den Dobbelsteen, A. Outdoor thermal comfort within five different urban forms in the Netherlands. Build. Environ. 2015, 83, 65–78. [Google Scholar] [CrossRef]
- Turner, V.K.; Middel, A.; Vanos, J.K. Shade is an essential solution for hotter cities. Nature 2023, 619, 694–697. [Google Scholar] [CrossRef]
- Zhang, X.; Weerasuriya, A.U.; Wang, J.; Li, C.Y.; Chen, Z.; Tse, K.T.; Hang, J. Cross-ventilation of a generic building with various configurations of external and internal openings. Build. Environ. 2022, 207, 108447. [Google Scholar] [CrossRef]
- Ai, Z.T.; Mak, C.M. Wind-induced single-sided natural ventilation in buildings near a long street canyon: CFD evaluation of street configuration and envelope design. J. Wind Eng. Ind. Aerodyn. 2018, 172, 96–106. [Google Scholar] [CrossRef]
- Ren, Z.; Chen, W.; Wang, L.; Chen, S.; Piao, J. Comparative analysis of east Asian summer monsoon northern boundary indices: Variability, climate anomalies and driving mechanisms. Clim. Dyn. 2024, 63, 35. [Google Scholar] [CrossRef]
- Li, L.; Lu, Y.; Fang, W.; Fan, C.; Zhou, T.; Zhou, X.; Pang, Y. Shading or ventilation: Optimal design for enhancing thermal comfort in university courtyards in hot and humid regions. Archit. Eng. Des. Manag. 2025, 1–24. [Google Scholar] [CrossRef]
- Deng, J.-Y.; Wong, N.H. Impact of urban canyon geometries on outdoor thermal comfort in central business districts. Sustain. Cities Soc. 2020, 53, 101966. [Google Scholar] [CrossRef]
- Ge, J.; Zhao, J.; Wu, Z.; Zhang, H. Investigation into the Impact of Enclosure Retrofit on Thermal Comfort in Semi-Open University Space. Buildings 2025, 15, 2883. [Google Scholar] [CrossRef]


Disclaimer/Publisher’s Note: The statements, opinions and data contained in all publications are solely those of the individual author(s) and contributor(s) and not of MDPI and/or the editor(s). MDPI and/or the editor(s) disclaim responsibility for any injury to people or property resulting from any ideas, methods, instructions or products referred to in the content. |
© 2025 by the authors. Licensee MDPI, Basel, Switzerland. This article is an open access article distributed under the terms and conditions of the Creative Commons Attribution (CC BY) license (https://creativecommons.org/licenses/by/4.0/).