1. Introduction
Large-diameter variable-section piles are extensively utilized in bridge construction with stringent seismic demands due to their superior load-bearing capacity, robust seismic performance, and material efficiency [
1]. Evidence indicates that pile groups exhibit superior seismic performance compared to single piles under identical site conditions. However, the dynamic response of pile groups cannot be presumed similar to that of single piles due to the pile group effect [
2]. Thus, investigating the dynamic response differences between large-diameter variable-section single piles and pile groups in liquefiable sites during seismic events is crucial [
3].
Extensive research has been conducted on the dynamic response of pile foundations both domestically and internationally [
4]. Feng et al. [
5] utilized shaking table tests to examine the dynamic reactions of large-diameter variable-section single piles and pile group foundations with varying liquefied soil layer thicknesses during seismic events. Shaking table tests have proven effective in studying pile foundation dynamics [
6,
7]. Aghamolaei M [
8] conducted such tests on pile foundation in saturated sandy soil, concluding that a batter pile foundation exhibits superior seismic performance compared to a vertical pile foundation in these conditions. Extensive shaking table experiments have elucidated the dynamic behavior of liquefiable foundation-pile group-structure systems under bidirectional seismic excitation [
9,
10]. Zhang et al. [
11] investigated the coupled dynamic responses of this integrated system. Li et al. [
12] explored the seismic performance of vertical and battered pile groups in liquefiable sites using centrifuge testing. Chen et al. [
13] studied the effect of layered liquefiable sediments on the seismic response of subsurface structures. Garala et al. [
14] investigated the dynamic characteristics of soft clay and its interaction with pile foundation under seismic conditions using hypergravity centrifuge tests. Goh et al. [
15] studied the seismic response of pile foundations in soft soils using finite element simulations, followed by regression analysis of the results. Feng et al. [
16] assessed the impact of pile group effects on the seismic performance of pile foundations using finite element models.
Most existing studies employ simplified models assuming a single homogeneous soil layer [
17]. In engineering practice, however, pile foundations of cross-sea bridges typically penetrate multiple soil layers with varying mechanical properties [
18,
19]. The liquefaction behavior and damage progression of bridge pile foundations subjected to dynamic loading, including seismic events or pile driving, are strongly governed by the geometric characteristics of the piles, local heterogeneities, and construction-induced imperfections. This reflects mechanistic parallels with the defect sensitivity observed in shell structures [
20,
21,
22]. This study utilizes large-scale shaking table model tests to investigate the dynamic responses of large-diameter single piles and pile group foundations in liquefiable sites under seismic conditions. We analyze differences in pore pressure ratio, pile acceleration, horizontal displacement at the pile top, and bending moment between single piles and pile groups, demonstrating that pile groups exhibit superior anti-liquefaction performance. The failure mechanism of the pile foundation structure is further examined through Fourier spectrum analysis. These findings offer theoretical support for optimizing the design of cross-sea bridge pile foundations in regions impacted by soil-structure interaction during strong earthquakes.
Unlike most previous studies that primarily focused on uniform pile foundations or homogeneous soil layers, this research investigates the dynamic response of large-diameter, variable-section pile groups in layered liquefiable sites through large-scale shaking table experiments. Its novelty lies in a comprehensive comparison of single and group pile foundations with different cross-sectional shapes under various seismic intensities, simulating real-world stratified conditions based on the Xiang’an Bridge site. Additionally, by combining acceleration, pore pressure, bending moment, and frequency-domain analyses, this study clarifies the delayed and diminished seismic response caused by pile group effects, providing new insights into the anti-liquefaction mechanisms of bridge pile foundations in strong earthquake regions.
In addition to advancing the scientific understanding of pile–soil interaction under dynamic loading, this study also addresses the broader goals of sustainable infrastructure development emphasized in governmental directives and strategic programs. Enhancing the seismic safety and durability of bridge pile foundations directly contributes to the sustainability and resilience of transportation systems, which are key priorities in national and regional development policies. By improving the reliability of foundation design in liquefiable soils, this work aligns with initiatives such as the National Plan for New Infrastructure Construction and the United Nations Sustainable Development Goals, providing both scientific insights and practical guidance for disaster-resilient, long-lasting bridge infrastructure.
2. Methodology
2.1. Geological Background
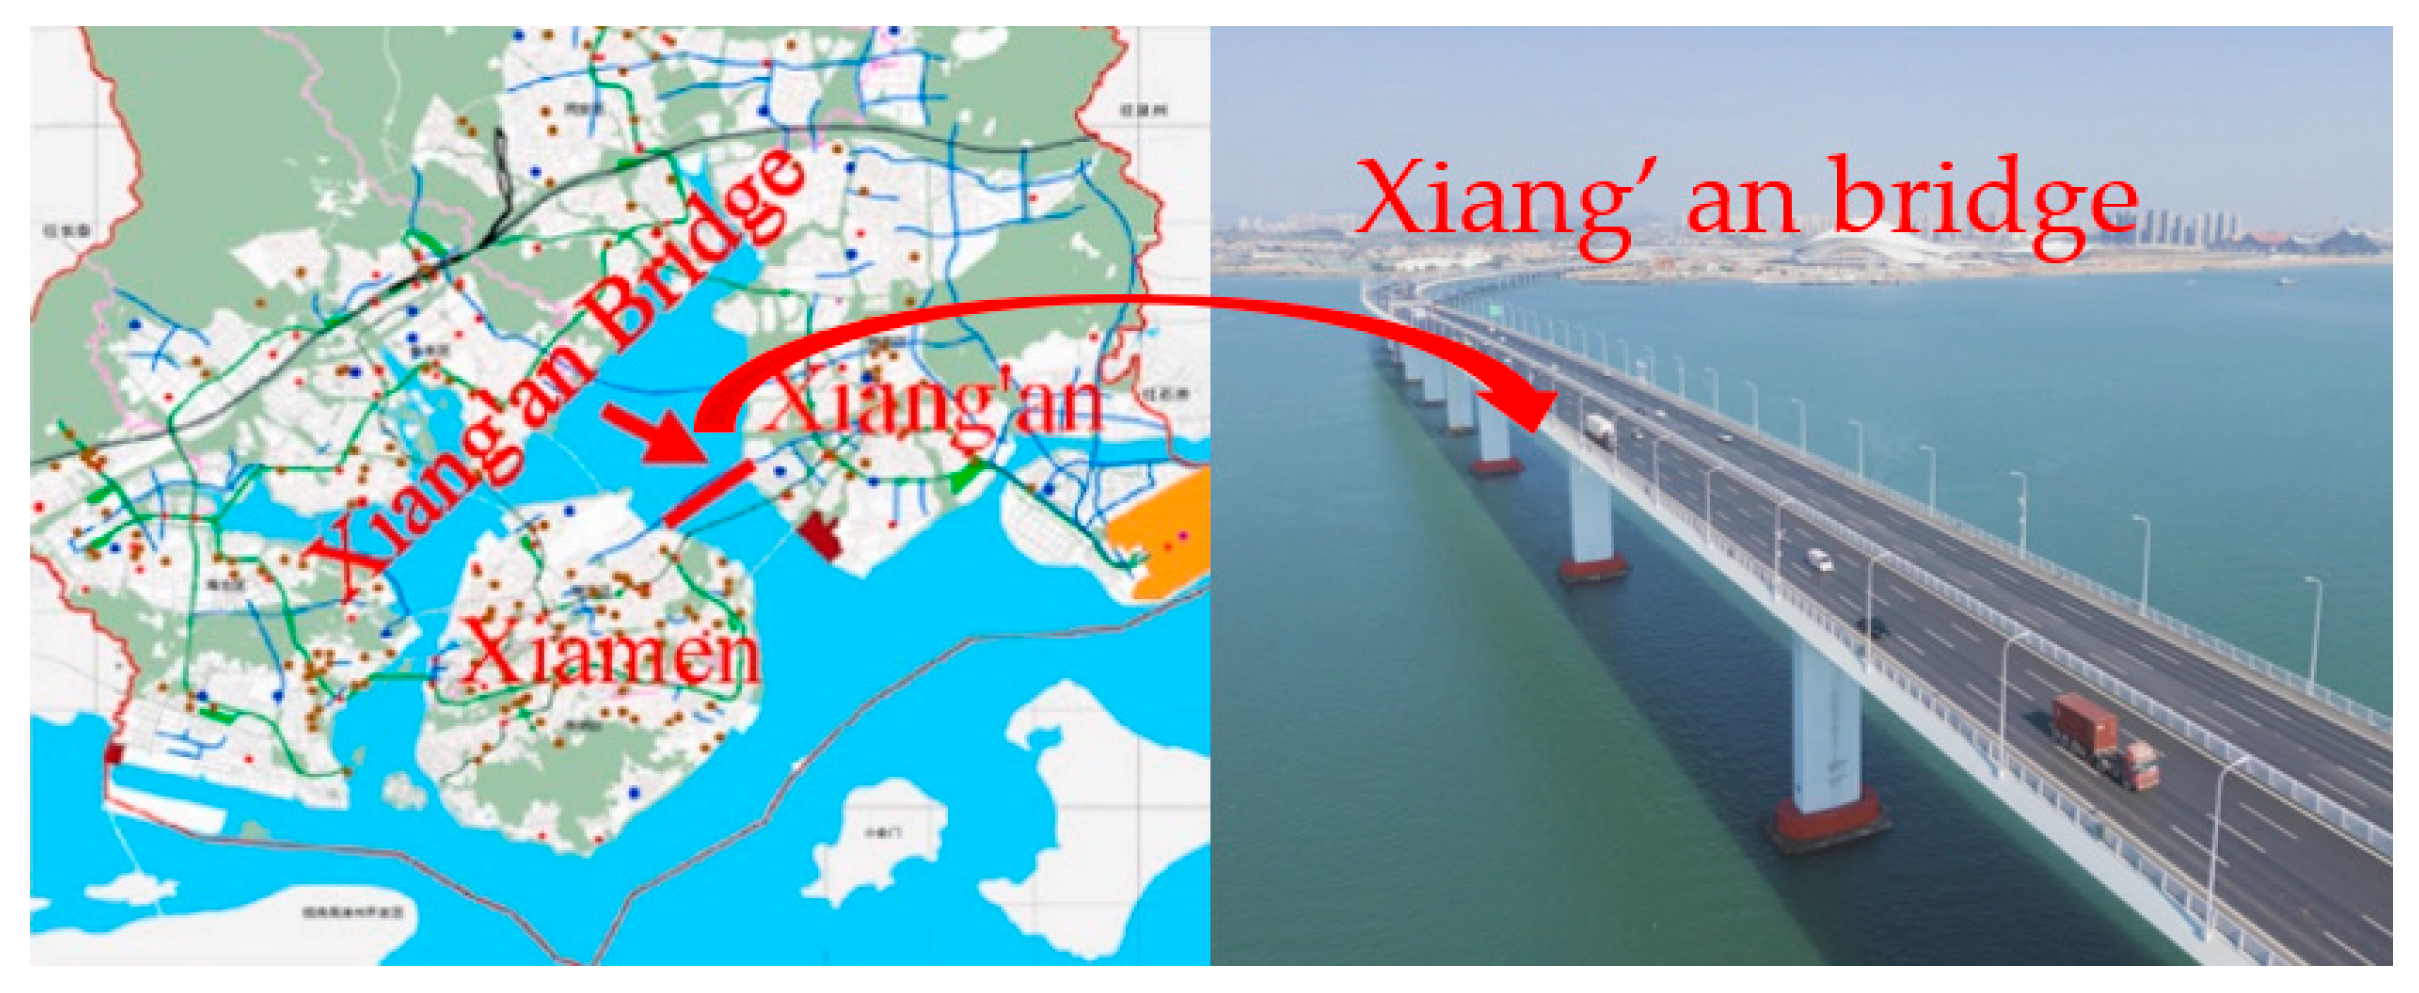
Xiang’an Bridge (
Figure 1), situated within the Circum-Pacific seismic belt and along the Jiulongjiang Fault Zone, faces heightened earthquake risks due to its complex geology. Historically, this region has experienced earthquakes of magnitude six or higher, inflicting substantial infrastructure damage. The Second Eastern Passage of Xiamen, where Xiang’an Bridge is located, lies in Quaternary strata with a seismic fortification intensity of Degree VII. Geological surveys indicate the presence of thick, saturated sandy soil layers at the site, which are susceptible to liquefaction under seismic loading.
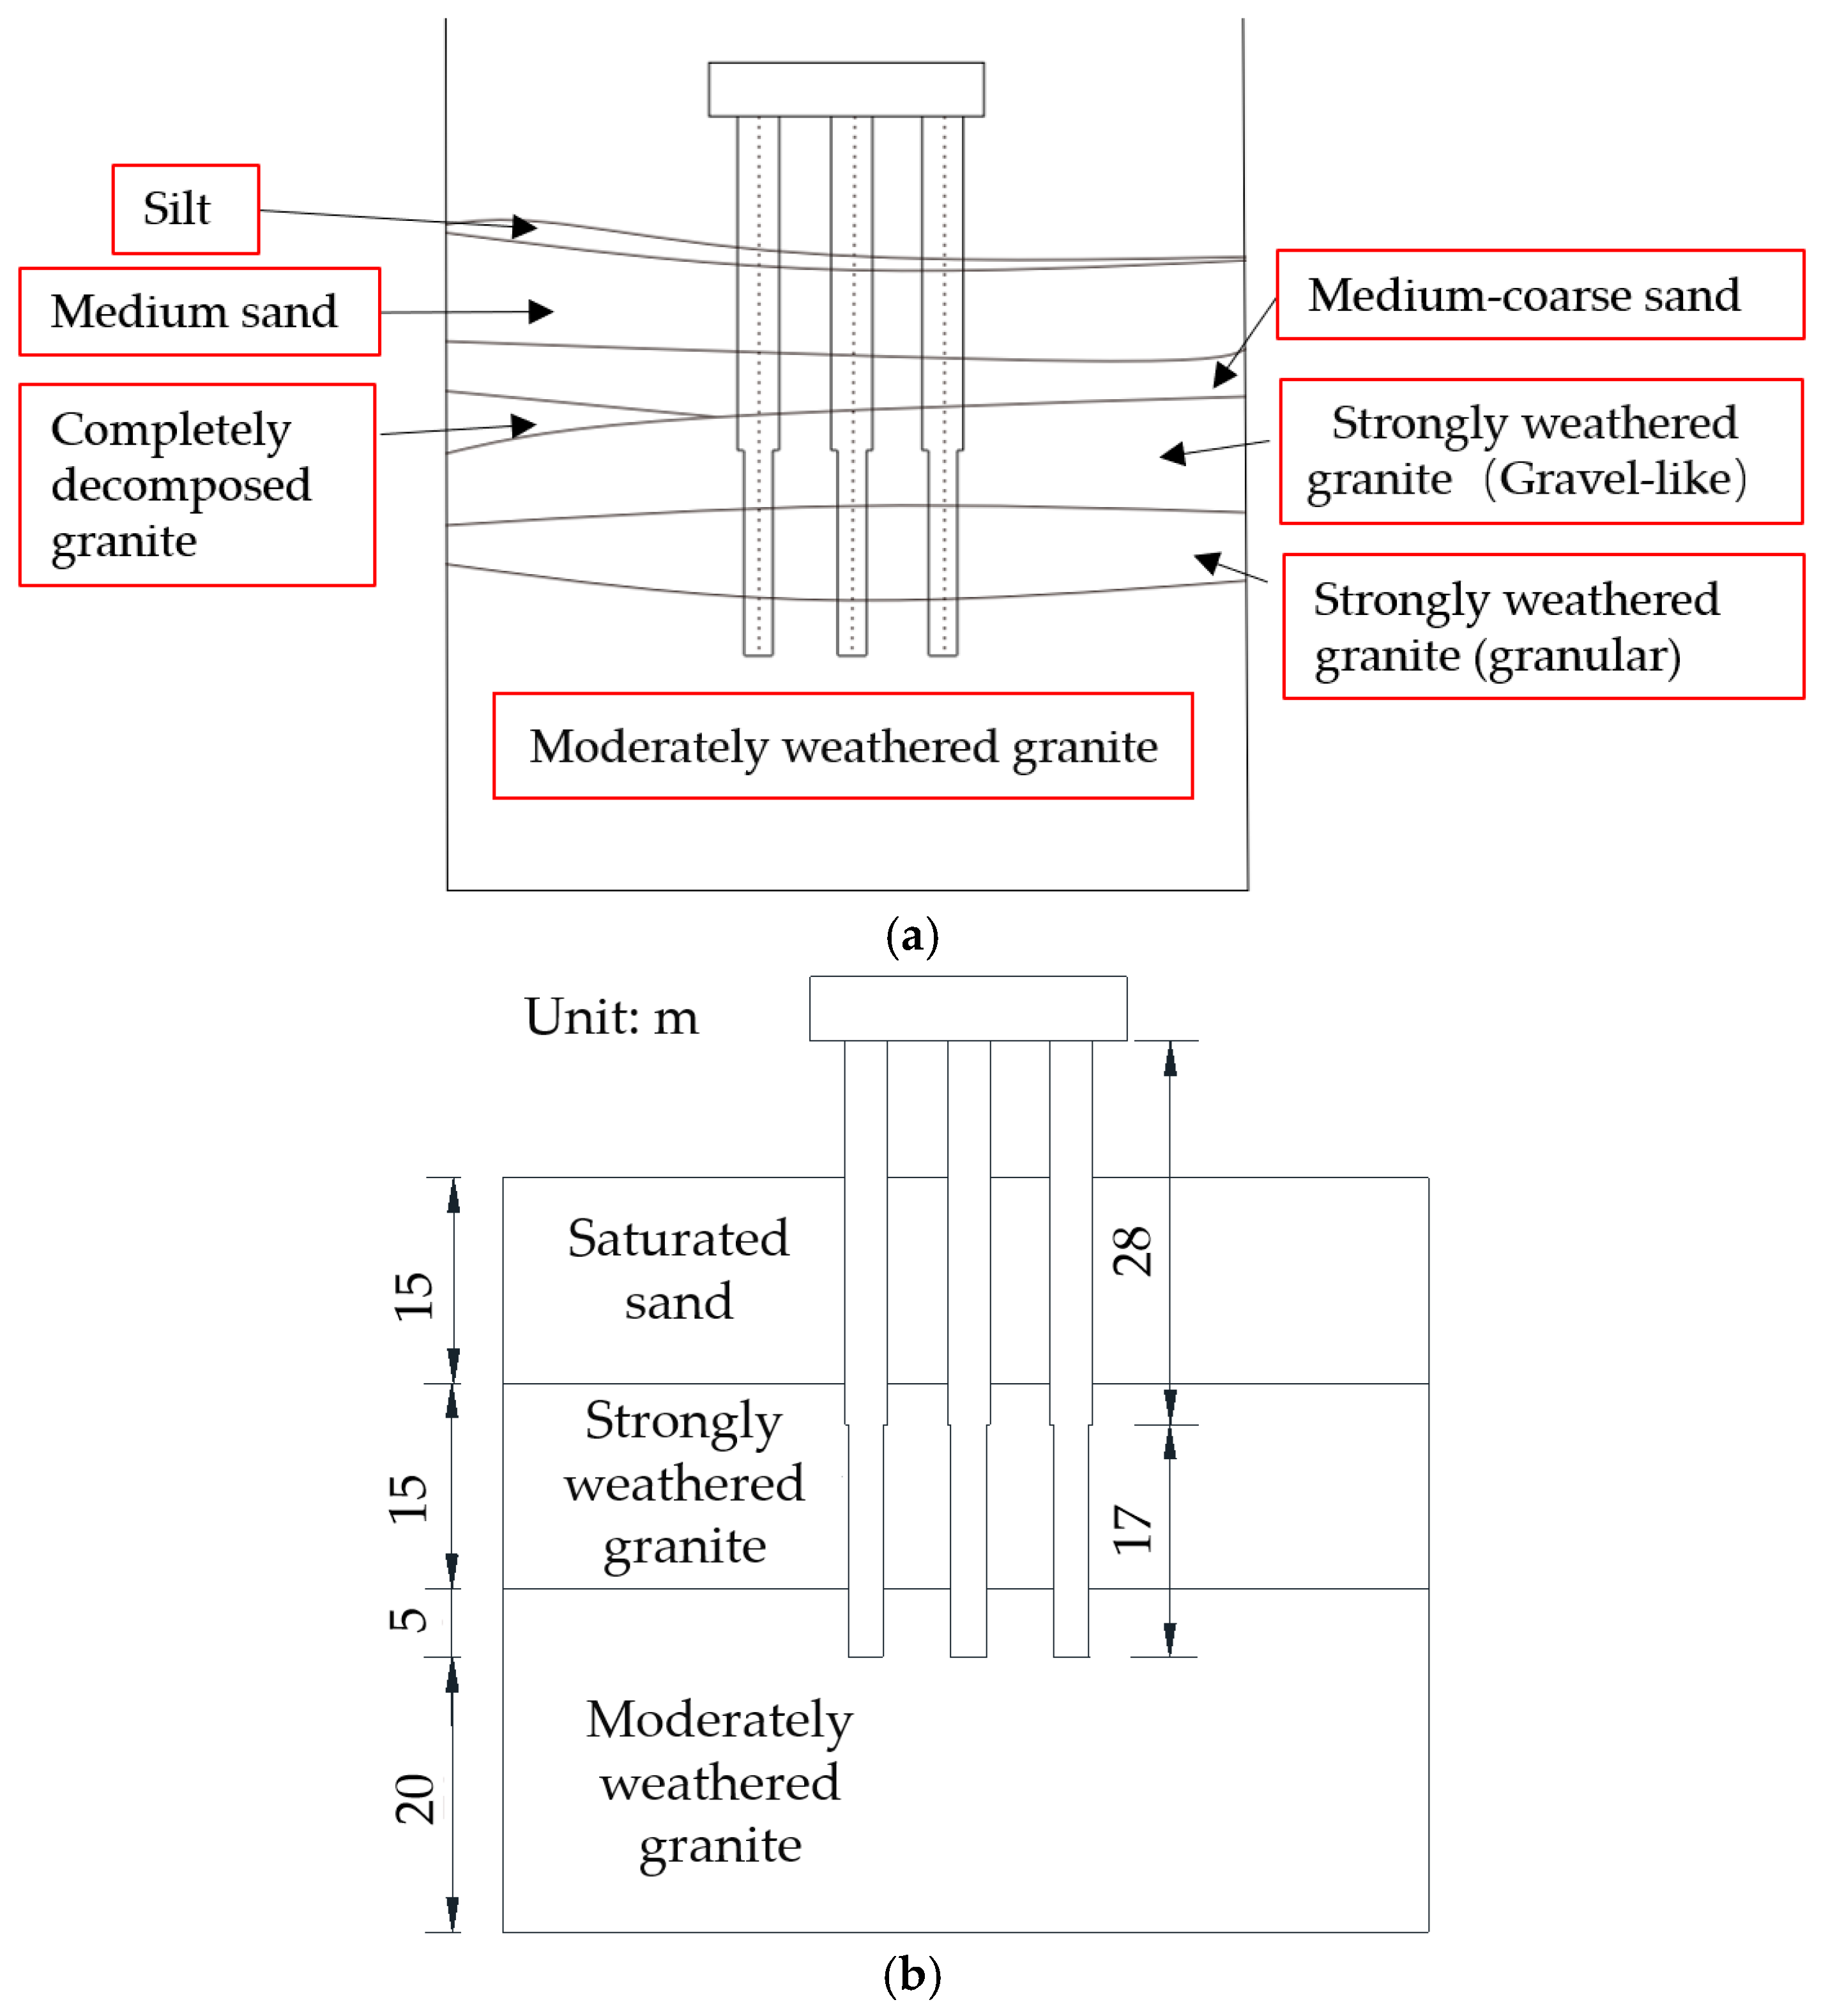
The Xiang’an Bridge features a pile foundation, with Pier H15 utilizing a large-diameter variable cross-section pile group. This foundation comprises piles that are 44.4 m in length, with diameters of 2.5 m and 2.15 m, and spaced 5.4 m apart. The pile cap measures 17.8 m by 13 m by 5.1 m. Due to the complex distribution of strata in the H15 pile foundation, the model test simplified it into three layers of soil. The distribution of the soil layers on the side of the pile from top to bottom is saturated sandy soil (15 m), strongly weathered granite (15 m), and moderately weathered granite (25 m), and the pile tip is located in the moderately weathered granite (
Figure 2).
2.2. Experimental Description
The experiment utilized the earthquake simulation shaking table from the Earthquake Engineering and Engineering Vibration Laboratory of the China Earthquake Administration, as shown in
Table 1.
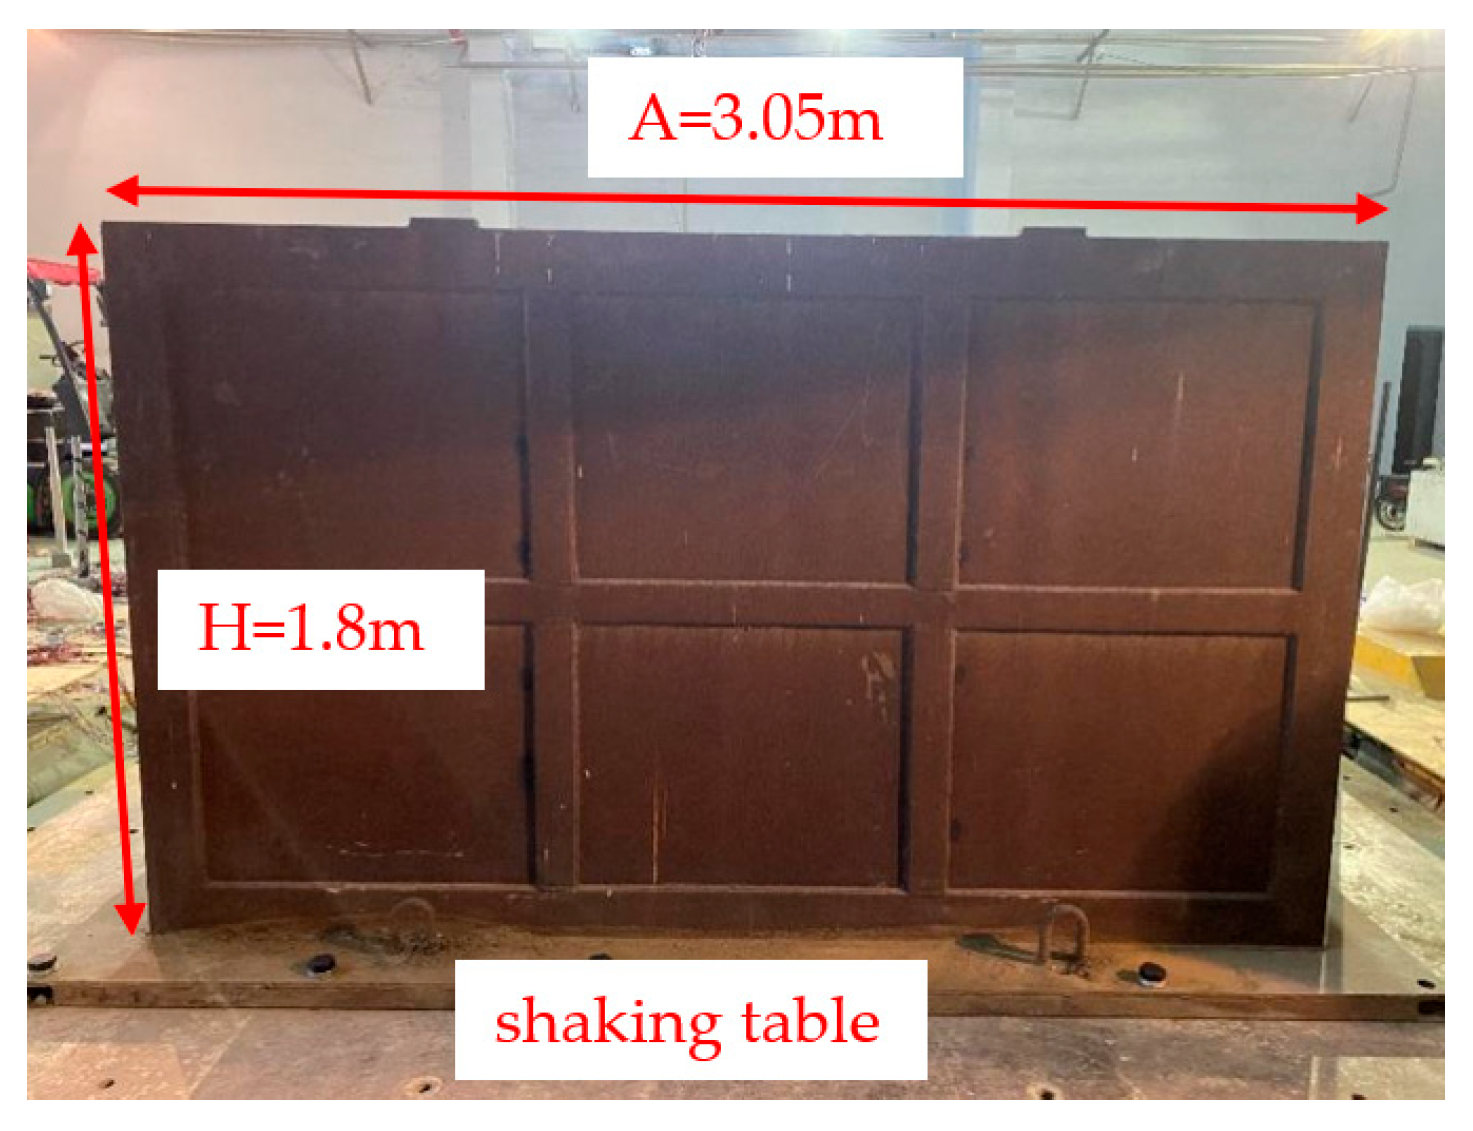
A rigid model box measuring 3.05 m × 1.7 m × 1.8 m was chosen based on the similarity ratio and the “model box size effect”, as depicted in
Figure 3. To mitigate seismic wave reflection during vibration tests and minimize “model box boundary effect” errors [
23], a 2 cm foam layer was applied to the inner boundary of the box.
The Buckingham π theorem is frequently employed in seismic model tests to establish similarity relationships between prototype and model systems, thereby ensuring that the scaled model can accurately replicate the dynamic behavior of the prototype under seismic excitation [
23]. Two primary model types are derived from this theory: one that neglects gravity effects and another that incorporates artificial mass to simulate gravitational influence. The former, which ignores gravity, can introduce considerable errors because the gravitational acceleration and the stress state within the soil are not correctly reproduced, leading to unrealistic deformation and pore pressure development during shaking. In contrast, the artificial mass model introduces an equivalent additional mass to produce the correct stress field, thereby maintaining dynamic similarity and improving the reliability of experimental results. Hence, the artificial mass model was adopted in this study to minimize discrepancies between model and prototype responses caused by scale effects.
Based on the model box conditions, similarity criteria, and engineering practices, the size similarity ratio
Cl is set at 1:50. Geotechnical similarity principles are used to determine the similarity constants for various physical quantities through dimensional analysis, as detailed in
Table 2.
Among them, the formula for calculating the artificial mass
ma is as follows:
where
CE is the elastic modulus similarity constant;
mp is the prototype mass;
mm is the model mass.
2.3. Materials
The test model piles were constructed from micro-concrete, with galvanized iron wires serving as both the primary reinforcement and stirrups. The primary reinforcement had a diameter of 4 mm, while the stirrups measured 2.8 mm in diameter. The reinforcement ratio was 2.4%. The piles’ length and diameter adhered to geometric similarity conditions. Compressive strength, determined at 28 days using a universal testing machine, was 17 MPa, aligning with the similarity ratio. Detailed parameters are listed in
Table 3, and the model pile is depicted in
Figure 4.
Geological exploration data from the Xiang’an Bridge site indicate that the foundation soil consists primarily of saturated fine sand overlying strongly weathered granite. The undisturbed sandy soil has a natural density of 1.89 g/cm
3, a relative density of 48%, a void ratio of 0.82, cohesion of 8.6 kPa, an internal friction angle of 31.4°, and a permeability coefficient of 3.2 × 10
−4 cm/s. These parameters indicate a medium-dense, highly saturated sand layer with moderate liquefaction potential. The compressive strength of moderately weathered granite is approximately 68 MPa. In the model, micro-concrete was used to simulate the granite layer, with a measured compressive strength of 19 MPa, consistent with the similarity ratio.
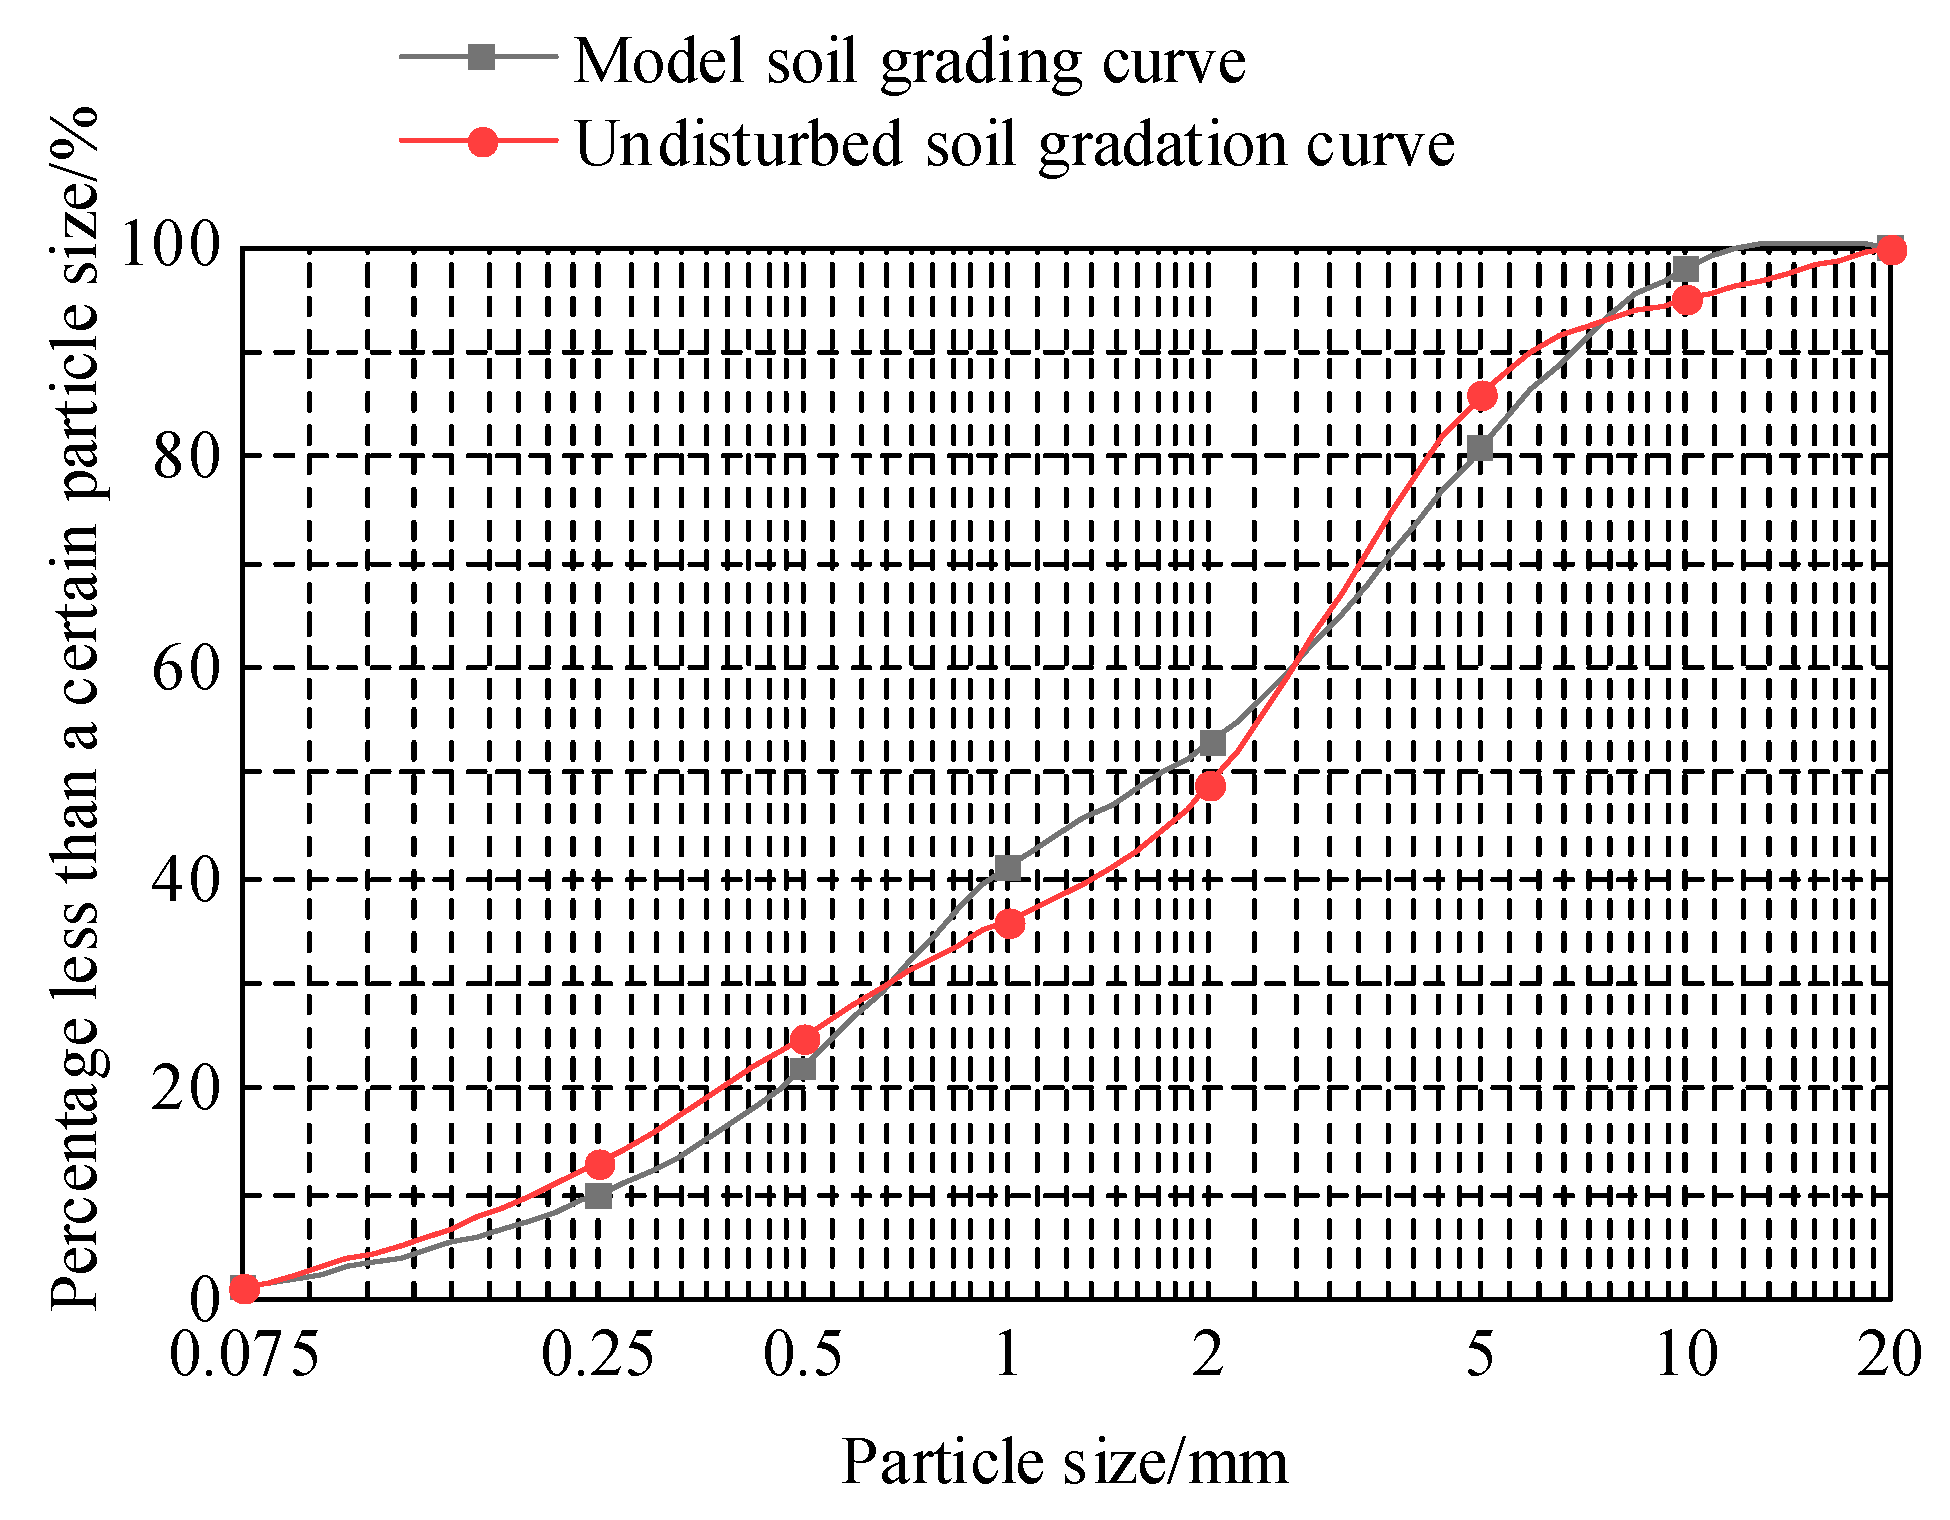
Figure 5 presents the particle gradation curve of the model soil, which closely matches that of the undisturbed soil, thereby ensuring the reliability and representativeness of the test results.
2.4. Testing Procedures
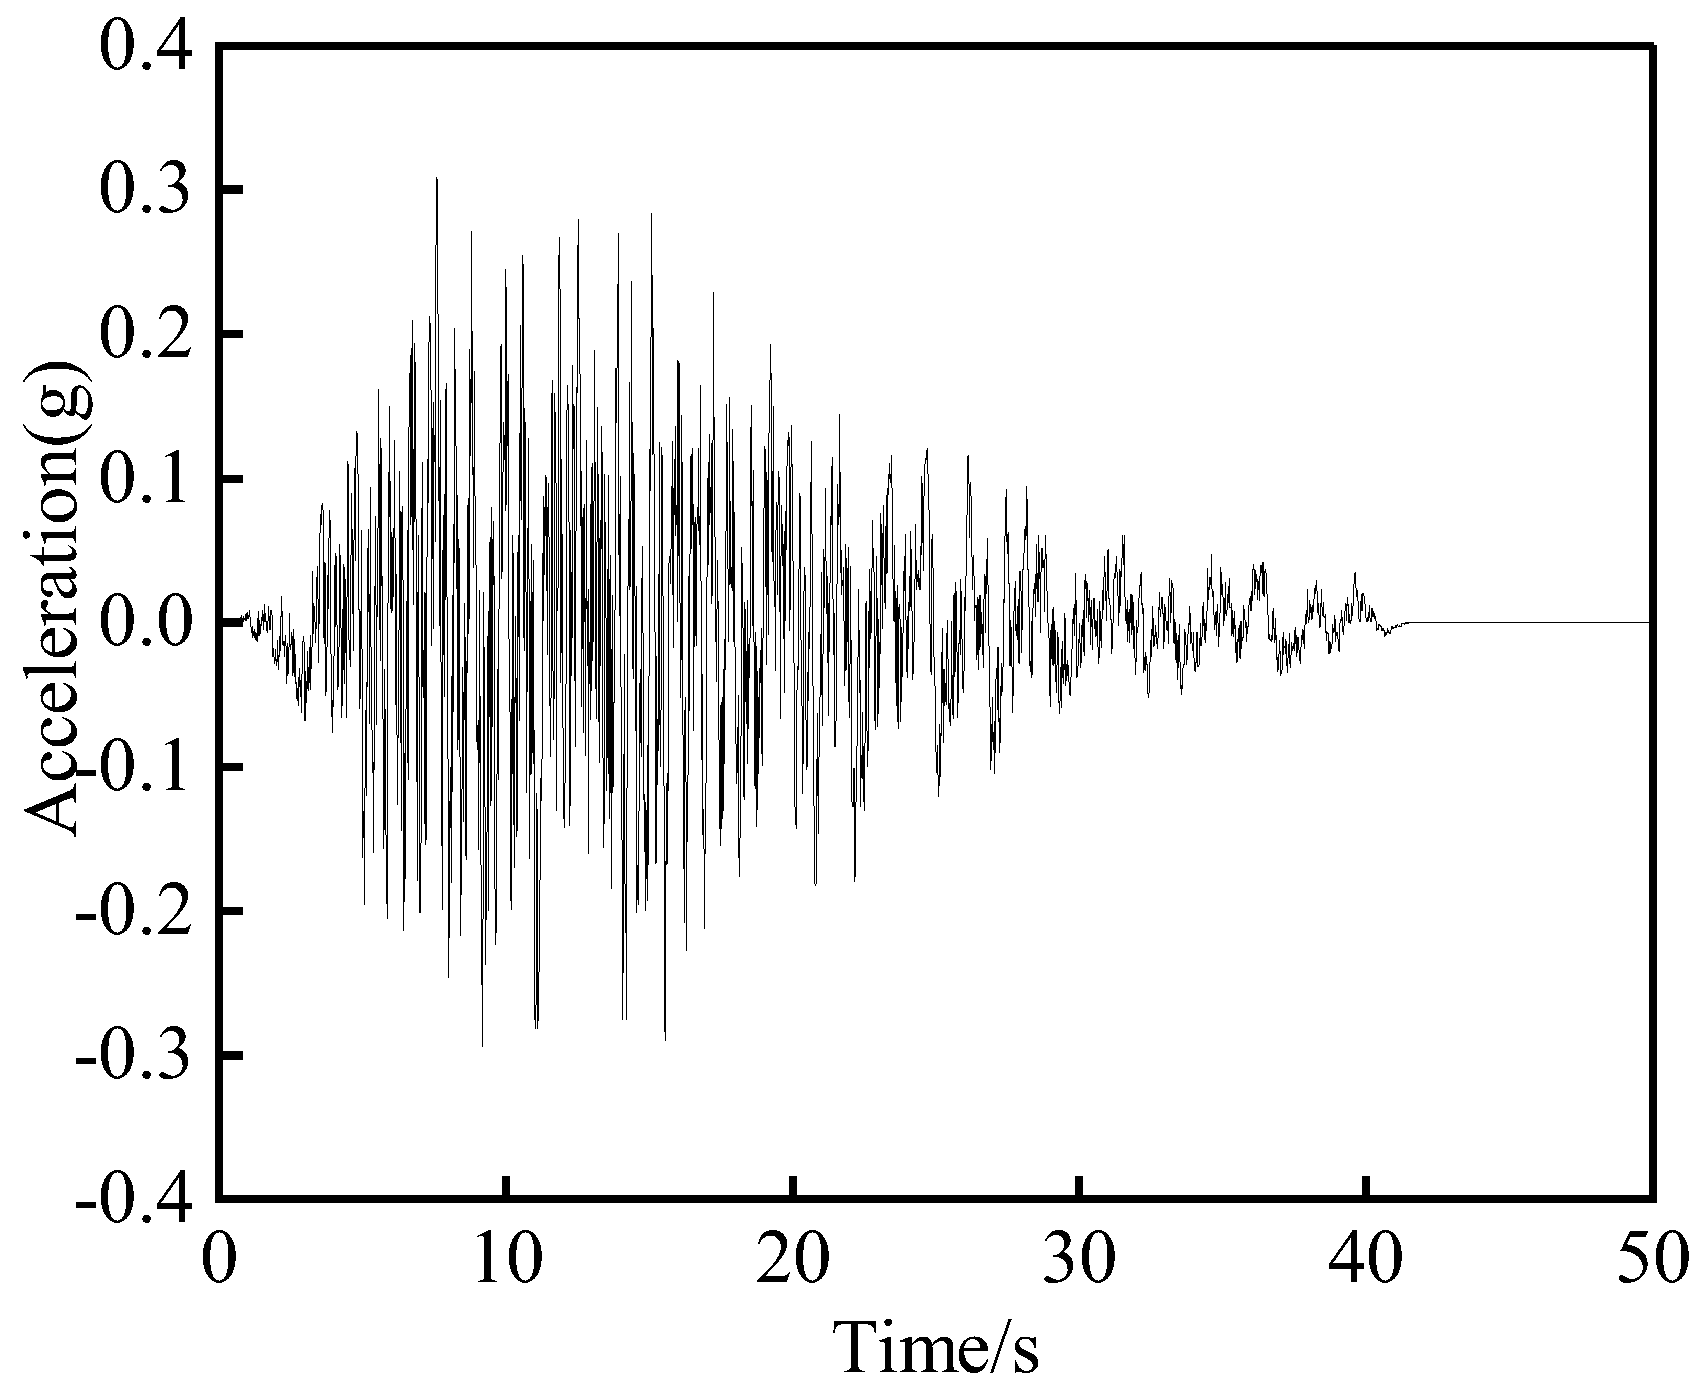
The 5010 artificial earthquake wave, widely used in shaking table experiments in China, served as the seismic input. It features a duration of approximately 20 s and a predominant frequency of 3.5–4.0 Hz, encompassing both low- and mid-frequency components representative of typical seismic motions in coastal and alluvial regions. The wave’s peak ground acceleration (PGA) was scaled to different intensity levels to examine the nonlinear dynamic response of the liquefiable soil–pile system under increasing seismic excitations. This wave was selected for its frequency compatibility with the natural frequencies of medium-stiff soils and bridge pile foundations, enabling a realistic simulation of soil–structure interaction under earthquake loading.
Figure 6 illustrates the waveform of this seismic wave.
The study examined the responses of pore pressure ratio, pile acceleration, pile bending moment, and pile top horizontal displacement in saturated sand using 5010 waves with ground motion intensities of 0.15 g, 0.25 g, 0.35 g, and 0.45 g. These responses were analyzed for a large-diameter variable-section single and group pile foundation with a 30 cm thick liquefiable soil layer under seismic conditions. Test conditions are detailed in
Table 4.
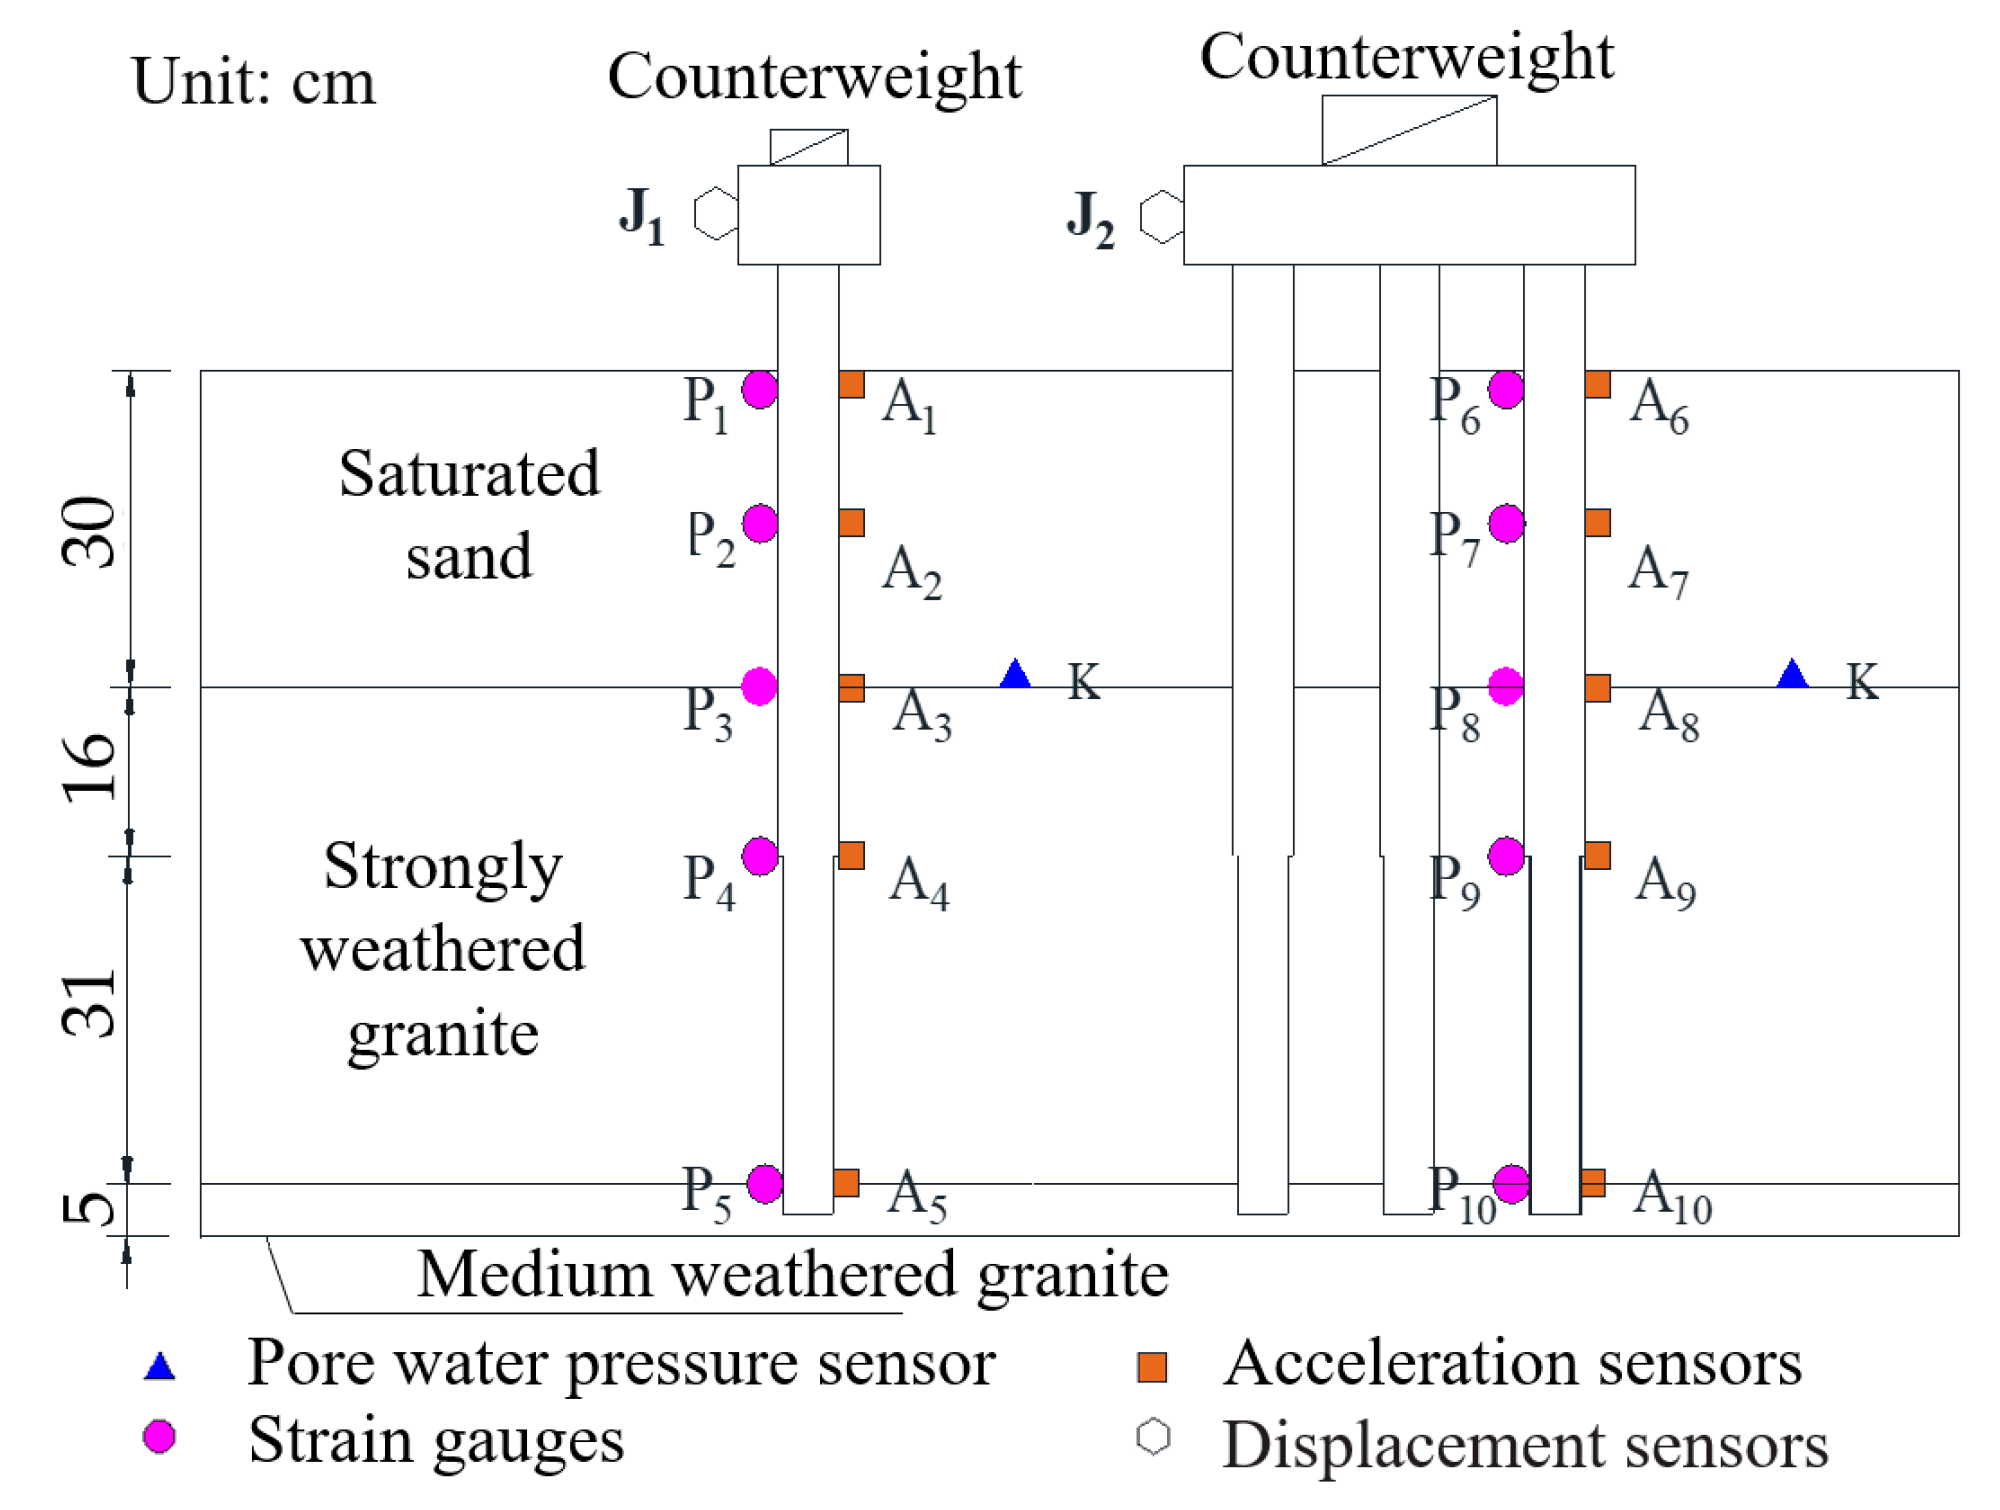
The experiment utilizes pore water pressure gauges, acceleration sensors, strain gauges, and displacement sensors. Pore water pressure gauges are positioned in the soil surrounding the pile to measure the pressure. Acceleration sensors, attached to the pile with rubber bands, gauge the pile’s acceleration due to seismic inertia. Strain gauges are placed at soil layer interfaces, the midpoint of the saturated sand layer, the bedrock surface, the pile top, and variable cross-section locations to assess pile strain under seismic loads, facilitating the calculation of the bending moment. Displacement sensors, secured with plasticine on the pile top, measure horizontal displacement changes under seismic conditions. The arrangement of these components is depicted in
Figure 7.
3. Experimental Results and Analyses
3.1. Recorded Pore Pressures
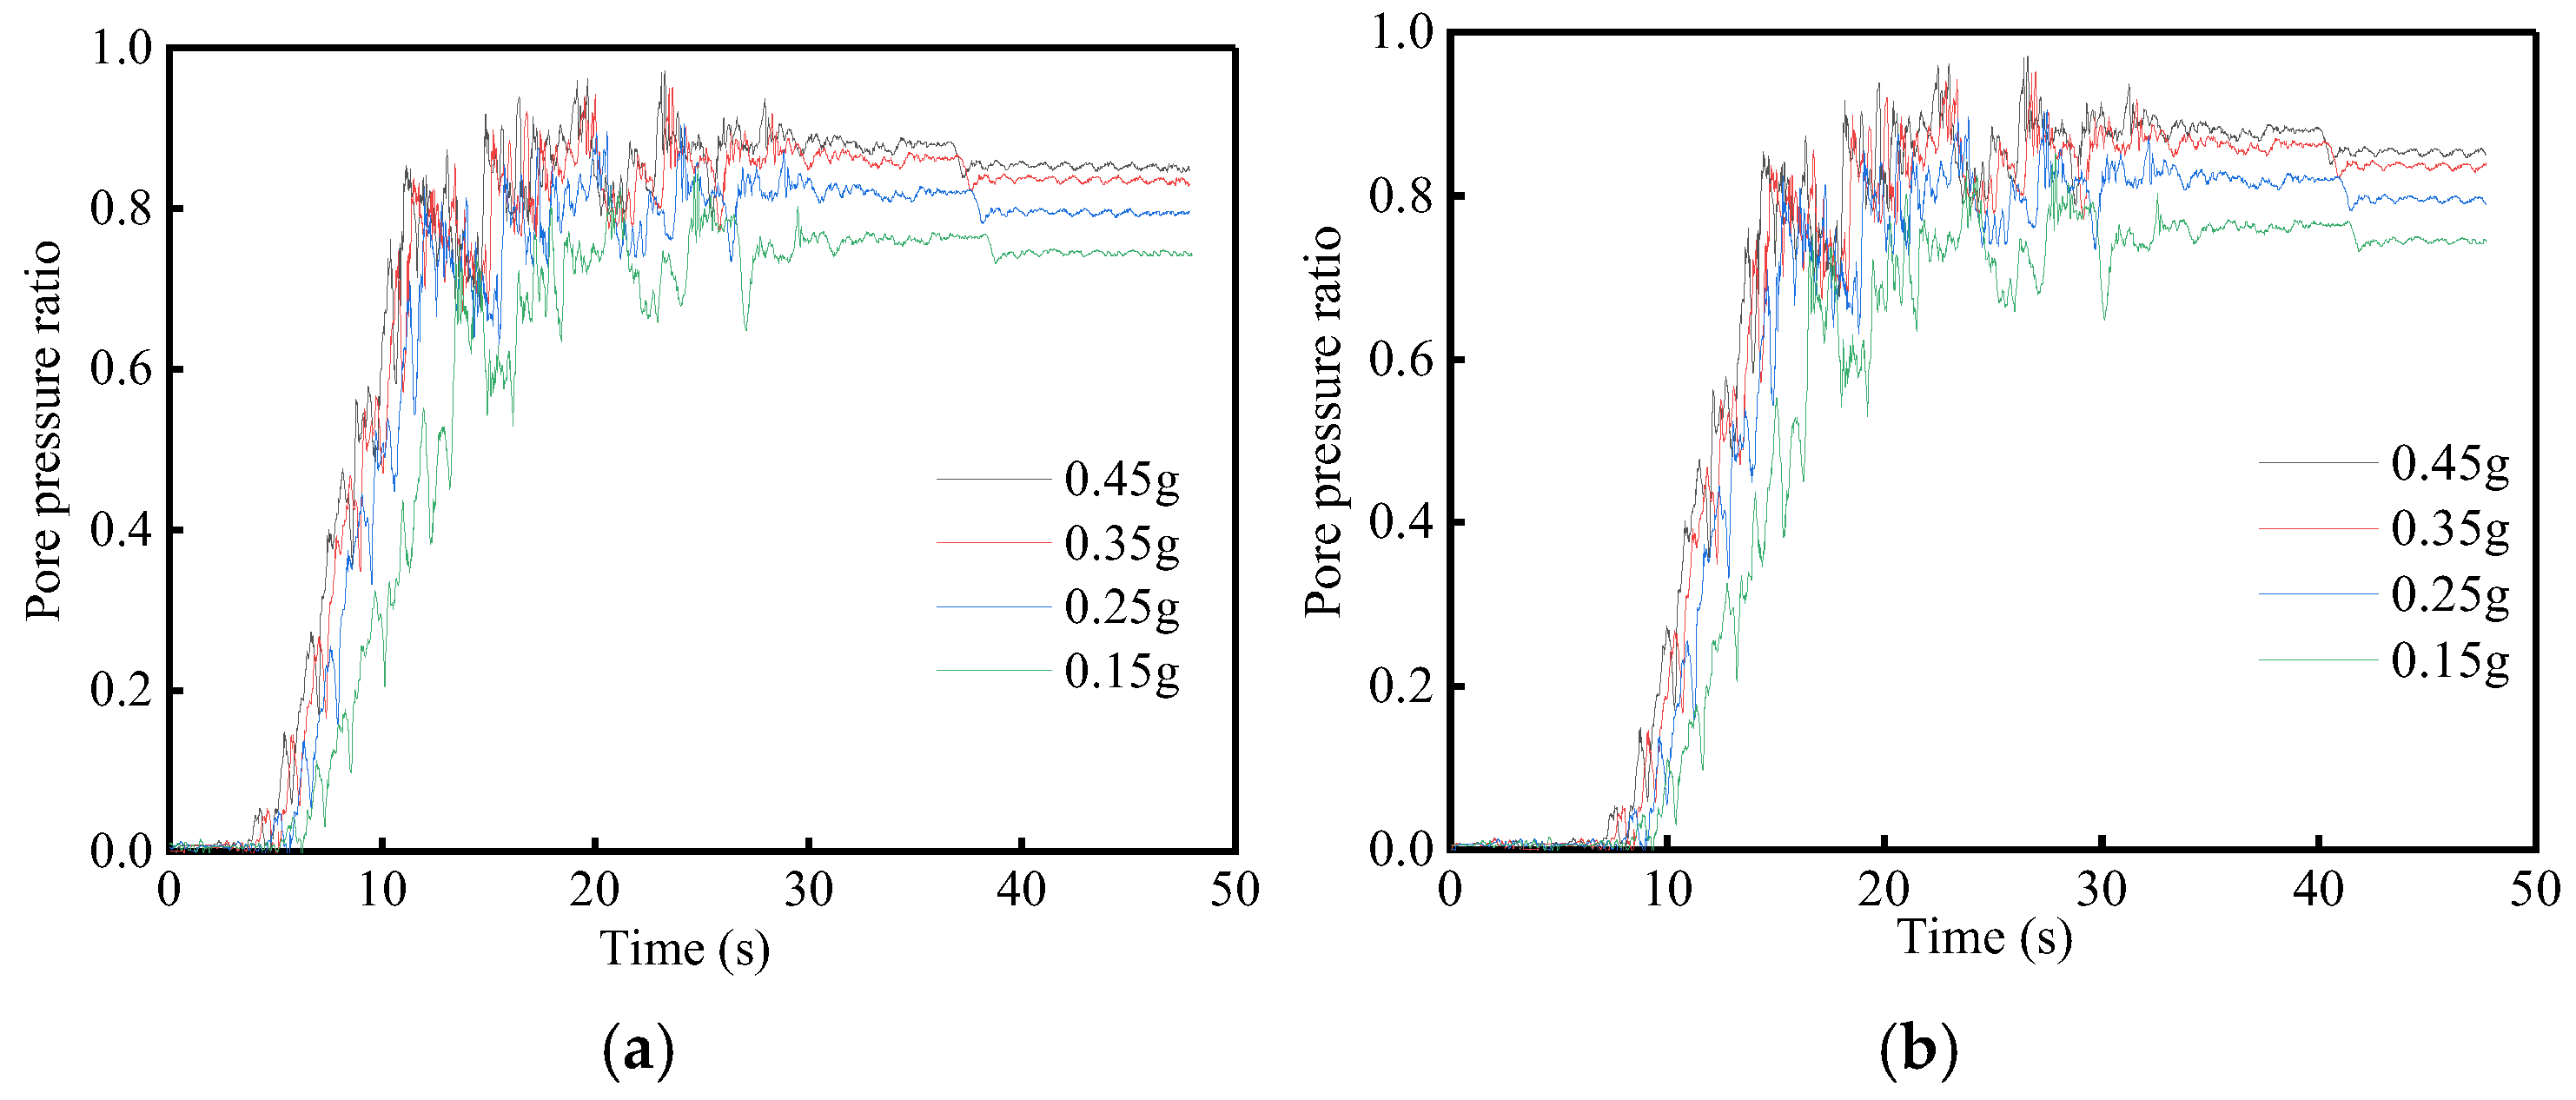
Figure 8 illustrates that the pore pressure ratio exhibits similar variation patterns across different ground motion intensities. Initially, upon seismic wave loading, the pore pressure ratio is near zero. As seismic intensity escalates, the ratio rises gradually before stabilizing. Complete soil liquefaction occurs when the ratio reaches 0.8. For a pile group foundation, the stable pore pressure ratios increase with seismic intensity. Specifically, at intensities of 0.15, 0.25, 0.35, and 0.45 g, the stable ratios are 0.72, 0.80, 0.84, and 0.86, respectively. This trend is attributed to the inability of pore water pressure to dissipate rapidly in saturated sand layers as seismic intensity increases, leading to higher stable pore pressure ratios.
Higher seismic intensity accelerates the onset and stabilization of the pore pressure ratio in saturated sand layers. This rapid accumulation of pore-water pressure heightens the likelihood of liquefaction, underscoring seismic intensity as a critical factor in sand liquefaction. Therefore, the seismic design of pile foundation must consider local seismic fortification intensity to address saturated sand layers appropriately.
3.2. Acceleration
Figure 9 illustrates the pile accelerations under seismic activity for both large-diameter variable-section single and group pile foundations. In both cases, pile acceleration intensifies as the soil burial depth decreases, with the peak values occurring at the pile top.
The accelerations of both the large-diameter variable cross-section single-pile foundation and the pile group foundation gradually increase from the pile tip to the pile top, and the peak values are all located at the pile top. When the seismic intensity is 0.15, 0.25, 0.35, and 0.45 g, the peak acceleration values of the single-pile foundation are 4.04, 5.10, 6.25, and 7.30 m/s
2, respectively, and those of the pile group foundation are 3.51, 4.43, 5.43, and 6.35 m/s
2, respectively (
Figure 10).
The acceleration of the pile body at a given location increases progressively with the intensity of ground motion. This acceleration increases gradually within the strongly weathered granite layer but more rapidly in the liquefiable soil layer, with abrupt changes observed at the interface between the soil layer and the variable cross-section of the pile. The sudden shift in pile body acceleration at the variable cross-section is attributed to the decrease in pile diameter, which reduces the overall pile-soil stiffness and amplifies the acceleration. Additionally, the acceleration of the pile body increases at different rates across soil layers, with abrupt changes at layer interfaces. This is because the liquefiable soil layer provides weaker restraint on the pile foundation, and soil liquefaction under seismic loading results in decreased strength and enhanced amplification of seismic waves within this layer.
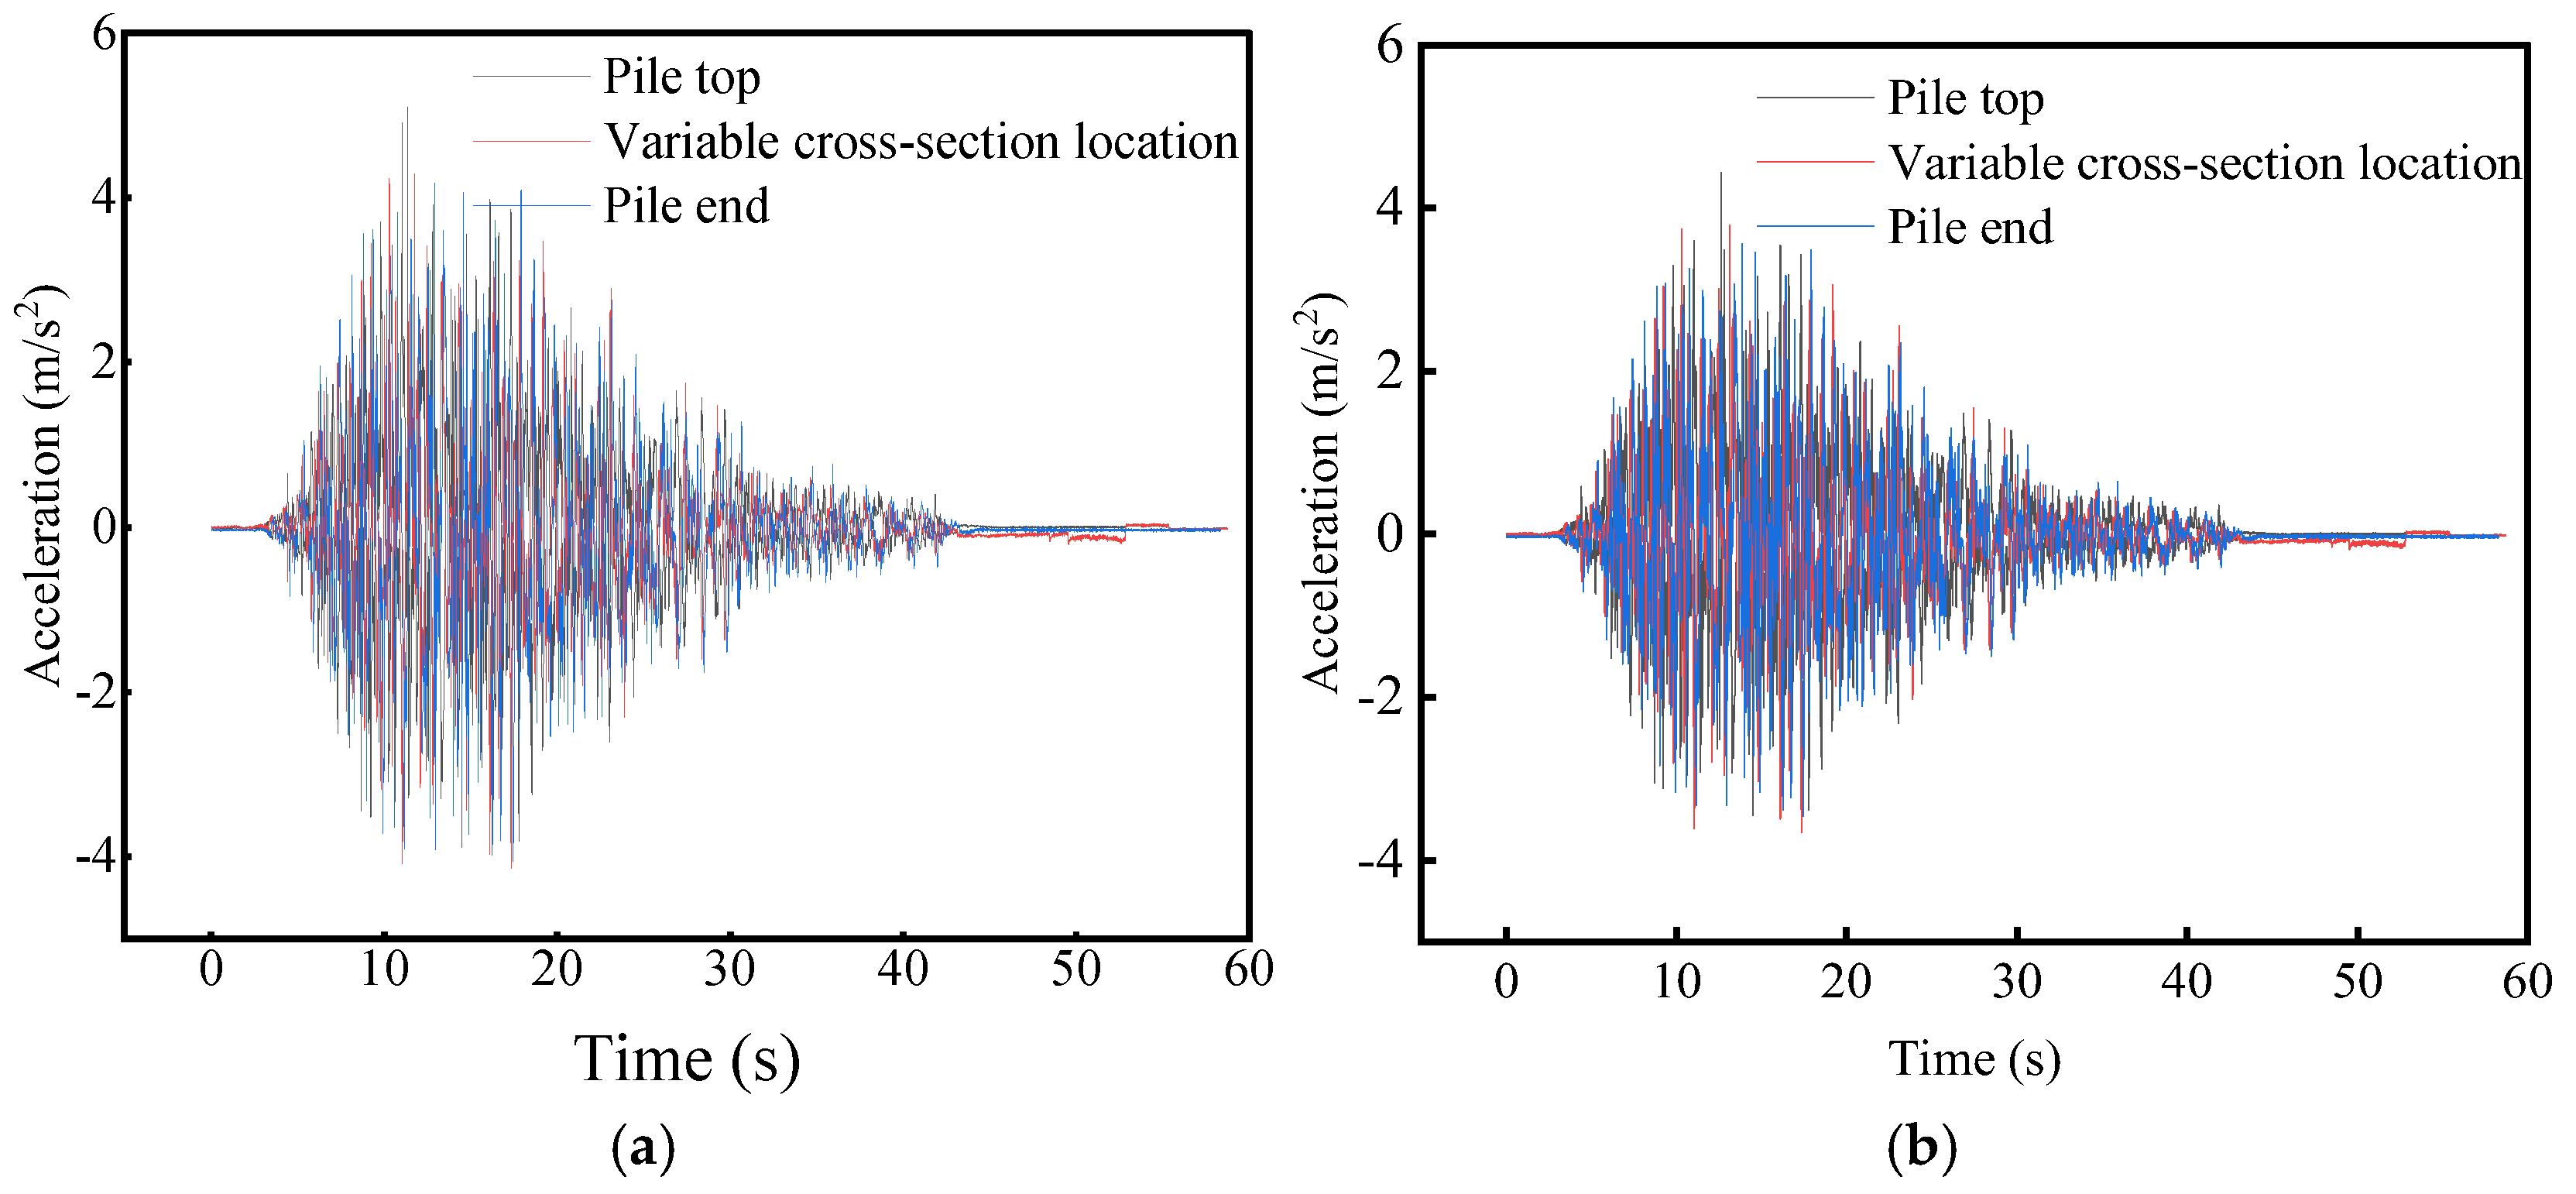
In
Figure 11, for an earthquake intensity of 0.25 g, the maximum accelerations for a large-diameter variable-section single pile occur at 11.37 s at the pile top (A
1), 11.76 s at the soil layer interface (A
3), and 12.60 s at the variable section (A
4). In contrast, for a large-diameter variable-section pile group, these accelerations occur at 12.63 s at the pile top (A
6), 13.13 s at the soil layer interface (A
8), and 13.85 s at the variable section (A
9), occurring 1.26 s, 1.37 s, and 1.25 s later than those in the single-pile foundation, respectively. The pile group foundation reaches complete liquefaction later than the single pile foundation due to the load-sharing effect among the piles. The interaction within the pile group increases the overall system stiffness and inertia, which reinforces the surrounding soil, constrains soil deformation, and enhances the anti-liquefaction performance of the group.
3.3. Horizontal Displacement
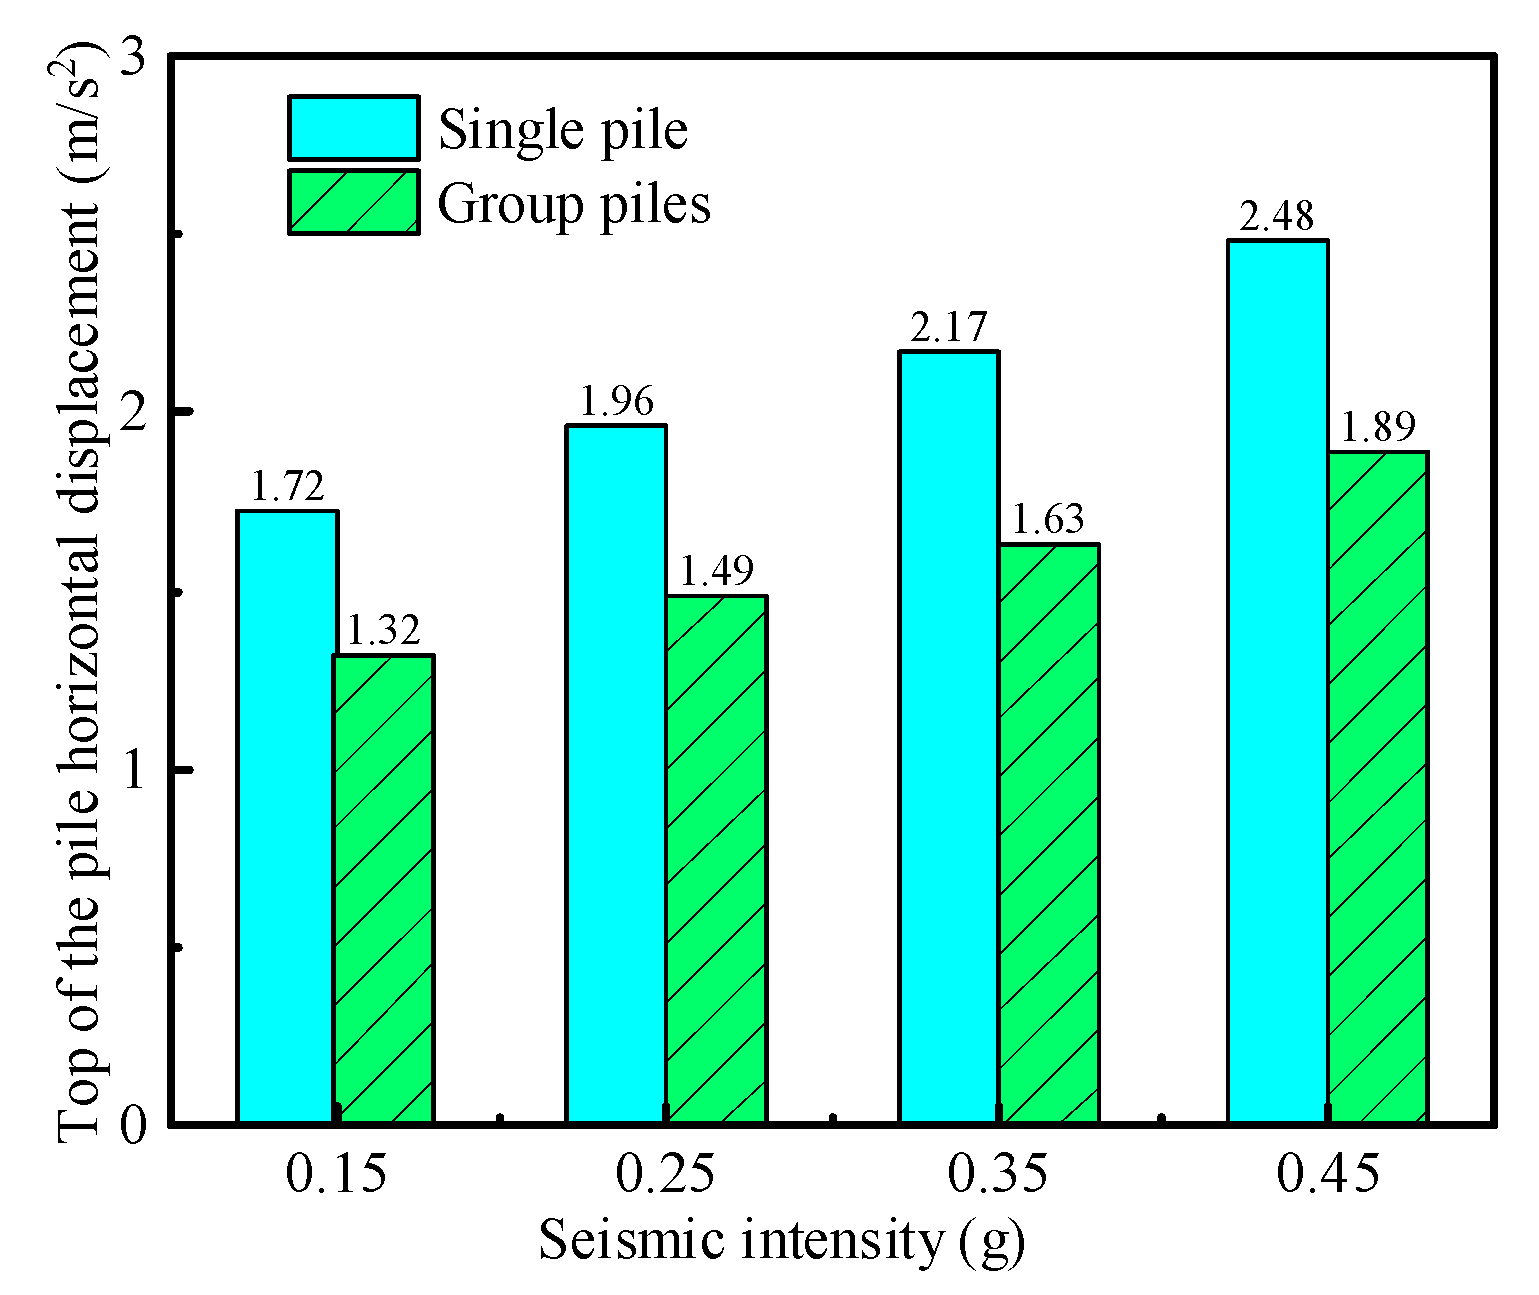
Figure 12 illustrates the horizontal displacement time histories at the pile top of large-diameter variable-section single piles and pile group foundation under seismic action. Both foundation types exhibit similar displacement patterns under identical seismic loads. As seismic intensity rises, the maximum horizontal displacements at the pile tops increase. Specifically, at seismic wave intensities of 0.15, 0.25, 0.35, and 0.45 g, the single-pile foundation displacements are 1.72, 1.96, 2.17, and 2.48 mm, respectively, while the pile group foundation displacements are 1.32, 1.49, 1.63, and 1.89 mm. This trend reflects the increasing horizontal displacement with higher seismic intensity, attributed to the gradual liquefaction of the saturated sandy soil layer, which reduces its stiffness and strength, imparting liquid-like characteristics. Reduced lateral restraint on the pile leads to relative displacement between the pile and soil, increasing horizontal displacement at the pile top.
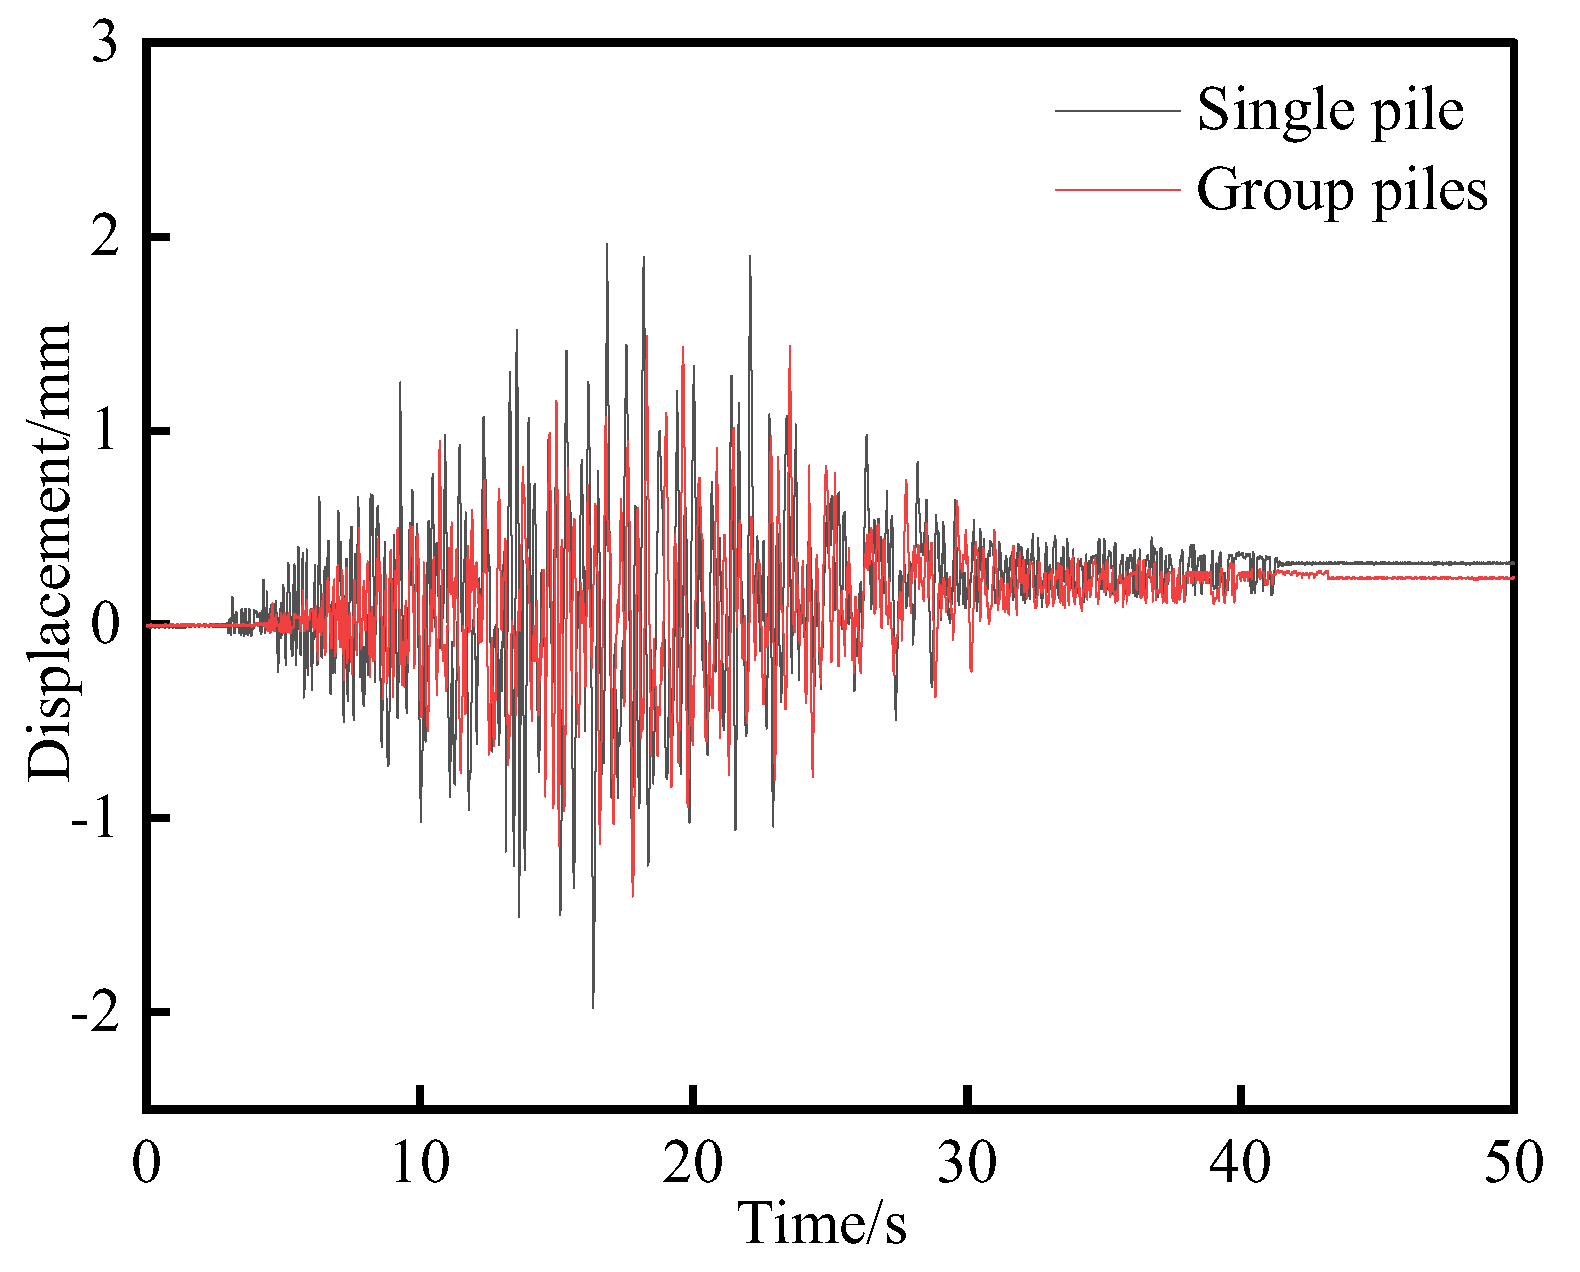
For a seismic wave intensity of 0.25 g, the horizontal displacement at the pile top of a large-diameter variable-section single-pile foundation is 1.96 mm. In contrast, the value for a pile group foundation is 1.49 mm, occurring at 16.83 s and 18.28 s, respectively (
Figure 13). This indicates that under seismic load, the pile top displacement of the pile group is smaller than that of the single pile. The surrounding soil provides better restraint for the pile group foundation than for the single-pile foundation. This is due to the greater stiffness of the pile group structure, the pronounced pile group effect, and the more uniform stress distribution compared to the single pile.
3.4. Bending Moment
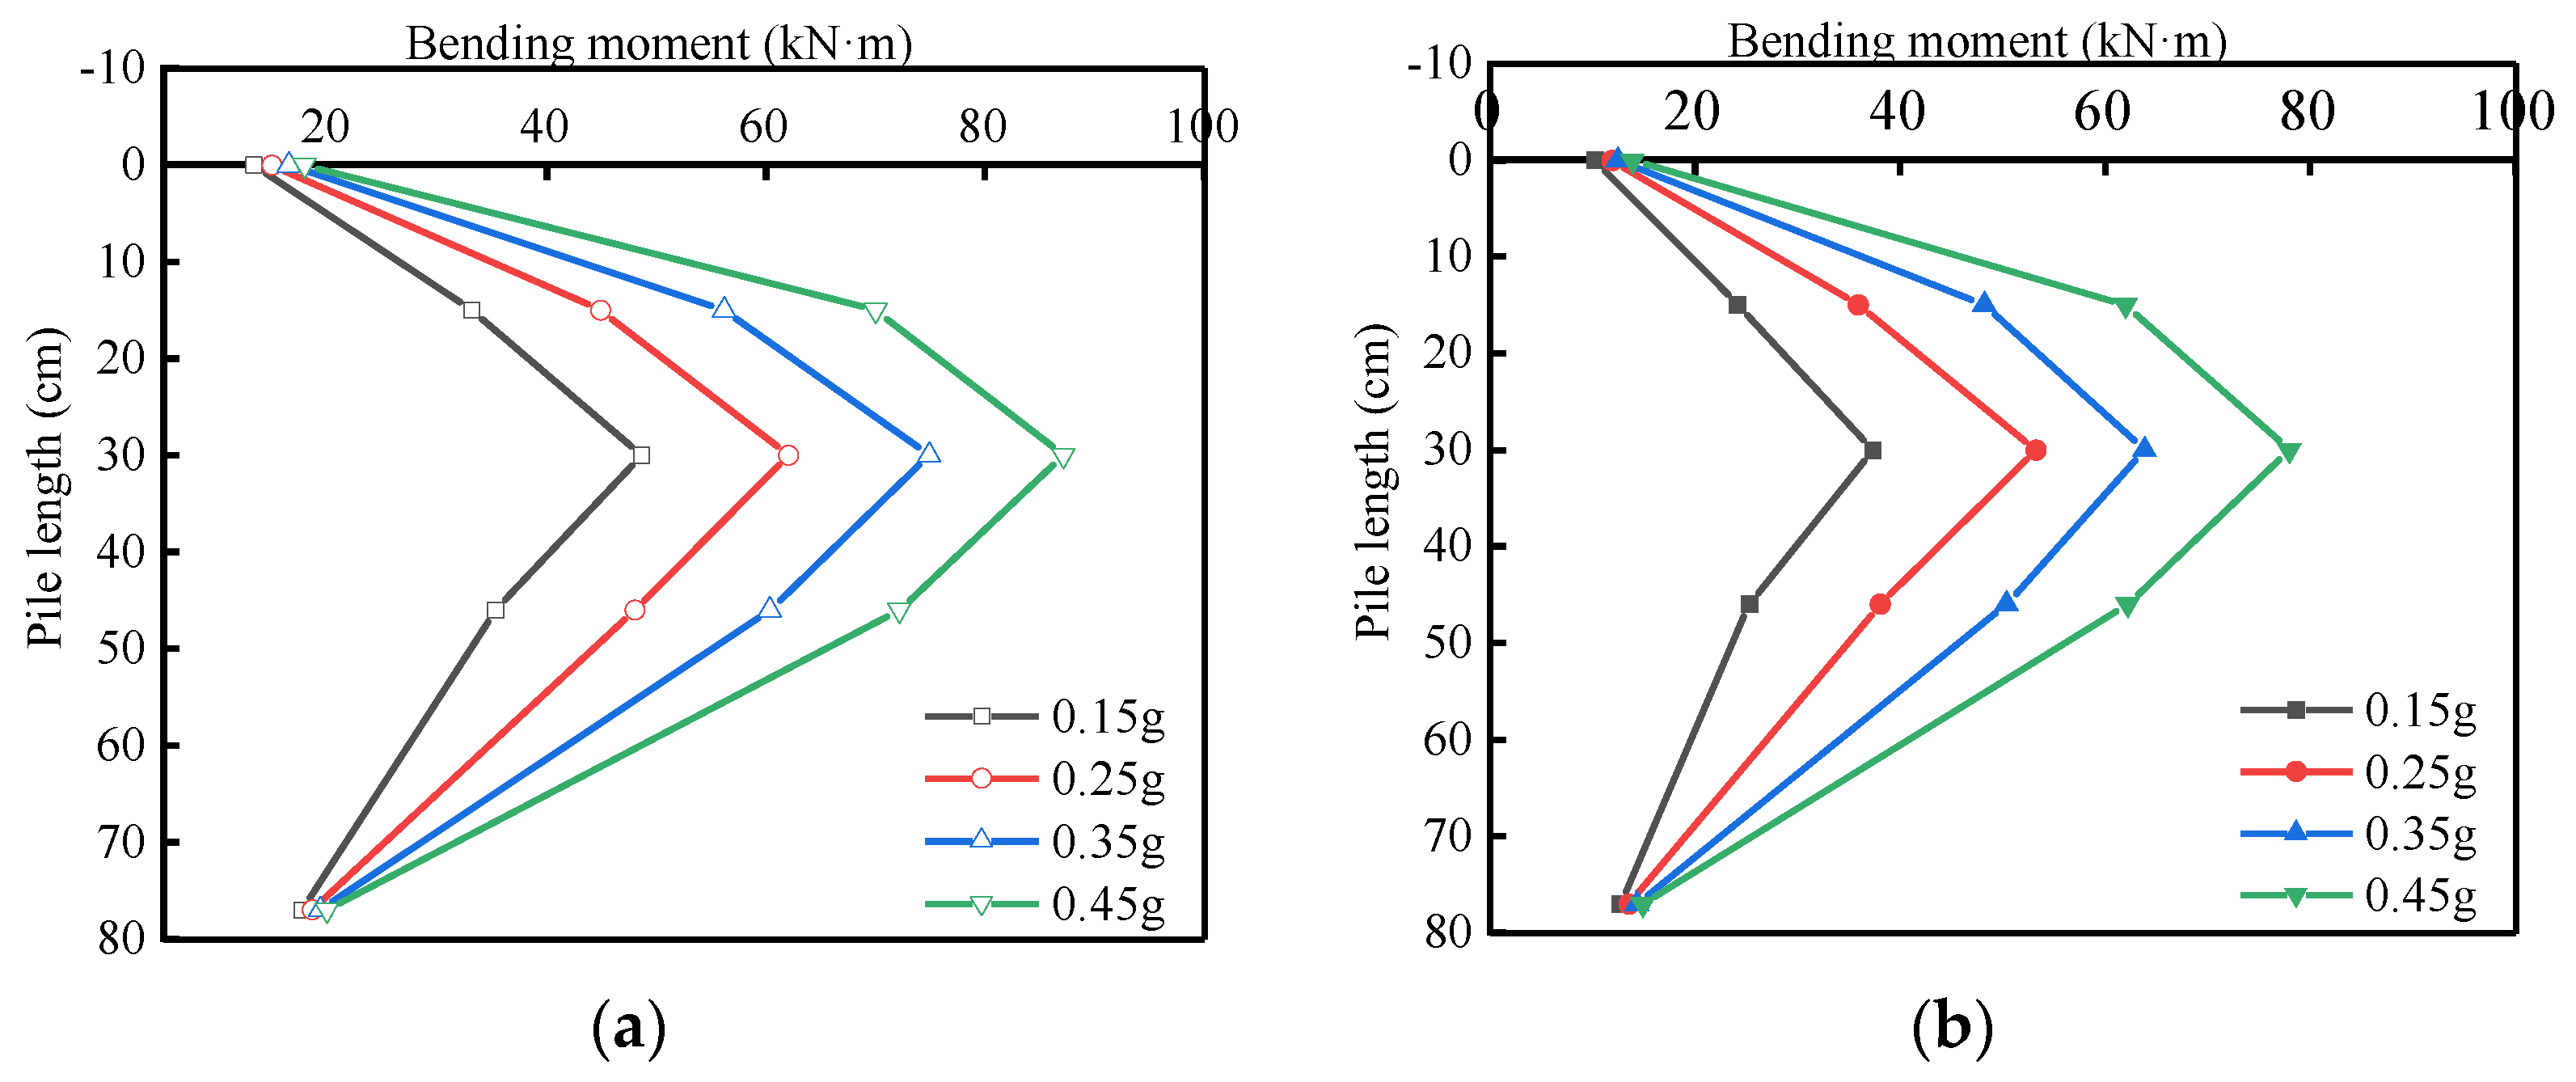
Figure 14 illustrates the bending moments of large-diameter variable-section single and group pile foundations under seismic activity. Both foundation types exhibit similar trends along the pile length, with minimal bending moments at the ends and a peak in the middle. This peak occurs at the interface between liquefied and non-liquefied layers due to soil liquefaction in saturated sandy layers, which causes lateral soil expansion. The resulting relative displacement between the pile and soil significantly increases the bending moment. In
Figure 15, as seismic intensity ranges from 0.15 g to 0.45 g, the peak bending moments progressively rise. For a single pile foundation, the maximum bending moments are 48.65, 62.08, 74.96, and 87.21 kN·m, while for a group pile foundation, they are 37.38, 53.23, 63.86, and 78.01 kN·m, respectively.
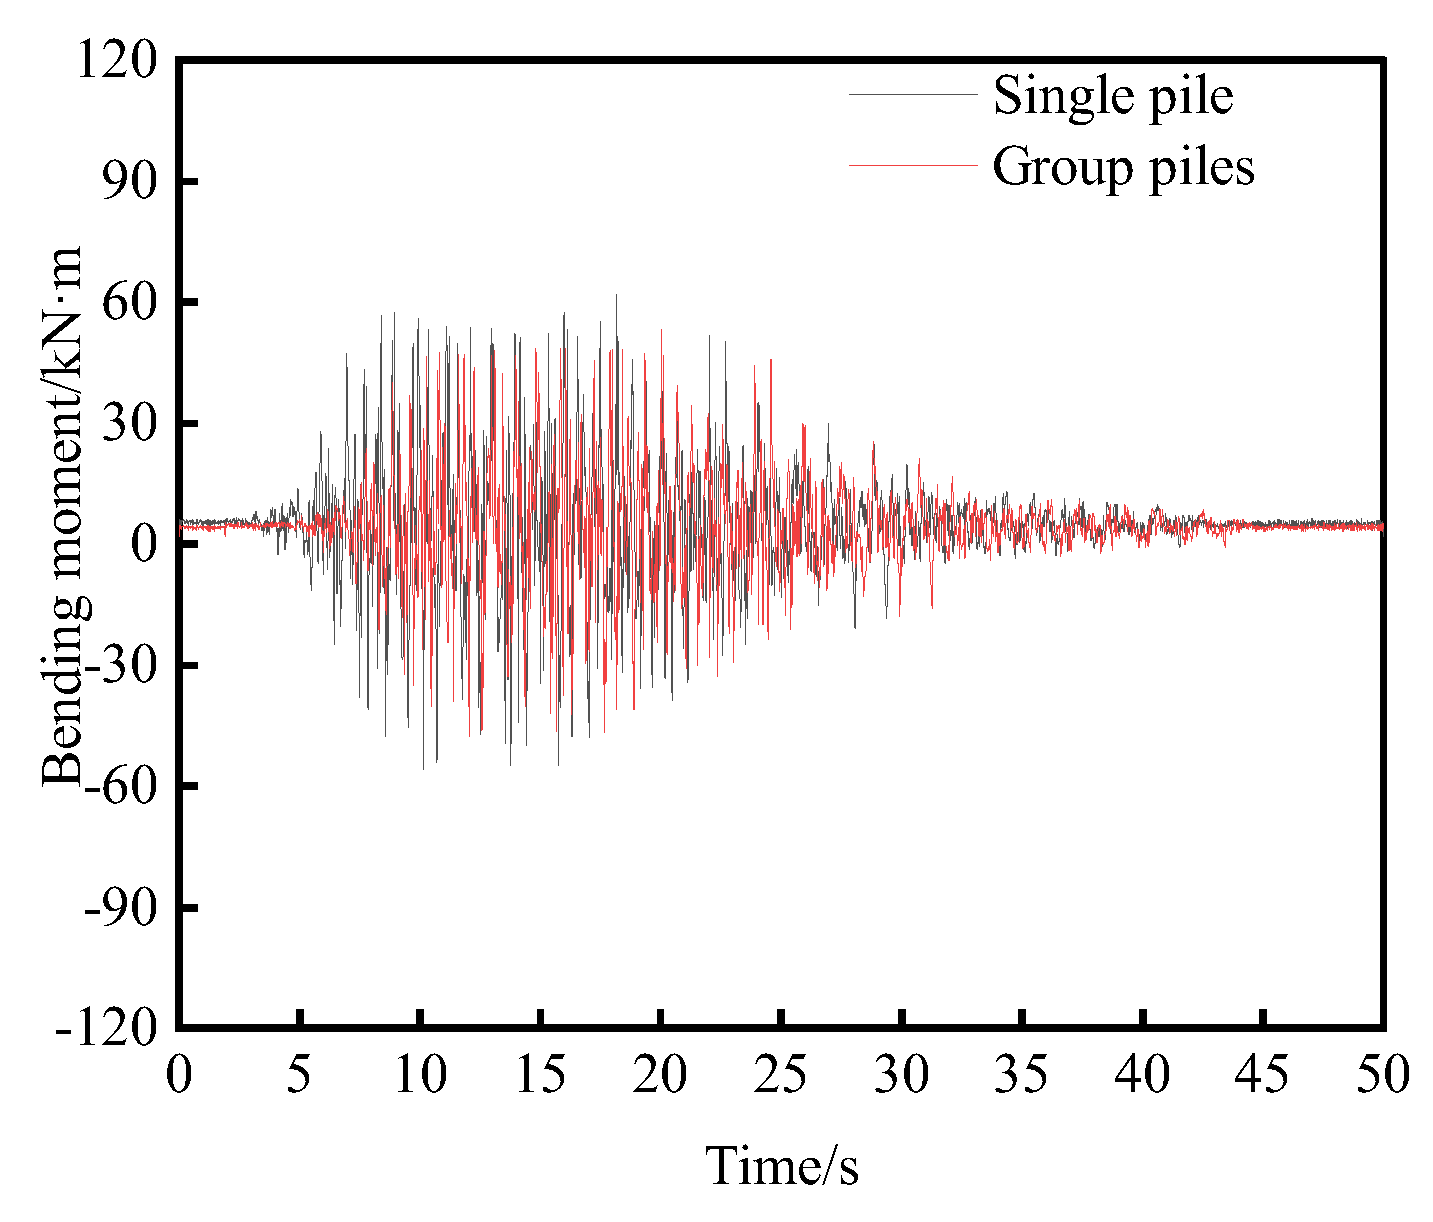
Using an earthquake intensity of 0.25 g as a case study,
Figure 16 illustrates the time-history curves of maximum bending moment locations for large-diameter, variable-cross-section single and group pile foundations. The maximum bending moment amplitude is notably high between 5 and 30 s, with significant bending moments persisting throughout the earthquake. After 30 s, the bending moment gradually diminishes to zero, indicating that no residual bending moment remains once the earthquake ceases. Under seismic wave influence, the peak bending moments for the single and group piles occur at 18.14 s and 20.01 s, respectively.
The bending resistance of a large-diameter, variable cross-section pile group foundation is superior to that of a single pile foundation under seismic loading conditions. Compared to single piles, the maximum bending moment experienced by the pile body in a large-diameter, variable cross-section pile group foundation is significantly reduced under seismic loads. This is attributable to the increased overall stiffness of the pile-soil structural system in the case of a large-diameter, variable cross-section pile group foundation, as well as the enhanced lateral soil resistance provided to the foundation by the surrounding soil.
3.5. Damage Analysis of the Pile Foundation
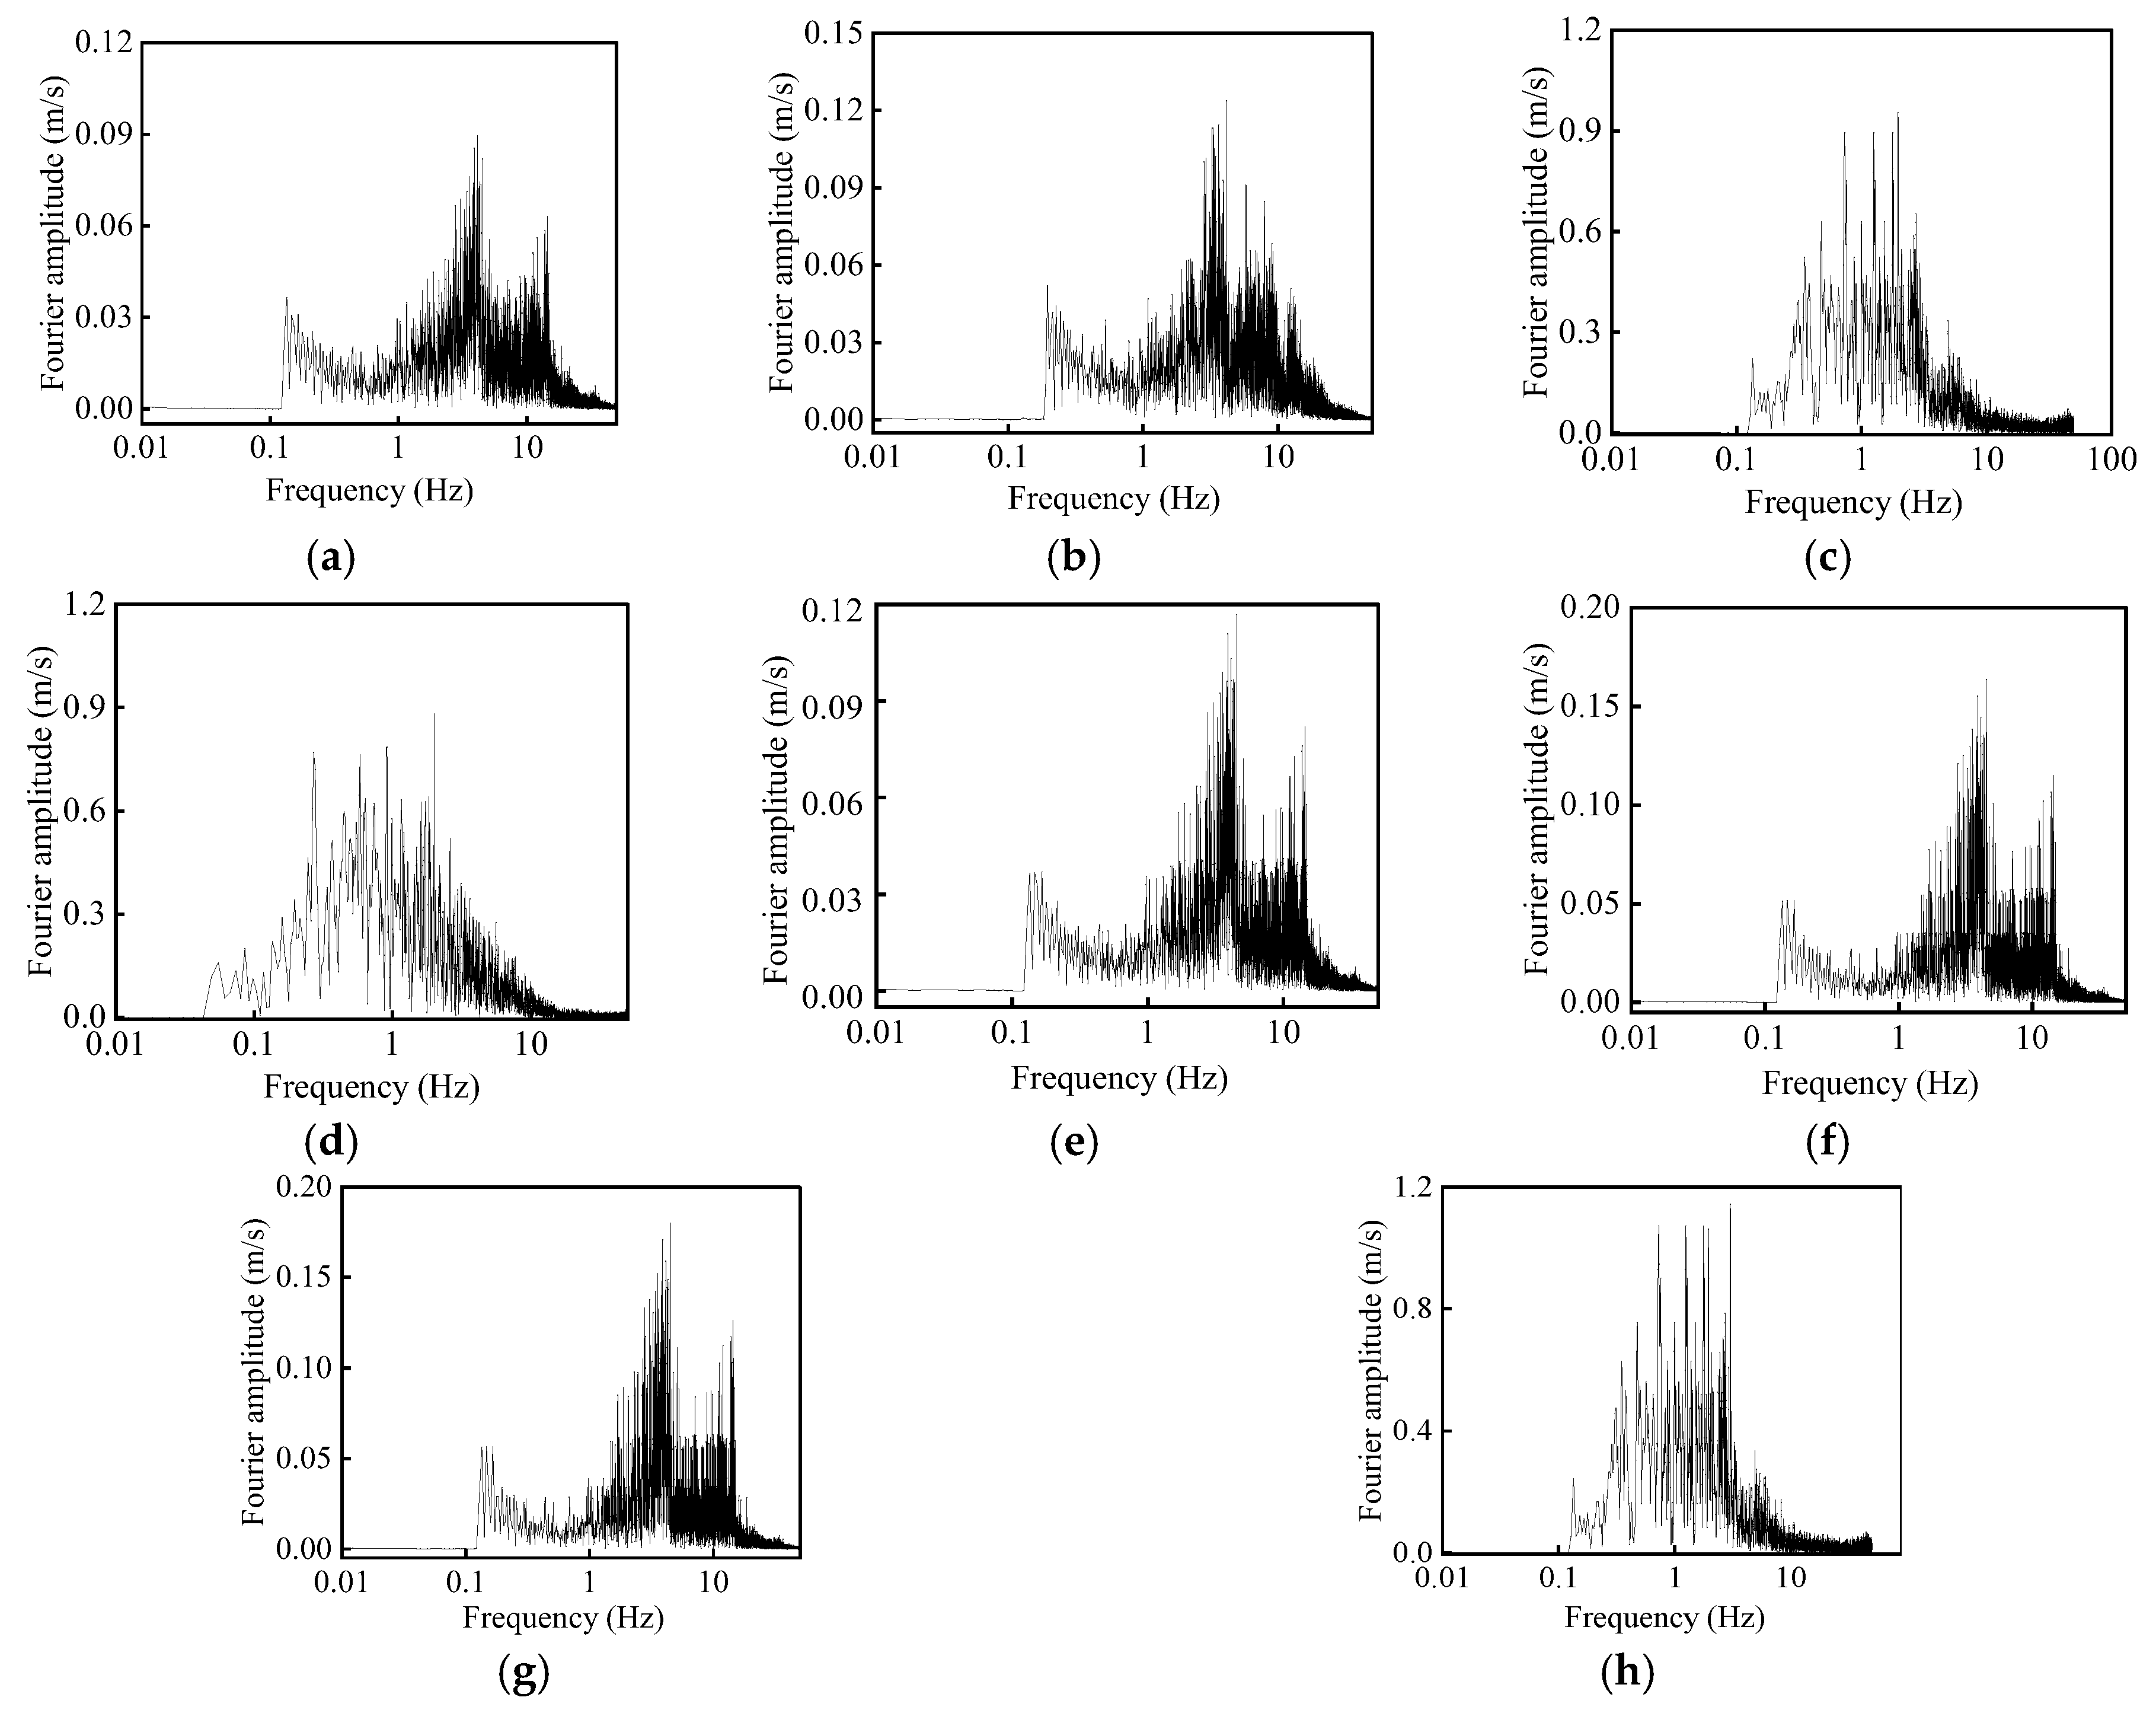
The impact of the 5010 wave on a large-diameter variable-section single-pile foundation was analyzed across varying seismic intensities. Pile top acceleration data were processed using the Fourier transform via Seismosignal_v5.0.0 software, with changes in fundamental frequency depicted in
Figure 17. Similarly, the effects on pile group foundation under different seismic intensities were examined, with corresponding frequency changes illustrated in
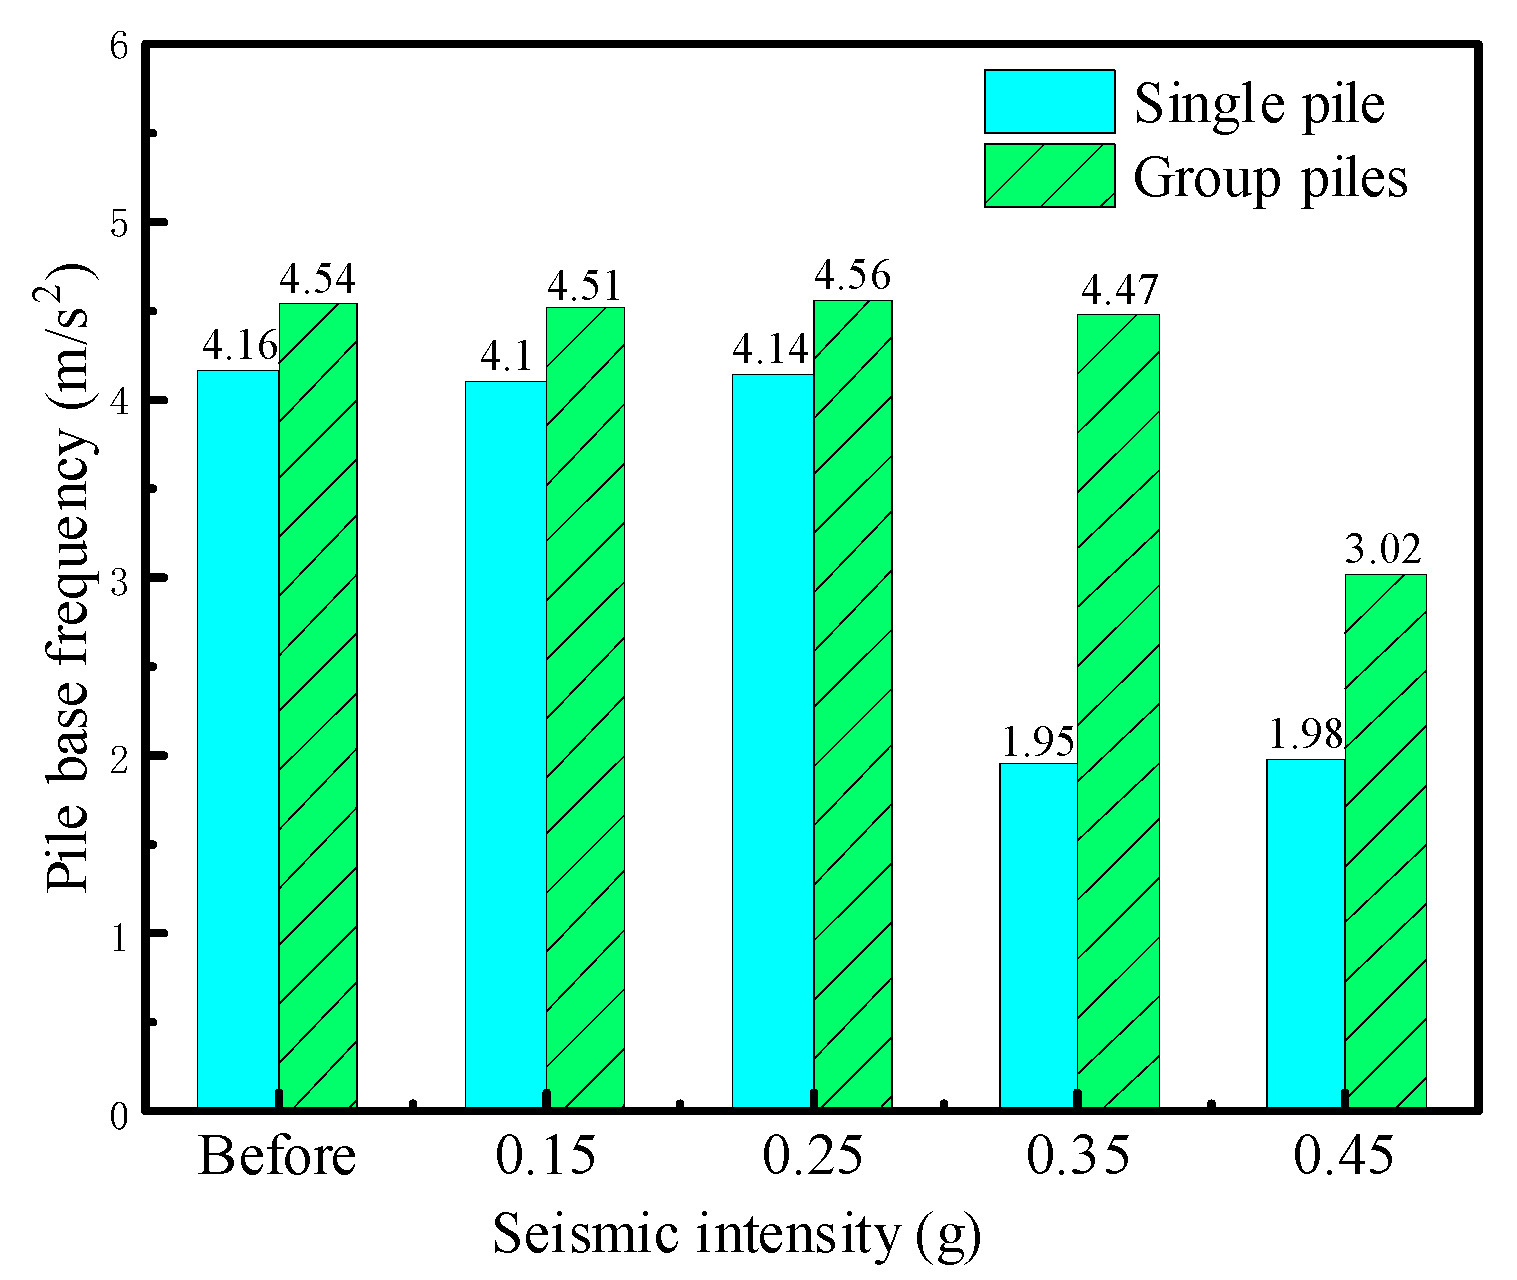
Figure 17. Comparative fundamental frequencies for both large-diameter variable-section single piles and pile group foundations are presented in
Figure 18 and
Figure 19.
Its stiffness and mass distribution mainly determine the fundamental frequency of a structure. When the mass variation is negligible, the frequency is approximately proportional to the square root of stiffness. Structural damage, such as cracking, joint loosening, or material degradation, results in decreased stiffness, thereby reducing the fundamental frequency. Therefore, the frequency reduction can be used as an indicator of stiffness degradation. The percentage reduction is calculated as:
where
f0 and
fd represent the fundamental frequencies before and after damage, respectively.
Figure 17,
Figure 18 and
Figure 19 illustrate that as seismic intensity increases, the fundamental frequencies of both single-pile and pile-group foundations initially remain stable before sharply decreasing beyond a certain intensity. The initial fundamental frequency of the single-pile foundation is 4.16 Hz. At ground motion intensities of 0.15 g to 0.45 g, the frequencies are 4.10, 4.14, 1.95, and 1.98 Hz, respectively. Between 0.15 g and 0.25 g, there is no significant change in the pile foundation’s fundamental frequency, indicating maintained stiffness and no apparent damage. However, at 0.35 g, the frequency decreases by 52.90%, signifying substantial damage to the pile foundation. The initial fundamental frequency of the pile-group foundation is 4.54 Hz. At ground motion intensities of 0.15 g to 0.45 g, the fundamental frequencies recorded are 4.51, 4.56, 4.47, and 3.02 Hz, respectively. At intensities between 0.15 g and 0.35 g, the fundamental frequency shows minimal or no change, suggesting that the pile foundation’s overall stiffness remains stable and undamaged. However, at an intensity of 0.45 g, the fundamental frequency decreases markedly by 32.44%, indicating significant damage to the pile foundation. This damage is primarily due to the loss of shear strength in the saturated sand layer, which enters a flowing state post-liquefaction. Consequently, the variable-section single pile loses lateral resistance from the sand layer under seismic loads, resulting in a pronounced dynamic response and increased susceptibility to damage.
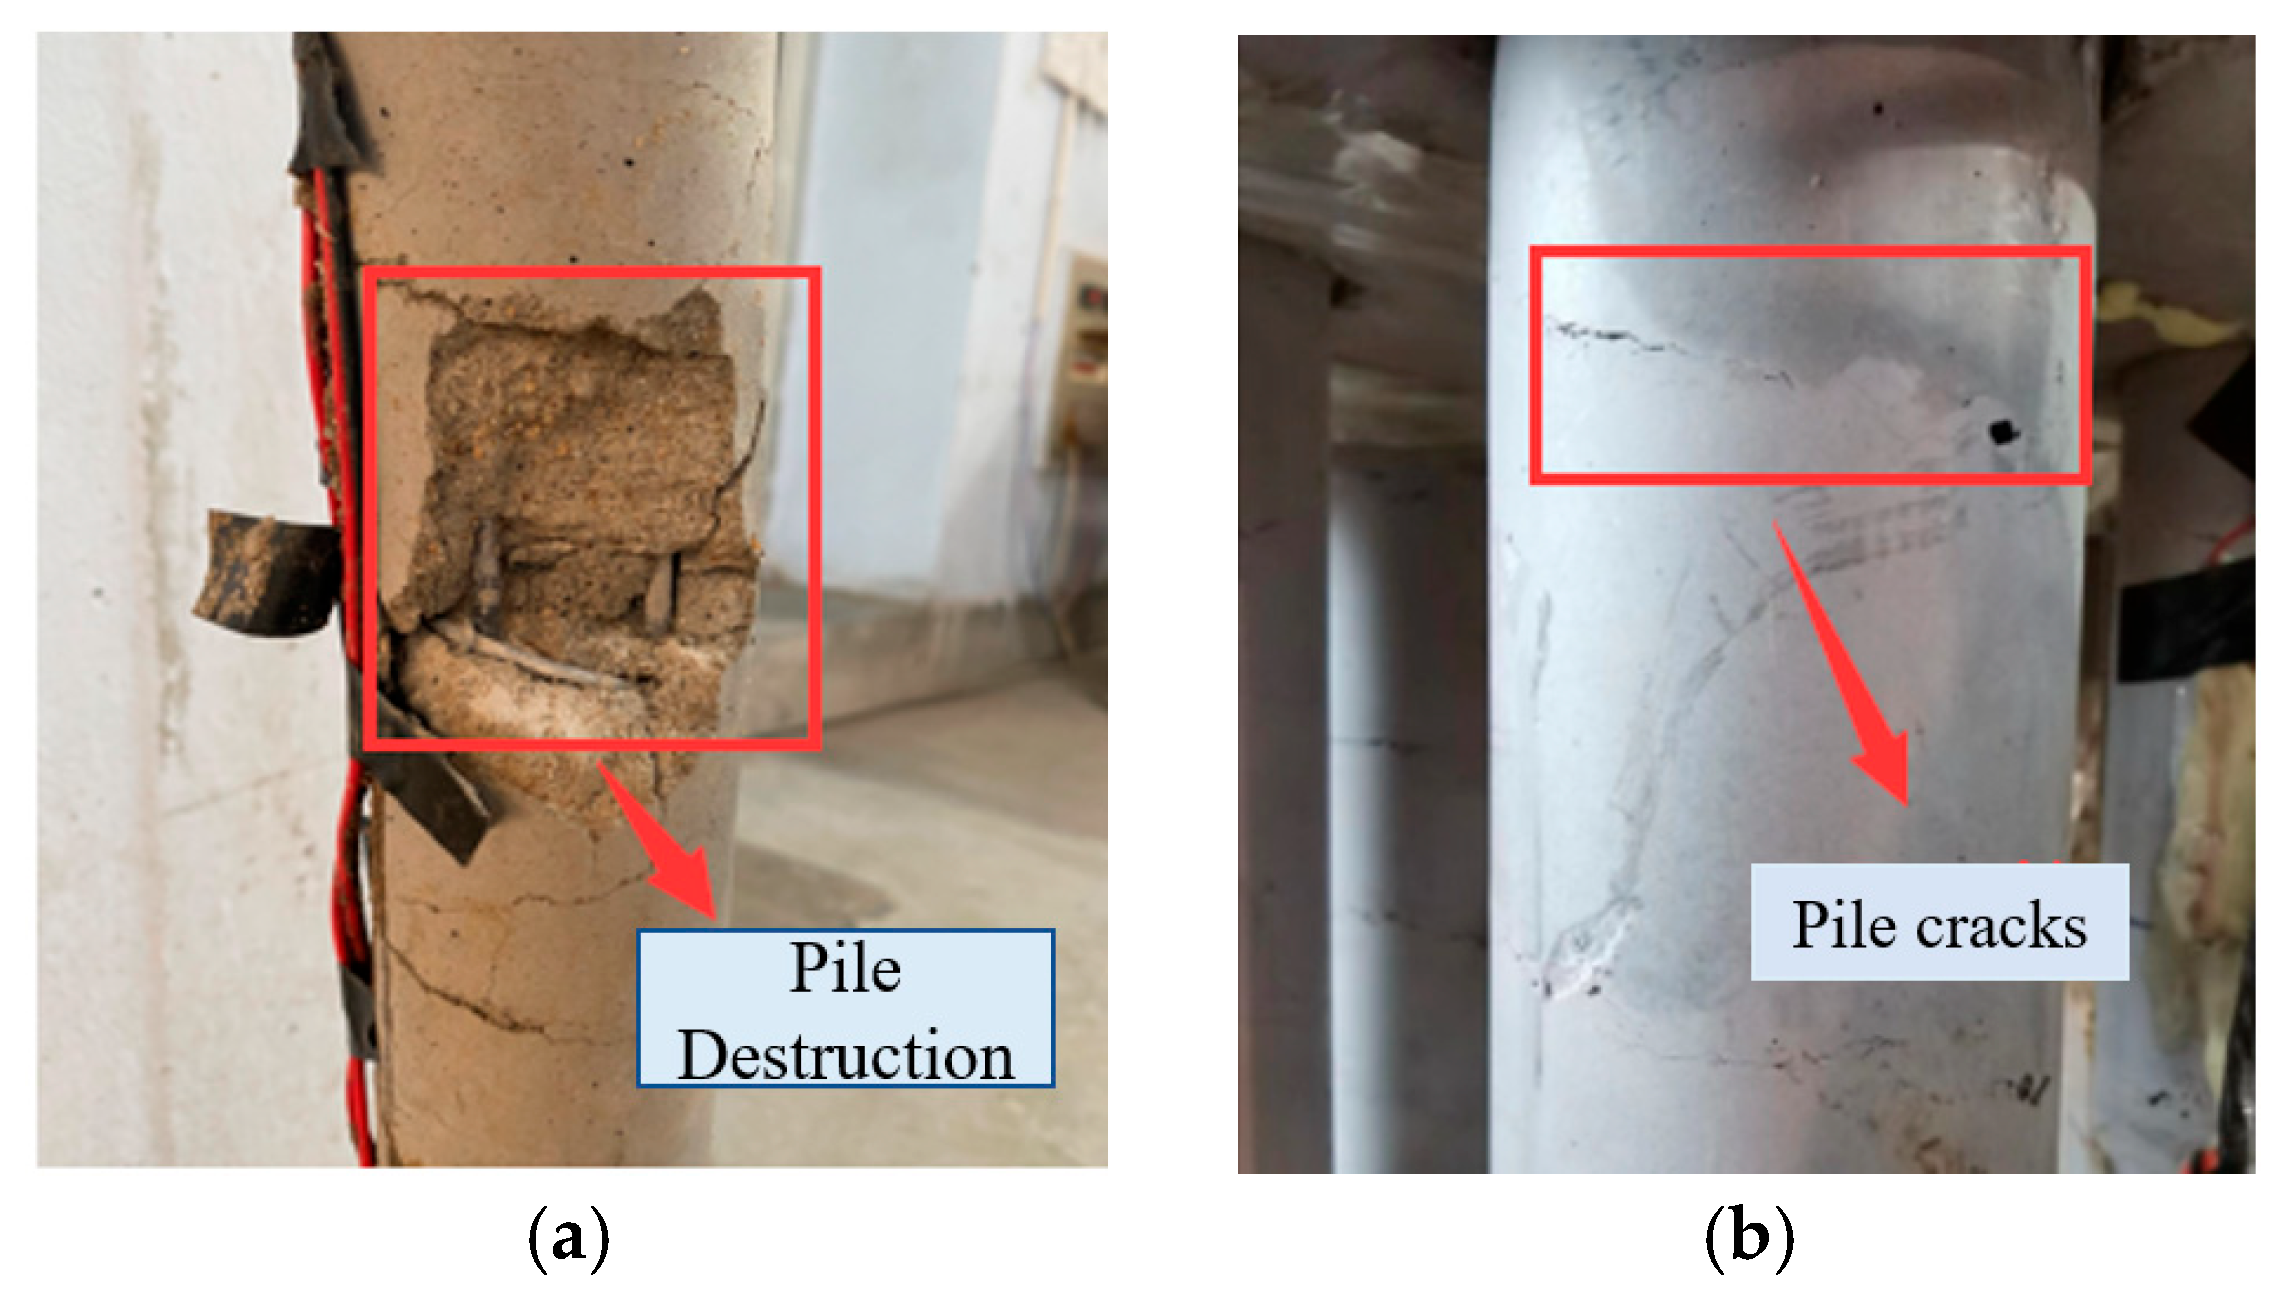
Group pile foundation exhibits reduced spectral response compared to a single pile foundation, suggesting that liquefiable sites more significantly affect the spectral characteristics of single piles. Damage occurs at a seismic intensity of 0.35 g for single piles and 0.45 g for group piles, as illustrated in
Figure 18. This indicates that at a seismic intensity of 0.15 g, the bridge pile foundation of the Second East Passage in Xiamen complies with the seismic fortification intensity requirements of VII degrees. The greater resilience of group pile foundations to ground motion underscores their superior seismic performance.
4. Discussion
This study investigated the dynamic response and damage mechanisms of large-diameter variable-section pile group foundations in liquefiable soil layers, using large-scale shaking table tests under varying earthquake intensities. Analyses focused on pore pressure ratio, acceleration, bending moment, and top displacement, providing a comprehensive characterization of pile group behavior under seismic loading.
The bending moment along the pile is highly non-uniform, especially near the pile head, soil–pile interface, and variable-section transitions. This non-uniformity creates stress concentrations that can induce localized plastic deformation and initiate cracking. Combined with uneven pore pressure dissipation, these effects accelerate curvature development and structural degradation under cyclic seismic loading. Therefore, bending moment non-uniformity is a critical factor influencing pile damage, highlighting the importance of considering section transitions and soil stratification in seismic design and damage assessment of pile foundations.
The experimental process has inherent limitations, including model box constraints, potential boundary effects, manual soil compaction, and repeated loading without pile replacement, which may lead to a conservative estimate of seismic performance. Comparisons with previous studies [
24,
25] reveal consistent trends in acceleration, displacement, and bending moment responses, thereby reinforcing the validity of the present findings and underscoring the critical influence of pile group effects on the seismic behavior of variable-section pile foundations in liquefiable soils.
Although the shaking table tests provided valuable insights into the seismic response of large-diameter variable-section pile group foundations in liquefiable soils, several limitations should be acknowledged. The physical model inevitably simplifies in situ conditions and cannot fully reproduce the complex pile–soil interactions observed in the field, particularly those influenced by soil heterogeneities, layering effects, and construction imperfections. These simplifications, while necessary for experimental feasibility, may restrict the direct extrapolation of the findings to full-scale engineering applications.
Moreover, the present tests were designed based on the geological conditions of a specific site, which may limit the generalization of the results. To enhance transferability, future studies should incorporate broader parametric analyses involving different soil types, stratification patterns, pile geometries, and group arrangements. Such investigations would help establish more comprehensive design guidelines for pile foundations in various liquefiable environments.
Furthermore, advanced soil behaviors, including time-dependent degradation, large-strain effects, and post-liquefaction ground settlement, were not explicitly addressed in this study. These phenomena are crucial for understanding long-term seismic resilience and deformation recovery of pile foundations. Future research combining numerical simulations and hybrid experimental approaches will be undertaken to capture these aspects and improve the predictive accuracy of foundation performance under decisive seismic actions.
5. Conclusions
Based on the shaking table experiments on large-diameter variable-section single and group pile foundations in liquefiable sites at the Xiang’an Bridge, the following conclusions are drawn:
- (1)
Under seismic loads of 0.15–0.45 g, both pile types experience increasing pore pressure ratios, stabilizing around 0.86 at complete liquefaction. The rate of pore pressure accumulation is slower in the pile group foundation, indicating better drainage and resistance to liquefaction.
- (2)
The acceleration and displacement responses increase with seismic intensity. However, the maximum acceleration, horizontal displacement, and bending moment of the pile group are significantly lower than those of a single pile.
- (3)
The horizontal displacement at the pile top grows with seismic intensity, but the pile group shows smaller displacement amplitudes and delayed peaks, confirming the stabilizing effect of group-pile interaction.
- (4)
The maximum bending moment occurs at the interface between liquefied and non-liquefied layers. At 0.25 g, the peak bending moments are 62.08 kN·m (single pile) and 53.23 kN·m (pile group), indicating the improved flexural resistance of the pile group system.
- (5)
Fourier spectrum analysis reveals that the fundamental frequency of the single pile drops sharply at 0.35 g (by 52.90%), indicating structural damage. In contrast, the pile group remains stiff until 0.45 g, with only a 32.44% reduction in stiffness.
- (6)
Overall, the large-diameter variable-section pile group foundation demonstrates delayed liquefaction onset, reduced dynamic response, and superior anti-liquefaction capacity compared to single piles. The findings provide novel experimental evidence and design implications for optimizing pile foundation systems of cross-sea bridges in liquefaction-prone seismic regions.
Author Contributions
Conceptualization, Z.-J.F. and S.-H.Z.; software, C.Z.; validation, C.-C.Z. and S.-H.Z.; investigation, J.-K.W.; resources, S.-Q.W.; data curation, C.Z.; writing—original draft preparation, C.-C.Z. and C.Z.; writing—review and editing, Z.-J.F.; visualization, C.-C.Z.; supervision, C.Z.; project administration, J.-K.W.; funding acquisition, S.-Q.W. All authors have read and agreed to the published version of the manuscript.
Funding
This research received no external funding.
Data Availability Statement
The original contributions presented in this study are included in the article. Further inquiries can be directed to the corresponding author.
Conflicts of Interest
The authors declare no conflicts of interest.
References
- Zou, D.; Sui, Y.; Chen, K. Plastic damage analysis of pile foundation of nuclear power plants under beyond-design basis earthquake excitation. Soil Dyn. Earthq. Eng. 2020, 136, 106179. [Google Scholar] [CrossRef]
- Zhang, X.; Wang, S.; Liu, H.; Cui, J.; Liu, C.; Meng, X. Assessing the impact of inertial load on the buckling behavior of piles with large slenderness ratios in liquefiable deposits. Soil Dyn. Earthq. Eng. 2024, 176, 108322. [Google Scholar] [CrossRef]
- Chatterjee, K.; Choudhury, D.; Kumar, M. Influence of depth of liquefiable soil layer on dynamic response of pile group subjected to vertical load. Bull. Earthq. Eng. 2022, 20, 113–142. [Google Scholar] [CrossRef]
- Montoya-Noguera, S.; Lopez-Caballero, F. Effect of coupling excess pore pressure and deformation on nonlinear seismic soil response. Acta Geotech. 2016, 11, 191–207. [Google Scholar] [CrossRef]
- Feng, Z.; Li, D.; Zhang, C.; Xu, B.; Zhao, R.; Lai, J. Dynamic response characteristics of large-diameter variable-section monopile foundation on liquefied site under seismic action. Eng. Sci. Technol. 2025, 57, 237–247. [Google Scholar]
- Sun, L.; Xie, W. Evaluation of pile-soil-structure interaction effects on the seismic responses of a super long-span cable-stayed bridge in the transverse direction: A shaking table investigation. Soil Dyn. Earthq. Eng. 2019, 125, 105755. [Google Scholar] [CrossRef]
- Rajan, K.C.; Sharma, K.; Raychowdhury, P.; Acharya, I.P.; Burnwal, M.L.; Misra, J. State-of-the-art review of composite caisson-pile foundation (CCPF). Appl. Ocean Res. 2023, 136, 103571. [Google Scholar]
- Aghamolaei, M.; Saeedi Azizkandi, A.; Abolhasanpoor, A.; Hashemi, S. Influence of soil–pile interface characteristics on the seismic response of single pile foundations: Shaking table testing and numerical simulation. Acta Geotech. 2024, 19, 417–436. [Google Scholar] [CrossRef]
- Roy, S.D.; Pandey, A.; Saha, R. Shake table study on seismic soil-pile foundation-structure interaction in soft clay. Structures 2021, 29, 1229–1241. [Google Scholar]
- Hussein, A.F.; El Naggar, M.H. Seismic behavior of piles in non-liquefiable and liquefiable soil. Bull. Earthq. Eng. 2022, 20, 77–111. [Google Scholar] [CrossRef]
- Zhang, H.; Qian, D.; Shen, C.; Dai, Q. Experimental investigation on the dynamic response of pile group foundation on liquefiable ground subjected to horizontal and vertical earthquake excitations. Rock. Soil Mech. 2020, 41, 6. [Google Scholar]
- Li, Y.; Yan, Z.; Zhang, J. Study on centrifuge test and damage numerical model of seismic response of pile group foundation in liquefied site. Chin. J. Rock Mech. Eng. 2023, 42, 212–223. [Google Scholar]
- Chen, R.; Taiebat, M.; Wang, R.; Zhang, J. Effects of layered liquefiable deposits on the seismic response of an underground structure. Soil Dyn. Earthq. Eng. 2018, 113, 124–135. [Google Scholar] [CrossRef]
- Garala, T.; Madabhushi, G. Seismic behavior of soft clay and its influence on the response of friction pile foundations. Bull. Earthq. Eng. 2019, 17, 1919–1939. [Google Scholar] [CrossRef]
- Goh, S.; Zhang, L. Estimation of peak acceleration and bending moment for pile-raft systems embedded in soft clay subjected to far-field seismic excitation. J. Geotech. Geoenviron. Eng. 2017, 143, 04017082. [Google Scholar] [CrossRef]
- Feng, Z.; Guan, Y.; Lai, D.; Dong, Y.; Meng, Y.; Zhang, C. Nonlinear dynamic interaction characteristics of pile-soil-fault under strong earthquake. World Earthq. Eng. 2021, 37, 167–176. [Google Scholar]
- Cui, C.; Qi, Y.; Meng, K.; You, Z.; Liang, Z.; Xu, C. A new analytical solution for horizontal vibration of a floating pile in saturated soil based on the FSSP method. Soil Dyn. Earthq. Eng. 2024, 187, 108960. [Google Scholar] [CrossRef]
- Jia, K.; Xu, C.; El Naggar, M.H.; Zhang, X.; Du, X.; Dou, P.; Cui, C. Large-scale shake table testing of pile group-bridge model in inclined liquefiable soils with overlying crusts. Soil Dyn. Earthq. Eng. 2022, 163, 107555. [Google Scholar] [CrossRef]
- Hussien, M.N.; Tobita, T.; Iai, S.; Karray, M. Soil-pile-structure kinematic and inertial interaction observed in geotechnical centrifuge experiments. Soil Dyn. Earthq. Eng. 2016, 89, 75–84. [Google Scholar] [CrossRef]
- Ismail, M.S.; Ifayefunmi, O.; Mazli, A.H. Combined stability of cone-cylinder transition subjected to axial compression and external pressure. Thin-Walled Struct. 2020, 157, 107102. [Google Scholar] [CrossRef]
- Ismail, M.S.; Al-Attas, S.M.M.; Mahmud, J. Buckling behavior of steel dome cap design under external pressure. Int. J. Press. Vessel. Pip. 2024, 208, 105135. [Google Scholar] [CrossRef]
- Ismail, M.S.; Purbolaksono, J. Analysis using finite element method of the buckling characteristics of stiffened cylindrical shells. Aust. J. Struct. Eng. 2024, 26, 321–331. [Google Scholar] [CrossRef]
- Feng, Z.; Meng, Y.; Dong, Y.; Guan, Y.; Yin, J. Nonlinear Dynamic Interaction Characteristics of Pile-soil in Liquefaction Site under Strong Earthquake. Sci. Technol. Eng. 2021, 21, 7299–7307. [Google Scholar]
- Feng, Z.; Zhang, C.; He, J.; Dong, Y.; Yuan, F. Shaking table test of time-history response of rock socketed single pile under strong earthquake. Rock Soil Mech. 2021, 42, 3227–3237. [Google Scholar]
- Zhang, C.; Feng, Z.; Zhang, C.; Wang, F.; Wang, X. Study on the dynamic response and progressive damage mechanisms of variable-section pile foundations in liquefiable soil-rock media. Soil Dyn. Earthq. Eng. 2025, 196, 109466. [Google Scholar]
Figure 1.
Photo of Xiang’an Bridge location.
Figure 1.
Photo of Xiang’an Bridge location.
Figure 2.
H15 Pile foundation prototype: (a) Soil Layer Distribution Diagram, (b) Simplified stratigraphic diagram.
Figure 2.
H15 Pile foundation prototype: (a) Soil Layer Distribution Diagram, (b) Simplified stratigraphic diagram.
Figure 3.
Schematic diagram of the model box.
Figure 3.
Schematic diagram of the model box.
Figure 4.
Schematic diagram of the model pile: (a) Single pile, (b) Group piles.
Figure 4.
Schematic diagram of the model pile: (a) Single pile, (b) Group piles.
Figure 5.
Particle grading curve.
Figure 5.
Particle grading curve.
Figure 6.
5010 Seismic Waves.
Figure 6.
5010 Seismic Waves.
Figure 7.
Layout of Test Elements.
Figure 7.
Layout of Test Elements.
Figure 8.
Pore pressure ratio time history curves: (a) Single pile, (b) Group piles.
Figure 8.
Pore pressure ratio time history curves: (a) Single pile, (b) Group piles.
Figure 9.
Peak acceleration curves of the pile body: (a) Single pile, (b) Group piles.
Figure 9.
Peak acceleration curves of the pile body: (a) Single pile, (b) Group piles.
Figure 10.
Peak acceleration of pile top.
Figure 10.
Peak acceleration of pile top.
Figure 11.
Acceleration time history curves: (a) Single pile, (b) Group piles.
Figure 11.
Acceleration time history curves: (a) Single pile, (b) Group piles.
Figure 12.
Horizontal displacement of pile top.
Figure 12.
Horizontal displacement of pile top.
Figure 13.
Horizontal displacement time history curves.
Figure 13.
Horizontal displacement time history curves.
Figure 14.
Peak bending moment curves of the pile body: (a) Single pile, (b) Group piles.
Figure 14.
Peak bending moment curves of the pile body: (a) Single pile, (b) Group piles.
Figure 15.
Peak bending moment.
Figure 15.
Peak bending moment.
Figure 16.
Peak bending moment time history curves.
Figure 16.
Peak bending moment time history curves.
Figure 17.
Fourier spectrum: (a) 0.15 g, (b) 0.25 g, (c) 0.35 g, (d) 0.45 g, (e) 0.15 g, (f) 0.25 g, (g) 0.35 g, (h) 0.45 g.
Figure 17.
Fourier spectrum: (a) 0.15 g, (b) 0.25 g, (c) 0.35 g, (d) 0.45 g, (e) 0.15 g, (f) 0.25 g, (g) 0.35 g, (h) 0.45 g.
Figure 18.
Pictures of damage to the pile foundation: (a) Single pile, (b) Group piles.
Figure 18.
Pictures of damage to the pile foundation: (a) Single pile, (b) Group piles.
Figure 19.
Pile base frequency.
Figure 19.
Pile base frequency.
Table 1.
Technical parameters of the vibration table.
Table 1.
Technical parameters of the vibration table.
| Performance | Parameters |
|---|
| Table size | 5 m × 5 m |
| Frequency range | 0.5 Hz~50 Hz |
| Maximum model load | 30 t |
| Maximum Acceleration Amplitude | Full load 1.0 g in XY direction, 0.7 g in Z direction. |
| Maximum displacement amplitude | XY direction: ±80 mm, Z direction: ±50 mm. |
Table 2.
Physical quantity similarity constants.
Table 2.
Physical quantity similarity constants.
| Physical Quantity | Dimension | Similarity Constant |
|---|
| Acceleration a | LT−2 | 1 |
| Gravitational acceleration g | LT−2 | 1 |
| Velocity v | LT−1 | 501/2 |
| Linear size l | L | 1/50 |
| Elastic modulus E | FL−2 | 1/3.5 |
| Stress σ | FL−2 | 1/3.5 |
| Density ρ | FL−4T2 | 1 |
Table 3.
Model pile parameters.
Table 3.
Model pile parameters.
| Pile Materials | Pile Length/cm | Pile Diameter/cm | Rebar Rate |
|---|
| Micronized concrete | 90 | 5.0/4.3 | 2.4% |
Table 4.
Test conditions.
Table 4.
Test conditions.
| Number of Piles | Pile Length/cm | Pile Diameter/cm | Type of Seismic Wave | Seismic Intensity/g |
|---|
| 1, 6 | 90 | 5.0/4.3 | 5010 Seismic Waves | 0.15 g, 0.25 g, 0.35 g, 0.45 g |
| Disclaimer/Publisher’s Note: The statements, opinions and data contained in all publications are solely those of the individual author(s) and contributor(s) and not of MDPI and/or the editor(s). MDPI and/or the editor(s) disclaim responsibility for any injury to people or property resulting from any ideas, methods, instructions or products referred to in the content. |
© 2025 by the authors. Licensee MDPI, Basel, Switzerland. This article is an open access article distributed under the terms and conditions of the Creative Commons Attribution (CC BY) license (https://creativecommons.org/licenses/by/4.0/).
