Article

Transforming Construction Waste into High-Performance Alkali-Activated Paste with Microstructural and Predictive π Modelling Insights

1
Sustainable Environment and Energy Systems, Middle East Technical University, Northern Cyprus Campus, Guzelyurt 99738, Türkiye
2
Civil Engineering Program, Middle East Technical University, Northern Cyprus Campus, Guzelyurt 99738, Türkiye
*
Author to whom correspondence should be addressed.
Buildings 2025, 15(21), 3830; https://doi.org/10.3390/buildings15213830
Submission received: 16 September 2025 / Revised: 19 October 2025 / Accepted: 21 October 2025 / Published: 23 October 2025
(This article belongs to the Section Building Materials, and Repair & Renovation)

Abstract

The construction industry is among the most resource-intensive sectors, generating nearly 40% of global CO2 emissions and over two billion tonnes of construction and demolition waste (CDW) annually. This study investigates the sustainable reuse of CDW in developing binder-free alkali-activated paste (AAP) using sodium hydroxide (NaOH) as an activator. Eleven formulations were prepared by varying the brick-to-total waste ratio (BW/TW: 0–1), NaOH concentrations (0–10%), and curing durations (7, 28, and 60 days). The mixes were evaluated for unconfined compressive strength (UCS), shear modulus (Go), durability (wet–dry and freeze–thaw cycles), and microstructural evolution. Results showed significant improvements in mechanical and durability properties with increased NaOH content, BW/TW ratios up to 0.9, and longer curing times. The optimal mix (10% NaOH, BW/TW = 0.9, 60 days of curing) achieved a UCS of 28.7 MPa and a Go of 30 GPa, while exhibiting minimal mass loss (<2% freeze–thaw; <3% wet–dry). Microstructural analyses revealed densified matrices and enhanced gel formation. A dimensional analysis using the Buckingham π theorem yielded a scalable predictive model that correlates material composition, alkaline activation, and curing with mechanical performance. The study underscores the feasibility of transforming CDW into durable, high-performance AAPs for sustainable infrastructure development.

1. Introduction

The global population has surged from 2.5 billion in 1950 to over 8 billion in 2021, with projections suggesting it will approach 10 billion by 2050 [1,2]. This rapid demographic growth has accelerated urbanisation, resulting in more than half of the world’s population now residing in cities. This proportion is anticipated to rise to two-thirds by the middle of the century [1,2,3]. The number of megacities, defined as urban areas with populations exceeding 10 million, has increased significantly from 4 in 1975 to 29 in 2021, currently accommodating 471 million people, or 12% of the global urban population [2]. While the construction industry is a key driver of this urban expansion, it presents substantial environmental challenges. The sector accounts for approximately 30% of global carbon dioxide emissions and consumes 40% of the world’s energy, heavily relying on the extraction of raw materials [4,5]. In the European Union, nearly half of all extracted resources are dedicated to the construction sector [6]. Globally, 40% of the 100 billion tonnes of materials used each year are allocated to construction, with cement and steel production contributing 8% and 7–9% of total emissions, respectively [7,8,9]. Even sand is being overexploited, with an estimated 50 billion tonnes dredged each year for concrete production [10]. These figures highlight the unsustainable nature of the construction sector’s linear resource consumption model.
In rapidly expanding megacities, the scarcity of space often necessitates the demolition of ageing infrastructure. Furthermore, natural disasters such as earthquakes, floods, and landslides intensify the generation of construction and demolition waste (CDW) [11]. CDW arises from construction, renovation, demolition, and disaster recovery activities and contains a wide array of materials, including concrete, wood, metals, and plastics [12,13]. This material diversity makes CDW a significant component of the global solid waste stream. It is estimated that 2.24 billion tonnes of solid waste are produced annually, with CDW accounting for up to 40% of this total [14,15]. Within the European Union, CDW surpasses 850 million tonnes per year, with the construction sector responsible for 38.4% of total waste generation in 2022 [16]. Germany, the United Kingdom, and France stand out as the largest contributors among EU member states, producing approximately 85, 58, and 65 million tonnes of CDW annually, respectively [17]. In the United States, a total of 292 million tonnes of municipal solid waste (MSW) was recorded in 2018, while construction and demolition activities generated 600 million tonnes, more than double the volume of MSW [18]. In China, CDW output exceeds 2 billion tonnes each year, accounting for approximately 35% of total urban solid waste [19,20].
The composition of CDW varies significantly by region, reflecting differences in material availability and construction practices. In densely populated countries with a rich history of masonry, such as China, India, and many parts of Europe, CDW predominantly consists of concrete and brick. This trend is indicative of the widespread use of concrete infrastructure and brickwork, which are supported by clay-rich soils and rapid urbanisation [21,22]. In contrast, wood features more prominently in the CDW of temperate, forested regions, such as Scandinavia, Canada, Russia, and the northern United States. In these areas, abundant timber resources and well-established logging industries have fostered a preference for wood-based construction [23,24,25]. Despite these regional variations, studies consistently demonstrate that concrete, brick, and masonry materials constitute the majority of CDW across most countries. A summary of this general trend is provided in Table 1.
CDW presents significant environmental challenges due to its large-scale accumulation and ongoing dependence on landfilling. However, it also offers considerable potential for sustainable reuse within the framework of circular economy principles. CDW can be repurposed for various construction applications, underscoring its high recycling value. Recycled aggregates derived from CDW are utilised in both structural and non-structural elements, including recycled aggregate concrete, mortar formulations, and precast components such as paving blocks and masonry units [31]. Additionally, CDW has been explored as a Supplementary Cementitious Material (SCM), either as a partial substitute or performance enhancer for conventional cement-based binders [32]. In particular, ceramic-based CDW has demonstrated promise as both a recycled aggregate and an alkali-activated precursor in mortars, replacing natural aggregates and cement [33]. Innovative geotechnical applications have also surfaced. Alkali-activated stabilised earth materials incorporating CDW aggregates have been developed using waste-derived binders [34]. In the context of deep soil mixing, partial cement replacement with CDW significantly enhanced the strength of clayey soils by up to 2.5 times and improved the stiffness of peat soils [35]. Alkali-activated brick dust from CDW resulted in an increase in soil compressive strength by 1.7 to 2.3 times in subgrade reinforcement, while CDW–soil mixtures enabled pavement thickness reductions exceeding 7% [36,37]. Furthermore, the combination of CDW with polypropylene fibres in sulfate- and alkali-activated cement-stabilised soil has been shown to enhance mechanical performance under aggressive environmental conditions [38]. These diverse applications are summarised in Table 2, which includes additive types, activation conditions, strength outcomes, and end uses.
Recent studies further underline the technical viability of CDW-based materials. Manzi et al. [39] developed geopolymer mortars using CDW, achieving compressive strengths of 15–20 MPa at replacement levels of 12.5–25%, despite some strength loss attributable to adhered mortar layers. Another study [40] reported compressive strengths exceeding 25 MPa and good workability in mortars and concrete formulated with CDW-derived sands. Peixoto et al. [41] demonstrated that up to 30% replacement with recycled fine aggregates from CDW could achieve compressive strengths of 44.9 MPa. Additionally, Maaze and Shrivastava [42] optimised geopolymer bricks utilising recycled concrete powder, identifying that NaOH molarity and curing temperature significantly influenced both strength and durability. These findings reinforce the suitability of CDW fines, especially those derived from brick and concrete, as effective precursors in alkali-activated systems. This aligns with the focus of the present study on binder-free formulations that incorporate optimised BW/TW ratios and alkaline dosages.
Table 2. Applications of CDW in different areas.
CDW TypeAdditiveOptimal ConditionsActivatorStrength (MPa)ApplicationReferences
Mixed CDWNone25 °C, 60 days,
AAS100% a (undiluted)
NaOH + Na2SiO3UCS: 4
Tensile: 0.8
Base/Subbase Pavement Layers[43]
Recycled Concrete None25 °C, 28 days
AAS100% (undiluted)
NaOH + Na2SiO3UCS: 0.2
Flexural: 0.1
Base/Subbase Pavement Layers[44]
Recycled AsphaltUCS: 7.9
Flexural: 4.5
Brick and TilesUCS: 2.1
Flexural: 0.5
Unselected AggregatesUCS: 12.8
Flexural: 4.9
Crushed BrickFA b25 °C, 7 days
Si/Na = 2.5,
(16% FA)
NaOH + Na2SiO3UCS: 1.2 Base/Subbase Pavement Layers[45]
Recycled Concrete AggregatesUCS: 2.1
Reclaimed Asphalt PavementUCS: 2.0
Mixed CDWNone39 °C, 21 days
10 M NaOH
NaOH, KOH, CaOBearing Capacity: 568 kPaSoil Improvement[46]
Brick WasteNone40–50 °C, 28 days
RH ≈ 59%
Lime Residue, NaOHUCS: 1.7–2.3× vs. non-stabilised.Soil Stabilization[36]
Mixed CDW10% OPC c25 °C, RH ≈ 80%,
90 days, Si/Na = 0.34
NaOH + Na2SiO3UCS: 44 MPaBinder, Concrete, Structural Blocks[47]
Ceramic Tile Wastes15% OPC25 °C, 90 days,
Si/Al = 7.0, Na/Si = 0.08
NaOH + Na2SiO3UCS: 58 MPa (paste, 28 days)Binder and Mortars[48]
UCS: 30 MPa (mortar, 90 days)
Ceramic Tile Waste 5% Ca (OH)265 °C, 7 days,
RH ≈ 95%, w/b = 0.50
NaOH + Na2SiO3UCS: 43 MPa (3 days at 65 °C)Binder and Mortars[33]
Mixed CDW (Concrete, Ceramic, Masonry)10% OPC/Ca(OH)225 °C Na/Si = 0.25
L/S = 0.30
NaOH + Na2SiO3UCS: 32 MPa (90 days at 25 °C)Hybrid Cement[49]
Brick PowderFA21 °C, 90 days
Si/Na = 1.6
NaOH + Na2SiO3UCS: 70 MPaBinder[50]
Brick Powder and Ceramic SandGGBFS d (0–50%)25 °C,56 days
95% RH, Si/Na = 1.5
NaOH + Na2SiO3UCS: 93 MPaMortar/Concrete Applications[51]
Concrete WasteNone90 °C, 7 days
NaOH (14 M)
NaOHUCS: 13 MPaInsulating Materials/Coatings[52]
Brick Waste90 °C, 7 days,
NaOH (8 M)
UCS: 49 MPaInsulating Materials/Coatings
Tile Waste80 °C, 7 days
NaOH (10 M)
UCS: 58 MPaLimited Structural Use
Waste red BrickFA + GGBFS25 °C & RH = 65%,
L/B = 0.45, Si/Na = 1.1
NaOH + Na2SiO3UCS: 70 MPaHigh-Strength Paste Applications[53]
Waste CeramicFA + GGBFS25 °C & RH = 65%,
L/B = 0.45, Si/Na = 1.2
NaOH + Na2SiO3UCS: 60 MPaHigh-Strength Paste Applications
a AAS: Alkali Activating Solution. b FA: Fly Ash. c OPC: Ordinary Portland Cement. d GGBFS: Ground Granulated Blast Furnace Slag.
Alkali activation is increasingly recognised as a sustainable method for converting CDW into high-performance construction materials, such as geopolymers. This approach offers significant environmental benefits, including reduced reliance on landfilling and lower greenhouse gas emissions compared to traditional Portland cement production [54]. The effectiveness of CDW in geopolymerisation is largely due to its widespread availability and high silica and alumina content, which make it a suitable precursor material [55,56,57]. Geopolymerisation, the central mechanism of alkali activation, is a multi-step chemical process that transforms aluminosilicate-rich CDW into durable binding matrices [58,59]. The process begins with the dissolution of amorphous aluminosilicate phases found in materials like bricks and concrete using high-pH alkaline solutions. Common chemical activators include sodium hydroxide (NaOH) and sodium silicate (Na2SiO3) [60,61]. Under alkaline conditions, Si-O and Al-O bonds undergo hydrolysis, releasing silicate (SiO44−) and aluminate (AlO45−) monomers into the solution [58,62]. These monomers then interact with hydroxyl and silicate ions from the activator, leading to the formation of oligomers [63,64]. Through polycondensation, these oligomers reorganise into a three-dimensional aluminosilicate network, and subsequent dehydration leads to strength development and solidification [57]. The calcium content of the precursor influences the final gel structure. Calcium-rich CDW, such as concrete, tends to form calcium aluminosilicate hydrate (C-A-S-H) gels [65,66], while low-calcium materials like brick promote the formation of sodium aluminosilicate hydrate (N-A-S-H) gels [67]. The simultaneous presence of multiple reactive species in the alkaline environment results in a series of complex, interacting reactions. This chemical complexity sets geopolymerisation apart from the relatively straightforward hydration reactions of ordinary Portland cement (OPC) [68].
The alkaline activator and the SiO2/Na2O ratio play crucial roles in dissolving precursor materials and forming binding gels. Optimising the molarity of NaOH is essential. For instance, ferronickel slag activated with 8M NaOH achieved a compressive strength of 99 MPa, whereas lower concentrations (6M) and higher concentrations (10M) resulted in decreased strengths due to insufficient and excessive alkalinity, respectively [69]. In fly ash-slag systems, a SiO2/Na2O modulus of approximately 1.4 maximises strength by ensuring adequate silicate availability for cross-linking. Ratios below this threshold diminish the Si/Al ratio, while higher ratios hinder sodium ion mobility and disrupt gel formation [70]. The choice of alkali also influences reaction kinetics and the properties of the gel. ATR-FTIR analysis suggests that LiOH induces slow dissolution and produces weaker gels, while KOH facilitates rapid dissolution and leads to surface efflorescence. In contrast, NaOH provides a balanced reactivity and forms dense N-A-S-H gels with superior mechanical performance [71]. Furthermore, thermal curing conditions significantly impact the geopolymerization process. For example, ferronickel slag cured at 80 °C for 24 h reached a compressive strength of 99 MPa, while lower temperatures delayed gel development. Mixed masonry waste cured at 125 °C for 3 days outperformed samples cured at 95 °C due to reduced microstructural instability [72]. Additionally, prolonged curing promotes gel densification. In one study, the compressive strength of CDW paste increased from 8.8 MPa at 1 day to 43.9 MPa at 90 days, representing a remarkable 397% improvement [47].
In addition to experimental methods, the behaviour of geopolymers is increasingly analysed using predictive tools such as artificial intelligence (AI), machine learning (ML), and dimensional analysis (DA). These tools help to reduce both the time and cost associated with laboratory testing [73,74]. Grounded in the Buckingham π theorem, DA converts complex systems into dimensionless π-groups, ensuring dimensional consistency and facilitating physical interpretability [75]. Its effectiveness has been demonstrated in predicting material properties, such as the 28-day compressive strength of 53-grade cement, by using only two calibration points to develop a universal power-law model [76]. In fly ash-based geopolymers, DA has enabled the creation of π-groups that incorporate parameters like the SiO2/Al2O3 ratio and curing time, allowing for strength predictions across various conditions [77]. Rayleigh-based dimensional analysis has also been applied to asphalt mixtures, effectively reducing experimental demands by consolidating governing variables into simplified forms [78]. The applications of DA also extend to geotechnical engineering. It has been utilised to predict the load–settlement behaviour of soft clays under compression [79] and to assess the compressive strength of brick masonry by linking the properties of brick and mortar [80]. In structural applications, DA has been integrated with neural networks to estimate beam failure loads based on shear strength parameters [81]. A recent review has confirmed that many ML and statistical models incorporate DA to predict geopolymer compressive strength with a high degree of reliability [82].
The construction industry is under growing pressure to adopt sustainable alternatives to OPC, which is a significant contributor to global carbon dioxide emissions [8]. While alkali-activated materials incorporating fly ash (FA) [45,50,53] and blast furnace slag (BFS) [51,53] offer environmental benefits, their dependence on industrial by-products restricts their scalability and regional applicability. Research focusing on using CDW as the sole precursor has been limited, often concentrating on low-value applications, such as subbase layers or soil stabilisation [36,43,44,46]. This study aims to fill this gap by developing high-performance alkali-activated pastes (AAPs) composed entirely of CDW, specifically brick waste and concrete waste. NaOH serves as the alkaline activator, while CDW acts as both the binder and aggregate, thus replacing traditional cement and natural sand in mortar formulations. A comprehensive experimental program was conducted to assess mechanical strength, durability, and microstructural characteristics. Empirical models were created to predict unconfined compressive strength and shear modulus based on binder ratios and NaOH concentration. DA was utilised to ensure physical consistency and generalizability across different mix designs and curing conditions. This integrated experimental and modelling approach highlights the technical feasibility of CDW-based AAPs and supports their use in sustainable construction, contributing to material circularity and reducing environmental impact.

2. Research Framework

The experimental methodology is schematically outlined in Figure 1, detailing the progression from CDW sourcing at disposal sites through material recovery via separation from construction debris, followed by its valorisation in AAP’s synthesis. The subsequent evaluation phase includes mechanical characterisation through unconfined compressive strength (UCS) and ultrasonic pulse velocity (UPV) testing, durability assessment via freeze–thaw and wet–dry cycles, and microstructural characterisation using scanning electron microscopy (SEM) and X-ray diffraction (XRD) analysis. Following a systematic evaluation, the collected data undergo a post-test analytical phase involving the interpretation of structural performance metrics.

3. Materials and Methods

3.1. Materials

The CDW analysed in this research was obtained from a landfill located adjacent to Famagusta, Cyprus, situated at the geographic coordinates (35°08′28″ N, 33°52′30″ E), as shown in Figure 2a. Satellite imagery of the site reveals an expansive, irregularly shaped terrain characterised by heterogeneous material deposits, indicating ongoing waste deposition and reorganisation over time. A distinctive lighter grey zone within the landfill corresponds to concentrated accumulations of construction waste, including concrete rubble, brick fragments, and other inert construction residues, which form the dominant waste profile. The site’s composition profile provides a reliable source of recyclable CDW and presents an opportunity to incorporate underutilised urban waste streams into strategies for a circular economy.
The CDW disposed of at the site exhibited a heterogeneous composition, primarily consisting of three dominant material types, concrete waste (CW), brick waste (BW), and excavated soil, as illustrated in Figure 2b. Concrete debris was the most prevalent material, ranging from gravel-sized fragments to large structural elements, including slabs, beams, and columns that contained embedded reinforcement bars. Brick fragments, often coated with residual mortar, were the second most abundant component, contributing to the overall variability of the waste stream. Excavated soil, mixed with fine particles and small construction debris, accounted for a significant portion of the landfill. Minor quantities of recyclable materials, including ferrous and non-ferrous metals, fragmented wood, and deteriorated cardboard, were also scattered throughout the site. To address the mixed nature of the waste, a targeted manual sorting procedure was implemented to isolate CW and BW. This hands-on approach minimised contamination from non-target materials such as soil, metals, and organic matter, thus ensuring the purity of the selected specimens for material characterisation. Structural elements, including beams and columns, were chosen as the source of CW due to their higher cement content and critical load-bearing function. These components, typically rectangular or square in cross-section and visibly reinforced, were identified as originating from the building’s structural frame. For BW, clay bricks characterised by their reddish-brown colour were collected. Only bricks with minimal mortar adherence were selected to maintain material purity. After collection, CW and BW were transferred into buckets and taken to the laboratory, where they were stored under controlled conditions for subsequent experimental procedures.
In the laboratory, a sequential pretreatment procedure was implemented to purify the BW and CW prior to experimental use, reflecting the standard processes carried out in CDW processing facilities [83]. Initial mechanical brushing (using a hard wire brush) was performed to remove loose particulate contaminants, including residual mortar, soil, and organic matter. Subsequently, the materials underwent aqueous washing to weaken the adhesive bonds between the waste materials and hardened residues, a technique similarly recommended in a review paper [84]. A secondary brushing phase was followed to eliminate remaining surface impurities, ensuring maximal removal of non-target substances that could compromise material homogeneity. To prevent interference from residual moisture in subsequent procedures, the samples were first dried in an oven at 105 °C for 24 h to remove bulk water [84,85]. Afterwards, the samples underwent air drying under ambient laboratory conditions, allowing the samples to reach equilibrium with the surrounding humidity and remove any remaining hygroscopic moisture.
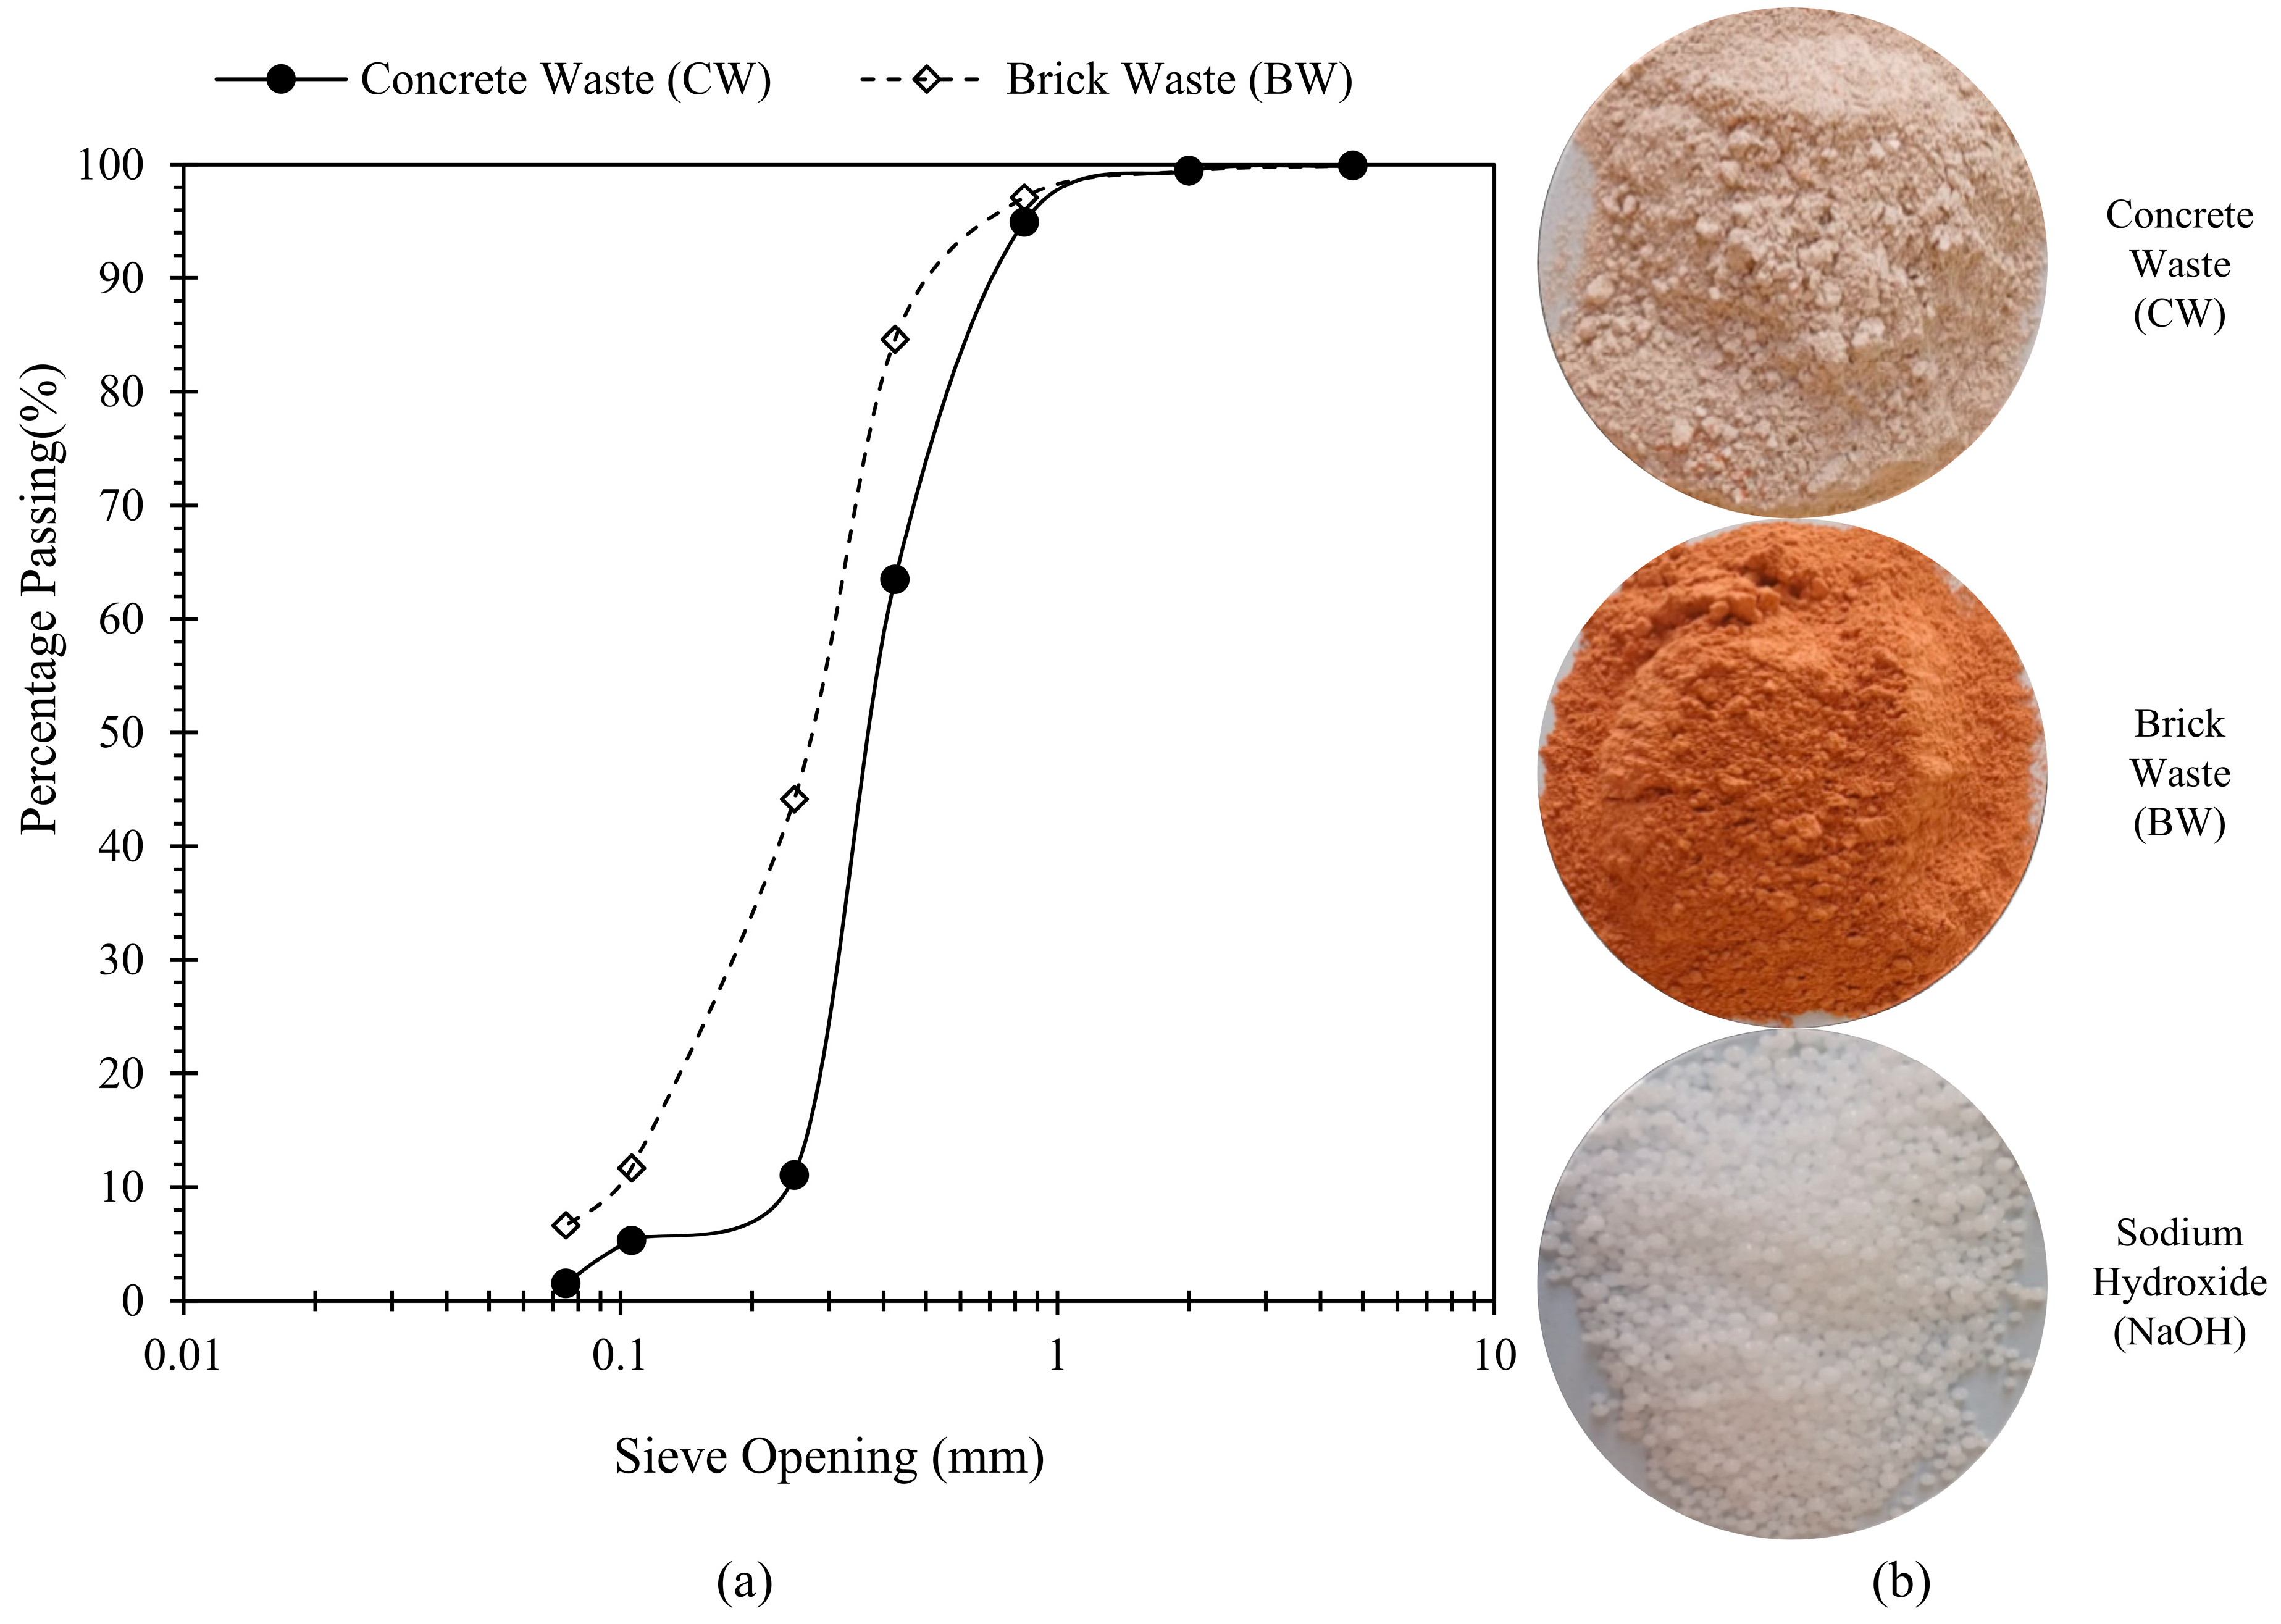
To accommodate the operational limits of the Los Angeles abrasion machine, coarse CW fragments were manually reduced to sizes ranging from 20 to 50 mm. This adjustment facilitated efficient milling and allowed for the manual removal of embedded steel rebar, in accordance with established practices [86]. In contrast, BW, being composed of smaller, more manageable pieces, was processed directly. Both materials were milled and sieved to isolate the <75 µm fraction, which served exclusively as the reactive precursor for alkali activation in this study. Although only the sub-75 µm fines were utilised in the mix designs (Figure 3b), a particle size distribution (PSD) analysis of the raw, unprocessed materials (Figure 3a) was conducted [87] to characterise their initial properties. BW displayed a finer gradation (D50 = 0.27 mm) and a narrower distribution compared to CW (D50 = 0.37 mm), indicating greater homogeneity and a higher content of fines. The broader PSD of CW reflects the heterogeneous, aggregate-rich nature of concrete debris. It is important to note that the PSD curves are presented solely for the purpose of characterising the inherent granulometric differences between the raw waste materials and should not be interpreted as indicative of their suitability as sand substitutes in the mix design. Following sieving, the <75 µm fractions were thermally activated at 70 °C for 24 h to remove moisture and enhance reactivity. Any oversized particles were re-milled to ensure uniform fineness. Table 3 compares the physical properties of CW and BW. CW exhibited a higher specific gravity (2.48, compared to BW 2.14), indicative of its denser quartz- and cement-rich matrix.
NaOH, a white, odourless, deliquescent solid characterised by its high solubility and exothermic dissolution in water, was procured in pellet form (99% purity) from a local chemical supplier, as shown in Figure 3b. The compound’s enthalpy of solution (−44.5 kJ/mol) was crucial to facilitate rapid dissolution during alkaline activator preparation, while its hygroscopic nature required airtight storage to prevent moisture absorption from the atmosphere.
X-ray fluorescence (XRF) spectroscopy revealed distinct compositional profiles for CW and BW, reflecting their origins and material behaviour, as reflected in Table 4. CW exhibited a calcium-rich profile dominated by CaO (53%) and CO2 (31%). The dominance of CaO highlights the prevalence of calcium silicate hydrate (C-S-H) phases and calcium hydroxide (Ca (OH)2) residues, typical of hydrated cement. This high calcium content is characteristic of OPC. The high CO2 content indicates significant carbonation of calcium-bearing phases (Ca (OH)2 → CaCO3), a standard process in aged concrete exposed to atmospheric CO2. In contrast, BW displayed a silicate-rich profile, characterised by elevated silica (32.6%), alumina (10.5%), and iron oxide (7.6%), reflecting its derivation from clay-derived material. Differences were also observed in minor constituents: CW contained higher magnesium oxide (6%), whereas BW showed enriched potassium oxide (1.4%). These compositional differences highlight CW as a potential calcium source (reflecting the calcareous nature of Portland cement) for alkali-activated systems, whereas BW aligns with aluminosilicate-rich precursors, which are more suitable for geopolymer synthesis.

3.2. Preparation and Moulding

3.2.1. Preparation of Alkaline Solution

The AAPs were prepared using a two-step process: formulation of the alkaline activator, followed by mixing with precursor materials (brick waste and concrete waste). NaOH pellets (99% purity) were dissolved in tap water to create activator solutions at 5, 7, and 10 wt.% concentrations, corresponding to 10 g, 14 g, and 20 g of NaOH per 200 g of precursor. A fixed water-to-solid (w/s) ratio of 0.27, determined through preliminary trials and literature [49,53], required 54 g of water per sample. To prevent localised heating and crystallisation, NaOH pellets were added gradually with continuous stirring. The prepared solution was sealed and left to equilibrate at room temperature (23 ± 2 °C) for 6 h. This step allowed excess heat to dissipate and reduced atmospheric CO2 uptake, which could otherwise lower alkalinity through the formation of carbonates. The cooled solution ensured thermal compatibility with the precursors during the mixing process.

3.2.2. Preparation of Mortar Blends

CDW AAPs were prepared using weight-based binary blends of BW and CW. The composition is expressed using the brick-to-total waste ratio (BW/TW); for example, a BW/TW of 0.5 corresponds to a 50% brick and 50% waste mix. Dry precursors were homogenised mechanically in accordance with ASTM C305 [88] to ensure uniform particle distribution. The pre-cooled NaOH solution was then added gradually under continuous manual mixing, with a total mixing time of 5 min to ensure uniform consistency and a workable rheology, as per ASTM C305 [88]. The fresh AAP was cast into 50 × 50 × 50 mm cube moulds using a three-gang steel mould compliant with ASTM C109 [89]. Moulds were pre-lubricated with a silicone-based release agent. The paste was poured in three layers, each compacted using 32 strokes of a stainless-steel tamping rod, followed by vibration on an electric table to eliminate entrapped air and enhance layer bonding. Specimens were immediately covered to minimise moisture loss during the initial setting phase.

3.2.3. Curing of Mortar Blends

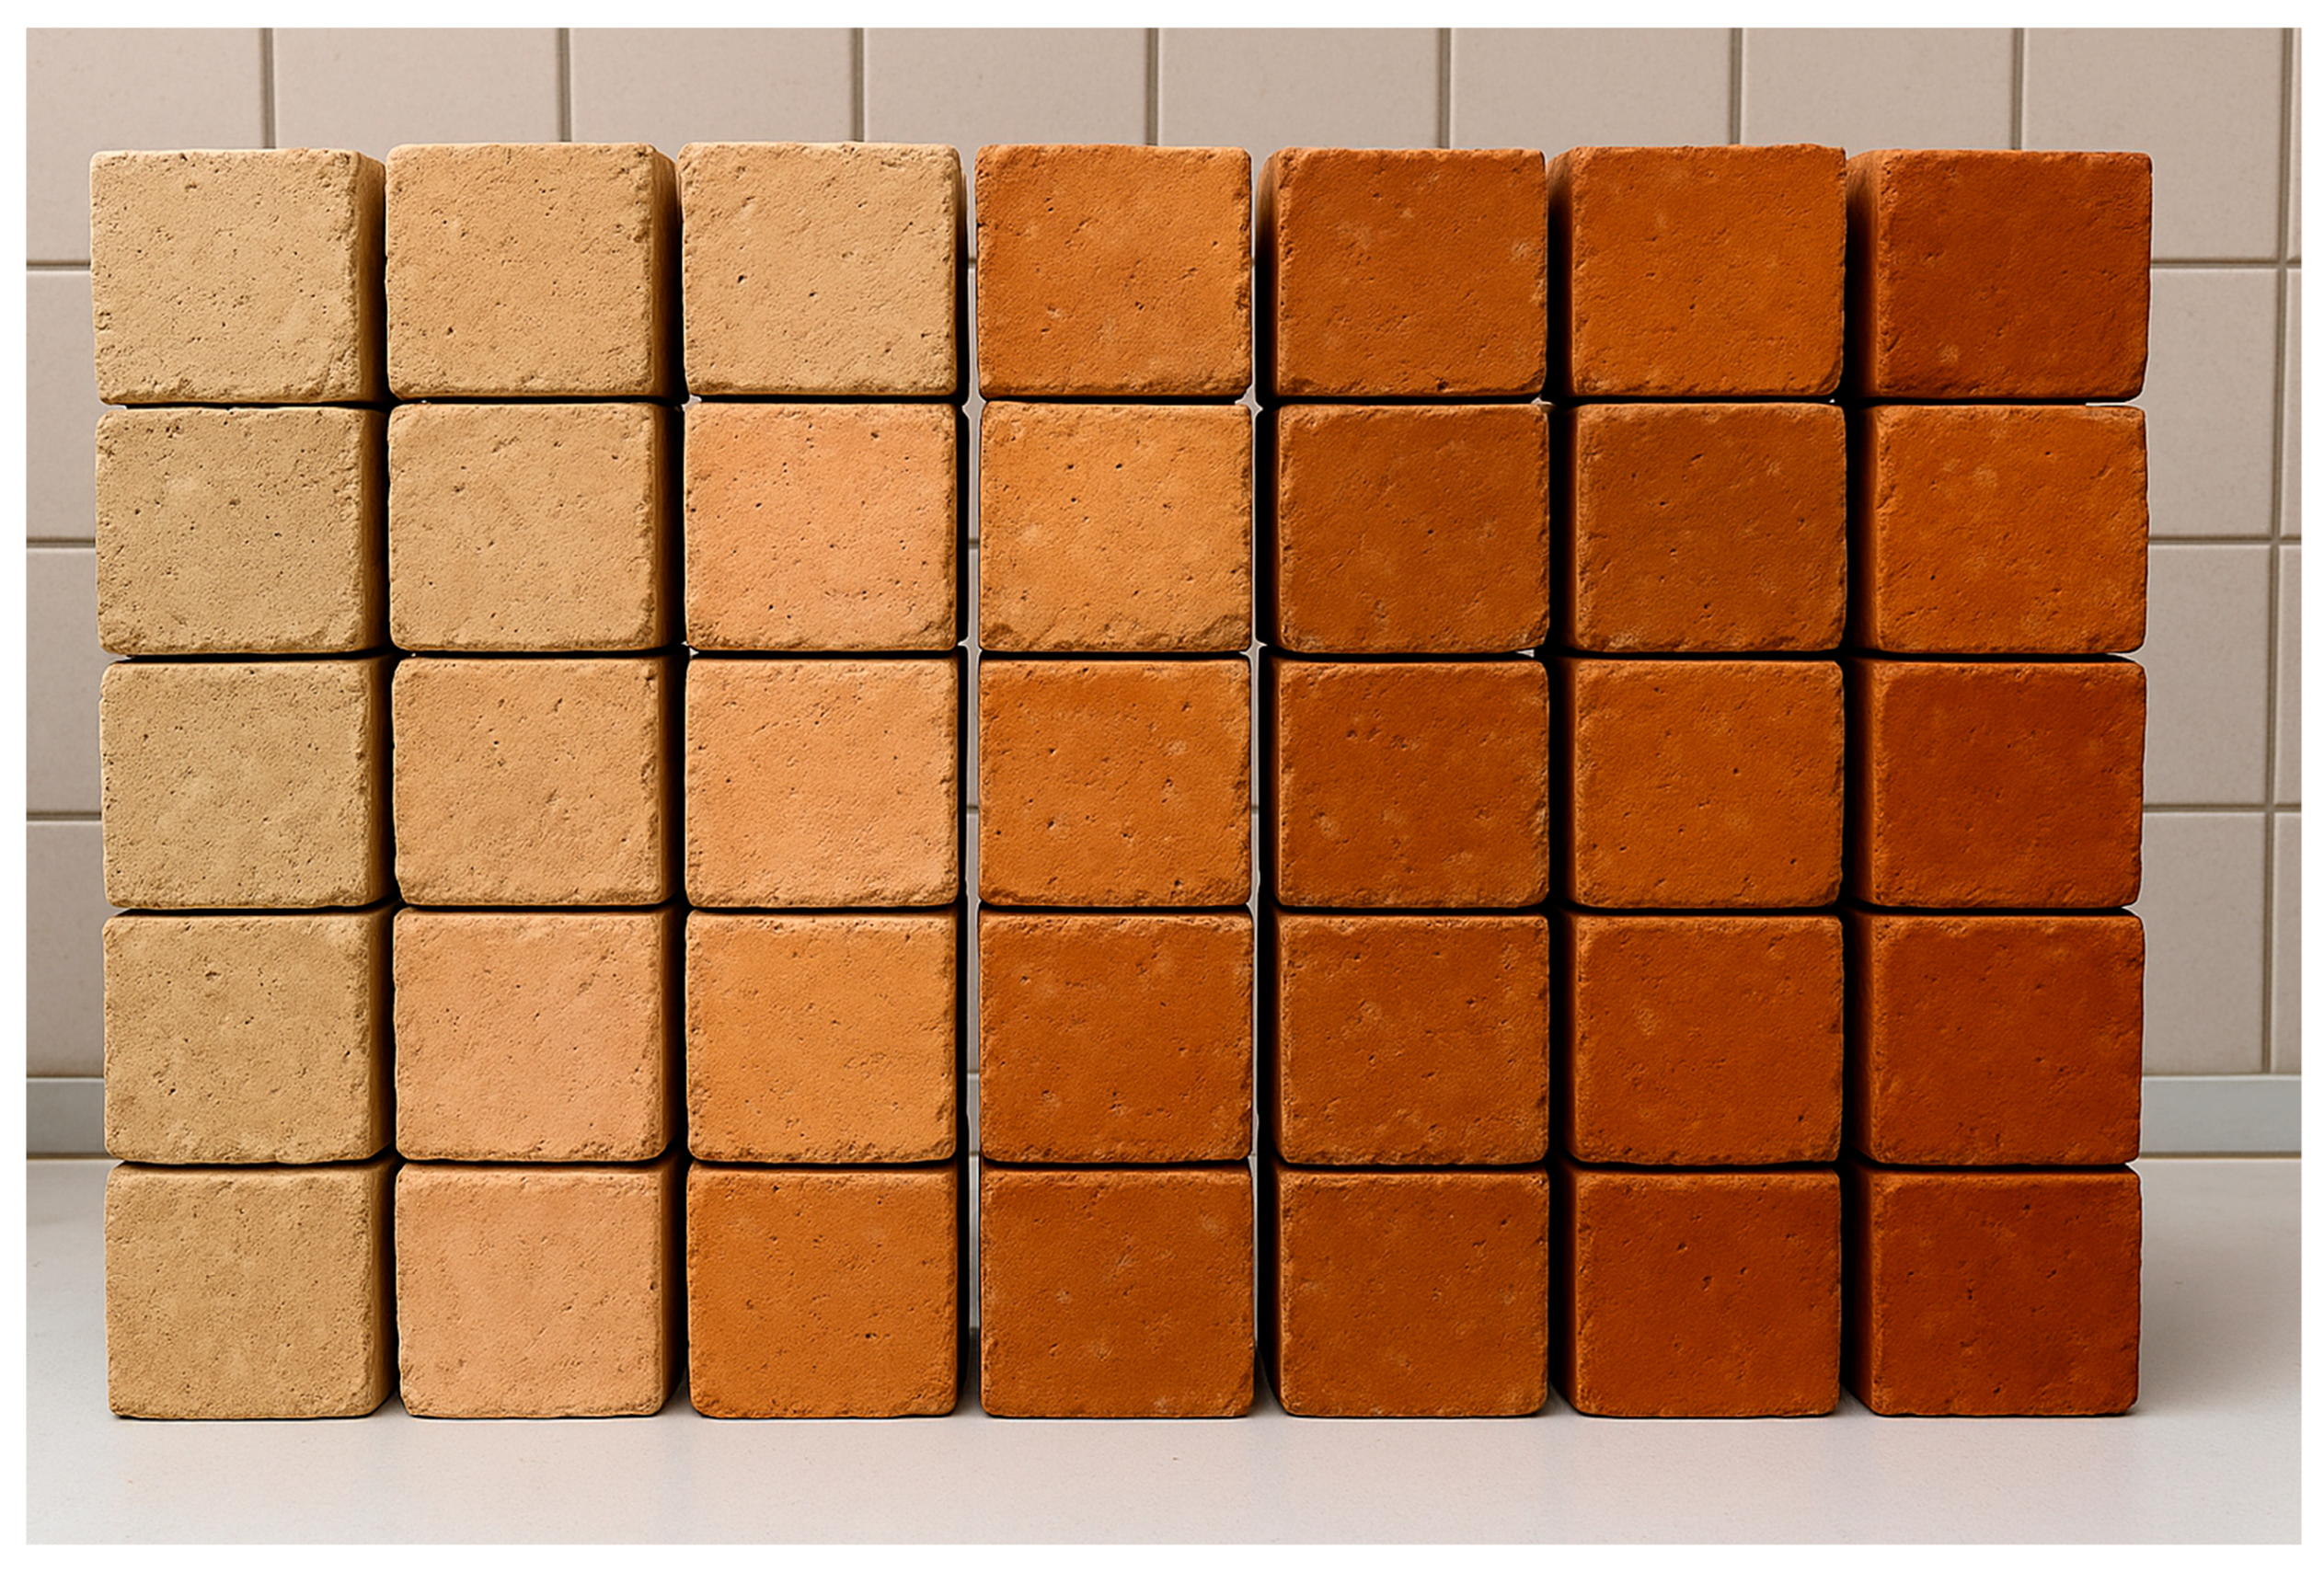
After casting, the moulds were sealed with non-absorbent polyethene film to minimise moisture loss and carbonation. Specimens were initially cured under ambient laboratory conditions (25 ± 1 °C) for 24 h to develop sufficient green strength for demoulding. After demoulding, the samples were transferred to a climate-controlled curing chamber (23 ± 2 °C, 90 ± 5% relative humidity) in accordance with ASTM C109 guidelines [89]. Curing durations were set at 7, 28, and 60 days. Upon completion of curing, specimens were measured for dimensions and weight. As shown in Figure 4, the cubes exhibited a visible colour gradient from light grey (pure CW) to dark brown (pure BW), corresponding to increasing BW/TW ratios. This chromatic shift reflects the higher iron oxide (Fe2O3) content in brick waste, which becomes dominant at BW/TW ratios above 0.5, producing a uniform reddish-brown hue that visually distinguishes BW-rich formulations.

3.2.4. Experimental Regime of AAP Blends

For each BW/TW ratio, a total of four specimens were prepared. Of these, two specimens were designated for mechanical testing. UPV measurements were taken non-destructively, followed by UCS testing on the same samples. The remaining two specimens were allocated for durability evaluation: one was subjected to wet–dry cycling and the other to freeze–thaw testing. This systematic allocation ensured that each mix design was uniformly represented across both mechanical and durability testing regimes. In total, 528 specimens were fabricated, corresponding to 44 unique mix designs, which included 11 BW/TW ratios and 4 NaOH dosages. Each mix was tested at three different curing ages, 7, 28, and 60 days, with four specimens per mix per curing age. A summary of the specimen preparation and testing regime is provided in Table 5.

3.3. Methods

3.3.1. Unconfined Compressive Strength

UCS tests were conducted to evaluate the mechanical performance of the AAPs. Prior to testing, samples were submerged in water for 24 h to achieve moisture equilibrium and then surface-dried to ensure accurate measurement of mass and dimensions. UCS tests were carried out in accordance with ASTM C109 [89] using a computer-controlled universal testing machine (UTM) fitted with a 1000 kN load cell (UTEST, Ankara, Türkiye). A constant displacement rate of 1 mm/min was applied until failure occurred. Two specimens per mix were tested, and the average value was reported.

3.3.2. Ultrasonic Pulse Velocity

UPV tests were performed in accordance with ASTM C597 [90] to assess the dynamic elastic properties of the mortars. A PUNDIT device (MATEST C368, Treviolo, Italy) equipped with 100 kHz piezoelectric transducers was used. Transducers were placed on opposite faces of each cube and coupled with silicone gel to ensure proper acoustic transmission. Measurements were taken across three orthogonal directions (X-Y, Y-Z, and X-Z) to account for material anisotropy, and the average shear wave velocity (Vs) was determined. The initial shear modulus (Go) was then calculated using Equation (1).
G o = ρ   V s 2
where ρ is the density of the sample, and the ρ of the sample was calculated using the mass of each sample. Prior to performing the UCS test, the mass of each sample was recorded, and the volume of the sample was maintained constant at 125 cm3.

3.3.3. Wet and Dry Durability

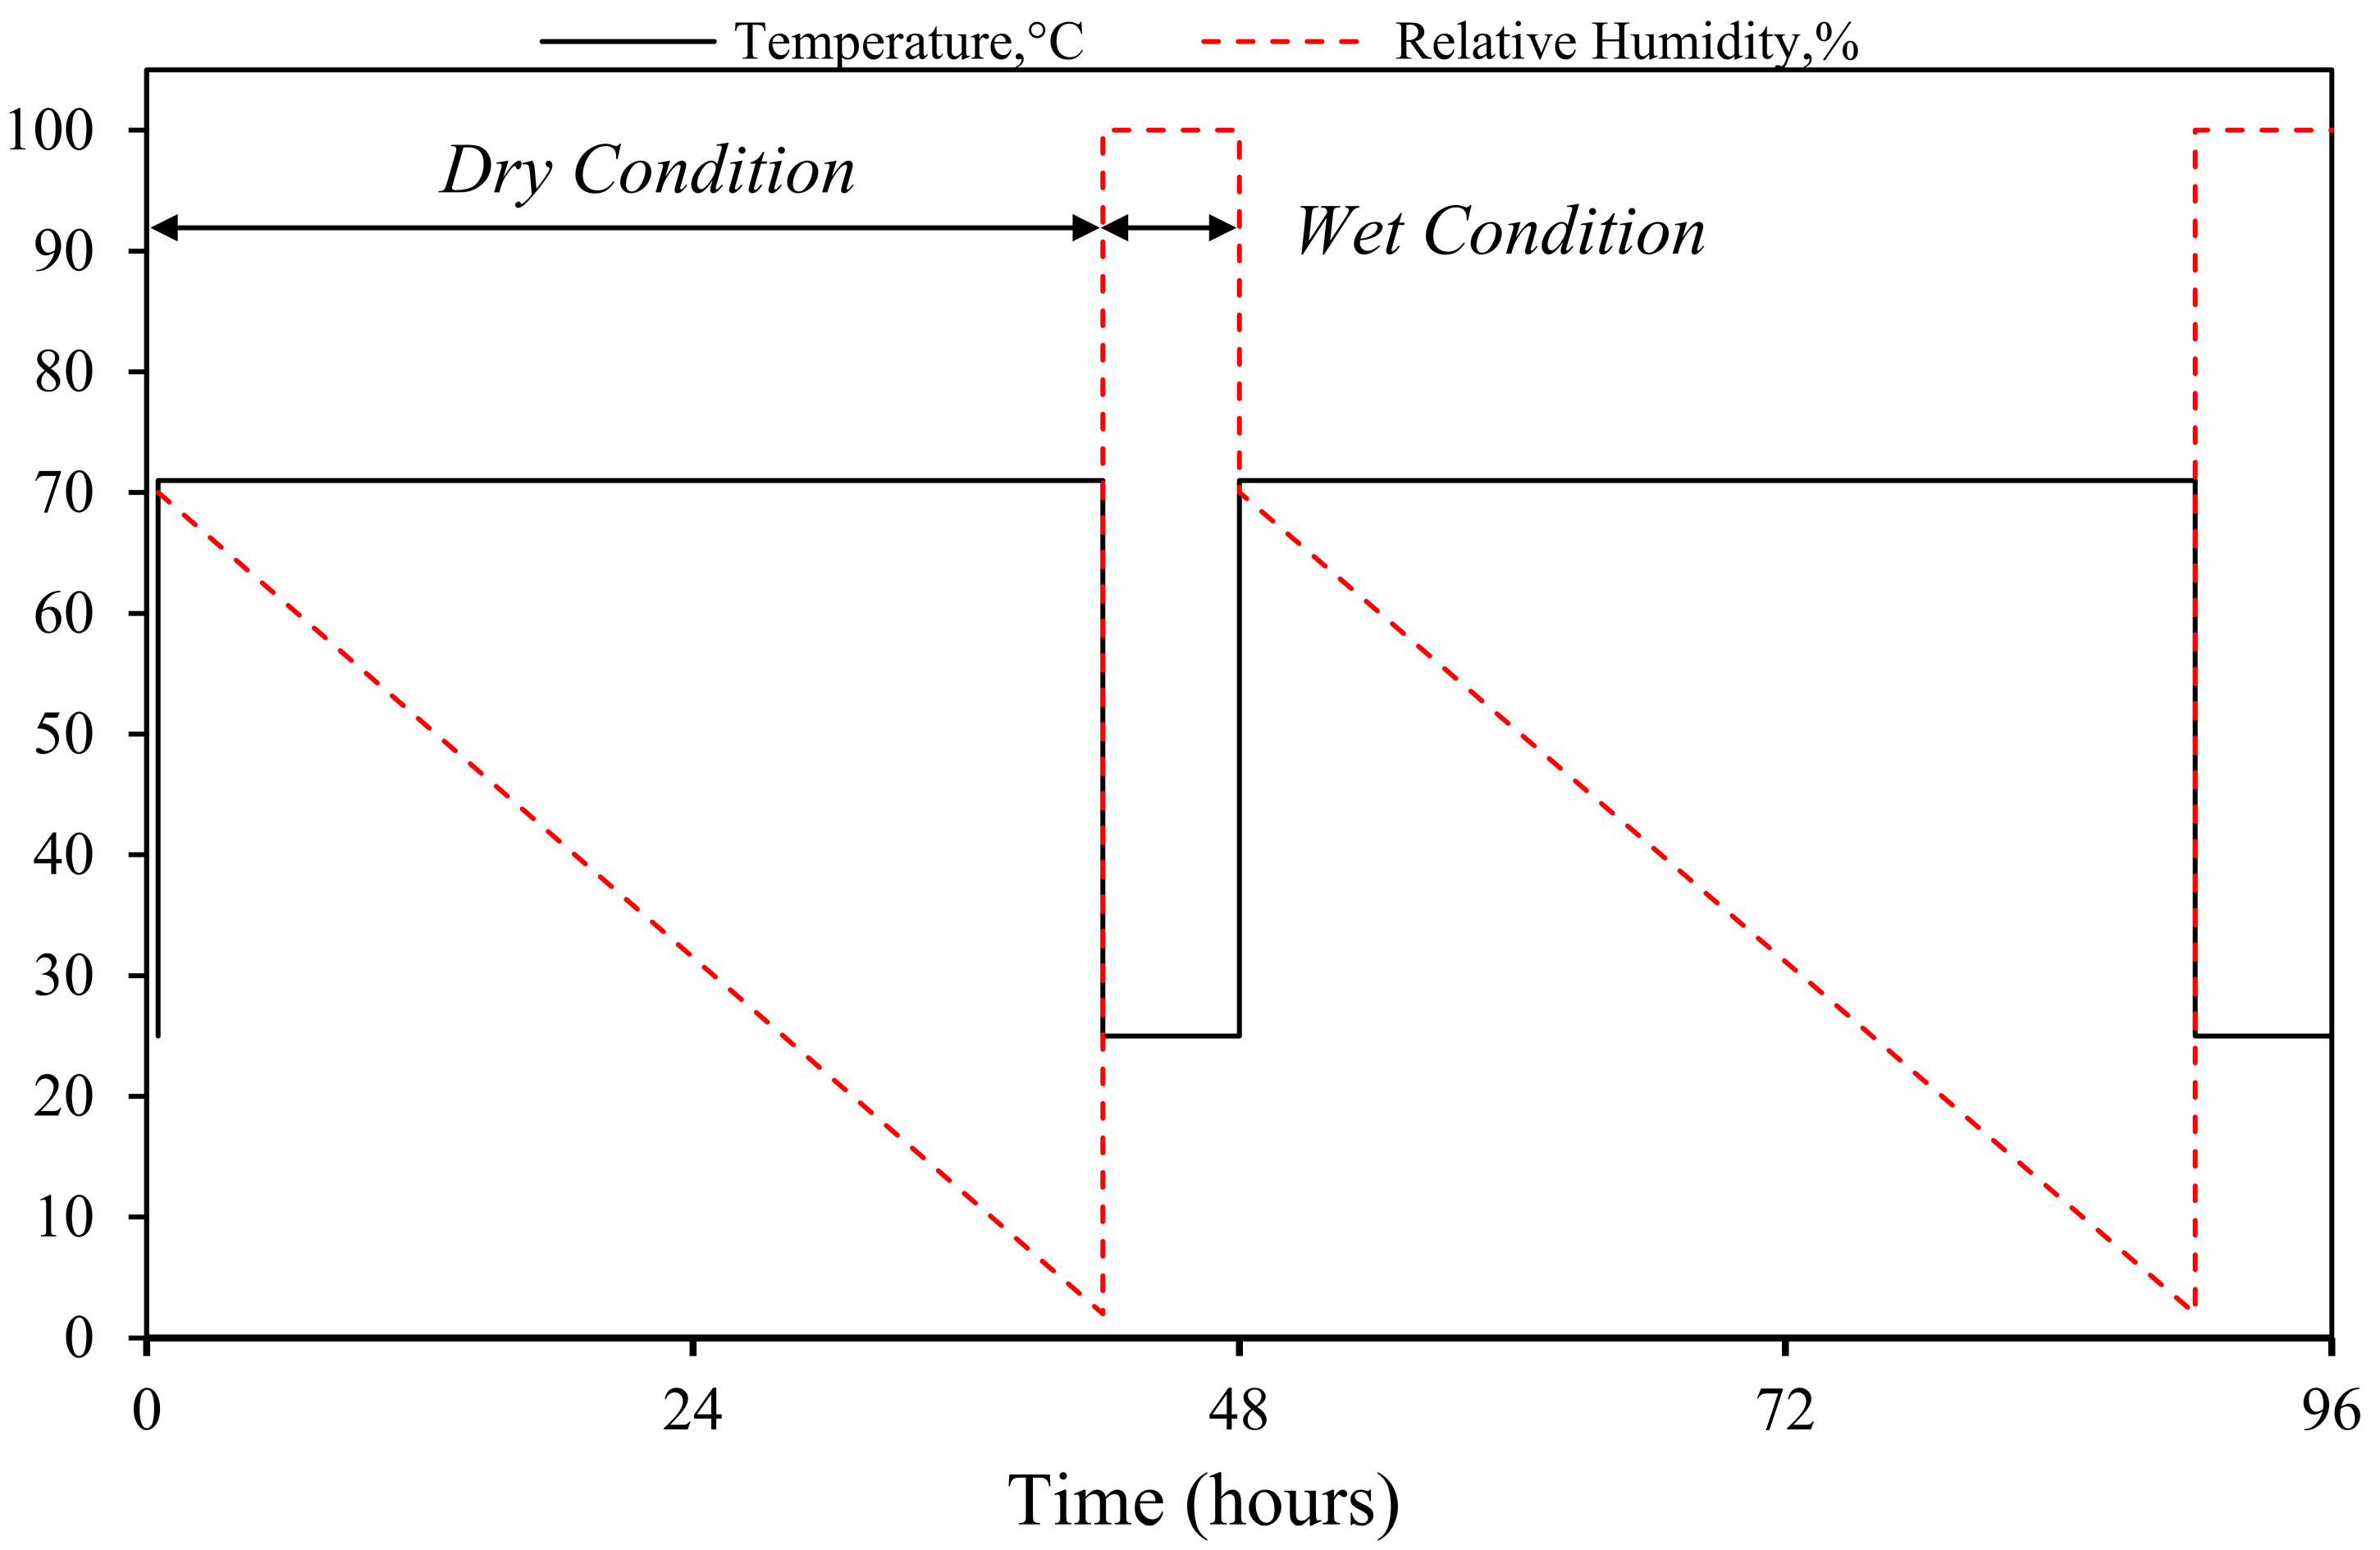
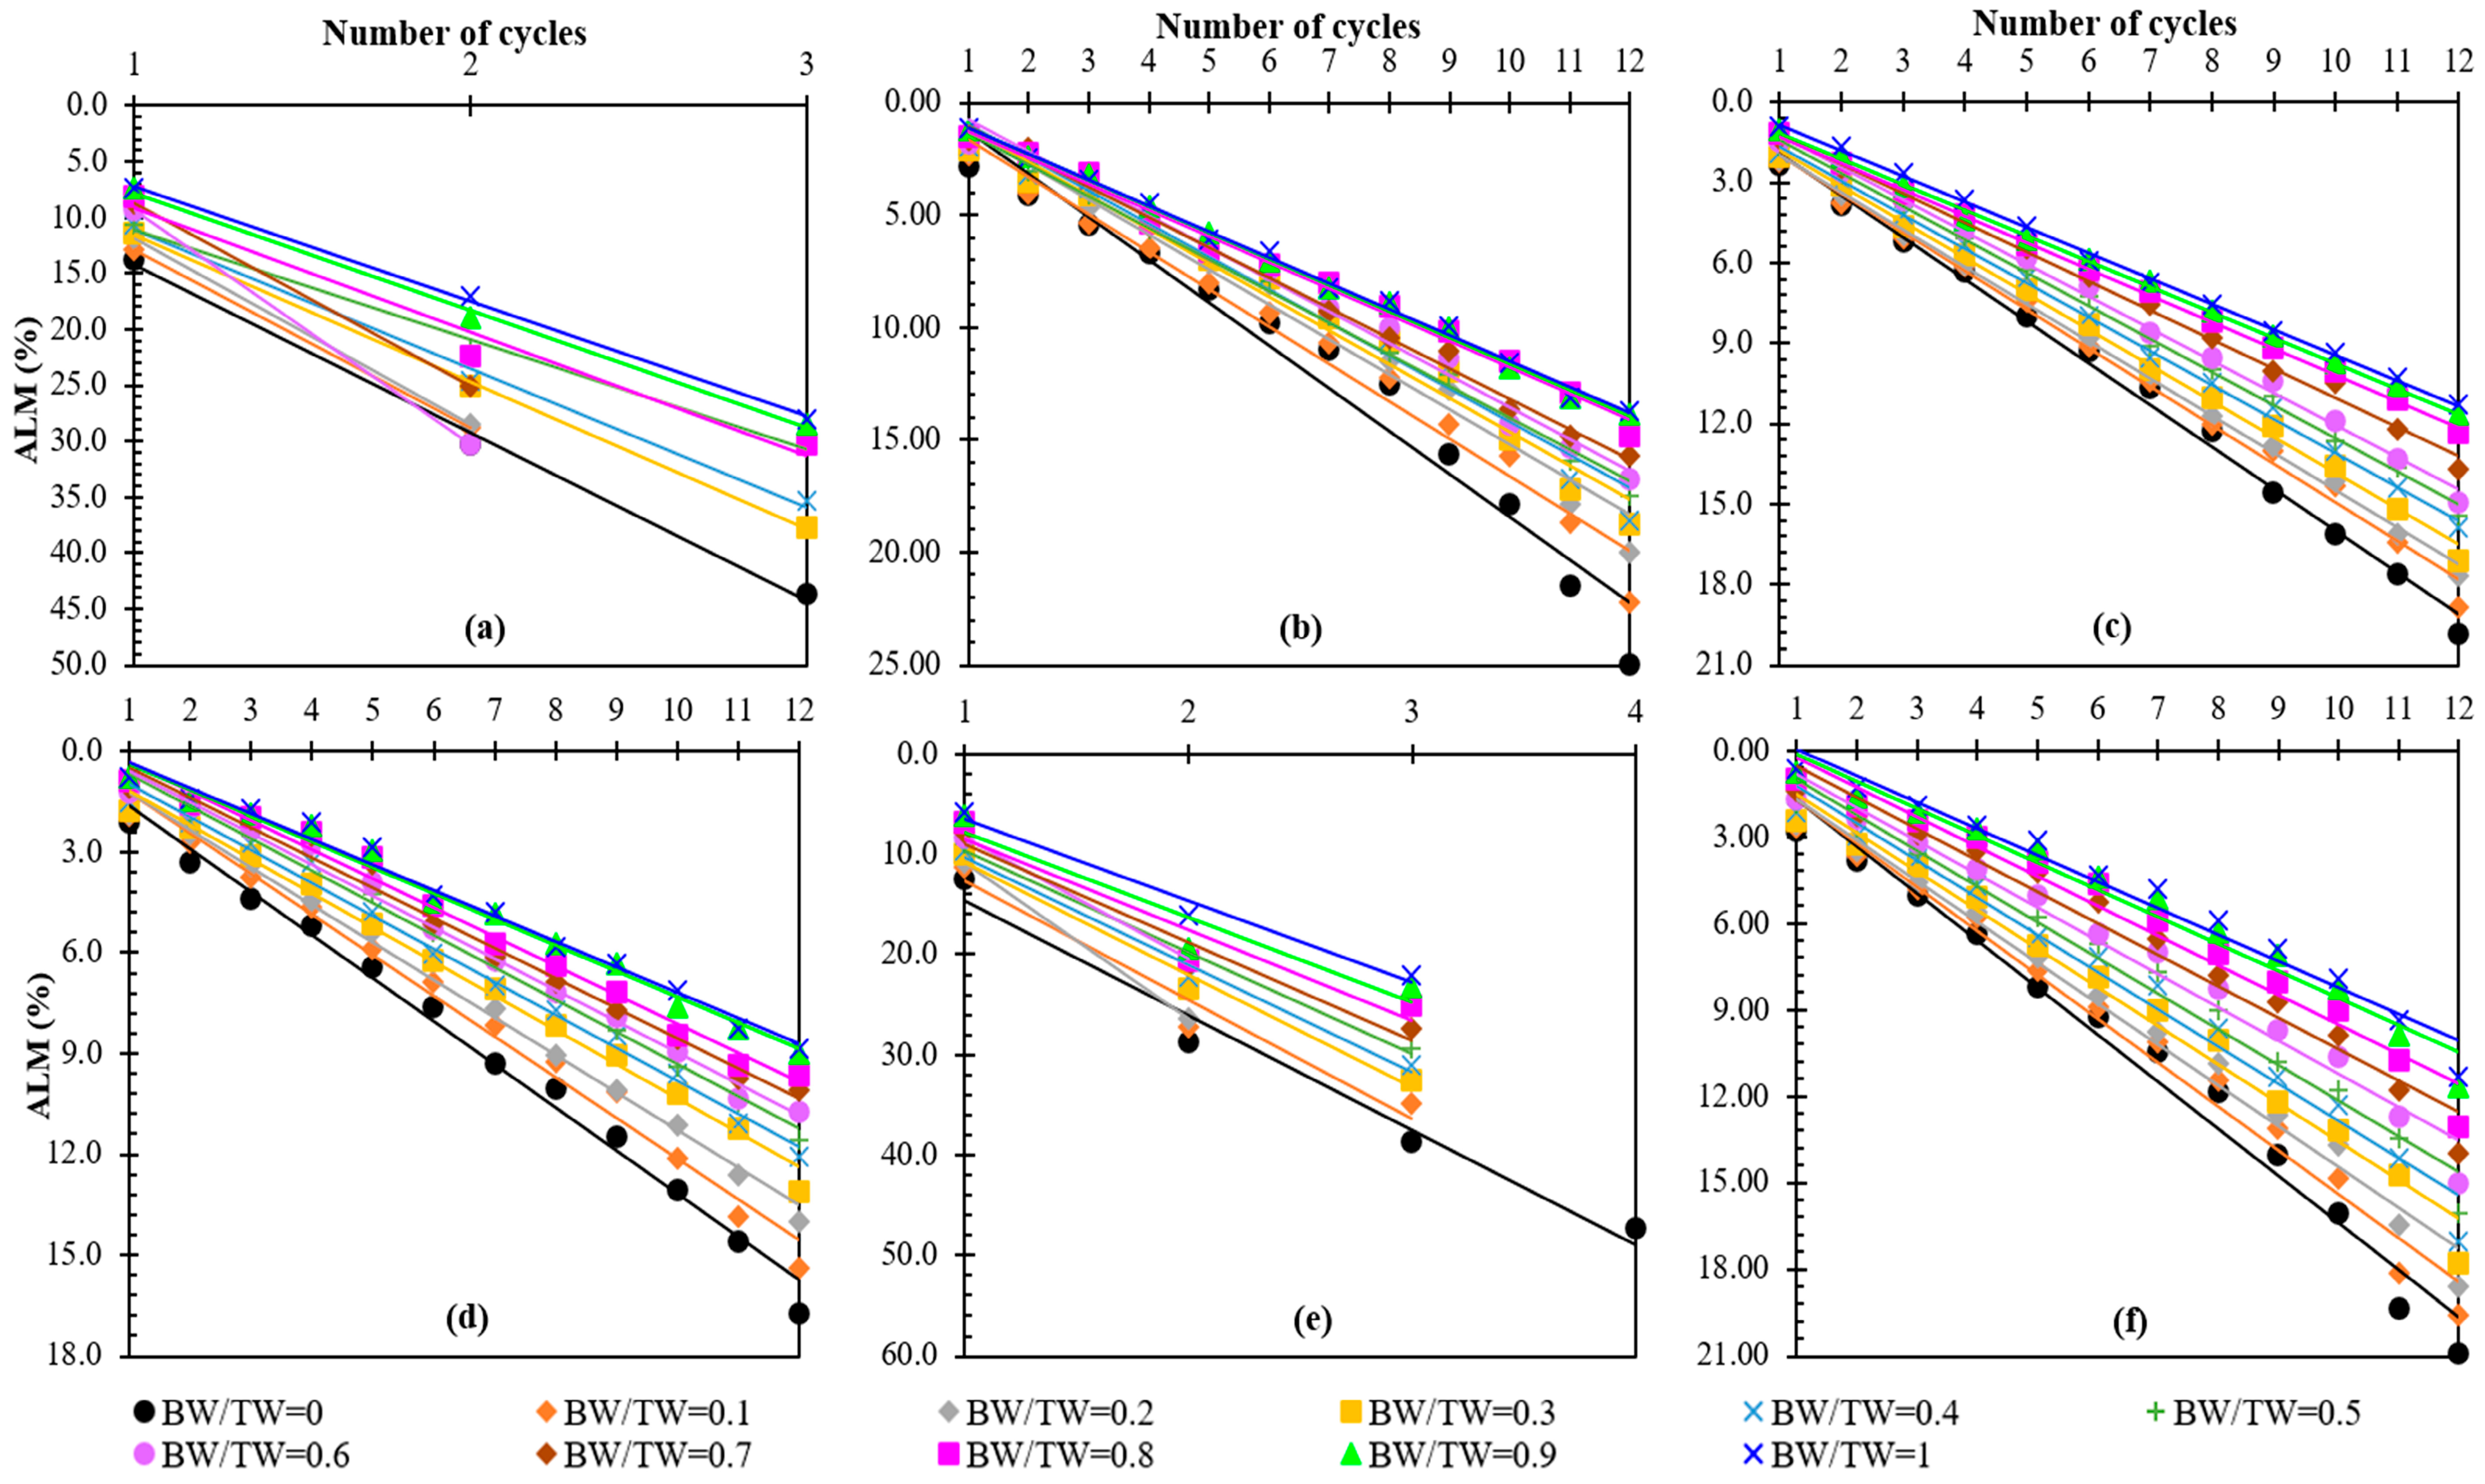
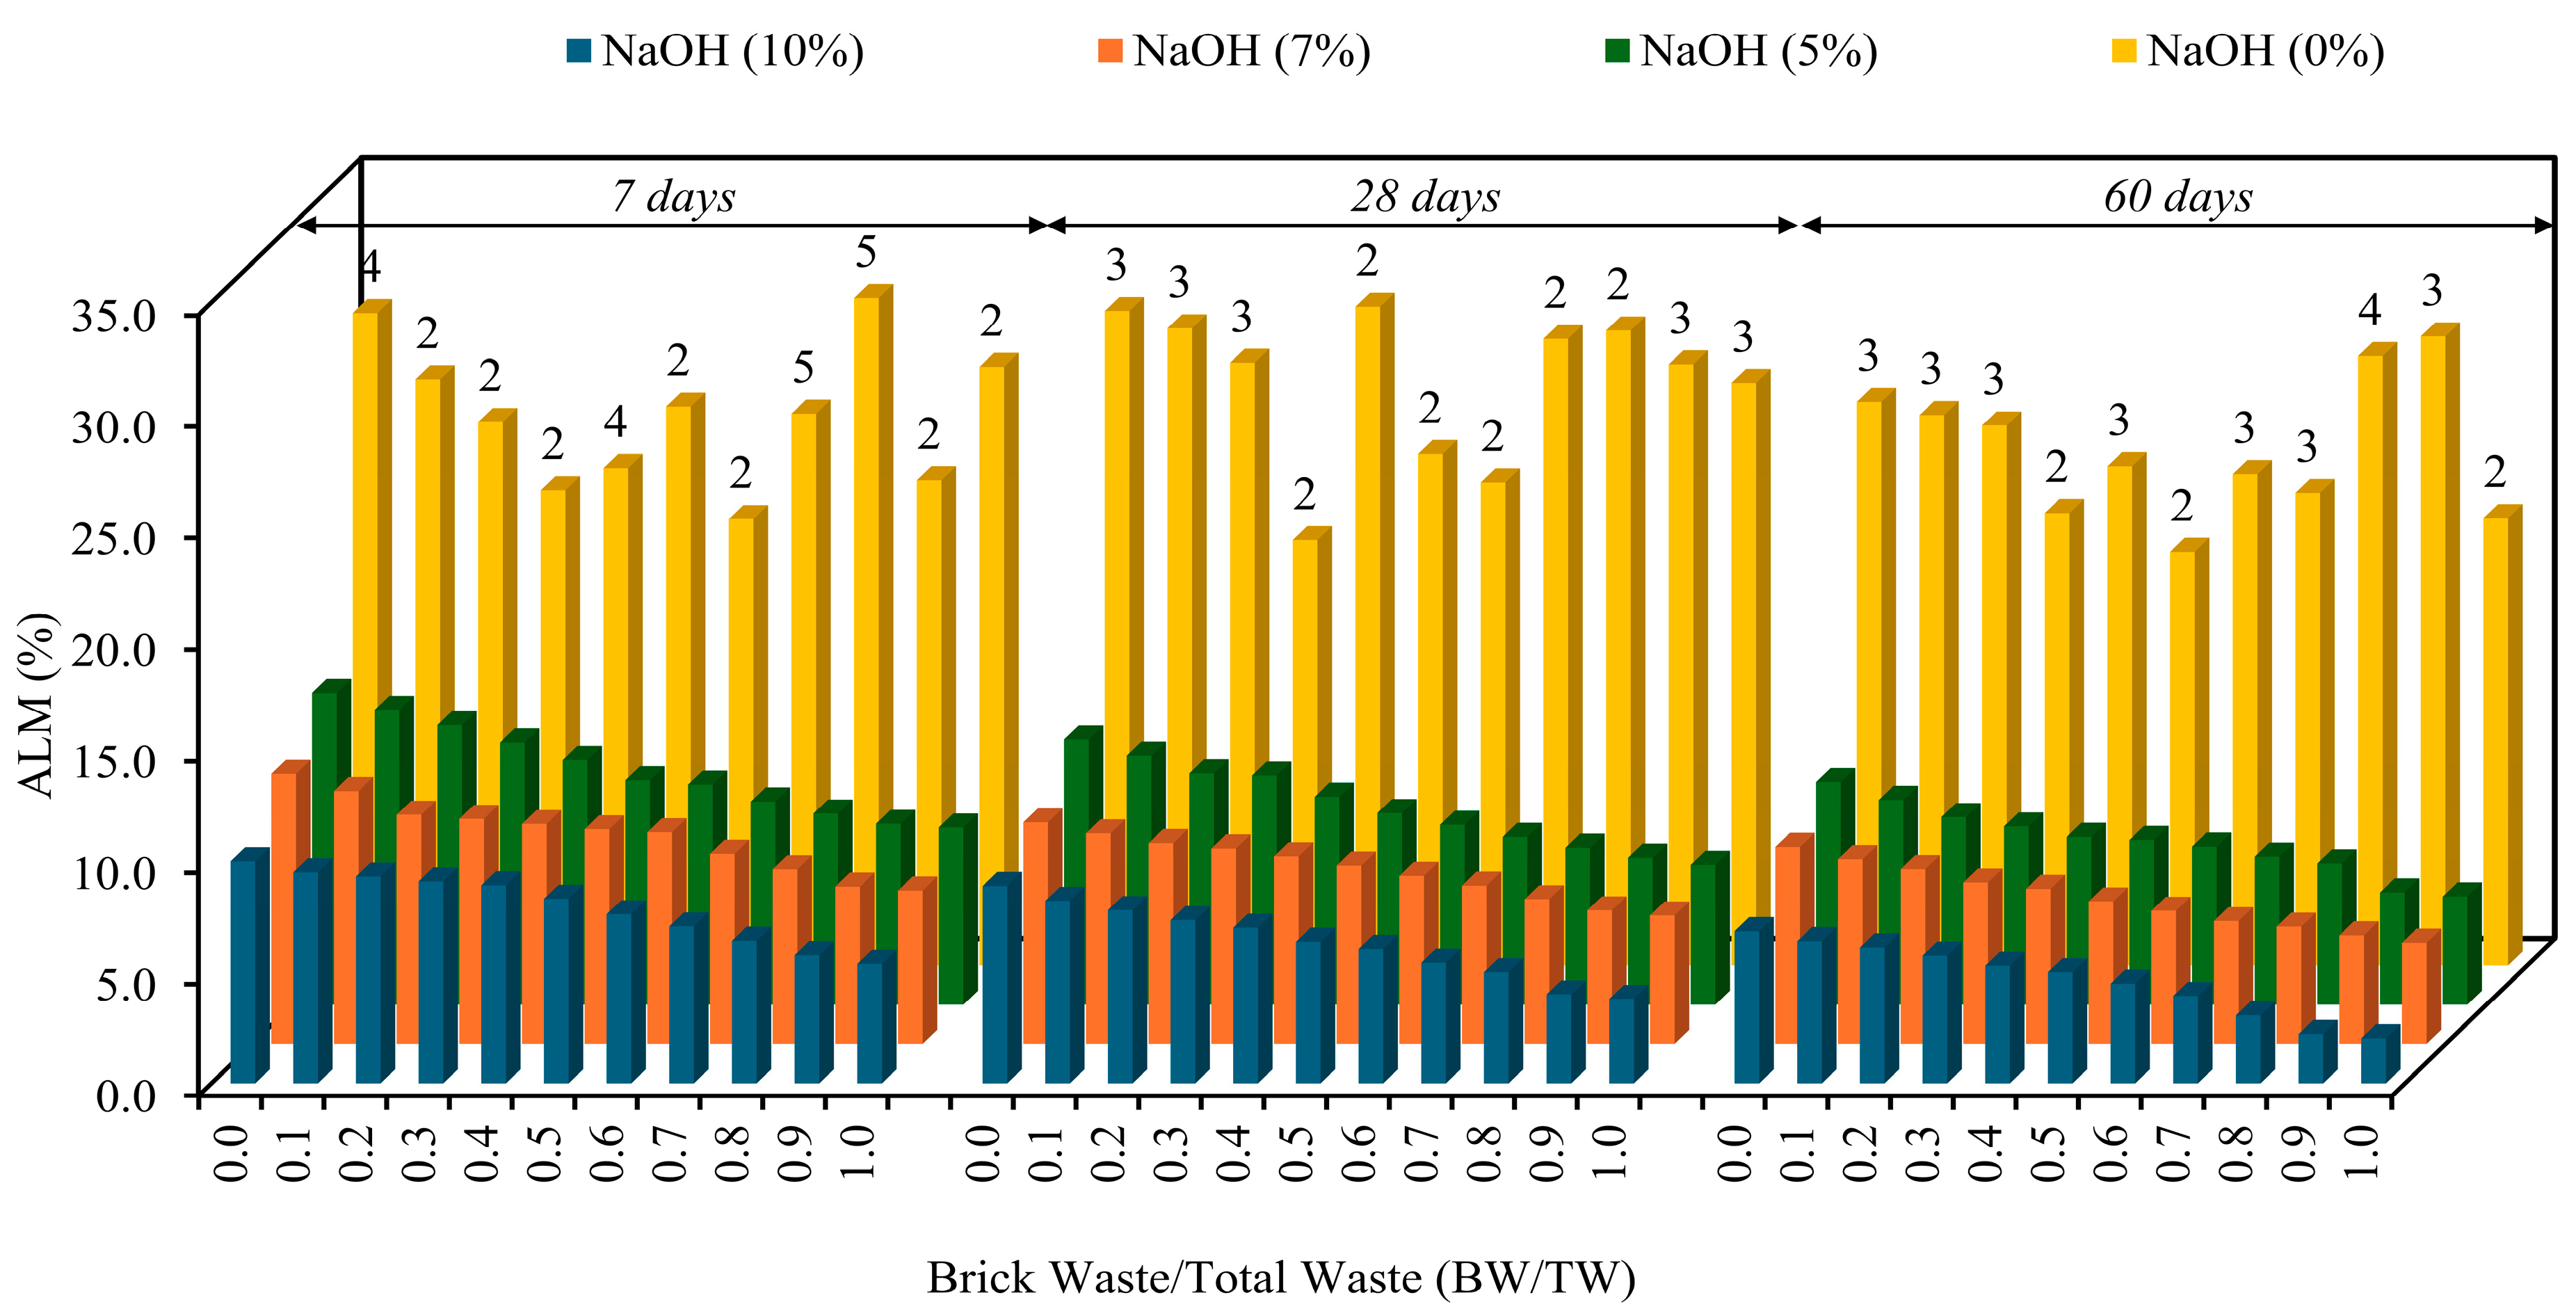
Durability under cyclic wet–dry conditions was assessed following ASTM D559 [91]. Each 12-cycle sequence included drying, brushing, and wetting phases (Figure 5). During the drying phase, specimens were oven-dried at 71 °C for 42 h (RH < 10%) to simulate arid exposure. This was followed by mechanical brushing (4–5 strokes per face) using a 1.5 kg wire-bristled brush to remove loosened surface material. In the wetting phase, specimens were fully submerged in water at 23 °C for 5 h under saturated conditions. After each cycle, the specimen mass was recorded, and the accumulated mass loss (ALM) was calculated across all cycles.

3.3.4. Freeze and Thaw Durability

Freeze–thaw resistance was evaluated over 12 sequential cycles in accordance with ASTM D560 [92]. Each cycle included freezing at −23 °C for 24 h, followed by thawing at 23 °C and 100% RH for 23 h (Figure 6). Mechanical abrasion was then applied using a wire-bristle brush with a 1.5 kg load (15 N force), delivering 4–5 strokes per face (24–30 total strokes). Specimen mass was recorded before and after each cycle, and ALM was calculated. To avoid directional bias, specimens were randomly reoriented between cycles.

4. Results and Discussion

4.1. Unconfined Compressive Strength

4.1.1. Influence of Activator Dosage, Curing Regime and Binder Composition on AAP Strength

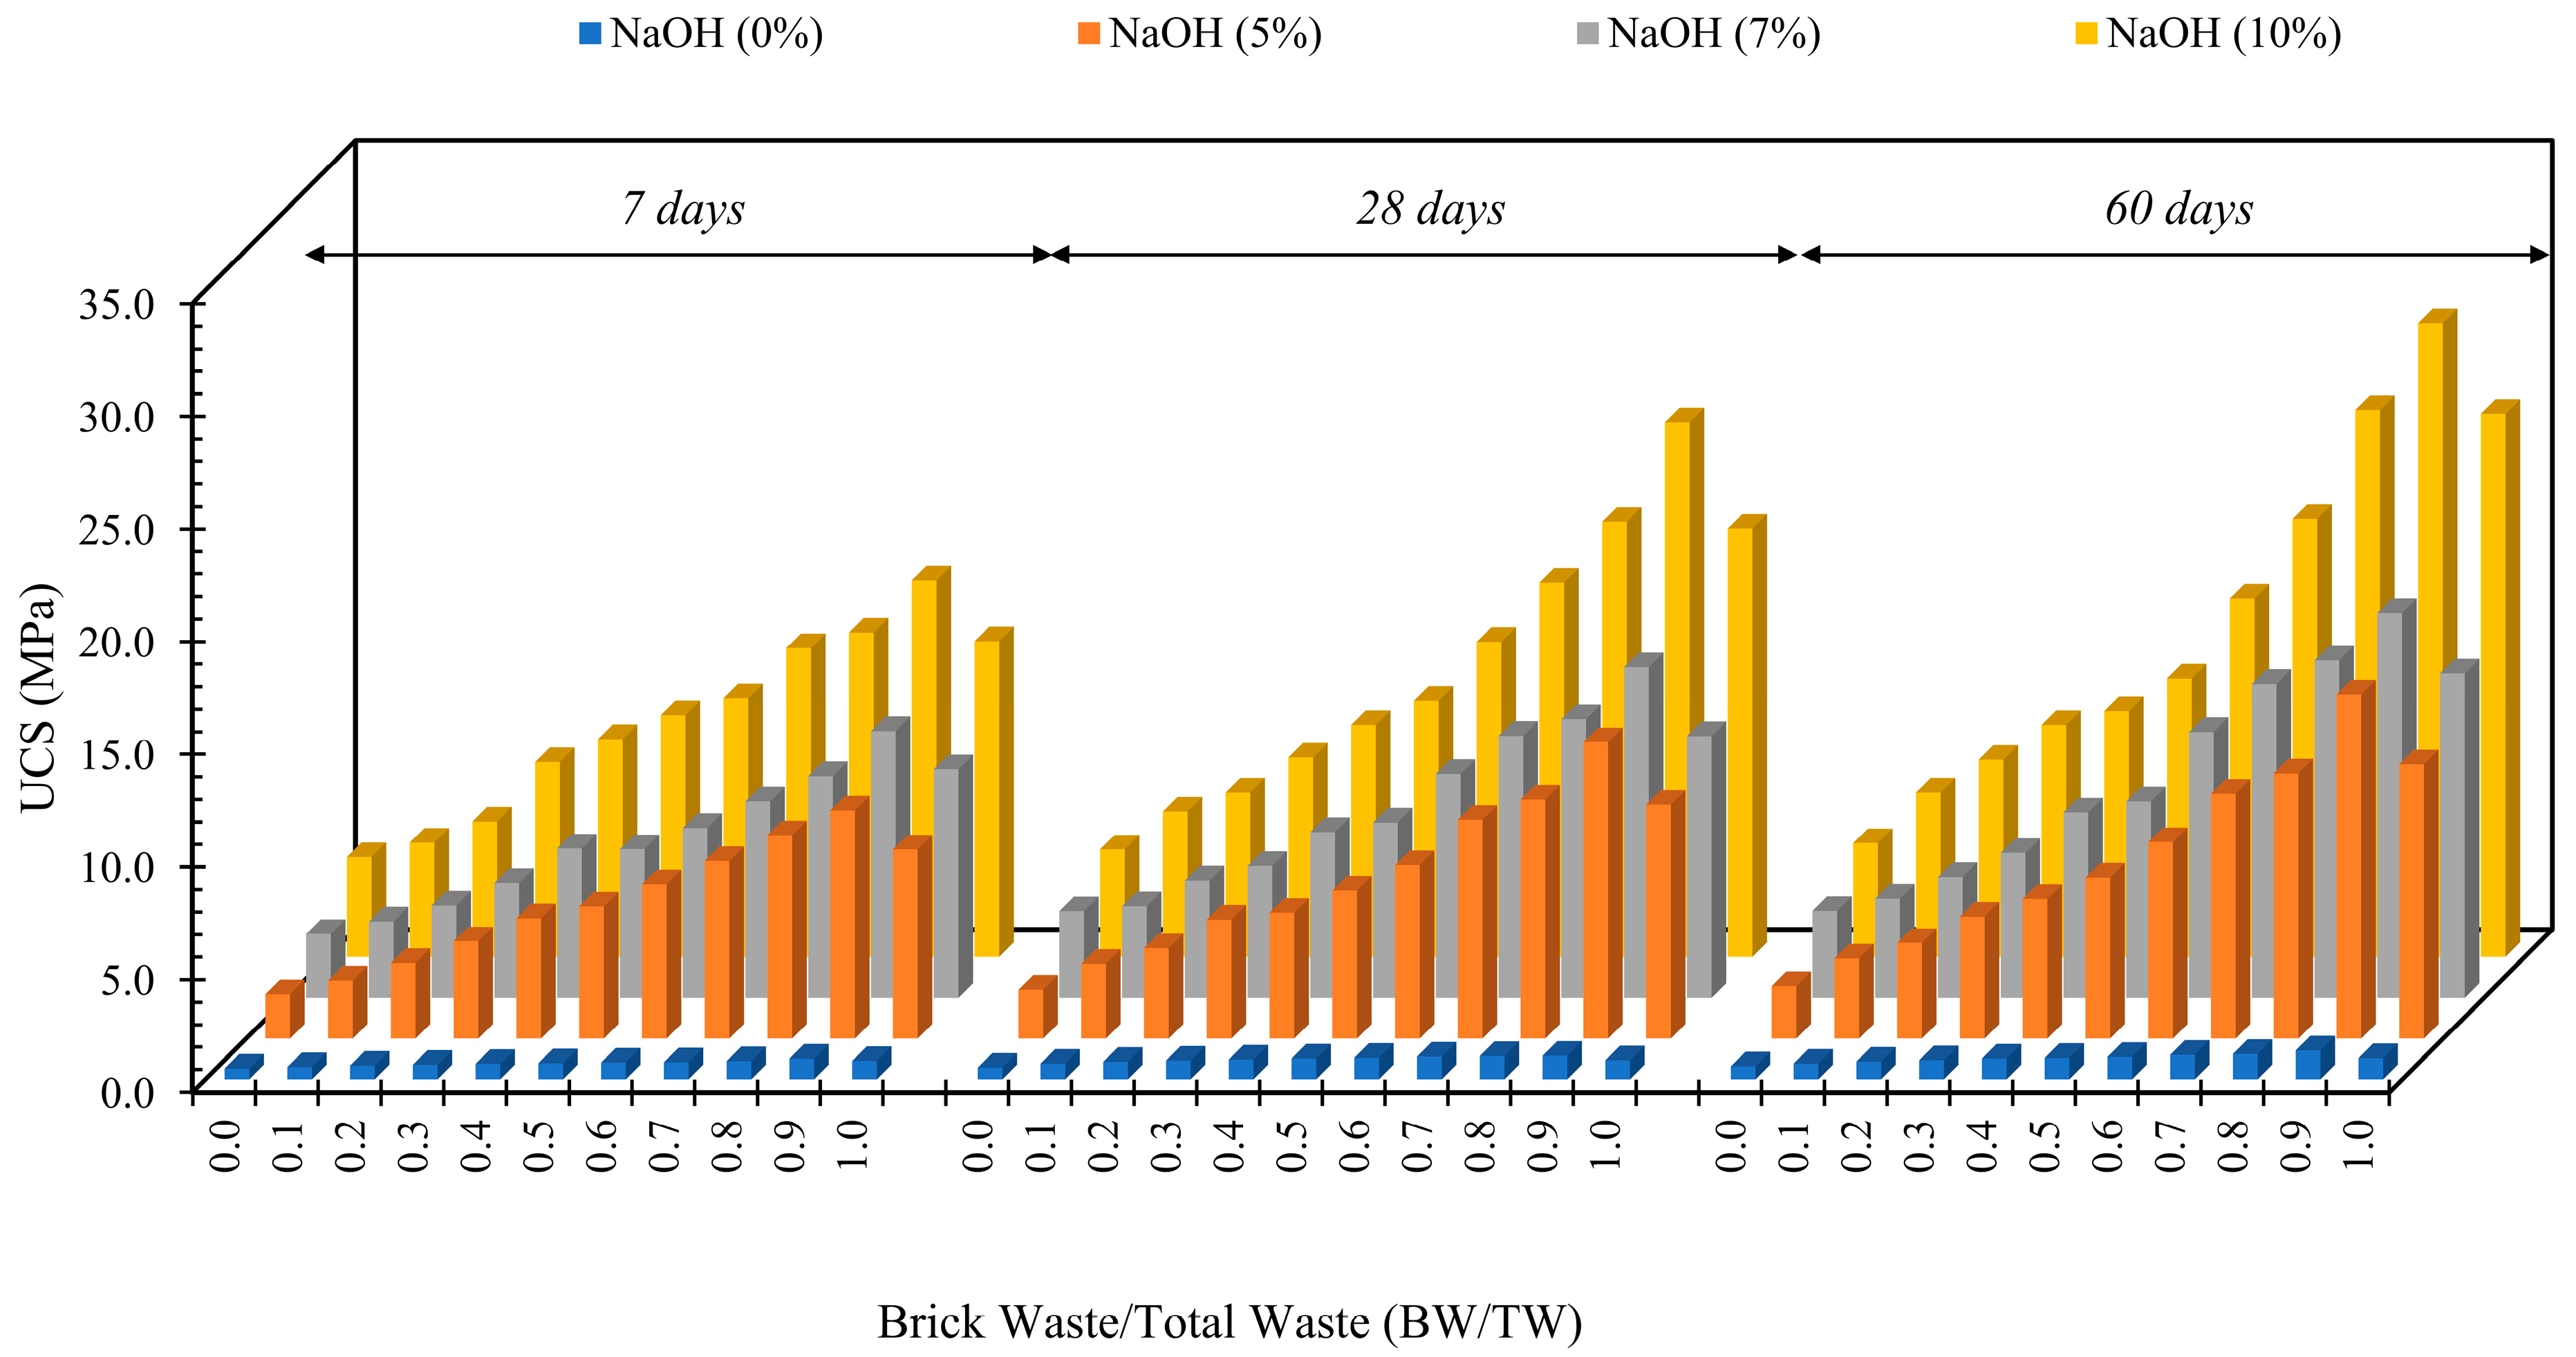
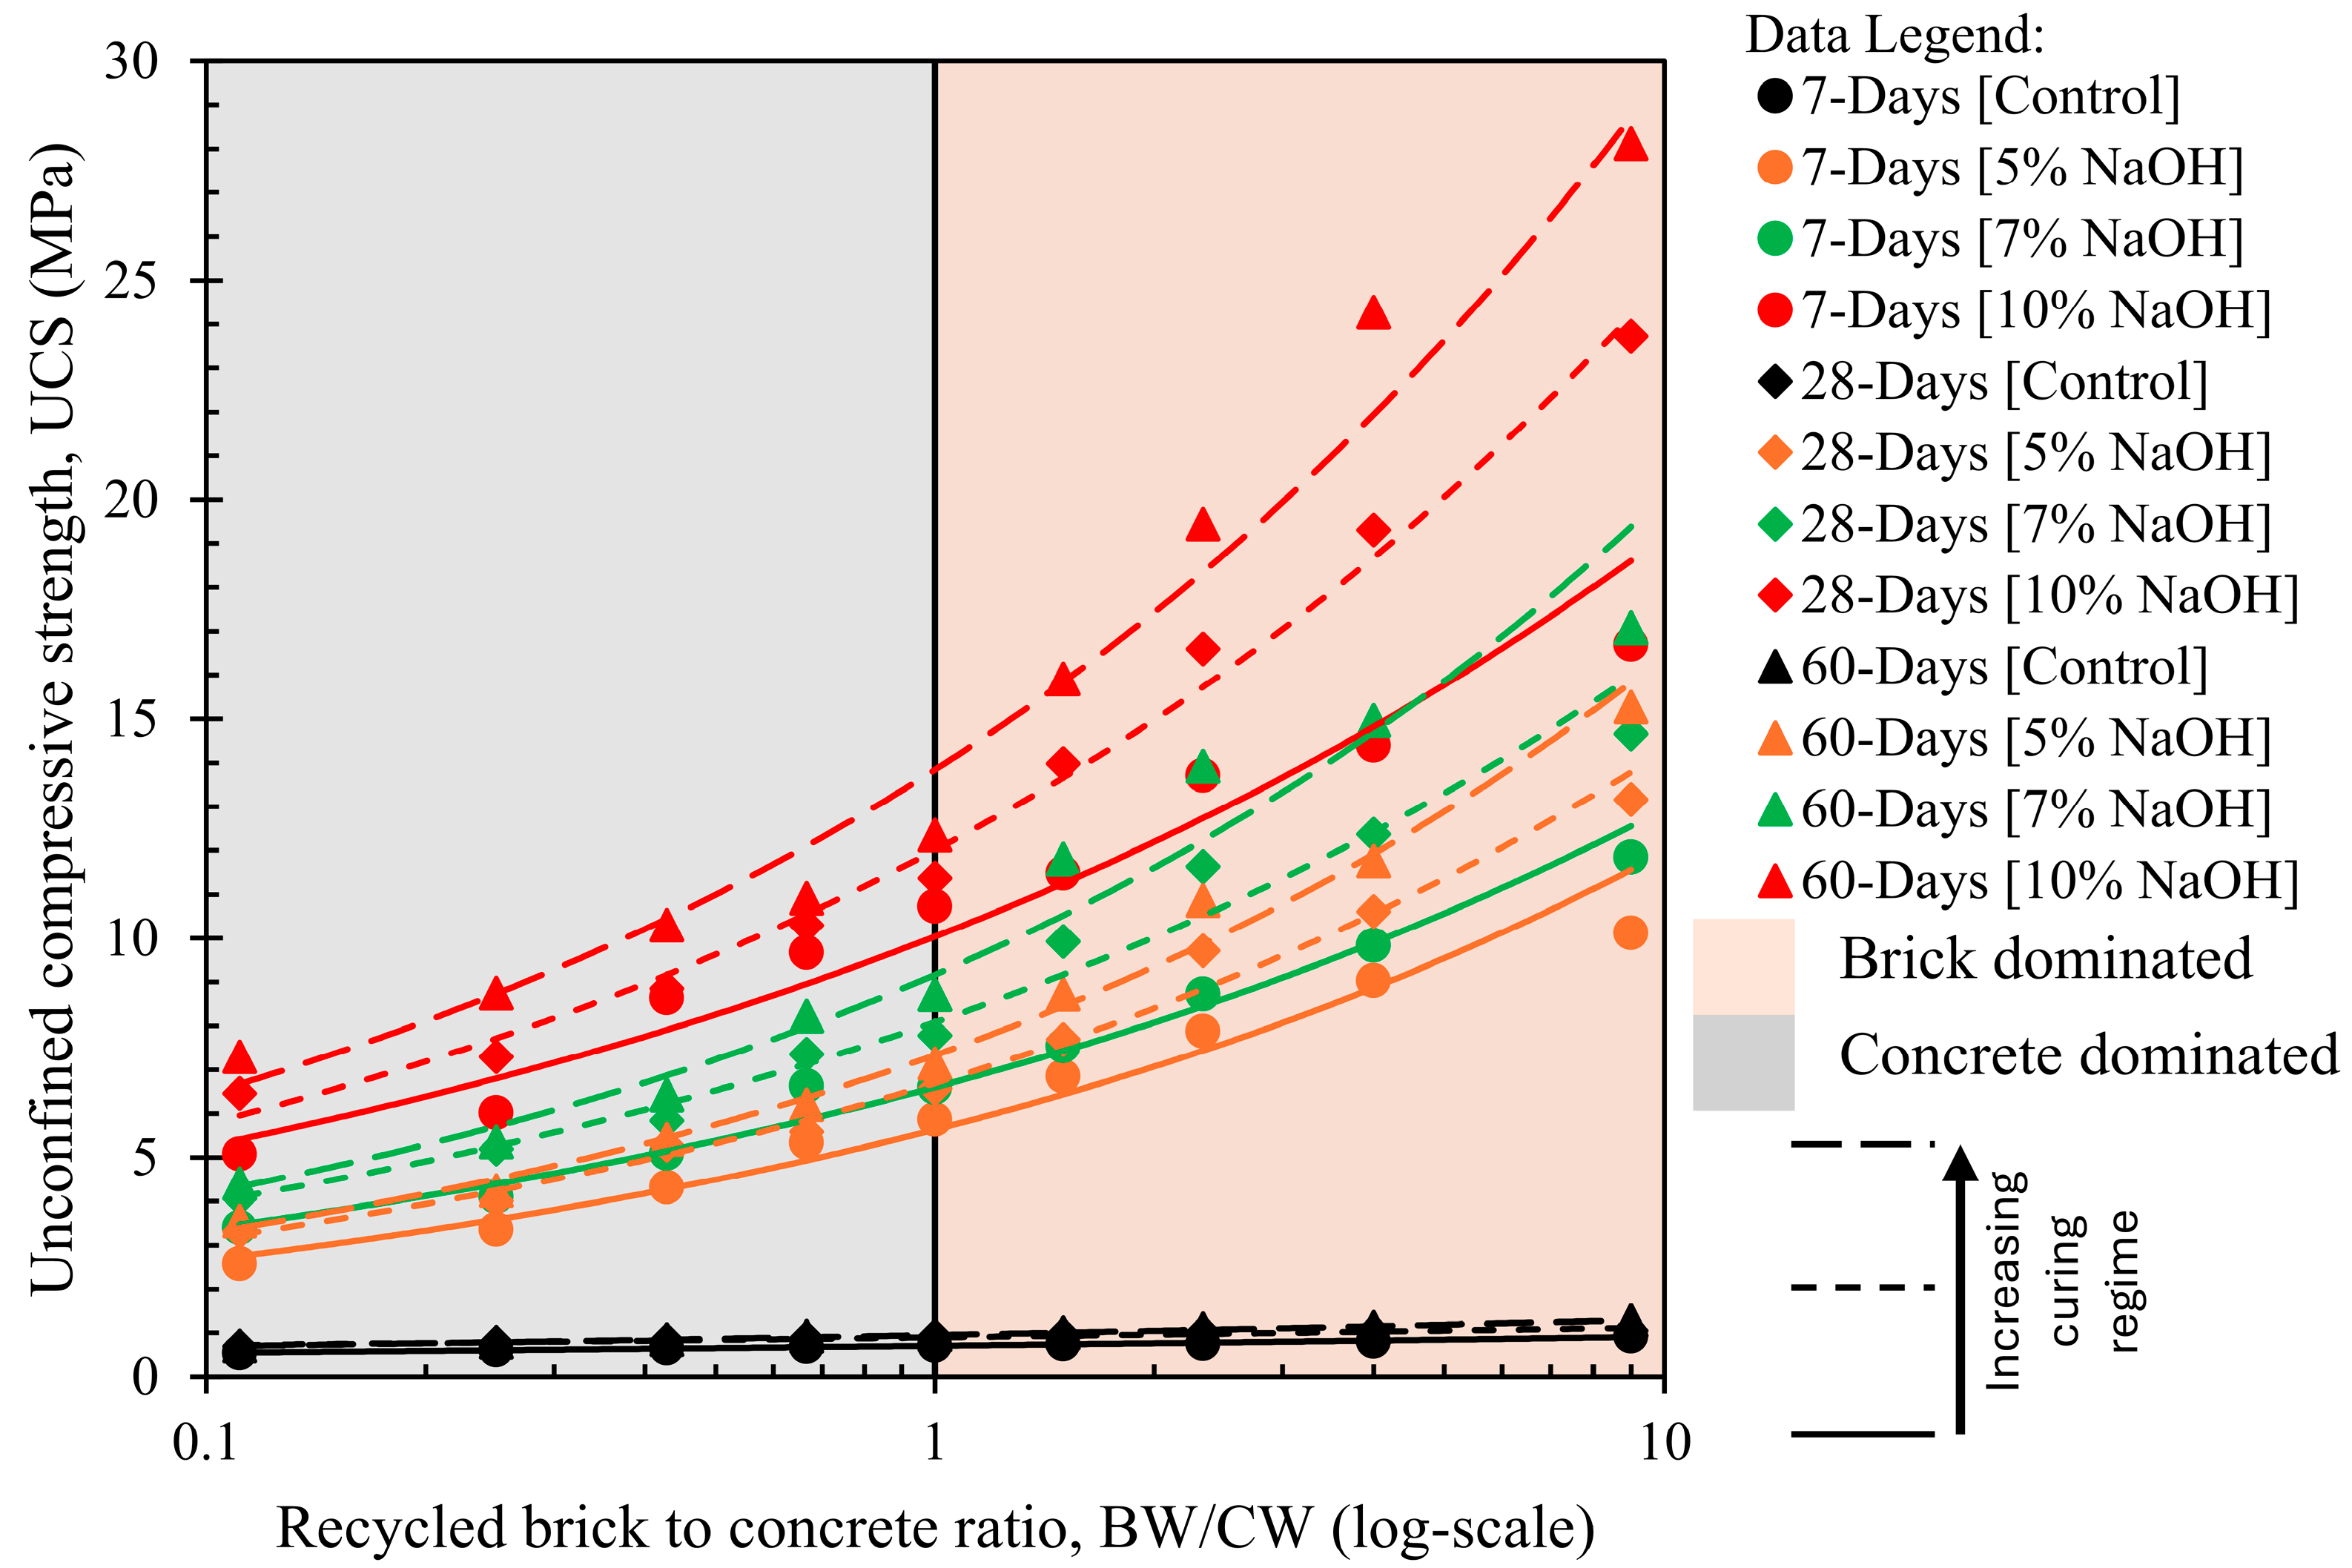
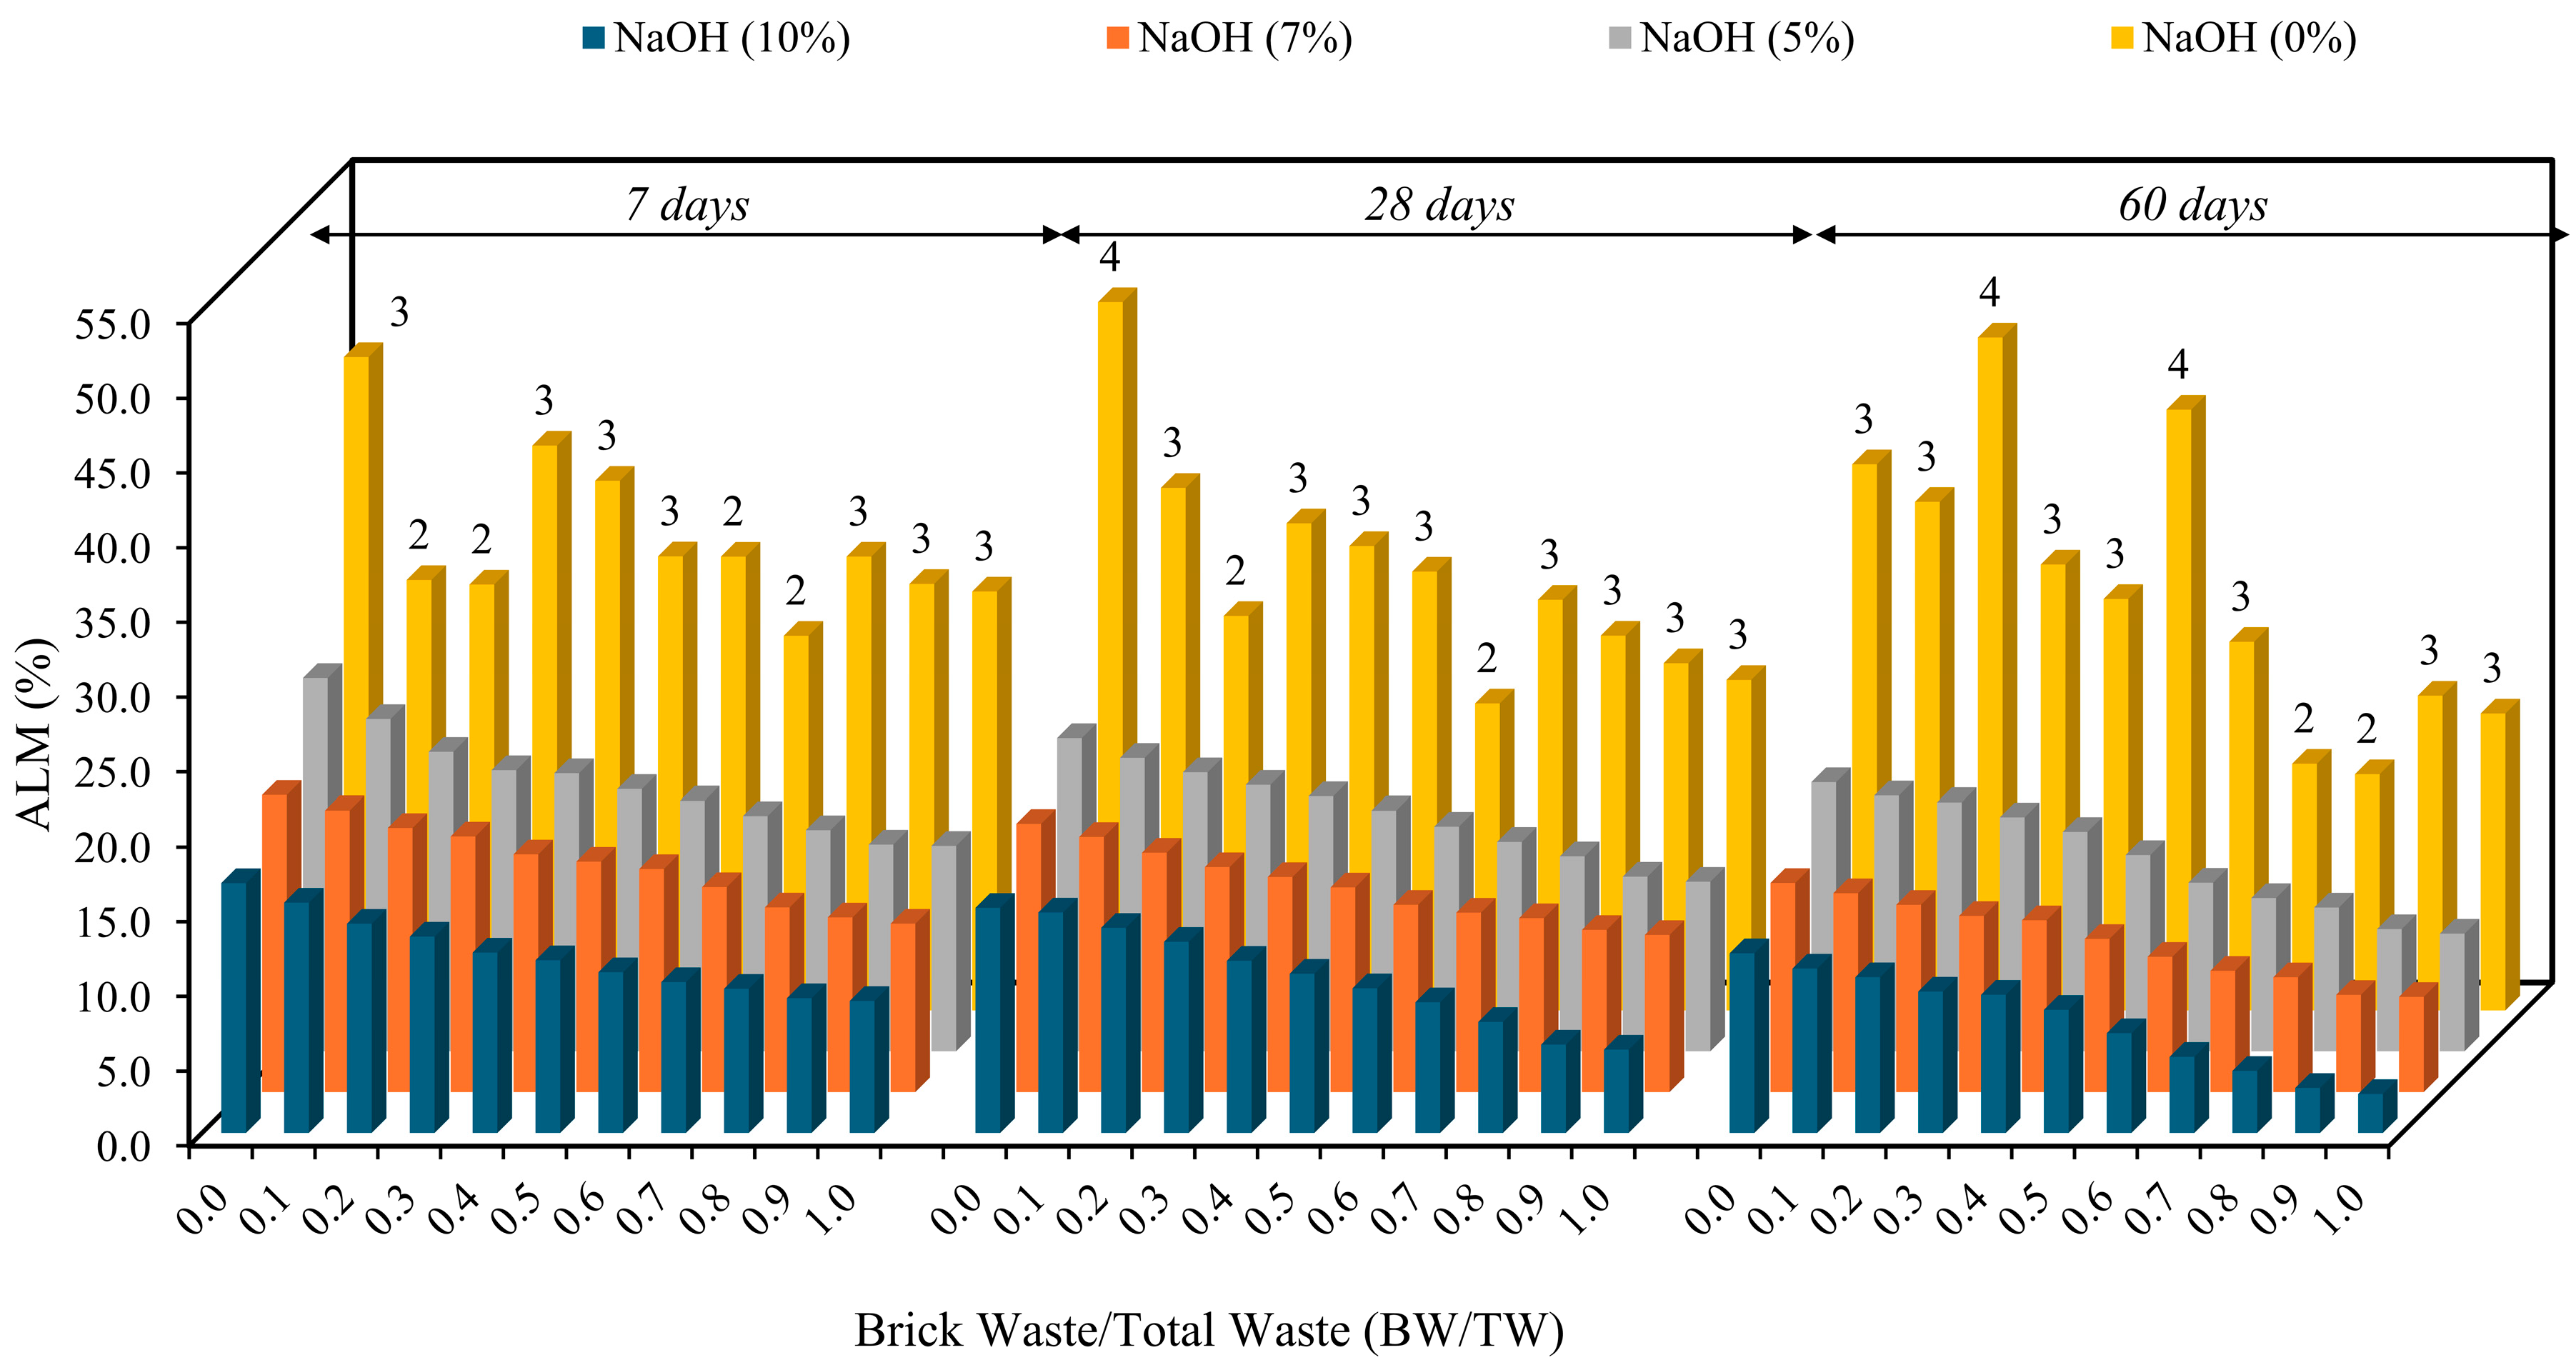
The performance of AAPs derived from CW and BW was assessed through a series of UCS tests. Figure 7 illustrates the variation in compressive strength of alkali-activated CW/BW blends as a function of BW/TW ratio (0–1), NaOH dosage (0%, 5%, 7%, and 10%) and curing periods of 7, 28, and 60 days. The experimental results demonstrate that the strength of the control mix (0% NaOH) increases marginally with an extended curing period, attributed to the inherent limitations of the constituent materials. The minimum strength observed is approximately 0.5 MPa at 7 days, while the maximum strength reaches around 1.3 MPa at 60 days. This observation aligns with established mechanisms of alkali activation. Without NaOH, insufficient alkalinity hinders the dissolution of aluminosilicate precursors in CW and BW, preventing geopolymerization. As secondary materials, CW and BW exhibit diminished reactivity due to prior consumption of reactive phases during their original cementitious and ceramic applications. As a result, strength relies solely on mechanical interlock and any residual cement hydration, leading to weak particle adhesion, higher porosity, and significantly lower compressive strength. In contrast, the introduction of NaOH significantly enhanced the mechanical performance compared to control mixes due to alkali activation. This activation dissolves silica (SiO2) and alumina (Al2O3) from BW and CW, initiating the geopolymerization process and forming binding gels such as sodium aluminosilicate hydrate (N-A-S-H) and, in the presence of calcium from CW, calcium silicate hydrate (C-S-H). These gels form a dense, interconnected network, which significantly improves the material’s strength [65,66].
The compressive strength of AAPs exhibits a direct correlation with NaOH concentration, increasing substantially with NaOH content and peaking at 10% NaOH, as evidenced by experimental data (Figure 7) and prior studies [52,63]. While 5% NaOH yielded measurable strength gains over non-activated mixes (0% NaOH), compressive strength continues to increase with NaOH content, exhibiting progressive enhancement at 7% and further improvement at 10%. Notably, at a BW/TW ratio of 0.9 and 60 days of curing, the 10% NaOH mixture achieved the highest compressive strength of 29 MPa, approximately 93% greater than the 15 MPa recorded for the 5% NaOH mix, as illustrated in Figure 7. In addition, due to prior hydration, CW and BW exhibited reduced reactivity. While 5% NaOH is insufficient to activate these phases, 10% NaOH effectively dissolved residual amorphous silica and alumina, thus enhancing the reactivity. This trend aligns with existing literature, which shows that compressive strength exhibits a concentration-dependent response to NaOH, with notable improvements observed at higher molarities (10M) [63]. Similarly, a study on concrete waste-based geopolymers reports progressive strength gains with increasing NaOH concentrations, reaching peak performance at ∼14M NaOH [52]. Higher NaOH concentrations provide high-base conditions, which aggressively dissolve amorphous silica and alumina from BW and CW. This liberates reactive Si4+ and Al3+ ions, which are essential for the formation of geopolymer gel (N-A-S-H) [63]. Furthermore, elevated NaOH increases ionic strength, stabilising dissolved monomers (silicates and aluminates) and accelerating their reorganisation into three-dimensional aluminosilicate networks, which subsequently form cohesive, less porous, and interconnected gel formations [93].
Additionally, from Figure 7, a trend is observed where UCS demonstrates a positive correlation with the BW/TW ratio (0–0.9), indicating that higher BW content within the mixture enhances mechanical performance. This relationship persists consistently irrespective of variations in curing duration or NaOH concentration. However, strength declines at a BW/TW ratio of 1.0, indicating a threshold where excess BW reduces performance. A similar trend was observed in the study [94], where increasing brick waste content beyond 10% of the precursor resulted in a decline in compressive strength for both 3D-printed and mould-cast specimens. The significantly higher silica (32.6%) and alumina (10.5%) content in BW, compared to the modest levels in CW at 6.3% and 1.8%, respectively, offers a more favourable stoichiometric ratio (high Si/Al ratio) that promoted the nucleation and formation of aluminosilicate (N-A-S-H) gel. These gels maintained structural integrity in high-alkaline media (pH ≥ 12) due to their aluminosilicate framework, which is responsible for binding and providing strength in AAPs [95]. Conversely, CW’s dominance in CaO (53%) drives calcium silicate hydrate (C-S-H) formation. However, in highly alkaline environments, C-S-H exhibits destabilisation through silicate repolymerization and Ca2+ leaching, thereby reducing its binding efficiency [96]. Accordingly, the increase in brick content within the mix correlates with an enhancement in compressive strength. The mix with a BW/TW ratio of 1.0 underperforms compared to the 0.9 blend due to a calcium deficiency, which limits the synergy between C-S-H and N-A-S-H gels. CW contributes Ca2+, enhancing microstructural densification, while 100% BW relies solely on N-A-S-H gels, which lack calcium’s pore-filling and interfacial reinforcement capabilities. Furthermore, the compressive strength improves as the curing duration increases for all NaOH concentrations and BW/TW ratios, as shown in Figure 7. This trend is primarily attributed to the time-dependent formation and maturation of binding gels, such as N-A-S-H and C-S-H, which are critical to microstructural densification. These chemical reactions are time-dependent, as prolonged curing promotes the progressive development of binding gels, densifies the matrix, reduces voids, and enhances gel network connectivity, thereby improving compressive strength [47,49,72].

4.1.2. Empirical Unconfined Compressive Strength Prediction Equation Development

In Figure 8, the UCS data exhibit an apparent interactive influence of curing duration, NaOH content, and the BW/CW. Over the curing regimes, the UCS consistently increases as curing proceeds, reflecting the ongoing chemical and physical transformations that develop strength. At the earliest stage (7 days), a substantial difference is observed between the mixes without NaOH and those with higher concentrations (notably at 10% NaOH), indicating that alkali activation significantly accelerates the early formation of strength. This effect becomes more pronounced by 28 days, where the UCS values roughly double or triple those observed at 7 days. At 60 days, the alkali-activated mixes reach their highest strength, surpassing 20 MPa and, in certain cases, exceeding 30 MPa for high BW/CW and 10% NaOH, indicating that sufficient alkaline conditions and adequate curing regimes allowed for the extensive formation of binder gels (C-A-S-H/N-A-S-H). Additionally, the BW/CW also exhibited a marked impact on UCS, as lower BW/CW ratios (0.11 to 0.25) yielded moderate strength gains. As the ratio increases (4.0–9), there is a pronounced overall rise in UCS at all NaOH concentrations and curing regimes. Such strength development indicates that recycled waste materials provide both a reactive aluminosilicate source and additional calcium (from CW), thereby enhancing geopolymeric or pozzolanic reactions under alkaline conditions. In particular, higher NaOH levels (7% and 10%) enhanced these benefits by facilitating the stronger dissolution of reactive compounds and faster gel formation.
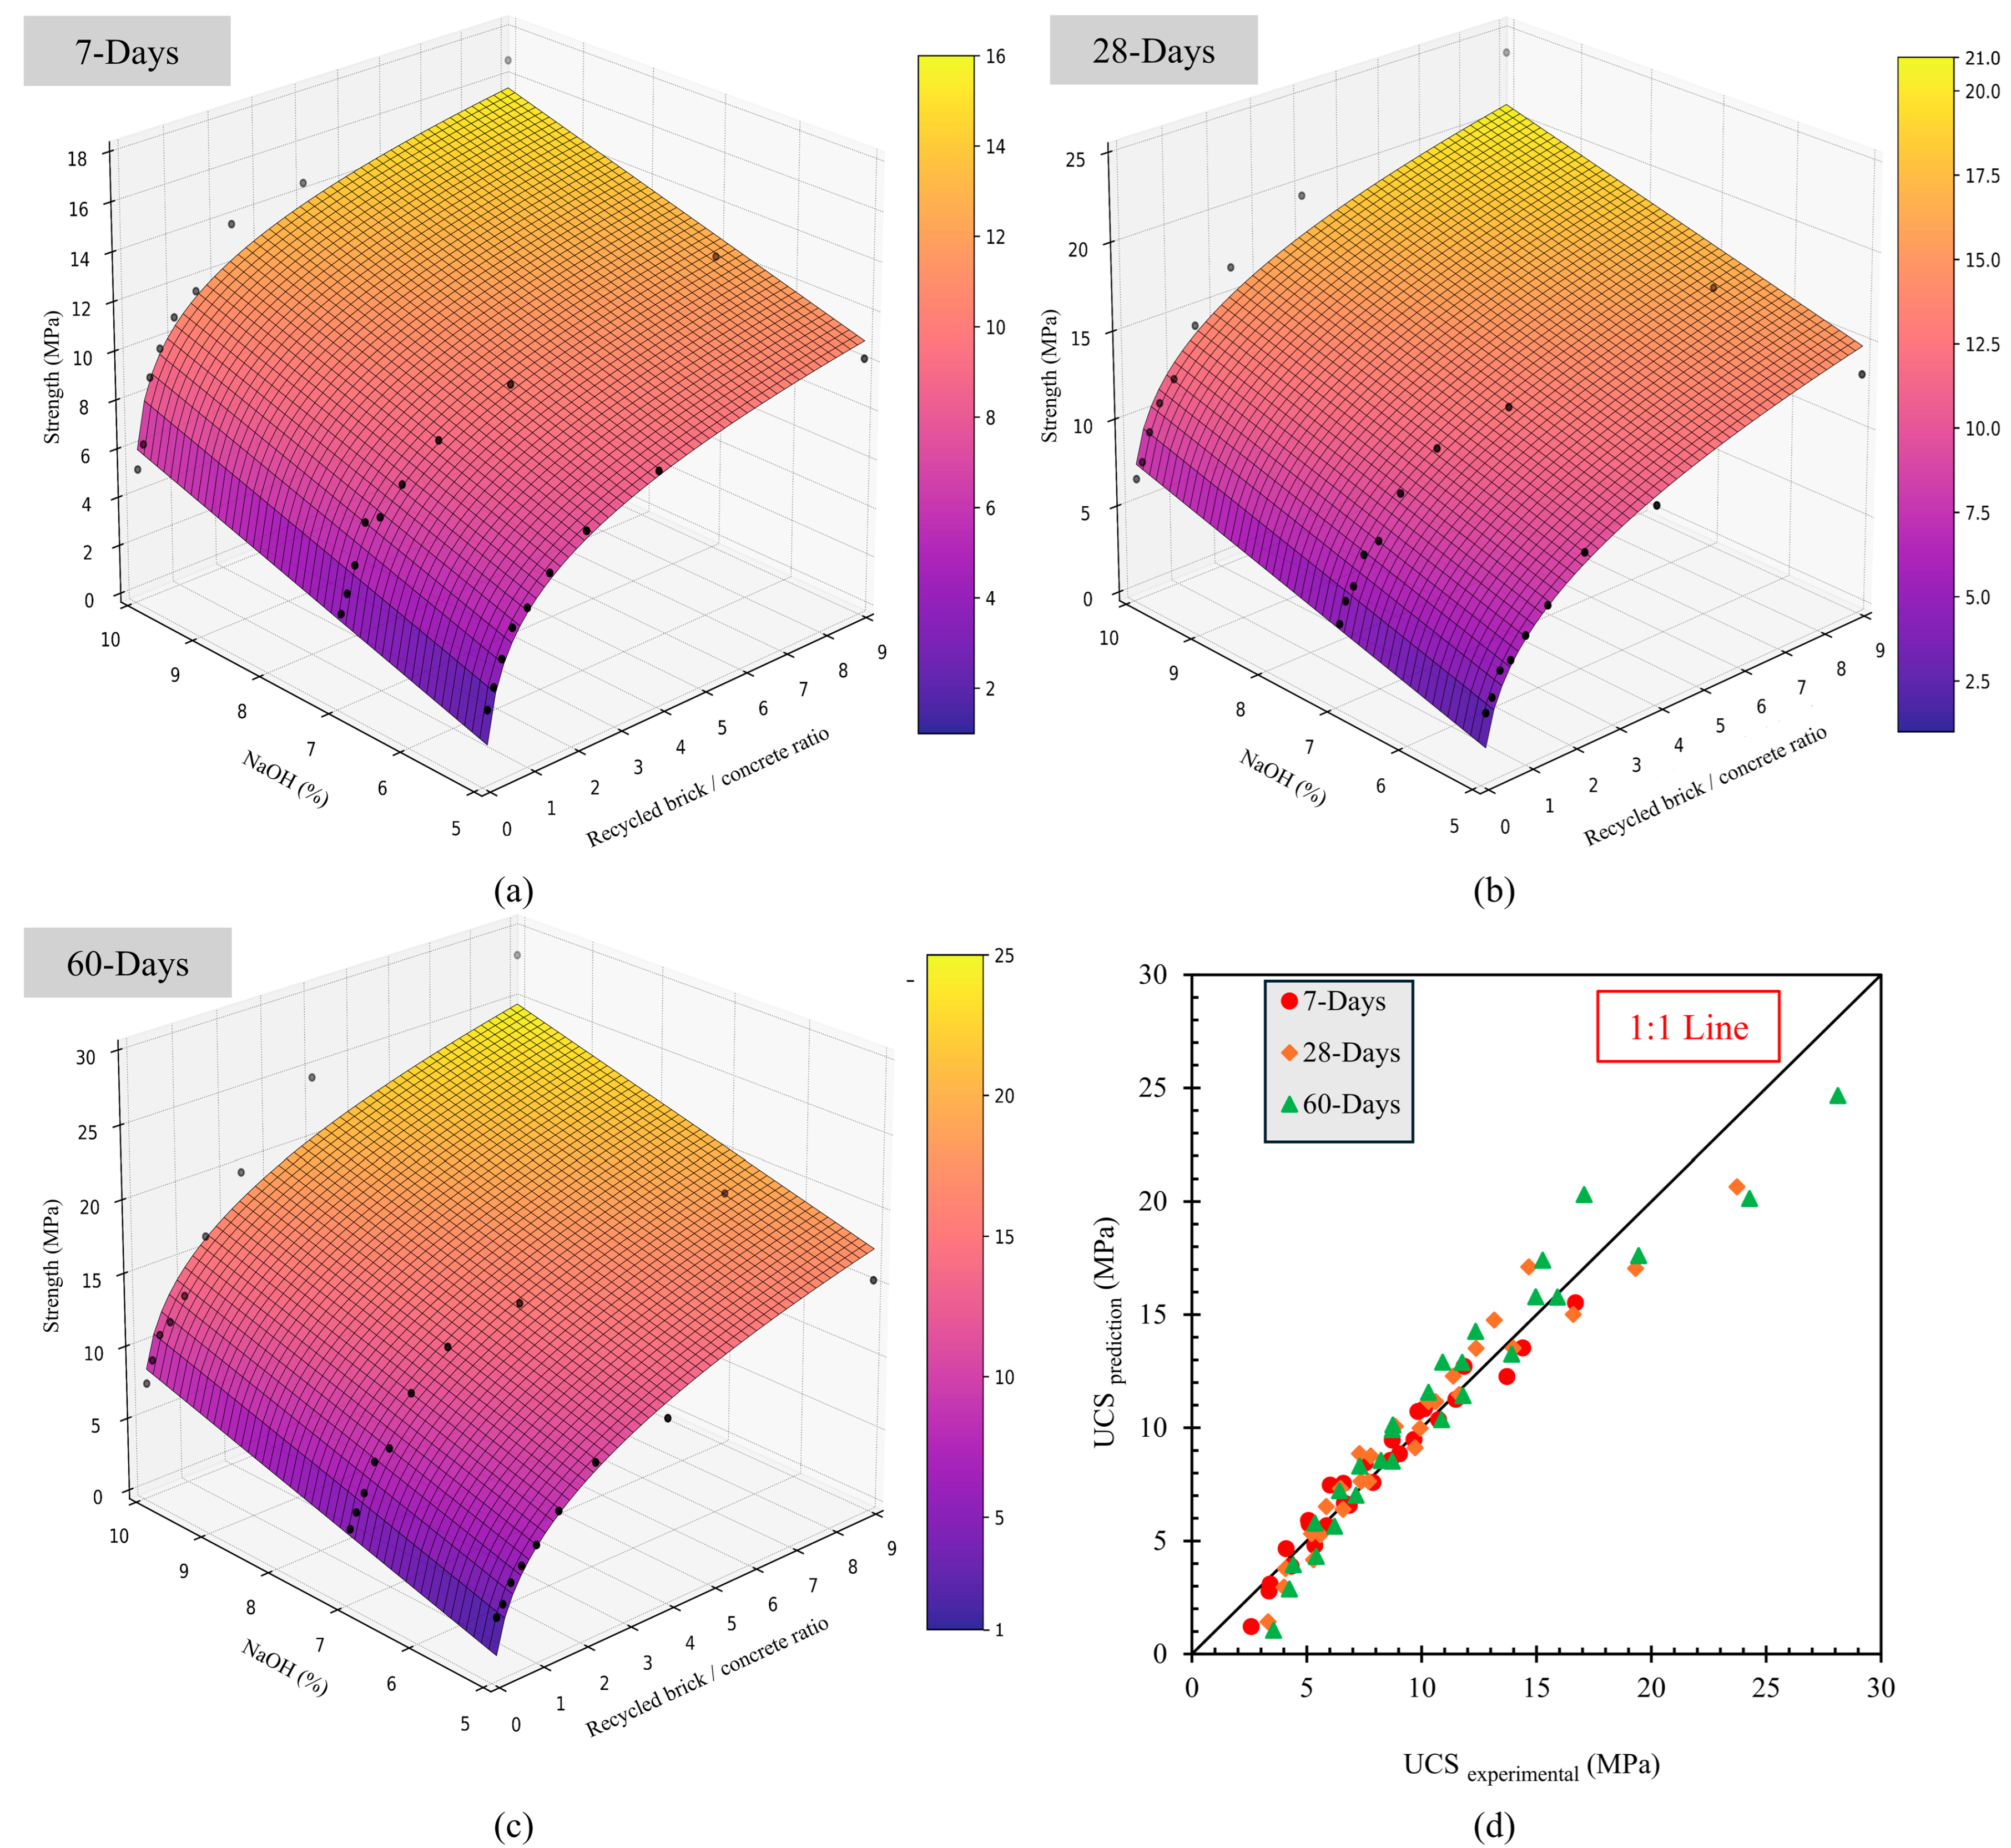
Furthermore, as shown in Figure 8, the UCS response to BW/CW follows a power-law relationship, whereas the UCS increases linearly with the NaOH content. The likely aspect behind the power-law increase with BW/CW is that the inclusion of recycled waste materials provided a progressively greater amount of reactive surfaces (from both bricks and concrete fines), which in turn accelerated and amplified the formation of key binding gels (C-A-S-H/N-A-S-H). As the BW/CW ratio increases, the matrix system transitions through microstructural thresholds, where each incremental addition of reactive particles creates disproportionately larger improvements in the connectivity and density of the binder matrix, thereby resulting in a characteristic power-law curve rather than a simpler linear trend. On the other hand, the linear trend with NaOH indicates that, within the addition range, the dissolution of aluminosilicate or calcium-bearing phases increases in proportion to the concentration of NaOH, leading towards a reaction product in a linear manner and thus impacting the UCS. Therefore, taking into account these observations, a 3D surface plot for each curing regime is illustrated in Figure 9, providing a visual representation of the interaction and influence of both variables on UCS. It is evident from the surface maps that BW/CW exhibits a strongly nonlinear effect, whilst NaOH content governs a more proportional, linear increase in UCS. Accordingly, an empirical relationship, as highlighted in Equation (2), was established to capture these individual dependencies.
U C S   k P a = α   B W / C W β + λ   ·   N a O H + κ
where α, β, κ, and λ are the regression coefficients that vary with the curing regime and are tabulated in Table 6. Equation (2) provides a practical framework for predicting strength behaviour, integrating material composition and chemical activation effects within a unified expression. In Table 6, the coefficient of determination (R2) remains higher across all curing regimes, indicating a strong overall fit of the proposed empirical equations to the experimental data. From Figure 9d, the predicted versus experimental UCS values confirm that the model predictions align closely with the experimental data for all three curing regimes.
Equation (2) applies within the BW/CW range of 0.11 to 9.0. It is essential to note that the dataset intentionally excludes cases where the composition is BW/TW 0 and 1. This exclusion criterion is set based on earlier observations, where specimens with a BW/TW ratio of 0 yielded the lowest UCS value due to insufficient interaction between components. On the other hand, a mix containing a BW/TW ratio of 1 also exhibits a decline in strength, which might be due to the lack of a sufficient calcium-based phase required for geopolymeric gel formation under alkaline conditions. The exclusion of these datasets allowed the model to focus on the interactive interaction between BW and CW.

4.1.3. Generalised Strength Prediction Modelling Using Dimensional Analysis

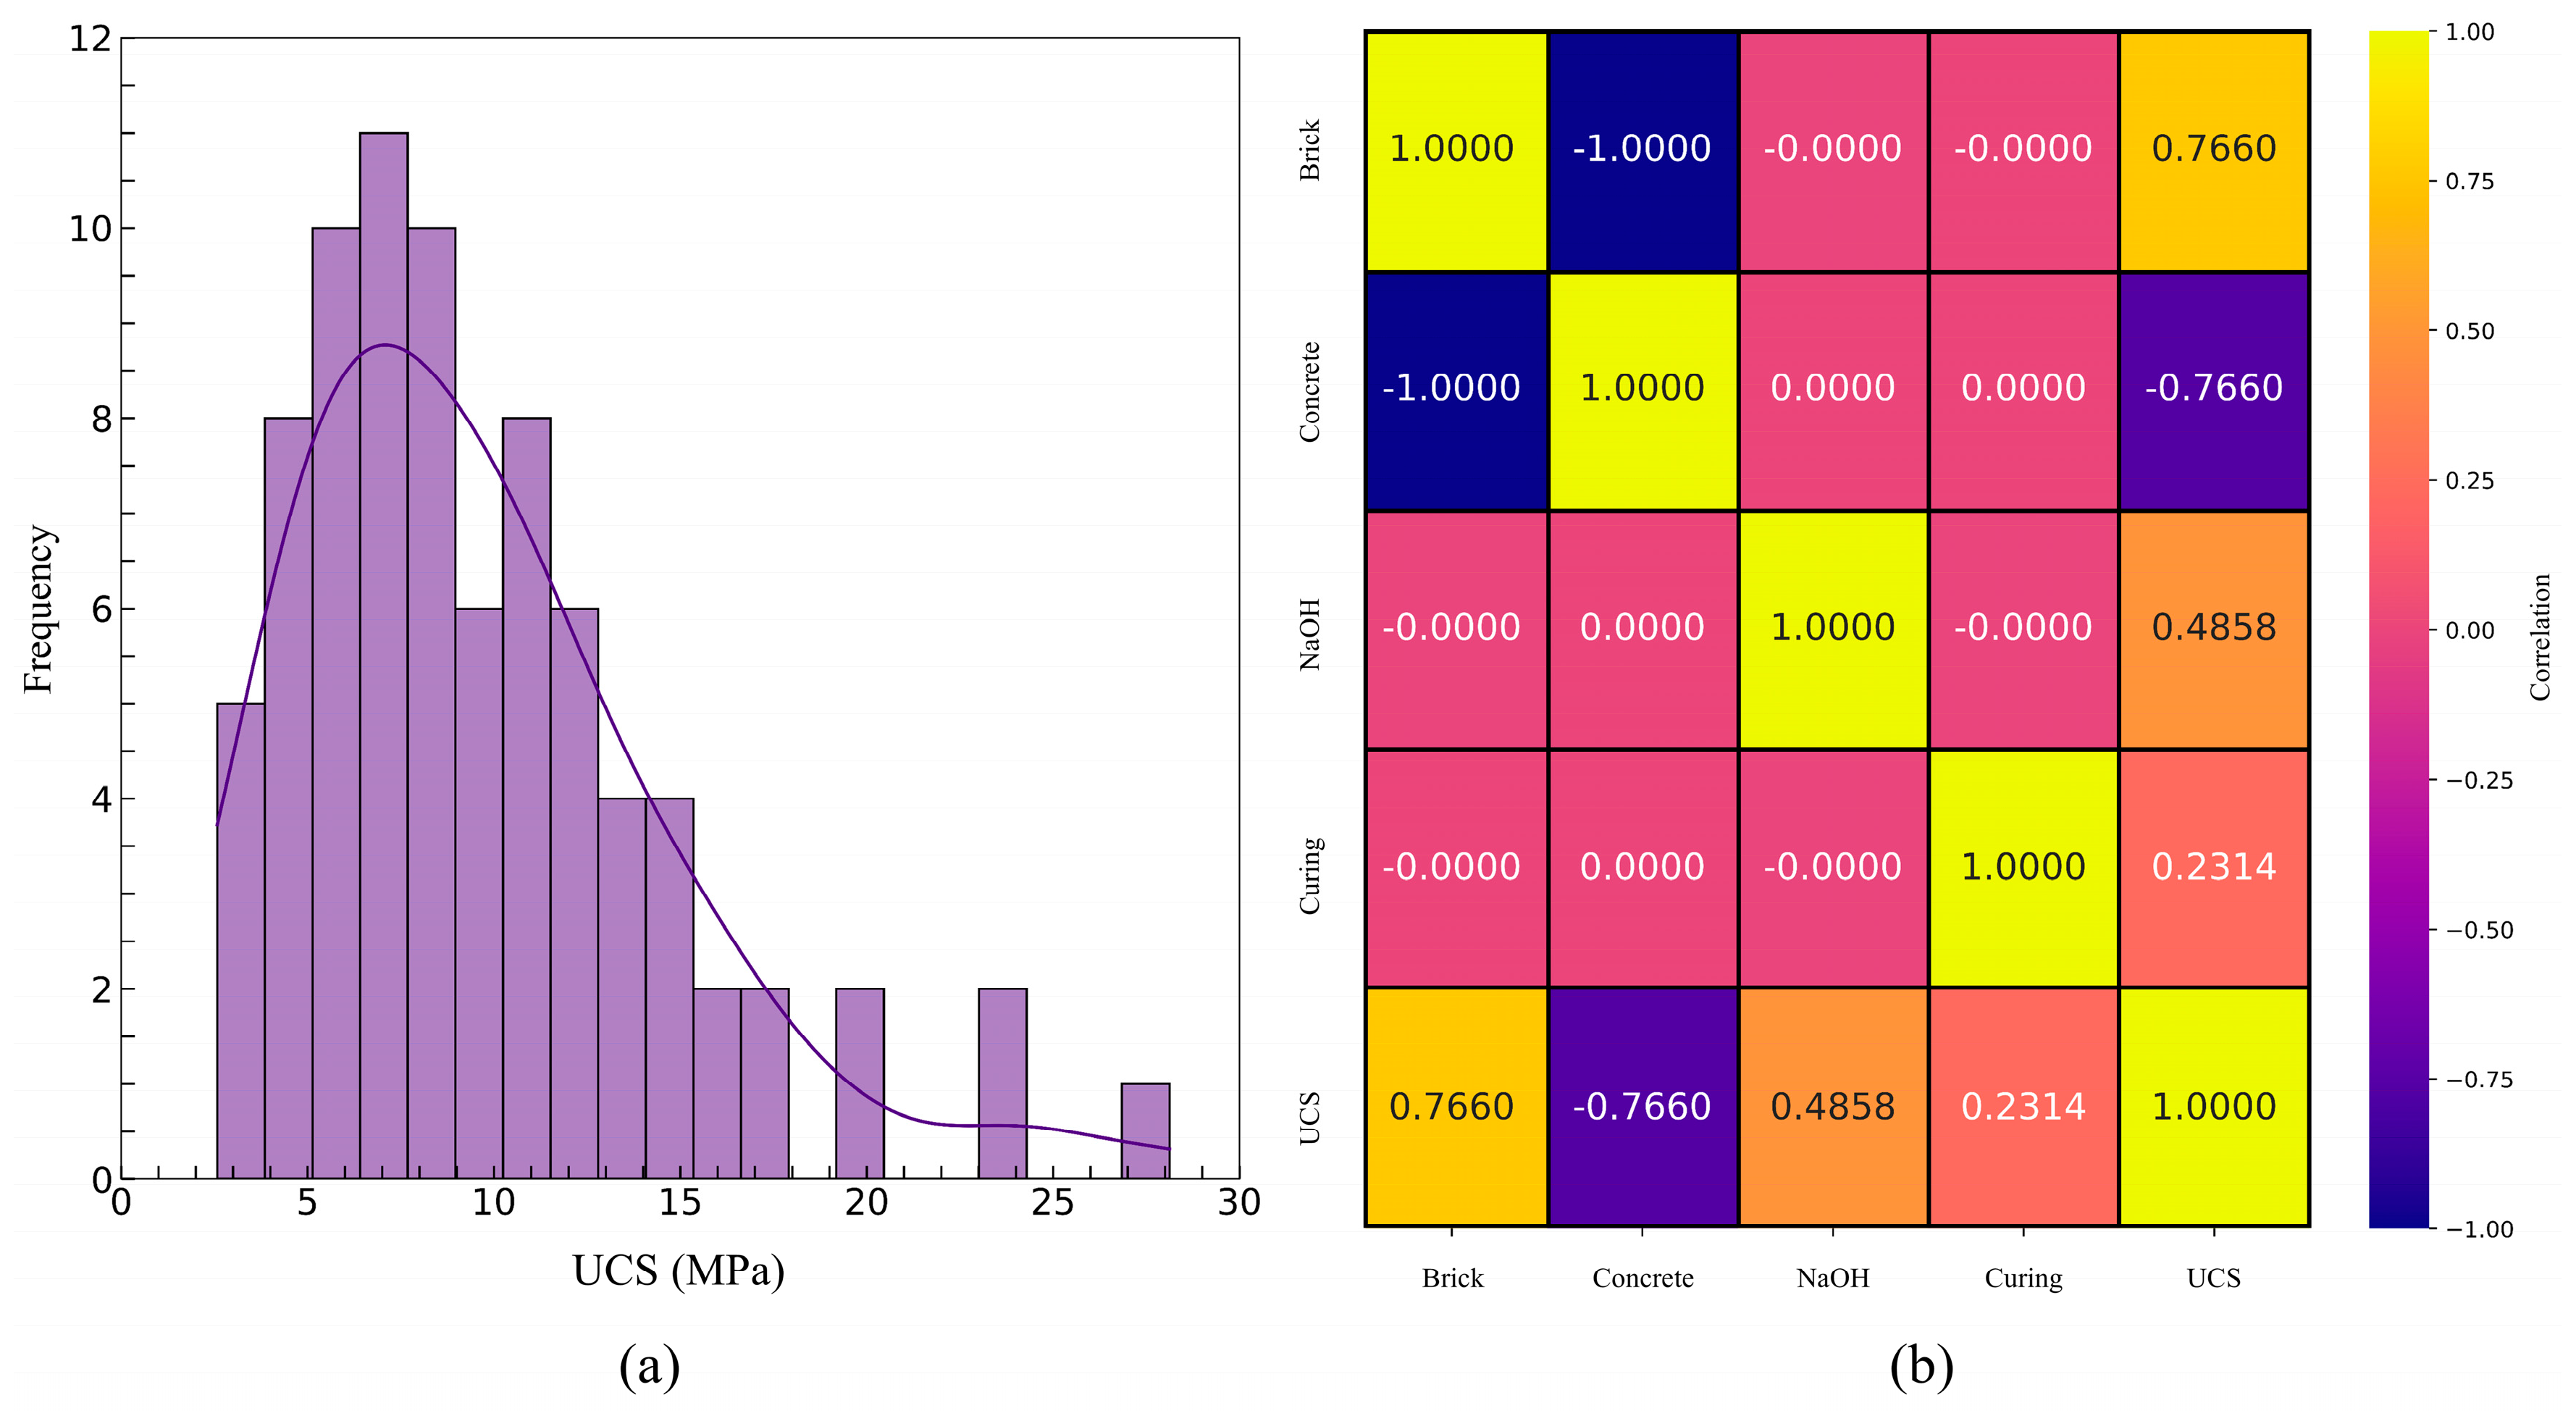
As observed earlier, the curing regime has a pronounced impact on the development of UCS, with longer curing regimes leading to higher UCS due to progressive geopolymerization and binder formation. Frequency distribution and correlation analysis are illustrated in Figure 10 to gain initial insights into the experimental dataset. The frequency distribution of UCS values (Figure 10a) revealed a moderately right-skewed pattern, with most UCS values concentrated around the mid-strength range. This strength reflects the inherent variability in mortar composition and curing conditions across the tested specimens. To further gain insights into how the variables influence the UCS, Figure 10b shows that the Pearson correlation heatmap indicates a strong positive correlation between recycled brick and strength (r = 0.766), suggesting that an increase in BW proportions in AAPs enhances UCS. Conversely, the recycled concrete content exhibited a strong negative correlation (r = −0.766), indicating that the UCS values decrease as the concrete content increases. The NaOH content exhibited a moderate positive correlation with strength, while the curing regime had a relatively lower influence among all variables.
To systematically account for this influence within the predictive framework, dimensional analysis using the Buckingham π-theorem was applied. This method enables the transformation of key physical variables into a set of non-dimensional parameters, allowing for the development of a generalised, scalable empirical model that captures the combined effects of recycled materials composition, alkali concentration, and the curing regime on UCS behaviour. As a first step, relevant variables were identified, where UCS is considered as the dependent variable and is governed by independent variables, as shown in Table 7. From Table 7, all variables except UCS and curing regime (T) are inherently dimensionless as they are expressed in mass percentages.
Applying the Buckingham π-theorem, the relevant dimensionless groups were constructed by dividing them into three groups. The first group (π1) represents UCS normalised by the curing regime, the second group (π2) represents the recycled CW/BW ratio, and the third group (π3) represents the NaOH content. All the groups and their parameters are highlighted in Equation (3).
π 1 = U C S T   ;   π 2 = C W B W   ; π 3 = N a O H  
To construct a dimensionally consistent empirical model, assuming a general power-law form between these non-dimensional variables leads to a relationship as described in Equations (4) and (5).
U C S T = χ   · C W B W η ·   N a O H λ
U C S = χ   · C W B W η ·   N a O H λ   ·   T
Equation (5) presents a dimensionally consistent and scalable representation of UCS that accounts for the effects of mix proportions, alkali activation, and curing regime. To linearise the power-law form, the logarithmic transformation (Equation (6)) is applied to both sides of Equation (5) to estimate the model parameters (χ, η, and λ) using the multiple linear regression method.
log U C S = log χ + η log C W B W   + λ log N a O H + log T
To ensure dimensional consistency, the modelling process began with formulating a power-law expression described in Equation (5). The regression coefficients were computed using ordinary least squares (OLS) regression, implemented via Python-based code through the statsmodels package.api library; however, Equation (6)’s predictive capability was limited (R2 = 0.319). Therefore, a log-linear exponential model was subsequently developed using the dimensional inputs (Equation (7)).
log U C S = χ + η   ·     B W + π   ·   C W + λ   ·   N a O H + ω   ·   T
By exponentiating both sides of Equation (7), the final UCS prediction equation is highlighted in Equation (8). Based on the regression analysis of the log-linear transformed UCS dataset, the regression coefficients of Equation (8) are established in the final form, as highlighted in Equation (9).
U C S = e x p   χ + η   ·     B W + π   ·   C W + λ   ·   N a O H + ω ·   T
U C S   k P a = e x p     0.0002 + 0.0193   C W + 0.0031   B W + 0.1211   N a O H + 0.0101   T  
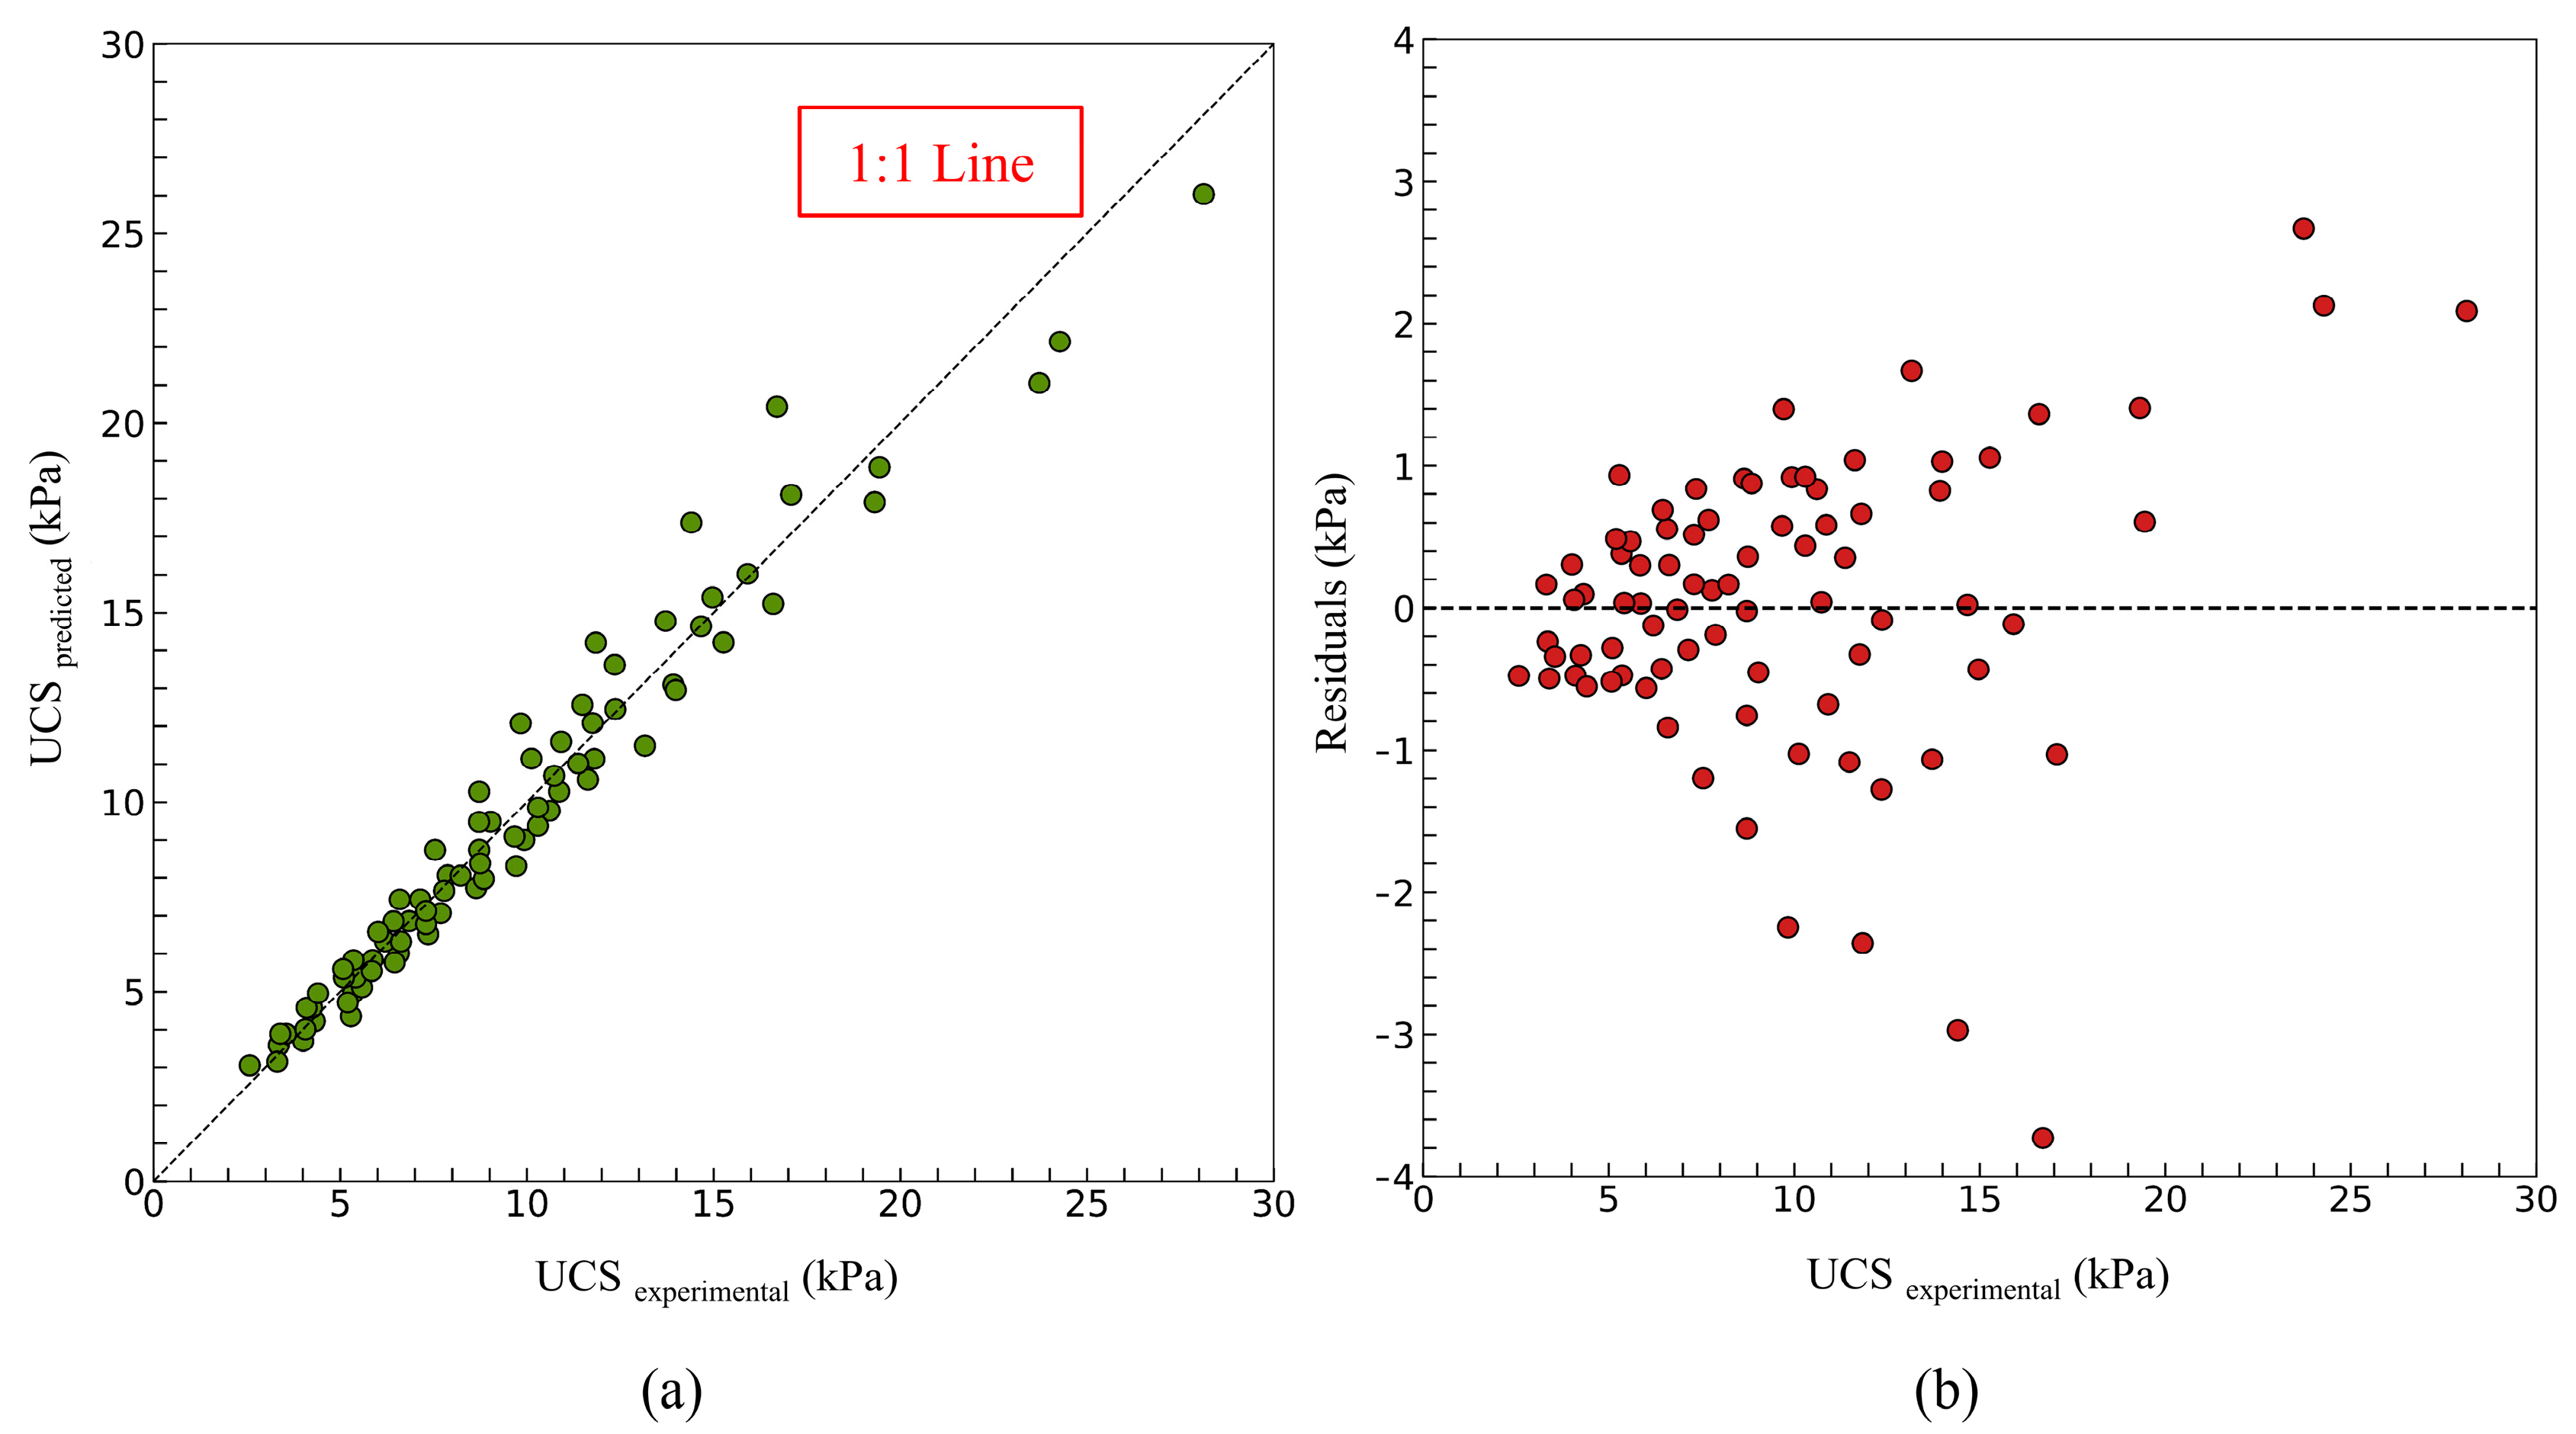
The model demonstrated good overall predictive accuracy, with an R2 of 0.9577 and an RMSE of 1.0331 MPa. In Figure 11a, the comparison between the predicted (Equation (9)) and experimental UCS is illustrated, with the predicted UCS values closely aligning with experimental measurements through tight clustering around the 1:1 line. The residual plots (Figure 11b) also show random scatter, indicating no systematic bias in prediction across the low to high UCS ranges.

4.2. Stiffness/Initial Shear Modulus

4.2.1. Influence of Alkali Content, Curing Duration, and Binder Composition on AAP Stiffness

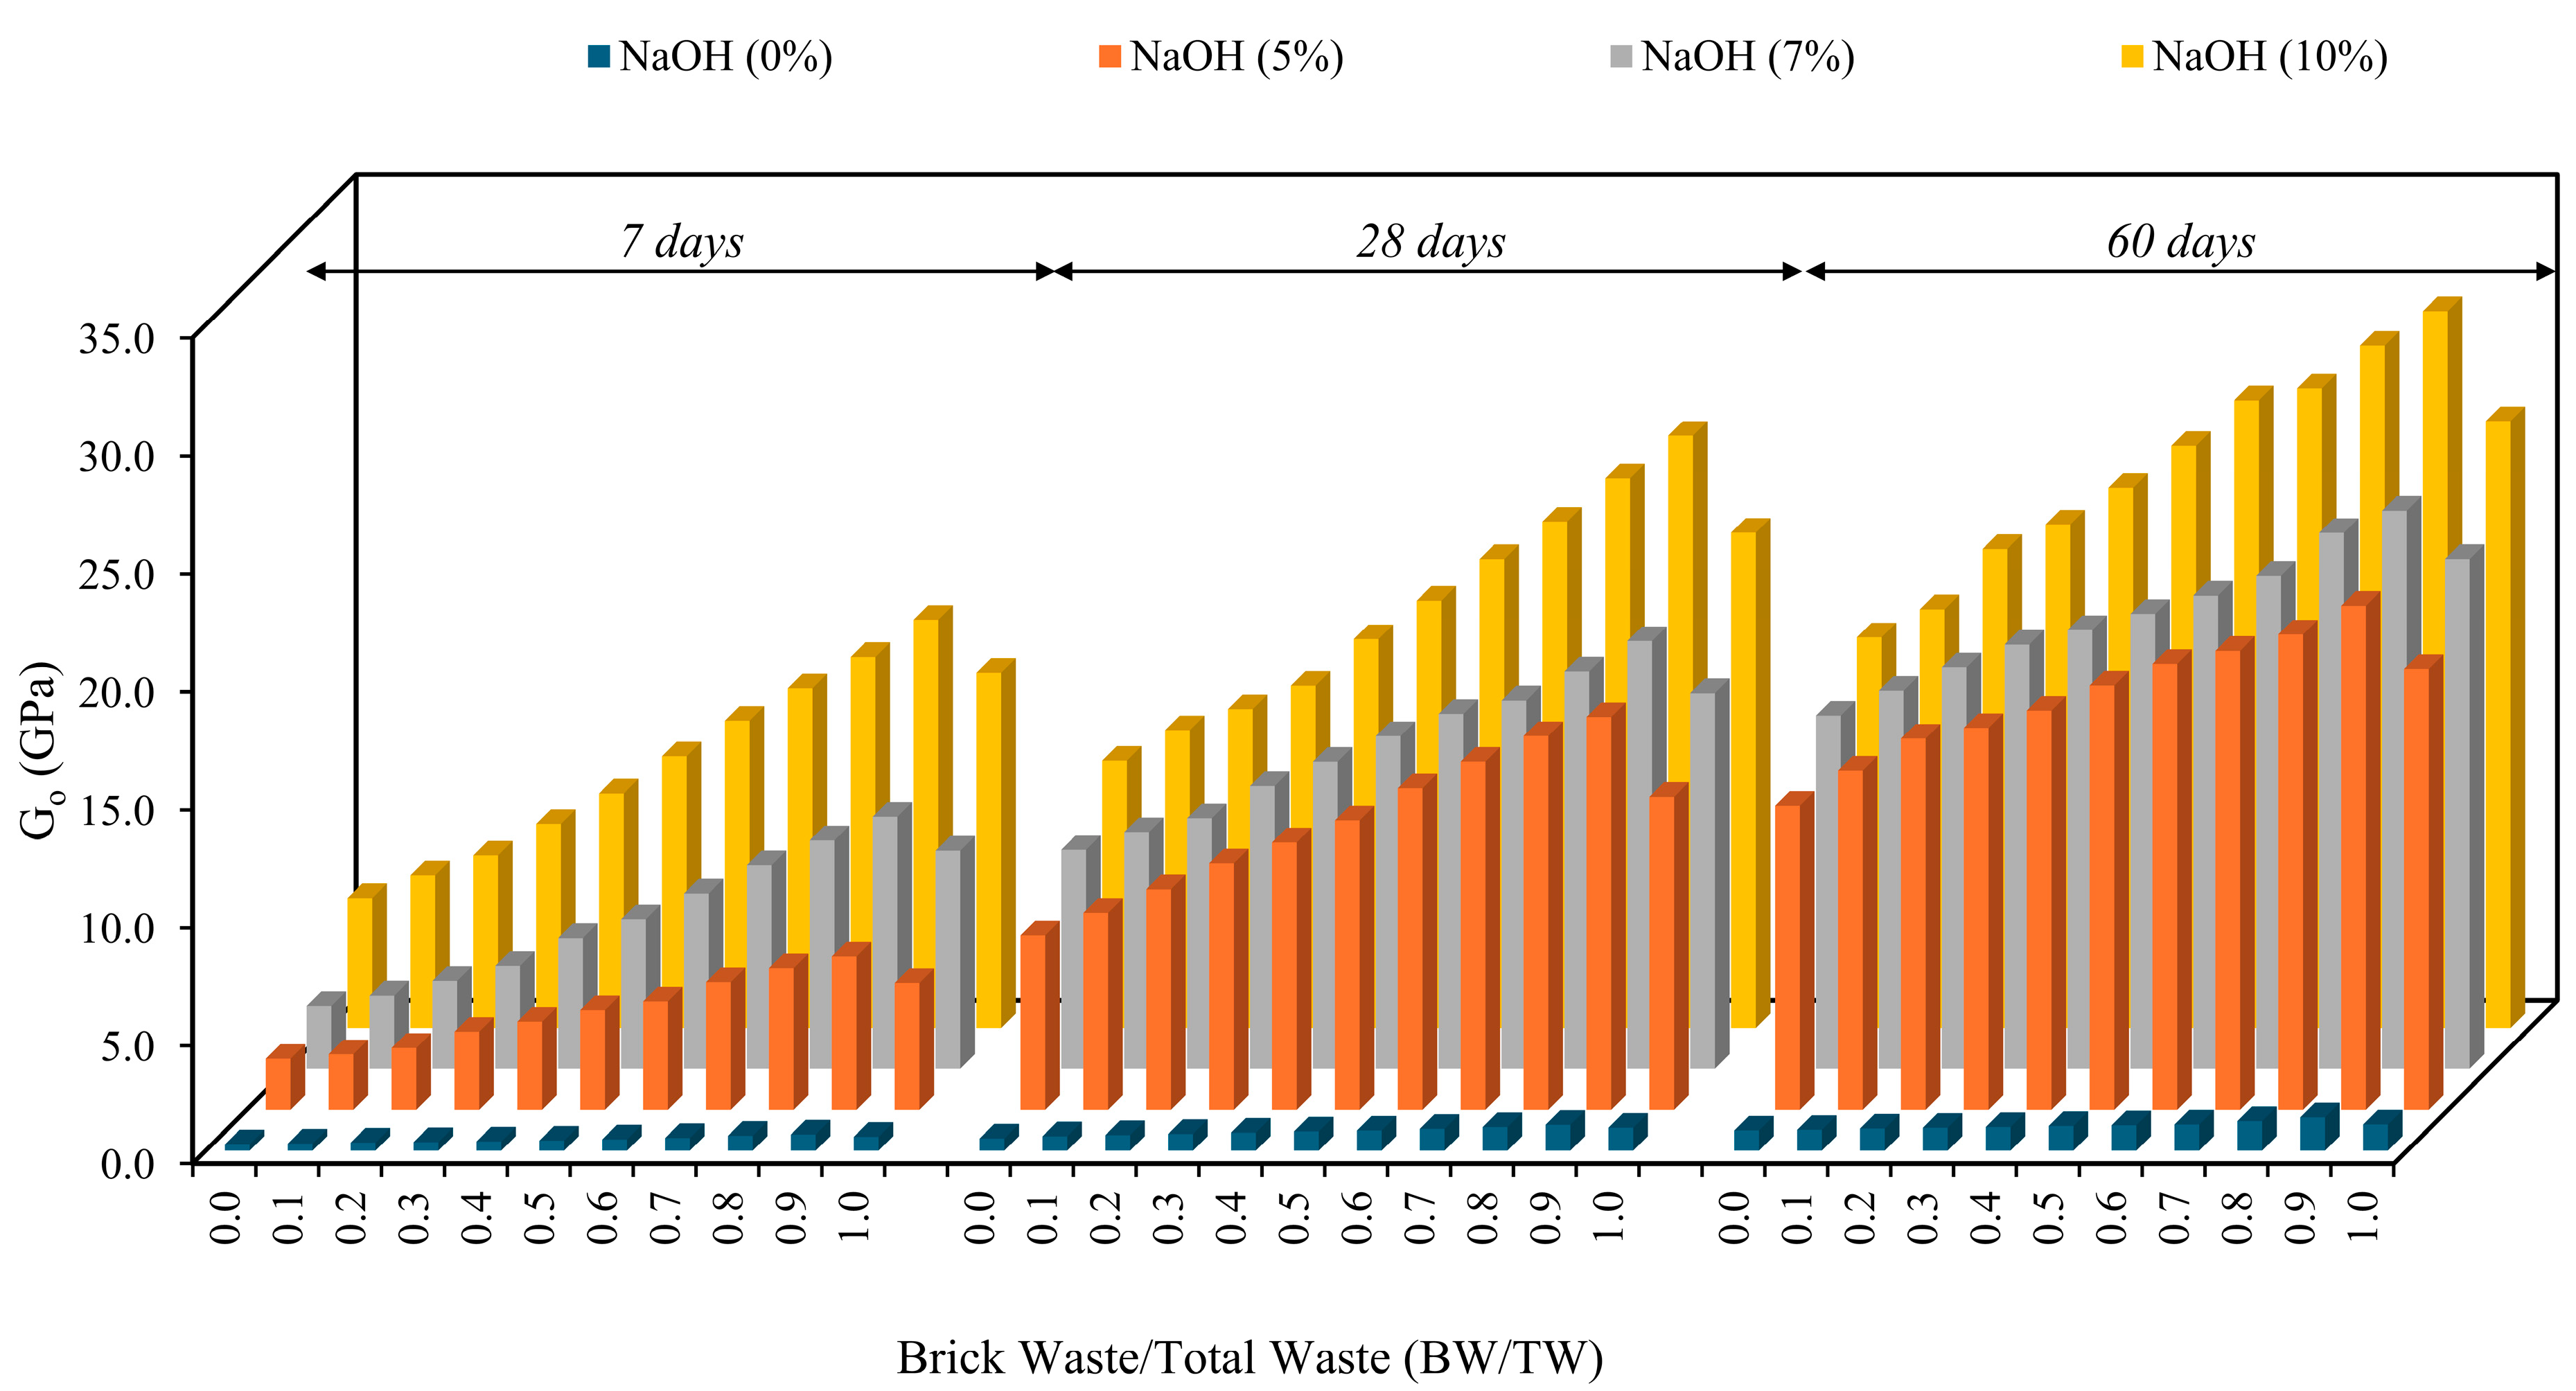
The stiffness for all mortar mixes was determined using the initial shear modulus (Go) via the UPV shear wave method. UPV testing non-destructively measures the homogeneity and integrity of the geopolymer matrix by measuring ultrasonic wave transit times, thereby detecting internal flaws (such as voids and cracks) and inferring mechanical properties. Figure 12 illustrates the variations in Go for mixtures evaluated under compressive strength conditions, analysed as a function of the BW/TW ratio, NaOH concentration (0%, 5%, 7%, and 10%), and curing periods (7, 28, and 60 days). Reported values represent the average of duplicate samples prepared with identical proportions. Numerous scholars have employed a comparable methodological framework throughout the literature [85,97,98,99]. The control specimens (0% NaOH) displayed only modest gains in Go, reaching a peak of 1.42 GPa in the mix with a BW/TW ratio of 0.9 at 60 days, as illustrated in Figure 12. In contrast, samples activated with NaOH achieved markedly higher Go values, underscoring the efficacy of alkaline activation in enhancing stiffness. Go increased with extended curing across all BW/TW ratios and NaOH contents, though the rate of gain diminished over time, indicating a progressive but decelerating stiffening behaviour, as shown in Figure 12. For example, a study showed that across all activator concentrations (5–12 M NaOH), UPV rose steadily between 3 and 28 days of curing, thereby corroborating the continuous progression of the geopolymerization process [98]. Complementary XRD and TGA investigations demonstrated that prolonging the curing period intensifies the generation of C-S-H and N-A-S-H gel phases within the specimens [97]. The deceleration in strength development over time reflects the distinct kinetics of hydration and alkali activation. NaOH-driven activation dominates the early age (7–28 days), after which slower, continuing hydration refines the pore structure. This progressive densification reduces porosity and enhances elastic stiffness, as evidenced by the increase in Go through improved shear-wave propagation. For instance, in the 0.9 BW/TW mixture activated with 7% NaOH, the shear modulus surged by 70% over the 7–28-day period and then dropped to only a 30% increase during days 28–60. In geopolymer concrete, activation with 10 M NaOH led to pronounced UPV gains during the early curing period (1–28 days); however, the rate of increase diminished after 90 days, likely due to moisture depletion and the onset of microcracking [99].
The Go exhibits a pronounced positive correlation with NaOH concentration (Figure 12), mirroring trends observed in compressive strength. This relationship remains consistent across BW/TW ratios (0–0.9), NaOH dosage (0%, 5%, 7%, and 10%) and curing durations. Peak Go values of 21, 23, and 30 GPa are achieved for the mixture with a BW/TW ratio of 0.9 at 60 days under NaOH concentrations of 5%, 7%, and 10%, respectively. NaOH creates a highly alkaline environment that dissolves aluminosilicate phases in CDW, forming C-S-H and N-A-S-H gels. These gels densify the matrix and increase crosslinking, leading to higher stiffness and Go at higher NaOH concentrations. As reported in the study, higher NaOH concentrations (6–10 M) significantly accelerate geopolymer gel formation, thereby reducing porosity and enhancing wave propagation. Specifically, mixtures with 10 M NaOH exhibited rapid initial UPV gains (750–1400 m/s) attributed to faster reaction kinetics and denser microstructural development [99]. Similarly, geopolymer bricks showed continuous UPV gains up to 12 M NaOH, reaching 5000 m/s, as denser matrices formed with fewer unreacted particles [98]. Furthermore, the study demonstrated that increasing the Na2O content (9–15%) significantly enhances geopolymerization, resulting in improved UPV resistance, mechanical stiffness, and strength. For instance, at 15% Na2O, fly ash mortars achieved compressive strengths of 18.1 MPa, elastic moduli of 18.4 GPa, and UPV values near 3424 m/s [85]. Similarly, a strong linear relationship between UPV and compressive strength (R2 = 0.91–0.96) indicates that enhanced microstructural integrity, reflected in greater density and uniformity, contributes to the concurrent improvement in both strength and ultrasonic properties [99]. A key observation supporting this relationship is the decline in Go for the mix with a BW/TW ratio of 1.0, which closely mirrors the reduction in compressive strength.

4.2.2. Empirical Stiffness Prediction Equation Development

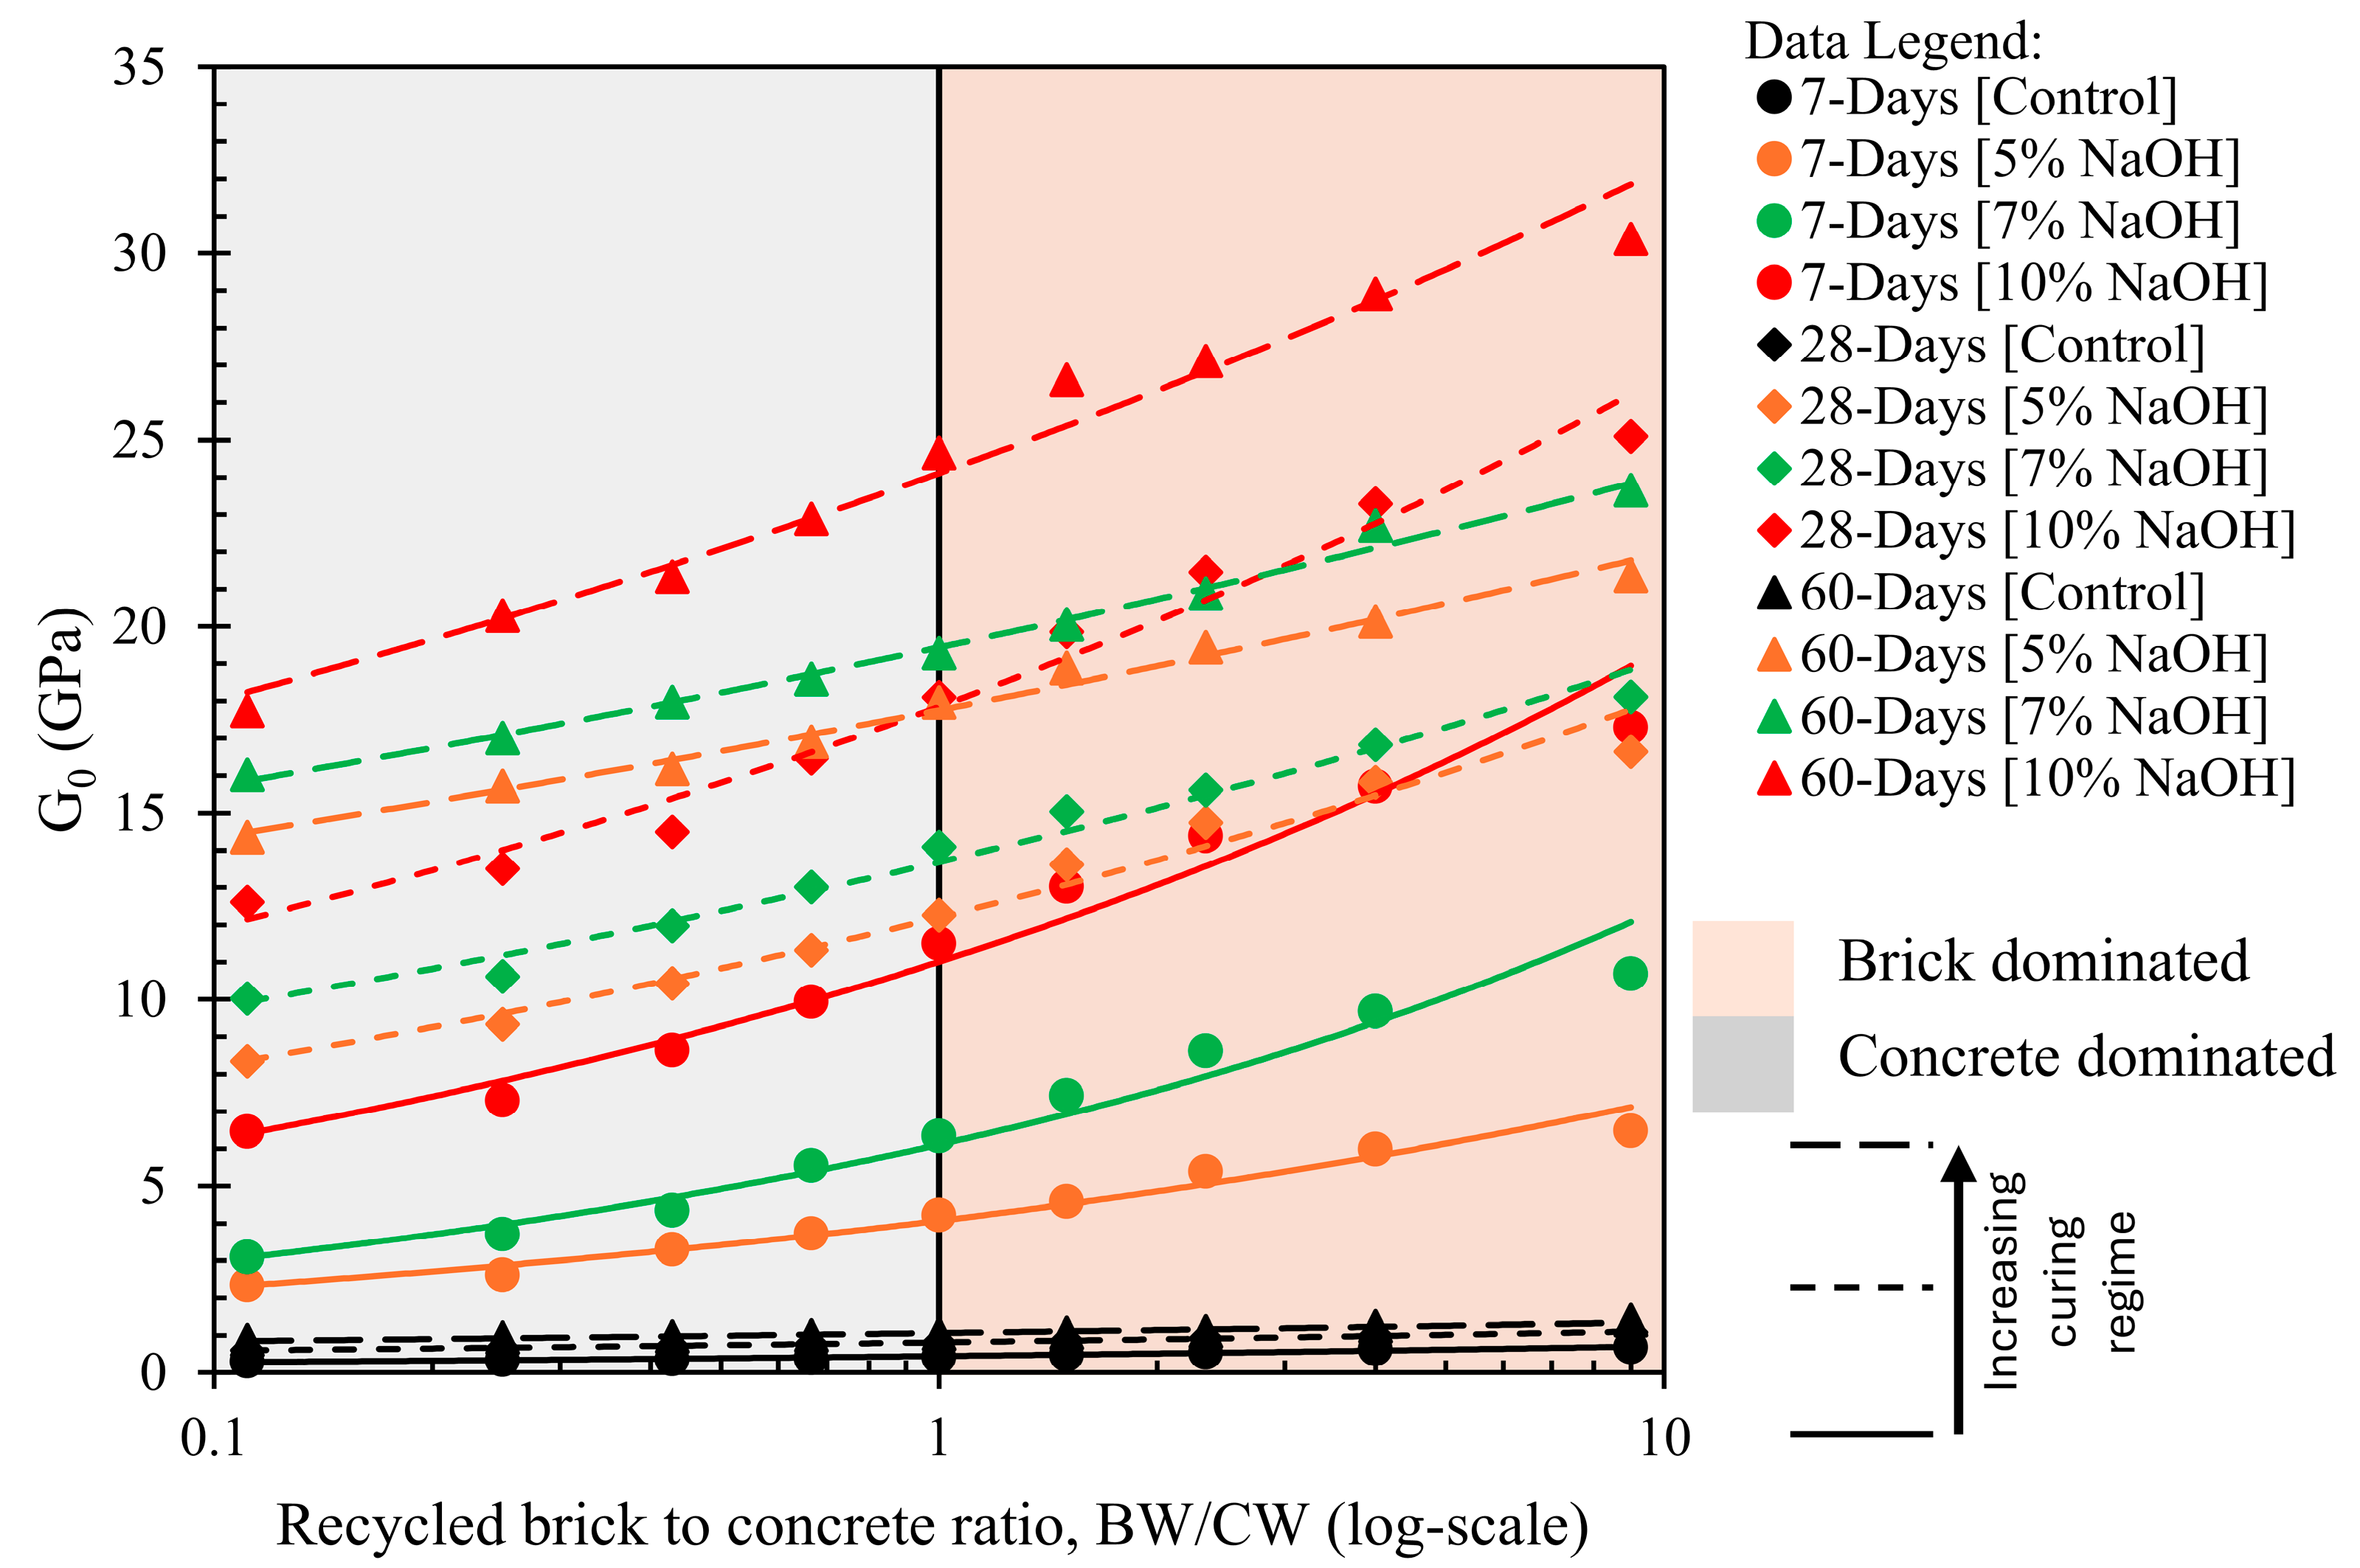
In the context of the observations recorded for UCS, the Go also exhibited a systematic trend with respect to the mix composition, NaOH content, and curing regime. As illustrated in Figure 13, the Go increases with increasing BW/CW, a counterintuitive trend given that bricks are generally less stiff than recycled concrete. As described earlier, finely ground brick particles likely enhanced matrix densification through improved particle packing, thereby contributing to reactive aluminosilicates that participated in the alkali activation process. These effects are further magnified under higher NaOH concentrations (10%), where enhanced dissolution and binder formation improved interparticle bonding and stiffness.
Additionally, the role of curing duration remains critical, as longer curing regimes promote more microstructure refinement due to geopolymerization, which directly translates into higher shear stiffness of AAPs. These aspects collectively supported the formulation of an empirical model similar to that developed for UCS, which was achieved by combining the power-law influence of BW/CW with the linear contribution of NaOH content (Figure 14), as highlighted in Equation (10). The fitting coefficients of Equation (10) are tabulated in Table 8.
G o   G P a = α   B W / C W β + λ   ·   N a O H + κ

4.2.3. Shear Modulus Prediction Modelling Using Logarithmic Regression

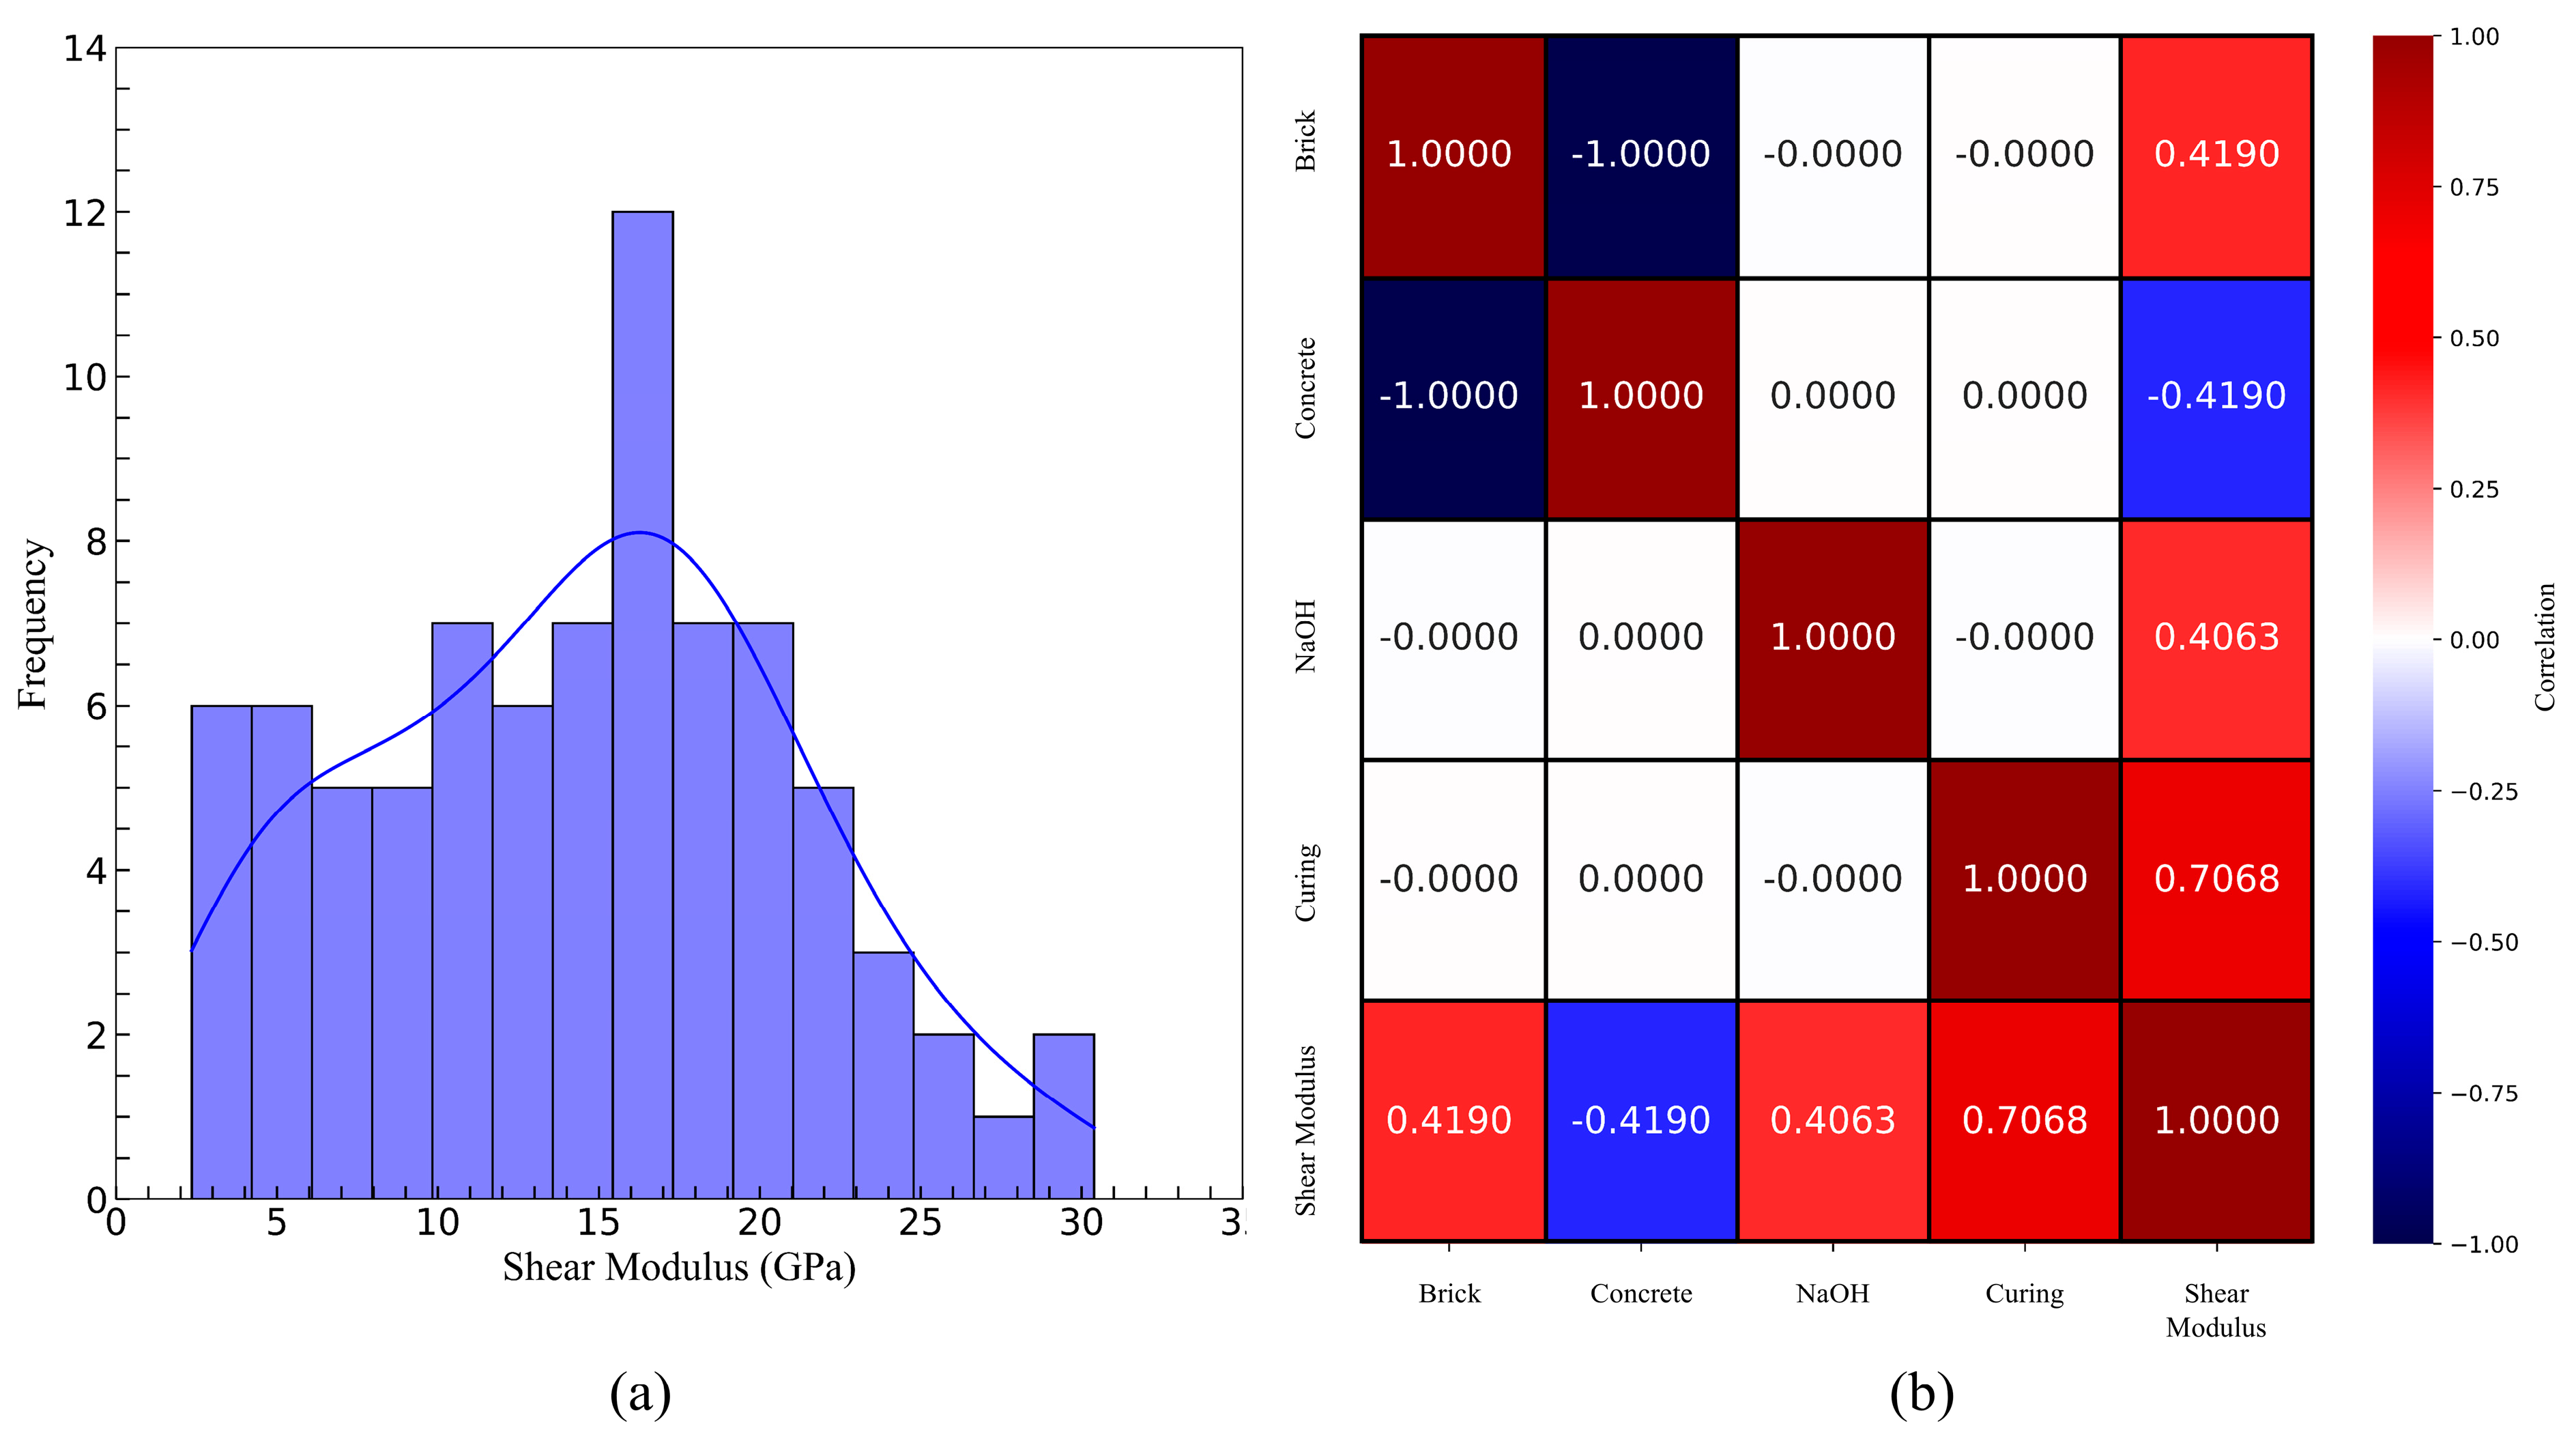
As observed previously, the curing regime has a significant impact on Go development, with longer curing durations contributing to increased stiffness due to continued binder formation and microstructural refinement. Therefore, to systematically incorporate the impact of the curing regime (similar to the approach adopted for UCS), the Go prediction was also extended using dimensional analysis based on the Buckingham π-theorem. In Figure 15a, the frequency distribution of Go highlights a moderately right-skewed distribution, with most values ranging between 10 and 32 GPa. This indicates that most samples developed moderate shear stiffness, with fewer specimens achieving a higher or lower modulus. The smooth density curve overlay highlights a relatively broad distribution, reflecting the combined effects of varying mix composition, NaOH content, and curing regime. The correlation matrix in Figure 15b indicates that curing time exhibited the strongest positive correlation with Go (r = 0.7068), confirming that extended curing significantly contributed to stiffness development. NaOH and concrete content exhibited a moderate negative correlation, whereas brick content showed a corresponding positive correlation. Overall, the correlation heatmap aligns well with earlier empirical observations, reaffirming the accounting of the curing regime.
Following the observed influence of mix composition and curing regimes, a predictive model for Go was developed using a logarithmic regression approach. The governing variables were identified as a first step and are highlighted in Table 9.
In Equation (11), the empirical structure of the model is proposed to capture the nonlinear behaviour and potential diminishing returns. This form assumes that the changes in the input produce a proportional effect on Go in the log scale.
G o = χ + η   · log C W + π   · log B W + λ   · log N a O H + ω   · log T
The formulation in Equation (11) maintains linearity in terms of coefficient determination using OLS regression. The log-transformed variables ensure that the model remains sensitive to changes across the input values. Model fitting was performed using Python-developed code using the statsmodel.api package. From the regression analysis, the final form of Equation (12) is highlighted as follows:
G o = 16.425 +   1.935 log C W 2.375 log B W + 9.492 λ   log N a O H + 6.250 log T
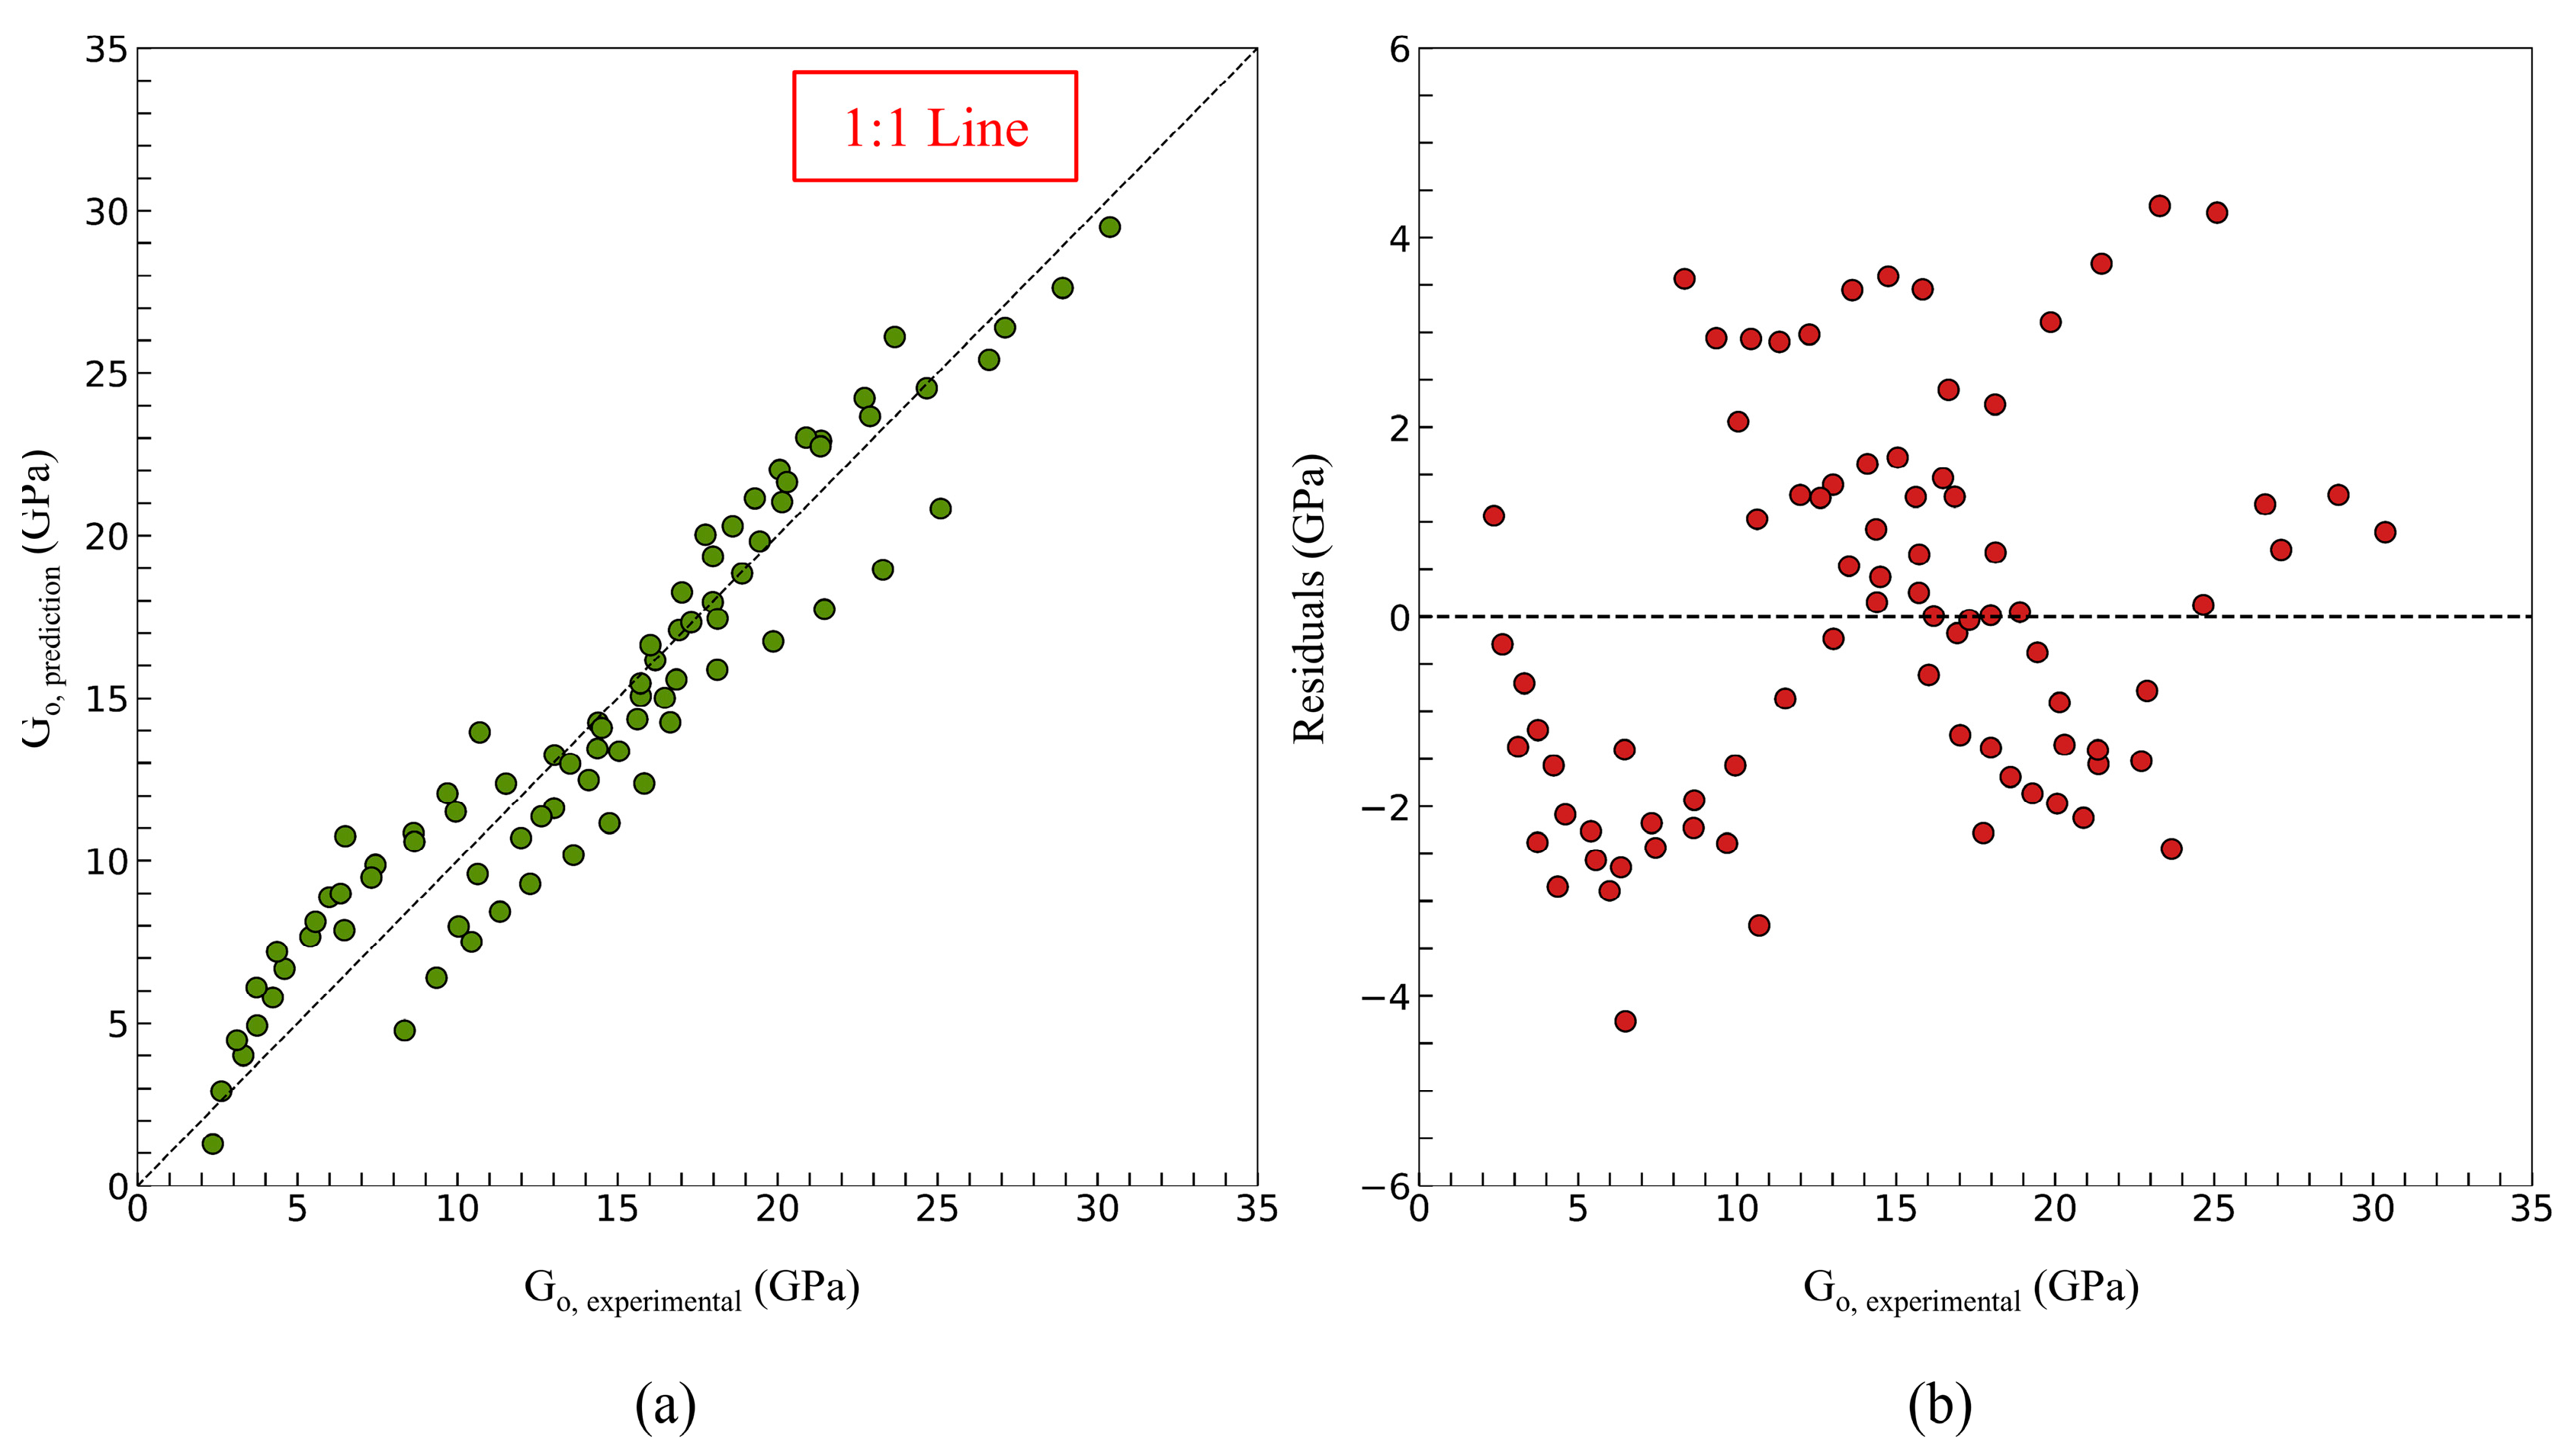
The developed logarithmic regression model (Equation (12)) demonstrated strong predictive performance, yielding an R2 of 0.9089 and an RMSE of 2.033 GPa. These metrics indicate a good agreement between predicted and experimental values (Figure 16a). In Figure 16b, the residual plot shows a relatively random and symmetric scatter around the zero line, indicating that the model does not exhibit systematic bias across the range of Go.

4.3. Effect of NaOH Concentration, Curing and CDW Composition on AAPs Freeze and Thaw Resistance

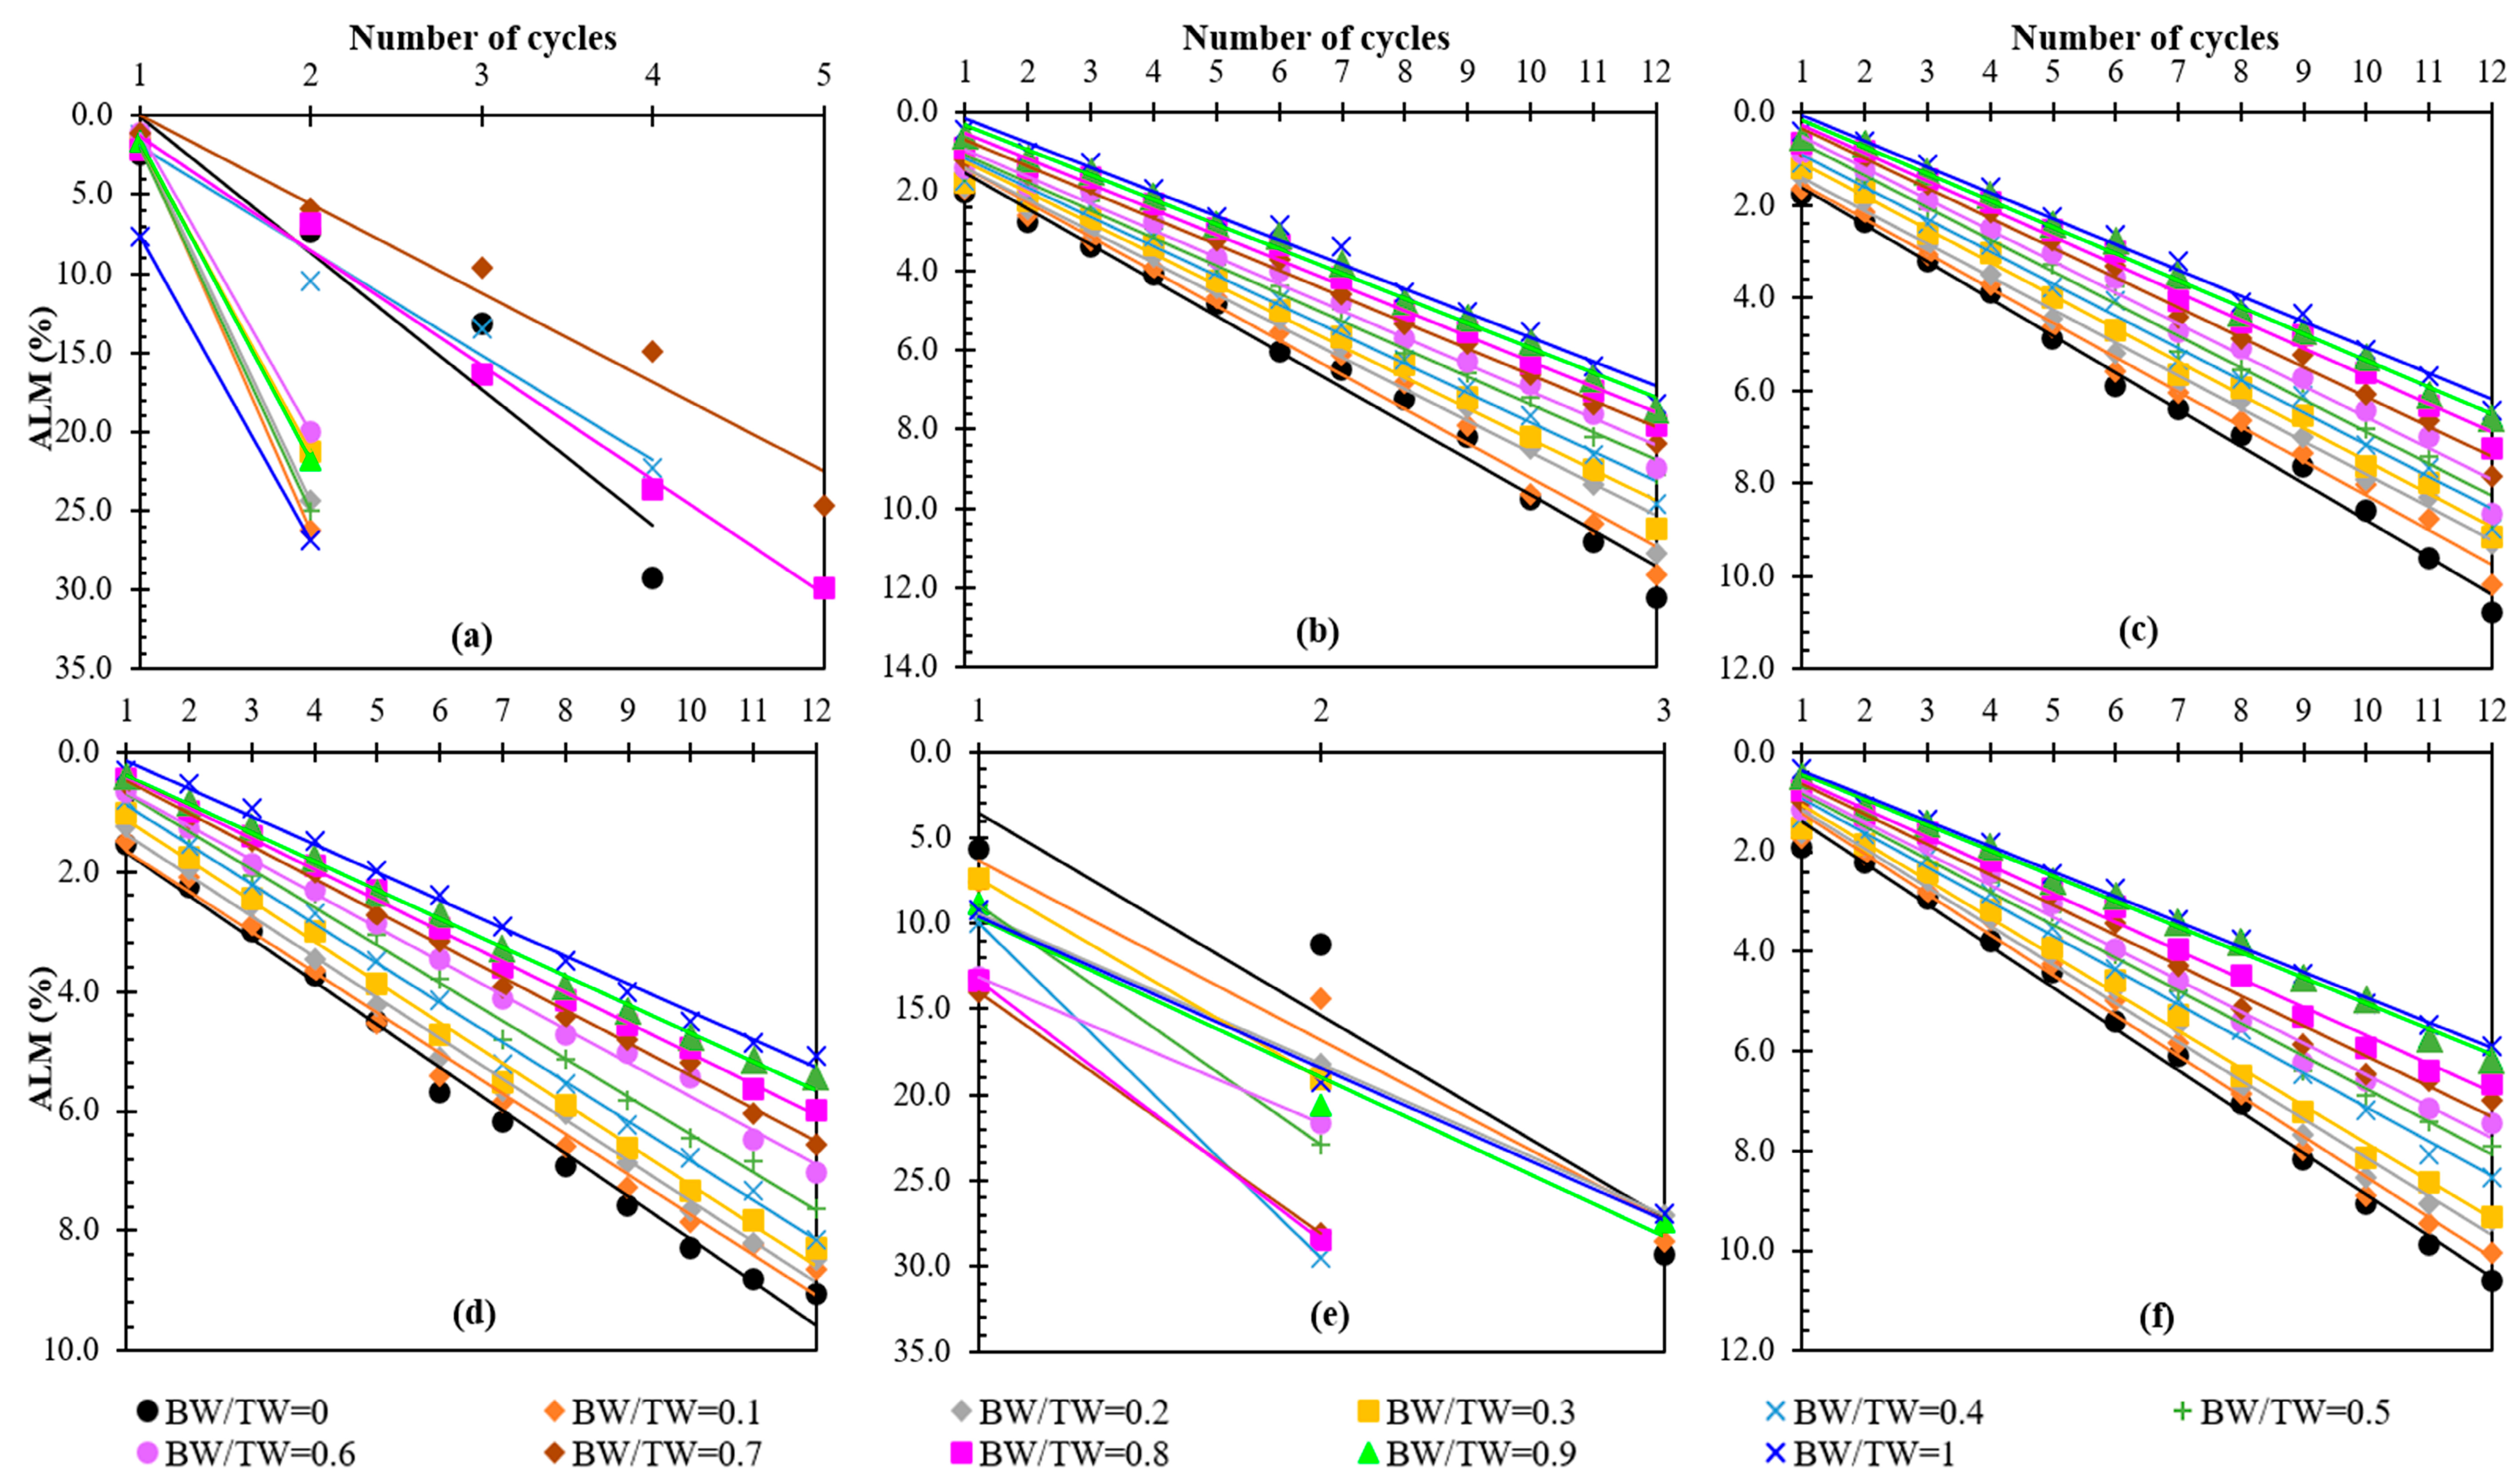
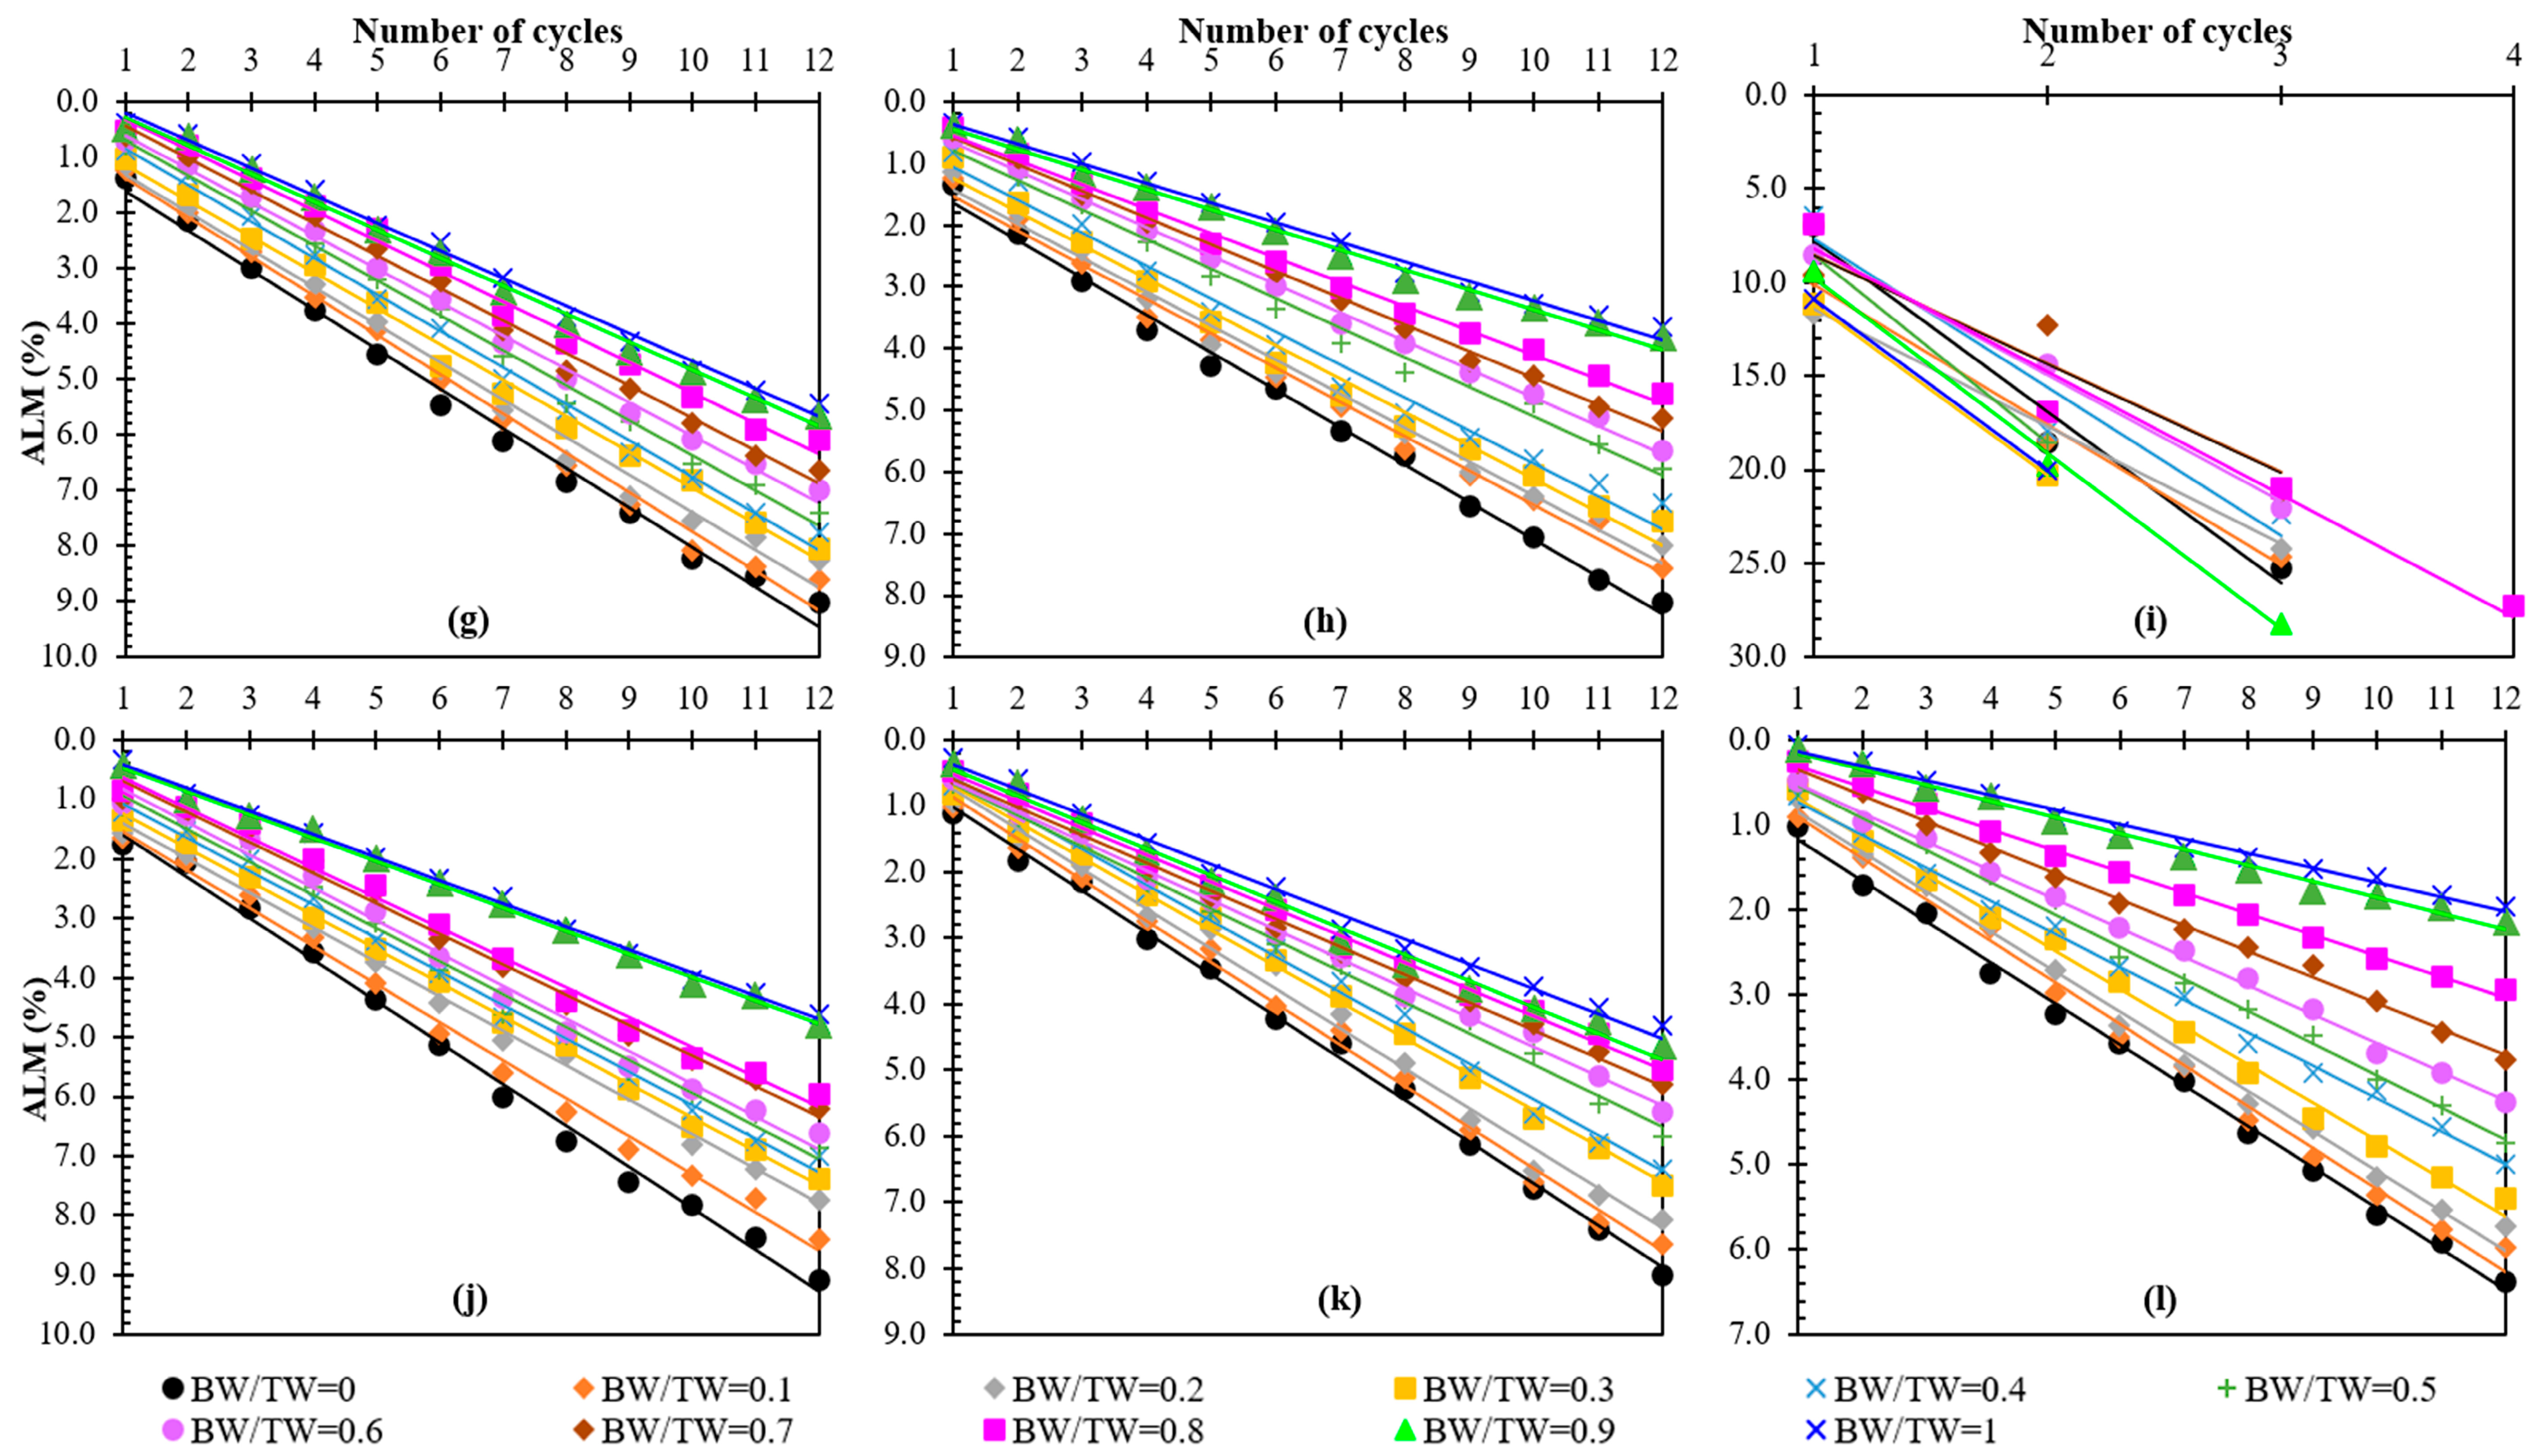
The frost resistance of alkali-activated CW/BW blends was evaluated by subjecting specimens to a series of freeze–thaw (F/T) cycling tests. ALM is plotted in Figure 17 as a function of the BW/TW (0–1) ratio, NaOH dosage (0, 5, 7, and 10%), and curing duration (7, 28, and 60 days). The experimental data reveal a critical limitation in the frost resistance of control mixes. As evidenced in the graph, all control specimens, regardless of the BW/TW ratio and curing period, exhibited premature failure during F/T cycling, failing to complete the target 12 cycles. The performance of these non-alkali-activated blends was notably poor, with cycle completion ranging narrowly between 2 and 4 cycles, as shown in Figure 17a,e,i and Figure 18. The rapid mass loss and disintegration observed in these mixes suggest that the control mixture lacks the binding phases or pore refinement necessary to resist cyclic frost-induced stresses, resulting in unpredictable ALM trends (Figure 17a,e,i).
By observing the mixes prepared using an alkali activator, it is clear that the AAPs completed all 12 F/T cycles and demonstrated a substantial reduction in ALM, as shown in Figure 18. Furthermore, a critical inverse relation was observed between NaOH dosage and ALM. A consistent linear increase in ALM was observed over the 12 F/T cycles for AAPs incorporating NaOH (Figure 17b–d,f–h,j,k). The lowest ALM values were consistently recorded at a 10% NaOH concentration, regardless of the BW/TW ratio and curing period. The reduction in ALM with increasing NaOH dosage is linked to the progression of geopolymerization. Higher NaOH concentrations facilitate the dissolution of aluminosilicate precursors from BW and CW, promoting the formation of a cohesive N-A-S-H and C-A-S-H gel matrix. These gels densify the microstructure, refining pore networks and reducing capillary porosity, which minimises water penetration and ice-related stress during F/T cycling. This finding aligns with existing literature, where increasing Na2O dosage from 4% to 6% in alkali-activated concrete (AAC) reduces mass loss during the first 100 F/T cycles (1.1% vs. 2.3%) by enhancing geopolymerization, refining pores (fewer macropores > 100 nm), and forming a denser C-(N)-A-S-H gel matrix, improving frost resistance by limiting water penetration and ice damage [100]. Furthermore, a study demonstrated that increasing NaOH from 4M to 6M reduced macropores (>50 nm) due to enhanced geopolymerization, resulting in a denser N-A-S-H gel. This gel fills larger voids, converting macropores to smaller mesopores (2–50 nm) and slightly decreasing water absorption, indicating reduced porosity [101].
F/T resistance further improved with longer curing as extended geopolymerization further densified the matrix. For instance, the BW/TW ratio of 1 at a 10% NaOH mix showed an ALM of 8.84% at 7 days, decreasing to 5.58% at 28 days and 2.61% at 60 days, as shown in Figure 17d,h,l. The study [102] on alkali-activated FA showed that extended curing (1 to 28 days) enhances freeze–thaw resistance by promoting geopolymerization, which densifies the matrix through C-S-H/C-A-S-H gel formation, resulting in a reduction in abrasion depth from 1.3 mm (1 day) to 0.7 mm (28 days). Concurrently, pore refinement reduces water absorption (from 11.4% to 6.4% over 1 and 360 days, respectively) as capillary porosity transitions into isolated gel pores, thereby mitigating water entry, which is critical to ice-induced damage. SEM/XRD analyses corroborate this evolution: the diminished presence of unreacted phases, crystalline growth, and reduced porosity yield a consolidated microstructure, which enhances re-freezing stress resistance by limiting permeability and microcrack propagation [102].
Lastly, it can be observed clearly from the graph (Figure 18) that increasing the BW concentration positively enhances F/T resistance across all tested alkaline concentrations and curing durations. For instance, ALM due to F/T cycling decreased from 12% (BW/TW = 0) to 2% (BW/TW = 1) after 60 days of curing at 10% NaOH (Figure 17l). This improvement is attributed to the refined pore structure and reduced porosity associated with higher BW/TW ratios. Referring to the particle size distribution of BW, it can be observed that its finer nature is characterised by a lower D50 value (0.27 mm). The enhanced specific surface area of finer BW particles amplifies pozzolanic reactivity, promoting the synthesis of dense N-A-S-H gels. These gels significantly reduce both porosity and permeability, thereby limiting the infiltration of water and the formation of ice. According to the study, the reduced particle size of brick powder (D50 = 3.4 µm) increases its specific surface area (795.4 m2/kg), thereby enhancing pozzolanic reactivity and lowering the Si–O/Al–O bond energy, which accelerates (N-A-S-H) gel formation [103]. This minimises ice crystallisation pressures during freezing, while the denser matrix resists hydraulic stress, thereby enhancing F/T resistance. Furthermore, CW incorporates aggregate fragments that, owing to their inert properties, negatively affect F/T resistance. These non-reactive particles facilitate the formation of a capillary network, which traps water and thereby enhances susceptibility to freezing-induced stress.

4.4. Effect of NaOH Concentration, Curing and CDW Composition on AAP Wet and Dry Resistance

The moisture susceptibility of alkali-activated CW/BW blends was investigated through cyclic wet–dry (W/D) exposure tests to assess their structural stability under fluctuating hygrothermal conditions. The W/D cycling exposure subjected specimens to alternating hygrothermal regimes: dry phases combined high temperatures with low humidity, while wet phases maintained ambient temperature with high humidity. This inverse relationship between temperature and moisture simulated opposing environmental stresses, allowing for the evaluation of the durability and resistance to degradation of AAPs. Figure 19 illustrates the ALM for each cycle and for the blends with NaOH, similar to F/T; a linear relationship can be observed. The performance of control mixes was notably poor, with none completing 12 cycles, regardless of curing duration and the BW/TW ratio, as shown in Figure 19a,e,i and Figure 20. From Figure 19a,e,i and Figure 20, the data reveal two critical observations: control mixes exhibit notably high ALM values, ranging from the low 20s to mid-30s, and cycle counts for control mixes indicate premature failure. Most failed by the second or third cycle, with only a few lasting up to the fifth cycle. The accelerated degradation of control mixes (unbound CW/BW particles held only by water) is attributed to their porous and very loosely structured matrix. Lacking a binding matrix, the porous network readily absorbs moisture (wetting), and upon drying, capillary tension induces internal stresses; the evaporation of water eliminates residual adhesion between particles, resulting in early-stage material breakdown.
On the other hand, similar to the F/T results, the alkali-activated mixes completed all 12 cycles of W/D, with the ALM consistently declining as the NaOH dosage increased, as shown in Figure 20. This decreasing trend was observed across all BW/TW ratios. For instance, after 7 days of curing, increasing the NaOH dosage from 5% to 10% led to a reduction in ALM from 14% to 9%. Furthermore, a consistent linear increase in ALM was observed over the 12 W/D cycles, incorporating NaOH, as shown in Figure 19b–k, excluding control mixes. An experimental study [104] of unfired clay bricks under wet/dry (W/D) conditions revealed a similar dose-dependent relationship. Specimens incorporating 3% alkaline additives demonstrated superior durability, exhibiting mass loss of 1.2% and 1.3% after 5 and 20 cycles, respectively. In contrast, additive-free formulations displayed significantly higher degradation, with losses of 1.6% and 1.7% under identical conditions [104]. Similarly, a study [105] on acid attack shows that increasing NaOH concentration (from 6M to 14M) in alkali-activated slag composites markedly improves durability, as evidenced by a 55% reduction in mass loss after 6 months of HCl exposure. This enhancement is attributed to intensified geopolymerization at higher alkalinity levels, resulting in a compact and chemically stable aluminosilicate network [105]. Higher concentrations of NaOH (10%) promote a more effective breakdown of the source materials (CW and BW), thereby accelerating the formation of geopolymer gel phases throughout the binder matrix, which reduces the void spaces. One way to confirm this is through water absorption, and according to a study, increasing the NaOH molarity from 4 M to 8 M significantly decreased water uptake in CDW-based geopolymer mixtures (from 9% to 4%), regardless of the precursor composition [106]. Moreover, insufficient alkalinity (5% NaOH) hinders complete activation of the precursors, resulting in residual unreacted particles that increase the porosity of the matrix and elevate water absorption levels. As a result, fewer interconnected pores restrict water penetration during wet phases, minimising internal saturation. Reduced water absorption lowers hydraulic pressure and swelling stresses during drying, preventing microcrack formation [107]. Prolonged curing further amplifies this process, as the CW/BW blends demonstrate improved resistance to moisture fluctuations due to sustained geopolymerization. For instance, in the mix with a BW/TW ratio of 1 and 10% NaOH, the ALM decreased from 5.1% at 7 days to 3.64% at 28 days and further dropped to 1.96% at 60 days, as shown in Figure 19d,h,l. Lastly, all alkali-activated blends exhibited lower ALM as the BW/TW ratio increased from 0 to 1 at all NaOH concentrations and curing days. The refined particle morphology of BW materials contributes to superior reactivity and a higher surface area compared to CW counterparts. Furthermore, the significantly elevated silica and alumina concentrations in BW yield a more favourable Si/Al molar ratio, which promotes the synthesis of highly polymerised N-A-S-H gels. These gels exhibit enhanced structural integrity in hyperalkaline conditions (pH ≥ 12), which is attributed to their densely cross-linked aluminosilicate framework. The stability arises from the synergistic interplay of tetrahedral SiO4 and AlO4 units, which form a three-dimensional network that is resistant to alkaline degradation [95,96,103].

4.5. Statistical Significance of Mix Design Parameters

As presented in Table 10, the ANOVA results highlight the distinct impacts that mix design parameters have on both mechanical and durability performance. For compressive strength, all three main factors, BW/TW ratio, curing period, and NaOH content, are statistically significant (p < 0.001). Among these factors, NaOH content is the most influential, accounting for approximately 53% of the total variation. This is followed by the BW/TW ratio (28%) and the curing period (3%). The interaction between the BW/TW ratio and NaOH content contributes approximately 11%, indicating that the effectiveness of alkali activation depends on the type of recycled blend used. While other interaction effects are statistically significant, their individual contributions are only 1 to 2%. These results suggest that compressive strength is primarily controlled by the concentration of NaOH, which should be carefully adjusted in conjunction with the BW/TW ratio, while the curing age plays a lesser role.
For the Go, all main factors again show statistical significance (p < 0.001). NaOH content explains approximately 57% of the total variation. In this case, curing time plays a more substantial role than in strength development, contributing 24%. The BW/TW ratio accounts for about 8% and a significant interaction is observed between curing time and NaOH content, contributing 7%, which suggests that increases in stiffness associated with NaOH dosage are more pronounced at later curing ages. This confirms that Go is jointly governed by NaOH content and curing period, with strong synergy between these two factors.
For wet–dry durability, NaOH content dominates the response, contributing about 91% of the variation (p < 0.001). The contributions of the BW/TW ratio and curing time are relatively small, at approximately 2.9% and 2.3%, respectively. Interaction terms, such as BW/TW × NaOH and curing × NaOH, are significant but have minor effects, each contributing less than 3%. The three-way interaction term approaches the threshold of significance (p = 0.056). For freeze–thaw durability, a similar trend is observed, with NaOH content explaining approximately 70% of the total variation, while the BW/TW ratio contributes 17% and curing time accounts for around 6.7%. The interaction between the BW/TW ratio and curing is statistically significant, accounting for approximately 3.6% of the variance. Other interactions are either small or only marginally significant. Compared to wet–dry conditions, the BW/TW blend has a greater influence under freeze–thaw cycling, indicating its importance in affecting pore structure and gel stability, which are relevant to frost resistance.
Overall, the results suggest the following practical implications:
  • NaOH Concentration: This is the most effective parameter for enhancing both strength and durability.
  • BW/TW Ratio: It must be selected carefully, particularly in conjunction with NaOH, to maximise strength. This is evidenced by the significant interaction between these two factors.
  • Curing Age: This factor plays a crucial role in enhancing stiffness, contributing more significantly than it does for strength.
  • Composition: The influence of composition becomes more pronounced under freeze–thaw conditions. This highlights the necessity for implementing gel densification strategies when exposure to such cycles is anticipated.
While the models for mechanical properties are statistically robust (with a residual degree of freedom, df, of 132), the models related to durability are limited due to the lack of replication. In these cases, the highest-order interaction was used as the error term, a standard approach in full factorial designs. However, this limits the precision of inferences for borderline interaction terms. Future studies should consider incorporating replicates or pooled error terms to improve the robustness of durability analyses. Appendix A provides detailed values for variance and standard deviation (SD) for both UCS and UPV across all mixture groups and curing ages. For UCS, the maximum variance and SD recorded were 6.255 and 2.501 MPa at 7 days, 1.638 and 1.280 MPa at 28 days, and 5.622 and 2.379 MPa at 60 days. In the case of UPV, the corresponding values were 0.273 and 0.550 MPa at 7 days, 1.160 and 2.330 MPa at 28 days, and 0.540 and 1.080 MPa at 60 days. These findings confirm that the experimental data are generally consistent, with higher variability observed during the early stages of curing and a noticeable trend toward stabilisation over time.

4.6. Microstructural Analysis

4.6.1. X-Ray Diffraction (XRD)

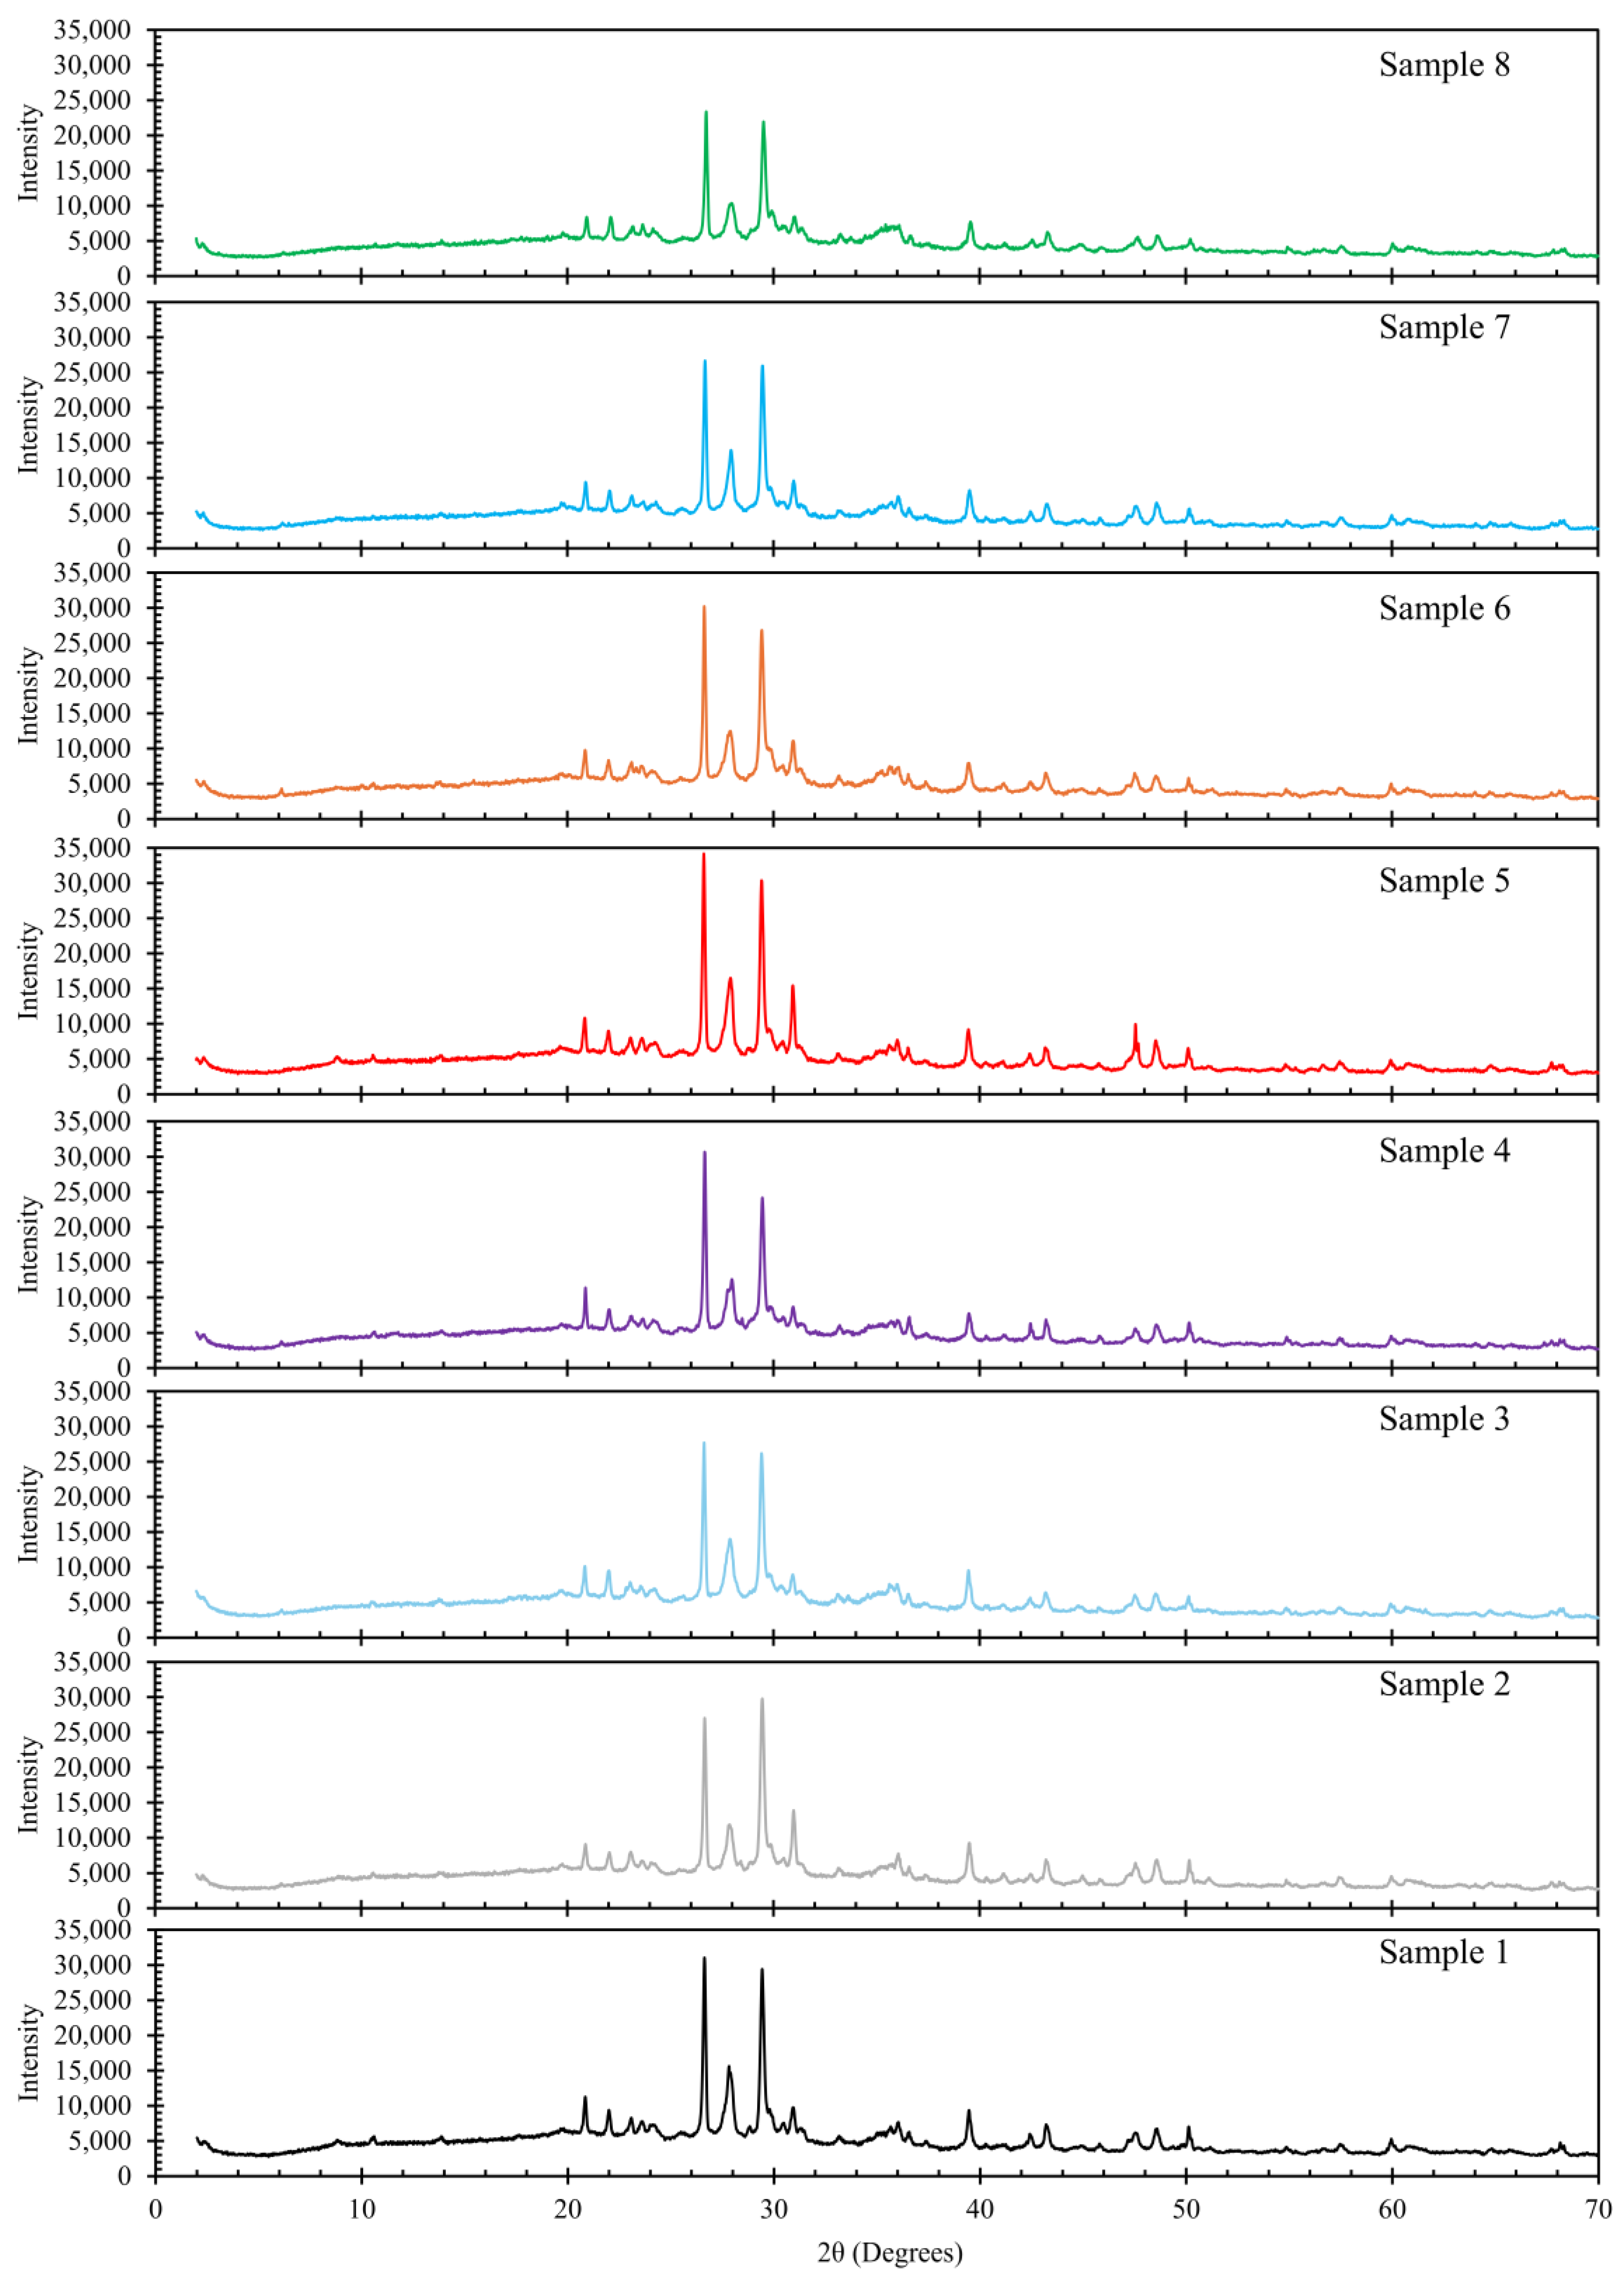
XRD analysis of AAPs with a high brick waste content (BW/TW = 0.9, comprising 90% BW and 10% CW) revealed significant changes in mineralogy based on both the concentration of NaOH and the curing duration (7 and 60 days). As illustrated in Figure 21, all eight samples exhibited prominent diffraction peaks corresponding to quartz (SiO2) in the range of 22.0–23.2° 2θ and calcite (CaCO3) at 29.4° 2θ. These peaks reflect the crystalline phases inherited from the original brick and the partially hydrated cementitious material. The consistent presence of quartz across all formulations underscores its chemical inertness under ambient temperature and alkaline conditions. Meanwhile, the calcite reflections are likely due to early-stage carbonation of calcium-rich phases or the presence of residual limestone components from the recycled cement paste. More importantly, the inclusion of NaOH induced distinct mineralogical transformations in the range of 28–31° 2θ, as shown in Figure 22. In the samples cured for 7 days (Samples 1–4), increasing NaOH content (from 0% to 10%) led to the intensification and emergence of new peaks, indicating the development of nascent geopolymeric phases. Specifically, the appearance of reflections near 28.2°, 30.1°, and 30.9° 2θ in the samples with higher NaOH content (Samples 3 and 4) suggests the formation of sodium aluminosilicate hydrate (N-A-S-H) gels. These crystalline phases result from the alkali-induced dissolution of amorphous aluminosilicate components present in the brick fines, followed by their reprecipitation into structured binding phases. This process contributes to enhanced microstructural densification and mechanical strength.
Extending the curing period to 60 days (Samples 5–8) further intensified these transformations. The XRD patterns revealed sharper, more defined peaks, signifying an increase in the overall degree of crystallinity. Particularly in Sample 8 (10% NaOH, 60 days), complex diffraction patterns were observed beyond 35° 2θ, with distinct peaks at approximately 36.0°, 39.5°, 43.2°, and 48.5° 2θ, which are consistent with the formation of crystalline calcium-aluminosilicate hydrate (C-A-S-H) phases. These reflections indicate enhanced structural ordering and maturation of the alkali-activated gel network during the extended curing period. Additionally, peaks seen at 26.6° and 27.3° 2θ, characteristic of portlandite (Ca(OH)2), became more pronounced in the long-term cured specimens. Their presence suggests ongoing interactions between residual hydration products and the alkaline environment, further enhancing the complexity and performance of the binder phases.
To quantitatively assess the mineralogical variations across mortar blends, principal component analysis (PCA) was applied to the standardised XRD intensity profiles of all eight samples (Figure 23). The first two principal components (PC1 and PC2) captured 64.04% of the total variance, with PC1 alone explaining 46.75%, indicating its dominant role in differentiating phase assemblages. The PCA biplot revealed a clear clustering trend based on curing duration and NaOH concentration. Samples cured for 7 days exhibited closer grouping, indicating comparable early-stage hydration or activation products. In contrast, 60-day samples exhibited greater dispersion, particularly sample 8 (10% NaOH), which was distinctly separated along both PC1 and PC2 axes, signifying substantial crystalline phase evolution due to prolonged curing and high alkalinity. These findings align with qualitative interpretations, confirming that alkali activation and extended curing synergistically enhanced the development of secondary reaction products such as C-A-S-H phases. Collectively, these observations underscore the transition from a gel-dominated, low-crystalline structure in early-age mortars to a heterogeneous yet stable network of crystalline hydrates and aluminosilicate frameworks in long-term, alkali-activated systems. Thus, the XRD evidence confirms that the NaOH concentration and curing time critically govern the extent and type of reaction products in recycled brick mortars. High-alkali, long-cured samples exhibit advanced geopolymerization and matrix structural consolidation.

4.6.2. Scanning Electron Microscope (SEM)

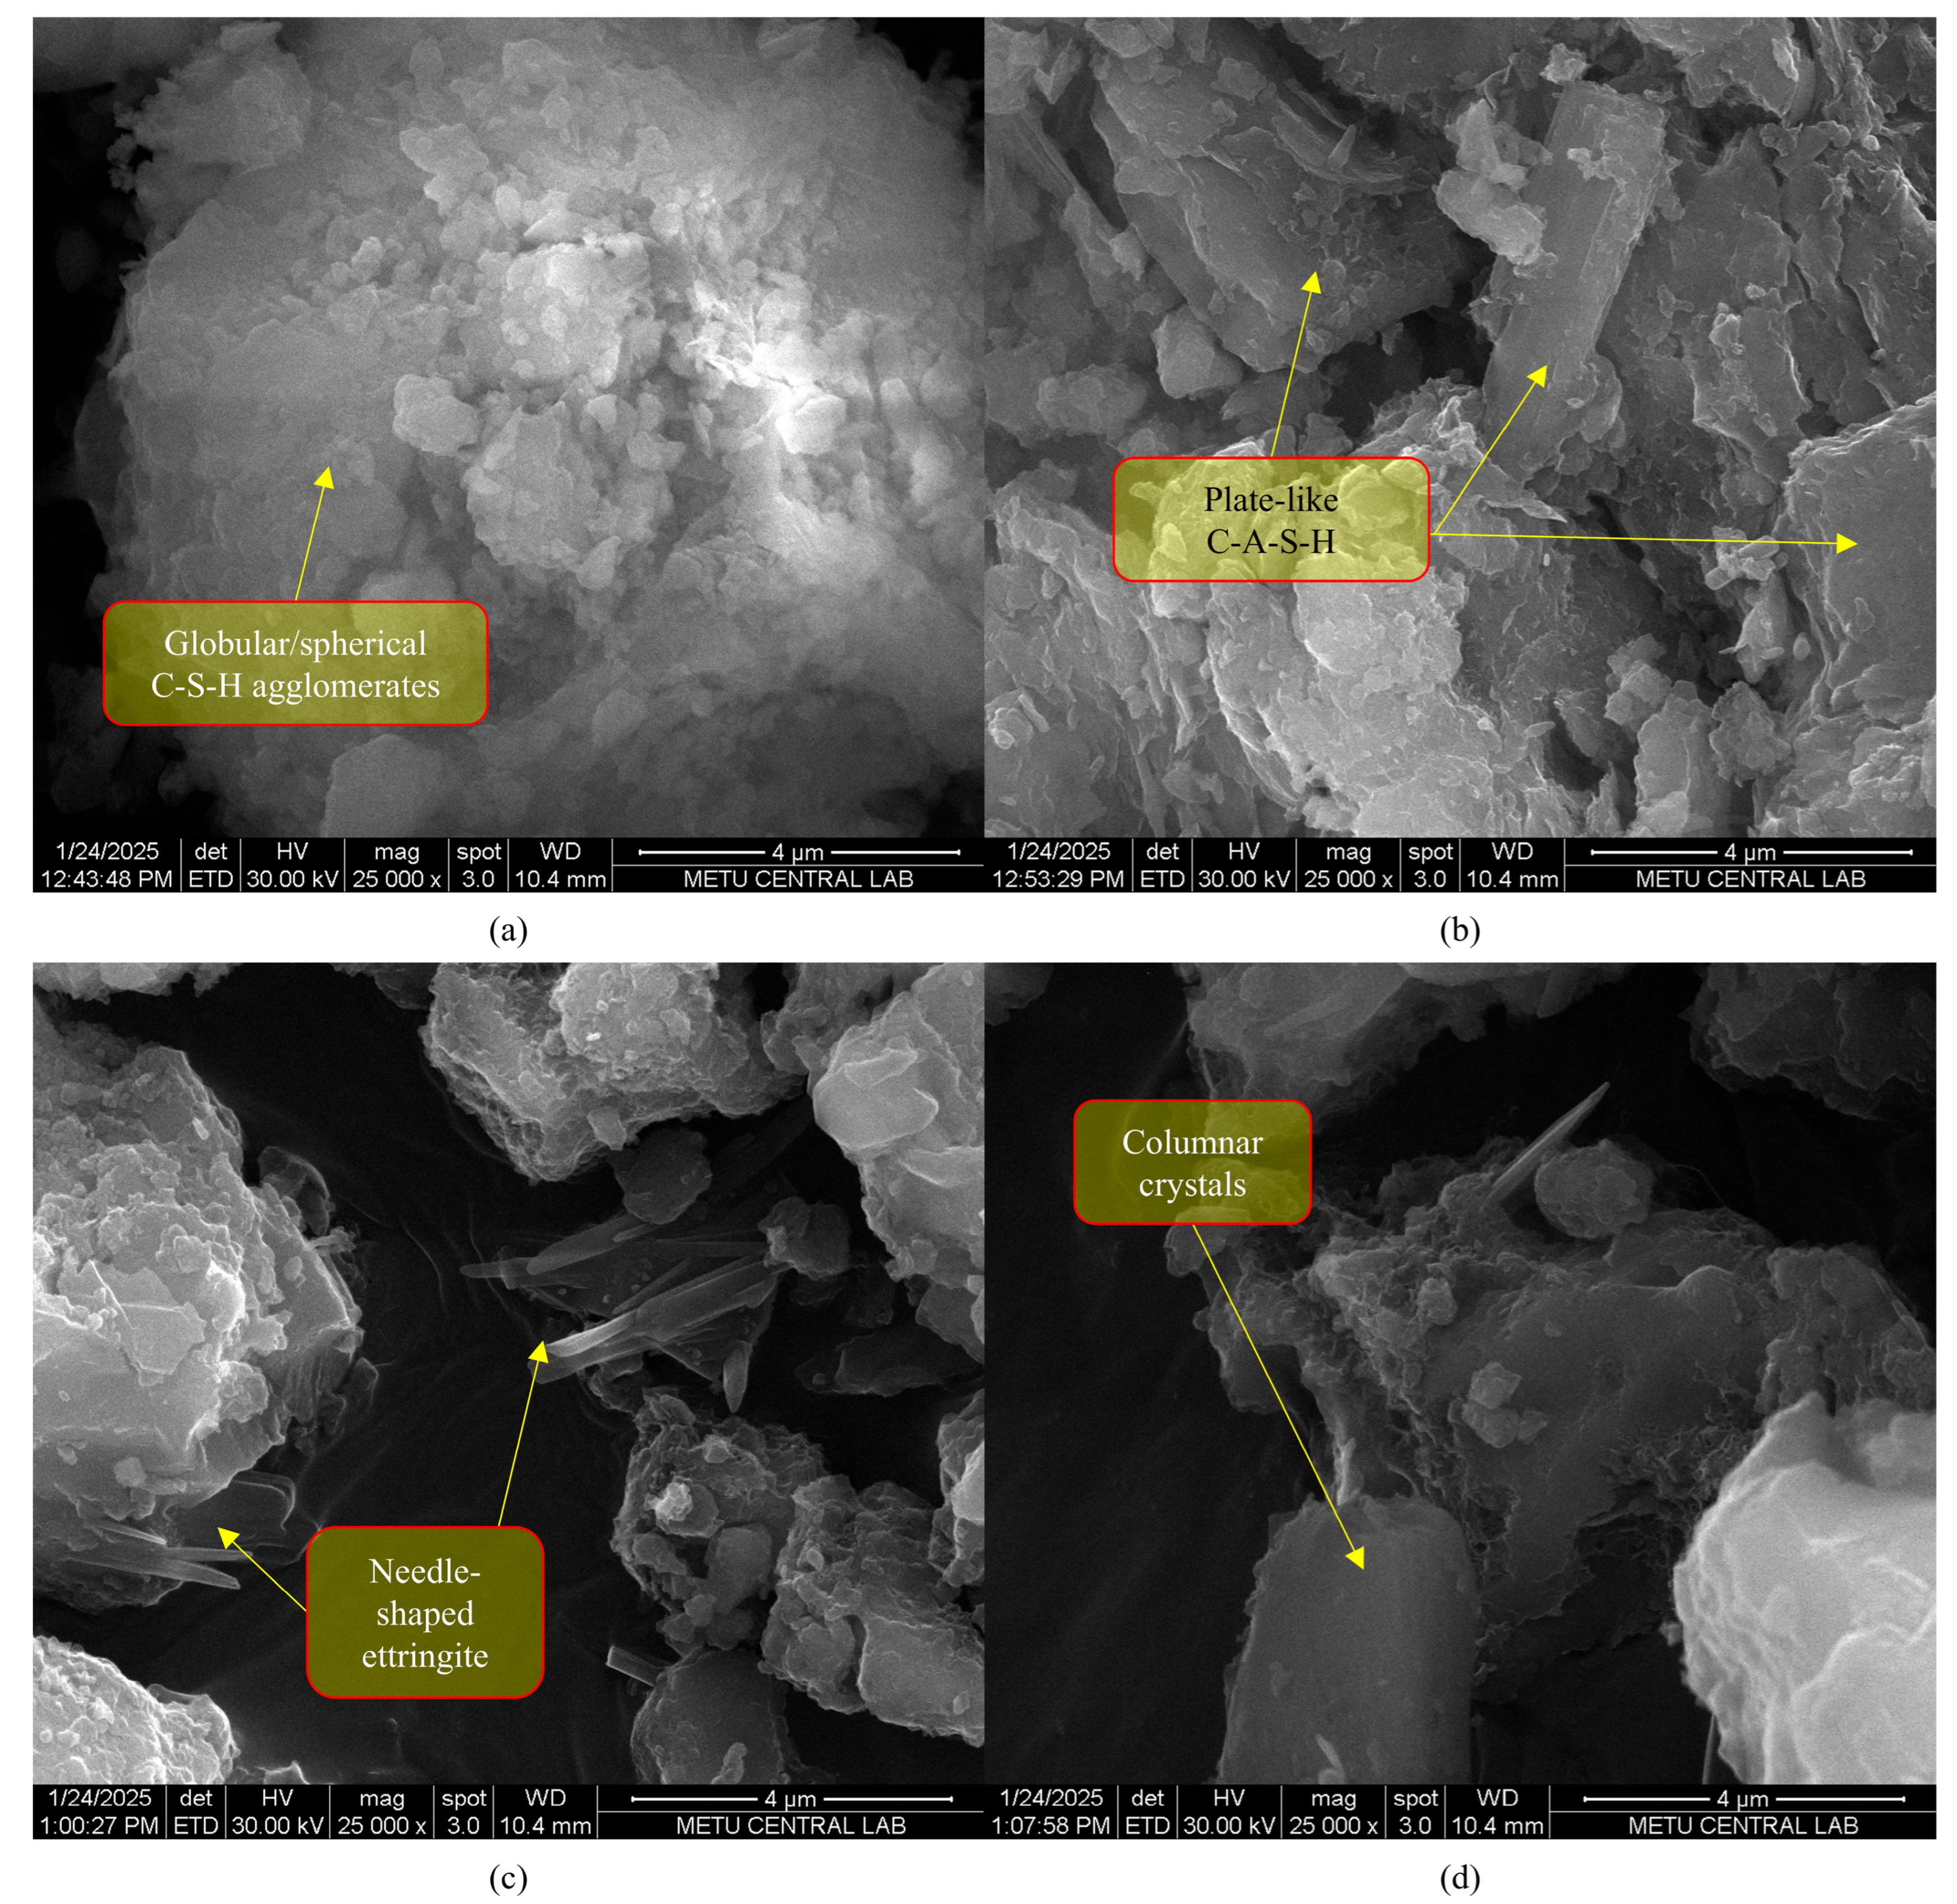
SEM was used to examine the microstructural evolution of AAPs prepared with a BW/TW ratio of 0.9 under a 7-day curing regime, as illustrated in Figure 24. The micrograph of Sample 1 (0% NaOH) shows a disordered and loosely aggregated matrix characterised by amorphous, fluffed clusters with minimal cohesion (Figure 24a). This morphology indicates ineffective alkali activation, resulting in limited dissolution of aluminosilicate phases and inadequate gel formation. Consequently, the binder system remains underdeveloped, which correlates with the low mechanical strength observed at early ages. In Sample 2, the introduction of 5% NaOH results in a significant transformation of the matrix morphology. The appearance of compact, flaky, and plate-like structures suggests the beginning of C-A-S-H or N-A-S-H gel formation (Figure 24b). These products begin to fill voids and enhance the cohesion of the matrix, indicating the onset of geopolymerization and the progressive development of the binder. Further refinement of the microstructure is evident in Sample 3, which contains 7% NaOH, resulting in a denser, interconnected network (Figure 24c). The matrix displays lamellar and sheet-like crystalline formations, indicating robust geopolymeric activity. The enhanced dissolution of reactive species from the brick fines results in substantial gel precipitation and matrix densification. This morphology reflects a well-balanced structure that promotes improved physical integrity and mechanical performance. At the highest alkali concentration of 10% NaOH in Sample 4, the microstructure is markedly crystalline, featuring angular, needle-like precipitates embedded within a dense matrix (Figure 24d). These elongated features are consistent with over-crystallised C-A-S-H phases, likely a result of supersaturation caused by a high NaOH dosage. While the matrix appears densified, the presence of sharp-edged crystalline growths may indicate increased brittleness or a tendency for microcracking under stress. Overall, the SEM observations indicate a progressive improvement in microstructural development with increasing NaOH concentration over a 7-day period. The optimal morphology is achieved at 7% NaOH, where gel formation and crystallinity are well balanced. Beyond this threshold, excessive alkali content may compromise matrix toughness by promoting excessive crystallisation.
After 60 days of curing, AAPs with a BW/TW ratio of 0.9 showed significant microstructural refinement and chemical maturation, which were notably influenced by the concentration of NaOH activator. The control sample with 0% NaOH displayed considerable morphological changes when compared to its 7-day counterpart (Figure 25a). Initially, the dispersed, globular C-S-H gels evolved into a more cohesive, plate-like structure that gradually filled the voids between clusters. This transformation indicates ongoing hydration and densification, resulting in a reduction in apparent porosity. In the 5% NaOH-activated system (Figure 25b), secondary crystallisation became more prominent. The matrix was densely interwoven with elongated, needle-like hydrate structures that connected adjacent grains, contributing to an interconnected skeleton. Although this enhanced interlocking improves mechanical integrity, residual micron-scale voids indicate that complete packing has not been achieved. The microstructure of the 7% NaOH sample (Figure 25c) exhibited the most refined configuration, characterised by thick, tubular plates arranged in an ordered, layered assembly. These structures are often coated with finer C-A-S-H gels, forming a tightly packed and homogeneous matrix. This morphology reflects an optimal balance between alkali-induced dissolution and subsequent polycondensation, resulting in a stable and compact geopolymeric network. In contrast, the sample with 10% NaOH (Figure 25d) displayed signs of over-crystallisation due to the abundance of large, columnar crystalline formations. While this increased crystallinity enhances stiffness, it also introduces microcracks at the terminations and interfaces of the crystals, likely caused by internal stress concentrations. This observation suggests that excessive alkali activation may compromise long-term durability by promoting embrittlement.
Although XRD and SEM analyses offered valuable information on phase evolution and matrix densification, it is recommended that future studies incorporate additional techniques, such as thermogravimetric analysis (TGA). This would allow for a better quantification of mass loss related to dehydration and reaction kinetics in CDW-based AAP systems.

5. Conclusions

This study demonstrates the feasibility of producing high-performance alkali-activated paste (AAP) solely from construction and demolition waste (CDW), providing a sustainable alternative to traditional cement-based mortars. By eliminating ordinary Portland cement and other conventional binders, these AAPs significantly reduce CO2 emissions, conserve natural resources, divert waste from landfills, and promote circular economy practices. The key findings of this research are summarised below:
  • High Mechanical Performance: Compressive strength increased significantly with NaOH concentration, reaching 29 MPa at 10% NaOH, a BW/TW ratio of 0.9, and a curing period of 60 days. This represents a more than 2100% improvement compared to untreated samples, which had a strength of 1.3 MPa.
  • Strength Behaviour: The compressive strength followed a power-law relationship with recycled brick content, driven by an increase in reactive surface area and enhanced gel formation. The NaOH content exhibited a linear effect on strength, resulting from proportional increases in precursor dissolution.
  • Parameter Correlations: Correlation analysis revealed that the recycled brick content significantly enhanced the strength (R = 0.77), whereas the recycled concrete content reduced it (R = −0.77). NaOH had a moderate positive effect, and curing time had the least influence.
  • Stiffness Gains: The shear modulus increased with NaOH concentration across all BW/TW ratios and curing periods. After 60 days with a BW/TW ratio of 0.9, Go reached 21, 23, and 30 GPa for 5%, 7%, and 10% NaOH, respectively, confirming enhanced stiffness with stronger activation.
  • Influence of Recycled Brick on Stiffness: The recycled brick content produced modest gains in stiffness at lower ratios (0.11–0.25) but substantial increases at higher ratios (4.0–9.0) across all NaOH levels and curing times.
  • Freeze–Thaw Durability: Control mixes failed within 2–4 cycles due to the absence of alkali activation. In contrast, AAPs completed all 12 cycles with significantly reduced ALM. The lowest ALM, 2.6%, occurred with 10% NaOH.
  • Wet–Dry Durability: Control mixes degraded rapidly (ALM 20–35%) and failed within 2–5 cycles. Conversely, AAPs completed all 12 cycles with an ALM as low as 1.96% at 10% NaOH.
  • Microstructural Evolution: XRD analysis confirmed the progressive mineralogical transformations that occurred with increasing NaOH content, particularly at a BW/TW ratio of 0.9. The formation of N-A-S-H and C-A-S-H phases, along with sharper peaks at 10% NaOH, indicates improved structural integrity and long-term stability. Principal component analysis of XRD data revealed distinct clustering based on curing time and NaOH content. High-alkali, long-cured samples exhibited advanced phase development, with Sample 8 (10% NaOH, 60 days) showing the greatest crystallinity.
  • Microstructural Densification: SEM images revealed that 10% NaOH resulted in the most crystalline and dense matrix, characterised by abundant needle-like and columnar phases, indicative of advanced geopolymerization. Such an aspect correlates with enhanced mechanical strength and durability.
  • Limitations and Future Work: This study demonstrates the feasibility of producing binder-free alkali-activated pastes from CDW fines, showing promising mechanical and durability properties. However, several limitations should be considered. The number of tested specimens, particularly for durability assessments, was limited, which may affect the statistical reliability of the results. Furthermore, advanced characterisation methods, such as Thermogravimetric Analysis (TGA) and energy-dispersive X-ray spectroscopy (EDS), can provide deeper insights into the reaction mechanisms and the evolution of the gel. Additionally, the performance and long-term durability of these materials in real environmental conditions still need to be validated. Future research should focus on these aspects to enhance the applicability of the findings and facilitate their transition from laboratory settings to large-scale implementation.
Overall, this study confirms that CDW can be transformed into durable, binder-free AAPs with high strength and superior durability. The findings provide a scalable pathway to reduce the construction industry’s dependence on virgin resources and mitigate its environmental impact.

Author Contributions

I.J., conducted the main investigation, performed data curation, and prepared the original draft of the manuscript. H.S., contributed to the development of the methodology, supported data analysis, and participated in the review and editing of the manuscript. A.E., conceived and supervised the study, provided guidance throughout the research process, contributed to manuscript revisions, and was responsible for project administration and funding acquisition. All authors have read and agreed to the published version of the manuscript.

Funding

The authors express their appreciation to the Office of Research Coordination and Support, Middle East Technical University, Northern Cyprus Campus for funding this research group. Scientific Research Project Code TFEN-25-YG1.

Data Availability Statement

The datasets of the current study are available from the corresponding author upon reasonable request.

Conflicts of Interest

The authors have no relevant financial or non-financial interests to disclose.

List of Notations and Abbreviations

AACAlkali-Activated Concrete
AAMsAlkali-Activated Mortars
AAPsAlkali-Activated Paste
AASAlkali-Activated Solution
ALMAccumulated Mass Loss
BFSBlast Furnace Slag
BWBrick Waste
CDWConstruction and Demolition Waste
CWConcrete Waste
DADimensional Analysis
FAFly Ash
GGBFSGround Granulated Blast Furnace Slag
MSWMunicipal Solid Waste
NaOHSodium Hydroxide
OPCOrdinary Portland Cement
RHRelative Humidity
SCMSupplementary Cementitious Material
SEMScanning Electron Microscopy
TWTotal Waste
UCSUnconfined Compressive Strength
UPVUltrasonic Pulse Velocity
XRDX-ray Diffraction
XRFX-ray Fluorescence
C-A-S-HCalcium Aluminosilicate Hydrate
C-S-HCalcium Silicate Hydrate
N-A-S-HSodium Aluminosilicate Hydrate
BW/CWBrick Waste-to-Concrete Waste Ratio
BW/TWBrick Waste-to-Total Waste Ratio
F/TFreeze–Thaw
W/DWet–Dry
GoInitial Shear Modulus
VsShear Wave Velocity
ρDensity

Appendix A

The results summarized in Appendix A include the variance and standard deviation (SD) of UCS and UPV measurements, calculated for each mix design and curing age to evaluate the consistency of the experimental data.
Table A1. Variance and Standard Deviation of UCS and UPV Measurements at 7 days.
SpecimenNaOH ContentUCSmeanVarianceStandard
Deviation
Go,meanVarianceStandard
Deviation
BW: Brick Waste
CW: Concrete Waste(MPa)(GPa)(GPa)(GPa)
00BW, 100CW0% NaOH0.4770.0000.0130.2520.000360.001
10BW, 90CW0.8140.0040.0620.2880.000030.000
20BW, 80CW0.5420.0010.0270.3280.000030.000
30BW, 70CW0.6050.0020.0390.3520.000140.000
40BW, 60CW0.6450.0000.0130.3760.002280.005
50BW, 50CW0.6840.0000.0160.4060.000100.000
60BW, 40CW0.7120.0000.0210.4560.000000.000
70BW, 30CW0.7420.0000.0020.5190.000050.000
80BW, 20CW0.7520.0000.0010.6200.000390.001
90BW, 10CW0.8050.0050.0710.6730.000030.000
100BW, 00CW0.920.0000.0030.5750.000010.000
00BW, 100CW5% NaOH1.9690.0060.0772.1580.007180.014
10BW, 90CW8.390.0360.192.3510.001040.002
20BW, 80CW2.5770.0170.1312.6180.014000.028
30BW, 70CW3.3510.0250.1593.3060.000710.001
40BW, 60CW4.3160.0030.0513.7350.005150.010
50BW, 50CW5.3440.0360.1894.2270.008290.017
60BW, 40CW5.8660.6360.7984.5940.019490.039
70BW, 30CW6.8460.3410.5845.3990.000250.000
80BW, 20CW7.8741.4261.1945.9910.000330.001
90BW, 10CW9.0282.0101.4186.4890.011870.024
100BW, 00CW10.120.0160.1275.3620.002600.005
00BW, 100CW7% NaOH2.8380.0010.0272.6700.005350.011
10BW, 90CW10.1310.0440.2093.1070.017280.035
20BW, 80CW3.3940.1350.3683.7200.016440.033
30BW, 70CW4.0990.0030.0574.3570.009170.018
40BW, 60CW5.0960.0240.1565.5580.000610.001
50BW, 50CW6.6260.0000.0056.3460.024100.048
60BW, 40CW6.5920.9480.9747.4350.007780.016
70BW, 30CW7.5390.0100.18.6270.014080.028
80BW, 20CW8.7210.0080.099.6850.092020.184
90BW, 10CW9.8320.3000.54710.6940.060110.120
100BW, 00CW11.8430.2700.529.2440.035100.070
00BW, 100CW10% NaOH4.4290.5280.7275.3930.026480.053
10BW, 90CW14.0141.5021.2256.3230.001290.003
20BW, 80CW5.0766.2552.5017.2110.115320.231
30BW, 70CW6.0142.3311.5278.5720.005310.011
40BW, 60CW8.6420.5010.7089.8110.049160.098
50BW, 50CW9.6680.0220.14811.3500.012560.025
60BW, 40CW10.730.0880.29712.8310.082830.166
70BW, 30CW11.4830.0330.18114.0160.033790.068
80BW, 20CW13.710.0370.19215.4220.009560.019
90BW, 10CW14.4013.4951.8717.0510.273980.548
100BW, 00CW16.6961.3731.17214.9720.029880.060
Table A2. Variance and Standard Deviation of UCS and UPV Measurements at 28 days.
SpecimenNaOH ContentUCSmeanVarianceStandard
Deviation
Go,meanVarianceStandard
Deviation
BW: Brick Waste
CW: Concrete Waste(MPa)(GPa)(GPa)(GPa)
00BW, 100CW0% NaOH0.5160.0200.1410.5190.000060.000
10BW, 90CW0.8430.0050.0680.6110.000010.000
20BW, 80CW0.6920.0000.0060.6630.000100.000
30BW, 70CW0.7760.0000.0160.7130.000150.000
40BW, 60CW0.8280.0000.0120.7690.000140.000
50BW, 50CW0.8770.0010.0250.8170.000010.000
60BW, 40CW0.9220.0010.0250.8540.000000.000
70BW, 30CW0.9540.0000.0200.9270.000000.000
80BW, 20CW1.0080.0030.0581.0030.000020.000
90BW, 10CW1.0320.0100.1011.0980.000010.000
100BW, 00CW1.0420.0100.1020.9760.004740.009
00BW, 100CW5% NaOH2.1700.0110.1077.4530.000000.000
10BW, 90CW10.3840.0030.0548.3260.051640.103
20BW, 80CW3.3130.0030.0589.4630.000010.000
30BW, 70CW4.0070.0640.25310.4620.145440.291
40BW, 60CW5.2840.0560.23711.2650.007840.016
50BW, 50CW5.5830.0540.23312.5570.154810.310
60BW, 40CW6.5700.5630.75014.0830.181530.363
70BW, 30CW7.6900.0600.24515.3240.000060.000
80BW, 20CW9.7100.1340.36616.3490.319610.639
90BW, 10CW10.6100.0080.08717.1010.034030.068
100BW, 00CW13.1580.0160.12513.3480.053390.107
00BW, 100CW7% NaOH3.8460.0020.0399.4160.023400.047
10BW, 90CW11.6160.0710.26710.2130.004390.009
20BW, 80CW4.0681.2311.10910.7220.162550.325
30BW, 70CW5.2000.0090.09312.0090.054490.109
40BW, 60CW5.8440.0190.13612.8330.117920.236
50BW, 50CW7.3550.4160.64513.8100.125510.251
60BW, 40CW7.7830.6660.81614.9500.031260.063
70BW, 30CW9.9280.2580.50815.8290.308730.617
80BW, 20CW11.6300.3970.63016.8350.085070.170
90BW, 10CW12.3660.0220.14818.1700.100570.201
100BW, 00CW14.6610.5550.74515.9360.102760.206
00BW, 100CW10% NaOH4.7700.0050.06811.3280.104110.208
10BW, 90CW19.0100.2200.46912.6190.000020.000
20BW, 80CW6.4560.0500.22313.5190.005550.011
30BW, 70CW7.2960.0640.25214.5040.198070.396
40BW, 60CW8.8470.0110.10516.4720.100400.201
50BW, 50CW10.2940.3340.57818.1140.042390.085
60BW, 40CW11.3721.6381.28019.8630.245250.490
70BW, 30CW13.9860.4880.69921.4640.019480.039
80BW, 20CW16.5961.0071.00323.2931.165942.332
90BW, 10CW19.3120.1280.35825.0970.133460.267
100BW, 00CW23.7220.1270.35620.9900.252260.505
Table A3. Variance and Standard Deviation of UCS and UPV Measurements at 60 days.
SpecimenNaOH ContentUCSmeanVarianceStandard
Deviation
Go,meanVarianceStandard
Deviation
BW: Brick Waste
CW: Concrete Waste(MPa)(GPa)(GPa)(GPa)
00BW, 100CW0% NaOH0.5760.0000.0190.8560.001660.003
10BW, 90CW0.9410.0050.0680.8830.000400.001
20BW, 80CW0.6950.0000.0110.9410.000210.000
30BW, 70CW0.7840.0000.0180.9720.001740.003
40BW, 60CW0.8430.0000.0061.0050.000050.000
50BW, 50CW0.9210.0020.0411.0490.000060.000
60BW, 40CW0.9500.0020.0401.0780.001140.002
70BW, 30CW0.9920.0000.0091.1110.000270.001
80BW, 20CW1.0860.0010.0231.2550.000080.000
90BW, 10CW1.1260.0000.0051.4170.000360.001
100BW, 00CW1.2830.0010.0311.1120.000200.000
00BW, 100CW5% NaOH2.3280.0000.00912.8910.001770.004
10BW, 90CW12.1601.8511.36014.3680.006450.013
20BW, 80CW3.5500.0170.12915.7250.005630.011
30BW, 70CW4.2430.0260.16116.1800.000020.000
40BW, 60CW5.4140.0960.31016.9210.051080.102
50BW, 50CW6.2010.1710.41317.9760.012720.025
60BW, 40CW7.1420.0010.03018.8910.011310.023
70BW, 30CW8.7220.1960.44319.4440.068610.137
80BW, 20CW10.8620.5160.71820.1390.158260.317
90BW, 10CW11.7580.3560.59721.3630.003320.007
100BW, 00CW15.2650.0150.12218.6760.056960.114
00BW, 100CW7% NaOH3.8560.0200.14114.9780.006540.013
10BW, 90CW14.3840.1280.35816.0250.021240.042
20BW, 80CW4.4060.0010.02517.0130.100500.201
30BW, 70CW5.3550.1560.39517.9820.384790.770
40BW, 60CW6.4260.0010.03618.5970.118160.236
50BW, 50CW8.2240.3000.54819.2870.468470.937
60BW, 40CW8.7181.4771.21620.0640.000940.002
70BW, 30CW11.8022.0651.43720.8940.261410.523
80BW, 20CW13.9200.3220.56822.7150.022410.045
90BW, 10CW14.9651.7561.32523.6640.000210.000
100BW, 00CW17.0740.0000.00921.6000.000470.001
00BW, 100CW10% NaOH5.0510.0200.14116.5500.000000.000
10BW, 90CW24.1000.2690.51817.7460.126190.252
20BW, 80CW7.2980.1040.32220.2970.446750.893
30BW, 70CW8.7460.0120.10721.3430.025220.050
40BW, 60CW10.2950.1900.43622.8920.106430.213
50BW, 50CW10.9120.0800.28224.6610.000020.000
60BW, 40CW12.3500.0130.11226.6060.042990.086
70BW, 30CW15.9065.6622.37927.1080.044330.089
80BW, 20CW19.4410.7490.86528.9090.322350.645
90BW, 10CW24.2722.6401.62530.3870.131480.263
100BW, 00CW28.1210.8050.89725.7250.540071.080

References

  1. United Nations Department of Economic and Social Affairs. Global Population Growth and Sustainable Development. 2021. Available online: https://www.unpopulation.org (accessed on 4 April 2025).
  2. Bloom, D.E.; Demographic Upheaval. International Monetary Fund. 2016. Available online: https://www.imf.org/external/pubs/ft/fandd/2016/03/bloom.htm (accessed on 4 April 2025).
  3. Henderson, V. The urbanization process and economic growth: The so-what question. J. Econ. Growth 2003, 8, 47–71. [Google Scholar] [CrossRef]
  4. International Energy Agency. Global Status Report for Buildings and Construction 2019—Analysis. 2019. Available online: https://www.iea.org/reports/global-status-report-for-buildings-and-construction-2019 (accessed on 4 April 2025).
  5. Graham, B.; Dean, J.; Dulac, K.; Petrichenko, P. Towards Zero-Emission, Efficient, and Resilient Buildings: Global Status Report. 2016. Available online: https://orbit.dtu.dk/en/publications/towards-zero-emission-efficient-and-resilient-buildings-global-st (accessed on 4 April 2025).
  6. Graaf, L.; Toth, Z.; Broer, R.; Oriol, J. Extended Producer Responsibility in the Construction Sector: Exploring the Potential. 2024. Available online: https://www.bpie.eu/publication/extended-producer-responsibility-in-the-construction-sector/ (accessed on 4 April 2025).
  7. de Wit, M.; Hoogzaad, J.; Ramkumar, S.; Friedl, H.; Douma, A. The Circularity Gap Report 2018; Circle Economy: Amsterdam, The Netherlands, 2018. [Google Scholar]
  8. Purton, M. Sustainable Concrete Is Possible—Here Are 4 Examples. World Economic Forum. 2024. Available online: https://www.weforum.org/stories/2024/09/cement-production-sustainable-concrete-co2-emissions/ (accessed on 4 April 2025).
  9. International Energy Agency. Iron and Steel Technology Roadmap. 2020. Available online: https://www.iea.org/reports/iron-and-steel-technology-roadmap (accessed on 4 April 2025).
  10. United Nations Environment Programme. Sand and Sustainability: 10 Strategic Recommendations to Avert a Crisis. 2022. Available online: https://www.unep.org/resources/report/sand-and-sustainability-10-strategic-recommendations-avert-crisis (accessed on 4 April 2025).
  11. Kaptan, B.K.; Aguiar, J.L.B.; Cunha, S. Earthquake generated construction and demolition waste. In Proceedings of the CIRMARE 2023; Lecture Notes in Civil Engineering. Springer: Berlin/Heidelberg, Germany, 2024; Volume 444, pp. 207–221. [Google Scholar] [CrossRef]
  12. Park, J.; Tucker, R. Overcoming barriers to the reuse of construction waste material in Australia: A review of the literature. Int. J. Constr. Manag. 2017, 17, 228–237. [Google Scholar] [CrossRef]
  13. European Commission. Construction and Demolition Waste. Available online: https://environment.ec.europa.eu/topics/waste-and-recycling/construction-and-demolition-waste_en (accessed on 5 April 2025).
  14. Kaza, S.; Yao, L.C.; Bhada-Tata, P.; Van Woerden, F. What a Waste 2.0: A Global Snapshot of Solid Waste Management to 2050; World Bank: Washington, DC, USA, 2018. [Google Scholar] [CrossRef]
  15. Jin, R.; Yuan, H.; Chen, Q. Science mapping approach to assisting the review of construction and demolition waste management research published between 2009 and 2018. Resour. Conserv. Recycl. 2019, 140, 175–188. [Google Scholar] [CrossRef]
  16. Eurostat. Waste Statistics [Statistics Explained]. 2022. Available online: https://ec.europa.eu/eurostat/statistics-explained/index.php?title=Waste_statistics (accessed on 4 April 2025).
  17. Menegaki, M.; Damigos, D. A review on current situation and challenges of construction and demolition waste management. Curr. Opin. Green Sustain. Chem. 2018, 13, 8–15. [Google Scholar] [CrossRef]
  18. Ulugöl, H.; Kul, A.; Yıldırım, G.; Şahmaran, M.; Aldemir, A.; Figueira, D.; Ashour, A. Mechanical and microstructural characterization of geopolymers from assorted construction and demolition waste-based masonry and glass. J. Clean. Prod. 2021, 280, 124358. [Google Scholar] [CrossRef]
  19. Shapiro-Bengtsen, S.; Andersen, F.M.; Münster, M.; Zou, L. Municipal solid waste available to the Chinese energy sector—Provincial projections to 2050. Waste Manag. 2020, 112, 52–65. [Google Scholar] [CrossRef] [PubMed]
  20. Hao, J.L.; Ma, W. Evaluating carbon emissions of construction and demolition waste in building energy retrofit projects. Energy 2023, 281, 128201. [Google Scholar] [CrossRef]
  21. An, R.; Guo, Y. Estimating construction and demolition waste in the building sector in China: Towards the end of the century. Waste Manag. 2024, 190, 285–295. [Google Scholar] [CrossRef]
  22. Shrivastava, S.; Chini, A.; Rinker, M. Construction Materials and C & D Waste in India; Fraunhofer IRB: Stuttgart, Germany, 2009. [Google Scholar]
  23. Schorr, D.; Boivin, G. Overview of Canadian CRD Wood Waste Recycling and Valorization Ecosystem. FPInnovations. 2023. Available online: https://library.fpinnovations.ca/link/fpipub10712 (accessed on 7 April 2025).
  24. Kuzmenkov, A.; Galaktionov, O.; Karpov, M.; Emelianova, E. Wood raw materials and wood waste use for the building materials production (on the example of the Republic of Karelia timber industry). E3S Web Conf. 2023, 458, 07025. [Google Scholar] [CrossRef]
  25. Nordic Council of Ministers. Wood in Construction—25 Cases of Nordic Good Practice; Nordic Council of Ministers: Copenhagen, Denmark, 2019. [Google Scholar] [CrossRef]
  26. Caro, D.; Lodato, C.; Damgaard, A.; Cristóbal, J.; Foster, G.; Flachenecker, F.; Tonini, D. Environmental and socio-economic effects of construction and demolition waste recycling in the European Union. Sci. Total Environ. 2024, 908, 168295. [Google Scholar] [CrossRef]
  27. Colorado, H.A.; Muñoz, A.; Monteiro, S.N. Circular economy of construction and demolition waste: A case study of Colombia. Sustainability 2022, 14, 7225. [Google Scholar] [CrossRef]
  28. European Commission; BRE; Directorate-General for Environment; ICEDD. Resource Efficient Use of Mixed Wastes: Improving Management of Construction and Demolition Waste—Final Report; Publications Office of the European Union: Brussels, Belgium, 2017. [Google Scholar] [CrossRef]
  29. Xiao, J.; Deng, Q.; Hou, M.; Shen, J.; Gencel, O. Where are demolition wastes going: Reflection and analysis of the February 6, 2023 earthquake disaster in Turkey. Low-Carbon Mater. Green Constr. 2023, 1, 17. [Google Scholar] [CrossRef]
  30. Nationwide Waste Services. Construction Waste to Materials. 2024. Available online: https://nationwidewasteservices.co.uk/construction-waste-to-materials/ (accessed on 6 April 2025).
  31. Robayo-Salazar, R.; Valencia-Saavedra, W.; Mejía de Gutiérrez, R. Reuse of powders and recycled aggregates from mixed construction and demolition waste in alkali-activated materials and precast concrete units. Sustainability 2022, 14, 9685. [Google Scholar] [CrossRef]
  32. Vásquez, A.; Cárdenas, V.; Robayo, R.A.; Mejía de Gutiérrez, R. Geopolymer based on concrete demolition waste. Adv. Powder Technol. 2016, 27, 1173–1179. [Google Scholar] [CrossRef]
  33. Reig, L.; Sanz, M.A.; Borrachero, M.V.; Monzó, J.; Soriano, L.; Payá, J. Compressive strength and microstructure of alkali-activated mortars with high ceramic waste content. Ceram. Int. 2017, 43, 13622–13634. [Google Scholar] [CrossRef]
  34. Abhilash, H.N.; Walker, P.; Venkatarama Reddy, B.V.; Heath, A.; Maskell, D. Compressive strength of novel alkali-activated stabilized earth materials incorporating solid wastes. J. Mater. Civ. Eng. 2020, 32, 04020118. [Google Scholar] [CrossRef]
  35. Barisoglu, E.N.; Meeusen, J.; Snoeck, D.; Verástegui-Flores, R.D.; Di Emidio, G. Feasibility of using recycled construction and demolition materials for deep soil mixing. Sustainability 2023, 15, 5223. [Google Scholar] [CrossRef]
  36. Hidalgo, C.; Carvajal, G.; Muñoz, F. Laboratory evaluation of finely milled brick debris as a soil stabilizer. Sustainability 2019, 11, 967. [Google Scholar] [CrossRef]
  37. Hidalgo, C.; Carvajal, G.; Hincapie, A.; Muñoz, F.; Hernández, M. Ground improvement by construction and demolition waste (CDW) soil mixture replacement. Buildings 2023, 13, 779. [Google Scholar] [CrossRef]
  38. Zhang, G.; Ding, Z.; Zhang, R.; Chen, C.; Fu, G.; Luo, X.; Wang, Y.; Zhang, C. Combined utilization of construction and demolition waste and propylene fiber in cement-stabilized soil. Buildings 2022, 12, 350. [Google Scholar] [CrossRef]
  39. Manzi, S.; Baldazzi, L.; Saccani, A. Formulating geopolymer mortars through construction and demolition waste (CDW) recycling: A comprehensive case study. Materials 2023, 16, 7304. [Google Scholar] [CrossRef]
  40. Pitarch, Á.M.; Piquer, A.; Reig, L.; Roig-Flores, M.; Albero, V.; Hernández-Figueirido, D.; Melchor-Eixea, A. Reutilization of recycled CDW sand in mortars, paving blocks, and structural concrete. Appl. Sci. 2025, 15, 3652. [Google Scholar] [CrossRef]
  41. Peixoto, M.L.; Jesus, S.D.; Cavalcante, H.S.; Teti, B.S.; Manta, R.C.; Lima, N.B.; Lima, N.B.D. Impacts of high CDW levels on the chemical, microstructural, and mechanical behavior of cement-based mortars. Next Mater. 2025, 8, 100514. [Google Scholar] [CrossRef]
  42. Maaze, M.R.; Shrivastava, S. Design optimization of a recycled concrete waste-based brick through alkali activation using Box-Behnken design methodology. J. Build. Eng. 2023, 75, 106863. [Google Scholar] [CrossRef]
  43. Bassani, M.; Tefa, L.; Russo, A.; Palmero, P. Alkali-activation of recycled construction and demolition waste aggregate with no added binder. Constr. Build. Mater. 2019, 205, 398–413. [Google Scholar] [CrossRef]
  44. Bassani, M.; Tefa, L.; Coppola, B.; Palmero, P. Alkali-activation of aggregate fines from construction and demolition waste: Valorisation in view of road pavement subbase applications. J. Clean. Prod. 2019, 234, 71–84. [Google Scholar] [CrossRef]
  45. Mohammadinia, A.; Arulrajah, A.; Disfani, M.M.; Bo, M.W.; Darmawan, S. Alkali-activated stabilized demolition wastes for geotechnical applications. In Proceedings of the 19th International Conference on Soil Mechanics and Geotechnical Engineering, Seoul, Republic of Korea, 17–21 September 2017; Available online: https://www.issmge.org/publications/online-library (accessed on 7 April 2025).
  46. Bagriacik, B. Utilization of alkali-activated construction demolition waste for sandy soil improvement with large-scale laboratory experiments. Constr. Build. Mater. 2021, 302, 124173. [Google Scholar] [CrossRef]
  47. Robayo-Salazar, R.A.; Valencia-Saavedra, W.; Mejía de Gutiérrez, R. Construction and demolition waste (CDW) recycling—As both binder and aggregates—In alkali-activated materials: A novel re-use concept. Sustainability 2020, 12, 5775. [Google Scholar] [CrossRef]
  48. Murillo, L.M.; Delvasto, S.; Gordillo, M. A study of a hybrid binder based on alkali-activated ceramic tile wastes and Portland cement. In Sustainable and Nonconventional Construction Materials Using Inorganic Bonded Fiber Composites; Turgut, A.P., Mobasher, B., Eds.; Woodhead Publishing: Cambridge, UK, 2017; pp. 291–311. [Google Scholar] [CrossRef]
  49. Robayo-Salazar, R.; Valencia-Saavedra, W.; Mejía de Gutiérrez, R. Recycling of concrete, ceramic, and masonry waste via alkaline activation: Obtaining and characterization of hybrid cements. J. Build. Eng. 2022, 46, 103698. [Google Scholar] [CrossRef]
  50. Rovnaník, P.; Řezník, B.; Rovnaníková, P. Blended alkali-activated fly ash/brick powder materials. Procedia Eng. 2016, 151, 108–113. [Google Scholar] [CrossRef]
  51. Hwang, C.L.; Yehualaw, M.D.; Vo, D.H.; Huynh, T.P.; Largo, A. Performance evaluation of alkali activated mortar containing high volume of waste brick powder blended with ground granulated blast furnace slag cured at ambient temperature. Constr. Build. Mater. 2019, 223, 657–667. [Google Scholar] [CrossRef]
  52. Komnitsas, K.; Zaharaki, D.; Vlachou, A.; Bartzas, G.; Galetakis, M. Effect of synthesis parameters on the quality of construction and demolition wastes (CDW) geopolymers. Adv. Powder Technol. 2015, 26, 368–376. [Google Scholar] [CrossRef]
  53. Hwang, C.L.; Yehualaw, M.D.; Vo, D.H.; Huynh, T.P. Development of high-strength alkali-activated pastes containing high volumes of waste brick and ceramic powders. Constr. Build. Mater. 2019, 218, 519–529. [Google Scholar] [CrossRef]
  54. Kravchenko, E.; Lazorenko, G.; Jiang, X.; Leng, Z. Alkali-activated materials made of construction and demolition waste as precursors: A review. Sustain. Mater. Technol. 2024, 39, e00829. [Google Scholar] [CrossRef]
  55. Dwibedy, S.; Parhi, S.K.; Panda, S.; Panigrahi, S.K. Performance of precursor characteristics in the realisation of geopolymer concrete: A review. Mag. Concr. Res. 2024, 76, 1404–1423. [Google Scholar] [CrossRef]
  56. Damilola, O.M. Syntheses, characterization and binding strength of geopolymers: A review. Int. J. Mater. Sci. Appl. 2013, 2, 185–192. [Google Scholar] [CrossRef]
  57. Alhawat, M.; Ashour, A.; Yildirim, G.; Aldemir, A.; Sahmaran, M. Properties of geopolymers sourced from construction and demolition waste: A review. J. Build. Eng. 2022, 50, 104104. [Google Scholar] [CrossRef]
  58. Davidovits, J. Geopolymers—Inorganic polymeric new materials. J. Therm. Anal. 1991, 37, 1633–1656. [Google Scholar] [CrossRef]
  59. De Silva, P.; Sagoe-Crenstil, K.; Sirivivatnanon, V. Kinetics of geopolymerization: Role of Al2O3 and SiO2. Cem. Concr. Res. 2007, 37, 512–518. [Google Scholar] [CrossRef]
  60. Lin, J.; Zhang, Y.; Yang, Z. A review of recent advances in alkali-activated materials from silica-rich wastes derived sodium silicate activators. J. Adv. Concr. Technol. 2023, 21, 189–203. [Google Scholar] [CrossRef]
  61. Antonić, T.; Čižmek, A.; Kosanović, C.; Subotić, B. Dissolution of amorphous aluminosilicate zeolite precursors in alkaline solutions. Part 1—Kinetics of the dissolution. J. Chem. Soc. Faraday Trans. 1993, 89, 1817–1822. [Google Scholar] [CrossRef]
  62. Alzeer, M.I.M.; Nguyen, H.; Cheeseman, C.; Kinnunen, P. Alkali-activation of synthetic aluminosilicate glass with basaltic composition. Front. Chem. 2021, 9, 715052. [Google Scholar] [CrossRef]
  63. Rattanasak, U.; Chindaprasirt, P. Influence of NaOH solution on the synthesis of fly ash geopolymer. Miner. Eng. 2009, 22, 1073–1078. [Google Scholar] [CrossRef]
  64. Weil, M.; Dombrowski, K.; Buchwald, A. Life-Cycle Analysis of Geopolymers; Elsevier: Amsterdam, The Netherlands, 2009. [Google Scholar] [CrossRef]
  65. Li, Y.; Dong, Y.; El-Naggar, M.R.; Wang, F.; Zhao, Y. The influence of particle size and calcium content on performance characteristics of metakaolin- and fly-ash-based geopolymer gels. Gels 2024, 10, 639. [Google Scholar] [CrossRef] [PubMed]
  66. Zhao, X.; Liu, C.; Zuo, L.; Wang, L.; Zhu, Q.; Wang, M. Investigation into the effect of calcium on the existence form of geopolymerized gel product of fly ash based geopolymers. Cem. Concr. Compos. 2019, 103, 279–292. [Google Scholar] [CrossRef]
  67. Chen, X.; Kim, E.; Suraneni, P.; Struble, L. Quantitative correlation between the degree of reaction and compressive strength of metakaolin-based geopolymers. Materials 2020, 13, 5784. [Google Scholar] [CrossRef]
  68. Zhang, P.; Gao, Z.; Wang, J.; Guo, J.; Hu, S.; Ling, Y. Properties of fresh and hardened fly ash/slag based geopolymer concrete: A review. J. Clean. Prod. 2020, 270, 122389. [Google Scholar] [CrossRef]
  69. Komnitsas, K.; Peys, A.; Tampouris, S.; Karmali, V.; Bartzas, G.; Vathi, D.; Kritikaki, A. Synthesis and morphology of slag-based alkali-activated materials. Min. Metall. Explor. 2024, 42, 1–13. [Google Scholar] [CrossRef]
  70. Zhao, J.; Wang, A.; Lyu, B.; Liu, K.; Chu, Y.; Ma, R.; Xu, H.; Jing, Y.; Sun, D. Proportioning factors of alkali-activated materials and interaction relationship revealed by response surface modeling. Materials 2023, 16, 2042. [Google Scholar] [CrossRef] [PubMed]
  71. Król, M.; Rożek, P.; Chlebda, D.; Mozgawa, W. Influence of alkali metal cations/type of activator on the structure of alkali-activated fly ash—ATR-FTIR studies. Spectrochim. Acta Part A Mol. Biomol. Spectrosc. 2018, 198, 33–37. [Google Scholar] [CrossRef]
  72. Yıldırım, G.; Kul, A.; Özçelikci, E.; Şahmaran, M.; Aldemir, A.; Figueira, D.; Ashour, A. Development of alkali-activated binders from recycled mixed masonry-originated waste. J. Build. Eng. 2021, 33, 101690. [Google Scholar] [CrossRef]
  73. Rathnayaka, M.; Karunasinghe, D.; Gunasekara, C.; Wijesundara, K.; Lokuge, W.; Law, D.W. Machine learning approaches to predict compressive strength of fly ash-based geopolymer concrete: A comprehensive review. Constr. Build. Mater. 2024, 419, 135519. [Google Scholar] [CrossRef]
  74. Alaneme, G.U.; Olonade, K.A.; Esenogho, E.; Lawan, M.M.; Dintwa, E. Artificial intelligence prediction of the mechanical properties of banana peel-ash and bagasse blended geopolymer concrete. Sci. Rep. 2024, 14, 26151. [Google Scholar] [CrossRef] [PubMed]
  75. Sonin, A.A. The Physical Basis of Dimensional Analysis. 2001. Available online: https://web.mit.edu/2.25/www/pdf/DA_unified.pdf (accessed on 28 April 2025).
  76. Phatak, D.R.; Deshpande, N.P. Prediction of 28 days compressive strength of 53-grade cements using dimensional analysis. J. Mater. Civ. Eng. 2005, 17, 733–735. [Google Scholar] [CrossRef]
  77. Shi, X.; Chen, S.; Wang, Q.; Lu, Y.; Ren, S.; Huang, J. Mechanical framework for geopolymer gels construction: An optimized LSTM technique to predict compressive strength of fly ash-based geopolymer gels concrete. Gels 2024, 10, 148. [Google Scholar] [CrossRef]
  78. Chandak, M.; Chaudhari, P. Application of dimensional analysis in prediction of strength of asphalt mix. IJSTE—Int. J. Sci. Technol. Eng. 2016, 2, 676–679. [Google Scholar]
  79. Tolun, M. Efficiency of dimensional analysis in predicting compression load–settlement relationship of soft clay under a rigid foundation. Appl. Sci. 2024, 14, 11252. [Google Scholar] [CrossRef]
  80. Ferretti, D. Dimensional analysis and calibration of a power model for compressive strength of solid-clay-brick masonry. Eng. Struct. 2020, 205, 110064. [Google Scholar] [CrossRef]
  81. Alonso-Betanzos, A.; Castillo, E.; Fontenla-Romero, O.; Sánchez-Marono, N. Shear strength prediction using di-mensional analysis and functional networks. In Proceedings of the European Symposium on Artificial Neural Networks (ESANN04), Bruges, Belgium, 28–30 April 2004; pp. 251–256. [Google Scholar]
  82. Matsimbe, J.; Dinka, M.; Olukanni, D.; Musonda, I. Fundamental machine learning algorithms and statistical models applied in strength prediction of geopolymers: A systematic review. Discov. Appl. Sci. 2024, 6, 538. [Google Scholar] [CrossRef]
  83. Putri, A.D. Recycled Concrete Aggregate (RCA) for the Use in Construction: General Review; Advance Concrete Materials, School of Civil Engineering: Beijing, China, 2017; Available online: https://www.researchgate.net/publication/327916306_Recycled_Concrete_Aggregate_RCA_for_the_Use_in_Construction_General_Review (accessed on 28 April 2025).
  84. Shi, C.; Li, Y.; Zhang, J.; Li, W.; Chong, L.; Xie, Z. Performance enhancement of recycled concrete aggregate—A review. J. Clean. Prod. 2016, 112, 466–472. [Google Scholar] [CrossRef]
  85. Cantero, B.; Neves, R.; Sequeira, L.; de Brito, J.; Bravo, M. Optimisation of the performance of alkali-activated mortars using CDW binders from different sources. Constr. Build. Mater. 2024, 442, 137677. [Google Scholar] [CrossRef]
  86. Díaz, A.G.; Bueno, S.; Villarejo, L.P.; Eliche-Quesada, D. Improved strength of alkali activated materials based on construction and demolition waste with addition of rice husk ash. Constr. Build. Mater. 2024, 413, 134823. [Google Scholar] [CrossRef]
  87. ASTM D6913/D6913M-17; Test Methods for Particle-Size Distribution (Gradation) of Soils Using Sieve Analysis. ASTM International: West Conshohocken, PA, USA, 2017. [CrossRef]
  88. ASTM C305-20; Practice for Mechanical Mixing of Hydraulic Cement Pastes and Mortars of Plastic Consistency. ASTM International: West Conshohocken, PA, USA, 2020. [CrossRef]
  89. ASTM C109/C109M-20; Test Method for Compressive Strength of Hydraulic Cement Mortars (Using 2-in. or [50-mm] Cube Specimens). ASTM International: West Conshohocken, PA, USA, 2020. [CrossRef]
  90. ASTM C597-16; Test Method for Pulse Velocity Through Concrete. ASTM International: West Conshohocken, PA, USA, 2016. [CrossRef]
  91. ASTM D559/D559M-15; Test Methods for Wetting and Drying Compacted Soil-Cement Mixtures. ASTM International: West Conshohocken, PA, USA, 2015. [CrossRef]
  92. ASTM D560-03; Test Methods for Freezing and Thawing Compacted Soil-Cement Mixtures. ASTM International: West Conshohocken, PA, USA, 2003. [CrossRef]
  93. Weng, L.; Sagoe-Crentsil, K. Dissolution processes, hydrolysis and condensation reactions during geopolymer synthesis: Part I—Low Si/Al ratio systems. J. Mater. Sci. 2007, 42, 2997–3006. [Google Scholar] [CrossRef]
  94. Pasupathy, K.; Ramakrishnan, S.; Sanjayan, J. 3D concrete printing of eco-friendly geopolymer containing brick waste. Cem. Concr. Compos. 2023, 138, 104943. [Google Scholar] [CrossRef]
  95. García-Lodeiro, I.; Fernández-Jiménez, A.; Blanco, M.T.; Palomo, A. FTIR study of the sol-gel synthesis of cementitious gels: C–S–H and N–A–S–H. J. Sol-Gel Sci. Technol. 2008, 45, 63–72. [Google Scholar] [CrossRef]
  96. García-Lodeiro, I.; Palomo, A.; Fernández-Jiménez, A.; MacPhee, D.E. Compatibility studies between N-A-S-H and C-A-S-H gels: Study in the ternary diagram Na2O–CaO–Al2O3–SiO2–H2O. Cem. Concr. Res. 2011, 41, 923–931. [Google Scholar] [CrossRef]
  97. Suescum-Morales, D.; Silva, R.V.; Bravo, M.; Jiménez, J.R.; Fernández-Rodríguez, J.M.; de Brito, J. Effect of incorporating municipal solid waste incinerated bottom ash in alkali-activated fly ash concrete subjected to accelerated CO2 curing. J. Clean. Prod. 2022, 370, 133533. [Google Scholar] [CrossRef]
  98. Ngo, S.-H. Performance of geopolymer bricks with various NaOH concentrations as activator. ARPN J. Eng. Appl. Sci. 2020, 15, 1234–1240. [Google Scholar]
  99. Ghosh, R.; Sagar, S.P.; Kumar, A.; Gupta, S.K.; Kumar, S. Estimation of geopolymer concrete strength from ultrasonic pulse velocity (UPV) using high power pulser. J. Build. Eng. 2018, 16, 39–44. [Google Scholar] [CrossRef]
  100. Liu, J.; Guo, L.; Cheng, L.; Xi, Y.; Chen, D. Effect of alkali dosage and silicate modulus on the deterioration of alkali-activated concrete properties subjected to sodium chloride attack and freeze–thaw cycles. Constr. Build. Mater. 2024, 449, 138335. [Google Scholar] [CrossRef]
  101. Risdanareni, P.; Schollbach, K.; Wang, J.; De Belie, N. The effect of NaOH concentration on the mechanical and physical properties of alkali activated fly ash-based artificial lightweight aggregate. Constr. Build. Mater. 2020, 259, 119832. [Google Scholar] [CrossRef]
  102. Huseien, G.F.; Khamehchi, M.; Kubba, Z.; Benjeddou, O.; Mahmoodi, M.J. Freeze–thaw cycle and abrasion resistance of alkali-activated FA and POFA-based mortars: Role of high volume GBFS incorporation. Heliyon 2023, 9, e17672. [Google Scholar] [CrossRef]
  103. Zhao, Y.; Gao, J.; Liu, C.; Chen, X.; Xu, Z. The particle-size effect of waste clay brick powder on its pozzolanic activity and properties of blended cement. J. Clean. Prod. 2020, 242, 118521. [Google Scholar] [CrossRef]
  104. Xu, J.; Xiong, W.; Guo, X.; Lai, T.; Liu, Y.; Ying, W. Properties of using excavated soil waste as fine and coarse aggregates in unfired clay bricks after dry–wet cycles. Case Stud. Constr. Mater. 2022, 17, e01471. [Google Scholar] [CrossRef]
  105. Teymouri, M.; Behfarnia, K.; Shabani, A. Mix design effects on the durability of alkali-activated slag concrete in a hydrochloric acid environment. Sustainability 2021, 13, 8096. [Google Scholar] [CrossRef]
  106. İlcan, H.; Demirbaş, A.O.; Ulugöl, H.; Şahmaran, M. Low-alkaline activated construction and demolition waste-based geopolymers. Constr. Build. Mater. 2024, 411, 134546. [Google Scholar] [CrossRef]
  107. Aygörmez, Y.; Canpolat, O.; Al-mashhadani, M.M.; Uysal, M. Elevated temperature, freezing–thawing and wetting–drying effects on polypropylene fiber reinforced metakaolin-based geopolymer composites. Constr. Build. Mater. 2020, 235, 117502. [Google Scholar] [CrossRef]
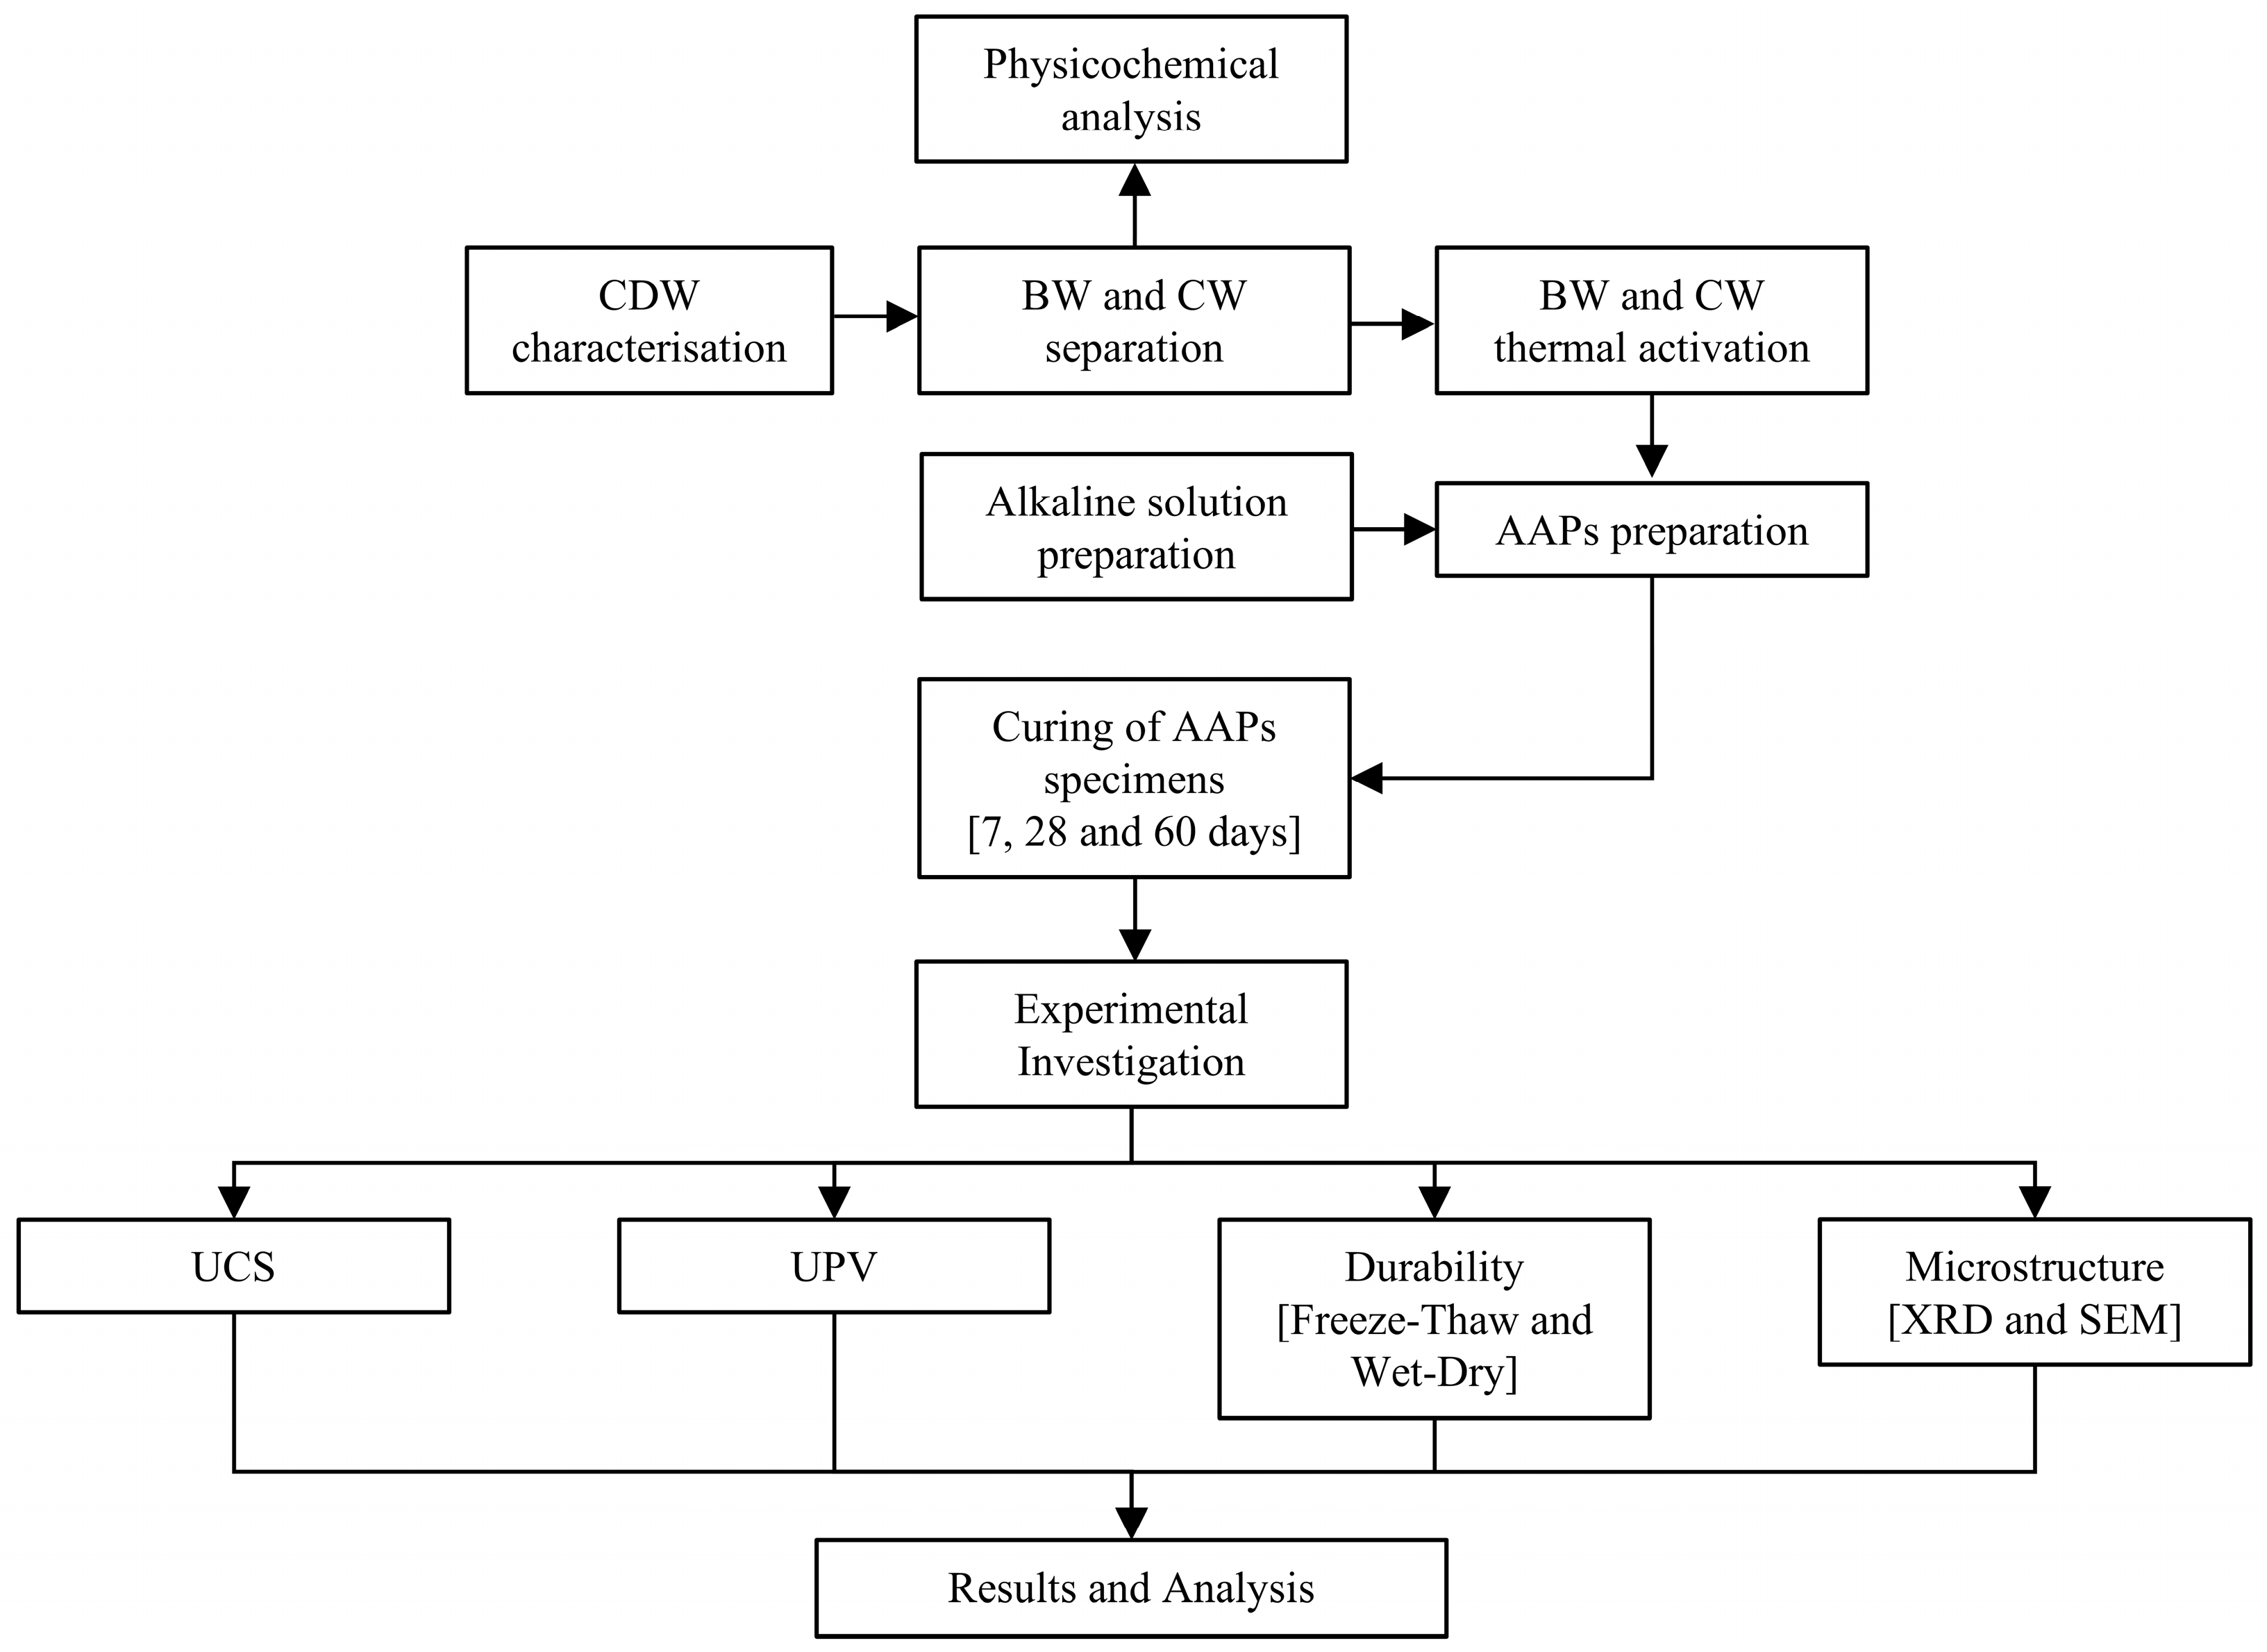
Figure 1. Research setup and flow.
Buildings 15 03830 g001
Figure 2. (a) Landfill location and (b) composition of CDW site.
Buildings 15 03830 g002
Figure 3. (a) Particle size distribution of BW & CW and (b) raw materials used: fine CW & BW (<75 µm) and NaOH pellets.
Buildings 15 03830 g003
Figure 4. Cubic samples showing (BW/TW = 0) to (BW/TW = 1.0) from left to right.
Buildings 15 03830 g004
Figure 5. Different phases of the wet and dry cyclic test.
Buildings 15 03830 g005
Figure 6. Different phases of the freeze–thaw cyclic test.
Buildings 15 03830 g006
Figure 7. Effect of NaOH, Curing Period and BW/TW Content on Compressive Strength of AAPs.
Buildings 15 03830 g007
Figure 8. Variation in UCS with recycled concrete-to-brick ratio under different NaOH concentrations and curing regimes.
Buildings 15 03830 g008
Figure 9. Synergistic influence of AAP composition on UCS development for (a) 7 days, (b) 28 days, and (c) 60 days and (d) prediction accuracy plot.
Buildings 15 03830 g009
Figure 10. (a) Frequency distribution histogram of UCS and (b) Pearson correlation heatmap.
Buildings 15 03830 g010
Figure 11. (a) Comparison of predicted and experimental UCS values and (b) residuals.
Buildings 15 03830 g011
Figure 12. Effect of NaOH, Curing Period and BW/TW Content on Stiffness of AAPs.
Buildings 15 03830 g012
Figure 13. Variation in Go with recycled concrete-to-brick ratio under different NaOH concentrations and curing regimes.
Buildings 15 03830 g013
Figure 14. Synergistic influence of AAP composition on Go for (a) 7 days, (b) 28 days, and (c) 60 days and (d) prediction accuracy plot.
Buildings 15 03830 g014
Figure 15. (a) Frequency distribution histogram of Go and (b) Pearson correlation heatmap.
Buildings 15 03830 g015
Figure 16. (a) Comparison of predicted and experimental Go values and (b) residuals.
Buildings 15 03830 g016
Figure 17. ALM of AMMs under F/T for 7 days, (a) 0% NaOH, (b) 5% NaOH, (c) 7% NaOH, and (d) 10% NaOH; 28 days, (e) 0% NaOH and (f) 5% NaOH, (g) 7% NaOH and (h) 10% NaOH; 60 days, (i) 0% NaOH, (j) 5% NaOH, (k) 7% NaOH, and (l) 10% NaOH.
Buildings 15 03830 g017aBuildings 15 03830 g017b
Figure 18. Effect of NaOH, Curing Period and BW/TW Content on F/T Resistance of AAPs.
Buildings 15 03830 g018
Figure 19. ALM of AMMs under W/D for 7 days, (a) 0% NaOH, (b) 5% NaOH, (c) 7% NaOH, and (d) 10% NaOH; 28 days (e) 0% NaOH and (f) 5% NaOH, (g) 7% NaOH and (h) 10% NaOH; 60 days, (i) 0% NaOH, (j) 5% NaOH, (k) 7% NaOH, and (l) 10% NaOH.
Buildings 15 03830 g019aBuildings 15 03830 g019b
Figure 20. Effect of NaOH, Curing Period and BW/TW Content on W/D Resistance of AAP.
Buildings 15 03830 g020
Figure 21. XRD patterns of mortar blends (90% BW and 10% CW): Samples 1–4, 7 days; Samples 5–8, 60 days.
Buildings 15 03830 g021
Figure 22. Zoomed-in 26.2–31° 2θ XRD patterns of mortar blends.
Buildings 15 03830 g022
Figure 23. PCA of XRD intensity profiles for mortar blends.
Buildings 15 03830 g023
Figure 24. SEM micrograph of mortar blends subjected to a 7-day curing regime: (a) 0% NaOH, (b) 5% NaOH, (c) 7% NaOH, and (d) 10% NaOH.
Buildings 15 03830 g024
Figure 25. SEM micrograph of mortar blends subjected to a 60-day curing regime: (a) 0% NaOH, (b) 5% NaOH, (c) 7% NaOH, and (d) 10% NaOH.
Buildings 15 03830 g025
Table 1. Composition of CDW in different countries.
RegionMaterial TypeAverage
Proportion
(%)
Ref.RegionMaterial TypeAverage
Proportion
(%)
Ref.
EUConcrete~30–50[26]ChinaConcrete~40–50[27]
Bricks~10–25Brick~20–30
Wood~5–15Mortar~10–15
GermanyConcrete, bricks, tiles~60.00[28]SpainConcrete~30–40[27]
Wood, glass, plastic~5.00Brick~25–35
Bituminous and coal tar~20.00Mortar~15–20
DenmarkConcrete, bricks, tiles~50.00[28]IndiaBrick and Masonry~30–35[22]
Wood, glass, plastic~5.00Concrete~25–30
Metals~17.00Soil, Sand and Gravel~30–40
TurkeyConcrete and Mortar~40–60[29]UKConcrete~25.00[30]
Masonry~20–30Asphalt~16.70
Wood~5–10Wood~8.30
Metals~12.50
Table 3. Physical Properties of CW & BW.
Material PropertyConcrete Waste
(CW)
Brick Waste
(BW)
Gravel (%)0.080.08
Sand (%)98.4193.30
Fines (%)1.516.62
D100.260.1
D300.310.19
D600.410.3
Cc0.901.20
Cu1.583.00
Specific Gravity, Gs2.482.14
Table 4. Chemical Composition of BW and CW.
Oxides
(%)
Brick Waste
(BW)
Concrete Waste
(CW)
CaO22.7052.90
SiO232.606.26
Al2O310.501.79
Fe2O37.591.09
SO30.500.69
MgO4.645.90
K2O1.390.14
CO217.9030.70
Table 5. Sample Preparation and Testing Regime.
NaOH
Content (%)
BW/TW
Ratios Tested
Curing Ages
(Days)
Specimens
per Mix
Specimen Allocation
per Mix
Total Specimens
per NaOH Dosage
00.0–1.0 (11 levels) *7, 28, 6042 for UPV/UCS
1WD a; 1FT b
132
50.0–1.0 (11 levels)7, 28, 6042 for UPV/UCS
1WD; 1FT
132
70.0–1.0 (11 levels)7, 28, 6042 for UPV/UCS
1WD; 1FT
132
100.0–1.0 (11 levels)7, 28, 6042 for UPV/UCS
1WD; 1FT
132
Total528
* 11 Levels ⇾ BW/TW = 0.0, 0.1, 0.2, 0.3, 0.4, 0.5, 0.6, 0.7, 0.8, 0.9, 1.0. a WD: Wet–Dry. b FT: Freeze–Thaw.
Table 6. Regression coefficients of Equation (2).
VariableSymbolUnitsDimensions
Unconfined compressive strengthUCSkPA[M L−1 T−2]
Recycled concrete wasteCW% (by mass)---
Recycled brick wasteBW% (by mass)---
Alkali activatorNaOH% (by mass)---
Curing regimeTdays[T]
Table 7. Relevant variable identification for Buckingham π-theorem application.
Curing Regime (Days)αβλκR2RMSE
732.390.067390.9367−31.400.95430.8161
2812.250.236801.1780−11.750.93301.3470
6013.980.252801.4500−14.220.92141.802
Table 8. Regression coefficients of Equation (10).
Curing Regime (Days)αβλκR2RMSE
728.010.067491.474−31.430.93771.092
2850.980.047211.187−44.860.94781.011
6010.690.19071.312---0.93341.107
Table 9. Relevant variables identification for Buckingham π-theorem application for G0.
VariableSymbolUnitsDimensions
Shear ModulusGoGPA[M L−1 T−2]
Recycled concreteCW% (by mass)---
Recycled brickBW% (by mass)---
Alkali activatorNaOH% (by mass)---
Curing regimeTdays[T]
Table 10. Summary of ANOVA results for compressive strength, shear modulus, and mass loss under durability testing.
Response VariableSourceSum of
Squares
Degrees
of
Freedom
(df)
Mean
Square
F-Ratiop-Value
Compressive Strength,
UCS (MPa)
A: BW/TW2607.8710260.79595.970.000
B: Curing Period (Days)264.212132.11301.90.000
C: NaOH Content (%)4861.1831620.393703.080.000
AB137.54206.8815.720.000
AC1046.273034.8879.70.000
BC119.91619.9945.670.000
ABC95.06601.583.620.000
Residual57.761320.44
Total (Corrected)9189.8263
Initial Shear Modulus,
Go (GPa)
A: BW/TW1406.2910140.631067.890.000
B: Curing Period (Days)42582212916,166.930.000
C: NaOH Content (%)10,166.433388.825,733.450.000
AB20.66201.037.840.000
AC546.73018.22138.380.000
BC1258.976209.831593.370.000
ABC24.52600.413.10.000
Residual17.381320.13
Total (Corrected)17,698.9263
Wet–Dry Accumulated Mass Loss
(%)
A: BW/TW230.891023.0927.310.000
B: NaOH Content (%)7341.3232447.112894.020.000
C: Curing Period (Days)184.35292.18109.010.000
AB219.08307.38.640.000
AC15.96200.80.940.038
BC31.5365.256.210.000
ABC50.73600.852.580.056
Residual00
Total (Corrected)8073.86131
Freeze–Thaw Accumulated Mass Loss (%)A: BW/TW1599.3310159.9354.070.000
B: NaOH Content (%)6592.532197.5742.890.000
C: Curing Period (Days)632.322316.16106.880.000
AB340.183011.343.830.000
AC64.83203.241.10.048
BC12.7862.130.720.055
ABC177.48602.961.390.068
Residual00
Total (Corrected)9419.42131
Disclaimer/Publisher’s Note: The statements, opinions and data contained in all publications are solely those of the individual author(s) and contributor(s) and not of MDPI and/or the editor(s). MDPI and/or the editor(s) disclaim responsibility for any injury to people or property resulting from any ideas, methods, instructions or products referred to in the content.