1. Introduction
Against the backdrop of China’s “dual carbon” goals, there is an urgent imperative for green transformation in both the ecological environment and industrial structure. The construction industry, as the primary contributor of carbon emissions (accounting for 50.9%), faces a stark contradiction between its high energy consumption, high pollution profile, and the low-carbon objectives, posing intricate challenges to urban and rural development, thereby making the green transition of construction enterprises an urgent necessity [
1]. Driven by the “dual carbon” goals and supportive policies, green technological innovation has emerged as a pivotal avenue for the construction industry’s green transformation. By refining production methods and integrating carbon reduction with efficiency enhancements, it bolsters corporate competitiveness and facilitates industry-wide energy conservation and emissions reduction. Green and ultra-low-energy buildings, in particular, achieve substantial emissions cuts and serve as a vital driving force in realizing the “dual carbon” targets [
2].
However, a central obstacle to implementing green technological innovation in the construction industry lies in the conflicting interests among multiple stakeholders. Innovation involves a complex web of participants, and the challenges of balancing these interests result in inadequate corporate enthusiasm and frequent instances of “greenwashing”, while the relationships and underlying mechanisms of action among entities at various stages remain poorly understood.
A review of existing research reveals the following facts. From an international green finance perspective, cutting-edge research since 2022 has centered on three primary directions. First, studies have explored the differentiated effects of green financial instruments. For instance, Kumar et al. [
3] employed panel data from the construction sectors of G20 countries to verify that green loans outperform green bonds significantly in incentivizing innovation in prefabricated assembly technologies—though government-provided risk mitigation mechanisms remain indispensable. Second, international comparisons. Liu et al. [
4] promoted green transformation in the construction sector through green financial instruments (GFIs). They developed a system dynamics assessment method to quantify the systemic impact of GFIs on new green building construction and energy retrofits of existing buildings. Results indicate that implementing a combination of multiple GFIs can reduce energy consumption. Carrera et al. [
5] develop an evolutionary game to show the conditions such that the economy dynamically evolves towards one state or another, i.e., green vs. brown, or fluctuates around them. We show that the green state is asymptotically stable if the green firms’ revenues minus their bank loans and transition costs are greater than the brown firms’ revenues and pollution costs, together with green interest rates, such that the default risk is lower for green firms.
With respect to green technology innovation in construction enterprises, existing studies by Chinese scholars have also yielded valuable insights. Wang et al. [
6] analyzed the dynamic game relationship between developers and consumers under two scenarios: anarchy and a dual incentive–penalty mechanism with government participation. Wang [
7] constructed an evolutionary game model for green technology innovation involving local governments, enterprises, and consumers. This model revealed the dynamic evolutionary patterns of systemic equilibrium strategies across different scenarios, identifying market returns from green products and brand benefits derived from technological innovation as key drivers that propel the game system toward distinct stable equilibrium states.
Feng et al. [
8] developed a game model between construction enterprises and consumers, with government subsidies as the control variable, and analyzed behavioral trajectories under three scenarios: no subsidies, partial subsidies, and two-way subsidies. They also established a two-party game model between government regulators and construction enterprises to examine the factors influencing the green building construction process. Sun [
9] proposed a tripartite evolutionary game model involving governments, the public, and construction enterprises for mega-construction projects, which accounts for multi-stakeholder interactions. The findings indicate that government penalties/subsidies and the level of public participation exert significant impacts on enterprises’ motivation to engage in green innovation.
Li, Wan et al. [
10] investigated the tripartite game behavior among governments, enterprises, and the public. Their research suggests that moderate public environmental awareness campaigns effectively promote green technological innovation, while excessive emphasis on such campaigns yields suboptimal results. In terms of policy tool combinations, the coordinated implementation of pollution taxes and innovation incentives substantially increases the rate at which enterprises adopt green technologies. However, attention must be paid to balancing the intensity of fiscal subsidies with the stringency of environmental regulations—excessively high subsidies may distort policy signals. Zou et al. [
11] established an evolutionary game model involving “government–enterprise–public” and found that effective government policy guidance plays a pivotal role in enterprises’ green technology R&D behavior. Additionally, there exists an interactive relationship between enterprises’ green technology R&D activities and the public’s purchase of carbon-labeled products. While domestic and international studies have delved into the connotations, influencing factors, challenges, and evolution of green technology innovation, they harbor certain limitations: Firstly, research on the interplay between “dual carbon” policies and corporate green technology innovation has primarily centered on the impact mechanisms of singular environmental regulatory tools, with limited literature providing a comprehensive examination of both command-and-control and market-incentive instruments. Secondly, discussions on stakeholder relationships in construction firms’ green technology innovation often exhibit a one-sided perspective, neglecting to analyze stakeholder game behavior by stages of the innovation process, resulting in ambiguous stage delineations and unclear relationships and mechanisms among stakeholders at each stage. Thirdly, in stakeholder game analysis, the literature involving financial institutions, evaluation bodies, and four-party games is scarce, and most studies fail to consider the divergent interest objectives between central and local governments at different stages of green technology innovation [
12]. Central and local governments may exhibit policy implementation goal discrepancies due to regional economic interests, forming a dynamic strategic interaction system that necessitates attention in green technology innovation within construction companies [
13]. Furthermore, financial institutions and evaluation bodies play a crucial role in green technology innovation, yet related evolutionary strategies predominantly focus on manufacturing, with limited exploration in the construction sector [
14].
In summary, this study sets out to tackle the hurdles in advancing green technology innovation. Against the backdrop of China’s “dual carbon” objectives, it establishes a dynamic evolutionary game model tailored to the decision-making phase of green technology innovation, with a keen focus on the divergent interest objectives of central and local governments across different stages of this innovation process. By integrating SD simulation and modeling techniques, the study delves into how initial intentions and parameter fluctuations affect system stability, and pinpoints the key factors shaping strategic choices. Theoretically, to address the lack of integration of financial entities in existing research on green innovation within the construction industry, we construct a tripartite evolutionary game model involving governments, construction enterprises, and banks. By combining evolutionary game theory with system dynamics, we quantify the impact of various parameters on stakeholders’ strategic choices. This not only fills the methodological gap in current research but also provides methodological guidance for subsequent studies focusing on other phases of the game (e.g., the implementation phase of green innovation).
Practically, this research offers quantitative evidence to support governments in formulating differentiated policies—for instance, determining appropriate subsidy thresholds under varying probabilities of green innovation failure. It also guides construction enterprises and banks to adjust their strategies with precision: for example, enterprises can select the optimal timing for green innovation based on credit interest rates, while banks can set subsidy requirements according to the risk profiles of green construction projects. Such guidance is instrumental in driving the construction industry to shift from a state of “passive compliance” to one of “proactive innovation.” This study is not without limitations. First, the parameter values employed in the model are derived solely from data collected in City M, which limits the regional representativeness of the findings and fails to account for developmental disparities across the construction sectors in eastern, central, and western China. Second, other relevant stakeholders—such as the general public and building material suppliers—were excluded from the model, which restricts the model’s ability to fully reflect the complexity of the green innovation decision-making network. Third, the study does not differentiate between types of green technologies (e.g., energy-saving technologies and solid waste utilization technologies), despite the fact that distinct strategic dynamics may exist across these technology categories.
Future research will address these limitations by pursuing three key directions: expanding the scope of surveys to cover construction sectors in eastern, central, and western regions, thereby developing region-specific parameter systems to enhance the generalizability of conclusions; incorporating public participation factors (e.g., consumer preferences for green buildings) into the model, evolving it into a four-party game framework involving governments, enterprises, banks, and the public; and segmenting research scenarios based on green technology types, to refine the analysis of strategic interactions and improve the specificity and applicability of research conclusions.
2. Model Building
2.1. Problem Description
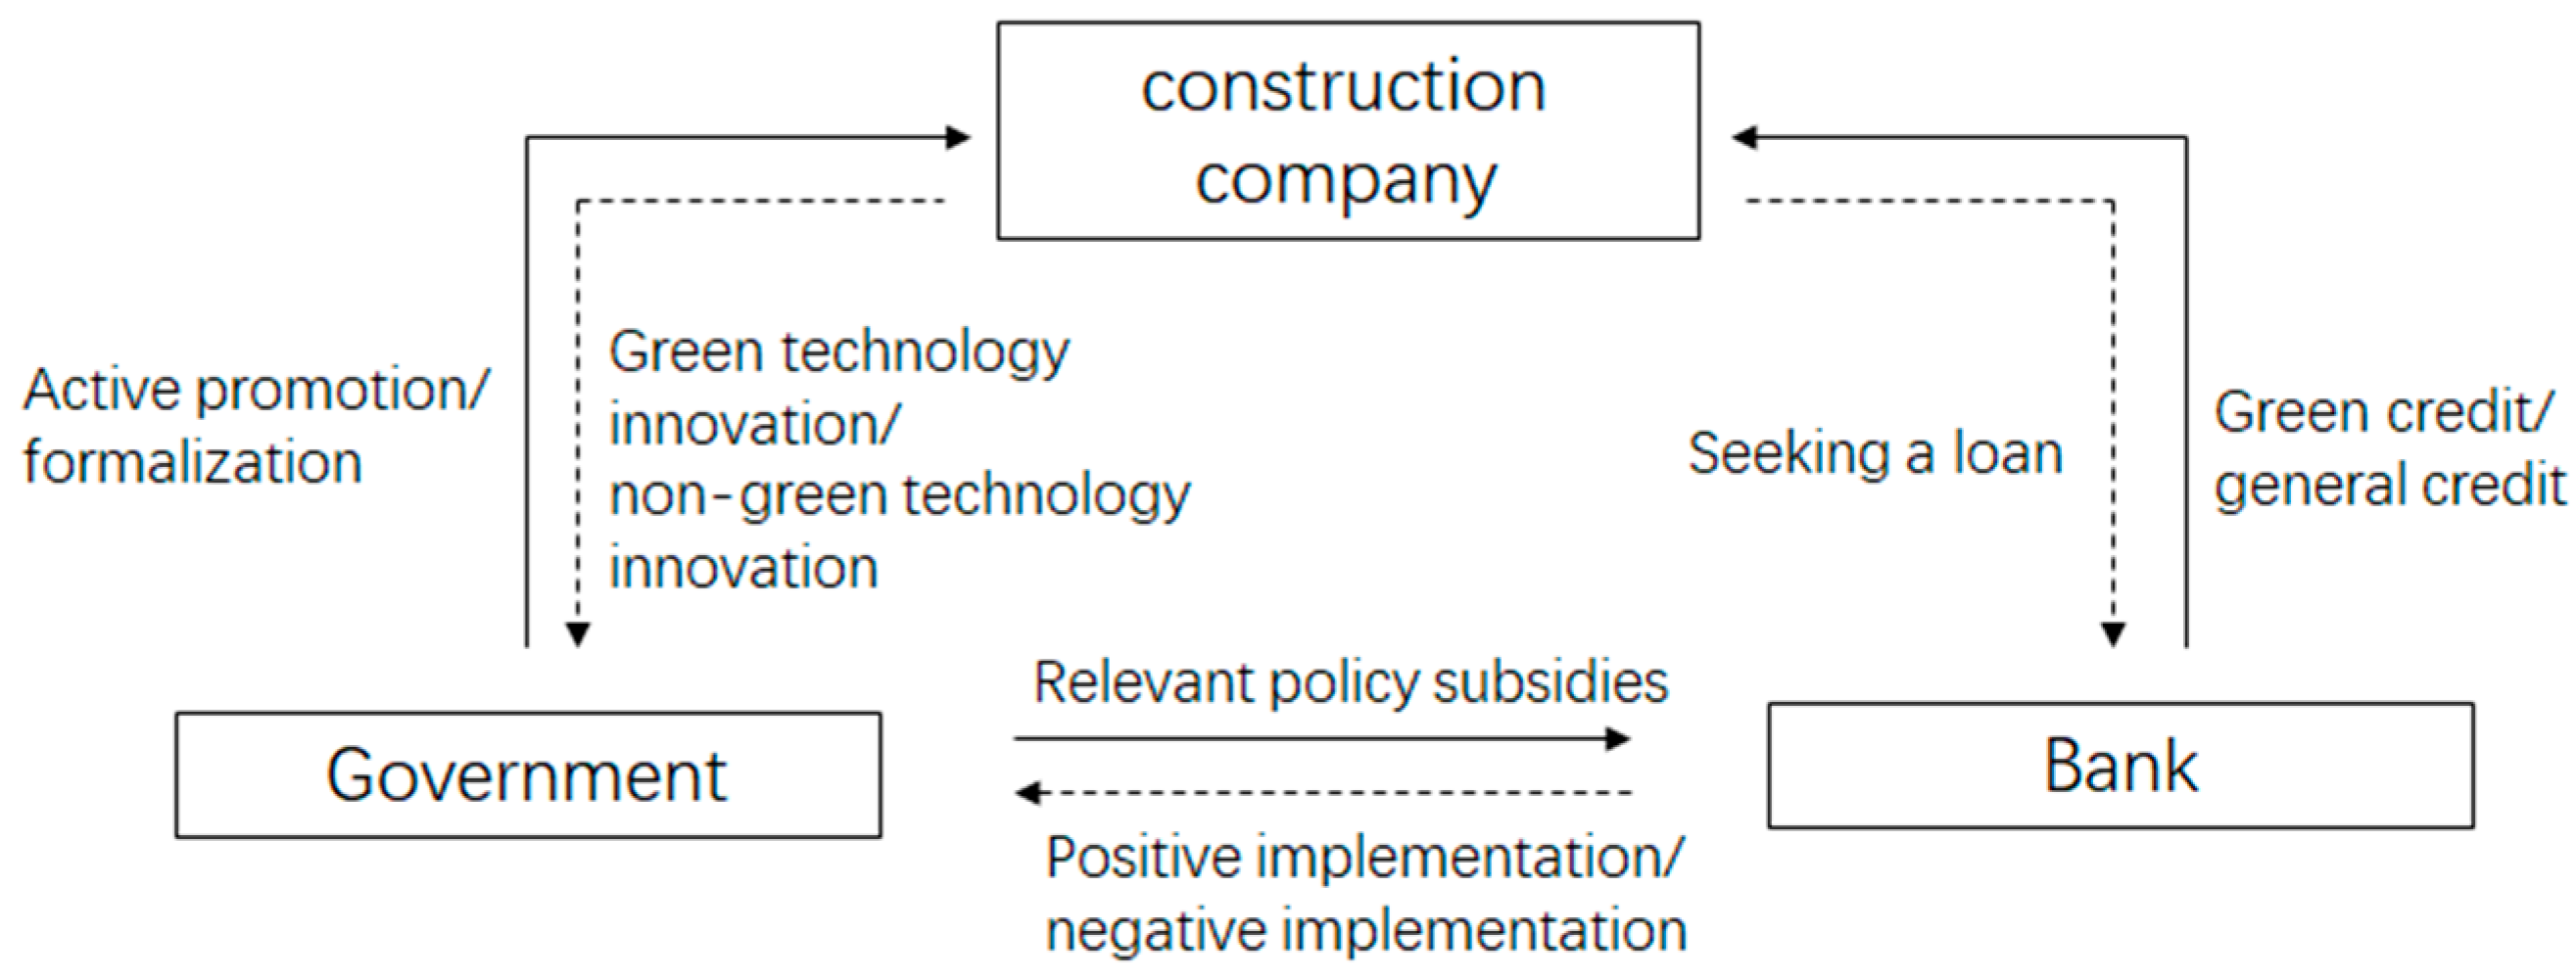
The key stakeholders in the innovation decision-making phase encompass construction firms, the government, and banks. During construction companies’ pursuit of green technology innovation, the government serves as a pivotal guiding force [
15]. Without adequate policy backing or robust incentive and penalty systems, construction companies might shy away from motivation due to cost and risk considerations, while banks could curtail green credit supply owing to risk concerns [
16]. Conversely, when the government enacts proactive policies and institutes transparent incentive and penalty frameworks, it can incentivize companies to undertake innovation initiatives for maximizing benefits, and this, in turn, encourages banks to boost green credit provision, fostering a mutually beneficial scenario for all involved and bolstering efforts to attain carbon reduction goals.
At the decision-making stage, the strategic decisions of the three core stakeholders could potentially trigger interest conflicts, as detailed below:
- (1)
Construction between companies and the government.
Construction companies, primarily focused on short-term financial gains, show limited enthusiasm for adopting green technology innovations. Governments, as advocates of green buildings and policy-makers, employ policy incentives and fiscal subsidies to nudge construction companies towards green technology adoption. While governments hope companies will actively embrace green technology innovations to reach the “dual carbon” targets, the economic burdens and funding expenses borne by companies make them inclined towards cheaper alternatives.
- (2)
Interest clash between construction companies and banks.
Construction companies rely on banks for sufficient loans or financing to carry out green technology innovation. Given the technical intricacies and uncertainties associated with green technology innovation projects, banks tend to choose non-green loans or offer smaller financing sums due to the high risks involved. Consequently, construction companies may find it difficult to make progress in green technology innovation due to a lack of funds.
- (3)
Interest divergence between banks and the government.
The government expects banks to actively embrace green finance policies and offer low-interest, long-term financing support for green technology innovation projects. However, as the source of capital, banks focus on risk management and maximizing their own returns. When a project poses high risks, banks may be reluctant to extend green credit or even withhold financial support altogether due to excessive risk.
Figure 1 below illustrates the relationship among the three parties.
2.2. Basic Assumptions
Assumption 1: In the decision-making phase, the game involves the government, construction companies, and banks. All of them are boundedly rational decision-makers with independent decision-making power and the ability to adjust their strategies during the game to maximize their own interests.
Assumption 2: Construction companies face a probability of of opting for green technology innovation and a probability of of choosing non-green technology innovation. Government departments, as advocates and promoters of green technology and green finance, offer economic subsidies and policy support. They have a probability of of actively promoting green technology innovation and a probability of of merely going through the motions. Banks have a probability of z of implementing green credit practices, but may be swayed by factors like risk and cost, leading to a probability of z of not providing green credit. Here, “actively promoting” means the government actively allocates funds, provides subsidies, and takes other measures in response to the actions of enterprises and banks. “Going through the motions” implies that the government lacks clear incentive and penalty mechanisms for the behavior of enterprises and banks.
Assumption 3: Under the carbon emission dual-control policy, it is assumed that the government imposes stringent emission caps on pollutants generated during construction through construction companies. If construction companies opt not to pursue green technology innovation, they will inevitably breach these limits, prompting the government to levy penalties on them. Simultaneously, government departments will bear extra environmental governance costs . When construction companies choose to engage in green technology innovation, they will face innovation costs , while government departments will reap additional environmental and economic benefits . The probability of technological innovation failure is defined as , and the probability of success is .
Assumption 4: The policy costs that government departments incur in promoting green technology innovation policies, including publicity and evaluation expenses, are represented as . If government departments actively promote these policies, their international and social reputation and credibility will increase by . To counteract the effects of economic externalities, the subsidies provided by government departments to construction companies and banks are set as and , respectively.
Assumption 5: Construction enterprises that do not engage in green technology innovation may only apply for conventional credit facilities. In contrast, those who pursue green technology innovation are eligible to apply for green credit. Let and denote the total interest payments construction companies must make to banks for green credit and conventional credit, respectively. Banks earn , from providing green credit to companies that successfully invest in green technology innovation projects, while they receive from conventional credit, with clearly exceeding .
Assumption 6: In evolutionary games, the costs, returns, and losses incurred by construction companies, governments, and banks are all measurable positive values.
2.3. Model Construction and Stability Analysis
Based on the aforementioned assumptions, we developed a payoff matrix to capture the evolving dynamics of core interest themes during the decision-making stage. As shown in
Table 1.
- (1)
Evolution of Construction Company Strategies.
Assume that the expected payoffs for construction companies opting to “adopt green technological innovation” and “refrain from adopting green technological innovation” are denoted as and , respectively, with an average payoff of .
Choosing to engage in green technological innovation:
Choosing not to innovate in green technology:
When , let , two stable points emerge: , and . If , then , , indicating that represents an evolutionary stable strategy. In this scenario, the benefits of green technological innovation for construction companies are inadequate to cover the associated costs of implementation, prompting them to favor non-green technological innovation strategies and rendering green ones unstable. Conversely, if is an evolutionarily stable strategy, the benefits of green technological innovation for construction firms surpass the previously incurred costs, leading them to opt for green technological innovation strategies and making non-green strategies unstable.
- (2)
Evolution of Government Strategy
Let the expected returns for the government choosing to “actively promote” and “go through the motions” be and , respectively, with an average return of .
Opting to actively promote:
Choosing to go through the motions:
When , let , two stable points are identified: , .
If , then and , indicating that represents an evolutionary stable strategy. In this case, the benefits derived from the government’s proactive promotion policy are insufficient to cover the range of costs (including publicity expenses, subsidies, and preferential policies) associated with its implementation. Consequently, the government is inclined to adopt a formalistic approach, rendering the proactive promotion strategy unstable. Conversely, if emerges as an evolutionarily stable strategy, with the benefits of active policy promotion outweighing the incurred costs, the government will favor the active promotion strategy, making the formalistic approach unstable. Thus, the likelihood of the government actively promoting the policy diminishes as the probability of banks providing green credit and enterprises engaging in green technological innovation rises.
- (3)
Evolution of the Bank’s Strategy
Assume that the expected returns when the bank opts for “green credit” and “ordinary credit” are and , respectively, with an average return of .
Choosing non-green credit:
When , let , two stable points emerge: and . If or , then and , indicating that z = 0 is an evolutionarily stable strategy. In this scenario, the benefits banks derive from green credit are insufficient to cover the associated costs, prompting them to favor conventional credit strategies and rendering green credit strategies unstable. Conversely, if is an evolutionarily stable strategy, with the benefits of green credit outweighing the incurred costs, banks will lean towards adopting green credit strategies, making conventional credit strategies unstable. Therefore, the likelihood of banks engaging in green credit rises as the probability of government proactive promotion and corporate green technological innovation increases.
2.4. Evolutionary Equilibrium Analysis of the Three-Party Game
To pinpoint the evolutionary stable equilibrium state within the decision-making stage model, let
yielding nine Nash equilibrium points, encompassing eight pure-strategy equilibrium solutions: (0,1,0), (1,1,0), (0,1,1), (0,0,1), (0,0,0), (1,0,1), (1,1,1), (1,0,0), and one mixed-strategy equilibrium solution
, where
and it serves as a saddle point. The Jacobian matrix [
17] is constructed as follows, and the stability analysis of the equilibrium points in the evolutionary game system is performed [
18]. When all three eigenvalues of the matrix are negative, the corresponding equilibrium point represents the evolutionary stable strategy (ESS) [
19] of the system; otherwise, it is either an unstable point (with all three eigenvalues positive) or a saddle point (with one or two of the three eigenvalues positive). The eigenvalues for each equilibrium point are calculated and presented in
Table 2.
Construct the Jacobian matrix as shown in the formula:
This paper centers on analyzing the stability of seven equilibrium points and their corresponding stability conditions.
Case 1: When , (0,0,0) represents the model’s evolutionary stable state (ESS), the additional benefits derived from corporate green technology innovation fall short of covering the incurred additional costs, yielding a negative relative net benefit for adopting green technology innovation strategies, leading to a decline in corporate willingness to pursue such innovation, and with government inaction, non-green technology innovation strategies emerge as the optimal choice. Moreover, the combined benefits from the government’s proactive promotion and the carbon tax levied on traditional technology usage are outweighed by the costs of proactive promotion, resulting in a relative net benefit of less than zero for the government. Therefore, the government tends to adopt a superficial approach.
Case 2: When , (0,1,0) serves as the model’s ESS, firms face a negative relative net benefit from adopting green technology innovation, diminishing their incentive to innovate; Meanwhile, the government’s proactive promotion yields a positive relative net benefit, as the combined benefits from promotion and carbon taxes surpass the associated costs, prompting the government to pursue an active promotion strategy; However, banks encounter a negative net benefit from implementing green credit, with costs outweighing government subsidies, leading them to opt for conventional credit strategies. In this case, firms refrain from green technology innovation, the government actively promotes it, and banks stick to conventional credit.
Case 3: When , (1,1,0) constitutes the model’s equilibrium steady-state point (ESS), the government’s returns from actively promoting green technology innovation outweigh the combined costs of promotion and subsidies provided to firms, yielding a positive relative net benefit. Consequently, the government opts for an active promotion strategy. With government departments driving green technology innovation, banks experience enhanced additional benefits and interest income from investments in corporate green initiatives. Nevertheless, these gains do not sufficiently offset the costs, leaving banks’ net benefits from green credit implementation below zero. As a result, banks continue to favor conventional credit strategies. Additionally, the greater the credibility benefits derived from government proactive promotion, the stronger the government’s inclination to actively promote, indicating a direct correlation between the probability of government proactive promotion and the credibility benefits it accrues.
Case 4: When , the system stabilizes at (0,1,1), firms refrain from pursuing green technological innovation, while government departments actively promote incentive and regulatory policies for green technologies. Under these conditions, if banks’ costs for implementing green credit are lower than the subsidies they receive from the government—meaning the net benefit of green credit implementation exceeds zero—banks are inclined to adopt green credit strategies. Moreover, the lower the operational costs banks incur in executing green credit strategies, and the greater the subsidies they receive from the government, the stronger their motivation to adopt such strategies. In essence, the likelihood of banks implementing green credit is inversely related to their operational costs and directly proportional to the subsidies they obtain from the government.
Case 5: When , the system settles at the stable strategy (1,0,1), construction companies and banks actively engage in green technology innovation even in the absence of government incentives. Eigenvalue analysis reveals that, under this scenario, both enterprises and banks derive positive net benefits from their respective green initiatives: enterprises enjoy higher returns from green innovation compared to non-innovation, fostering a strong innovation drive; similarly, banks find green credit more profitable than conventional credit. However, for the government, the combined costs of subsidizing banks and construction companies, along with policy implementation expenses, outweigh the benefits, resulting in a negative relative net benefit for proactive intervention. Consequently, the government leans toward a formalistic approach. Given the current state of green technology innovation in China’s construction sector, achieving this scenario remains challenging.
Case 6: When , the system stabilizes at (1,0,0), enterprises pursue green technology innovation while the government adopts a formalistic approach to policy promotion. Under these conditions, banks face negative relative net benefits from implementing green credit strategies, prompting them to favor conventional credit options. Additionally, as the costs of active government promotion rise, the government’s preference for formalistic strategies intensifies, suggesting an inverse relationship between the probability of formalistic approaches and the magnitude of promotion-related costs.
Case 7: When , the system reaches the stable strategy (1,1,1), construction companies opt for green technological innovation due to positive net benefits. The government, driven by favorable relative net gains, adopts a proactive approach to promote green innovation, and this governmental support enhances the additional benefits and interest income banks derive from green credit investments, making green credit strategies financially attractive. Banks’ willingness to adopt green credit strategies strengthens with higher government subsidies, demonstrating a positive incentive effect; conversely, elevated operational costs associated with green credit diminish their enthusiasm, reflecting a negative incentive effect. Parameter values such as collectively influence strategic choices under eigenvalue conditions. Under these parameters, all three stakeholders—construction firms, government, and banks—achieve greater benefits by selecting green innovation, proactive promotion, and green credit over conventional alternatives. This scenario represents the ideal development state and ultimate incentive goal for advancing green technological innovation in the construction industry.
2.5. Integration Logic of Chemical Games and System Dynamics
To dynamically illustrate the evolution of core strategies, this study develops an integrated “evolutionary game-system dynamics” framework. For variable mapping, the strategy probabilities (x, y, z, m, n) derived from the evolutionary game are designated as level variables in system dynamics, whereas parameters from the replication dynamic equation—including costs, benefits, and subsidies—are defined as exogenous variables. The differential in expected benefits acts as the core driver of rate variables.
In terms of feedback loop design, the positive feedback loop operates as follows: proactive government promotion leads to increased subsidies for corporate innovation, which in turn enhances the probability of corporate innovation. This higher innovation probability reduces the risk associated with banks’ green credit, thereby raising banks’ propensity to issue green credit. This, in turn, boosts the government’s environmental benefits, ultimately further increasing the likelihood of proactive government promotion.
Conversely, the negative feedback loop functions such that a higher probability of corporate innovation reduces the government’s carbon tax revenue, intensifying the cost pressure of proactive government initiatives. This heightened pressure lowers the probability of proactive government promotion, which subsequently reduces subsidies for corporate innovation, and ultimately results in a decline in the probability of corporate innovation.
Applying evolutionary game theory to analyze distinct stages of green technology innovation in construction enterprises facilitates the examination of long-term strategic interactions among stakeholders. Notably, however, this approach cannot directly reveal the dynamic evolution of strategies across multiple entities—such as construction enterprises, governments, banks, and evaluation agencies. Green technology innovation in the construction sector progresses incrementally, with strategy choices exhibiting dynamic shifts over time. In this context, system dynamics complements evolutionary game theory by comprehensively capturing interactions among system elements and conducting in-depth analysis of how internal factors influence the game system through feedback mechanisms. Additionally, simulation techniques enable effective modeling of strategy evolution trajectories under different initial conditions. Integrating these two approaches thus allows for a more accurate depiction of the interactive relationships and dynamic evolution patterns among game participants, thereby identifying the key determinants that shape each actor’s strategic choices.
3. Simulation Analysis of Evolutionary Game Models
3.1. Model Parameterization
3.1.1. Model Construction
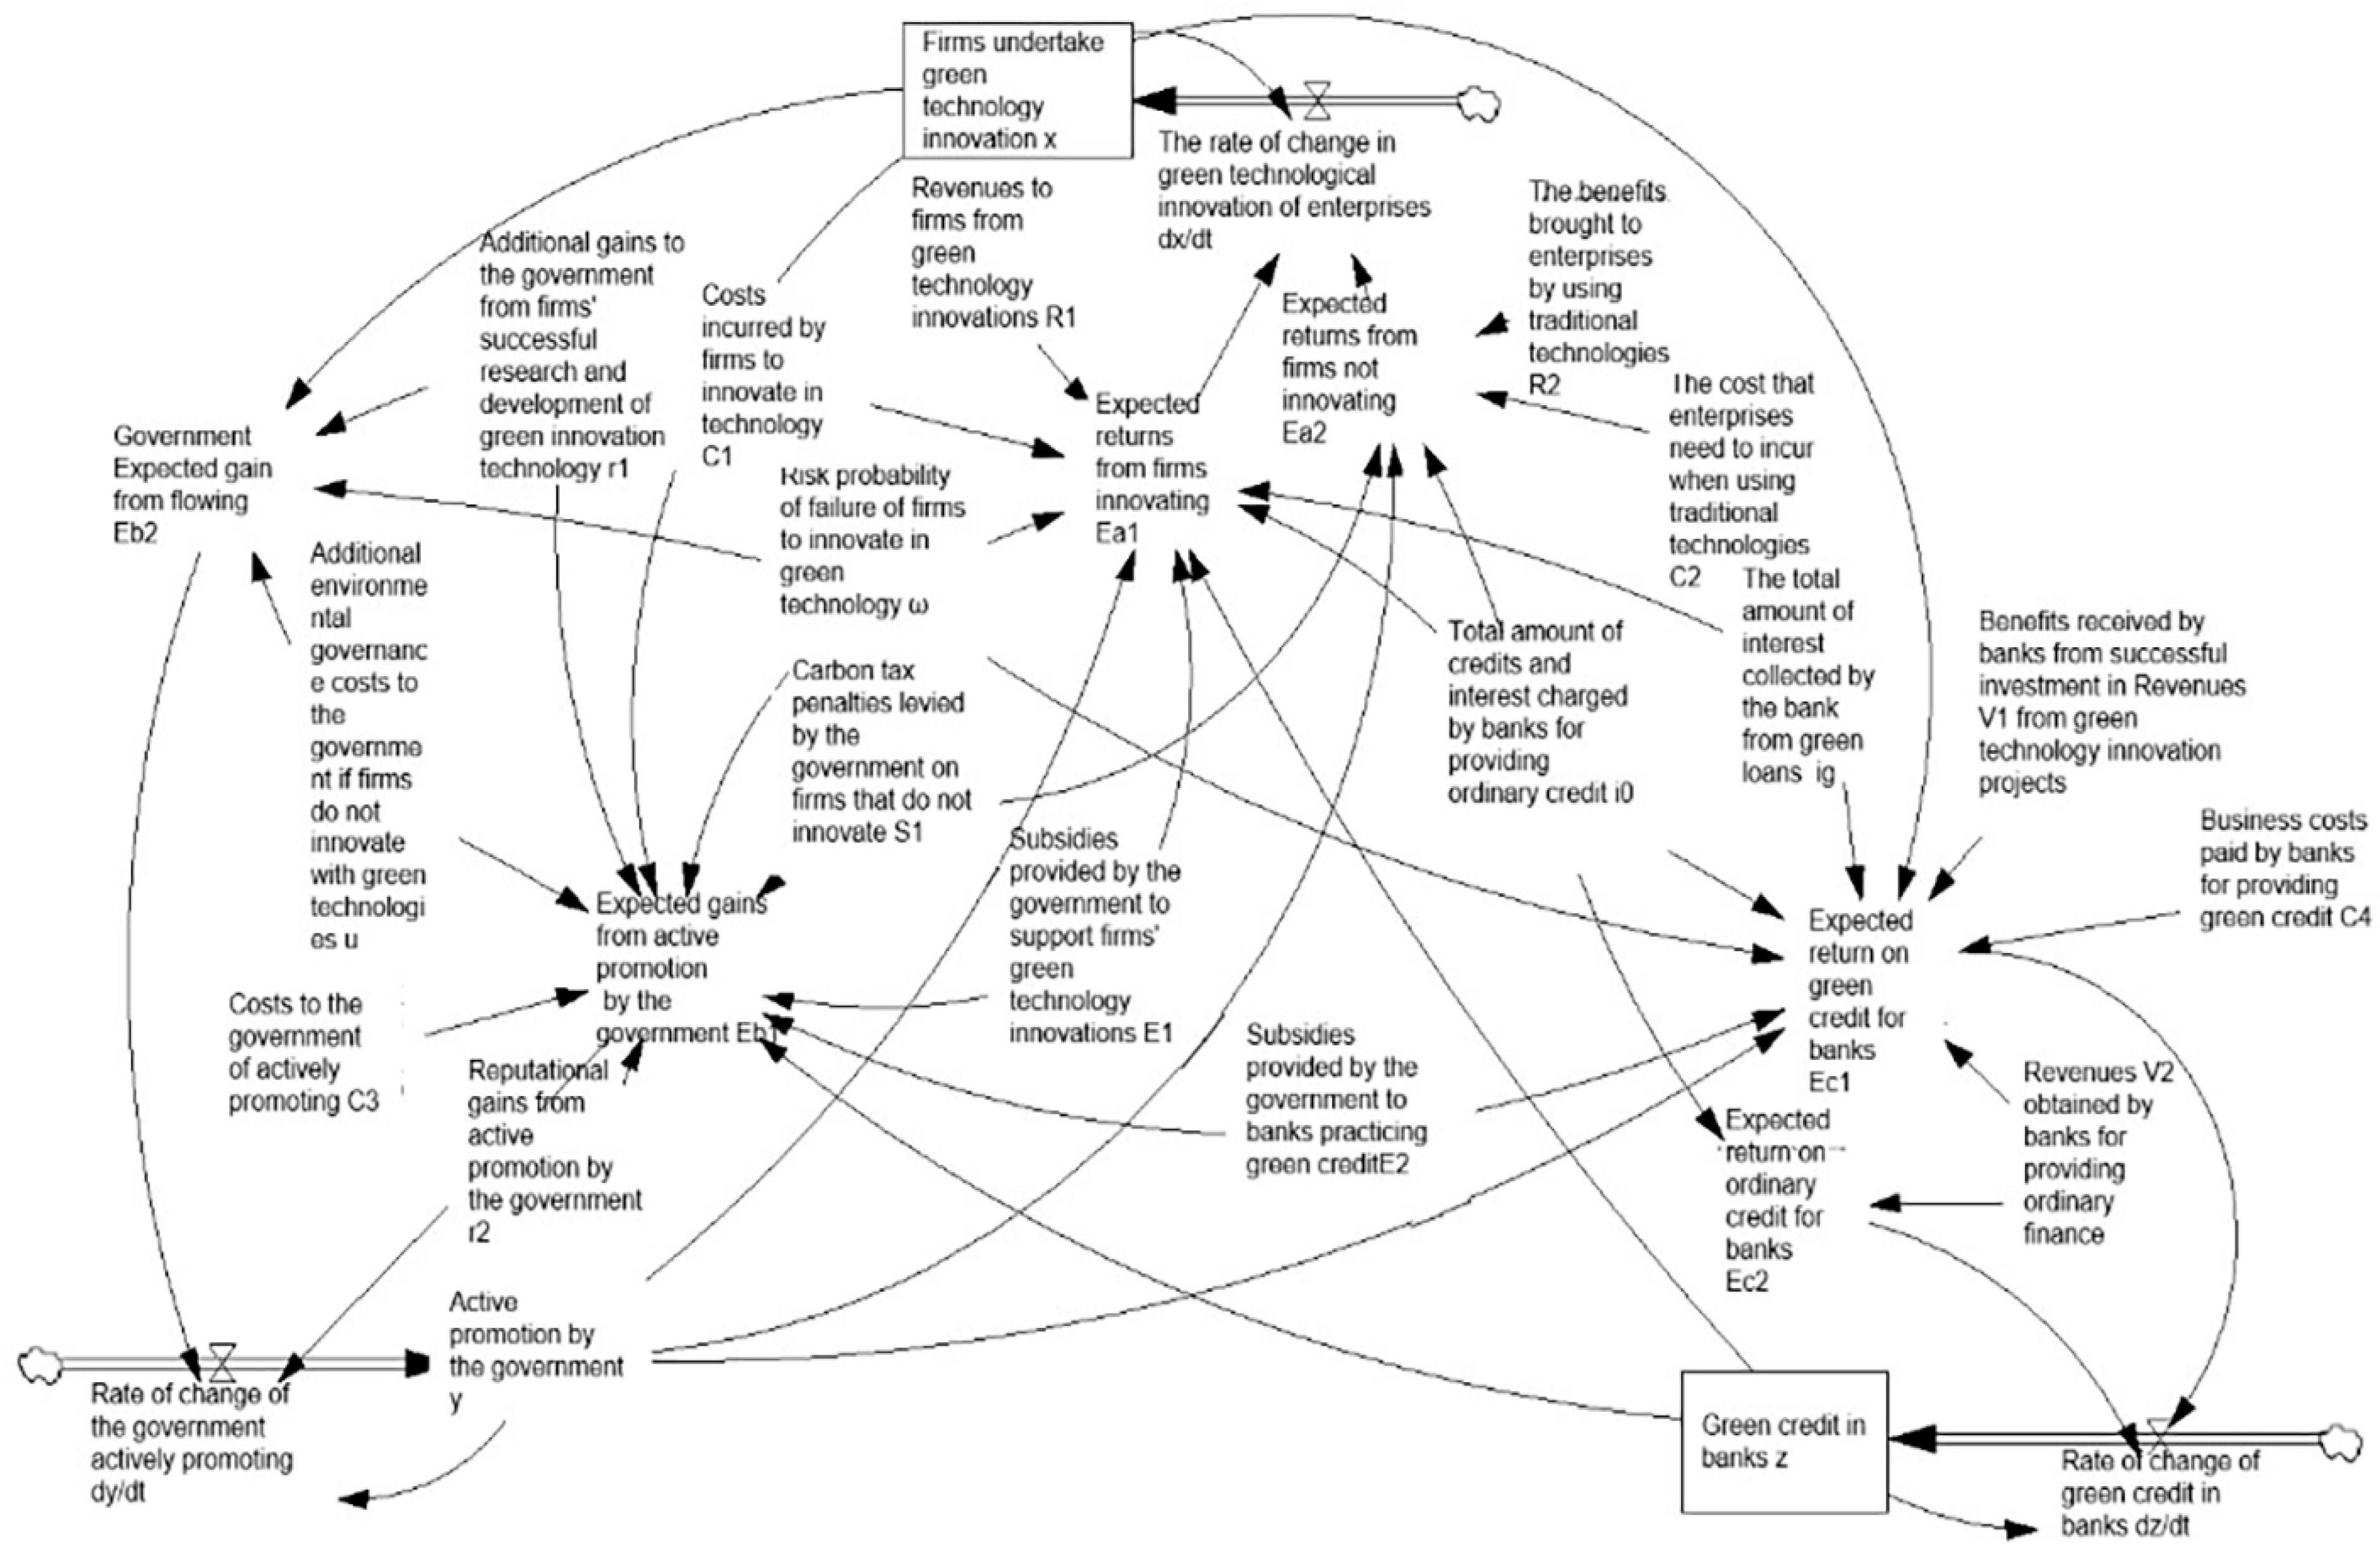
To examine how variables influence the behavior of key stakeholders, an SD model was developed for the evolutionary game among core entities during the decision-making stage, based on the internal dynamics of the system as illustrated in
Figure 2. This evolutionary system—comprising construction enterprises, government, and banks—incorporates three level variables (system stocks), three rate variables, six intermediate variables, and seventeen exogenous variables, as outlined in
Table 3. The rate variables represent the time-based accumulation of the level variables. M City, a pivotal hub for the clustering and development of the construction industry, has recently made substantial investments and launched numerous projects focused on green technology innovation. The interest-driven game theory challenges faced by construction firms in this city during green innovation processes are highly representative. Furthermore, as M City advances toward achieving the “dual carbon” goals, the interactive mechanisms among construction companies, government agencies, and banks are well-established, supported by extensive practical data. Therefore, selecting M City’s green technology innovation data for this study not only provides a vivid case to support research on evolutionary game theory for construction firms under the “dual carbon” framework but also yields findings with strong representativeness, effectively meeting the research objectives of validating the evolutionary game theory model and analyzing its underlying mechanisms.
3.1.2. Basic Parameter Settings and Assignment for the Model
Drawing on the evolutionary game theory model, parameter values were calibrated using data from M City. The system’s temporal parameters were configured as follows: INITIAL TIME = 0, FINAL TIME = 14, TIME STEP = 0.001, with time measured in years. Within the “dual carbon” framework, the optimal strategy for construction companies, government departments, and banks is (green technology innovation, proactive promotion, green credit), denoted as (1,1,1), indicating that under proactive promotion, construction companies and banks can fully align with national objectives to pursue green technology innovation and green credit initiatives, accelerating the achievement of “dual carbon” goals and fostering an ideal, stable system state.
Based on survey data and literature references [
20,
21], initial values for the model’s exogenous variables were assigned to satisfy the conditions for scenario (1,1,1):
,
,
,
,
,
,
,
,
,
,
,
,
,
,
,
,
.
3.2. Parameter Validation and Rationality Analysis
To ensure model parameters align with industry realities, this study quantitatively validated the rationality and error range of core parameter values. This was achieved by analyzing survey data from typical green building projects across key regions nationwide and referencing authoritative sources such as the China Green Building Development Report (2023) and the Green Credit Statistics System. Specific results are as follows:
- (1)
Green Technology Innovation Costs for Construction Enterprises (C1):
The model assigns a value of 8 million yuan, referencing the actual innovation investment of a prefabricated residential project in City M. For comparable projects, innovation costs range from 6.2 to 9.8 million yuan, with an average of 7.8 million yuan and a median of 7.9 million yuan. The absolute error between the model value and the mean is 200,000 yuan, with a relative error rate of 2.56%. The primary source of error stems from regional variations in building material prices—the average price of green building materials in City M is 3.2% higher than the national average, resulting in slightly elevated project costs locally. This error falls within the industry′s acceptable range (generally ≤5%).
- (2)
Government Environmental Violation Fines (S1):
The model value is 2 million yuan, based on the “Fines for Exceeding Carbon Emission Standards in Construction Projects (2–3% of project cost)” stipulated in the Measures for Environmental Administrative Penalties, corresponding to a green residential project with a 100 million yuan construction cost. Research indicates that actual local government fines range from 1.55 to 2.45 million yuan, with an average of 1.92 million yuan. The absolute error between the model value and the average is 80,000 yuan, representing a relative error rate of 4.17%. The discrepancy stems from certain central and western regions lowering the minimum penalty to 1.8% (equivalent to 1.8 million yuan) to encourage corporate transformation. The model adopts the mainstream standard of 2% for central regions, aligning with the parameter setting principle of “taking the middle ground while considering policy orientation.”
- (3)
Bank Green Credit Interest Rate (rg):
The model value is 3.65%, referencing the “Weighted Average Interest Rate for Green Credit in the Construction Industry” published by the People′s Bank of China in 2023. Survey data indicates that the green credit interest rate range for major commercial banks nationwide is 3.52–4.18%, with an average of 3.72%. The model value exhibits an absolute error of 0.07 percentage points relative to the average, representing a relative error rate of 1.88%. This discrepancy stems from certain joint-stock banks applying higher green credit rates of 3.9–4.1% for small construction enterprises.
- (4)
Probability of Green Technology Innovation Failure (ω):
The model value is set at 20%, based on the “Green Technology Pilot Failure Rate in the Construction Industry” from the Ministry of Science and Technology′ 2023 Green Technology R&D Statistical Bulletin. Survey data indicates an actual failure rate range of 15.8–24.2%, with an average of 19.3%. The absolute error between the model value and the average is 0.7 percentage points, representing a relative error rate of 3.63%. The discrepancy primarily stems from leading construction firms exhibiting higher innovation success rates (failure rates of 16–18%), while the model encompasses all industry enterprises, resulting in a value closer to the sector-wide average.
- (5)
Government Green Innovation Subsidies (E1):
The model value is set at 3 million yuan, referencing the Ministry of Housing and Urban-Rural Development′s “Green Building Demonstration Project Subsidy Standards.” Research indicates that local government subsidies range from 2.05 to 3.85 million yuan, with an average of 2.88 million yuan. The absolute error between the model value and the average is 120,000 yuan, representing a relative error rate of 4.17%. The discrepancy stems from higher subsidy levels in eastern coastal regions (e.g., Shanghai and Shenzhen at 3.5–3.85 million yuan), while the model employs a national average subsidy level that also considers fiscal sustainability.
In summary, the relative error rates for core parameters remain below 5%, meeting the precision requirements for evolutionary game model parameter settings. The sources of error stem from objective factors such as regional industry variations and enterprise scale differences, which do not compromise the representativeness of parameters or the reliability of the model.
3.3. Overall Simulation Analysis of the Model
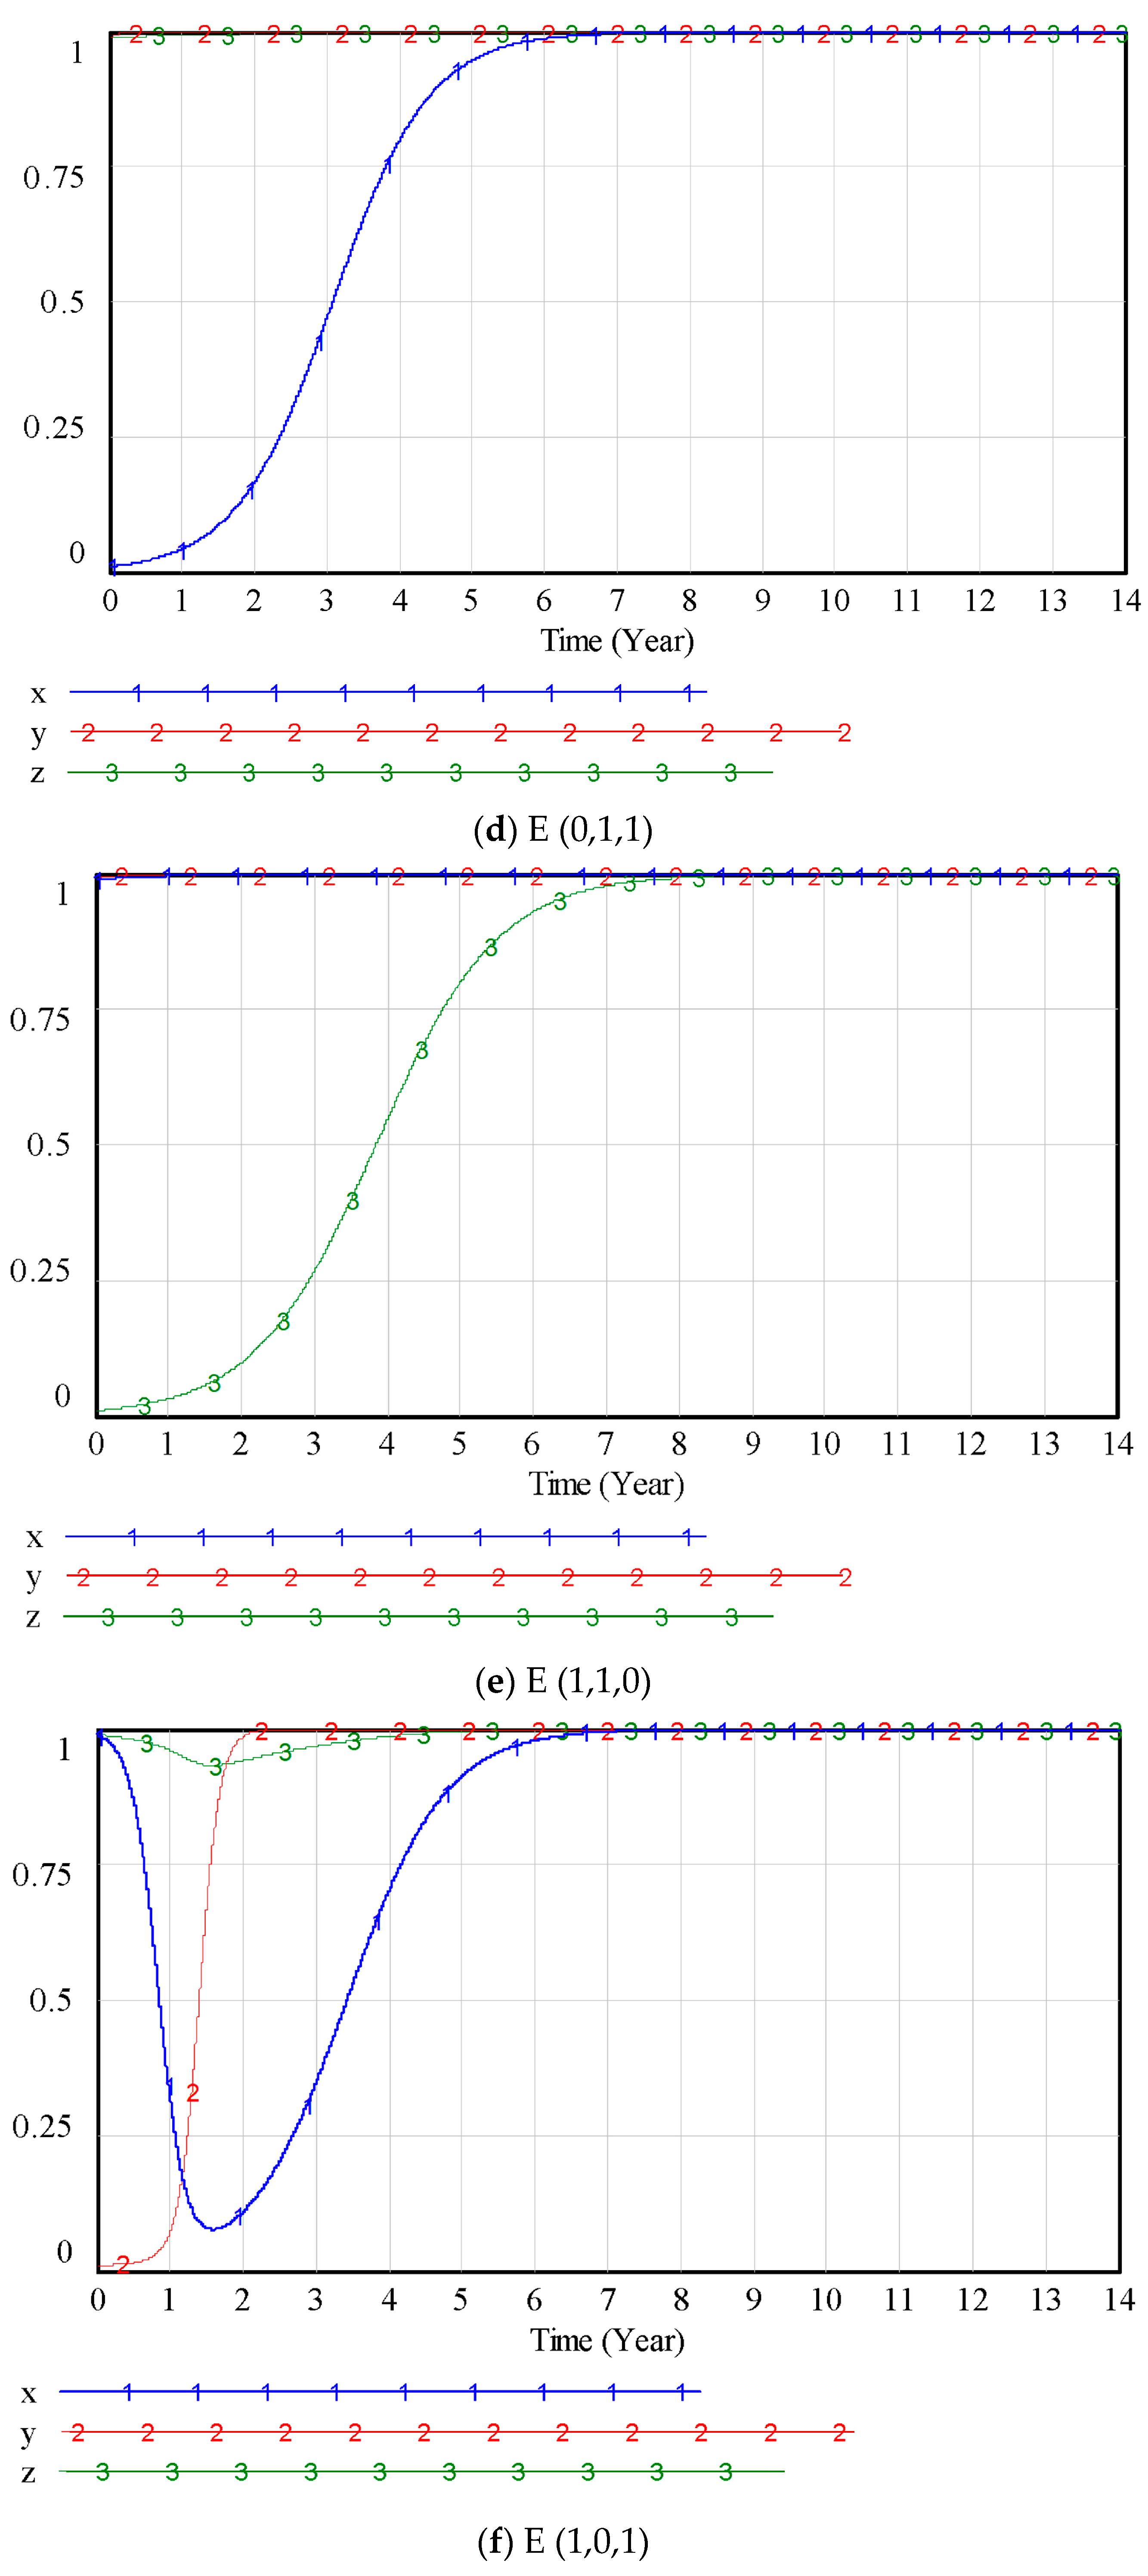
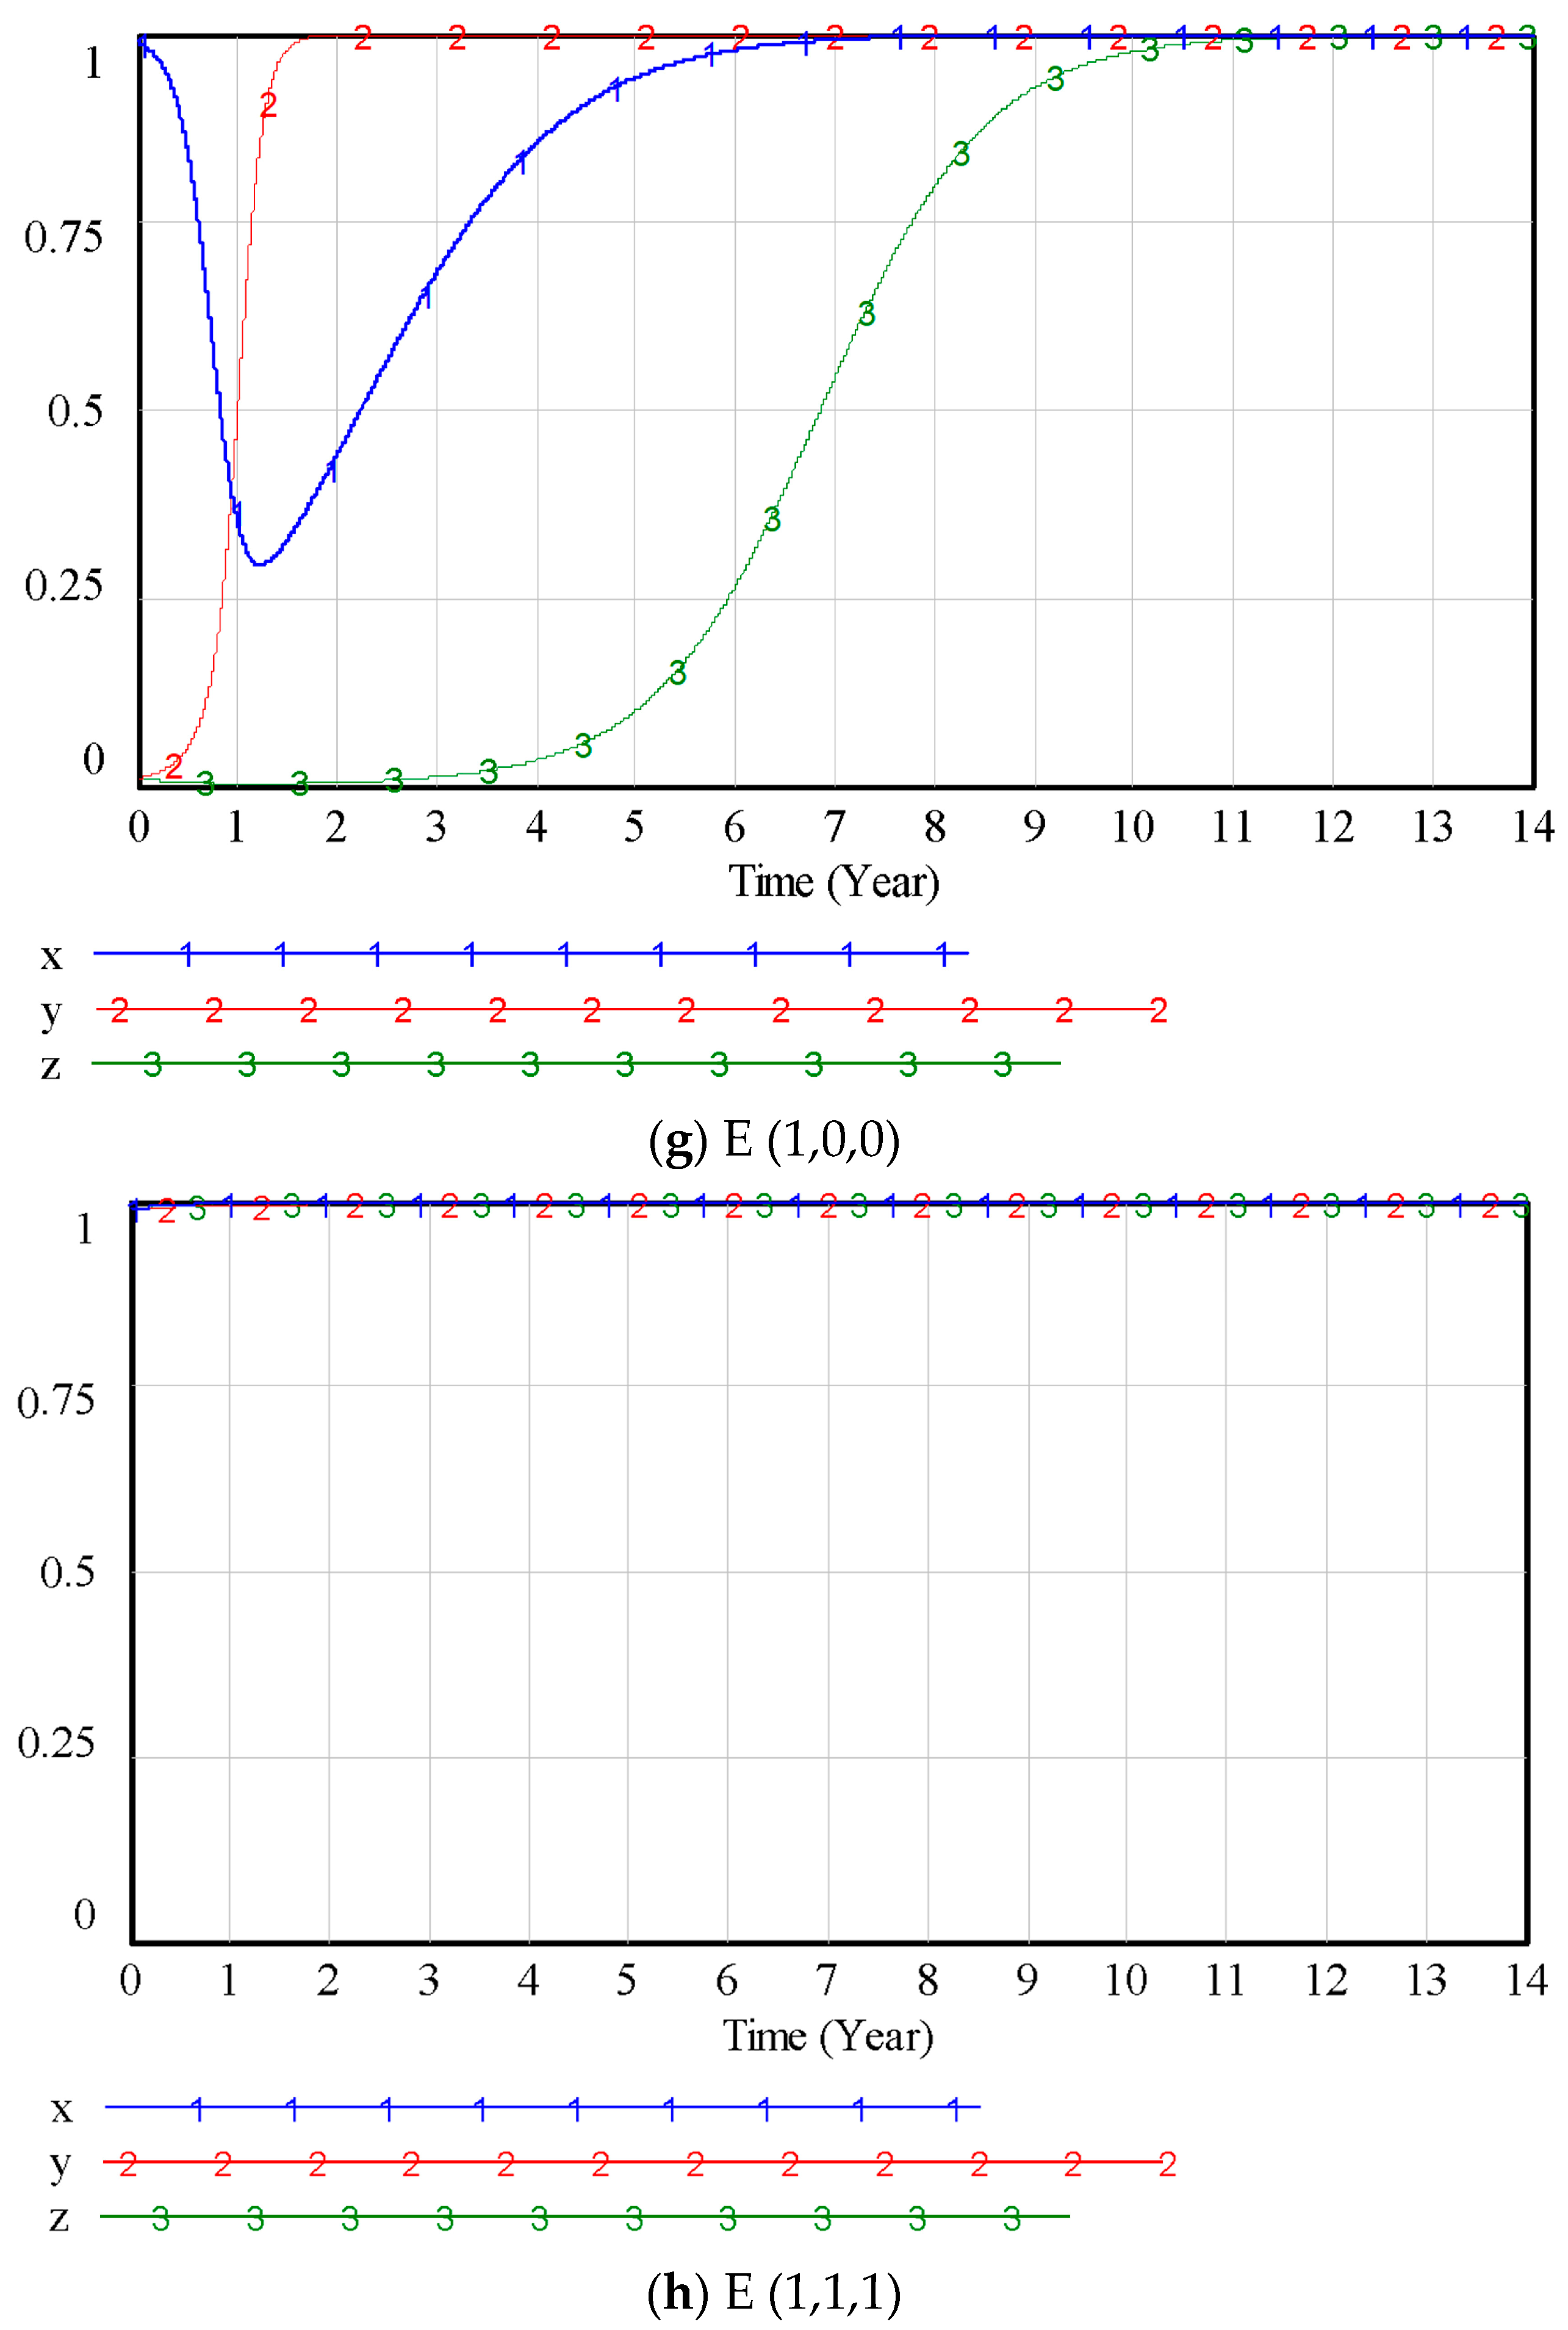
The three key stakeholders—construction companies, governments, and banks—face eight possible initial strategy combinations: (0,1,0), (1,1,0), (0,1,1), (0,0,1), (0,0,0), (1,0,1), (1,1,1), and (1,0,0). After assigning the predefined parameter values to the model, the initial strategy combination (0,1,1) was simulated with starting values set at (0.01,0.99,0.99). To explore strategic dynamics, each pure strategy across the eight combinations underwent a small perturbation, with a 1% probability of mutation, and was then substituted into the tripartite evolutionary game model for simulation. The eight evolutionary processes are depicted in
Figure 3.
The simulation results reveal that, regardless of the initial strategies adopted by construction companies, governments, and banks, all three parties’ strategies ultimately converge to (1,1,1). None of the stakeholders shows a willingness to deviate from this equilibrium by altering their strategies, thereby maintaining a stable system state. As illustrated in
Figure 3a,g, when construction companies initially opt for green technology innovation, banks are quicker to adopt green credit strategies compared to scenarios where companies start with non-green innovation, and governments exhibit a slower increase in proactive promotion efforts, indicating that construction company’s pursuit of green innovation positively influences bank’s adoption of green credit but has a restraining effect on government’s inclination to actively promote such initiatives.
The simulation results in
Figure 3a,b demonstrate that when the government initiates its strategy with proactive promotion rather than a formalistic approach, both construction companies and banks adopt green technology innovation and green credit strategies more swiftly, indicating that active government promotion significantly accelerates green innovation among construction firms and the implementation of green credit by banks. The underlying reason is that a proactive government strategy typically involves offering targeted incentives and subsidies to enterprises and financial institutions engaged in green technological innovation, thereby enhancing their motivation and capacity to pursue sustainable practices and fostering a more conducive environment for achieving green development goals.
The simulation results in
Figure 3a,c reveal that when banks initially adopt green credit strategies rather than conventional credit approaches, construction companies accelerate their transition toward green technology innovation, while the government’s shift toward aggressive promotion strategies slows down under these conditions, suggesting that bank-driven green credit positively reinforces construction companies’ green innovation efforts while exerting a dampening effect on the government’s enthusiasm for proactive policy promotion. The mechanism behind this dynamic lies in banks’ intrinsic motivation to implement green credit independently, driven by long-term benefits and risk management considerations, and government departments face additional costs when incentivizing banks through subsidies or rewards for green credit adoption, thereby reducing the government’s motivation to actively promote policies.
3.4. Exogenous Variable Simulation Analysis
This section employs Vensim PLE to perform path and numerical simulations based on the derived tripartite replicator dynamic equations, analyzing how different parameters influence stakeholder behavior. The initial strategy selection ratios for construction companies, governments, and banks are (0.5,0.5,0.5). Using the control variable method, the study examines how varying parameter values affect the evolutionary results for each stakeholder. The simulation results for each parameter are as follows:
- (1)
Analysis of the Impact of Construction Firm Strategy Selection
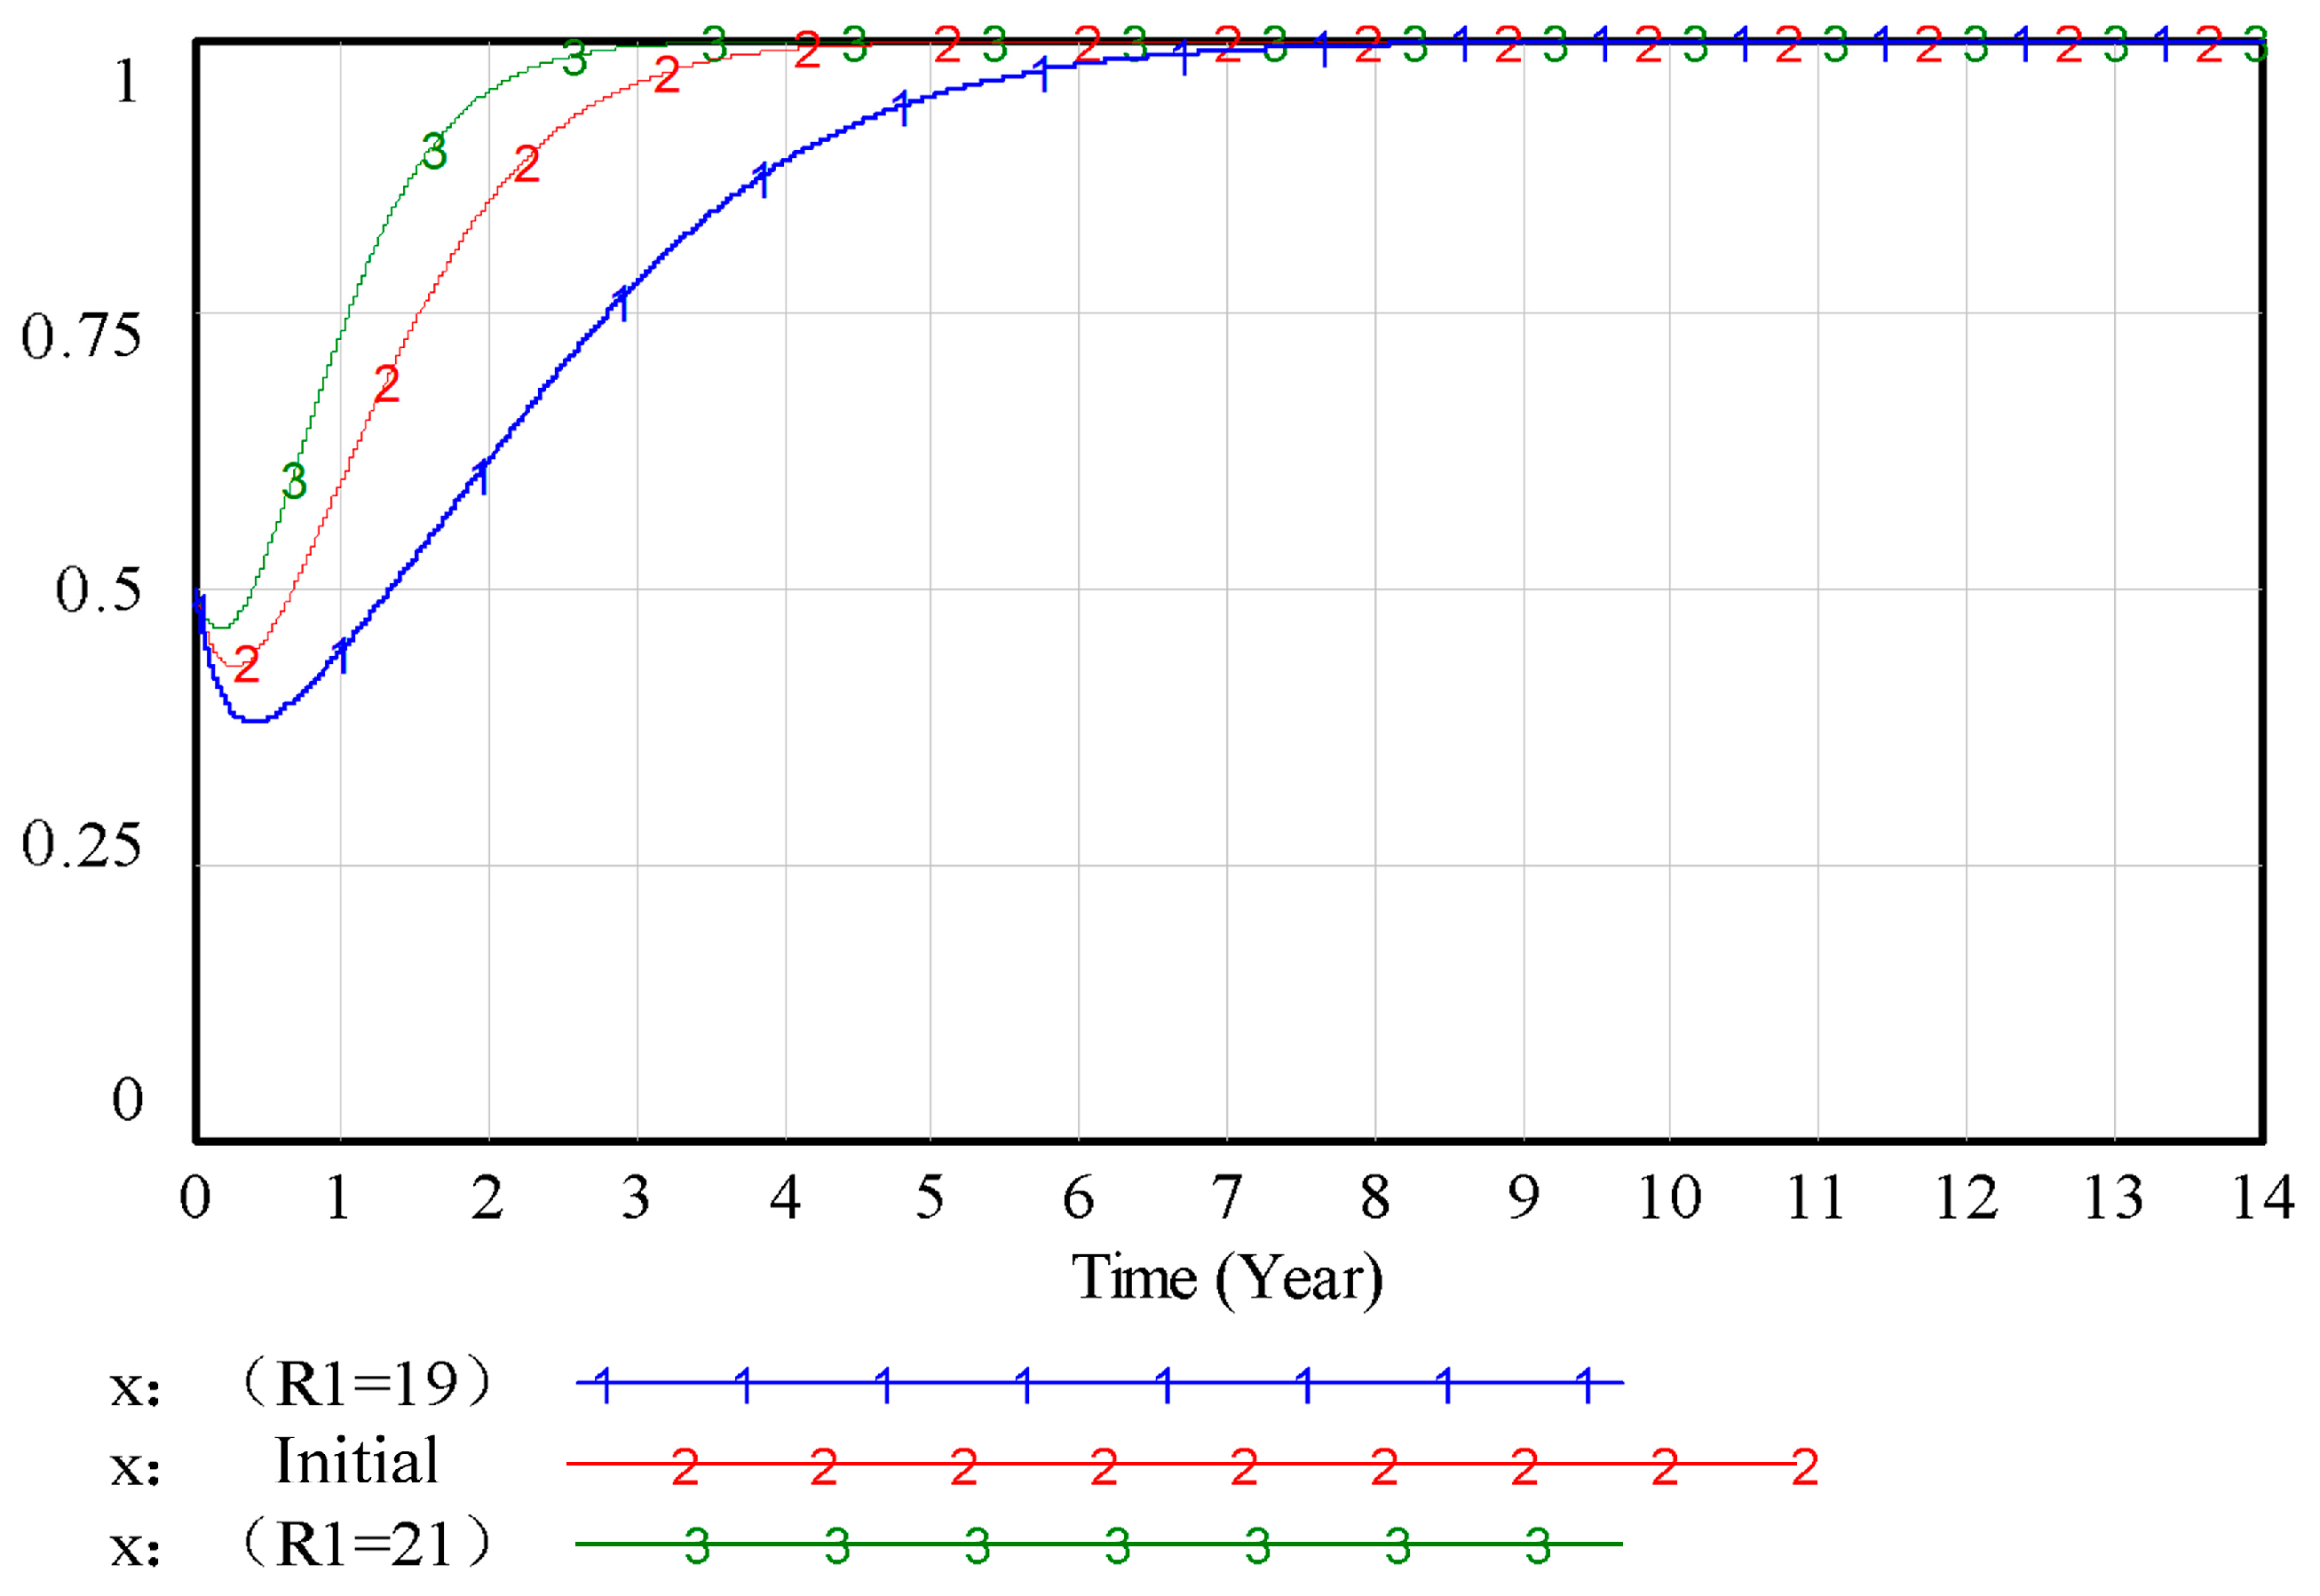
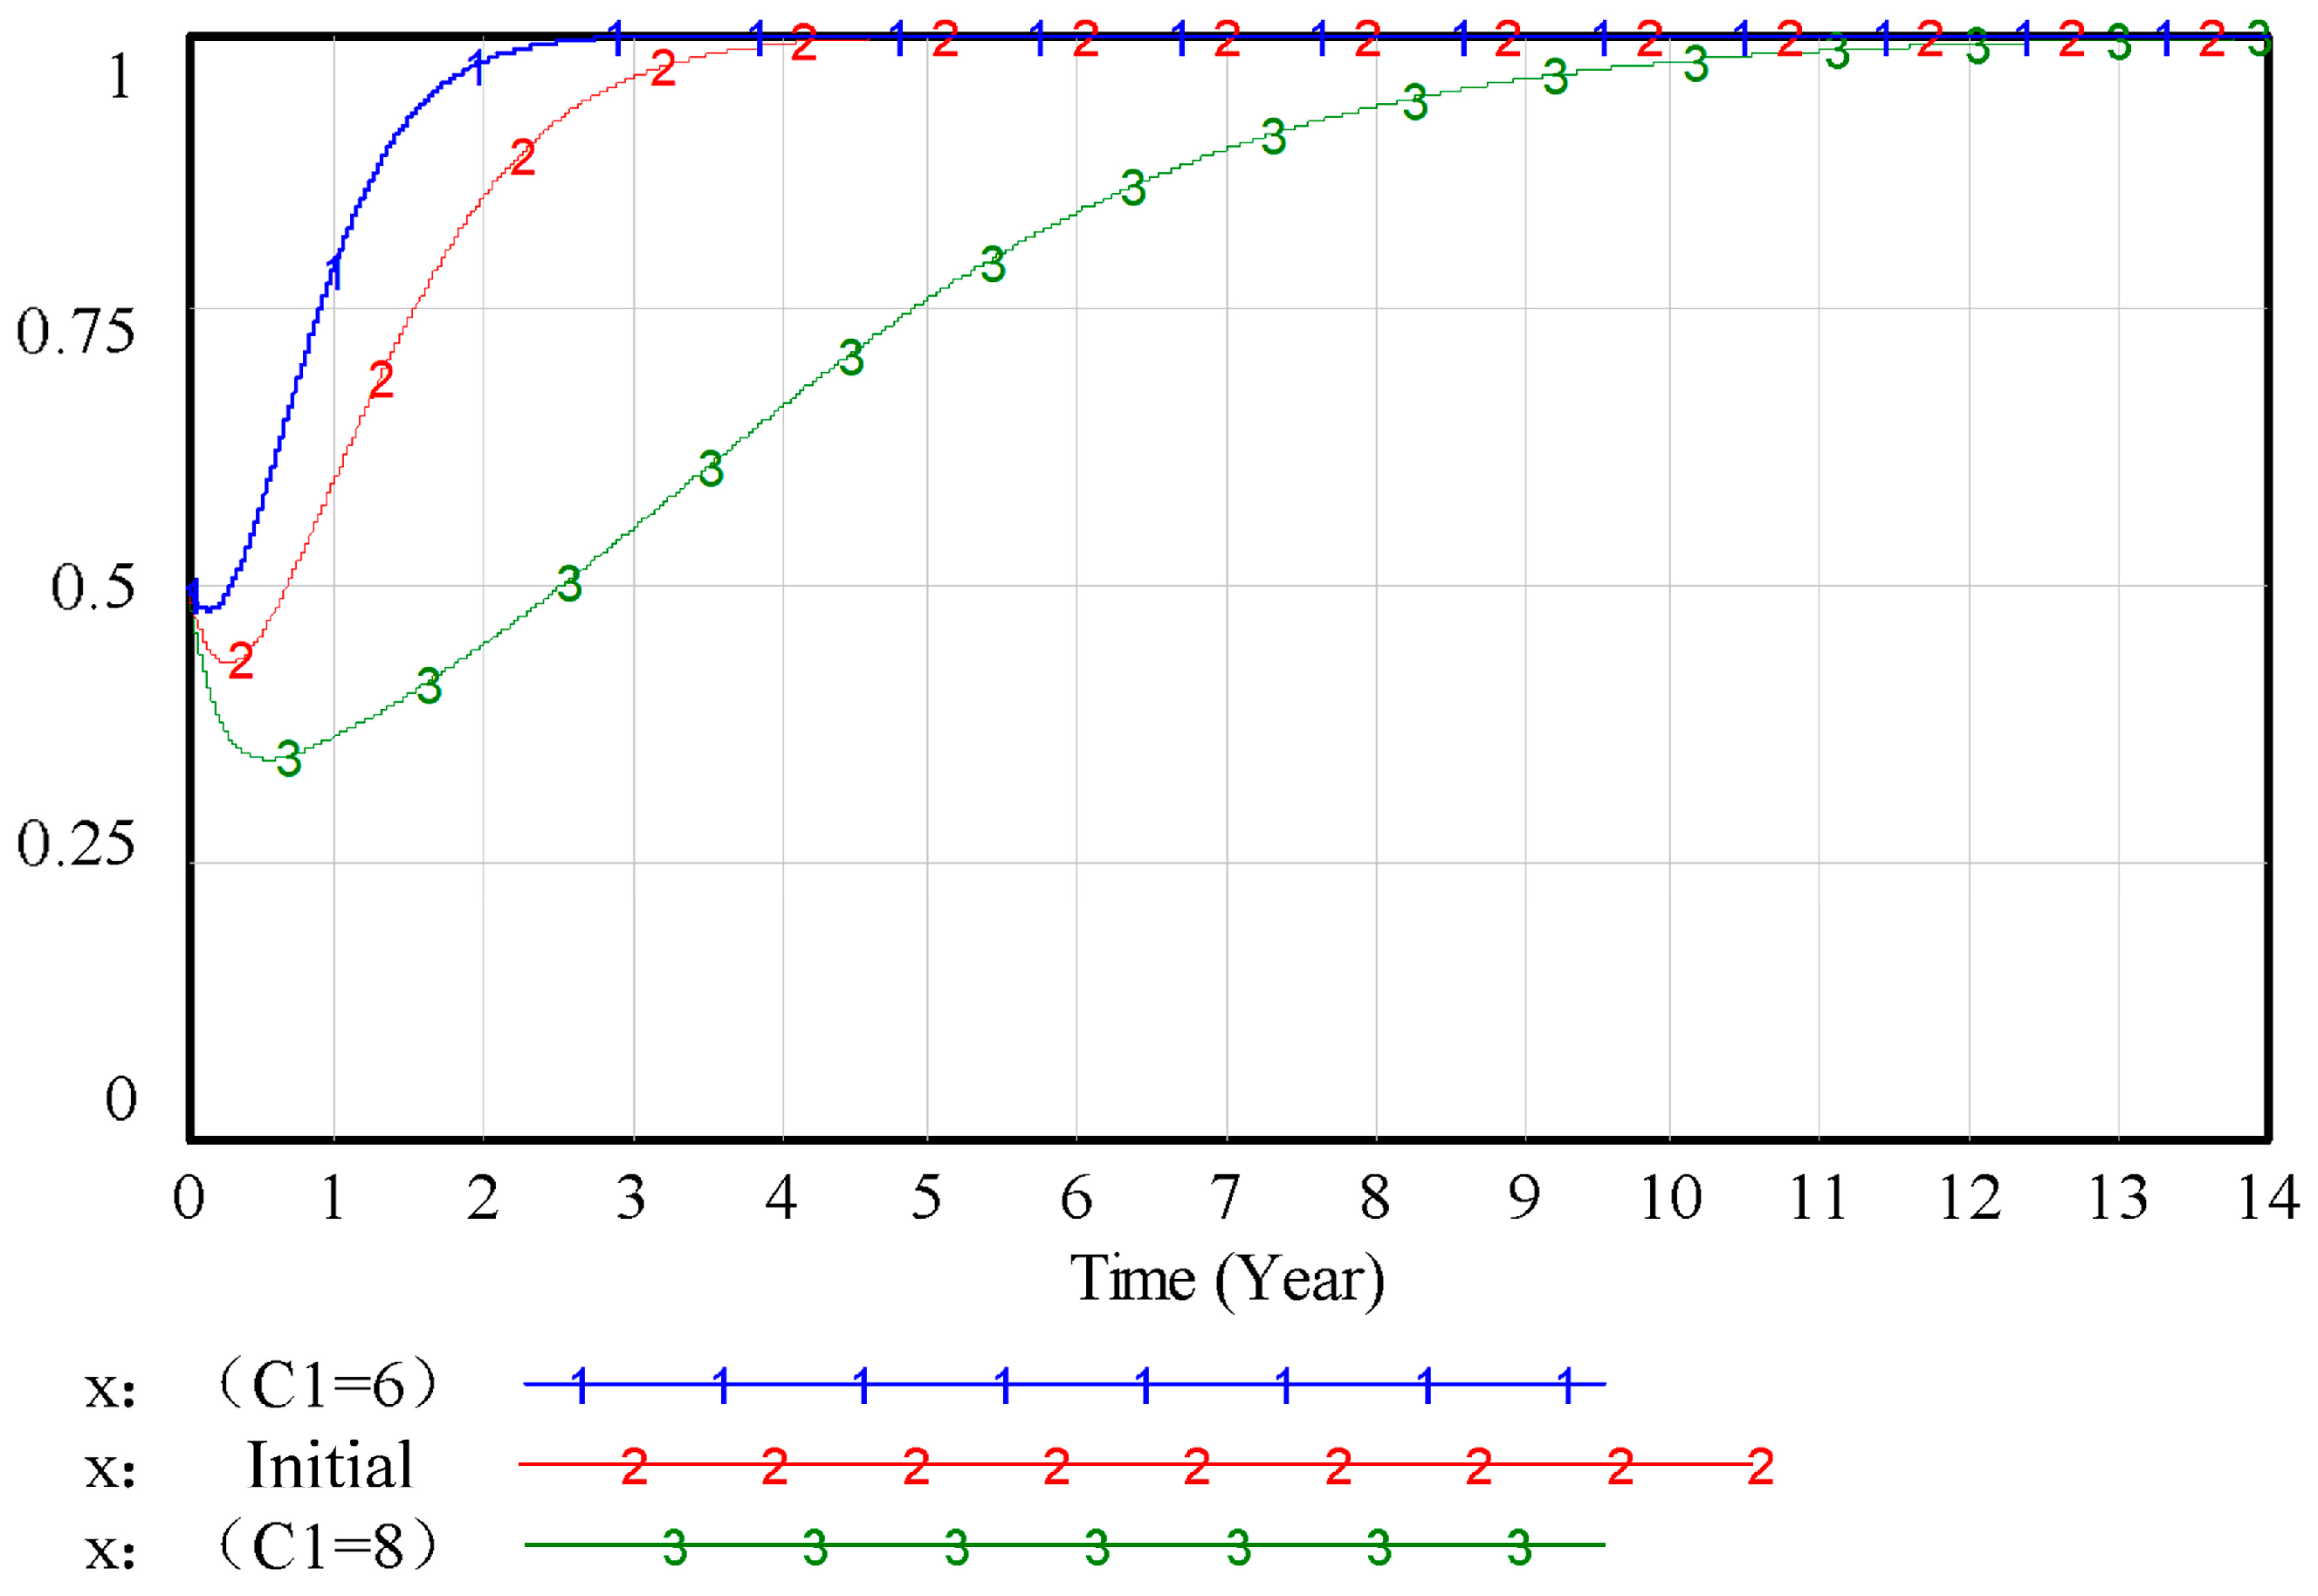
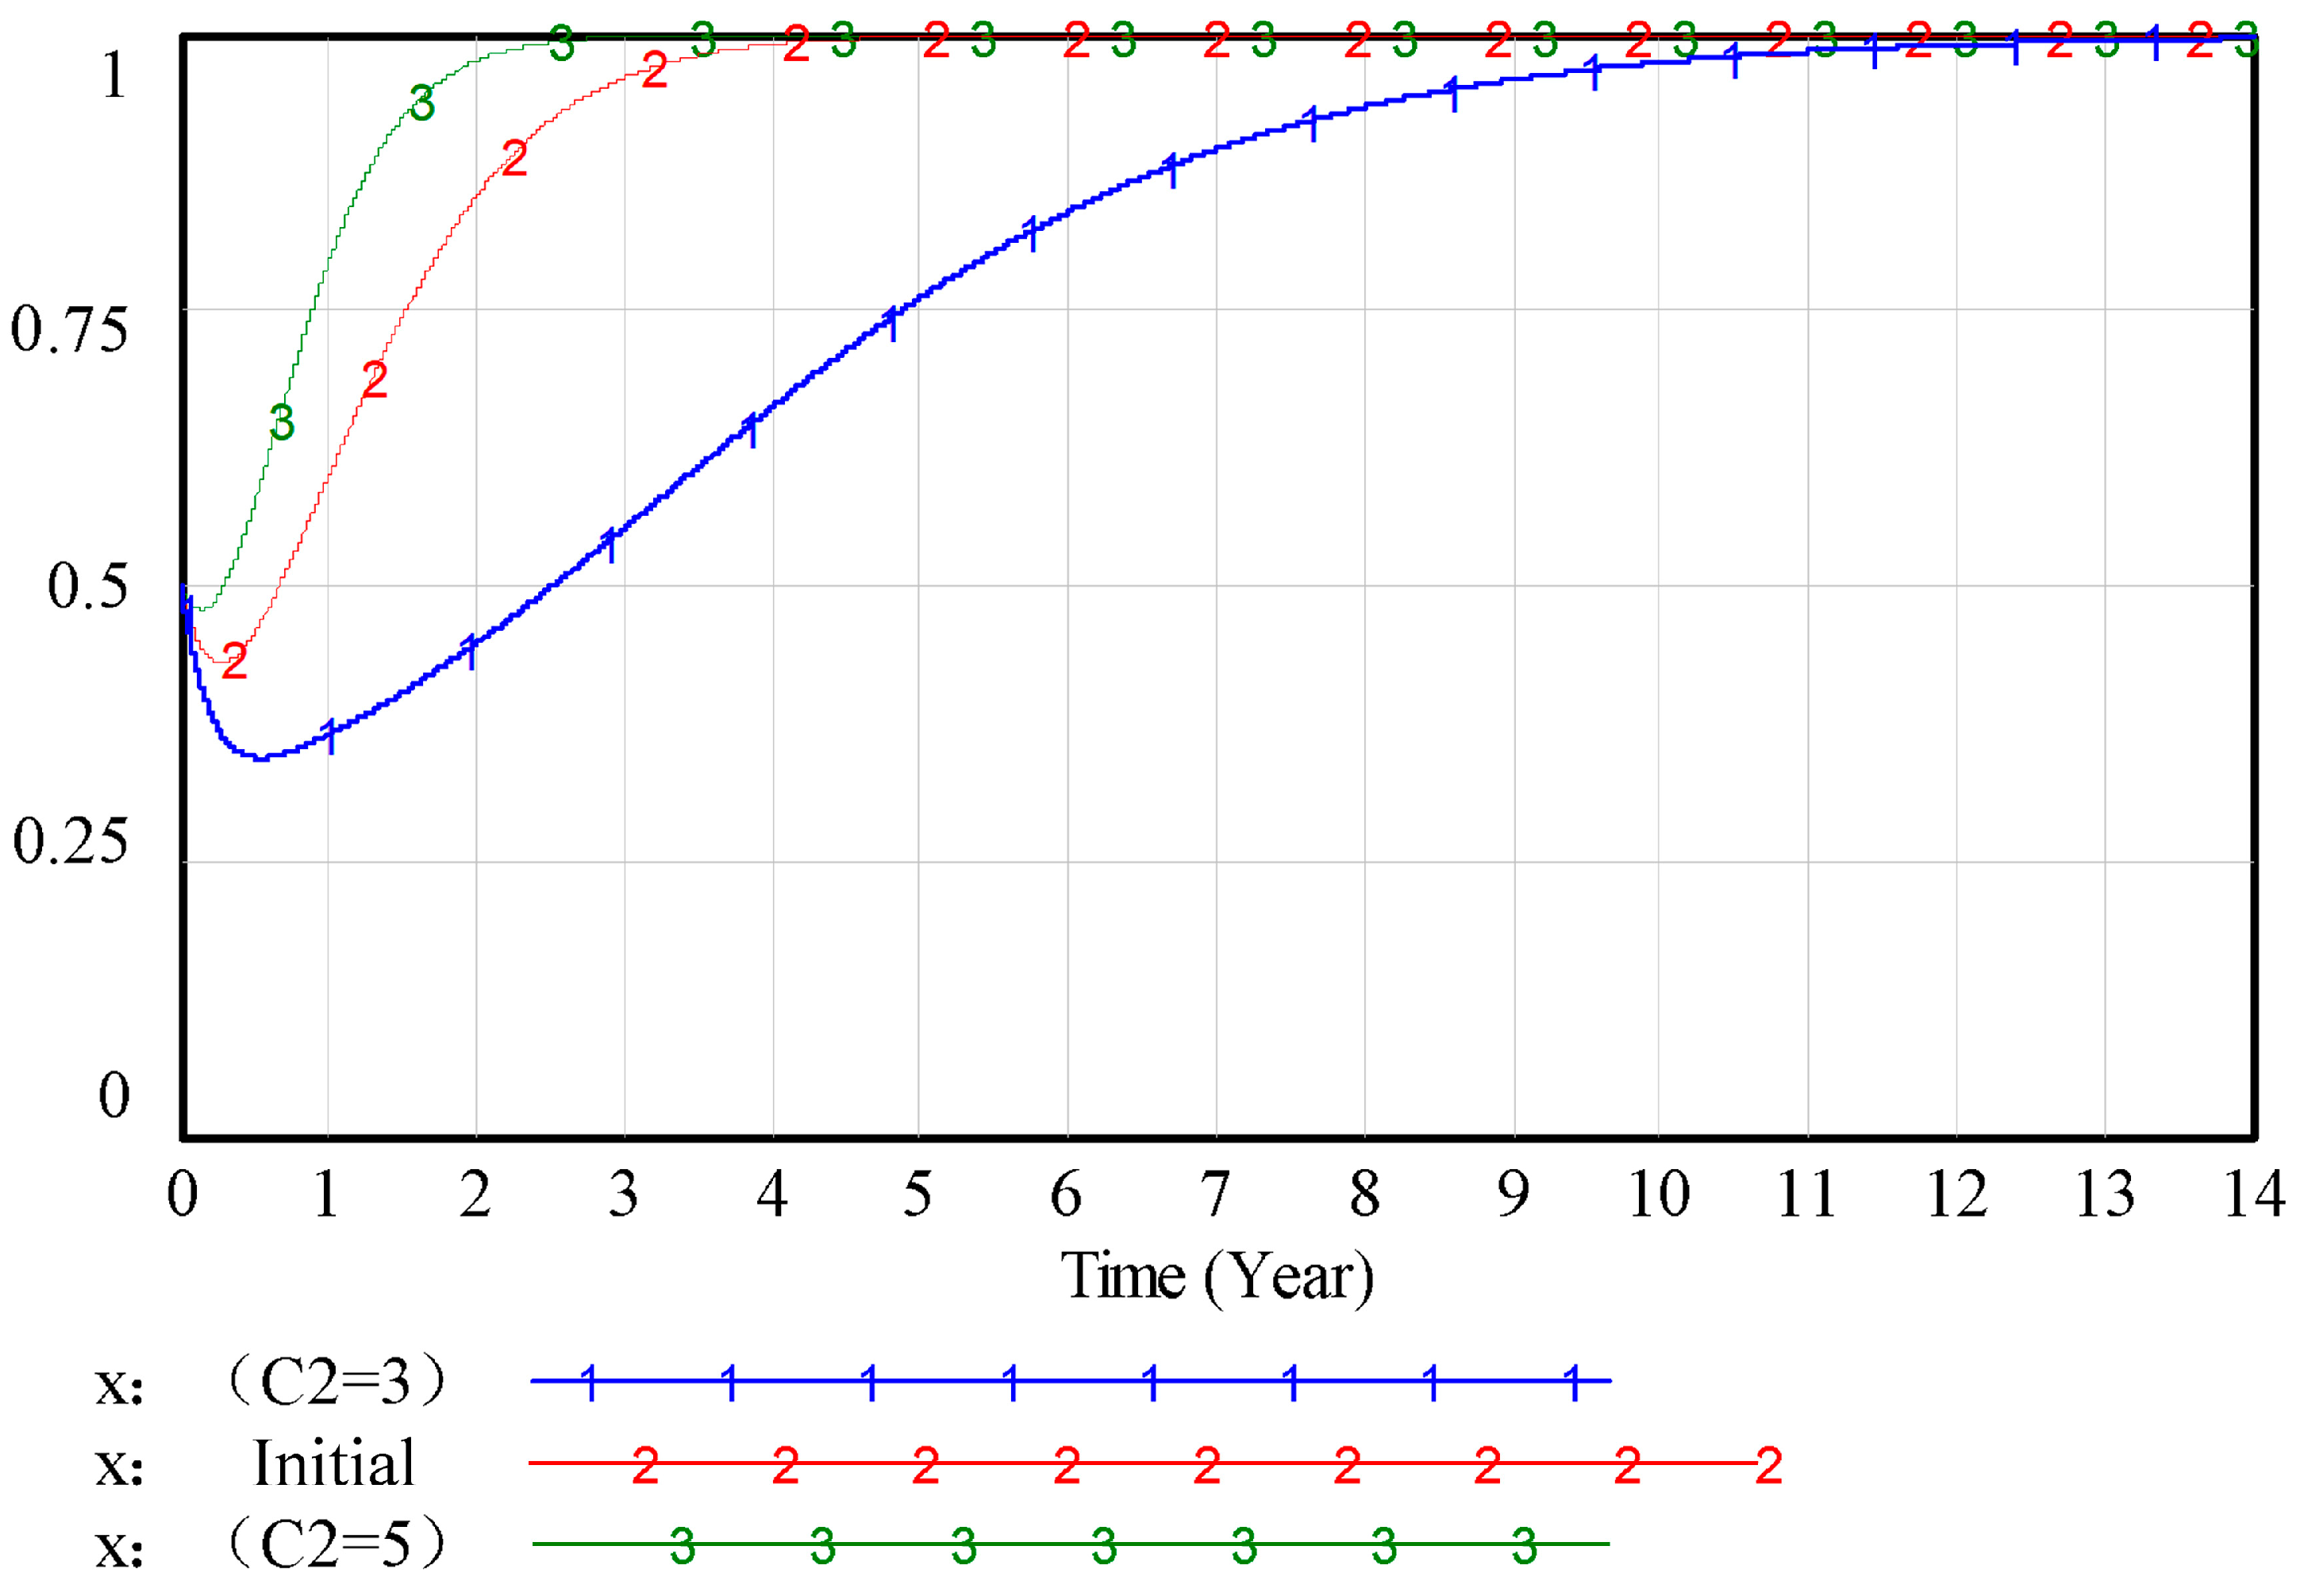
According to the replicator dynamic equation governing construction firms’ strategic choices, the primary exogenous variables influencing their decisions are:
R1,
R2,
C1,
C2,
i0,
ig,
E1, and
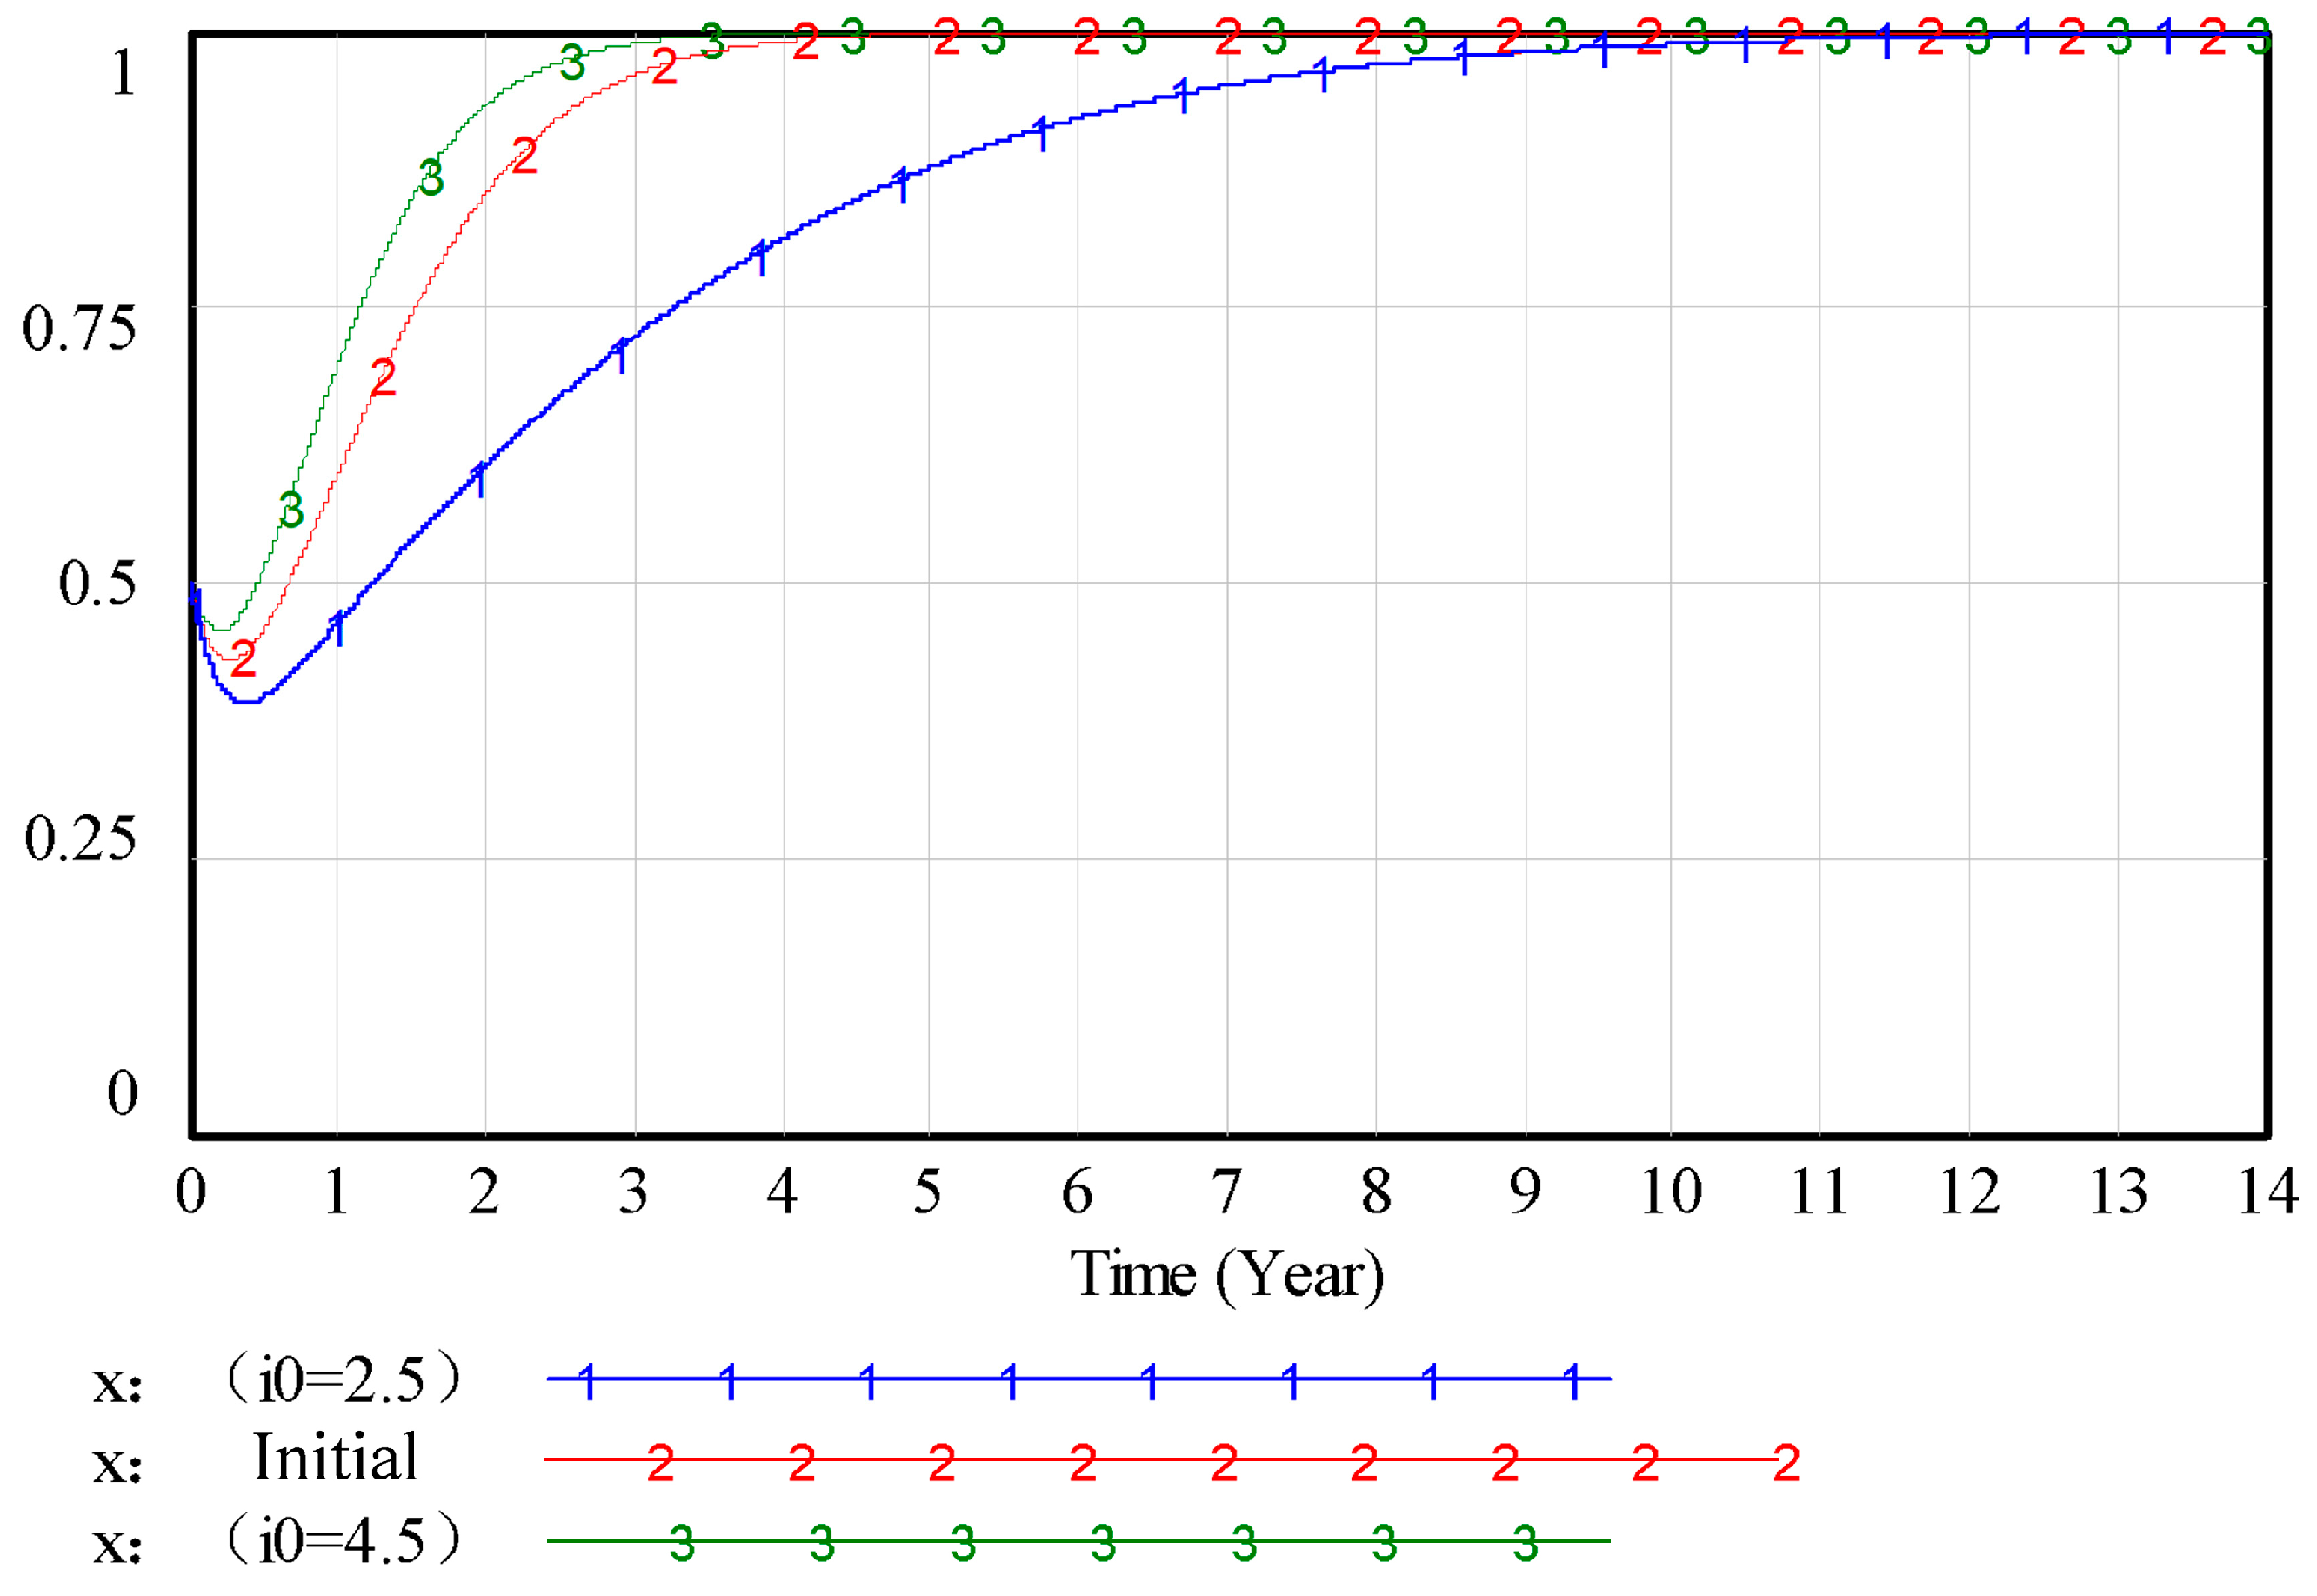
S1. Assuming construction companies have a 50% initial probability of adopting green technology innovation, i.e., x = 0.5, the simulation identifies these nine variables as critical determinants of their strategic evolution. Detailed simulation results are presented in
Figure 4,
Figure 5,
Figure 6 and
Figure 7, illustrating how each parameter shapes firms’ adoption of green innovation over time.
As depicted in
Figure 4,
Figure 5,
Figure 6 and
Figure 7, the simulation reveals that when the benefits
R1 construction companies derive from green technological innovation increase, or when the costs
R1,
C2 associated with traditional technologies rise, firms exhibit a faster upward trajectory in adopting green innovation strategies, with their enthusiasm for such initiatives markedly intensifying, and this indicates that higher
R1 and
C2 act as positive drivers for green technology adoption. Conversely, as the benefits
R2 from traditional technologies grow or the costs
C1 of implementing green innovations escalate, the rate at which companies adopt green strategies declines sharply, and their motivation to pursue sustainable practices diminishes significantly, indicating that benefits
R2 and costs
C1 inhibit construction companies from choosing green technological innovation pathways.
As illustrated in
Figure 8 and
Figure 9, the simulation demonstrates that when banks raise the total interest rate,
i0, on conventional loans to construction companies, the pace of firms’ transition toward green technology innovation strategies accelerates. This phenomenon likely arises because higher conventional loan costs reduce the profitability of traditional technologies, making green innovation returns comparatively more attractive and thereby incentivizing firms to adopt sustainable practices. Conversely, as banks increase the total interest rate
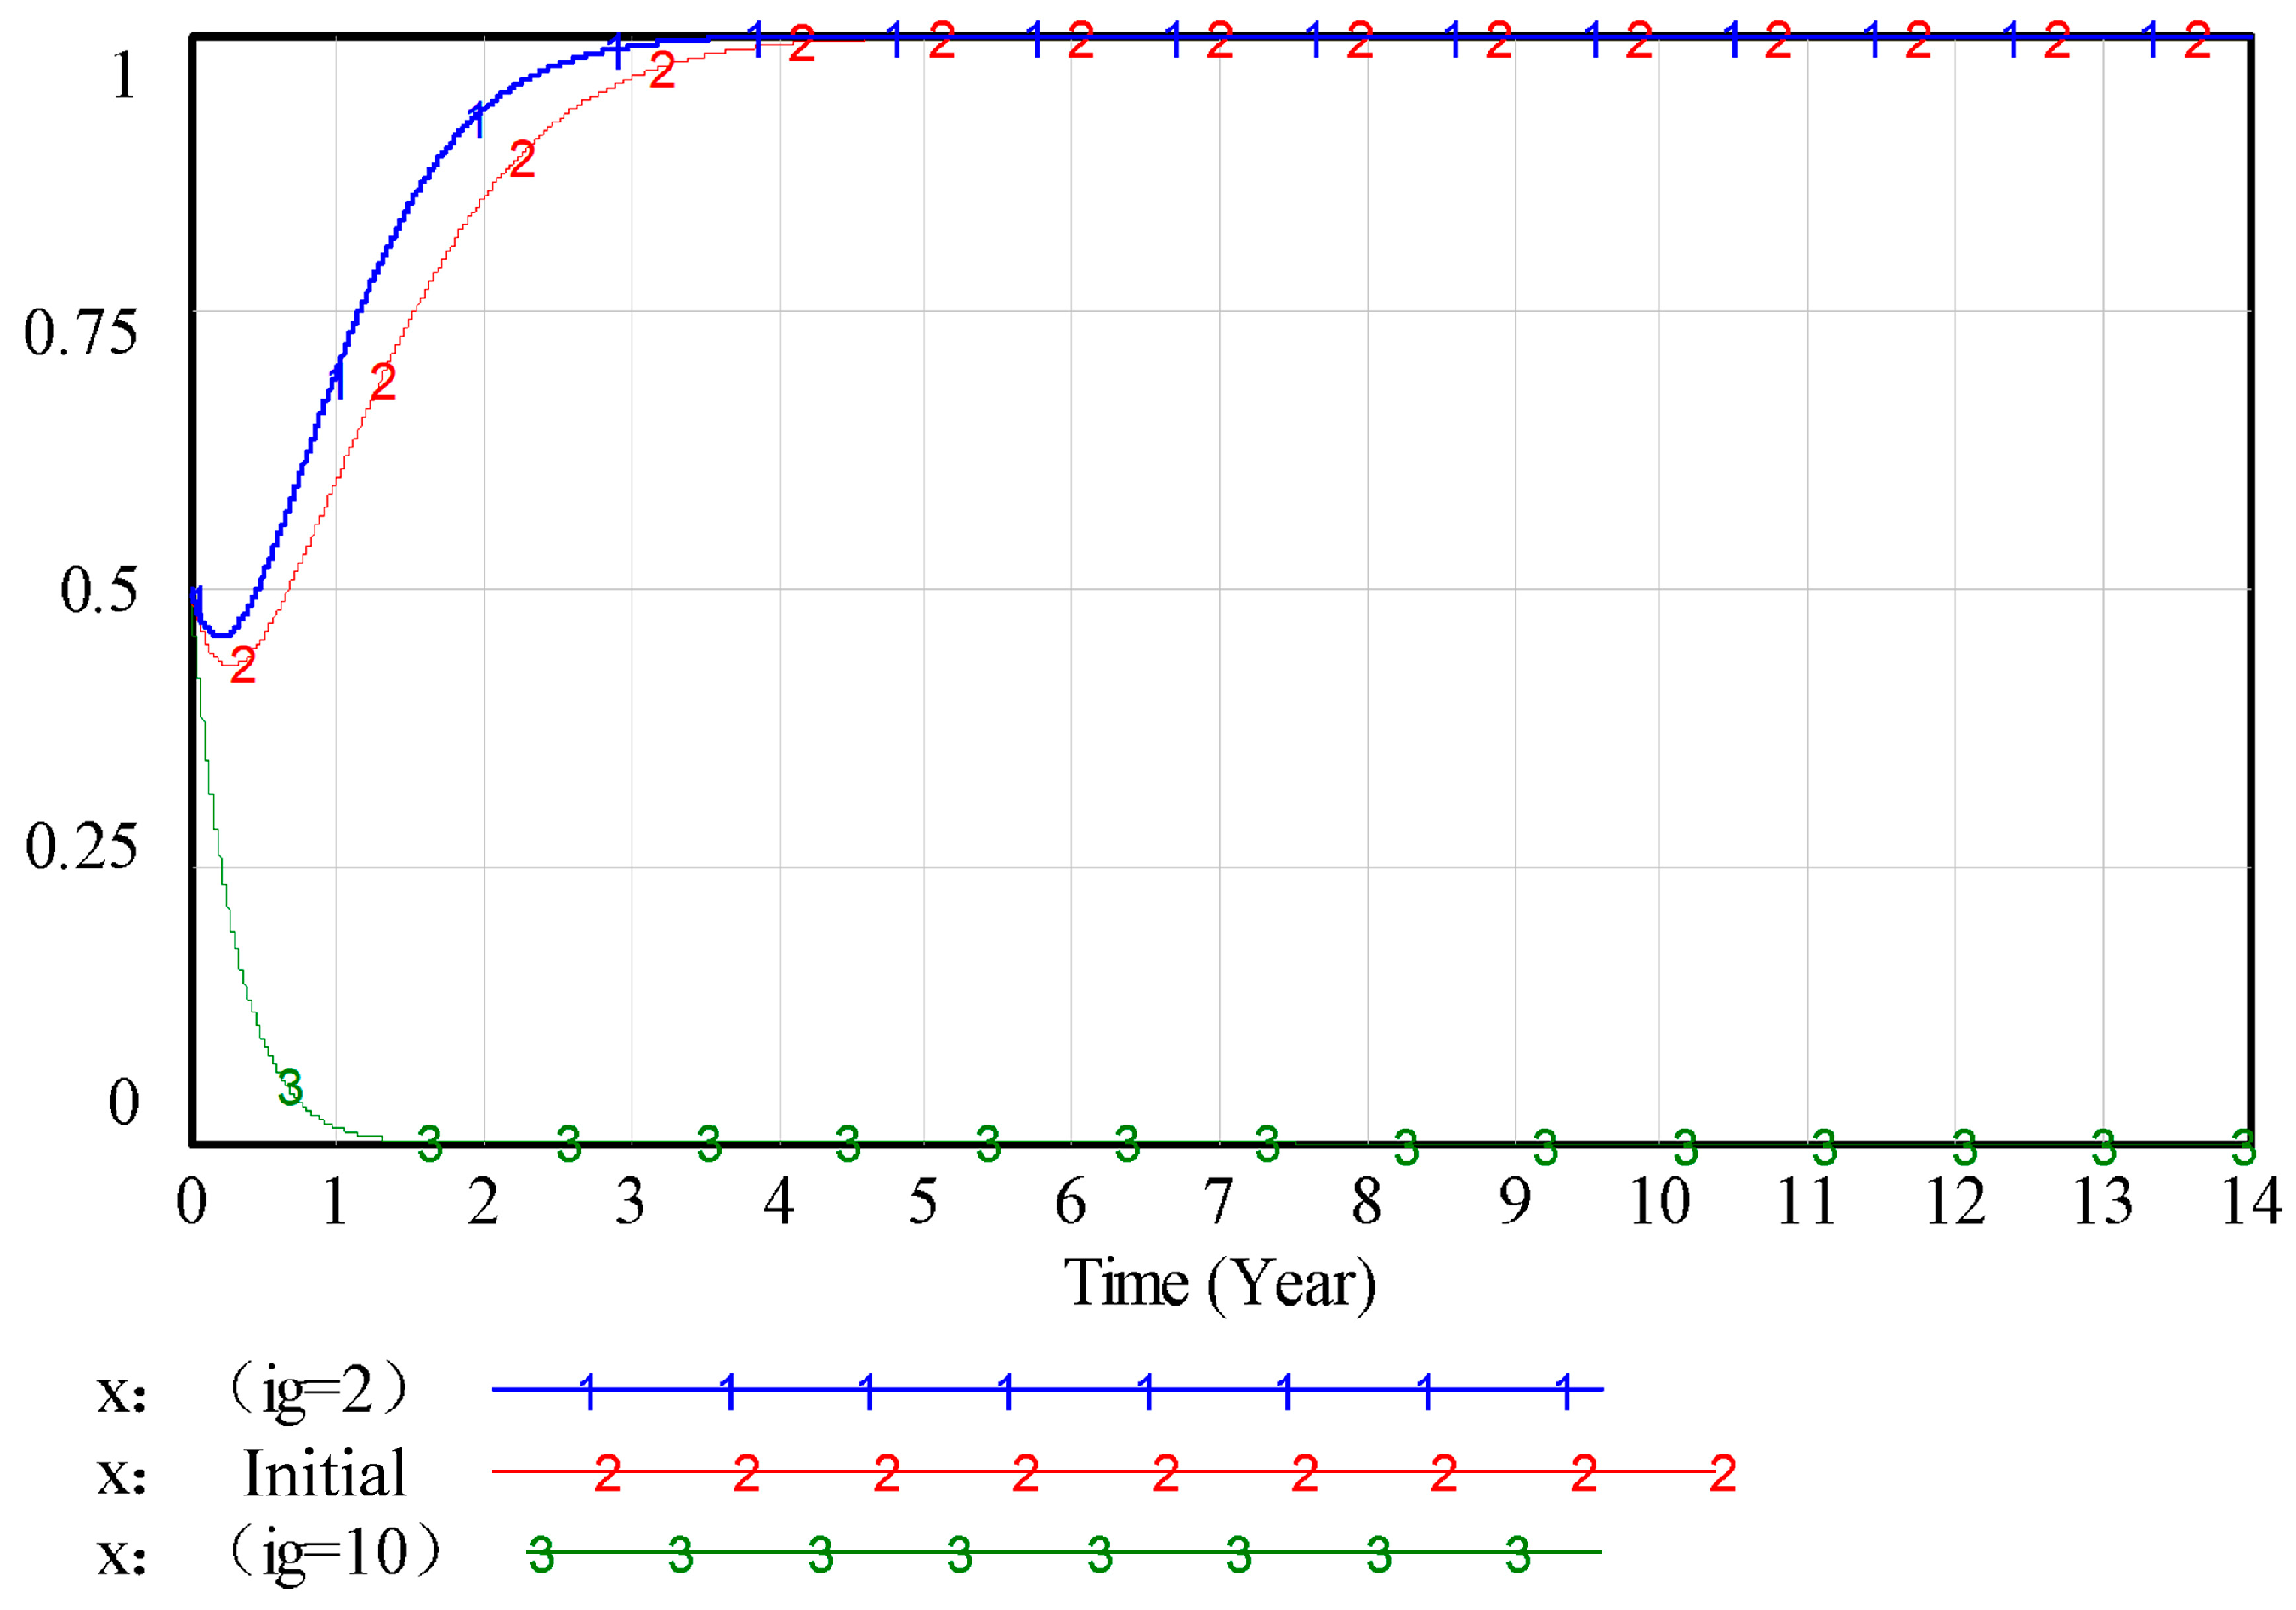
ig on green loans, the rate of firms’ green technology innovation strategy adoption decelerates, and in some scenarios, companies even reverse course, abandoning green innovation initiatives, and this indicates that conventional loan interest
i0 functions as a catalyst for green technology adoption, while elevated green loan interest
ig acts as a deterrent, discouraging firms from pursuing environmentally friendly technological advancements.
As illustrated in
Figure 10 and
Figure 11, as
E1 and
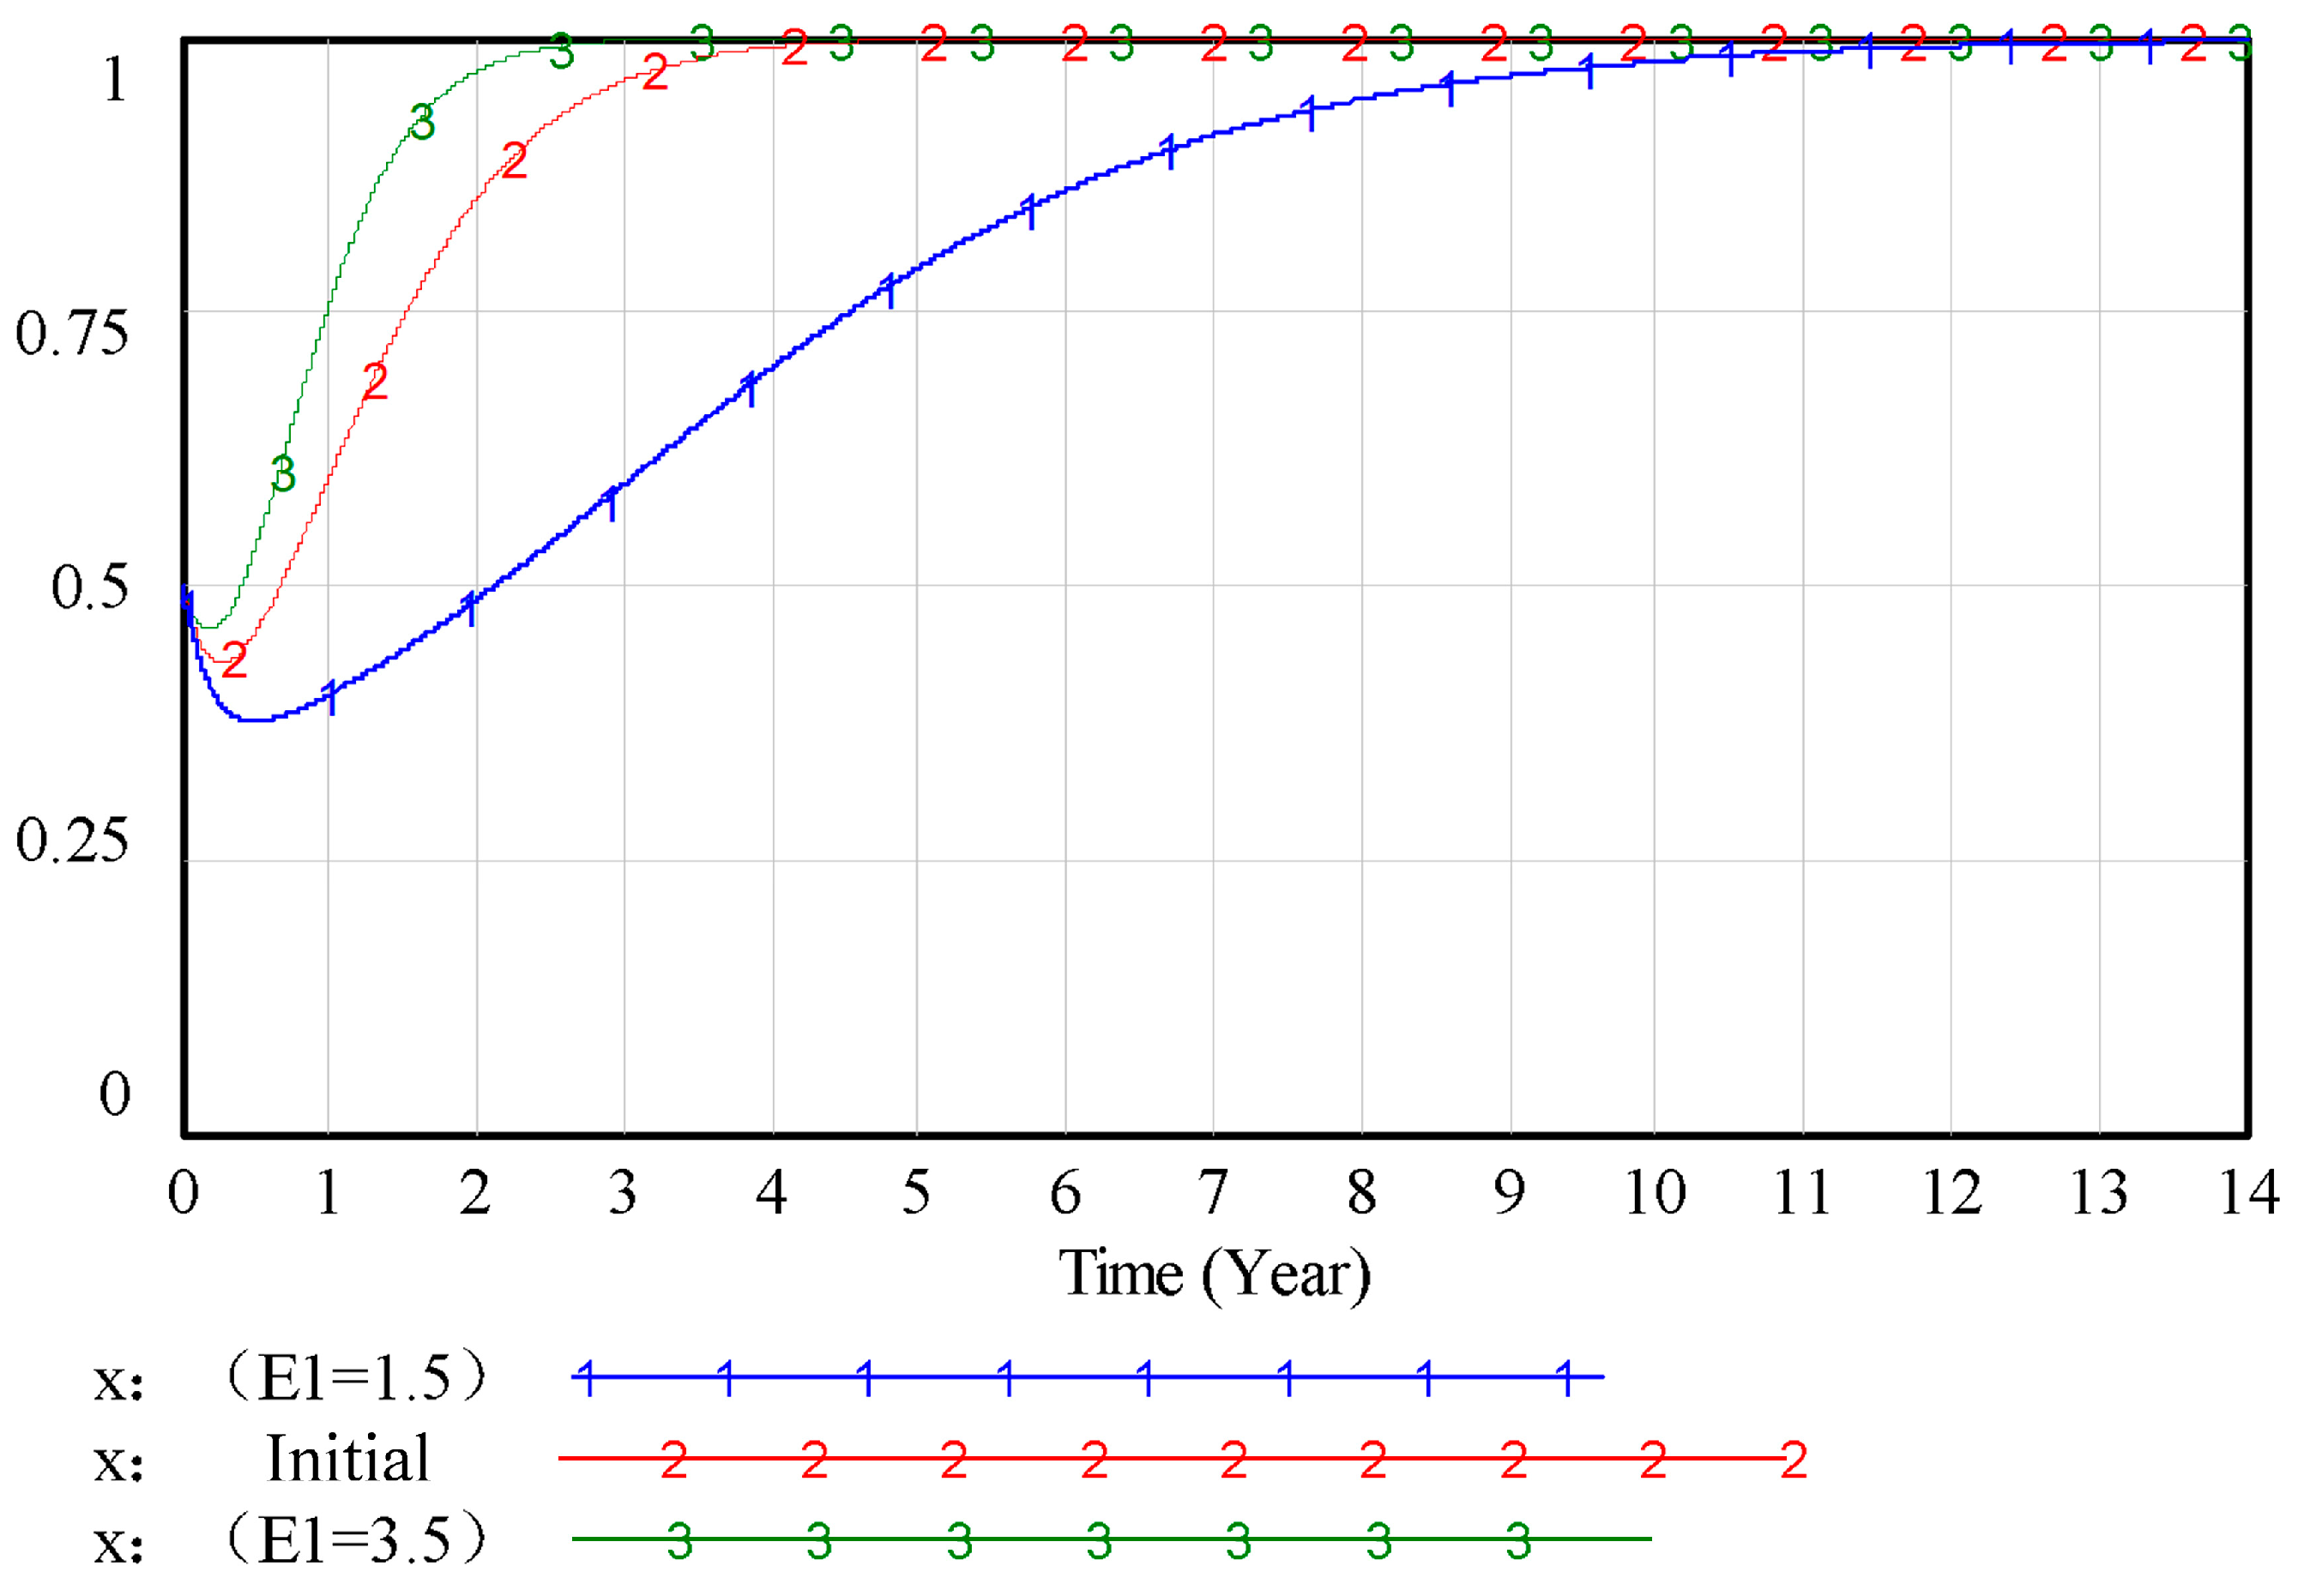
S1 increase, the probability of construction companies engaging in green innovation accelerates, indicating that the benefits of
E1 and the costs of
S1 promote construction companies’ choice of green technological innovation strategies. Additionally, as carbon tax costs imposed on companies using conventional technologies rise, the profitability of traditional methods declines, making green innovation returns comparatively more advantageous. At this point, firms strategically shift toward green technological innovation to optimize their long-term profitability, aligning economic incentives with environmental sustainability goals.
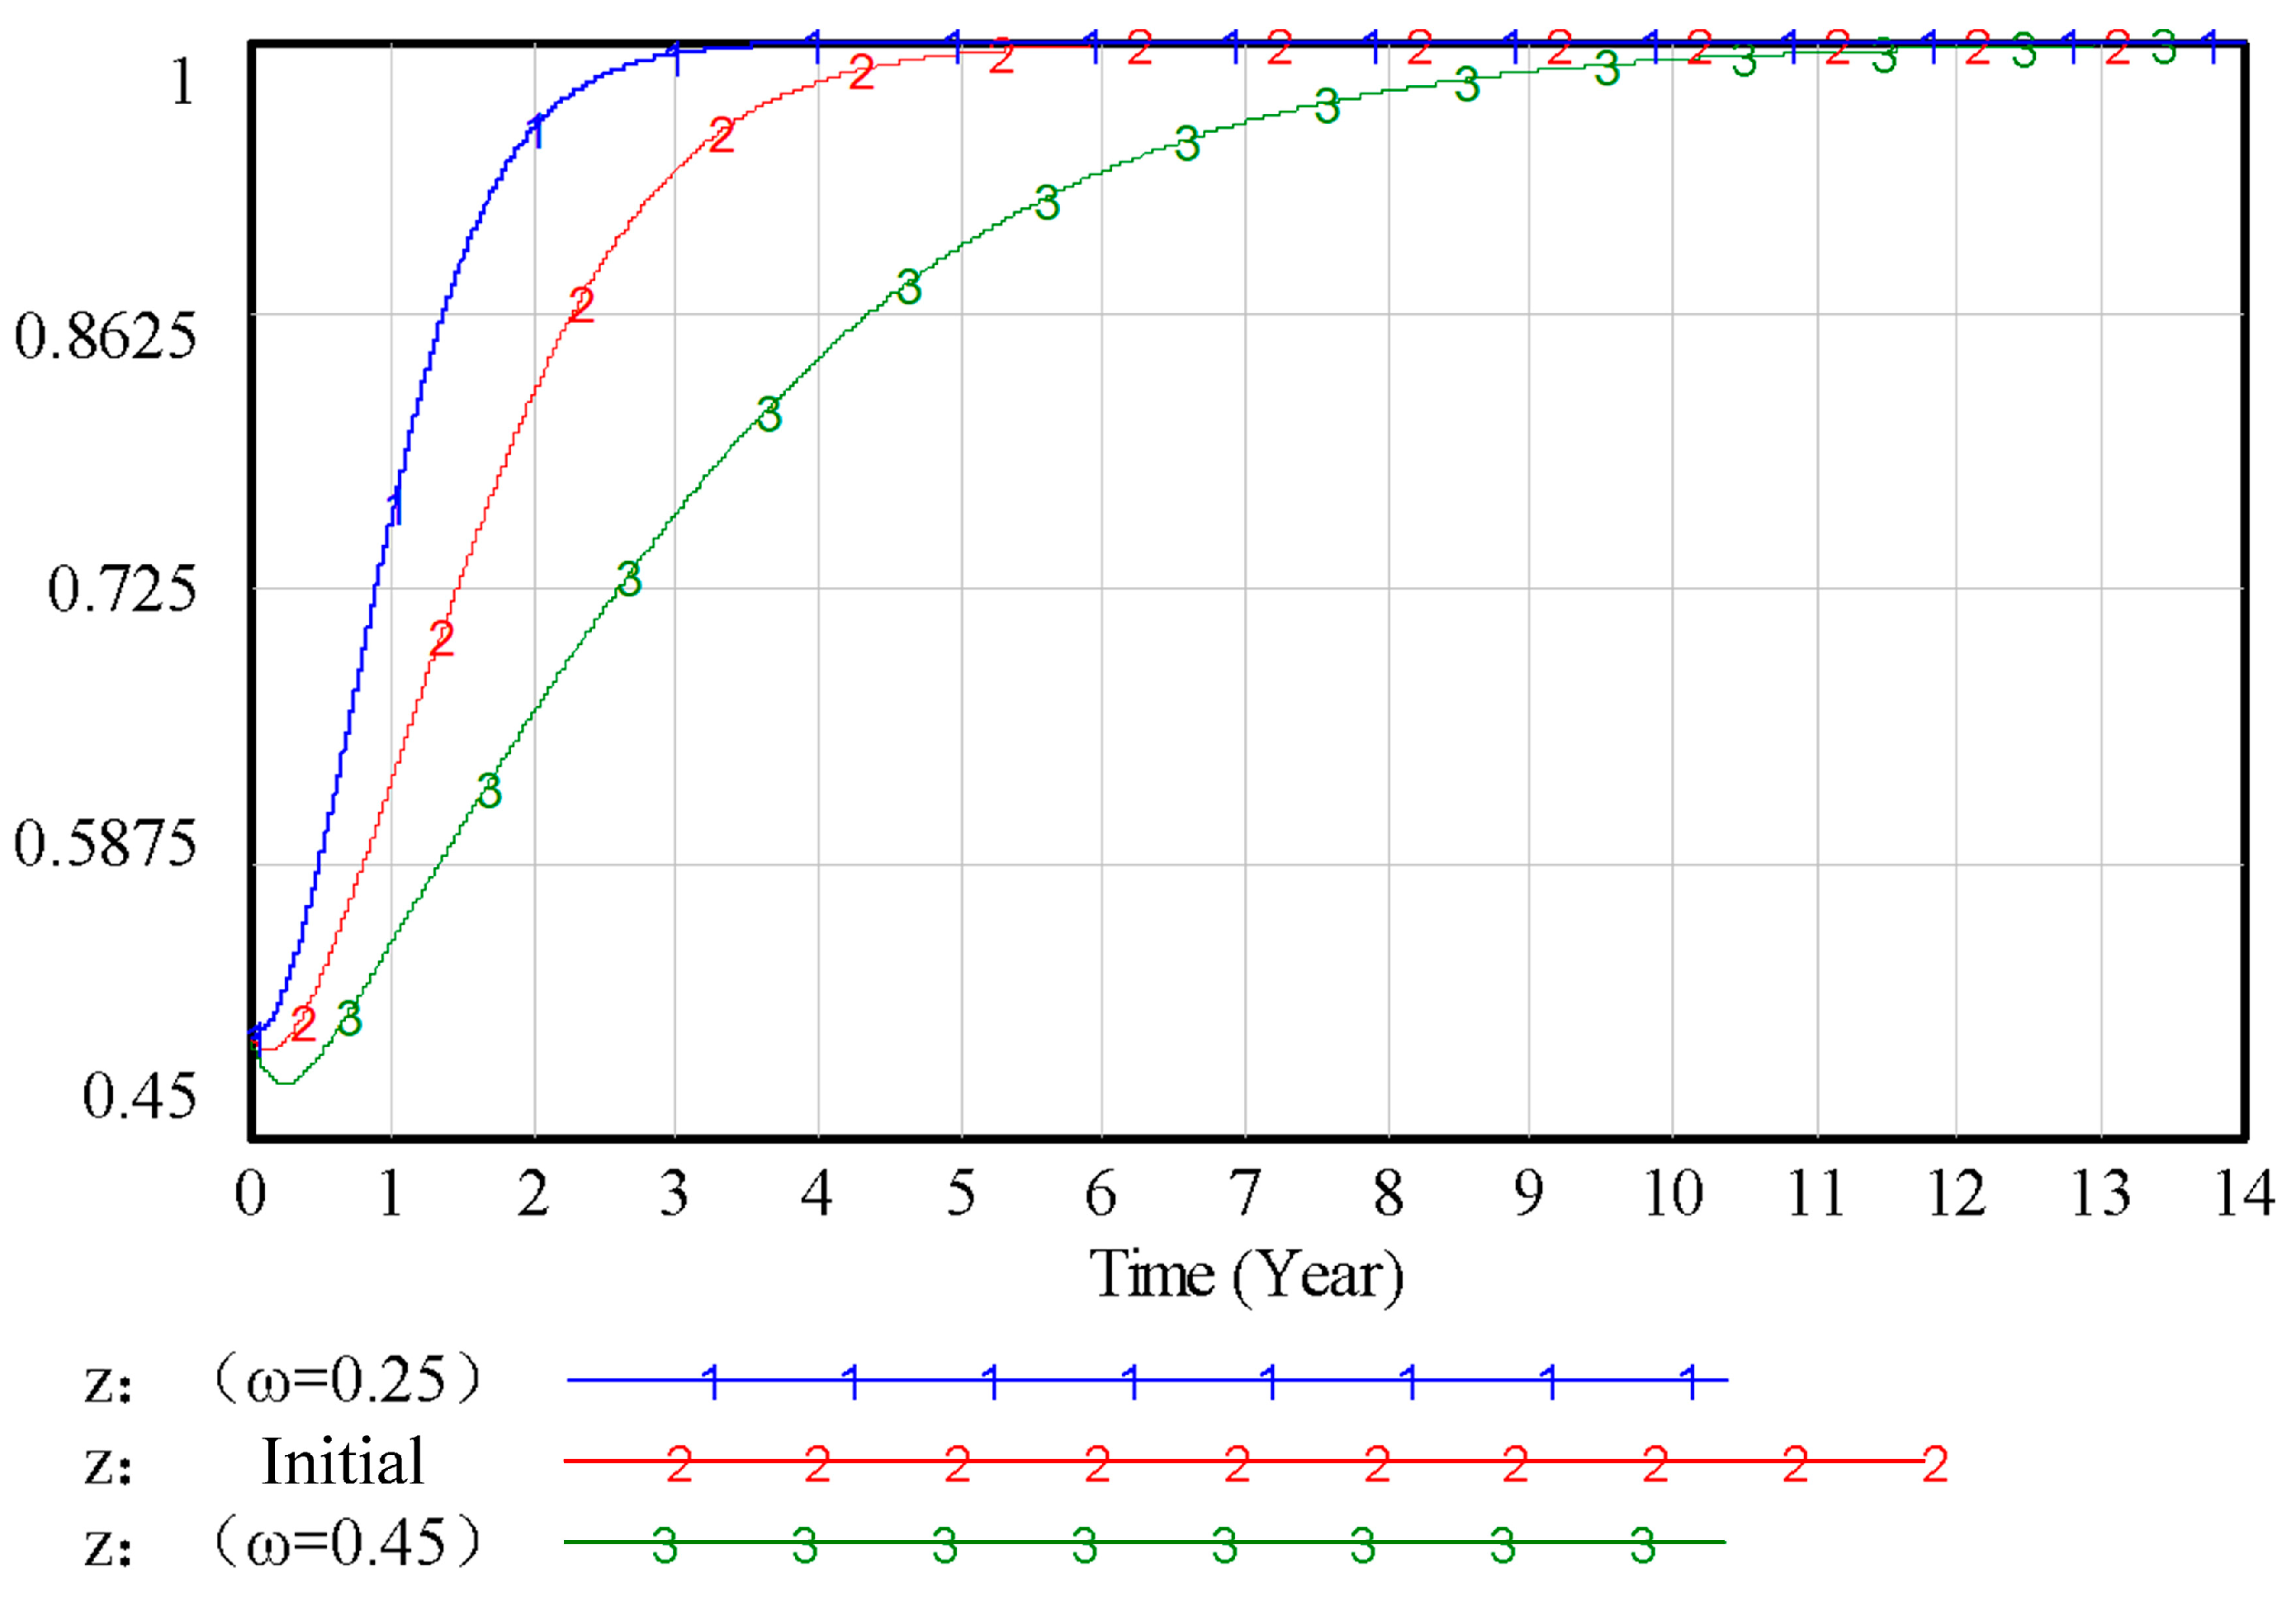
As depicted in
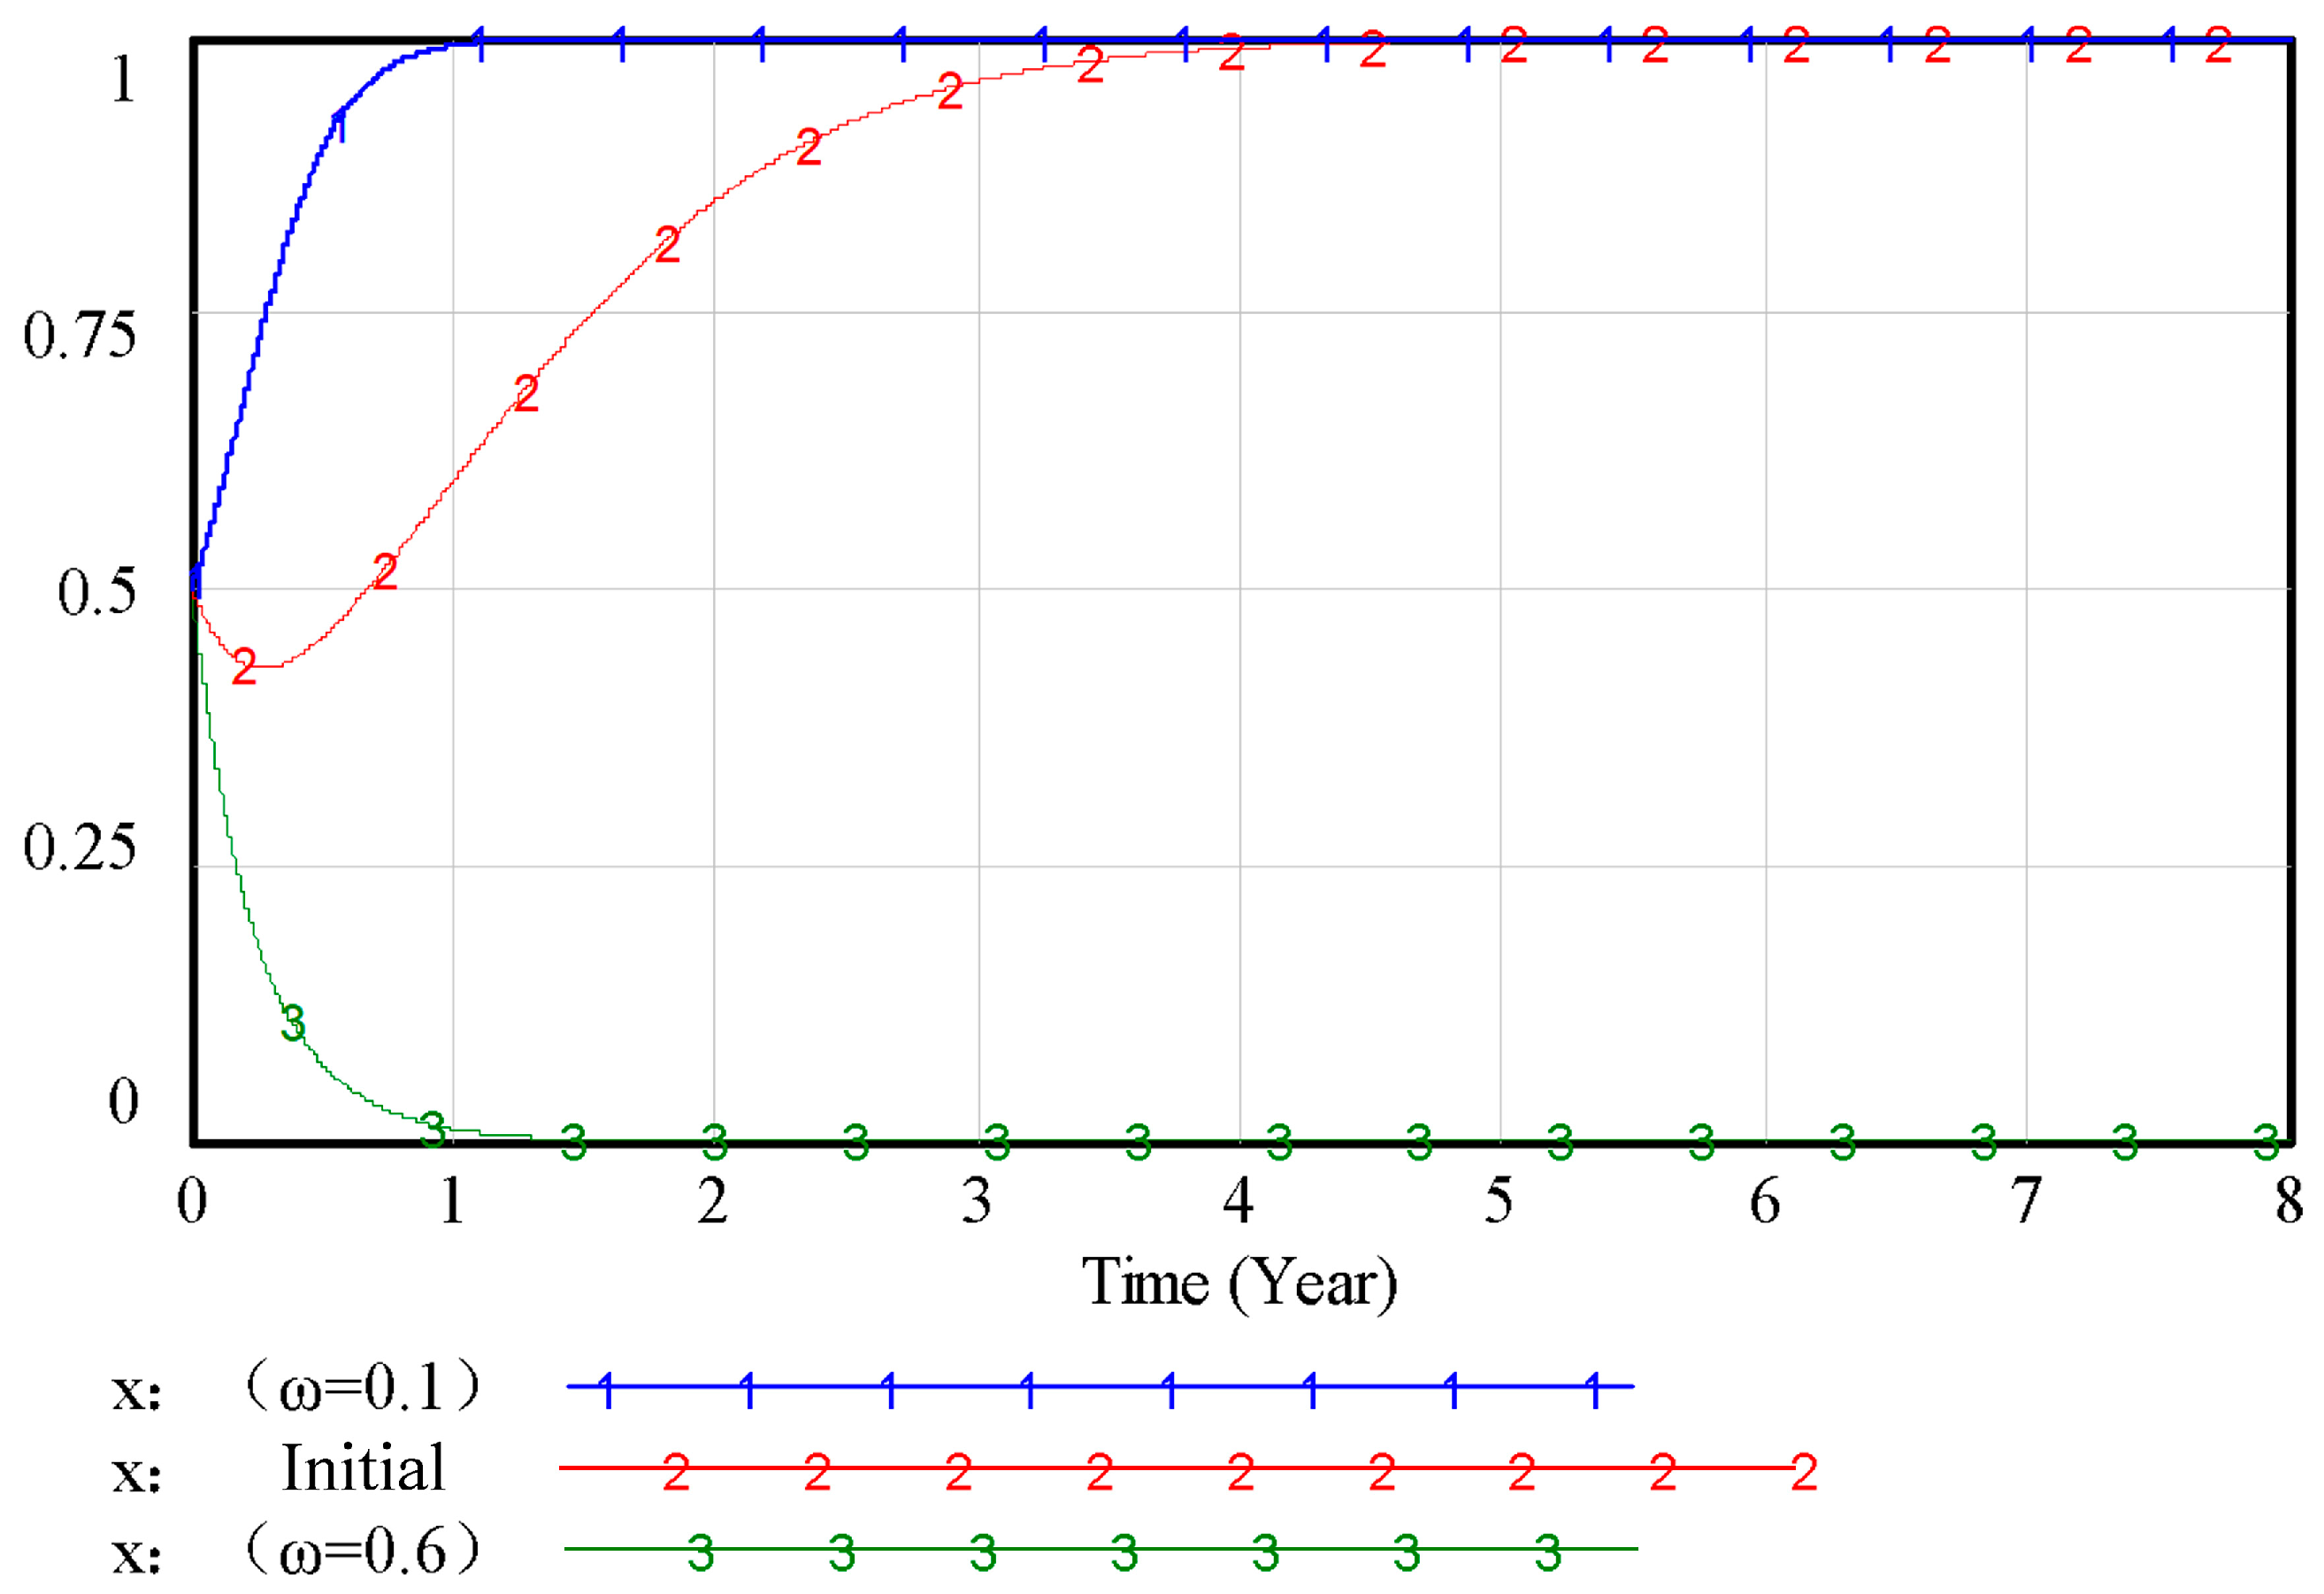
Figure 12, an increase in the failure probability ω of green technology innovation reduces the rate at which construction firms adopt sustainable strategies. When ω surpasses a critical threshold, firms systematically shift away from green innovation, opting instead for conventional approaches. This reflects heightened perceived risks associated with green innovation, as elevated failure probabilities signal greater uncertainty and potential losses. Under such conditions, firms prioritize risk mitigation over long-term sustainability to safeguard core business interests.
- (2)
Analysis of the Impact of Government Policy Choices
As illustrated in
Figure 13 and
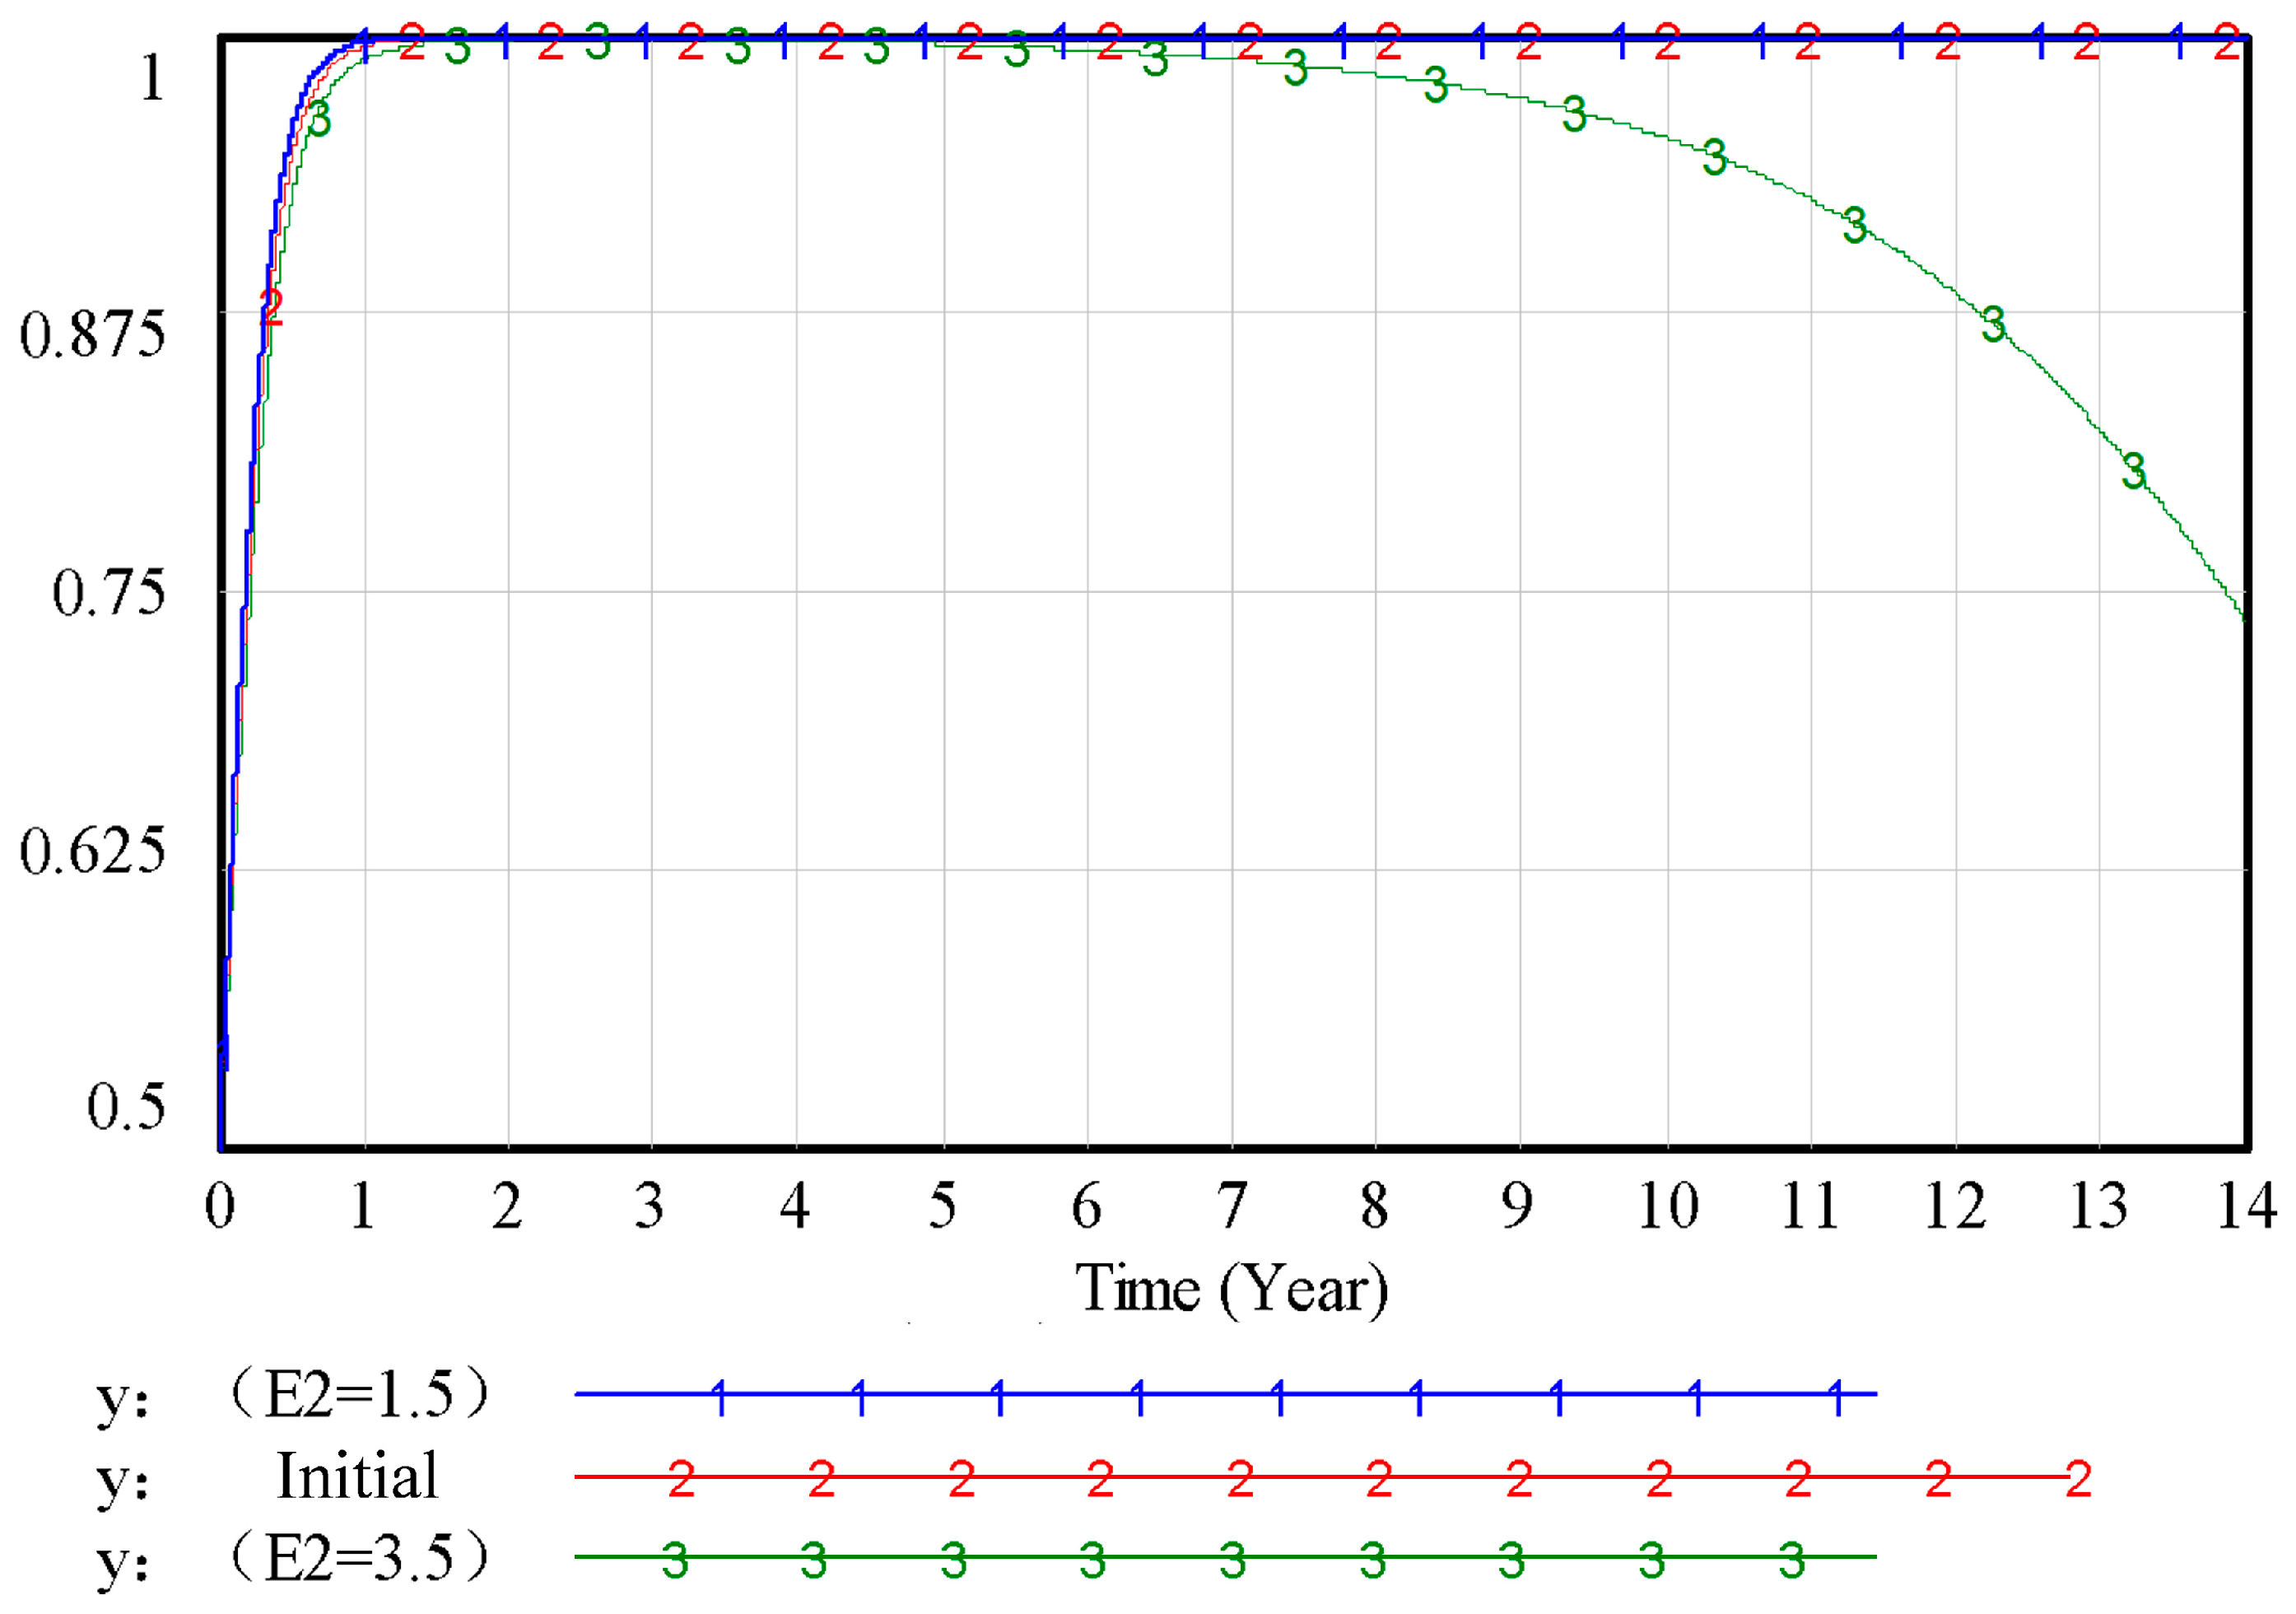
Figure 14, as
E1 and
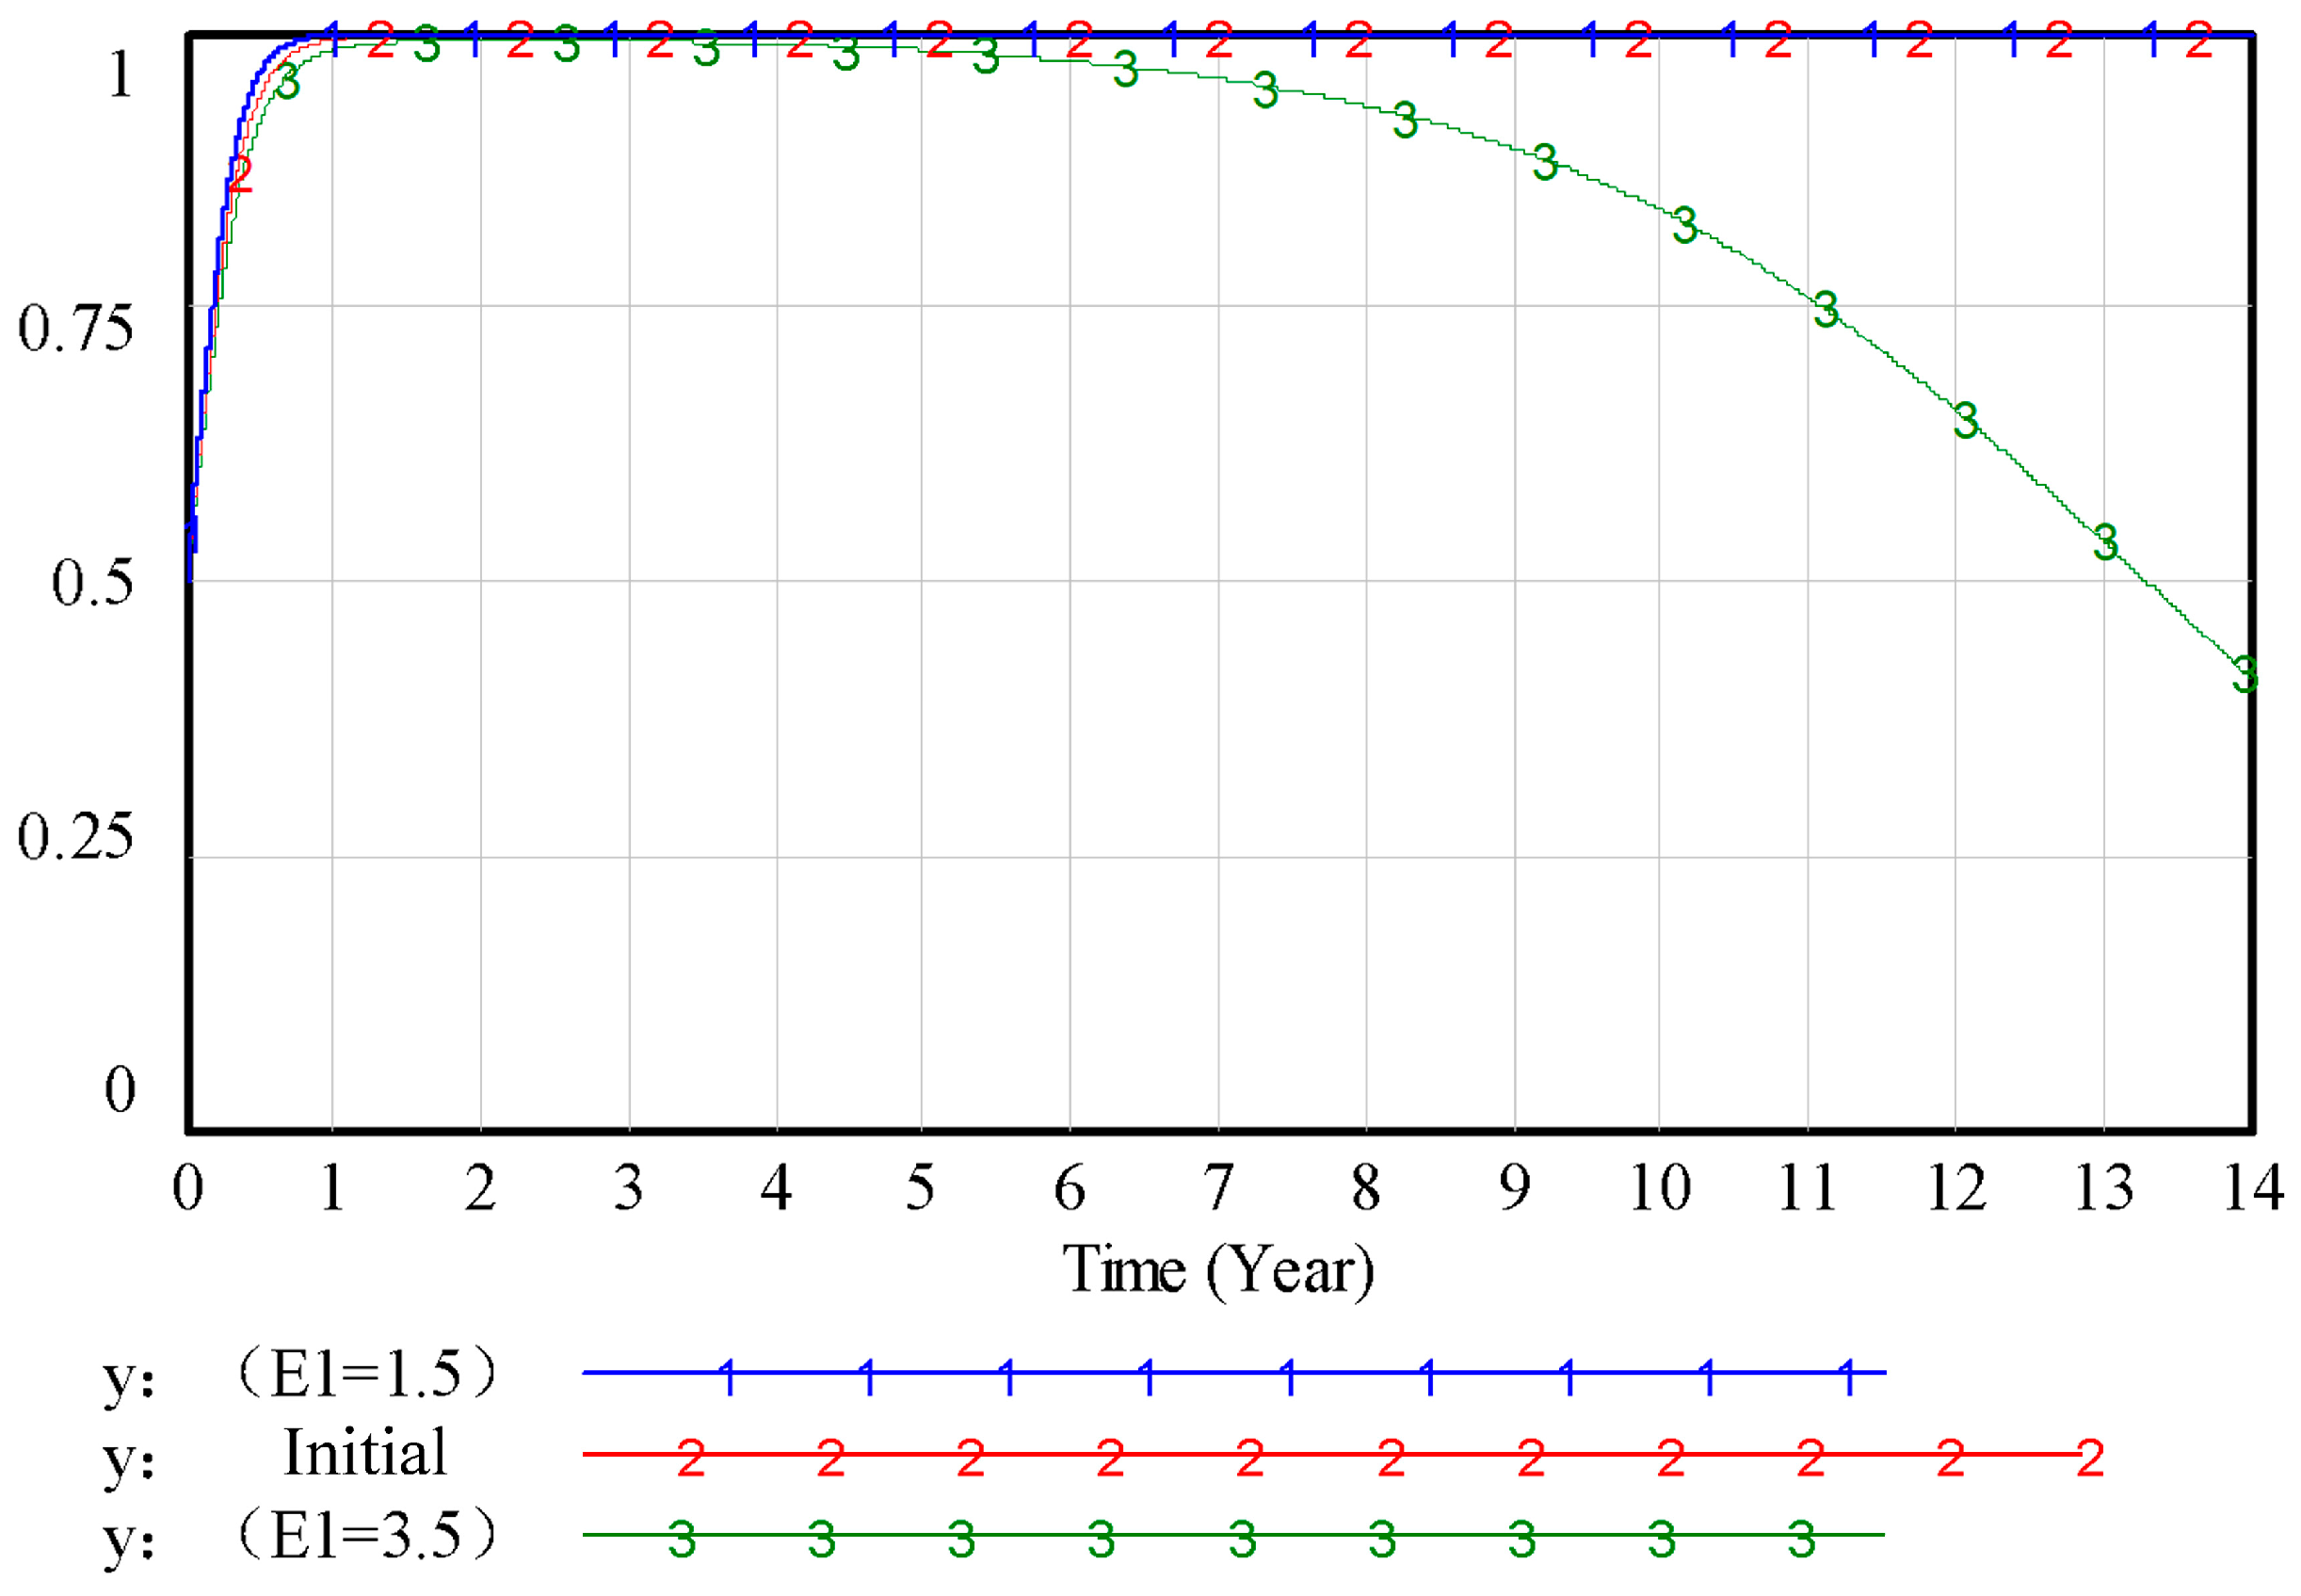
E2 increase, the government’s proactive promotion of evolutionary rates decreases. Once
E1 and
E2 reach a certain value, the government shifts to a passive promotion strategy, suggesting that excessive subsidies for
E1 and
E2 have an inhibitory effect on the government’s proactive promotion strategy. When the subsidies provided by the government’s proactive promotion reach a certain value, the benefits obtained from proactive promotion diminish relative to passive approaches, thereby weakening the government’s motivation to sustain aggressive policy initiatives.
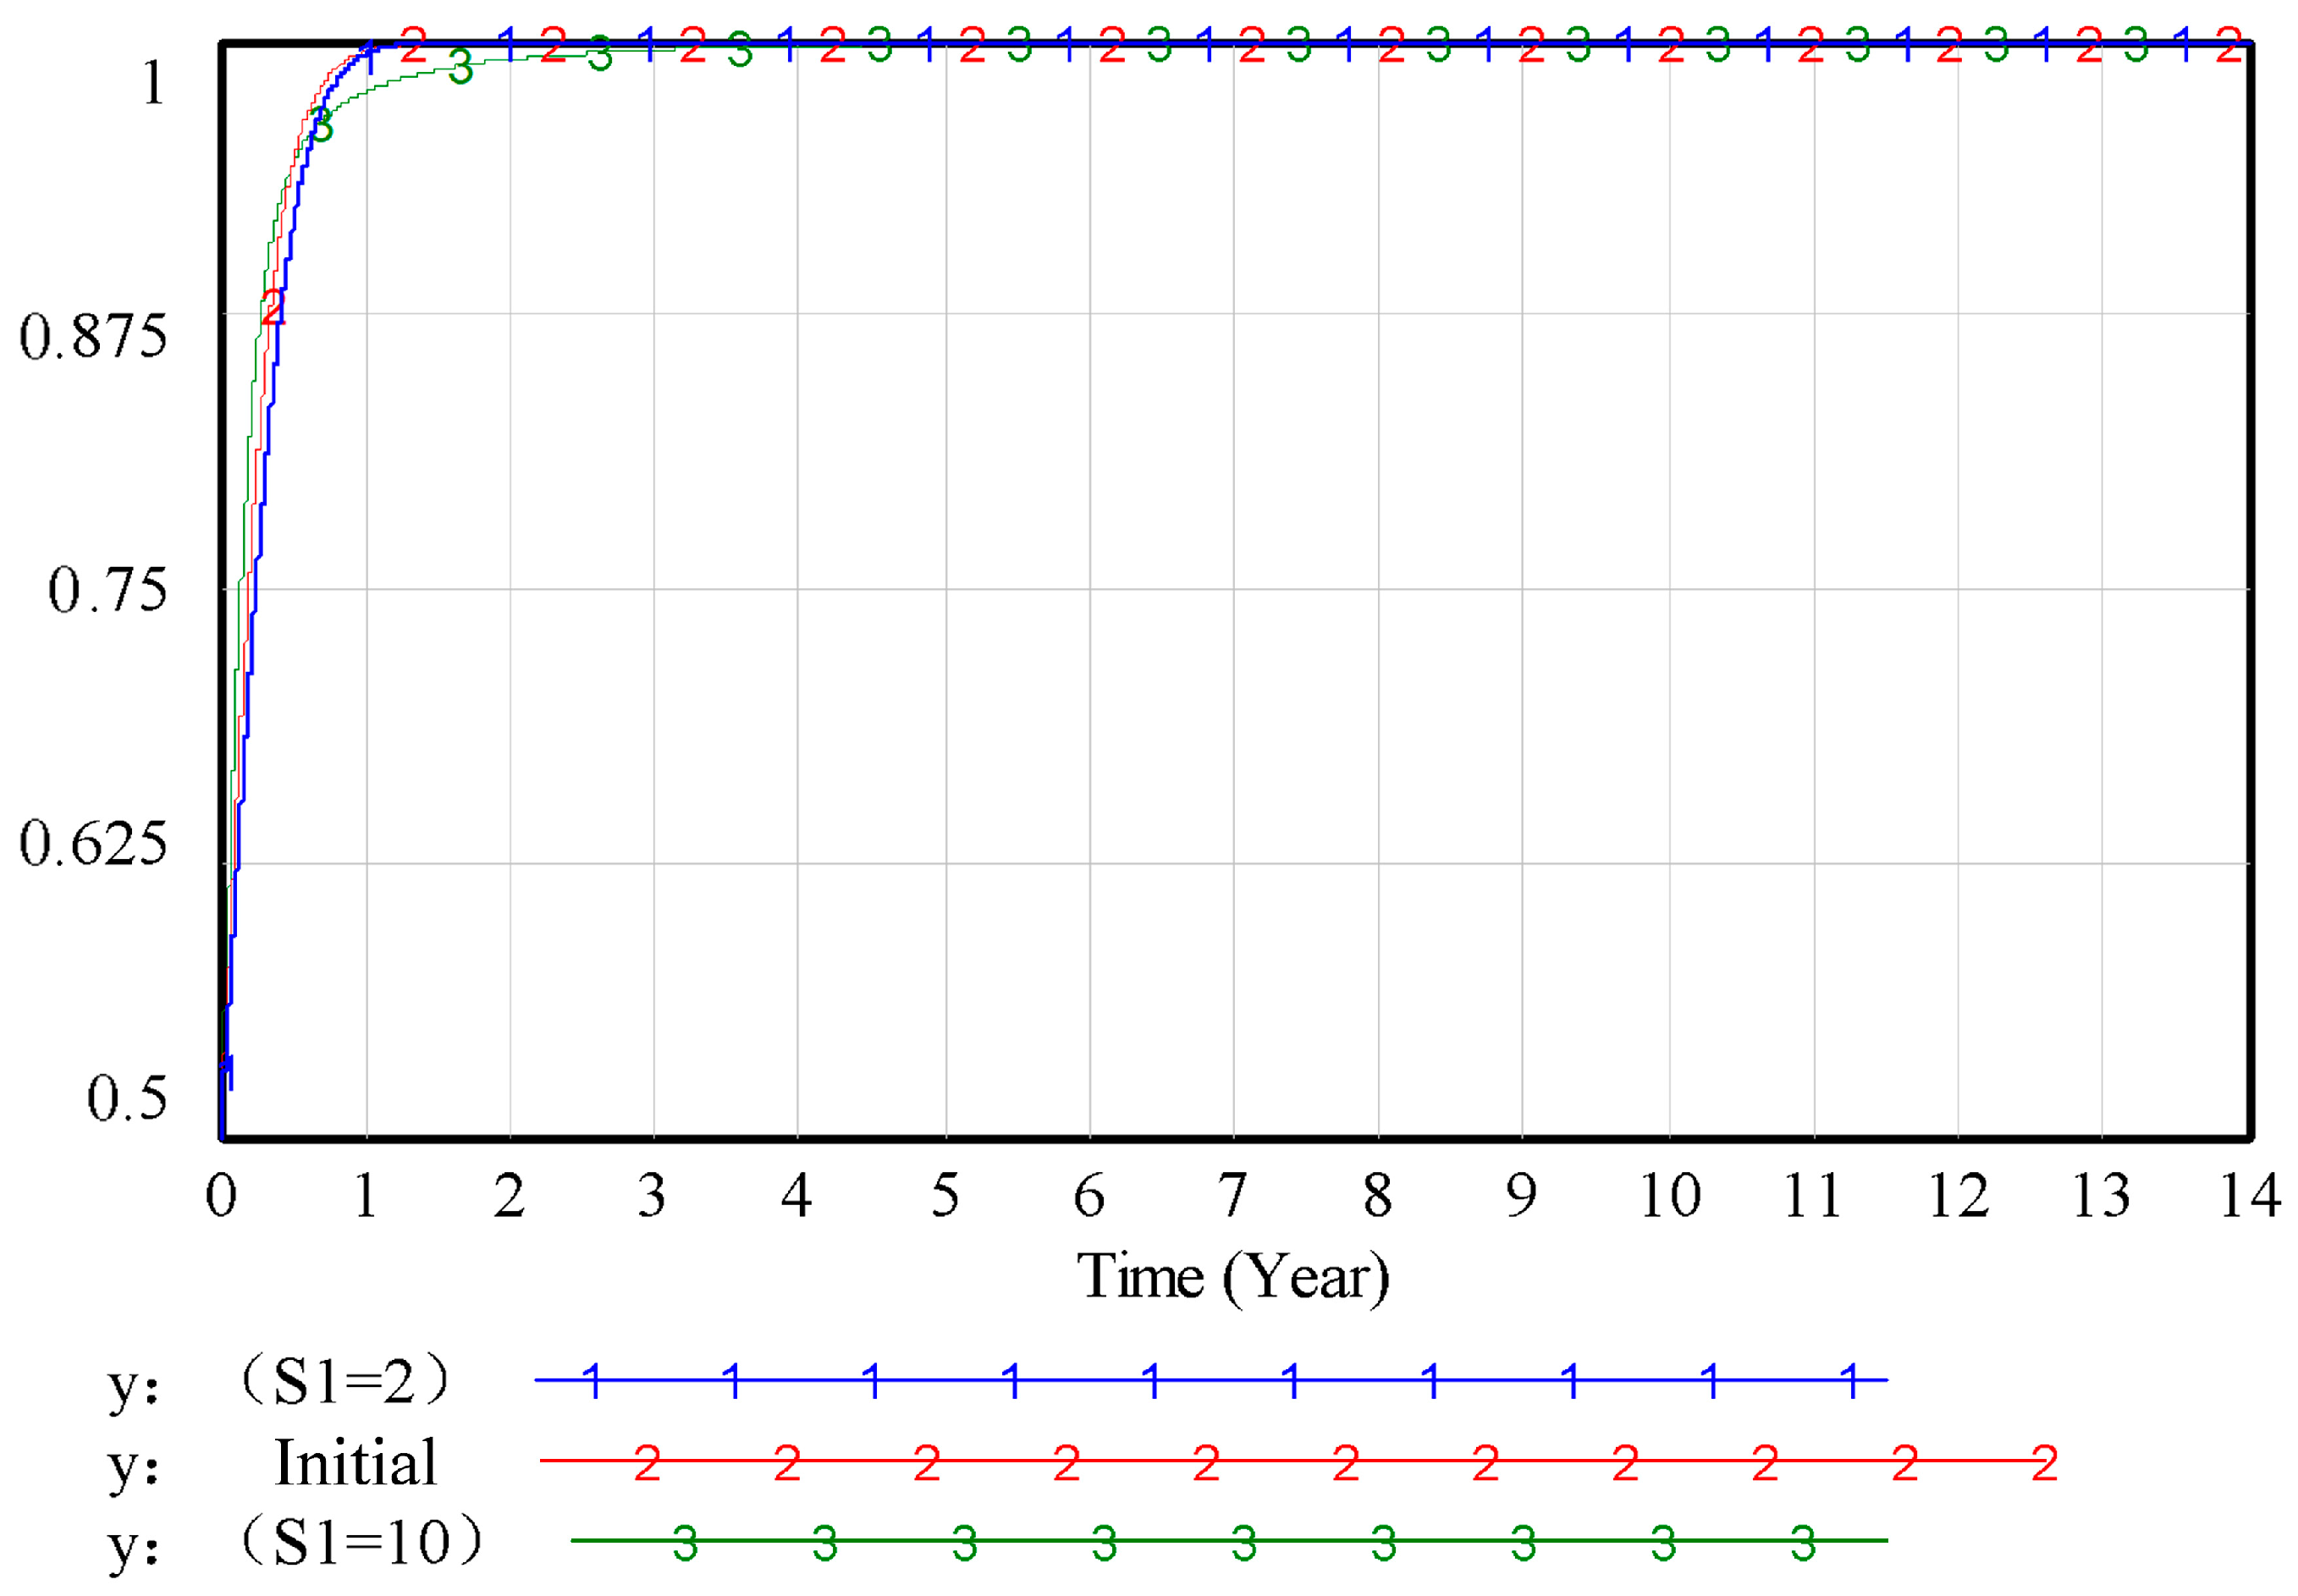
As illustrated in
Figure 15, as
S1 increases, the evolutionary rate of the government’s proactive promotion strategy increases. However, at higher
S1 values in the later stages, enterprises gradually shift toward a green technology innovation strategy, at which point the government can no longer obtain revenue from imposing carbon taxes on enterprises as penalties. Consequently, the evolutionary rate of the proactive promotion strategy begins to decline again.
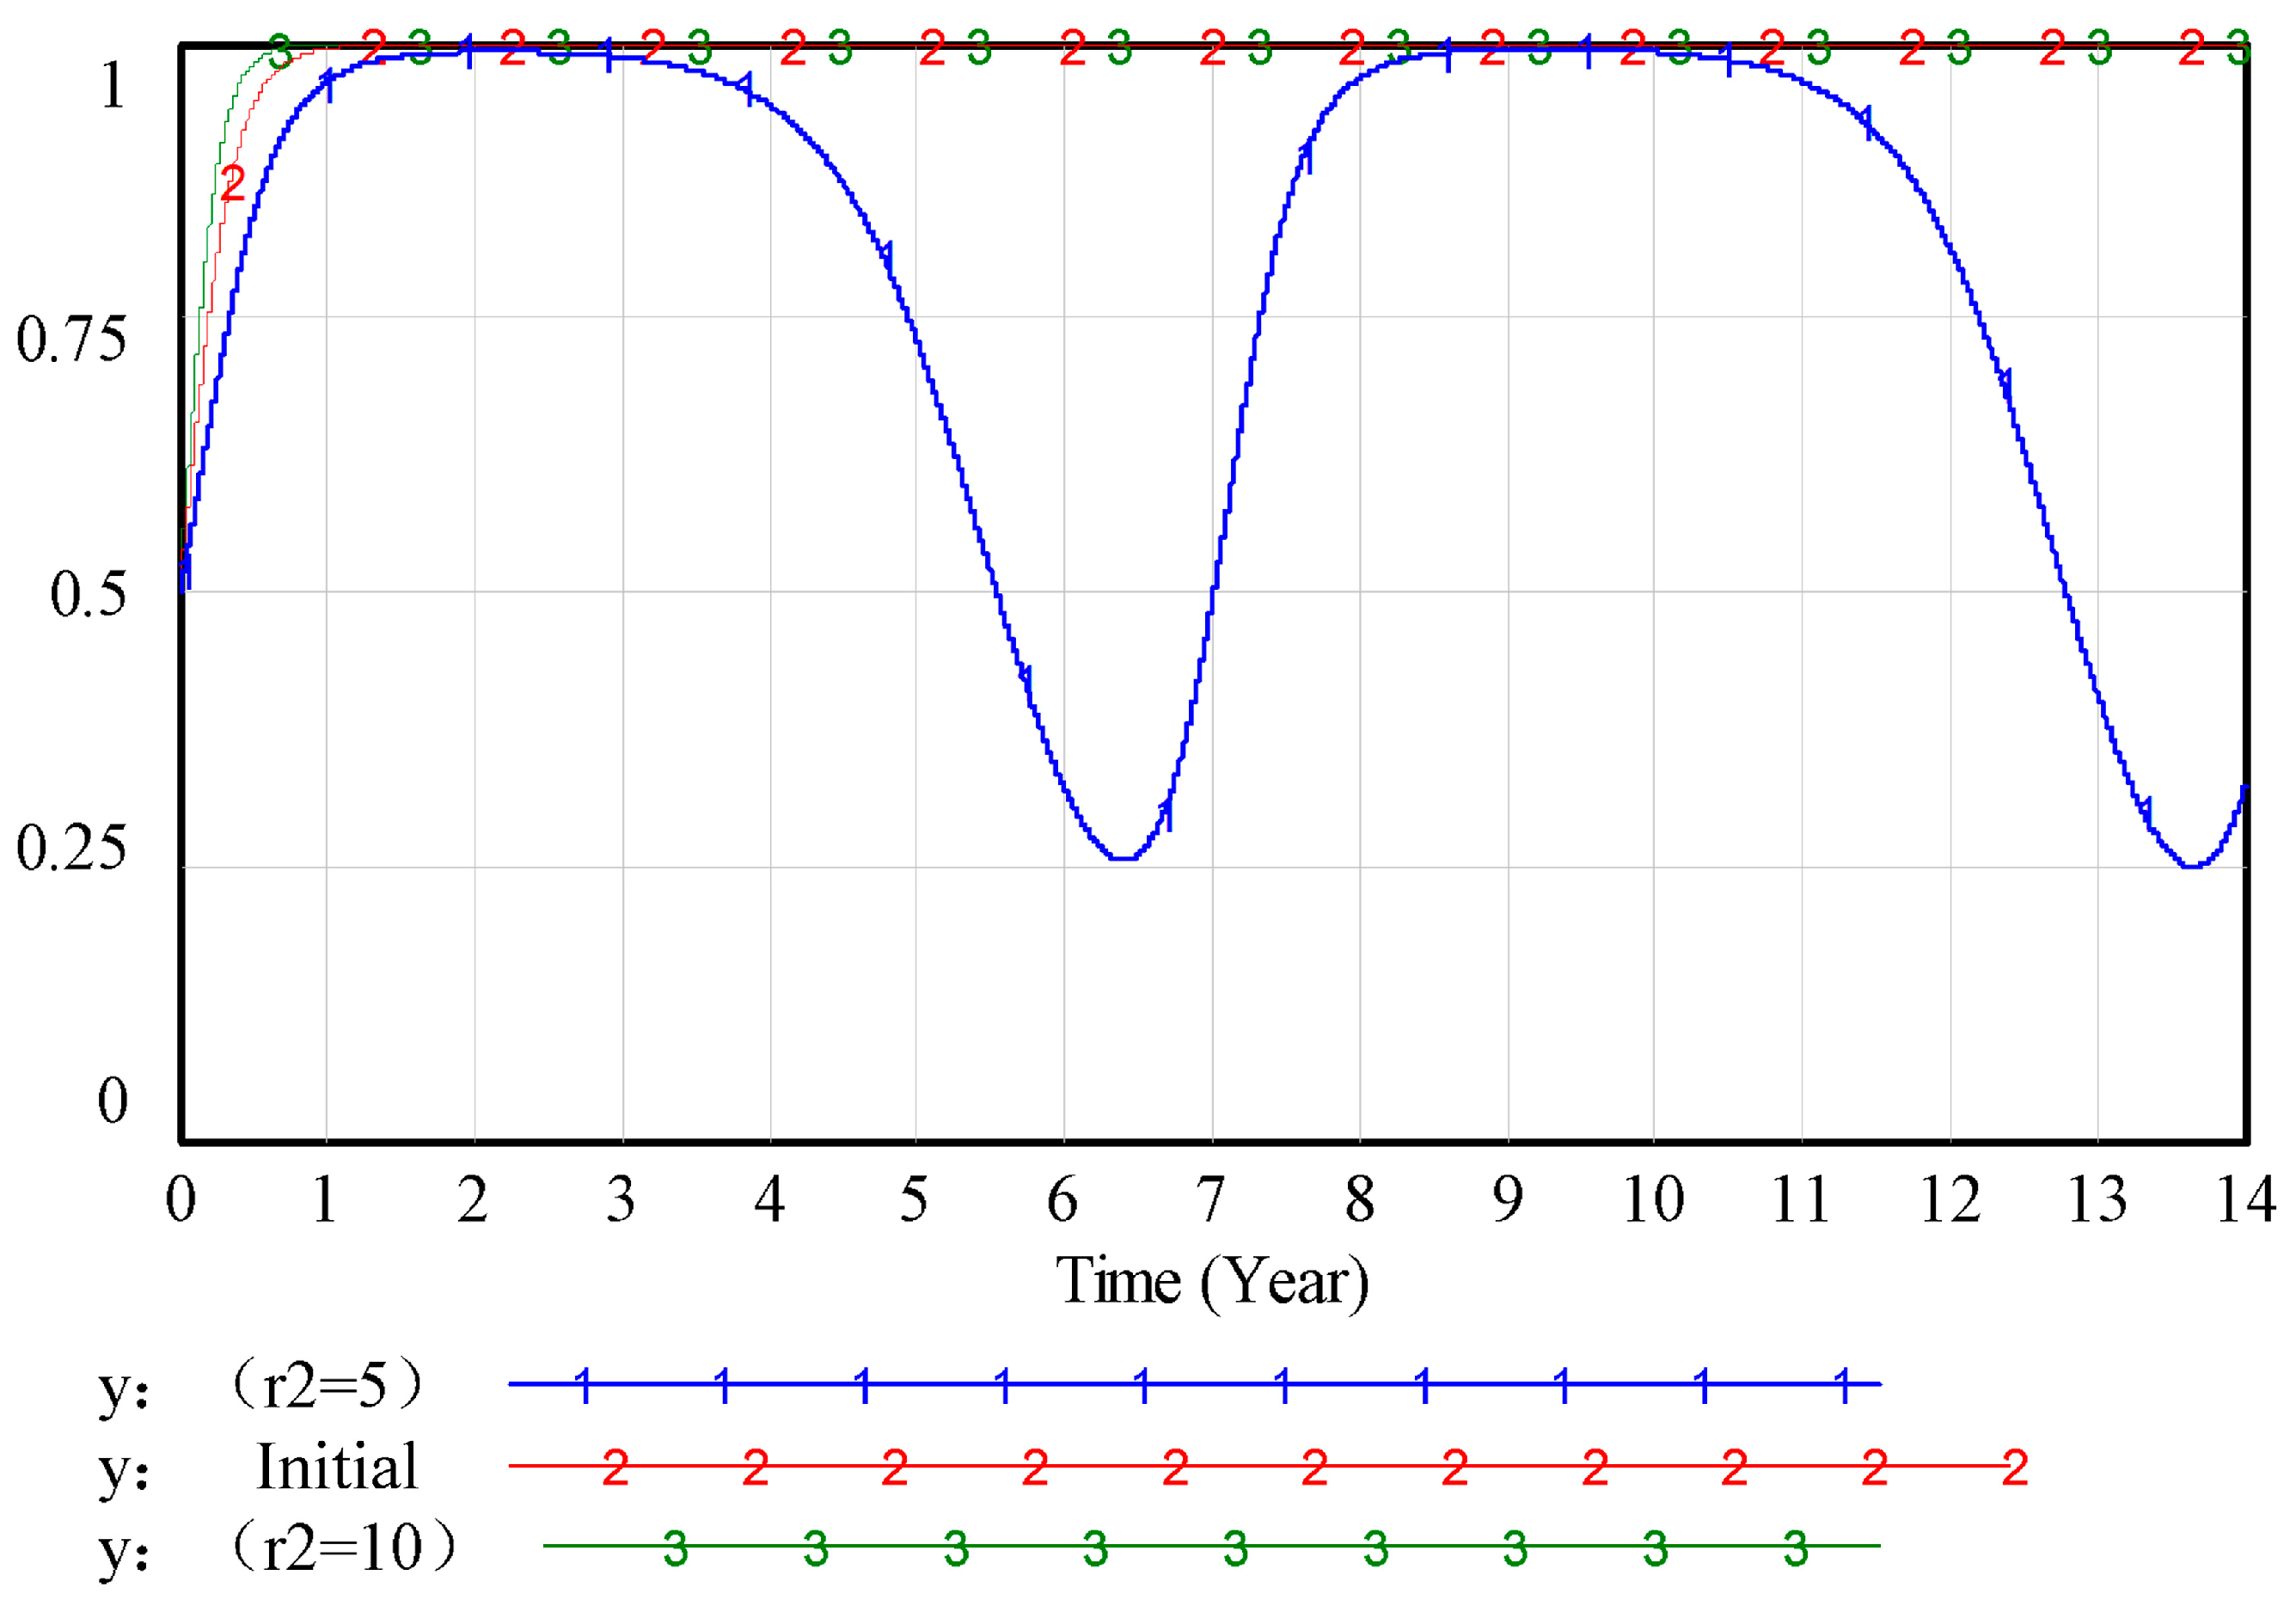
As demonstrated in
Figure 16, as
r2 increases, the evolutionary rate of the government’s proactive promotion strategies increases, underscoring how stronger institutional trust incentivizes active policy intervention. However, when
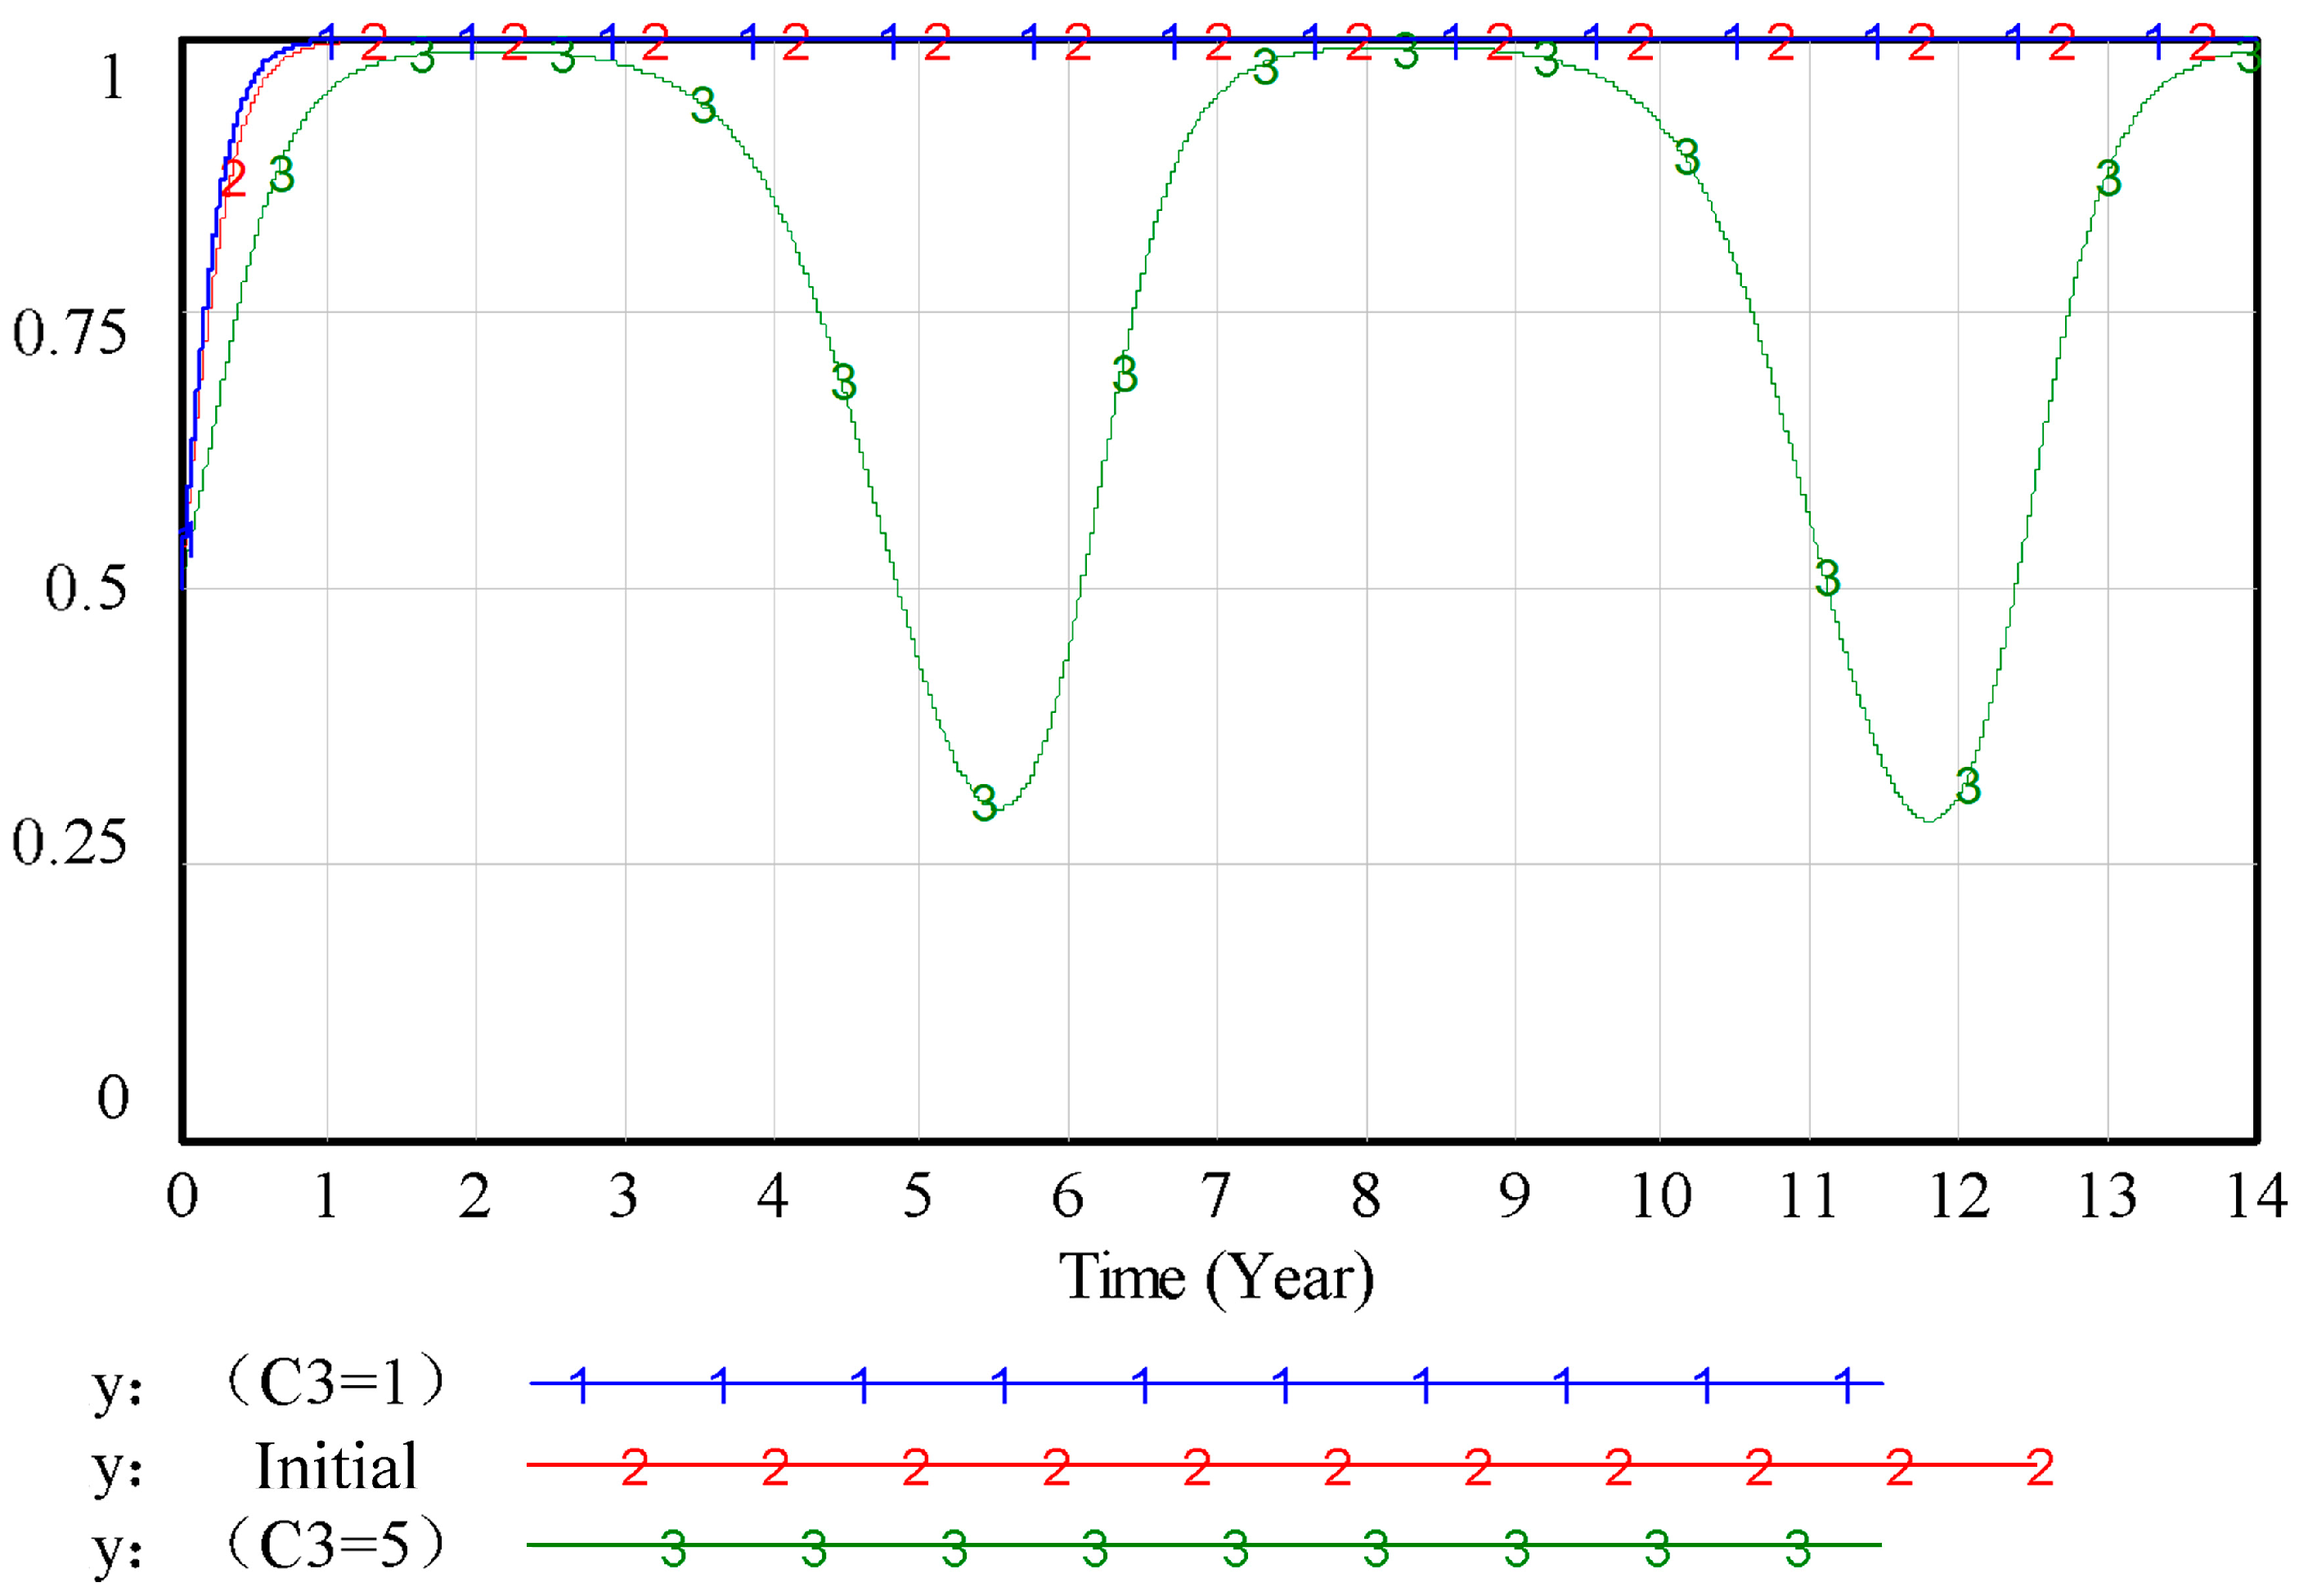
r2 drops below a critical threshold (e.g., 2), the government’s likelihood of adopting proactive measures initially peaks but subsequently declines, signaling a shift toward passive approaches. This reversal may stem from adaptive responses by construction companies and banks, which accelerate green technology adoption and green credit expansion in anticipation of or reaction to government behavior, thereby reducing the perceived necessity for sustained active promotion. Furthermore, as illustrated in
Figure 17, as
C3 increases, the government’s proactive promotion rate declines, indicating that the costs associated with proactive promotion have an inhibitory effect on the government′s choice of proactive promotion strategies.
- (3)
Analysis of the Impact of Bank Strategy Selection
As depicted in
Figure 18 and
Figure 19, as
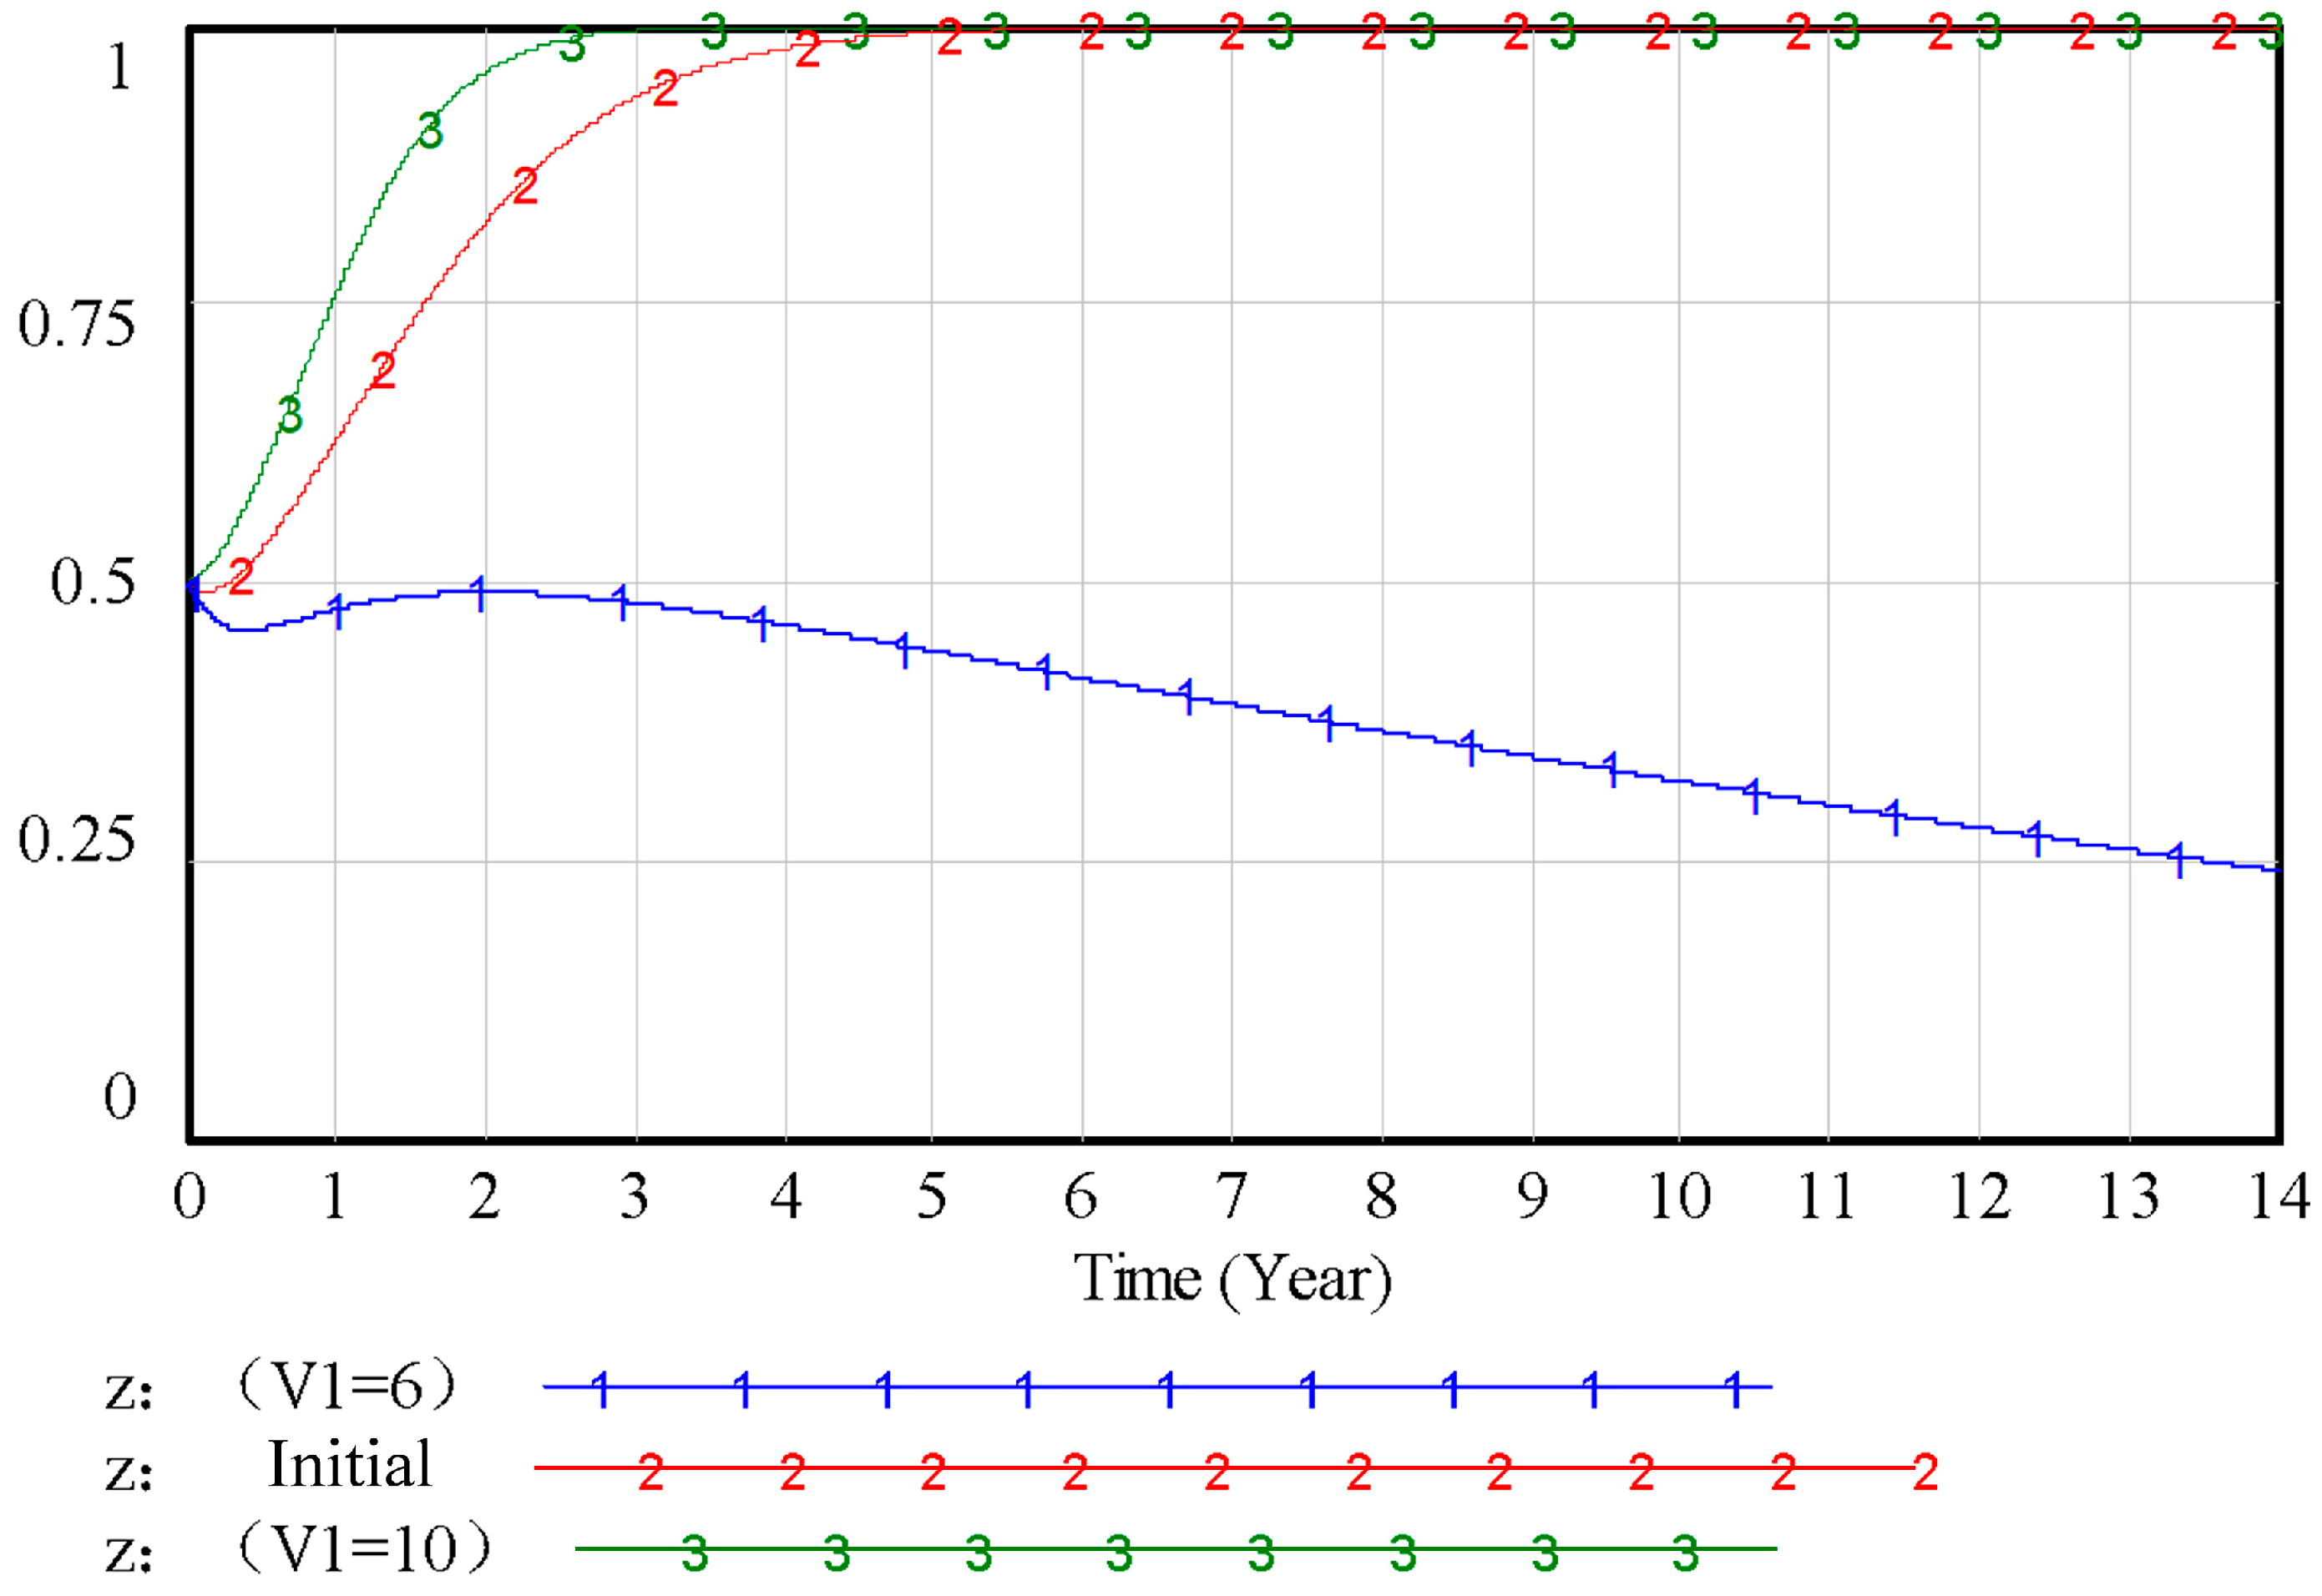
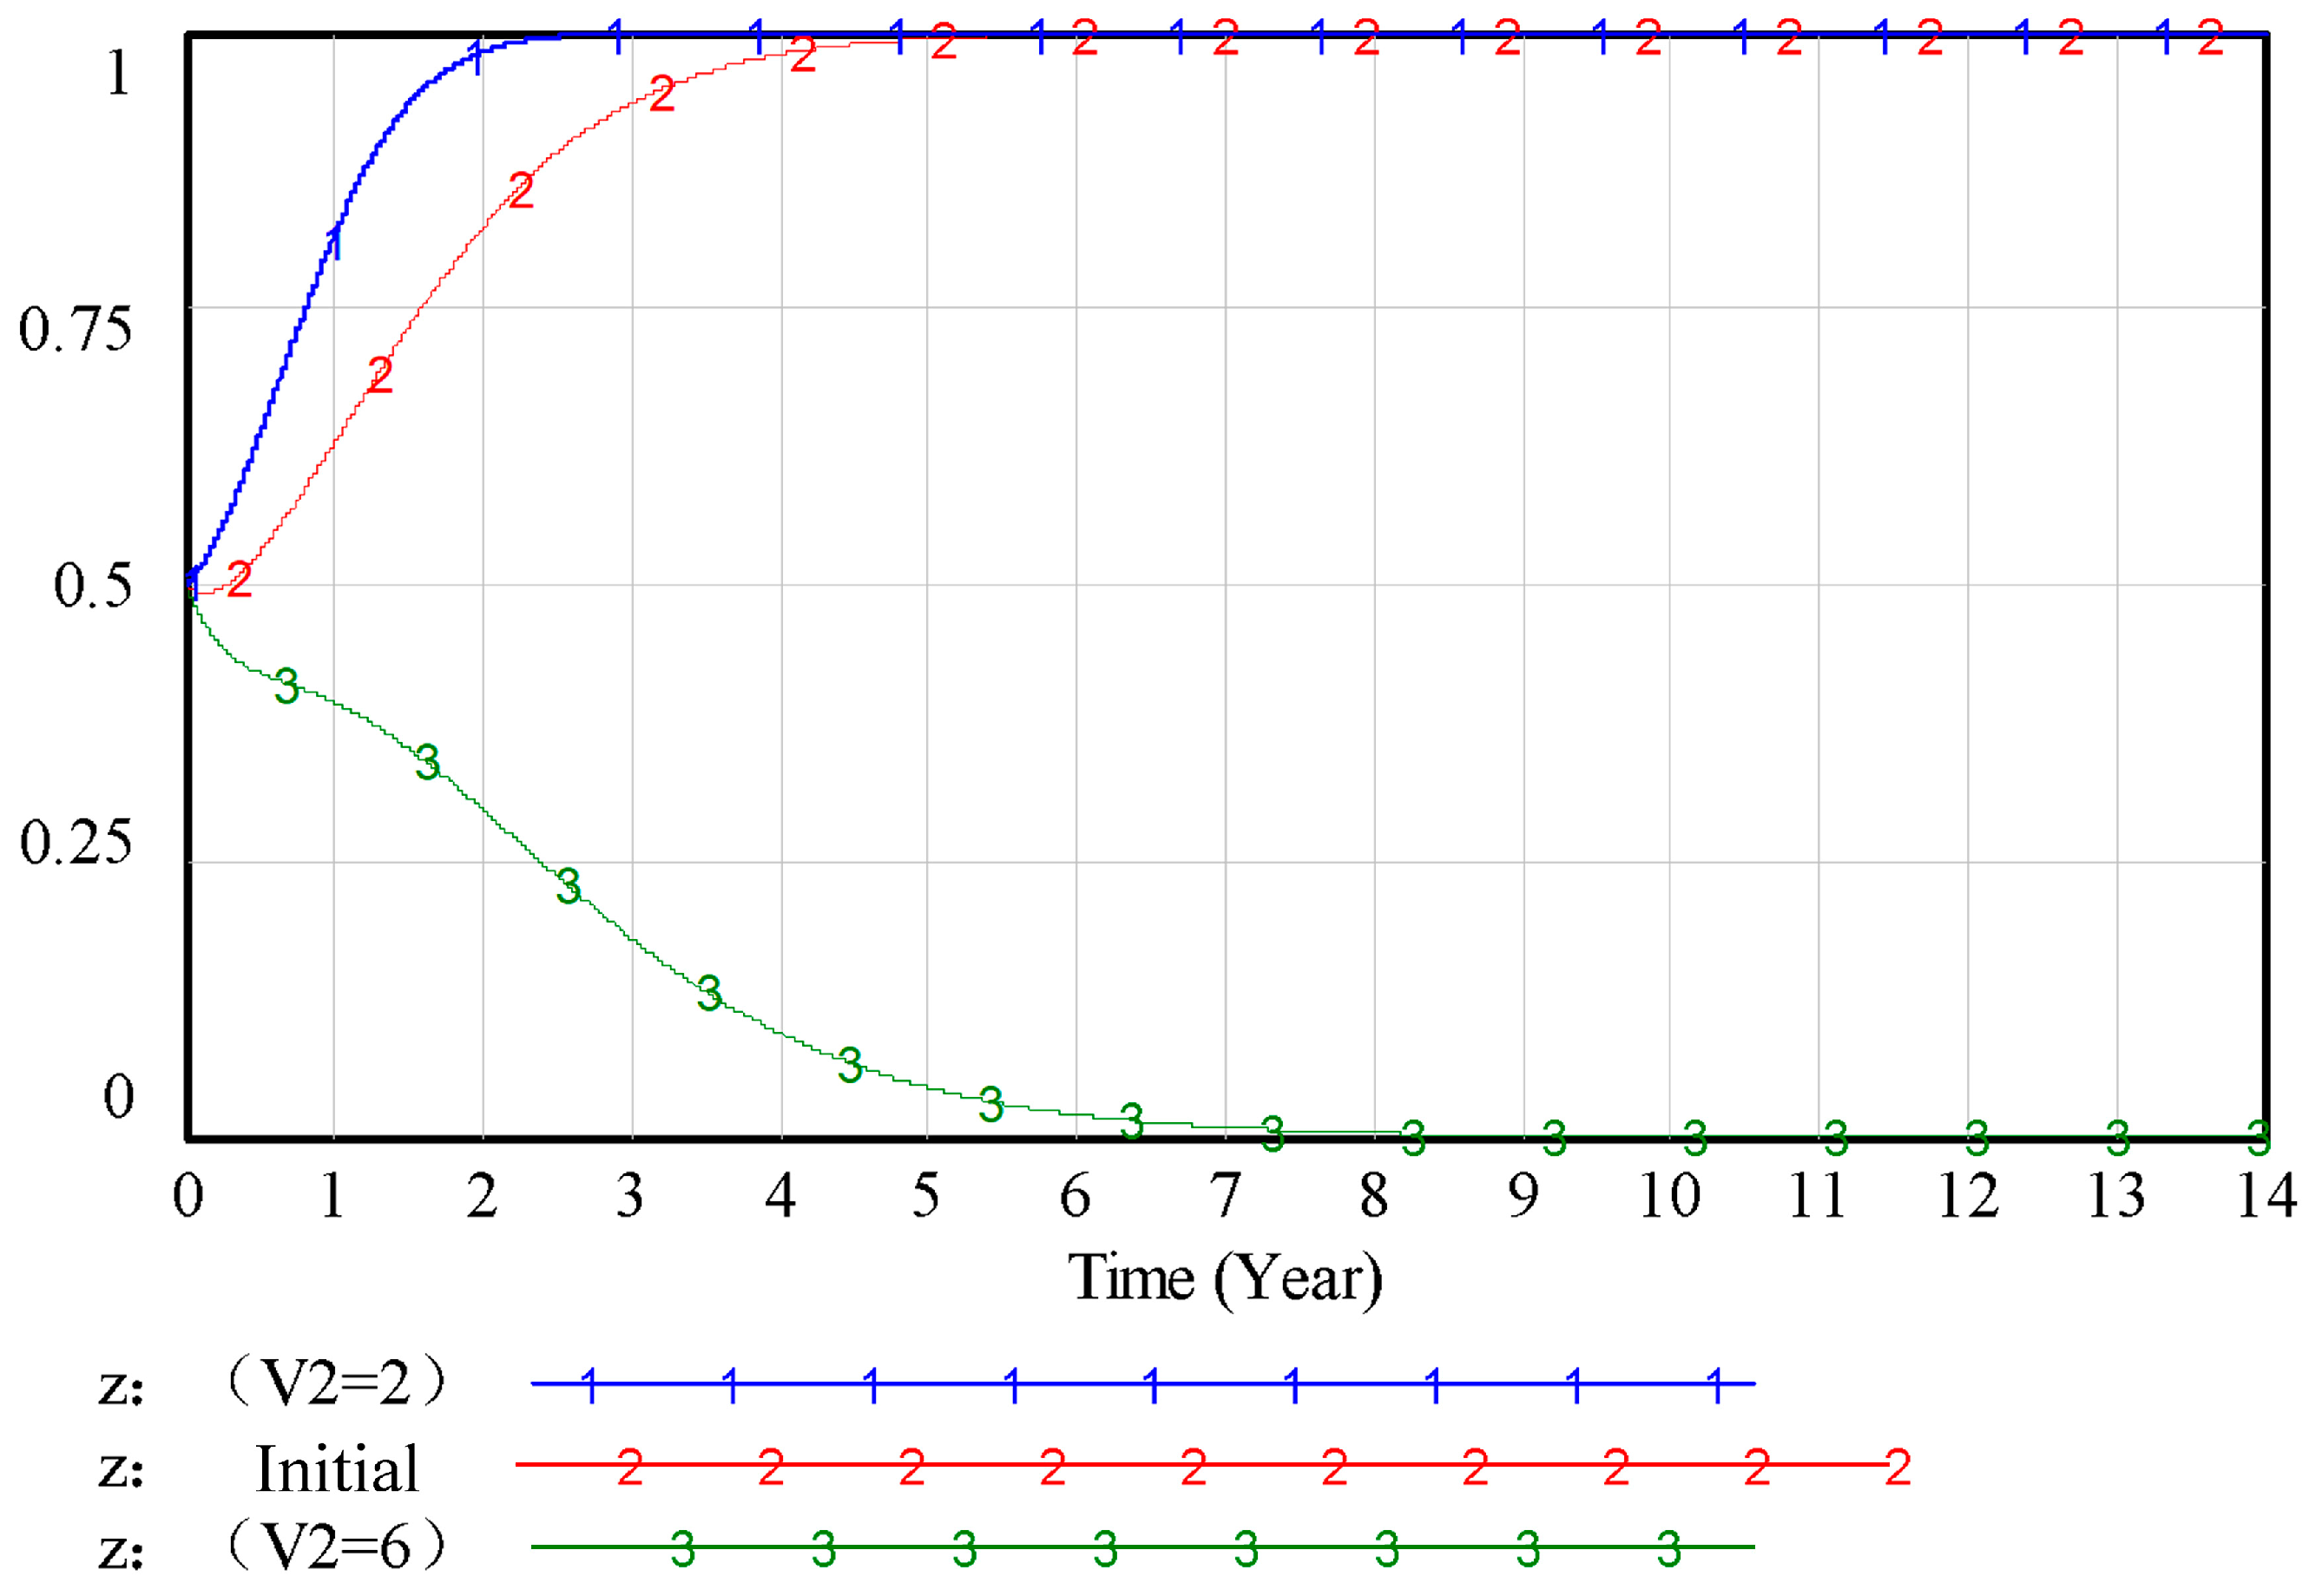
V1 increases, the rate at which banks implement green credit policies accelerates; however, as
V2 continues to increase, the rate at which banks implement green credit policies decelerates, eventually evolving into the implementation of conventional credit strategies. This suggests that rising profits from green credit policies serve as a strong incentive for banks to adopt green credit strategies, whereas increased profitability from conventional credit operations creates a disincentive, discouraging banks from shifting toward green credit initiatives.
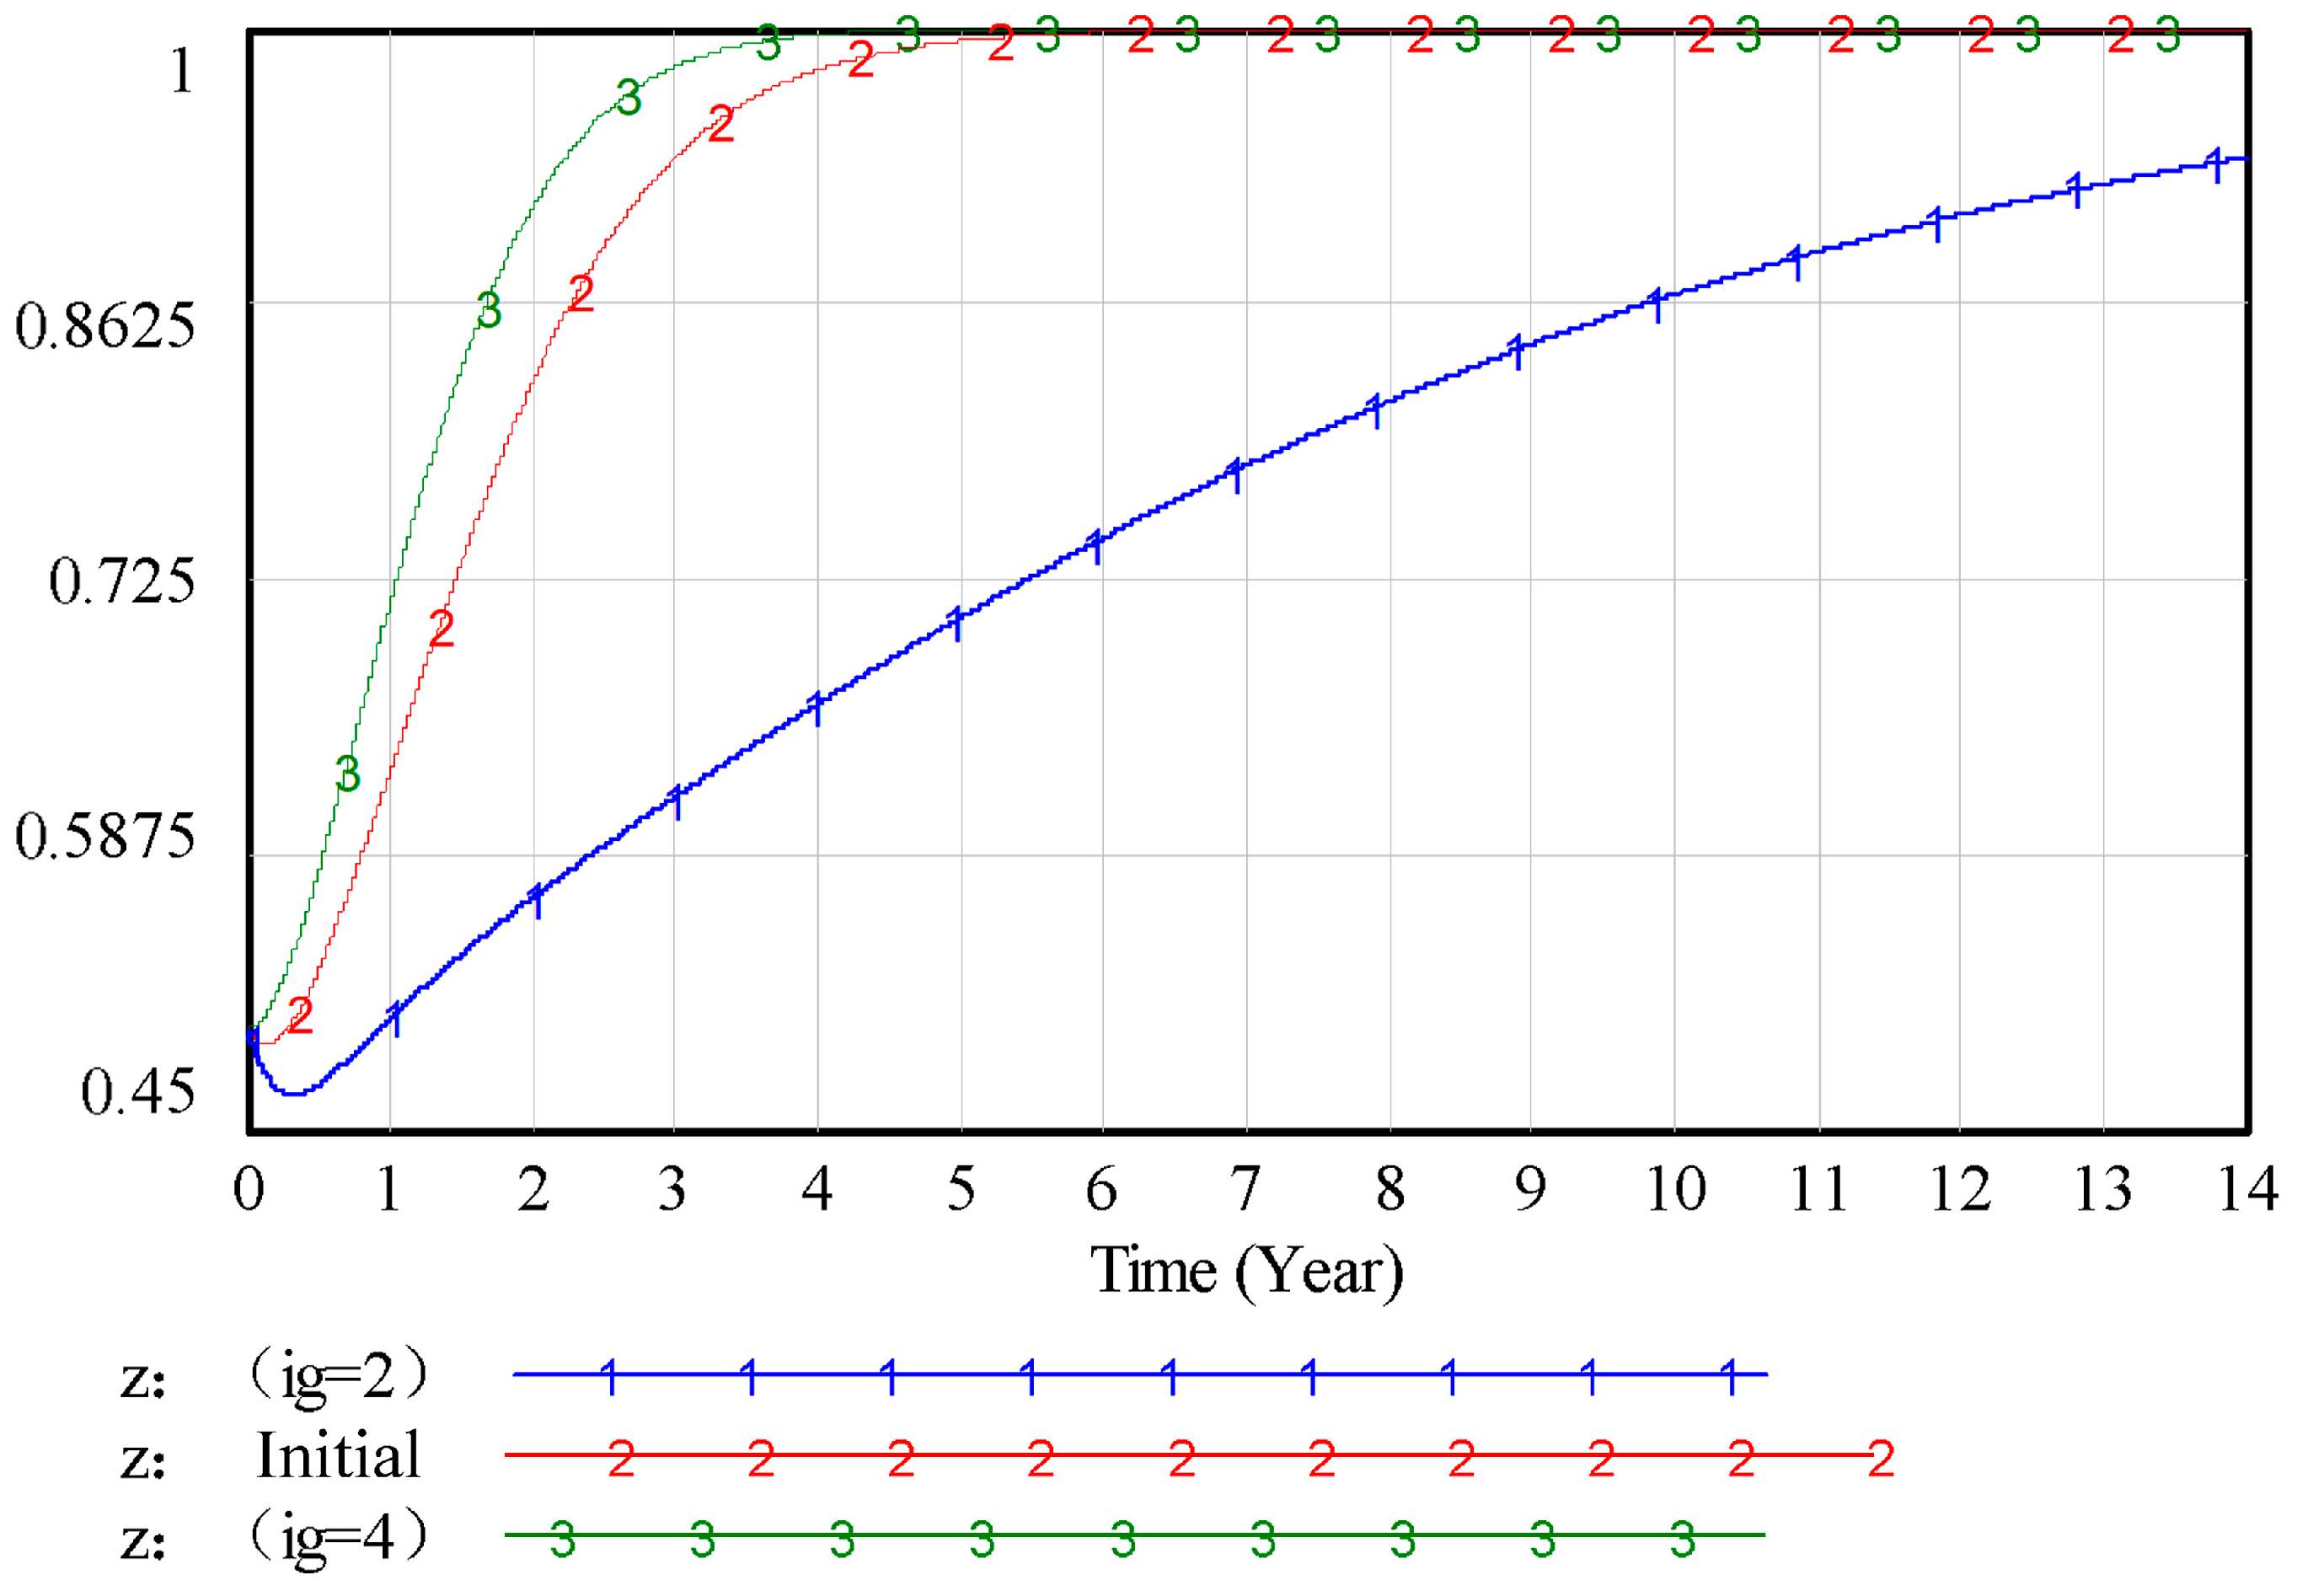
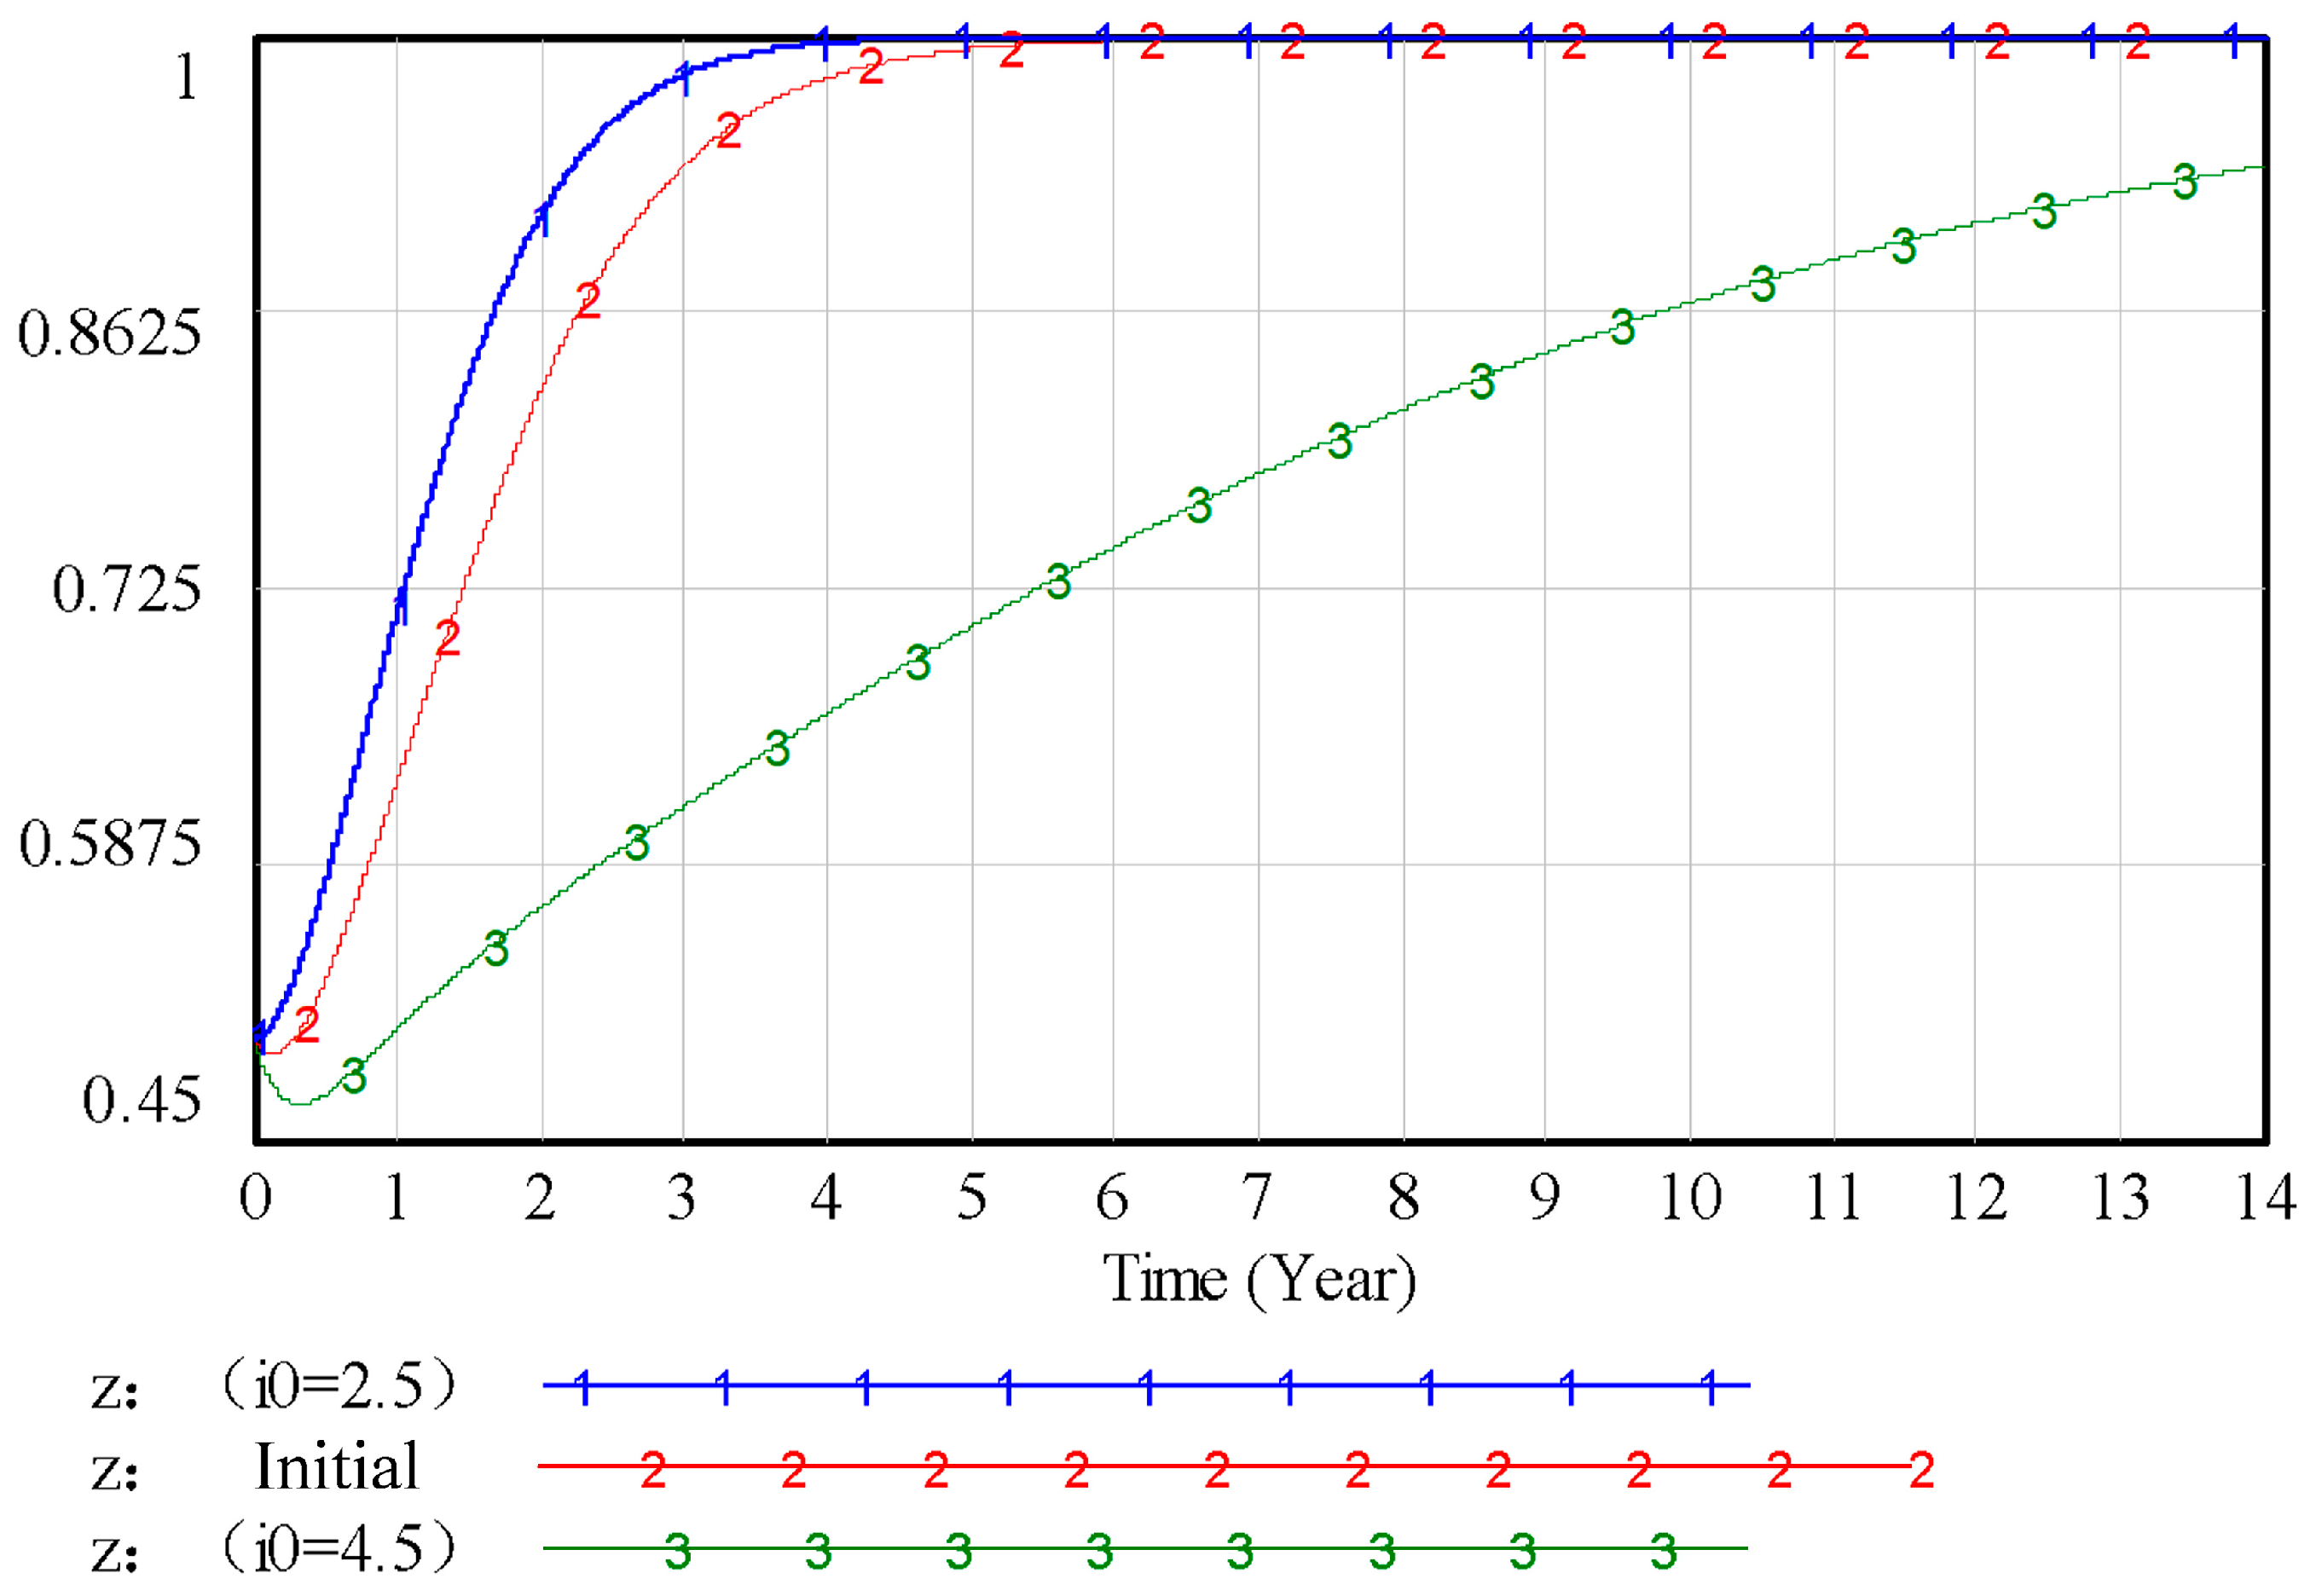
As illustrated in
Figure 20 and
Figure 21, as
i0 increases, the rate at which banks adopt green credit decreases, and the time required to reach stability increases; as
ig increases, the rate at which banks adopt green credit increases, and the time required to reach stability decreases. This suggests that an increase in total interest income derived from green credit operations incentivizes banks to adopt green credit strategies, whereas a rise in interest income from conventional credit creates a disincentive, leading banks to deprioritize green credit initiatives in favor of traditional lending approaches. As demonstrated in
Figure 22 and
Figure 23, as
E2 increases, the rate at which banks adopt green credit strategies accelerates, and the time required to reach a stable state decreases; as
C4 increases, the rate at which banks adopt green credit strategies slows down, and the time required to reach a stable state increases. This highlights the dual role of policy support in offsetting implementation barriers while underscoring how cost structures influence institutional behavior. As revealed in
Figure 24, an increase in the probability of failure of green technology innovation by construction companies ω leads to a decrease in the rate at which banks adopt green credit policies. If the success rate of green technology innovation by companies is low, banks may deem the potential returns unworthy of assuming such high risks. That is, an increase in ω inhibits banks’ evolution toward green credit strategies, and when the failure probability ω is very high, banks may directly evolve toward conventional credit strategies.
3.5. Sensitivity Testing and Equilibrium Stability Analysis
This study conducted tests from two perspectives: “single-parameter marginal impact” and “multi-parameter linkage effects.” The former involved selecting five core parameters with ±20% gradient variations to observe the evolution of the main strategy. The latter simulated typical industry scenarios to validate the stability of the (1,1,1) equilibrium (corporate innovation, government initiative, green bank lending). The results are as follows:
In single-parameter sensitivity tests: Green innovation cost (C1), baseline: 8 million yuan (range: 6.4–9.6 million yuan). A 20% cost reduction (to 6.4 million yuan) increases the probability of corporate innovation from 95% to 99%, shortening the stabilization period to 3.2 years. A 20% cost increase (to 9.6 million yuan) lowers the innovation probability to 82% and extends stabilization to 7.5 years. For every 1% change in cost, the innovation probability changes inversely by 0.75%, confirming cost as the core constraint on corporate innovation. Environmental violation fines (S1), baseline 2 million yuan (range 1.6–2.4 million yuan). A 20% reduction in fines (1.6 million yuan) lowers the innovation probability to 88%. A 20% increase in fines (2.4 million yuan) raises the innovation probability to 97%, but with diminishing marginal returns (a 5-percentage-point increase occurs between 2 million and 2.2 million yuan, 220–240 million RMB increases by only 2 percentage points), exerting minimal influence on government strategy (positive probability fluctuation ≤ 3%). Green credit interest rate (rg), baseline 3.65% (range 2.92–4.38%). A 20% reduction in interest rate (2.92%) increases bank credit probability from 92% to 98%, with corporate innovation probability rising synchronously to 98%; A 20% interest rate increase (to 4.38%) reduces credit probability to 78% and innovation probability to 85%, requiring an increase in government risk compensation (E2) from 500,000 to 700,000 yuan to reverse the decline. Each 0.1 percentage point decrease in interest rate increases credit probability by 2.1 percentage points and innovation probability by 1.8 percentage points. Green innovation subsidy (E1), baseline 3 million yuan (variable range 2.4–3.6 million yuan). A 20% subsidy increase (3.6 million yuan) raises the innovation probability to 97%, but pushes government fiscal expenditure beyond the reasonable range (3% to 4.5%); A 20% subsidy reduction (to ¥2.4 million) lowers the innovation probability to 89%. It requires a 10% penalty increase (to ¥2.2 million) to rebound to 93%, with minimal impact on bank strategy (credit probability fluctuation ≤ 2%). Innovation failure probability (ω), baseline 20% (range 16–24%). A 20% decrease in failure rate (16%) increases credit probability to 96% and innovation probability to 98%. A 20% increase in failure rate (24%) reduces credit probability to 80% and innovation probability to 83%, requiring a rate cut (3.3%) + subsidy increase (3.3 million) to recover. Failure rate impacts banks more significantly (sensitivity coefficient −1.5 vs. enterprises −1.2).
In multi-parameter joint sensitivity testing, scenarios are analyzed separately: Scenario 1: Dual increase in cost + penalty (C1 + 20%, S1 + 20%). Cost adjusted to 9.6 million, penalty adjusted to 2.4 million. Enterprise innovation probability drops from 95% to 90%, government proactive probability from 90% to 88%, and bank credit probability from 92% to 90%. The (1,1,1) equilibrium remains stable, with the “cost-penalty” linkage partially offsetting losses. In Scenario 2, interest rate increases while subsidies decrease (rg + 20%, E1 − 20%), adjusting the interest rate to 4.38% and subsidies to 2.4 million; Credit probability drops from 92% to 75%, innovation probability from 95% to 80%, and proactive probability from 90% to 85%; (1,1,1) equilibrium is unstable, but adding 300,000 in risk compensation (E3) restores equilibrium. In Scenario 3, failure rate + cost double increase + policy response (ω + 20%, C1 + 20%, E1 + 20%, rg − 10%), failure rate adjusted to 24%, cost adjusted to 9.6 million, subsidy adjusted to 3.6 million, interest rate adjusted to 3.29%; Innovation probability drops from 95% to 92%, credit probability falls from 92% to 91%, while positive probability remains stable at 89%. The (1,1,1) equilibrium remains stable as the policy mix offsets negative shocks.
Core conclusions are drawn as follows: First, single-parameter sensitivity tests reveal that green credit interest rate > innovation failure probability > green innovation cost > environmental violation fines > green innovation subsidy, with green credit interest rate and innovation failure probability being the “key levers.”. Second, the multi-parameter equilibrium boundary indicates equilibrium stability when synchronous parameter changes ≤ 15%, while changes exceeding 20% require a combination of 2–3 policies to maintain stability. Finally, regarding policy implications, a three-dimensional framework of “subsidies + interest rates + compensation + penalties” should be established to avoid reliance on a single policy.
4. Discussion of Results and Recommendations for Action
Based on the results of evolutionary game theory and system dynamics simulations concerning construction enterprises, governments, and banks during the decision-making phase of green technology innovation, the following conclusions are drawn:
- (1)
Construction enterprises, government, and banks maintain equilibrium at (1,1,1). Research on the stability and interactive logic of this tripartite strategic equilibrium confirms that (green technology innovation, proactive promotion, green credit)—i.e., (1,1,1)—constitutes the core stable equilibrium point in system evolution. Regardless of initial strategy combinations, all three parties converge toward this state. This conclusion aligns with Sun et al.’s [
9] perspective that “government incentives and financial support synergistically drive corporate green innovation,” but further refines the unique interactive mechanism in the construction industry: green innovation by construction enterprises significantly positively influences banks’ credit strategies. Conversely, when banks proactively offer green credit, it reduces the “perceived necessity” of government policy promotion, thereby inversely suppressing the government′s willingness for active intervention. This forms a progressive relationship of “enterprise—Bank autonomous coordination → Weakened government role.” This differs from the “long-term government dominance” evolutionary pattern observed in manufacturing (Li, Wan Hong et al. [
10], 2021). The reason lies in the construction sector’s large capital requirements and extended project cycles, where bank credit support exerts significantly greater influence on corporate decision-making than in manufacturing, thereby reshaping the tripartite structure.
- (2)
Simulation results reveal key factors influencing construction firms′ strategic choices: green innovation decisions are driven by the “benefit–cost-risk” triad. Variables such as green innovation benefits, traditional technology costs, and high interest rates on conventional loans positively promote innovation, while innovation costs, green credit interest rates, and innovation failure risks negatively inhibit it. This partially aligns with Wang Mannan′s conclusion that “environmental regulations drive innovation through cost pressures.” However, this study further reveals that the impact of credit interest structures on corporate decisions far exceeds expectations—a 10% increase in conventional credit interest rates boosts the probability of innovation by 1.5 times more than government subsidies. This divergence stems from the capital-intensive nature of the construction industry: compared to one-time subsidies, the sustained pressure of long-term credit costs more effectively alters firms′ long-term decision preferences. Previous manufacturing studies have largely overlooked the differentiated impact of credit structures.
- (3)
Government penalties imposed on construction firms and the benefits gained from actively pursuing enhanced international and social credibility both exert positive influence on government departments′ choice to adopt proactive strategies. Conversely, subsidies provided by government departments to construction firms and banks, along with the costs associated with proactive advancement, exert a negative influence on the government′s selection of proactive strategies. In terms of evolutionary characteristics of government and bank strategies, for governments, gains in international credibility and the severity of traditional technology penalties are the core drivers of proactive promotion. However, excessively high subsidies to firms/banks significantly weaken policy willingness. While consistent with Zou et al.’s [
11] conclusion that “government subsidies exhibit diminishing marginal utility,” this study finds that when gains in government credibility exceed subsidy costs by a specific margin, governments will maintain proactive policies even without carbon tax revenues. This indicates that Government subsidies exhibit diminishing marginal utility.” However, this study finds that when government credibility gains exceed subsidy costs by a specific multiple, governments maintain proactive policies even without carbon tax revenues. This indicates that under the “dual carbon” goals, governments′ “ecological performance aspirations” have become a key decision variable independent of economic gains. For banks, green credit returns, government subsidies, and corporate innovation success rates collectively determine their strategy. An increase in corporate innovation failure probability reduces banks′ willingness to extend green credit, primarily because the extended innovation cycle and high asset specificity of green building technologies make post-failure capital recovery significantly more challenging than in manufacturing.
- (4)
Banks are motivated to select green credit strategies by the benefits derived from successful investments in green technology innovation projects, the total interest from green credit, and government subsidies for green credit; However, the benefits from ordinary credit, the total interest from ordinary credit, the risk of construction companies’ green technology innovation failures, and the costs associated with implementing green credit business all discourage banks from pursuing green credit strategies.
We further explored the analysis of research differences and their causes, as discussed below.
Prior research frequently positions public participation as a key external variable driving enterprises’ green innovation. However, this study excluded the public dimension and still arrived at conclusions regarding a stable tripartite equilibrium. The root cause of this divergence lies in the significant professional knowledge barriers inherent in the green innovation landscape of the construction industry. The public faces challenges in directly influencing corporate decisions through consumer choices or public oversight—for instance, green building certifications require specialized professional assessments, which are difficult for non-expert members of the public to evaluate intuitively. As a result, the public’s contribution to the evolution of the green innovation system is less substantial than that of governments and banks.
By contrast, the green attributes of products in manufacturing sectors (e.g., home appliances, automobiles) are more readily perceivable by the public, leading to a higher weight assigned to the influence of public participation in relevant studies. This distinction suggests that the governance of green innovation in the construction industry should prioritize “collaboration among professional stakeholders” rather than relying on oversight from non-expert members of the public.
Existing studies on central-local government interactions highlight misalignment between the goals of central and local governments in implementing low-carbon construction policies—for example, local governments may weaken environmental requirements to prioritize economic growth. However, this study treats central and local governments as a single integrated entity without differentiation. This simplification does not compromise the core findings, as the study focuses on the decision-making phase of green innovation. During this phase, policies primarily involve central-level standard-setting (e.g., green building evaluation criteria) and financial incentive design (e.g., nationwide green credit policies), where deviations in local implementation have not yet emerged.
In contrast, research by Hu et al. [
12] centers on the “implementation phase” of green innovation, during which local governments exercise greater discretionary power in project approval and oversight—making the dynamics between central and local governments more prominent. This distinction indicates that different stages of green innovation in construction enterprises require tailored governance priorities: the decision-making phase emphasizes central policy guidance, while the implementation phase should prioritize strengthening local oversight and enforcement mechanisms.
Based on the findings, we propose the following policy recommendations and validate them.
- (1)
Further Refinement of Corporate Incentive and Penalty Mechanisms Based on Simulation Results of Enterprise Innovation Subsidies
Model simulations indicate that, among the core variables influencing construction enterprises’ decision to adopt green technological innovation, the following factors exert a positive driving effect on their innovation strategies: returns from green technological innovation (R1), costs of traditional technologies (C2), government subsidies (S1), and penalties for traditional technology adoption (T). Conversely, returns from traditional technologies (R2), costs of green innovation (C1), and green credit interest rates (I1) exert a negative inhibitory effect.
Specifically, when the condition (R1 − C1 + S1) > I1 and (C2 + T) > R2 is satisfied, the probability of enterprises engaging in green innovation increases significantly. However, if the probability of green innovation failure (p) exceeds 30%, enterprises will shift their strategic focus to non-green technologies. This risk of strategic deviation can be mitigated through the design and implementation of a dynamic penalty mechanism.
Notably, investment in green technology R&D emerges as a key constraint on construction enterprises’ innovation initiatives. To address this, governments should provide critical financial support through funding subsidies and tax incentives. Specifically, establishing dedicated funds or targeted subsidy programs to finance green technology innovation projects—particularly by offering seed capital or R&D subsidies to small and medium-sized enterprises (SMEs)—can effectively reduce initial costs and risks, thereby stimulating enterprises’ willingness to pursue green innovation. Additionally, governments can implement supportive policies such as debt extensions and opportunities for re-innovation. Through technical guidance and market-oriented incentives, governments can assist enterprises in achieving effective recovery following innovation setbacks, which in turn reduces hesitation in innovation decision-making and enhances sustained enthusiasm for green innovation.
For enterprises that continue to rely on traditional technologies, governments should impose punitive measures—including increased environmental taxes and stricter emission standards—to compel their transition to green technologies. Specifically, the environmental tax burden on construction enterprises can be progressively adjusted based on metrics such as pollutant emissions and resource consumption, thereby increasing their environmental protection costs. Meanwhile, elevating emission standards requires enterprises to meet more stringent requirements within specified timelines, forcing them to increase investment in environmental protection technologies and adopt advanced green solutions. Furthermore, restrictive measures—such as reducing or revoking eligibility for government procurement and limiting market access—should be applied to non-compliant enterprises, serving as a powerful impetus for their technological transformation and upgrading in the environmental protection domain.
- (2)
Establishment of a Bank Incentive System Based on Credit Simulation Results to Optimize Green Credit Product Structures
Banks’ green credit strategies are positively driven by three core factors: returns from green credit (Rb1), green loan interest income (I1), and government subsidies for green lending (S2). Conversely, these strategies face negative constraints from returns from conventional credit (Rb2), green credit operational costs (Cb), and the probability of corporate green innovation failure (p).
Specifically, when the conditions (Rb1 + S2 − I1 − Cb) > Rb2 and p < 25% are met, the probability of banks approving green loans exceeds 90%. However, if the government subsidy (S2) falls below 30% of banks’ green credit operational costs (Cb), banks will shift their lending focus toward conventional credit products.
To address this, governments should fully recognize banks’ pivotal role in advancing construction enterprises’ green technological innovation and design targeted incentive mechanisms to guide their green credit behavior. For banks actively providing green credit, incentives such as interest subsidies and credit rating upgrades should be offered—these measures can foster a virtuous cycle of “green lending expansion to enhanced bank reputation to increased market share.” Concretely, governments can implement two key financial support measures: first, provide dedicated subsidies for green credit projects and establish green finance development funds to reduce banks’ operational costs, enhance their green credit service capabilities, and enable them to extend loans to enterprises at more favorable interest rates (thereby alleviating corporate financing burdens); second, establish a green credit risk compensation fund. For green credit portfolios where banks’ non-performing loan (NPL) rates exceed 3%, the fund would cover 50% of the excess NPL losses. Simulation results indicate that this risk compensation mechanism could increase the volume of banks’ green credit disbursements by 30%.
Beyond financial incentives, governments should conduct regular evaluations of banks’ green credit performance, with tiered reward mechanisms based on metrics including green credit scale, intensity of support for green technologies, and effectiveness of environmental project implementation. Establishing green finance awards or industry rankings would further encourage sustained bank investment in the green credit sector. For banks that refuse to provide adequate green credit (e.g., failing to meet industry green lending benchmarks), punitive measures should be imposed—such as restricting their participation in government-led green building project loans and prioritizing other compliant banks for environmental project financing. These measures will compel non-compliant banks to recognize the strategic importance of green credit, adjust their lending policies, and enhance support for green construction projects.
Furthermore, simulation results highlight that reducing banks’ green credit operational risks and boosting their enthusiasm for green lending exert a significant positive impact on enterprises’ willingness to engage in green technological innovation. To this end, banks themselves should design more flexible and preferential green credit products tailored to the specific needs of construction enterprises, offering targeted loan solutions. For example, long-term loan tenures, installment repayment plans, and green guarantee funds can be deployed to lower construction firms’ financing costs while simultaneously reducing banks’ green credit operational costs and risk exposure. Additionally, banks can strengthen the sustainability of their green credit operations and reduce implementation costs by establishing long-term cooperative mechanisms—including forming strategic partnerships with governments and construction enterprises to jointly advance financing for green technology innovation projects. This collaborative approach helps mitigate the risks previously borne solely by banks, further stabilizing their green credit business.
- (3)
Strengthen Risk Management and Establish a Tripartite Cooperation and Coordination Mechanism Based on Simulation Results of Innovation Failure Probability
Simulation results reveal that the probability of corporate green innovation failure (p) is the sole variable exerting a negative cross-influence on the strategies of all three stakeholders (construction enterprises, banks, and governments). Specifically, an increase in p leads to a simultaneous decrease in: enterprises’ probability of engaging in green innovation, banks’ probability of extending green credit, and governments’ willingness to proactively promote green policies. By contrast, when p < 20%, the system exhibits a significantly higher tendency to converge toward the optimal (1,1,1) equilibrium (i.e., corporate innovation, bank green lending, and government proactive promotion). Additionally, excessively high government promotion costs may suppress policymakers’ willingness to implement green initiatives, highlighting the need to reduce administrative costs through targeted cooperation mechanisms.
To address these challenges, several risk mitigation and coordination measures are proposed:
First, legal and competitive risks during the innovation process can be alleviated by establishing and refining regulations governing green technology innovation—such as frameworks for green technology patent protection and intellectual property (IP) safeguards. These measures protect the outcomes of enterprises’ innovation efforts, thereby reducing the disincentives caused by IP infringement risks.
Second, industry-academia-research collaboration should be actively promoted to foster in-depth partnerships between universities, research institutions, and construction enterprises. This collaborative model shortens innovation cycles, accelerates the transfer of cutting-edge technologies from research to practice, and enhances the participation and influence of all stakeholders in green technology innovation. Ultimately, it improves the credibility of green technology projects and strengthens their market competitiveness.
Third, green procurement policies should be optimized to prioritize products and technologies with verified green attributes in public construction projects and government procurement processes. This provides construction enterprises with stable market demand for green innovations, mitigating the negative impacts of market uncertainty on their technological R&D investments.
Fourth, governments, construction enterprises, and banks should jointly establish an information-sharing mechanism to regularly exchange updates on three critical dimensions: green technology innovation progress, enterprise financing needs, and the implementation effects of green policies. This ensures all stakeholders remain well-informed about policy adjustments, market dynamics, and technological advancements—thereby improving the accuracy of their decision-making. Concurrently, the three parties should collaborate to formulate long-term plans and strategic objectives for green technology innovation, ensuring that policy implementation aligns with actual market demand.
Fifth, stakeholders should collectively establish green technology innovation platforms and cultivate a robust innovation ecosystem. These platforms facilitate resource sharing (e.g., R&D facilities, technical expertise) and synergistic development across green technology research, project design, and implementation phases. For their part, construction enterprises can set up technology transfer service platforms to enable technical exchange and cooperation among peer companies. This helps enterprises access advanced green technologies more efficiently and overcome key bottlenecks in the innovation process.
- (4)
Strengthen the Promotion of Green Technology Innovation Policies
Model results demonstrate that government credibility gains (G)—encompassing public trust in policy continuity and effectiveness—exert a significant positive influence on governments’ proactive promotion strategies: specifically, a 10% increase in G raises the probability of governments adopting proactive green promotion measures by 8%. Furthermore, enhanced public environmental awareness indirectly amplifies the social returns derived from corporate green innovation (conceptualized as an extension of R1, i.e., returns from green technological innovation), which in turn shortens the system’s convergence time toward the optimal (1,1,1) equilibrium (corporate innovation, bank green lending, government proactive promotion).
To leverage these dynamics, governments should implement the following policy promotion strategies:
First, intensify publicity and outreach efforts for green technology policies. This includes elevating public environmental awareness, enhancing international recognition of domestic green innovation achievements, and expanding the global influence of local green technological innovation. These actions not only attract more high-quality green technology projects to the region but also impose healthy competitive pressure on local construction enterprises—ultimately driving their adoption of green technological innovation.
Second, strengthen education and knowledge dissemination initiatives to raise public and market awareness of green technologies. By demystifying the environmental and economic benefits of green innovations, these efforts can enhance market acceptance of green technologies and foster broader stakeholder recognition. For green technology enterprises, this heightened awareness translates to easier access to consumer trust and approval, thereby mitigating market acceptance risks associated with new green technologies.
Third, establish targeted green consumption incentive mechanisms. Examples include green consumption subsidies (e.g., subsidies for end-users purchasing green building-related products) and green credit assessment linkages (e.g., incorporating corporate green procurement behavior into credit rating criteria). Such mechanisms encourage both consumers and businesses to prioritize green products and services in their decision-making, ultimately providing sustained market demand support for the advancement of green technological innovation.
