Abstract
Urban Heat Islands (UHIs) are intensifying under climate change, exacerbating thermal exposure risks for socially vulnerable populations. While the role of urban environmental features in shaping UHI patterns is well recognized, their differential impacts on diverse social groups remain underexplored—limiting the development of equitable, context-sensitive mitigation strategies. To address this challenge, we employ an interpretable ensemble machine learning framework to quantify how vegetation, water proximity, and built form influence UHI exposure across social strata and simulate the outcomes of alternative urban interventions. Drawing on data from 1660Dissemination Areas in Vancouver, we model UHI across seasonal and diurnal contexts, integrating environmental variables with socio-demographic indicators to evaluate both thermal and equity outcomes. Our ensemble AutoML framework demonstrates strong predictive accuracy across these contexts (R2 up to 0.79), providing reliable estimates of UHI dynamics. Results reveal that increasing vegetation cover consistently delivers the strongest cooling benefits (up to 2.95 °C) while advancing social equity, though fairness improvements become consistent only when vegetation intensity exceeds 1.3 times the baseline level. Water-related features yield additional cooling of approximately 1.15–1.5 °C, whereas built-form interventions yield trade-offs between cooling efficacy and fairness. Notably, modest reductions in building coverage or road density can meaningfully enhance distributional justice with limited thermal compromise. These findings underscore the importance of tailoring mitigation strategies not only for climatic impact but also for social equity. Our study offers a scalable analytical approach for designing just and effective urban climate adaptations, advancing both environmental sustainability and inclusive urban resilience in the face of intensifying heat risks.
1. Introduction
Urban heat exposure has emerged as a critical environmental justice (EJ) concern in the context of accelerating climate change. Vulnerable populations—such as low-income, racialized, and socially disadvantaged groups—often face disproportionate exposure to extreme urban temperatures due to systemic inequalities in land use, housing, and infrastructure planning [1,2,3]. In many urban areas, these groups are more likely to live in neighborhoods with fewer trees, higher building density, and limited access to cooling infrastructure, which exacerbates their vulnerability during heat events [4,5,6,7]. Such environmental disadvantages are frequently coupled with social and economic stressors, including limited mobility, healthcare access, and adaptive capacity [2,8,9]. These conditions not only increase direct exposure to heat but also reduce the ability to respond effectively. These inequities are particularly pronounced in metropolitan areas where the Urban Heat Island (UHI) effect amplifies baseline climate stress, threatening public health, social well-being, and long-term urban resilience.
Prior research has made important strides in documenting the unequal distribution of UHI exposure across socio-demographic groups [5,8,10]. Studies have consistently shown that heat risk is strongly associated with neighborhood-level social vulnerability, where low-income and minority communities tend to reside in areas with limited vegetation, higher impervious surface coverage, and insufficient cooling infrastructure [5,6,11]. For instance, Voelkel et al. [12] and Chakraborty et al. [4] demonstrated that UHI intensity correlates with patterns of residential segregation and historical planning inequities, resulting in higher heat exposure for marginalized populations. Similar findings have been reported in cities across North America and Europe, highlighting that these disparities persist even after accounting for population density and urban morphology [13,14]. However, existing studies remain largely descriptive, emphasizing correlations rather than causal mechanisms [15,16,17,18]. This limitation constrains our understanding of why and under what conditions certain environmental configurations exacerbate or mitigate urban heat. Most prior research has also focused on static associations within single time frames, overlooking the temporal variability of UHI and the shifting vulnerability of populations across diurnal and seasonal cycles [19,20,21,22]. Such oversimplification risks producing incomplete or even misleading policy guidance, since interventions effective under one climatic condition may fail to deliver comparable or equitable benefits under another.
Two critical gaps therefore remain. First, while several studies have examined the correlates of UHI intensity, few have systematically quantified the relative influence of specific environmental determinants such as vegetation, built form, and water proximity across temporal and seasonal contexts [13,14]. Without such insight, planners cannot identify which urban features offer the greatest leverage for mitigating heat exposure, limiting evidence-based prioritization. Second, limited research has explored how environmental characteristics interact with social vulnerability to generate differentiated impacts, or whether built-environment interventions can jointly enhance cooling efficiency and distributive equity [9,13]. This knowledge gap constrains the development of fair and adaptive urban strategies.
Beyond these empirical limitations, conventional statistical models often rely on linear and independent assumptions, which fail to capture the complex and context-dependent interactions among urban morphology, vegetation, and microclimate. As a result, key mechanisms such as shading, airflow, and land–water interactions remain underrepresented in existing analyses, obscuring the multidimensional dynamics of urban heat.
Recent advances in interpretable machine learning (ML) offer new opportunities to unpack the complex, non-linear interactions among environmental predictors and social variables [23,24,25]. By integrating high-resolution spatial datasets, ML models can capture non-linear relationships and higher-order interactions between environmental features and socio-demographic variables—patterns that are often difficult to detect using traditional statistical methods [17,26,27]. This is particularly valuable in urban heat studies, where the drivers of thermal exposure are both context-dependent and interrelated across scales [17,26]. ML frameworks also enable flexible prediction across multiple temporal and seasonal scenarios, allowing for consistent comparison of environmental influences under varying conditions [18,28]. Importantly, these models support counterfactual simulations, making it possible to estimate how specific interventions (e.g., increased vegetation or reduced building density) might alter heat exposure outcomes for different population groups [18,27]. Such data-driven simulation capabilities are particularly critical for advancing environmental justice, as they enable an explicit evaluation of trade-offs between cooling benefits and fairness outcomes—an area where current planning practice remains largely assumption-driven rather than evidence-based.
Consequently, viewing the above challenges, this study addresses these gaps by developing a data-driven, fairness-oriented analysis of UHI exposure in Vancouver, Canada. Specifically, we construct a multi-scenario modeling framework to predict UHI intensity across 1660 Dissemination Areas using seven environmental features and evaluate their distributional impacts across four social vulnerability dimensions. We employ AutoGluon—a high-performance Automated Machine Learning (AutoML) framework—to build ensemble-based regression models across four seasonal-temporal scenarios: Summer Daytime, Summer Nighttime, Winter Daytime, and Winter Nighttime [29]. Building on the model outputs, we simulate environmental interventions by scaling individual features and assess their cooling potential and equity implications for different social groups [23].
This research is guided by the following questions:
- RQ1: What are the most influential environmental features driving UHI intensity under different temporal and seasonal conditions?
- RQ2: Which types of environmental interventions provide the greatest cooling benefits in high-risk periods, such as summer daytime, and how do their impacts vary with intervention scale?
- RQ3: To what extent can environmental interventions reduce UHI exposure equitably across social groups?
Taken together, this study makes important contributions across theoretical, methodological, and practical domains. Theoretically, it extends the discourse on environmental justice by examining how urban form interacts with social vulnerability to shape differential heat exposure, revealing that thermal inequities are not only socioeconomic but also spatially embedded. Methodologically, it introduces a scalable, interpretable ensemble machine learning framework that integrates high-resolution environmental and demographic data to predict UHI patterns and simulate targeted interventions—advancing a reproducible and flexible toolkit for urban climate modeling. Practically, the study offers actionable insights for equity-sensitive urban planning by identifying which environmental strategies—such as greening and road network adjustments—can deliver both maximum cooling and distributive fairness. This integrated approach lays a foundation for data-driven, socially just, and climate-resilient urban adaptation.
2. Dataset and Methodology
The primary objective of this study is to develop a data-driven framework to quantify the determinants of Urban Heat Island (UHI) exposure and evaluate the equity implications of mitigation strategies. Specifically, we aim to predict UHI intensity under varying seasonal and diurnal conditions, identify the most influential environmental features, and simulate intervention scenarios to assess both cooling effectiveness and social fairness.
To achieve this, the methodology integrates multiple components: (i) the construction of UHI labels for four representative scenarios—Summer Daytime (SD), Summer Nighttime (SN), Winter Daytime (WD), and Winter Nighttime (WN)—using satellite-derived land surface temperature [30]; (ii) the compilation of environmental predictors (e.g., vegetation index, hydrological proximity, road and POI density, and built-form attributes) and socio-demographic indicators representing population vulnerability [31]; (iii) the application of an ensemble-based AutoML framework (AutoGluon) for UHI prediction and feature importance analysis; and (iv) scenario-based simulations to estimate the cooling potential of scaled interventions (0–2×) across seven environmental features. These simulations are further stratified by socio-demographic groups to quantify disparities in benefits, providing an evidence base for equitable adaptation strategies.
Figure 1 illustrates the overall research workflow. The process begins with data acquisition and feature engineering, followed by model training and evaluation across four seasonal–diurnal contexts. Feature importance analysis addresses RQ1 by revealing the key environmental drivers of UHI. Subsequently, intervention simulations estimate the marginal cooling effect of environmental modifications (RQ2) and examine the distributional equity of benefits among vulnerable and non-vulnerable populations (RQ3). This integrated approach enables the joint assessment of environmental performance and social justice trade-offs in climate adaptation planning.
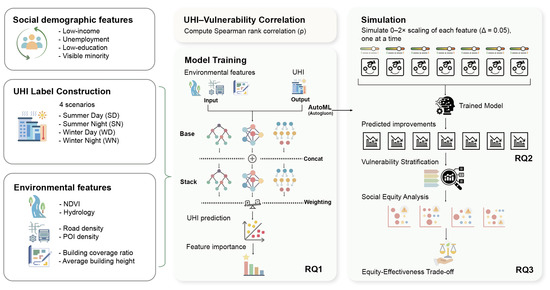
Figure 1.
Overview of the research framework. The left panel displays input features, while the center illustrates the AutoML ensemble model integrating base learners through bagging and multi-layer stacking, followed by permutation importance analysis. The right panel presents the simulation and equity evaluation process. Together, these components correspond to the three Research Questions (RQ1–RQ3).
2.1. Study Area and Data Sources
This study focuses on 1660 Dissemination Areas (DAs) in the metropolitan region of Vancouver, Canada. The city was selected due to its Mediterranean-influenced climate, characterized by hot dry summers and mild wet winters, which amplify the seasonal dynamics of the Urban Heat Island (UHI) effect. Vancouver also offers comprehensive spatial and socio-demographic datasets, and exhibits diverse urban morphologies and socioeconomic heterogeneity, making it a suitable site for examining the environmental and social determinants of UHI exposure. Various datasets are collected for the study, as shown in Table 1.

Table 1.
The collected datasets for this study.
2.1.1. UHI Label Construction
The prediction target is Urban Heat Island (UHI) intensity derived from satellite-based land surface temperature (LST). Although LST reflects surface-level thermal conditions rather than human-perceived air temperature, it remains a widely accepted and spatially consistent proxy for assessing relative heat exposure across urban areas, particularly when examining fine-scale spatial variability [29]. We computed UHI for four representative situations in 2018—Summer Daytime, Summer Nighttime, Winter Daytime, and Winter Nighttime. Pixel values were aggregated to the Dissemination Area (DA) level by averaging all pixels intersecting a DA and weighting each pixel by its overlap area with the DA polygon. The resulting DA-level UHI values are expressed in degrees Celsius [4]. All DAs were retained as observations in a continuous regression setting rather than a hotspot classification task.
2.1.2. Environmental Features (7)
We constructed seven neighborhood-scale predictors capturing land surface, built form, and blue–green infrastructure:
- BCR: The share of a DA’s area that is covered by building footprints.
- Mean Building Height: The average building height within a DA, weighted by building footprint area so that larger buildings contribute proportionally more.
- NDVI: The mean greenness within a DA computed from Sentinel-2 imagery and summarized across all intersecting pixels using area weights.
- Distance to Nearest Watercourse: Straight-line distance from the DA centroid to the closest mapped stream or river.
- Distance to Nearest Waterbody: Straight-line distance from the DA centroid to the nearest lake or pond polygon.
- POI Density: Number of POI per square kilometer within the DA boundary, used as a proxy for human activity intensity.
- Road Density: Total length of roads within a DA normalized by its area (kilometers of road per square kilometer of land).
All spatial layers were harmonized to a common coordinate reference system (EPSG:3347). Raster-vector overlays, zonal statistics, and nearest-neighbor distance operations were used to derive DA-level summaries. These environmental features have been widely recognized in the literature as important determinants of UHI variability and heat exposure inequities [4,12,31].
All input features were normalized using Min-Max scaling:
No additional dimensionality reduction was applied in order to preserve the complete environmental and socio-demographic information contained in the dataset. Furthermore, to ensure model interpretability and reduce multicollinearity, feature selection was guided through permutation importance and correlation screening.
2.1.3. Socio-Demographic Features (4)
To characterize population vulnerability, we included four census-based indicators at the DA level, which are widely employed in environmental justice and UHI vulnerability assessments to represent dimensions of social disadvantage [21,32]:
- Unemployment Rate: Share of the labor force (15+ years) that is unemployed.
- Low-Income Share: Proportion of residents below the official low-income threshold.
- No High-School Diploma: Proportion of residents aged 25+ without a secondary school diploma.
- Visible Minority Share: Proportion of residents who self-identify as members of a visible minority group (Statistics Canada definition).
2.2. Modeling UHI via Ensemble AutoML Framework
We formalize the Urban Heat Island (UHI) prediction task as a supervised regression problem. For each Dissemination Area i, the surface UHI intensity is modeled as a function of environmental predictors:
where the following:
- is the predicted UHI intensity for area i;
- represents a p-dimensional feature vector (e.g., NDVI, building coverage, road density);
- denotes the ensemble prediction function learned by AutoGluon;
- is the residual error term;
The ensemble model F is trained using AutoGluon, a high-performance AutoML framework that integrates multiple base learners , and combines them using bagging and multi-layer stacking strategies. Specifically, the ensemble prediction is defined as
where is the optimized weight assigned to base model , obtained via internal validation.
2.2.1. Model Architecture
The base learners include the following:
- CatBoost: gradient boosting on categorical features;
- NN-Torch: fully connected neural networks;
- XT (Extremely Randomized Trees): an ensemble of decorrelated decision trees.
The AutoML pipeline uses the following:
- Bagging folds: –6, to reduce variance via bootstrap aggregation;
- Stacking levels: –2, where predictions from one level serve as inputs to the next;
- Hyperparameter optimization: automatically conducted under the ‘best’ preset configuration.
2.2.2. Training Configurations
Separate models were trained for each of the four seasonal scenarios:
Table 2 summarizes the training configurations for each scenario.
Table 2.
Training configurations for different seasonal scenarios.
All input features were normalized using Min-Max scaling as shown in Equation (1).
To ensure model interpretability and reduce multicollinearity, feature selection was guided through permutation importance and correlation screening.
2.3. Model Evaluation
We selected an ensemble AutoML framework (AutoGluon), which incorporates CatBoost, neural networks, and extremely randomized trees among others as base learners, providing a balance between interpretability, non-linear fitting capacity, and computational efficiency [17,28]. This framework enables robust and transparent modeling across heterogeneous predictors while reducing manual bias in hyperparameter tuning. Model performance was evaluated using the coefficient of determination (), which also served as the optimization objective during training in AutoGluon (eval_metric = ‘r2’) [29]. indicates the proportion of variance in UHI values that is explained by the model; values closer to 1 reflect better fit. To assess generalization, we report separate scores for the training and testing subsets for each seasonal–diurnal scenario. Feature importance was quantified with AutoGluon’s permutation-based procedure (predictor.feature_importance()). The method randomly shuffles one feature at a time and measures the resulting deterioration in model performance [29,33]. This implementation evaluates feature importance consistently across all base learners (CatBoost, NN-Torch, and XT) using the same permutation framework, rather than relying on algorithm-specific definitions such as split counts or gain-based metrics in CatBoost. The permutation approach was chosen for its model-agnostic nature and interpretability, as it directly quantifies the marginal contribution of each predictor to overall model accuracy. It returns an importance score together with the associated standard deviation, p-value, and confidence interval, enabling both ranking of predictors and assessment of their statistical robustness.
All evaluations used an 80/20 train-test split with a fixed random seed (42) to ensure reproducibility across runs. To confirm model stability, the training–testing procedure was repeated several times with randomly partitioned subsets, and the resulting values remained highly consistent across runs, showing only minimal variation (<0.02). Model regularization was achieved through AutoGluon’s ensemble mechanisms, including bagging (), multi-layer stacking (), and early stopping based on validation loss. Overfitting was further mitigated by L2 regularization in CatBoost () and by dropout () and weight decay () in neural networks.
Hyperparameter optimization was performed using pre-optimized configurations under the preset ‘best’. Key parameters included learning rates (0.02 for CatBoost, 0.0027 for neural networks), tree depth (10), and regularization coefficients determined from prior tuning experiments to maximize validation performance. These transparent and reproducible steps ensure that the ensemble modeling process is scientifically rigorous rather than a black-box procedure. For transparency, we additionally visualize performance with scatter plots of observed vs. predicted UHI and summarize feature rankings across scenarios.
2.4. Effectiveness Evaluation of Various Practice-Based Urban Development Strategy via Scenario Simulation
To evaluate the effectiveness of different environmental interventions on mitigating Urban Heat Island (UHI) intensity, we designed a scenario-based simulation framework. The objective was to quantify the cooling effect of modifying individual environmental features while keeping all other factors constant. This approach isolates the marginal contribution of each feature, enabling planners to prioritize interventions with the greatest potential impact [25,30].
2.5. Intervention Scenario Simulation
Each environmental feature (e.g., NDVI, BCR, road density) was scaled individually over a predefined intervention range:
where L represents the total intervention levels. For each level, the scaled feature vector is expressed as
where n is the total number of features, and is the scaling factor applied to feature j, while all other features remain at their baseline values.
The predictive UHI for each intervention level is then computed using the trained AutoML regression model:
where denotes the ensemble learning model [19].
2.6. Effectiveness Metric
To quantify the maximum cooling benefit of each intervention, we define the improvement metric as
where the following:
- is the predicted UHI with all features scaled to 1.0;
- represents the lowest predicted UHI across all intervention levels for feature j.
This metric captures the greatest achievable reduction in UHI intensity through scaling of a single environmental feature within the intervention range.
2.7. Social Equity Assessment
To evaluate the equity implications of environmental interventions, we simulated their effects across socio-demographic subgroups. Four vulnerability indicators were considered: low income, unemployment, low educational attainment, and visible minority status [4,6,9,32]. For each indicator, Dissemination Areas (DAs) were stratified into three vulnerability tiers—low, medium, and high—based on their empirical quantile distribution. This stratification resulted in a total of 12 subgroups for equity analysis.
2.7.1. Equity Evaluation Framework
After applying an intervention scenario, the predicted UHI values for each subgroup were computed as
where the following:
- G represents the set of DAs in subgroup g;
- denotes the feature vector for DA i under intervention level l;
- is the trained AutoML prediction model.
2.7.2. Fairness Metric
To capture the extent of disparity in cooling benefits across subgroups, we define the Max Group Difference (MGD) as
where is the number of subgroups for a given vulnerability indicator.
A lower MGD indicates greater equity, meaning UHI exposure after intervention is more evenly distributed across vulnerability groups. This metric allows us to compare interventions not only by their overall cooling effect but also by their ability to reduce socio-spatial disparities.
3. Results
3.1. Model Performance
This study applied the AutoGluon framework to predict Urban Heat Island (UHI) intensity under four temporal–seasonal scenarios: Summer Daytime (SD), Summer Nighttime (SN), Winter Daytime (WD), and Winter Nighttime (WN). The dataset of 1660 Dissemination Areas (DAs) was randomly divided into training (80%, 1328 DAs) and testing (20%, 332 DAs) subsets for each scenario. Figure 2 illustrates this partition for the Summer Daytime scenario as an example, showing that training (blue) and testing (red) areas are spatially well distributed across the study region. Similar partitions were applied for the other three scenarios.
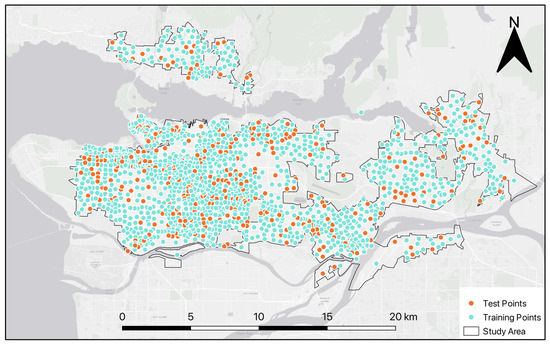
Figure 2.
Spatial distribution of training and testing subsets for the Summer Daytime scenario. Blue points represent the 1328 Dissemination Areas (80%) used for training, and red points represent the 332 areas (20%) used for testing.
Through optimized hyperparameter tuning, each model achieved a reasonable balance between predictive accuracy and computational efficiency. Table 3 summarizes the performance of the best-performing models across all scenarios. Notably, the Summer Daytime model outperformed others with a testing of 0.7873, indicating strong generalization performance.
Table 3.
Model performance under different UHI scenarios.
To further assess prediction accuracy and generalization behavior, Figure 3 presents scatter plots comparing predicted and actual UHI values across the four scenarios. The SD model shows close alignment along the 45-degree line, reflecting low residual error and robust prediction. In contrast, the SN and WD models exhibit greater dispersion, suggesting higher uncertainty and potential underfitting in more complex nighttime or seasonal conditions.
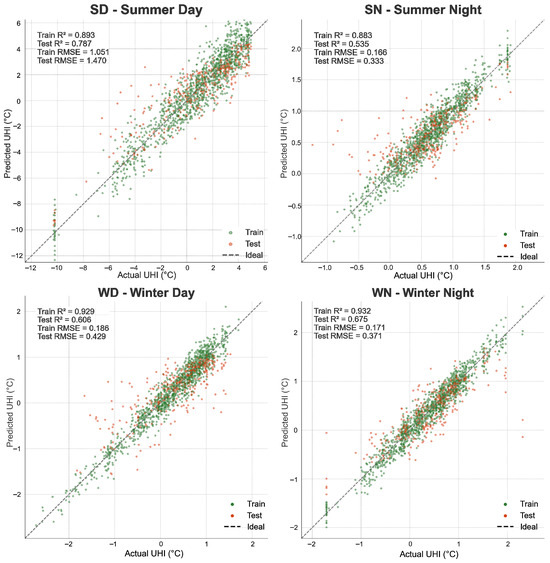
Figure 3.
Scatter plots of predicted vs. actual UHI values for training and testing data across four temporal scenarios.
The AutoML-based ensemble models exhibited varying predictive performance across the four temporal–seasonal scenarios of Urban Heat Island (UHI) intensity. The Summer Daytime (SD) model achieved the highest accuracy, with a test of 0.7873, leveraging a robust ExtraTreesMSE architecture with multi-level stacking and bagging to ensure strong generalization. In contrast, the Summer Nighttime (SN) model recorded the lowest performance (), likely reflecting the increased complexity of nighttime heat dynamics driven by thermal inertia, anthropogenic heat, and atmospheric mixing. The Winter Daytime (WD) and Winter Nighttime (WN) models demonstrated moderate accuracy ( and , respectively), with neural network-based models proving effective in capturing seasonal patterns and colder climate nuances.
These results demonstrate that our AutoML methodology can automatically tailor model architectures to diverse prediction contexts, achieving highly accurate UHI modeling and context-sensitive performance without manual tuning.
3.2. Seasonal Variations of Built Environmental Feature Contribution to UHI
To identify key environmental drivers of UHI intensity, feature importance analysis was performed across the four temporal–seasonal scenarios (see Figure 4). This comparison reveals both common influential factors and contextual variations in their relative importance.
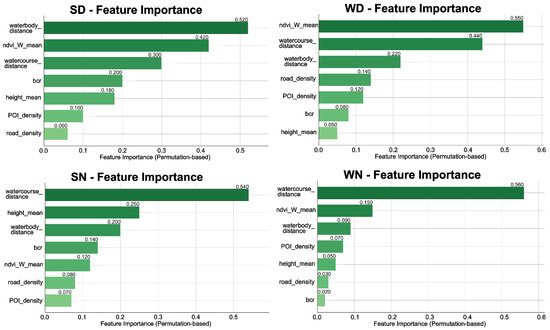
Figure 4.
Feature importance analysis across the four temporal–seasonal scenarios.
3.2.1. Investigation of Influential Factors for UHI Exposure
Seven environmental features consistently emerged as significant contributors to Urban Heat Island (UHI) predictions, though their relative importance varied across temporal and seasonal contexts. NDVI was the most or second-most important predictor across all scenarios, underscoring the critical role of vegetation cover in mitigating urban heat. BCR, a measure of urban density, also demonstrated strong predictive power, indicating its relevance to heat retention and impervious surface effects. Watercourse distance ranked among the top three features in most models, suggesting that proximity to rivers offers localized cooling benefits. Similarly, waterbody distance—representing lakes or ponds—provided complementary influence, reinforcing the cooling potential of blue infrastructure.
Other influential features included the mean building height, whose importance fluctuated across scenarios, likely due to its interactions with vertical airflow and heat transport mechanisms. POI density, a proxy for human activity and infrastructure concentration, gained prominence particularly during nighttime, reflecting its association with anthropogenic heat emissions. Lastly, road density also played a notable role, often correlating with impervious surface coverage and transportation-related heat production.
3.2.2. Variations and Consistencies in Feature Importance
To better understand the environmental determinants of UHI under varying conditions, we analyzed feature importance across the four seasonal and temporal scenarios.
Seasonal Variation
Distinct patterns emerged across summer and winter. During summer scenarios (SD and SN), water-related features—especially watercourse and waterbody distance—ranked consistently high, highlighting their strong cooling capacity in hot periods. NDVI was particularly important in Summer Daytime (SD), suggesting that vegetation-driven evapotranspiration is most effective under direct sunlight. In contrast, terrain-related features like building height gained relevance at night (SN), potentially due to their role in influencing heat dissipation after sunset. In winter scenarios (WD and WN), NDVI retained its high importance, indicating its year-round utility in cooling. However, built environment factors such as BCR were less influential, especially at night, as natural features dominated thermal behavior in colder months.
Diurnal Variation
Daytime scenarios (SD and WD) were primarily moderated by NDVI and water-related variables, demonstrating the synergistic impact of green and blue infrastructure. BCR maintained a moderate influence during daytime. At night (SN and WN), river proximity became the most influential feature, while building height and other terrain factors gained importance, likely due to their role in controlling airflow and nighttime heat retention. NDVI displayed seasonally dependent effects—less influential during Summer Nighttime (SN) but regaining importance in Winter Nighttime (WN).
Across all scenarios, several cross-cutting consistencies emerged. River proximity consistently ranked among the top features, confirming the fundamental role of water systems in regulating urban heat. NDVI’s importance varied by both season and time of day, reflecting its sensitivity to solar radiation and evapotranspiration. Built environment indicators such as BCR showed diminished relevance in winter, suggesting that natural features are more dominant under colder conditions. Terrain-related factors like height became particularly influential at night, especially during summer, due to their role in facilitating heat drainage. Overall, these findings reveal context-dependent complementarities among features, underscoring the importance of designing spatially and temporally adaptive intervention strategies for UHI mitigation.
3.3. Exploration of Disproportional UHI Exposure Across Socio-Demographic Groups
To further investigate the equity implications of urban heat exposure, we conducted a correlation analysis between UHI intensity and four selected socio-demographic indicators. This analysis provides insights into how urban heat risk is distributed across vulnerable populations and space.
These four variables—proportion of visible minority population, proportion of residents without educational certificates, proportion of low-income households, and unemployment rate—were chosen based on prior literature on environmental justice and climate vulnerability. They represent multiple dimensions of social disadvantage relevant to climate impact sensitivity, including race/ethnicity, education, income, and employment.
Socio-Demographic Patterns of UHI Exposure
Table 4 and Figure 4 summarize the Spearman correlation coefficients between UHI and socio-demographic indicators across the four scenarios. Significant variation in correlation strength and direction is observed across both time and season.
Table 4.
Spearman correlation coefficients between UHI and socio-demographic variables across scenarios.
Visible minority groups show consistently positive correlations with UHI intensity across all scenarios ( to ), with the strongest exposure during summer daytime (). This pattern, which persists into winter (), highlights systemic thermal vulnerability. Low-education groups—measured by the share of residents without a high school diploma—are also strongly associated with higher UHI during daytime in both summer () and winter (), suggesting links to poor environmental conditions in under-resourced neighborhoods.
Low-income populations display a more complex trend. They show a weak negative correlation in summer daytime (), possibly due to peripheral housing with better ventilation or vegetation. However, significant positive correlations emerge at night ( in summer, in winter), indicating elevated nighttime heat retention in low-income areas. Unemployed populations have weaker and less consistent correlations with UHI, mostly limited to daytime periods, likely reflecting indirect effects through neighborhood or housing characteristics.
Collectively, these findings reveal distinct patterns of thermal exposure across social groups, suggesting that vulnerability to urban heat is both socially and temporally stratified.
3.4. Evaluating the Cooling Efficiency and Social Equity of Urban Heat Interventions
3.4.1. Analysis of Feature-Specific Cooling Effects
Following the experimental design detailed in Section 2, we independently adjusted each environmental feature within a scale range of with a fixed step size of , while holding all other variables constant. This approach yielded 41 intervention levels per variable, allowing us to estimate marginal cooling effects and non-linear response patterns in detail.
Marginal Cooling Effects
Based on the sensitivity analysis results (see Figure 5), the effectiveness of each environmental feature in mitigating UHI varied substantially. Using the baseline scale of as a reference, we quantified the maximum cooling potential of each variable at its optimal scale.
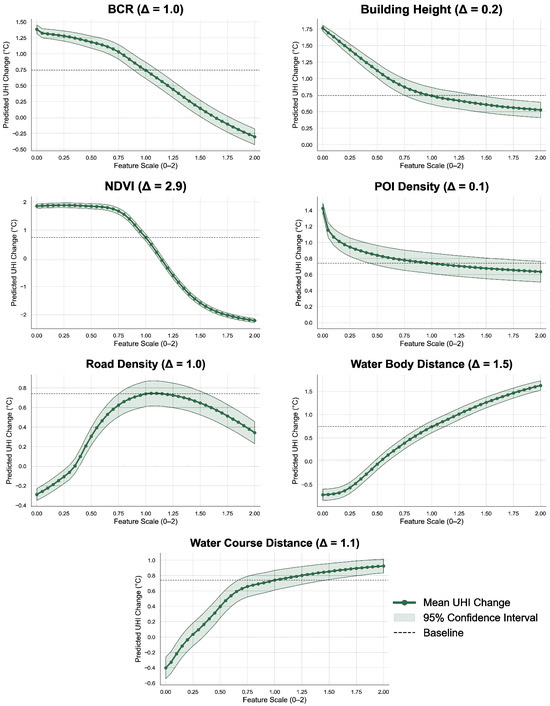
Figure 5.
Estimated marginal cooling effects across different environmental features under varying scale values. NDVI exhibits the strongest potential, while POI density shows the least.
The findings are summarized below in descending order of effectiveness: Among all strategies, greening emerged as the most effective. Specifically, NDVI delivered a cooling effect of 2.95 °C at a scale of 2.0. This finding reinforces the role of vegetation enhancement as the highest-impact intervention, capable of reducing near-surface temperatures by almost 3 °C in areas with maximal greening efforts.
Moderate-impact strategies demonstrated cooling effects between 1.0 °C and 2.0 °C. Proximity to water bodies produced a 1.46 °C reduction at a scale of 0.0, attributed to evaporative cooling. Similarly, distance to rivers yielded a 1.14 °C drop, confirming the cooling role of linear water systems, especially during summer daytime. Built environment adjustments also contributed: increasing BCR to a scale of 2.0 resulted in a 1.04 °C cooling effect, likely due to increased shading and reduced surface heat absorption. Additionally, reducing road density (scale = 0.0) led to a 1.03 °C decrease, reflecting the thermal benefits of minimizing impervious surfaces. Limited-impact strategies achieved cooling effects below 0.5 °C. Increasing building height to a scale of 2.0 provided a marginal benefit of 0.21 °C, potentially due to enhanced vertical airflow and shading. Meanwhile, increasing POI density had minimal influence, with only a 0.11 °C reduction, indicating its limited relevance in direct thermal mitigation.
Overall, the results highlight that nature-based strategies—especially greening and water-related interventions—exhibit both strong cooling potential and high efficiency. These findings provide a foundation for evaluating the equity of their distribution across social groups in the next section.
3.4.2. Disparity Analysis of Intervention Outcomes
To assess whether cooling benefits are equitably distributed across population groups, we stratified Dissemination Areas into three vulnerability tiers (low, medium, high) based on four socio-demographic variables. For each intervention simulation, we predicted UHI exposure values for each group and calculated the Maximum Group Difference (MGD) to quantify disparities.
Tertile-Based Group Analysis. Each socio-demographic variable—namely Visible Minority Proportion, No Education Certificate, Low-Income Prevalence, and Unemployment Rate—was divided into tertiles using the 33.3% and 66.7% percentiles. This stratification resulted in 12 distinct feature–group combinations for comparative analysis (see Figure 6).
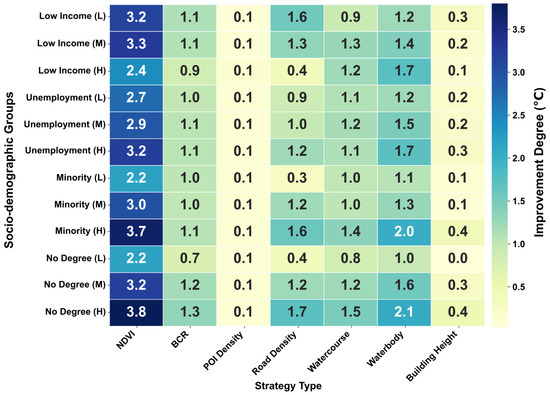
Figure 6.
UHI improvement heatmap for 12 socio-demographic groups across 7 intervention strategies (baseline scale = 1.0). Row labels show group type and level: L/M/H = Low/Medium/High proportion for each factor (Low Income, Unemployment, Minority, No Degree). Each row represents a group with a distinct vulnerability level; NDVI and water-related interventions show the most consistent and equitable benefits.
The results revealed that high-vulnerability groups, such as those with a high proportion of individuals without a diploma or a high percentage of visible minority populations, experienced the most substantial improvements under most intervention strategies. These gains were especially notable in response to NDVI enhancement and proximity-to-water interventions, suggesting that nature-based strategies yield disproportionately greater benefits for disadvantaged populations.
In contrast, low-vulnerability groups demonstrated more modest improvements, although their baseline UHI exposure levels were generally lower to begin with. This pattern suggests that while the magnitude of improvement was smaller, these populations were already less exposed to urban heat, highlighting the potential of interventions to reduce disparities in thermal exposure across socio-demographic lines.
Furthermore, to quantify the equity of benefit distribution, we define
This metric captures the largest inter-group difference in predicted UHI exposure and serves as a proxy for the equity implications of each intervention strategy.
Fairness Patterns of Interventions. Based on the heatmaps of group-level disparities for each socio-demographic variable (see Figure 7), several key patterns emerged regarding the equity implications of different intervention strategies.
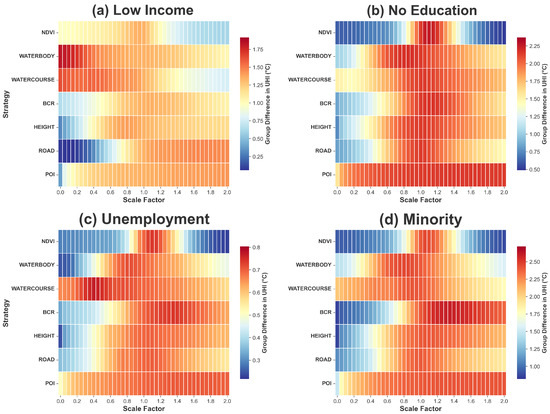
Figure 7.
Maximum group differences in UHI across scale levels and intervention strategies, stratified by four socio-demographic variables.
Some interventions were identified as equity-enhancing. Notably, increasing NDVI consistently resulted in low Maximum Group Difference (MGD) values across all four social indicators, especially at higher scale levels, indicating that greening interventions deliver broadly equitable cooling benefits. Similarly, optimizing proximity to water bodies produced balanced outcomes across different groups when applied at moderate intervention scales.
In contrast, other strategies were found to worsen inequities. Increasing building height led to significant disparities, particularly among high-minority and low-income populations. Although increasing POI density had a limited effect on overall cooling, it also showed relatively small inter-group differences, suggesting low overall equity impact—positive or negative.
Finally, certain interventions exhibited mixed impacts. Adjusting BCR and road density revealed complex and scale-sensitive fairness patterns. These strategies offered potential cooling benefits but also carried the risk of amplifying social disparities if not carefully calibrated. As such, they require nuanced, context-specific policy design to ensure equitable outcomes.
In summary, nature-based interventions—particularly urban greening—demonstrated the strongest overall cooling performance and the most equitable distribution of benefits. Conversely, certain built-environment adjustments, while potentially effective, may exacerbate existing disparities unless accompanied by fairness-oriented policy safeguards.
4. Discussion
4.1. Effectiveness and Fairness of Environmental Interventions
This study demonstrates that nature-based strategies—particularly increasing urban vegetation—deliver the most substantial and equitable reductions in urban heat exposure. Vegetation-based interventions (NDVI) achieved the highest potential cooling of 2.95 °C, approximately 3.9 times greater than that of built-environment modifications (average 0.76 °C). For low-education populations, NDVI interventions yielded the smallest group disparity (0.52 °C at scale = 2.0), making it the most effective and equitable overall strategy for residents without formal education. However, an “equity trap” was identified between scale = 1.1 and 1.3, where group disparity peaked at approximately 2.2 °C. Therefore, fairness improvements became more stable once vegetation intensity exceeded about 1.3 times the baseline level. These results reaffirm the dual role of greening in mitigating thermal stress while advancing climate justice.
Built environment interventions—such as reducing road density or modifying BCR—also showed fairness-enhancing potential, though their cooling impacts were more modest. For example, BCR at scale = 0.0 yielded the most equitable outcome for visible minority groups (group difference = 0.86 °C), and road density adjustments improved fairness among low-income populations. Specifically, Road Density at scale < 1.0 showed consistent inequality reduction across all social groups. Notably, for low-income populations, the minimum group difference (0.062 °C) was achieved at scale = 0.15. As the scale decreases, inequality also decreases, making Road Density a strong candidate for targeted, equitable interventions. These findings suggest that scale-sensitive, targeted modifications to urban form can achieve meaningful equity gains, even when total cooling is limited.
Our group-based analysis further revealed that high-vulnerability populations—such as low-education or high-minority groups—often benefited more from environmental interventions than their low-vulnerability counterparts, with an additional cooling gain of approximately 1.5 °C. This responsiveness challenges static narratives of persistent disadvantage and highlights the importance of designing interventions that account for group-specific sensitivity to urban heat mitigation.
These findings are broadly consistent with previous research showing that urban greening substantially mitigates surface heat intensity, with cooling effects strengthening as vegetation density increases [15]. Moreover, differential cooling among vegetation types observed in tropical and temperate regions [16] supports our conclusion that vegetation structure influences both thermal performance and equity outcomes. The additional benefits of water-related features identified in this study further align with global assessments of blue–green infrastructure as a synergistic cooling mechanism [19].
4.2. Complexities of Context-Dependent Urban Heat Dynamics
Several findings challenged common assumptions about urban heat exposure and social vulnerability. For instance, low-income populations were negatively correlated with UHI during Summer Daytime (), likely due to peripheral housing areas with better ventilation or vegetation, but showed positive correlations at night and in winter. These temporal reversals suggest that vulnerability to heat is not static but shifts with season and time of day.
Another counterintuitive result was the high cooling efficacy of built-environment intensification—such as increased building height or coverage—at scale = 2.0. While dense morphology is often blamed for worsening UHI, our simulations indicate possible shadowing or airflow effects that reduce heat exposure under certain configurations. Specifically, the Building Coverage Ratio (BCR) at scale = 2.0 achieved a cooling benefit of approximately 1 °C, suggesting that high-density forms can sometimes facilitate shading and convective heat dispersion. Additionally, the cooling impact of NDVI dropped sharply at night, underscoring the time-sensitive nature of vegetation effects.
These temporal and morphological patterns are consistent with global evidence showing that daytime SUHI intensity typically exceeds nighttime levels due to differential radiative and aerodynamic controls [34]. Similar diurnal and seasonal reversals have also been reported across South Asian cities [20,21], suggesting that social and environmental vulnerability to heat varies dynamically through time. Furthermore, regional studies in arid and continental settings [22] reinforce the context-dependent and non-linear nature of UHI processes. At the same time, our observation that compact urban forms can under certain configurations yield local cooling effects aligns with recent global analyses emphasizing morphology optimization rather than simple densification or sprawl reduction as the pathway to sustainable heat mitigation [35].
These findings point to the non-linear, context-dependent nature of UHI dynamics. Factors such as ventilation corridors, elevation, and microclimatic variation may mediate thermal exposure in ways not fully captured by conventional planning assumptions. Moreover, the stronger cooling gains observed among some socially vulnerable groups highlight the need to move beyond uniform intervention strategies and adopt more nuanced, data-driven planning approaches.
4.3. Methodological Contributions, Limitations, and Future Directions
Methodologically, this study contributes a scalable framework for evaluating both the effectiveness and equity of urban heat mitigation strategies. By integrating AutoGluon’s ensemble learning models with fine-grained spatial and socio-demographic data, we were able to model UHI exposure under four seasonal and diurnal conditions, simulate 41 levels of intervention per environmental feature, and assess group-level disparities. Importantly, the proposed workflow is transferable to other urban contexts, provided that comparable environmental and demographic datasets are available. The model’s modular structure allows users to adapt the input features, retrain the ensemble on local data, and simulate city-specific intervention scenarios, thereby facilitating cross-city or cross-climate applications. This pipeline provides a reproducible blueprint for equity-oriented climate adaptation planning.
Despite its strengths, the study has several limitations. Although regularization techniques were applied during model training, some degree of overfitting was still observed in complex thermal contexts—particularly during Summer Nighttime (SN), Winter Daytime (WD), and Winter Nighttime (WN). This may result from data sparsity, meteorological fluctuations, and weaker nighttime radiative signals, which collectively reduce the model’s generalization capacity. The interpretability of AutoML remains limited, making it harder to trace specific non-linear interactions between features. Furthermore, this study’s geographic scope—restricted to Vancouver in 2018—limits generalizability across other cities or climates. Endogenous relationships (e.g., between vegetation and income) also complicate causal inference. Additionally, the correlation-based assessment of social vulnerability was exploratory in nature and does not capture complex mediating or spatially confounding relationships among socio-demographic factors.
Looking ahead, future research could mitigate such overfitting risks through sample expansion, refined feature selection, or spatiotemporal modeling approaches that better capture contextual variability. In addition, longitudinal designs that incorporate decadal climate trends and extreme heat events would enhance the temporal robustness of the findings. Causal inference techniques (e.g., structural equation modeling or natural experiments) could strengthen understanding of underlying mechanisms. At finer spatial scales, high-resolution data from IoT sensors or crowdsourced platforms could uncover hidden inequities. Beyond these methodological directions, future efforts should focus on bridging model results with real-world implementation by integrating crowdsourced and Volunteered Geographic Information (VGI) data to enable participatory validation and local feedback. Such an approach can connect data-driven insights with lived experiences, supporting policymakers in evaluating trade-offs between cooling effectiveness, social equity, and feasibility under actual governance and spatial constraints. From a policy perspective, incorporating cost-benefit analysis, stakeholder feedback, and multi-objective optimization will be crucial for operationalizing simulation findings. In particular, applying and validating this framework across different climatic zones (e.g., arid, tropical, continental) and governance contexts could help identify universal versus context-specific drivers of urban heat inequity. Cross-city comparisons and links to health and economic outcomes would further enhance the impact and relevance of equity-centered UHI mitigation strategies.
5. Conclusions
Urban heat inequality has emerged as a pressing environmental justice issue, with vulnerable populations—such as low-income, low-education, and racialized groups—often facing disproportionate exposure to extreme urban temperatures [4].
This study presents a novel machine learning-based approach to investigate how urban environmental features influence the distribution of Urban Heat Island (UHI) exposure across space, time, and social groups. By applying an interpretable AutoML framework to high-resolution spatial data from Vancouver, we identify vegetation cover (NDVI), proximity to water, and built form indicators as key drivers of UHI patterns. Scenario-based simulations reveal that greening strategies not only provide the strongest overall cooling effects, but also consistently deliver equitable benefits to socially disadvantaged communities. Other interventions, such as modifying building density or road layout, also show potential for targeted fairness improvement. These findings highlight the spatial and temporal complexity of heat vulnerability, underscoring the need for localized, equity-sensitive adaptation strategies in urban climate planning.
From a theoretical standpoint, this study contributes to the evolving discourse on climate justice by integrating urban morphology, social vulnerability, and data-driven modeling. It moves beyond conventional correlational approaches by leveraging interpretable machine learning to reveal non-linear, context-dependent relationships between urban form and environmental inequity. Our results demonstrate that thermal disparities are not merely socioeconomic artifacts, but are materially embedded in the spatial configurations of the built environment. The methodologically grounded framework developed here offers a new lens to investigate the intersection of spatial form and social inequality, enriching existing environmental justice theories with a spatial analytic perspective.
On a practical level, our research delivers actionable insights for urban planning and policy-making. The strategy evaluation framework enables practitioners to test the thermal and distributional effects of various interventions before implementation, thereby supporting data-informed, equity-oriented decision-making. Moreover, the modeling framework is transferable and adaptable to other cities, provided local environmental and demographic data are available [3]. As cities worldwide confront rising heat risks, the findings of this study can support the formulation of socially just and spatially effective adaptation strategies aligned with broader sustainability agendas, particularly SDG 11 and SDG 13 [36].
Despite these contributions, the study is not without limitations. First, the analysis is limited to one city and one year (Vancouver, 2018), which restricts generalizability across climatic and governance contexts. Second, while model performance was strong in summer daytime scenarios, other periods (e.g., summer night, winter day) exhibited signs of overfitting, indicating sensitivity to spatiotemporal complexity. Third, the study remains correlational in nature, and causal mechanisms behind observed inequities require further investigation. Finally, policy, historical, and behavioral variables—potentially crucial in shaping environmental injustice—were not directly modeled. Future research should build upon this framework by incorporating longitudinal and causal methods, expanding the scope to diverse urban contexts, and integrating health, economic, and behavioral data to enhance both scientific understanding and policy relevance in the pursuit of urban climate justice.
Author Contributions
Conceptualization, W.L.; methodology, W.L. and L.C.; software, W.L.; validation, W.L. and L.C.; formal analysis, W.L.; investigation, W.L. and L.C.; resources, W.L. and L.C.; data curation, W.L. and L.C.; writing—original draft preparation, W.L.; writing—review and editing, W.L. and L.C.; visualization, W.L. and L.C.; supervision, W.L.; project administration, W.L. All authors have read and agreed to the published version of the manuscript.
Funding
Open access funding provided by the Open Access Publishing Fund of RWTH Aachen University.
Data Availability Statement
The datasets used in this study are publicly available. UHI and NDVI data are available from Google Earth Engine (https://developers.google.com/earth-engine/datasets, accessed on 18 October 2025). Building footprints are from Microsoft (https://github.com/microsoft/GlobalMLBuildingFootprints, accessed on 18 October 2025). Hydro features are from Natural Resources Canada (https://www.canada.ca/en/services/environment.html, accessed on 18 October 2025). Road networks and POIs are from OpenStreetMap via Geofabrik (https://download.geofabrik.de/, accessed on 18 October 2025). Dissemination Area boundaries are from Statistics Canada (https://www12.statcan.gc.ca/census-recensement/2021/geo/sip-pis/boundary-limites/index2021-eng.cfm?year=21, accessed on 18 October 2025). Socio-demographic data are from the CDC/ATSDR Social Vulnerability Index (https://www.atsdr.cdc.gov/place-health/php/svi/, accessed on 18 October 2025).
Acknowledgments
I would like to express my deepest gratitude to Zhewei Liu for his invaluable guidance, insightful advice, and continuous encouragement throughout the process of this research. His professional knowledge and patient supervision have been essential to the completion of this work. I am also sincerely grateful to my fellow student Aopu Xu, whose technical support and constructive suggestions have provided great help during the research and analysis stages.
Conflicts of Interest
The authors declare no conflicts of interest.
Abbreviations
The following abbreviations are used in this manuscript:
| UHI | Urban Heat Island |
| NDVI | Normalized Difference Vegetation Index |
| BCR | Building Coverage Ratio |
| POI | Point of Interest |
| DA | Dissemination Area |
| AutoML | Automated Machine Learning |
| MGD | Maximum Group Difference |
| EJ | Environmental Justice |
| ML | Machine Learning |
| LST | Land Surface Temperature |
References
- Anguelovski, I.; Connolly, J.J.; Masip, L.; Pearsall, H. Assessing green gentrification in historically disenfranchised neighborhoods: A longitudinal and spatial analysis of Barcelona. Urban Geogr. 2016, 39, 458–491. [Google Scholar] [CrossRef]
- Hallegatte, S.; Bangalore, M.; Bonzanigo, L.; Fay, M.; Kane, T.; Narloch, U.; Rozenberg, J.; Treguer, D.; Vogt-Schilb, A. Shock Waves: Managing the Impacts of Climate Change on Poverty; World Bank: Washington, DC, USA, 2015. [Google Scholar]
- Arruda Filho, M.T.d.; Torres, P.H.C.; Jacobi, P.R. A Systematic Review of the Literature on Climate Justice: A Comparison Between the Global North and South. Sustainability 2024, 16, 9888. [Google Scholar] [CrossRef]
- Chakraborty, J.; Grineski, I.E.; Collins, T.W. Disproportionately higher exposure to urban heat in lower-income neighborhoods: A multi-city perspective. Nat. Commun. 2019, 10, 4811. [Google Scholar] [CrossRef]
- Mitchell, B.C.; Chakraborty, J. Urban Heat and Climate Justice: A Landscape of Thermal Inequity in Pinellas County, Florida. Geogr. Rev. 2014, 104, 459–480. [Google Scholar] [CrossRef]
- Harlan, S.L.; Brazel, A.J.; Prashad, L.; Stefanov, W.L.; Larsen, L. Neighborhood microclimates and vulnerability to heat stress. Soc. Sci. Med. 2006, 63, 2847–2863. [Google Scholar] [CrossRef]
- Hsu, A.; Sheriff, G.; Chakraborty, T.; Manya, D. Disproportionate Exposure to Urban Heat Island Intensity Across Major U.S. Cities. Nat. Commun. 2021, 12, 2721. [Google Scholar] [CrossRef]
- Flocks, J.; Escobedo, F.; Wade, J.; Varela, S.; Wald, C. Environmental Justice Implications of Urban Tree Cover in Miami-Dade County, Florida. Environ. Justice 2011, 4, 125–134. [Google Scholar] [CrossRef]
- Méndez, M.; Flores-Haro, G.; Zucker, L. The (In)visible Victims of Disaster: Understanding the Vulnerability of Undocumented Latino/a and Indigenous Immigrants. Geoforum 2020, 116, 50–62. [Google Scholar] [CrossRef]
- Calderón-Argelich, A.; Benetti, S.; Anguelovski, I.; Connolly, J.J.T.; Langemeyer, J.; Baró, F. Tracing and building up environmental justice considerations in the urban ecosystem service literature: A systematic review. Landsc. Urban Plan. 2021, 214, 104130. [Google Scholar] [CrossRef]
- Schlosberg, D.; Collins, L.B. From Environmental to Climate Justice: Climate Change and the Discourse of Environmental Justice. WIREs Clim. Change 2014, 5, 359–374. [Google Scholar] [CrossRef]
- Voelkel, J.; Hellman, D.; Sakuma, R.; Shandas, V. Assessing vulnerability to urban heat: A study of disproportionate heat exposure and access to refuge by socio-demographic status in Portland, Oregon. Int. J. Environ. Res. Public Health 2018, 15, 640. [Google Scholar] [CrossRef]
- Schell, C.J.; Dyson, K.; Fuentes, T.L.; Des Roches, S.; Harris, N.A.; Miller, D.B.; Patton, E.K.; Ray, C.A.; Nelson, A.A.; Thomas, M.R.; et al. The Ecological and Evolutionary Consequences of Systemic Racism in Urban Environments. Science 2020, 369, eaay4497. [Google Scholar] [CrossRef]
- Pulido, L. Rethinking Environmental Racism: White Privilege and Urban Development in Southern California. Ann. Assoc. Am. Geogr. 2000, 90, 12–40. [Google Scholar] [CrossRef]
- Aram, F.; Solgi, E.; Ghoddousi, G. Urban Green Space Cooling Effect in Cities. Heliyon 2019, 5, e01339. [Google Scholar] [CrossRef]
- Richards, D.R.; Fung, T.K.; Belcher, R.N.; Edwards, P.J. Differential Air Temperature Cooling Performance of Urban Vegetation Types in the Tropics. Urban For. Urban Green. 2020, 50, 126651. [Google Scholar] [CrossRef]
- Hoang, N.D. Machine Learning Approaches for Geospatial Modeling of Urban Land Surface Temperature: Assessing Geographical Compactness, Interpretability, and Causal Inference. Sensors 2025, 25, 5380. [Google Scholar] [CrossRef] [PubMed]
- Syeda, A.Q.; Castillo-Villar, K.K.; Alaeddini, A. Sustainable Urban Heat Island Mitigation Through Machine Learning: Integrating Physical and Social Determinants for Evidence-Based Urban Policy. Sustainability 2025, 17, 7040. [Google Scholar] [CrossRef]
- Li, S.; Liang, Y.; Yang, D.; Shen, J. Effect of Blue–Green Landscape Pattern and Urban Forms on Surface Urban Heat Island Intensity: Evidence from 816 Chinese Urban Clusters. Ecol. Indic. 2025, 178, 113949. [Google Scholar] [CrossRef]
- Dewan, A.; Kiselev, G.; Botje, D.; Mahmud, I.; Rahman, M.M. Diurnal and Seasonal Trends of Surface Urban Heat Island Intensity in Multiple Cities of Bangladesh. Sustain. Cities Soc. 2021, 74, 102926. [Google Scholar] [CrossRef]
- Dewan, A.; Corner, R. Exploring the Influence of Urban Expansion on Land Surface Temperature Patterns Using Remote Sensing: A Case of Dhaka, Bangladesh. Appl. Geogr. 2021, 134, 102533. [Google Scholar] [CrossRef]
- Chen, H.; Mamitimin, Y.; Abulizi, A.; Huang, M.; Tao, T.; Ma, Y. Seasonal and Diurnal Characteristics and Drivers of Urban Heat Island Based on Optimal Parameters-Based Geo-Detector Model in Xinjiang, China. Atmosphere 2024, 15, 1377. [Google Scholar] [CrossRef]
- Hou, H.; Longyang, Q.; Su, H.; Zeng, R.; Xu, T.; Wang, Z.-H. Prioritizing Environmental Determinants of Urban Heat Islands: A Machine Learning Study for Major Cities in China. Int. J. Appl. Earth Obs. Geoinf. 2023, 122, 103411. [Google Scholar] [CrossRef]
- Ho, Y.-H.; Liu, Z.; Lee, C.-C.; Mostafavi, A. ML4EJ: Decoding the Role of Urban Features in Shaping Environmental Injustice Using Interpretable Machine Learning. Cities 2026, 169, 106546. [Google Scholar] [CrossRef]
- Shwartz-Ziv, R.; Armon, A. Tabular Data: Deep Learning Is Not All You Need. Inf. Fusion 2022, 81, 84–90. [Google Scholar] [CrossRef]
- Petrou, I.; Kassomenos, P. Estimating the Importance of Environmental Factors Influencing the Urban Heat Island for Urban Areas in Greece: A Machine Learning Approach. J. Environ. Manag. 2024, 368, 122255. [Google Scholar] [CrossRef] [PubMed]
- Zhang, J.; Liu, X.; Li, Y.; Wang, H. A Data-Driven Framework for Conceptual Cost Estimation of Infrastructure Projects Using XGBoost and Bayesian Optimization. J. Asian Archit. Build. Eng. 2025, 24, 751–774. [Google Scholar] [CrossRef]
- Mansouri, A.; Erfani, A. Machine Learning Prediction of Urban Heat Island Severity in the Midwestern United States. Sustainability 2025, 17, 6193. [Google Scholar] [CrossRef]
- Erickson, N.; Mueller, J.; Zhang, H.; Li, M.; Smola, A.; DeCoste, D. AutoGluon-Tabular: Robust and Accurate AutoML for Structured Data. arXiv 2020, arXiv:2003.06505. [Google Scholar]
- Chakraborty, T.; Lee, X. A simplified urban-extent algorithm to characterize surface urban heat islands on a global scale and examine vegetation control on their spatiotemporal variability. ISPRS J. Photogramm. Remote Sens. 2019, 148, 1–18. [Google Scholar] [CrossRef]
- Jesdale, B.M.; Morello-Frosch, R.; Cushing, L. The Racial/Ethnic Distribution of Heat Risk–Related Land Cover in Relation to Residential Segregation. Environ. Health Perspect. 2013, 121, 811–817. [Google Scholar] [CrossRef]
- Li, Y.; Svenning, J.-C.; Zhou, W.; Zhu, K.; Abrams, J.F.; Lenton, T.M.; Ripple, W.J.; Yu, Z.; Teng, S.N.; Dunn, R.R.; et al. Green Spaces Provide Substantial but Unequal Urban Cooling Globally. Nat. Commun. 2024, 15, 7108. [Google Scholar] [CrossRef]
- Breiman, L. Random Forests. Mach. Learn. 2001, 45, 5–32. [Google Scholar] [CrossRef]
- Peng, S.; Piao, S.; Ciais, P.; Friedlingstein, P.; Ottle, C.; Bréon, F.-M.; Myneni, R.B. Surface Urban Heat Island Across 419 Global Big Cities. Environ. Sci. Technol. 2012, 46, 696–703. [Google Scholar] [CrossRef] [PubMed]
- Li, X.; Zhou, Y.; Asrar, G.R.; Imhoff, M.; Li, X. The Surface Urban Heat Island Response to Urban Expansion: A Panel Analysis for the Conterminous United States. Sci. Total Environ. 2017, 605–606, 426–435. [Google Scholar] [CrossRef] [PubMed]
- Revi, A.; Satterthwaite, D.E.; Aragón-Durand, F.; Corfee-Morlot, J.; Kiunsi, R.B.R.; Pelling, M.; Roberts, D.; Solecki, W.; Surjan, S.; Wilbanks, C.P.; et al. Towards Transformative Adaptation in Cities: The IPCC’s Fifth Assessment. Environ. Urban. 2014, 26, 11–28. [Google Scholar] [CrossRef]


Disclaimer/Publisher’s Note: The statements, opinions and data contained in all publications are solely those of the individual author(s) and contributor(s) and not of MDPI and/or the editor(s). MDPI and/or the editor(s) disclaim responsibility for any injury to people or property resulting from any ideas, methods, instructions or products referred to in the content. |
© 2025 by the authors. Licensee MDPI, Basel, Switzerland. This article is an open access article distributed under the terms and conditions of the Creative Commons Attribution (CC BY) license (https://creativecommons.org/licenses/by/4.0/).