Article

Assessment of Seismic Intensity Measures on Liquefaction Response: A Case Study of Yinchuan Sandy Soil

1
Ningxia Hui Autonomous Region Institute of Basic Geological Survey, Yinchuan 750021, China
2
School of Civil Engineering, Shanghai Normal University, Shanghai 201418, China
3
Green and Intelligent Prevention Institute of Geological Disasters, Shanghai Normal University, Shanghai 200234, China
*
Author to whom correspondence should be addressed.
Buildings 2025, 15(20), 3803; https://doi.org/10.3390/buildings15203803
Submission received: 9 September 2025 / Revised: 12 October 2025 / Accepted: 15 October 2025 / Published: 21 October 2025

Abstract

The proliferation of tunnel and subway networks in urban areas has heightened concerns regarding their vulnerability to seismic-induced liquefaction. This phenomenon, wherein saturated sandy soils lose strength and behave like a liquid under seismic waves, poses a catastrophic threat to the structural integrity and stability of underground constructions. While extensive research has been conducted to evaluate liquefaction triggering, most existing approaches rely on single ground motion intensity measures (e.g., PGA, IA), which often fail to capture the combined effects of amplitude, energy, and duration on liquefaction behavior. In this study, the seismic response of saturated sandy soil from Yinchuan was analyzed using the Dafalias–Manzari constitutive model implemented in the OpenSeesPy platform. The model parameters were carefully calibrated using laboratory triaxial results. A total of ten real earthquake records were applied to evaluate two critical engineering demand parameters (EDPs): surface lateral displacement (SLD) and the maximum thickness of the liquefied layer (MTL). The results show that both SLD and MTL exhibit weak correlations with conventional intensity parameters, suggesting limited predictive value for engineering design. However, by applying Partial Least Squares (PLS) regression to combine multiple intensity measures, the prediction accuracy for SLD was significantly improved, with the correlation coefficient increasing to 0.81. In contrast, MTL remained poorly predicted due to its strong dependence on intrinsic soil characteristics such as permeability and fines content. These findings highlight the importance of integrating both seismic loading features and geotechnical soil properties in performance-based liquefaction hazard evaluation.

1. Introduction

The accelerating pace of global urbanization has led to underground space development as an essential strategy for addressing critical issues like land scarcity and traffic congestion. Large-scale underground structures—including metro systems, utility tunnels, and underground commercial complexes—are proliferating, forming the vital arteries of modern cities. However, many cities located in coastal areas, riverine regions, and deltaic plains (e.g., Tianjin and Shanghai in China, Tokyo and Osaka in Japan) are built on thick layers of saturated sandy or silty soils. Under seismic loading, such soils are highly susceptible to liquefaction [1,2,3]—a phenomenon where they transiently lose their strength and stiffness and behave like a liquid—posing a catastrophic threat to both surface and subsurface infrastructures. Yinchuan City is located in the central part of the Yinchuan Plain, where saturated sand layers are widely distributed. The region lies within a graben fault-depression basin characterized by active tectonic faults and frequent seismic activity. Historical earthquake records reveal multiple occurrences of soil liquefaction in the area. For instance, the 1920 Haiyuan (Ms = 8.5) mega-earthquake caused widespread liquefaction-induced ground fissures and collapses across the region. Despite decades of research, the complex interplay between seismic loading characteristics and soil behavior during liquefaction remains a major challenge for engineering prediction and risk mitigation
Numerous studies have attempted to bridge this knowledge gap by investigating how specific ground motion parameters influence liquefaction potential and its manifestations. The seminal work by Seed and Idriss [4] established peak ground acceleration (PGA) as a fundamental parameter in simplified liquefaction evaluation procedures. Subsequent research has expanded to consider more comprehensive intensity measures, including Arias Intensity introduced by Arias [5], which was subsequently developed into a robust framework for liquefaction potential evaluation by Kayen and Mitchell [6]. The importance of Effective Duration was systematically defined by Bommer et al. [7], which characterizes the time window of significant shaking and was demonstrated by Kramer and Mitchell [8] to influence the number of loading cycles. Characteristic Intensity was comprehensively studied by Kayen et al. [9], which combines amplitude and frequency characteristics and was found to correlate well with liquefaction-induced deformations.
However, it is widely recognized in current research that any single ground motion parameter faces insurmountable theoretical and practical limitations in assessing liquefaction risk. These limitations manifest primarily at four levels: the parameter’s inherent physical representation capacity, the multi-stage nature of the liquefaction process, site-specific conditions, and complex interactions between parameters. At the physical representation level, conventional parameters typically capture only a single dimension of ground motion characteristics. While the PGA-based methodology established by Seed and Idriss [4] offers practical simplicity, subsequent studies have revealed fundamental deficiencies. Kramer [10] demonstrated through theoretical analysis that PGA represents merely an instantaneous peak value during shaking, failing to capture both the energy accumulation process and spectral characteristics of ground motions. This limitation was further corroborated by Bommer and Martinez-Pereira [7], who found that ground motions with identical PGA levels but different durations could produce substantially different liquefaction consequences. A more profound issue lies in the multi-stage nature of liquefaction itself. Cubrinovski et al. [11] discovered that different phases exhibit distinct sensitivities to ground motion characteristics through detailed investigation of the Canterbury earthquakes. Their research demonstrated that while the triggering phase is primarily influenced by shaking intensity, the development phase depends more critically on shaking duration—a finding supported by Kramer and Mitchell [8]. Site-specific conditions further exacerbate the limitations of single parameters. Research by Boulanger and Idriss [12] demonstrated that the performance of the same ground motion parameter varies significantly across different soil types. Their extensive analysis of case histories revealed that fine-grained soils show greater sensitivity to duration parameters, while clean sands respond more noticeably to acceleration amplitude parameters—a phenomenon also observed and quantified by Idriss and Boulanger [13], which provides additional evidence of how fines content affects soil response to various ground motion characteristics. The complex interactions between parameters present another significant constraint. Kramer and Mitchell [8] systematically evaluated numerous intensity measures and demonstrated significant correlations and potential redundancies among them. Their research indicated that simply increasing the number of parameters does not improve prediction accuracy and may instead introduce multicollinearity problems, emphasizing the need for careful selection of complementary parameters. Recent research has continued to uncover additional layers of complexity in liquefaction prediction. Studies employing advanced computational techniques have demonstrated that the importance of various ground motion parameters exhibits significant variation across different shaking intensity levels and site conditions [14]. Furthermore, the fundamental challenge of parameter sensitivity was first systematically addressed by Kayen and Mitchell [6], which continues to pose important considerations for practical applications.
These limitations not only affect the accuracy of liquefaction assessment but also have direct consequences for engineering practice. To address the above paucity, this study takes the saturated sandy soil in Yinchuan as a representative case to investigate the relationship between seismic loading characteristics and liquefaction-induced ground response. A series of laboratory triaxial tests was conducted to calibrate the parameters of the Dafalias–Manzari constitutive model, which was then implemented in the OpenSeesPy (v3.1.2) platform to simulate nonlinear dynamic responses of liquefiable soil columns. By applying ten real earthquake ground motion records, the study evaluates two key engineering demand parameters (EDPs): (i) surface lateral displacement (SLD) and (ii) maximum thickness of the liquefied layer (MTL). Partial Least Squares (PLS) regression was introduced to explore the potential of composite indices in improving predictive accuracy. The findings provide insights into performance-based liquefaction assessment and highlight the significance of integrating both seismic and geotechnical factors in hazard evaluation.

2. Materials and Methods

2.1. Definition of Parameters and Nomenclature

In order to ensure clarity, the key parameters and symbols used in this study and quoted in subsequent tables and analyses have been defined. Related to the basic soil parameters (Table 1) include: average particle size (D50), non-uniformity coefficient (Cu), maximum and minimum void ratios (emax and emin), specific gravity of soil particles (Gs), plasticity index (Ip) and saturated permeability coefficient (ks). Parameters related to the constitutive model (Table 2) include elastic parameters (small-strain shear modulus G0 and Poisson’s ratio ν), critical state parameters (M, c, λc, e0, ξ), plastic modulus parameters (h0, ch, nb), dilatancy parameters (A0, nd), and fabric-dilatancy tensor parameters (zmax, cz) considering the evolution effect of soil fabric under cyclic loading. Parameters related to ground motion intensity (Table 3) relate to: Peak Ground Acceleration (PGA); Arias intensity (IA), which is used to measure the total seismic energy input; significant duration (D5–95), which is used to characterize the duration of strong earthquakes; and Characteristic Intensity (Ic), which is a composite parameter that combines the characteristics of amplitude and frequency components.

2.2. Physical Properties of the Test Material

In this study, soil samples collected from Wuqiqu Xincun in the Xixia District of Yinchuan, Ningxia Hui Autonomous Region, were adopted. According to X-ray diffraction (XRD) and X-ray fluorescence (XRF) analyses, the soil consists predominantly of silica powder, with approximately 12% clay minerals, thus classifying it as poorly graded sand (SP). Based on the GB/T 50123-2019 [15], the grain size distribution and associated index properties were determined [16], as provided in Figure 1 and Table 1, respectively.

2.3. Triaxial Test Program

With the purpose of calibrating model parameters, a series of undrained triaxial tests [17] was conducted at different relative densities Dr, defined as follows:
D r = e max e e max e min
where emax, emin are the maximum and minimum void ratios, and e denotes the target void ratio, respectively. Six relative densities were considered, ranging from a very loose state (Dr = −0.10) to a very dense state (Dr = 0.90), with a step of 0.20. The triaxial specimens with 61.8 mm in diameter and 125 mm in height were reconstituted in the laboratory with five layers. The dry tamping technique [18,19] was generally employed, except for the specimens with Dr = −0.10, 0.10 and 0.30, where the moist tamping method [20,21] was applied to achieve the extremely loose state. After the specimen was installed on the equipment pedestal, the stepwise back-pressure saturation was applied to ensure that Skempton’s B value reached 0.98 or higher. This threshold was considered sufficient to achieve full saturation in sandy soil [22,23]. Prior to shearing, the specimen was finally subjected to an isotropic consolidation stress of 100 kPa.

3. Constitutive Model

The Dafalias–Manzari constitutive model [24,25], based on the bounding surface plasticity framework [26], has been widely adopted in geotechnical earthquake engineering to simulate the cyclic behavior of sand [27,28]. By involving critical state soil mechanics, the model allows for consistent characterization of sand behavior across various densities using a single set of parameters. This is particularly advantageous for site liquefaction analyses where precise density control is challenging. Besides, the model has been successfully implemented in finite element platforms, including OpenSeesPy [29] and FLAC [30]. It has demonstrated robust performance in capturing soil dynamic properties, such as strain accumulation and excess pore water pressure development, under complex loading conditions.
The power equation defined by Li and Wang [24] is employed in the Dafalias–Manzari model to represent the critical state line:
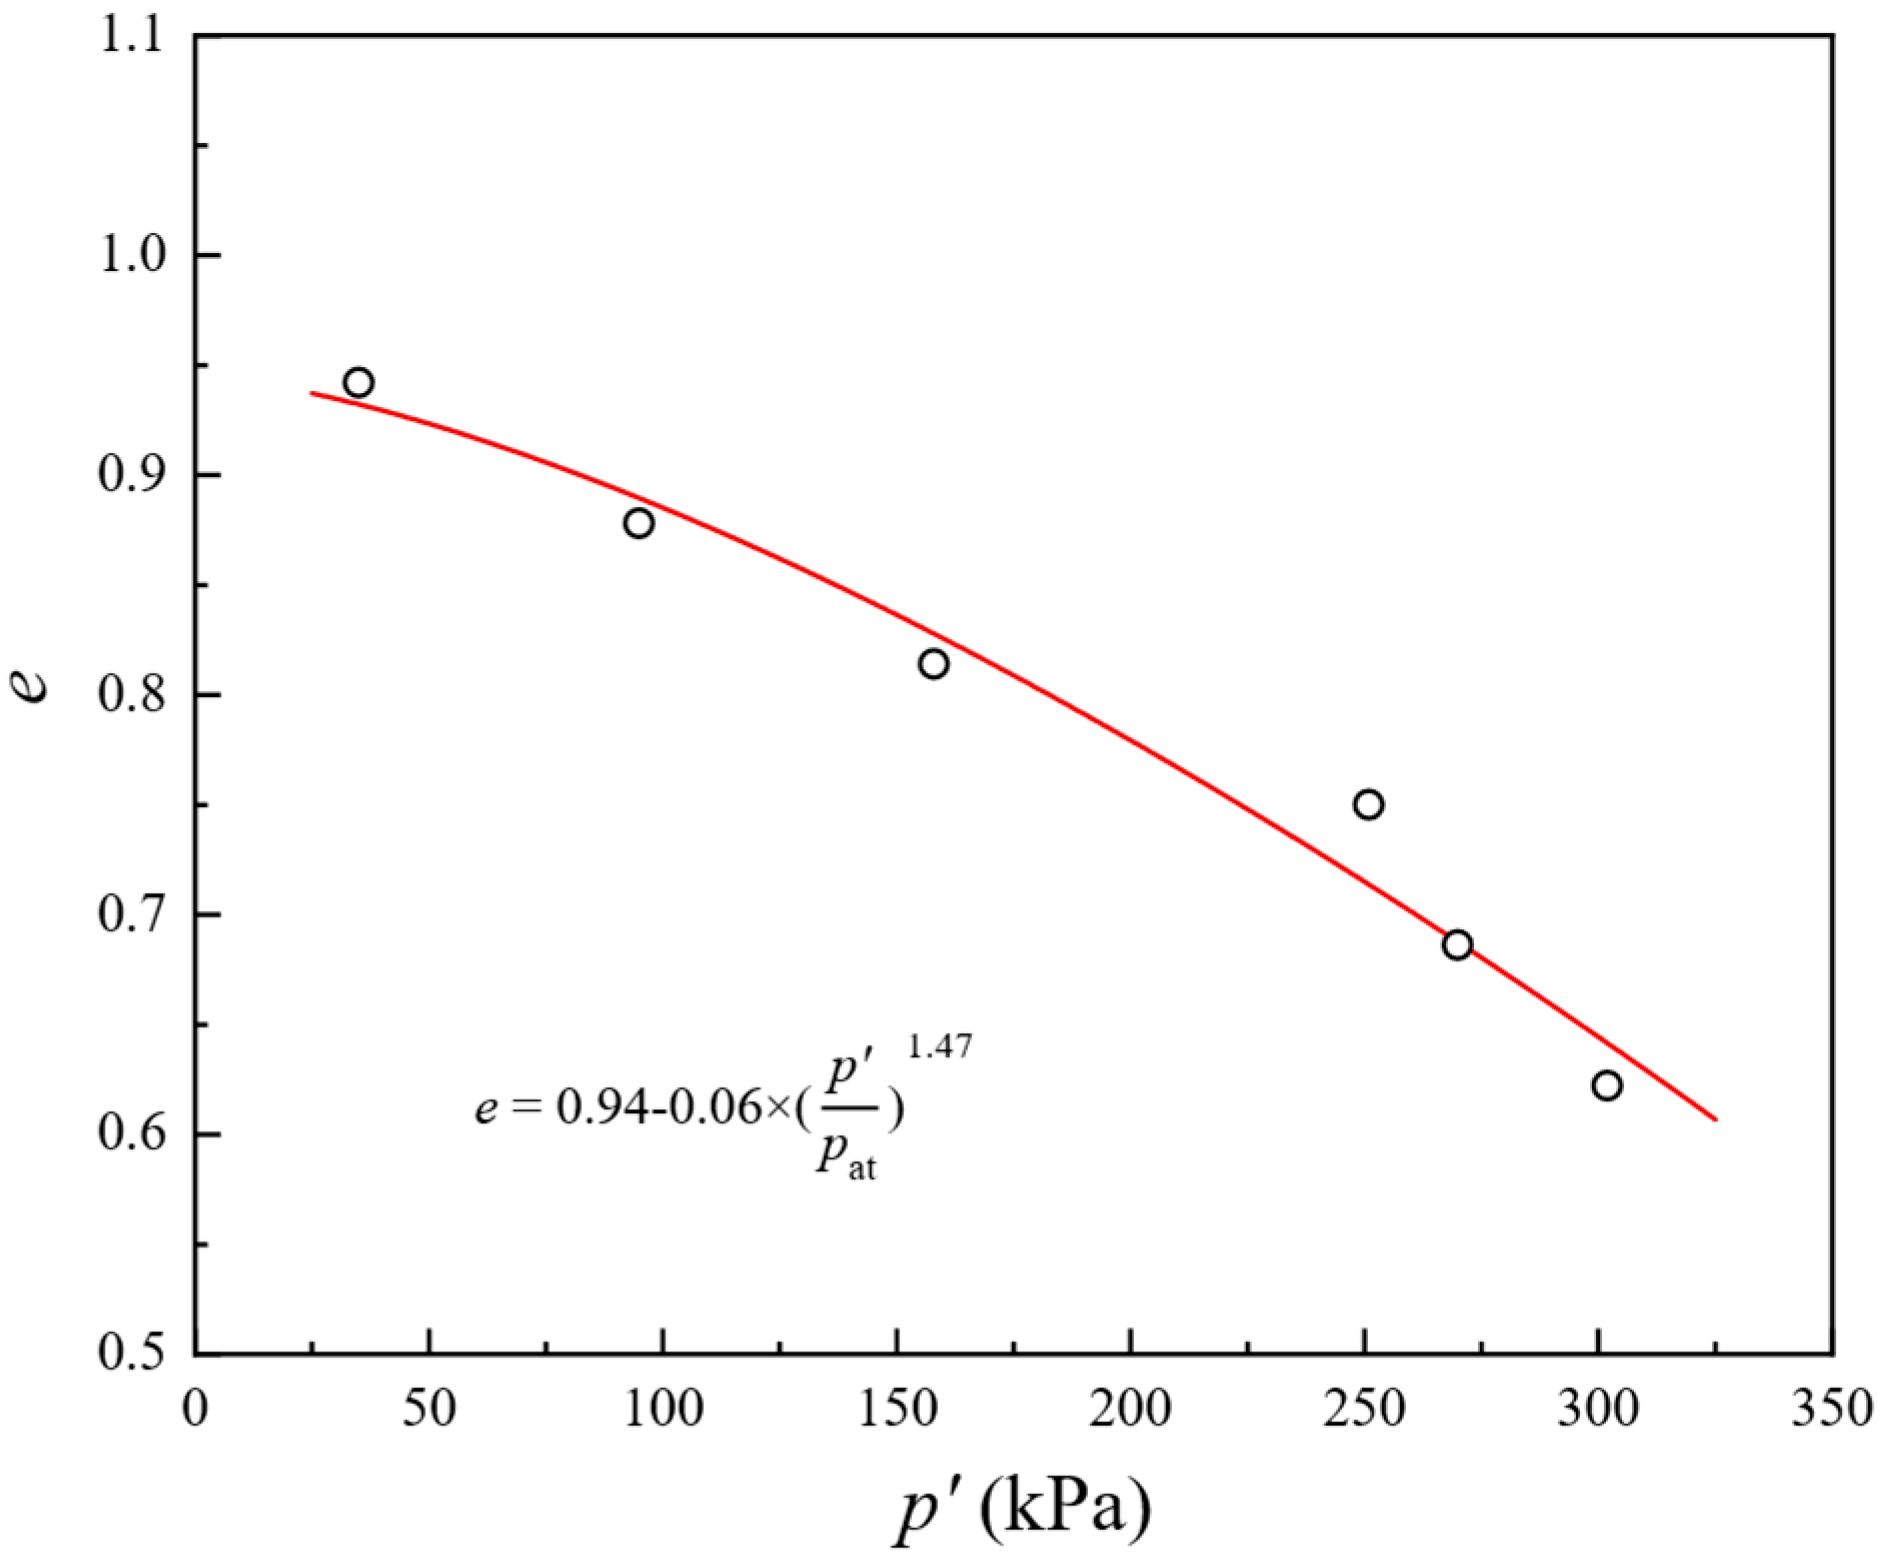
e c   =   e 0 λ c ( p /   p at ) ξ
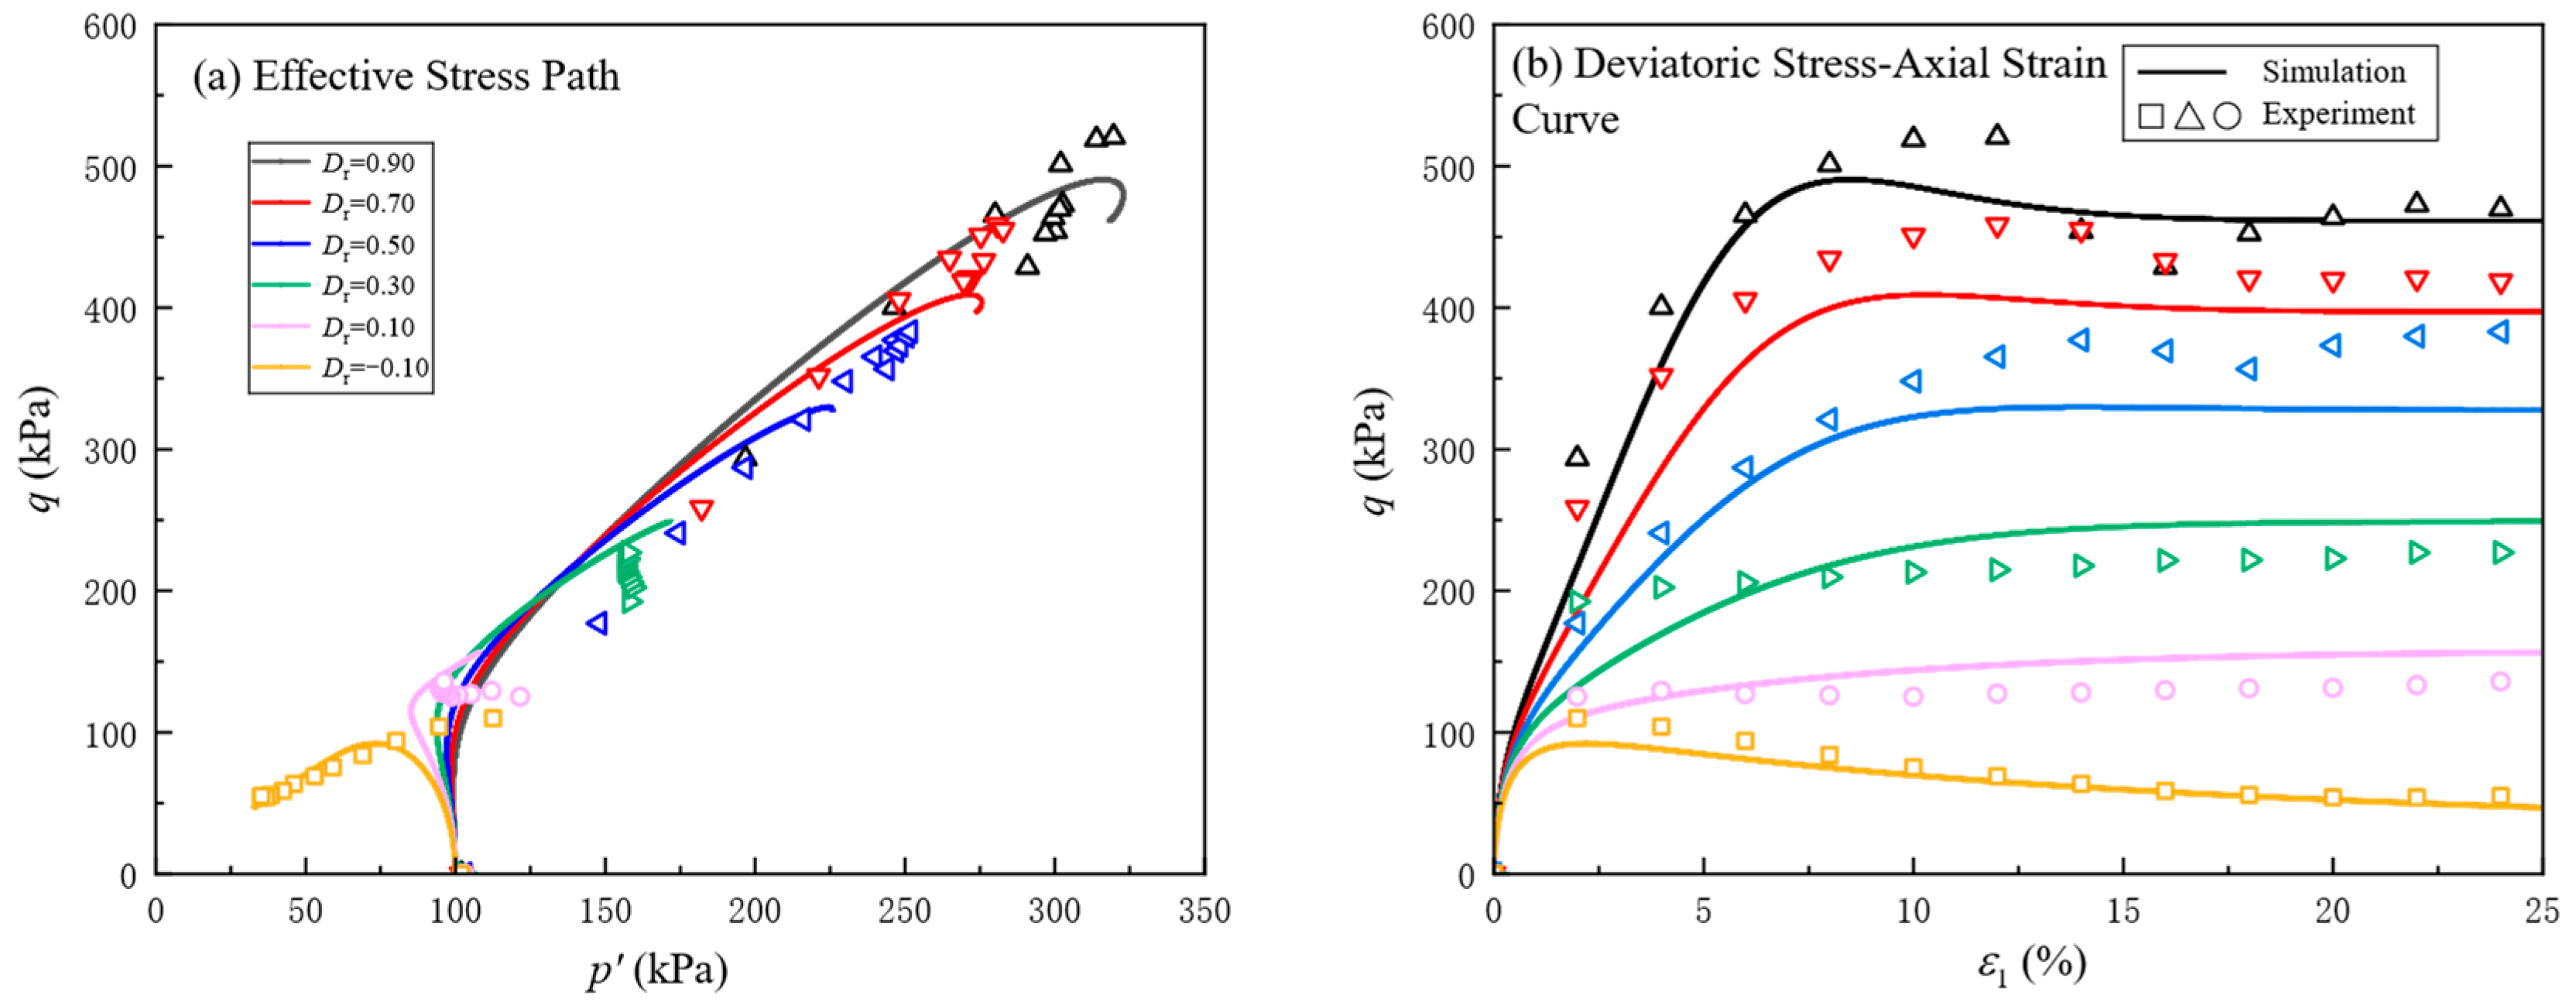
where pat is the atmospheric pressure, e0 is the void ratio at p’ = 0 and λc, ξ are two model dimensionless constants. In triaxial tests, the critical state was assumed to be reached when the increment of deviator stress was nearly zero. As shown in Figure 2, the experimental data at this state were used to calibrate e0, λc and ξ through curve fitting based on the above equation. The remaining parameters were determined following a combination of direct calibration and trial-and-error approach. For parameters (i.e., G0, v, M) that can be directly derived from laboratory outcomes, the methodology proposed in previous studies [31,32] was adopted without modifications. For parameters (i.e., h0, ch, zmax, cz and A0) that cannot be inferred [33], a trial-and-error approach was adopted to iteratively adjust their values until the numerical simulations exhibited a close agreement with the experimental results (see Figure 3). The initial values of the three variables h0, ch, A0 were all set to 1. It is found that if the values of h0 or A0 are too large, the axial strain ε1 corresponding to the same deviatoric stress peak q decreases. Conversely, if the value of ch is too large, the ε1 corresponding to the same peak q will increase. The model parameters calibrated for Yinchuan soil are tabulated in Table 2.

4. Simulation Setup

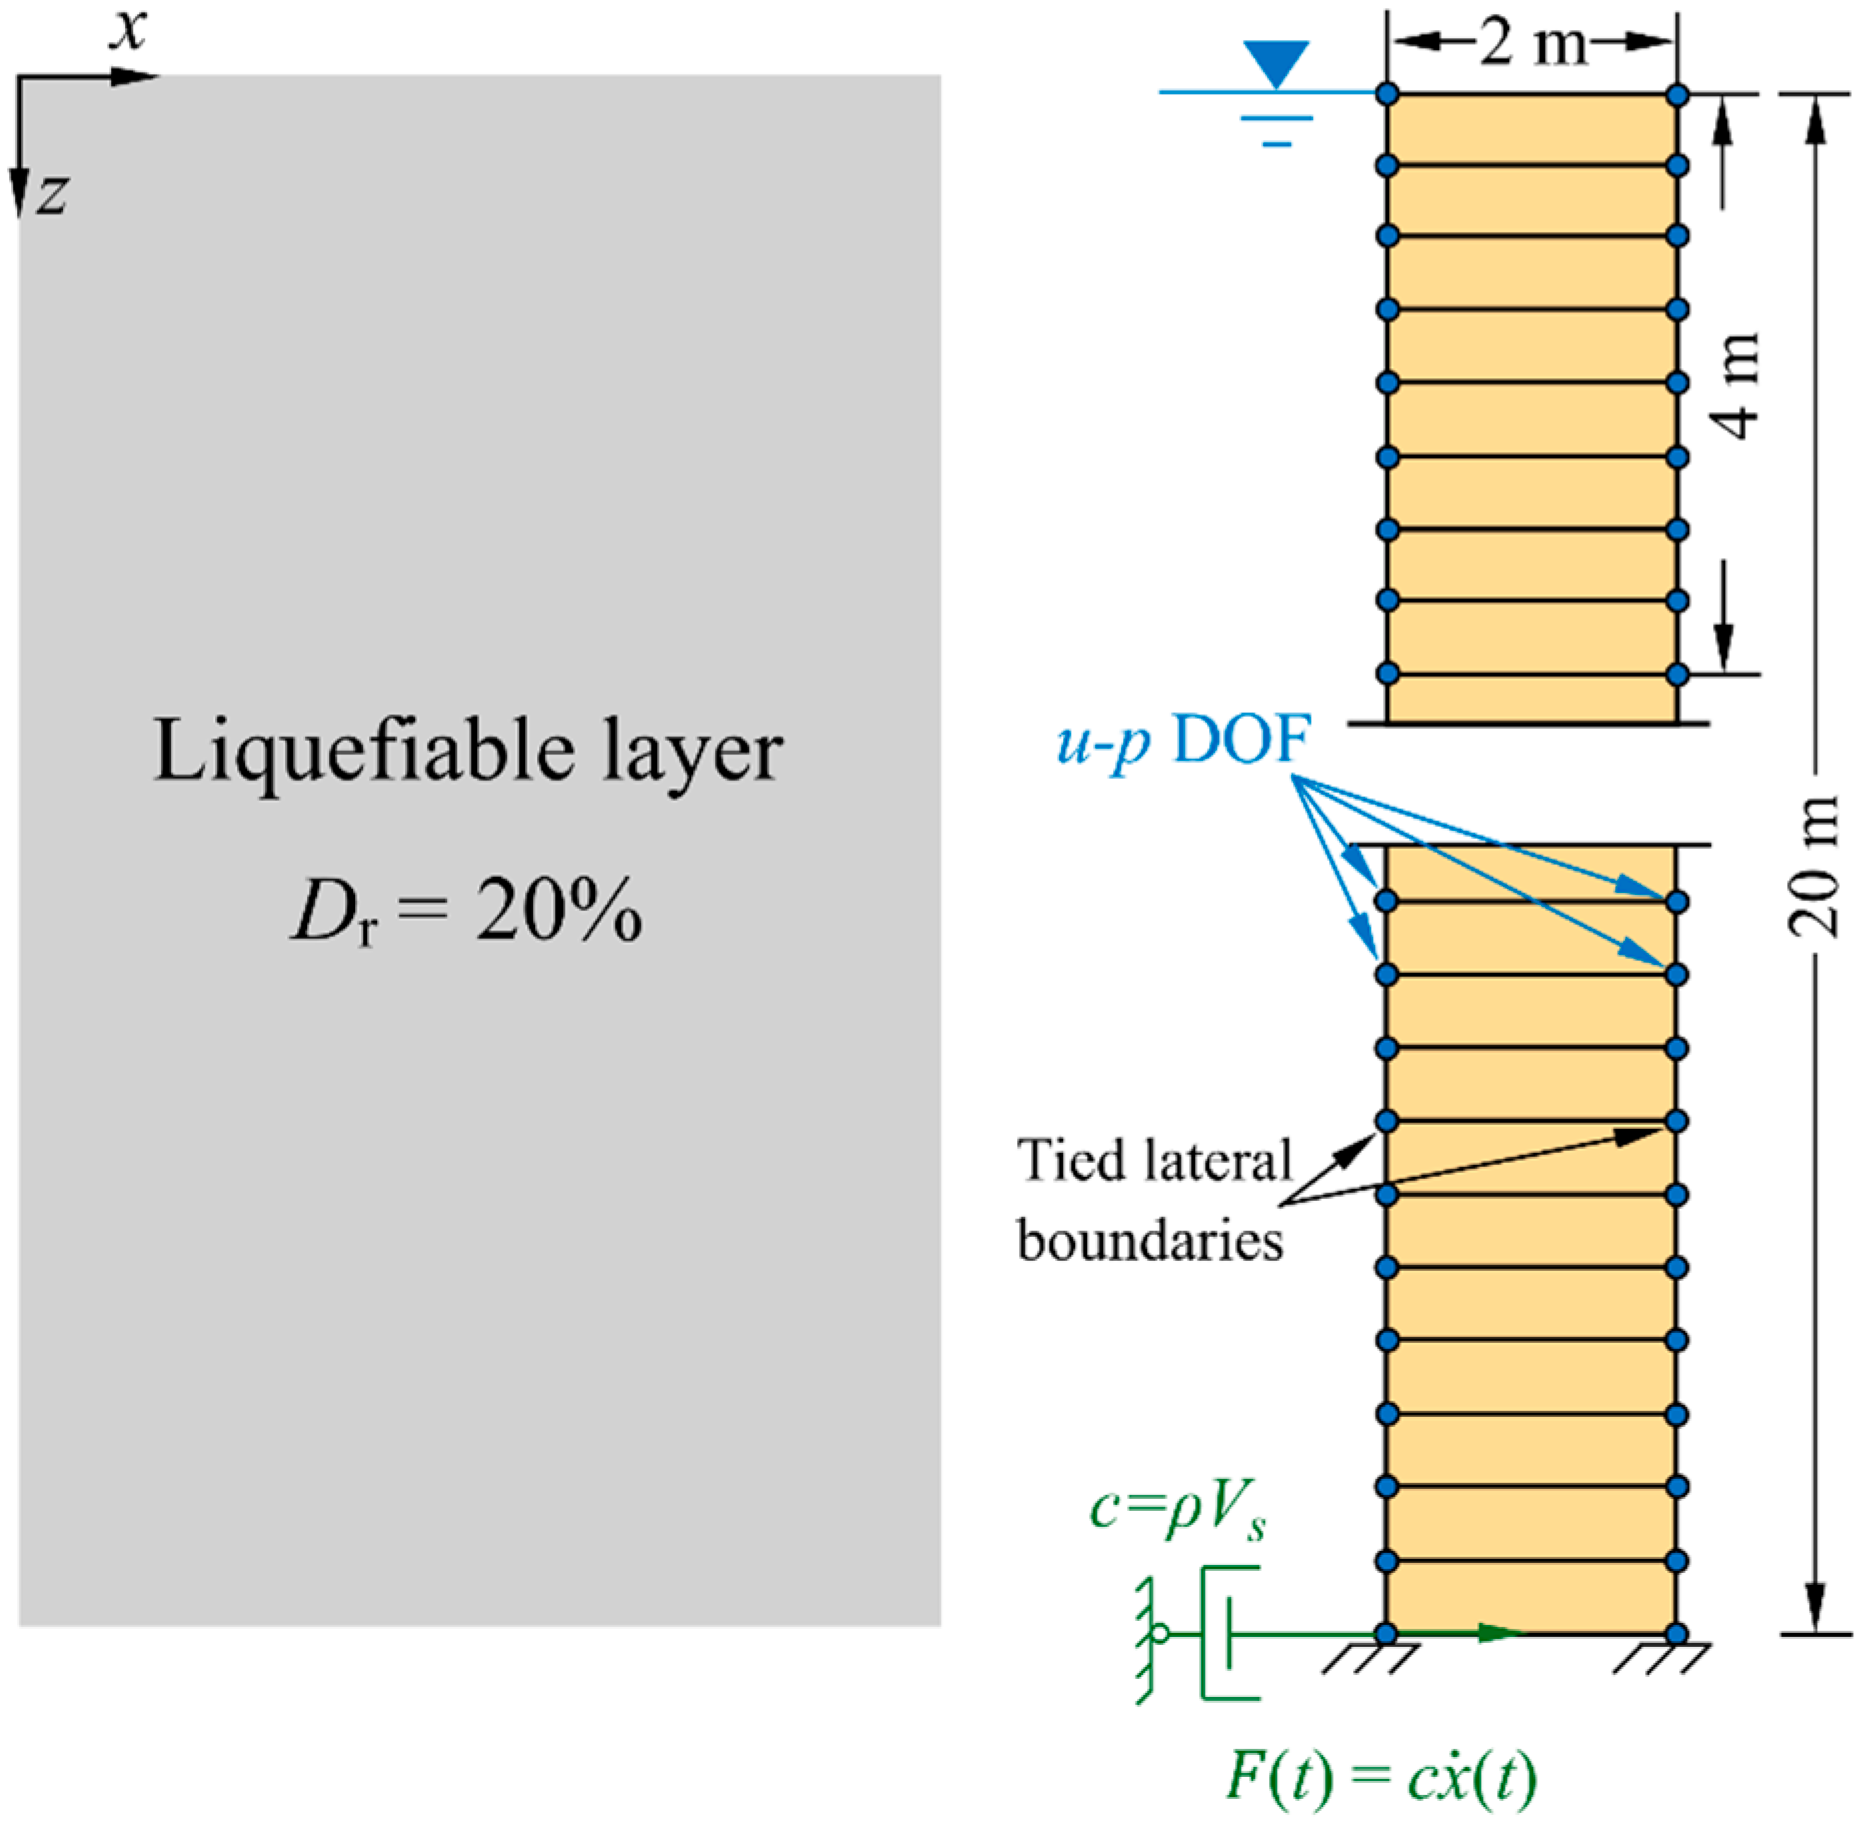
This section describes the numerical simulations of liquefiable soil columns, including the soil profile configuration and input motions. In this study, fully coupled nonlinear dynamic analyses [34] were conducted using the OpenSeesPy finite element platform. The model simulated an infinite vertical soil column that includes a single liquefiable layer. According to typical field surveys in Yinchuan, a reference case was set with H = 20 m and Dr = 0.20, as shown in Figure 4. The groundwater table was assumed to be at the profile surface, consistent with the common geological conditions in the region. The spatial domain was discretized using 2.0 m × 0.5 m 9_4_QuadUP elements [35]. This plane-strain element consists of nine nodes, with four corner nodes assigned three degrees of freedom (DoFs, two translations and one pore pressure), whilst the midside nodes have only two translational DoFs. This feature enables accurate representation of the coupled solid-fluid response [36] in saturated soils and offers a good balance between numerical stability and computational cost. To reflect the finite rigidity of the base layer, a Lysmer dashpot was represented by a zero-length element and connected to the base node [37]. The dashpot coefficient c was calculated as the product of the mass density ρ and the shear wave velocity Vs of the base. The velocity time history of the input wave x ˙ t , was imposed at the base, generating a force time history F ( t )   =   c · x ˙ t . The base layer was characterized by a shear wave velocity of 700 m/s and a density of 2500 kg/m3, representing a typical sandy soil substratum [38].
The boundary conditions were defined such that the base nodes were fixed against vertical translations. At the top boundary, the pore water pressure DoFs were set to 0 kPa for nodes located at the groundwater table. To simulate shear beam behavior, nodes located at the same height were strictly tied to share common degrees of freedom [39]. The simulation was carried out in two stages: a static initialization followed by dynamic excitation [40]. The first stage initially brought the model to equilibrium using only the elastic part of the Dafalias–Manzari model and then activated the full elastoplastic behavior to correctly establish the initial stress state. In the second stage, the velocity input was applied at the free node of the dashpot to simulate seismic loading.
To examine the seismic response of the liquefiable site under actual ground motions, ten representative earthquake records were selected and applied as input motions to the numerical model built in this study. These ground motion records, selected to cover a range of magnitudes, frequency components, and durations, are commonly used in geotechnical seismic analysis. In order to describe the characteristics of the input motions, four ground motion parameters were calculated for each record. Peak Ground Acceleration (PGA) represents the maximum acceleration recorded for a given ground motion. It serves as a conventional indicator of shaking severity and is widely used in seismic design and performance evaluation of geotechnical structures [41]. Arias Intensity IA is a measure of the cumulative seismic energy input to the ground, obtained by integrating the squared ground acceleration over time. Compared to PGA, IA offers a more integrated measure of seismic energy, useful for evaluating cumulative damage [42]. Effective Duration D5–95 quantifies the time span during which significant seismic energy is delivered. It is typically defined as the interval between 5% and 95% of IA accumulation, providing insight into the duration of strong shaking [43]. Characteristic Intensity Ic refers to a composite parameter that captures the energy within the most damaging frequency components of ground motion, providing a more direct measure of destructive potential [44].
The computed values of these parameters for all ten ground motions are summarized in Table 3, forming the solid foundation for the subsequent analysis.
In addition to the nine representative ground motions, a recently recorded Yongning Earthquake event (Epicenter: 38.400° N, 106.220° E; Depth: 10.0 km; Magnitude: Ms = 4.8) from the Yinchuan region was incorporated into the analysis to enhance the regional specificity and statistical robustness of the study. The uncorrected acceleration record was obtained from Station NX. A0023, located at 38.40° N, 106.27° E, with a very small epicentral distance, classifies it as a near-fault ground motion. The record has a Peak Ground Acceleration (PGA) of −160.8 cm/s2 (approximately −0.164 g), a significant duration of 140 s, and a sampling interval of 0.01 s (100 Hz). This record provides a unique and regionally representative input for evaluating the liquefaction response of Yinchuan sand under actual local seismic conditions. The parameters of this record have been added to an updated Table 3 for reference.

5. Typical Results

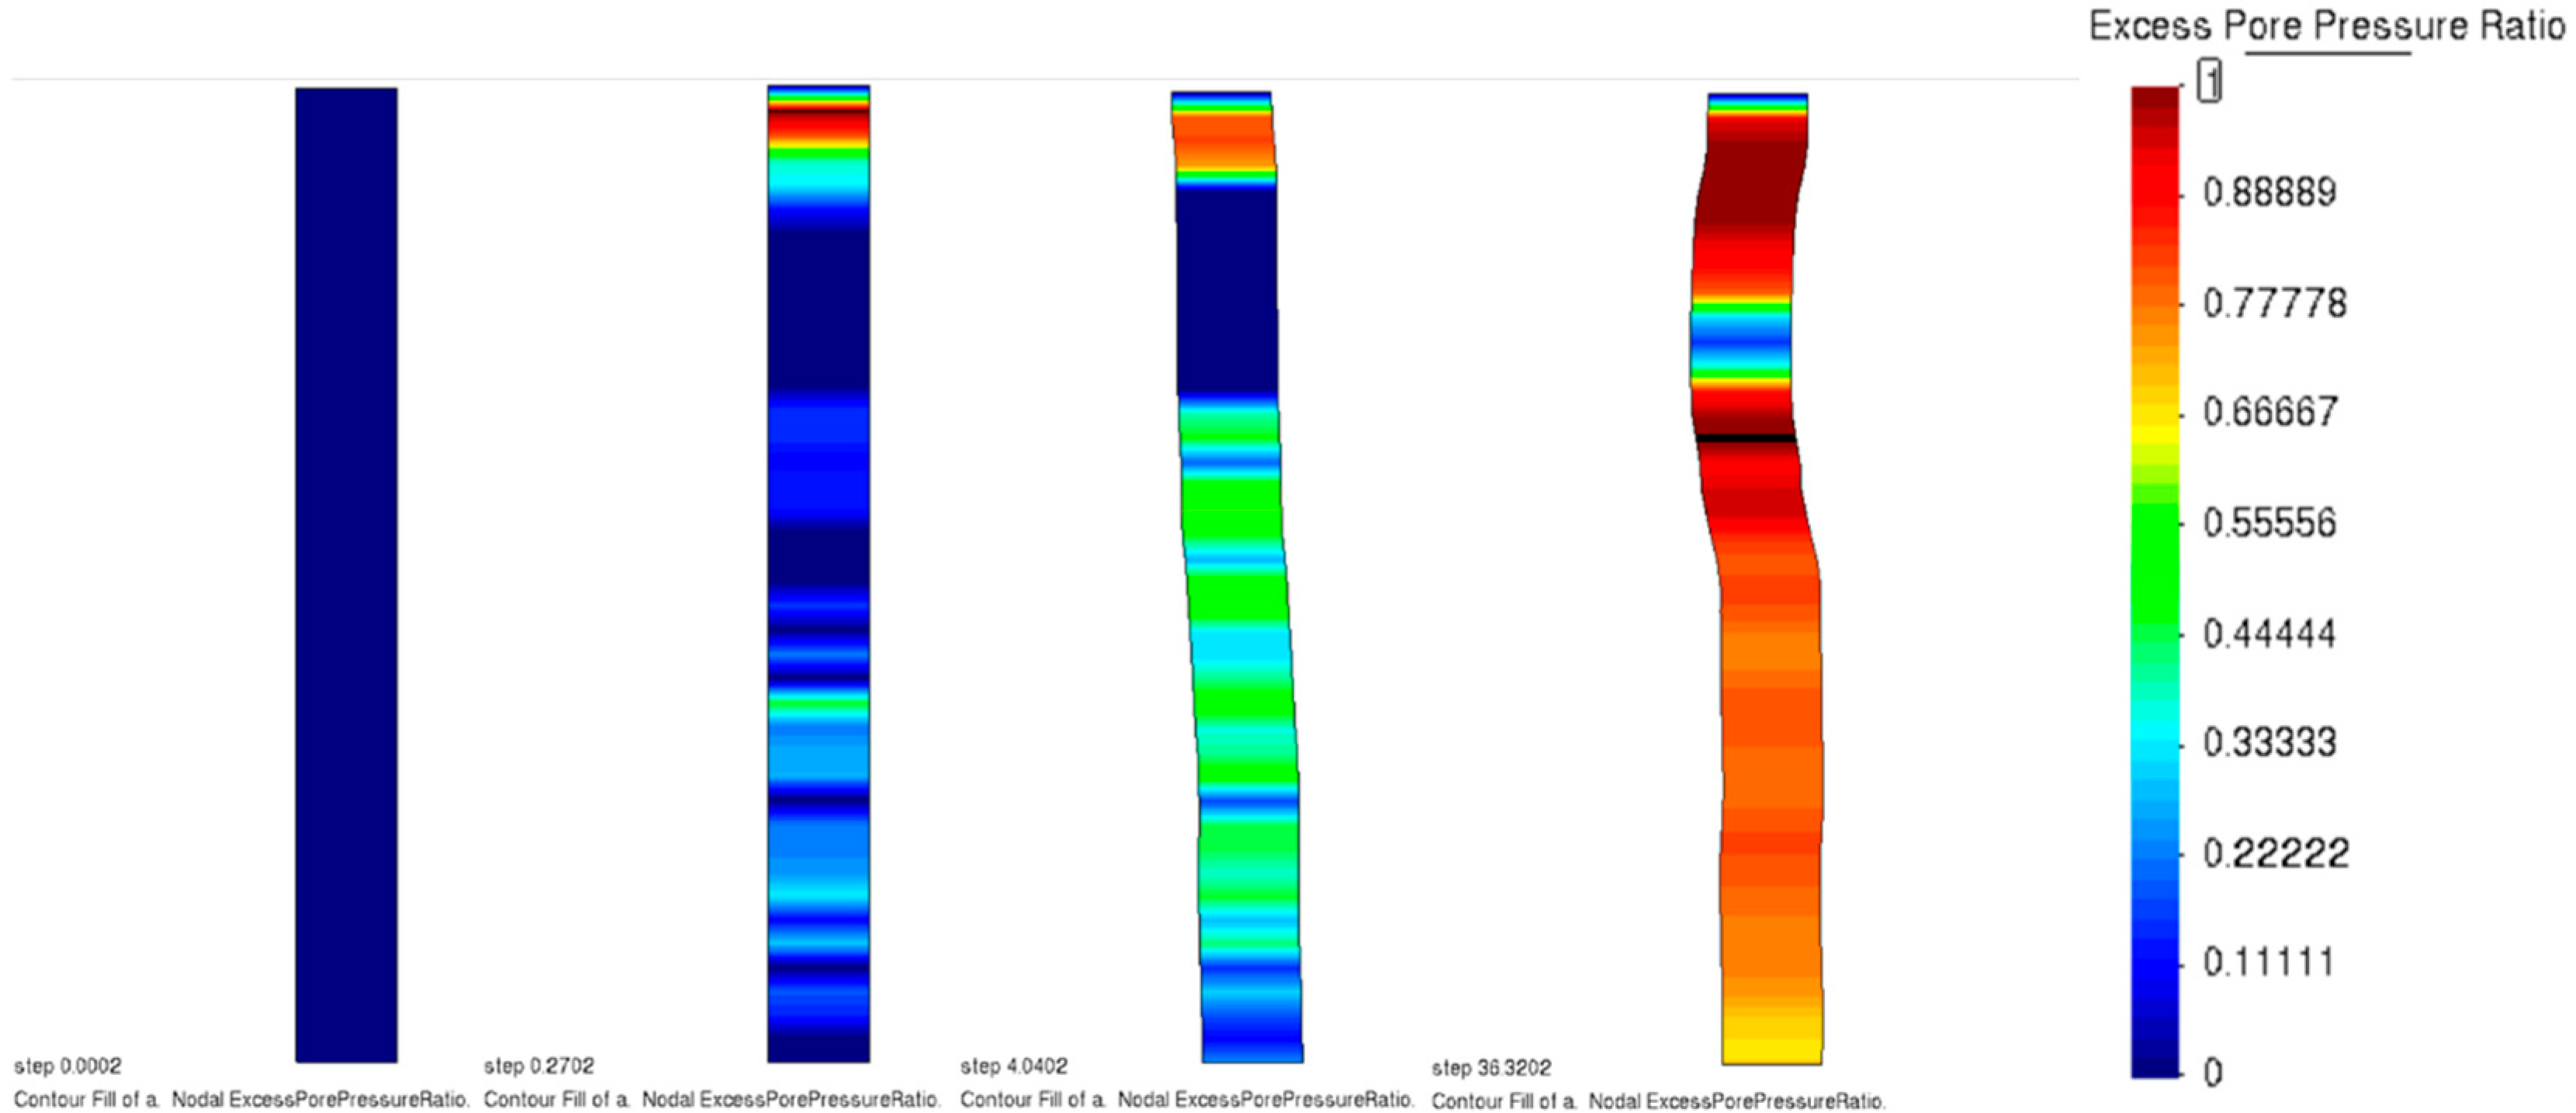
To illustrate the seismic response of the liquefiable soil column, the velocity time history of Friuli earthquake record was selected as a representative ground motion input [45]. The velocity corresponding to this input motion is presented in Figure 5. Four critical time points were selected for analysis, including the initial state at t = 0.00 s, the virgin liquefaction at t = 0.27 s, the PGA moment at t = 4.04 s and the end-of-motion at t = 36.32 s. These points reflect the evolution of seismic energy input over time and the corresponding soil response. The excess pore water pressure ratio ru (the excess pore water pressure ratio Δu divided by the initial effective vertical stress σ v 0 ) serves as the most direct and fundamental physical parameter for determining whether soil has reached the critical state of liquefaction. It quantitatively represents the degradation of soil strength and stiffness. When ru ≥ 0.95–1.0, the effective stress is significantly reduced, resulting in a substantial loss of frictional resistance between soil particles. Consequently, the soil temporarily exhibits fluid-like behavior, with its strength and stiffness effectively diminishing to near zero. Therefore, in both laboratory testing and numerical analysis, an excess pore water pressure ratio approaching or reaching 1.0 is conventionally established as the defining criterion for the initiation of liquefaction in a soil element. Figure 6 presents the evolution of the ru within the soil profile at selected time points [46]. As seismic shaking progressed, ru increased gradually with time, reflecting the continuous accumulation of excess pore water pressure induced by cyclic loading. The buildup of ru was most prevailing in the shallow subsurface layers, indicating that liquefaction primarily occurred at these depths. However, the topmost layer, which was modeled under drained boundary conditions, remained non-liquefied throughout the seismic event due to its ability to dissipate excess pore pressure effectively. Unlike typical clean sands, where excess pore pressure tends to dissipate after the shaking ceases, the Yinchuan sand did not exhibit significant post-shaking pressure dissipation [47]. This behavior is attributed to the soil’s mineral composition, which includes approximately 12% clay minerals [48]. The presence of these fine particles certainly reduced the permeability (ks = 1.0 × 10⁻⁷ m/s as in Table 1) and suppressed drainage.
Figure 6 presents the comparison of acceleration, velocity, and displacement time histories between the base and the surface of the soil column under the Friuli ground motion input. Figure 6a compares the acceleration time histories at the base (input) and at the surface (output) of the soil column [49]. During the early stages of seismic shaking, the acceleration at the surface rapidly increased and exhibited significantly higher peak values than the base input. This amplification effect is mainly attributed to the nonlinear response of the liquefiable soil [50], where cyclic softening and excess pore pressure generation modified the wave propagation characteristics. The surface signal shows more pronounced spikes and asymmetry, indicating that localized strain and stiffness degradation occurred in the upper layers [51]. As shaking progressed, the surface acceleration gradually decreased and eventually returned to levels comparable with the input, reflecting the reduction in effective stress and the onset of partial liquefaction. Figure 6b shows the velocity time histories at the base and the surface. As excess pore pressure accumulated during shaking, the surface velocity response became smoother and slightly delayed, reflecting stiffness reduction in the liquefied layers. Although less sensitive than acceleration, velocity still captures key features of the soil’s nonlinear behavior under liquefaction. Figure 6c presents the displacement time histories at the base and the surface of the soil column. The base displacement returns to zero due to baseline correction of the input motion, while the surface shows a clear residual offset, indicating permanent ground deformation [52]. This type of deformation is a critical issue in geotechnical engineering due to its potential to cause severe damage.
The above phenomena demonstrate the ability of the Dafalias–Manzari model to accurately replicate the development of pore water pressure and surface ground motion under dynamic loading [53]. The model effectively captured the key characteristics of liquefaction behavior, including progressive strain development, pressure accumulation and post-shaking stabilization.

6. Discussion

Two engineering demand parameters EDPs were adopted to evaluate the simulation outcomes and capture both the intensity of liquefaction and its induced effects. (1) The end-of-motion surface lateral displacement SLD quantifies the permanent horizontal deformation at the ground surface after shaking, representing the typical manifestation of liquefaction-induced ground failure [54]. (2) The maximum thickness of the liquefied MTL zone is defined as the greatest vertical extent where the excess pore water pressure ratio ru exceeds 0.90 during shaking [55]. This parameter serves as an indicator of the severity and spatial development of liquefaction within the soil profile. Together, these two EDPs provide a comprehensive measure of both the triggering and consequences of liquefaction under seismic loading.
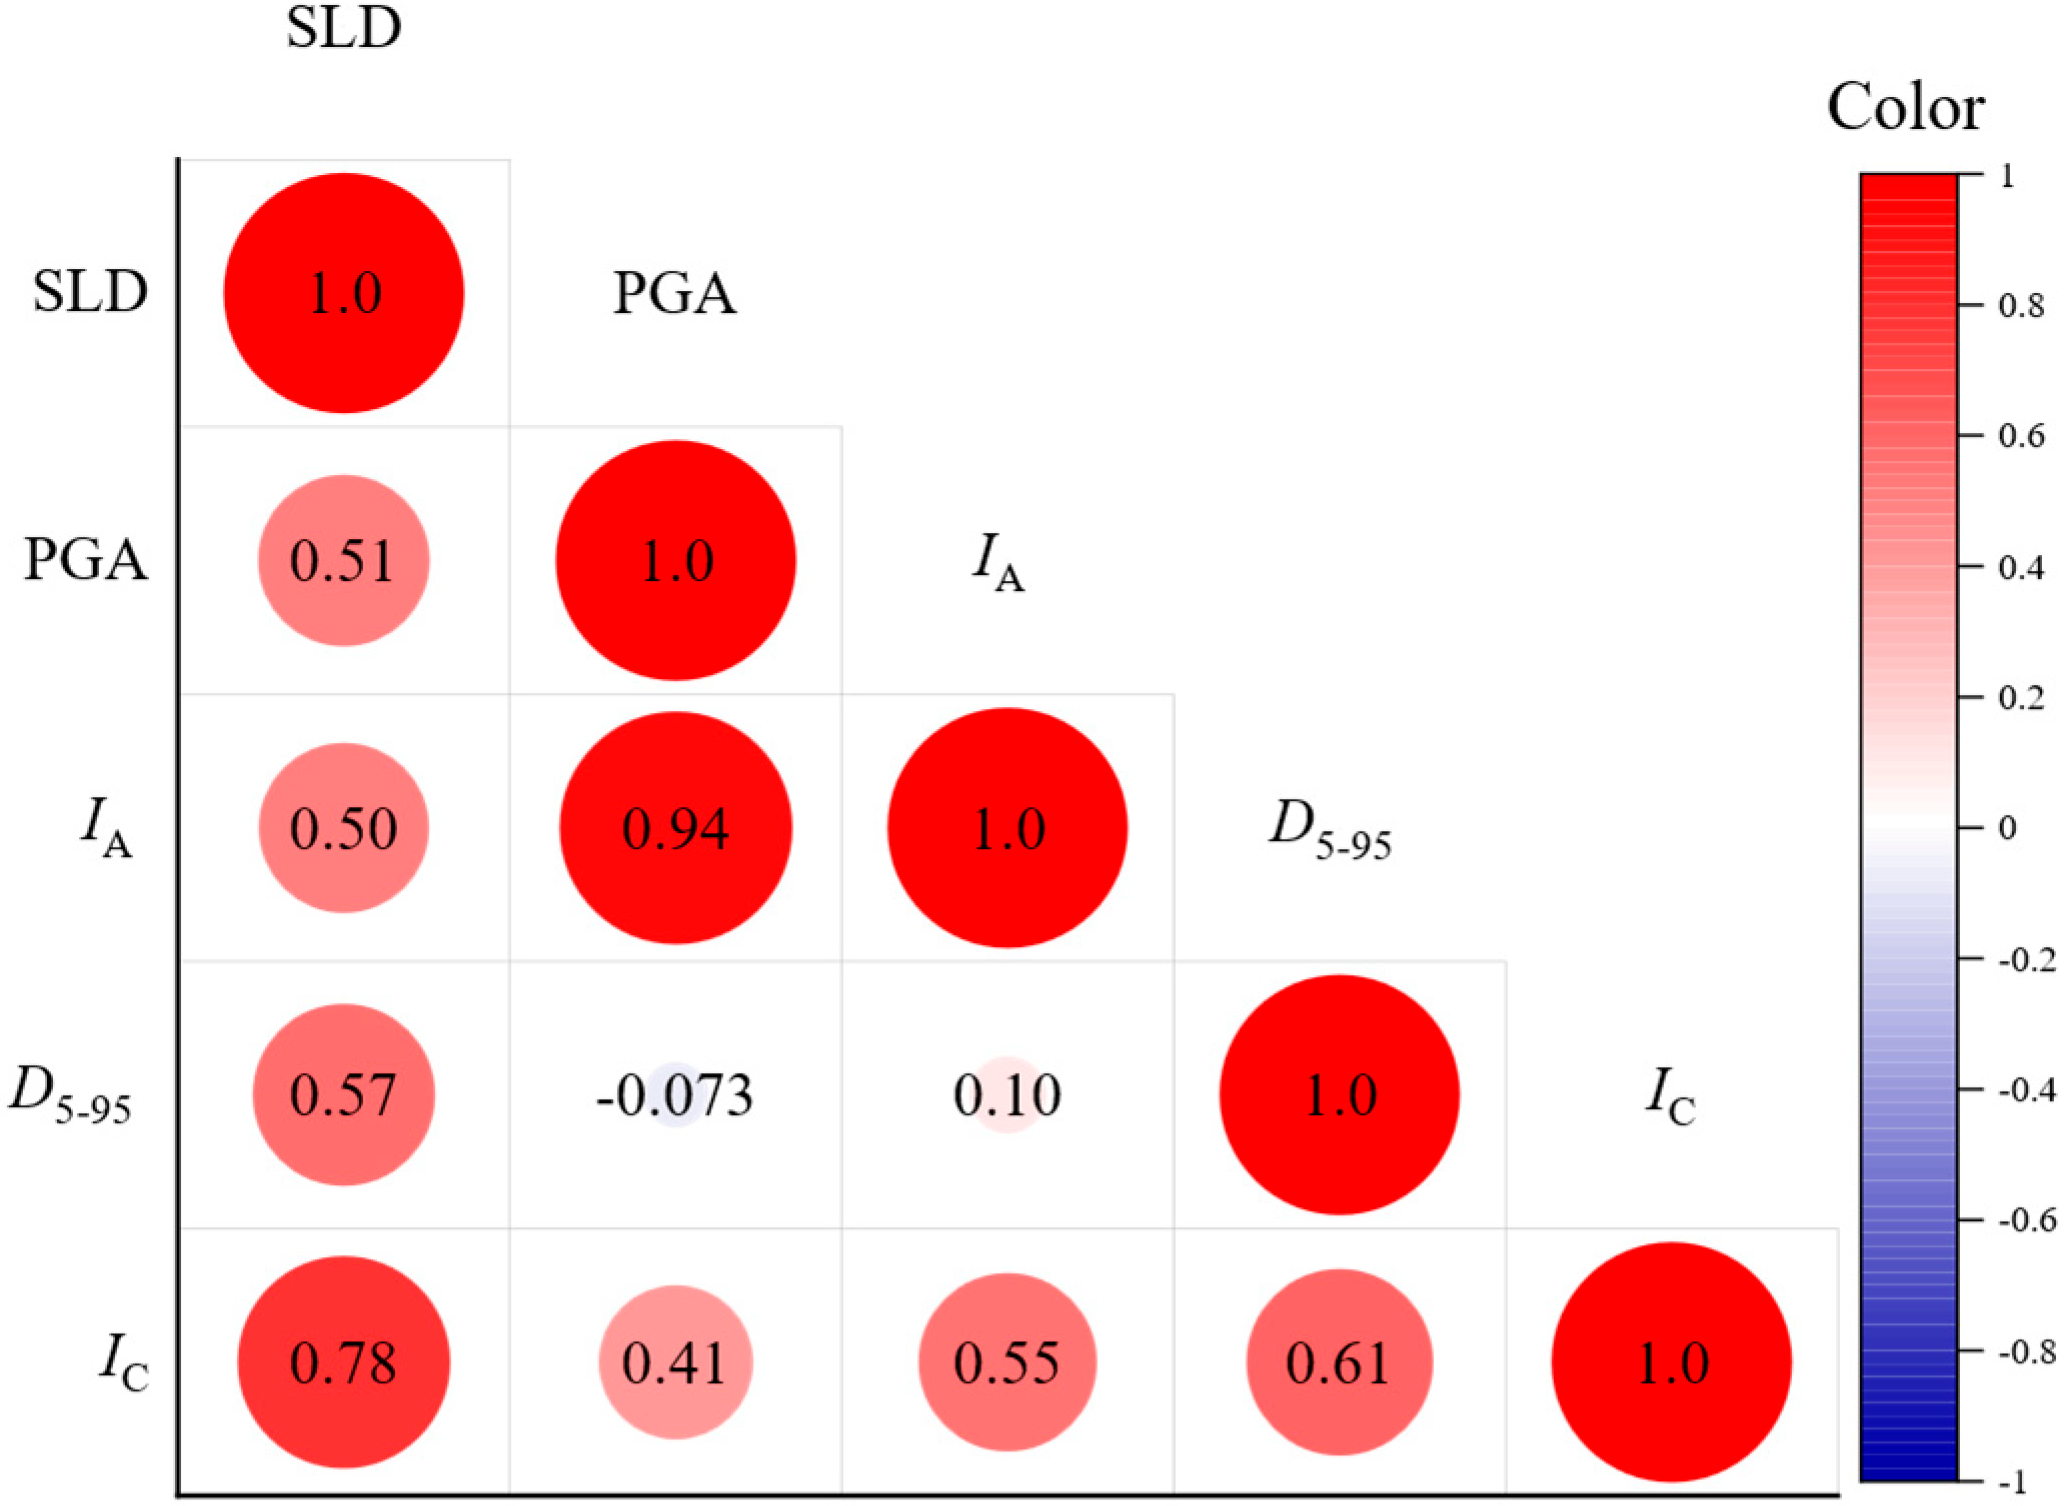
To evaluate the relationship between EDPs and ground motion, a series of scatter plots was plotted comparing SLD with four ground motion parameters (see Table 1). As shown in Figure 7, the data points exhibit a high degree of dispersion across all four subplots, indicating the absence of a strong or consistent correlation between SLD and any single ground motion parameter. This observation is further confirmed by the correlation heatmap (see Figure 8), where the coefficients between SLD and PGA, IA, Ic, and D5–95 all remain relatively in a very low range (i.e., <0.50).
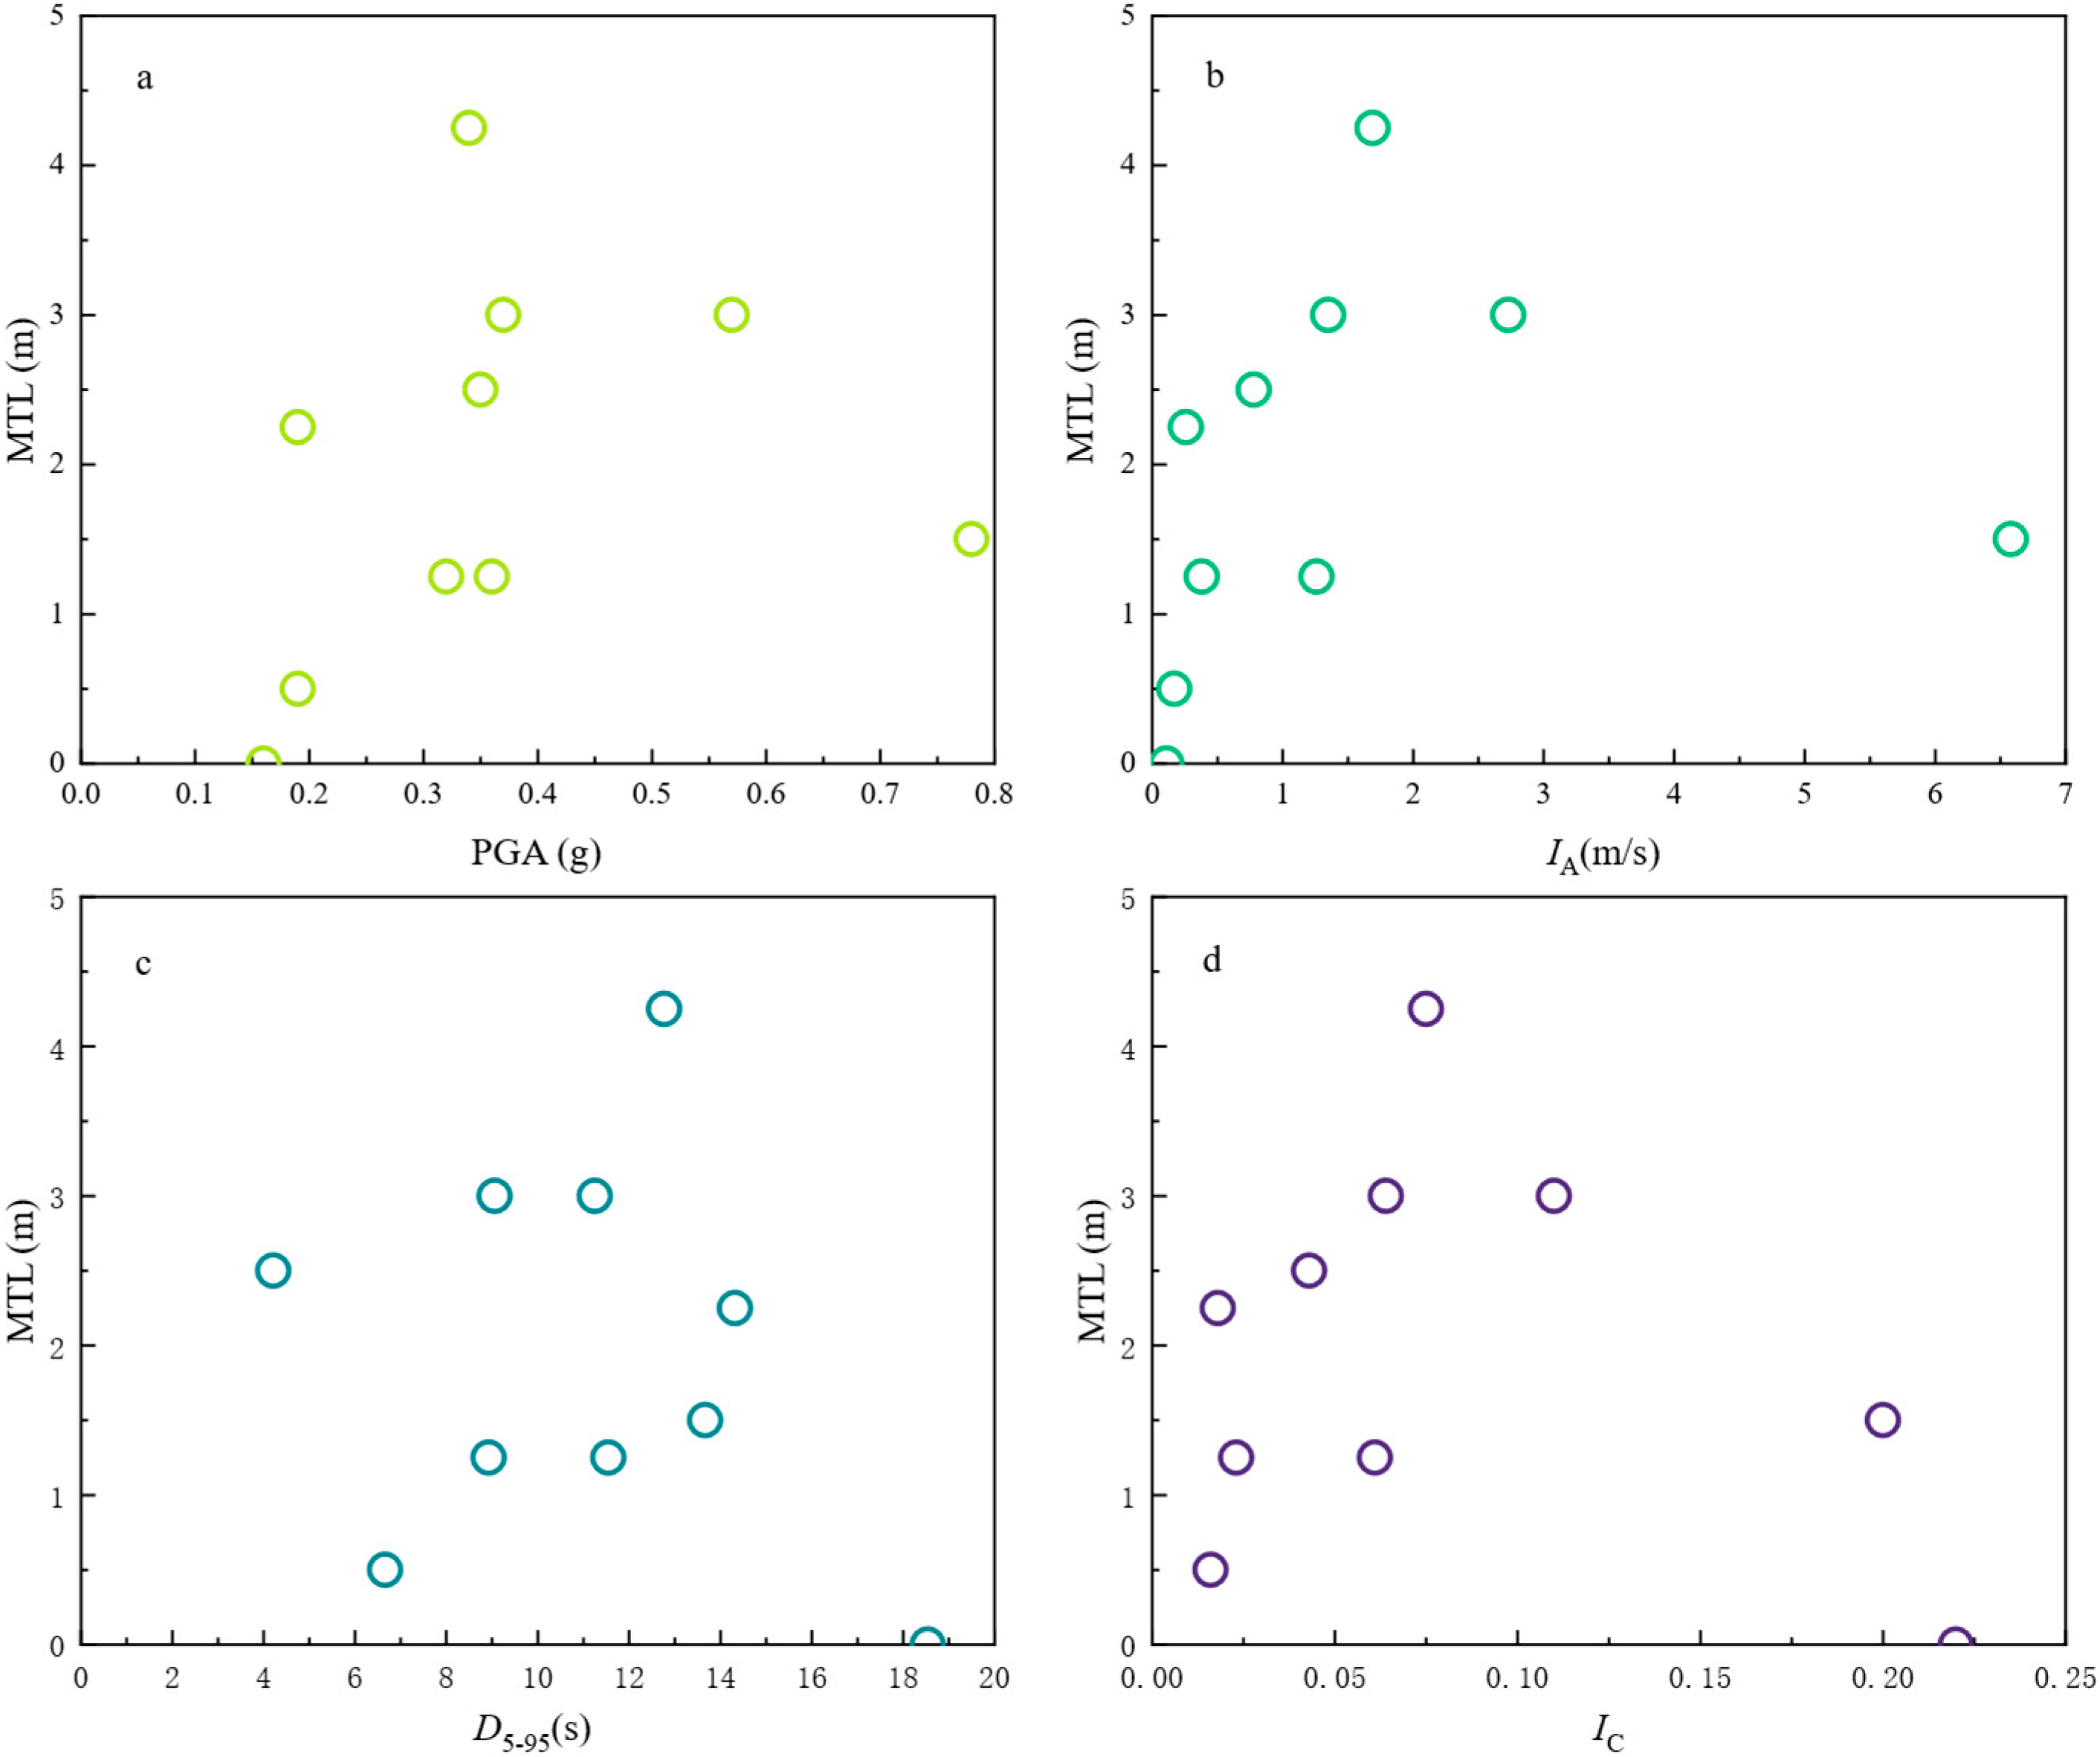
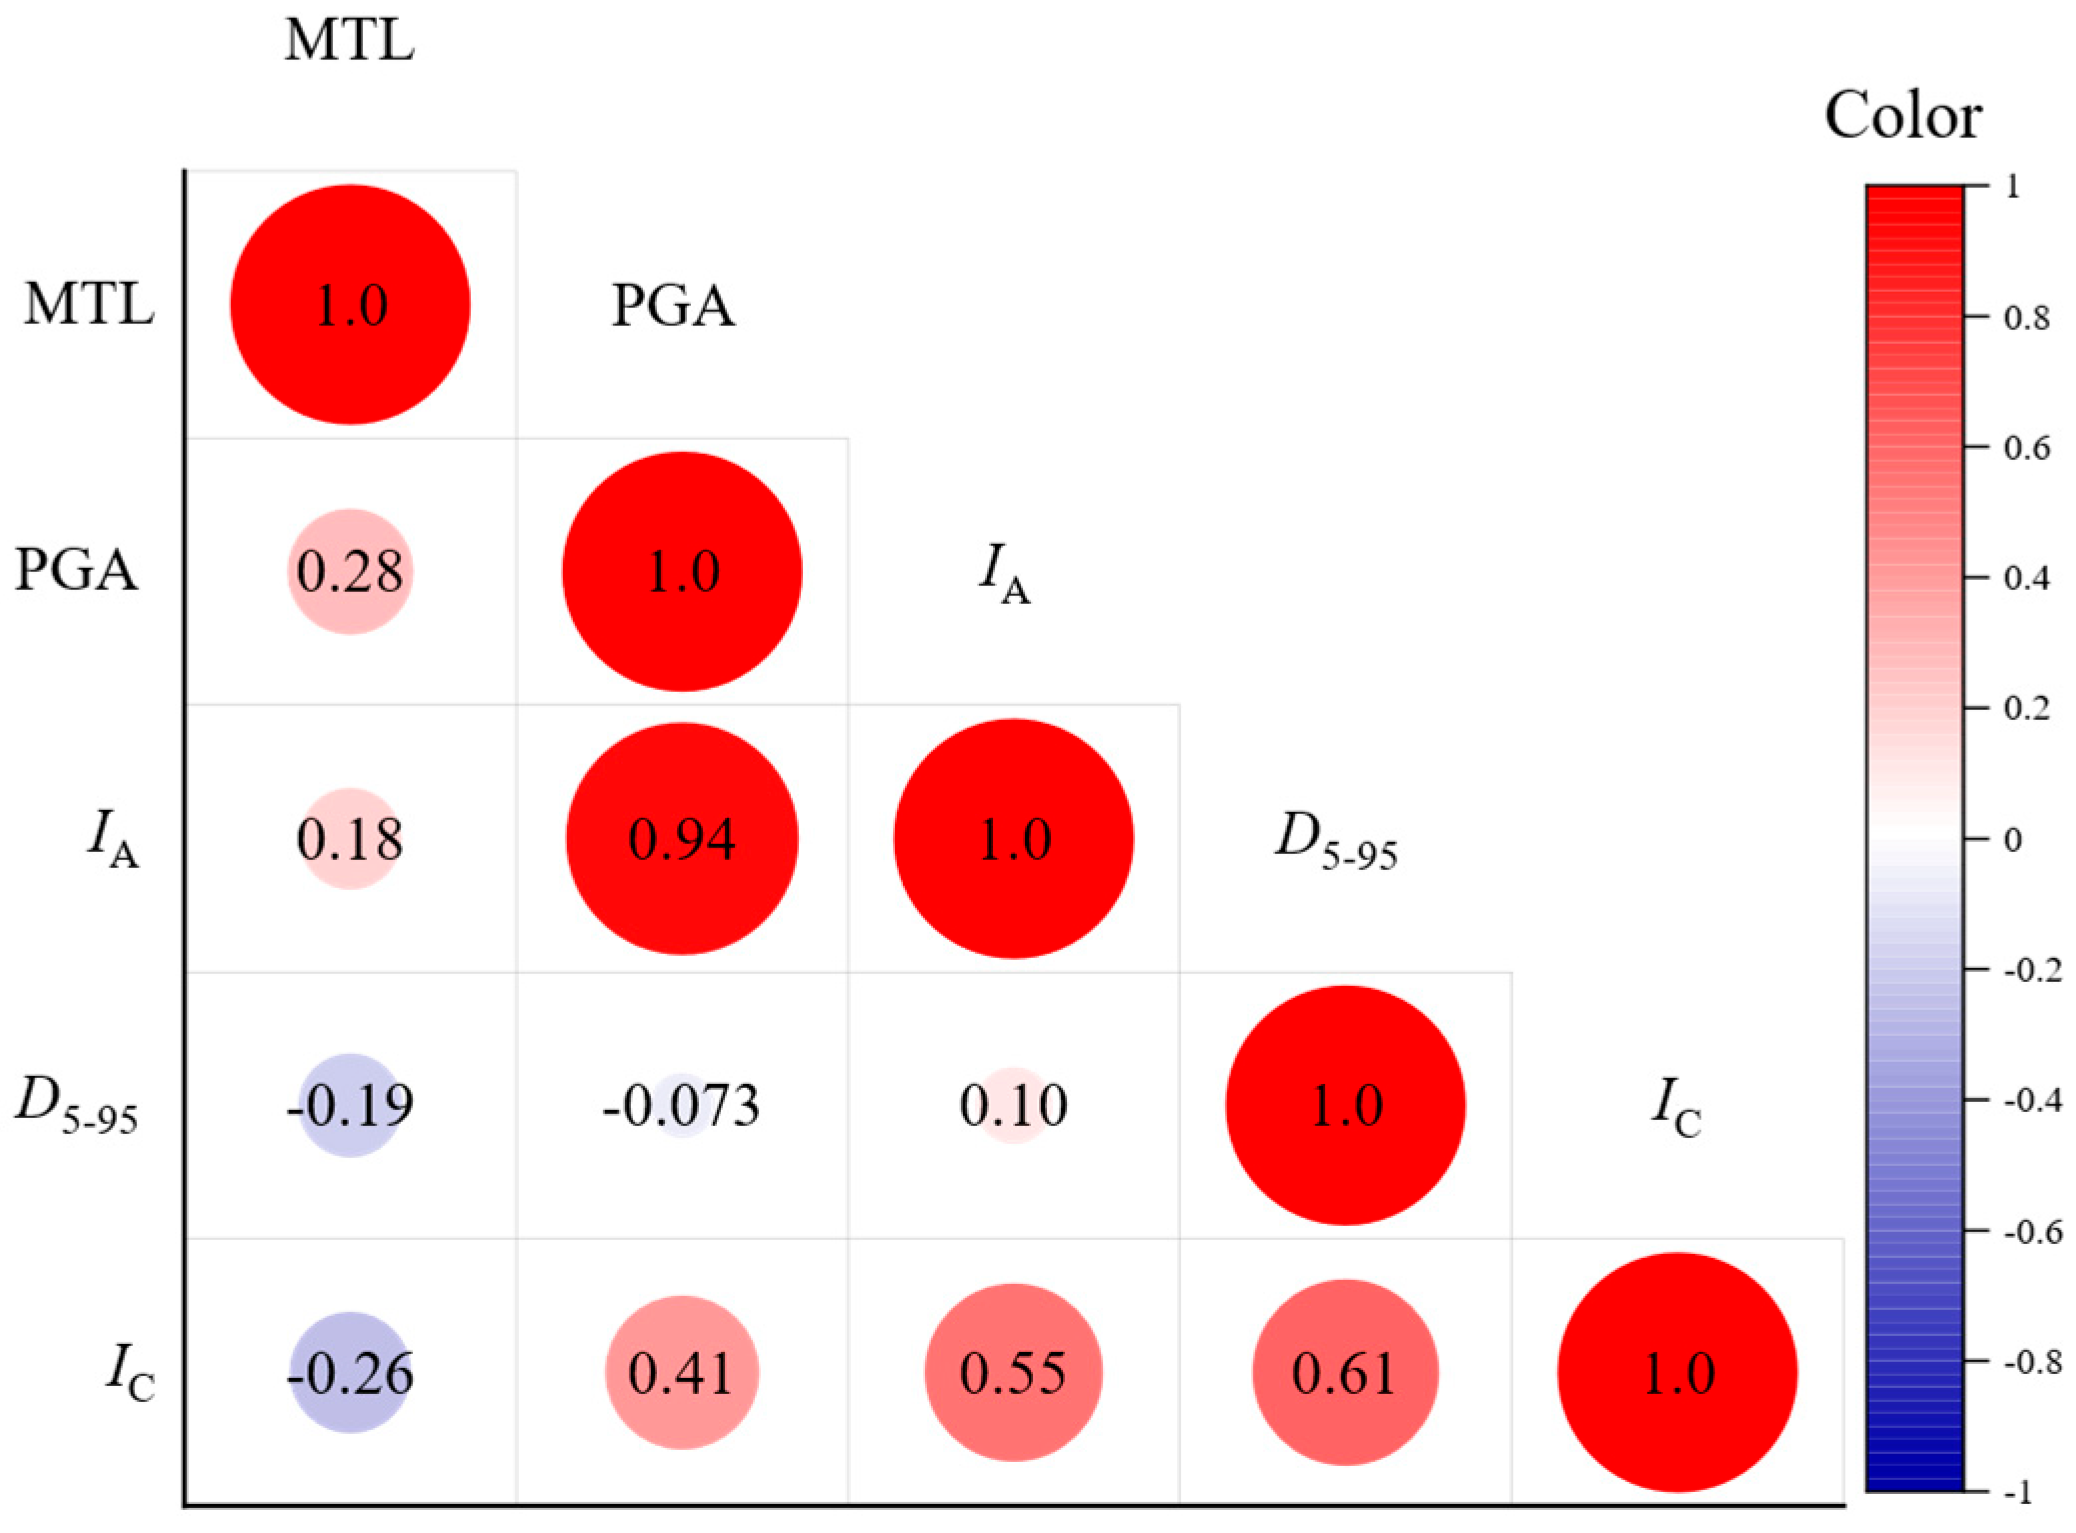
Beyond surface lateral displacement, the maximum thickness of the liquefied layer MTL was also examined as a critical indicator of liquefaction severity with the same four ground motion parameters [56]. The results in Figure 9 show remarkably low linear correlations between MTL and all four intensity measures. As shown in the correlation heatmap (see Figure 10), the coefficients are all close to zero, indicating no meaningful linear association. Visually, the corresponding scatter plots show highly dispersed distributions with no discernible trend or clustering, further confirming the lack of predictive power in these conventional parameters for explaining MTL behavior. The above phenomena suggest that liquefaction responses are influenced by more complex interactions and cannot simply be captured by any single ground motion intensity measure. This reinforces the necessity of developing more integrated or physics-informed intensity metrics that better reflect the mechanisms underlying liquefaction triggering and propagation.
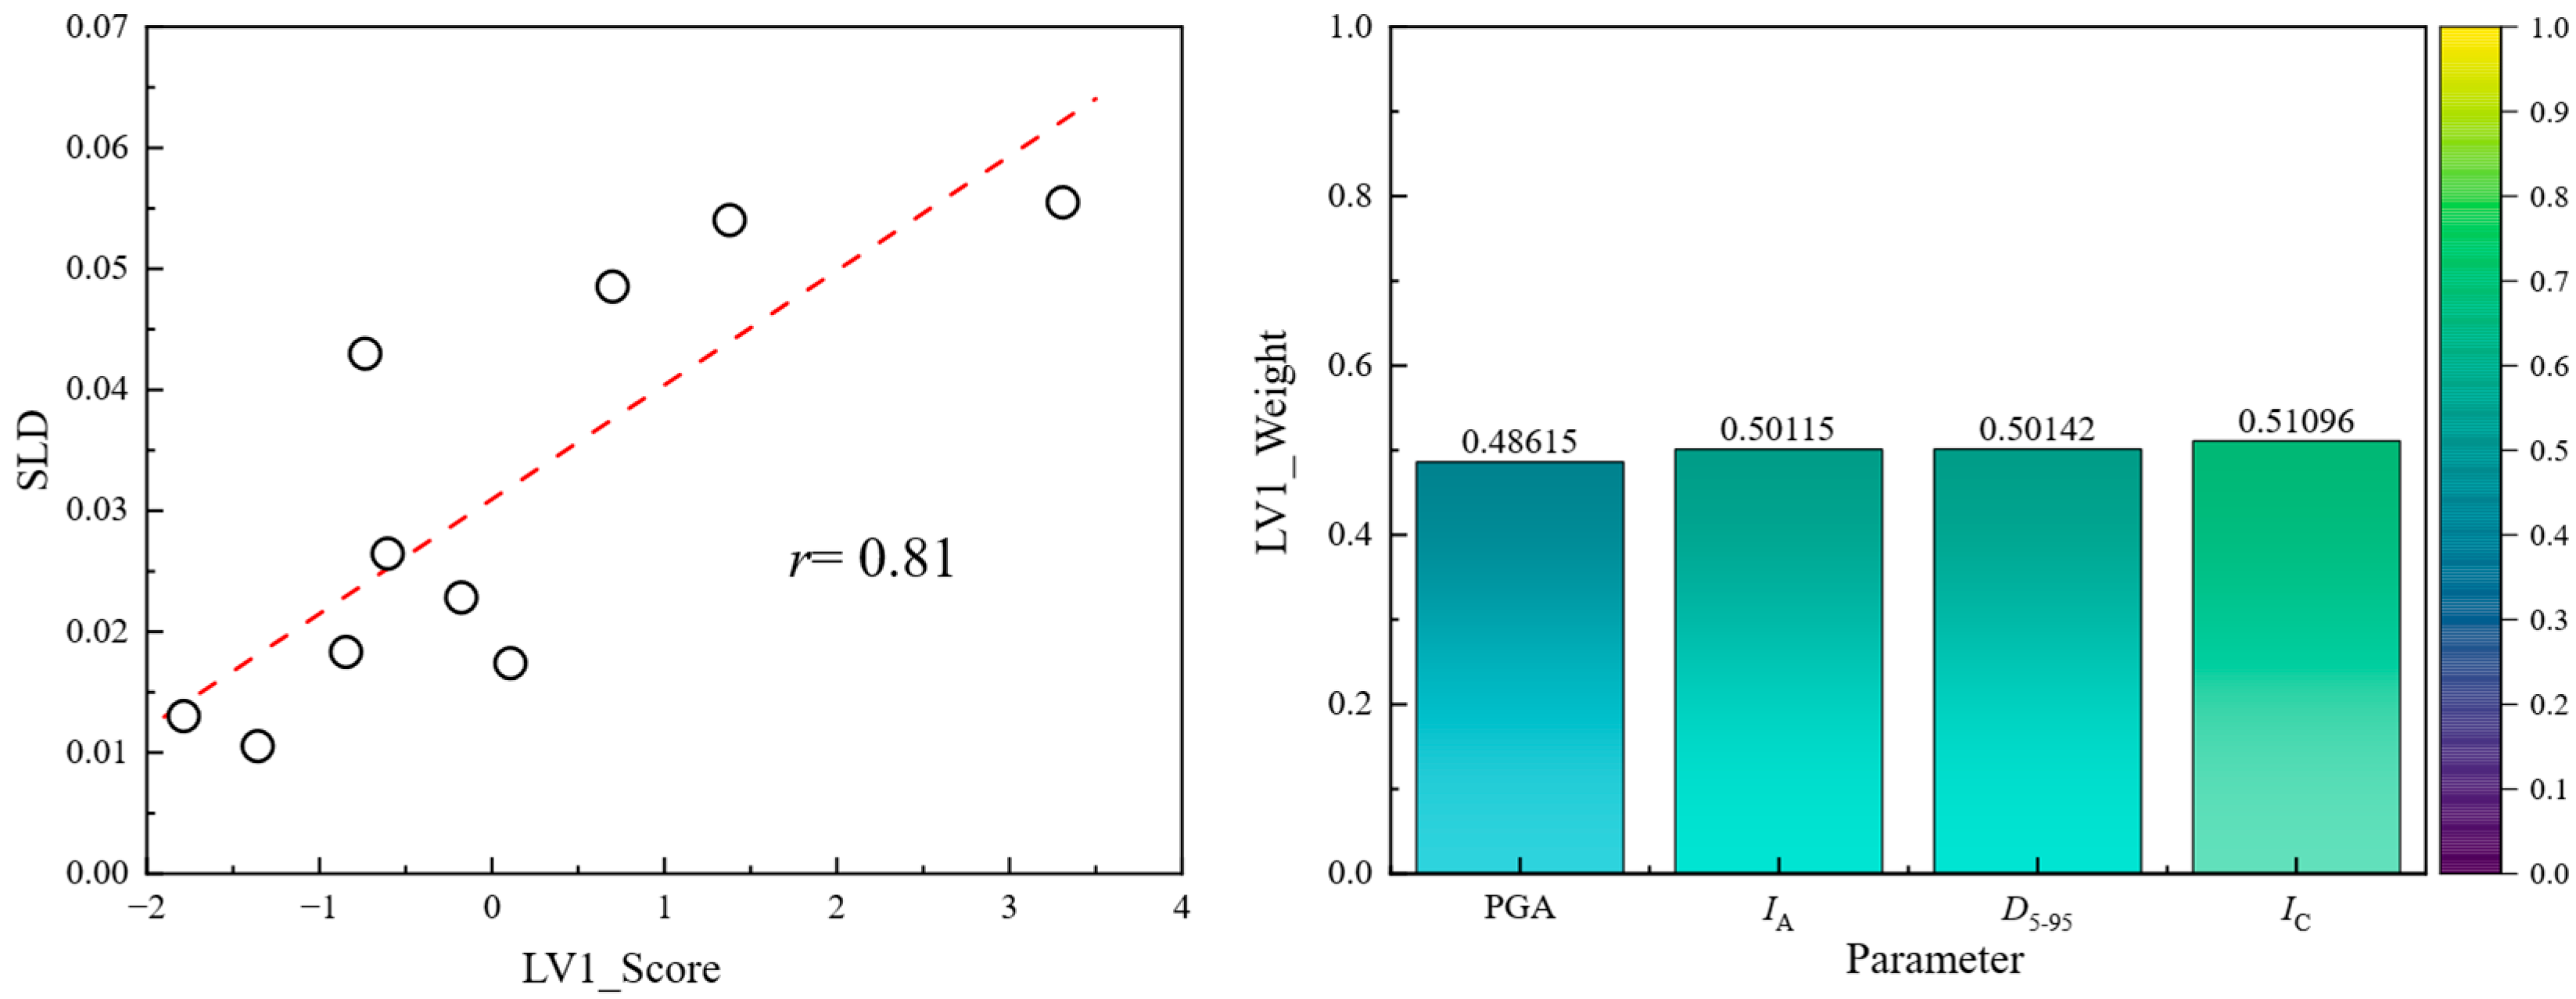
In light of the above observations, this study seeks to improve the predictive capacity of ground motion intensity measures for liquefaction response. Conventional single motion indicators such as PGA, IA, D5–95 and Ic were shown to exhibit only weak or negligible correlations with the engineering demand parameters (EDPs), particularly the surface lateral displacement (SLD) and the maximum thickness of the liquefied zone (MTL). To address this limitation, Partial Least Squares regression (PLS) was adopted [57], as it is capable of handling strongly collinear predictors and constructing composite variables that maximize covariance with the target responses. To determine the optimal number of latent variables (LVs) in the PLS regression and prevent overfitting, we applied Leave-One-Out Cross-Validation (LOOCV). In each iteration, one of the ten ground motion records was set aside as the validation set, and the remaining nine were used to develop PLS models with 1 to 4 LVs. The prediction residual sum of squares (PRESS) was calculated for the omitted record. This procedure was repeated for all ten records. The resulting PRESS values showed that the prediction error reached its minimum when only one LV was included. Adding further LVs did not lead to a notable improvement in prediction accuracy, suggesting that extra components were modeling noise rather than meaningful signal—a typical symptom of overfitting. Therefore, the final PLS model was constructed using a single LV, balancing predictive performance with model simplicity and generalizability. This method thus provides a balance between physical interpretability and data-driven optimization. After PLS regression, the first latent variable (LV1) score exhibits a significantly enhanced correlation with SLD, increasing from approximately 0.59 (the average of four correlation coefficients) for the best single parameter to 0.81 (see Figure 11). This substantial improvement confirms that LV1 effectively captures the combined influence of amplitude, energy, and duration measures. In particular, the comparable weights of Ic, IA, and D5–95 underscore the importance of both frequency-dependent intensity and cumulative energy input [58], whereas PGA alone contributes less. These results highlight that integrated demand parameters derived from PLS provide a markedly more robust predictor of liquefaction-induced lateral displacement than any individual conventional measure.
In addition to SLD, the applicability of PLS regression was also examined for predicting the maximum thickness of the liquefied zone (MTL). The same procedure was adopted by treating the four conventional ground motion intensity measures as predictors and MTL as the response variable. The first latent variable (LV1) extracted from PLS regression was then correlated with the observed MTL to evaluate its explanatory power. The results indicated that the LV1 score showed only a very weak correlation with MTL (r ≈ 0.11) [59], and the associated variable weights did not reveal any dominant contribution from a specific parameter. This finding contrasts sharply with the significant improvement obtained for SLD. The lack of predictive capability for MTL can be attributed to several reasons. First, unlike surface lateral displacement, which is directly influenced by cumulative seismic demand, the extent of liquefaction propagation is strongly governed by intrinsic soil properties such as permeability, fine content, and stratigraphic fabric [60]. These factors control pore pressure dissipation and vertical drainage pathways, which are not captured by ground motion intensity measures. Second, the development of MTL is inherently a nonlinear process involving complex pore pressure redistribution and soil–water interactions. Linear combinations of input motion parameters, even when optimized by PLS, cannot adequately represent such mechanisms. Finally, the limited number of ground motion records introduces additional statistical uncertainty, making the prediction of MTL more challenging.
PGA directly governs the maximum inertial force imposed on the soil skeleton by ground motion, serving as the liquefaction trigger mechanism—a process characterized by high nonlinearity. IA, whose physical essence is the total energy input of the seismic motion, acts as the energy driver for liquefaction, determining the energy budget and total damage accumulation; it typically exhibits a strong positive correlation with liquefaction potential. D5–95 signifies the duration of the strong shaking phase, governing the number of cyclic loading cycles and the extent of cumulative effects during liquefaction, with its influence being nonlinear. IC represents the filtered cumulative absolute effect, serving as an indicator of engineering damage in liquefaction analysis and being closely linked to permanent deformation. It is characterized by robust linearity, exhibiting strong correlations with liquefaction manifestations.
In summary, the influence of seismic motion parameters on liquefaction response is a complex process involving coupled mechanisms. PGA is responsible for “igniting” the process, IA supplies the “fuel”, D5–95 controls the “burn time”, and IC provides a superior measure of the “total extent of the burn”. Understanding the unique roles and sensitivities of these parameters is crucial for conducting scientific and precise risk assessments of liquefaction hazards.
Overall, the comparative analysis demonstrates a clear distinction between deformation-related and extent-related liquefaction responses. While the PLS-based composite index substantially improves the prediction of SLD, raising the correlation from 0.59 to 0.81, it still fails to provide meaningful predictive capacity for MTL. This indicates that surface lateral displacement is strongly motion-driven and can be effectively captured by integrated ground motion descriptors [61], whereas the vertical extent of liquefaction is primarily soil-controlled and cannot be explained by seismic demand parameters alone [62]. These insights underline the necessity of employing multivariate demand measures for displacement prediction, while integrating geotechnical and hydro-mechanical properties for assessing liquefaction extent, thereby paving the way for more reliable performance-based liquefaction hazard evaluations.

Parameter Sensitivity Analysis on MTL

To directly validate the conclusion that the Maximum Thickness of the Liquefied layer (MTL) is predominantly governed by intrinsic soil properties, a systematic sensitivity analysis was conducted focusing on two fundamental soil parameters: hydraulic conductivity and relative density. All analyses were performed using the baseline model (with a total height H = 20 m, relative density Dr = 0.20, and saturated hydraulic conductivity ks = 1.0 × 10⁻⁷ m/s) subjected to the Friuli ground motion record.
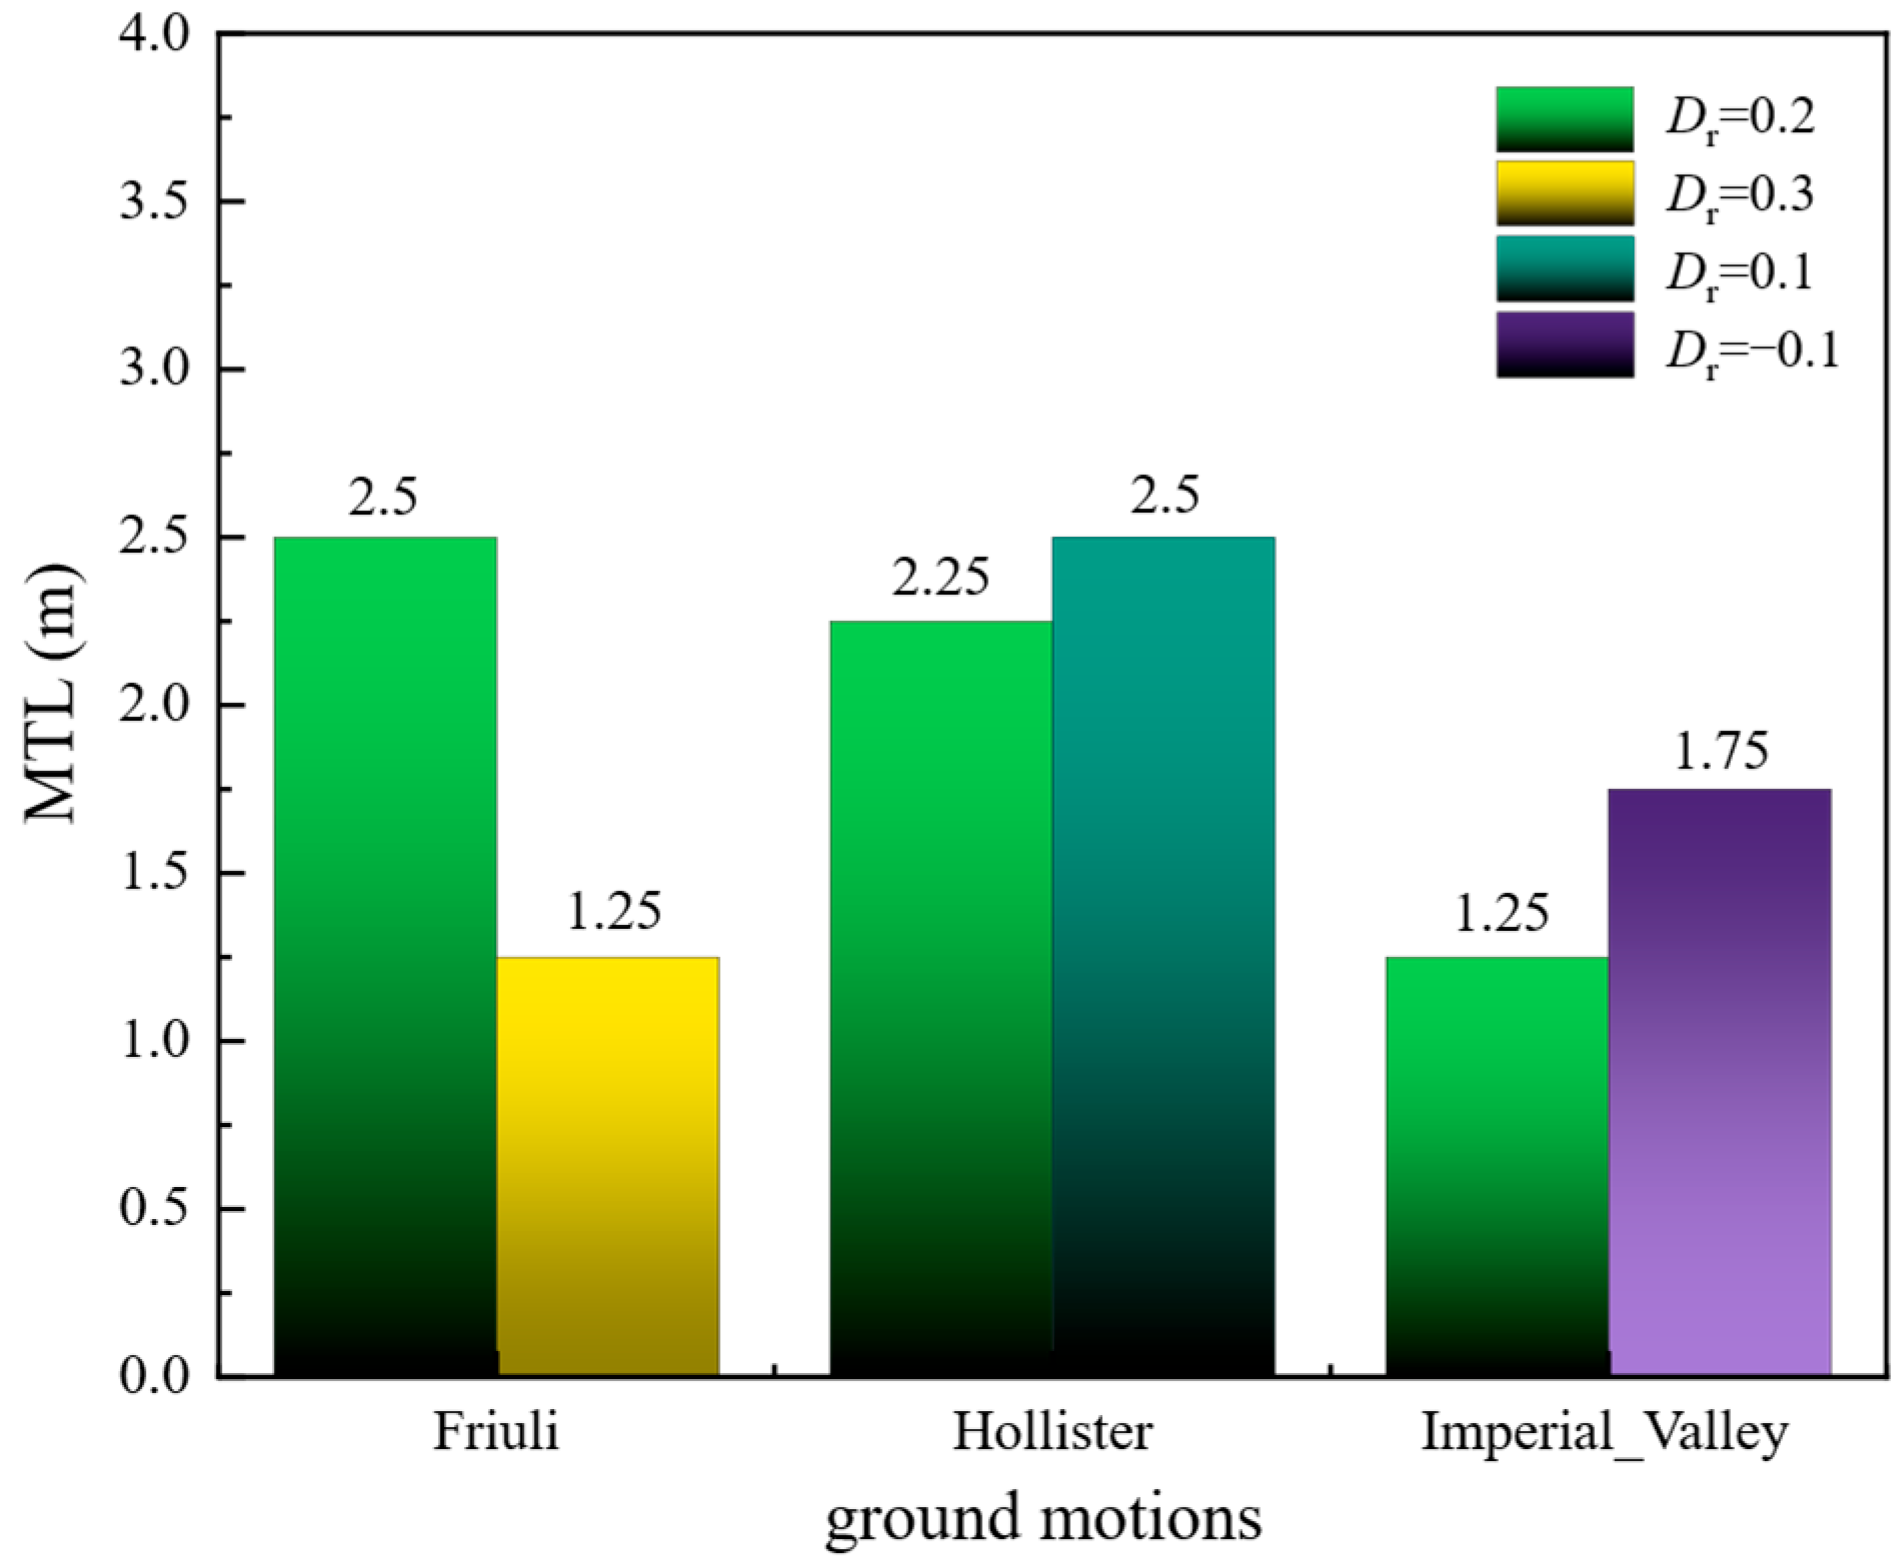
Influence of Relative Density: The effect of the soil’s initial state was examined by varying the relative density from the original state (Dr = 0.20) to Dr = −0.10, 0.10, and 0.30. The analysis revealed a pronounced inhibitory effect of increasing relative density on the MTL. At Dr = 0.30, the increased resistance to liquefaction of the denser soil led to a dramatic reduction in the MTL, representing a decrease of nearly 50% compared to the baseline loose state (Dr = 0.20). Conversely, at Dr = −0.10 and 0.10, the reduced resistance to liquefaction of the looser soil resulted in a progressive increase in the MTL (see Figure 12). This strong negative correlation provides compelling evidence that the initial compactness of the soil, represented by the relative density, is an intrinsic governing factor that dictates the initiation and significant propagation of liquefaction.
Influence of Hydraulic Conductivity: The sensitivity of MTL to the saturated hydraulic conductivity was investigated by varying ks over two orders of magnitude [63], from 1.0 × 10⁻⁶ m/s to 1.0 × 10⁻⁸ m/s. The results demonstrated a profound sensitivity of MTL to this parameter. A lower hydraulic conductivity (ks = 1.0 × 10⁻⁸ m/s) significantly impeded the dissipation of excess pore water pressure, leading to a downward extension of the liquefied zone. Conversely, a higher hydraulic conductivity (ks = 1.0 × 10⁻⁶ m/s) facilitated drainage and pressure dissipation, which suppressed the development of liquefaction. This stark contrast unequivocally identifies the soil’s drainage capacity, characterized by its hydraulic conductivity, as another decisive factor controlling the vertical extent of liquefaction.
This targeted sensitivity analysis provides direct numerical evidence supporting the core conclusion. While ground motion characteristics supply the triggering energy for liquefaction, the vertical propagation of the liquefaction front—quantified by the MTL—is primarily controlled by the intrinsic soil properties of drainage capacity (hydraulic conductivity) and initial compactness (relative density). The magnitude of MTL variation induced by these two soil parameters is overwhelming compared to the minor dispersion observed when correlating MTL with various ground motion intensity measures.

7. Conclusions

In this study, a series of dynamic analyses were conducted on a saturated sand column representative of Yinchuan soil using the Dafalias–Manzari constitutive model. The model parameters were meticulously calibrated by laboratory experiments. Ten actual earthquake records were applied to simulate seismic loading, aiming to evaluate liquefaction behavior and its correlation with ground motion characteristics. Based on the numerical and statistical analyses, the main conclusions are as follows.
(1)
The Dafalias–Manzari model proved effective in capturing key features of seismic liquefaction, including pore pressure buildup, stiffness degradation, and permanent ground deformation under various earthquake inputs. The Dafalias–Manzari model proved effective in capturing key features of seismic liquefaction, including pore pressure buildup, stiffness degradation, and permanent ground deformation under various earthquake inputs.
(2)
Two critical engineering demand parameters (i.e., SLD and MTL) exhibited weak correlations with conventional ground motion parameters (PGA, IA, D5–95, Ic), indicating the limitations of using these parameters alone for performance-based liquefaction assessment.
(3)
By integrating multiple intensity measures through Partial Least Squares (PLS) regression, the prediction of SLD was significantly improved (correlation increased to 0.81), demonstrating the potential of composite seismic indicators in engineering evaluation. However, MTL remained poorly predicted, emphasizing the need to incorporate site-specific soil properties in liquefaction extent assessment.

Author Contributions

Conceptualization, B.H., W.J., Y.Z. and Z.Z.; Methodology, B.H., W.J., Y.Z., S.Q. and Z.Z.; Software, S.Q.; Formal analysis, Z.Z.; Data curation, S.Q.; Writing—original draft, S.Q.; Writing—review & editing, B.H., W.J., Y.Z. and Z.Z.; Supervision, Z.Z. All authors have read and agreed to the published version of the manuscript.

Funding

The financial support provided by the Natural Science Foundation of Ningxia Province (Grant No. 2023AAC03773) and National Natural Science Foundation of China (Grant No. 42307190) is deeply acknowledged.

Data Availability Statement

The original contributions presented in the study are included in the article material. Further inquiries can be directed to the corresponding author.

Conflicts of Interest

The authors declare no conflicts of interest.

References

  1. Yao, C.; Zhong, H.; Zhu, Z. Development of a Large Shaking Table Test for Sand Liquefaction Analysis. Lithosphere 2024, 2024, 2. [Google Scholar] [CrossRef]
  2. Li, Q.; Zhu, Z. Calibration of an elastoplastic model of sand liquefaction using the swarm intelligence with a multi-objective function. J. Rock Mech. Geotech. Eng. 2023, 15, 789–802. [Google Scholar] [CrossRef]
  3. Wu, L.; Cheng, W.; Zhu, Z. Fractional-Order Elastoplastic Modeling of Sands Considering Cyclic Mobility. J. Mar. Sci. Eng. 2021, 9, 354. [Google Scholar] [CrossRef]
  4. Seed, H.B.; Idriss, I.M. Simplified Procedure for Evaluating Soil Liquefaction Potential. J. Soil Mech. Found. Div. 1971, 97, 1249–1273. [Google Scholar] [CrossRef]
  5. Arias, A. A measure of earthquake intensity. In Seismic Design for Nuclear Plants; MIT Press: Cambridge, MA, USA, 1970; pp. 438–483. [Google Scholar]
  6. Kayen, R.E.; Mitchell, J.K. Assessment of Liquefaction Potential during Earthquakes by Arias Intensity. J. Geotech. Geoenviron. Eng. 1997, 123, 1162–1174. [Google Scholar] [CrossRef]
  7. Bommer, J.J.; Martínez-Pereira, A. The Effective Duration of Earthquake Strong Motion. J. Earthq. Eng. 1999, 3, 127–172. [Google Scholar] [CrossRef]
  8. Kramer, S.L.; Mitchell, R.A. Ground Motion Intensity Measures for Liquefaction Hazard Evaluation. Earthq. Spectra 2006, 22, 413–438. [Google Scholar] [CrossRef]
  9. Kayen, R.; Moss, R.E.S.; Thompson, E.M.; Seed, R.B.; Cetin, K.O.; Der Kiureghian, A.; Tanaka, Y.; Tokimatsu, K. Shear-Wave Velocity–Based Probabilistic and Deterministic Assessment of Seismic Soil Liquefaction Potential. J. Geotech. Geoenviron. Eng. 2013, 139, 407–419. [Google Scholar] [CrossRef]
  10. Kramer, S.L.; Stewart, J.P. Geotechnical Earthquake Engineering; CRC Press: Boca Raton, FL, USA, 2024. [Google Scholar]
  11. Wood, C.M.; Cox, B.R.; Green, R.A.; Wotherspoon, L.M.; Bradley, B.A.; Cubrinovski, M. Vs-Based Evaluation of Select Liquefaction Case Histories from the 2010–2011 Canterbury Earthquake Sequence. J. Geotech. Geoenviron. Eng. 2017, 143, 04017066. [Google Scholar] [CrossRef]
  12. Boulanger, R.W.; Idriss, I.M. CPT and SPT Based Liquefaction Triggering Procedures; Report No. UCD/CGM-14/01; University of California: Davis, CA, USA, 2014. [Google Scholar]
  13. Iwasaki, T.; Arakawa, T.; Tokida, K.-I. Simplified procedures for assessing soil liquefaction during earthquakes. Int. J. Soil Dyn. Earthq. Eng. 1984, 3, 49–58. [Google Scholar] [CrossRef]
  14. Liu, C.; Macedo, J. Machine learning-based models for estimating liquefaction-induced building settlements. Soil Dyn. Earthq. Eng. 2024, 182, 108673. [Google Scholar] [CrossRef]
  15. GB/T 50123-2019; Standard for Geotechnical Testing Method. China Planning Press: Beijing, China, 2019.
  16. Liu, Y.; Zhang, Q.; Liu, R. Effect of particle size distribution and shear rate on relative viscosity of concentrated suspensions. Rheol. Acta 2021, 60, 763–774. [Google Scholar] [CrossRef]
  17. Knippel, E.P.; Xiong, Q.; Vargas, A.P.V.; Hampton, J.C. Measurements of elastic properties and their dependencies within a damage mechanics workflow. Rock Mech. Bull. 2023, 2, 100083. [Google Scholar] [CrossRef]
  18. Zhu, Z.; Zhang, F.; Dupla, J.-C.; Canou, J.; Foerster, E. Investigation on the undrained shear strength of loose sand with added materials at various mean diameter ratios. Soil Dyn. Earthq. Eng. 2020, 137, 106276. [Google Scholar] [CrossRef]
  19. Sarkar, G.; Sadrekarimi, A. Undrained shearing behaviour of oil sands tailings. Soil Dyn. Earthq. Eng. 2022, 161, 107410. [Google Scholar] [CrossRef]
  20. Kang, Y.; Qiang, Z.; Fengming, L.; Tingcheng, Z.; Pengfei, C.; Haonan, L.; Yu, B.; Panbo, D.; Jiang, L.; Zishan, J.; et al. Simulation of gangue bulk tamping technology in solid filling mining: A method for performance evaluation. Powder Technol. 2025, 466, 121404. [Google Scholar] [CrossRef]
  21. Zhang, H.; Jin, Y.; Liu, Q.; Zhao, Y.; Gao, Q. Intelligent monitoring method for tamping times during dynamic compaction construction using machine vision and pattern recognition. Measurement 2022, 193, 110835. [Google Scholar] [CrossRef]
  22. Skempton, A.W. The pore-pressure coefficients A and B. Geotechnique 1954, 4, 143–147. [Google Scholar] [CrossRef]
  23. Gharehdaghi, M.; Shahbodagh, B.; Khalili, N. Pore pressure parameters for unsaturated soils. Comput. Geotech. 2024, 172, 106441. [Google Scholar] [CrossRef]
  24. Dafalias, Y.F.; Manzari, M.T. Simple Plasticity Sand Model Accounting for Fabric Change Effects. J. Eng. Mech. 2004, 130, 622–634. [Google Scholar] [CrossRef]
  25. Cheviakov, A.; Ganghoffer, J.-F.; Rahouadj, R. Finite strain plasticity models revealed by symmetries and integrating factors: The case of Dafalias spin model. Int. J. Plast. 2012, 44, 47–67. [Google Scholar] [CrossRef]
  26. Xu, M.; Wang, L.; Wang, L.; Guo, Z.; Zhou, W. Influence of bounding surface plasticity-based soil-structure interaction model on integrated dynamic behaviour of jacket offshore wind turbines. Ocean Eng. 2024, 298, 117204. [Google Scholar] [CrossRef]
  27. Ishihara, K.; Okada, S. Effects of Stress History on Cyclic Behavior of Sand. Soils Found. 1978, 18, 31–45. [Google Scholar] [CrossRef] [PubMed]
  28. Salem, M.; Elmamlouk, H.; Agaiby, S. Static and cyclic behavior of North Coast calcareous sand in Egypt. Soil Dyn. Earthq. Eng. 2013, 55, 83–91. [Google Scholar] [CrossRef]
  29. Zhu, M.; McKenna, F.; Scott, M.H. OpenSeesPy: Python library for the OpenSees finite element framework. SoftwareX 2018, 7, 6–11. [Google Scholar] [CrossRef]
  30. Cai, M.; Kaiser, P.; Morioka, H.; Minami, M.; Maejima, T.; Tasaka, Y.; Kurose, H. FLAC/PFC coupled numerical simulation of AE in large-scale underground excavations. Int. J. Rock Mech. Min. Sci. 2007, 44, 550–564. [Google Scholar] [CrossRef]
  31. Wheeler, S.J.; Sivakumar, V. An elasto-plastic critical state framework for unsaturated soil. Geotech. 1995, 45, 35–53. [Google Scholar] [CrossRef]
  32. Yao, Y.; Sun, D.; Luo, T. A critical state model for sands dependent on stress and density. Int. J. Numer. Anal. Methods Geomech. 2004, 28, 323–337. [Google Scholar] [CrossRef]
  33. Asgarpoor, M.; Taiebat, M. Role of ground motion characteristics in liquefaction triggering and lateral displacements of sloping grounds. Soil Dyn. Earthq. Eng. 2025, 198, 109555. [Google Scholar] [CrossRef]
  34. Stam, C. Nonlinear dynamical analysis of EEG and MEG: Review of an emerging field. Clin. Neurophysiol. 2005, 116, 2266–2301. [Google Scholar] [CrossRef]
  35. Chowdhury, S. Earthquake Response Analysis of Pond Ash Deposit with Geocell Reinforcement. Iran. J. Sci. Technol. Trans. Civ. Eng. 2024, 48, 4007–4022. [Google Scholar] [CrossRef]
  36. Knight, R.; Pyrak-Nolte, L.J.; Slater, L.; Atekwana, E.; Endres, A.; Geller, J.; Lesmes, D.; Nakagawa, S.; Revil, A.; Sharma, M.M.; et al. Geophysics at the interface: Response of geophysical properties to solid-fluid, fluid-fluid, and solid-solid interfaces. Rev. Geophys. 2010, 48, RG4002. [Google Scholar] [CrossRef]
  37. Kuhlemeyer, R.L.; Lysmer, J. Finite Element Method Accuracy for Wave Propagation Problems. J. Soil Mech. Found. Div. 1973, 99, 421–427. [Google Scholar] [CrossRef]
  38. Descloitres, M.; Ribolzi, O.; Le Troquer, Y.; Thiébaux, J.P. Study of water tension differences in heterogeneous sandy soils using surface ERT. J. Appl. Geophys. 2008, 64, 83–98. [Google Scholar] [CrossRef]
  39. Ozgur, A.; Leveque, O.; Tse, D. Spatial Degrees of Freedom of Large Distributed MIMO Systems and Wireless Ad Hoc Networks. IEEE J. Sel. Areas Commun. 2013, 31, 202–214. [Google Scholar] [CrossRef]
  40. Crama, P.; Schoukens, J. Initial estimates of Wiener and Hammerstein systems using multisine excitation. IEEE Trans. Instrum. Meas. 2001, 50, 1791–1795. [Google Scholar] [CrossRef]
  41. Chandler, A.M.; Lam, N.T. Performance-based design in earthquake engineering: A multi-disciplinary review. Eng. Struct. 2001, 23, 1525–1543. [Google Scholar] [CrossRef]
  42. Kunnath, S.K.; Chai, Y.H. Cumulative damage-based inelastic cyclic demand spectrum. Earthq. Eng. Struct. Dyn. 2004, 33, 499–520. [Google Scholar] [CrossRef]
  43. Lee, J.; Green, R.A. Predictive relations for significant durations in stable continental regions. In Proceedings of the 14th World Conference on Earthquake Engineering, Beijing, China, 12–17 October 2008. [Google Scholar]
  44. Yang, D.; Pan, J.; Li, G. Non-structure-specific intensity measure parameters and characteristic period of near-fault ground motions. Earthq. Eng. Struct. Dynam. 2009, 38, 1257–1280. [Google Scholar] [CrossRef]
  45. Kaklamanos, J.; Baise, L.G.; Boore, D.M. Estimating Unknown Input Parameters when Implementing the NGA Ground-Motion Prediction Equations in Engineering Practice. Earthq. Spectra 2011, 27, 1219–1235. [Google Scholar] [CrossRef]
  46. Chen, G.; Zhao, D.; Chen, W.; Juang, C.H. Excess Pore-Water Pressure Generation in Cyclic Undrained Testing. J. Geotech. Geoenviron. Eng. 2019, 145, 04019022. [Google Scholar] [CrossRef]
  47. Wang, B.; Zen, K.; Chen, G.; Zhang, Y.; Kasama, K. Excess pore pressure dissipation and solidification after liquefaction of saturated sand deposits. Soil Dyn. Earthq. Eng. 2013, 49, 157–164. [Google Scholar] [CrossRef]
  48. Bergaya, F.; Lagaly, G. General introduction: Clays, clay minerals, and clay science. Dev. Clay Sci. 2006, 1, 1–18. [Google Scholar]
  49. Beresnev, I.A.; Atkinson, G.M. FINSIM--a FORTRAN Program for Simulating Stochastic Acceleration Time Histories from Finite Faults. Seism. Res. Lett. 1998, 69, 27–32. [Google Scholar] [CrossRef]
  50. Pavlenko, O.V.; Irikura, K. Identification of the non-linear behaviour of liquefied and non-liquefied soils during the 1995 Kobe earthquake. Geophys. J. Int. 2005, 160, 539–553. [Google Scholar] [CrossRef]
  51. Likitlersuang, S.; Teachavorasinskun, S.; Surarak, C.; Oh, E.; Balasubramaniam, A. Small strain stiffness and stiffness degradation curve of Bangkok Clays. Soils Found. 2013, 53, 498–509. [Google Scholar] [CrossRef]
  52. Meisina, C.; Zucca, F.; Fossati, D.; Ceriani, M.; Allievi, J. Ground deformation monitoring by using the Permanent Scatterers Technique: The example of the Oltrepo Pavese (Lombardia, Italy). Eng. Geol. 2006, 88, 240–259. [Google Scholar] [CrossRef]
  53. Bobet, A. Effect of pore water pressure on tunnel support during static and seismic loading. Tunn. Undergr. Space Technol. 2003, 18, 377–393. [Google Scholar] [CrossRef]
  54. Hochstetter, A.; Vernekar, R.; Austin, R.H.; Becker, H.; Beech, J.P.; Fedosov, D.A.; Gompper, G.; Kim, S.-C.; Smith, J.T.; Stolovitzky, G.; et al. Deterministic Lateral Displacement: Challenges and Perspectives. ACS Nano 2020, 14, 10784–10795. [Google Scholar] [CrossRef]
  55. Maurer, B.W.; Green, R.A.; Cubrinovski, M.; Bradley, B.A. Evaluation of the Liquefaction Potential Index for Assessing Liquefaction Hazard in Christchurch, New Zealand. J. Geotech. Geoenviron. Eng. 2014, 140, 04014032. [Google Scholar] [CrossRef]
  56. Miyamoto, J.; Sassa, S.; Sekiguchi, H. Progressive solidification of a liquefied sand layer during continued wave loading. Geotechnique 2004, 54, 617–629. [Google Scholar] [CrossRef]
  57. Abdi, H. Partial least square regression (PLS regression). Encycl. Res. Methods Soc. Sci. 2003, 6, 792–795. [Google Scholar]
  58. Kausel, E.; Assimaki, D. Seismic Simulation of Inelastic Soils via Frequency-Dependent Moduli and Damping. J. Eng. Mech. 2002, 128, 34–47. [Google Scholar] [CrossRef]
  59. Cohen, I.; Huang, Y.; Chen, J.; Benesty, J. Pearson Correlation Coefficient. In Noise Reduction in Speech Processing; Springer: Berlin/Heidelberg, Germany, 2009. [Google Scholar]
  60. Pemberton, S.G.; Gingras, M.K. Classification and characterizations of biogenically enhanced permeability. AAPG Bull. 2005, 89, 1493–1517. [Google Scholar] [CrossRef]
  61. Guang, Y.; Zhang, X.; Liu, Y.; Peng, L.; Yasin, F.S.; Karube, K.; Nakamura, D.; Nagaosa, N.; Taguchi, Y.; Mochizuki, M.; et al. Confined antiskyrmion motion driven by electric current excitations. Nat. Commun. 2024, 15, 7701. [Google Scholar] [CrossRef] [PubMed]
  62. Jia, K.; El Naggar, M.H.; Xu, C.; Song, J.; Cui, C.; Du, X. Seismic behavior of piles-supported pier-superstructure to liquefaction-induced lateral spreading considering variability of soil permeability. Can. Geotech. J. 2024, 62, 1–22. [Google Scholar] [CrossRef]
  63. Li, Z.; Ma, X.; Kong, X.-Z.; Saar, M.O.; Vogler, D. Permeability evolution during pressure-controlled shear slip in saw-cut and natural granite fractures. Rock Mech. Bull. 2023, 2, 100027. [Google Scholar] [CrossRef]
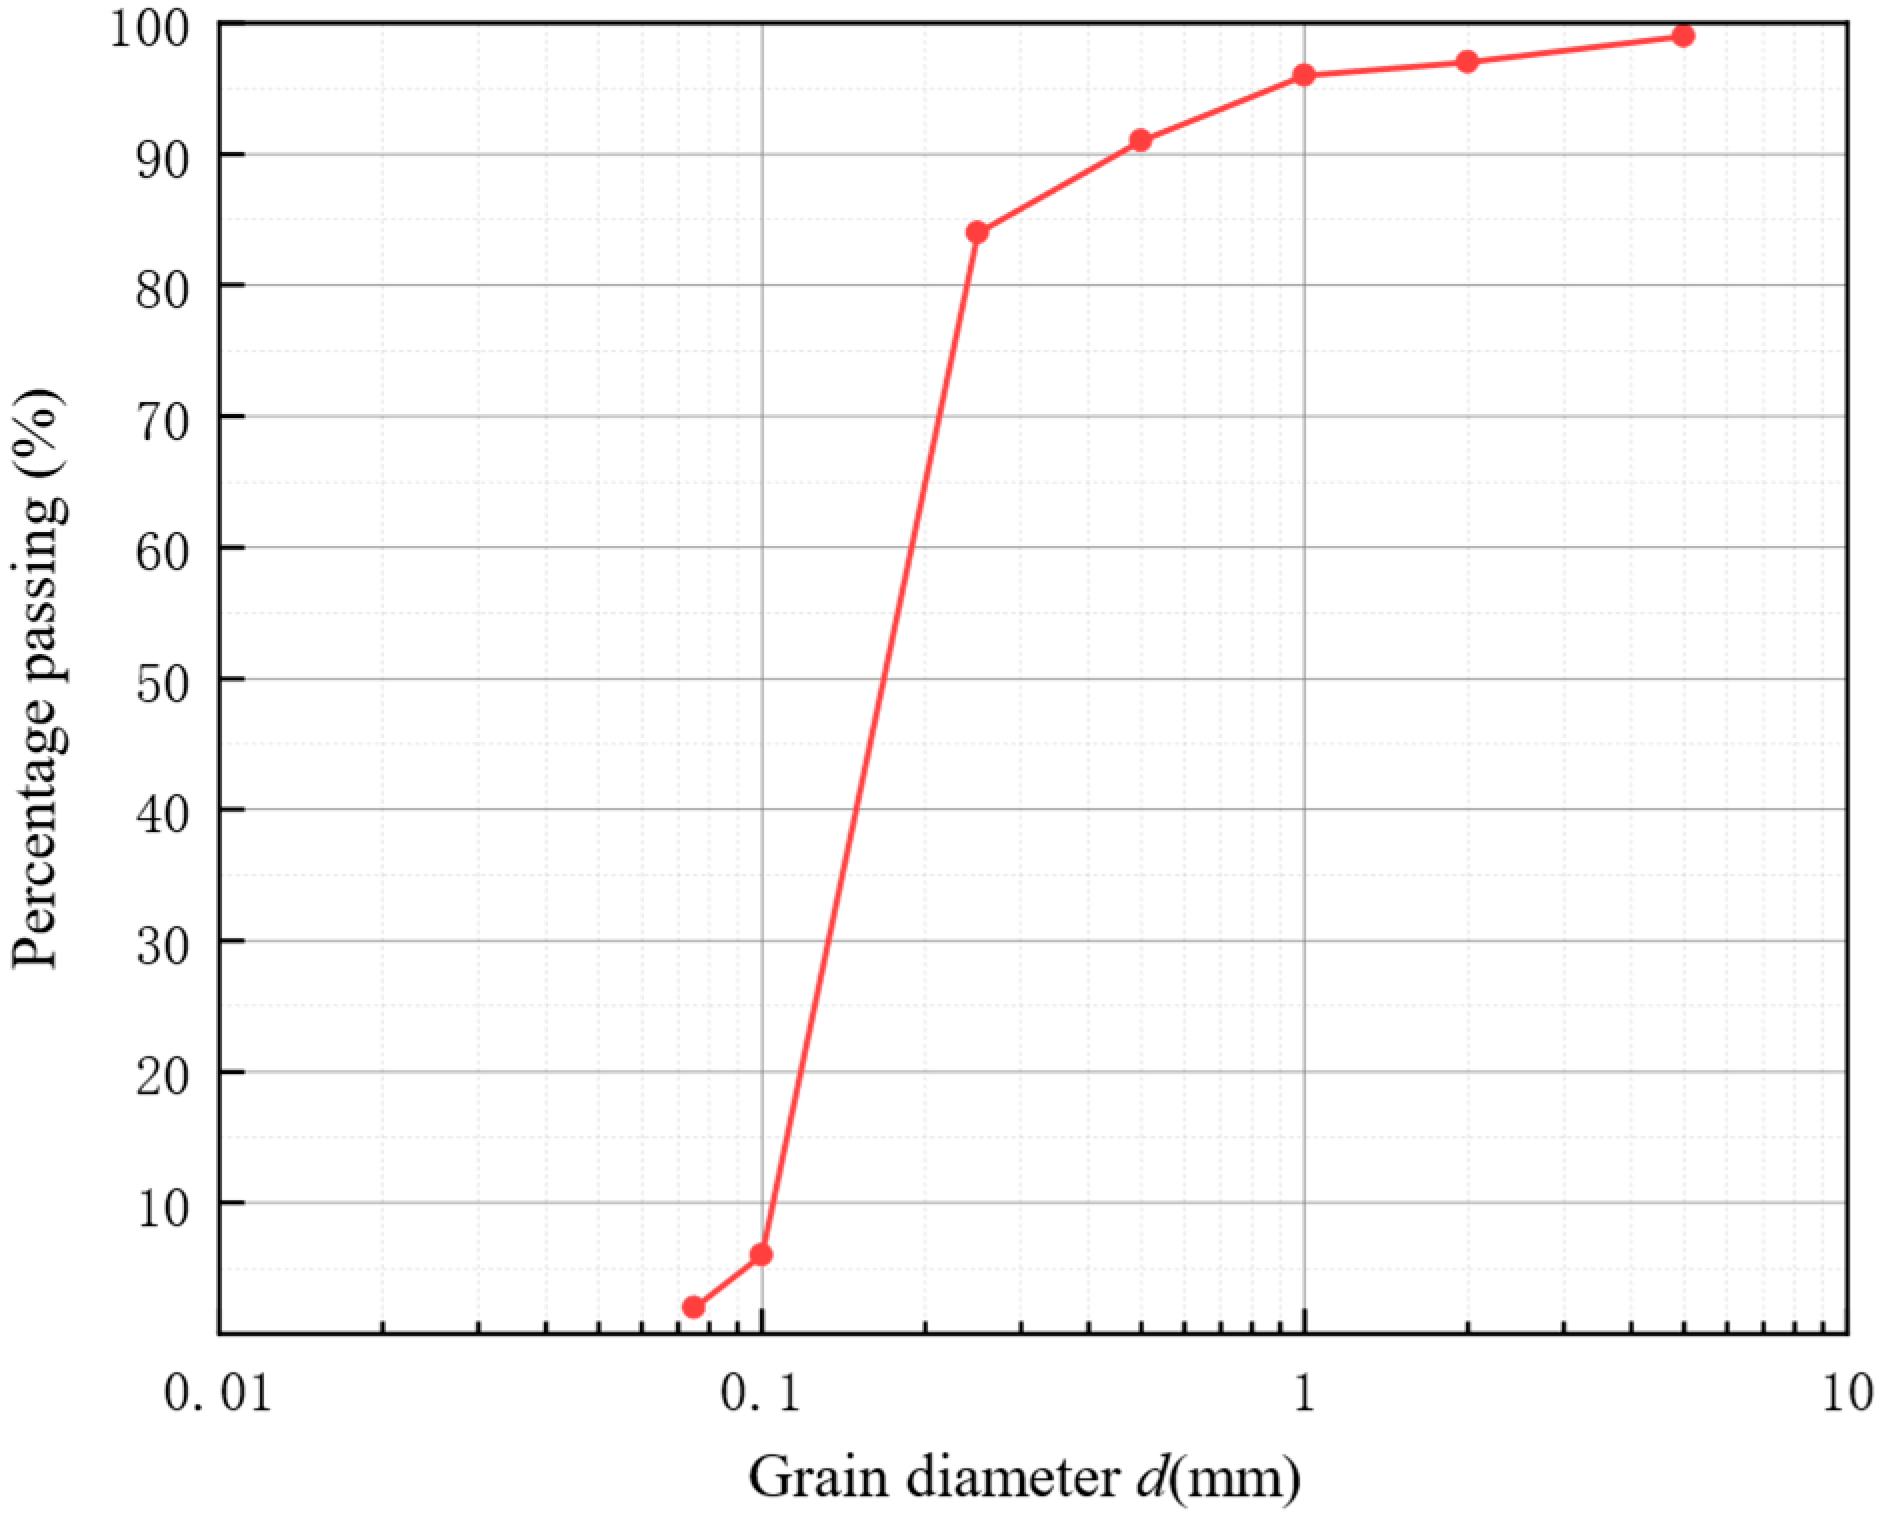
Figure 1. Grain size distribution of Yinchuan soil.
Buildings 15 03803 g001
Figure 2. Effective stress path and stress-strain of materials used in the study.
Buildings 15 03803 g002
Figure 3. Simulations versus experiments in undrained compression tests on Yinchuan sand.
Buildings 15 03803 g003
Figure 4. Schematic representation of soil profile, including liquefiable layers, water table, and the corresponding finite element model, highlighting variables Htotal, Dr.
Buildings 15 03803 g004
Figure 5. The development process of pore water pressure.
Buildings 15 03803 g005
Figure 6. The variation trend of the acceleration, velocity and displacement of the surface nodes.
Buildings 15 03803 g006
Figure 7. Scatter plots of SLD against (a) PGA, (b) IA, (c) IC, and (d) D5–95.
Buildings 15 03803 g007
Figure 8. Heatmap of correlation coefficients for the analyzed parameters, including SLD and intensity measures (PGA, IA, IC, D5–95).
Buildings 15 03803 g008
Figure 9. Scatter plots of MTL against (a) PGA, (b) IA, (c) IC, and (d) D5–95.
Buildings 15 03803 g009
Figure 10. Heatmap of correlation coefficients for the analyzed parameters, including MTL and intensity measures (PGA, IA, IC, D5–95).
Buildings 15 03803 g010
Figure 11. Linear regression between SLD and LV1 from PLS regression and variable weights for LV1 from PLS regression.
Buildings 15 03803 g011
Figure 12. Effect of relative density on the maximum thickness of the liquefied layer (MTL).
Buildings 15 03803 g012
Table 1. Physical properties of the test material.
ClassificationD50
(mm)
CueminemaxGsIpks
(m/s)
SP0.171.50.590.912.6817.51.0 × 10-7
Table 2. Calibrated model parameters for Yinchuan soil.
ConstantVariableValue
ElasticityG0125
v0.05
Critical stateM1.25
c0.71
λc0.06
e00.94
ξ1.47
Yield surfacem0.01
Plastic modulush00.85
ch0.15
nb1.10
DilatancyA00.11
nd3.50
Fabric-dilatancy tensorzmax4
cz600
Table 3. Ground motion parameters of seismic waves.
Input MotionPGA
(g)
IA
(m/s)
D5–95
(s)
Ic
(-)
ChiChi0.360.3811.550.023
Friuli0.350.784.210.043
Hollister0.190.2614.320.018
Imperial_Valley0.321.268.930.061
Kobe0.341.6912.770.075
Landers0.786.5813.670.2
Loma_Prieta0.371.3511.250.064
Northridge0.572.739.060.11
Trinidad0.190.176.660.016
Yinchuan0.160.1118.540.22
Disclaimer/Publisher’s Note: The statements, opinions and data contained in all publications are solely those of the individual author(s) and contributor(s) and not of MDPI and/or the editor(s). MDPI and/or the editor(s) disclaim responsibility for any injury to people or property resulting from any ideas, methods, instructions or products referred to in the content.