Article

Mechanisms of Seismic Failure in Multistory Masonry and Infilled Frame Buildings: Field Investigation and Numerical Validation from the 2022 Luding Earthquake

1
School of Civil Engineering, Jiaying University, Meizhou 514015, China
2
WSP Global Inc., Shenzhen 518000, China
3
School of Architecture and Engineering, Liaocheng University, Liaocheng 252000, China
4
Key Laboratory of Building Collapse Mechanism and Disaster Prevention, China Earthquake Administration, Sanhe 065201, China
5
School of Civil Engineering, Institute of Disaster Prevention, Sanhe 065201, China
*
Author to whom correspondence should be addressed.
Buildings 2025, 15(20), 3801; https://doi.org/10.3390/buildings15203801
Submission received: 30 August 2025 / Revised: 14 October 2025 / Accepted: 20 October 2025 / Published: 21 October 2025
(This article belongs to the Section Building Structures)

Abstract

Multi-story buildings in seismic regions are susceptible to earthquake-induced damage; however, the direct correlation between observed damage patterns and underlying failure mechanisms remains insufficiently understood. The Ms6.8 Luding earthquake, which struck Luding County, Sichuan Province, China, in September 2022, offers a unique opportunity to investigate this relationship, as it affected a concentrated area with diverse building types and preserved a wide range of damage states. This study leverages the distinctive conditions of the Luding earthquake to elucidate the influence of wall element distribution on structural failure modes under seismic loading. To elucidate the underlying mechanisms, three representative buildings were analyzed using a one-dimensional numerical model. The simulations yielded shear force distributions, shear ratios, and displacement ratios across structural components, enabling a detailed assessment of failure modes. The results indicate that torsion-dominated structures are susceptible to premature failure of low-stiffness components due to excessive displacement, whereas high-stiffness components generally remain intact owing to their ductility. In contrast, translation-dominated structures fail when high-stiffness components fracture at small displacements, resulting in global collapse without substantial ductility or load-bearing contribution from other elements. Structures that remained undamaged exhibited a relatively uniform stiffness distribution, enabling them to resist seismic forces primarily through overall capacity rather than ductility. The numerical results closely reproduced the observed damage patterns, thus validating the proposed mechanisms for the three structural categories. These findings contribute to a deeper understanding of seismic damage processes and provide a basis for enhancing seismic design and retrofitting strategies for both new and existing structures.

1. Introduction

Earthquakes are among the most destructive natural hazards, causing significant casualties, social disruption, and economic losses worldwide [1,2,3,4,5,6,7,8]. Recent technical and socio-economic analyses confirm that seismic events continue to impose an unacceptably high burden on global society, crippling critical infrastructure and exacerbating long-term economic and social inequalities [9,10]. Notably, in the past two decades, major events such as the 2008 Wenchuan (M8.0), 2010 Chile (M8.8), 2011 Great East Japan (M9.1), 2015 Nepal (M8.1), and 2023 Türkiye (M7.8) earthquakes have resulted in hundreds of thousands of deaths and trillions of dollars in losses [11,12,13,14,15,16,17]. Urban areas in seismic regions are especially vulnerable, as densely distributed multi-story buildings form the core of residential, commercial, and public infrastructure. The seismic performance of these buildings is therefore crucial for community resilience and the maintenance of essential services. Response spectra from major earthquakes show that the predominant ground motion periods (0.2–1.0 s) often coincide with the natural periods of multi-story buildings, leading to maximum structural response [18,19]. Most of these buildings are constructed as reinforced concrete (RC) frames, masonry structures, or RC frame–masonry hybrids, which generally perform worse than shear wall systems. As a result, multi-story buildings consistently account for most seismic damage and collapse.
Understanding the collapse mechanisms of buildings is fundamental to improving seismic safety, and this issue has been extensively investigated for decades. Most building collapses are initiated by failure at a single story, which triggers global structural instability—a phenomenon long described as the “story-yield mechanism” [20,21,22]. To counteract this, the beam-hinge mechanism—often referred to as the “strong-column weak-beam” design philosophy—was developed and incorporated into seismic codes worldwide [23,24,25,26,27,28]. However, field investigations from recent destructive earthquakes have revealed that many buildings exhibited structural responses that deviate from these design principles. For example, Luo et al. reported that during the 2021 Yangbi earthquake (M6.4) in Yunnan, RC school buildings with infilled frames experienced severe damage to infill–frame composite components, while unrestrained columns within the same buildings remained largely intact, indicating inconsistent mechanical behavior [29]. Similar patterns were observed in the 2022 Luding (M6.8) [30] and 2023 Türkiye (M7.8) [31] earthquakes, where poor ductility in specific components contributed to collapse.
Previous studies have mainly focused on the stiffness and confinement effects of infill walls at the component level, including investigations of frame–infill connections [32,33], masonry materials [34,35], and wall openings [36,37,38,39]. However, direct links between component behavior and overall structural response are rarely established. Recent research has started to address this gap. For example, shaking table tests by Stavridis et al. showed that infill walls can restrain beam deformation and prevent the “strong-column weak-beam” failure mode [40]. Wang et al. found that, in corridor-type school buildings, frame–infill components bore greater seismic shear and failed earlier, while unrestrained columns remained largely undamaged, suggesting sequential rather than simultaneous failure [41]. However, a systematic framework that directly connects observed component failures to global collapse mechanisms in real earthquake scenarios remains lacking. This study addresses this gap by integrating detailed field surveys with numerical modeling to establish and validate these links, offering new insights for both seismic assessment and design.
The 2022 Luding earthquake (M6.8) in Sichuan provides a valuable case for further study. The affected town featured diverse building types—irregular RC frames with infill walls, uniformly stiff masonry structures, and RC frame–masonry hybrids [42,43]. Within a relatively confined region subjected to comparable seismic input, buildings experienced outcomes ranging from total collapse to minor damage or no damage at all. This rare scenario allowed direct correlation of observed damage with underlying mechanical mechanisms. In many historical extreme events, widespread building collapses have occurred; however, once a structure collapses, evidence of its failure mechanism is often obscured, making it difficult to establish clear causal relationships [44]. In contrast, the Luding earthquake caused varying degrees of damage without widespread collapse. This created a unique situation analogous to full-scale natural shaking table tests, in which most original structural responses were preserved, thereby providing abundant and reliable data for post-earthquake investigation.
In this study, systematic surveys were combined with nonlinear finite element analyses to classify and interpret the representative failure mechanisms of multi-story buildings during the Luding earthquake. Three structural archetypes were identified: (1) torsion-dominated structures, where low-stiffness components experienced large deformation and failed; (2) translation-dominated structures, where high-stiffness components fractured at small deformation; and (3) structures with uniform stiffness distribution, which remained largely intact under strong shaking. Idealized mechanical models were developed based on observed motion patterns and validated through numerical simulations. Unlike most previous studies, which primarily relied on experimental setups or numerical assumptions, this study derives simplified yet rational failure mechanisms directly from observed seismic performance in engineering structures. By grounding the models in post-earthquake evidence and validating them through simulations, this study offers a robust and practical framework for understanding seismic damage. This work bridges empirical observation and theoretical modeling, providing a practical basis for seismic design and retrofitting. It also advances the engineering objective from “no collapse under major earthquakes” to the higher standard of “no severe damage under major earthquakes”.

2. Typical Building Damage Patterns

A wide variety of buildings sustained damage during this earthquake. Based on field surveys of more than 300 buildings, three representative categories were identified according to the characteristic failure modes of their structural components. These categories accounted for over 90% of all surveyed buildings, thus ensuring a high degree of representativeness. Detailed descriptions of the earthquake damage survey are available in [45,46] and are not repeated here.
The selection was guided by a single criterion: the observed damage patterns of structural components and the distribution of load-bearing walls. Based on this consideration, three representative cases were chosen: a bottom-frame structure (Building A), a frame–masonry hybrid structure (Building B), and a masonry structure (Building C). Collectively, these buildings typify the predominant seismic failure patterns observed in the affected area. It should be emphasized that the focus of this study is not merely on structural typology, but rather on the mechanical behavior of structures and their components; the identified failure mechanisms may therefore be applicable across different structural types.

2.1. Failure of Low-Stiffness Components

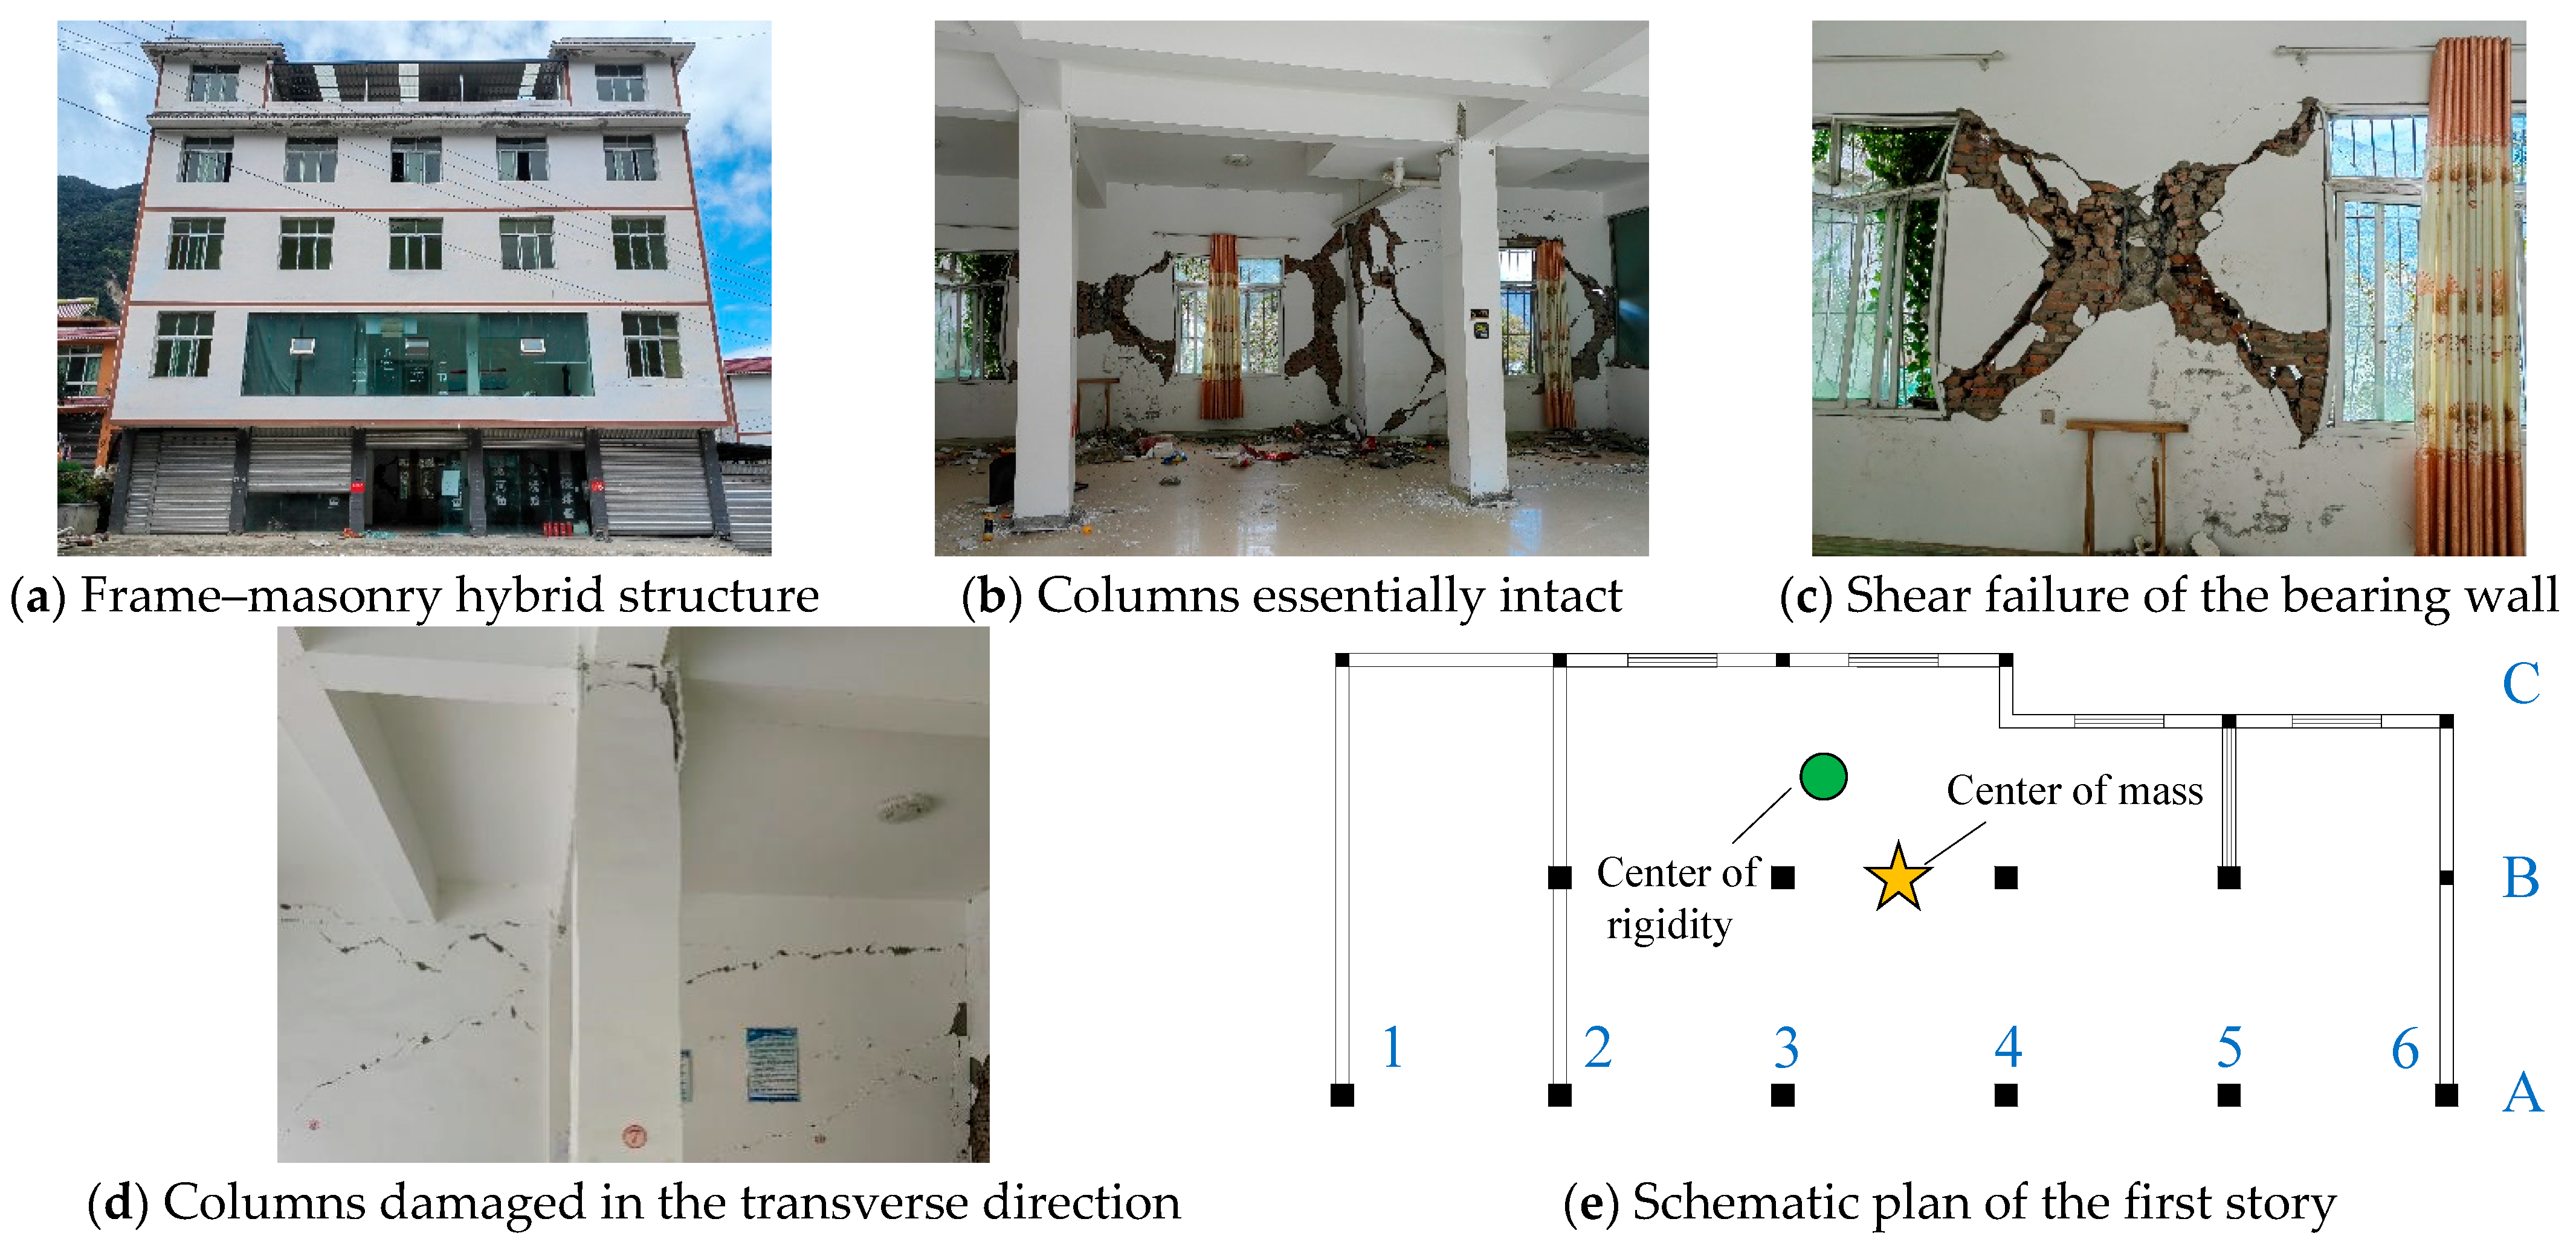
Several corner buildings exhibited global torsional failure, characterized by severe damage to low-stiffness components while high-stiffness components remained largely unaffected. Figure 1a shows a five-story guesthouse with a bottom-frame structural system, where the first story consisted of a frame with infill walls and the upper stories were masonry. This building was situated 7.8 km from the earthquake epicenter. Due to the weak first story, damage was concentrated at this level, with the upper stories remaining mostly intact (see Figure 1e for a schematic plan of the first story).
As shown in Figure 1b,c, the frame columns along Axis A and Axis 5 experienced large deformations, with measured drift angles reaching 1/7, indicating severe column damage and a structure on the verge of collapse. In contrast, Figure 1d illustrates the frame–infill composite member along Axis D, which exhibited minimal in-plane deformation and damage. These observations confirm that torsional effects primarily governed the structural failure.
Corner buildings typically face streets on two adjacent sides, often featuring large door openings, while the other two sides face neighboring buildings and are constructed with solid infill walls. The stiffness provided by these infill walls resulted in significant eccentricity and large torsional moments (Figure 1e). The fundamental cause of torsional failure in this structure was the asymmetric wall distribution, leading to insufficient torsional stiffness. Consequently, the floor slab displaced predominantly along the weaker torsional direction. Frame columns with low stiffness underwent large deformations and sustained severe damage, whereas frame–infill composite components with higher stiffness experienced only minor deformation and damage. Despite the unfavorable torsional response, the available ductility of certain frame columns was sufficient to prevent collapse.

2.2. Failure of High-Stiffness Components

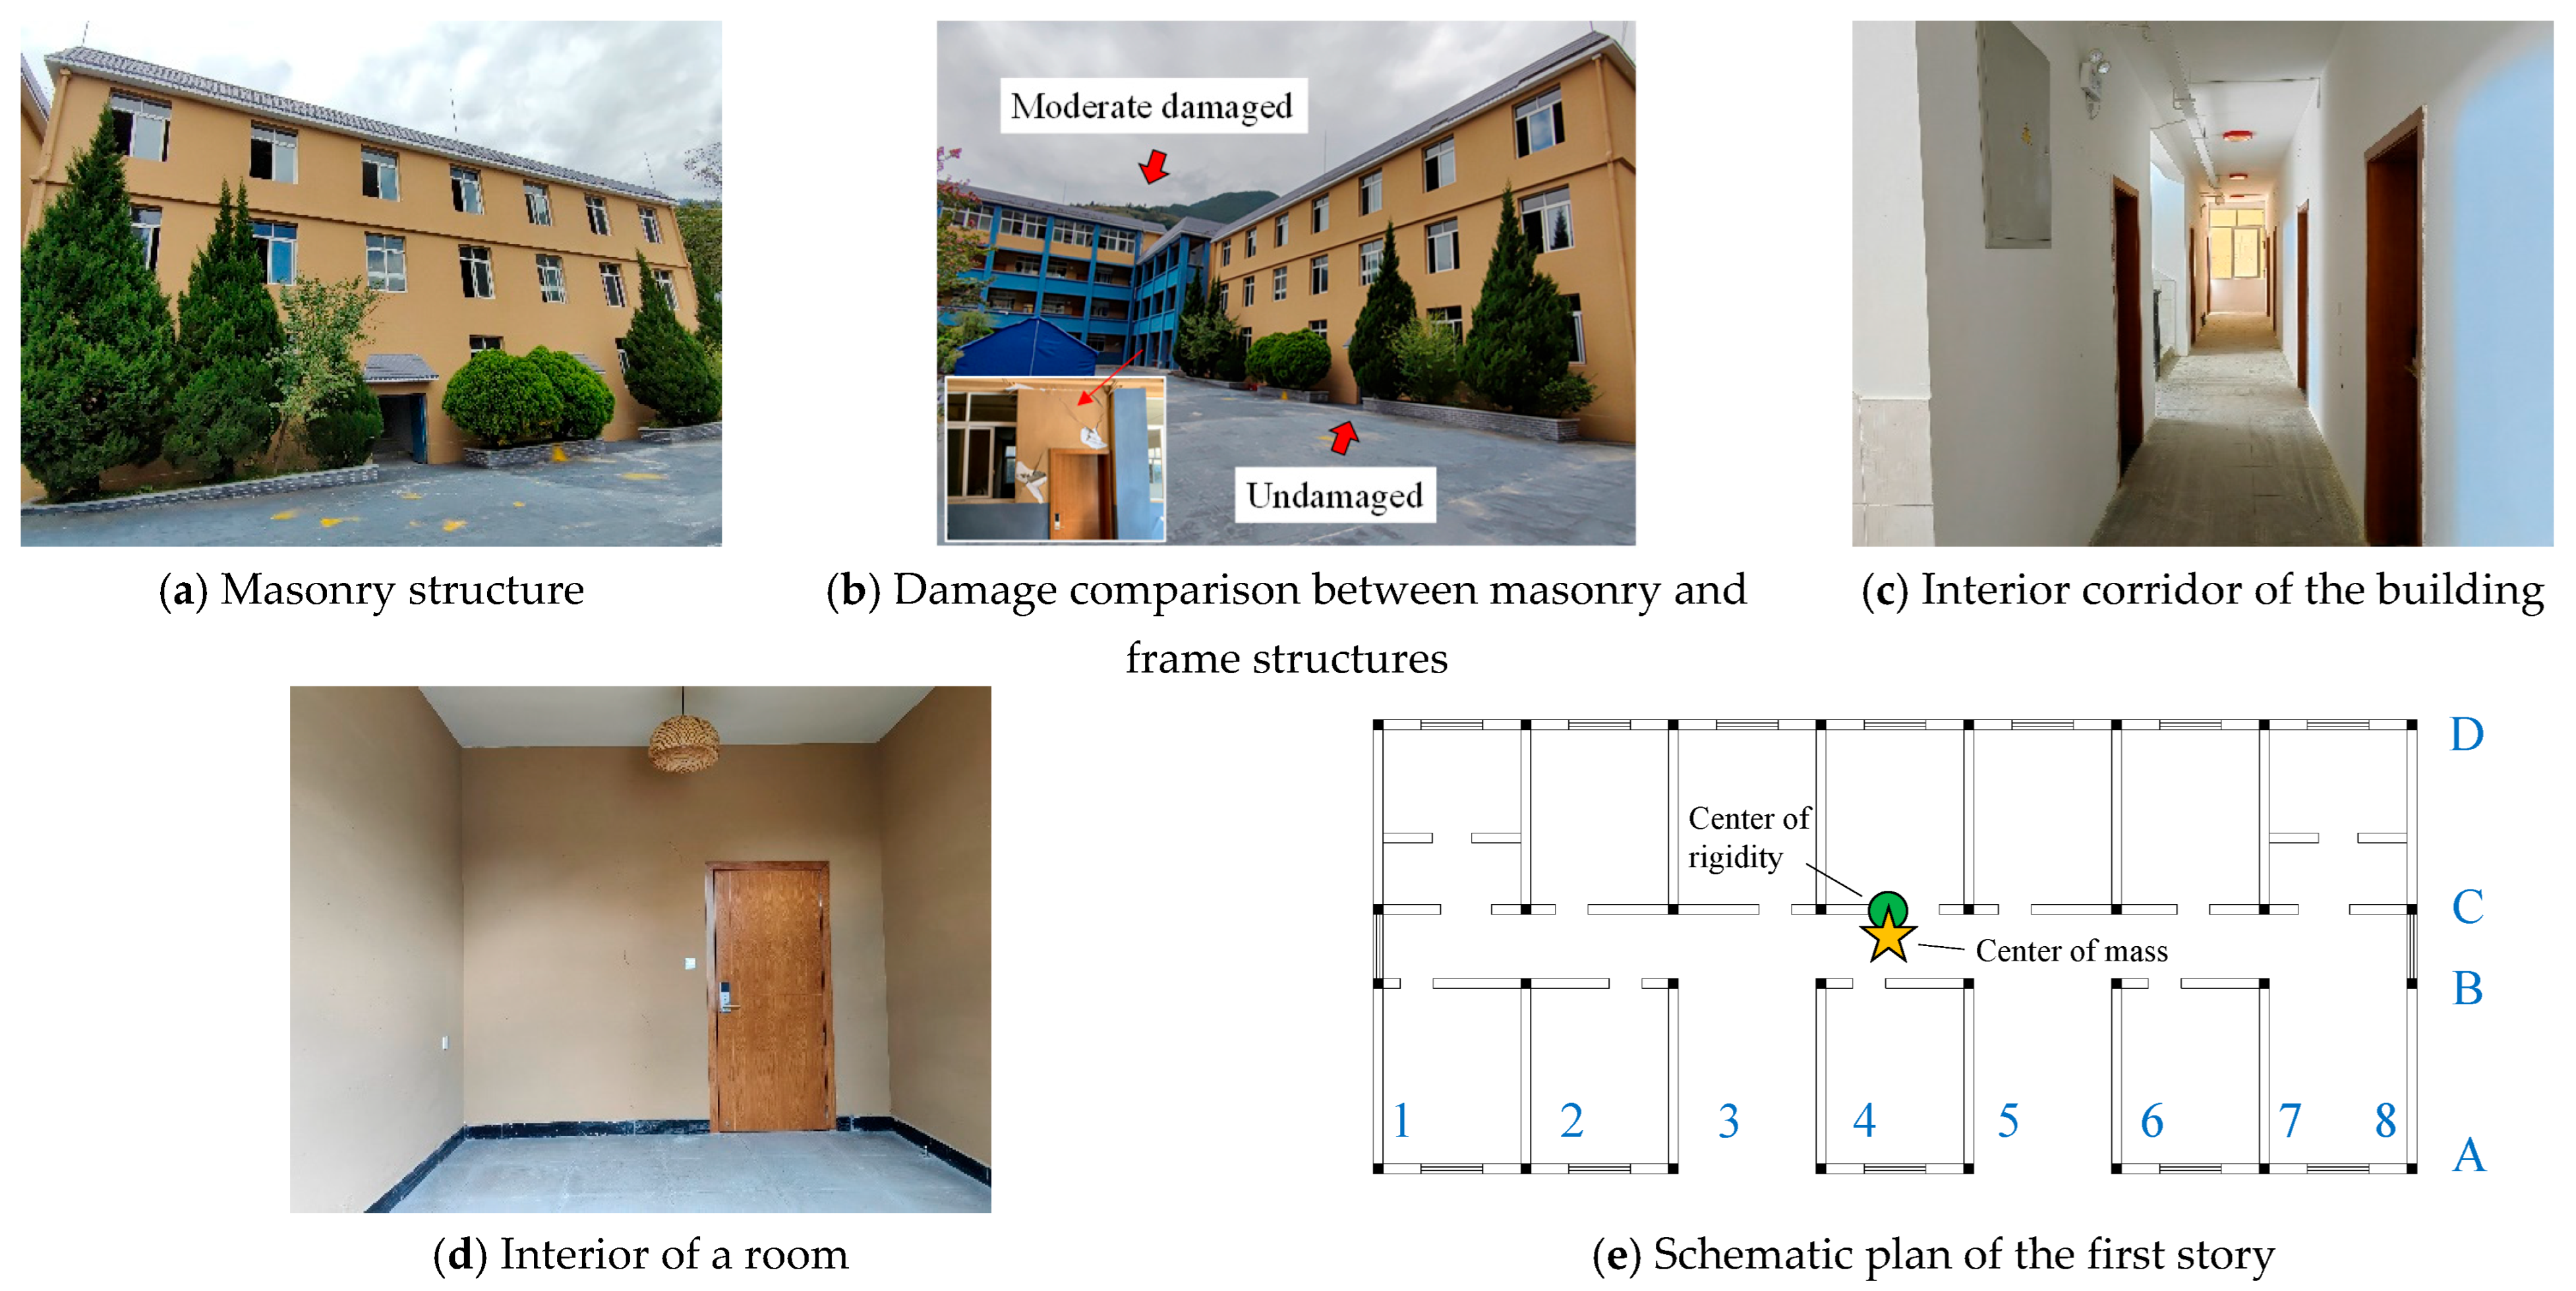
Extensive damage surveys revealed that high-stiffness components, such as frame–infill wall assemblies and masonry load-bearing walls, often sustained severe damage, while low-stiffness components at the same story, such as frame columns, remained relatively intact. Figure 2a shows a five-story guesthouse with a frame–masonry hybrid system. This building was located 9.8 km from the earthquake epicenter. The first story consisted of a frame–masonry composite structure, whereas the upper stories were masonry. Owing to the weakness of the first story, damage was concentrated at this level, while the upper stories remained largely undamaged. A schematic plan of the first story is shown in Figure 2e.
Figure 2b highlights the contrasting conditions of components along Axis B and Axis C. The frame column on Axis B sustained minimal damage, whereas the load-bearing wall on Axis C experienced severe shear failure (Figure 2c). This behavior can be attributed to the substantial transverse stiffness, bearing capacity, and torsional stiffness provided by the solid transverse walls on both sides of the building, which effectively prevented damage in the transverse direction and enhanced the overall torsional stiffness. As a result, although there was a large eccentricity between the stiffness center and the mass center that generated significant torsional moments, the torsional resistance of the structure was sufficient to prevent torsional failure. Instead, slab displacements were concentrated in the longitudinal direction, and the structural response was dominated by longitudinal translation.
Under this translational mode, all components underwent similar longitudinal displacements. In this case, internal forces were primarily distributed in proportion to component stiffness. The load-bearing wall on Axis C, being stiffer but with limited deformability, sustained large internal forces and reached its ultimate displacement capacity, resulting in brittle shear failure and placing the structure on the verge of collapse. By contrast, the frame columns on Axes A and B experienced little to no damage at small displacements; however, some columns adjacent to Axis C exhibited localized transverse damage, with their ends being crushed (Figure 2d). This secondary failure occurred after the load-bearing wall on Axis C failed, resulting in significant gravity-induced settlement. The resulting deformation, as evidenced by the window frames (Figure 2c), led to downward displacement of the slab along Axis C and crushing of adjacent column ends along Axis B.

2.3. Undamaged Buildings

Even within the meizoseismal area, some buildings remained entirely undamaged. Surveys revealed that these buildings exhibited no observable damage to their structural components. Such undamaged buildings are represented by the case shown in Figure 3.
Figure 3a depicts a three-story masonry dormitory building located at an epicentral distance of 7.7 km. The ring beams and tie columns were well-constructed, lateral load-resisting components were abundant, and stiffness distribution was uniform. The floor plan of the first story is shown in Figure 3e. In contrast, adjacent three- and four-story frame-structure school buildings sustained considerable damage and were rated as unsafe for use, whereas this masonry building remained essentially intact and was considered suitable for continued occupancy (Figure 3b). Figure 3c shows the interior corridor of the building, while Figure 3d presents one of its rooms, both of which exhibited no cracking.
The superior performance of this masonry building can be attributed to several factors. First, the absence of abrupt changes in longitudinal stiffness prevented the formation of a weak story. The building adopted an internal-corridor layout with rooms on both sides. In plan view, lateral load-resisting components were uniformly distributed along both longitudinal and transverse directions, resulting in minimal eccentricity. Moreover, all these components were load-bearing walls with high stiffness, large load-bearing capacity, and limited deformability. Once cracked, such components typically suffer severe damage, as failure occurs when their ultimate strength is reached. However, the presence of ring beams and tie columns ensured that even if individual components failed, progressive collapse would not occur, providing a certain degree of ductility. As long as the ultimate capacity was not reached, the components remained largely intact. Overall, the uniform distribution of lateral load-resisting components, combined with their comparable stiffness and strength, enabled each element to contribute effectively to seismic resistance. Consequently, the structure relied primarily on its high total load-bearing capacity, rather than ductility, to withstand seismic forces and remain undamaged.

3. Structural Failure Mechanisms

3.1. Translational and Torsional Motion Mechanisms

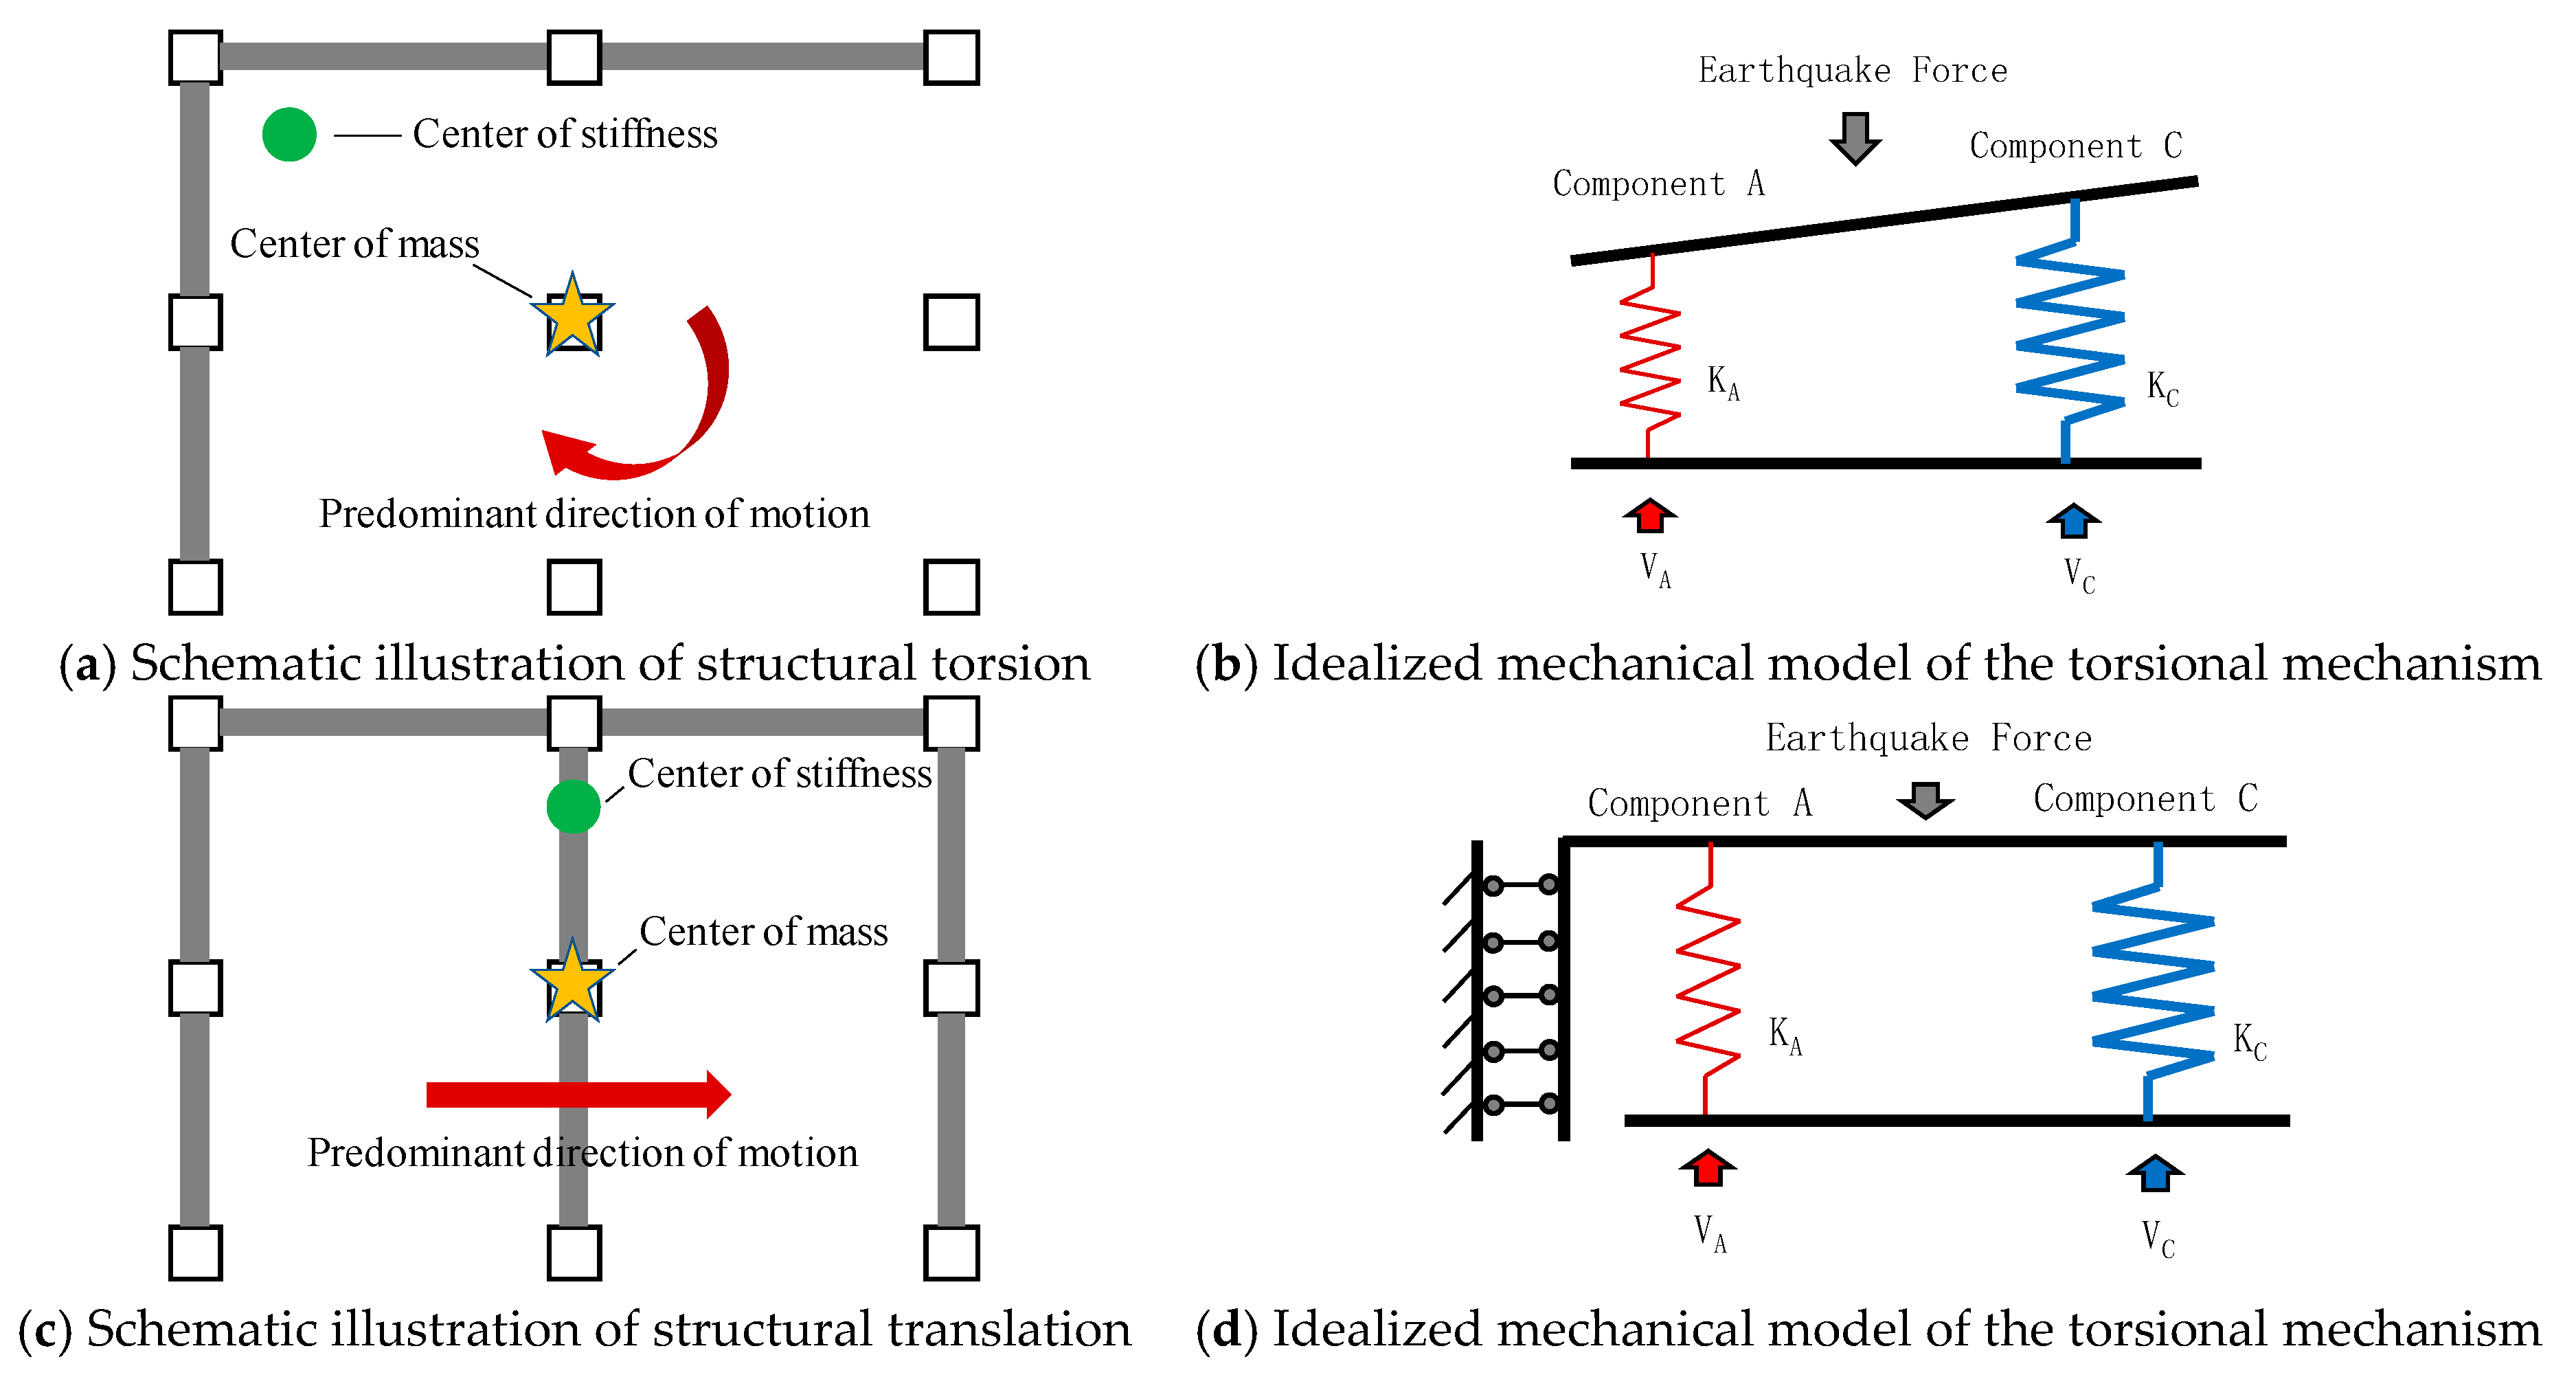
Traditionally, the distance between the center of mass and the center of rigidity is regarded as the main factor influencing torsional effects. However, under seismic excitation, the dominant structural motion depends not only on eccentricity but, more critically, on the torsional stiffness and load-bearing capacity determined by the spatial arrangement of lateral load-resisting elements. This arrangement is typically dictated by architectural requirements.
As shown in Figure 4a, infilled assemblies deform minimally, while bare columns experience considerable lateral drift. Torsional moments lead to downward deformation of the right-side columns and leftward displacement of the bottom columns. Without stiff components to resist torsion, the structure develops a torsion-dominated motion mechanism. The idealized model in Figure 4b shows that flexible frame columns suffer extensive damage due to large deformations.
In contrast, Figure 4c illustrates the translational mechanism. Stiff walls on both sides provide substantial torsional stiffness, limiting differential displacement across the transverse direction. These walls also offer high load-bearing capacity, making transverse failure unlikely. Consequently, the building primarily exhibits a longitudinal translational mechanism. As idealized in Figure 4d, components with high stiffness but limited deformability are the first to sustain significant damage under longitudinal translation.

3.2. Constitutive Behavior and Component Failure Modes

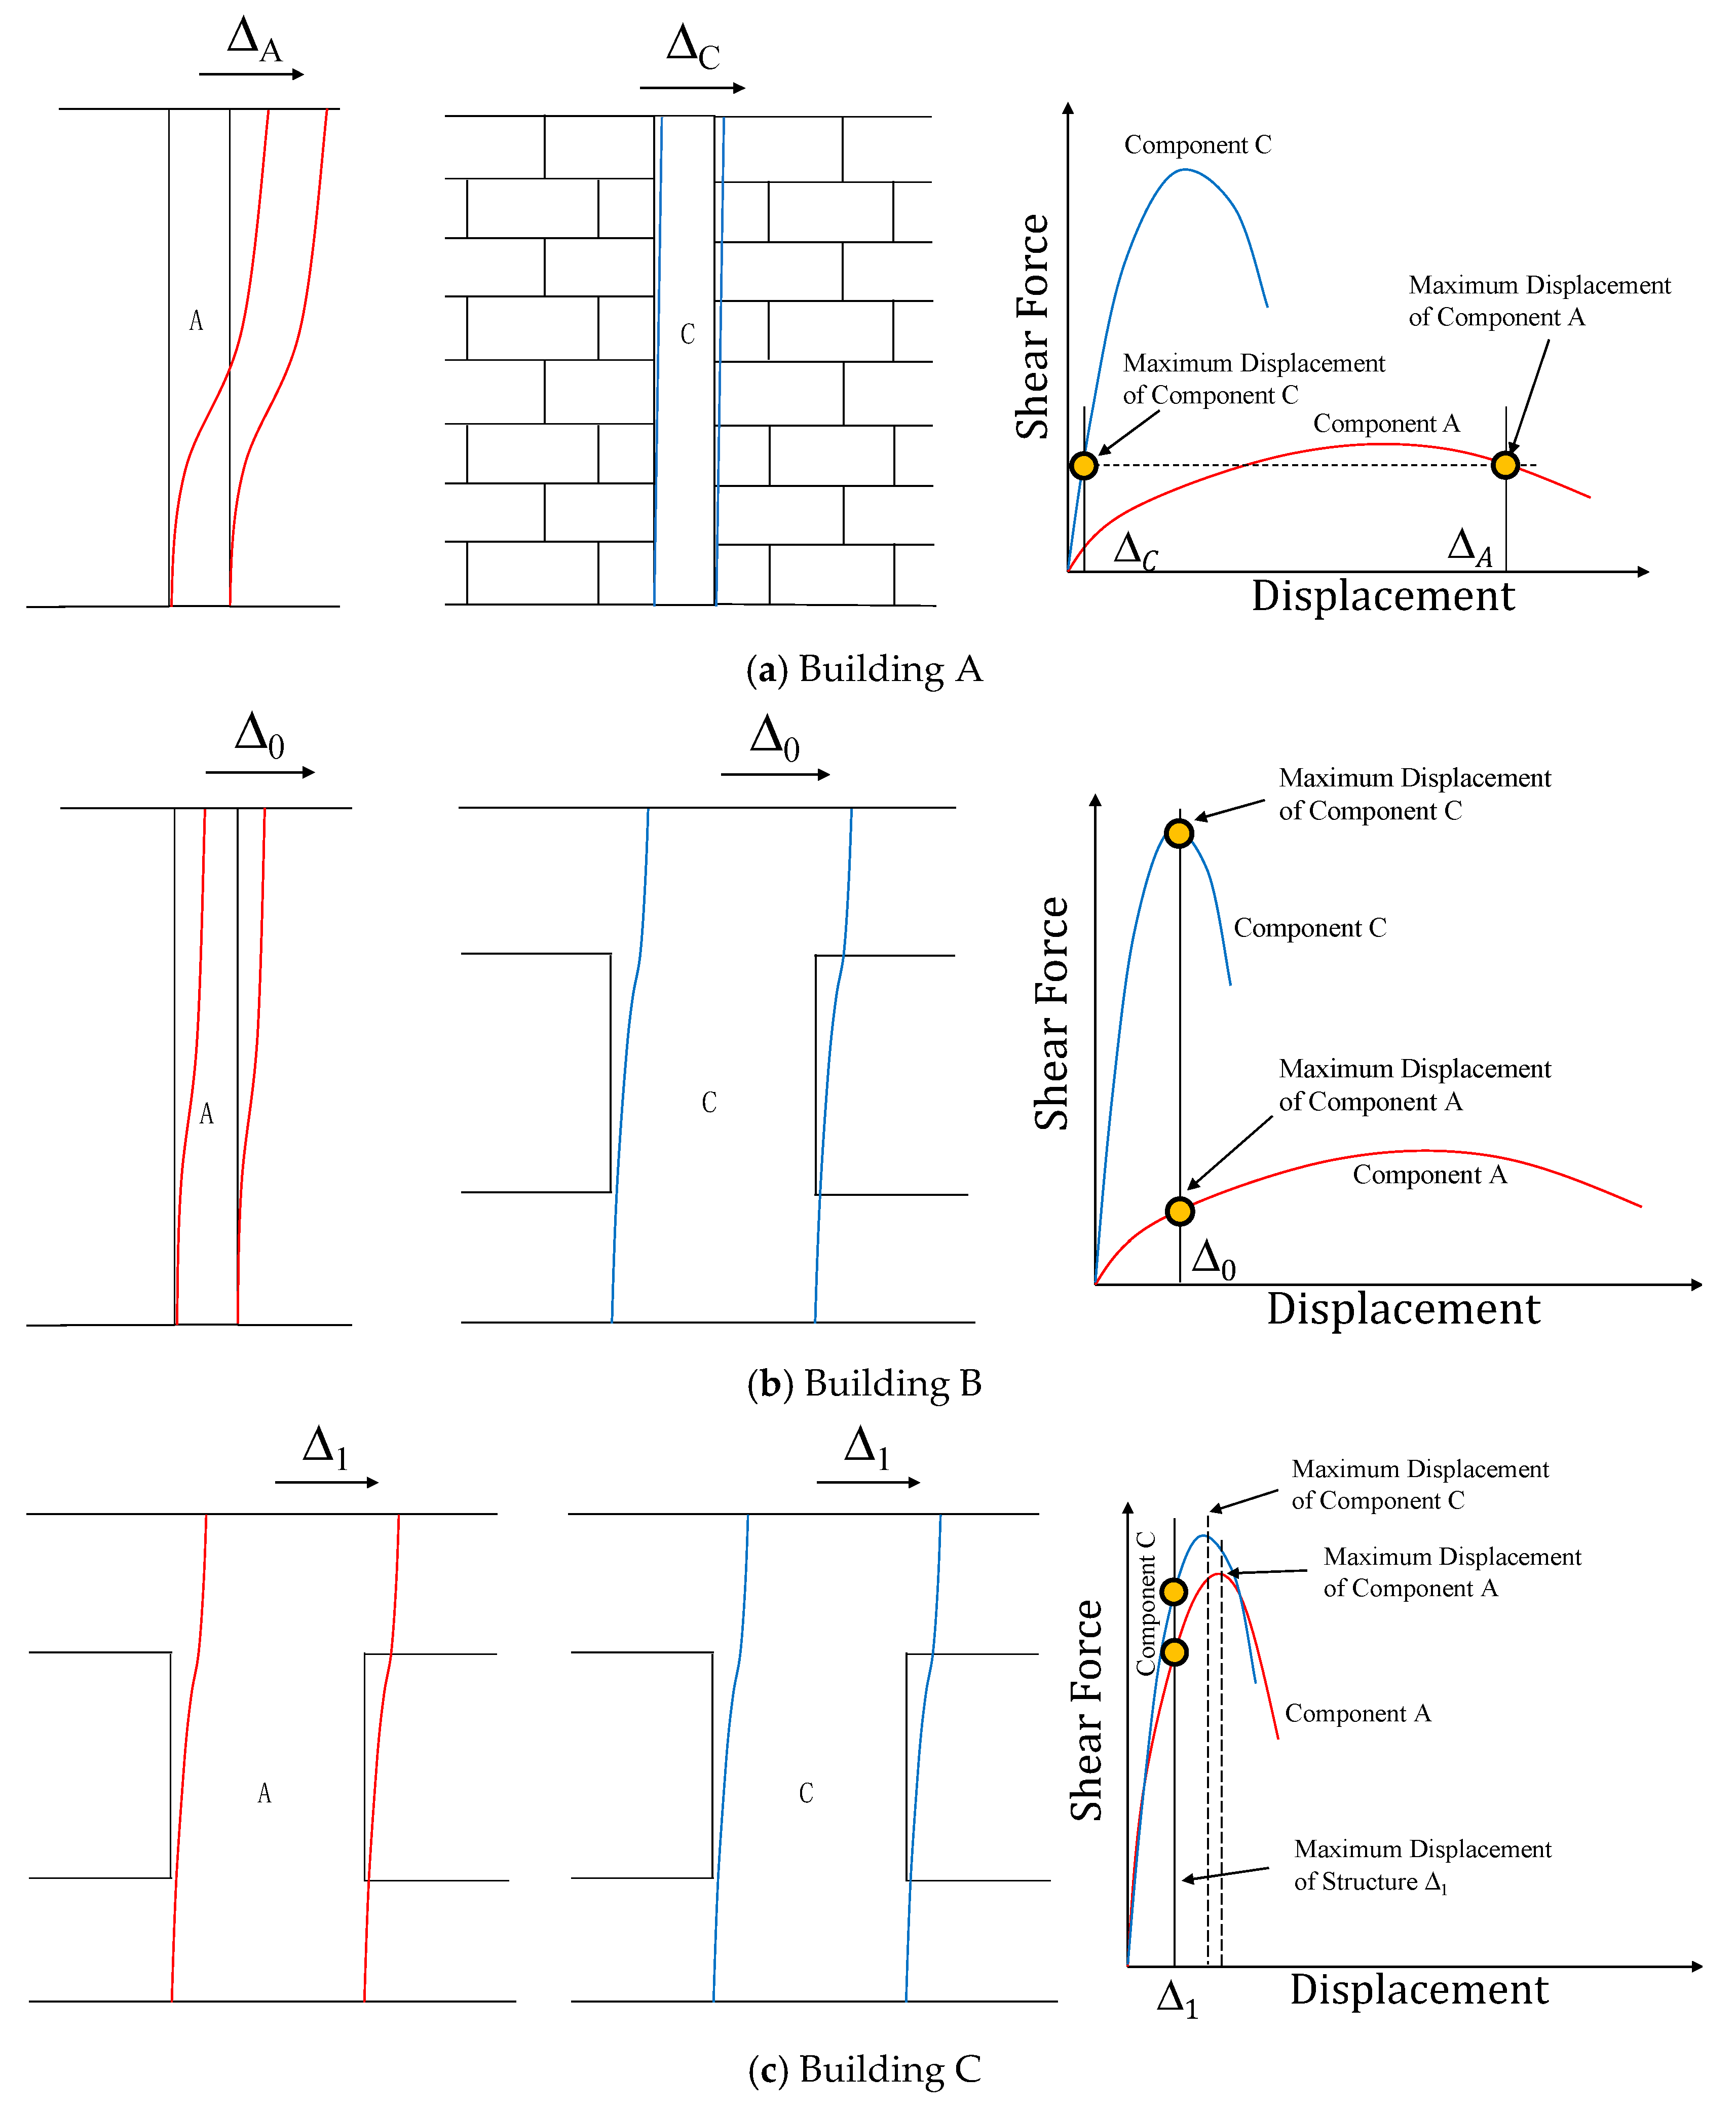
Based on the motion mechanisms and idealized models in Figure 4, the force–deformation behavior of individual components can be deduced. Figure 5 presents the constitutive relationships of representative components from different building types within a unified coordinate system.
Figure 5a shows the behavior and failure mechanism of Building A. Under the torsional mechanism in Figure 4b, both stiff (Component C) and flexible (Component A) elements are subjected to the same internal force. Component A reaches its deformation limit and fails, while Component C remains intact since the force does not reach its ultimate capacity. Such complete torsional failure is particularly damaging to seismic performance, though it generally occurs in buildings with highly irregular wall distributions, such as corner buildings.
Figure 5b illustrates Building B, which contains both stiff, high-strength but low-deformability components (Component C) and flexible, low-strength but high-deformability components (Component A) within the same story. According to the translational mechanism in Figure 4d, both components undergo identical displacements. When the displacement reaches the ultimate limit of Component C, the system may suffer severe damage or collapse, even though Component A has not fully mobilized its strength or ductility. As a result, the overall load-bearing capacity is low and ductility cannot be effectively utilized, rendering this building type highly susceptible to catastrophic failure. In practice, many structures with frame–infill wall systems and frame columns, or combinations of load-bearing walls and frame columns, have experienced various degrees of damage and collapse during earthquakes.
Figure 5c depicts Building C, where components are mainly stiff, high-strength, but low-deformability members (Components C and A). The proximity of the center of mass and center of rigidity leads to a translation-dominated response, with all components undergoing identical displacements. Unlike Building B, both member types in Building C have similar constitutive relationships and uniformly high load-bearing capacities. Although deformability is limited and ductility is poor, most components contribute significantly to overall strength. With proper arrangement of lateral load-resisting elements, the structure achieves very high total load-bearing capacity. In seismic practice, such buildings resist earthquake forces primarily through strength, and due to the brittle nature of their members, damage rarely occurs before the ultimate strength is reached.
The failure mechanisms identified in this study—torsion-dominated, translation-dominated, and uniform-stiffness behaviors—are derived from fundamental mechanical relationships governing stiffness distribution and deformation compatibility. These mechanisms are primarily applicable to well-constructed masonry and infilled-frame buildings, where construction quality and connection detailing conform to standard design practices. Under such conditions, variations in material strength or construction workmanship exert limited influence on the governing seismic behavior, as the dominant factor remains the relative stiffness contrast among structural components.
Multiple post-earthquake surveys consistently show that well-built structures exhibit stiffness-controlled damage patterns similar to those reproduced in this study. Nevertheless, structures with weak, poorly bonded, or highly deformable infill walls may deviate from these mechanisms, as premature infill failure can modify load paths and reduce torsional restraint. Although such cases fall outside the immediate scope of this research, they represent an important area for future investigation into nonstandard or degraded construction conditions.

4. Numerical Validation of Structural Motion and Failure Mechanisms

4.1. Representative Buildings

To validate component behavior and structural failure mechanisms, numerical models were developed for three representative building types. For Building A, the torsional failure process and the distribution of internal forces and displacements were analyzed to verify the mechanism illustrated in Figure 5a. For Building B, the contribution of transverse walls to torsional resistance was assessed by quantifying the internal forces and displacements in the longitudinal members, thereby confirming the mechanism shown in Figure 5b. For Building C, seismic performance was evaluated to clarify the basis for its exceptional earthquake resistance, thus validating the mechanism depicted in Figure 5c.

4.2. Modeling Method

4.2.1. Element Types and Material Properties

Finite element analyses were performed using Perform-3D v8.0, a widely recognized nonlinear structural analysis software extensively applied in seismic performance assessments of masonry and reinforced concrete buildings [42,47]. A simplified macro-element modeling strategy was adopted to capture both global and component-level responses. All structural components were represented as frame-type macro elements, which enhanced computational efficiency and ensured robust simulation. Compared with refined micro-modeling techniques—such as continuum finite element or discrete element methods—the macro-element approach significantly reduces computational demand and avoids convergence difficulties, while reliably reproducing the seismic response of infilled frames and masonry structures [48].
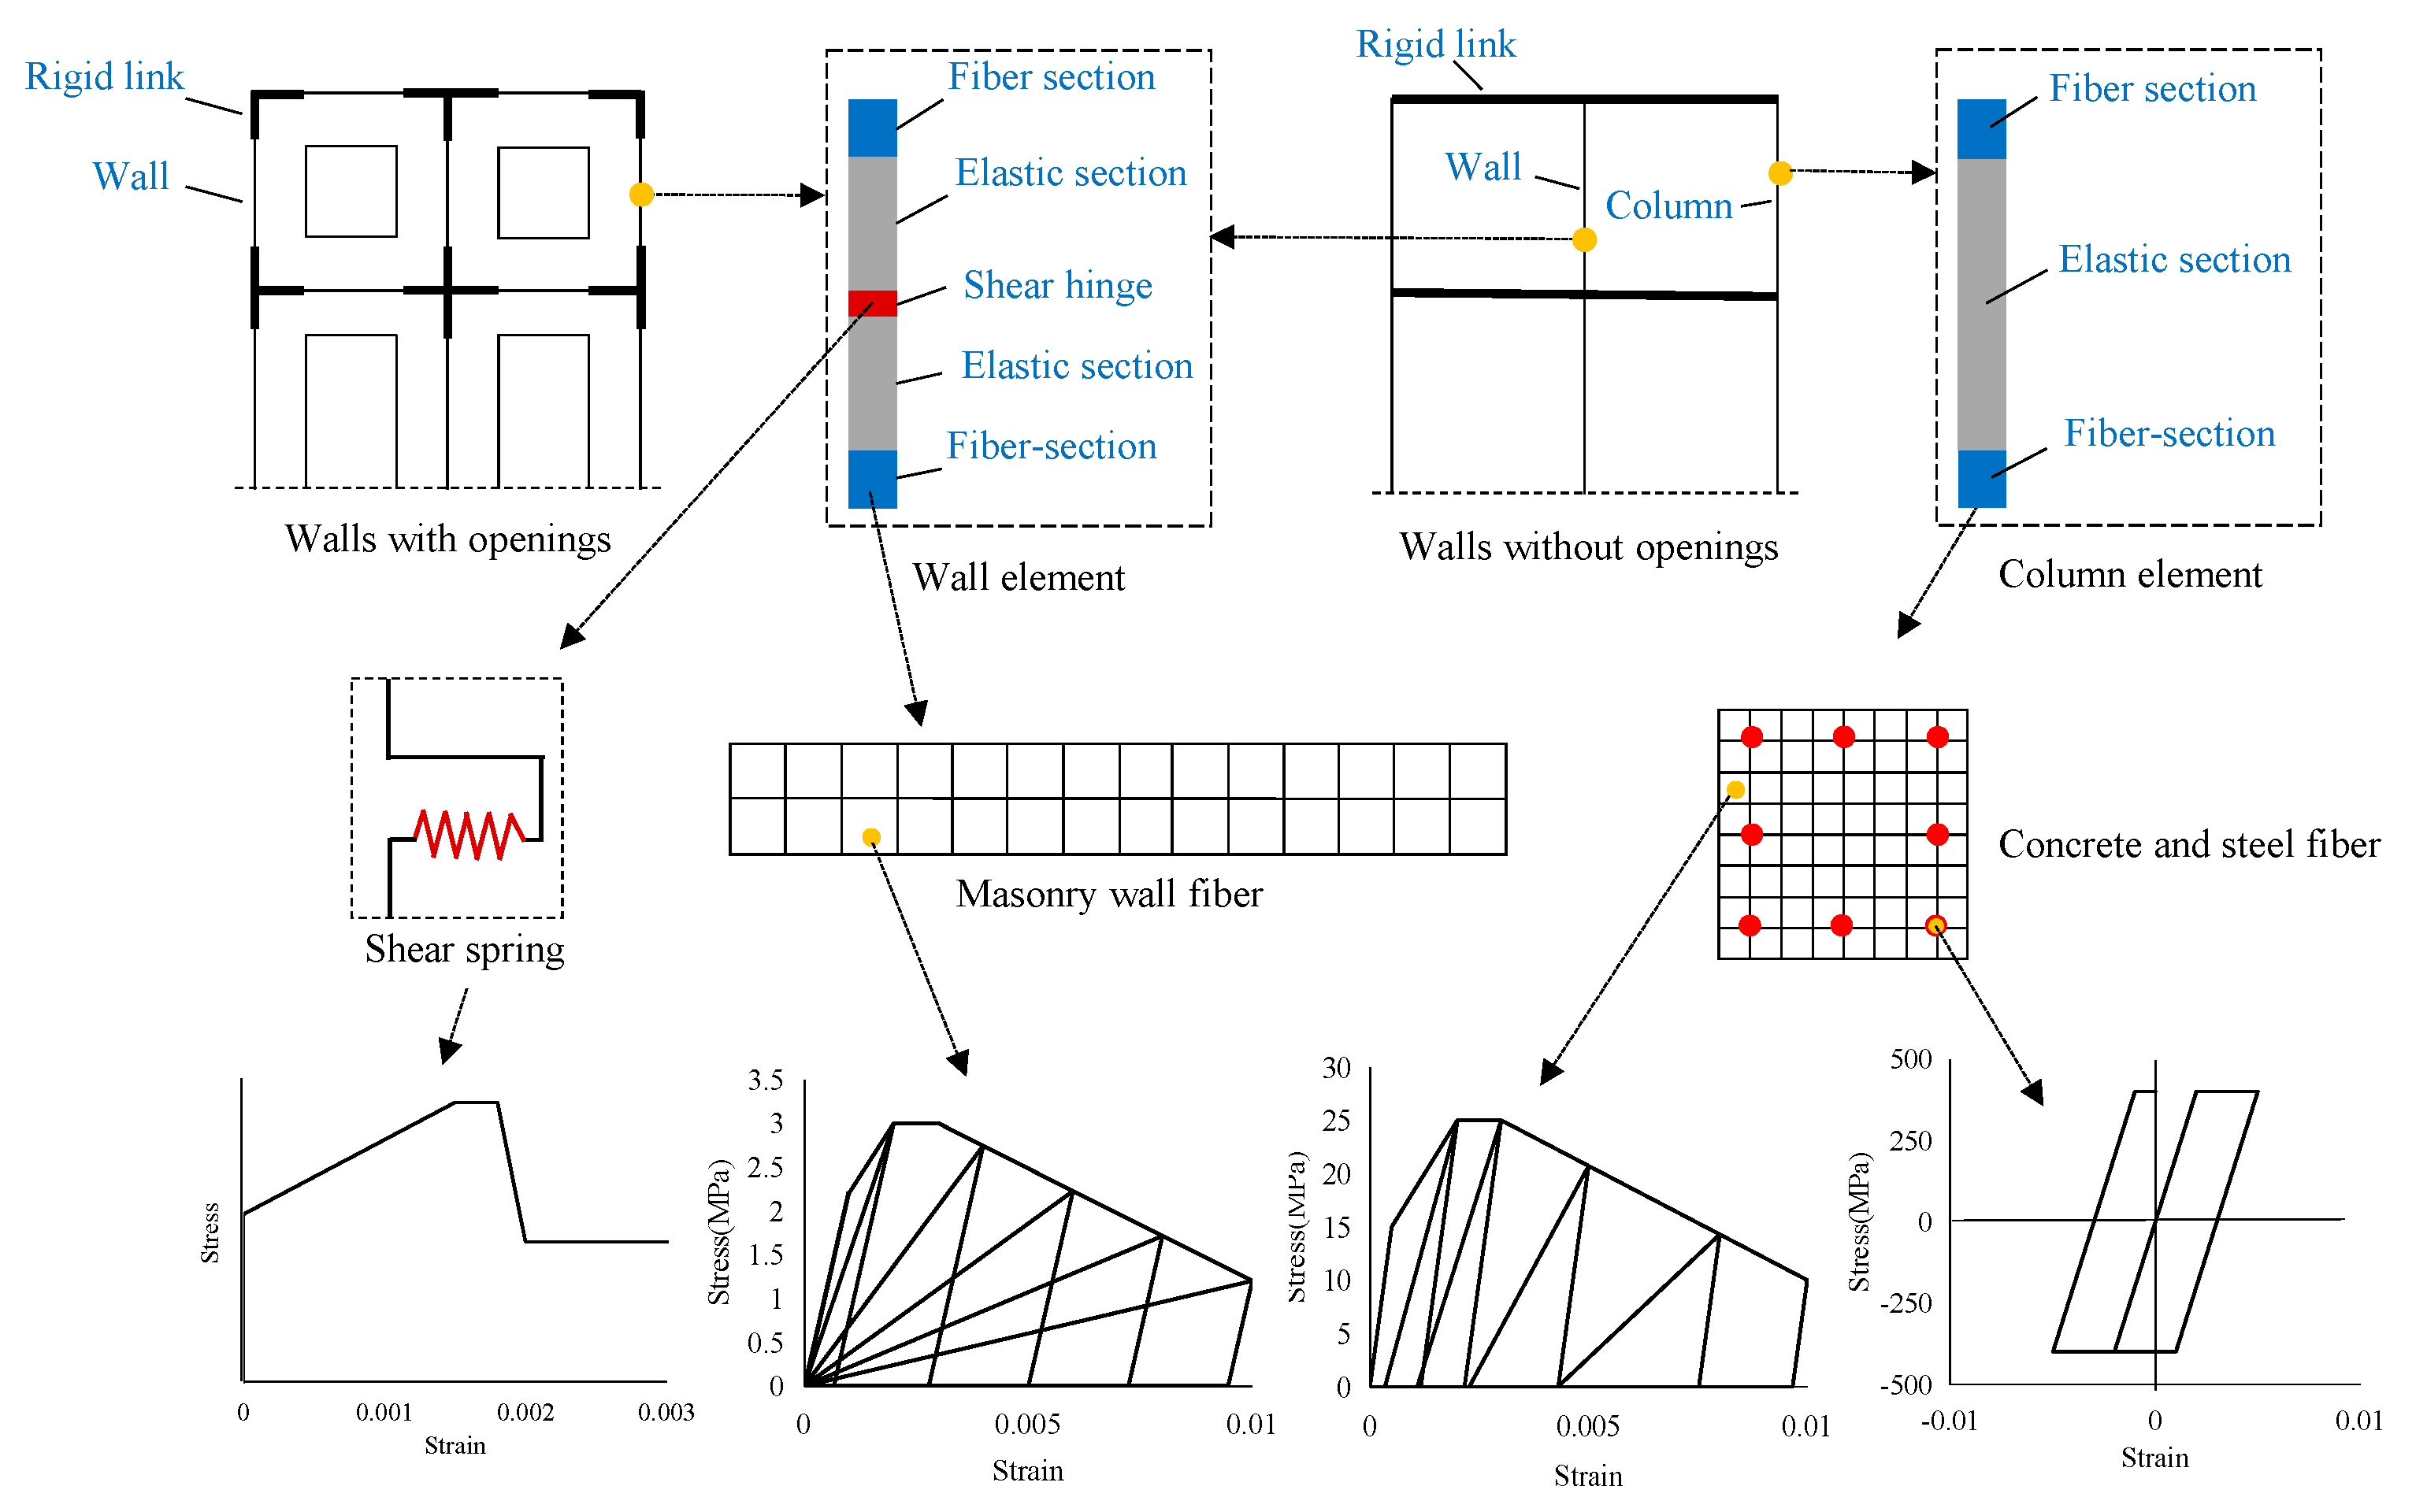
The configuration of load-bearing walls and frame elements is shown in Figure 6. Rigid zones were introduced at the intersections of horizontal and vertical elements in perforated walls. Wall piers were modeled as frame elements, with nonlinear flexural behavior simulated using fiber sections at both ends and nonlinear shear hinges assigned to the elastic middle segment to capture shear-related inelasticity. Frame columns were modeled similarly, with fiber sections at both ends and an elastic segment in between. Both the fiber sections and shear hinges were defined according to material constitutive relationships [49]. Additionally, slabs were modeled under the rigid-diaphragm assumption, consistent with standard seismic analysis practice. This approach is supported by field observations, which revealed no significant in-plane slab failures, indicating that the slabs effectively acted as rigid diaphragms in distributing lateral forces. Consequently, the analysis focused on the dominant failure mechanisms of walls, columns, and infills, without significant influence from slab in-plane bending.
Given the practical challenges in accurately determining the material parameters of existing buildings, representative values were used in this study: concrete compressive strength of 25 N/mm2, steel yield strength of 400 N/mm2, shear strength of load-bearing walls of 0.8 N/mm2, and masonry compressive strength of 3 N/mm2. The objective was not to replicate the precise behavior of a specific structure, but to capture the overall structural and component-level response necessary for validating the proposed failure mechanisms. From this perspective, the absolute values of the material parameters are less critical than their relative magnitudes, which govern the balance between load-bearing capacity and deformation. To address uncertainties, sensitivity analyses were conducted within a reasonable parameter range. These checks confirmed that variations in strength values did not alter the identified failure modes, but only affected the specific displacement or force levels at which failure occurred. This approach ensures that the adopted nominal parameters are both sufficient and appropriate for the study’s objectives.
In the frame–infill wall model, the interaction between the infill wall and the surrounding frame produces a stiffened composite component. Based on field observations, only the in-plane behavior of the infill walls was considered, while out-of-plane effects were neglected. The diagonal strut model is widely accepted for representing infill walls [50] (see Figure 7). In this study, the effective strut width was calculated according to FEMA 365:
a = 0.175 λ 1 h c o l 0.4 r i n f
λ 1 = E m e t i n f sin 2 θ 4 E f e I c o l h i n f 4
where a is the equivalent strut width; λ1 is the stiffness coefficient; hcol is the column height; rinf is the diagonal length of the infill wall; Eme is the elastic modulus of masonry; tinf is the thickness of the equivalent strut; θ is the diagonal inclination angle; Efe is the elastic modulus of the frame material; Icol is the moment of inertia of the column section; and hinf is the height of the infill wall.
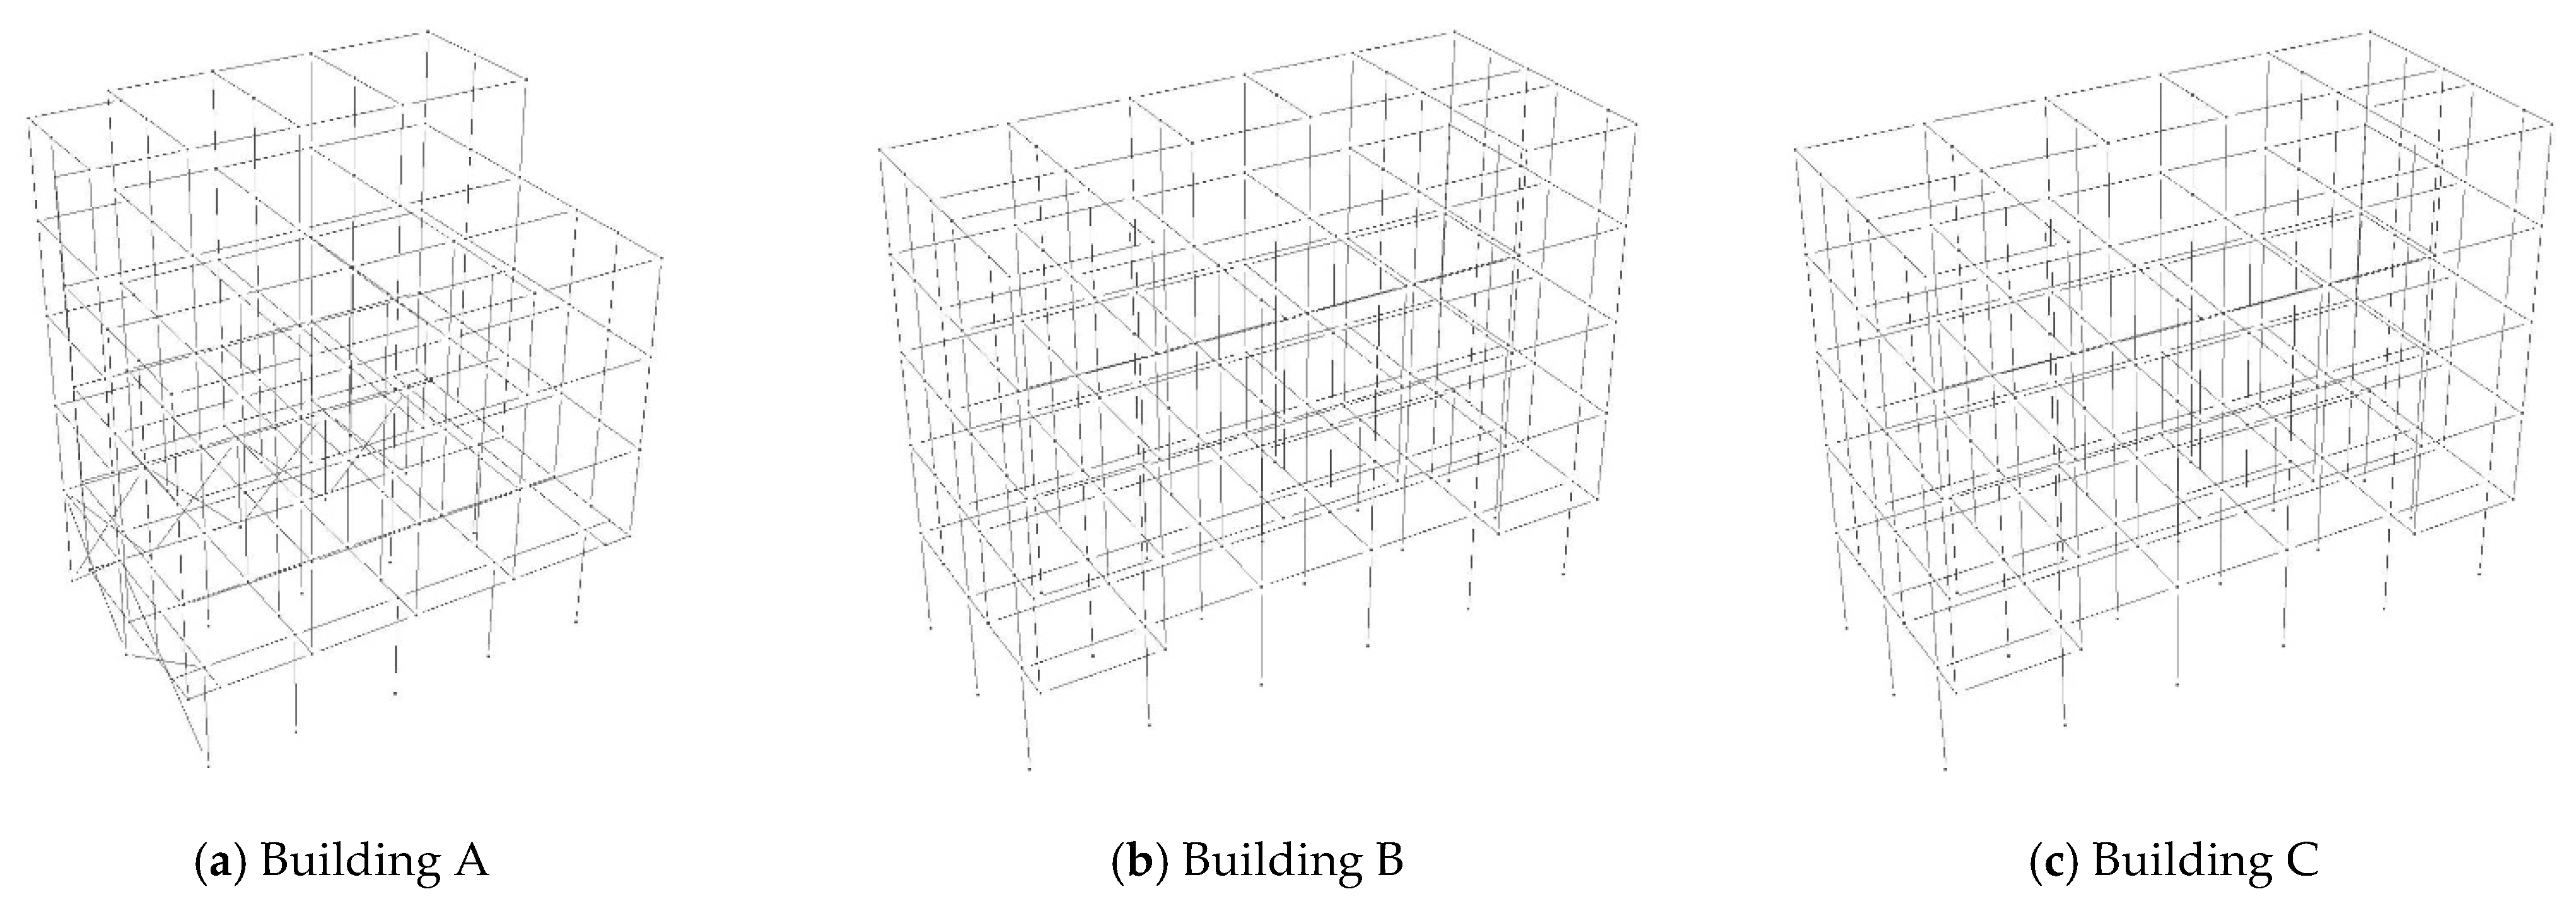
The established numerical models are shown in Figure 8.

4.2.2. Loading Conditions

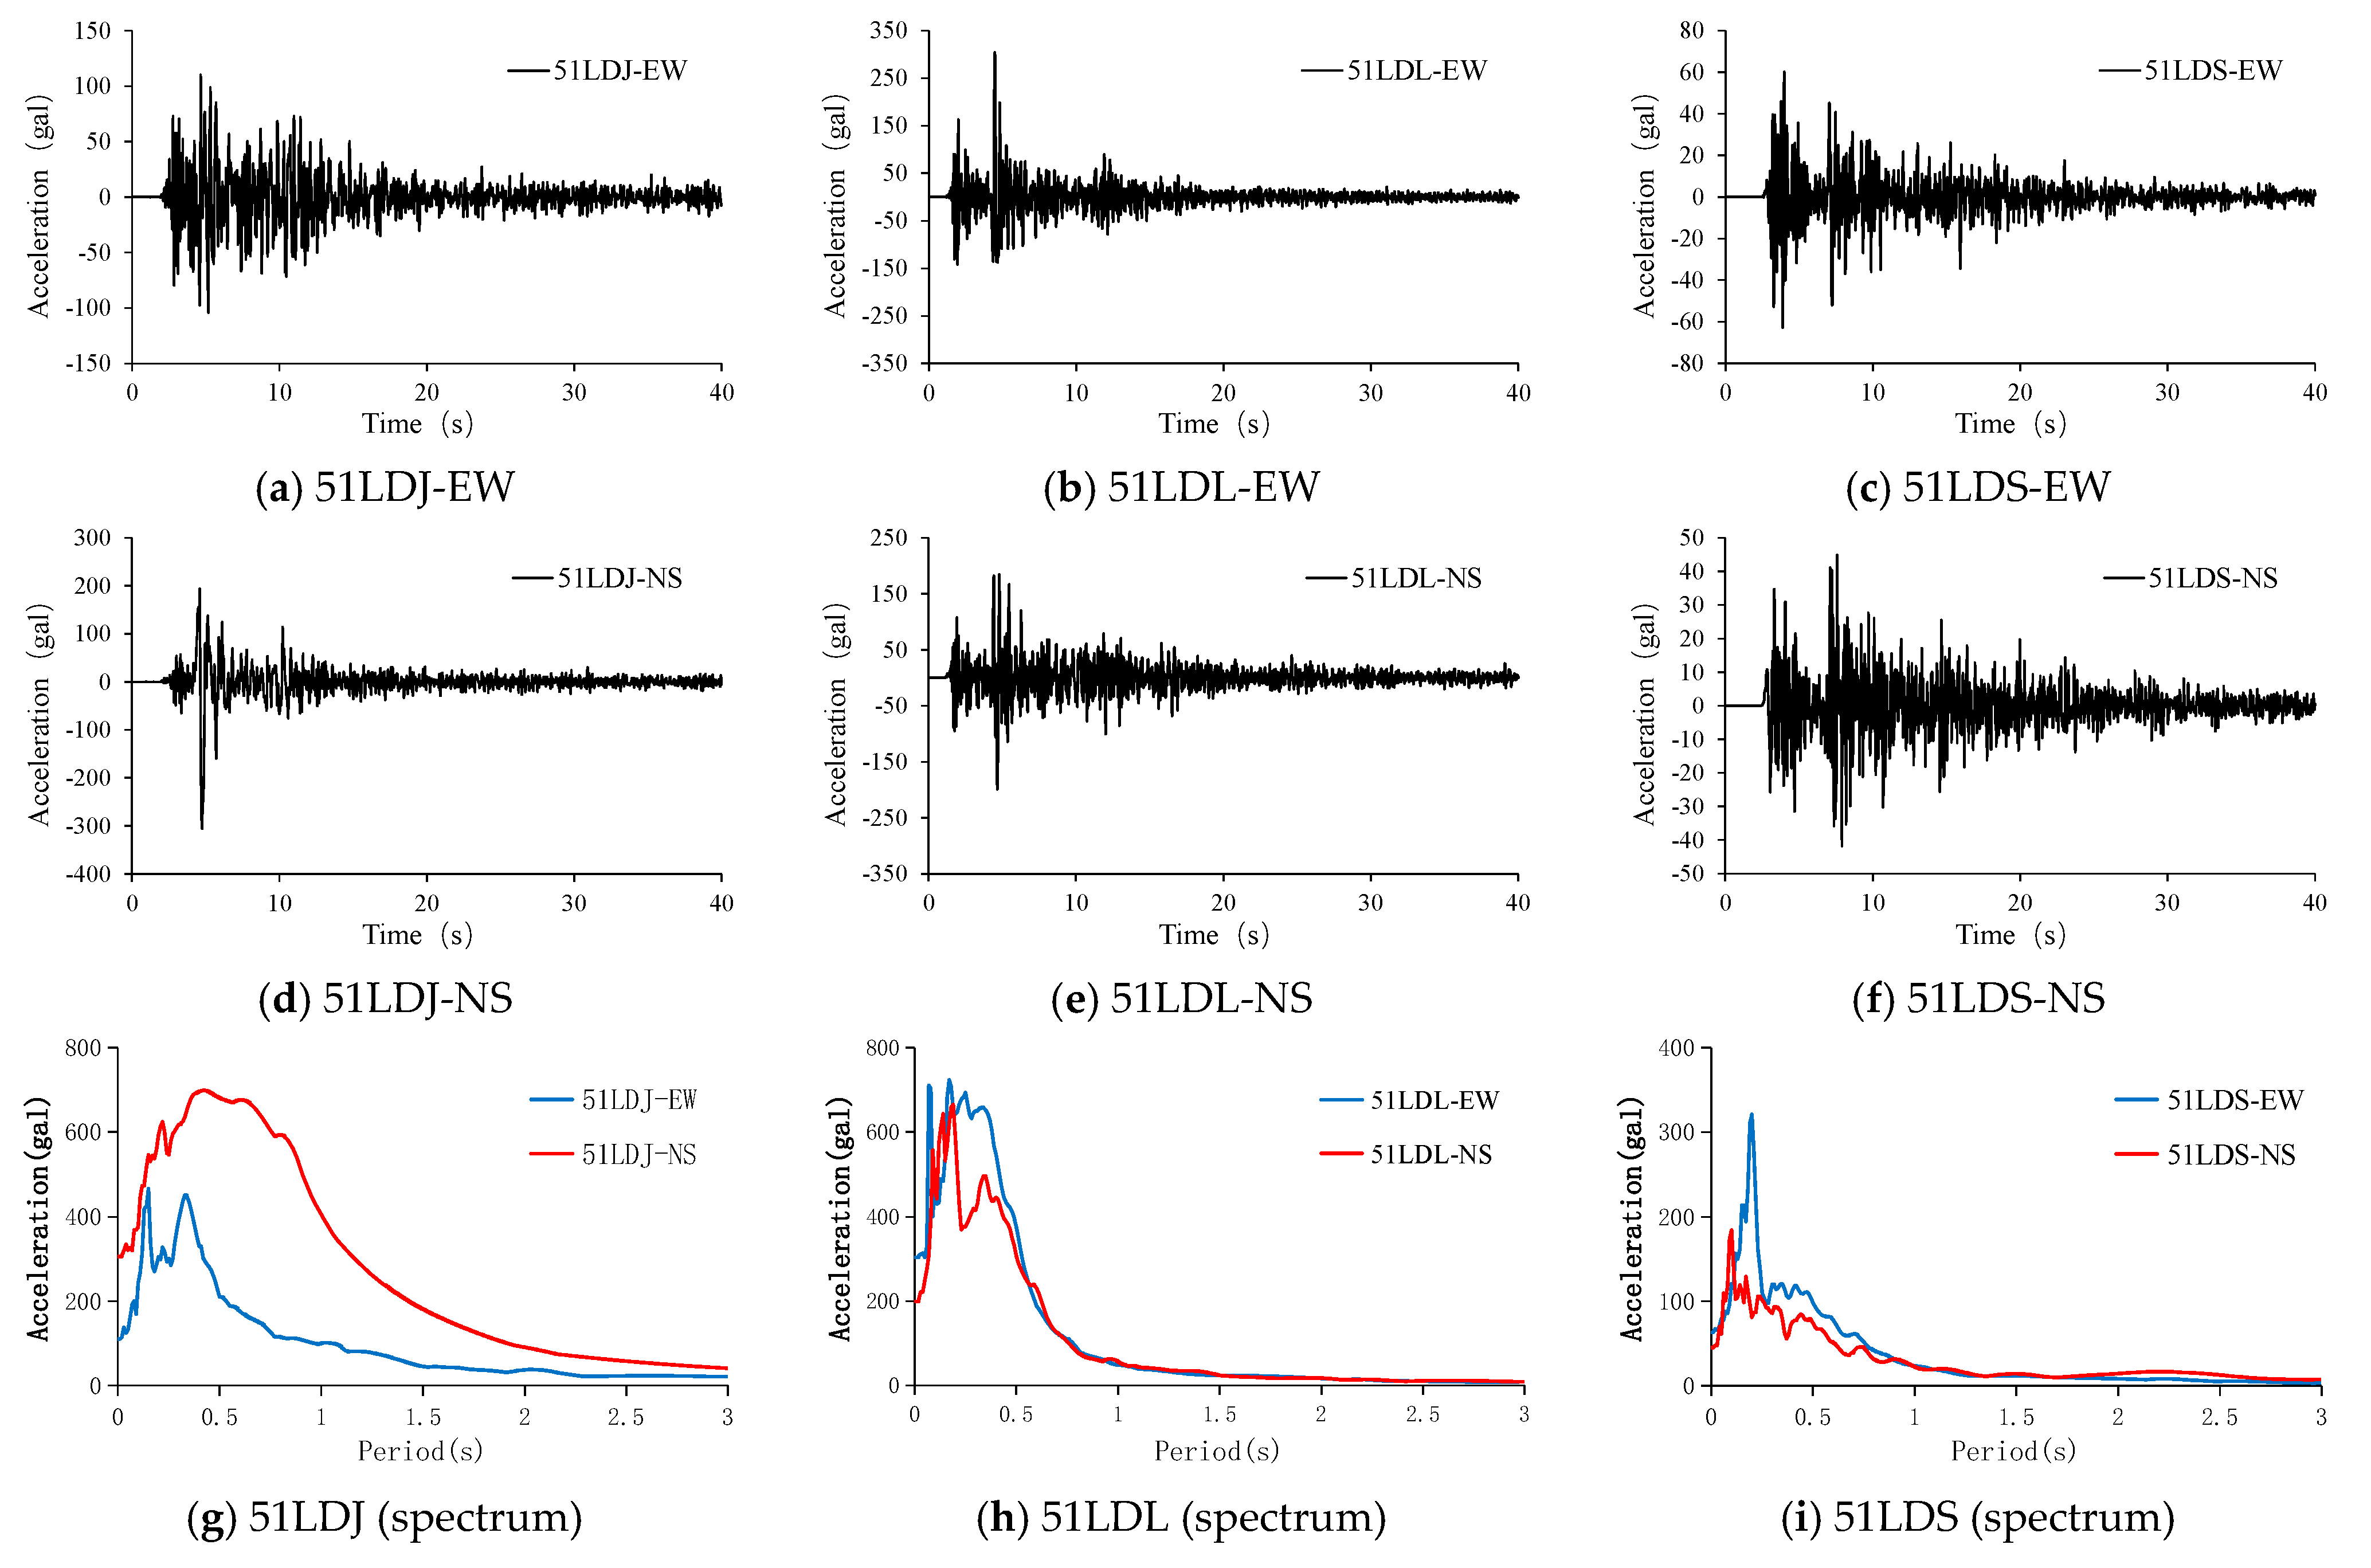
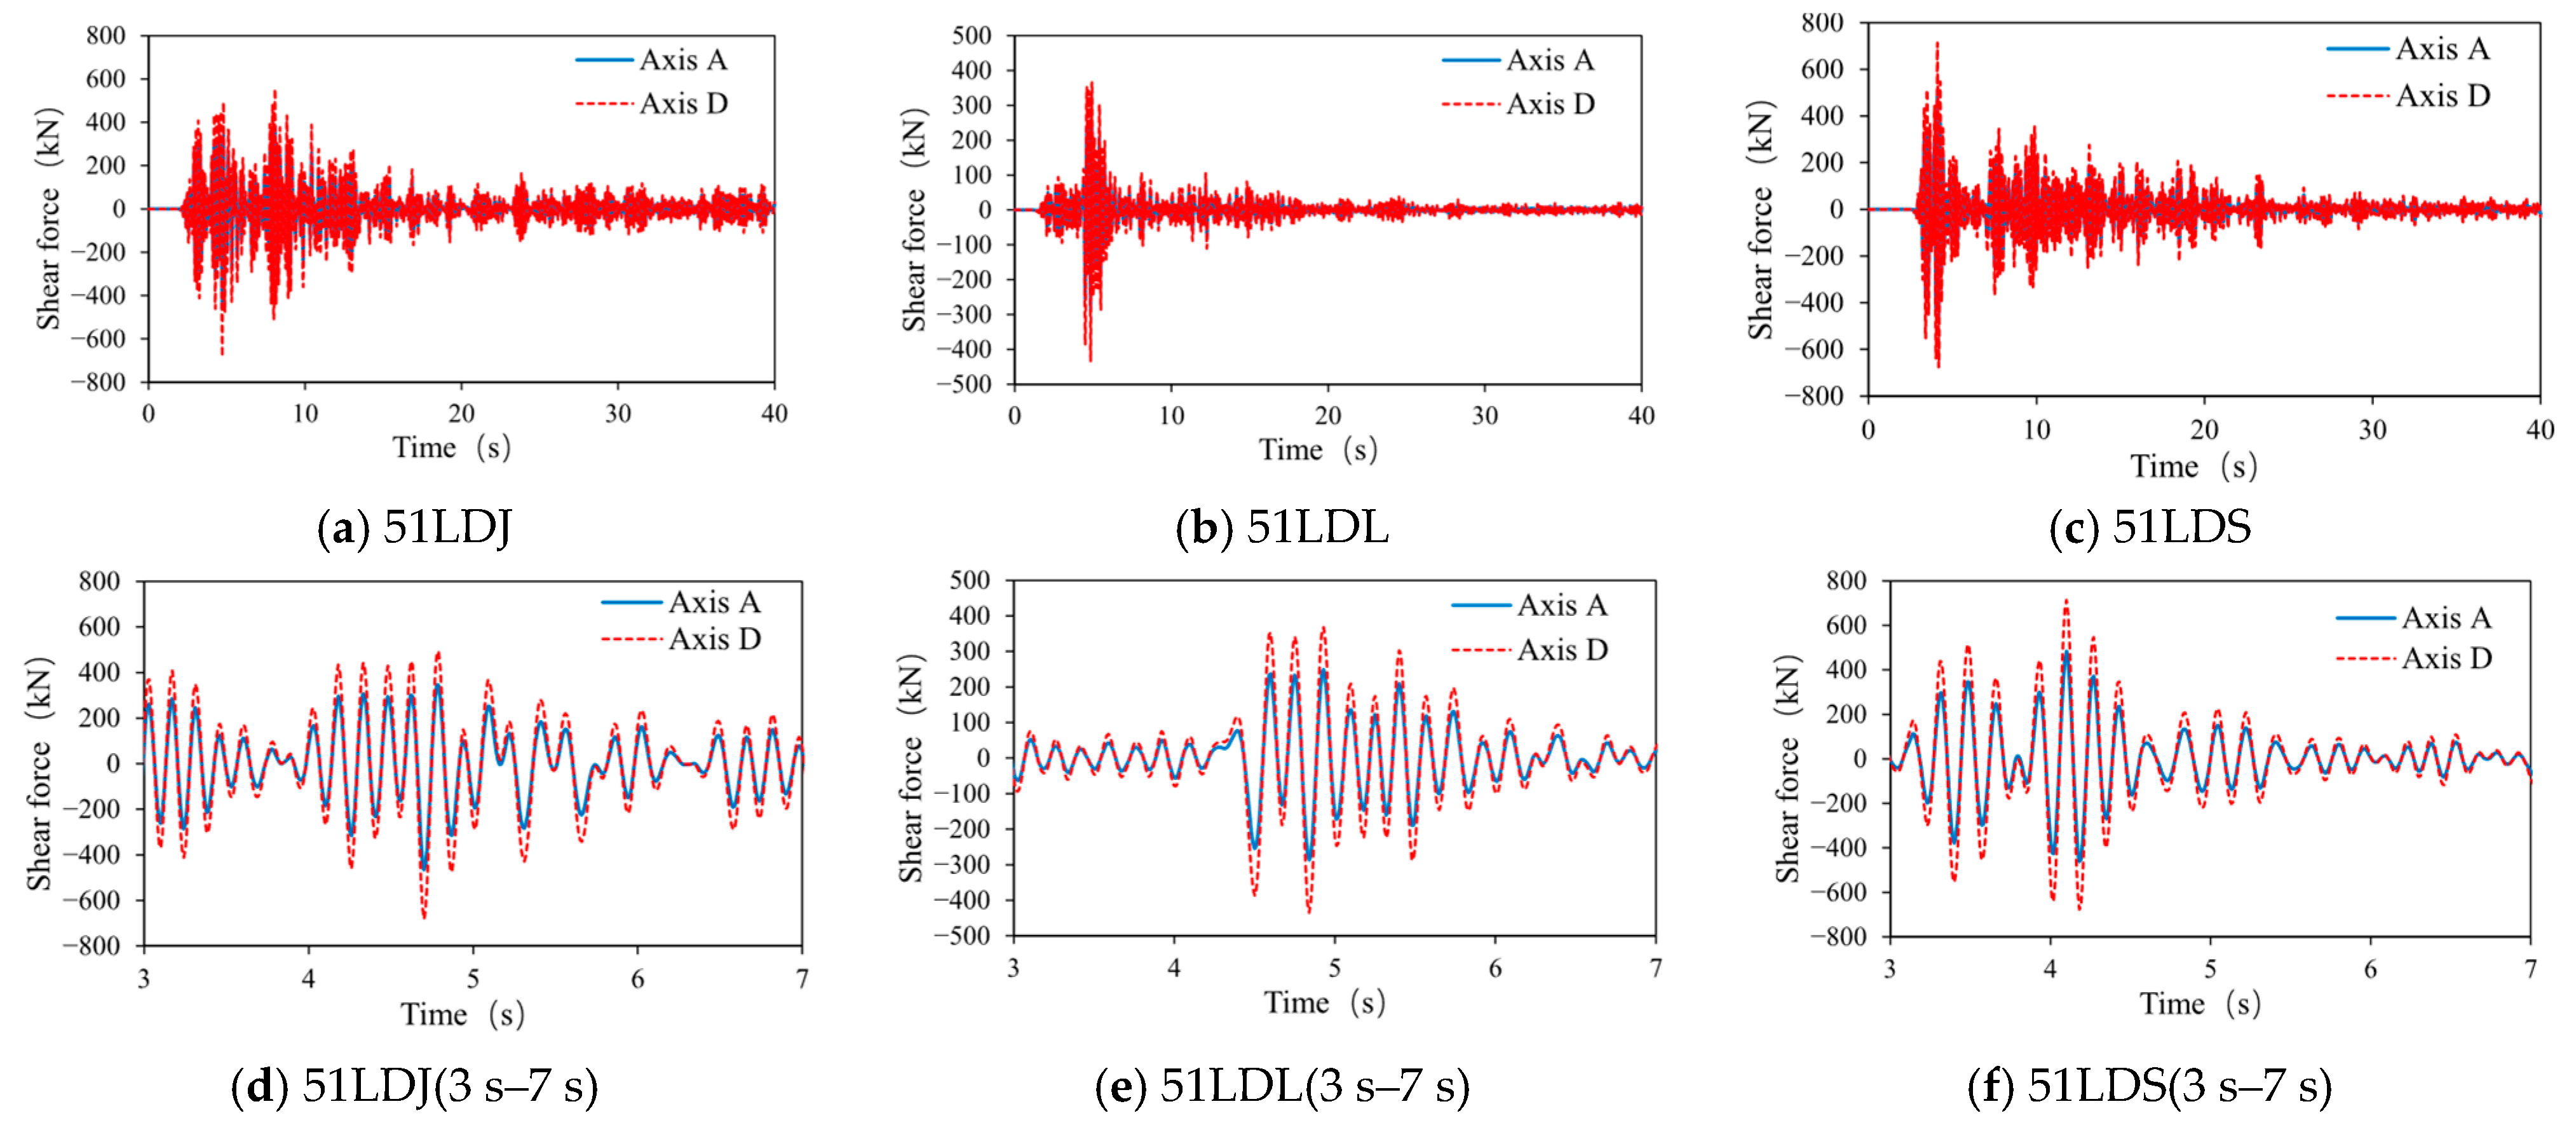
Nonlinear time-history analyses were performed under bidirectional seismic excitations. Multiple strong-motion records were obtained from both accelerographs and intensity meters during the earthquake, and three accelerograph records were selected as seismic inputs for the numerical models. The record from the 51LDJ station in Jiajun Township, Luding County, exhibited peak ground accelerations (PGAs) of 0.11 g (east–west) and 0.31 g (north–south). The record from the 51LDL station in Lengqi Town, Luding County, showed PGAs of 0.30 g (east–west) and 0.20 g (north–south). The record from the 51LDS station in Luqiao Town, Luding County, had PGAs of 0.06 g (east–west) and 0.05 g (north–south). The acceleration time histories are presented in Figure 9.
These three records were selected because they were obtained directly from the 2022 Luding earthquake and therefore most accurately represent the seismic input experienced by the investigated buildings. Notably, their response spectra encompass different amplification ranges—51LDJ at 0–1 s, 51LDL at 0–0.5 s, and 51LDS at 0–0.25 s—ensuring a diverse representation of frequency content (Figure 9g–i). Since the focus of this study is on capturing generalized structural responses and validating failure mechanisms, rather than conducting probabilistic fragility assessments, these three records are sufficient and appropriate for the intended analysis.
To investigate the distribution of internal forces and displacement ratios under minor earthquakes, all input ground motions were initially amplitude-scaled to 0.1 g, and then incrementally increased in steps of 0.1 g until structural collapse occurred, thereby capturing the failure states of each model.
It should be noted that the validation in this study is mechanism-oriented and semi-quantitative. Because detailed post-earthquake measurements—such as residual drift, energy dissipation, or quantitative damage indices—were not available for the surveyed buildings, the correlation between numerical and observed damage was established through comparative deformation and shear ratios, failure sequence, and overall damage morphology, rather than absolute numerical indices. This approach aligns with widely adopted practices in post-earthquake mechanism analyses.
The semi-quantitative validation adopted here ensures that the dominant structural motion mechanisms—torsion-dominated, translation-dominated, and uniform-stiffness behaviors—are faithfully reproduced, even in the absence of precise local damage parameters. Future studies will incorporate quantitative measures, including energy-based and drift-based damage indices, as detailed experimental or monitoring data become available. These enhancements will further improve the accuracy of model-to-observation correlation.

4.3. Result and Analysis

4.3.1. Building A

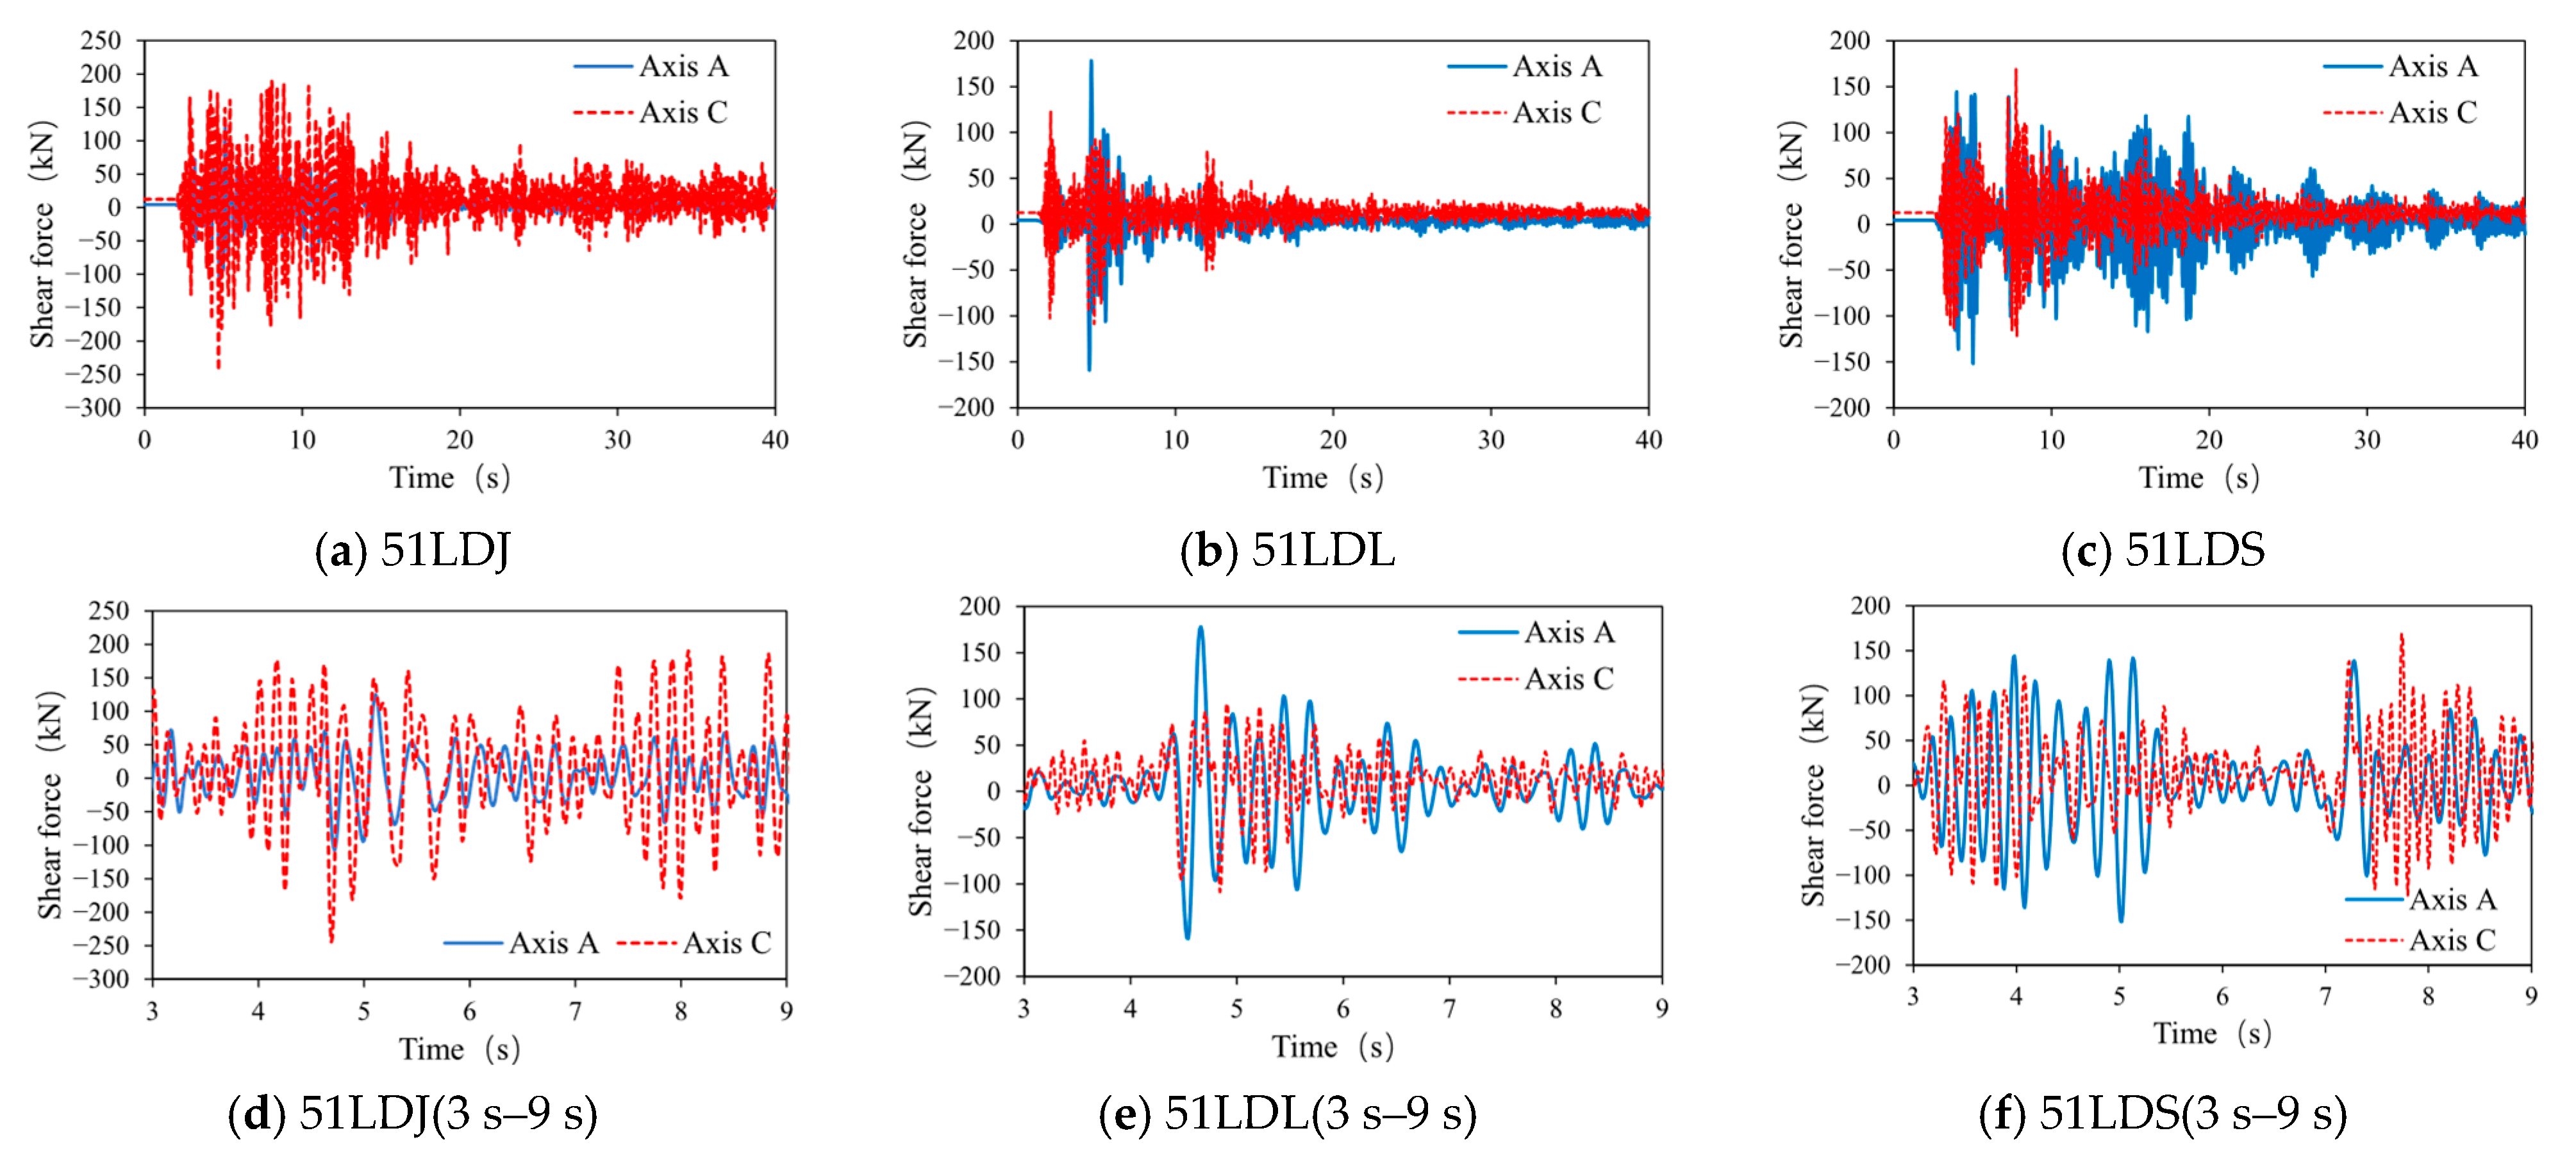
Figure 10 presents the time-history curves of shear forces for all components along Axes A and C under a 0.1 g ground motion. Axis A consists of bare frame columns without infill walls, while Axis C comprises frame columns fully infilled with walls. Despite the substantial stiffness contrast between these axes, the base shear force time histories are nearly identical. This behavior is analogous to a simply supported beam with end springs of differing stiffness: when subjected to a central load, the end displacements differ, but the forces remain equal (Figure 4b). Such a response indicates minimal torsional restraint, resulting in a fully developed torsional failure mechanism. Table 1 summarizes the ratios of maximum base shear forces as 1:1.28, 1:0.79, and 1:1.39, further confirming the similarity in shear demands on both axes.
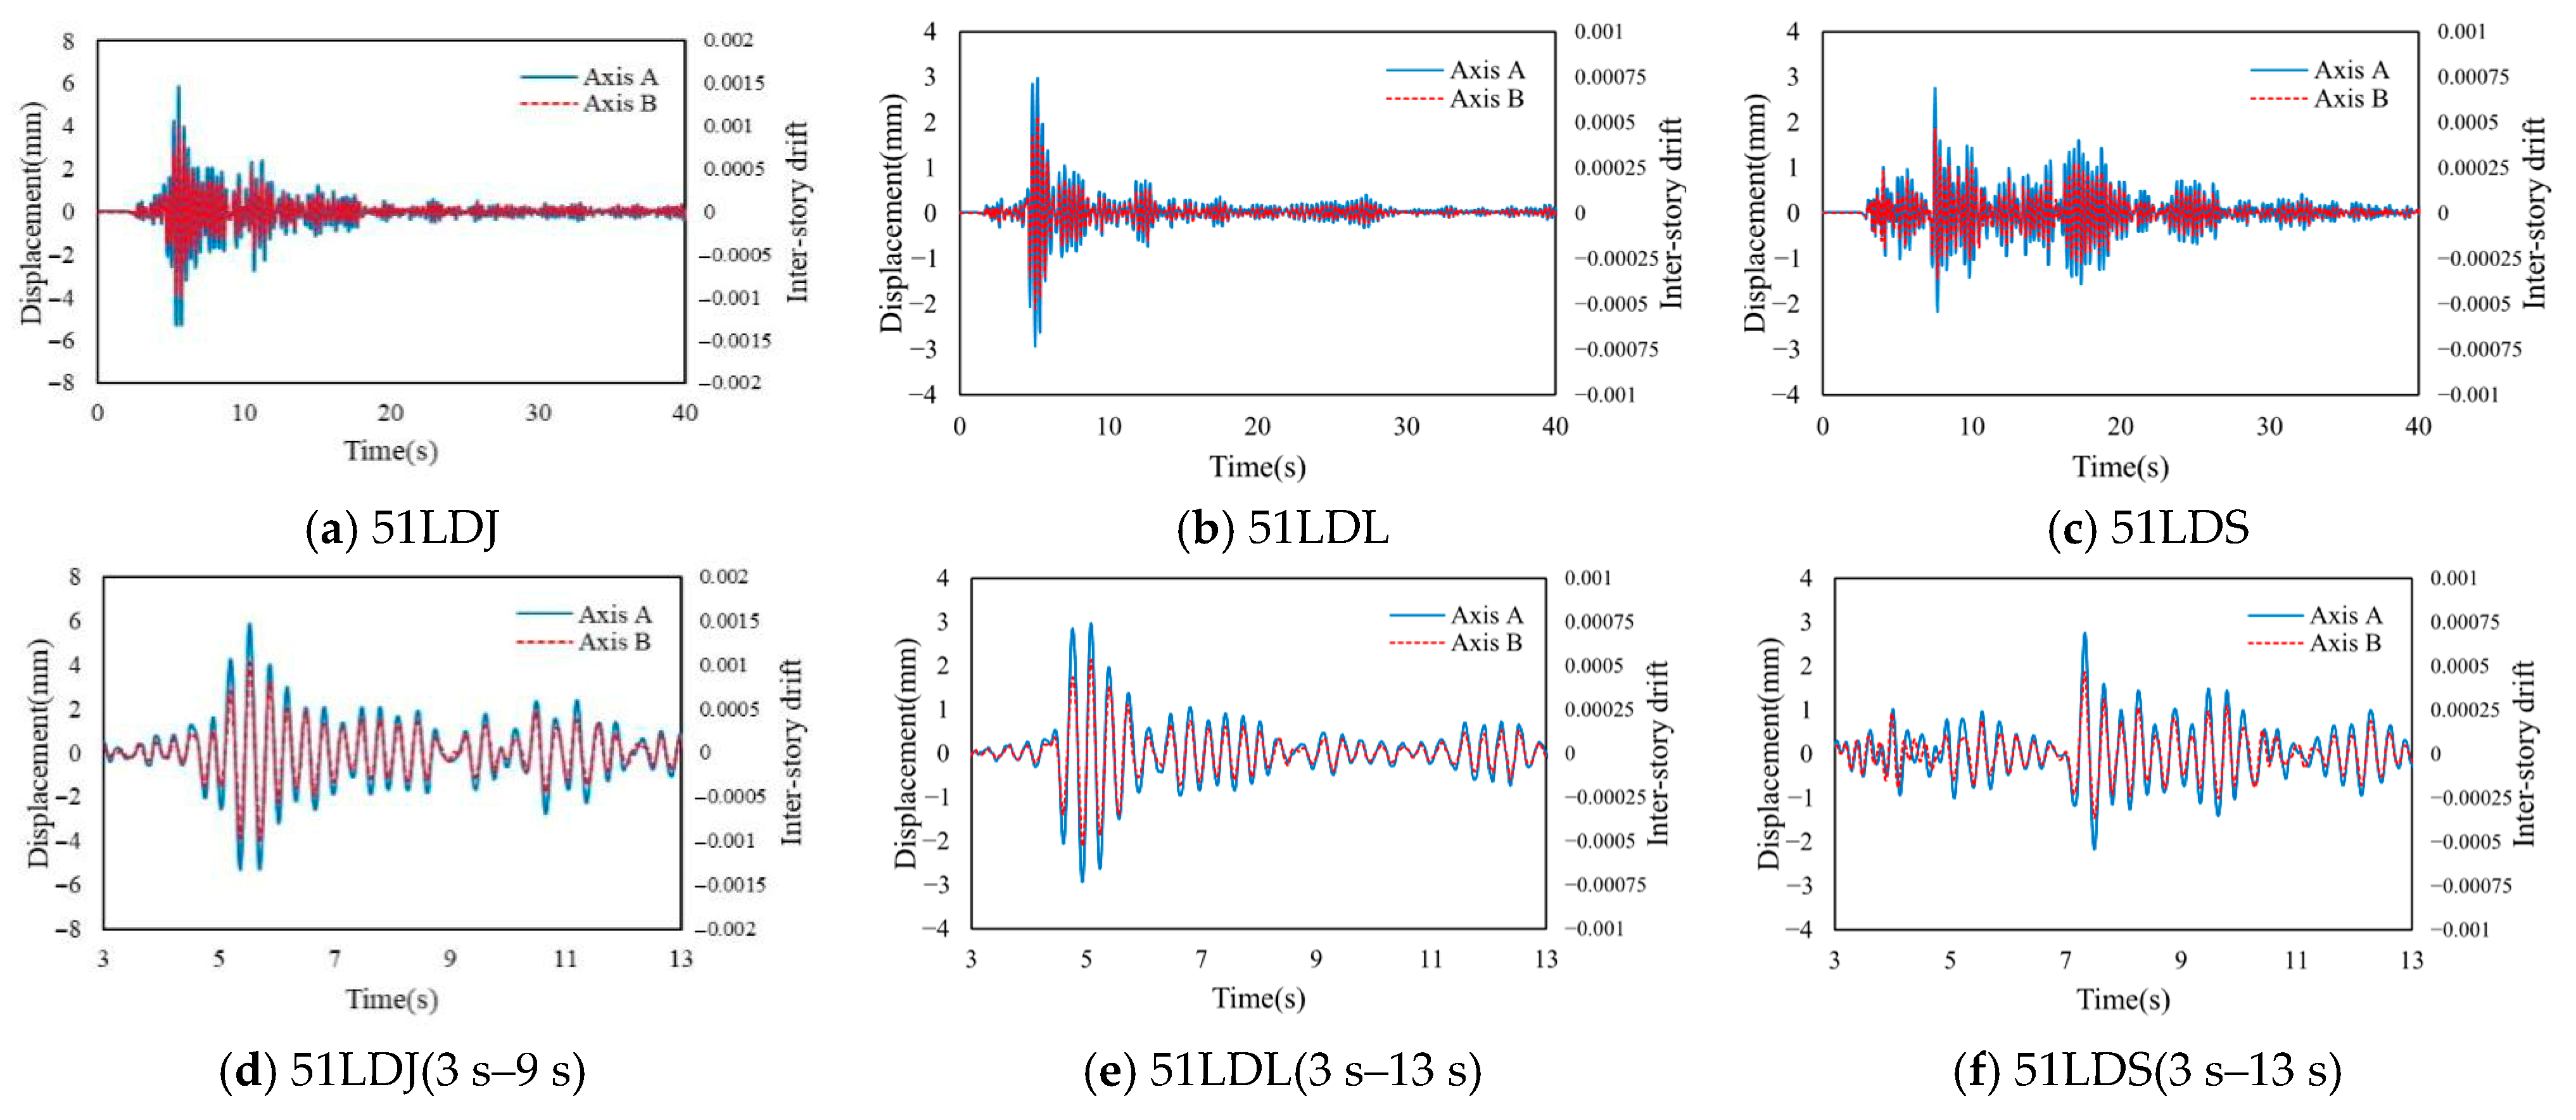
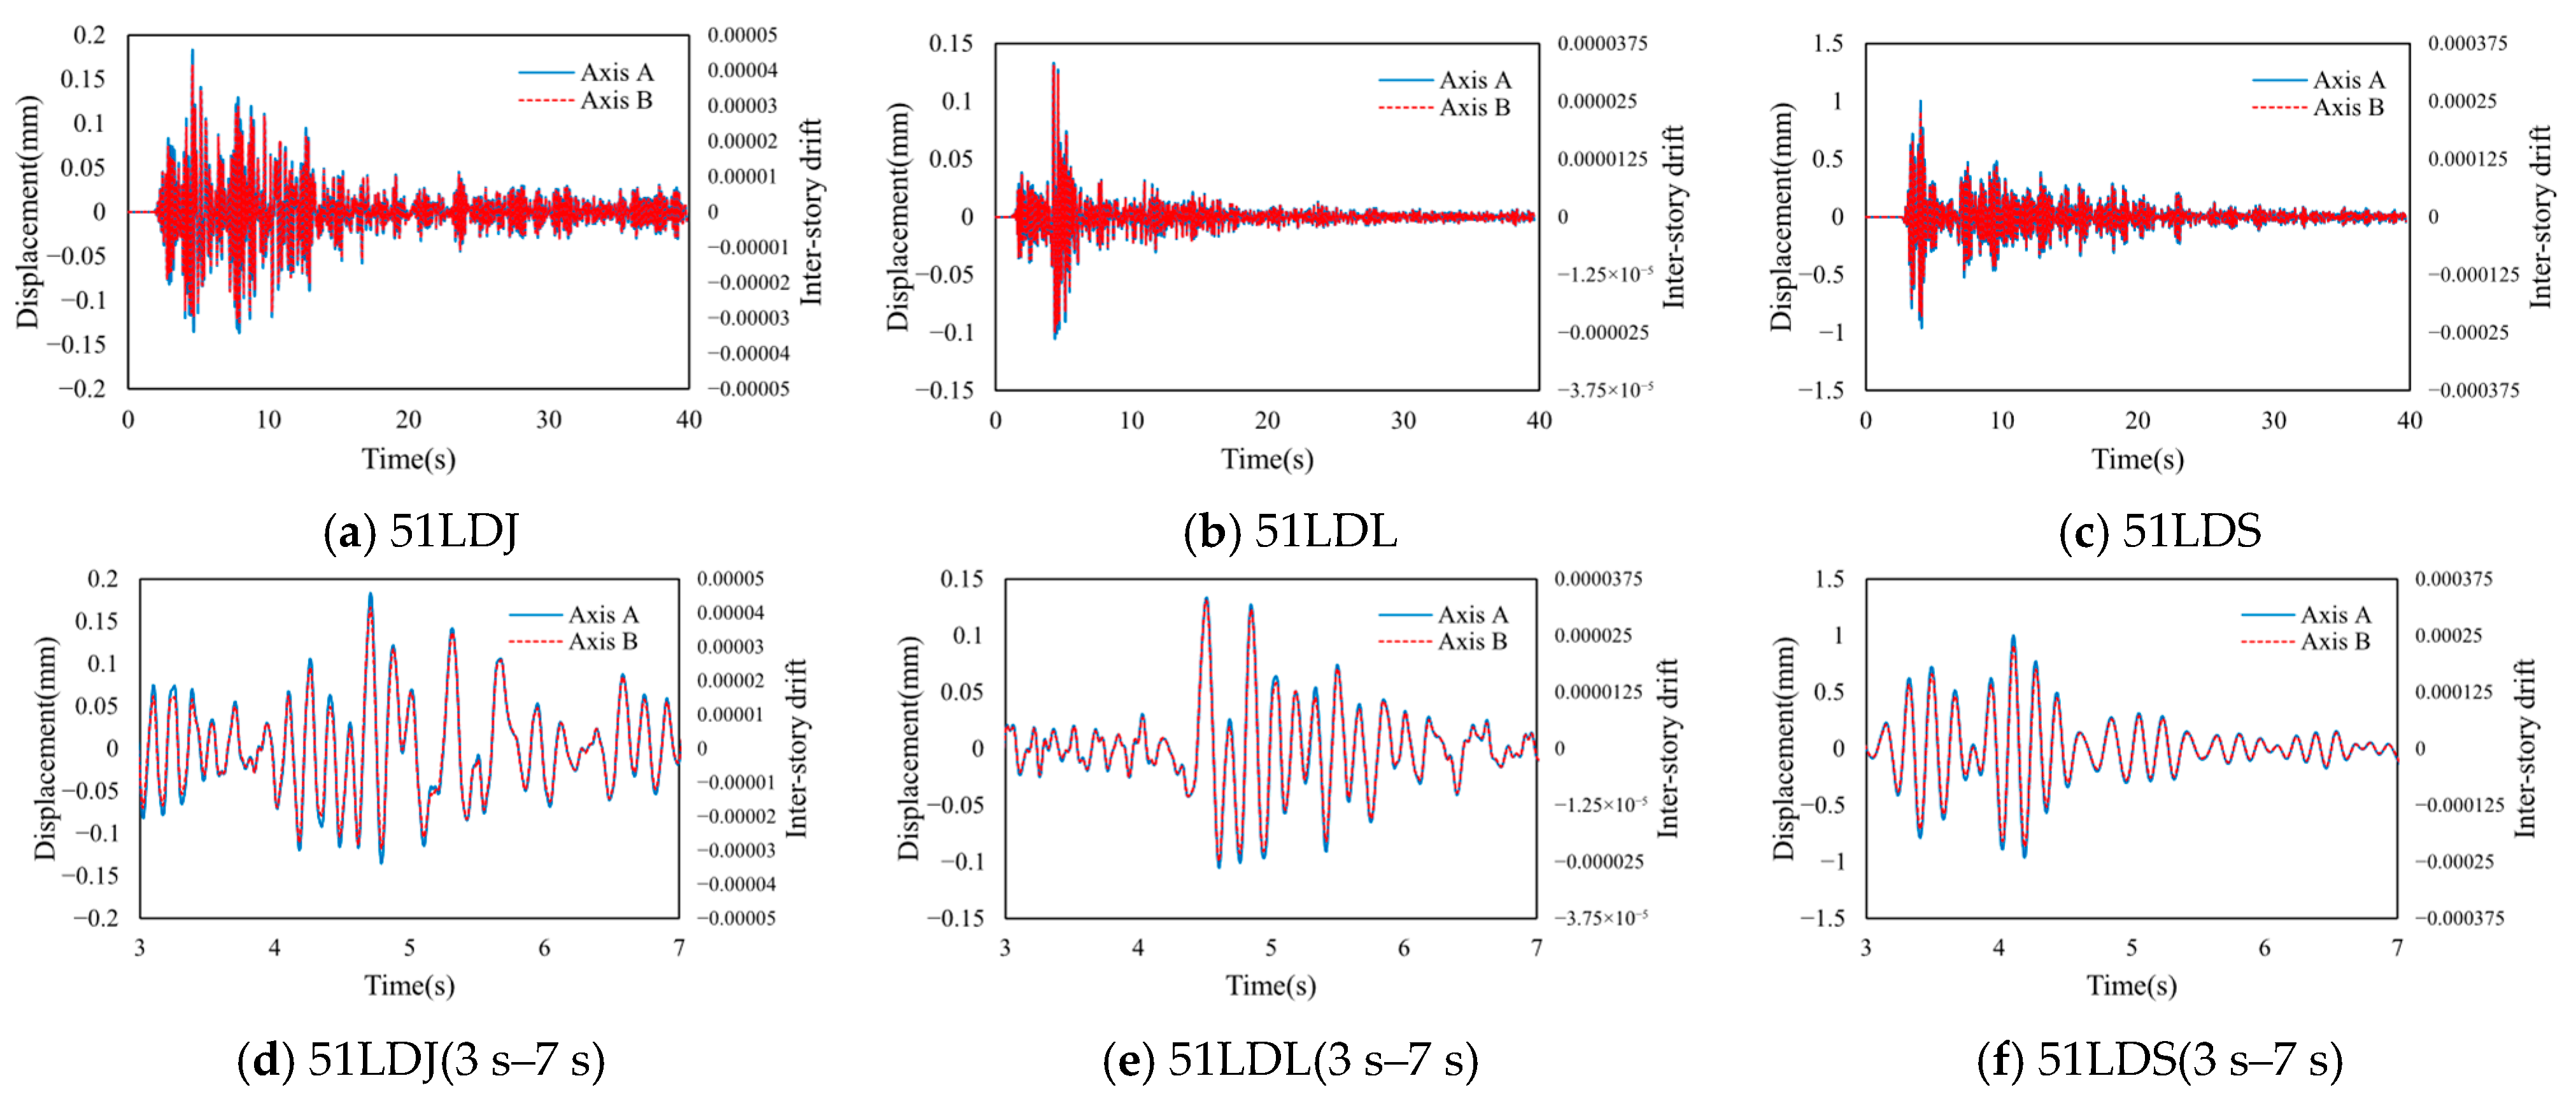
To further investigate the structural response, the displacement behavior of these components is examined. Figure 11 shows the time-history curves of first-story displacements at the top of components along Axes A and C. The displacements of Axis A components are significantly larger than those of Axis C. Given the nearly identical base shear forces, this displacement contrast reflects the substantial stiffness difference between the two axes. As shown in Table 1, the maximum displacement ratios are 4.79:1, 8.44:1, and 4.94:1, indicating a pronounced torsional response. These results demonstrate that the stiffness contrast between components along different axes governs the degree of torsion, highlighting the dominant contribution of infill walls, as the stiffness of infilled frame columns far exceeds that of bare frame columns.
When the input ground motion is scaled to a peak acceleration of 0.5 g, the structure experiences severe damage. Results under the 51LDL record are provided for illustration. Figure 12 displays the time-history of displacements for components along Axes A and C. As the members enter the inelastic range, the displacement ratio between the two axes remains largely unchanged, with a maximum value of 7.12:1—similar to that under the 0.1 g case—indicating that the stiffness of Axis A frame columns progressively degrades due to yielding, while the infill walls in Axis C simultaneously enter the inelastic stage.
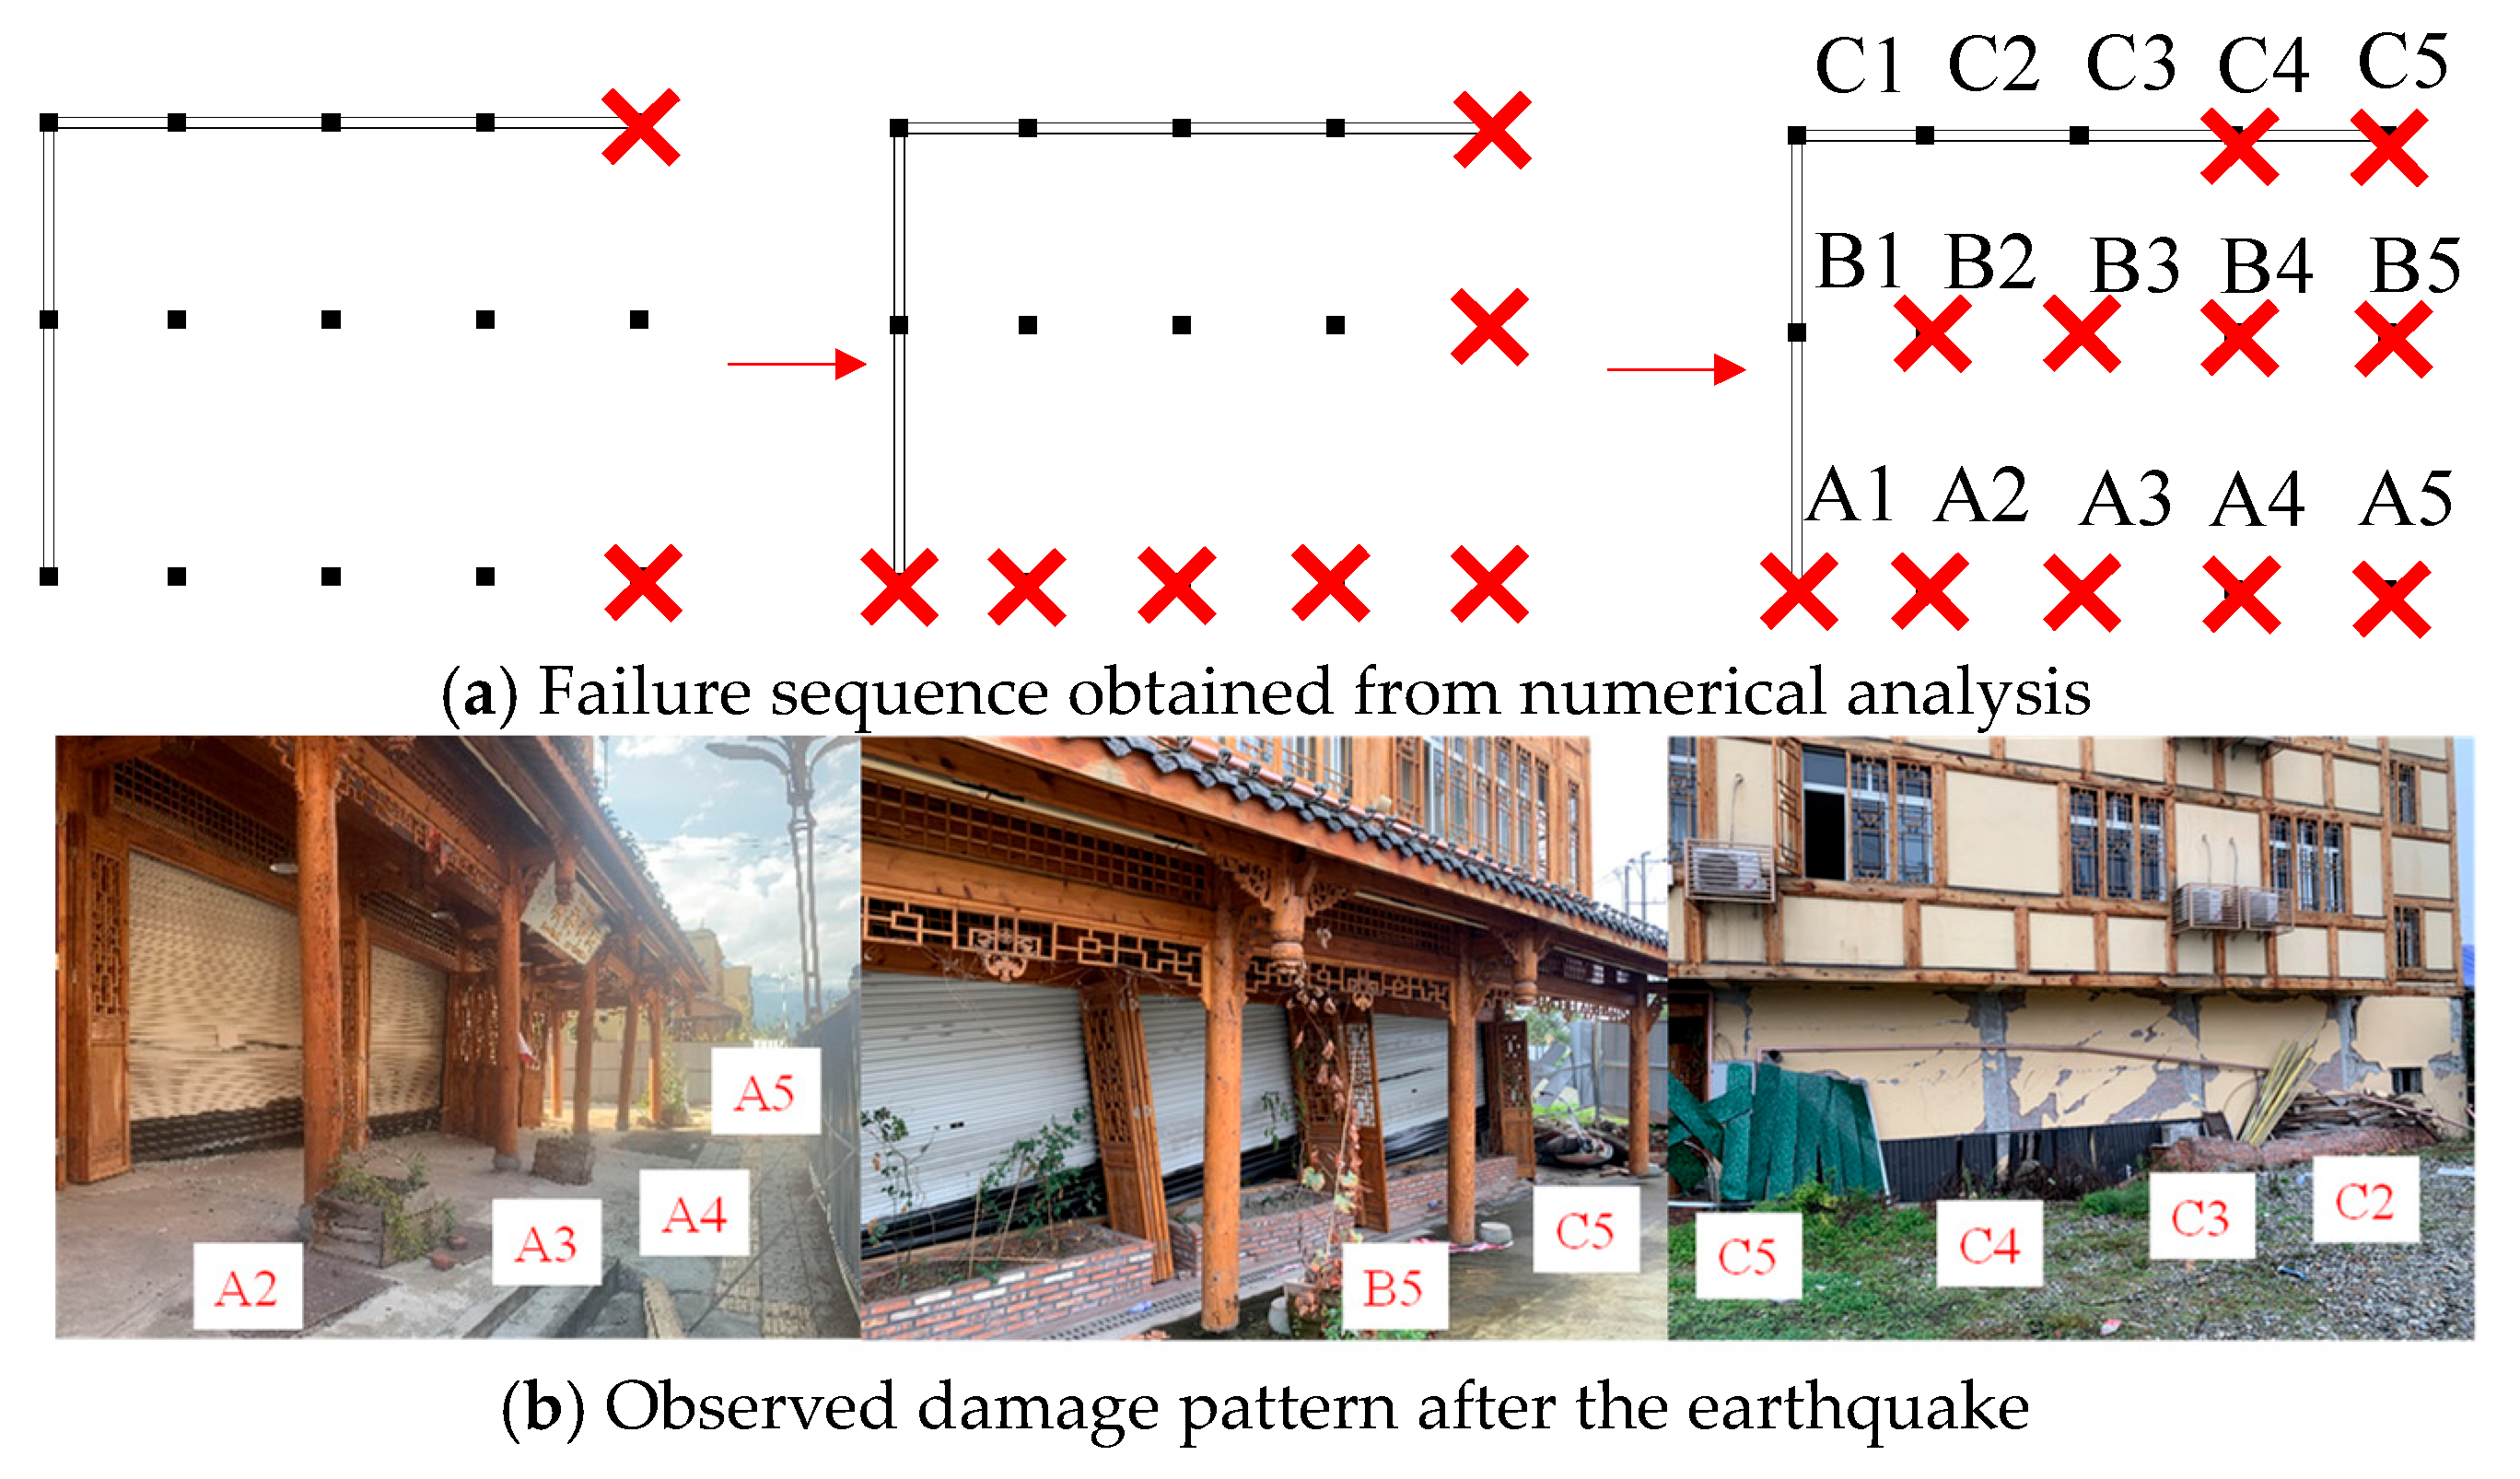
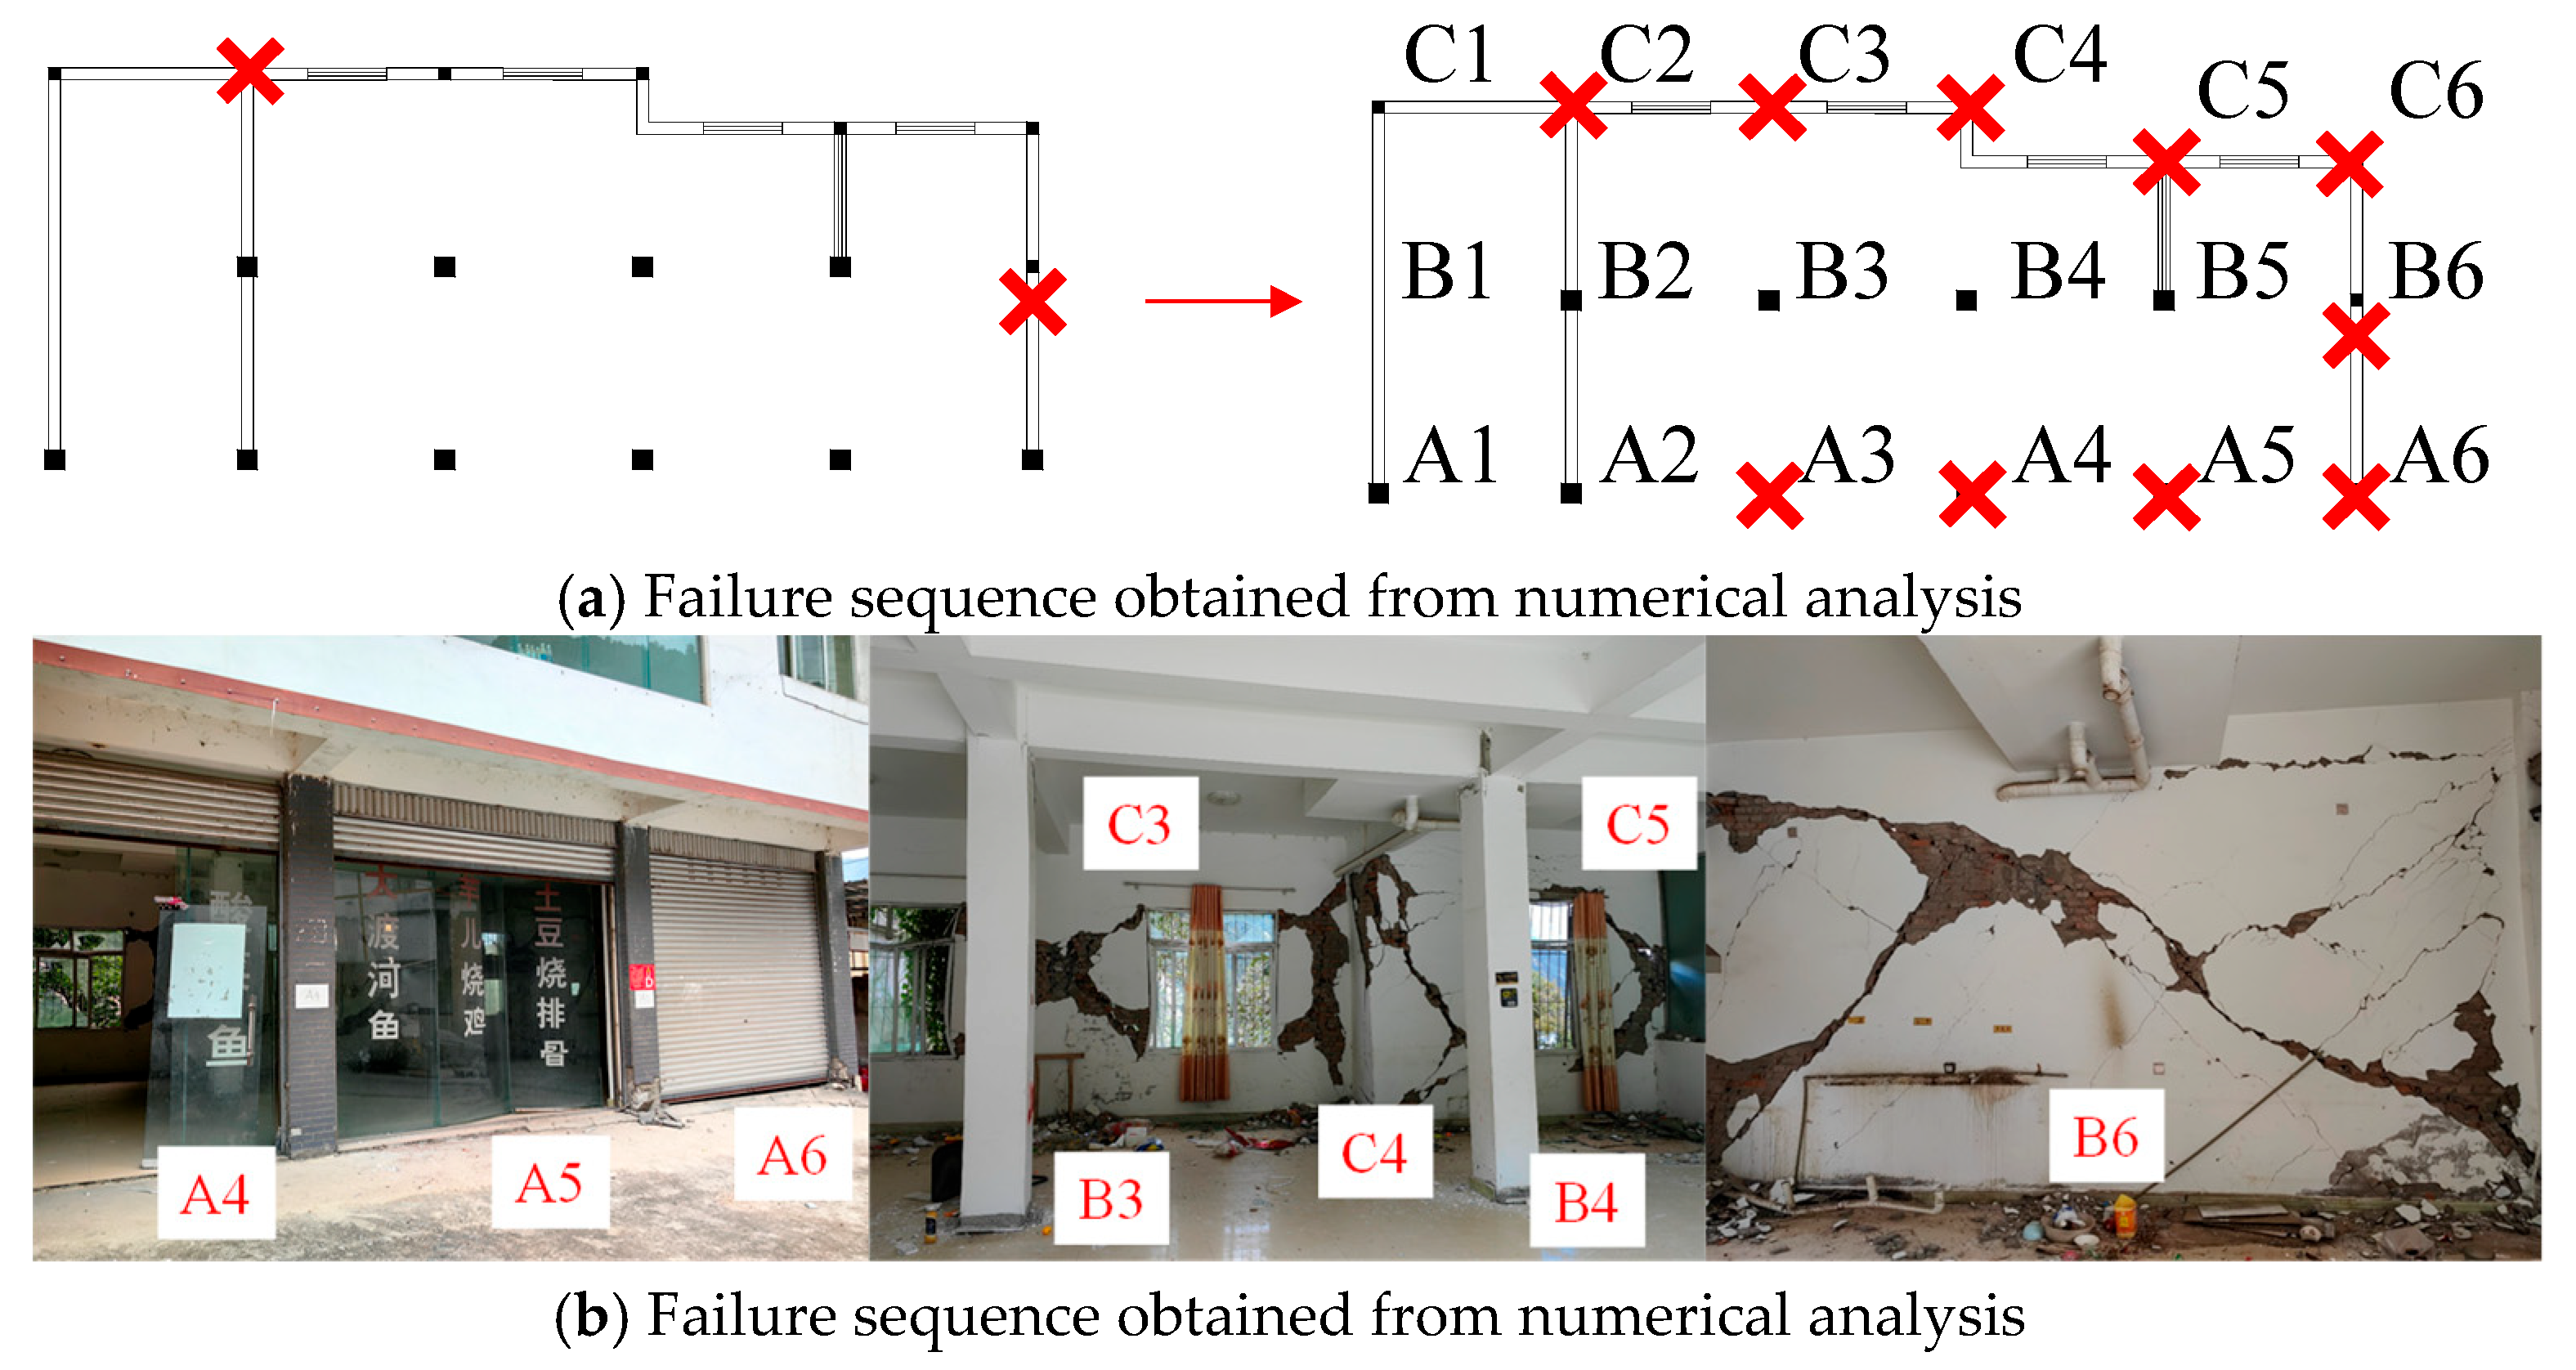
To better understand the progression of failure, the sequence of yielding and collapse is analyzed, and the results are shown in Figure 13a. The frame column along Axis 5 yields first, followed by those along Axis A. With further increases in torsional displacements, the frame columns along Axis B and Axis 4—initially experiencing smaller displacements—also yield. In contrast, the infilled frame columns do not exhibit in-plane failure. This pattern aligns with field observations, as shown in Figure 13b, and represents a typical torsional failure mechanism. The consistently large displacement ratios between Axes A and C confirm that the stiffness of frame–infill wall assemblies is much higher than that of bare frame columns. This is a typical characteristic of corner buildings, where the disproportionate stiffness contribution of infill walls is often overlooked during design.

4.3.2. Building B

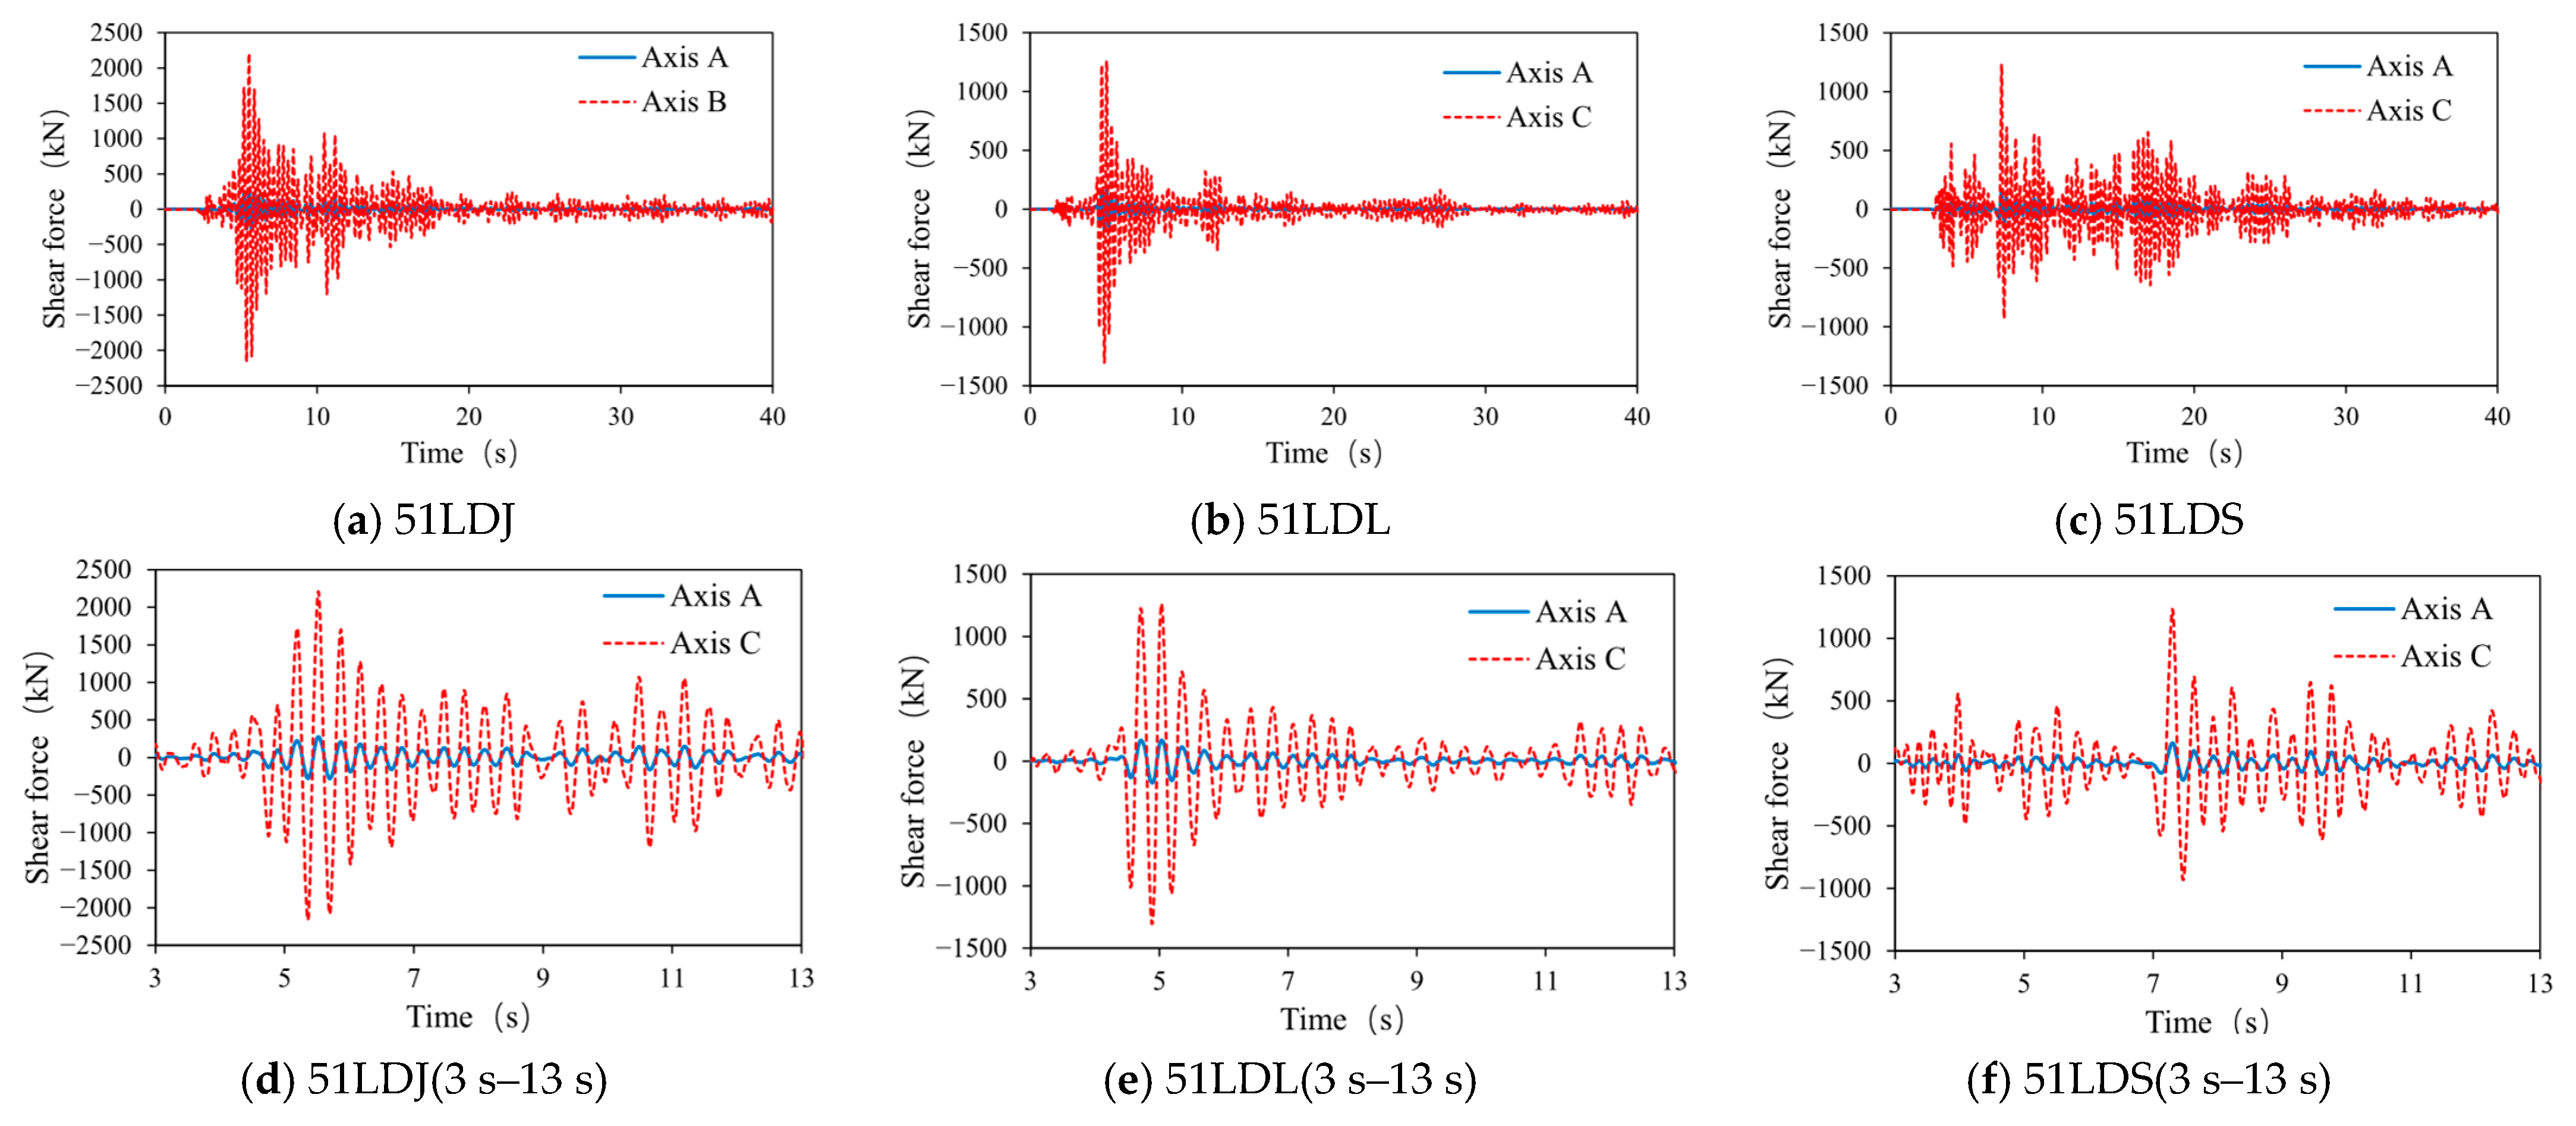
Figure 14 presents the time-history curves of shear forces for all components along Axes A and C under the 0.1 g case. In this building, Axis A consists of bare frame columns without infill walls, while Axis C consists of masonry load-bearing walls. The substantial stiffness difference between the two axes leads to significantly different base shear forces; however, the shear forces along both axes remain in phase, indicating that the structural response is dominated by translational motion. This behavior suggests that the transverse walls on both sides provide strong torsional restraint, resulting in a failure mode primarily governed by translation. Table 2 presents the ratios of maximum base shear between the two axes—1:7.97, 1:7.81, and 1:7.59—demonstrating that Axis C, with its higher stiffness, attracts a much larger share of the internal forces.
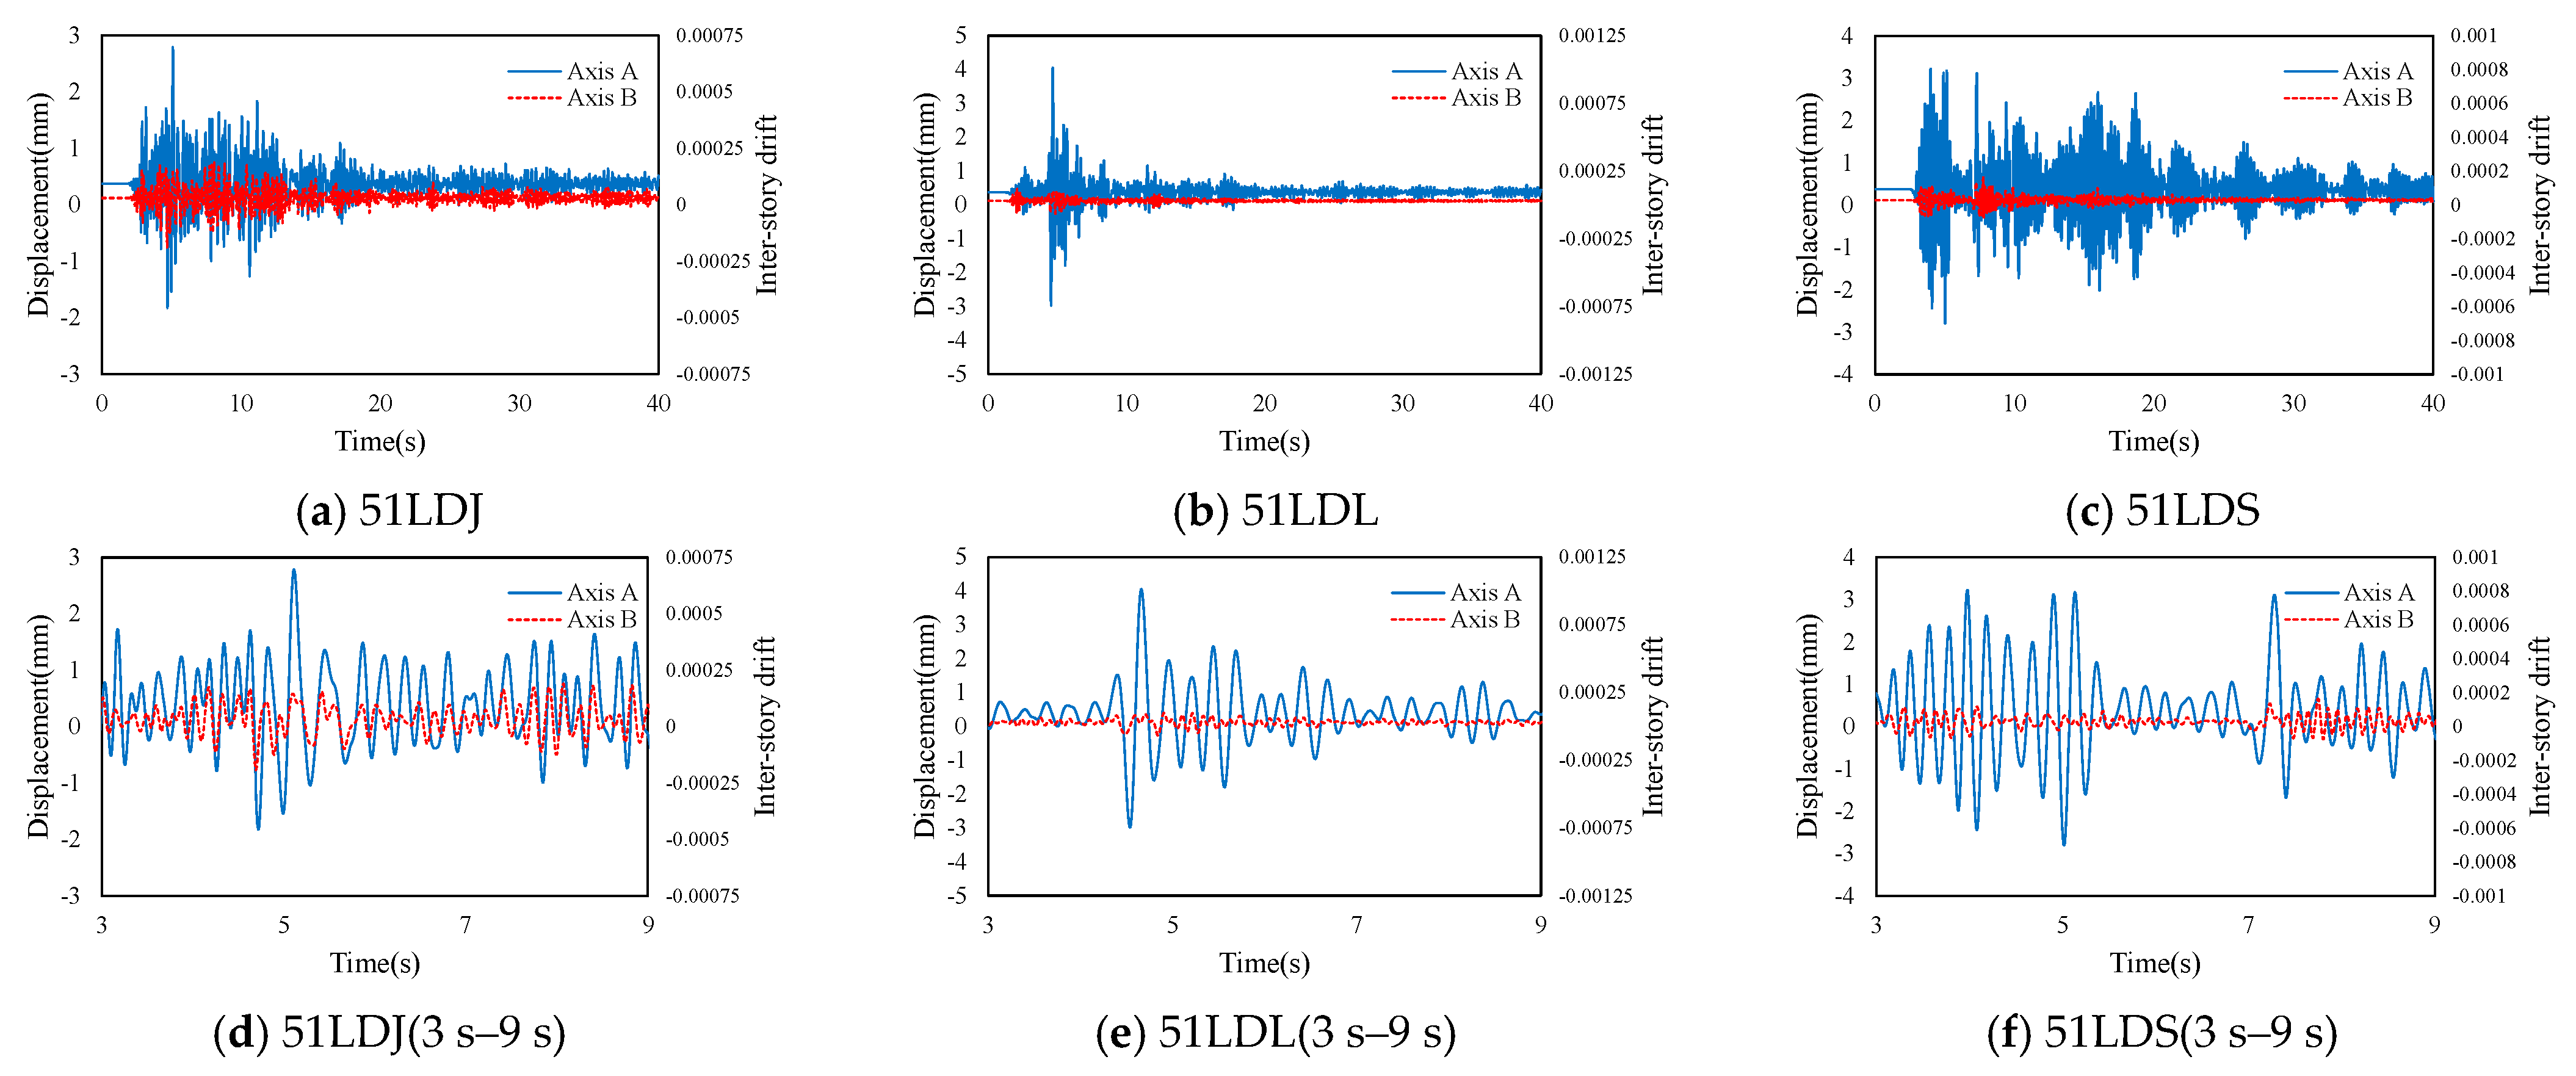
To complement the shear force analysis, the displacement response is examined. Figure 15 depicts the displacement time histories at the first-story top nodes of components along Axes A and C. The displacements of the two axes are nearly identical, further confirming that the structural response is dominated by translation with only minor torsional effects. As shown in Figure 2e, Axis C exhibits very high stiffness, and the left-side transverse wall also provides considerable stiffness. Consequently, the distance between the center of stiffness and the center of mass is relatively large, resulting in a significant torsional moment acting on the structure. Unlike Building A, this building has a fully infilled transverse wall on the right side, which contributes substantial stiffness and strength, imparting high torsional rigidity. As a result, the overall motion remains predominantly translational, though a small degree of torsion is unavoidable due to the existing torsional moment. Table 2 further shows that the maximum displacement ratios between the two axes are 1.28:1, 1.31:1, and 1.28:1, indicating only minor displacement differences. This type of building can be classified as “eccentric but non-torsional,” where internal force distribution is essentially proportional to stiffness (Figure 4d). Although minor torsion exists—resulting in slightly larger displacements in the ductile components of Axis A compared to the brittle components of Axis C—the inherent ductility of Axis A is not fully utilized, and the structure undergoes brittle failure at relatively small displacements.
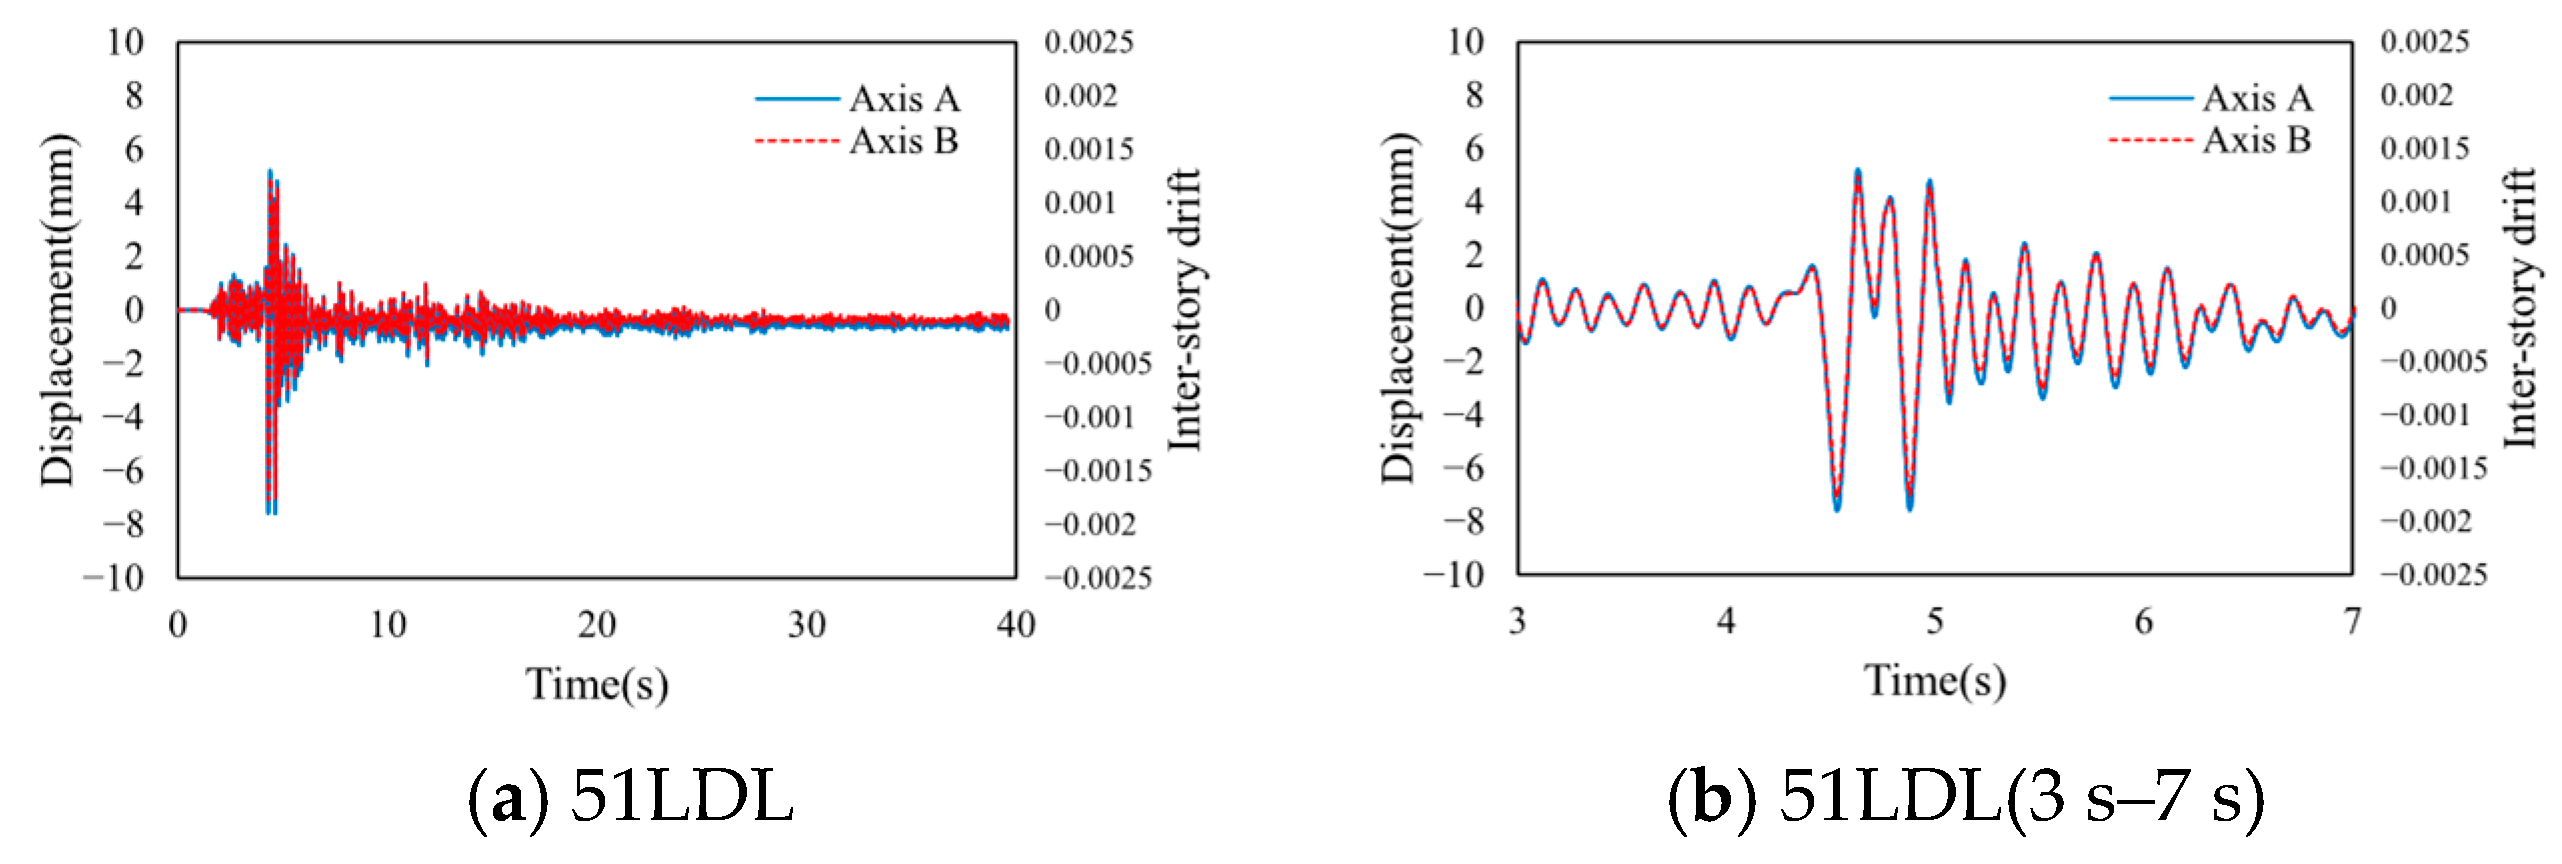
When the input ground motion is scaled to a peak acceleration of 0.3 g, severe structural damage occurs. Figure 16 illustrates the displacement time histories of components along Axes A and C under the 51LDL record. The brittle components of Axis C fail first, while cracking simultaneously develops in the right-side transverse wall, leading to a reduction in torsional stiffness. As a result, the maximum displacement ratio increases to 2.08:1. Unlike ductile failure, brittle failure occurs abruptly, causing rapid structural collapse; therefore, the force and displacement ratios during the failure stage are unstable and lack strong reference value, and analysis of failure mechanisms should focus on the force–displacement relationships prior to failure. Figure 17 shows the failure process: the components along Axis C fail first due to their high stiffness and low deformability, while the right-side transverse wall fails simultaneously due to the additional shear induced by torsional moment. Subsequently, nearly all components along Axis C experience shear failure. With the progressive failure of Axis C, displacements increase suddenly, forcing the components along Axis A into failure. This pattern is consistent with field observations, as shown in Figure 17b.
Notably, although Building A experienced unfavorable torsional failure, it sustained a higher peak ground acceleration than Building B, which did not undergo significant torsion. This difference is attributed to the failure mechanism: torsional failure in Building A allowed partial mobilization of ductility in certain components, enabling the structure to survive large displacements without collapse (Figure 5a). In contrast, in Building B, effective torsional restraint led to brittle failure of Axis C components, directly resulting in structural failure. Since the ductility of the frame columns could not be mobilized and the overall load-bearing capacity was relatively low, the maximum earthquake intensity that Building B could withstand was consequently smaller (Figure 5b).

4.3.3. Building C

In Building C, all primary lateral force-resisting elements along Axes A, B, C, and D are masonry load-bearing walls. The analysis focuses on the shear forces and displacements of components along Axes A and D. Figure 18 presents the time-history curves of shear forces for all components along these two axes under the 0.1 g case. Since the stiffness difference between the two axes is negligible, the base shear values are also very close. As illustrated in Figure 3e, the distribution of lateral force-resisting walls in both longitudinal and transverse directions is uniform, resulting in very small eccentricity and negligible torsional effect. Table 3 presents the maximum base shear ratios—1:1.47, 1:1.51, and 1:1.48—confirming that the shear forces on both axes are nearly identical, reflecting the similar stiffness of the components.
Figure 19 shows the first-story top displacement time histories of components along Axes A and D. The displacements are nearly identical, further demonstrating that the structural response is dominated by translation with minimal torsional influence. Unlike Building B, where stiffness varied significantly between axes, Building C exhibits nearly uniform stiffness distribution in both longitudinal and transverse directions. This uniformity ensures that internal forces are distributed evenly among components across all axes. Table 3 further confirms this, with maximum displacement ratios of 1.10:1, 1.03:1, and 1.09:1. Thus, torsional effects are negligible. This type of building can be categorized as “non-eccentric and non-torsional,” where internal forces are distributed proportionally to stiffness, and the absence of eccentricity ensures a uniform stiffness distribution across the plan, effectively avoiding localized concentration of internal forces.
To further explore its ultimate capacity, the input ground motions were incrementally scaled. Structural failure occurred only when the PGA reached 1.0 g. Figure 20 shows the displacement time histories of Axes A and D under the 51LDL record. Even at the point of failure, the displacement ratios remained very close, with the maximum value being 1.04:1. Figure 21 illustrates the failure process. Since all components are brittle, shear failures occurred almost simultaneously across all axes.
Although the failure mode in Building C was governed by translational response leading to brittle behavior, it differs significantly from Building B. Building B experienced brittle failure under a PGA of only 0.3 g, whereas Building C withstood up to 1.0 g before failure, primarily due to stiffness uniformity. In Building B, significant stiffness disparity among axes led to excessive concentration of internal forces in the stiffer load-bearing walls, resulting in failure at very small displacements, with less stiff columns neither contributing their ductility nor fully mobilizing their load-bearing capacity before collapse. In contrast, the uniformly distributed lateral force-resisting components in Building C prevented excessive concentration of internal forces, allowing each component to contribute effectively to the overall capacity and resulting in a much higher total load-bearing strength. Although its ductility is not comparable to that of reinforced concrete frame structures, the high shear resistance of masonry walls provided exceptional strength, enabling the structure to exhibit a “no damage under major earthquakes” behavior.

5. Conclusions

5.1. Summary of Findings

This study examined the seismic performance of three representative types of multi-story buildings, focusing on structural motion modes, component mechanical behavior, and resulting failure mechanisms. Numerical models were developed for each building type to analyze dynamic responses under seismic excitations and validate the proposed failure mechanisms. The main conclusions are as follows:
(1)
Three typical failure mechanisms were identified: torsion-dominated behavior in corner buildings with L-shaped infilled walls, translation-dominated behavior in street-front buildings with large façade openings, and strength-controlled behavior in buildings with uniformly distributed walls. These patterns correspond to distinct stiffness distributions and deformation compatibilities among components.
(2)
The essential difference among these mechanisms lies in the relative stiffness and ductility balance of components. Torsion-dominated structures exhibit similar force but uncoordinated deformation among elements, while translation-dominated ones show uniform displacement but concentrated stress in stiff components. Uniform wall distribution achieves coordinated deformation and balanced strength utilization.
(3)
Numerical analyses corroborate the proposed mechanisms and demonstrate that stiffness nonuniformity governs the shift between torsional, translational, and balanced responses.
(4)
Design implications: To improve seismic resilience, two conceptual strategies are suggested—(a) ensuring uniformly high ductility among primary components, or (b) maintaining balanced stiffness and strength through rational wall configurations. Both approaches enhance seismic capacity and collapse prevention.

5.2. Limitations and Future Work

This study employed simplified one-dimensional macro-models to capture mechanism-level seismic responses of typical mid-rise reinforced concrete and masonry buildings constructed with standard workmanship. These assumptions, together with the exclusion of explicit soil–structure interaction (SSI), may affect the estimation of base deformations and torsional response, particularly for irregular or soft-soil structures. Future research should extend the framework to a broader range of structural typologies, incorporate SSI and potential material degradation, and integrate post-earthquake monitoring and experimental validation to quantify these effects and refine the proposed mechanisms.

Author Contributions

Conceptualization, C.C.; Methodology, X.G.; Software, R.L. and S.W.; Validation, R.L.; Formal analysis, R.L.; Investigation, X.D.; Data curation, S.W.; Writing – original draft, R.L.; Project administration, X.G.; Funding acquisition, C.C. All authors have read and agreed to the published version of the manuscript.

Funding

The research reported in this paper is funded by the Guangdong Provincial Department of Finance Project (Grant No. 2024A0505050030) and the National Natural Science Foundation of China (Grant No. 52278489).

Data Availability Statement

The original contributions presented in the study are included in the article, further inquiries can be directed to the corresponding author.

Acknowledgments

We thank Dong Ce, Zhang Qinzhe, and Zhang Jun for their fieldwork.

Conflicts of Interest

Author Shicheng Wang was employed by the company WSP Global Inc. The remaining authors declare that the research was conducted in the absence of any commercial or financial relationships that could be construed as a potential conflict of interest.

References

  1. Shibata, A. Estimation of earthquake damage to urban systems. Struct. Control Health Monit. 2006, 13, 454–471. [Google Scholar] [CrossRef]
  2. Chan, C.C.; Lin, Y.P.; Chen, H.H.; Chang, T.-Y.; Cheng, T.-J.; Chen, L.-S. A population-based study on the immediate and prolonged effects of the 1999 Taiwan earthquake on mortality. Ann. Epidemiol. 2003, 13, 502–508. [Google Scholar] [CrossRef] [PubMed]
  3. Huang, Y.; Chen, W.; Liu, J. Secondary geological hazard analysis in Beichuan after the Wenchuan earthquake and recommendations for reconstruction. Environ. Earth Sci. 2012, 66, 1001–1009. [Google Scholar] [CrossRef]
  4. Gao, S.; Lu, Y.; Mao, L. Risk assessment of earthquake-induced geological hazards considering cultivated land factor: A case study of the Jishishan Ms 6.2 earthquake. J. Mt. Sci. 2025, 22, 913–930. [Google Scholar] [CrossRef]
  5. Sepúlveda, S.A.; Serey, A. Tsunamigenic, earthquake-triggered rock slope failures during the April 21, 2007 Aisén earthquake, southern Chile (45.5° S). Andean Geol. 2009, 36, 131–136. [Google Scholar] [CrossRef]
  6. Furtado, A.; Rodrigues, H.; Arêde, A.; Varum, H. A review of the performance of infilled RC structures in recent earthquakes. Appl. Sci. 2021, 11, 5889. [Google Scholar] [CrossRef]
  7. Kawashima, K.; Unjoh, S.; Hoshikuma, J.I.; Kosa, K. Damage of bridges due to the 2010 Maule, Chile, earthquake. J. Earthq. Eng. 2011, 15, 1036–1068. [Google Scholar] [CrossRef]
  8. Perrone, D.; Calvi, P.M.; Nascimbene, R.; Fischer, E.C.; Magliulo, G. Seismic performance of non-structural elements during the 2016 Central Italy earthquake. Bull. Earthq. Eng. 2019, 17, 5655–5677. [Google Scholar] [CrossRef]
  9. Aydın, M.C.; Işık, E.; Büyüksaraç, A.; Ulu, A.E.; Avcil, F. Technical and Socio-Economic Perspective on the Disaster of the Century (6 February 2023 Earthquake) in Türkiye on the Second Anniversary. Geol. J. 2025, 1–18. [Google Scholar] [CrossRef]
  10. Aksoy, C.G.; Chupilkin, M.; Koczan, Z.; Plekhanov, A. Unearthing the impact of earthquakes: A review of economic and social consequences. J. Policy Anal. Manag. 2024, 44, 1450–1471. [Google Scholar] [CrossRef]
  11. Kaushik, H.B.; Jain, S.K. Impact of great December 26, 2004 Sumatra earthquake and tsunami on structures in Port Blair. J. Perform. Constr. Facil. 2007, 21, 128–142. [Google Scholar] [CrossRef]
  12. Ye, S.; Zhai, G.; Hu, J. Damages and lessons from the Wenchuan earthquake in China. Hum. Ecol. Risk Assess. Int. J. 2011, 17, 598–612. [Google Scholar] [CrossRef]
  13. DesRoches, R.; Comerio, M.; Eberhard, M.; Mooney, W.; Rix, G.J. Overview of the 2010 Haiti earthquake. Earthq. Spectra 2011, 27 (Suppl. S1), S1–S21. [Google Scholar] [CrossRef]
  14. Saatcioglu, M.; Tremblay, R.; Mitchell, D.; Ghobarah, A.; Palermo, D.; Simpson, R.; Adebar, P.; Ventura, C.; Hong, H. Performance of steel buildings and nonstructural elements during the 27 February 2010 Maule (Chile) Earthquake. Can. J. Civ. Eng. 2013, 40, 722–734. [Google Scholar] [CrossRef]
  15. Kabeyasawa, T. Damages to RC school buildings and lessons from the 2011 East Japan earthquake. Bull. Earthq. Eng. 2017, 15, 535–553. [Google Scholar] [CrossRef]
  16. Gautam, D. Unearthed lessons of 25 April 2015 Gorkha earthquake (MW 7.8): Geotechnical earthquake engineering perspectives. Geomat. Nat. Hazards Risk 2017, 8, 1358–1382. [Google Scholar] [CrossRef]
  17. Tapia-Hernández, E.; Genes, M.C.; Guerrero-Bobadilla, H. Damages observed in Turkey due to the Kahramanmaras earthquakes of February 6, 2023. J. Earthq. Eng. 2024, 1–19. [Google Scholar] [CrossRef]
  18. Hao, L.N.; Zhang, Y.S. Natural Vibration Period Analysis of Multi-Storey Reinforced Concrete Frame Structure. Appl. Mech. Mater. 2012, 226, 351–354. [Google Scholar] [CrossRef]
  19. Luo, R.; Guo, X.; Wang, B.; Dong, X.; Zhang, Q.; Ouyang, Z. The impact of infill wall distribution on the mechanical behavior and failure patterns of multi-story RC frame structures: An acceleration–strain coupled testing approach. Structures 2024, 59, 105737. [Google Scholar] [CrossRef]
  20. Blume, J.A.; Newmark, N.M.; Corning, L.H. Design of Multistory Reinforced Concrete Buildings for Earthquake Motions; Portland Cement Association: Chicago, IL, USA, 1961. [Google Scholar]
  21. Hollings, J.P. Reinforced concrete seismic design. Bull. New Zealand Soc. Earthq. Eng. 1969, 2, 217–250. [Google Scholar] [CrossRef]
  22. Park, R. State of the art report ductility evaluation from laboratory and analytical testing. In Proceedings of the 9th World Conference on Earthquake Engineering, Tokyo-Kyoto, Japan, 2–9 August 1988; pp. 605–616. [Google Scholar]
  23. Paulay, T.; Priestley, M.J.N. Seismic Design of Reinforced Concrete and Masonry Buildings; John Wiley & Sons, Inc.: New York, NY, USA, 1992. [Google Scholar]
  24. Fardis, M.N. Capacity design: Early history. Earthq. Eng. Struct. Dyn. 2018, 47, 2887–2896. [Google Scholar] [CrossRef]
  25. SEAOC. Recommended Lateral Force Requirements and Commentary; Seismology Committee, Structural Engineers Association of California: San Francisco, CA, USA, 1968. [Google Scholar]
  26. ACI 318; Building Code Requirements for Structural Concrete and Commentary. American Concrete Institute: Farmington Hills, MI, USA, 2019.
  27. NZS-3101; Concrete Structures Standard. Standards New Zealand: Wellington, New Zealand, 2006.
  28. GB-50011; Code for Seismic Design of Buildings. Architectural & Building Press: Beijing, China, 2016. (In Chinese)
  29. Luo, R.; Guo, X.; Lata, A.; Wang, B.; Qi, F.; Dong, X. Investigation and Analysis of Seismic Damage to Side Corridor School Buildings in M6.4 Yangbi Earthquake. World Earthq. Eng. 2021, 37, 54–63. (In Chinese) [Google Scholar]
  30. Dong, X.; Guo, X.; Lata, A.; Luo, R.; Yan, C. Seismic Response of Multi-Story Buildings Subjected to Luding Earthquake 2022, China Considering the Deformation Saturation Theory. Buildings 2024, 14, 2887. [Google Scholar] [CrossRef]
  31. Wang, T.; Chen, J.; Zhou, Y.; Lin, X.; Wang, X.; Shang, Q. Preliminary investigation of building damage in Hatay under February 6, 2023 Turkey earthquakes. Earthq. Eng. Eng. Vib. 2023, 22, 853–866. [Google Scholar] [CrossRef]
  32. Peng, Q.; Zhou, X.; Yang, C. Influence of connection and constructional details on masonry-infilled RC frames under cyclic loading. Soil Dyn. Earthq. Eng. 2018, 108, 96–110. [Google Scholar] [CrossRef]
  33. Jiang, H.; Liu, X.; Mao, J. Full-scale experimental study on masonry infilled RC moment-resisting frames under cyclic loads. Eng. Struct. 2015, 91, 70–84. [Google Scholar] [CrossRef]
  34. Zovkic, J.; Sigmund, V.; Guljas, I. Cyclic testing of a single bay reinforced concrete frames with various types of masonry infill. Earthq. Eng. Struct. Dyn. 2013, 42, 1131–1149. [Google Scholar] [CrossRef]
  35. Misir, S.; Ozcelik, O.; Girgin, S.C.; Kahraman, S. Experimental work on seismic behavior of various types of masonry infilled RC frames. Struct. Eng. Mech. 2012, 44, 763–774. [Google Scholar] [CrossRef]
  36. Kakaletsis, D.J.; Karayannis, C.G. Influence of masonry strength and openings on infilled R/C frames under cycling loading. J. Earthq. Eng. 2008, 12, 197–221. [Google Scholar] [CrossRef]
  37. Tasnimi, A.A.; Mohebkhah, A. Investigation on the behavior of brick-infilled steel frames with openings, experimental and analytical approaches. Eng. Struct. 2011, 33, 968–980. [Google Scholar] [CrossRef]
  38. Zhang, X.; Zhou, Y.; Liu, X.; Zheng, Y.; Qi, Z. Study on seismic performance of RC frame structures considering the effect of infilled walls. Buildings 2024, 14, 1907. [Google Scholar] [CrossRef]
  39. Lazaridis, P.C.; Kavvadias, I.E.; Demertzis, K.; Iliadis, L.; Vasiliadis, L.K. Structural damage prediction of a reinforced concrete frame under single and multiple seismic events using machine learning algorithms. Appl. Sci. 2022, 12, 3845. [Google Scholar] [CrossRef]
  40. Stavridis, A.; Koutromanos, I.; Shing, P.B. Shake-table tests of a three-story reinforced concrete frame with masonry infill walls. Earthq. Eng. Struct. Dyn. 2012, 41, 1089–1108. [Google Scholar] [CrossRef]
  41. Wang, B.; Guo, X.; Xuan, Y.; Fan, X.-Q.; Chen, B. The effects of infilled walls on seismic performance of RC frame structures with eccentrically placed open corridor. Sustainability 2022, 14, 5299. [Google Scholar] [CrossRef]
  42. Dong, X.; Guo, X.; Wang, B.; Lata, A.; Luo, R. Suggestions for a Collapse-Resistant Design for Frame–Masonry Hybrid Buildings Based on the Concept of Balancing Seismic Shear Forces. Buildings 2025, 15, 1357. [Google Scholar] [CrossRef]
  43. Dong, X.; Lata, A.; Guo, X.; Luo, R.; Yan, C. Study on seismic performance of semi-enclosed buildings based on shaking table test. Structures 2025, 81, 110315. [Google Scholar] [CrossRef]
  44. Luo, R.; Guo, X.; Dong, X.; Zhang, Q. New recognition of failure and collapse mechanism of multi-story building suffered from earthquake. Earthq. Eng. Eng. Dyn. 2022, 42, 95–103. (In Chinese) [Google Scholar]
  45. Zhang, J.; Guo, X.; Luo, R.; Dong, X.; Dong, C.; Zhang, Q. Seismic damage investigation and analysis of buildings in Ms6.8 Luding earthquake. Earthq. Eng. Eng. Dyn. 2024, 44, 190–199. (In Chinese) [Google Scholar]
  46. Luo, R.; Jin, X.; Guo, X.; Dong, C.; Dong, X.; Zhang, Q.; Zhang, J. Investigation and analysis of structure damage in the Sichuan Luding Ms6.8 earthquake in 2022. J. Inst. Disaster Prev. 2022, 24, 46–55. (In Chinese) [Google Scholar]
  47. Lowes, L.N.; Lehman, D.E.; Baker, C.; Lundeen, C.P. Recommendations for modeling the nonlinear response of slender reinforced concrete walls using PERFORM-3D. In Proceedings of the 2016 SEAOC Convention, Maui, HI, USA, 12–15 October 2016. [Google Scholar]
  48. Powell, G.H. Modeling for Structural Analysis: Behavior and Basics; Computers and Structures: Berkeley, CA, USA, 2010. [Google Scholar]
  49. Peruch, M.; Spacone, E.; Camata, G. Nonlinear analysis of masonry structures using fiber-section line elements. Earthq. Eng. Struct. Dyn. 2019, 48, 1345–1364. [Google Scholar] [CrossRef]
  50. Federal Emergency Management Agency. FEMA 356 Pre-Standard and Commentary for the Seismic Rehabilitation of Buildings; Federal Emergency Management Agency: Washington, DC, USA, 2000.
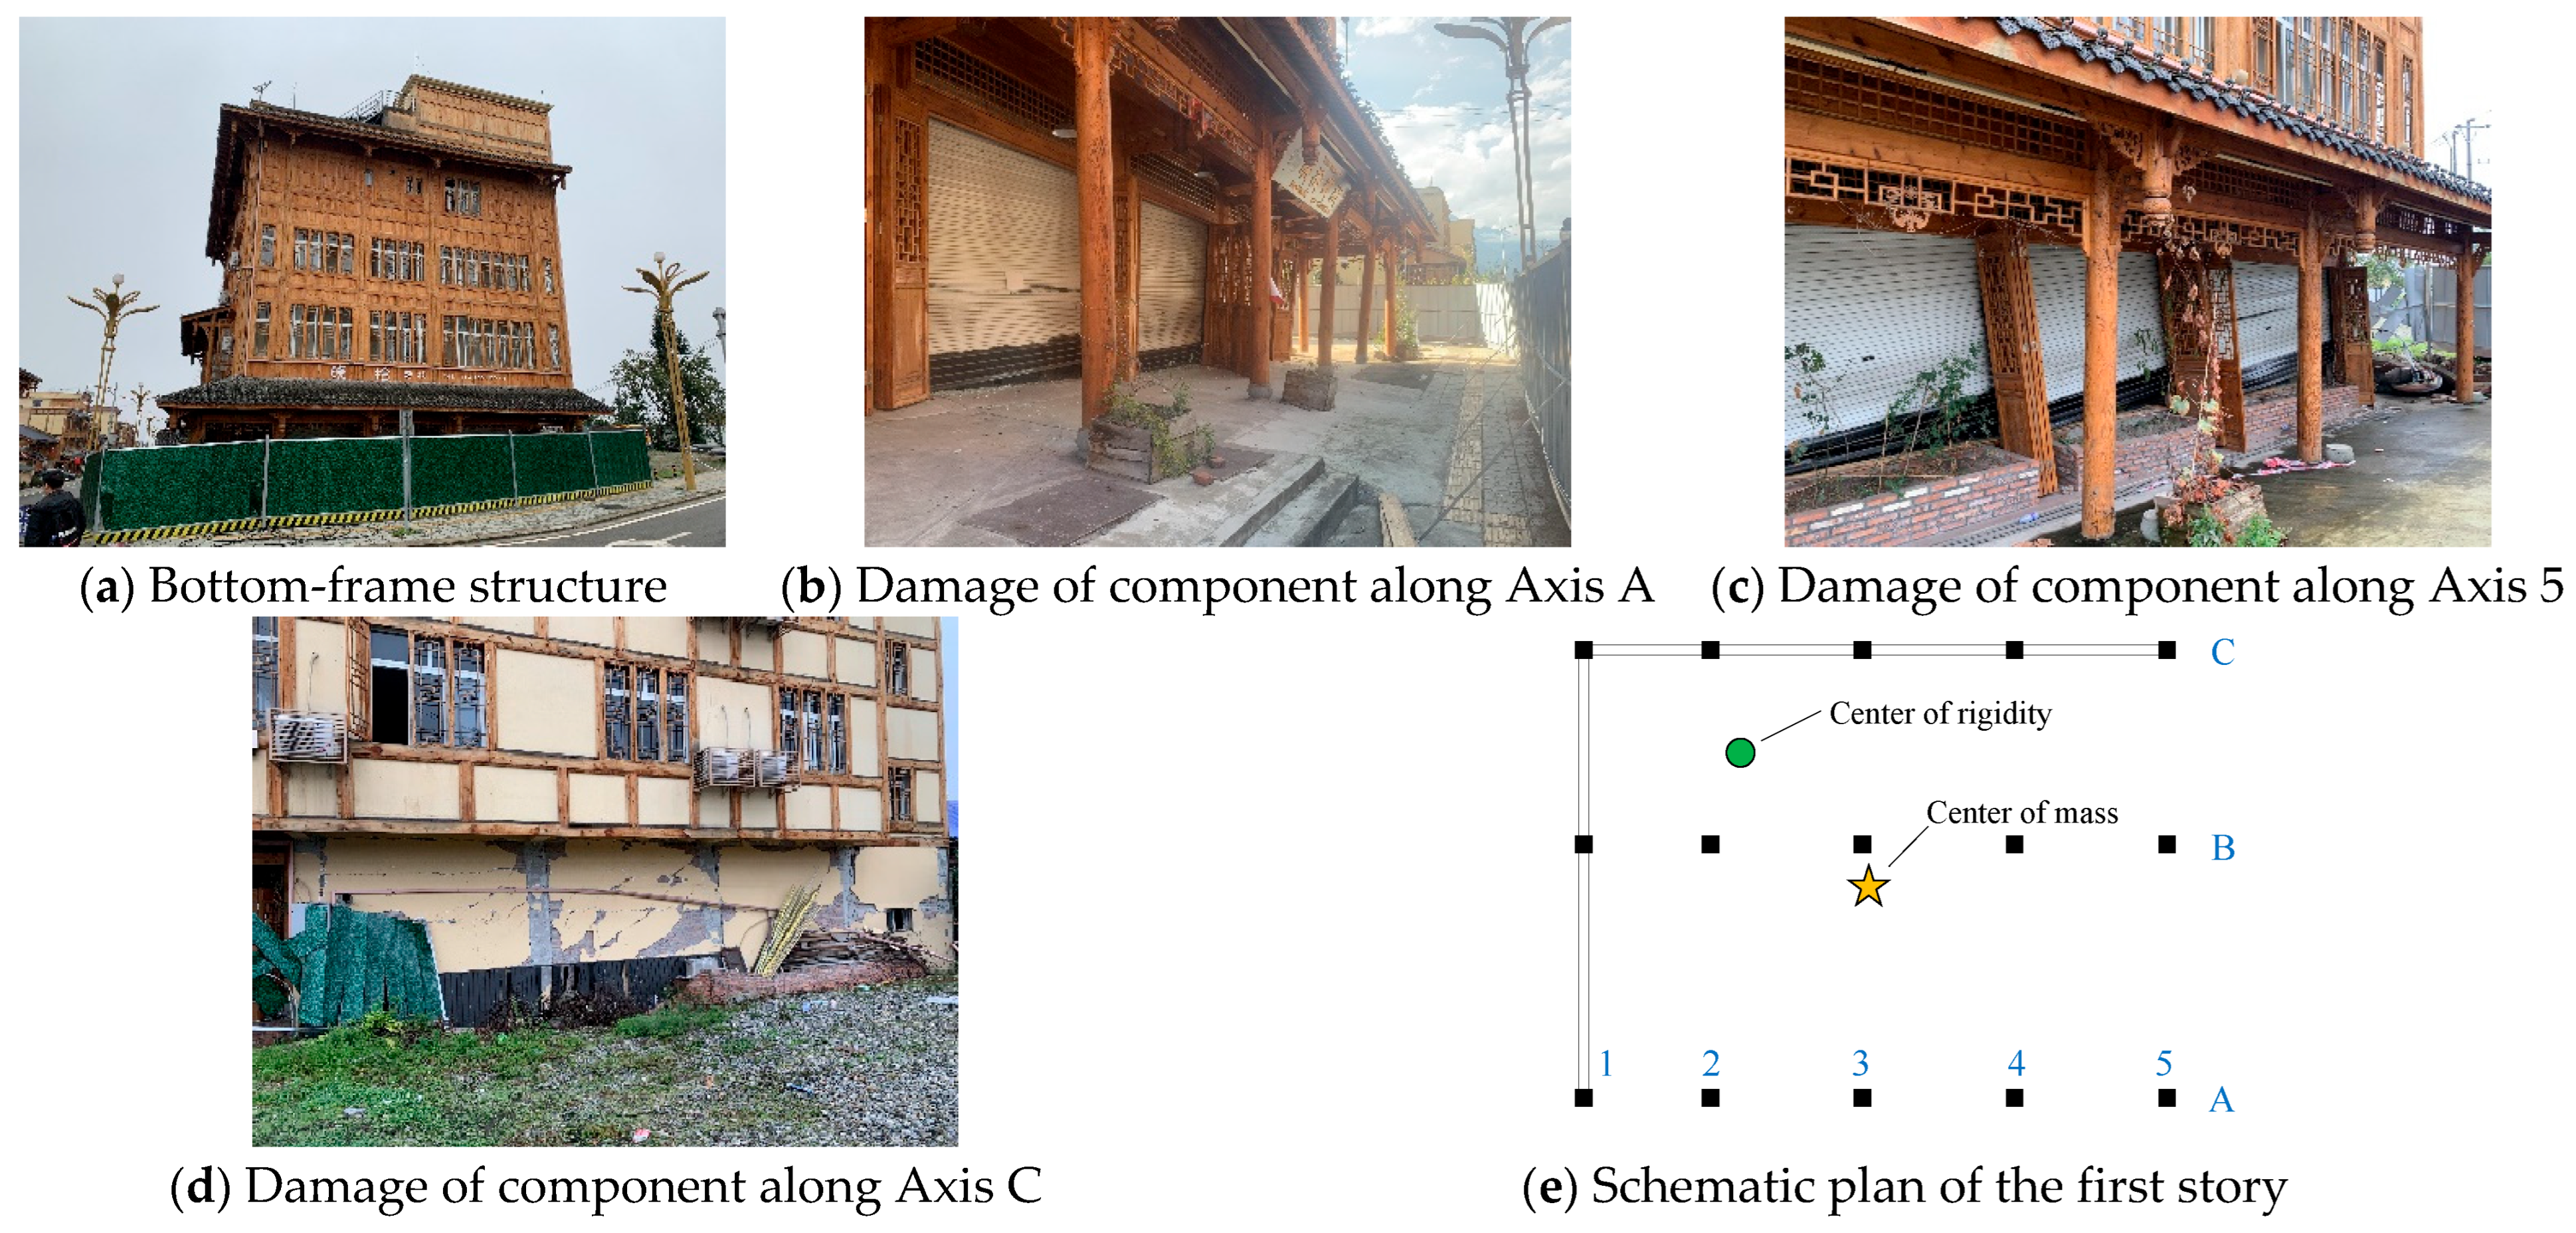
Figure 1. Corner building (Building A).
Buildings 15 03801 g001
Figure 2. Ground-floor commercial building (Building B).
Buildings 15 03801 g002
Figure 3. Undamaged building (Building C).
Buildings 15 03801 g003
Figure 4. Structural motion mechanisms.
Buildings 15 03801 g004
Figure 5. Schematic representation of mechanical behavior of structural components.
Buildings 15 03801 g005
Figure 6. Load-bearing wall elements and frame column elements.
Buildings 15 03801 g006
Figure 7. Frame–infill wall element.
Buildings 15 03801 g007
Figure 8. Structural models.
Buildings 15 03801 g008
Figure 9. Input ground motions and response spectrums.
Buildings 15 03801 g009
Figure 10. Time-history curves of shear forces for components along Axes A and C in Building A.
Buildings 15 03801 g010
Figure 11. Time-history curves of first-story displacements for components along Axes A and C in Building A.
Buildings 15 03801 g011
Figure 12. Time-history curves of displacements for components along Axes A and C under the 51LDL record scaled to 0.5 g in Building A.
Buildings 15 03801 g012
Figure 13. Failure sequence of Building A.
Buildings 15 03801 g013
Figure 14. Time-history curves of shear forces for components along Axes A and C in Building B.
Buildings 15 03801 g014
Figure 15. Time-history curves of first-story top displacements for components along Axes A and C in Building B.
Buildings 15 03801 g015
Figure 16. Time-history curves of displacements for components along Axes A and C under the 51LDL record scaled to 0.3 g in Building B.
Buildings 15 03801 g016
Figure 17. Failure sequence of Building B.
Buildings 15 03801 g017
Figure 18. Time-history curves of shear forces for components along Axes A and D in Building C.
Buildings 15 03801 g018
Figure 19. Time-history curves of first-story top displacements for components along Axes A and D in Buiding C.
Buildings 15 03801 g019
Figure 20. Time-history curves of displacements for components along Axes A and C under the 51LDL record scaled to 1.0 g in Building C.
Buildings 15 03801 g020
Figure 21. Failure localisation of Building C.
Buildings 15 03801 g021
Table 1. Ratios of maximum base shear and displacement between components along Axes A and C in Building A.
51LDJ51LDL51LDS
AxisACACAC
Shear force1.001.281.000.791.001.39
Displacement4.791.008.441.004.941.00
Table 2. Ratios of maximum base shear and displacement between components along Axes A and C in Building B.
51LDJ51LDL51LDS
AxisACACAC
Shear force1.007.971.007.811.007.59
Displacement1.281.001.311.001.281.00
Table 3. Ratios of maximum base shear and displacement between components along Axes A and D in Buiding C.
51LDJ51LDL51LDS
AxisADADAD
Shear force1.001.471.001.511.001.48
Displacement1.101.001.031.001.091.00
Disclaimer/Publisher’s Note: The statements, opinions and data contained in all publications are solely those of the individual author(s) and contributor(s) and not of MDPI and/or the editor(s). MDPI and/or the editor(s) disclaim responsibility for any injury to people or property resulting from any ideas, methods, instructions or products referred to in the content.