Article

A Framework for Evaluating Cost Performance of Architectural Projects Using Unstructured Data and Random Forest Model Focusing on Korean Cases

1
New Growth Procurement Research Department, Korea Institute of Procurement, Seoul 06228, Republic of Korea
2
Innovation Procurement Research Center, Korea Institute of Procurement, Seoul 06228, Republic of Korea
3
Overseas Investment Development POG, SHIN and KIM LCC, Seoul 03155, Republic of Korea
4
Department of Construction Economics & Finance Research, Construction & Economy Research Institute of Korea, Seoul 06050, Republic of Korea
*
Author to whom correspondence should be addressed.
Buildings 2025, 15(20), 3799; https://doi.org/10.3390/buildings15203799
Submission received: 19 August 2025 / Revised: 21 September 2025 / Accepted: 5 October 2025 / Published: 21 October 2025

Abstract

Cost is a key performance indicator for evaluating the success of architectural construction projects. While previous studies have relied on quantitative data and statistical models to evaluate cost performance, recent advancements in methods have enabled analysis using unstructured data. Unstructured data, particularly in construction supervision reports, can be considered the significant variables for performance evaluation, as they represent independent third-party monitoring of the construction project’s execution. This study aims to present a framework that supports cost performance evaluation using unstructured data and random forests (RFs), a representative method of machine learning. Specifically, association rule analysis and social network analysis were used to identify the main keywords, and an RF model was applied to these data to evaluate cost performance. The tuning of hyper-parameters in the RF was implemented by the Bayesian optimization technique with the augmentation of the original dataset. The accuracy of cost performance evaluation was 59% for the traditional logistic regression (LR), 74% for the regularization-based logistic regression (BLR) designed to prevent overfitting, and 76% for the RF model utilizing augmented data. The complementary utility of the models consisting of the proposed framework can be useful for deriving various evaluation explanations about cost performance. The applicability is expected to increase as more data become available in the future.

1. Introduction

The construction phase of the project life cycle is characterized by the highest operating costs due to the involvement of various stakeholders (i.e., general contractor, subcontractor, and supervisor) and the production process using a large amount of materials [1,2,3,4,5]. Due to these characteristics, establishing a performance evaluation framework for cost in the construction phase has been recognized as a key prerequisite for successful project completion [2,6,7,8,9]. Previous studies have presented various research results about performance evaluation frameworks that have improved the earned value management system, a representative conventional framework, or utilized statistical methodologies such as regression analysis and artificial intelligence [6,7,8,9,10,11,12,13,14,15].
The use of conventional frameworks and methods requires the collection of quantitative data, such as the planned and completed costs for each process, but there are limitations in that the data are recognized as a business secret of the general contractors [4,5,6]. Furthermore, recent studies have shown that despite the evaluation that successful performance was achieved based on the conventional frameworks or methods, there is a need for supplementing the cases where the results cannot be confirmed due to continuous changes in the industrial environment [16,17,18]. As a way to complement such limitations, the use of unstructured text data obtained during the construction phase is gaining attention, and this is linked to the trend of methodological advancement that enables multi-faceted analysis using methods such as machine learning and artificial intelligence [16,17]. In particular, the construction supervision document, which is the result of monitoring the construction phase from a third-party location based on relevant laws and regulations, can be considered a meaningful source for evaluating cost performance [17]. In Korea, construction supervision work is conducted based on related laws such as the Building Act, and comprehensive inspection opinions on the construction phase are included in the supervision documents [19,20,21,22,23,24,25]. Namely, the unstructured qualitative data included in the documents can be interpreted as key information that can be used to complement cost performance evaluation in that they are the opinions of experts who objectively monitored the construction phase. In the case of unstructured data, there are limitations in analysis using traditional statistical models, but analysis is possible with the emergence of methods such as social network analysis (SNA) and text mining, and various related studies are being presented [18,26,27,28]. In addition, interest in the use of artificial intelligence is increasing due to the global paradigm shift to smart construction, and machine learning, which can be considered a representative technology of artificial intelligence, is highly evaluated as a decision-making support tool because it enables analysis and prediction based on learning functions in existing data [26,27,28,29,30,31]. Therefore, it is expected that by establishing an evaluation framework using unstructured data and machine learning, it will be possible to complement the limitations of an evaluation framework based on quantitative data, and to support decision-making that considers continuous environmental changes based on data of various forms and sizes.
This study proposes a cost performance evaluation framework using unstructured data that can be collected through construction supervision documents and machine learning. The scope of this study was set to architectural construction projects, which account for the largest proportion of construction contracts in Korea. The procedures of this study are as follows: (1) preliminary review about the contract statistics of Korean construction, the operation system of Korean construction supervision, and the need for a framework based on unstructured data through the analysis of conventional cost performance evaluation methods; (2) analysis of proposed framework development methods such as association rule analysis (ARA), social network analysis (SNA), and a random forest (RF) model; (3) derivation and verification of a proposed framework based on the data analysis results; and (4) presentation of the implications of the analysis results.

2. Methods

2.1. Preliminary Review

2.1.1. Contract Statistics of Korean Construction

The contract size of Korean construction can be confirmed through the comprehensive construction statistics database operated by the Construction Association of Korea [32]. The statistical information that can be confirmed through the database is as follows: (1) construction business status; (2) investigation results of construction wage; (3) trend analysis results about construction order; (4) cost statistics for completed construction projects; and (5) investigation result for general contractors’ contracts. The investigation results for general contractors’ contracts can be checked in various forms depending on the headquarters’ location, client type, construction area, company size, and project types. The result of analyzing the average annual contract statistics by project types from 2013 to 2023 is as shown in Table 1.
As a result of the analysis, the average number of contracts for construction projects in Korea was 78,403 per year, and the contract amount was reviewed to be about USD 106 billion. In particular, it was analyzed that architectural projects accounted for the highest proportion of the number and size of contracts for all project types, and therefore, it can be interpreted that the representativeness of the scope of this study was secured.

2.1.2. Construction Supervision System in Korea

The subjects of construction supervision in Korea are divided into general construction and specialized construction, where specialized construction refers to electrical construction, firefighting system installation, and information and communication construction businesses. Each construction supervision subject is operated based on the relevant laws and regulations. In detail, general construction is regulated in the Building Act, Housing Act, and Construction Technology Promotion Act, and specialized construction is regulated in the Electrical Construction Business Act, Firefighting System Installation Business Act, and Information and Communication Construction Business Act [17,19,20,21,22,23,24,25]. The entities that perform construction supervision for architectural projects, which is the scope of this study, are divided into construction engineering firms and architectural firms according to the scale and type of the project. In other words, depending on the scale and type of project, the entity that performs construction supervision can be interpreted as having a structure in which a third party separate from the general contractor performs the supervision [17,18].
In addition, the form of construction supervision is divided into non-resident supervision, resident supervision, and responsible supervision depending on the difficulty of the project and the type of facility. For example, a facility with a floor area of 5000 m2 or more is subject to resident supervision, and a multi-use building with 16 floors or more or a total floor area of 5000 m2 or more (e.g., cultural and assembly facilities, retail facilities, and general hospitals) is subject to responsible supervision. The work content related to construction supervision consists of about 50 items such as conformity with design documents and the appropriateness of process management, and the details are presented in the Ministry of Land, Infrastructure, and Transport Notice No. 2020-11, Detailed Standards for Construction Supervision Standards [25]. In this way, the results of the supervisor (construction engineering or architectural firm) supervising the work content presented in the notice are written in a construction supervision report, and the supervisor comprehensively presents an opinion judging the project execution process based on his/her unique expertise in the report. Namely, the comprehensive opinion written by the supervisor can be interpreted as a measure for inferring the project’s performance, as it is qualitative data that objectively monitor the project’s execution process based on expertise.
Construction supervision in Korea is carried out based on the subjects and contents stipulated in the relevant laws and regulations. Since supervisors manage projects from a third-party perspective distinct from the general contractors, the unstructured data included in the construction supervision report are produced. And they are expected to be valuable information that can be utilized to derive a framework for cost performance evaluation.

2.1.3. The Need for an Advanced Framework from Conventional Evaluation Methods

In the construction industry, statistical methods have been mainly used to evaluate cost performance. For example, linear regression analysis, a representative statistical method, is widely used to analyze and explain the linear relationship between dependent and independent variables using collected quantitative data. The verification of the explanatory and predictive power of the statistical model derived through the ordinary least squares and the parameters (β, named regression coefficients) that minimize the sum of squares of the errors are reflected in the model. However, in the case of this method, since it forces linearity between the dependent and independent variables, there is a limitation in explaining nonlinear relationships between variables. Nonlinear regression analysis, which can overcome these limitations, is more flexible, but has the limitations of being prone to overfitting and difficult to interpret. Furthermore, regression analysis has strong statistical limitations such as independence, homoscedasticity, and normality, which limit its application to the analysis of various data.
To complement the limitations of existing evaluation methods and utilize various types of data, methods such as data mining and machine learning are attracting attention. In particular, among data mining methods, ARA, SNA, and cluster analysis have been applied to cost performance evaluation in the construction industry [10]. Data mining is mainly used for the purpose of extracting useful information from collected data and deriving interpretable and understandable correlations and patterns [33,34]. Machine learning models such as RF, support vector machines, and genetic algorithms have been usefully used for cost performance evaluation [3,4]. One of their characteristics is that they find and learn complex patterns in data. Furthermore, they have the advantage of being able to effectively explain complex relationships between variables compared to conventional statistical models. In particular, machine learning has a high advantage in terms of usability in that it is effective in accurate prediction and classification functions when new data are collected after learning by the obtained data [35].
Accordingly, this study developed an advanced framework that can support the cost performance evaluation of architectural construction projects by utilizing and integrating ARA, SNA, and RF techniques in a hybrid manner. ARA and SNA were used to extract meaningful unstructured data for cost performance evaluation from construction supervision documents, and RF was applied for performance evaluation.

2.2. Development Methods of a Proposed Framework

2.2.1. Overview

As mentioned above, this study utilized the following methods to develop a cost performance evaluation framework using unstructured data: (1) ARA; (2) SNA; and (3) RF. The detailed utilizations of each method are as follows.
First of all, ARA and SNA were used as methods to select independent variables for evaluating cost performance. In detail, ARA was used to build the keyword pool by exploring the rules regarding the correlation between keywords related to cost performance. They are involved in the contents presented as comprehensive opinions in the construction supervision documents. SNA was applied to select the main keywords expected to have a high impact on cost performance evaluation by constructing the relationship between keywords based on the association rules in the form of a network. Next, RF was used for the purpose of analyzing the quantitative relationship between the independent variables, which are the main keywords set using ARA and SNA. In the RF model, the dependent variable is defined as the actual compared to the planned construction cost. In other words, it can be interpreted as the concept of the method for setting independent variables with high explanatory power for the dependent variable.

2.2.2. ARA and SNA

ARA is one of the data mining techniques that derives associations such as patterns between specific attributes of data, and is a method for exploring the tendency of other attributes to occur when specific attributes occur [36]. ARA has great advantages in extracting useful information from large-scale data and discovering association patterns, is used in various industries such as medicine and finance, and has recently been widely used in the construction industry for unstructured text data analysis [37,38,39,40,41].
The representative evaluation measures for setting rules in ARA are support, confidence, and lift [37,38,39,40]. Firstly, support indicates the proportion of the entire sentence that contains a set of patterns or rules between specific keywords, and it is common to set the support threshold that is generally applied within 0.001 to 0.05. Next, confidence is the proportion (conditional probability) of the sentences in which keyword ‘A’ is found that keyword ‘B’ is additionally included in the sentence, and is generally set to a value around 0.5. If confidence is lower than 0.5, even if the probability of word B appearing when A appears is relatively low, it is likely to be recognized as a rule, so it may not be a meaningful rule but a randomly generated rule. Lastly, lift is a measure to quantitatively evaluate the relationship between keywords ‘A’ and ‘B’. In general, a meaningful rule is defined when the lift is greater than 1. It is efficient to first set an exploration interval for the support, confidence, and lift according to the research field and the structure and form of the data, and then experimentally determine the values of the scales within the interval. This study reflected the values presented in the existing studies and set the support, confidence, and lift to 0.01, 0.1, and 1 or higher, respectively, for rule generation.
There are algorithms for generating association rules such as Apriori and Fp-growth, and among them, the Apriori algorithm is a representative method that has been widely used in various studies [37,39,41]. The characteristic is that all subsets of the frequent data attribute set are also frequent, and the frequent attribute set refers to a set that is recognized as having a pattern or rule between keywords. In other words, it is a pattern or rule set between keywords that has a support value greater than the minimum support. The Apriori algorithm is applied through the following procedure. Firstly, set the minimum support, which is the threshold for being recognized as a rule. Secondly, create a set of attributes with length 1, calculate the support for all attributes, and search for attribute sets greater than or equal to the minimum support. Thirdly, combine the frequent attribute sets found in the previous step to create a new set of attributes greater than or equal to 2, calculate their support, and remove infrequent attribute sets while leaving only attribute sets greater than or equal to the minimum support value. Finally, repeat until no new frequent attribute sets are created [42].
SNA was used to construct a network structure through the nodes and links of keyword relationships used in cost performance evaluation. It is a representative method for visually understanding the structure and characteristics of keyword relationships, and has recently been used in various fields in the construction industry [43].
Indicators that determine the characteristics of a network include the degree, density, and inclusiveness, and a representative indicator that can identify the structural characteristics of a network is defined as the centrality. Centrality is a measurement indicator that represents the relationship formed by nodes that make up a network, and is used to identify nodes with high centrality in a network and understand the network structure [43]. Representative centrality indicators are included as follows: (1) betweenness centrality; (2) eigenvector centrality; (3) degree centrality; and (4) page rank centrality [43]. In this study, the degree centrality indicator was utilized because it provides a simple yet intuitive explanation of the network structure. This indicator is calculated as the number of links connected to nodes in a network and is highly applicable in SNA.
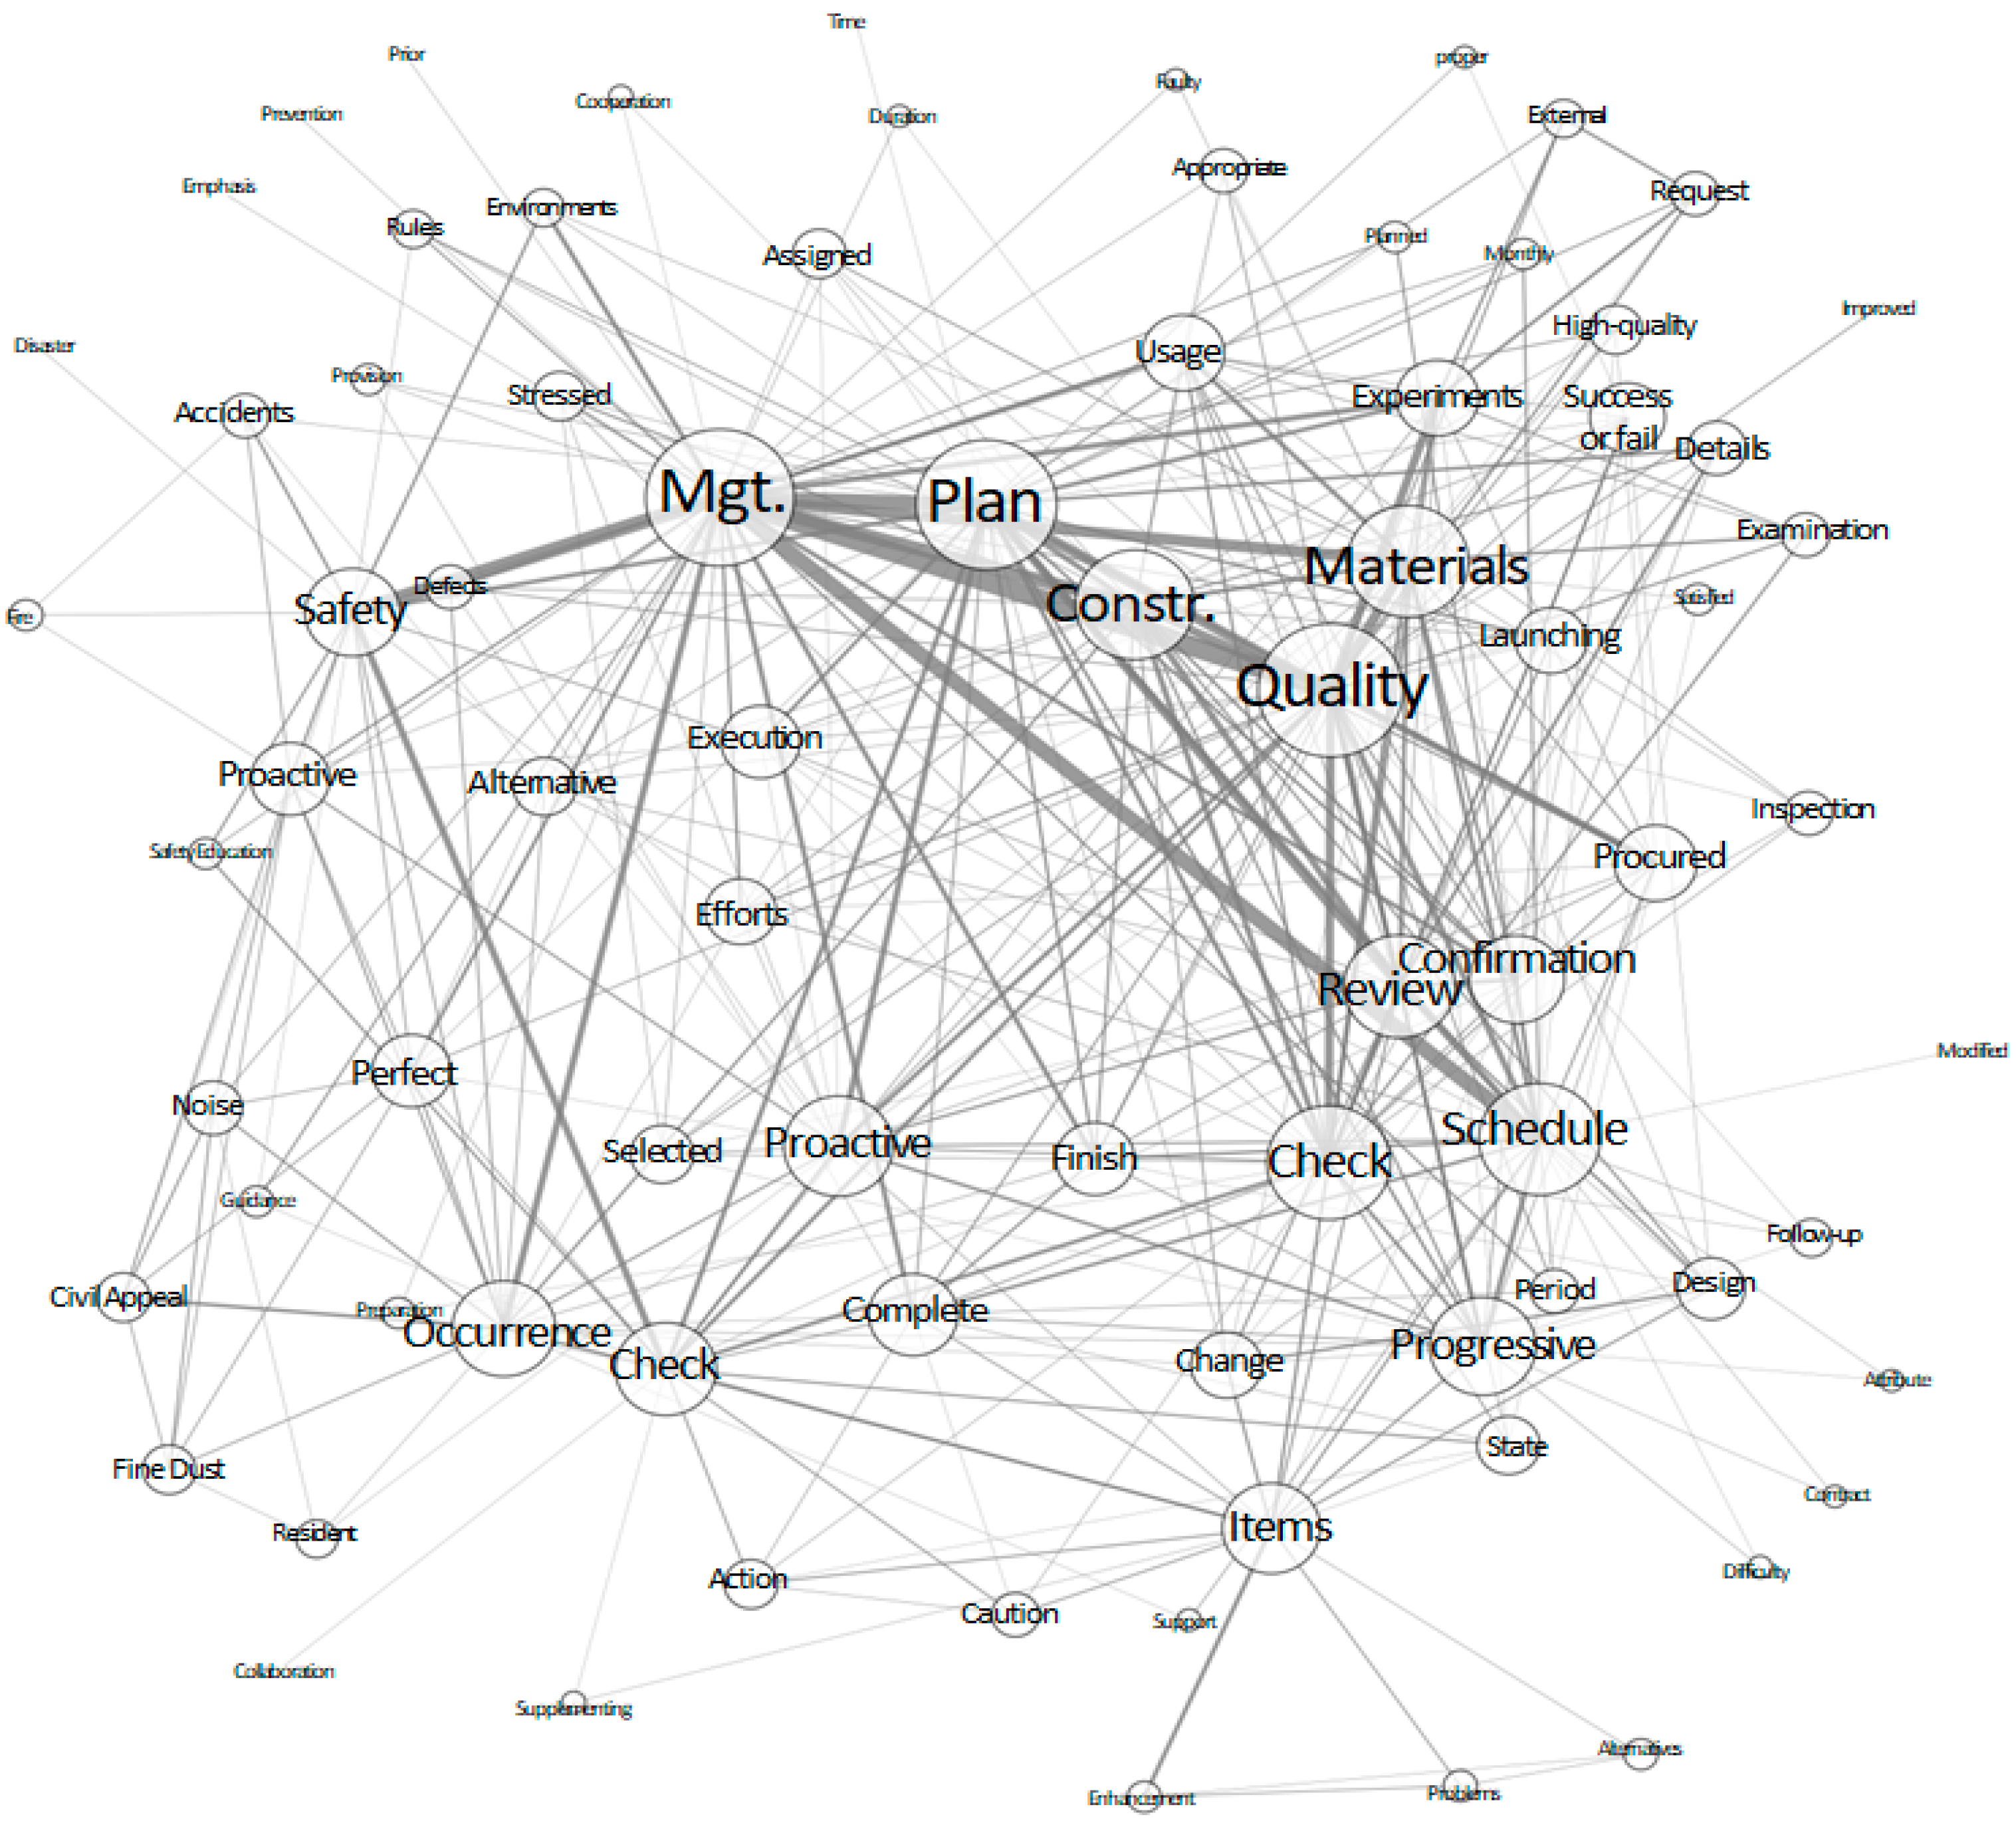
In the results of ARA, since one sentence corresponds to one set of attributes (keyword set), when applying SNA, keyword combinations (e.g., A and B) in one sentence appear as two nodes connected by a link in the network. In this procedure, if a rule is generated between keywords in the results using ARA, each keyword is expressed as a node in the network graph, and the rule is explained as a link. Here, the higher the centrality of the node, the larger the node appears in the network, and the higher the support for the rule held by the two nodes, the bolder the link appears.

2.2.3. RF Model

RF is a representative ensemble technique that uses a bagging algorithm to generate individual trees and combine them to derive results. Bagging is a method that encompasses the bootstrap and aggregating functions, and refers to the combination of the bootstrap function that randomly extracts from the original dataset to generate independent subsets with the same distribution, and the function that generates a model for each generated bootstrap data and synthesizes the model results [44].
In the RF, one decision tree is generated for each sub-dataset (named bootstrap). The CART (Classification and Regression Tree) algorithm is applied to generate these individual decision trees. The CART has a pruning function that removes branches that have a high risk of classification error or have inappropriate rules, but the RF does not use this pruning function. The pruning function in the CART is used to prevent the model from overfitting the data. However, in the RF algorithm, even if an individual decision tree is overfitted, it does not significantly affect the performance of the entire model, and since the main goal is to predict the average of the target value, the noise is canceled out and the variance is reduced in the prediction of each decision tree [45]. In addition, in the process of constructing an individual decision tree, variables are randomly selected, and two child nodes are generated based on the variable that minimizes impurity among the selected m variables and its value. This process is repeated until each decision tree is completed. Randomly selecting variables can partially resolve the limitations of the conventional bagging predictor due to correlation between individual predictors and improve the generalization performance of the model [45].
The concept of the RF algorithm is to derive various models based on the generated decision trees and perform prediction classification based on the model with the highest selection frequency. In other words, the class most frequently selected among the classes predicted by each decision tree is used as the final prediction result. This concept can be expressed as Equation (1), where B is the number of decision trees, Cb(x) is the classification result of an individual decision tree model, and CrfB(x) means the result of synthesizing the classification of individual decision trees. The process of applying the RF algorithm can be diagrammed, as shown in Figure 1.
C r f ^ x = m a j o r i t y   v o t e { C b ^ ( x ) } 1 B
In the RF model, each decision tree consists of the root node, internal nodes, branches, and leaf nodes, and the details are as follows. Firstly, the root node is defined as the node where the first split occurs, and it is the concept of the starting point from which the decision tree grows. Next, the internal node selects a variable that is the basis for splitting in the decision tree, and splits the data according to that variable. This splitting is a concept of dividing the data into two child nodes according to the value of the variable determined in each internal node. Thirdly, the branch represents a path from the internal node to a new internal node or leaf node. Finally, the leaf node contains the prediction result and is the final node of the decision tree that is not split any further. The criterion for deciding which variable to use and which value of that variable to use when splitting from the root node to the internal node or from the internal node to the leaf node is generally to minimize impurity [46]. Impurity is defined as the indicator that describes how many different classes are mixed in the node, and minimizing impurity means that after splitting a node, the classes in the child nodes are separated as purely as possible without being mixed. Impurity is mainly measured using the Gini index or entropy, which is similar to the concept of the mean squared error used in regression analysis.
In this study, the Gini index was employed as a measure of impurity due to its computational efficiency. Node splitting in the decision tree was performed to maximize impurity reduction, determined by comparing the impurity before and after the split. Here, the impurity of one node is calculated as in Equation (2), where J is the number of classes, pi represents the proportion of samples belonging to each class, and IG(p) is the Gini impurity of one node. Since the CART-based decision tree generates two child nodes for each node split, the total impurity of the two nodes is calculated.
I G ( p ) = 1 i = 1 J p i 2
The total impurity after the split is calculated according to Equation (3), where IT represents the total impurity after the split, and S, Sleft, and Sright represent the number of samples of the parent node and the number of samples of the left and right child nodes, respectively. In addition, Ileft and Iright represent the impurity of the left/right child nodes.
IT = Sleft(Ileft/S) + Sright(Iright/S)
This study uses the sklearn library in Python 3.0 to build the RF model. In order to build the RF model, hyper-parameters such as the number of trees, maximum depth, minimum number of leaf node samples, minimum number of node split samples, and maximum features must be set, and the details are as follows. Firstly, the number of trees is the hyper-parameter that specifies the number of trees in the RF model. The generalization performance of the model improves when there are many trees because it synthesizes various prediction results [45]. However, when the number of trees increases beyond a certain level, the performance of the model is hardly improved and the computation increases, so it is important to set the appropriate number [47]. Secondly, the maximum depth is the hyper-parameter that limits the growth size of individual trees. If this value is large, overfitting can be prevented, but if the value is too small, the model may be reduced, so the appropriate value should be set. Thirdly, the minimum number of leaf node samples and the minimum number of node split samples are hyper-parameters that determine the minimum number of samples that each leaf node must have when each tree grows and the minimum number of samples required for the node (branch) to be split. In Python, they are set to fixed values of 1 and 2, respectively [48]. Fourthly, although it is efficient to set the node size to a fixed value, it is important to set the appropriate value considering the data characteristics [49]. Lastly, the maximum feature refers to the maximum number of features (variables) considered in one node division, and classifiers generally use the square root value of the number of variables [46].
In order to secure the optimal analysis performance of the RF model, tuning of hyper-parameters must be a prerequisite, and representative methods can be reviewed as grid search, random search, and Bayesian optimization [50,51]. Among these methods, Bayesian optimization is a method to find optimal solutions that maximizes an arbitrary objective function, and the optimization method can be applied to any function that can obtain observation values, and has the advantage of being able to be used for the objective function of an algorithm whose structure is difficult to systematize [52]. In addition, Bayesian optimization is differentiated from grid search and random search in that it utilizes prior information in the process of searching for hyper-parameters [52,53]. Therefore, this study utilizes Bayesian optimization as a search technique to find a combination of hyper-parameters. The specific application process of the Bayesian optimization algorithm is as follows. Firstly, random values are selected in the initial hyper-parameter search process to learn the model and evaluate its performance. Secondly, the probability model (Gaussian process) that predicts the performance distribution for the initial hyper-parameters is generated as the surrogate model to improve the efficiency of selecting the objective function [52,53]. The hyper-parameter values that maximize the expected improvement, which is the acquisition function, are selected according to the distribution generated from the surrogate model. Thirdly, the objective function values are derived using cross-validation, and Bayesian optimization is repeated up to the set number of iterations. During the iteration process, the combination showing the objective function values with the highest performance is derived. This study implemented these processes using the BayesSearchCV class of the Python skopt library [48].

2.2.4. Dataset Augmentation for Stabilizing the RF Model

In this study, datasets were collected from 39 construction projects, and the Gaussian Copula algorithm was applied to augment them for enhancing the robustness of the RF model. While several other algorithms exist for augmentation, such as conditional tabular gGAN (CTGAN), CopulaGAN, TVAE (Tabular Variational Auto-encoder), and Fast-ML, the Gaussian Copula algorithm was adopted, as it provides high fidelity in preserving similarity and correlation structures with the original dataset [54]. By meaningfully reflecting the statistical characteristics of the original variables, augmented datasets were generated and evaluated for similarity with the Kolmogorov–Smirnov (KS) test. As presented in Table 2, the results of the KS test of variables indicated significance levels greater than 0.05 in all cases [55], confirming that the augmented dataset was consistent with the original dataset.
In addition, we analyzed the mean absolute error (MAE) of the Spearman correlation coefficients between the original and augmented dataset to explain that the augmented dataset preserved the correlations among variables. The existing study has suggested that the correlations of the original dataset are regarded as adequately preserved in case the MAE value is below 0.05 [56]. The estimated MAE of the augmented dataset was 0.012, indicating that the dataset was statistically meaningful.

2.3. Development Process of a Proposed Framework

A proposed framework presented in this study was developed based on unstructured text data included in the final supervision report generated during the construction phase of the architectural project. The final supervision report contains a variety of information, including comprehensive opinion on the project supervision and the results of inspection work, and can collect efficient unstructured qualitative data that can be used to estimate the cost performance of the architectural project. This study collected final supervision reports generated from 43 architectural projects and developed a framework based on 39 reports containing various inspection results and comprehensive opinions. For the projects for which data were collected, project types consisted of residential facilities and non-residential facilities (i.e., public buildings), and the construction period was analyzed to be a minimum of 17 months and a maximum of 44 months, with an average of 31 months. In addition, the average floor area was analyzed to be about 167,229 m2, and the floor area ratio was reviewed to be approximately 265%.
The detailed development process of the proposed framework is as follows. Firstly, the frequency of words (nouns) appearing in the inspection results and comprehensive opinions was calculated, and 124 keywords related to the cost performance of the architectural project were selected. Secondly, the dataset in which the set of words appearing in one sentence is organized into one row was constructed, and analysis was performed using ARA and SNA. Thirdly, 10 keywords highly related to cost performance were selected using the analysis results of the second stage, and the weights (%) between these keywords were calculated and used for RF-based analysis. Here, in this study, Bayesian optimization was used for the hyper-parameter tuning as described above. Finally, in order to verify the results based on the RF, comparison was performed with the analysis results based on the traditional logistic regression (LR) and the binominal logistic regression (BLR) model with a regularization constant to prevent overfitting. While the regularization-based BLR model effectively mitigates overfitting and stabilizes model performance, it necessarily requires imposing conditions and constraints on the loss function to minimize the squared sum of regression coefficients [18].

3. Results

3.1. Setting Independent and Dependent Variables

This study applied the same independent and dependent variables to compare the performance of the proposed framework with the results of a previous study [18]. In detail, 11 keywords derived through ARA and SNA were selected as input values for the model that can estimate cost performance evaluation. However, in order to avoid the problem of perfect multicollinearity, the keyword ‘construction’ was excluded from the 11 keywords. The proportion (%) between the 10 keywords was set as independent variables, and the actual cost compared to the plan was set as the dependent variable to evaluate cost performance. The dependent variable was converted to binary and used as 0 if it was less than 100% and 1 if it was more than 100%. Here, 100% is a threshold value, indicating that the actual cost achieves the planned or targeted cost. The details of the procedure for setting the independent variables and the results are as follows.
The comprehensive opinions were excerpted from the final supervision documents using Python’s TIKA library. The words (nouns) were extracted using the OKT module of the KoNLPy package and then grouped into sentence units to form data. The extracted keywords were refined through three rounds of focus group interviews conducted with construction supervision practitioners and our research team, resulting in the identification of applicable keywords for performance measurement. This can be interpreted as a preprocessing step for performing ARA using the constructed data [53]. Words (nouns) with low frequencies among the analysis results were assumed to be unrelated to cost performance, and the top 124 keywords were initially derived based on frequency. Especially, 37 keywords of 124 keywords were selected, accounting for approximately 70% of the total frequency, and were specifically composed of ‘management’, ‘quality’, ‘plan’, ‘safety’, ‘construction’, ‘materials’, ‘process’, and ‘inspection’.
ARA was conducted using sentence-level data restricted to the 124 keywords. Here, the support, confidence, and lift were set to 0.01, 0.1, and 1 or higher, respectively, as the rule generation standard, and the analysis results showed that the top 30 rules secured high reliability based on the support, as shown in Table 3 [18].
For example, if the reliability of ‘quality’ as an antecedent event and ‘management’ as a consequent event was higher than that of ‘management’ as an antecedent event and ‘quality’ as a consequent event, only the former combination was selected as a target. The analysis results showed that among the rules with high support values, association rules containing keywords such as ‘management’, ‘quality’, ‘plan’, and ‘materials’ were frequently generated. In the case of the keywords ‘management’, ‘quality’, and ‘plan’, rules were frequently generated as consequent events, while the keyword ‘materials’ was mainly generated as an antecedent event.
The results of the SNA using the above results analysis are as shown in Figure 2 [18]. As a result of analyzing the relationship between keywords, ‘management’, ‘quality’, and ‘plan’ had the highest centrality, followed by ‘construction’, ‘materials’, ‘confirmation’, ‘check’, and ‘process’.
The analysis results of the descriptive statistics for the variables are shown in Table 4. The mean of the dependent variable, cost performance, was 101.5 and the median was 103.3, showing a distribution with a long tail to the left side (skewness −2.3). In addition, the average proportion (%) of the keywords, which were independent variables, was in the order of ’management’, ‘quality’, ‘process’, ‘safety’, ‘plan’, and ‘materials’. The kurtosis of ‘change’ was very high at 21.4, and the fact that the first quartile value was 0 can be interpreted as being that a considerable number of data have values of 0 and are distributed around 0. Except for ‘change’, the proportions of other keywords are relatively evenly distributed.

3.2. Analysis Results Based on RF

In order to derive analysis results using RF, this study set the search space for applying Bayesian optimization as follows. Firstly, the number of decision trees was set to a value between 100 and 500, and in particular, the minimum value was set to 100 to secure sufficient decision trees. Secondly, the maximum depth of the decision tree was set to a value between 1 and 10, which was made so that the maximum depth of the tree did not exceed 10 considering that it was a binary classification model and that the data size was not large. Thirdly, the maximum number of features generally uses the value of the square root in classifiers, but since it was difficult to judge the data applied in this study in a general and systematic form, it was set so that all values from 1 to 10 could be applied. Finally, the minimum number of samples for node splitting and the minimum number of samples for leaf nodes were set to search for hyper-parameters within a value of 10 or less.
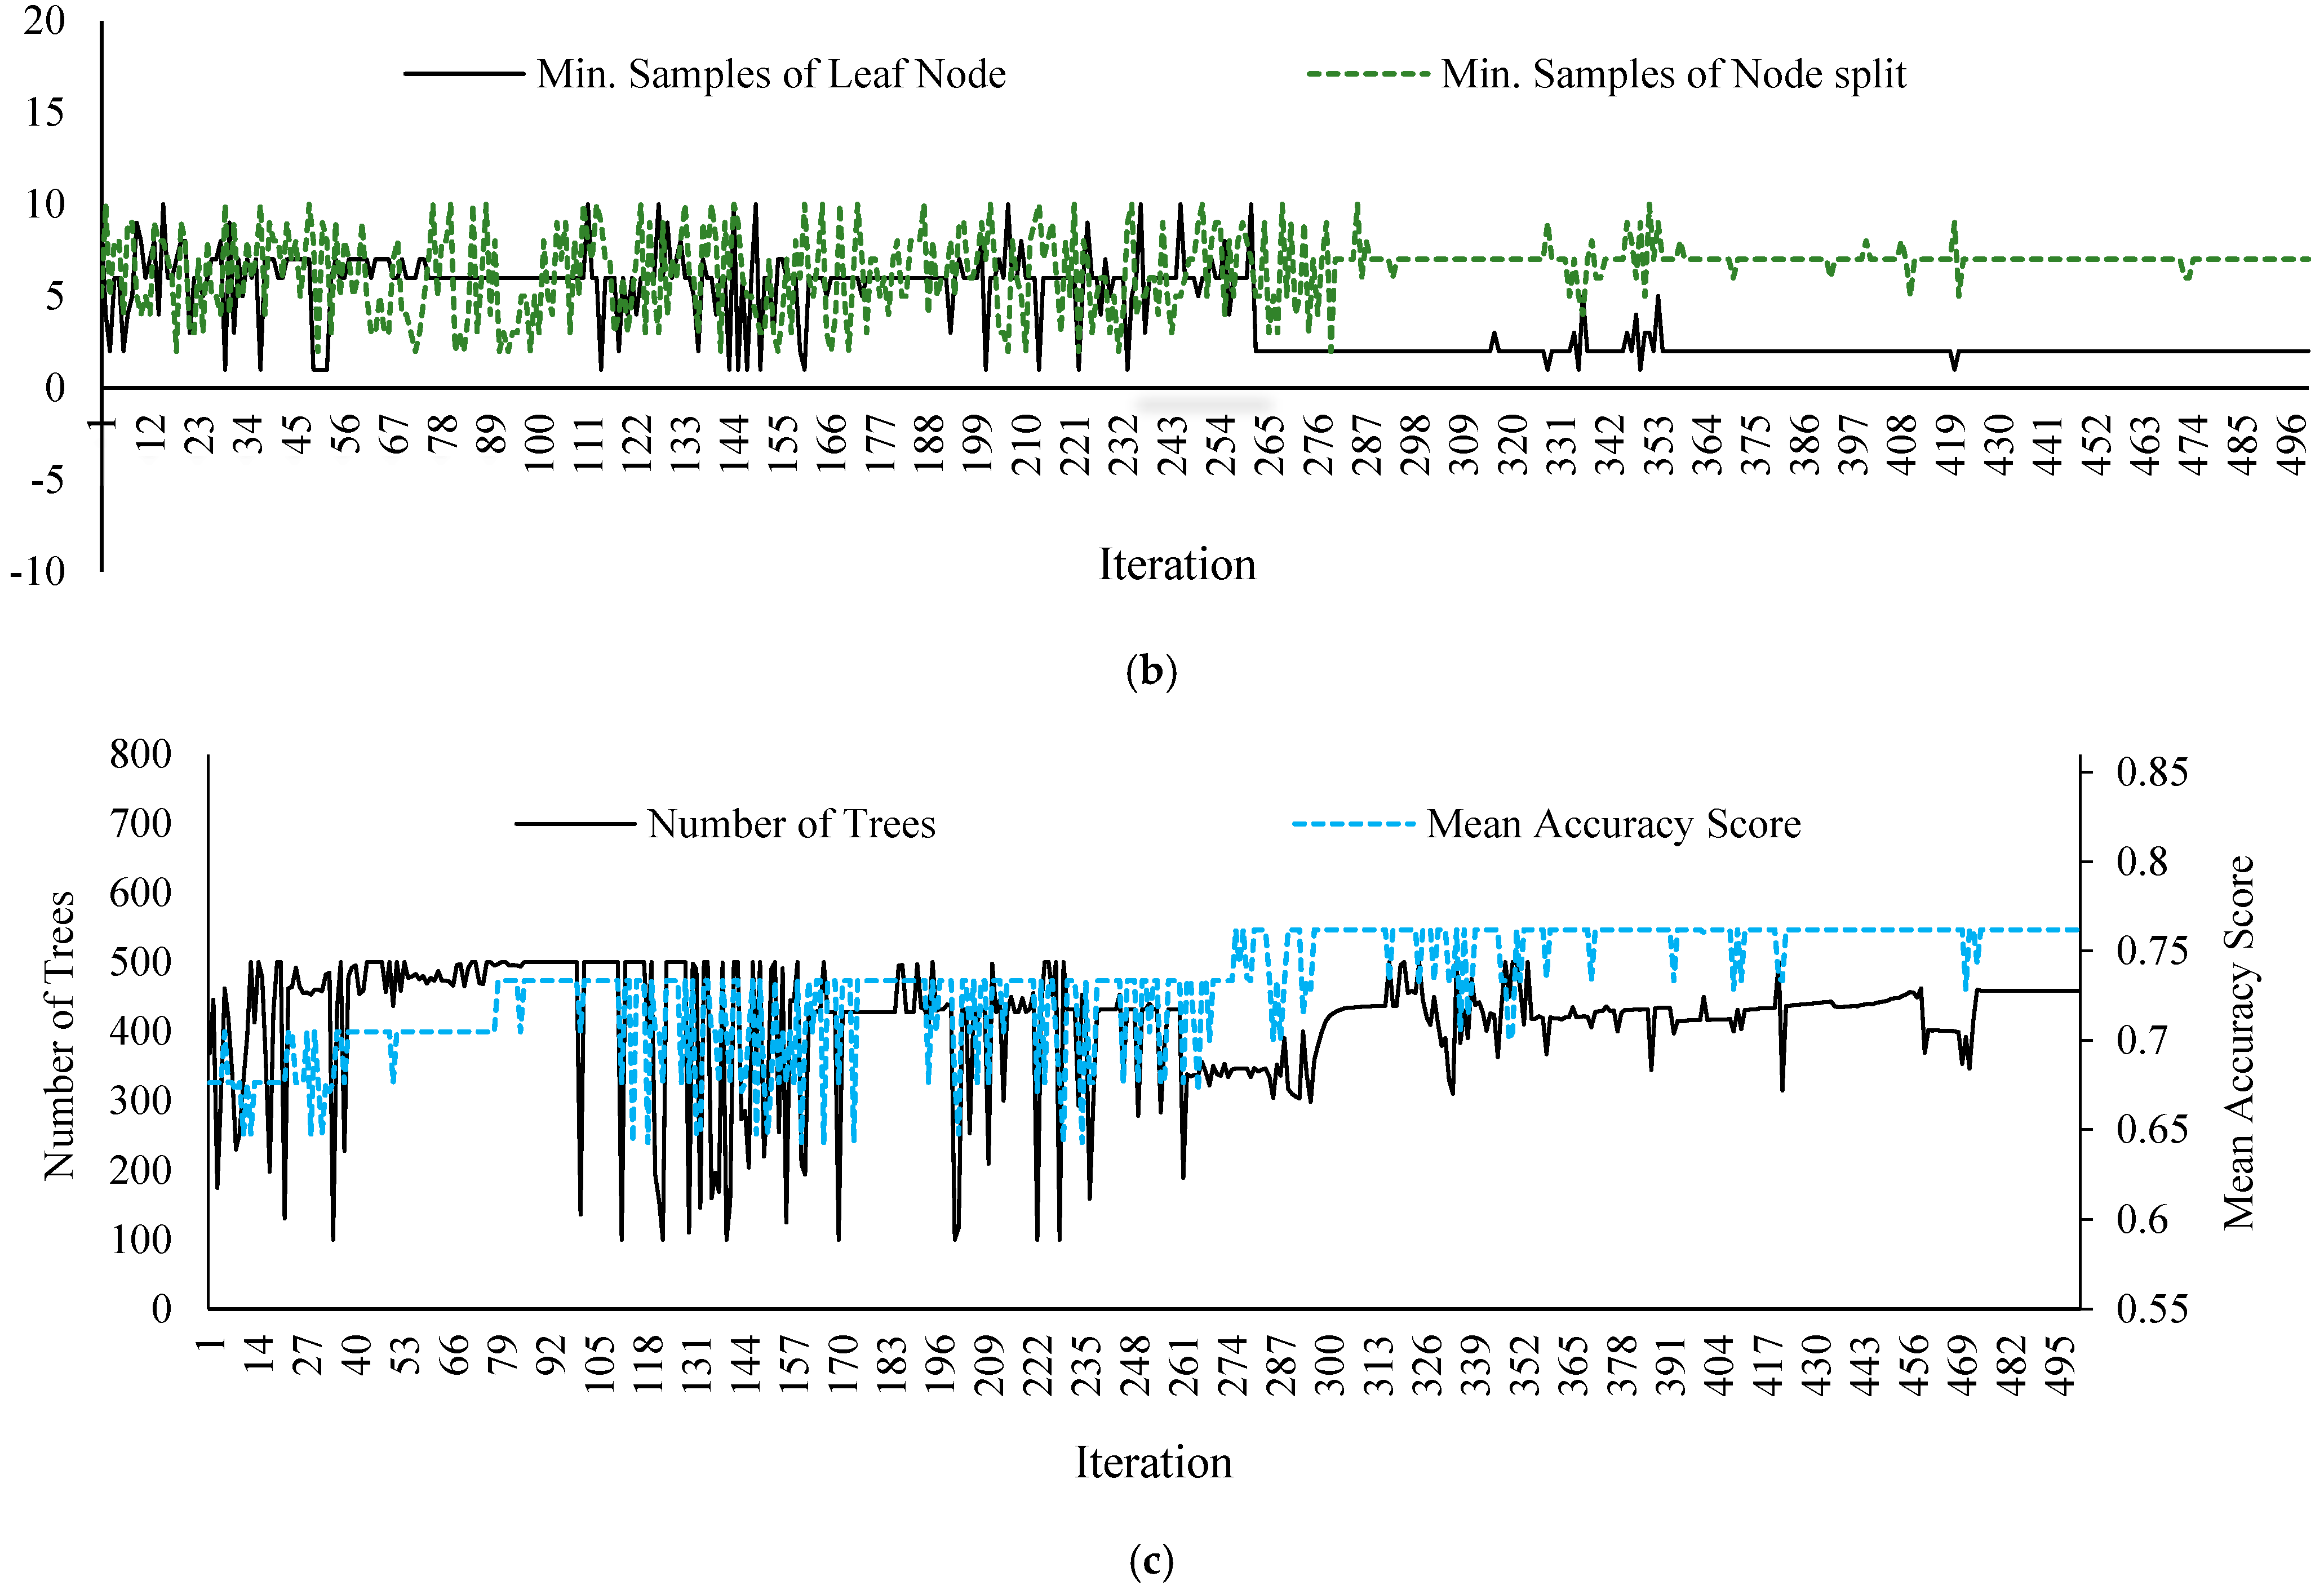
Using Bayesian optimization, the average class classification (prediction) accuracy can be derived through 5-fold cross-validation based on each hyper-parameter combination. In other words, after the process of deriving the hyper-parameter combination with the optimal accuracy was repeated 500 times, the combination that presented the highest prediction accuracy was derived, and the performance of the model was analyzed through test data after retraining using the training data. The specific analysis results can be diagrammed, as shown in Figure 3, and the details are as follows.
As shown in Figure 3a, both the maximum depth of the tree and the maximum number of features fluctuated up to 300 iterations, but the modes were 8 and 2, respectively, after about 300 iterations. Namely, it was analyzed that when the maximum depth of the tree showed a large value, the maximum number of features tended to show a low value. Additionally, the maximum number of features generally used in classification problems is a square root value, but in this study, it showed a relatively smaller value (2). Next, as shown in Figure 3b, the minimum number of samples of leaf nodes and the maximum number of features used for node splitting fluctuated up to about 300 iterations, and the modes were derived as 2 and 8, respectively, after about 300 iterations; that is, all four hyper-parameters tend to converge at around 300 iterations, which is the same point where the mean accuracy score increases to around 76% (Figure 3c). In addition, the number of trees continued to fluctuate in the range of 100 to 500, and the main set value was between 400 and 500 (Figure 3c). In summary, after around 475 iterations, the maximum tree depth was 8, the maximum number of features used for node splitting was 2, the minimum number of leaf node samples was 2, the minimum number of node split samples was 7, and the number of trees did not show much fluctuation at 459, so they were set as the optimized hyper-parameters of the RF.
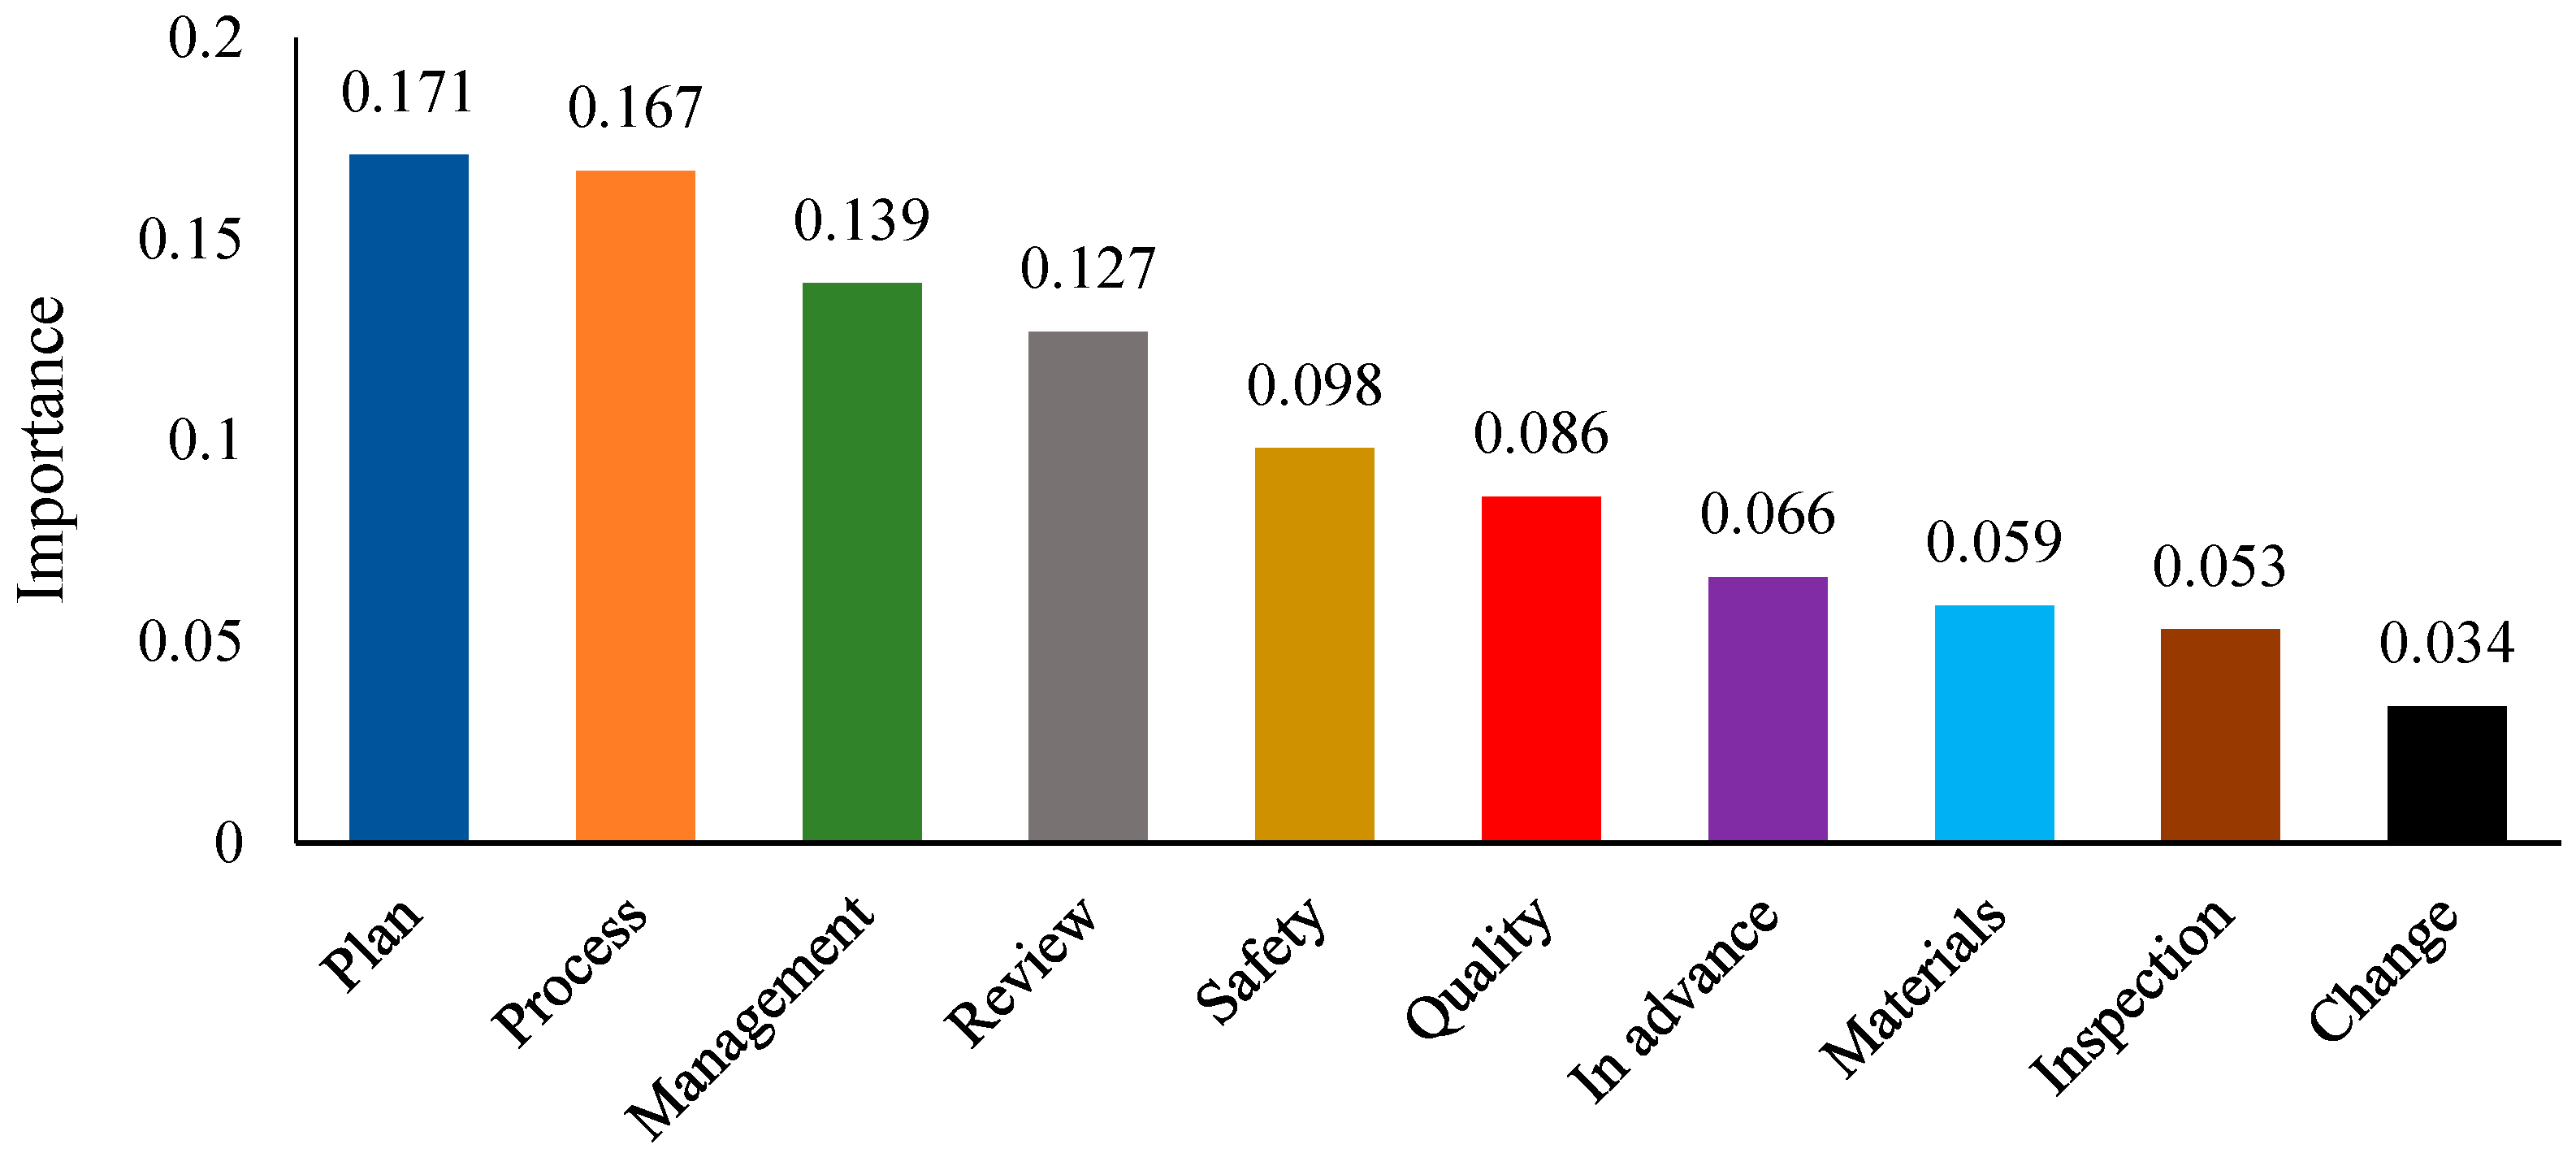
The results of graphically plotting the importance of the independent variables derived using the RF model built on the basis of Bayesian optimization are shown in Figure 4. Such analysis results have been evaluated as an effective method for quantitatively explaining and visualizing the influence of independent variables on the dependent variable [44]. Among the independent variables used in this study, the order of importance was analyzed as ‘plan (0.171)’, ‘process (0.167)’, ‘management (0.139)’, ‘review (0.127)’, ‘safety (0.098)’, ‘quality (0.086)’, ‘in advance (0.066)’, ‘materials (0.059)’, ‘inspection (0.053)’, and ‘change (0.034)’. Among these, the variables with high importance were ‘plan’, ‘process’, and ‘management’, and the variables with low importance were derived as ‘materials’, ‘inspection’, and ‘change’. Overall, the average weight of the keywords used in cost performance evaluation and the variable importance showed a rank correlation of approximately 0.62.
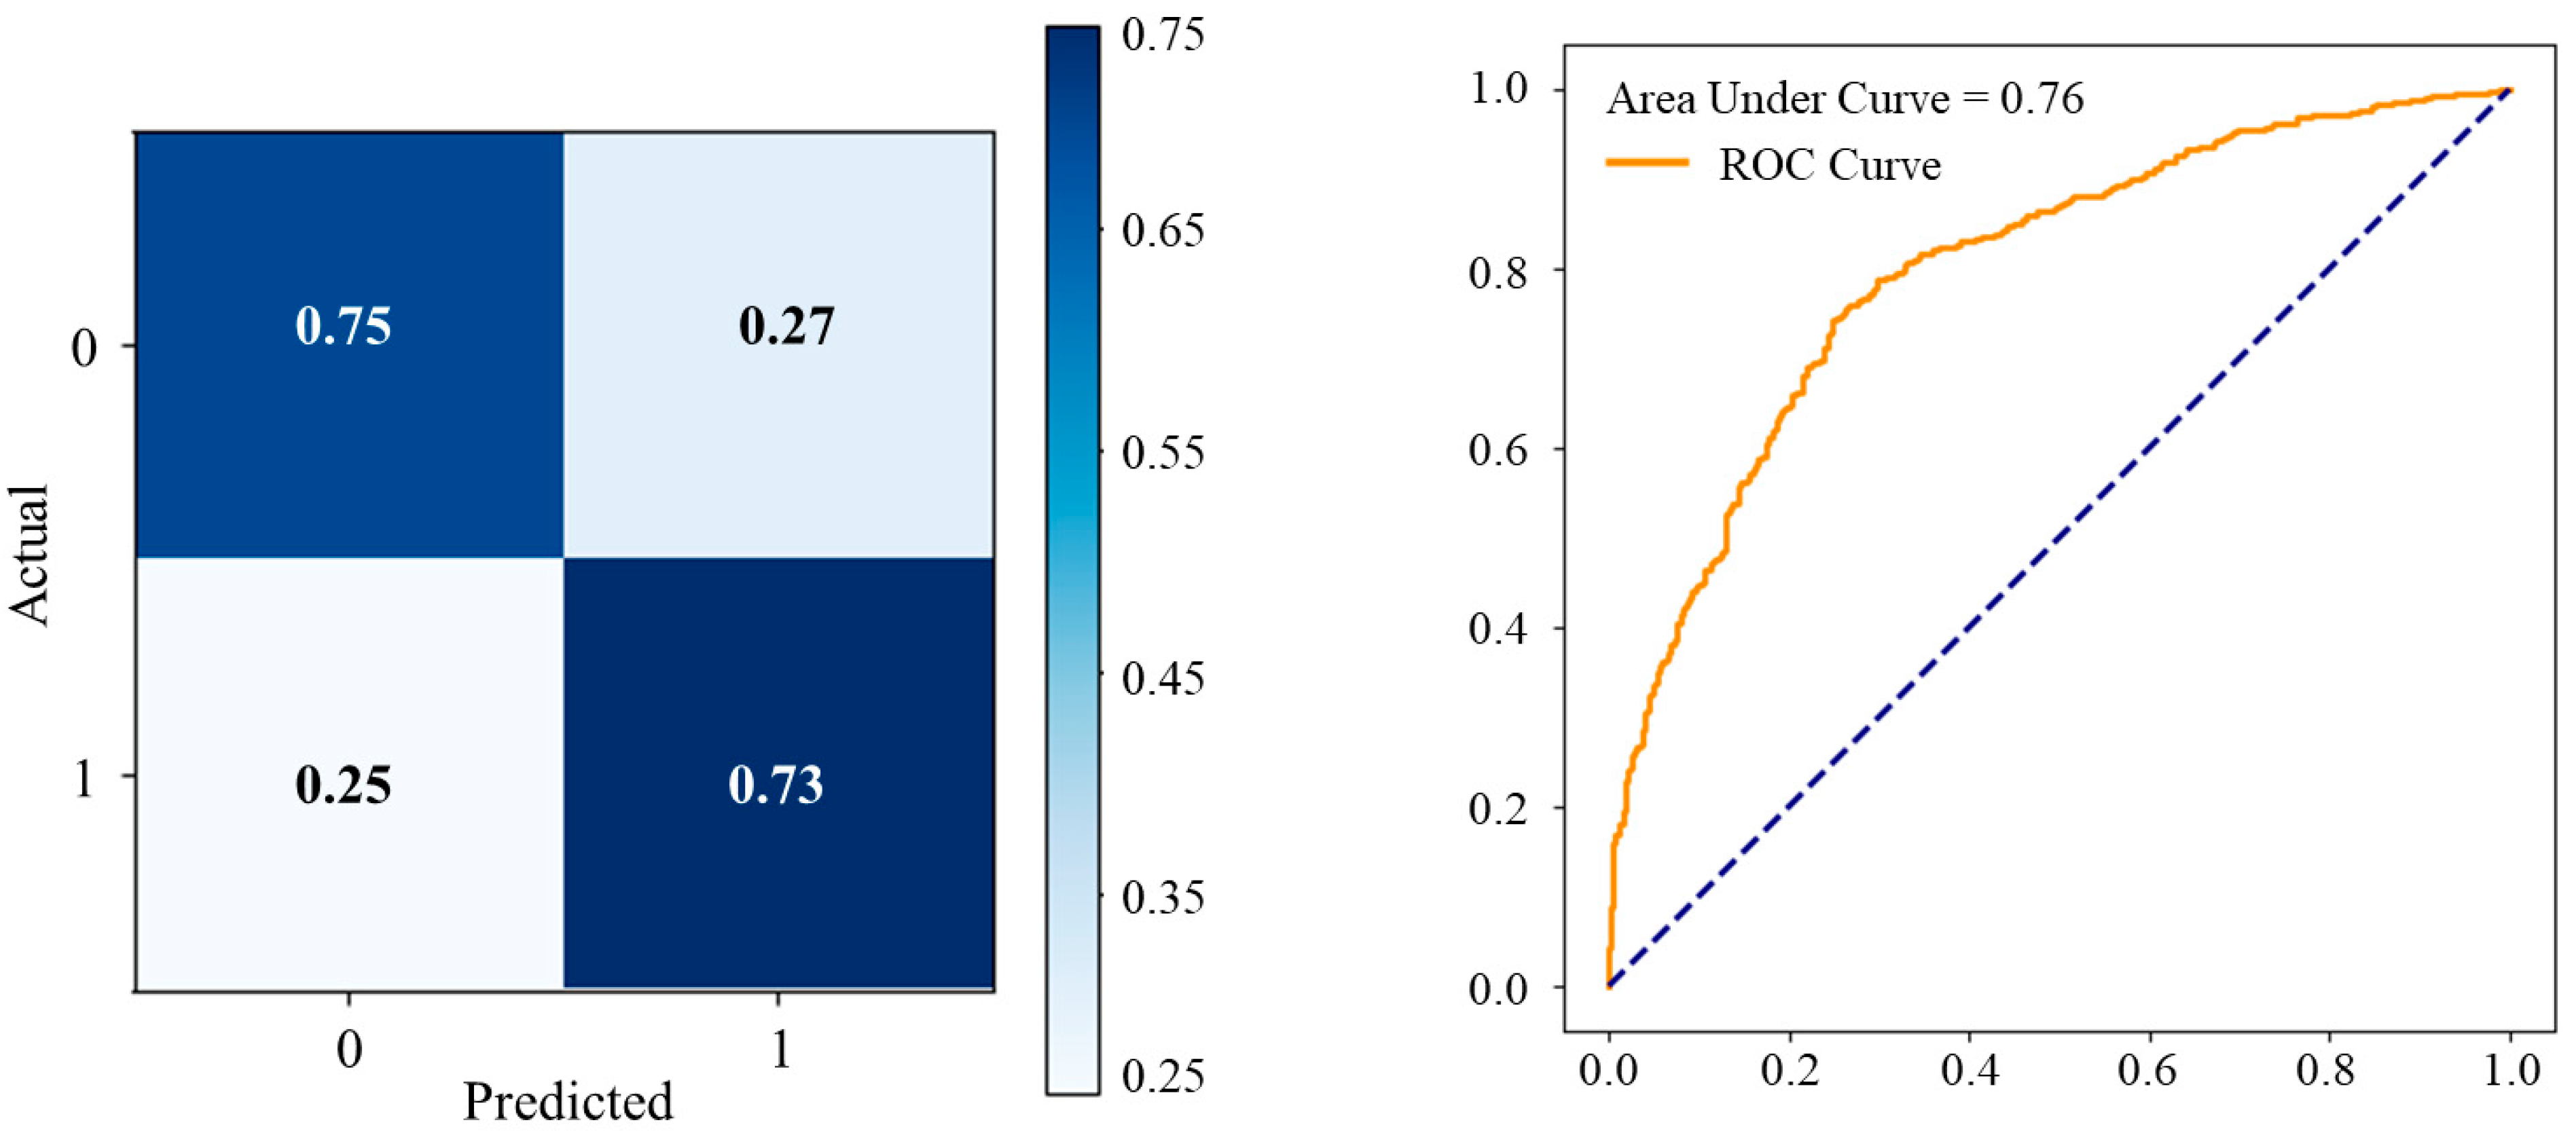
Since the augmented datasets were divided into training (70%) and testing (30%) subsets, the accuracies of traditional LR, constrain-based BLR, and RF models are compared in Table 5 and Table 6 shows the results of five projects reflecting the hyper-parameter values in the RF model. The datasets were utilized to stabilize the performance of the constructed model, which was evaluated using the Receiver Operating Characteristic (ROC) curve and the confusion ratio matrix, as presented in Figure 5. The application to five projects presented that the decision tree vote was significantly classified along with the actual and predicted values of the independent and dependent variables. From the performance perspective of the model, the Area Under the Curve (AUC) was approximately 0.76, which indicates a statistically meaningful classification capability. This result is higher than that of traditional logistic regression (LR) and also surpasses the regularization-based logistic regression (BLR) presented in the previous study [18].
As a result, the use of machine learning can be interpreted as a method that can secure relatively high reliability for prediction values compared to traditional statistical techniques. However, the model based on LR and BLR can estimate the regression coefficient of each variable, and these values can be used as the direction (negative or positive) and influence size of the independent variable on the dependent variable. The importance derived through the RF model only shows the influence size on the prediction of the dependent variable, and there is a limitation in confirming the direction. In other words, the RF model can explain the relationship between the proportion of major keywords and cost performance, but it may be constrained in explaining the causal relationship. Therefore, the BLR and RF models consisting of the framework can be useful for integration in cases for deriving various evaluation explanations about cost performance. It is expected that the framework can evaluate the explanatory power of unstructured data by applying the RF model and examine the direction of influence together by incorporating BLR.

3.3. Operational Concept of a Proposed Cost Performance Evaluation Framework

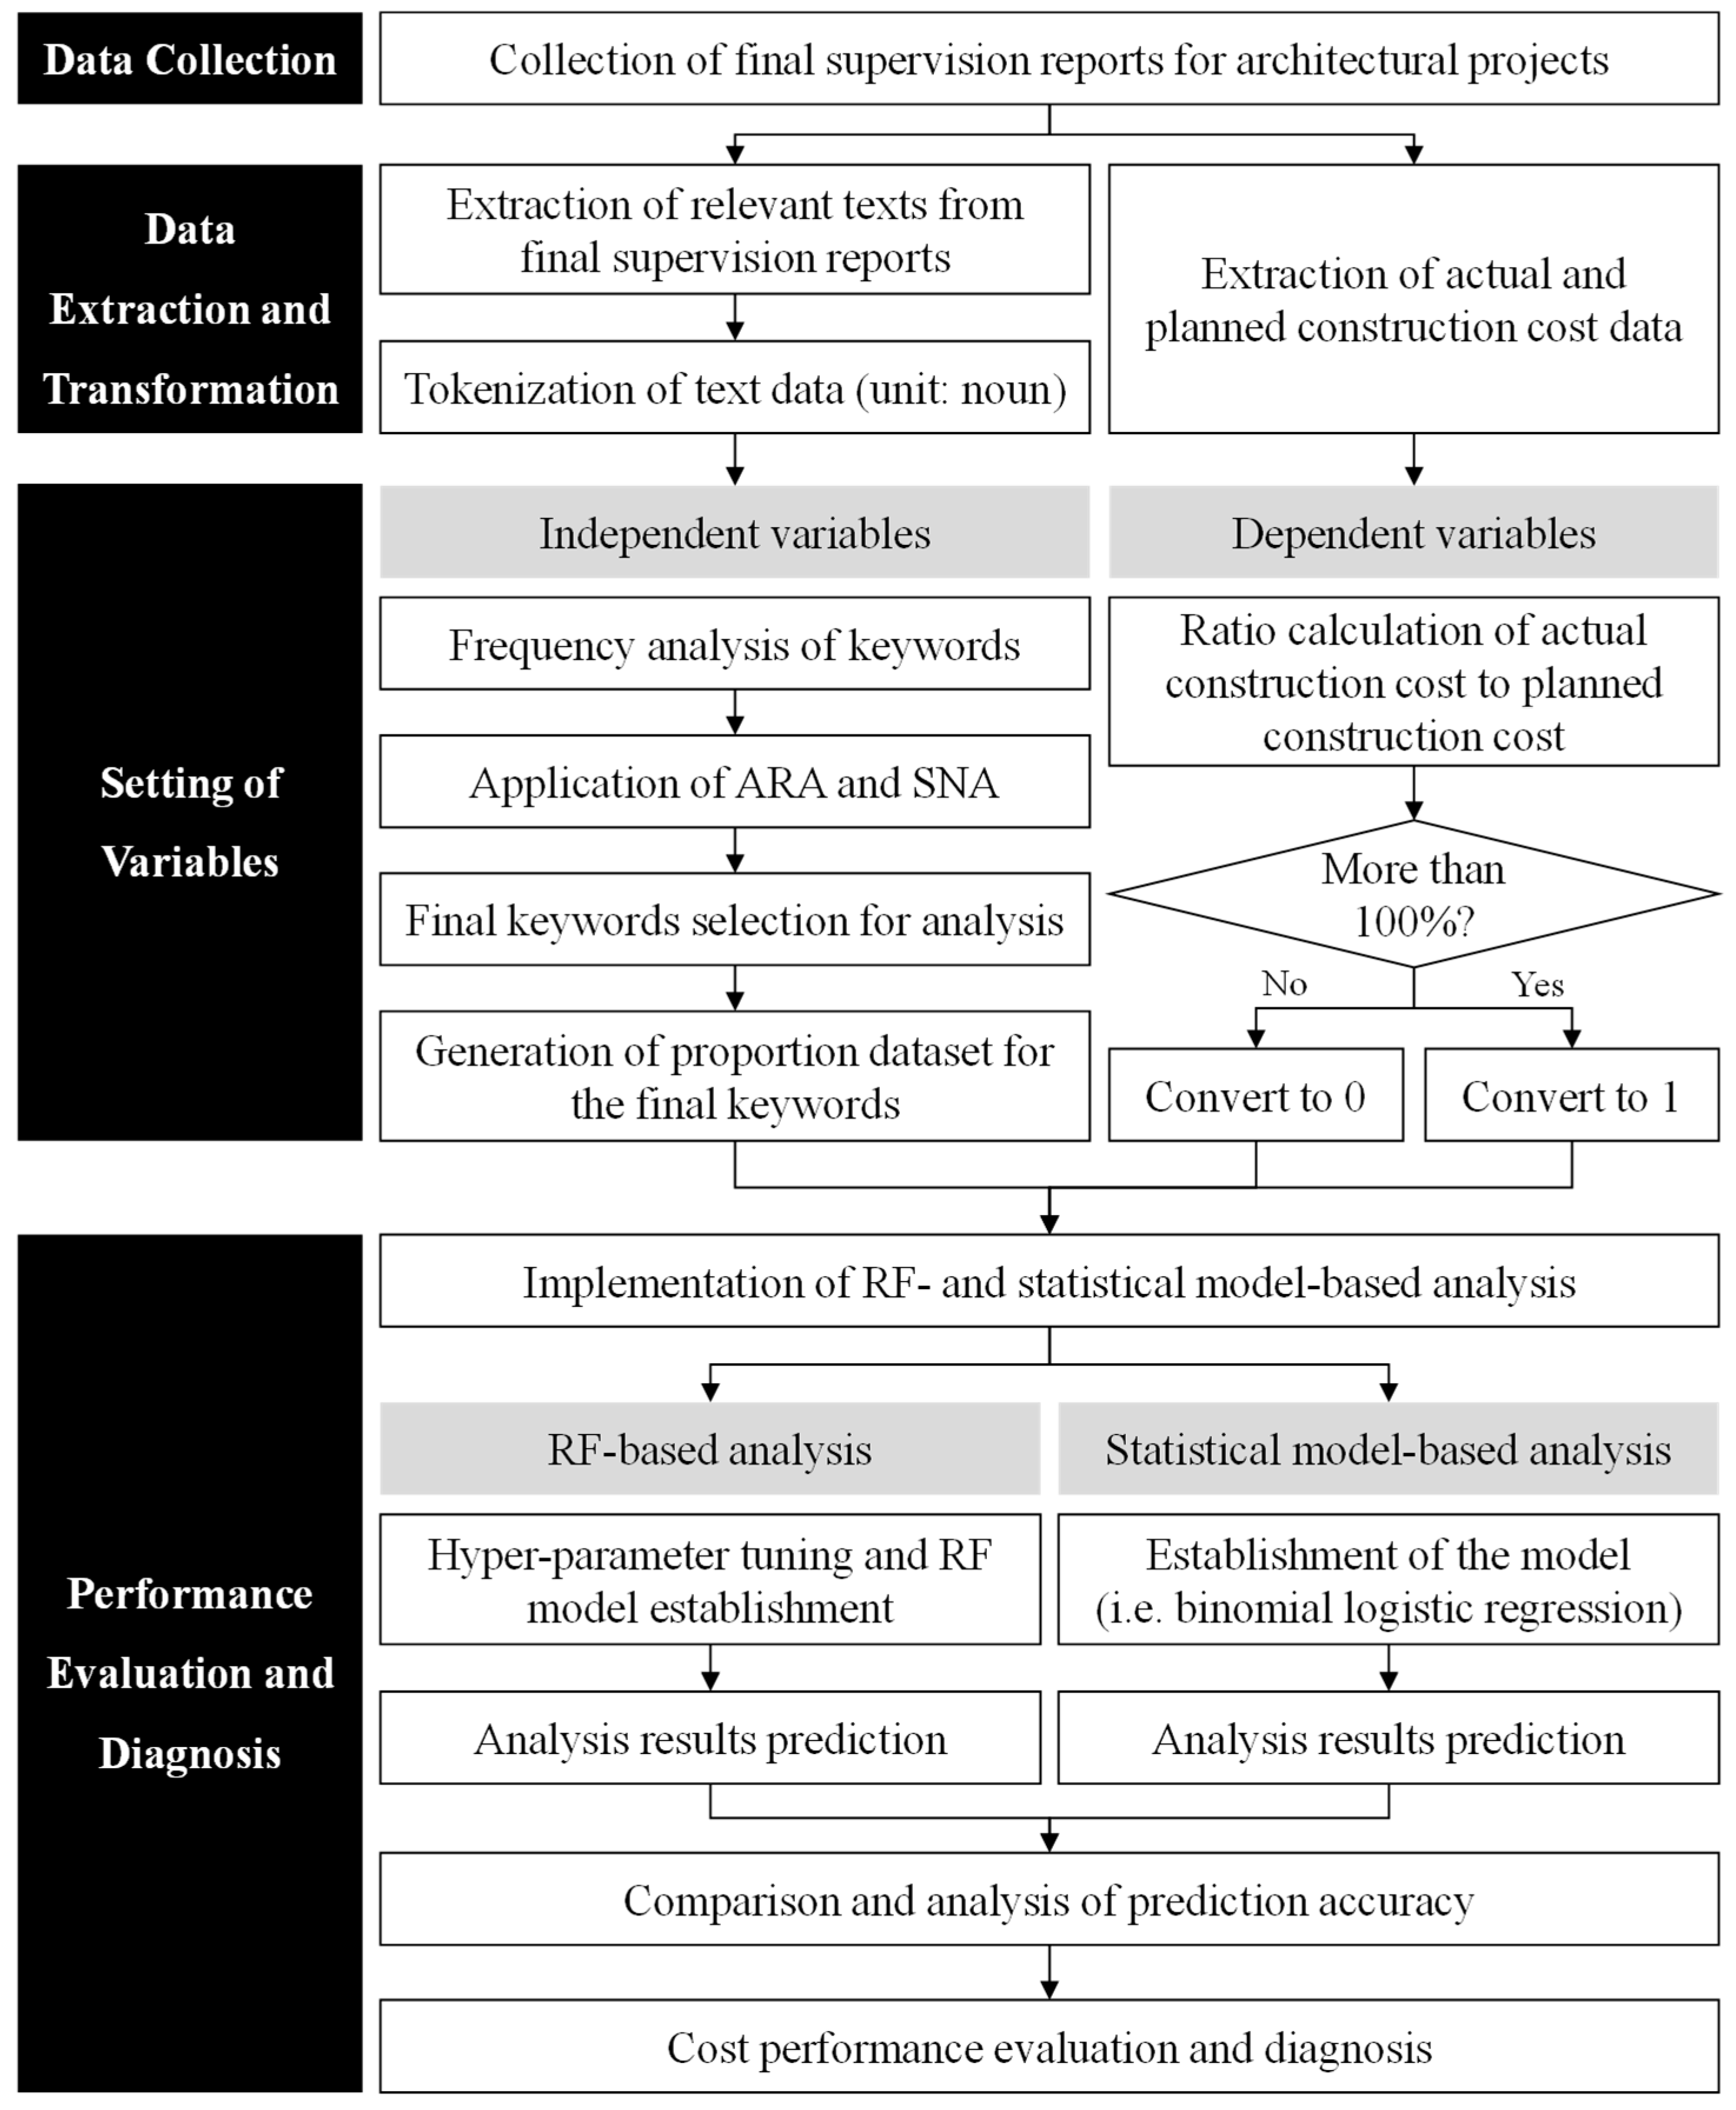
The operational concept of a cost performance evaluation framework proposed in this study can be diagrammed, as shown in Figure 6. The main contents of the operational concept of a proposed framework are as follows: (1) collection of final supervision reports of the architectural projects and keyword extraction; (2) establishment of a dataset in which a set of words appearing in one sentence is composed of one row; (3) collection of planned and actual construction cost data; (4) selection of major keywords based on frequency analysis, ARA, and SNA; (5) generation and analysis of proportion dataset between keywords; (6) binary conversion of the ratio of planned construction cost to actual construction cost; and (7) cost performance evaluation and diagnosis through the comparison of the analysis results of the statistical model and RF.
In other words, a proposed evaluation framework can be organized into a system that selects major keywords that are expected to have a high impact on cost performance by reviewing the comprehensive opinions in the final supervision report, analyzes and verifies the relationship between the proportion of keywords and the actual construction cost compared to the planned construction cost using various methods, and then selects and diagnoses a model with high prediction accuracy.

4. Discussions

This study distinguishes itself from previous studies by structurally interpreting the latent meanings embedded in unstructured data through the combined application of ARA and SNA. Whereas existing studies based on text mining techniques were largely limited to frequency counts or simple keyword extraction, the approach proposed in this study derives systematic co-occurrence patterns of cost performance-related keywords using ARA. The approach analyzes the centrality and structural influence among keywords through SNA. This enables not only the extraction of significant implications but also the examination of interactions among factors directly or indirectly associated with cost performance.
By integrating the results of ARA and SNA with the RF model, the study simultaneously achieves exploratory analyses, which demonstrate originality compared to conventional approaches. Furthermore, the study incorporates keyword networks derived from ARA and SNA as independent variables in the RF model, thereby verifying both the structural importance and influence of cost performance factors. The semantic meanings extracted from construction supervision documents are not restricted to qualitative interpretation but are embedded into a quantitative evaluation framework, highlighting the practical applicability. As data are additionally accumulated, ARA and SNA can continually update the relational rules, while the RF model can improve the learning performance through Bayesian optimization. Consequently, the proposed framework contributes a dynamic and adaptive evaluation for cost performance levels based on unstructured supervision documents.
Unlike traditional statistical models, the RF model presents a key advantage by employing ensemble learning, which mitigates overfitting and strengthens predictive performance. Since cost performance in construction projects is influenced by multiple factors such as design changes, material costs, labor expenses, and safety management, the RF model strengthens performance evaluation by simultaneously considering heterogeneous text-based data. With high scalability in handling unstructured information, the framework extends beyond conventional numerical indicators and establishes a more comprehensive evaluation system by transforming large volumes of documents into independent variables through text mining and natural language processing. As more data subsequently become available, the framework enhances decision support functions and potentials to evolve into a self-learning system.

5. Conclusions

This study proposes a framework that can support the evaluation of the cost performance for architectural construction projects using unstructured text data and an RF model, which is one of the representative machine learning techniques. The prediction accuracy was approximately 76% when analyzed based on RF, which can be evaluated as a relatively high value considering the limited dataset. These results suggest that the proportion of keywords appearing in the comprehensive opinion of the construction supervision document is highly correlated with cost performance. Additionally, it showed a higher result than the accuracies of the traditional LR (0.59) and BLR (0.74) model with a regularization constant that can be interpreted as the effectiveness of evaluation and the high adaptability in data types.
A proposed framework, which aims to evaluate cost performance by utilizing various data and documents generated from construction supervision work in architectural projects, is expected to be expandable in the future as it is a study that is in line with the recent digital transformation of the construction industry. Moreover, if integrated with the cost estimation and prediction system at the design stage, it is expected that it will be possible to continuously evaluate cost performance from the start to the completion of a single construction site, thereby supporting the establishment of preemptive responses to cost fluctuations. Furthermore, an evaluation framework proposed in this study is expected to be applicable to a wider range of performance indicators, such as schedule and safety, and is expected to be ultimately utilized in the analysis of competitiveness trends at the construction industry level.
However, the following issues should be addressed and considered in future research. Firstly, this study used the comprehensive opinions of supervision documents as input data after rewriting them in a consistent type. Namely, Python’s KoNLPy package was used to extract various keywords, but since the method of extracting keywords for each package was different, additional review processes by researchers were conducted. Therefore, it is expected that in the future, it will be necessary to compare the extraction results of various modules to select modules that fit the research purpose, and to review the direction of algorithm development and data preprocessing to improve the efficiency of the cost performance evaluation. Secondly, additional data collection is necessary to enhance the reliability of the framework proposed in this study. Securing a sufficient number of data can complement the constraints in terms of dividing training and test datasets without data augmentation, thereby providing detailed analysis by dividing the dependent variable into diverse performance levels.
Finally, it is believed that policy improvements are needed to increase the disclosure and accessibility of construction supervision documents. In the case of Korea, specific laws and regulations that regulate the disclosure of construction supervision documents are practically insufficient. In detail, related laws and regulations such as the Building Act only stipulate the subject, content, and method of supervision work, but do not specify the disclosure of supervision documents for the relevant projects. Therefore, it is expected that improvements in related laws and regulations should be a prerequisite in order to support the derivation of various research results that can evaluate the cost performance level.

Author Contributions

Conceptualization, C.-W.K. and W.S.Y.; methodology, W.S.Y. and T.S.; formal analysis, K.L.; investigation, T.S.; data curation, W.S.Y., K.L. and T.S.; writing—original draft, C.-W.K.; writing—review and editing, C.-W.K. and W.S.Y.; supervision, W.S.Y.; project administration, W.S.Y. All authors have read and agreed to the published version of the manuscript.

Funding

This research was supported by a grant (RS-2022-00143493, project number: 1615012983) from the Digital-Based Building Construction and Safety Supervision Technology Research Program funded by the Ministry of Land, Infrastructure and Transport of Korean Government.

Data Availability Statement

The data used in the study are available from the authors and can be shared upon reasonable request.

Conflicts of Interest

The authors declare no conflicts of interest.

References

  1. Nan, J.; Choi, J.W.; Choi, H.; Kim, J.H. A Study on Estimating Construction Cost of Apartment Housing Projects using Genetic Algorithm-Support Vector Regression. Korean J. Constr. Eng. Manag. 2014, 15, 68–76. [Google Scholar]
  2. Kim, C.W.; Yoo, W.S.; Lim, H.; Yu, I.; Cho, H.; Kang, K.I. Early-warning performance monitoring system (EPMS) using the business information of a project. Int. J. Proj. Manag. 2018, 36, 730–743. [Google Scholar] [CrossRef]
  3. Lim, H.; Seo, J.; Yoo, W.S.; Kim, C.W. Critical impact factors affecting the performance of domestic construction projects through megatrend analysis. J. Korean Inst. Build. Constr. 2022, 22, 207–218. [Google Scholar]
  4. Kim, C.W.; Yoo, W.S.; Park, H.T. Development Direction of Performance Assessment System based on Building Supervision using Digital Technology. Build. Constr. 2022, 22, 16–21. [Google Scholar]
  5. Kim, C.W.; Yoo, W.S.; Lim, H. Priority analysis for applying digital technology to improve the efficiency of building supervision work. J. Korean Inst. Build. Constr. 2023, 23, 93–102. [Google Scholar]
  6. Kim, C.W. Development of Diagnostic Performance Index for Domestic Construction Projects. Ph.D. Thesis, Korea University, Seoul, Republic of Korea, 2017. [Google Scholar]
  7. Chandanshive, V.; Kambekar, A.R. Estimation of building construction cost using artificial neural networks. J. Soft Comput. Civ. Eng. 2019, 3, 91–107. [Google Scholar]
  8. Chakraborty, D.; Elhegazy, H.; Elzarka, H.; Gutierrez, L. A novel construction cost prediction model using hybrid natural and light gradient boosting. Adv. Eng. Inform. 2020, 46, 101201. [Google Scholar] [CrossRef]
  9. Kang, Y.H.; Yun, S.H. Analysis of the construction cost prediction performance according to feature scaling and long conversation of target variables. J. Korean Inst. Build. Constr. 2022, 22, 317–326. [Google Scholar]
  10. Jeong, S.-Y. Analysis on the characteristics of construction practice information using text mining: Focusing on information such as construction technology, cases, and cost Reduction. J. Korean Soc. Libr. Inf. Sci. 2022, 56, 205–222. [Google Scholar]
  11. Leu, S.S.; Liu, Y.; Wu, P.L. Project cost overrun risk prediction using Hidden Markov chain Analysis. Buildings 2023, 13, 667. [Google Scholar] [CrossRef]
  12. Ibrahim, A.; Zayed, T.; Lafhaj, Z. Enhancing construction performance: A critical review of performance measurement practices at the project level. Buildings 2024, 14, 1988. [Google Scholar] [CrossRef]
  13. Yalçın, G.; Bayram, S.; Çıtakoğlu, H. Evaluation of Earned Value Management-Based Cost Estimation via Machine Learning. Buildings 2024, 14, 3772. [Google Scholar] [CrossRef]
  14. Ateş, B.; Eirgash, M.A. Proactive and Data-Driven Decision-Making Using Earned Value Analysis in Infrastructure Projects. Buildings 2025, 15, 2388. [Google Scholar] [CrossRef]
  15. Kim, J.-S. AI-powered forecasting of environmental impacts and construction costs to enhance project management in highway projects. Buildings 2025, 15, 2546. [Google Scholar] [CrossRef]
  16. Seo, J.; Kim, B.; Yang, J.; Park, H.; Kim, C.W. An environmental performance estimation model for architectural projects using unstructured data from construction supervision documents. J. Korean Inst. Build. Constr. 2024, 24, 697–705. [Google Scholar]
  17. Kim, C.W.; Yoo, W.S.; Seo, J.; Kim, B.G.; Lim, H. A roadmap for applying digital technology to improve the efficiency of construction supervision in building projects: Focusing on Korean cases. Buildings 2023, 14, 75. [Google Scholar] [CrossRef]
  18. Kim, C.W.; Song, T.; Lee, K.; Yoo, W.S. Cost performance evaluation framework through analysis of unstructured construction supervision documents using binomial logistic regression. J. Korean Inst. Build. Constr. 2024, 24, 121–131. [Google Scholar]
  19. Ministry of Land, Infrastructure and Transport. Building Act. Available online: https://www.law.go.kr/법령/건축법 (accessed on 12 August 2025).
  20. Ministry of Land, Infrastructure and Transport. Housing Act. Available online: https://www.law.go.kr/법령/주택법 (accessed on 12 August 2025).
  21. Ministry of Land, Infrastructure and Transport. Construction Technology Promotion Act. Available online: https://www.law.go.kr/법령/건설기술진흥법 (accessed on 12 August 2025).
  22. Ministry of Trade, Industry and Energy. Electrical Construction Business Act. Available online: https://www.law.go.kr/법령/전기공사업법 (accessed on 12 August 2025).
  23. National Fire Agency. Firefighting System Installation Business Act. Available online: https://www.law.go.kr/법령/소방시설공사업법 (accessed on 12 August 2025).
  24. Ministry of Science and ICT. Information and Communication Construction Business Act. Available online: https://www.law.go.kr/법령/정보통신공사업법 (accessed on 12 August 2025).
  25. Ministry of Land, Infrastructure and Transport. Notice on Detailed Standards for Building Supervision. Available online: https://www.law.go.kr/행정규칙/건축공사감리세부기준 (accessed on 12 August 2025).
  26. Aragao, R.; El-Diraby, T.E. Network analytics and social BIM for managing project unstructured data. Autom. Constr. 2021, 122, 103512. [Google Scholar] [CrossRef]
  27. Punia, S.K.; Kumar, M.; Stephan, T.; Deverajan, G.G.; Patan, R. Performance analysis of machine learning algorithms for big data classification: Ml and ai-based algorithms for big data analysis. Int. J. E-Health Med. Commum. 2021, 12, 60–75. [Google Scholar] [CrossRef]
  28. Xu, X.; Casasayas, O.; Wang, J.; Mao, P.; Cui, P. Stakeholder-associated impact factors of building energy performance gap and their intersections: A social network analysis. J. Clean. Prod. 2022, 370, 133228. [Google Scholar] [CrossRef]
  29. Al-Surmi, A.; Bashiri, M.; Koliousis, I. AI based decision making: Combining strategies to improve operational performance. Int. J. Prod. Res. 2022, 60, 4464–4486. [Google Scholar] [CrossRef]
  30. Pan, Y.; Zhang, L. Integrating BIM and AI for smart construction management: Current status and future directions. Arch. Comput. Methods Eng. 2023, 30, 1081–1110. [Google Scholar] [CrossRef]
  31. Ali, Z.; Saad, S.; Rasheed, K.; Ammad, S. AI Future Perspectives and Trends in Construction. In *AI in Material Science: Revolutionizing Construction. In *AI in Material Science: Revolutionizing Construction in the Age of Industry 4.0*; Saad, S., Ammad, S., Rasheed, K., Eds.; CRC Press: Boca Raton, FL, USA, 2024; pp. 239–261. [Google Scholar] [CrossRef]
  32. Construction Association of Korea. Annual Contract Amount by Ordering Agency, Construction Scales, and Construction Project Type in Korea (2013–2023). Available online: https://www.cak.or.kr/lay1/S1T39C246/contents.do (accessed on 13 August 2025).
  33. Chung, H.M.; Gray, P. Special Section: Data Mining. J. Manag. Inf. Syst. 1999, 16, 11–16. [Google Scholar] [CrossRef]
  34. Jackson, J. Data mining; a conceptual overview. Commun. Assoc. Inf. Syst. 2022, 8, 19. [Google Scholar] [CrossRef]
  35. Agrawal, R.; Imieliński, T.; Swami, A. Mining association rules between sets of items in large databases. In Proceedings of the 1993 ACM SIGMOD International Conference on Management of Data, Washington, DC, USA, 25–28 May 1993. [Google Scholar]
  36. Jang, S.R.; Kim, H.S. Association rules analysis between the types and causes of disputes in construction projects. Korean J. Constr. Eng. Manag. 2022, 23, 3–14. [Google Scholar]
  37. Park, H.; Lee, M.; Hwang, S.; Oh, S. TF-IDF based association rule analysis system for medical data. KIPS Trans. Softw. Data Eng. 2016, 5, 145–154. [Google Scholar] [CrossRef]
  38. Kim, Y.; Kim, J.; Kim, C.; Kim, K.J. Cryptocurrency recommendation model using the similarity and association rule mining. J. Intell. Inf. Syst. 2022, 28, 287–308. [Google Scholar]
  39. Ryu, J.H.; You, Y.Y. The Fourth Industrial Revolution core technology association analysis using text mining. J. Digit. Converg. 2018, 16, 129–136. [Google Scholar]
  40. Son, K.Y.; Ryu, H.G. Association rules analysis of safe accidents caused by falling objects. J. Korean Inst. Build. Constr. 2019, 19, 341–350. [Google Scholar]
  41. Tan, P.N.; Steinbach, M.; Kumar, V. Introduction to Data Mining; Pearson Addison-Wesley: New Delhi, India, 2016. [Google Scholar]
  42. Park, Y.; Lee, D.; Kim, J. A Study on the Task Variation and Social Network Analysis in the Construction Process. Korean J. Constr. Eng. Manag. 2019, 20, 105–113. [Google Scholar]
  43. Breiman, L. Random forests. Mach. Learn. 2001, 45, 5–32. [Google Scholar] [CrossRef]
  44. Probst, P.; Wright, M.N.; Boulesteix, A.L. Hyperparameters and tuning strategies for random forest. WIREs Data Min. Knowl. 2019, 9, e1301. [Google Scholar] [CrossRef]
  45. Hastie, T.; Tibshirani, R.; Friedman, J. The Elements of Statistical Learning; Springer Series in Statistics; Springer: New York, NY, USA, 2009. [Google Scholar]
  46. Breiman, L. Bagging predictors. Mach. Learn. 1996, 24, 123–140. [Google Scholar] [CrossRef]
  47. Scikit-Optimize. Available online: https://scikit-optimize.github.io/stable/modules/generated/skopt.BayesSearchCV.html (accessed on 13 August 2025).
  48. Díaz-Uriarte, R.; Alvarez de Andrés, S. Gene selection and classification of microarray data using random forest. BMC Bioinform. 2006, 7, 3. [Google Scholar] [CrossRef]
  49. Genuer, R.; Poggi, J.M.; Tuleau-Malot, C. Variable selection using random forests. Pattern Recognit. Lett. 2010, 31, 2225–2236. [Google Scholar] [CrossRef]
  50. Daviran, M.; Maghsoudi, A.; Ghezelbash, R.; Pradhan, B. A new strategy for spatial predictive mapping of mineral prospectivity: Automated hyperparameter tuning of random forest approach. Comput. Geosci. 2021, 148, 104688. [Google Scholar] [CrossRef]
  51. Choi, Y.; Yoon, D.; Choi, J.; Byun, J. Hyperparameter search for facies classification with bayesian optimization. Geophys. Geophys. Explor. 2020, 23, 157–167. [Google Scholar]
  52. Brochu, E.; Cora, V.M.; De Freitas, N. A tutorial on Bayesian optimization of expensive cost functions, with application to active user modeling and hierarchical reinforcement learning. arXiv 2010, arXiv:1012.2599. [Google Scholar] [CrossRef]
  53. Park, E.L.; Cho, S. KoNLPy: Korean natural language processing in Python. In Proceedings of the 26th Annual Conference on Human & Cognitive Language Technology, Chuncheon, Republic of Korea, 10 October 2014. [Google Scholar]
  54. Estrepo, J.P.; Rivera, J.C.; Laniado, H.; Osorio, P.; Becerra, O.A. Nonparametric generation of synthetic data using copulas. Electronics 2023, 12, 1601. [Google Scholar] [CrossRef]
  55. Aguirre, J.; Yu, J.Y.; Jung, K.; Yoon, J.; Cha, W.C. Computationally efficient and stable real-world synthetic emergency room electronic health record data generation: High similarity and privacy preserving diffusion model approach. Precis. Future Med. 2024, 8, 92–104. [Google Scholar] [CrossRef]
  56. Zheng, S.; Cheng, G.; Guo, J.; Zhu, H. Test for high-dimensional correlation matrices. Ann. Stat. 2019, 47, 2887–2921. [Google Scholar] [CrossRef] [PubMed]
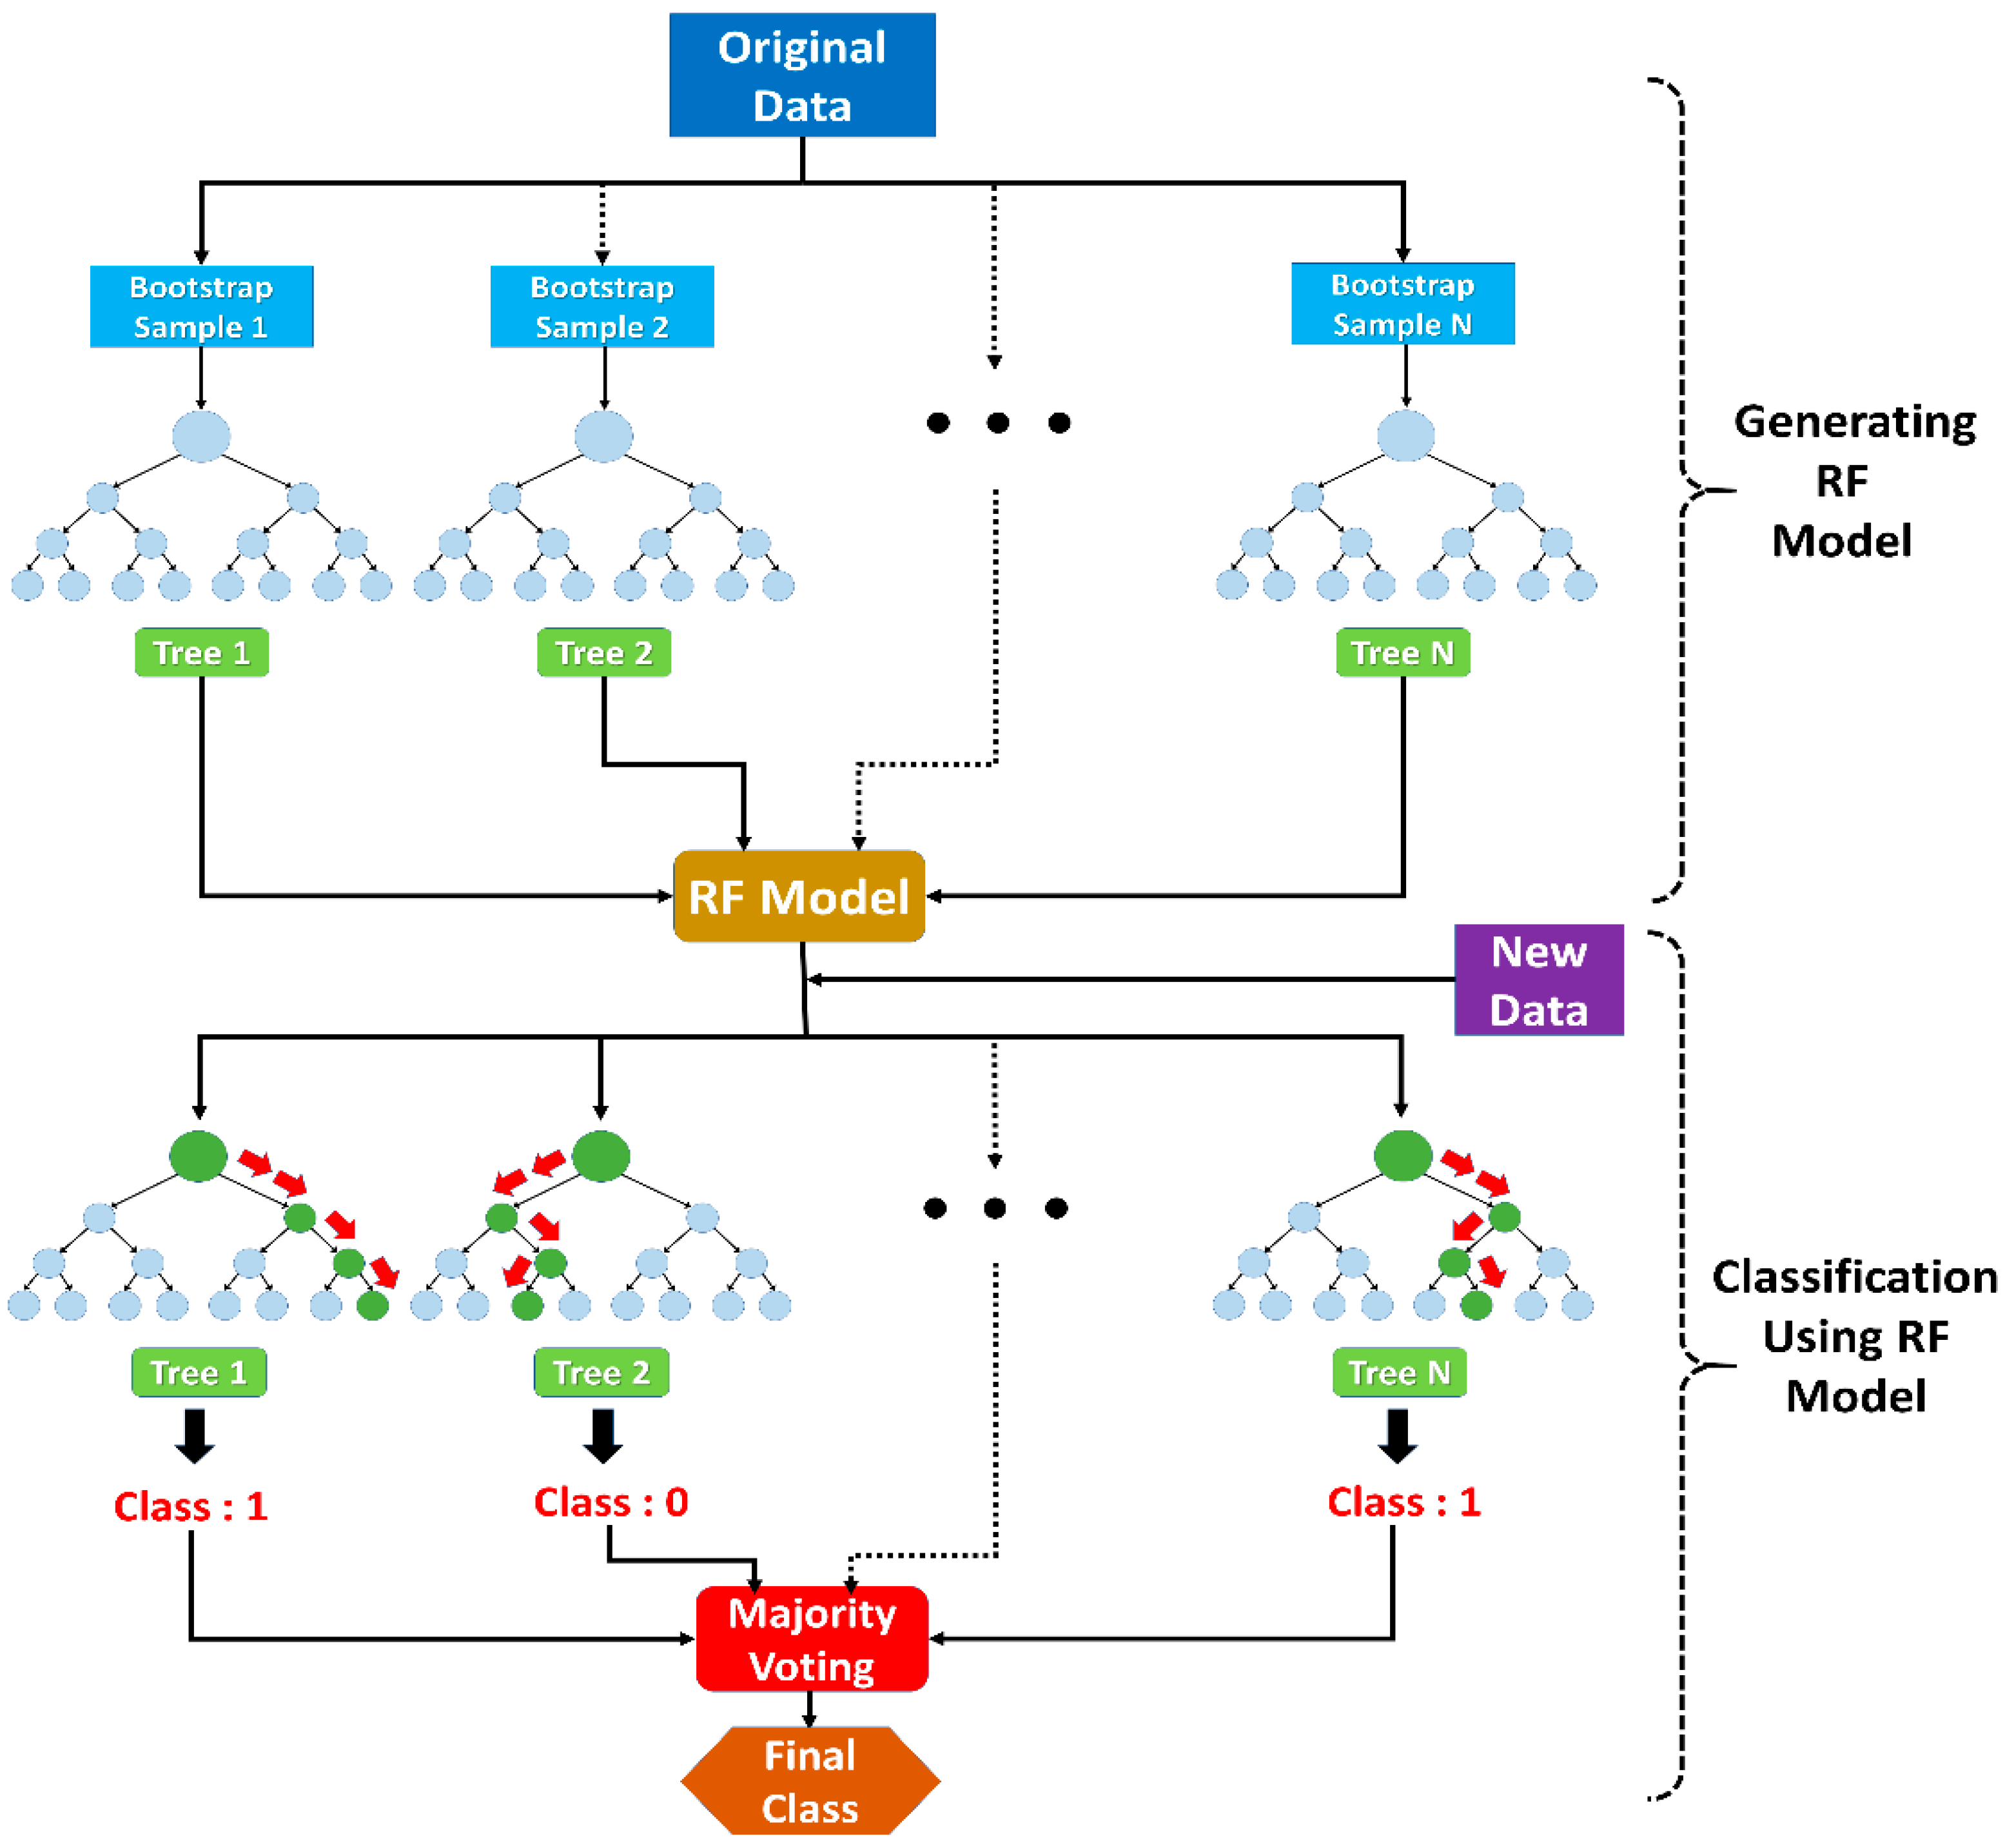
Figure 1. Model creation and classification process using RF.
Buildings 15 03799 g001
Figure 2. Results of network analysis between keywords using SNA.
Buildings 15 03799 g002
Figure 3. Bayesian optimization-based hyper-parameter tuning results and average prediction accuracy: (a) maximum depth of the tree and the maximum number of features; (b) minimum number of samples of leaf nodes and node spilt; (c) number of trees and mean accuracy score.
Buildings 15 03799 g003aBuildings 15 03799 g003b
Figure 4. Calculation results of the importance by independent variables using RF.
Buildings 15 03799 g004
Figure 5. Confusion ratio matrix and ROC curve of RF model.
Buildings 15 03799 g005
Figure 6. Operational concept of a proposed evaluation framework.
Buildings 15 03799 g006
Table 1. Contract statistics for Korean construction (average from 2013 to 2023).
Project TypeNumber of ContractsAmount of Contracts
Each Ratio (%)Billion USDRatio (%)
Architectural50,321647772
Civil infrastructure23,705302019
Industrial facility1243277
Landscape3134422
Total78,403100106100
Table 2. Kolmogorov–Smirnov (KS) test results between original and augmented dataset.
VariablesKS Statisticsp-Value
Cost performance0.19330.0980
Review0.15620.2745
Plan0.14350.3702
Process0.18130.1404
Management0.12040.1401
Change0.15330.1115
In advance0.12110.5823
Safety0.13650.4316
Materials0.10050.7947
Inspection0.18030.1441
Quality0.12050.5883
Table 3. Results of deriving high-frequency keywords using ARA.
Rule No.Antecedent EventConsequent EventSupportConfidenceLift
1QualityManagement0.160.661.36
2ProcessManagement0.120.671.38
3PlanManagement0.120.581.20
4SafetyManagement0.120.681.41
5ConstructionManagement0.110.561.15
6MaterialsManagement0.090.611.25
7PlanQuality0.090.411.71
8MaterialsQuality0.080.522.15
9CheckPlan0.070.492.38
10TestQuality0.070.793.26
11ConfirmationQuality0.070.451.84
12SecureQuality0.060.843.47
13ConstructionQuality0.060.321.30
14CheckConstruction0.060.392.03
15InspectionSafety0.060.442.56
16OccurrenceManagement0.050.531.10
17AdvancePlan0.050.482.30
18ProcessQuality0.050.281.15
19ConfirmationConstruction0.050.321.65
20TestManagement0.050.571.17
21ProcessPlan0.050.261.28
22ConstructionPlan0.050.241.18
23CheckQuality0.040.311.29
24CompletionManagement0.040.531.10
25ProgressProcess0.040.402.20
26CheckConfirmation0.040.291.94
27ConfirmationPlan0.040.281.34
28FinishManagement0.040.521.06
29InspectionPlan0.040.331.61
30OperationMaterials0.040.563.76
Table 4. Descriptive statistics of independent and dependent variables for 39 datasets.
VariableAverage1st
Quartile
Median3rd
Quartile
MaxStandard
Deviation
KurtosisSkewness
Cost performance101.595.8103.3108.5137.916.511.8−2.3
Review6.435.39.316.74.8−0.30.7
Plan7.85.27.89.826.153.61.0
Process9.45.68.110.830.26.14.51.9
Management26.521.623.329.460.08.55.92.0
Change4.20.01.55.248.08.321.44.2
In advance3.41.43.25.77.22.6−1.40.1
Safety8.45.49.310.520.64.11.00.2
Materials7.64.97.410.822.45.20.40.4
Inspection5.10.03.910.415.84.9−1.30.4
Quality11.58.211.713.929.25.42.40.6
Table 5. Accuracy comparison of traditional LR, constrain-based BLR, and RF models.
Traditional LRConstrain-Based BLRRF
Accuracy of Models0.590.740.76
Table 6. Application results of RF model with 5 projects.
Project No.ReviewPlanProcessManagementChangeIn AdvanceSafetyMaterialsInspectionQualityActual Cost PerformancePredicted Cost PerformanceVote Class 0Vote Class 1
13.77.411.137.00.03.714.83.73.711.1110.420.58
20.00.027.827.816.70.05.60.00.05.6000.600.40
310.35.29.321.63.17.29.36.22.116.5010.100.90
414.36.36.322.23.23.29.59.51.612.7110.170.83
54.29.75.622.20.05.69.712.511.113.9110.120.88
Disclaimer/Publisher’s Note: The statements, opinions and data contained in all publications are solely those of the individual author(s) and contributor(s) and not of MDPI and/or the editor(s). MDPI and/or the editor(s) disclaim responsibility for any injury to people or property resulting from any ideas, methods, instructions or products referred to in the content.