Article

Interface Design, Visual Comfort, and Safety Perception: An Empirical Study of Spatial Lighting Environments in Subway Systems

1
School of Architecture and Design, China University of Mining and Technology, Xuzhou 221000, China
2
Executive Dean, Institute of Sustainable Design, China University of Mining and Technology, Xuzhou 221000, China
*
Author to whom correspondence should be addressed.
Buildings 2025, 15(20), 3796; https://doi.org/10.3390/buildings15203796
Submission received: 12 September 2025 / Revised: 15 October 2025 / Accepted: 17 October 2025 / Published: 21 October 2025
(This article belongs to the Section Building Energy, Physics, Environment, and Systems)

Abstract

The rapid expansion of metro systems has exacerbated lighting-related issues, including uneven illuminance, glare, and blind spots. These issues compromise passenger visual comfort and perceived safety. Previous research has predominantly focused on individual lighting parameters, paying little attention to the combined effects of multiple factors. Perceived safety is a core objective in metro space design and is particularly susceptible to adverse visual environments. This study uses field measurements, virtual environment simulations, and eye tracking experiments to investigate the influence of lighting conditions and interface design (ceiling height and material) on visual comfort and perceived safety. The findings indicate that light-coloured, low-reflectance materials enhance visual guidance, whereas dark, high-reflectance surfaces induce frequent gaze shifts and diminish perceived safety. The optimal environmental benchmark parameters were illuminance levels of 140–270 lux and a correlated color temperature (CCT) of 4428–6250 K. This study also discusses optimizing interface design parameters in different spatial contexts. It also revealed systematic correlations between lighting parameters and spatial geometry, particularly regarding ceiling height. Elevated spaces require increased illuminance and color temperature to compensate for light attenuation, while areas with low ceilings necessitate reduced lighting intensity and warmer color temperatures to mitigate oppressive sensations. This evidence provides a human-centered theoretical foundation for lighting design in underground transport spaces.

1. Introduction

With urban rail transit incorporated into China’s 14th Five-Year Plan for new urbanization and the national strategy for building a strong transportation network, the subway—an archetypal high-density underground public space—has become a critical focus of environmental design. Its lighting environment not only shapes passengers’ comfort experience [1,2] but also directly affects spatial orientation, pathfinding, and reaction speed [3]. Furthermore, according to the “prospect–refuge principle” in environmental psychology, glare, unstable visual focus, blind spots [4,5], and pronounced spatial compression can undermine passengers’ sense of safety by disrupting their fundamental need for clear views and spatial security [6,7,8,9]. However, existing research and practice have primarily emphasized the optimization of technical lighting parameters or the impact of isolated visual factors, with limited exploration of how lighting conditions and interface materials interact to influence comfort and perceived safety in subway environments. Multiple elements in human–environment interactions jointly shape perceptions of visual comfort and safety. As the physical carrier of light, architectural space—particularly ceiling height—can directly or indirectly alter lighting distribution, influencing comfort and safety perception [10]. Meanwhile, the reflective properties of the interface material may amplify or diminish the effectiveness of lighting parameters [11]. Thus, focusing on a single factor is insufficient to fully and accurately reveal the underlying mechanisms of visual comfort in subway lighting environments. From a methodological standpoint, little attention has been given to quantitative analyses of visual behavior patterns, such as natural gaze paths and eye movement trajectories. As a result, the current understanding of how lighting parameters influence visual comfort and perceived safety remains reliant mainly on subjective judgment, making it difficult to precisely capture the complex interactions among humans, light, and space, and ultimately constraining the evidence base for precise and human-centered subway design.
Therefore, this study focuses on subway public spaces as the research context, taking interface design—specifically, ceiling height and interface material—as the core dimensions of analysis. Ceiling height, as a critical indicator of underground spatial form, not only directly influences passengers’ psychological perception of spatial pressure [12] but also indirectly regulates visual comfort by altering light reflection paths and illuminance distribution [13]. Meanwhile, prior studies have confirmed that underground spatial morphology significantly affects individual perception and behavior [14]. Building on these insights, this study employs a “subjective questionnaire–eye-tracking” approach to integrate subjective and objective data within a conceptual framework of “interface design–visual comfort–perceived safety”. By combining eye-movement metrics with subjective evaluations, this research seeks to uncover the synergistic mechanisms of multiple parameters. The findings are expected to contribute to advancing research on multi-factor interactions and provide scientific evidence for theoretical support for optimizing lighting design in subway spaces.

1.1. Related Research on Light Environment Design

As a core factor influencing spatial comfort, the light environment has garnered considerable research efforts with established outcomes [15]. Xu et al. (2019) developed an evaluation system named LES 1.0 for the light environment in subway carriages based on Dialux virtual simulation technology [16]. Constructing a three-dimensional evaluation model encompassing “visual comfort-functional adaptability-safety perception” provides digital decision-making support for subway lighting design [16]. In 2023, Xiaohui D. et al. combined eye tracking with subjective evaluations to investigate the effects of color temperature and illuminance on learning motivation and psychological perception [13]. Furthermore, visual comfort is influenced not only by the light environment. Nevertheless, it is also closely related to the physical attributes of the space: Pan Liao et al. (2025) investigated the impact of subway station hall scale on visual comfort using eye-tracking devices [17]. Xiangmin G et al. (2022) built an assessment model for the dynamic visual attraction of commercial streets using virtual reality (VR) and eye-tracking perception technology, proving that spatial form affects human perception [18]. Through VR experiments, Gao X et al. (2025) compared the effects of enclosed, semi-open, and open space types on psychological perception [19].
Meanwhile, light environment research has shifted from single-factor analysis to collaborative optimization of multiple parameters. Hu X et al. (2023) explored the synergistic mechanism of temperature and illuminance on work efficiency through summer field measurements and questionnaires in subway stations [20]. Iacomussi P et al. (2015) investigated the effects of LED light illuminance and correlated CCT parameters on different scenarios, proposing a comfort threshold model for dynamic lighting scenes [21]. Shi L et al. (2022) assessed athletes’ visual comfort in gymnasiums using a method that integrates subjective and objective measures, innovatively proposing a two-dimensional evaluation system of “dynamic threshold-emotion regulation” [22].
Building upon the research above, and combined with the principal component analysis results presented later—which identify “light physical characteristic factor,” “spatial scale factor,” and “interface material factor” as the core factors influencing visual perception—this study investigates the synergistic mechanism between “interface design (ceiling height and interface material)” and “light parameters.” It explores the compound effects of these elements on crowd visual comfort and perceived safety, thereby supporting the optimized design of metro public spaces.

1.2. Subjective and Objective Research Methods for Visual Perception

Traditional assessments of visual perception correlations have predominantly relied on subjective questionnaires, lacking objective quantitative analysis of passengers’ visual behaviors. This limitation has confined related research largely to the level of empirical judgment. With advancements in the field, contemporary studies increasingly adopt approaches integrating physiological data with subjective measures [23,24,25]. For instance, Wang J et al. (2024) [24] conducted experiments using optical see-through AR devices to quantitatively analyze the impact of ambient light intensity, virtual target brightness, and shadow models on depth perception. In 2024, Gao et al. [25] investigated the relationship between visual attention, spatial elements, and visitor behavior in garden environments. This study utilized eye-tracking technology and VR modeling. Fan et al. (2021) [26] proposed an HSB (Hue, Saturation, Brightness) color attribute-based model for evaluating stereoscopic visual comfort in VR/AR. By analyzing the effects of binocular color difference on 300 subjects, they found that saturation and brightness contributed the most to discomfort, while hue had an insignificant impact. The constructed HSB-VC model achieved an 89% accuracy in predicting discomfort when the color difference exceeded 15ΔE, providing a quantitative basis for optimizing VR/AR content. Furthermore, Du X et al. (2023) [13] simulated three light environments in university professional classrooms using virtual reality technology. Their experiment confirmed that virtual scenes can effectively replicate the visual perception characteristics of real light environments, offering methodological support for parametric experimental design in metro spaces.
In summary, the development of perceptual measurement technologies, such as eye tracking [27,28,29], has enabled the quantification of spatial experience research, driving a shift toward constructing quantitative strategies based on empirical data. Grounded in this progress, this study takes visual perception as the entry point and adopts a research path that combines subjective and objective data. It systematically investigates the impact of composite factors within metro spaces—particularly the moderating role of physical elements—on crowd visual perception. It aims to provide a theoretical basis and practical guidance for the optimized design of metro light environments.

2. Materials and Methods

2.1. Selection of Study Subjects

This study selected Shanghai and Xuzhou as the core cities for field investigation. With its mature and extensive metro network, Shanghai represents the design characteristics of early construction phases (Figure 1). In contrast, as an emerging metro city, Xuzhou reflects standardized and modular design concepts Therefore, combining these locations ensures high typicality and representativeness for the experimental samples. Considering that interface materials and spatial dimensions comprehensively influence the light environment, this study chose representative metro stations from both Shanghai and Xuzhou, enhancing the persuasiveness and generalizability of the experimental conclusions.

2.2. Survey Data and Analysis

2.2.1. Field Survey Data

The survey covered over 90 stations from Shanghai Metro Lines 1, 2, 4, 9, 11, 12, 14, and 15, as well as Xuzhou Metro Lines 1, 2, and 3. The investigation focused on two core functional spaces—station concourses and platforms—and systematically measured three categories of key parameters: firstly, spatial dimension parameters including length, width, and height; secondly, core light environment parameters such as illuminance and CCT; and thirdly, interface characteristic parameters involving material, color attributes, and decorative style of spatial interfaces. Professional equipment, including laser distance and illuminance meters, was used during data collection to obtain objective quantitative data. At the same time, on-site photography was simultaneously employed to record spatial morphological details, ensuring informational completeness. Measurements of artificial lighting elements were conducted per the relevant specifications for transportation building lighting outlined in the “Methods for Lighting Measurement,” with the ground uniformly serving as the height reference for illuminance measurement points. Data rationality was further validated against standard values in the “Urban Rail Transit Lighting Standards” (GB/T 16275-2008) [30]. A database containing 86 valid samples was established, providing robust data support for subsequent research.

2.2.2. Visual Perception Questionnaire for Metro Public Spaces

Building upon the field survey, this study conducted a questionnaire to obtain passengers’ subjective evaluations of the visual environment within metro spaces. The questionnaire utilized a Likert scale and established an evaluation index system centered around five dimensions: lighting environment, spatial scale, interface materials, color scheme, and decorative art. Through pilot testing and formal surveying, 37 valid questionnaires were collected and tested for reliability, indicating good internal consistency. Furthermore, principal component analysis was employed to extract three core factors: the “Light Physical Characteristic Factor” (loadings 0.529–0.839), the “Spatial Scale Factor” (loadings 0.656–0.837), and the “Interface Material Factor” (loadings 0.697–0.786). These results provided a basis for selecting experimental variables in subsequent research.

2.3. Virtual Reality Experiment and Eye-Tracking

2.3.1. Construction of Typical Scenes

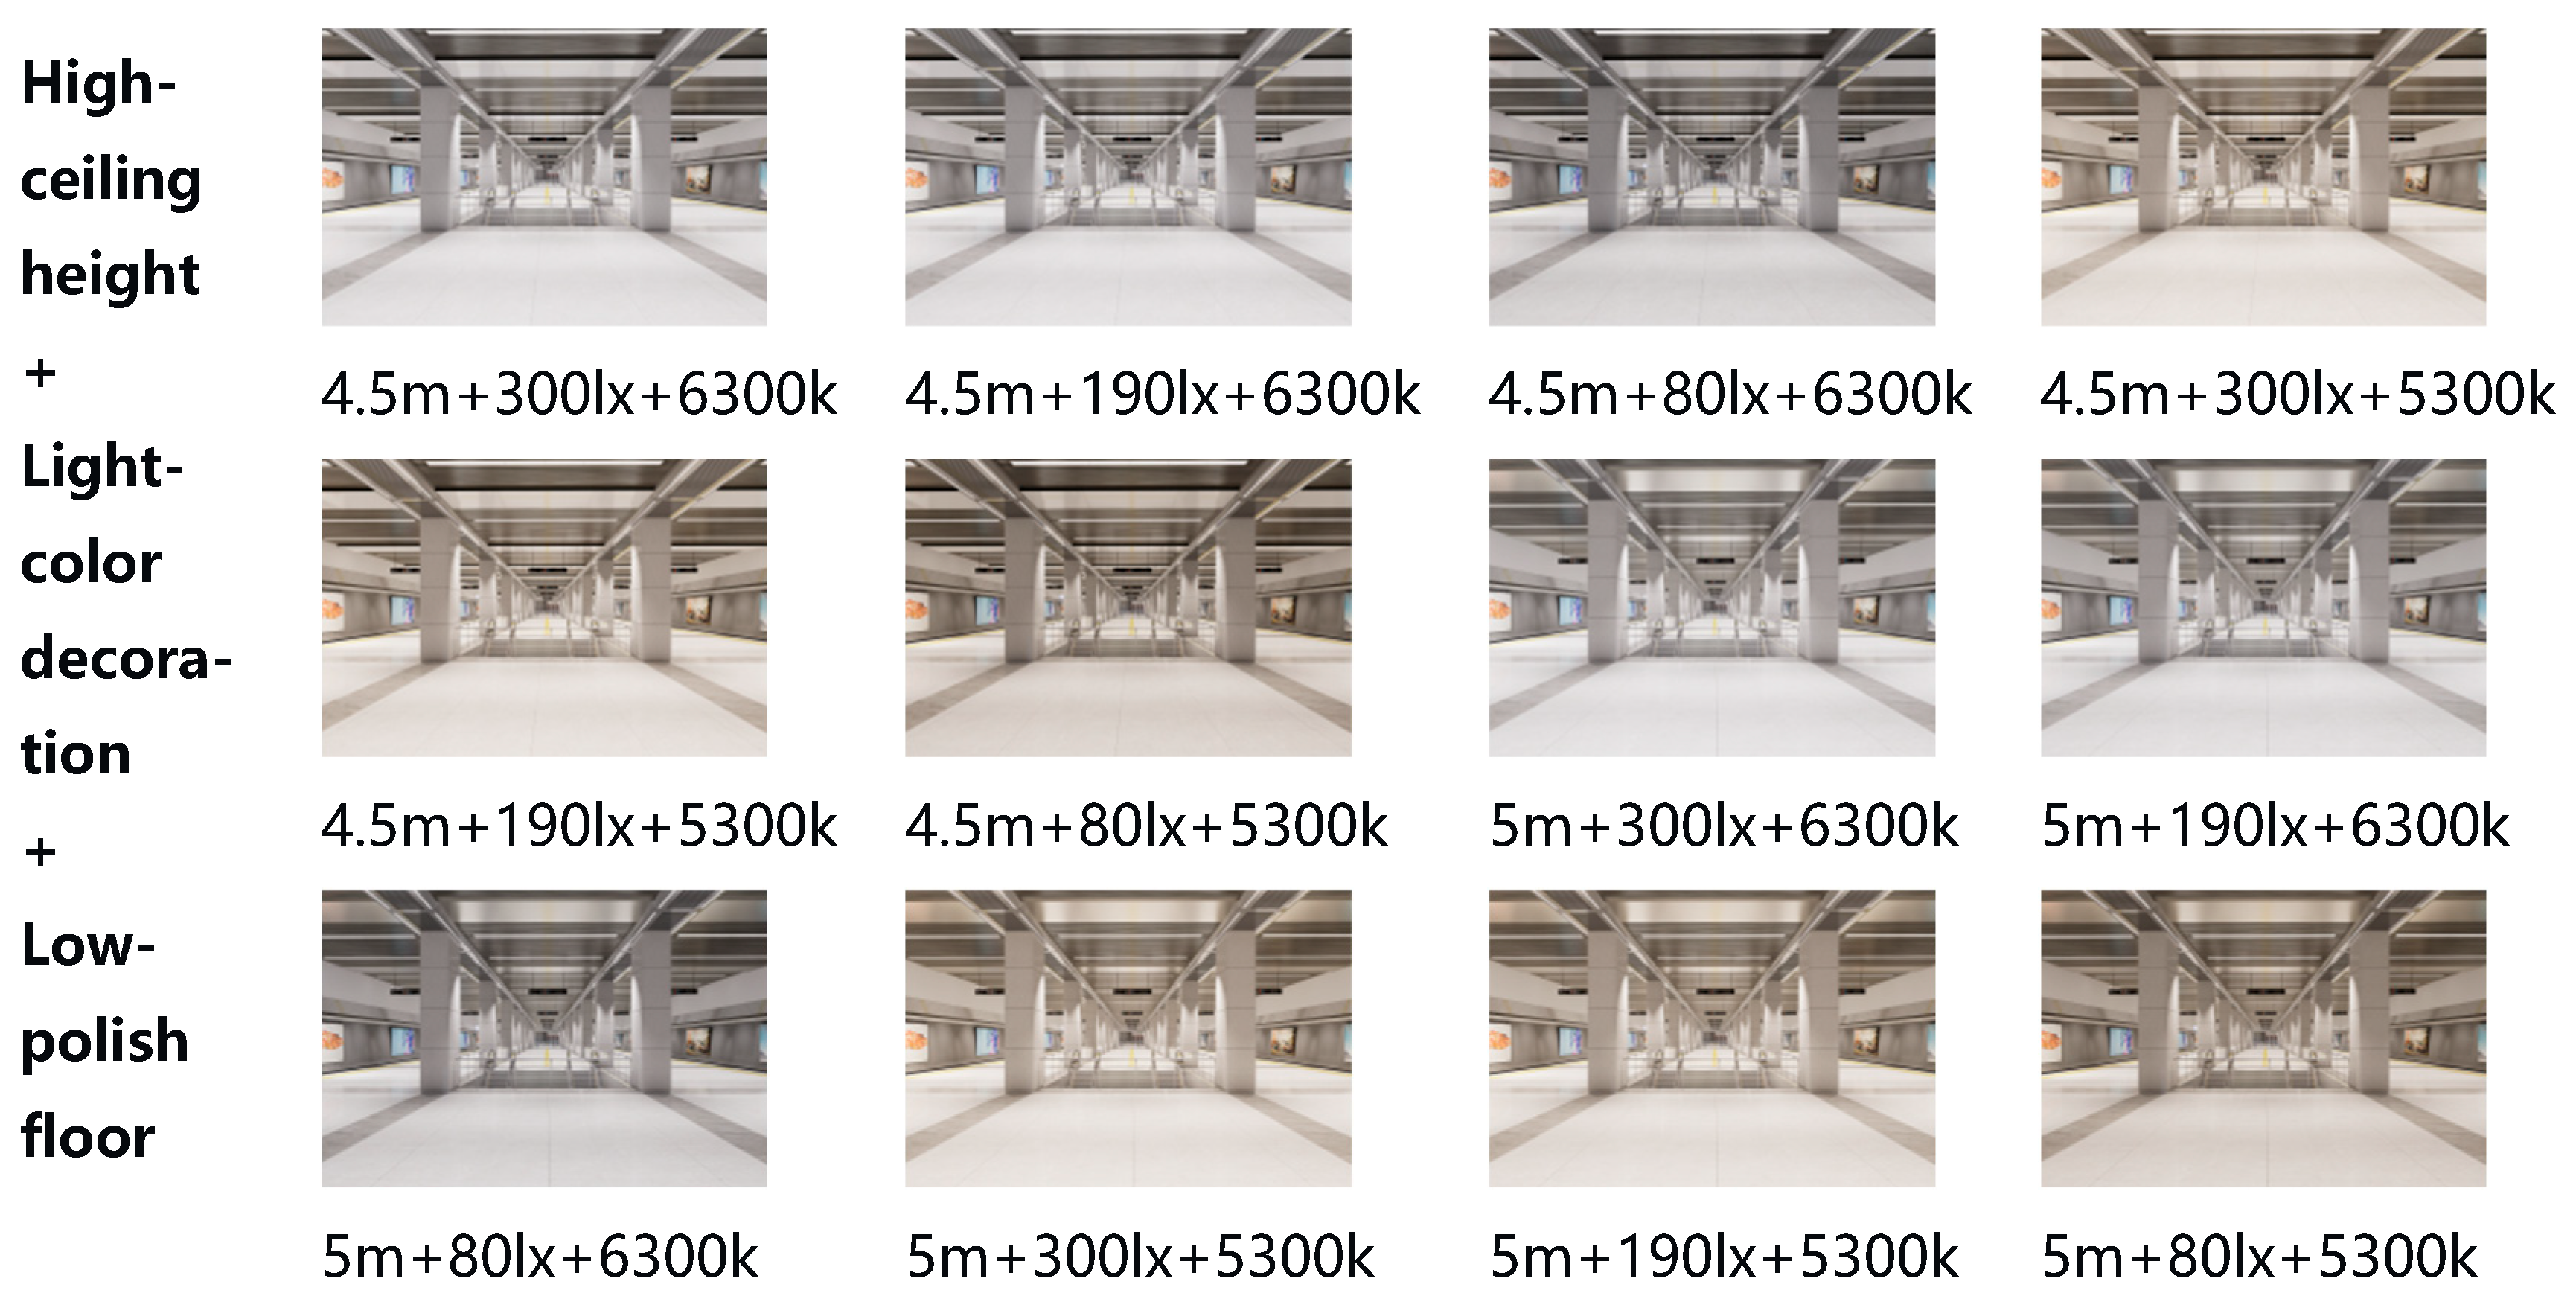
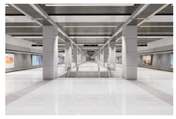
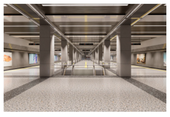
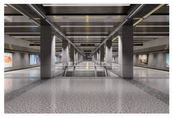
Based on the interface design parameters, photometric parameters, and visual perception influencing factors identified in the preliminary research, a K-means clustering algorithm was applied to 86 sample stations. The aim was to categorize the sample data into groups with high internal similarity and significant external differences, extracting parameters for typical models. After data standardization and the removal of outliers, four types of virtual scenes based on interface material combinations were formed: light-color decoration + low-polish floor, light-color decoration + high-polish floor, dark-color decoration + low-polish floor, and dark-color decoration + high-polish floor. Building upon the clustering results and incorporating the “ceiling height-light environment” grouping, parameter combinations were created using fixed typical concourse dimensions (length: 95.7 m, width: 22.6 m) alongside variables of ceiling height (low: 4.5 m/high: 5 m), illuminance (80 lx/190 lx/300 lx), and CCT (4300 K/5300 K/6300 K). Ultimately, 40 virtual scene models were constructed, systematically encompassing the characteristics of light environment parameters under different interface designs, thus providing a foundation for the virtual reality experiments (Figure 2).

2.3.2. Experimental Procedure and Data Collection

The experiment recruited 36 healthy participants (18 males and 18 females) aged 20–35, all with normal or corrected vision. The virtual reality environment was presented using an HTC Vive Pro head-mounted display, featuring a combined binocular resolution of 2880 × 1600 pixels, a refresh rate of 120 Hz, and a field of view of 110°. Eye-tracking data were collected at a sampling rate of 120 Hz. A nine-point calibration procedure was performed for every participant before each experimental session to ensure tracking accuracy. To mitigate the effects of fatigue on data stability, participants were divided into two batches of 18 individuals, each session lasting no longer than 40 min. The experiment employed a randomized presentation paradigm, displaying 40 virtual scenes in a completely random order. Each scene was viewed for 15 s while simultaneously collecting objective eye-tracking data, including total fixation duration, blink count, saccade count, pupil diameter fluctuations, and eye trajectory maps. Immediately after each scene presentation, participants provided subjective evaluations across six dimensions: spatial brightness perception, warmth perception, spatial sense, openness perception, sense of security, and comfort level.

3. Results

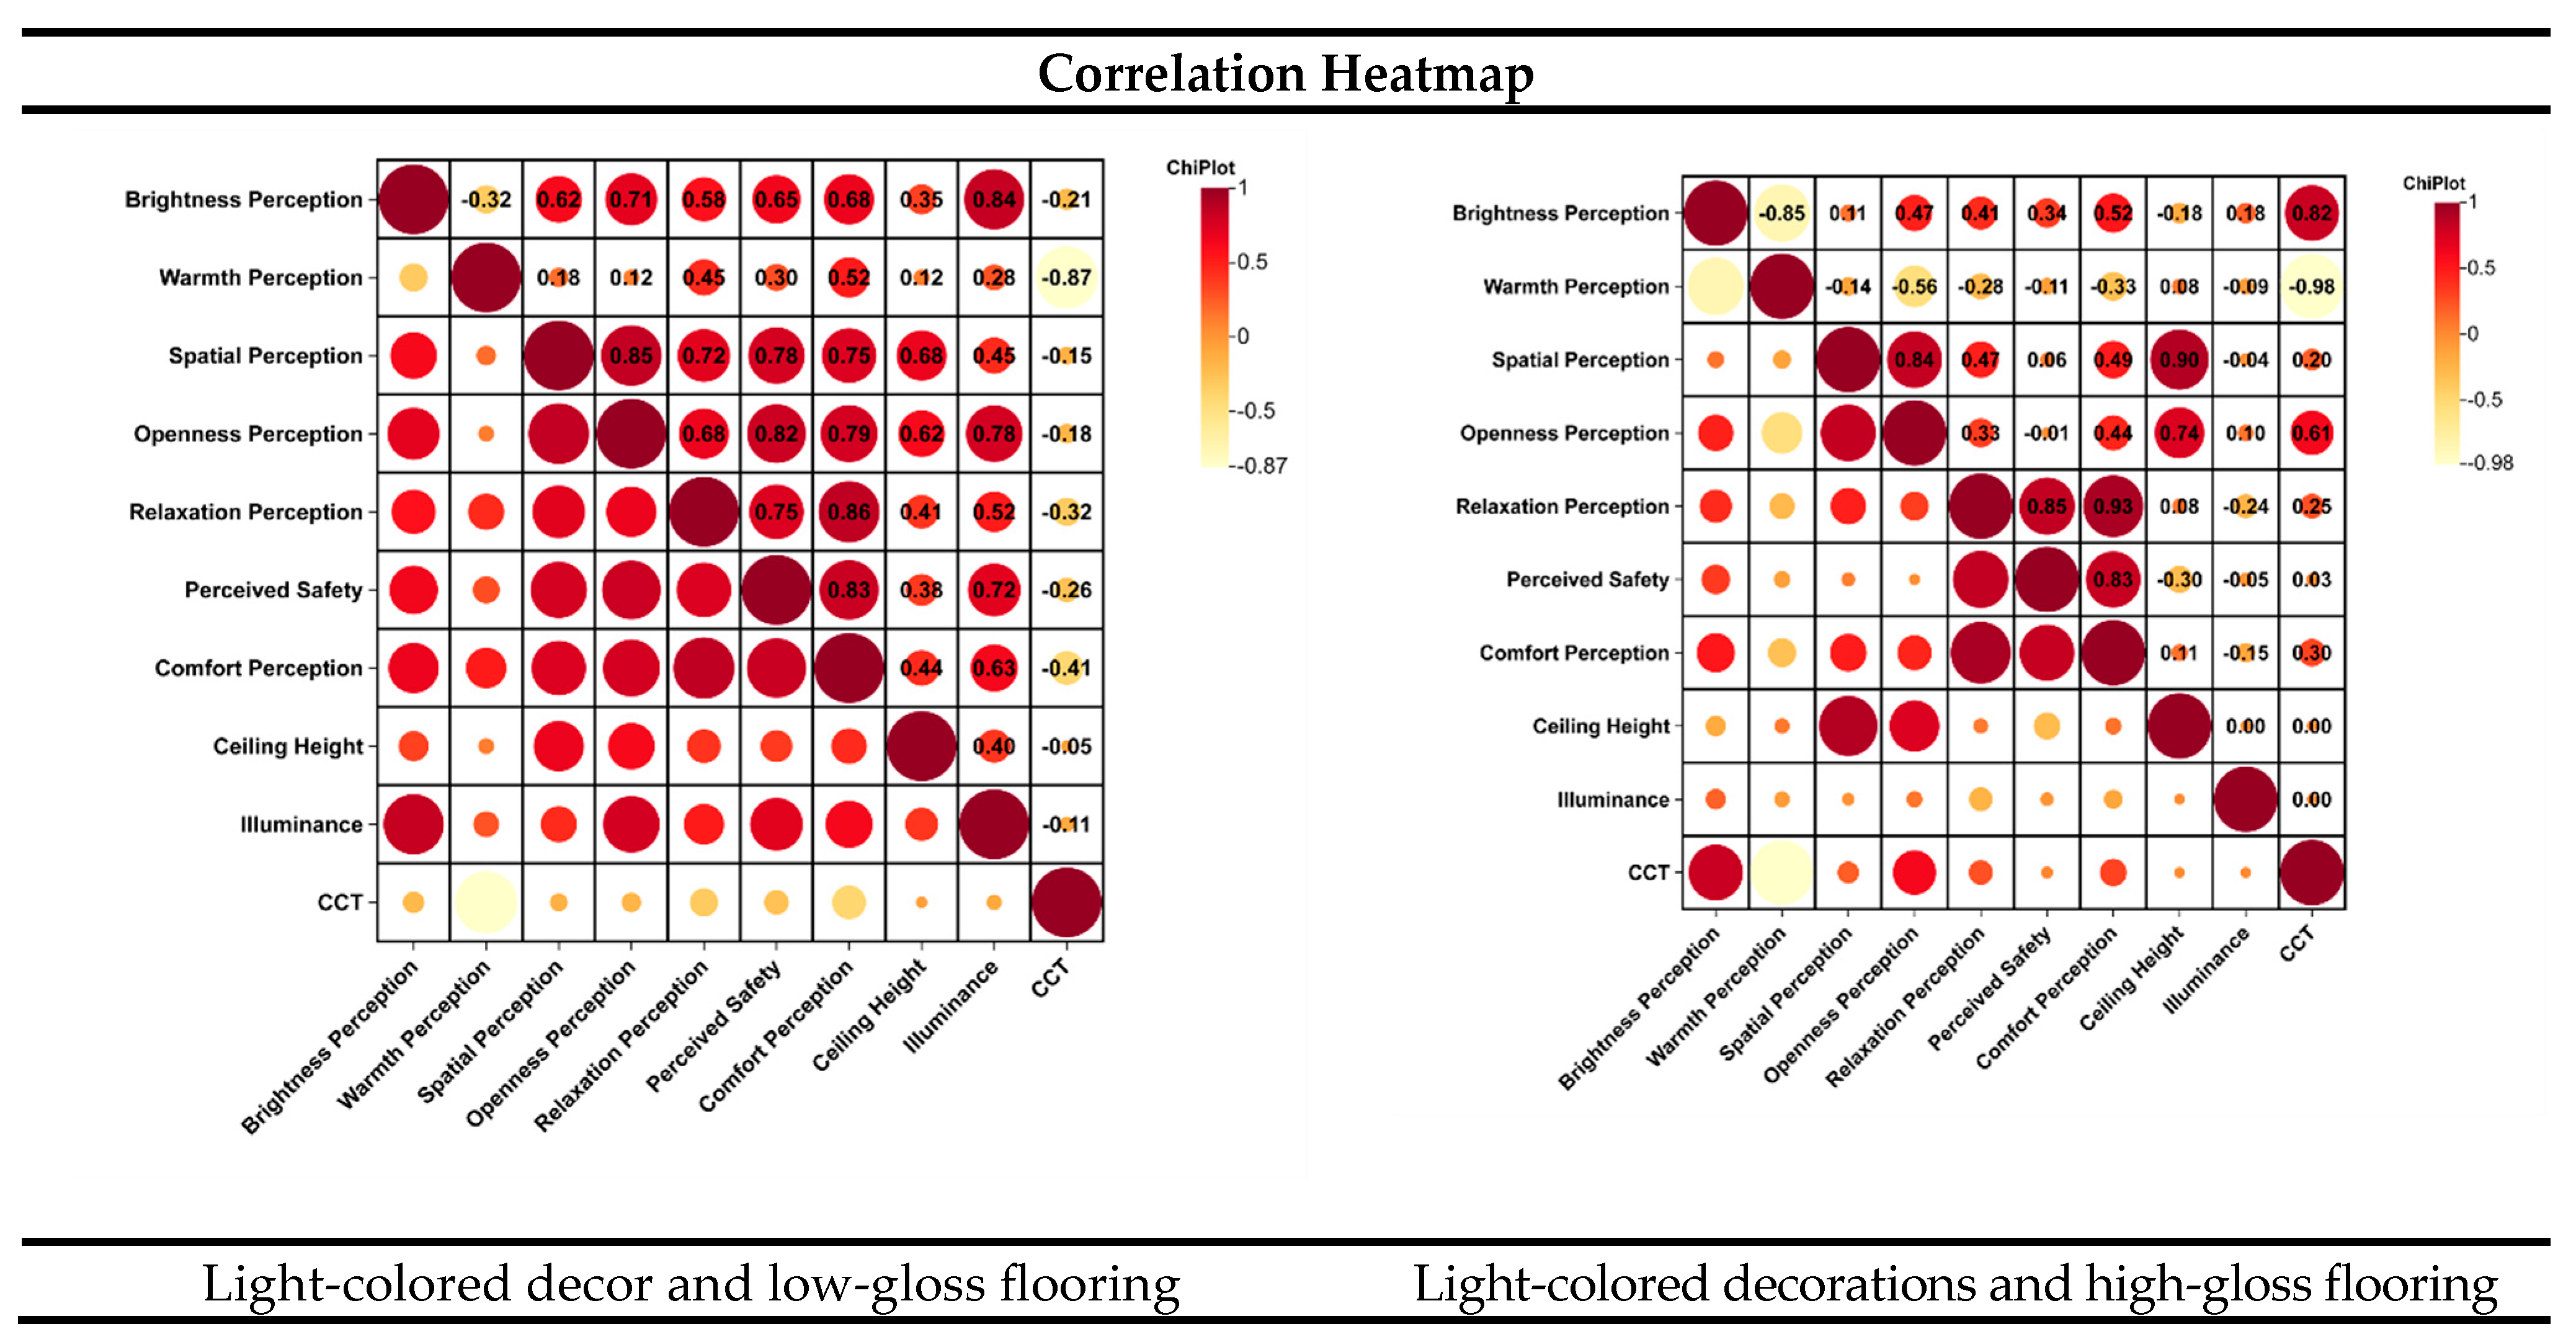
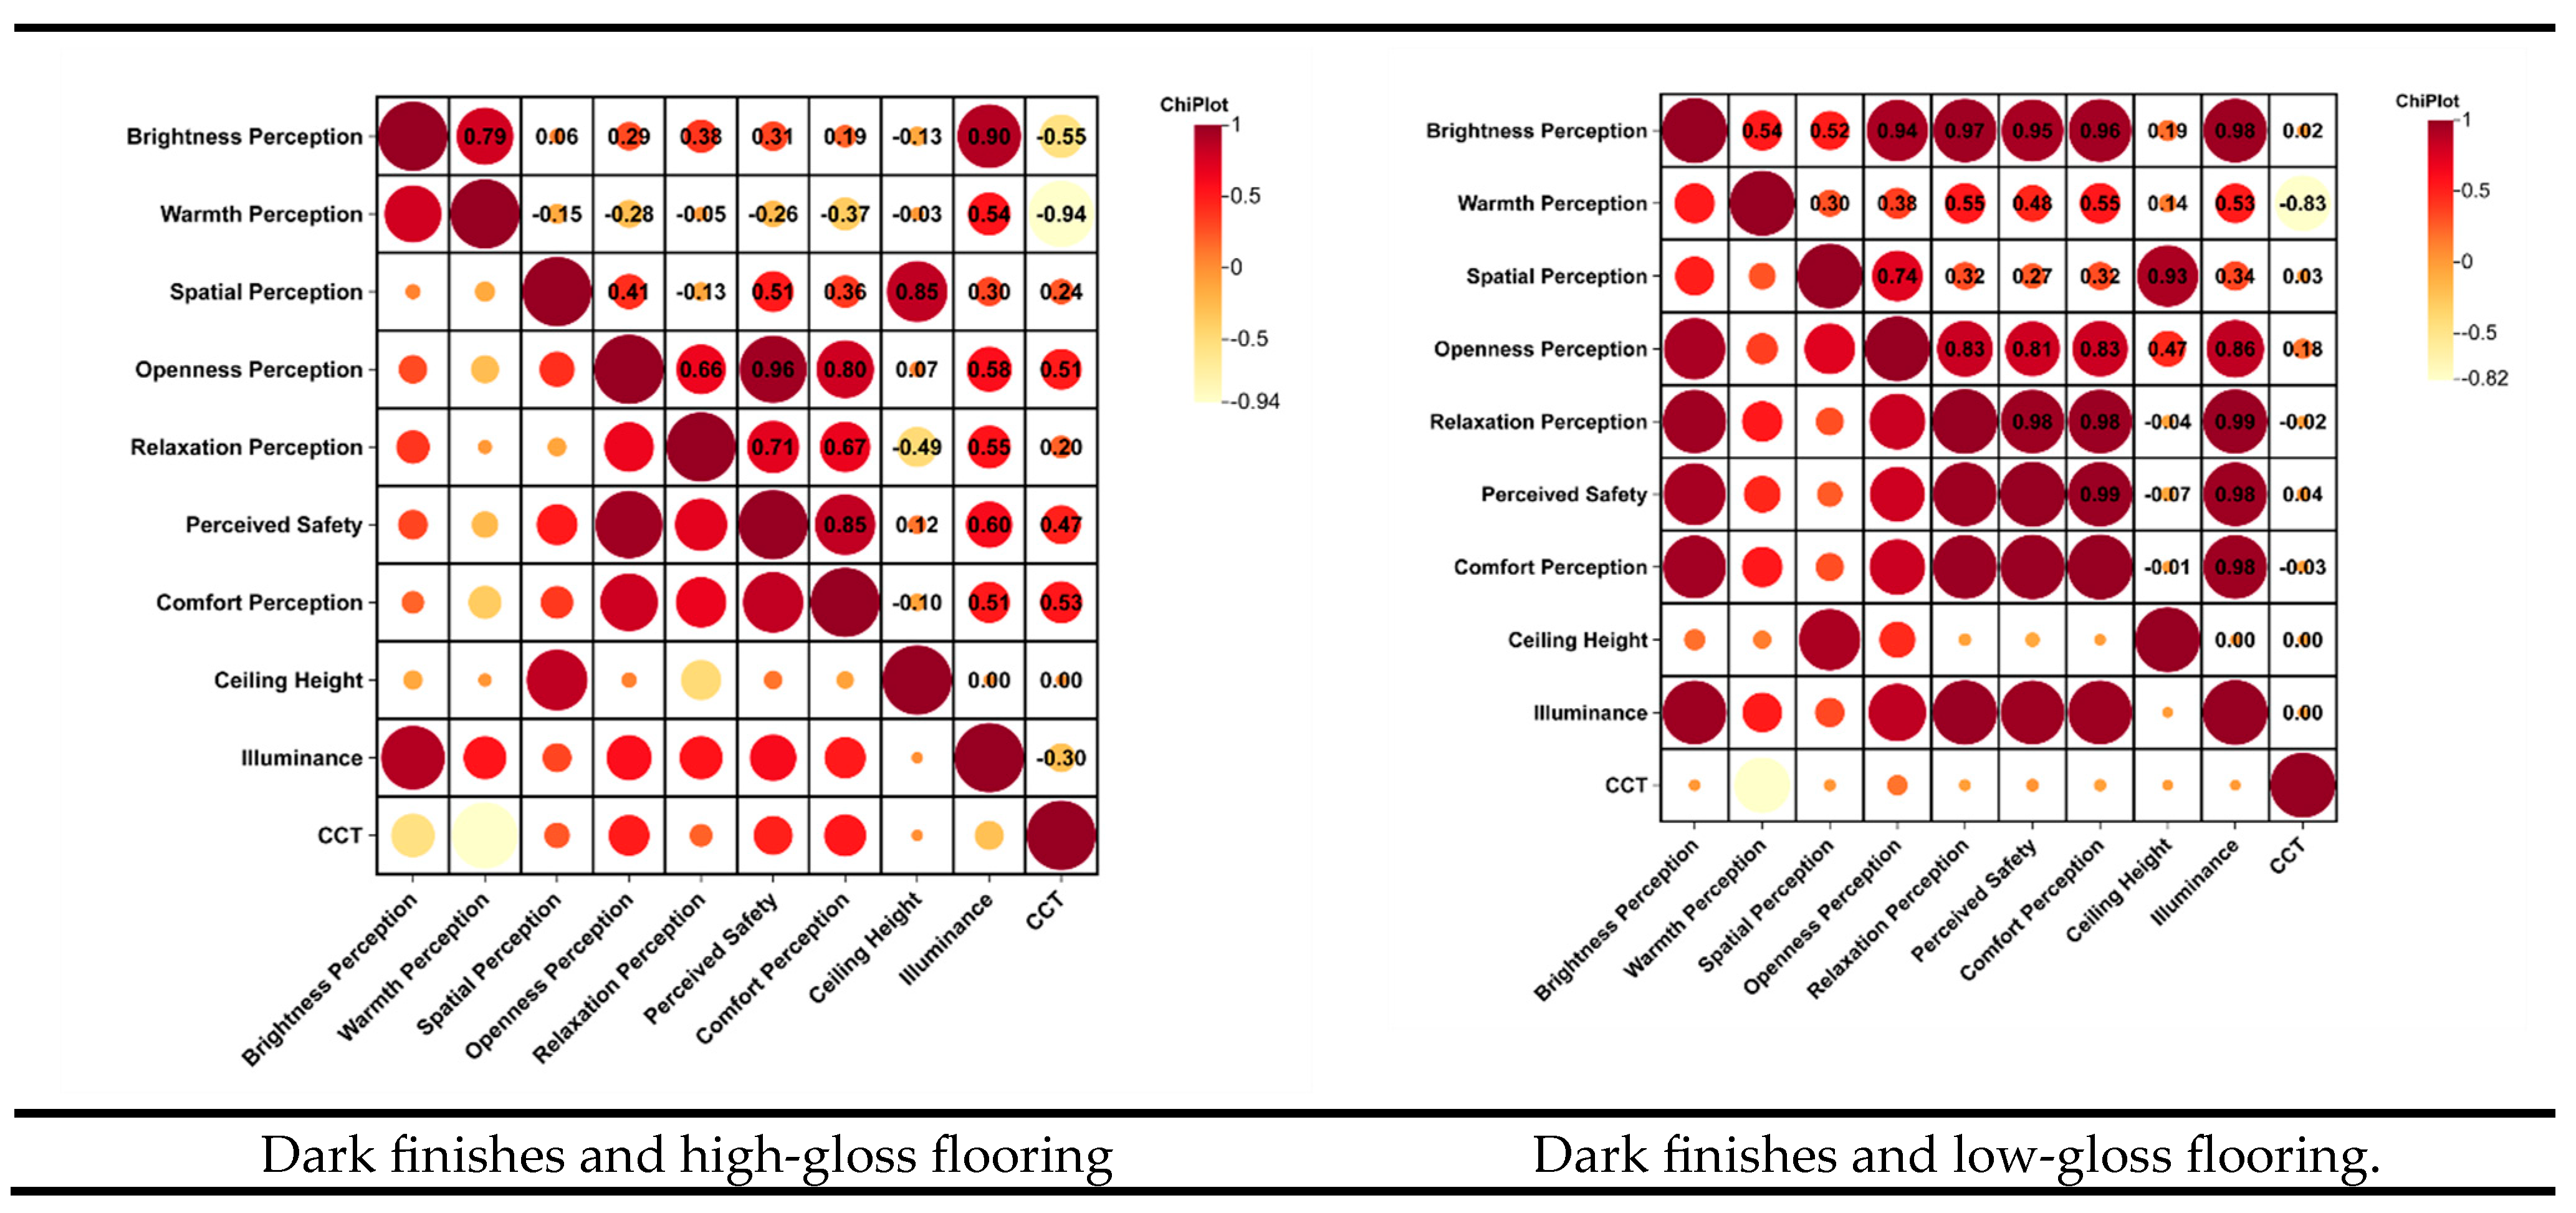
This study analyzed the influence mechanisms of light environment parameters and interface design (ceiling height and interface material) on passengers’ visual comfort and safety perception within metro public spaces by integrating subjective questionnaire data and eye-tracking metrics. Based on four typical scenarios, Pearson correlation analysis (Figure 3), regression modeling, and validation with physiological indicators were employed to elucidate the interaction patterns among parameters and define optimal design intervals.

3.1. The Mechanism of Interface Materials on Visual Comfort and Safety Perception

This study systematically reveals how lighting environment parameters in public subway spaces influence visual comfort and safety perception under varying material conditions using multidimensional data from subjective evaluations and eye tracking. The comprehensive analysis results are as follows:
Light–colored decoration + Low-polish floor scenario:
Subjective evaluations revealed strong positive correlations between illuminance and perceived brightness (r = 0.842, p < 0.05) and openness (r = 0.783, p < 0.05). Conversely, a significant negative correlation was observed between color temperature and perceived warmth (r = −0.874, p < 0.05). Further analysis revealed a significant positive correlation between sense of security and illuminance (r = 0.721, p < 0.05), the strength of which was influenced by ceiling height.
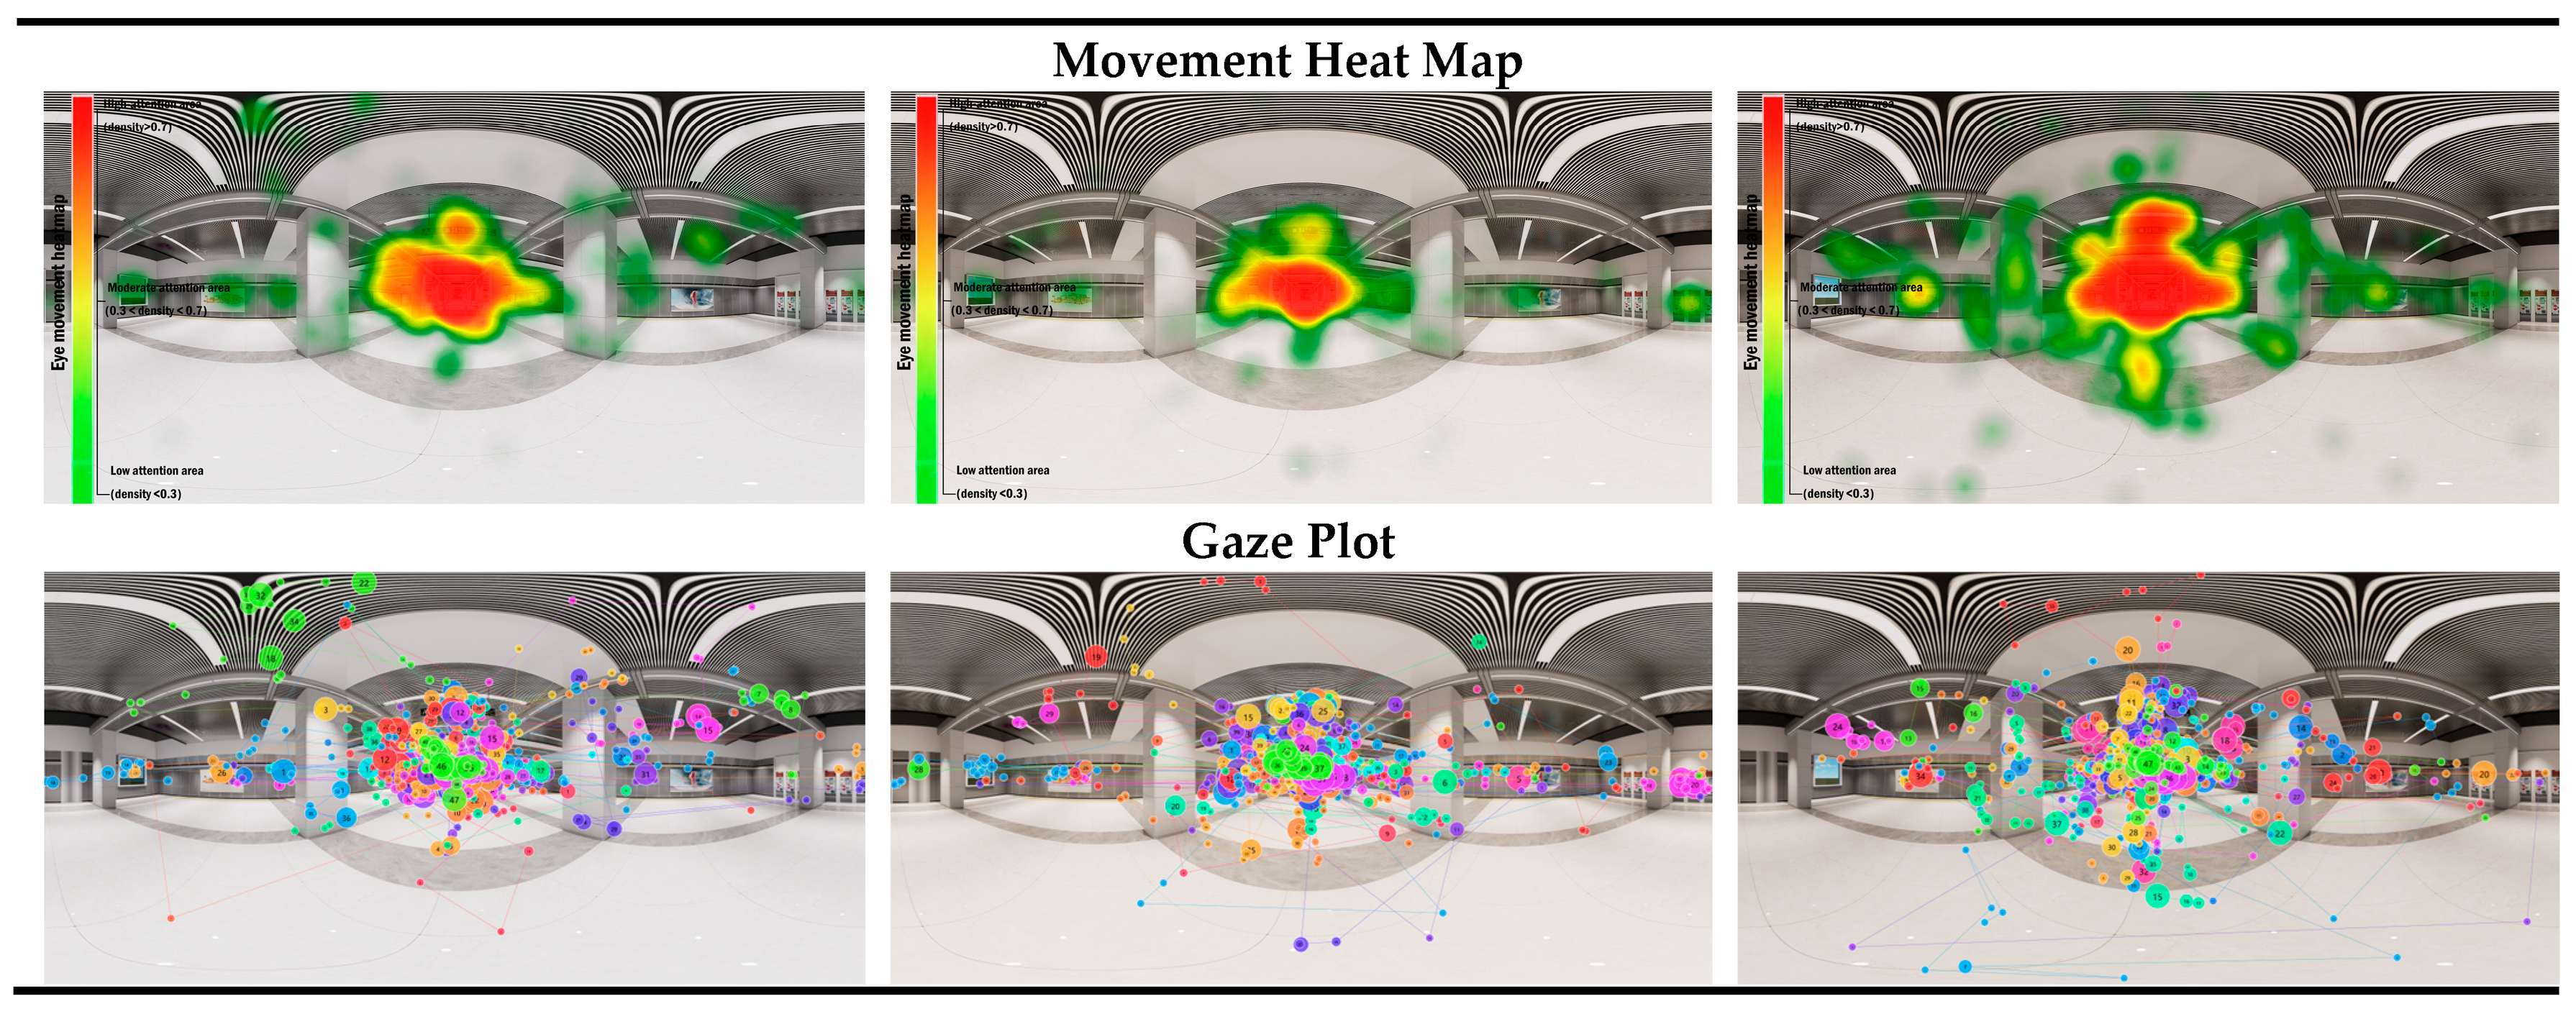
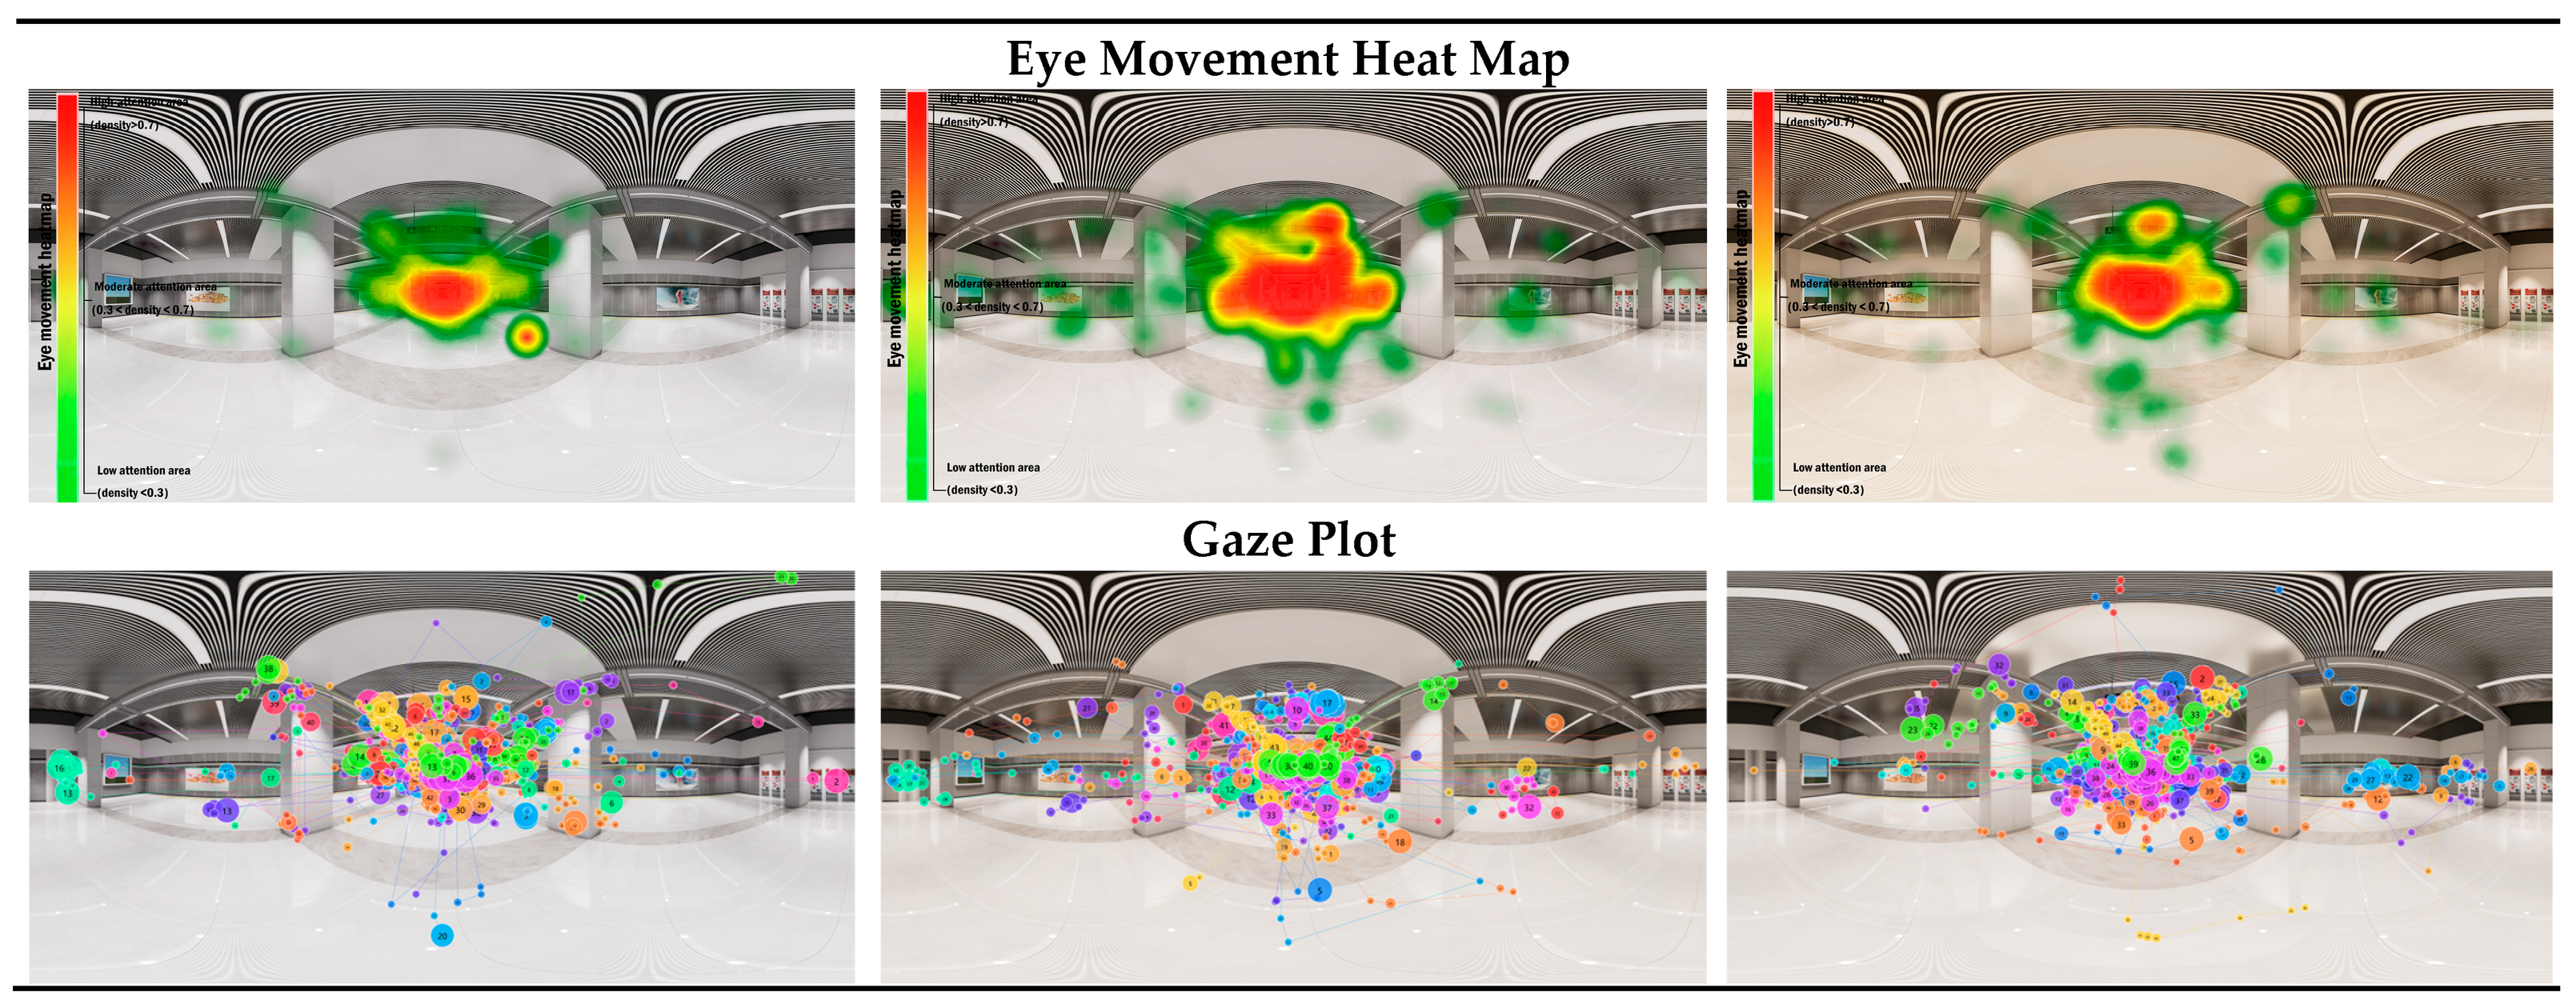
Eye-tracking data in this scenario showed a uniform distribution of visual attention, with hotspots concentrated on functional areas such as wayfinding systems. The gaze plot exhibited coherent saccadic paths and a natural distribution of fixation points, suggesting comfortable visual behavior and smooth information acquisition for passengers. This indicates that the environment effectively enhances visual guidance and increases passengers’ attention to key information, thereby improving path recognition and spatial orientation.
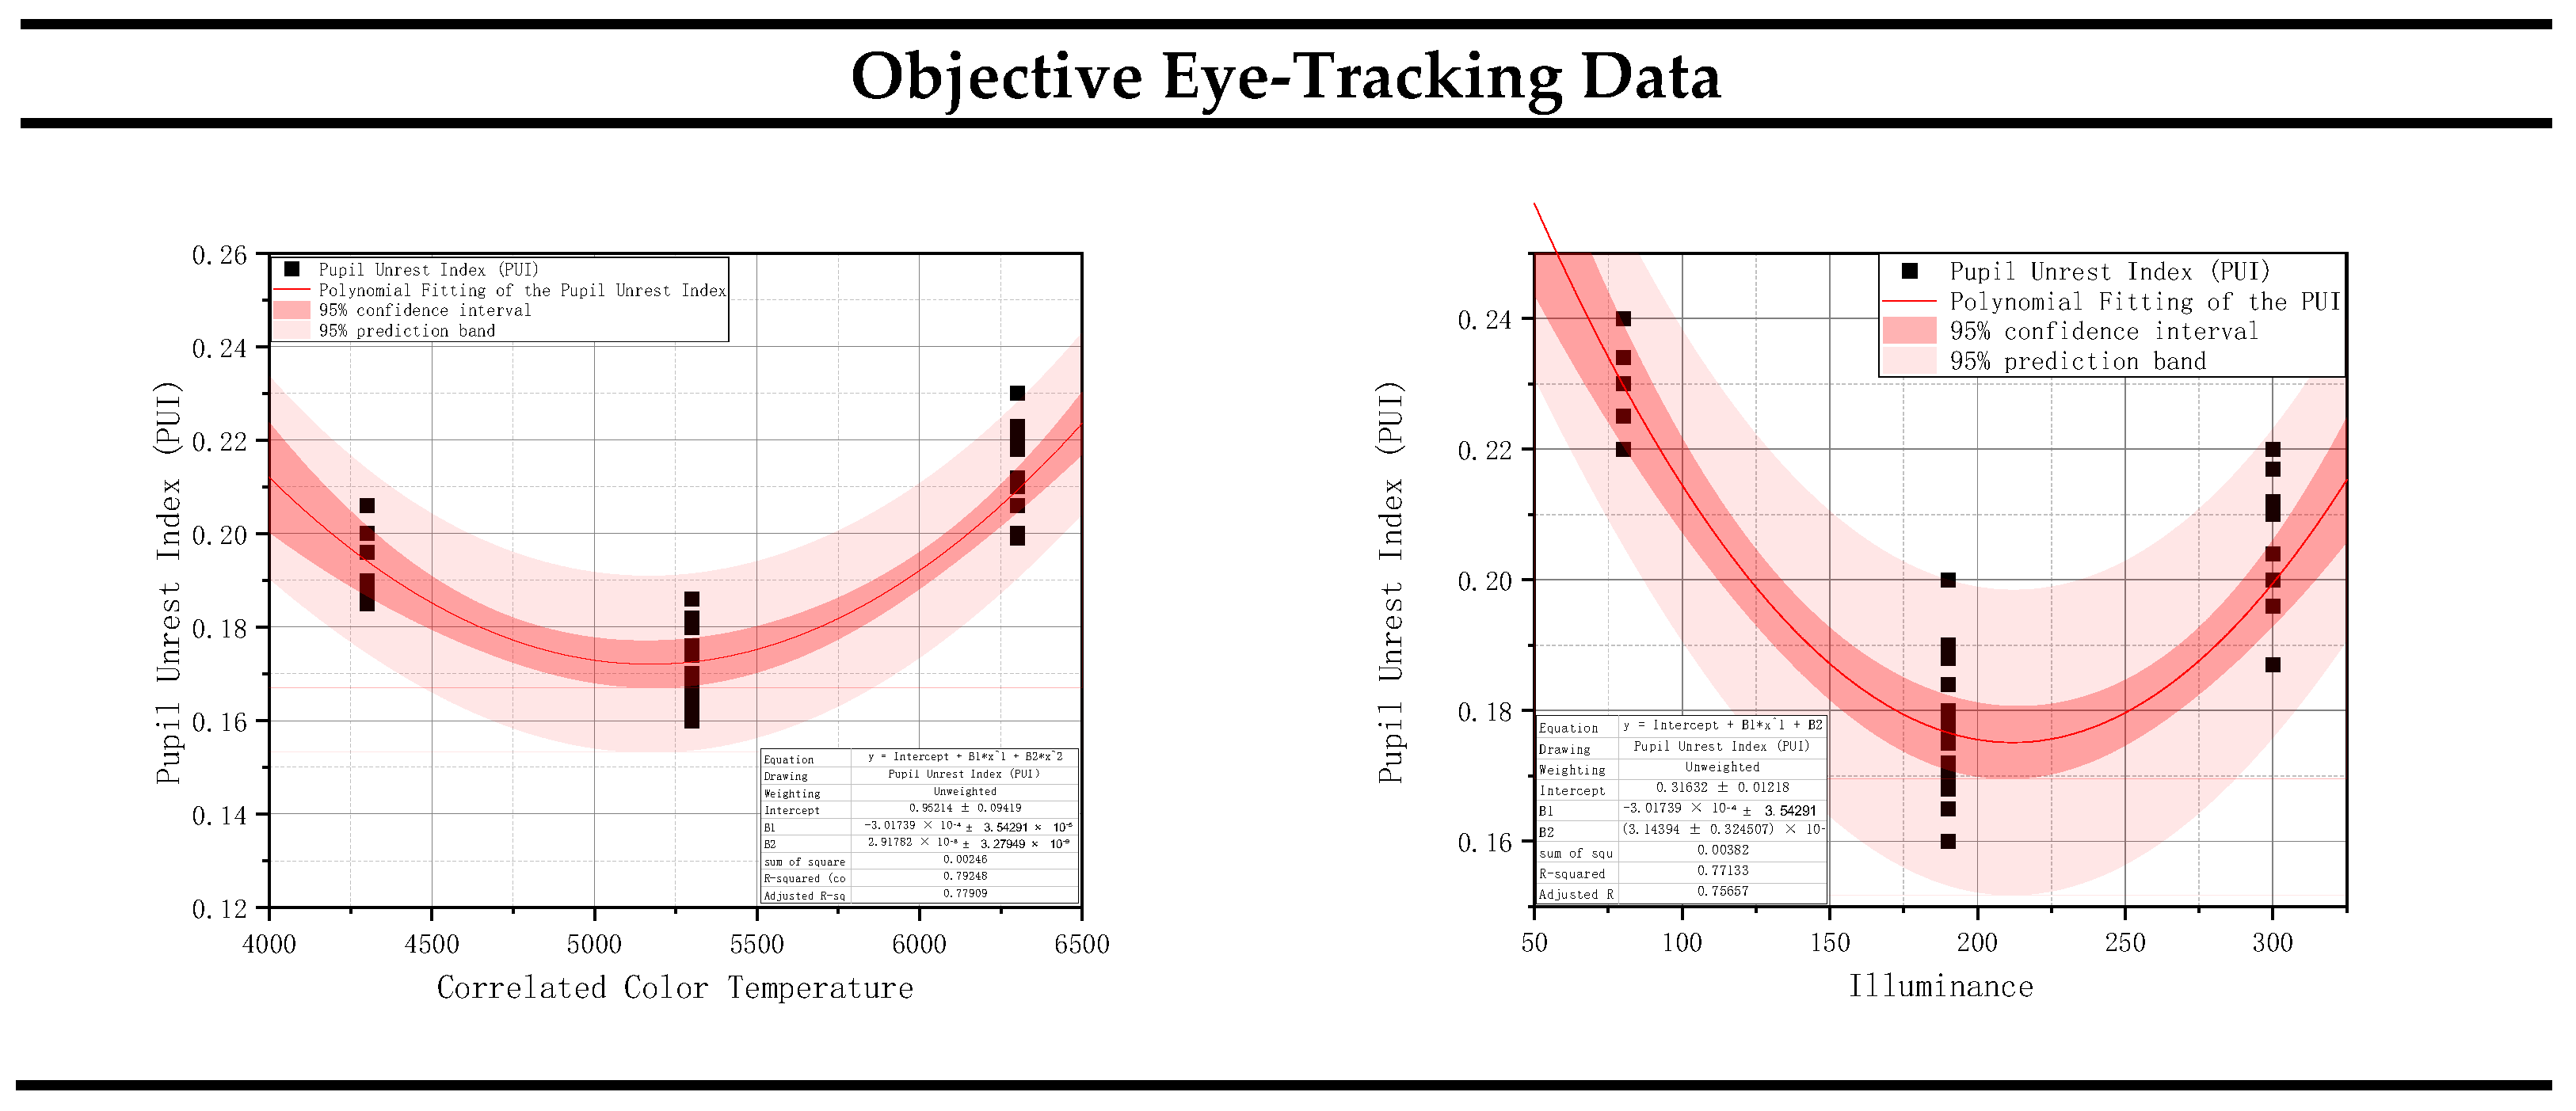
The average fixation duration was 3.8 s, and there were minimal fluctuations in pupil diameter (SD = 0.12 mm). This indicates that the illuminance range of 120–260 lx combined with a color temperature range of 6106–6470 K provides excellent visual guidance due to its low reflectivity. This reduces cognitive load and aids identification of potential obstacles or anomalies, contributing to an enhanced sense of security. By comparing these findings with the fitting results from the objective eye tracking data, the final recommended optimal parameters were identified as 120–260 lx and 6106–6470 K (Figure 4).
Light-colored decoration + high-gloss floor scene:
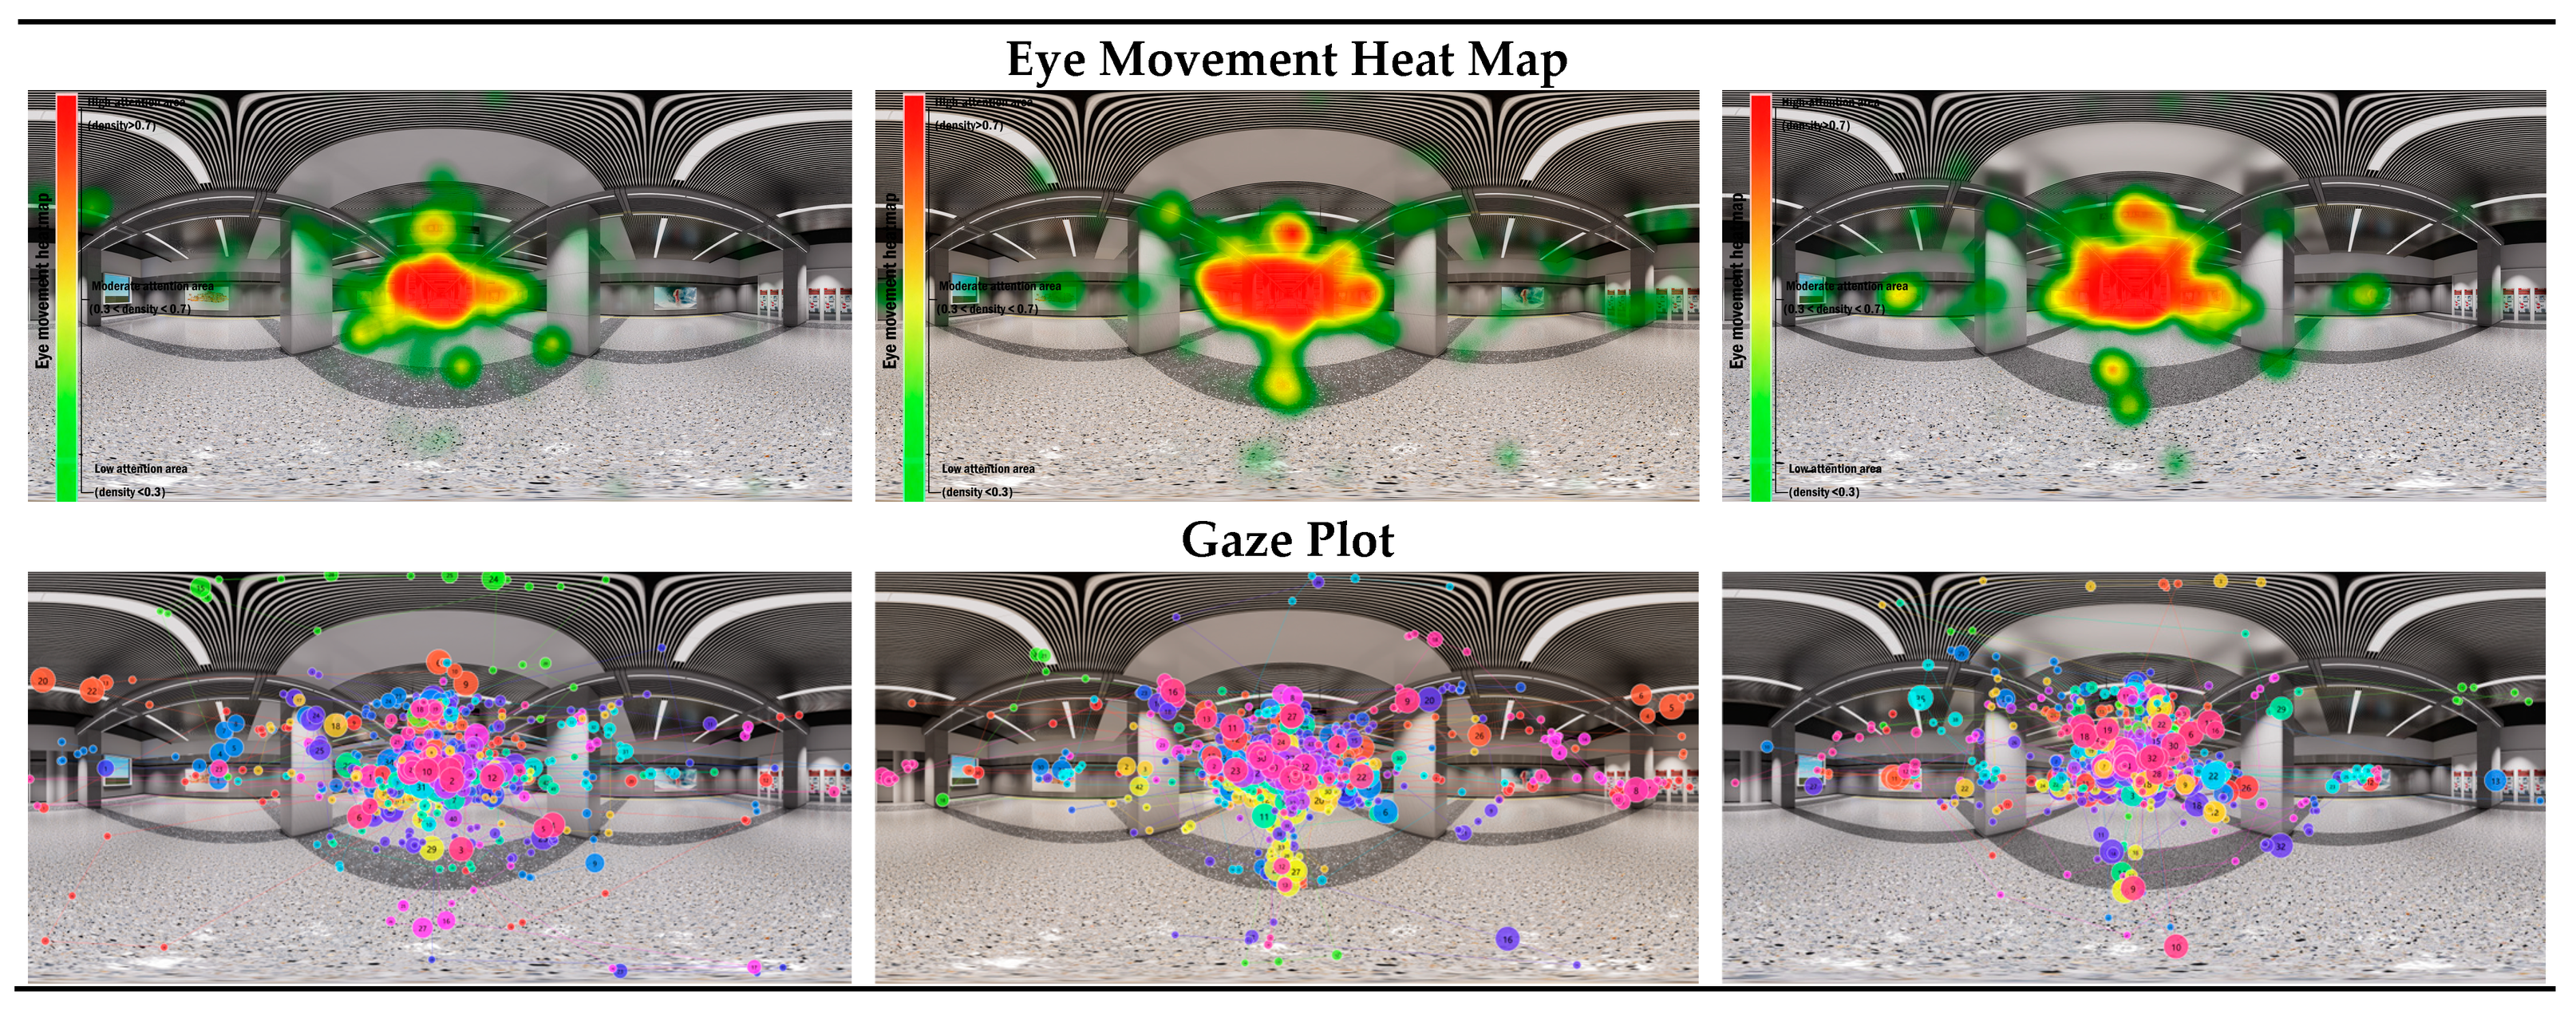
Subjective data indicate a significant negative correlation between color temperature and perceived warmth (r = −0.985, p < 0.01). Perceived safety positively correlated with illuminance; however, this relationship was weaker than in the ‘light color temperature + low gloss’ scenario and was influenced by ceiling height. Increased illuminance enhances perceived safety at higher ceiling heights (≥4.7 m). However, lower ceilings may reduce perceived safety due to increased reflected glare. Eye-tracking data revealed that visual hotspots were predominantly concentrated on the top light source and its reflected areas. The frequent attraction of the eye to bright areas indicates that reflections from light sources interfere with visual focus. Trajectory plots reveal localized jumps and back-gazing behaviors, suggesting that passengers may experience visual fatigue and diverted attention due to glare. This diminishes overall spatial visibility and recognition efficiency. Glare severely disrupts visual attention, reducing focus on wayfinding information. Frequent visual jumps weaken passengers’ perception of spatial safety. Integrated regression analysis and eye-tracking data show that maintaining a color temperature of 4425–5480 K, a ceiling height of 4.7–4.8 m, and an illuminance level of ≤200 lux effectively reduces glare and minimizes gaze jumps. This ensures optimal spatial legibility and safety perception (Figure 5).
Dark decor + low-gloss floor scene:
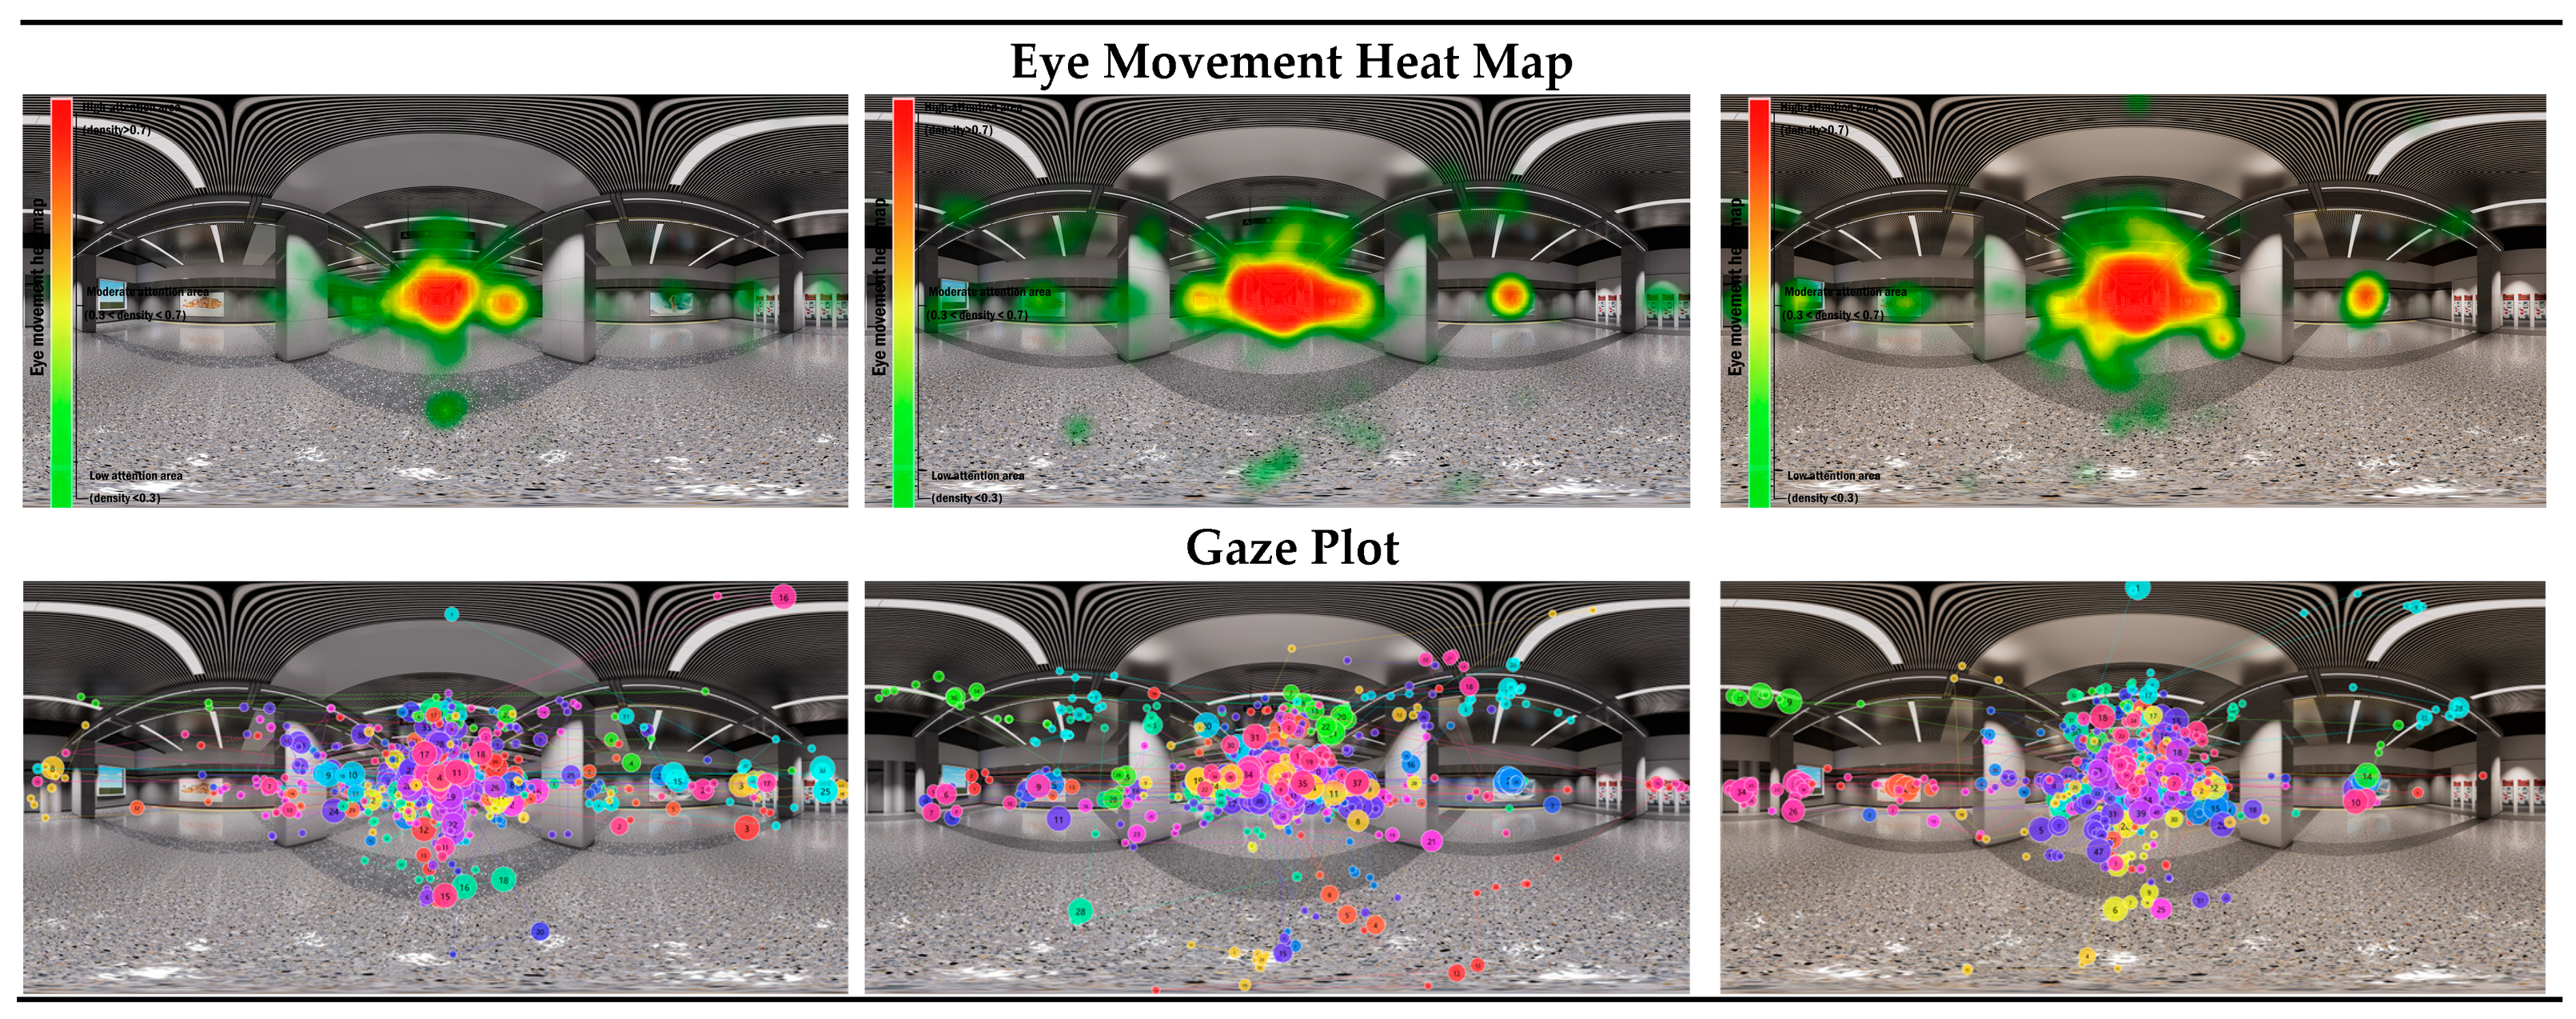
Illuminance has a significant impact on subjective perception, showing a strong positive correlation with brightness perception (r = 0.972, p < 0.01) and the perceived sense of security (r = 0.979, p < 0.01). These findings suggest that adequate illuminance is essential for improving environmental recognition and perceived safety. Eye-tracking results showed that participants focused on bright areas due to the light-absorbing properties of dark materials and the low reflectance of dull surfaces. Insufficient attention to other interface elements resulted in ‘visual blind spots’ within the space. Trajectory maps showed restricted visual exploration ranges and concentrated gaze patterns. Compared to the light-coloured scenario, the area covered by fixations decreased by one-third, indicating significantly reduced exploratory vision in this environment. The presence of blind spots implies a diminished capability to monitor dark peripheral areas (such as corners and spaces behind columns), which increases the likelihood of overlooking floor obstacles and reduces perceived safety. Integrated regression and eye-tracking analysis: Illuminance levels of 150–176 lux eliminate or minimize visual blind spots, ensuring environmental visibility and enhancing perceived safety in this scenario. A color temperature of 5525–6100 K mitigates the environment’s austere feel, thereby improving safety and comfort simultaneously (Figure 6).
Dark decor + high-gloss floor scene:
Both subjective and objective data reveal strong interaction effects. There is a strong correlation (p < 0.01) between illuminance and perceived brightness (r = 0.92), as well as between color temperature and perceived warmth (r = −0.937). Perceived safety shows a strong positive correlation with illuminance (r = 0.882, p < 0.01) and a negative correlation with color temperature. This indicates that enhancing illuminance is key to improving perceived safety. However, this scenario presents visual blind spots due to dark, light-absorbing surfaces, glare, and visual jumps caused by highly polished floors, which harm perceived safety. Further corroboration comes from eye-tracking data: heatmaps reveal fragmented hotspot distributions concentrated at light-dark transitions, which are severely disrupted by reflections. Trajectory plots reveal frequent gaze jumps and disordered paths, suggesting that such spatial configurations may induce elevated visual cognitive load. This compromises path recognition and environmental monitoring efficiency, which impairs passengers’ spatial orientation and safety judgment. Participants frequently shifted their focus between reflective surfaces and functional landmarks. This resulted in an unstable distribution of gaze that diminished path identification and situational awareness. Cross-validation of subjective and objective data determined that illuminance levels of 220–300 lux and color temperatures of 5600–6250 K are required. This configuration illuminates dark areas, suppresses glare caused by high reflectance, maintains relatively stable visual trajectories, and counteracts interference from strong reflections and high contrast (Figure 7).
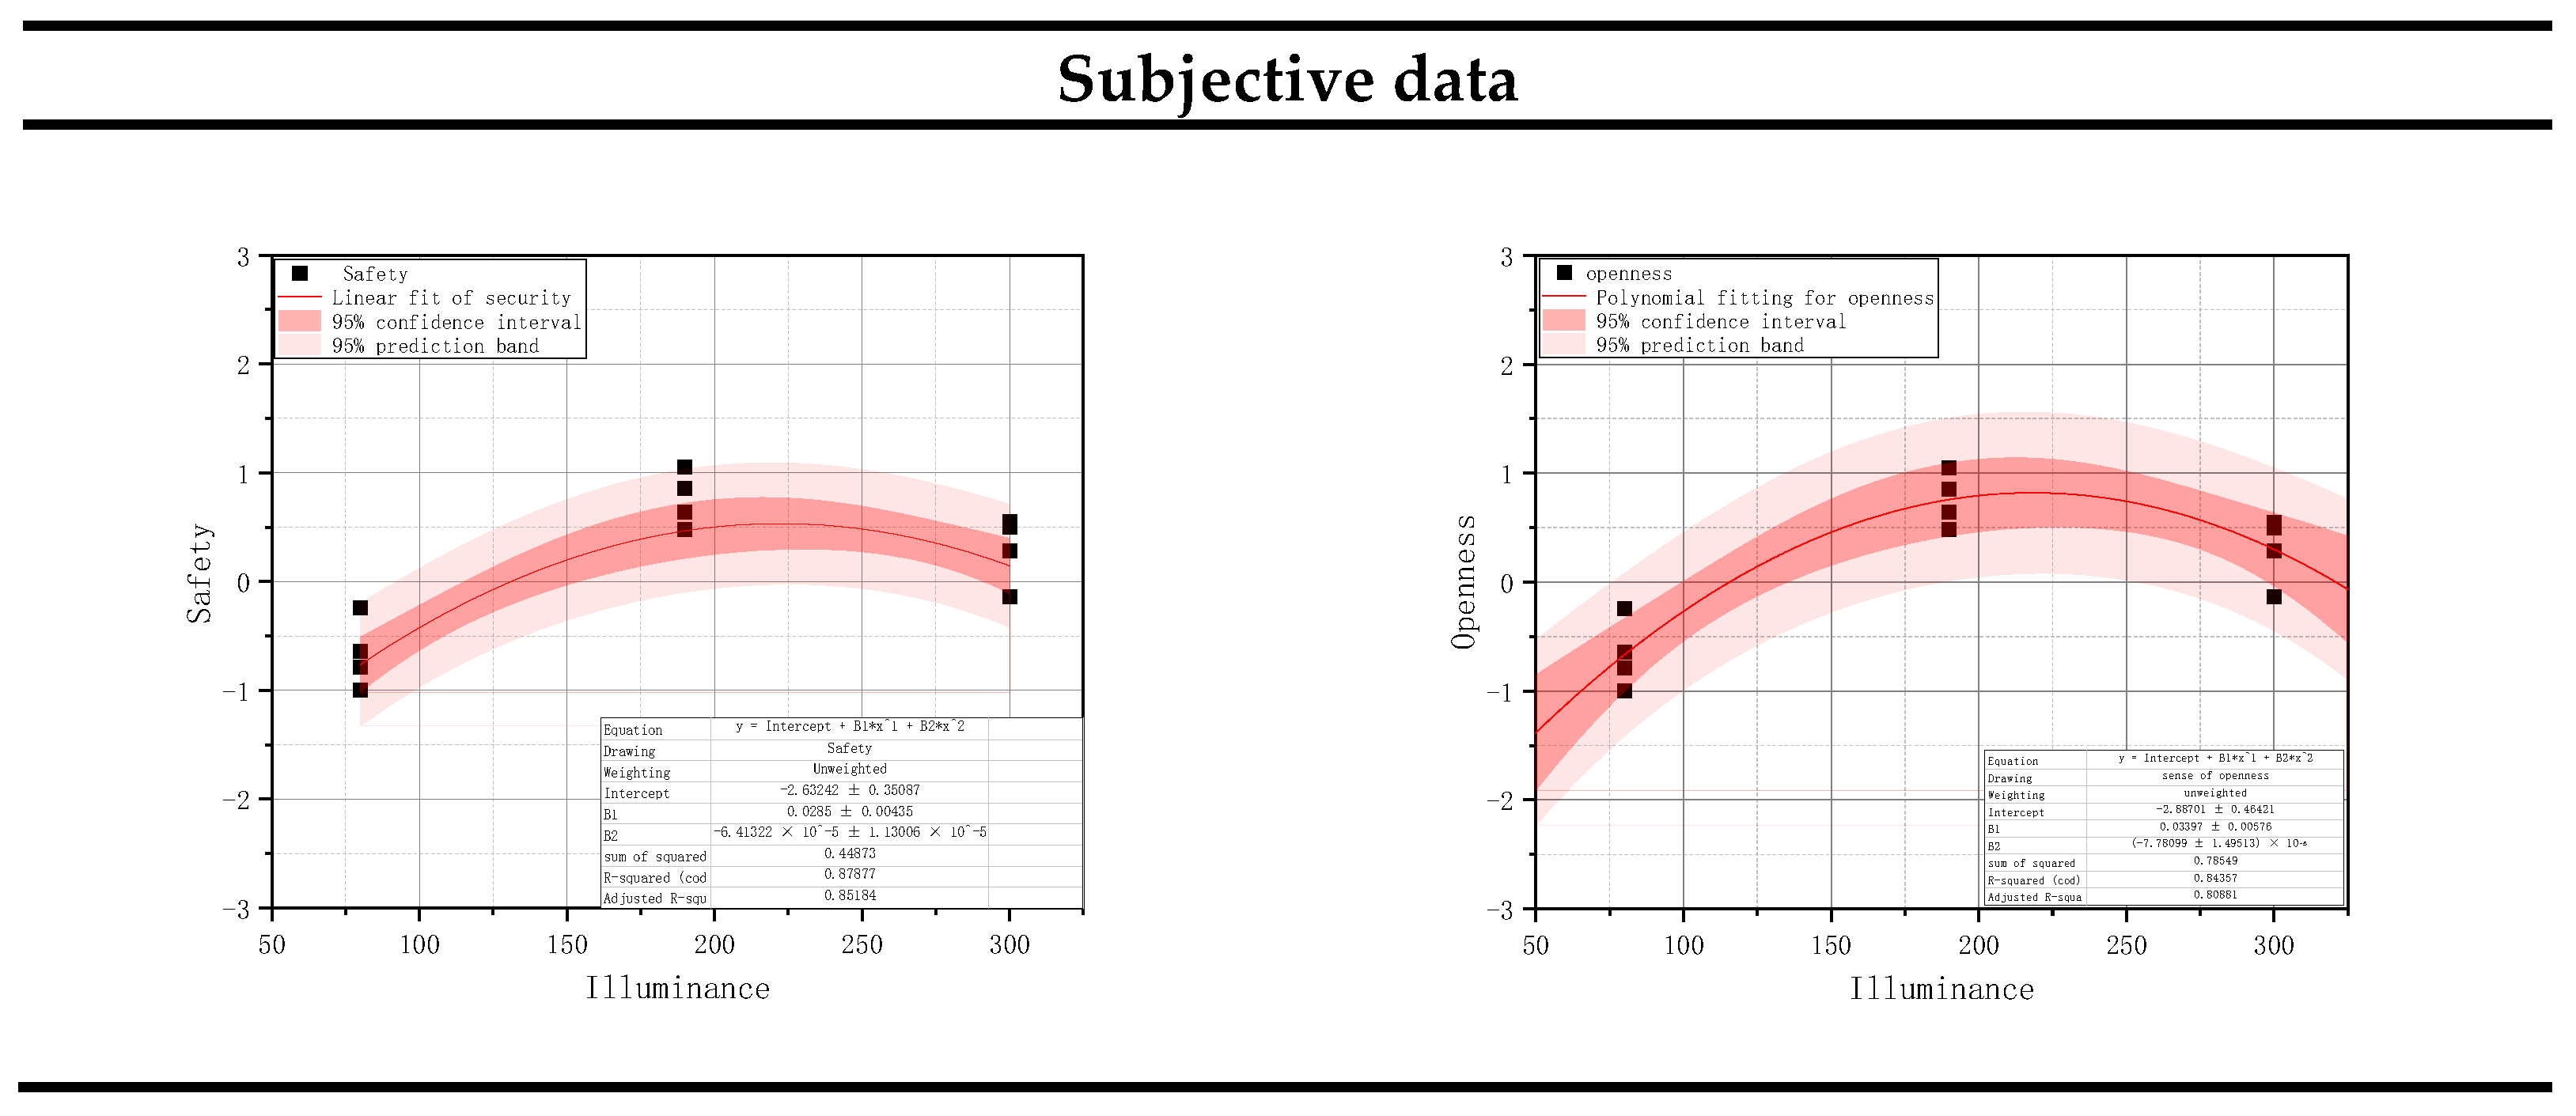
In summary, lighting environment parameters under different interface design parameters (ceiling height and material) affect visual comfort and influence passengers’ safety perception through glare, field of view, and visual blind spots (Figure 8).

3.2. The Mechanism of Interface Layer Height on Visual Comfort and Safety Perception

Ceiling height is a key parameter that regulates the lighting environment in public spaces in subways, influencing spatial perception directly and modulating light parameters indirectly. From a psychological perspective, the impact of ceiling height varies across different material contexts. In scenarios featuring light-coloured finishes and highly polished floors, for example, there is a highly significant positive correlation (r = 0.898, p < 0.01) between ceiling height and perceived spaciousness (r = 0.742). High-reflectance surfaces amplify vertical light propagation, enhancing the perception of spatial openness through increased ceiling height. Openness perception positively correlates with ceiling height (r = 0.742, p < 0.01). High-reflectivity floors strengthen the perception of spatial openness by amplifying vertical light extension. This improves psychological comfort, strengthens passengers’ spatial orientation and sense of control, and enhances perceived safety. In dark-coloured décor scenarios, the visual contraction effect of dark surfaces accentuates the correlation between ceiling height and spatial perception (dark low-gloss scenario: r = 0.927; dark high-gloss scenario: r = 0.866; both p < 0.01). This tendency is particularly pronounced in low-ceilinged environments, where it can lead to heightened anxiety and significantly impact perceived safety and comfort.
Further analysis through regression: Light-colored, high-gloss scenes should be kept within the range of 4.7–4.8 m to balance reflective glare and openness. Dark, low-gloss scenes should be increased to 4.8–5.0 m to offset a sense of oppression. Dark, high-gloss scenes should be maintained at 4.6–4.9 m to balance reflective control and scale.
Next, ceiling height adjusts perception thresholds for illuminance and color temperature by altering light propagation paths. High ceilings (≥4.8 m) require an increase in illuminance of 10–15 lx (e.g., dark, high-gloss scenes require 220–300 lx) to ensure sufficient lighting in dark areas and prevent reduced visibility of information from lowering safety perception. They should also be paired with a slightly higher color temperature (100–200 K) to meet comfort requirements. Low ceilings (≤4.5 m) have shorter light paths, exacerbating glare risks. Therefore, illuminance should be reduced by 5–10 lx to prevent visual interference that could lead to falls or collisions. Simultaneously, the color temperature should be lowered by 100–300 K to alleviate a sense of oppression. Dark-colored decorative scenes require an additional 15% increase in illuminance to compensate for their light-absorbing properties, which can create visual blind spots.
Through the analysis of eye movement data, it was found that, within a ceiling height range of 4.66–4.91 m, the eye movement indicators of the participants—including the pupil instability index (0.169–0.210 mm), blink frequency (three to 3.75 times per 15 s), and saccade count (146–156 times per 15 s)—all remained within comfortable levels, indicating stable visual regulation (Table 1). These results suggest efficient environmental information acquisition and processing, ensuring visual comfort and a sense of safety. However, when the ceiling height deviated from this range, total fixation duration prolonged (>5.575 s), and eye movement indicators fluctuated significantly. This demonstrates consistency between subjective and objective data and reflects visual system strain and fatigue. These factors significantly reduce alertness and reaction speed, posing a potential safety risk.
Ceiling height influences visual perception by affecting the multi-path propagation of light and the perception of physical scale. The intensity of its effect exhibits dynamic interactions with interface materials and lighting parameters. The suitable parameter ranges for the four scenarios in Table 2 result from the synergistic effects of ceiling height, materials, and lighting parameters. These ranges provide a quantitative basis for precisely designing the light environment in metro spaces.
This study thoroughly reveals the complex interplay of ceiling height, illuminance, and CCT and their combined effects on visual comfort and safety perception through a systematic analysis of subjective and objective experimental data derived from virtual scenarios of metro public spaces with four typical interface material combinations. Illuminance is a key factor in overall comfort. It significantly affects subjective perceptions, such as brightness and openness. It also enhances environmental visibility and ensures a sense of safety. However, insufficient illuminance or glare caused by lighting can undermine the feeling of safety. CCT primarily modulates the emotional atmosphere, and variations in CCT directly affect a space’s perceived warmth and friendliness. From a safety perspective, an appropriate CCT can alleviate tension and enhance the sense of security; however, extreme cool or warm tones may indirectly reduce the perception of safety by affecting mood. Ceiling height influences the perception of spatial scale, improving openness and reducing claustrophobia-related safety concerns. It also moderates the perceptual thresholds of lighting parameters by altering light propagation paths. As a key moderating variable, interface materials produce different effects. Highly polished floors can cause glare issues, dark decorations can increase sensitivity to illuminance, and light-colored, low-polish combinations can offer better visual guidance. However, improper pairing of ceiling height and materials can induce a sense of oppression and reduce perceived safety.
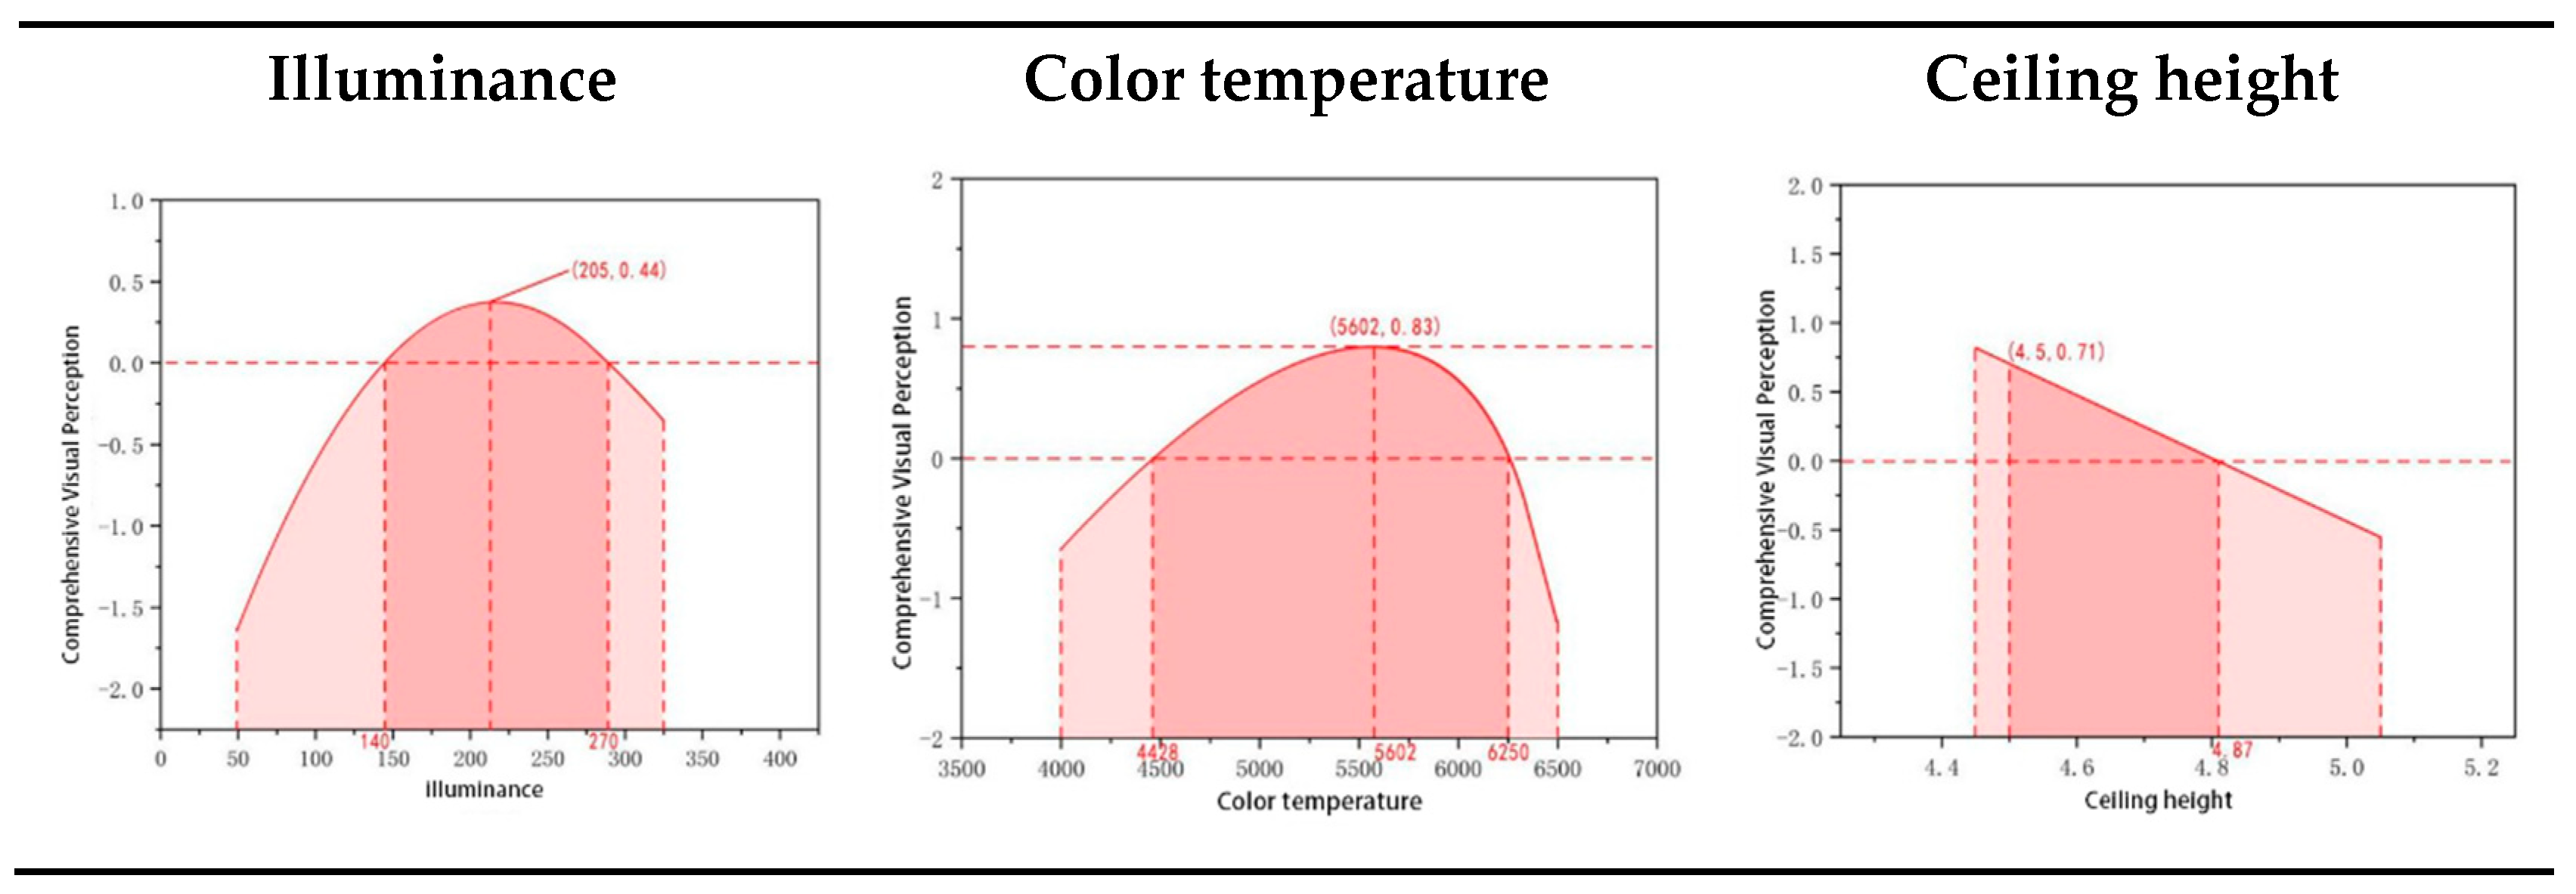
Furthermore, a high degree of consistency was observed between eye-movement metrics and subjective comfort evaluations (Figure 9), which validates the effectiveness of eye-tracking indicators as an objective assessment tool. This study identifies the optimal comfort parameter ranges for different material combinations. This provides a solid scientific basis for developing optimized design strategies for lighting in public metro spaces.

4. Discussion

Based on the parameter ranges derived from the research findings, this section proposes synergistic design strategies targeting the four typical interface material combinations in metro public spaces, focusing on the light environment (illuminance and CCT) and interface design (ceiling height and materials). Research indicates that the perception of comfort and safety in metro light environments results from the combined effects of lighting and interface design. There is no universal “optimal solution.” Thus, the design strategies are presented according to interface materials, considering spatial function and ceiling height.

4.1. Design Strategies for Different Interfaces

The combination of light-colored decorations and low-polish flooring provides strong visual guidance, reduces glare risk, and offers wide adaptability to various ceiling heights. Illuminance should be maintained between 120 and 260 lux and a CCT between 6106 and 6470 K. The material’s reflective properties can reduce illuminance by approximately 10% in the design phase. In spaces with high ceiling heights (≥4.8 m), illuminance should be increased slightly to 150–270 lx to compensate for light diffusion loss. For medium ceiling heights (4.5–4.8 m), illuminance can be maintained at 150–260 lx to balance comfort and energy efficiency. Employing a relatively higher CCT can enhance a sense of spatial transparency and guidance. This material combination is well-suited for high-flow areas, such as main passageways and transfer nodes. Since ceiling height has a relatively minor influence on lighting parameters in this case, the design offers high flexibility and can be adapted to most metro spaces.
The primary challenge of combining light-colored decorations with high-polish flooring is the high reflectivity of the floor surface, which easily causes glare. This requires balancing openness with visual stability. The recommended parameter ranges include a ceiling height between 4.7 and 4.8 m, illuminance between 140 and 200 lux (not exceeding 200 lux to prevent reflective glare), and a CCT between 4425 and 5480 Kelvin. In spaces with low ceilings (≤4.5 m), where the risk of direct light exposure is higher, the illuminance in main circulation areas should be reduced by 5–10 lx (to 180–210 lx) to mitigate glare-induced discomfort. Conversely, in spaces with high ceilings (≥4.8 m), illuminance can be lowered by 5–10%, yet it must remain ≤200 lx, to leverage the benefits of diffuse reflection. Additionally, the CCT should be adjusted according to the ceiling height. For every 0.1 m decrease in height, the CCT should be reduced by 100–200 K to minimize glare. This combination is best suited for areas such as atriums, where a strong sense of openness is desired.
The primary challenge of combining dark-colored decorations and low-polish flooring is the strong light absorption of dark surfaces, which can easily create a visually oppressive atmosphere. To enhance comfort, it is essential to compensate for ceiling height and illuminance while ensuring environmental visibility to promote safety. The recommended parameter ranges are as follows: a ceiling height of 4.8–5.0 m, an illuminance of 150–176 lux, and a CCT of 5525–6100 Kelvin. During the design process, priority should be given to achieving a ceiling height of at least 4.8 m. If the ceiling height is less than 4.8 m, the illuminance should be increased by 10% to counteract the reduced perception of brightness caused by spatial oppression. A neutral to warm CCT range (5525–6100 K) should also offset the cold impression created by dark tones and enhance the sense of security. This combination suits areas requiring a specific atmosphere, such as culturally themed spaces. However, it should be avoided in small spaces to prevent a diminished perception of safety resulting from excessive oppressiveness.
The combination of dark finishes and highly polished flooring presents the most demanding requirements, with the core challenge lying in balancing the visual dead zones caused by the light absorption of dark surfaces against the glare produced by highly reflective flooring. This helps to prevent safety perceptions from being compromised. Suitable parameters range from a ceiling height of 4.6–4.9 m, illuminance of 220–300 lux, and a color temperature of 5600–6250 K. For high ceilings (≥4.8 m), the range may extend to 250–300 lux due to diffuse reflection gain. For low ceilings (4.5 m or less), control within the 220–280 lux range is required to minimize glare, and the color temperature should be adjusted according to the ceiling height. For ceilings between 4.8 and 4.9 m high, a color temperature of 5800–6250 K is suitable to enhance brightness perception. For low ceilings (4.6–4.7 m), a color temperature of 5600–5900 K should be maintained to minimize reflective instability. This combination presents the most significant challenge and is recommended for cautious use only. If it is adopted, strict adherence to the specified parameter ranges is essential, and it should be prioritized for use in areas with high ceilings. Based on the research findings, we have drawn up a scene design diagram for reference (Table 3).

4.2. Universal Design Strategy

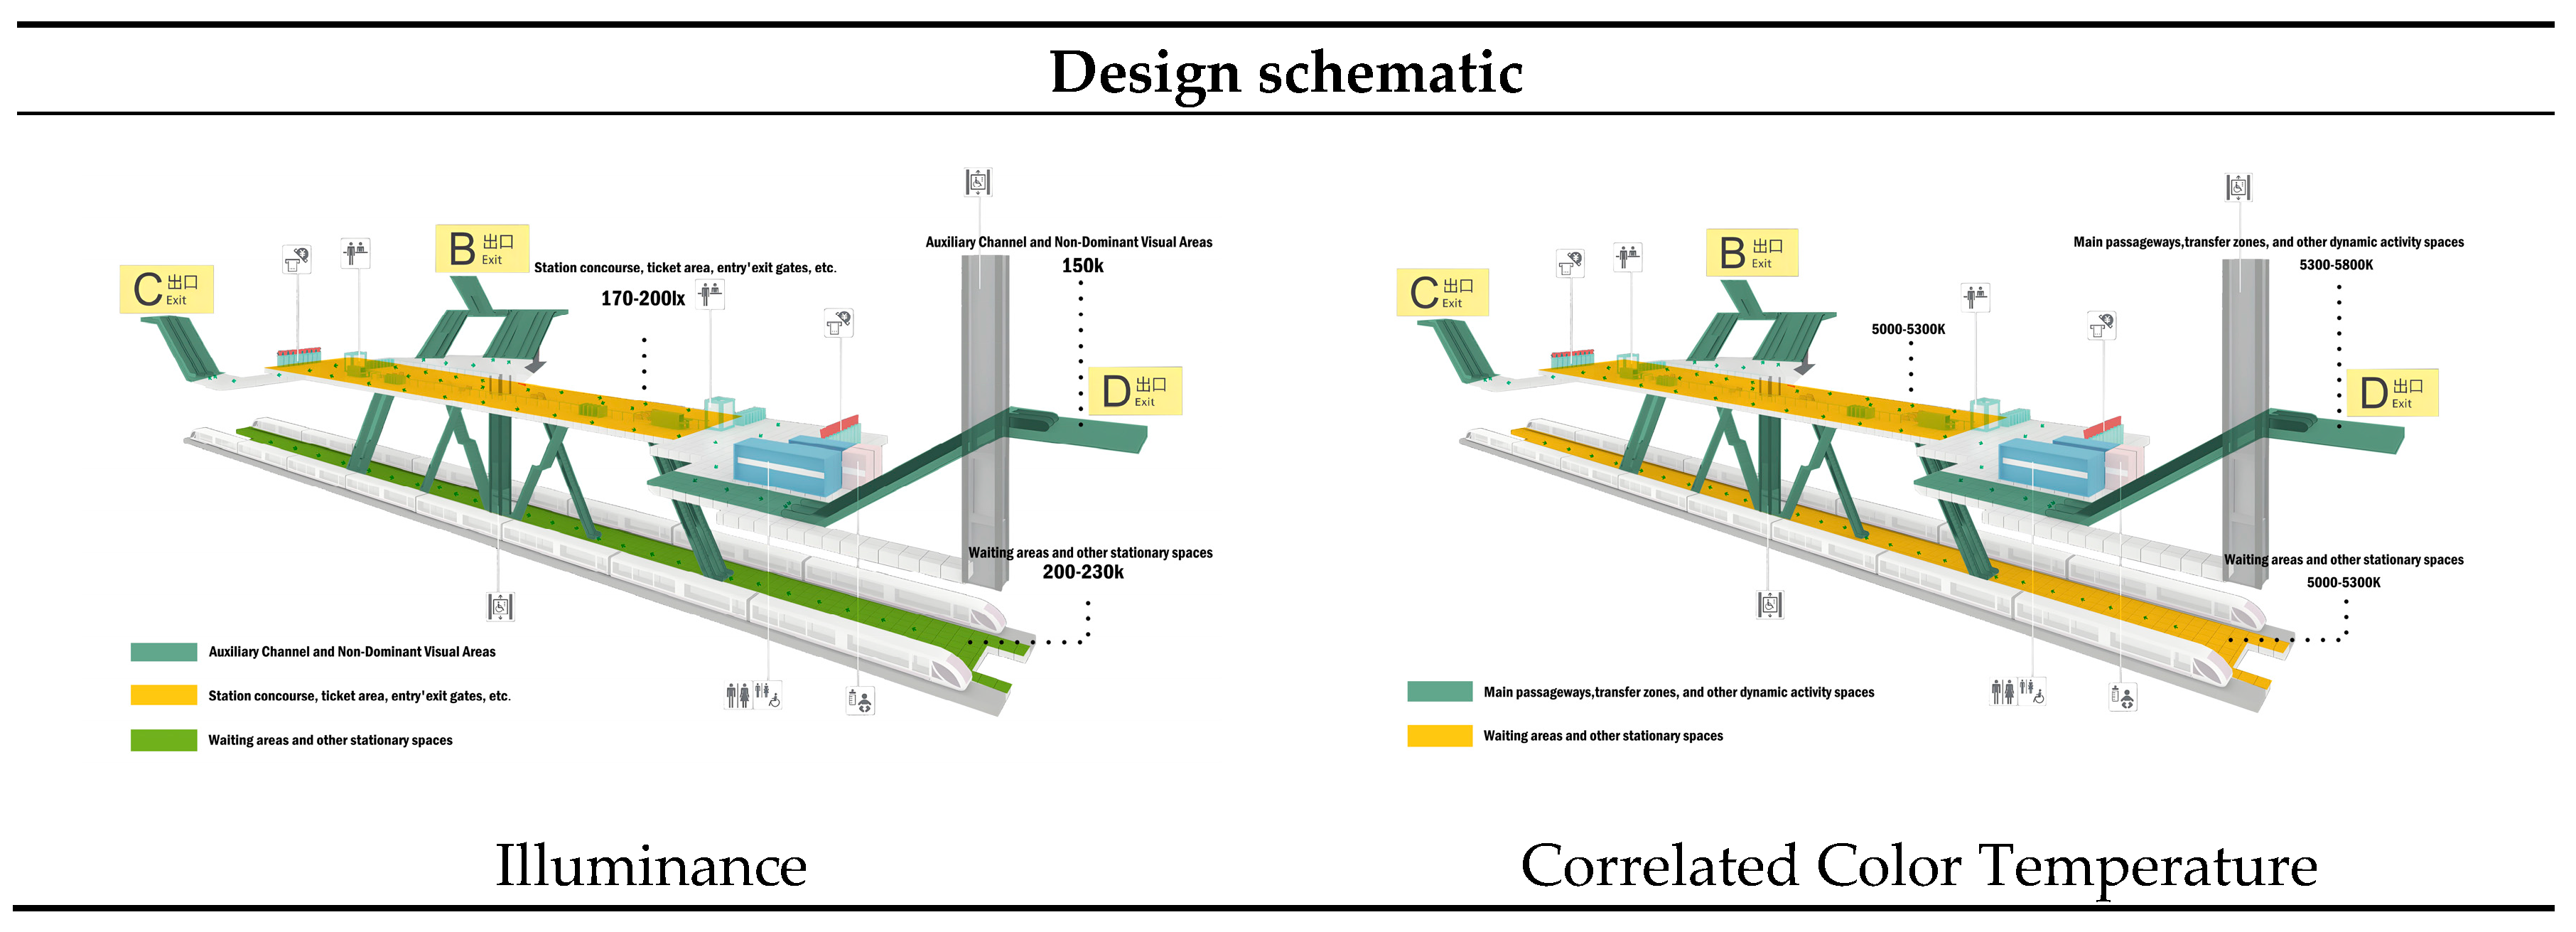
Regarding universal design strategies, parameter adaptation must align with spatial functional requirements. This involves making precise adjustments within the appropriate parameter ranges for the four material combinations. High-traffic zones such as station concourses, ticketing areas, and entry/exit points featuring light-coloured, low-gloss finishes can use higher illuminance levels (200–230 lux) and higher color temperatures (6000 K+) to improve wayfinding and reduce the perception of reduced safety during crowding. In dwell zones (e.g., waiting areas and rest platforms), moderate to low illuminance (170–200 lux) and medium color temperatures (5000–5500 K) are recommended. Strict glare control is essential in high-gloss areas to prevent visual fatigue. Auxiliary passageways should use low illumination (approximately 150 lux) and prioritize light-coloured, low-gloss materials to balance energy consumption and visibility (Figure 10).
To adapt the lighting parameters dynamically, the color temperature is increased by 100–200 K within the specified range of the material during the morning rush hour (7:00–9:00) to heighten alertness. At night (19:00–23:00), the color temperature is lowered to the lower limit of the specified range to enhance comfort and conserve energy. When selecting materials, prioritize combinations of light-coloured, low-gloss finishes, which offer excellent visual guidance, low glare risk, and adaptability to a range of ceiling heights. Exercise caution with high-gloss flooring, particularly in dark settings, where strict limits on ceiling height and illuminance must be enforced. Dark materials require a ceiling height of 4.8 m and sufficient illuminance to prevent oppressive effects and visual blind spots.
In summary, implementing dynamic, adaptive lighting parameter control based on interface design—namely, ceiling height and material selection—across different functional spaces provides a framework for achieving precise, human-centered design within metro environments. It should be noted that the conclusions of this study primarily apply to underground stations with spatial layouts, passenger flow characteristics, and construction standards similar to those of the Shanghai and Xuzhou metro systems. Further validation of these conclusions is required for stations employing open-plan or above-ground concourses, or those featuring special structural configurations. To facilitate wider application, designers should initially evaluate the similarity of their station’s spatial dimensions (e.g., ceiling height and aspect ratio) and interface material properties (e.g., reflectance and color) to the typical case studies presented herein, informing relevant design decisions.

5. Conclusions

5.1. Research Findings and Practical Implications

This study employed a cross-scale data fusion methodology, combining subjective questionnaires with eye-tracking data. Shanghai and Xuzhou metro stations were used as case studies. This study revealed the combined effect of interface design parameters (e.g., ceiling height and interface material) and lighting environment parameters on visual comfort and perceived safety in metro public spaces. The findings indicate that combinations of light-colored, low-gloss materials can significantly improve visual guidance. The comfortable lighting range spans illuminance levels of 140–270 lux and color temperatures of 4428–6250 K, with parameters requiring adaptation to specific contextual characteristics. Ceiling height directly influences spatial openness and thus safety perception while also synergistically affecting light propagation and perceptual thresholds for luminous parameters. Higher ceilings require an increase in illuminance of 10–15% and a rise in color temperature of 100–200 K to mitigate the reduced perception of safety caused by visual blind spots in dark environments, while lower ceilings require a reduction of 5–10% to minimize the diminished perception of comfort and safety caused by glare. In practice, the optimal parameter ranges identified for the four scenarios studied here can inform the design of metro spaces to enhance visual comfort and safety perception, overcoming the limitations of traditional single-parameter optimization.
This study validated the efficacy of eye-tracking metrics as an objective evaluation criterion, thereby refining the ‘interface design parameters–lighting parameters’ system quality assessment framework. The interaction patterns revealed by this study have shifted design principles from singular adjustments towards collaborative optimization. This provides scientific support for human-centered lighting design in metro environments and enhances the quality of underground spaces.

5.2. Research Limitations and Prospects

Focusing on the combined effects of light environment parameters and interface design meant that complex factors such as spatial flow lines, wayfinding systems, and dynamic pedestrian flows received limited coverage. Consequently, the interaction mechanisms of multiple variables within actual metro spaces have not yet been fully revealed. Regarding perceptual data, comfort, and safety assessments have relied primarily on subjective ratings and eye tracking, excluding multimodal indicators such as skin conductance and electroencephalography (EEG). The objectivity and comprehensiveness of the evaluation framework could be improved. Future research could encompass additional variables, such as spatial layout and wayfinding design. Dynamic crowd behavior, environmental acoustics, and thermal comfort parameters could make virtual experiments more realistic. At the same time, incorporating multimodal physiological monitoring, including EEG and ECG, would facilitate the development of a more comprehensive evaluation framework. Exploring spatial design variations across urban contexts would strengthen the findings’ generalisability.

Author Contributions

Conceptualization, L.S., Z.C. and H.L.; Methodology, L.S., Z.C., Y.Z. and Z.S.; Software, L.S. and Z.C.; Validation, L.S.; Formal analysis, L.S., Z.C. and Z.S.; Investigation, L.S. and Z.C.; Data curation, L.S. and Z.C.; Writing—original draft, L.S., Z.C. and H.L.; Writing—review & editing, L.S., Z.C. and Z.S.; Visualization, Z.C., H.L., Y.Z., X.Z. and Z.L.; Supervision, L.S.; Project administration, L.S.; Funding acquisition, L.S. All authors have read and agreed to the published version of the manuscript.

Funding

This research received no external funding.

Institutional Review Board Statement

This research involves human participants through non-sensitive methods such as questionnaires. As the research poses minimal risk and does not involve sensitive data, formal ethical approval was not required. However, we confirm that informed consent was obtained from all participants prior to the experiments, and their privacy and confidentiality were strictly protected throughout the study, in accordance with standard ethical guidelines and was approved by the Institutional Review Board of authors’ affiliation.

Informed Consent Statement

Informed consent was obtained from all subjects involved in the study.

Data Availability Statement

The original contributions presented in the study are included in the article, further inquiries can be directed to the corresponding author.

Conflicts of Interest

All authors certify that they have no affiliations with or involvement in any organisation or entity with any interest or non-financial interest in the subject matter or materials discussed in this manuscript.

References

  1. Kang, H.; Sharston, R.; Shen, J.; Hayes, R. When a Stranger Approaches at Night: The Impact of Adaptive Street Lighting on Safety Perception. LEUKOS 2025, 21, 141–163. [Google Scholar] [CrossRef]
  2. Liu, J.; Yan, H.; White, M.; Huang, X. A comparative analysis of perceptions of insecurity in Milan and Beijing metro stations. Front. Archit. Res. 2025, 14, 863–884. [Google Scholar] [CrossRef]
  3. Zhong, W.; Yang, W.; Zhu, J.; Jia, W.; Dong, X.; Ou, M. An Improved UNet-Based Path Recognition Method in Low-Light Environments. Agriculture 2024, 14, 1987. [Google Scholar] [CrossRef]
  4. Ceccato, V.; Besenecker, U.; Ariel, B.; Eizadi, H.; Höglund, M.; Näsman, P. Assessing safety perceptions and lighting conditions in a metro station. J. Exp. Criminol. 2025, 1–27. [Google Scholar] [CrossRef]
  5. Wen, F.; Peng, L.; Zhang, B.; Zhang, Y.; Zhang, Y. Satisfaction with Nighttime Outdoor Activity Environment Among Elderly Residents in Old Gated Communities. Buildings 2025, 15, 277. [Google Scholar] [CrossRef]
  6. Garcia, M.F.; Mangold, M.; Johansson, T. Examining property and neighborhood effects on perceived safety in urban environments: Proximity to square and heights of buildings. Cities 2024, 150, 105069. [Google Scholar] [CrossRef]
  7. Rezakhani, M.; Mahdavinejad, M.J.; Pilechiha, P. Light in Nightscape and Perception of Security among Pedestrians, Case Study: Tehran. Adv. Eng. Forum 2018, 4868, 46–56. [Google Scholar] [CrossRef]
  8. Bullough, J.D.; Snyder, J.D.; Kiefer, K. Impacts of average illuminance, spectral distribution, and uniformity on brightness and safety perceptions under parking lot lighting. Light. Res. Technol. 2020, 52, 626–640. [Google Scholar] [CrossRef]
  9. Narendran, N.; Freyssinier, J.P.; Zhu, Y. Energy and user acceptability benefits of improved illuminance uniformity in parking lot illumination. Light. Res. Technol. 2016, 48, 789–809. [Google Scholar] [CrossRef]
  10. Dong, L.; He, Y.; Chen, X.; Cheng, N.; Liu, T. Optimization of underground open intermediary space comfort in TOD complexes: A case study of Chongqing, China. Front. Public Health 2023, 11, 1108750. [Google Scholar]
  11. Bellia, L.; Błaszczak, U.; Diglio, F.; Fragliasso, F. Light-environment interactions and integrative lighting design: Connecting visual, non-visual and energy requirements in a case study experiment. Build. Environ. 2024, 253, 111323. [Google Scholar] [CrossRef]
  12. Shi, S.; Yang, Y.; Yu, J.; Zeng, Y.; Lin, B. Effects of eye illuminance and correlated color temperature on subjective visual comfort, mood, and alertness in high-space buildings. Build. Environ. 2025, 283, 113382. [Google Scholar] [CrossRef]
  13. Du, X.; Zhao, S.; Zhang, D.; Yu, Y. Comparative analysis of light environment perception, eye movement, and physiology in university professional classroom based on virtual reality experiment. Indoor Built Environ. 2023, 32, 1152–1169. [Google Scholar] [CrossRef]
  14. Yu, L.; Kang, J.; Xu, Z.; Zhang, J.; Tao, J. Evaluation and quantification of sound intelligibility (SdI): Metro commercial spaces as an example. Build. Environ. 2024, 265, 112011. [Google Scholar] [CrossRef]
  15. Chung, Y. A Study on The Luminous Environment Investigation of Subway Stations In SEOUL—Comparison with the Artificial Lighting Design and Daylighting Design. J. Korean Inst. Illum. Electr. Install. Eng. 2004, 18, 40–47. [Google Scholar]
  16. Xu, J.; Xiang, Z.; Zhi, J.; Xu, X.; He, S.; Wang, J.; Du, Y.; Xu, G. Research on Virtual Simulation Evaluation System for Passenger Compartments Lighting of Subway Trains in China; Springer: Cham, Switzerland, 2019; pp. 343–353. [Google Scholar]
  17. Liao, P.; Chen, L.; Liang, Z.; Huang, Y.; Chen, H.; Sun, L. Investigating the optimal scale for subway station hall designs based on psychological perceptions and eye-tracking methods. J. Build. Eng. 2025, 103, 112175. [Google Scholar] [CrossRef]
  18. Guo, X.; Cui, W.; Lo, T.; Hou, S. Research on dynamic visual attraction evaluation method of commercial street based on eye movement perception. J. Asian Archit. Build. Eng. 2022, 21, 1779–1791. [Google Scholar]
  19. Gao, X.; Geng, Y.; Spengler, J.D.; Long, J.; Liu, N.; Luo, Z.; Kalantari, S.; Zhuang, W. Evaluating the impact of spatial openness on stress recovery: A virtual reality experiment study with psychological and physiological measurements. Build. Environ. 2025, 269, 112434. [Google Scholar] [CrossRef]
  20. Hu, X.; Li, N.; Gu, J.; He, Y.; Yongga, A. Lighting and thermal factors on human comfort, work performance, and sick building syndrome in the underground building environment. J. Build. Eng. 2023, 79, 107878. [Google Scholar] [CrossRef]
  21. Iacomussi, P.; Radis, M.; Rossi, G.; Rossi, L. Visual Comfort with LED Lighting. Energy Procedia 2015, 78, 729–734. [Google Scholar] [CrossRef]
  22. Shi, L.; Li, Y.; Tao, L.; Zhang, Y.; Jiang, X.; Yang, Z.; Qi, X.; Qiu, J. Sporters’ visual comfort assessment in gymnasium based on subjective evaluation & objective physiological response. Build. Environ. 2022, 225, 109678. [Google Scholar] [CrossRef]
  23. Choe, S.; Han, S. Applicability of Assessment Indices for Hanok-User Sensory Comfort Based on Visual and Tactile Comfort Evaluation Indicators. Sustainability 2021, 13, 11511. [Google Scholar] [CrossRef]
  24. Wang, J.; Ma, S.; Liu, Y.; Wang, Y.; Song, W. Effects of Luminance Contrast on Depth Perception in Optical See-Through Augmented Reality. LEUKOS 2023, 20, 194–208. [Google Scholar] [CrossRef]
  25. Gao, Y.; Cui, S.; Ren, S.; Zhang, Y. Touring Pattern of Chinese Classical Gardens Based on VR and Eye Tracking Experiment: A Case Study of Canglang Pavilion Garden in Suzhou City. J. Landsc. Res. 2024, 16, 94–98. [Google Scholar]
  26. Fan, X.; Yan, Y.; Yin, E.; Cai, M.; Xie, L.; Wang, N. Evaluation of VR/AR Visual Comfort Based on Color Perception; Springer: Cham, Switzerland, 2021; pp. 108–119. [Google Scholar]
  27. Pang, X.; Jia, M.; Zhang, Y. Campus landscape perception decoded by surveys combined with eye tracking: Visual and cultural perception for user well-being. Build. Environ. 2025, 283, 113341. [Google Scholar] [CrossRef]
  28. Xu, Z.; Sun, R. A Study on the Visual Perception and Emotional Differences of Urban Residents Towards Urban Spatial Elements from the Perspective of Xiangchou—An Analysis of Xiaoyaojin Park in Hefei. Buildings 2025, 15, 1209. [Google Scholar] [CrossRef]
  29. Liu, R.; Neisch, P. Measuring the effectiveness of street renewal design: Insights from visual preference surveys, deep-learning technology, and eye-tracking simulation software. Landsc. Urban Plan. 2025, 256, 105291. [Google Scholar] [CrossRef]
  30. GB/T 16275-2008; Urban Rail Transit Lighting. General Administration of Quality Supervision, Inspection and Quarantine of the People’s Republic of China, Standardization Administration of the People’s Republic of China: Beijing, China, 2008.
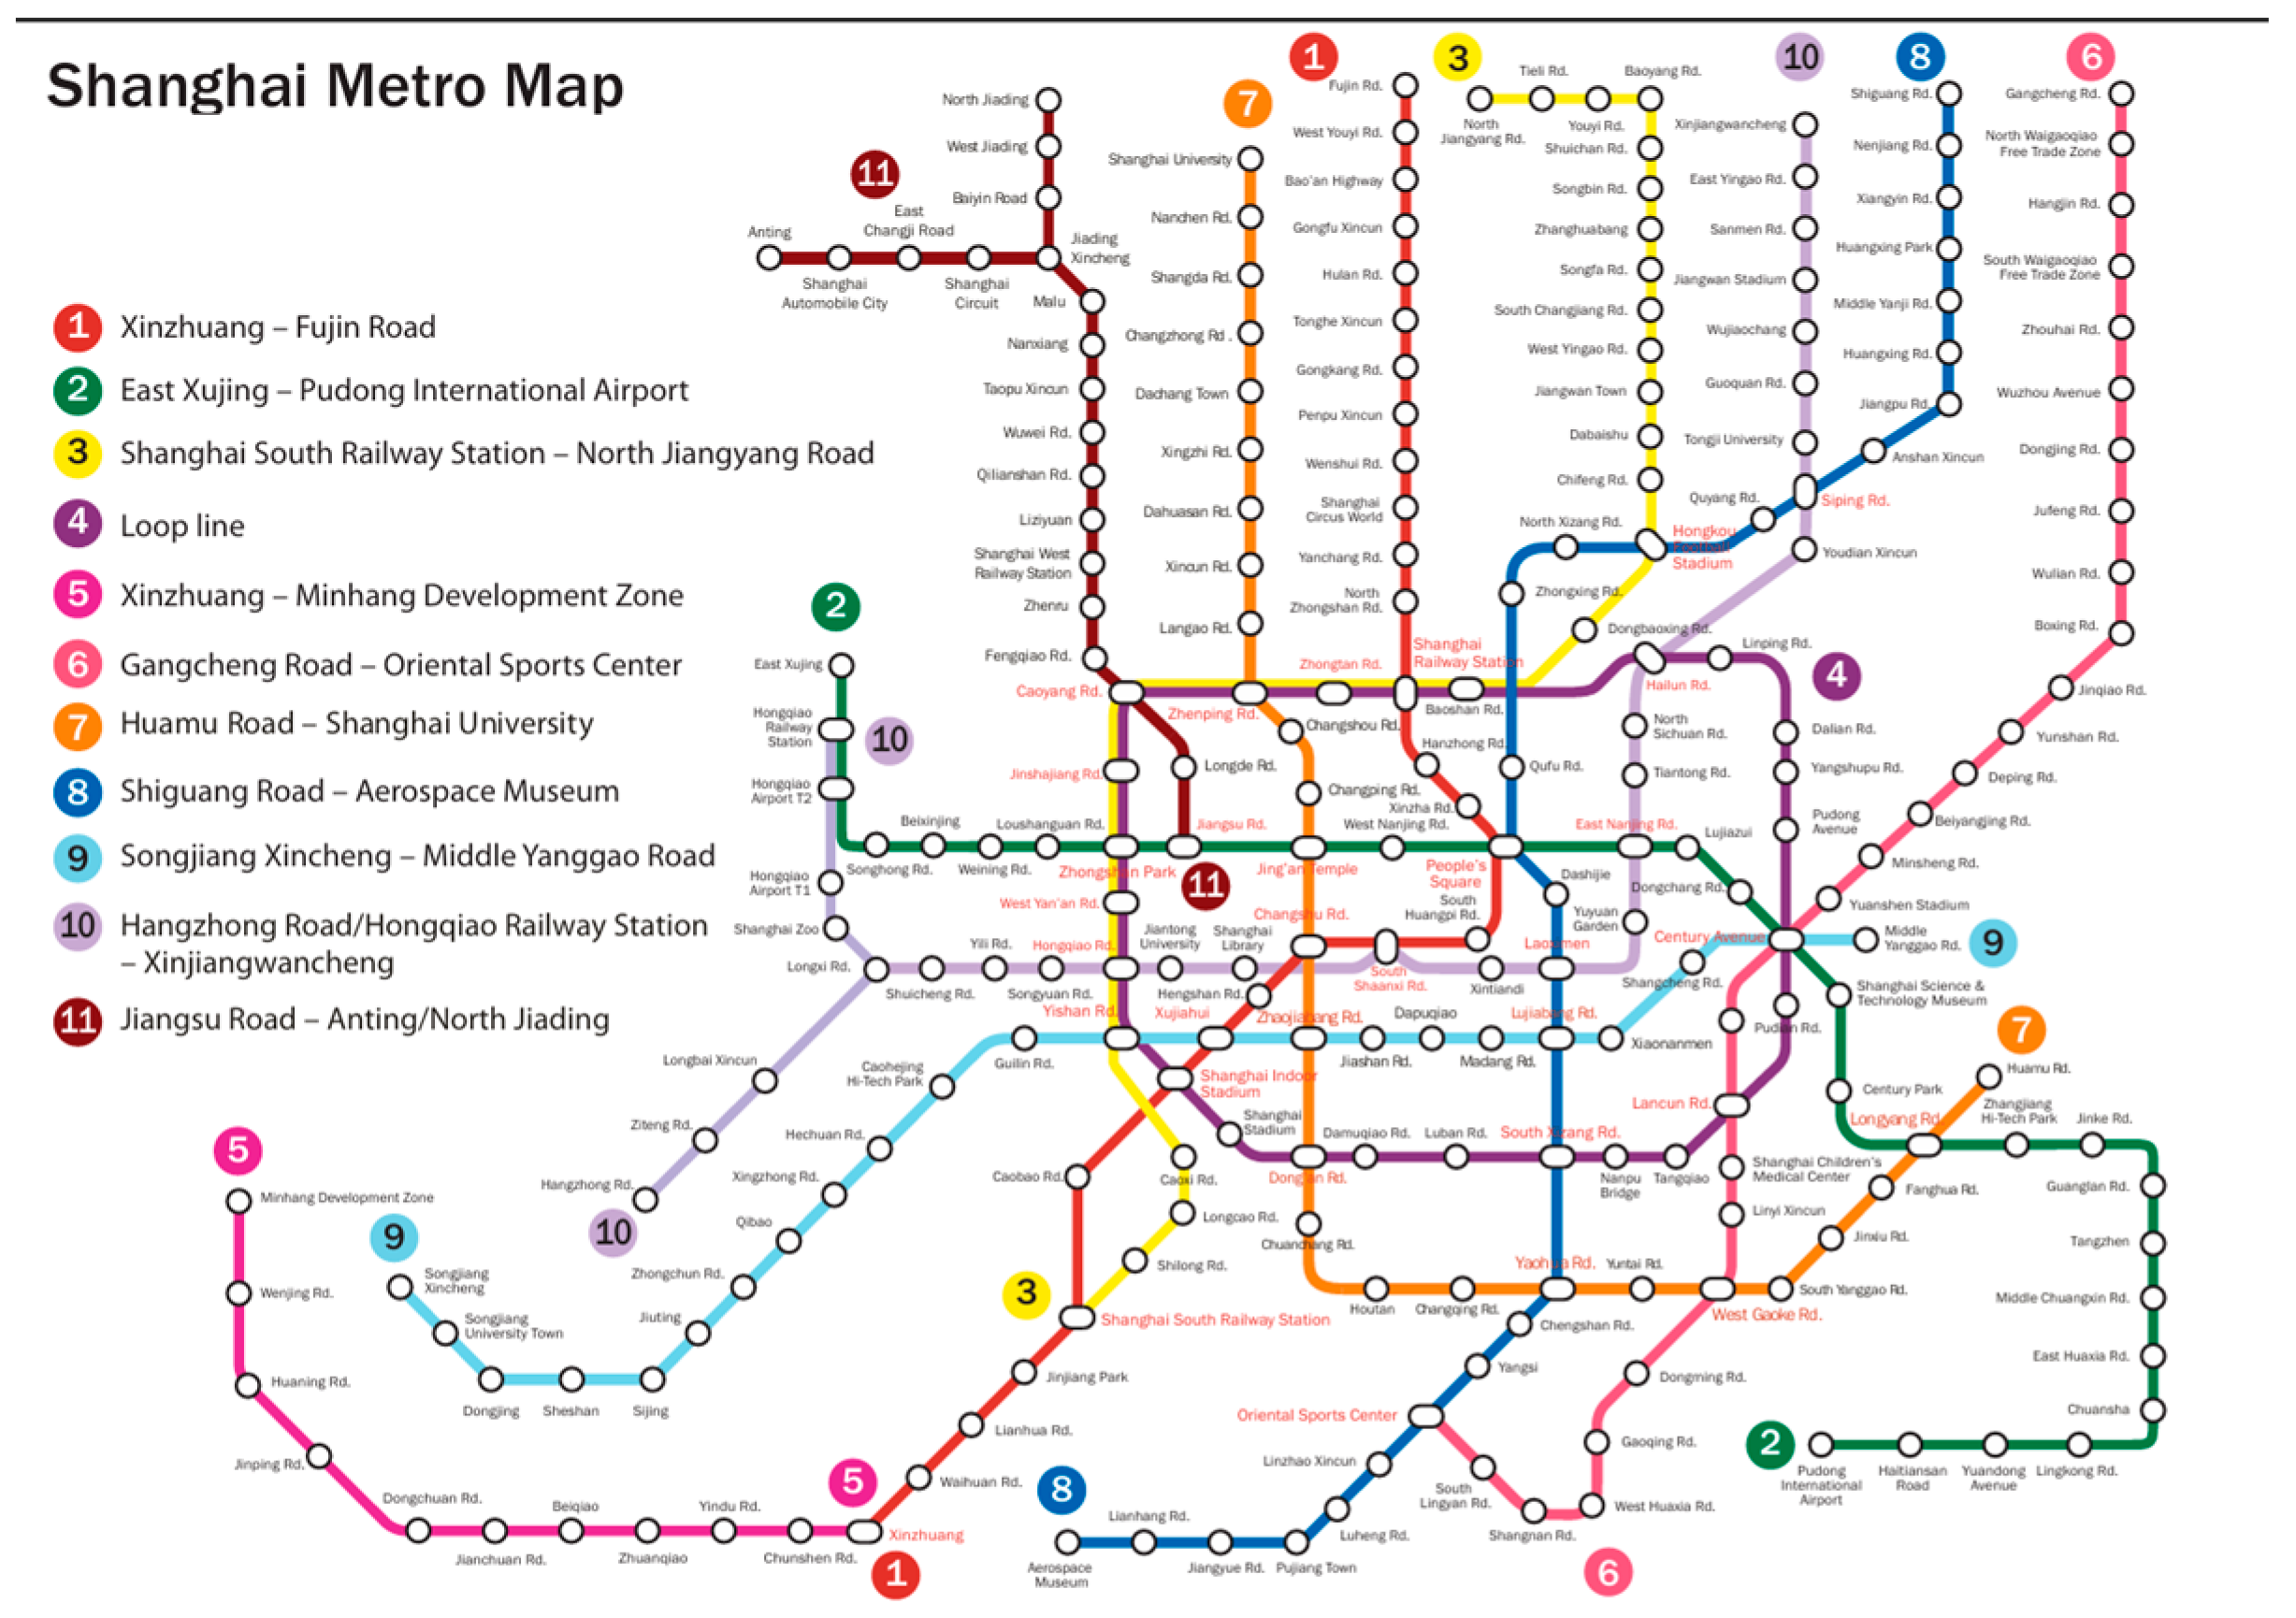
Figure 1. Shanghai Metro Line Map. Image source: Internet.
Buildings 15 03796 g001
Figure 2. Partial Virtual Scene Diagram.
Buildings 15 03796 g002
Figure 3. Correlation Heatmap of Four Categories of Ground-Level Subway Public Spaces.
Buildings 15 03796 g003aBuildings 15 03796 g003b
Figure 4. Light-colored decoration and Low-gloss floor Eye-Tracking Diagram.
Buildings 15 03796 g004
Figure 5. Light-Colored Décor and High-Gloss Floor Eye-Tracking Diagram.
Buildings 15 03796 g005
Figure 6. Dark Decor and Low-Gloss Floor Eye-Tracking Diagram.
Buildings 15 03796 g006
Figure 7. Dark Decor and High-Gloss Floor Eye-Tracking Diagram.
Buildings 15 03796 g007
Figure 8. Regression Curve for Partial Subway Public Space.
Buildings 15 03796 g008aBuildings 15 03796 g008b
Figure 9. Schematic Diagram of Comprehensive Visual Perception and Key Factor Rating Intervals.
Buildings 15 03796 g009
Figure 10. Partition Design Diagram.
Buildings 15 03796 g010
Table 1. Objective physiological indicators of subjects in environments with varying ceiling heights.
Ceiling Height (m)Pupillary Instability IndexSaccade CountTotal Fixation DurationBlink Rate
4.50.174 ± 0.009142.8 ± 3.45.66 ± 0.172.6 ± 0.5
5.00.210 ± 0.011153.5 ± 2.34.91 ± 0.144.1 ± 0.3
Table 2. Design Range for Optimal Lighting Environment Parameters in Four Types of Subway Public Spaces.
Material Scenario TypeRecommended Lighting Environment Parameters
Ceiling HeightIlluminanceCCT (K)
Light-color decoration + Low-polish floor120–260 lx6106–6470 K
Light-color decoration + High-polish floor4.7–4.8 m4425–5480 K
Dark-color decoration + Low-polish floor4.8–5 m150–176 lx5525–6100 K
Dark-color decoration + High-polish floor4.6–4.9 m220–300 lx5600–6250 K
Table 3. Scenario Design Diagram.
Design Schematic
Buildings 15 03796 i001Buildings 15 03796 i002Buildings 15 03796 i003Buildings 15 03796 i004
ceiling height: 4.5 m
Illuminance: 300 lx
CCT: 6300
ceiling height: 4.5 m
Illuminance: 190 lx
CCT: 6300 K
ceiling height:4.5 m
Illuminance:190 lx
CCT: 5300 K
ceiling height:5 m
Illuminance:190 lx
CCT: 6300 K
Light-coloured decor + low-gloss flooring materials sceneLight-colored décor + high-gloss flooring material settingDark décor + low-gloss flooring materials sceneDark décor + high-gloss flooring material setting
Disclaimer/Publisher’s Note: The statements, opinions and data contained in all publications are solely those of the individual author(s) and contributor(s) and not of MDPI and/or the editor(s). MDPI and/or the editor(s) disclaim responsibility for any injury to people or property resulting from any ideas, methods, instructions or products referred to in the content.