Article

Shear Strength of Double-Skin Truss-Reinforced Composite Shear Walls: Finite Element Analysis

1
BIM and Intelligent Construction Industry-Education Integration Research Center, School of Civil Engineering, Xinjiang Institute of Engineering, Urumqi 830023, China
2
School of Civil Engineering and Architecture, Xinjiang University, Urumqi 830047, China
3
School of Civil Engineering, Southeast University, Nanjing 211189, China
*
Author to whom correspondence should be addressed.
Buildings 2025, 15(20), 3788; https://doi.org/10.3390/buildings15203788
Submission received: 22 August 2025 / Revised: 12 October 2025 / Accepted: 17 October 2025 / Published: 20 October 2025
(This article belongs to the Section Building Structures)

Abstract

This study investigates the shear behavior of double-skin truss-reinforced composite shear walls through finite element analysis validated by published tests. Parametric studies reveal that the shear strength increases with the axial compression ratio up to a threshold of 0.6, beyond which it declines. However, increasing the aspect ratio significantly decreases the shear strength when the aspect ratio does not exceed 2.5. Additionally, increasing the spacing–thickness ratio reduces the shear strength, with a recommended limit of 60. Truss connector specifications are found to have a minor impact on the shear resistance. A new design formula for predicting the ultimate shear strength is established based on finite element analysis (FEA), which yields relatively conservative predictions with acceptable accuracy.

1. Introduction

The shear strength of double-skin composite shear walls is critical for their seismic design, yet predictive models for the truss-reinforced type remain limited and lack comprehensive validation. This study aims to address this gap by developing a reliable shear strength design equation through finite element analysis and parametric investigation. The double-skin truss-reinforced composite shear wall is a type of composite shear wall that utilizes truss connectors, initially proposed by Zhejiang Southeast Space Frame Co., Ltd. (Hangzhou, China) and Southeast University. The truss connector consists of two angle steels serving as chords and one corrugated steel bar serving as a web. The truss connectors have a smooth outer shape, facilitating positioning and welding on the steel plates. Moreover, the hollow structure in the middle does not affect concrete pouring, allowing for rapid manufacturing and construction of the double-skin composite shear walls. Extensive research has been conducted on the performance of double-skin truss-reinforced composite shear walls. Qin et al. [1,2] conducted compression tests on full-scale specimens with high aspect ratios, investigating the effects of truss connector spacing, outer steel plate thickness, and wall section form on axial compression performance. The test results confirmed that the truss connectors provide effective out-of-plane support for the outer steel plates. Liu et al. [3] and Luo et al. [4] conducted compression tests and numerical simulation analyses on double-skin truss-reinforced composite shear wall specimens with low aspect ratios. They studied the effects of spacing-thickness ratio, truss connector steel bar diameter and node spacing, and eccentric loads on the axial compression performance of the walls. Qin et al. [5] investigated the seismic performance of four types of double-skin truss-reinforced composite shear wall-steel beam joints through cyclic load tests and provided design suggestions for the joint connections. Han et al. [6,7,8] conducted cyclic load tests on full-scale double-skin truss-reinforced composite shear walls, analyzing the effects of aspect ratio, axial compression ratio, spacing-thickness ratio, and section type on seismic performance indicators such as failure mode, strength, ductility, stiffness, and energy dissipation capacity. Based on this, they established design formulas for the shear strength and flexural strength of double-skin truss-reinforced composite shear wall.
However, due to the limited number of specimens and constraints of measurement equipment, a more cost-effective and efficient approach is needed to understand the transmission mechanism, stress distribution, and the impact of key design parameters on the performance of double-skin truss-reinforced composite shear walls. Notably, there is currently no validated shear strength model for truss-reinforced double-skin walls under the studied loading protocol. Finite element simulation is an effective numerical analysis method for increasing the number of research samples and observing details of the working state of walls. The typical approach is to establish finite element models with the same geometric and material properties as the specimens based on a limited number of experimental results. These models are then validated under consistent boundary constraints and load histories to verify the accuracy of the finite element analysis results. Subsequently, model parameters are adjusted to expand the sample size. Behavior patterns are then summarized using statistical methods, and strength design formulas are derived. Finite element analysis of double-skin composite shear walls has been reported, with parametric analyses primarily focusing on the influence of model parameters such as aspect ratio, axial compression ratio, material strength, and steel plate thickness on axial strength [9,10,11] or shear strength [12]. The main achievements of finite element analysis are the design formulas for wall compressive strength [13,14], flexural strength [15,16,17], and shear strength [18,19]. In the following chapters, based on existing seismic test results, finite element models will be established for double-skin truss-reinforced composite shear walls. Parametric analysis will be conducted on impact factors such as axial compression ratios, aspect ratios, spacing-thickness ratios, and specifications of truss connectors. The influence of each parameter on the seismic performance of such composite shear walls will be summarized, and a design formula for shear resistance capability will be established, aiming to provide a theoretical basis for further research on the performance of this type of wall.
This study specifically investigates the shear strength of double-skin truss-reinforced composite shear walls through finite element analysis. The scope covers the effects of the axial compression ratio (0.1–0.8), aspect ratio (0.75–4.3), spacing–thickness ratio (37.5–100), and truss connector specifications. The models, subjected to cyclic horizontal loading, are validated against experimental data from Han et al. [6], with shear capacity serving as the primary comparison metric. The objectives are to develop, and then validate within the studied parameter ranges, a new ultimate-shear-strength formula that explicitly incorporates both the concrete contribution and the aspect-ratio effect overlooked by current codes, thereby furnishing designers with an accurate yet conservative predictor for this wall type.

2. Benchmark Tests for Finite Element Model

The finite element models (FEMs) developed in this study were rigorously validated against a series of cyclic tests conducted by Han et al. [6]. The validation involved seven full-scale, rectangular double-skin truss-reinforced composite shear wall specimens (SCW-1 to SCW-7). The key parameters of these benchmark specimens are summarized in Table 1, and the specific dimensions are illustrated in Figure 1. Based on these. All specimens shared a constant wall height of 3000 mm and a thickness of 150 mm, with 4 mm thick external steel plates. The primary variables were the wall width (ranging from 900 mm to 1500 mm), leading to aspect ratios from 2.0 to 3.3, the axial compression ratio (0.4 to 0.6), and the truss spacing (200 mm to 400 mm), resulting in spacing-thickness ratios from 50 to 100. The concrete had a designed compressive strength grade of C25, and the steel plates had a strength grade of Q235B as Chinese standard.
In the benchmark tests [6], a constant axial load, corresponding to the specified axial compression ratio, was first applied and maintained. Subsequently, a quasi-static cyclic horizontal displacement loading protocol, following FEMA 461 guidelines, was applied at the top of the wall. The validation of the FEMs in this study was primarily based on a direct comparison of the failure modes (including local buckling of steel plates and crushing of concrete) and the global load–displacement hysteretic responses. Key comparison metrics included the ultimate shear strength and the overall shape and degradation characteristics of the hysteresis loops.

3. Finite Element Model (FEM)

3.1. Overview

The double-skin truss-reinforced composite shear wall mainly consists of steel plates, rectangular steel tubes, infilled concrete walls, infilled concrete columns, and truss connectors. As shown in Figure 2, the infilled concrete walls and concrete columns are simulated using three-dimensional solid elements (C3D8R). The steel plates, rectangular steel tubes, and angle steels in the truss connector are considered continuous homogeneous thin plates, which are prone to out-of-plane buckling under compression or shear. Therefore, Continuum solid shell elements (CSS8) were used for simulation. The corrugated steel bars in the truss connectors were simulated using three-dimensional truss elements (T3D2). To ensure mesh independence and accuracy, a mesh sensitivity study was conducted based on advanced meshing strategies for nonlinear problems [20]. Three global element sizes (25 mm, 50 mm, and 100 mm) were compared. The results showed that the 50 mm global size provides an optimal balance between computational efficiency, convergence, and the ability to capture buckling deformations of steel plates. Therefore, a uniform global element size of 50 mm was adopted for all components in the model, corresponding to the 50 mm grid drawn on the specimen surfaces during testing. Additionally, local refinement with a 20 mm element size was applied near the steel plates and truss connectors to accurately capture buckling and stress concentrations. This mesh configuration provides a good balance between computational accuracy and efficiency, as confirmed through preliminary convergence studies.
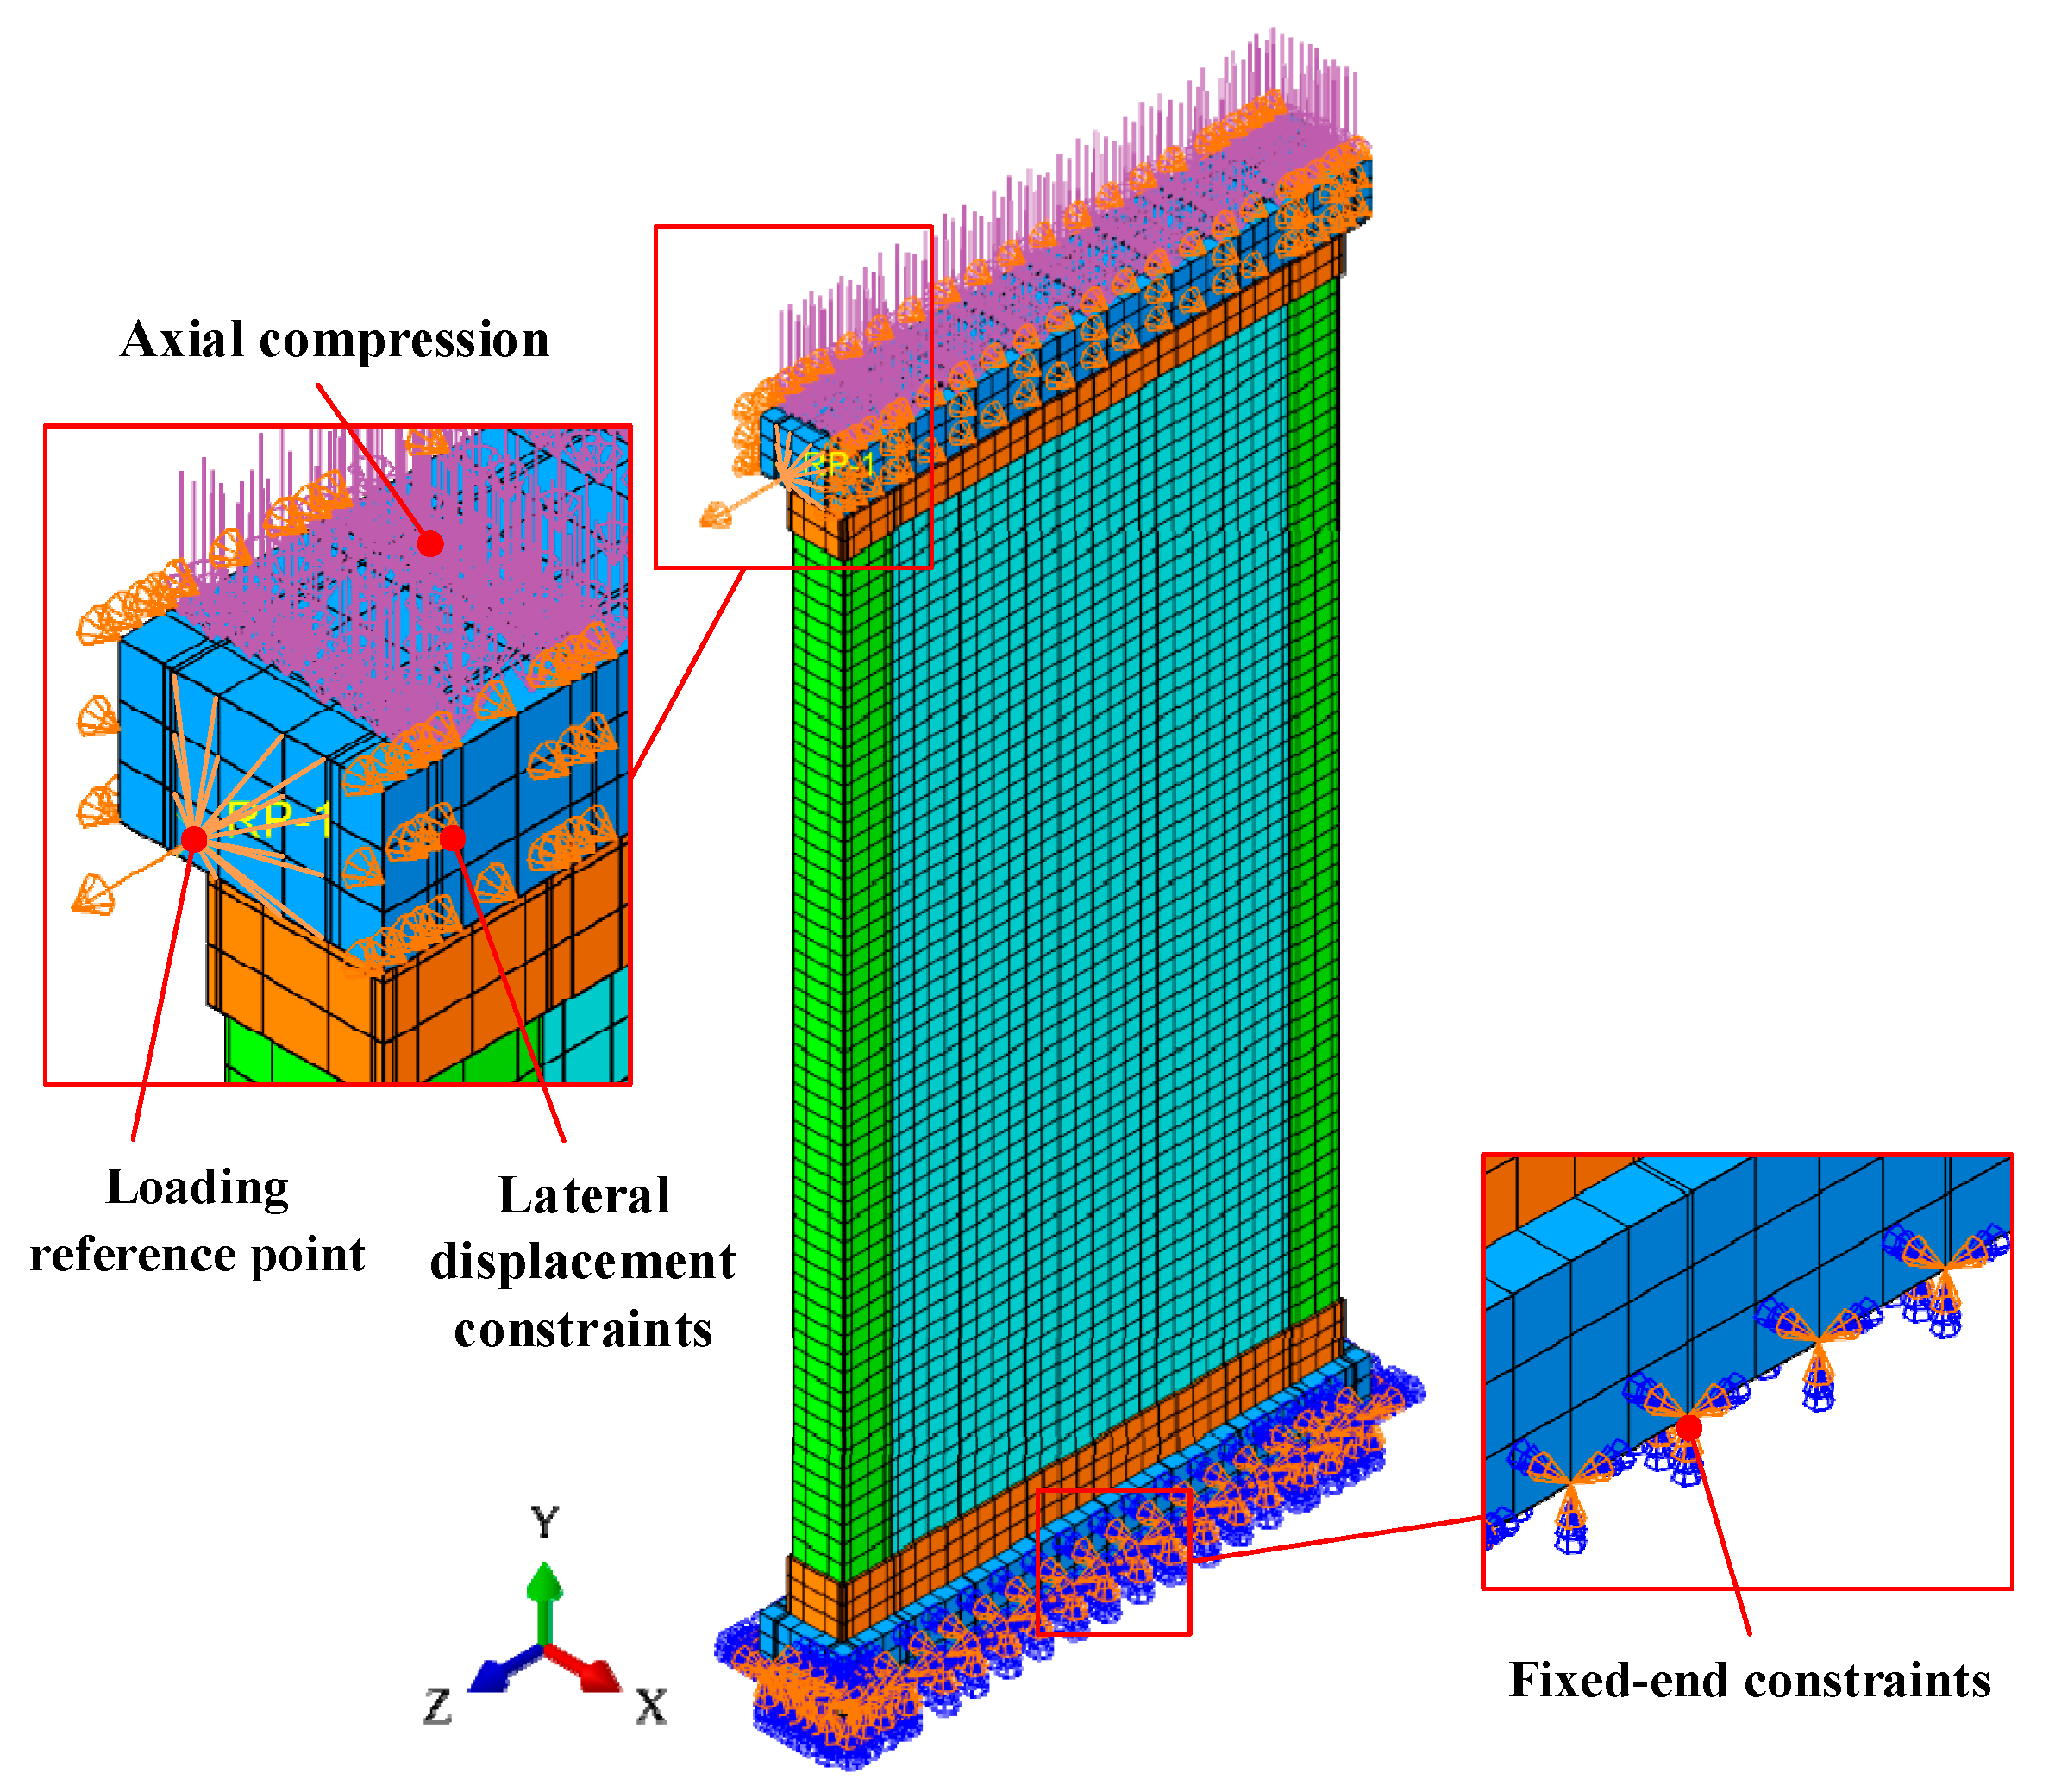
The boundary constraints and loading settings of FEM are shown in Figure 3. The fixed boundary conditions at the base simulate the laboratory test setup where the specimen was bolted to a rigid reaction floor, providing full fixity. This simplification is justified for simulating the global shear response, as the foundation stiffness in the test was significantly higher than the wall stiffness, minimizing base deformation effects [21]. Lateral displacement constraints on the loading beam sides replicate the lateral bracing in the test rig to prevent out-of-plane sway.
The interface between the infilled concrete and the steel components was modeled using a surface-to-surface contact algorithm. “Hard contact” was defined in the normal direction, preventing penetration. The tangential behavior was modeled using Coulomb friction with a friction coefficient (μ) of 0.6 and the “small sliding” formulation. This setup is consistent with that used for modeling similar soil-structure and composite interfaces [20], and the value μ = 0.6 lies within the typical range reported for concrete-steel interfaces (0.4 to 0.8).
“Embed” operation was used to couple the nodes of the waveform steel bars with infilled concrete wall or angle steels. The steel components are “welded” together using the “Merge” operation. Reference points were set at the ends of the loading beam and coupled with the plane of the loading beam ends. Constant vertical loads and cyclic horizontal loads were applied at the loading points to simulate loading conditions. The loading protocol followed a displacement-controlled pattern with specific cyclic sequences. After applying and maintaining constant vertical load, lateral cyclic displacements were imposed at the reference point. The protocol included two cycles each at displacement levels of 2 mm, 4 mm, and 6 mm until reaching 10 mm displacement. Beyond 10 mm, three cycles were applied at each increment of 10 mm. The analysis was terminated when the lateral load capacity dropped below 85% of the maximum recorded value or when numerical convergence became problematic, consistent with standard termination criteria.
To mitigate convergence difficulties associated with material softening, contact nonlinearity, and potential local instabilities, specific solution controls and stabilization procedures were implemented in Abaqus/Standard. The analysis utilized an automatic incrementation scheme with the following key settings to ensure robustness and stability: the maximum number of increments was set to 10,000, allowing the analysis to proceed with very fine step size adjustments if necessary; a small fixed damping factor of 0.000002 was applied using the stabilize method to help overcome transient numerical instabilities without significantly altering the physical response; the initial increment size was set to 0.0001 to improve the initial stability of the nonlinear solution process; the maximum increment size was limited to 0.1 to prevent the solver from skipping critical nonlinear response stages by taking excessively large steps; and the geometric nonlinearity option was activated to account for large deformation effects and ensure the correct formulation of the stiffness matrix. These measures collectively ensured a stable numerical solution throughout the loading history, up to the specified termination criterion, confirming the numerical robustness of the presented results.

3.2. Material Constitutive Model

3.2.1. Steel Material Constitutive Model

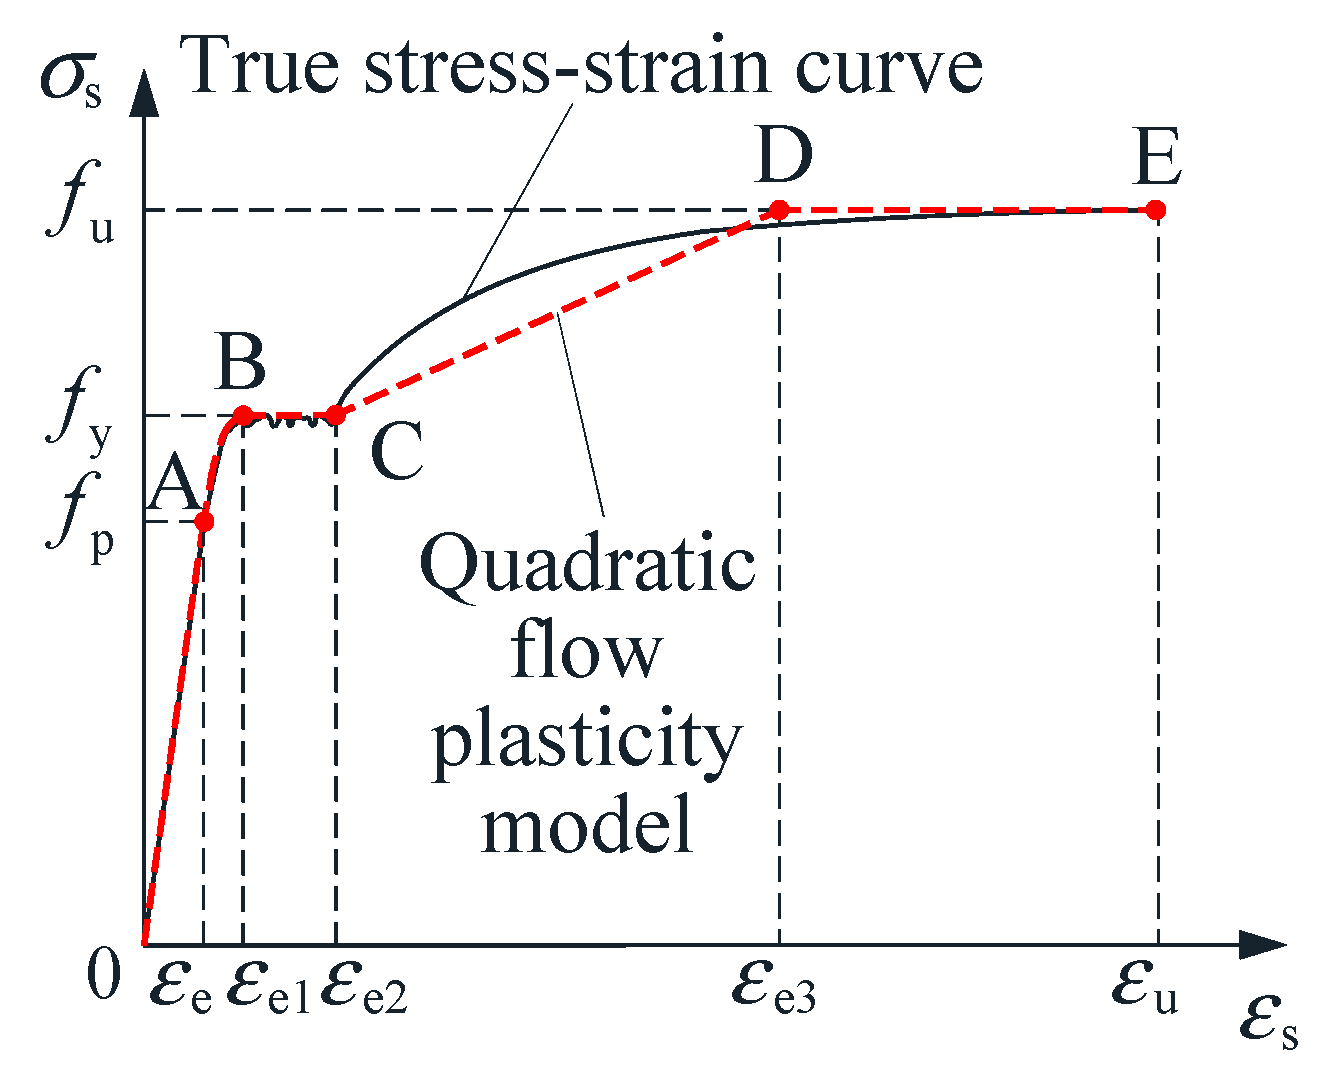
The constitutive model of steel materials in FEM adopts a quadratic flow plasticity model [22] Compared to the bilinear model, the quadratic flow plasticity model can better reflect the true stress–strain relationship of steel materials. The constitutive relationship model is shown in Figure 4. For cyclic loading analyses, an isotropic hardening rule was adopted in conjunction with the quadratic flow plasticity model. This approach is considered appropriate for the scope of this study, as the primary focus is on capturing the peak strength and overall hysteretic energy dissipation of the composite shear walls under the applied displacement amplitudes. The isotropic hardening model provides a reasonable balance between computational efficiency and accuracy in predicting the global cyclic response, as validated by the good agreement with experimental hysteresis loops presented in Section 4.2. The mathematical expression of the quadratic flow plasticity model is shown in Equation (1):
σ s = E s ε s ε s ε e φ 1 ε s 2 + φ 2 ε s + φ 3 ε e < ε s ε e 1 f y ε e 1 < ε s ε e 2 f y + f u f y ε s ε e 2 ε e 3 ε e 2 ε e 2 < ε s ε e 3 f u ε s > ε e 3
Es is steel elastic modulus. fy and fu represents the yield strength and ultimate tensile strength; fp is proportional limit strength of steel, taken as fp = 0.8fy. εe, εe1, εe2, εe3 and εu represent the strains corresponding to point A, B, C, D and E on the stress–strain curve of steel in Figure 4. Specifically, εe = fp/Es, εe1 = 1.5εe, εe2 = 10εe1, εe3 = 100εe1 and εu = 0.4. φ1, φ2 and φ3 are the shape coefficient. φ1 = 0.2fy/(εe1εe)2, φ2 = 2φ1εe1 and φ3 = 0.8fy + φ1εe2φ2εe.

3.2.2. Concrete Material Constitutive Model

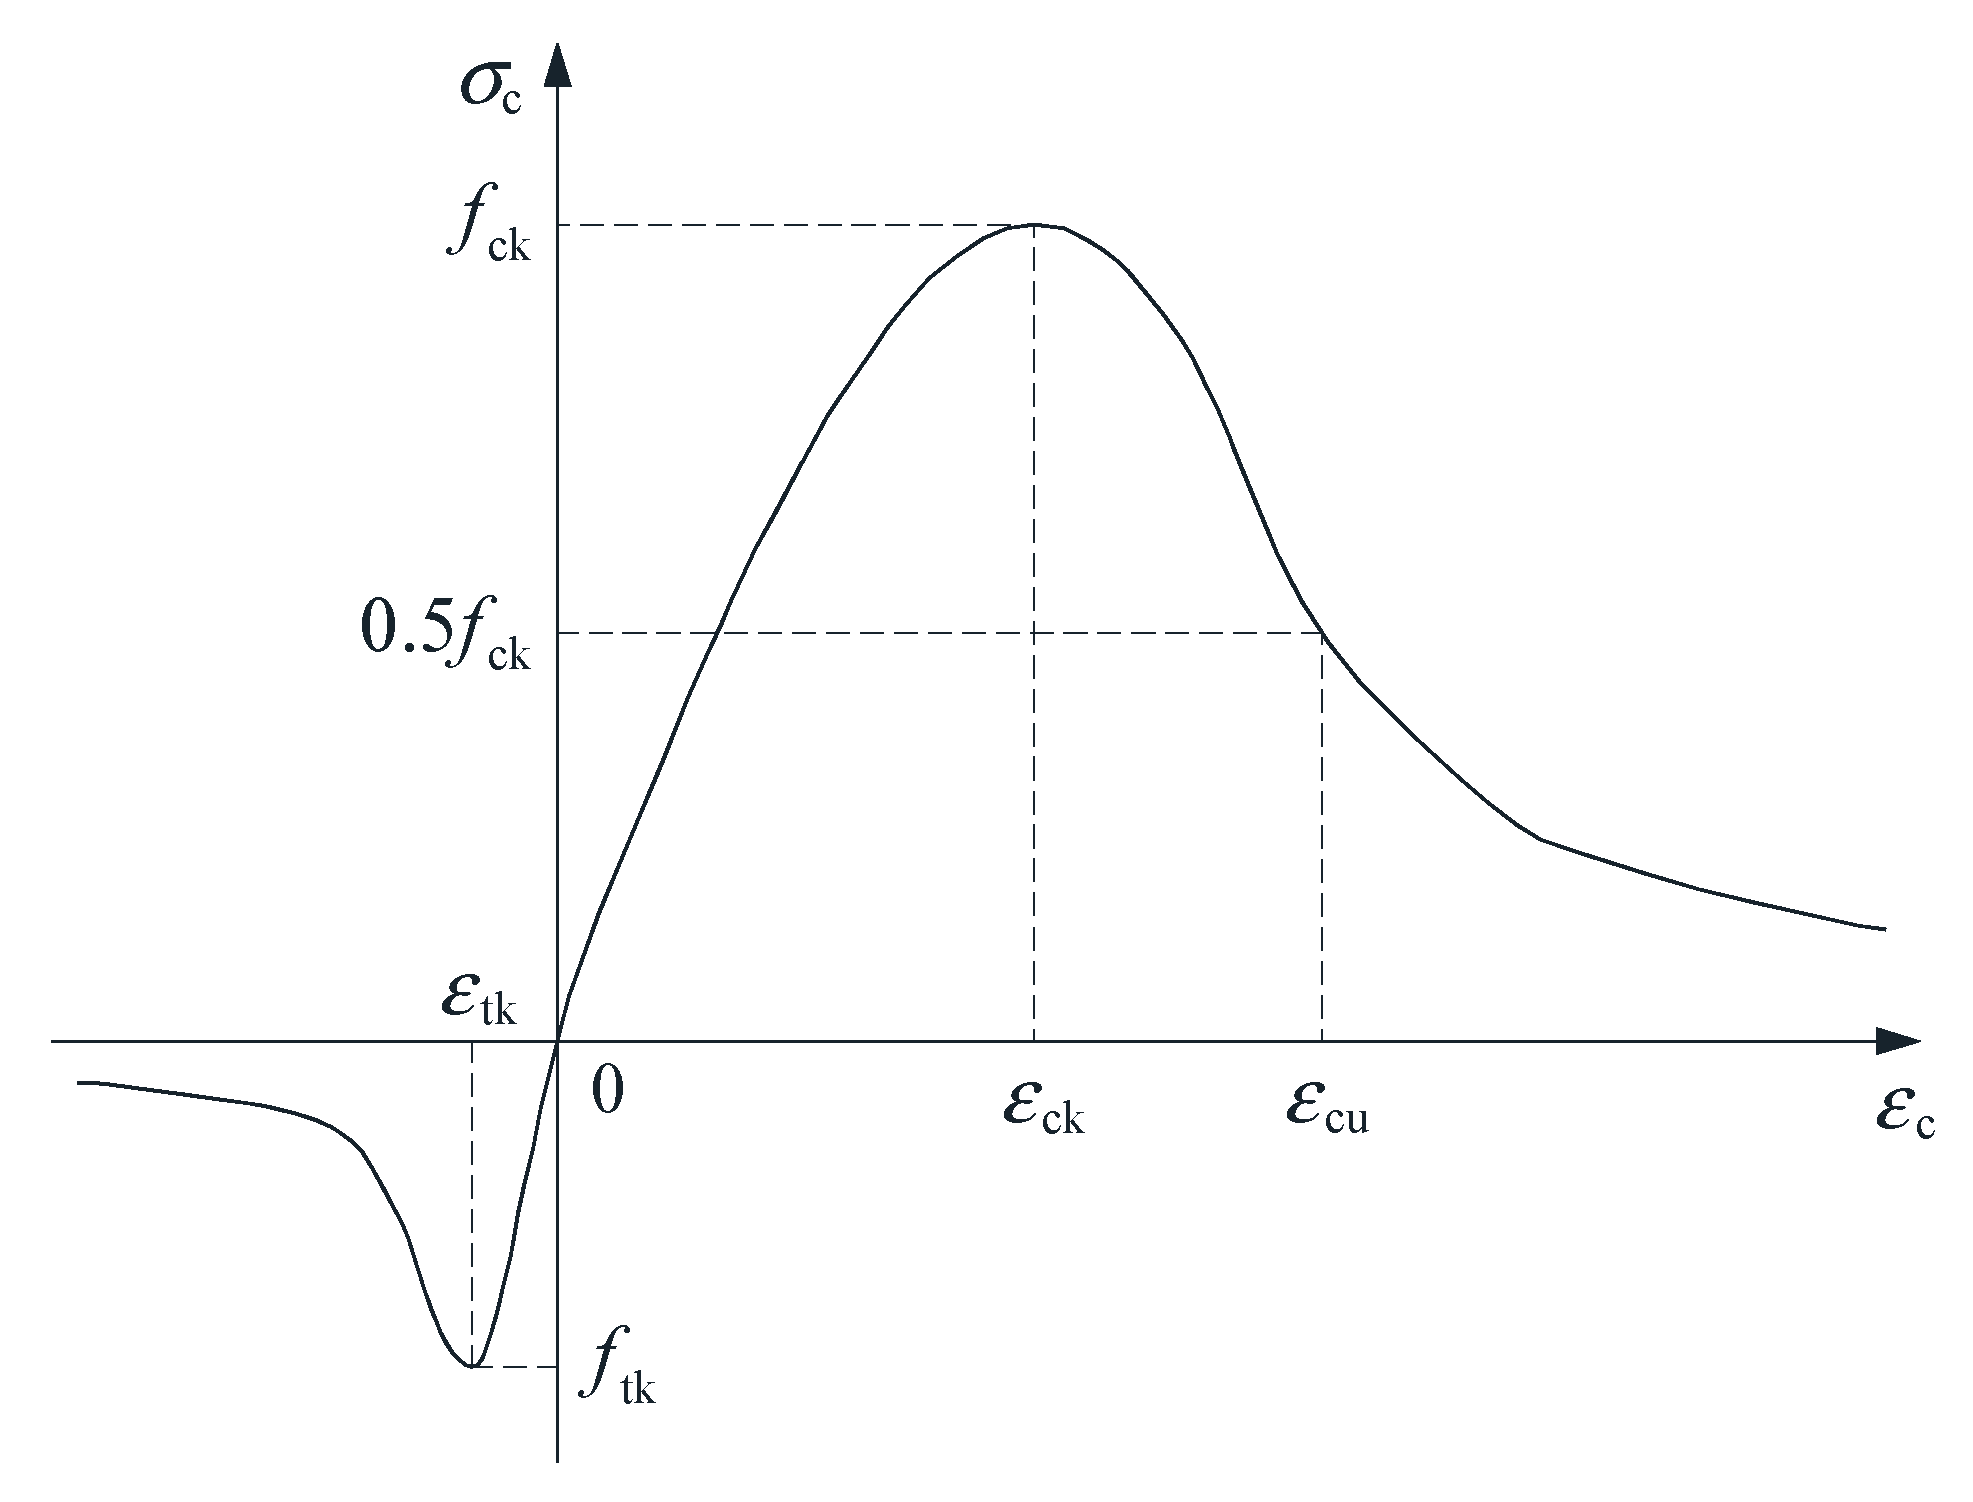
The stress–strain relationship curve of the infilled concrete in the finite element analysis model adopted the constitutive model for ordinary concrete. GB50010, Code for Design of Concrete Structures [23] provides a constitutive model for concrete under uniaxial stress based on the plastic damage theory, as shown in Figure 5. In this model, the expressions for the stress–strain relationship of concrete under uniaxial compression are shown in Equations (2)–(5).
σ c = ρ c n n 1 + x c n E c ε c x c 1 ρ c α c x c 1 2 + x c E c ε c x c > 1
ρ c = f ck E c ε ck
n = E c ε ck E c ε ck f ck
x c = ε c ε ck
The expressions for the stress–strain relationship of concrete under uniaxial tension are given by Equations (6)–(8):
σ t = ρ t 1.2 0.2 x t 5 E c ε c x t 1 ρ t α t x t 1 1.7 + x t E c ε c x t > 1
ρ t = f tk E c ε tk
x t = ε c ε tk
Ec is the elastic modulus of concrete. fck and ftk are the standard values of compressive and tensile strength of concrete, respectively. εck represents the peak compressive strain corresponding to the standard value of axial compressive strength of concrete. εtk represents the peak tensile strain corresponding to the standard value of axial tensile strength of concrete. αc, ρc, n, xc, αt, ρt and xt are the strength calculation parameters. All the aforementioned parameters can be determined according to the concrete material’s strength grade, following the relevant provisions of GB50010, Code for Design of Concrete Structures [23]. In Abaqus, the stress–strain relationship of concrete can be simulated using the Concrete Damage Plasticity Model, which allows for better simulation of the mechanical behavior of plain concrete under cyclic loading and exhibits good convergence [24,25]. The Concrete Damage Plasticity (CDP) model in Abaqus was employed with parameters calibrated against established numerical practices for cyclic analysis [20,26]. The key CDP parameters used are: dilation angle = 30°; eccentricity = 0.1; fb0/fc0 = 1.16; K = 0.6667; and viscosity parameter = 0.0005. The dilation angle was selected based on values validated for normal-weight concrete under cyclic loading [20]. The viscosity parameter helps regularize the solution in the post-peak softening regime, improving convergence.

4. Result Comparison Between FEM and Experiment

4.1. Comparison of Deformation Results

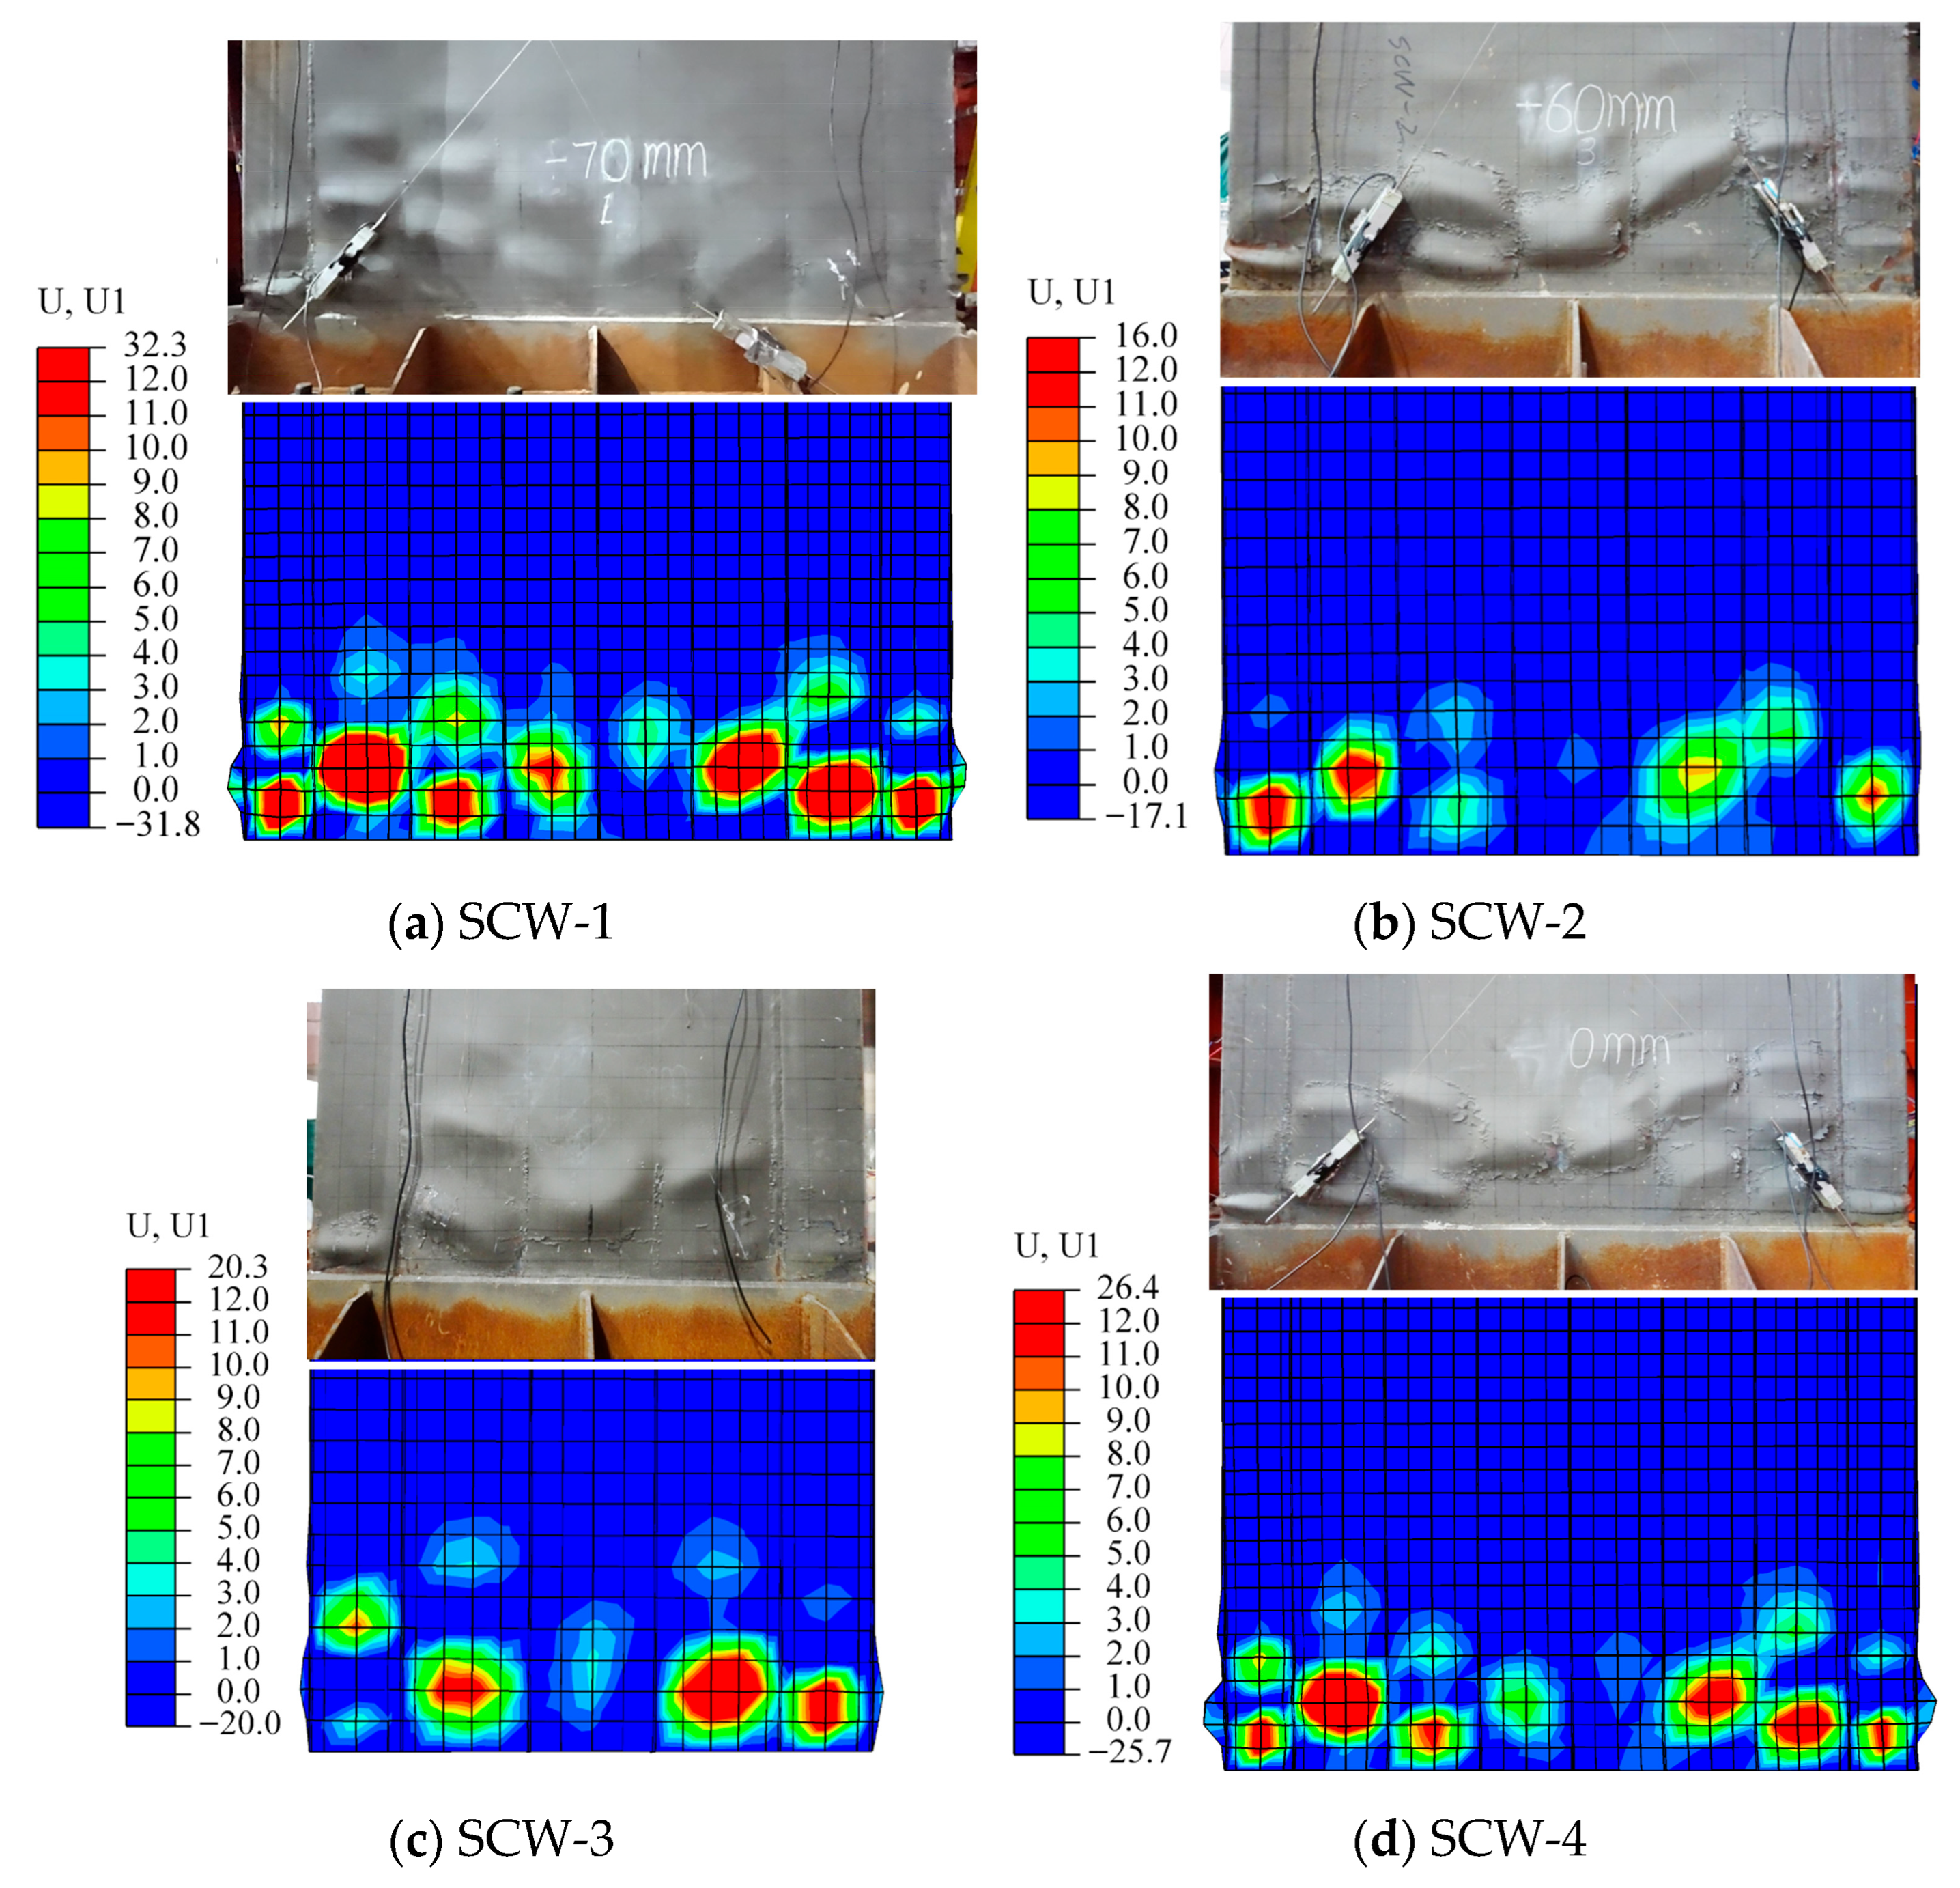
The comparison of deformation results between the failure phenomena of FEM and the typical failure modes observed in the experiment is shown in Figure 6. The failure phenomena of the double-skin truss-reinforced composite shear wall specimens mainly include local buckling deformation of the steel plates and steel tubes, tearing of the steel tubes, and cracking and crushing of the infilled concrete [6]. According to the comparison results, it is observed that the final failure mode of FEM matches well with the experimental results.

4.2. Load–Displacement Curves

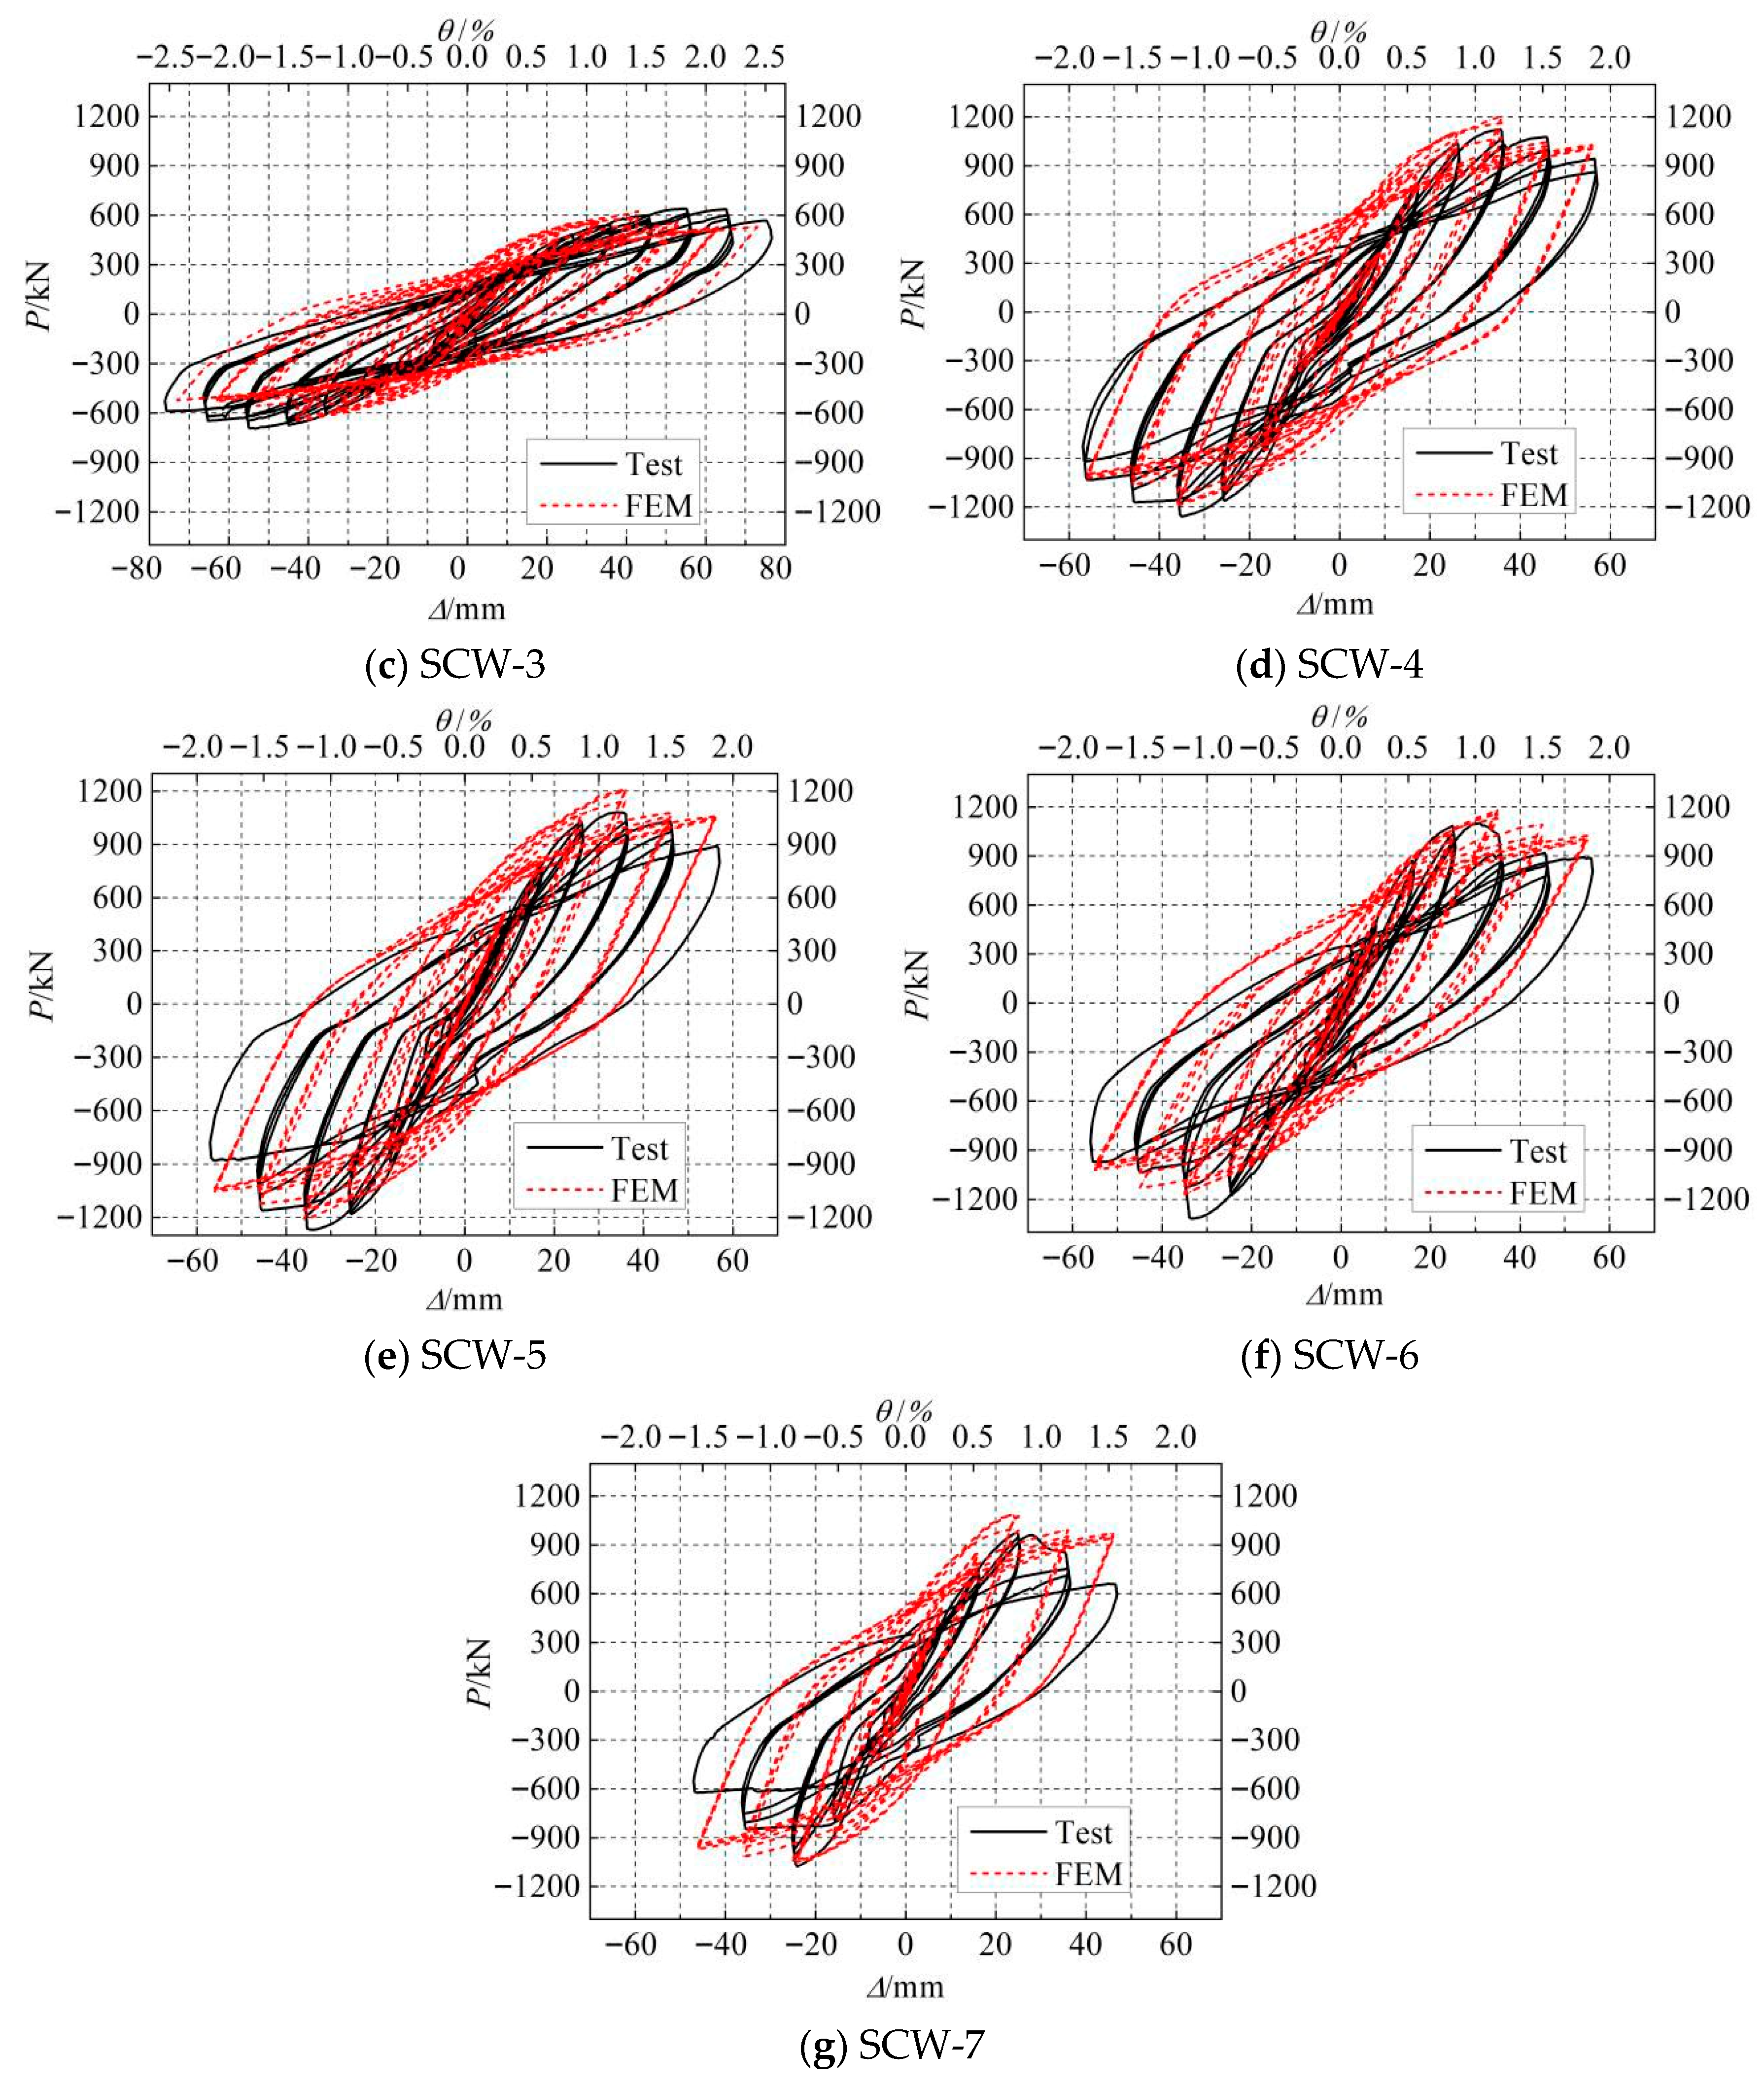
Comparison of the load–displacement curves calculated by FEM of each double-skin truss-reinforced composite shear wall specimen with the experimental curves are shown in Figure 7 and Figure 8, respectively.
From the comparison results, it is observed that the load–displacement curves calculated by FEM generally agree well with the experimental results. The degradation pattern of the hysteresis curves closely matches the experimental results, and the skeleton curves capture the key loads and displacements at each stage of the specimen, maintaining consistency with the development trends of the experimental curves at each stage. Quantitative comparison of key parameters shows that the finite element models accurately predict the specimen behavior. The average ratio of FEA to experimental ultimate load is 0.94, while the average ratio for ultimate displacement is 1.04, demonstrating good agreement between numerical and experimental results.

4.3. Quantitative Validation of Hysteretic Parameters

To provide a more comprehensive validation of the FEM’s capability to simulate seismic behavior beyond peak strength and deformation, key hysteretic parameters were quantitatively compared. The initial shear stiffness (K0) was determined as the secant stiffness of the hysteresis loop in the elastic stage (typically corresponding to the first cycle at 0.1% drift ratio). The energy dissipation capacity was characterized by the maximum equivalent viscous damping coefficient (he, max) reached at the ultimate failure state. A comparison of these parameters between the FEA and test results is presented in Table 2. As shown in Table 2, the FEM accurately captures the initial shear stiffness, with the ratio of FEA to test values ranging from 0.91 to 1.04, indicating a maximum error within 9%. For the maximum equivalent viscous damping coefficient, the ratio ranges from 0.88 to 1.19, with a maximum error within 19%. The slightly larger scatter in predicting the damping coefficient is expected, as this parameter is highly sensitive to localized damage, concrete cracking patterns, and interface behavior, which are challenging to replicate perfectly in the simulation.
Considering the comprehensive comparison between FEM and experimental results, it can be concluded that the FEM established in this study can accurately simulate the failure mode, and hysteresis behavior of double-skin truss-reinforced composite shear walls. It can also predict the shear capacity of these shear walls with good accuracy.

5. Finite Element Parametric Analysis

The selection of parameter ranges for this parametric study was guided by both practical engineering applications and theoretical considerations. The values for the axial compression ratio, aspect ratio, spacing–thickness ratio, and truss connector specifications were chosen to reflect common design practices as suggested by relevant codes like JGJ/T 380-2015, Technical Specification for Steel Plate Shear Walls [27] and to explore the behavioral limits of the walls. This approach ensures that the findings are not only theoretically sound but also directly applicable to real-world design scenarios. The following subsections detail the influence of each parameter and discuss the underlying engineering insights.

5.1. Impact of Axial Compression Ratio

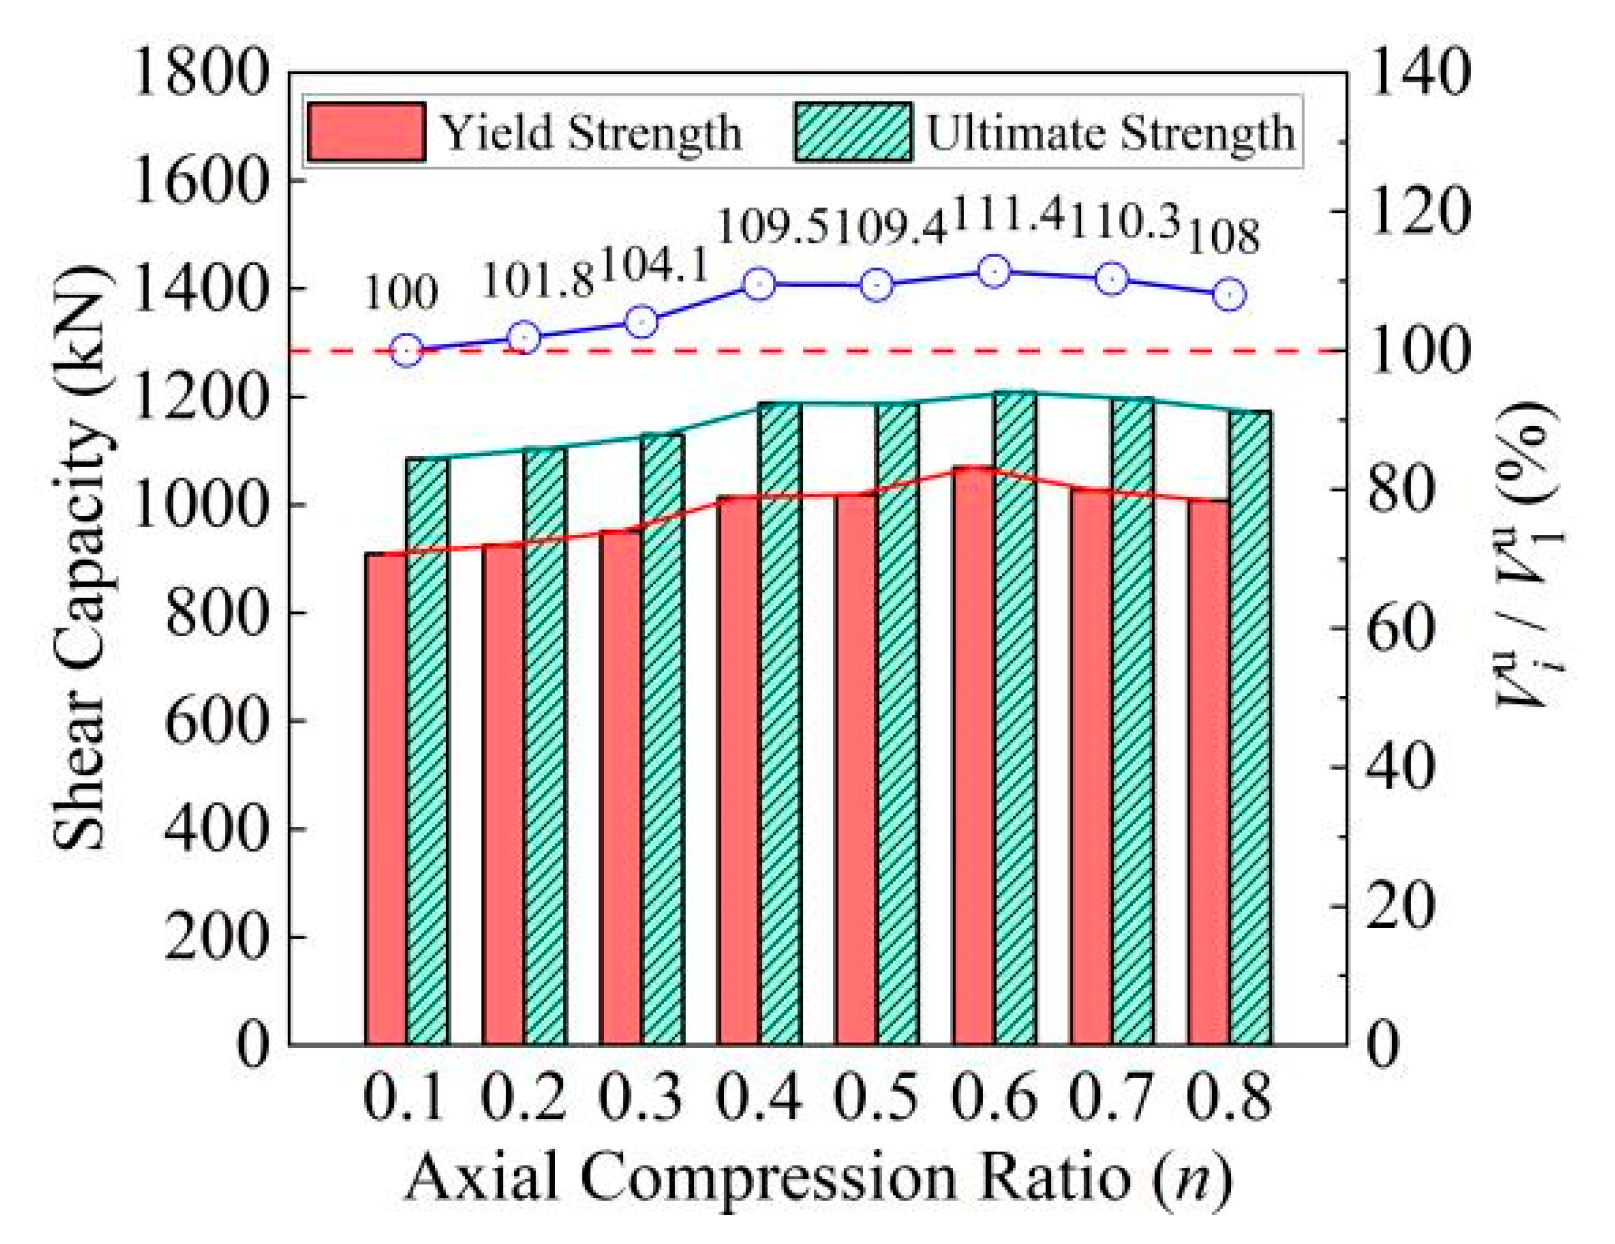
FEMs of double-skin truss-reinforced composite shear walls with axial compression ratios of 0.1, 0.2, 0.3, 0.4, 0.5, 0.6, 0.7, and 0.8 were established. The main parameter settings for each FEM are shown in Table 3. Referring to the provisions regarding the design values of axial compression ratio in JGJ/T 380-2015, Technical Specification for Steel Plate Shear Walls [27], the design values of axial compression ratio for each specimen were calculated using Equation (9).
n = N t f c , d A c + f y , d A s
The comparison of shear capacities of each FEM under different axial compression ratios is illustrated in Figure 9. It is observed that when the axial compression ratio does not exceed 0.6, the shear strength of the FEM increases as the axial compression ratio increases. The maximum increase in ultimate shear strength is up to 11.4%. This is because, under the constraint of vertical pressure and the reinforcement of the outer steel plates, the infilled concrete wall is in a three-dimensional stress state conducive to increasing the load-carrying capacity. Additionally, the support provided by the concrete wall to the steel plates is enhanced, thereby increasing the shear strength of the wall. However, when the axial compression ratio exceeds 0.6, with the continued increase in vertical pressure, the steel plates start to buckle prematurely, and the concrete is more susceptible to crushing, resulting in a decrease in shear strength. This identifies an axial compression ratio of 0.6 as a critical design threshold for optimizing shear performance.

5.2. Impact of Aspect Ratio

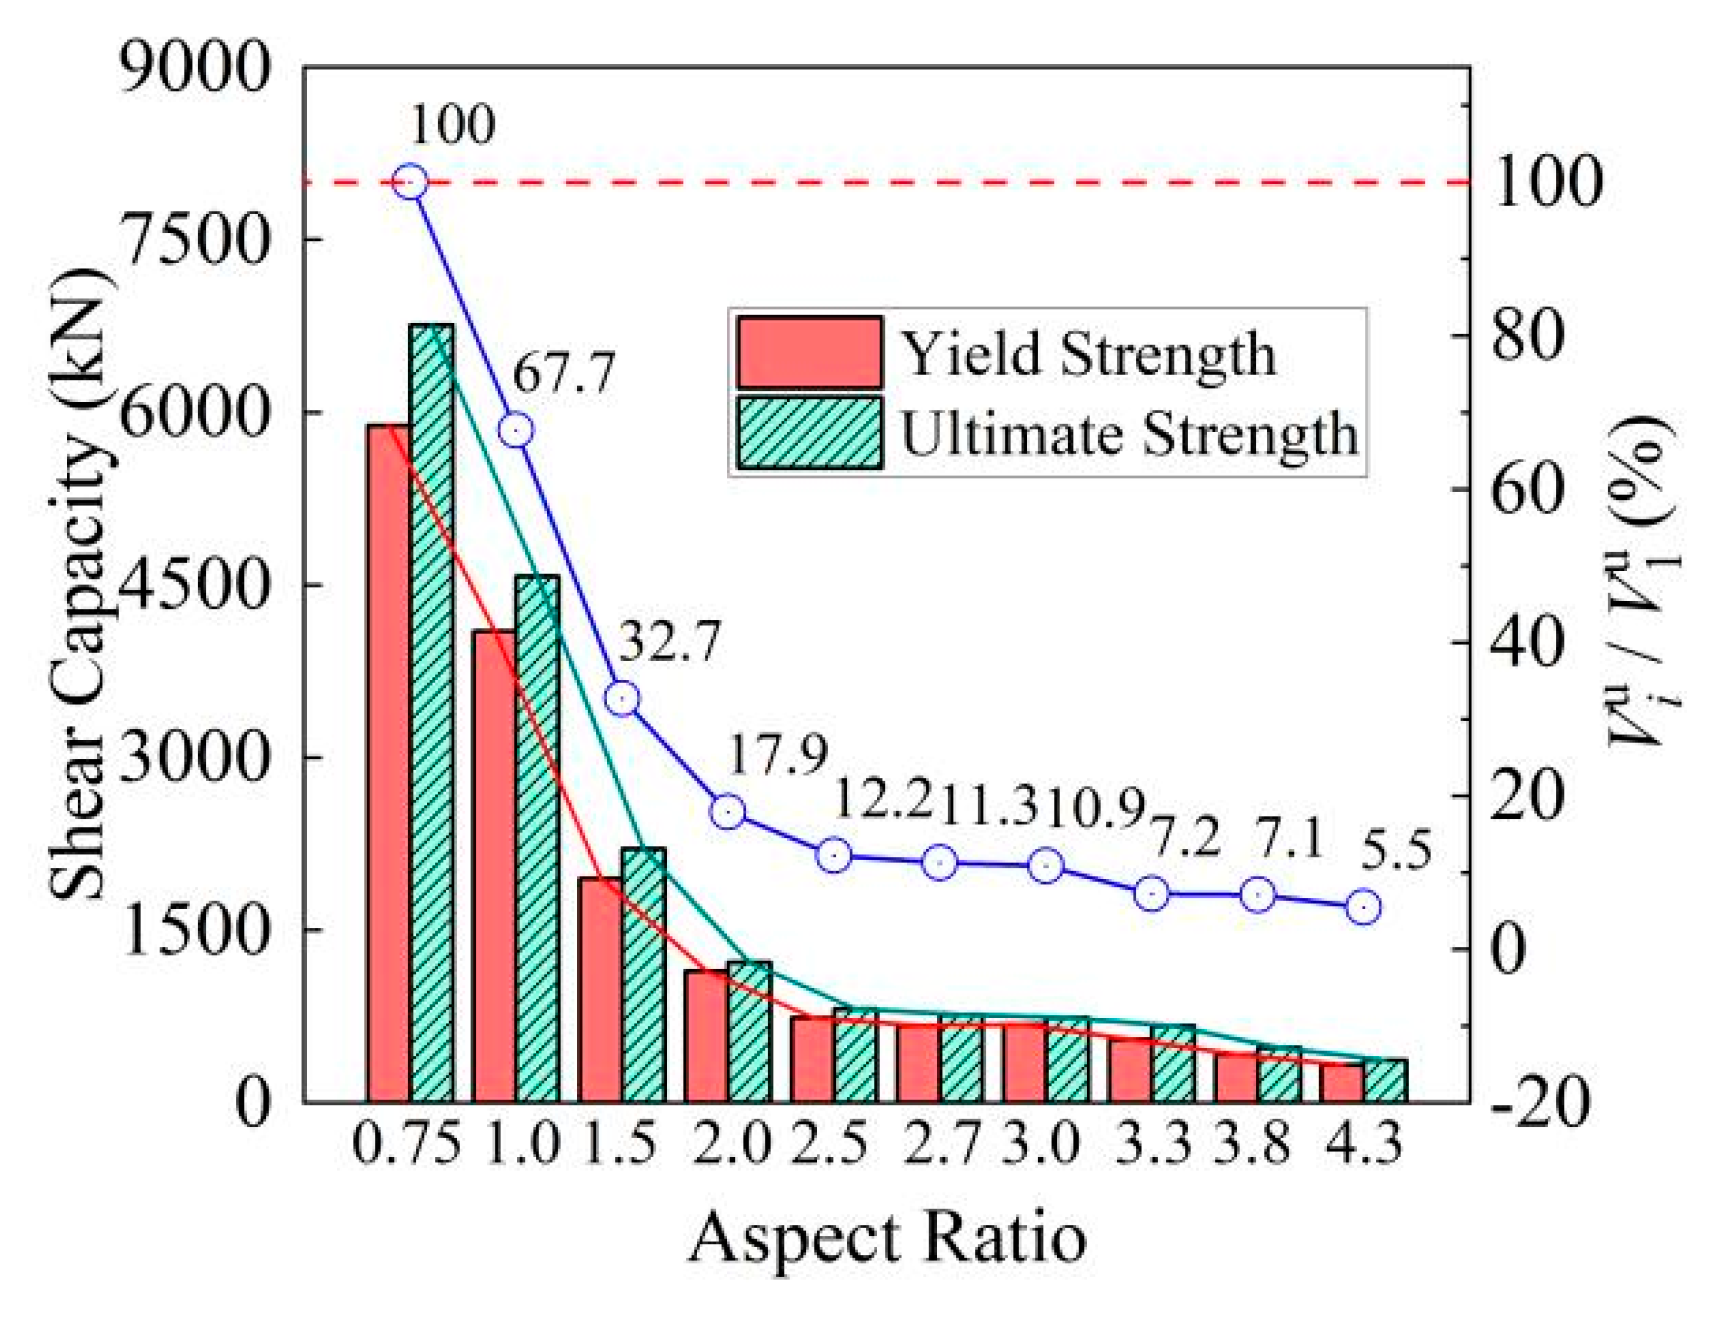
On the premise that the wall height remains unchanged, FEMs of double-skin truss-reinforced composite shear walls were established with aspect ratios of 0.75, 1.0, 1.5, 2.0, 2.5, 3.0, 3.3, and 4.3. The main parameter settings for each model are listed in Table 4.
The comparison of shear capacities of various finite element analysis models under different aspect ratios is illustrated in Figure 10. It is observed that as the aspect ratio increases from 0.75 to 2.5, there is a significant decrease in shear ultimate capacity, exceeding 80%. One possible reason for this is that an increase in aspect ratio, when the wall height remains constant, results in a noticeable reduction in the width or cross-sectional area of the wall. Additionally, with a larger aspect ratio, the wall ends are more prone to undergo flexural failure before shear yielding, leading to a decrease in shear capacity. However, when the aspect ratio exceeds 2.5, the decrease in shear ultimate capacity tends to slow down. The analysis indicates that the aspect ratio significantly influences the failure mode and efficiency of the shear wall.

5.3. Impact of Spacing-Thickness Ratio

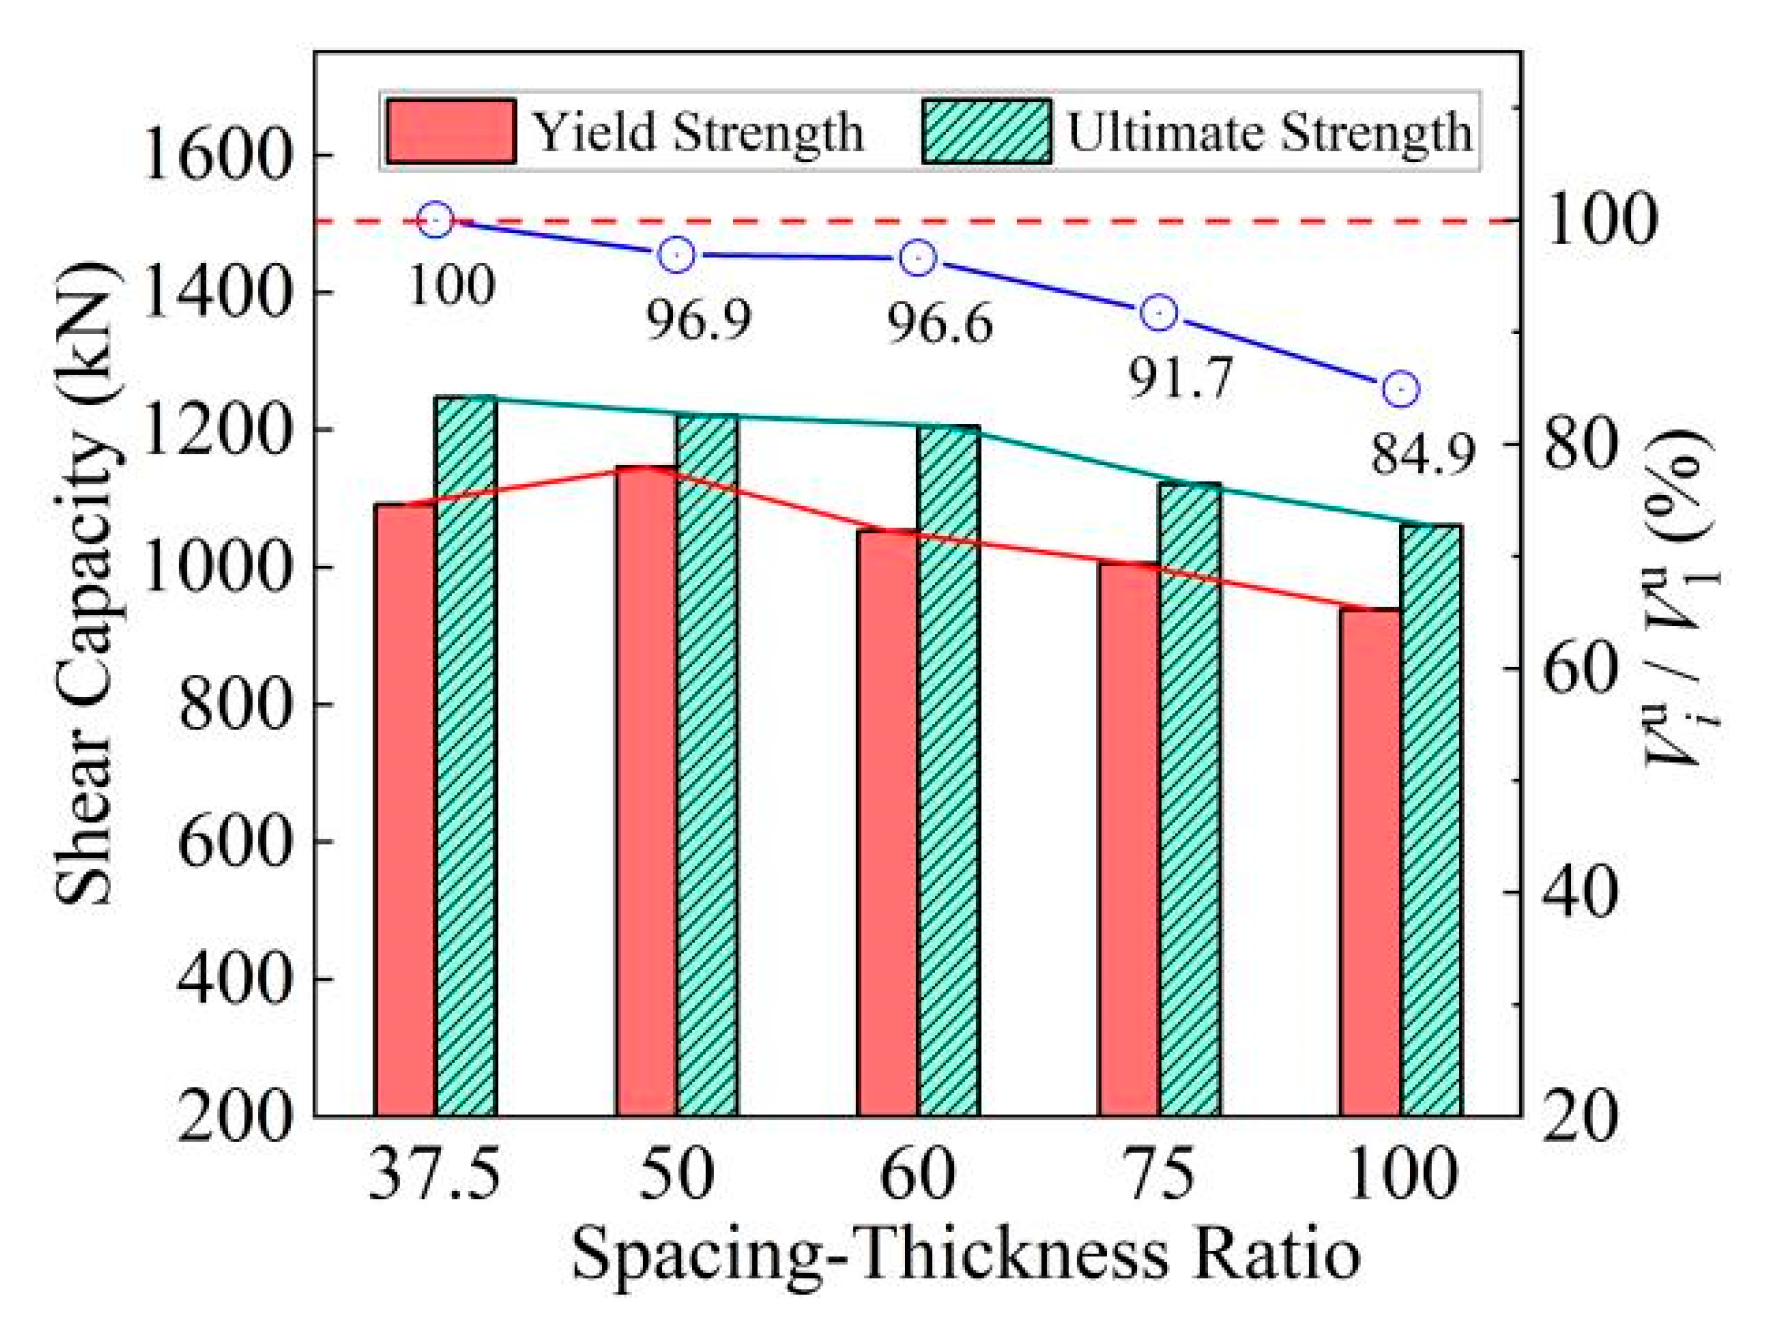
On the premise that the steel plate thickness remains unchanged, FEMs of double-skin truss-reinforced composite shear walls were established with spacing-thickness ratios of 37.5, 50, 60, 75, and 100. The main parameter settings for each model are presented in Table 5.
The comparison of shear capacities of various finite element analysis models under different spacing–thickness ratios is illustrated in Figure 11. It is observed that increasing the spacing–thickness ratio decreases the shear ultimate capacity of the wall. This is because the unrestrained steel plates between the truss connectors are more prone to buckling, and the interaction between the steel plates and the internal concrete wall weakens. It is worth noting that when the spacing–thickness ratio does not exceed 60, the reduction in shear ultimate capacity does not exceed 5%. The results highlight the importance of connector spacing on the stability of the steel skins.

5.4. Impact of Truss Connector Specifications

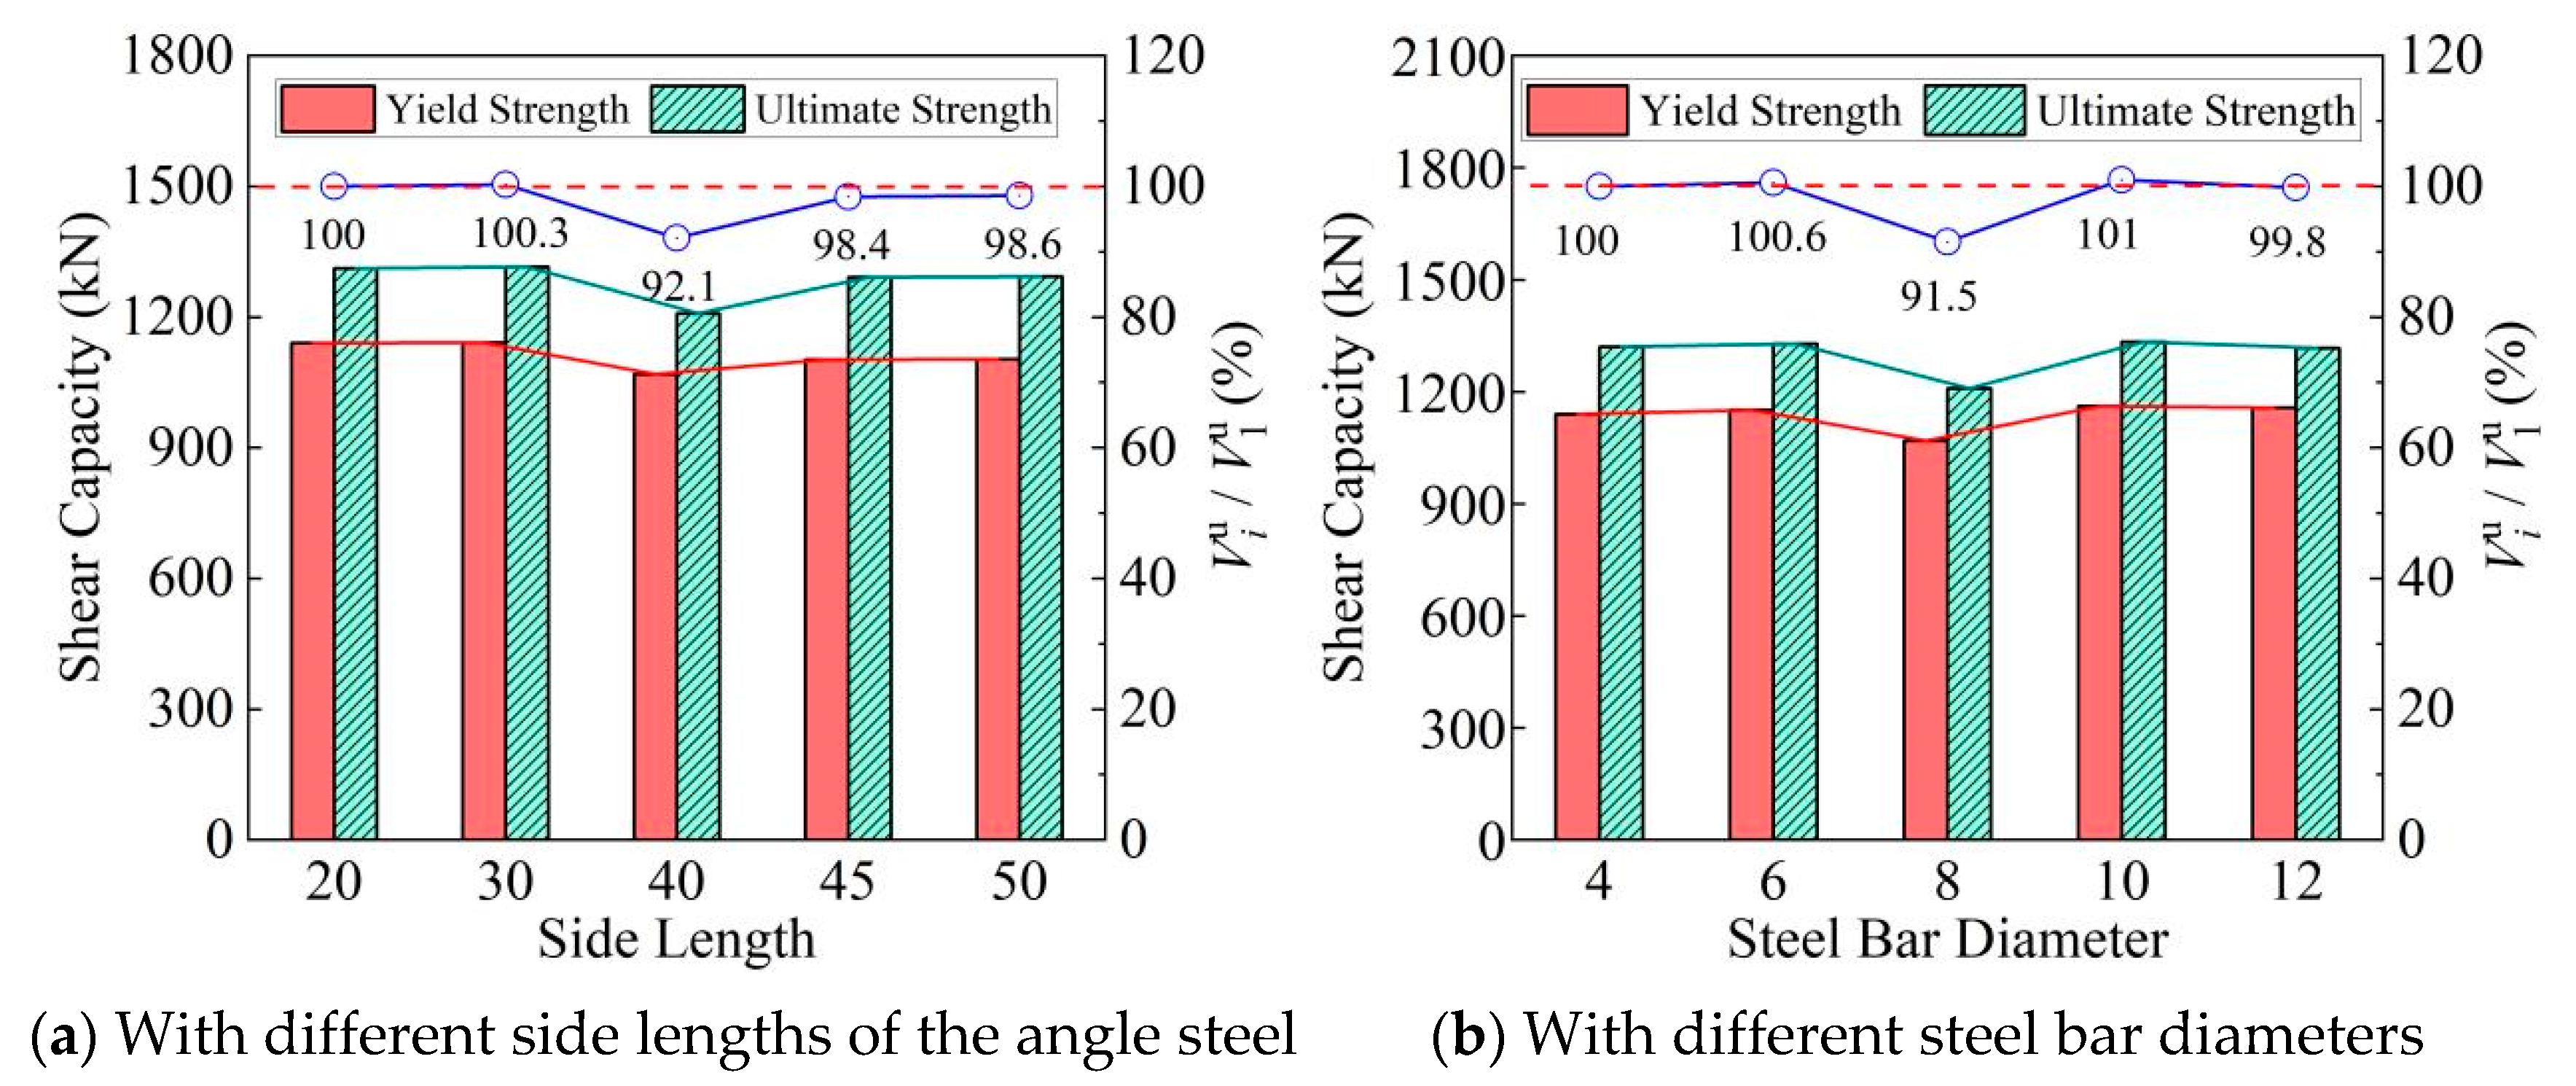
The truss connector in the double-skin truss-reinforced composite shear wall is composed of chord angle steel and web reinforcement bars. Finite element parametric analysis was conducted on the truss connector specifications. FEMs were established with steel bar diameters of 8 mm and chord angle steel side lengths of 20 mm, 30 mm, 40 mm, 45 mm, and 50 mm. Additionally, models were established with a chord angle steel side length of 40 mm and web reinforcement bar diameters of 6 mm, 8 mm, 10 mm, and 12 mm. The main parameter settings for each model are presented in Table 6. The minimal impact of truss connector specifications on the global shear strength confirms that their primary role is not direct shear transfer but rather to ensure the integrity of the composite section by connecting the steel skins and providing out-of-plane restraint.
The comparison of the shear capacities of the finite element analysis models under different steel truss specifications is shown in Figure 12. It is observed that the variations in the shear strength of the wall are minor with different truss connector specifications. This is mainly because the load-bearing planes of the truss connectors are perpendicular to the shear planes of the wall and do not directly participate in shear resistance, resulting in minimal influence on the shear strength.

6. Establishment of Ultimate Shear Strength Design Formulas

6.1. Formulation Establishment

For the shear capacity of double-skin composite shear walls, JGJ/T 380-2015, Technical Specification for Steel Plate Shear Walls [27] only considers the contribution of steel plates to the load-bearing capacity. Based on the full-section plastic shear yield and the von Mises yield criterion, the design formula for the shear strength of the wall was established as follows:
V w = f y 3 A s
where As represents the cross-sectional area of the steel plate.
However, Equation (10) neglects the shear strength contribution of the internal concrete wall. Seismic performance tests for double-skin truss-reinforced composite shear walls have confirmed that the internal concrete wall can form a diagonal strut mechanism to resist shear forces [6]. Therefore, the shear strength of the shear wall can be included in the shear contribution of the internal concrete wall, calculated according to Equation (11). Considering that the internal concrete wall does not contain transverse reinforcement and its performance is close to that of plain concrete walls, its shear strength can be calculated according to Equation (12) according to the Code for Design of Concrete Structures [23]:
V w = V sp + V cw
V cw = 0 . 7 β h f t b w 2 t s l w 2 h c
β h = 800 l w 2 h c 1 / 4
where Vcw denotes the shear strength of the infilled concrete wall; βh denotes the influence coefficient of section width; βh denotes 800 mm when lw − 2hc < 800 mm, and it denotes 2000 mm when lw − 2hc > 2000 mm; and ft denotes the tensile strength of concrete. It is observed that βh denotes the influence of the section width of the wall (i.e., aspect ratio) on the shear strength.
As for the shear strength of the steel plates in the composite shear walls, following the design recommendations in the JGJ/T 380-2015, Technical Specification for Steel Plate Shear Walls [27], we considered the full-section shear yielding state as its ultimate strength condition. Additionally, we introduced a strength coefficient ζ to account for the effects of bending-shear coupling and uneven stress distribution on the shear strength of the steel plates, as shown in Equation (14):
V sp = ζ f y 3 A sp
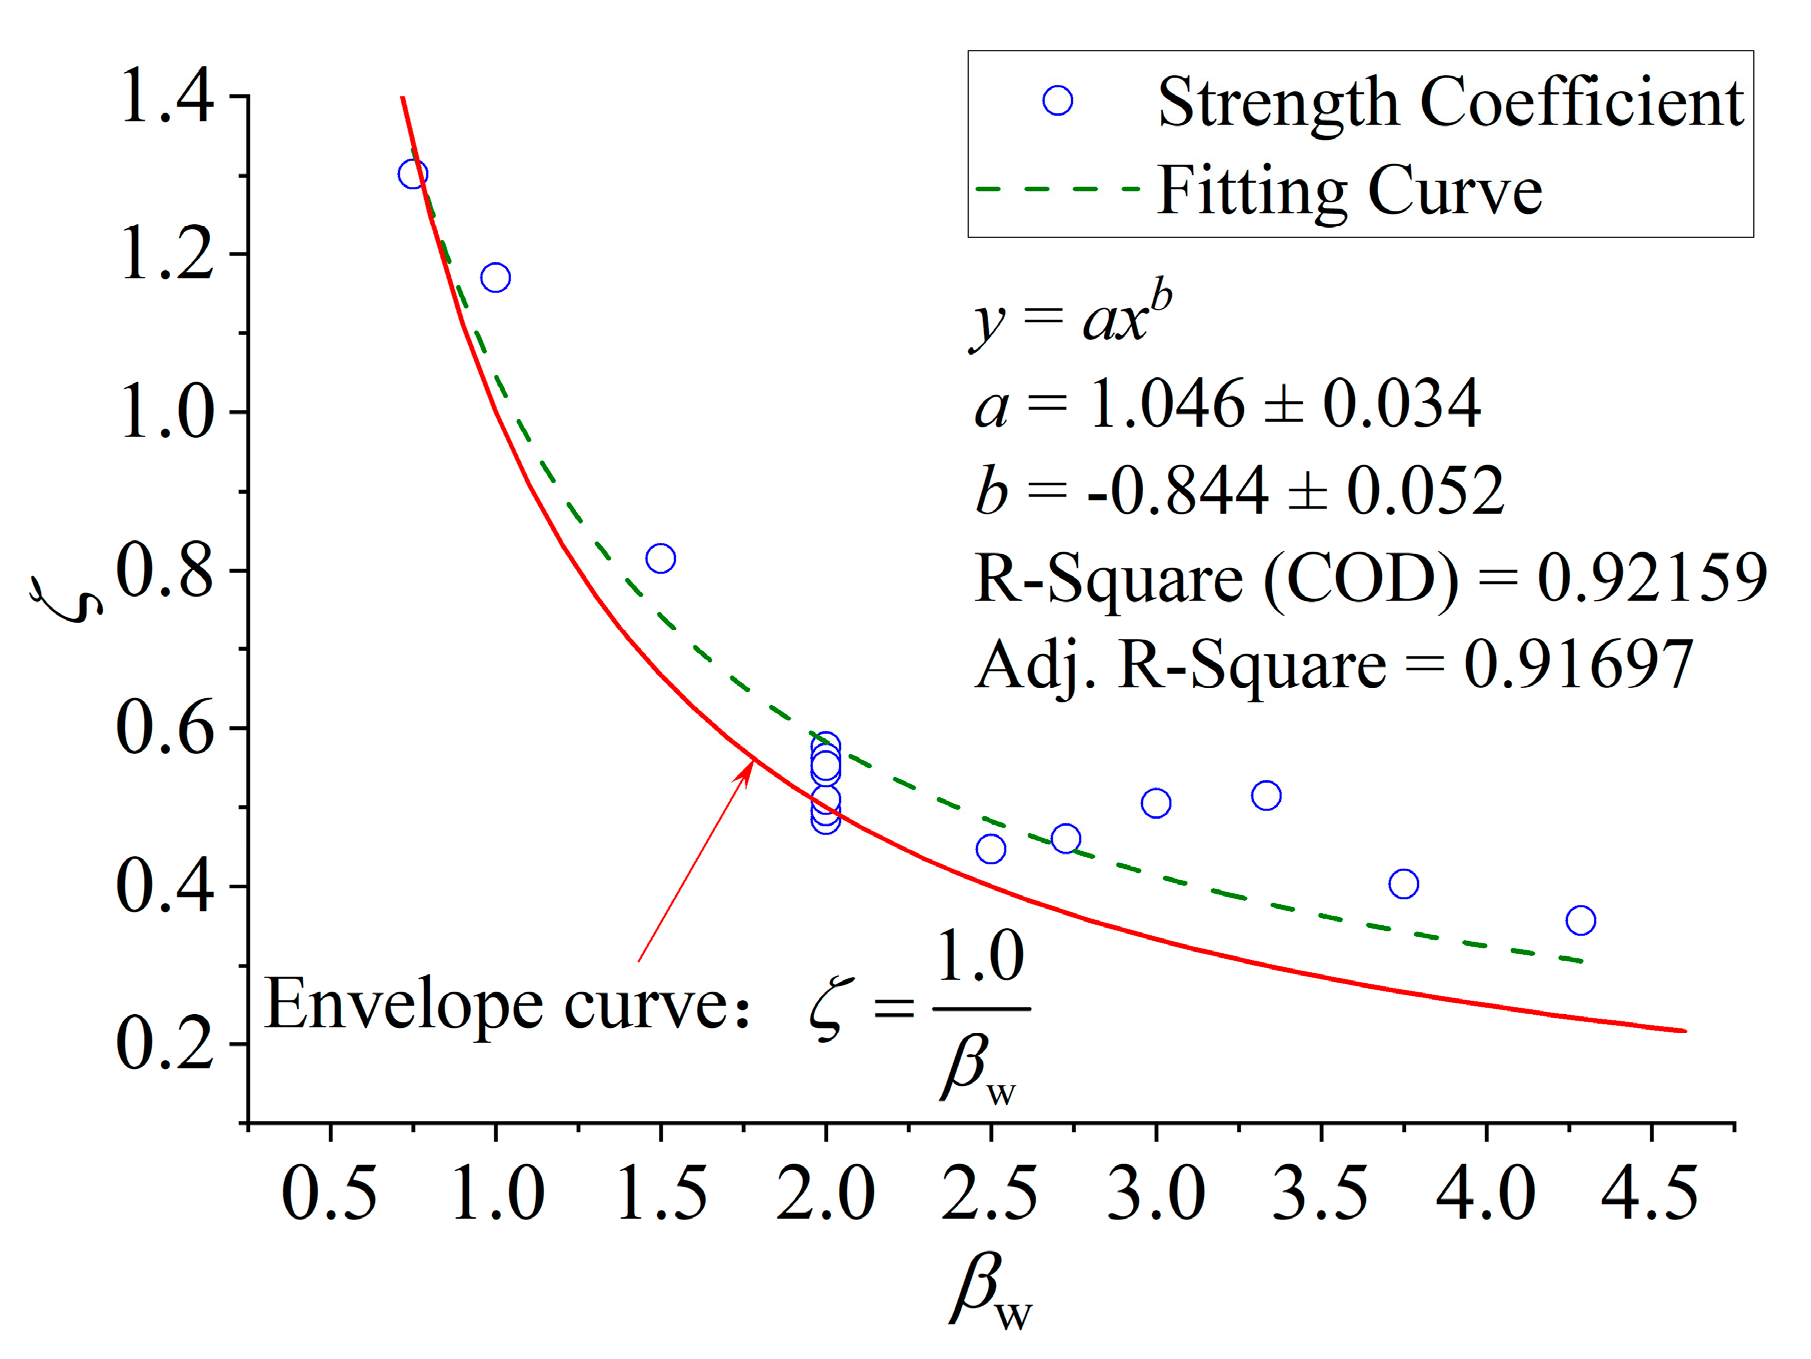
Based on the aforementioned parametric analysis results, it is evident that the aspect ratio has the most significant impact on the ultimate shear strength of double-skin truss-reinforced composite shear walls. Therefore, this study utilized the obtained shear strength from the parametric analysis as samples to determine the relationship between the strength coefficient (ζ) and the aspect ratio (βw). The results are depicted in Figure 13.
According to the fitted equation, the relationship between the strength coefficient (ζ) and the aspect ratio (βw) can be described by Equation (15):
ζ = 1.046 ± 0.034 β w 0.844 ± 0.052
For ease of calculation, the envelope curve was taken as ζ = 1/βw to define the relationship between the two, as shown in Figure 13.

6.2. Formula Verification

The ultimate shear strength prediction formula established in this study was validated against the ultimate shear strength of 26 double-skin composite shear wall specimens [6,28,29,30,31,32,33]. The results are shown in Figure 14. It should be noted that all 26 specimens used connectors capable of connecting the two outer steel plates, such as reinforced trusses, J-hooks, tie bolts, etc. The verification results indicate that the predicted ultimate shear strength values have good accuracy and are generally on the conservative side.

7. Conclusions and Future Research Directions

In this paper, a finite element model was established for the double-skin truss-reinforced composite shear walls, and it was verified by experimental results, showing high accuracy. Subsequently, finite element parametric analyses were conducted on key parameters such as axial compression ratios, aspect ratios, spacing-thickness ratios, and truss connector specifications. The main conclusions obtained in this study are as follows:
(1) The constraint effect of vertical pressure and the outer steel plates puts the concrete in a triaxial compressive stress state, thus proper vertical pressure can enhance the shear strength of the double-skin truss-reinforced composite shear walls. However, excessive vertical pressure may prematurely cause the buckling of the steel plates and crushing of the concrete, thereby reducing the shear strength of the walls. According to the FEA results in this paper, it is suggested that the axial compression ratio not exceed 0.6.
(2) Increasing the aspect ratio leads to a decrease in the shear strength of the walls. The decline in shear strength is particularly significant when the aspect ratio increases from 0.75 to 2.5. When the aspect ratio exceeds 2.5, the decrease in shear strength tends to be relatively gradual. This may be attributed to the fact that an increase in the aspect ratio results in a reduction in the cross-sectional area of the double-skin truss-reinforced composite shear walls. Additionally, changes in the aspect ratios may alter the failure mode of the walls. However, further research is needed to obtain more detailed conclusions on this.
(3) The truss connector can effectively connect the two steel plates and restrain the outward deformation of the steel plates, rather than directly resisting shear forces. The specifications of the truss connectors have minimal impact on the shear strength of the double-skin truss-reinforced composite shear walls. Truss connectors with angle steel side lengths not less than 40 mm and steel bar diameters not less than 8 mm are sufficient to meet structural requirements. Attention should be paid to the spacing of truss connectors. With an increase in the spacing-thickness ratios, the restraining effect of truss connectors on the steel plates decreases, leading to premature buckling of the steel plates and a subsequent reduction in the shear strength of the walls. Therefore, it is recommended to limit the spacing of truss connectors. Based on the results of finite element parametric analysis, a spacing-thickness ratio exceeding 60 is not advisable.
(4) The proposed formula for predicting the ultimate shear strength of double-skin truss-reinforced composite shear walls demonstrates good applicability and tends to yield conservative predictions, offering a valuable tool for practical design.
However, this study has certain limitations that warrant future investigation.
(1) The scope of the finite element models and the derived design formula is primarily limited to in-plane global shear behavior. Important aspects such as out-of-plane loading, complex boundary conditions (beyond the fixed base assumption used herein), and long-term material effects were not considered. Furthermore, the failure mode transition mechanism associated with high aspect ratios warrants more detailed investigation.
(2) The material constitutive models, while practical, require refinement. The parameters for the CDP model were derived from code specifications (GB50010). Future work should involve direct calibration against experimental stress–strain curves from the specific concrete batches used to enhance the simulation of localized crushing and cracking. Regarding the steel material model, future work will consider the use of a kinematic hardening model to more comprehensively capture the cyclic hardening behavior and transient effects under large inelastic strain cycles, further enhancing the accuracy of predicted hysteretic loops and energy dissipation.
(3) The interface between concrete and steel, modeled with a simplified Coulomb friction law, may not fully capture complex cyclic phenomena such as progressive slip, debonding, and the associated pinching effects. Experimental characterization of the interface under reversed cyclic shear is needed to calibrate more sophisticated cohesive zone or advanced friction models.
(4) Advancements in numerical techniques are recommended. Although a mesh sensitivity study was conducted, the exploration of adaptive meshing techniques could further optimize computational efficiency for large-scale models. Future studies should also validate the models against a broader range of experimental scenarios to strengthen their predictive capability. Addressing these areas will foster the development of a more comprehensive understanding and design framework for these composite walls.

Author Contributions

Conceptualization, P.T.; Methodology, J.H.; Data curation, P.T. and D.T.; Writing—original draft, Z.S.; Writing—review and editing, J.H. All authors have read and agreed to the published version of the manuscript.

Funding

This research was funded by Natural Science Foundation of Xinjiang Uygur Autonomous Region (Grant No. 2024D01B20), Xinjiang Tianchi Talent Project (Grant No. 2023XGYTCYC05) and the Doctoral Research Startup Fund of Xinjiang Institute of Engineering (Grant No. 2023XGYBQJ20).

Data Availability Statement

The original contributions presented in this study are included in the article. Further inquiries can be directed to the corresponding author.

Acknowledgments

The authors gratefully acknowledge all reviewers of the paper.

Conflicts of Interest

The authors declare no conflicts of interest.

References

  1. Qin, Y.; Shu, G.P.; Zhou, X.L.; Han, J.H.; He, Y.F. Height-thickness ratio on axial behavior of composite wall with truss connector. Steel Compos. Struct. 2019, 30, 315–325. [Google Scholar] [CrossRef]
  2. Qin, Y.; Shu, G.-P.; Zhou, X.-L.; Han, J.-H.; Zhang, H.-K. Behavior of T-shaped sandwich composite walls with truss connectors under eccentric compression. J. Constr. Steel Res. 2020, 169, 106067. [Google Scholar] [CrossRef]
  3. Liu, Z.-H.; Shu, G.-P.; Luo, K.-R.; Qin, Y. Performance of double-skin truss-reinforced composite wall under axial compression. J. Constr. Steel Res. 2023, 202, 107778. [Google Scholar] [CrossRef]
  4. Luo, K.R.; Shu, G.P.; Liu, Z.H. Research on the axial compressive behavior of double skin composite wall with steel truss. Structures 2024, 62, 106159. [Google Scholar] [CrossRef]
  5. Qin, Y.; Shu, G.-P.; Zhang, H.-K.; Zhou, G.-G. Experimental cyclic behavior of connection to double-skin composite wall with truss connector. J. Constr. Steel Res. 2019, 162, 105759. [Google Scholar] [CrossRef]
  6. Han, J.; Shu, G.; Qin, Y.; Zhou, G.; Zhou, X. Experimental seismic behavior of double skin composite wall with steel truss. J. Constr. Steel Res. 2021, 180, 106569. [Google Scholar] [CrossRef]
  7. Han, J.; Shu, G.; Qin, Y.; Zhou, G.; Zhou, X. Experimental seismic behavior of T-shaped double skin composite wall with steel truss. J. Constr. Steel Res. 2021, 184, 106776. [Google Scholar] [CrossRef]
  8. Han, J.; Shu, G.; Qin, Y.; Zhou, G.; Zhou, X. Sectional strength design of a double-skin truss-reinforced composite shear wall. Thin-Walled Struct. 2024, 195, 111377. [Google Scholar] [CrossRef]
  9. Gharavi, A.; Asgarpoor, M.; Epackachi, S.; Mirghaderi, S.R.; Imanpour, A. Axial-flexural strength of steel-concrete composite shear walls. J. Build Eng. 2023, 76, 107122. [Google Scholar] [CrossRef]
  10. Yang, K.; Sun, G.; Yang, W. Axial compressive behavior of low steel–concrete composite walls with multi-partition steel tubes and concrete. Nucl. Eng. Des. 2023, 415, 112684. [Google Scholar] [CrossRef]
  11. Wang, S.; Wang, W.; Xie, S.; Chen, Y. Behavior and design method of double skin composite wall under axial compression. J. Build Eng. 2023, 64, 105554. [Google Scholar] [CrossRef]
  12. Zhao, Y.; Li, Z.; Liu, P.; Ma, H. The seismic behaviors of steel-concrete-steel composite walls with dumbbell-shaped connectors. J. Constr. Steel Res. 2023, 211, 108182. [Google Scholar] [CrossRef]
  13. Wang, M.-Z.; Guo, Y.-L.; Zhu, J.-S.; Yang, X.; Tong, J.-Z. Sectional strength design of concrete-infilled double steel corrugated-plate walls with T-section. J. Constr. Steel Res. 2023, 160, 23–44. [Google Scholar] [CrossRef]
  14. Li, W.; Li, F.; Chen, H. Performance of concrete-filled double-skin shallow-corrugated steel plate composite walls under axial compression. J. Constr. Steel Res. 2022, 196, 107374. [Google Scholar] [CrossRef]
  15. Wang, M.-Z.; Guo, Y.-L.; Zhu, J.-S.; Yang, X. Flexural buckling of axially loaded concrete-infilled double steel corrugated-plate walls with T-section. J. Constr. Steel Res. 2020, 166, 105940. [Google Scholar] [CrossRef]
  16. Li, W.; Chen, H.; Li, F. Performance of concrete-filled double-skin shallow-corrugated steel plate composite walls under compression-bending load. J. Constr. Steel Res. 2023, 201, 107701. [Google Scholar] [CrossRef]
  17. Wang, M.-Z.; Guo, Y.-L.; Zhu, J.-S.; Yang, X. Flexural-torsional buckling and design recommendations of axially loaded concrete-infilled double steel corrugated-plate walls with T-section. Eng. Struct. 2020, 208, 110345. [Google Scholar] [CrossRef]
  18. Yan, J.-B.; Guan, H.-N.; Yan, Y.-Y.; Wang, T. Numerical and parametric studies on SCS sandwich walls subjected to in-plane shear. J. Constr. Steel Res. 2020, 169, 106011. [Google Scholar] [CrossRef]
  19. Booth, P.N.; Bhardwaj, S.R.; Tseng, T.-C.; Seo, J.; Varma, A.H. Ultimate shear strength of steel-plate composite (SC) walls with boundary elements. J. Constr. Steel Res. 2020, 165, 105810. [Google Scholar] [CrossRef]
  20. Bagheri, M.; Malidarreh, N.R.; Ghaseminejad, V.; Asgari, A. Seismic resilience assessment of RC superstructures on long–short combined piled raft foundations: 3D SSI modeling with pounding effects. Structures 2025, 81, 110176. [Google Scholar] [CrossRef]
  21. Ali, A.; Mohsen, B.; Mohammad, H. Advanced seismic analysis of soil-foundation-structure interaction for shallow and pile foundations in saturated and dry deposits: Insights from 3D parallel finite element modeling. Structures 2024, 69, 107503. [Google Scholar] [CrossRef]
  22. Han, L.H. Concrete Filled Steel Tubular Structures—Theory and Practice; Science Press: Beijing, China, 2007. [Google Scholar]
  23. GB 50010-2010; Code for Design of Concrete Structures. Ministry of Housing and Urban Rural Development of the People’s Republic of China: Beijing, China, 2016.
  24. Wang, J.C.; Chen, Y.K. Application of ABAQUS in Civil Engineering; Zhejiang University Press: Hangzhou, China, 2006. [Google Scholar]
  25. Sun, Q.Z. An Overview of Plastic Damage Model of ABAQUS Concrete. Chongqing Archit. 2014, 13, 70–72. [Google Scholar] [CrossRef]
  26. Mohsen, B.; Mehdi, E.J.; Bijan, S. Effect of Seismic Soil–Pile–Structure Interaction on Mid- and High-Rise Steel Buildings Resting on a Group of Pile Foundations. Int. J. Geomech. 2018, 18, 04018103. [Google Scholar] [CrossRef]
  27. JGJ/T 380–2015; Technical Specification for Steel Plate Shear Wall. China Association for Engineering Construction Standardization: Beijing, China, 2015.
  28. Zhang, X.M.; Qin, Y.; Chen, Z.H. Experimental seismic behavior of innovative composite shear walls. J. Constr. Steel Res. 2016, 116, 218–232. [Google Scholar] [CrossRef]
  29. Yan, J.B.; Yan, Y.Y.; Wang, T. Cyclic tests on novel steel-concrete-steel sandwich shear walls with boundary CFST columns. J. Constr. Steel Res. 2020, 164, 105760. [Google Scholar] [CrossRef]
  30. Wu, J. Research on Seismic Behavior of High Strength Concrete Composite Shear Wall with Double Steel Plates. Master’s Thesis, Guangzhou University, Guangzhou, China, 2012. [Google Scholar]
  31. Chen, L.; Yin, C.; Wang, C.; Liu, Y. Experimental study on seismic behavior of double-skin composite wall with L-shaped connectors. J. Constr. Steel Res. 2020, 174, 106312. [Google Scholar] [CrossRef]
  32. Chen, Q. New L-Shaped Connector Double Steel Plate-Concrete Experimental Study on Hysteretic Performance of Composite Shear Wall. Master’s Thesis, Hefei University of Technology, Hefei, China, 2020. [Google Scholar]
  33. Liu, H.L. Study on Seismic Behavior of Composite Shear Wall with Double Steel Plates and Infill Concrete with Binding Bars. Ph.D. Thesis, South China University of Technology, Guangzhou, China, 2013. [Google Scholar]
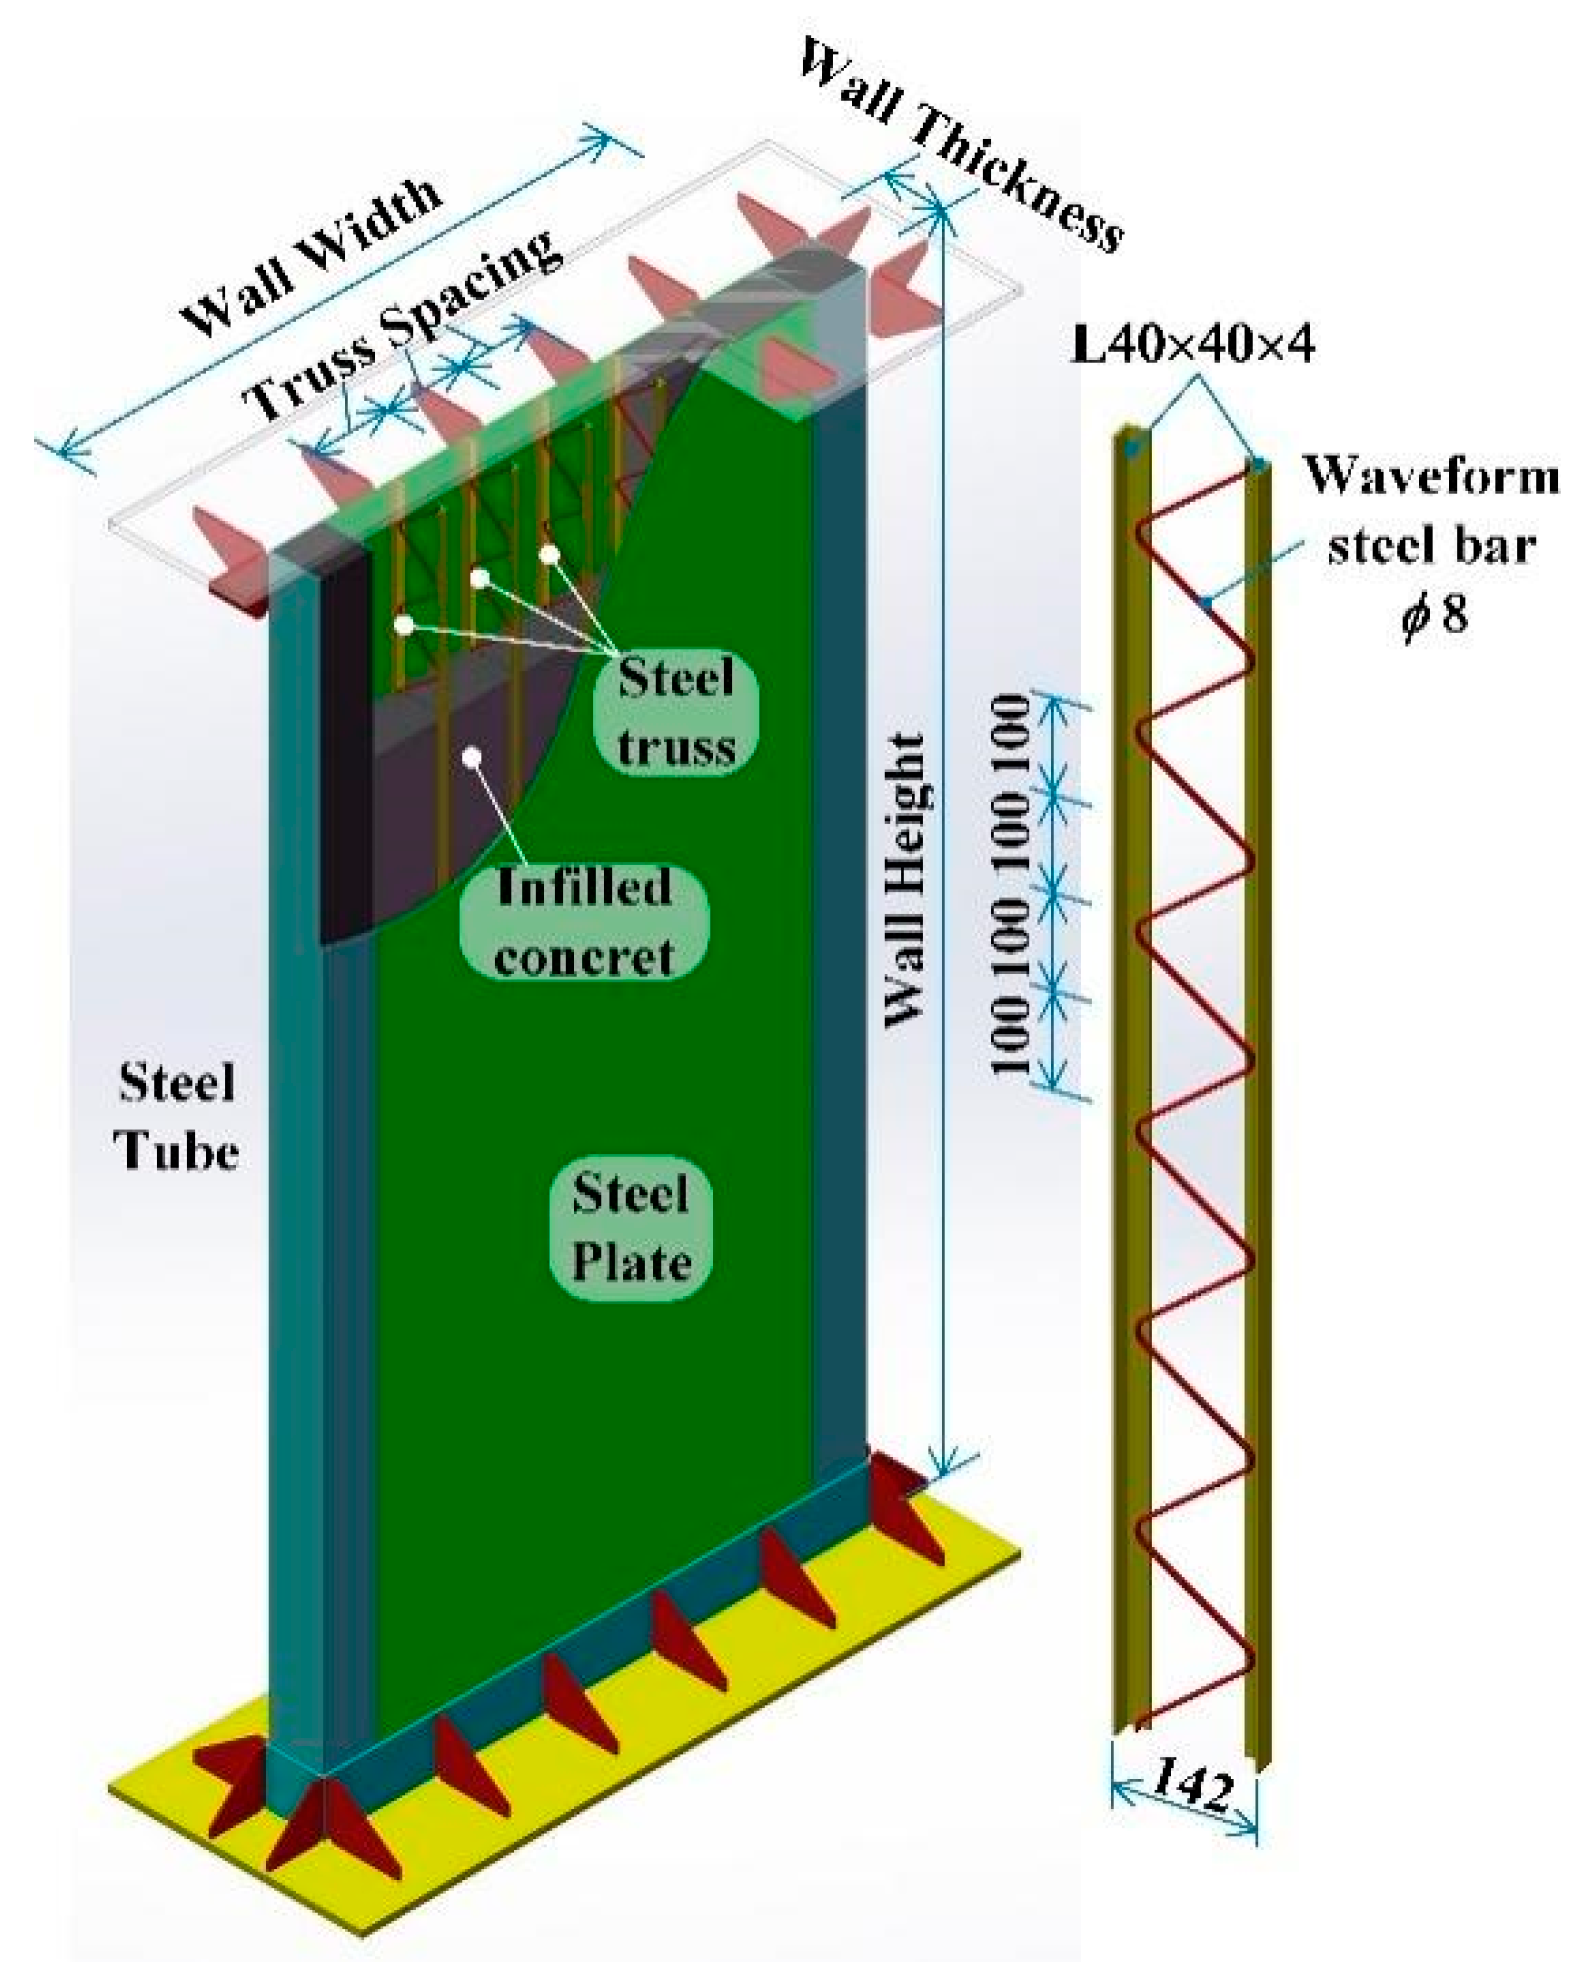
Figure 1. Diagram of specimen.
Buildings 15 03788 g001
Figure 2. Finite element analysis model.
Buildings 15 03788 g002
Figure 3. Boundary constraints and loading settings.
Buildings 15 03788 g003
Figure 4. Steel material constitutive model.
Buildings 15 03788 g004
Figure 5. Concrete constitutive model.
Buildings 15 03788 g005
Figure 6. Deformation comparison between FEM and experimental results.
Buildings 15 03788 g006aBuildings 15 03788 g006b
Figure 7. Comparison of load–displacement hysteresis curves.
Buildings 15 03788 g007aBuildings 15 03788 g007b
Figure 8. Comparison of load–displacement skeleton curves.
Buildings 15 03788 g008aBuildings 15 03788 g008b
Figure 9. Comparison of shear capacity under different axial compression ratios.
Buildings 15 03788 g009
Figure 10. Comparison of shear capacities under different aspect ratios.
Buildings 15 03788 g010
Figure 11. Comparison of shear capacities under different spacing–thickness ratios.
Buildings 15 03788 g011
Figure 12. Comparison of shear capacities of FEMs with different truss connector specifications.
Buildings 15 03788 g012
Figure 13. Strength coefficient curve.
Buildings 15 03788 g013
Figure 14. Comparison of predicted and tested ultimate shear strength for 26 composite walls [6,28,29,30,31,32,33].
Buildings 15 03788 g014
Table 1. Key parameters of double-skin truss-reinforced composite shear wall specimens.
Specimens No.Steel Plate Thickness
(mm)
Wall Height
(mm)
Wall Width
(mm)
Wall Thickness
(mm)
Truss Spacing
(mm)
Aspect RatiosSpacing-Thickness RatioAxial Compression Ratio
SCW-14300012001502002.5500.4
SCW-24300012001502002.5500.6
SCW-3430009001502003.3500.6
SCW-44300015001502002.0500.5
SCW-54300015001502002.0500.6
SCW-64300015001503002.0750.6
SCW-74300015001504002.01000.6
Table 2. Comparison of initial shear stiffness and the maximum equivalent viscous damping coefficient between FEA and test results.
Specimen No.Initial Shear Stiffness, K0 (kN/mm)Max. Equivalent Viscous Damping Coeff., he, max (%)
FEATestRatioFEATestRatio
SCW-163.860.31.0622.523.90.94
SCW-235.236.30.9723.827.90.85
SCW-320.721.70.9524.623.81.03
SCW-460.359.51.012521.41.17
SCW-559.254.51.0924.220.61.17
SCW-656.157.60.9825.126.70.94
SCW-756.5541.0526.532.80.81
Table 3. Parameter settings of FEMs with different axial compression ratios.
Models
No.
Steel Plate Thickness
(mm)
Wall Height
(mm)
Wall Width
(mm)
Wall Thickness
(mm)
Column Side Length
(mm)
Truss Spacing
(mm)
Axial Compression Ratio
WN-0.14300015001501502000.1
WN-0.24300015001501502000.2
WN-0.34300015001501502000.3
WN-0.44300015001501502000.4
WN-0.54300015001501502000.5
WN-0.64300015001501502000.6
WN-0.74300015001501502000.7
WN-0.84300015001501502000.8
Table 4. Main parameter settings of FEMs with different aspect ratios.
Model No.Steel Plate Thickness
(mm)
Wall Height
(mm)
Wall Width
(mm)
Wall Thickness
(mm)
Column Side Length
(mm)
Truss Spacing
(mm)
Aspect RatioAxial Compression Ratio
WA-0.754300040001501502000.750.6
WA-1.04300030001501502001.00.6
WA-1.54300020001501502001.50.6
WA-2.04300015001501502002.00.6
WA-2.54300012001501502002.50.6
WA-3.04300010001501502003.00.6
WA-3.3430008001501502003.30.6
WA-4.3430007001501502004.30.6
Table 5. Parameter settings of FEMs with different spacing–thickness ratios.
Model No.Steel Plate Thickness
(mm)
Wall Height
(mm)
Wall Width
(mm)
Wall Thickness
(mm)
Column Side Length
(mm)
Truss Spacing
(mm)
Spacing–Thickness RatioAxial Compression Ratio
WS-37.543000150015015015037.50.6
WS-50430001500150150200500.6
WS-60430001500150150240600.6
WS-75430001500150150300750.6
WS-1004300015001501504001000.6
Table 6. Parameter settings of FEMs with different truss connector specifications.
Model No.Steel Plate Thickness
(mm)
Wall Height
(mm)
Wall Width
(mm)
Wall Thickness
(mm)
Column Side Length
(mm)
Angle Steel Specification (mm)Steel Bar Diameter
(mm)
Axial Compression Ratio
WST-20&843000150015015020 × 20 × 4 *80.6
WST-30&843000150015015030 × 30 × 480.6
WST-40&843000150015015040 × 40 × 480.6
WST-45&843000150015015045 × 45 × 480.6
WST-50&843000150015015050 × 50 × 480.6
WST-40&643000150015015040 × 40 × 460.6
WST-40&1043000150015015040 × 40 × 4100.6
WST-40&1243000150015015040 × 40 × 4120.6
* Side Length × Side Length × Thickness.
Disclaimer/Publisher’s Note: The statements, opinions and data contained in all publications are solely those of the individual author(s) and contributor(s) and not of MDPI and/or the editor(s). MDPI and/or the editor(s) disclaim responsibility for any injury to people or property resulting from any ideas, methods, instructions or products referred to in the content.