Article

Optimization of a Design Process and Passive Parameters for Residential Nearly Zero Energy Building Envelopes Based on Energy Consumption Targets

1
School of Architecture and Urban Planning, Shandong Jianzhu University, Jinan 250101, China
2
Shandong Quality Inspection and Testing Center of Construction Engineering Co., Ltd., Jinan 250109, China
3
Shandong Academy of Building Sciences Co., Ltd., Jinan 250031, China
*
Author to whom correspondence should be addressed.
Buildings 2025, 15(20), 3785; https://doi.org/10.3390/buildings15203785
Submission received: 20 September 2025 / Revised: 16 October 2025 / Accepted: 17 October 2025 / Published: 20 October 2025
(This article belongs to the Section Building Energy, Physics, Environment, and Systems)

Abstract

The calculation of energy consumption in building plans is usually carried out after design completion, resulting in high time costs and hindering their application in the early design stage. This study focused on the heating and cooling demands of nearly zero energy residential buildings in Jinan and developed an envelope optimization model for the design stage. Firstly, field research on residential buildings in Jinan was conducted, and the shape coefficient based on research data was determined. Subsequently, ten design parameters were selected, and a prediction function was established through multiple linear regression. Finally, the mechanisms between the parameters and energy consumption were revealed, and the reliability of the model was verified. Results showed that the most energy-efficient shape coefficient is an 18-story rectangular building with a length of 52.6 m, a width of 15.1 m, and a floor-to-floor height of 3 m. The goodness of fit of the prediction function is 0.994. The adjusted R2 and RMSE of the neural network model in interpretable analysis are 0.933 and 0.089, respectively. The window-to-wall ratio significantly impacts energy consumption. This study addresses the lack of energy optimization by establishing a process that first determines energy-efficient parameter combinations and then refines the architectural scheme, and provides software to assist architects in design during schematic phases.

1. Introduction

1.1. Research Background

Energy consumption standards for nearly zero energy buildings (NZEBs) have become progressively stringent. A comprehensive review of the extant literature and detailed case studies indicates that over 30% of the potential for building energy savings can be realized during the early design phase. Consequently, compliance-based design and design validation have emerged as the prevailing strategies for regulating building energy consumption standards. However, the current dynamic simulation software, such as DeST [1], EnergyPlus [2], and TRNSYS [3], require the input of detailed design parameters, whereas static calculation methods, such as IBE, PHPP [4], the BIN [5] method, and existing Chinese energy consumption calculation methods [6] necessitate complex manual input. Therefore, architects cannot accurately predict the quantitative correlation between the building envelope design parameters and energy consumption during a design phase, which has frequently resulted in unwarranted escalations in specific design parameters, product overuse, and the excessive application of energy-saving technologies. Thus, establishing an energy consumption prediction and optimization method for the envelope design phase of buildings is essential to eliminate the design validation model, reduce designer workload during the conceptual design phase, and promote the development of NZEBs in China.

1.2. Literature Review

The approaches to energy-saving architectural design are generally classified into compliance-based and performance-based methods. Compliance-based design is the most commonly used approach for adhering to energy efficiency and nearly zero energy (NZE) standards in many countries due to its simplicity and ease of implementation. However, regional variations in the regulatory limit values for energy consumption, influenced by distinct local climate characteristics, are often observed. Consequently, Germany revised its Passive House standard [7]. This revision underscores the contention that compliance-based design has lagged behind the development of NZEBs, with performance-based design emerging as a pivotal approach for NZEBs.
Scholars have also contributed significantly to the exploration of performance-based design. Several studies have developed parametric design methods for NZEB design [8], combining platforms like Building Information Modeling (BIM) [9], DesignBuilder [10], Ladybug, and Honeybee [11] with optimization algorithms and machine learning (ML) models [12]. These methods have been applied to predict building performance targets with high accuracy and reduced computational costs compared to full dynamic simulations [13,14]. Furthermore, surrogate models and hybrid ML frameworks are used to accelerate multi-objective optimization processes, making them particularly suitable for early-stage parametric design optimization where rapid feedback is critical [15] and enabling architects to explore design alternatives efficiently. Despite these advancements, most existing studies either focus on isolated parameters or specific case studies, lacking integrated approaches tailored to regional-specific building typologies [16]. Table 1 shows the summary of performance-based design in recent years.
The performance-based design for NZE residential buildings primarily encompasses two components: the building shape coefficient and the building envelope. Based on the extant literature, before achieving 75% energy savings, buildings with poor window insulation performance and high heating demand in cold climates are chiefly heat-dissipating. Therefore, small shape coefficients lead to reduced heat loss surface for buildings of the same volume, which is favorable for energy savings [32,33]. However, based on NZE targets, the impact of heat gain becomes increasingly significant with improvements in window insulation performance, and the theoretical limitations of the shape coefficients become apparent. For example, Szalay et al. [34] revealed that in Hungary, merely improving the envelope heat transfer coefficients and mitigating air infiltration thermal transfer would not be sufficient to meet Passive House certification standards. Furthermore, they argued that a smaller shape coefficient is not the optimal building form and proposed that the solar gain-facing facade area and corresponding window-to-wall ratio (WWR) should be the primary reference indicators. In the design of the building envelope, compliance-based design operates under the assumption that if the design parameters of the building enclosure system align with the regulatory indicators specified in energy efficiency standards, the building energy consumption level will attain the desired energy-saving target. However, this approach limits the creativity of architects during the design phase and underperforms relative to the fundamental goal of building energy performance optimization. As performance-based design does not necessitate specific design parameter values, a significant number of scholars have conducted studies on the selection of key parameters [35,36,37].
Although extensive research has explored both shape coefficients and envelope parameters for residential NZEB design, most previous works remain fragmented and often focus on specific technologies [38,39] or case studies [40], lacking practical application in real-world building design. Therefore, quantifying the relationship between passive design parameters and energy consumption under regional climate conditions [41] and developing a prediction model for envelope design parameters and energy consumption applicable to the scheme design phase can help promote the development of residential NZEBs in Jinan.

1.3. Research Gaps and Aims

Approaches using the shape coefficients and WWR for energy-saving building design are outdated. Although numerous studies have investigated the relationship between building design parameters and energy consumption, the quantitative relationship applicable to residential buildings in Jinan remains unclear, hindering effective prediction of energy consumption during the design phase and optimization of the design parameters. To address these gaps, this study proposes an NZE residential building envelope optimization and building energy consumption prediction model, which can assist architects in envelope design during schematic phases. To make the model applicable to residential buildings in Jinan, the shape coefficients and envelope design parameters are identified by field research and design specifications. Furthermore, this study explores the impact of design parameters of the envelope on energy consumption and validates the effectiveness of the prediction model through the case study. Therefore, the novelty of this study can be summarized as follows. (1) Developing an energy consumption prediction model can facilitate the rapid completion of energy consumption calculations for envelope design alternatives, even in the absence of energy-saving calculation theories as part of design parameters. (2) Revealing the mechanism between NZE residential building envelope passive design parameters and energy consumption in Jinan, enabling practical application during schematic design.

2. Methodology

2.1. Research Framework

This study developed a model using simulation performance modeling, univariate interpretability analysis, and multiple linear regression. Design Optimization and Energy Prediction (DOEP) 1.0.0 software was developed using JavaScript. V8. The technical process is illustrated in Figure 1.
In the context of NZEB targets, the minimum building energy demand depends on the building having the most energy-efficient shape coefficient and envelope structure. This study explored the numerical association between the shape coefficients design factor of NZE residential buildings in Jinan and overall building energy consumption. Subsequently, the design parameters for the minimum energy consumption target were derived, and the most energy-efficient shape coefficient model was established. The established minimum energy consumption model was used to select the key parameters for an energy-efficient envelope design. Then, building envelope design parameters were combined to generate orthogonal design schemes, and energy simulations were conducted to determine the heating and cooling energy consumptions under multifactorial interactions. Finally, SPSS 27.0.1 software was used to perform multiple linear regression on the orthogonal experimental data, thereby establishing a mathematical model for heating and cooling energy consumption in relation to the key building envelope parameters. Additionally, interpretable analysis using SHAP revealed the influence relationship between building envelope design parameters and energy consumption, assisting architects in better understanding the importance of envelope design parameters during the design phase. DOEP software was developed to assist in the design process during the conceptual phase. The development of a calculation model facilitated the optimization of key parameters in building performance-driven design and operational energy demand modeling.

2.2. Simulation

2.2.1. Energy Consumption Simulation Software

Dynamic calculation methods are reasonable and close to real-world conditions, as they consider factors such as meteorological influences and the volumetric heat capacity metrics of building materials [42]. This study employed the Ladybug Tools plugin on the Rhino platform within the Grasshopper environment for energy consumption simulations. This suite of tools integrates modules such as Ladybug, Honeybee, and Dragonfly and can be used to simulate various building parameters, including energy consumption, lighting, and thermal comfort [43].
A comparative analysis of multiple simulation software tools revealed that the Honeybee Tools plugin employs the EnergyPlus calculation core, developed by the U.S. Department of Energy and Lawrence Berkeley National Laboratory, based on BLAST and DOE-2. This integration combines the strengths of both models and introduces novel features. Specifically, the daylighting model employs an anisotropic sky model, facilitating precise simulations of sky diffuse intensity on inclined surfaces [44]. The software employs an integrated synchronous load, system, and equipment simulation method for energy consumption. It uses the CTF and heat balance methods to calculate wall heat transfer and load, respectively, and simulates air-conditioning systems based on component assembly. The software comprehensively considers factors such as solar radiation and airflow velocity, making it particularly suitable for the refined design requirements of NZEBs [45].

2.2.2. Passive Design Parameters

Passive design parameters of residential buildings are categorized into two dimensions: building shape coefficient parameters and building envelope parameters. Shape coefficient parameters include building plan shape, building plan size, and building height. Among them, building plan size is composed of building plan length (L) and building plan width (W); building height is composed of the number of floors and the floor-to-floor height. Envelope parameters include the heat transfer coefficient of the external wall (U), heat transfer coefficient of the window (UW), solar heat gain coefficient (SHGC), and WWR. Among them, UW, SHGC, and WWR are composed of south (UWS, SHGCS, WWRS), north (UWN, SHGCN, WWRN), and east/west (UWEW, SHGCEW, WWREW). The values of the shape coefficient design parameters are determined by field research, while the values of the envelope design parameters are determined by field research and design specifications [6].

2.2.3. Simulation Boundary Conditions

This study mainly focuses on the insulation and thermal insulation capabilities of the building, exploring the impact of internal disturbance factors on the energy consumption of the building, and avoiding external disturbance factors. During the simulations, factors such as indoor occupancy, electrical equipment, and other internal heat sources were set to zero, and the fresh air ventilation system was deactivated. Thus, the energy consumption calculations considered only the effects of heat transfer through the building envelope, solar heat gain, and heat gain or loss due to infiltration. This approach referred to prior studies that applied specific simulation conditions to evaluate the sensitivity of passive design variables [46]. By excluding external disturbance factors, the analysis focuses on the intrinsic thermal performance of the envelope [47]. The energy consumption simulation emphasized the configuration of construction and HVAC systems. Comprehensive parameter details are presented in Table 2.

2.2.4. Building Energy Consumption

Building energy consumption is usually defined as the final energy used for heating, cooling, ventilation, lighting, domestic hot water, and elevator operation under specified calculation conditions, minus the electricity produced by on-site renewable systems. It is expressed as the annual average useful energy per unit of floor area [6]. Because energy use by electrical equipment is largely insensitive to the simulated design parameters, this study refines the definition of building energy consumption (E) and adopts a streamlined set of indicators that focus primarily on heating and cooling energy for assessment. The calculation using EnergyPlus is as follows:
E = E U I H + E U I C
where E U I H is the energy use intensity for heating, kWh/m2; E U I C is the energy use intensity for cooling, kWh/m2.

2.3. Interpretability Analysis

By delving into interpretability, architects can unravel the secrets of machine learning’s inner workings and the rationale behind its predictions. The DeepSHAP model, an upgrade to the SHAP technique [48], combines DeepLIFT and Shapley value ideas to offer a near-accurate approach to elucidating artificial neural network models. It measures how much impact each input feature has on the final predictions and assesses their distinct roles in the output during backpropagation—a technique deeply rooted in Shapley value calculation fundamentals. This study employs interpretable analysis to elucidate the relationship between building envelope design parameters and energy consumption.

3. Analysis

3.1. Analysis of the Most Energy-Efficient Shape Coefficient

Based on scholarly findings and considering the impact of solar radiation [49], the effects of building shape coefficient design parameters on energy consumption were sorted from largest to smallest as plan shape, building height, and plan size. This ranking was utilized to ascertain the minimum energy consumption shape coefficient model for NZE residential buildings in Jinan.

3.1.1. Building Plan Shape

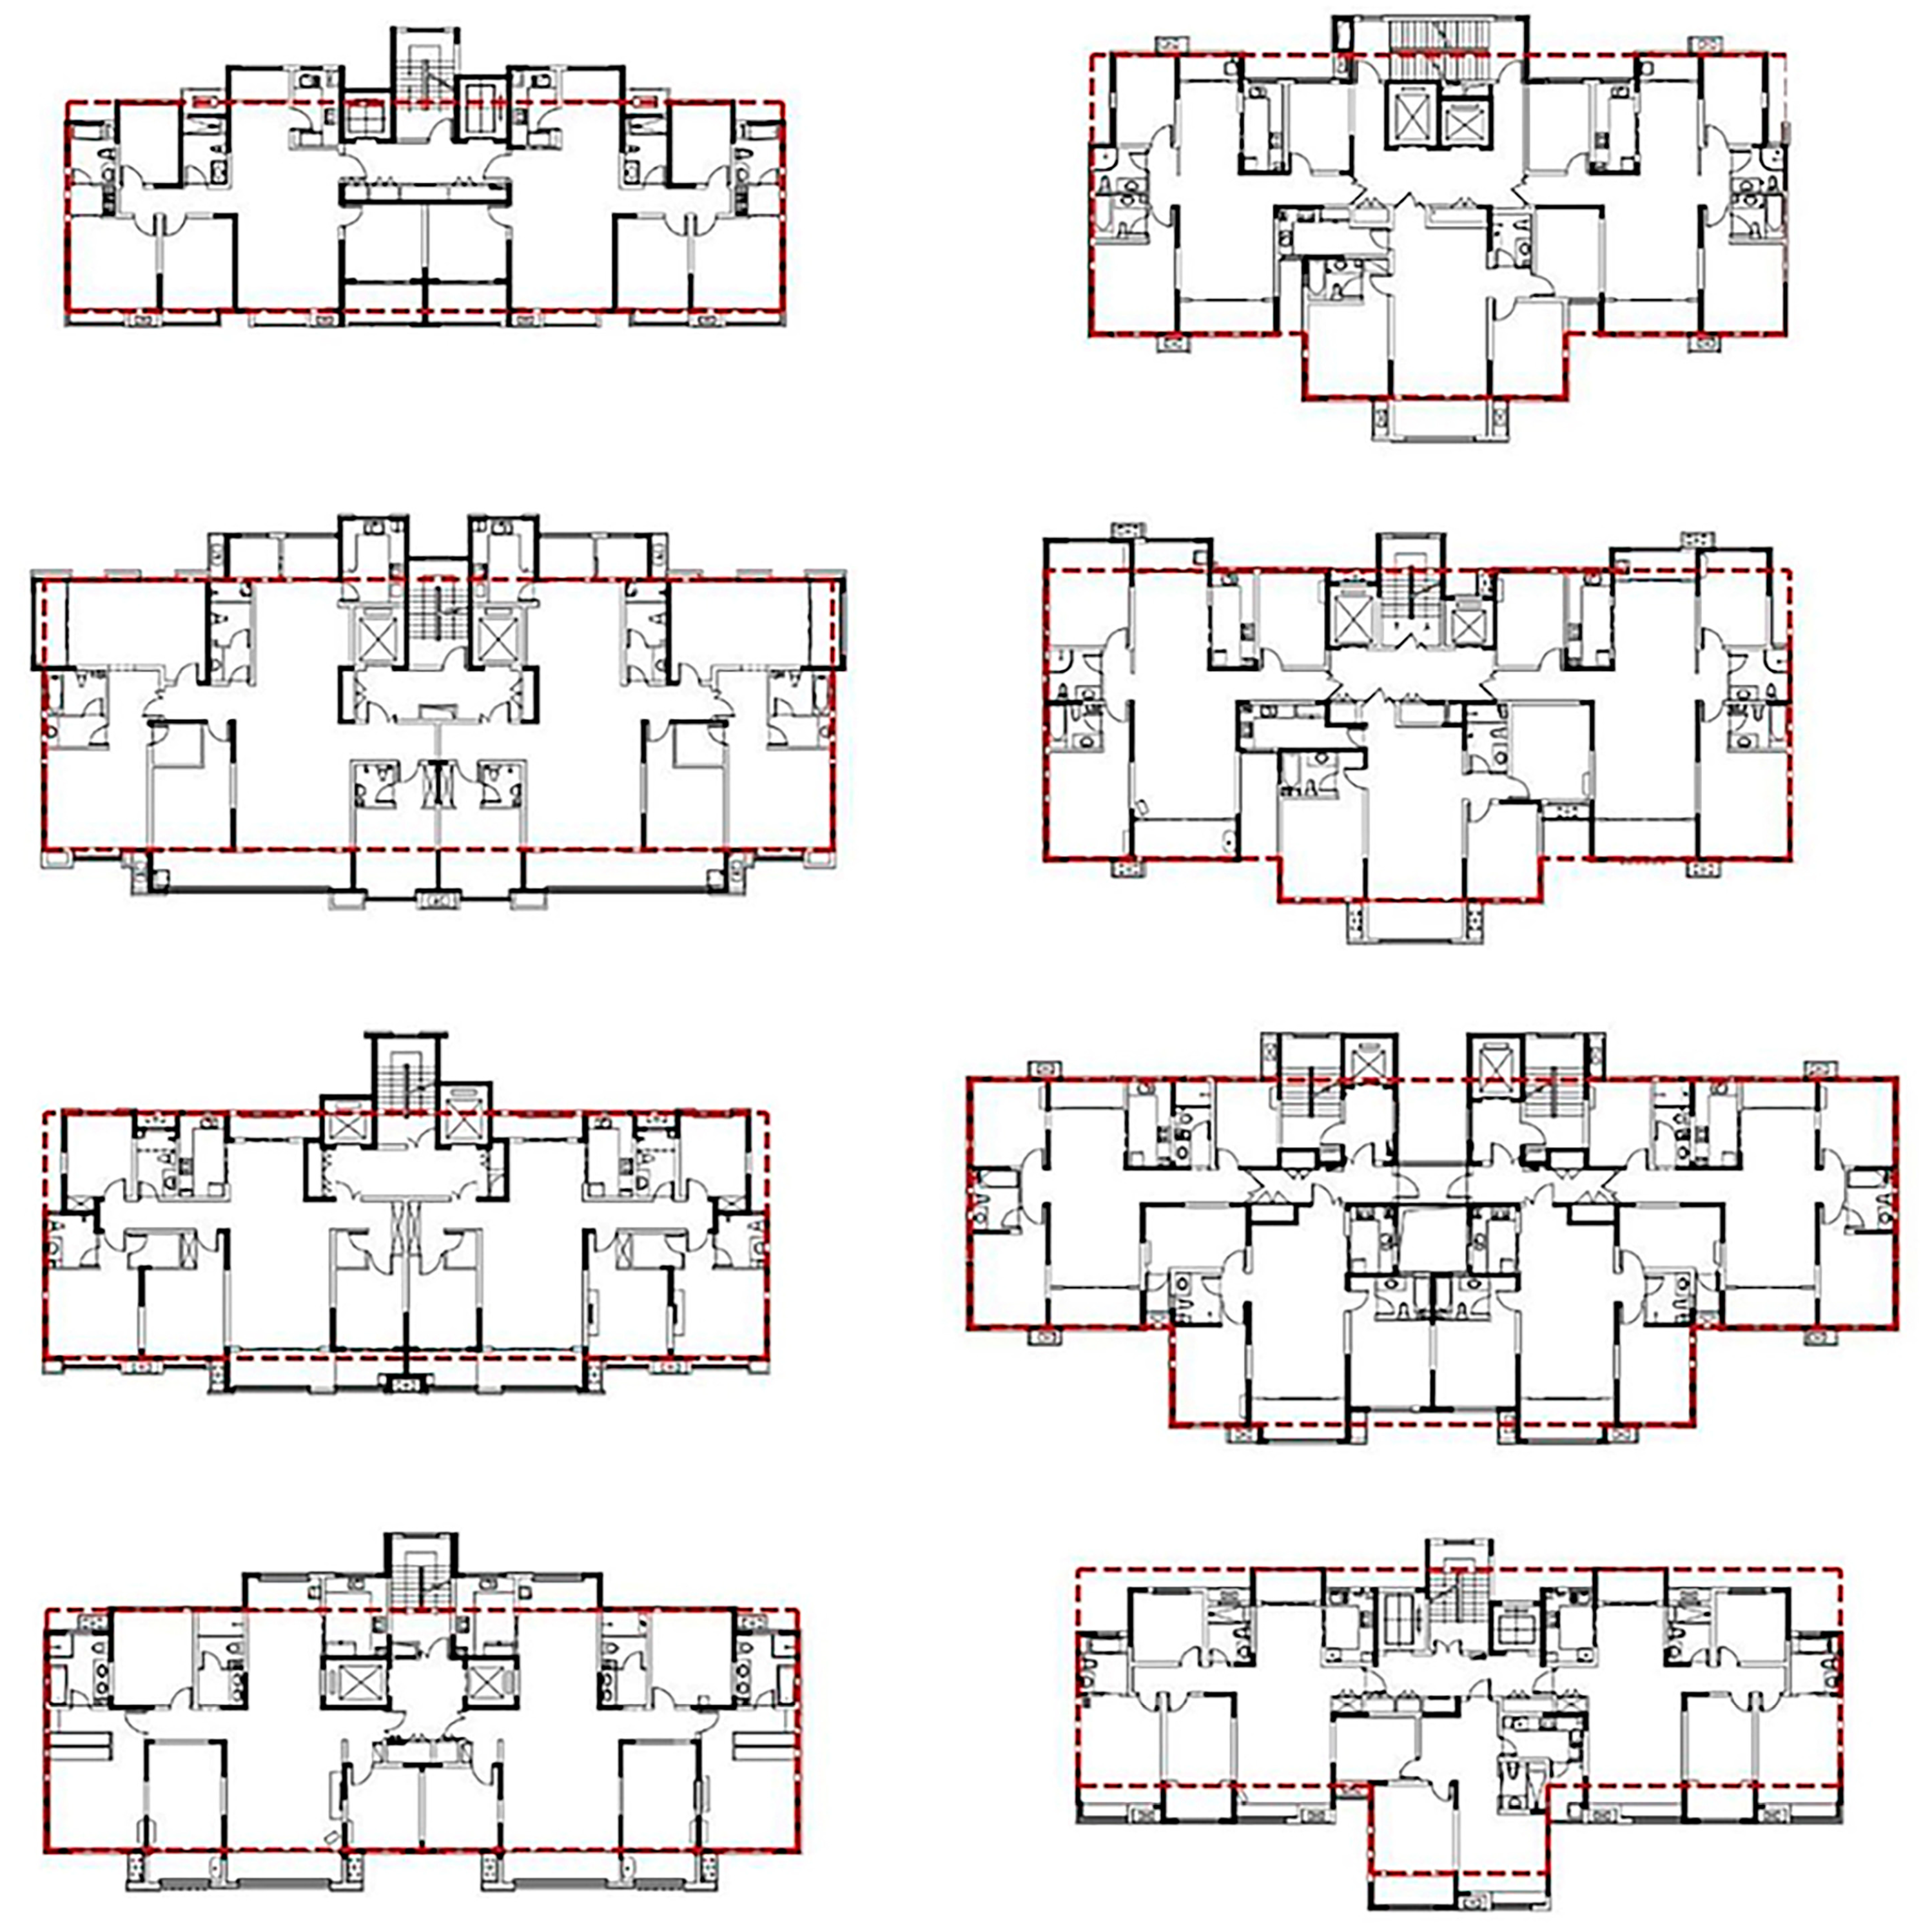
The study examined the different floor plan types of residential buildings in Jinan. The floor plans of individual residential units were simplified, with the most common shapes being the rectangular plan and the inverted convex shape, as shown in Figure 2. To ensure that the simplified rectangular plan did not impact the subsequent analysis, energy consumption simulations were performed for both the original and simplified plans. A paired t-test was conducted on the energy consumption values before and after simplification and revealed no significant difference in the energy consumption of buildings with two units per floor. This finding suggested that simplifying the floor plan of buildings with two units per floor to a rectangular shape did not significantly affect the energy consumption results, thereby validating the feasibility of simplifying the building model.
To determine the most energy-efficient building form, energy consumption simulations were conducted for rectangular and inverted convex-shaped residential housing with consistent story height parameters, number of floors, and standard floor area. A paired t-test of the energy consumption values for the two building types demonstrated significant differences (p < 0.05): inverted convex shaped residential buildings exhibited higher heating energy consumption per unit area (1.03 kWh/m2), higher cooling energy consumption per unit area (0.08 kWh/m2), and higher total heating and cooling energy consumption (1.11 kWh/m2). This finding suggested that a rectangular plan for buildings with two units per floor was more energy efficient.

3.1.2. Building Height

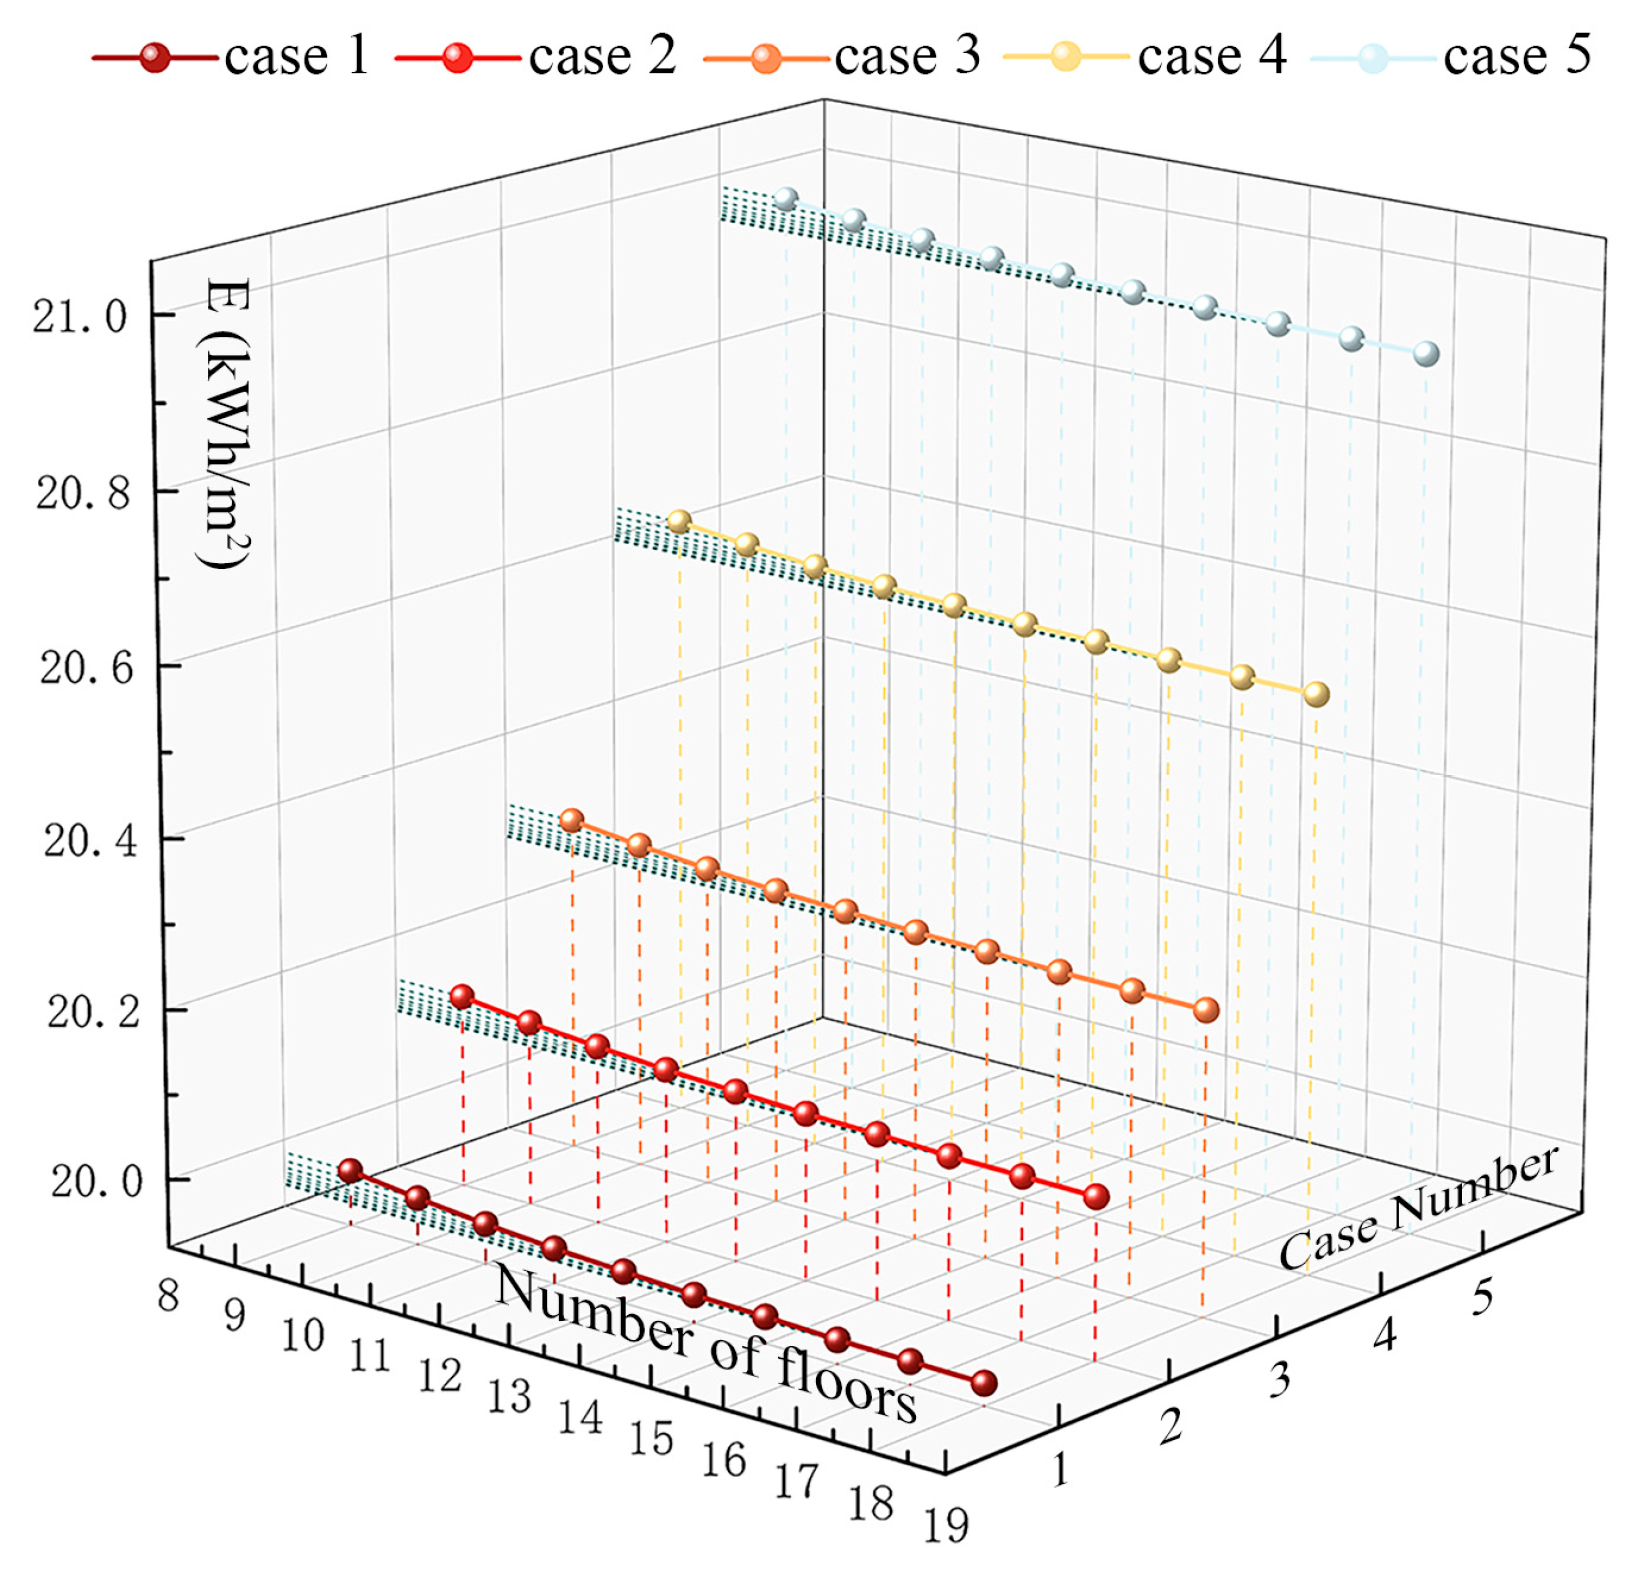
The study established that the building floor height fluctuated between 2.8 m and 3.0 m. Five randomly selected survey cases were simulated to verify this hypothesis. The results demonstrated that as the number of floors increased from 9 to 18, the energy consumption per unit area initially decreased and subsequently stabilized, as shown in Figure 3. Consequently, a building construction with 18 floors and a floor-to-floor height of 3 m was reasonable for NZE residential buildings in Jinan.

3.1.3. Building Plan Size

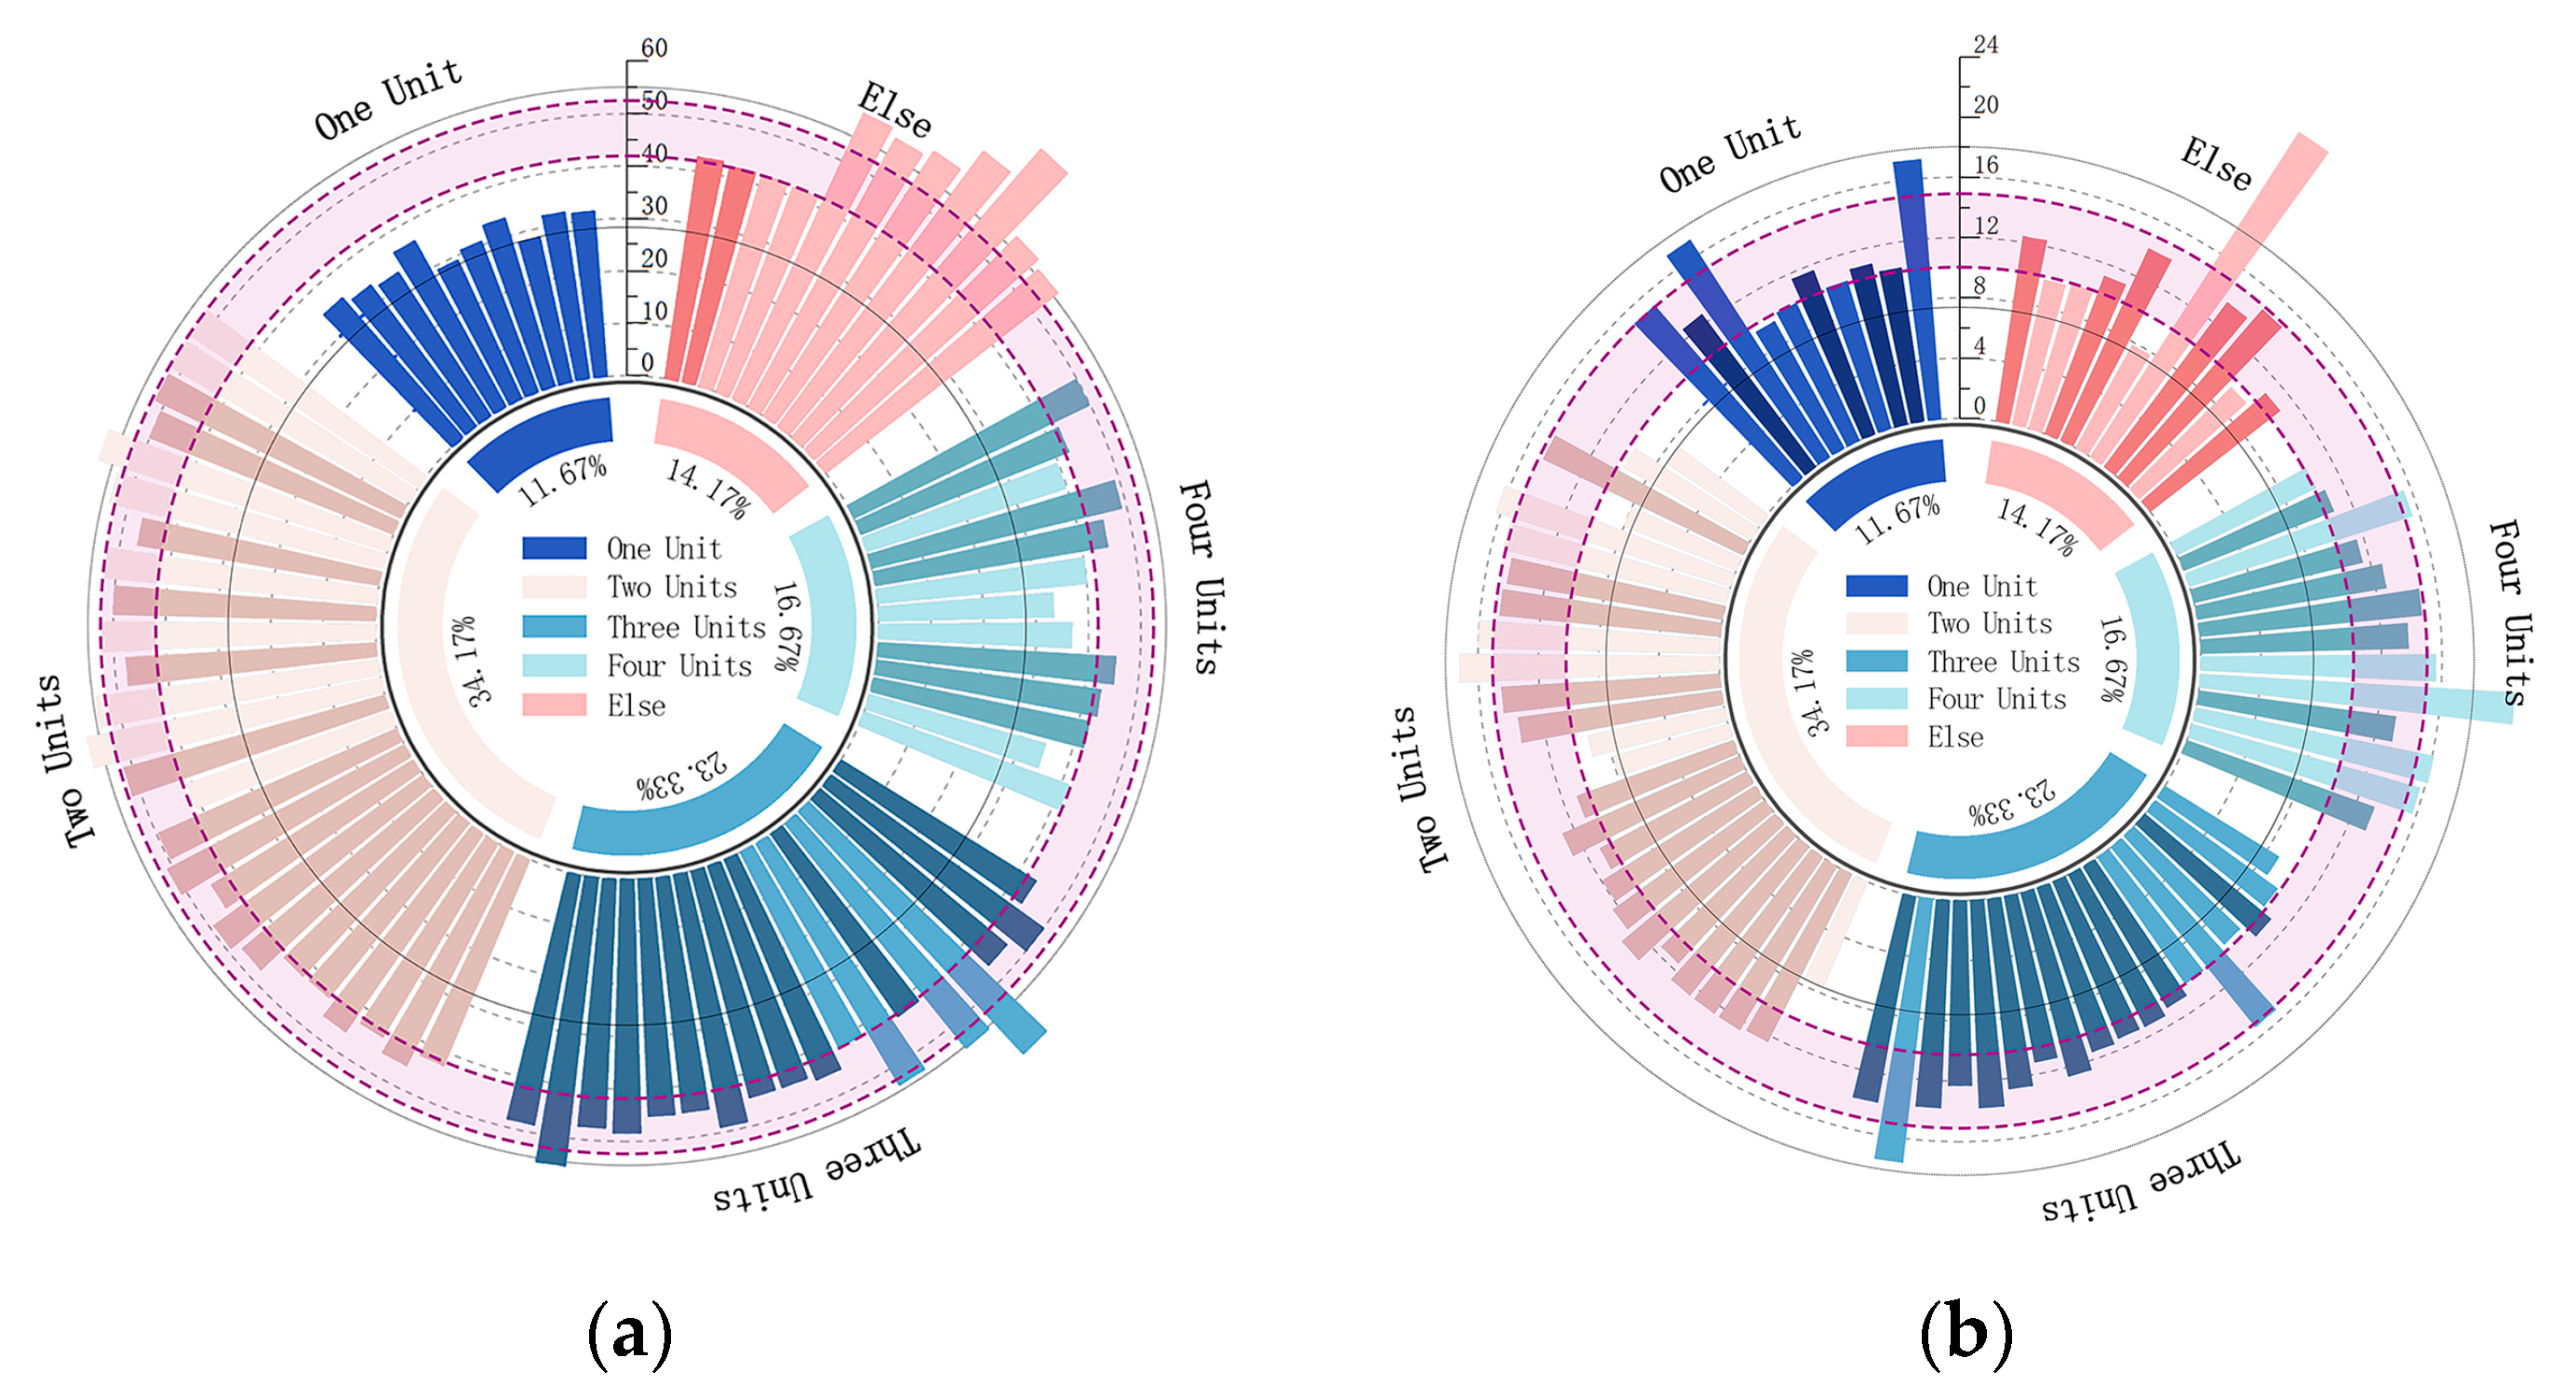
The floor dimensions of residential buildings were determined using several factors, such as unit width, unit depth, and number of units per floor. The survey results indicated that high-rise residential buildings predominantly comprised 1 to 4 units per floor, with the most prevalent configuration being two adjacent units, accounting for 34.17% of the total. Further statistical analysis of the building length and width for two-unit adjacent residential buildings revealed that the building length was predominantly from 40.6 to 52.6 m, while the building width was from 10.3 to 15.1 m, as shown in Figure 4.
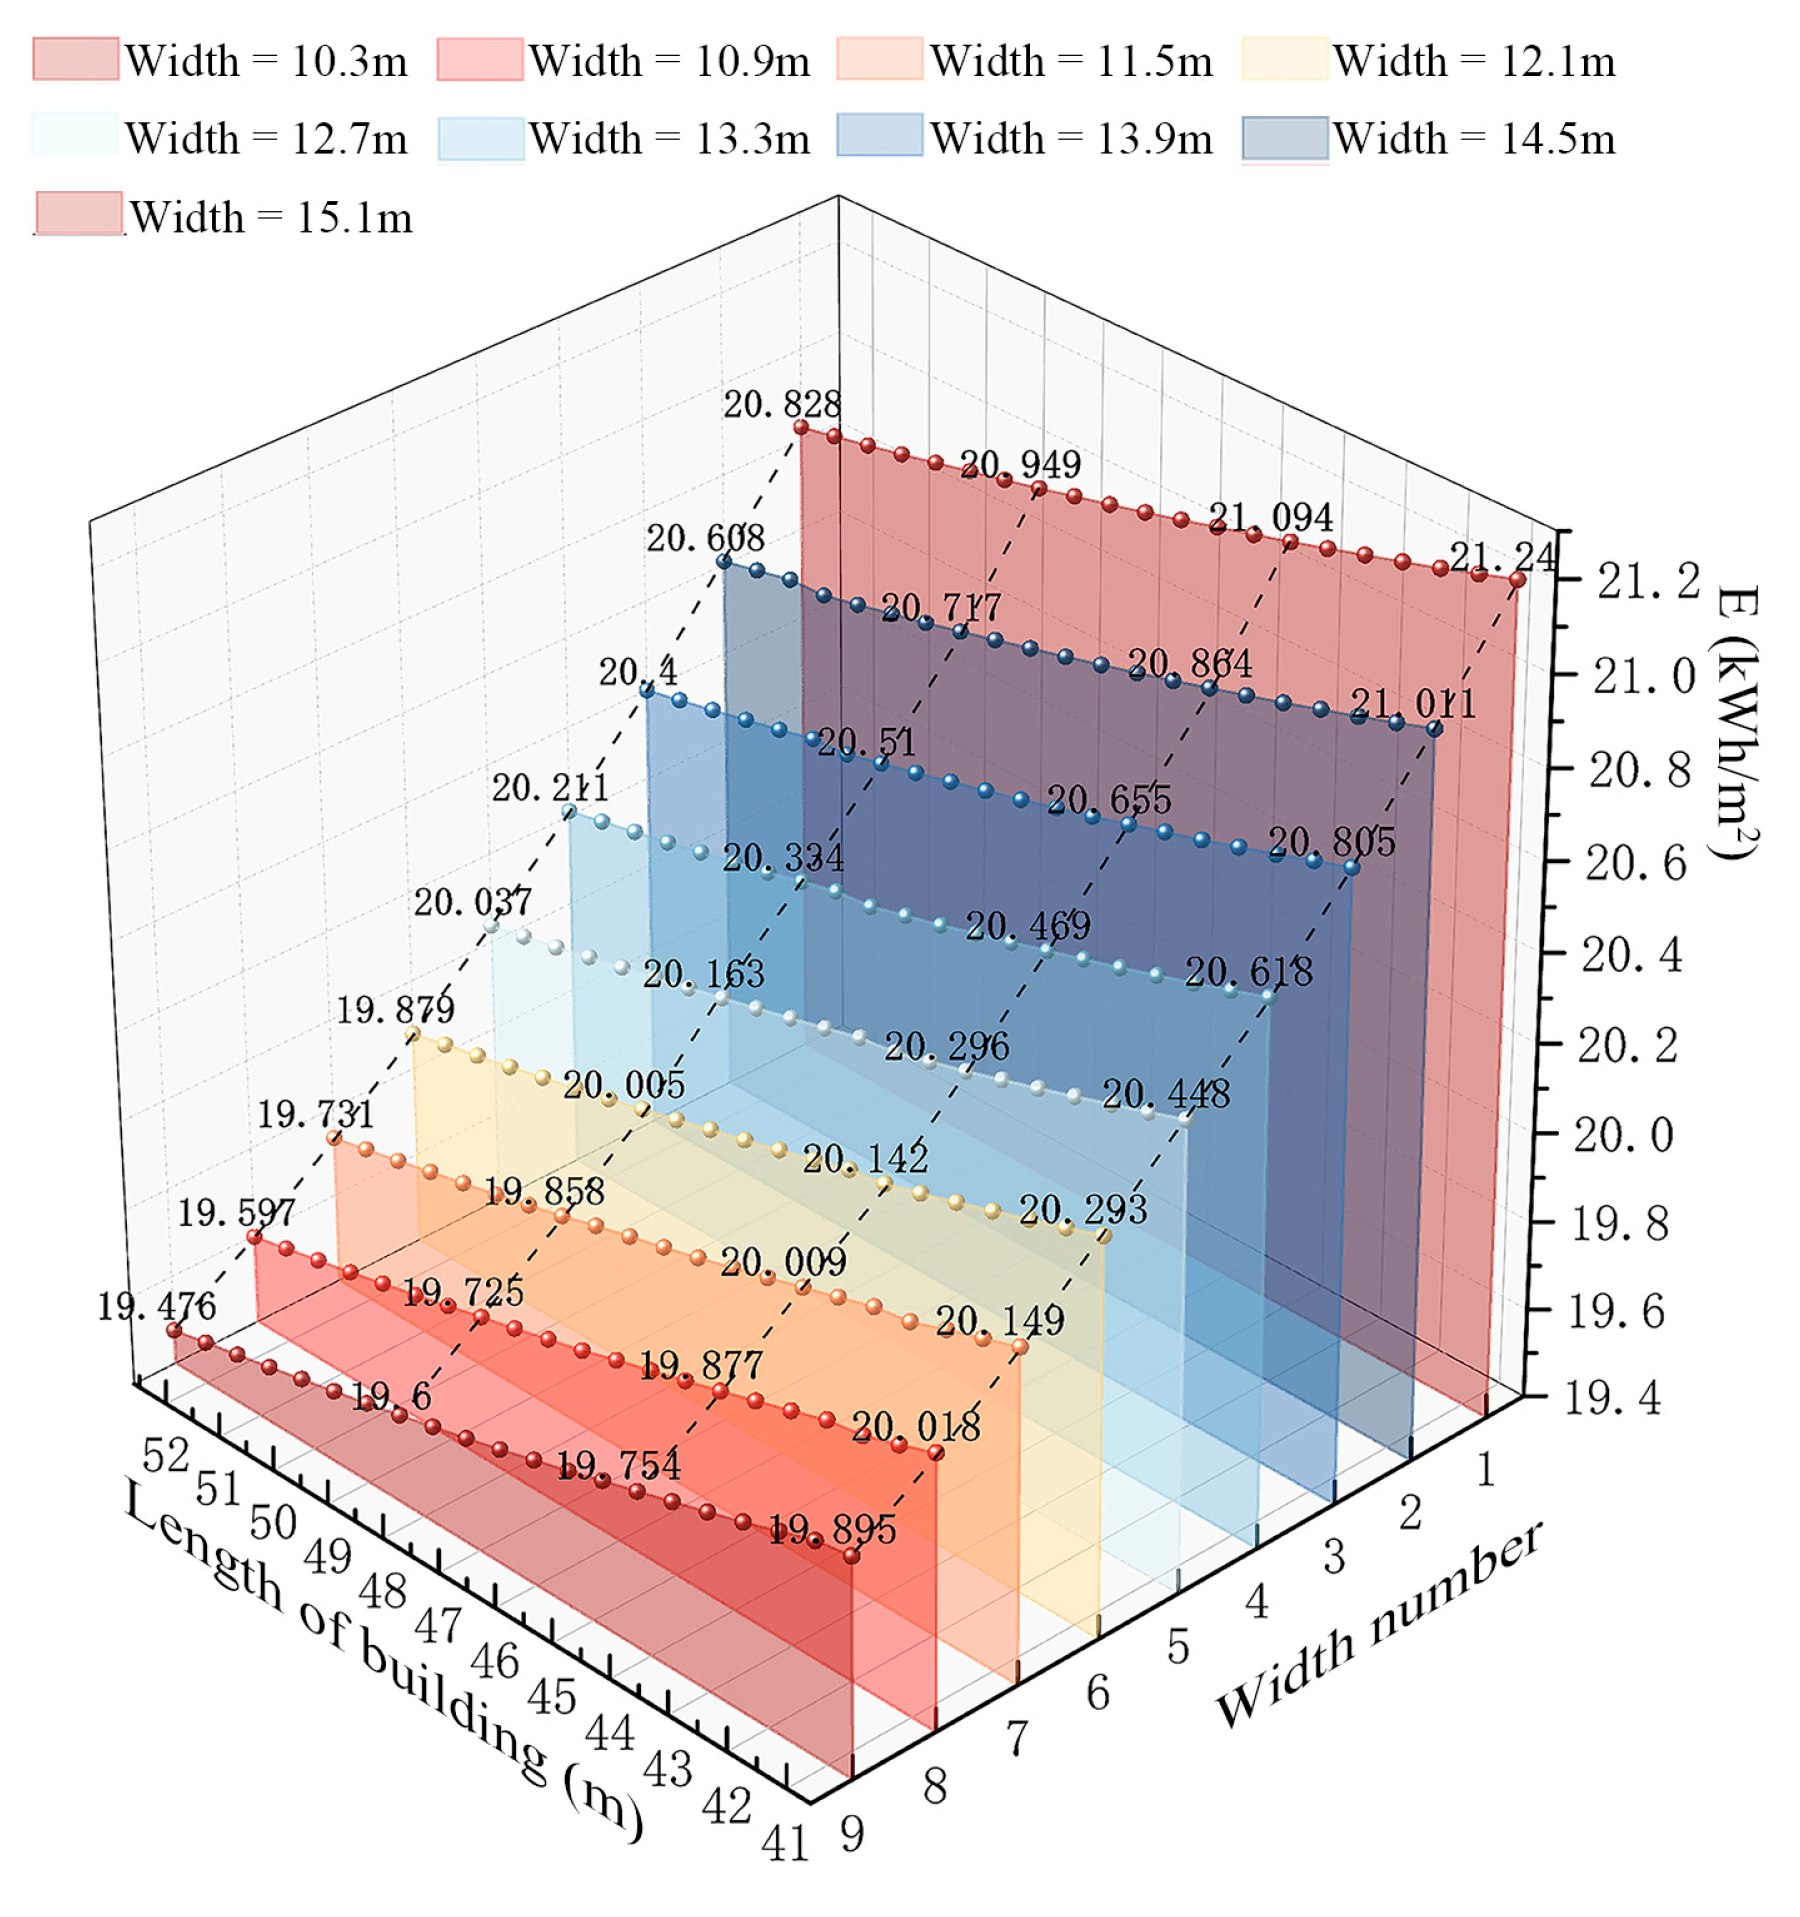
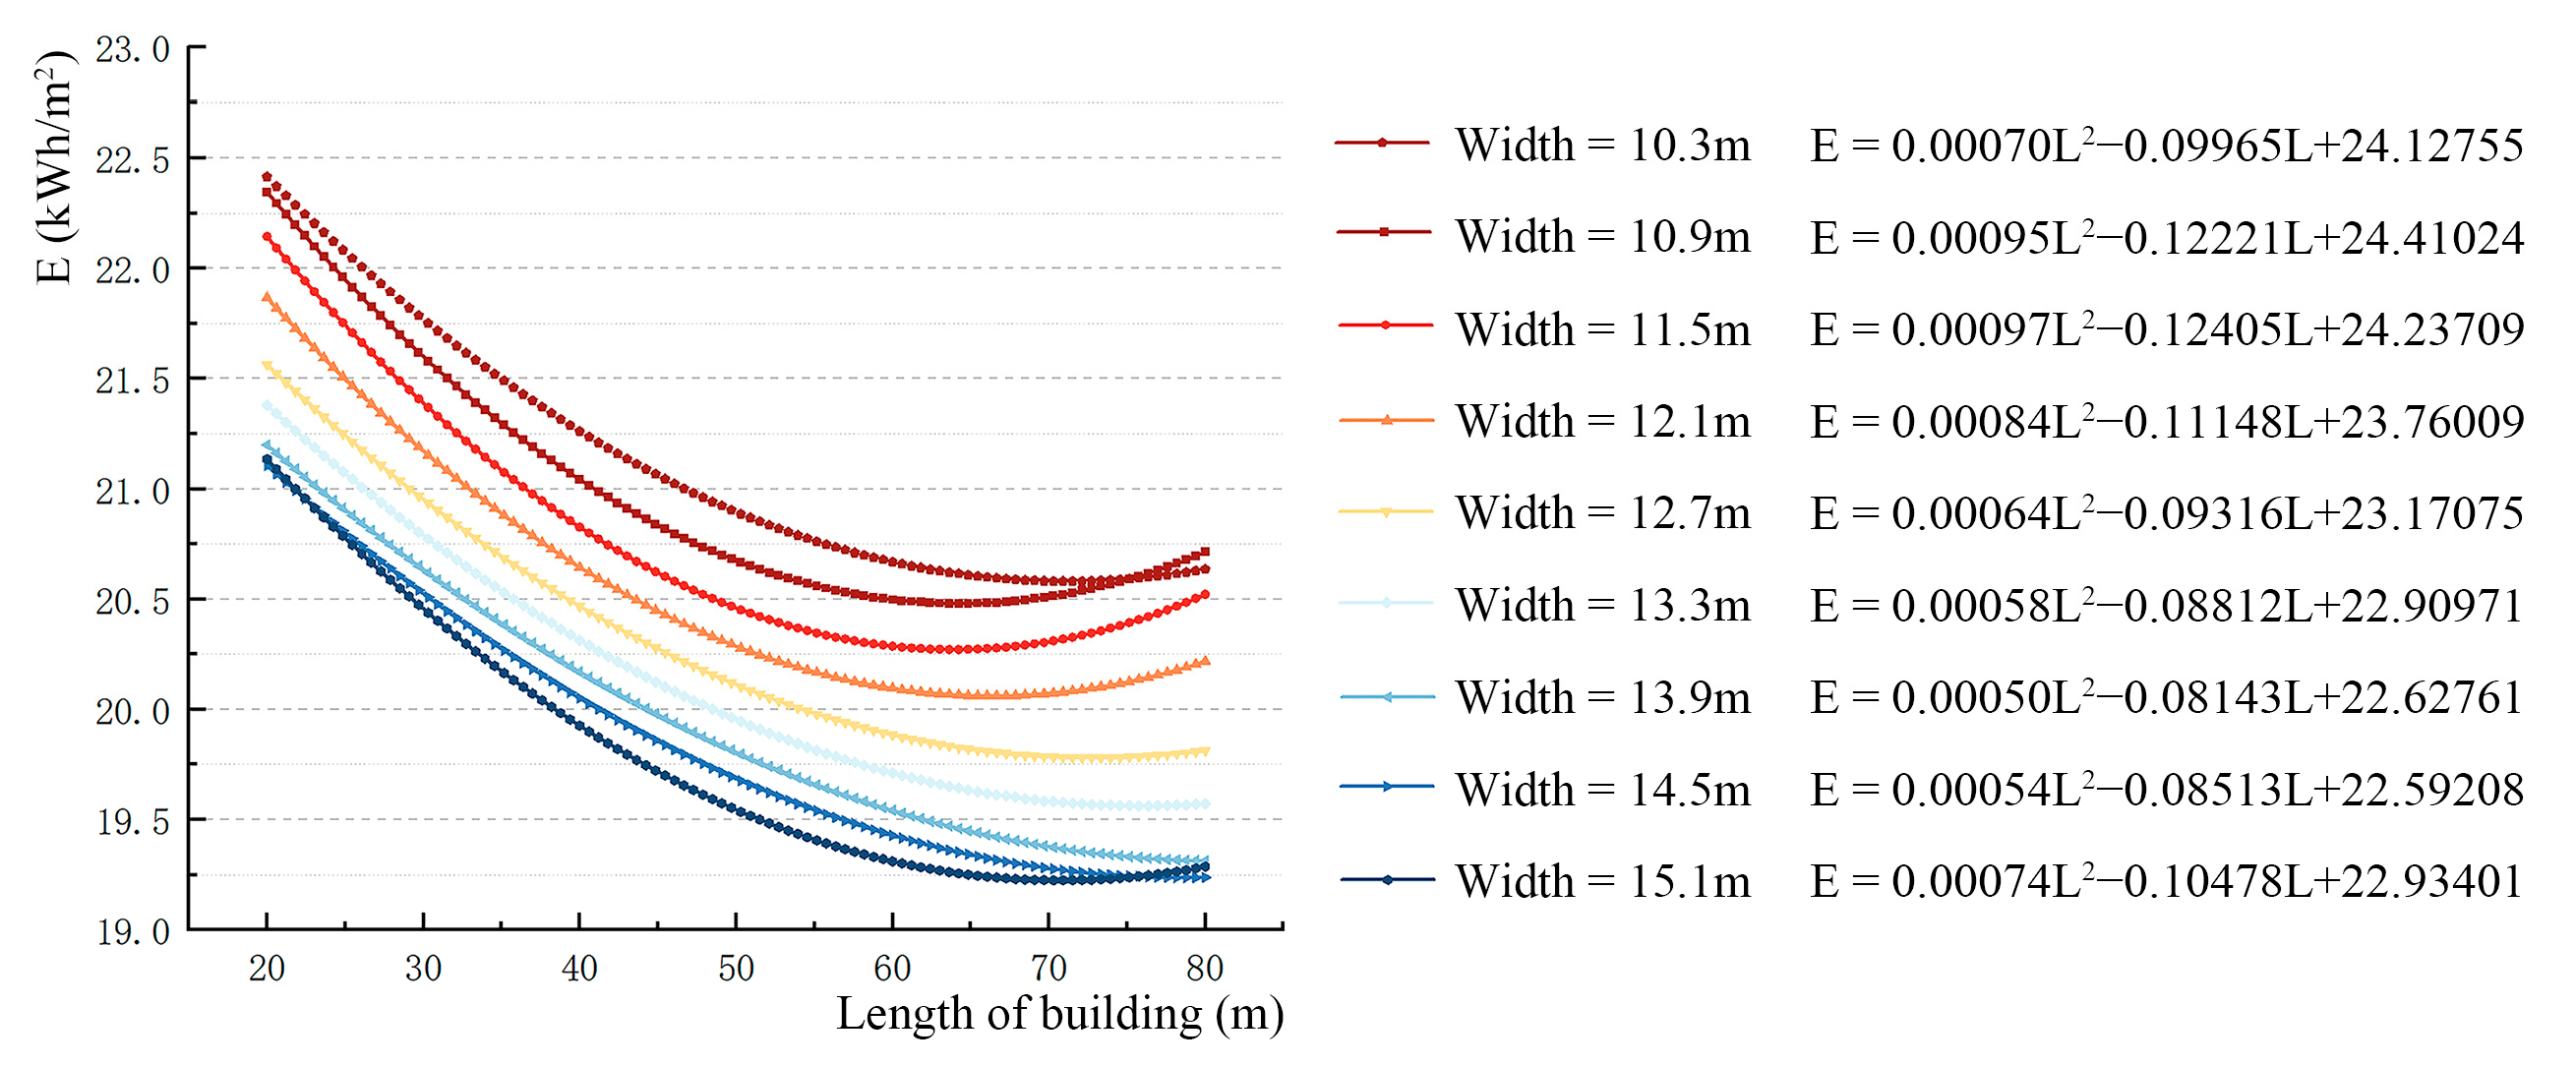
Analysis of the design parameters indicated that the optimal configuration for minimizing the total energy consumption of the building was a rectangular floor plan comprising 18 floors with a floor-to-floor height of 3 m, a building length of 40.6 m to 52.6 m, and a width of 10.3 m to 15.1 m. To achieve this, the building width was controlled as a single variable, with values taken at intervals of 0.6 m within the specified range. The energy consumption corresponding to the variation in building length is presented in Figure 5.
Based on the data in Figure 5, a regression analysis was conducted using the SPSS 27.0.1 software with the building width held constant, and a relationship diagram between building length and energy consumption was plotted, as shown in Figure 6. A close examination of the function graphs revealed a clear trend: as the building width increased from 10.3 m to 15.1 m, the function graphs shifted progressively to the right and downward. The minimum energy consumption was observed to occur at the function graph corresponding to a width of Y = 15.1 m, with the lowest point of the graph at X = 52.6 m. Consequently, the base model for NZE residential buildings in cold climates was a structure with a length of 52.6 m, a width of 15.1 m, a floor height of 3 m, and 18 floors.

3.2. Analysis of Building Envelope Key Parameters

A comparison of the key design parameters across the standards revealed significant differences in the classification of the transparent envelope structure, orientation, and solar heat gain [6,50]. To avoid omissions, the transparent envelope parameters were categorized based on the orientation into the following directions: south, north, and east/west. Each category included the WWRS, WWRN, and WWREW for WWR; UWS, UWN, and UWEW for UW; and SHGCS, SHGCN, and SHGCEW for SHGC. Using the previously established base model, the heat transfer coefficient for non-transparent envelope structures was set to 0.15 W/m2. Using the method of controlling variables, the sensitivity of the UW, SHGC, and WWR for each orientation was examined, as shown in Figure 7.
To assess the sensitivity of the WWR in various orientations, WWR values for the north, east/west, and south orientations were varied in steps of 0.1, ranging from 0.3 to 0.7. The results are shown in Figure 7a. The impact of the WWR on energy consumption, ranked from largest to smallest, was south-facing, north-facing, and east/west-facing. Furthermore, increasing the WWR for south-facing windows was conducive to enhancing the building energy efficiency. To assess the sensitivity of the UW in various orientations, UW values for the north, east/west, and south orientations were varied in steps of 0.1, ranging from 0.8 to 1.2. The results are shown in Figure 7b. The results indicated that the impact of the UW on energy consumption, when ranked from largest to smallest, was south-facing, north-facing, and east/west-facing. To assess the sensitivity of the SHGC, SHGC values for the north, east/west, and south orientations were varied in steps of 0.1, ranging from 0.2 to 0.6. The results are shown in Figure 7c. The impact of the SHGC on building energy consumption, ranked from largest to smallest, was south-facing, north-facing, and east/west-facing. Furthermore, an increase in SHGC was found to be beneficial for building energy efficiency. Therefore, the impact of the same parameter on the transparent envelope structure differed according to the orientation of the building energy consumption. WWR, UW, and SHGC must be considered as discrete parameters for each orientation.

4. Results and Validation

4.1. Energy Consumption Simulation

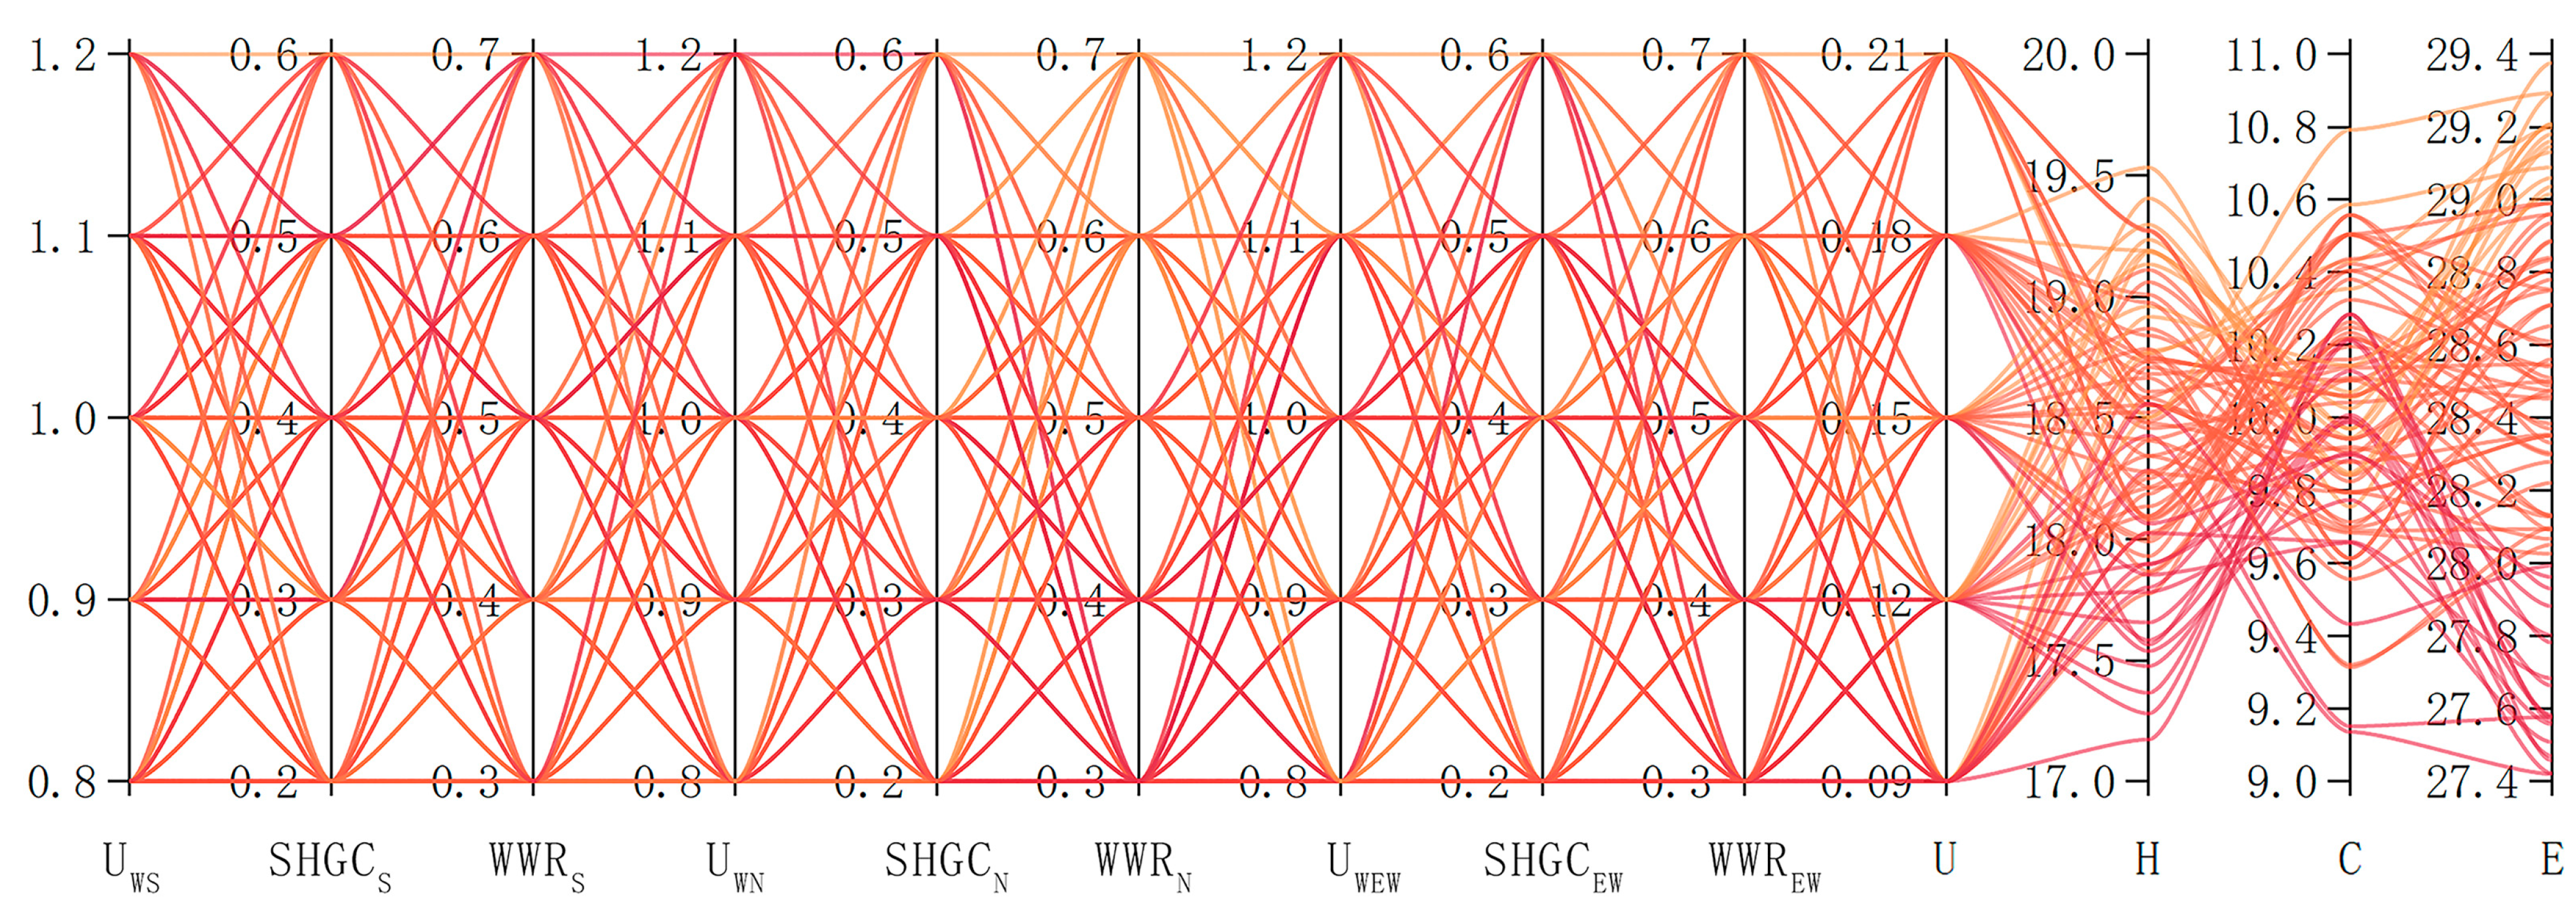
To achieve the refined and performance-based design of NZE residential building envelopes, the coordination mechanism must be examined under the interaction of multiple factors. This study employed an orthogonal experimental design, which involves the systematic arrangement and combination of multiple factors at various levels and cross-grouping of these factors. This approach reduces the number of experiments required while facilitating an efficient and accurate investigation of the relationship between the ten variables and heating/cooling energy consumption. The range of ten independent variables of the building envelope is determined by both field research and the GB/T 51350 [6], with each variable set at five levels, as shown in Table 3. According to the survey and relevant building design guidelines, the south-facing WWR of residential buildings in Jinan typically exceeds 0.3, ensuring adequate natural lighting. The upper limit of 0.7 was selected to represent the maximum feasible glazing area on the facade, excluding structural components and external shading devices. For consistency, the WWRs of the other orientations were set within the same interval.
An orthogonal combination was designed to conduct the energy consumption simulations for each test group using the above variables and their respective levels. The results of these simulations are presented in Figure 8.

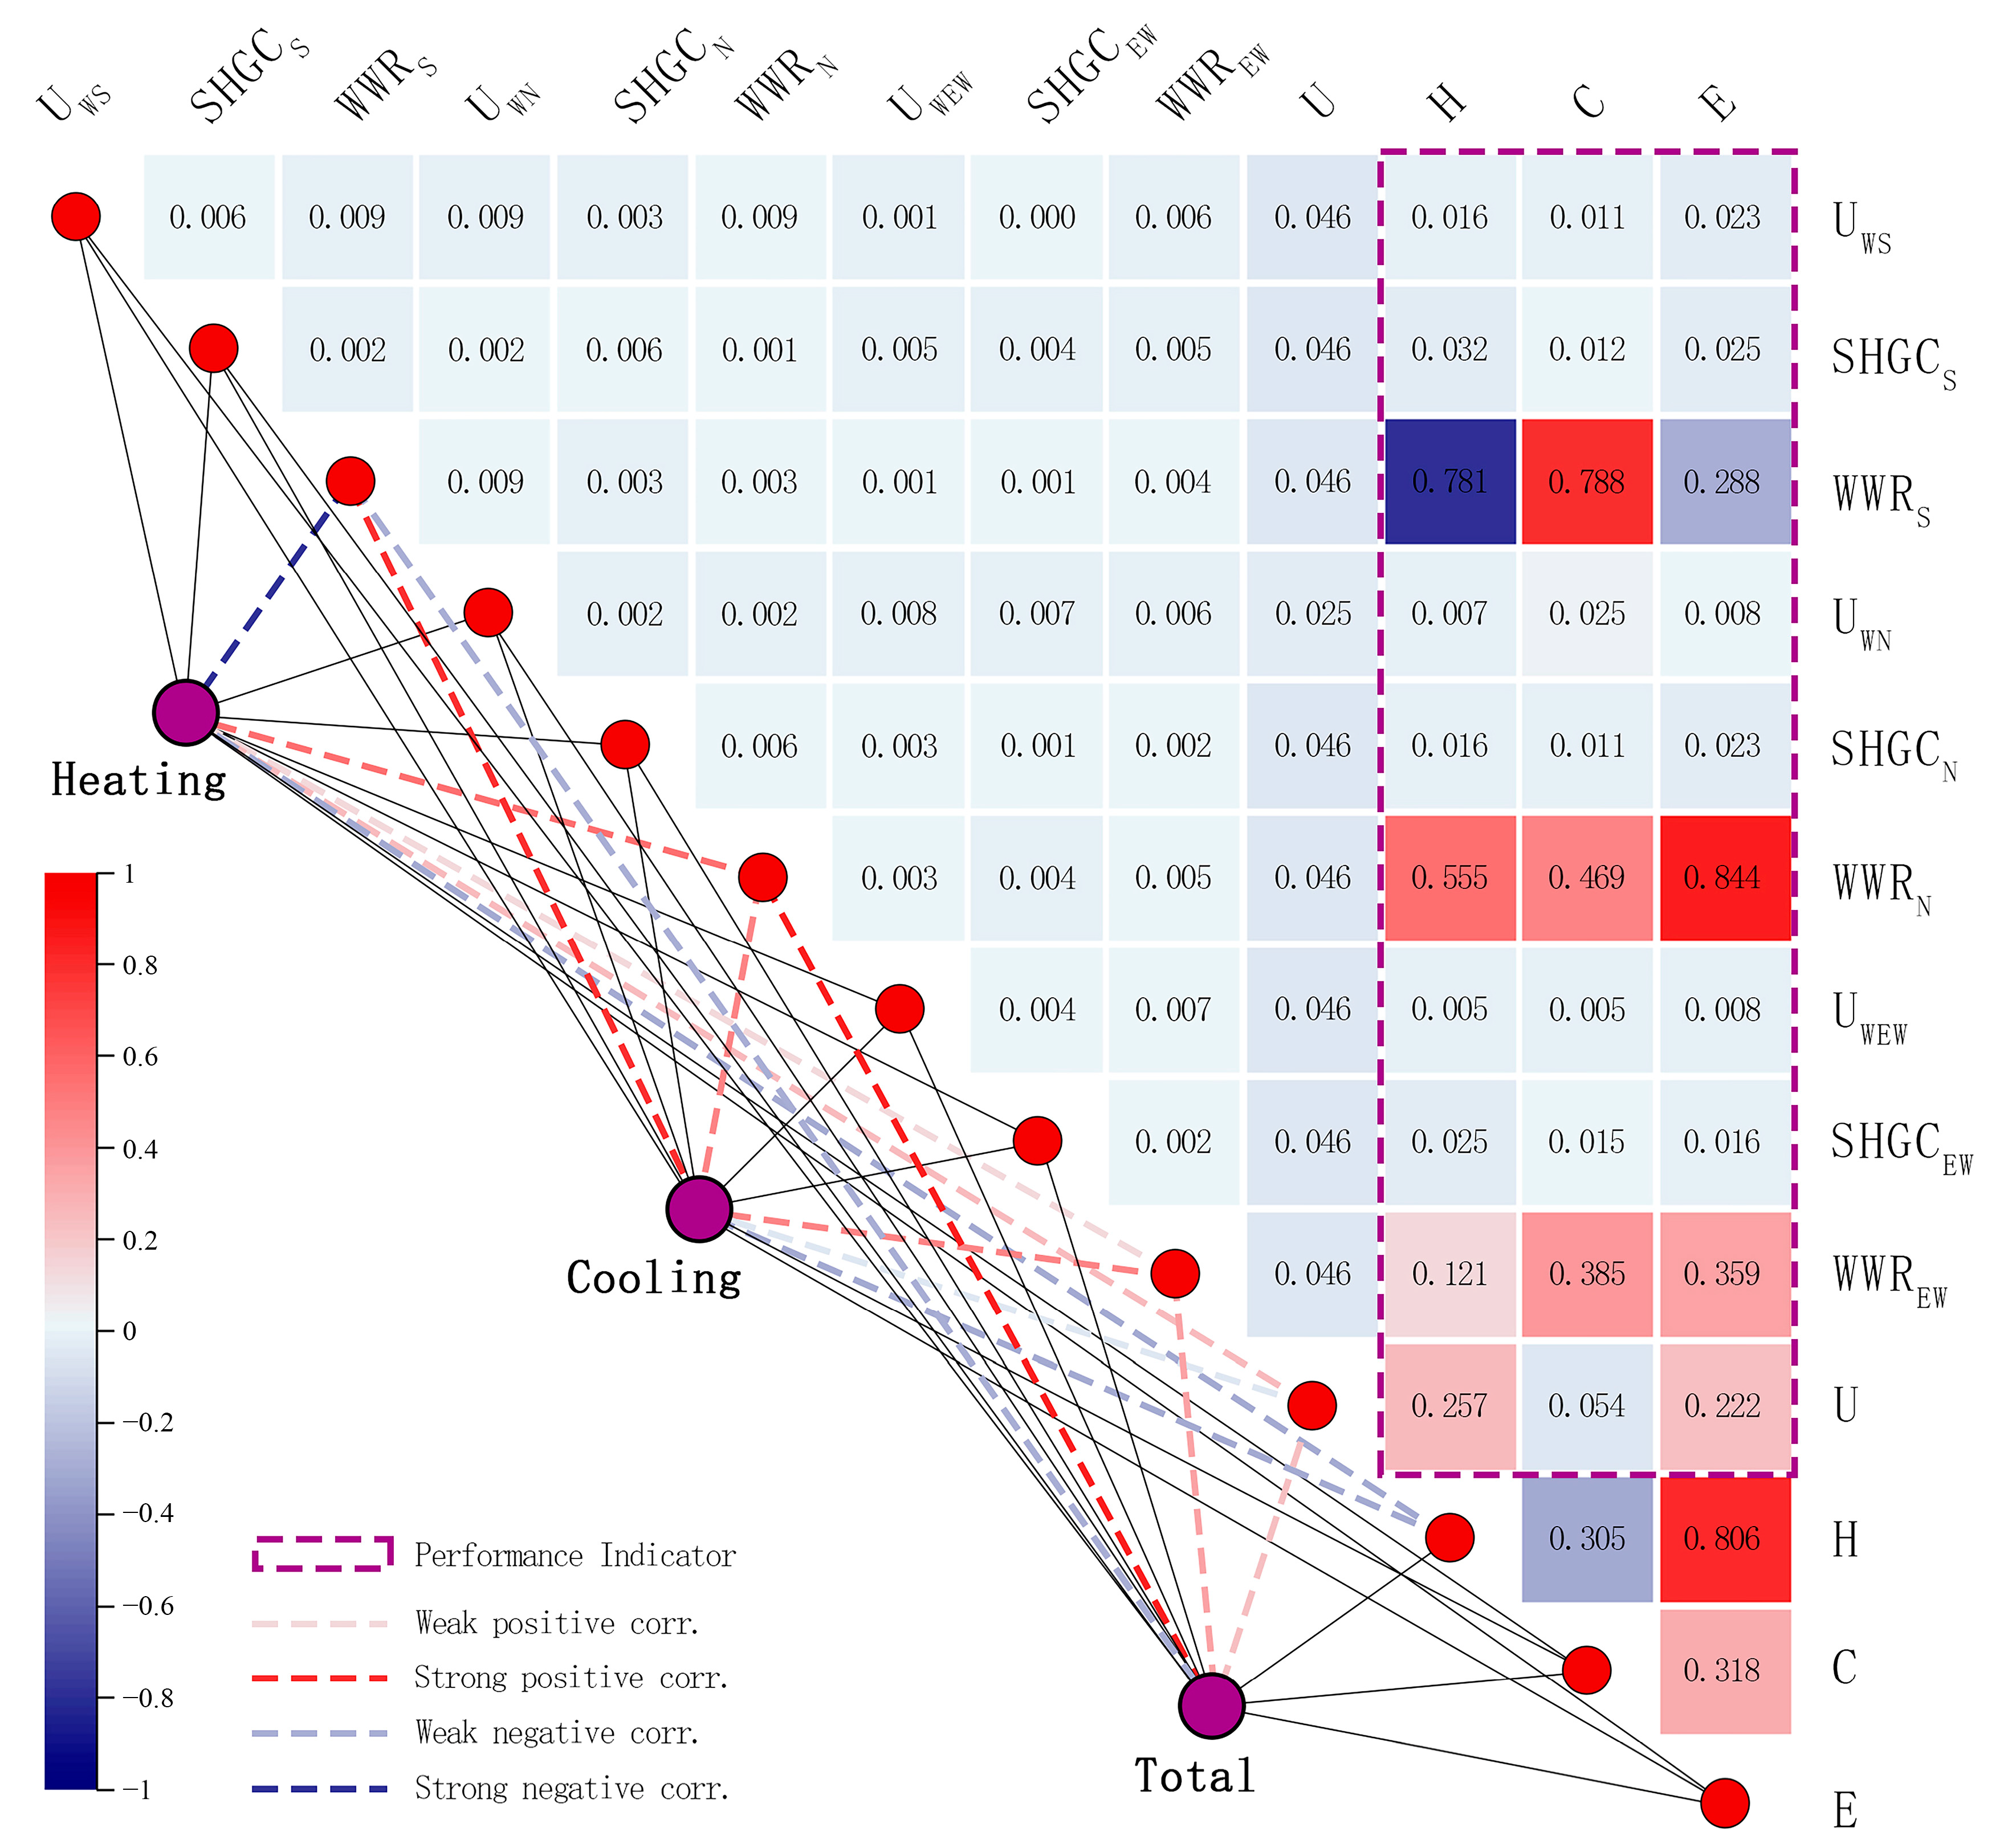
4.2. Correlation Analysis

Pearson correlation analysis was performed on variables and energy consumption simulation results using orthogonal experimental combination, as shown in Figure 9. The results show that there is a strong positive correlation between total energy consumption and WWRN, and a weak correlation with WWREW, WWRS, and U. Among them, WWRS has a strong negative correlation with heating energy consumption (H) and a strong positive correlation with cooling energy consumption (C). Moreover, the lack of a strong or discernible connection between the design parameters highlights the applicability of the parameters themselves and indicates a complex, non-linear relationship with the intended performance goals.

4.3. Multiple Linear Regression Analysis

Univariate sensitivity analysis for each orientation demonstrated that each of the aforementioned parameters exhibited a linear relationship with building energy consumption. Consequently, a multiple linear regression analysis was employed to investigate the impact of multiple factors on building energy consumption under combined effects. The experimental data were analyzed using the SPSS software, resulting in the following multiple linear regression equation:
E = 3.556 U 0.042 U W S 0.052 S H G C S 1.129 W W R S + 0.063 U W N 0.045 S H G C N + 3.506 W W R N + 0.017 U W E W 0.014 S H G C E W + 1.522 W W R E W + 26.065
The coefficient of determination (R2) was 0.994, which was close to 1, indicating the high prediction accuracy of the model. The residual value is 0.117 and follows a normal distribution. The Durbin–Watson test value of 1.631 fell within the range of (1, 3), suggesting that the residuals were independent. Furthermore, the tolerance, variance inflation factor, and condition index tests verified that the multicollinearity in the equation was within a reasonable range. The absence of a linear correlation between parameters signified the absence of interaction terms in the equation. Consequently, this equation was deemed statistically rational.

4.4. Interpretability Analysis of Envelope Design Parameters

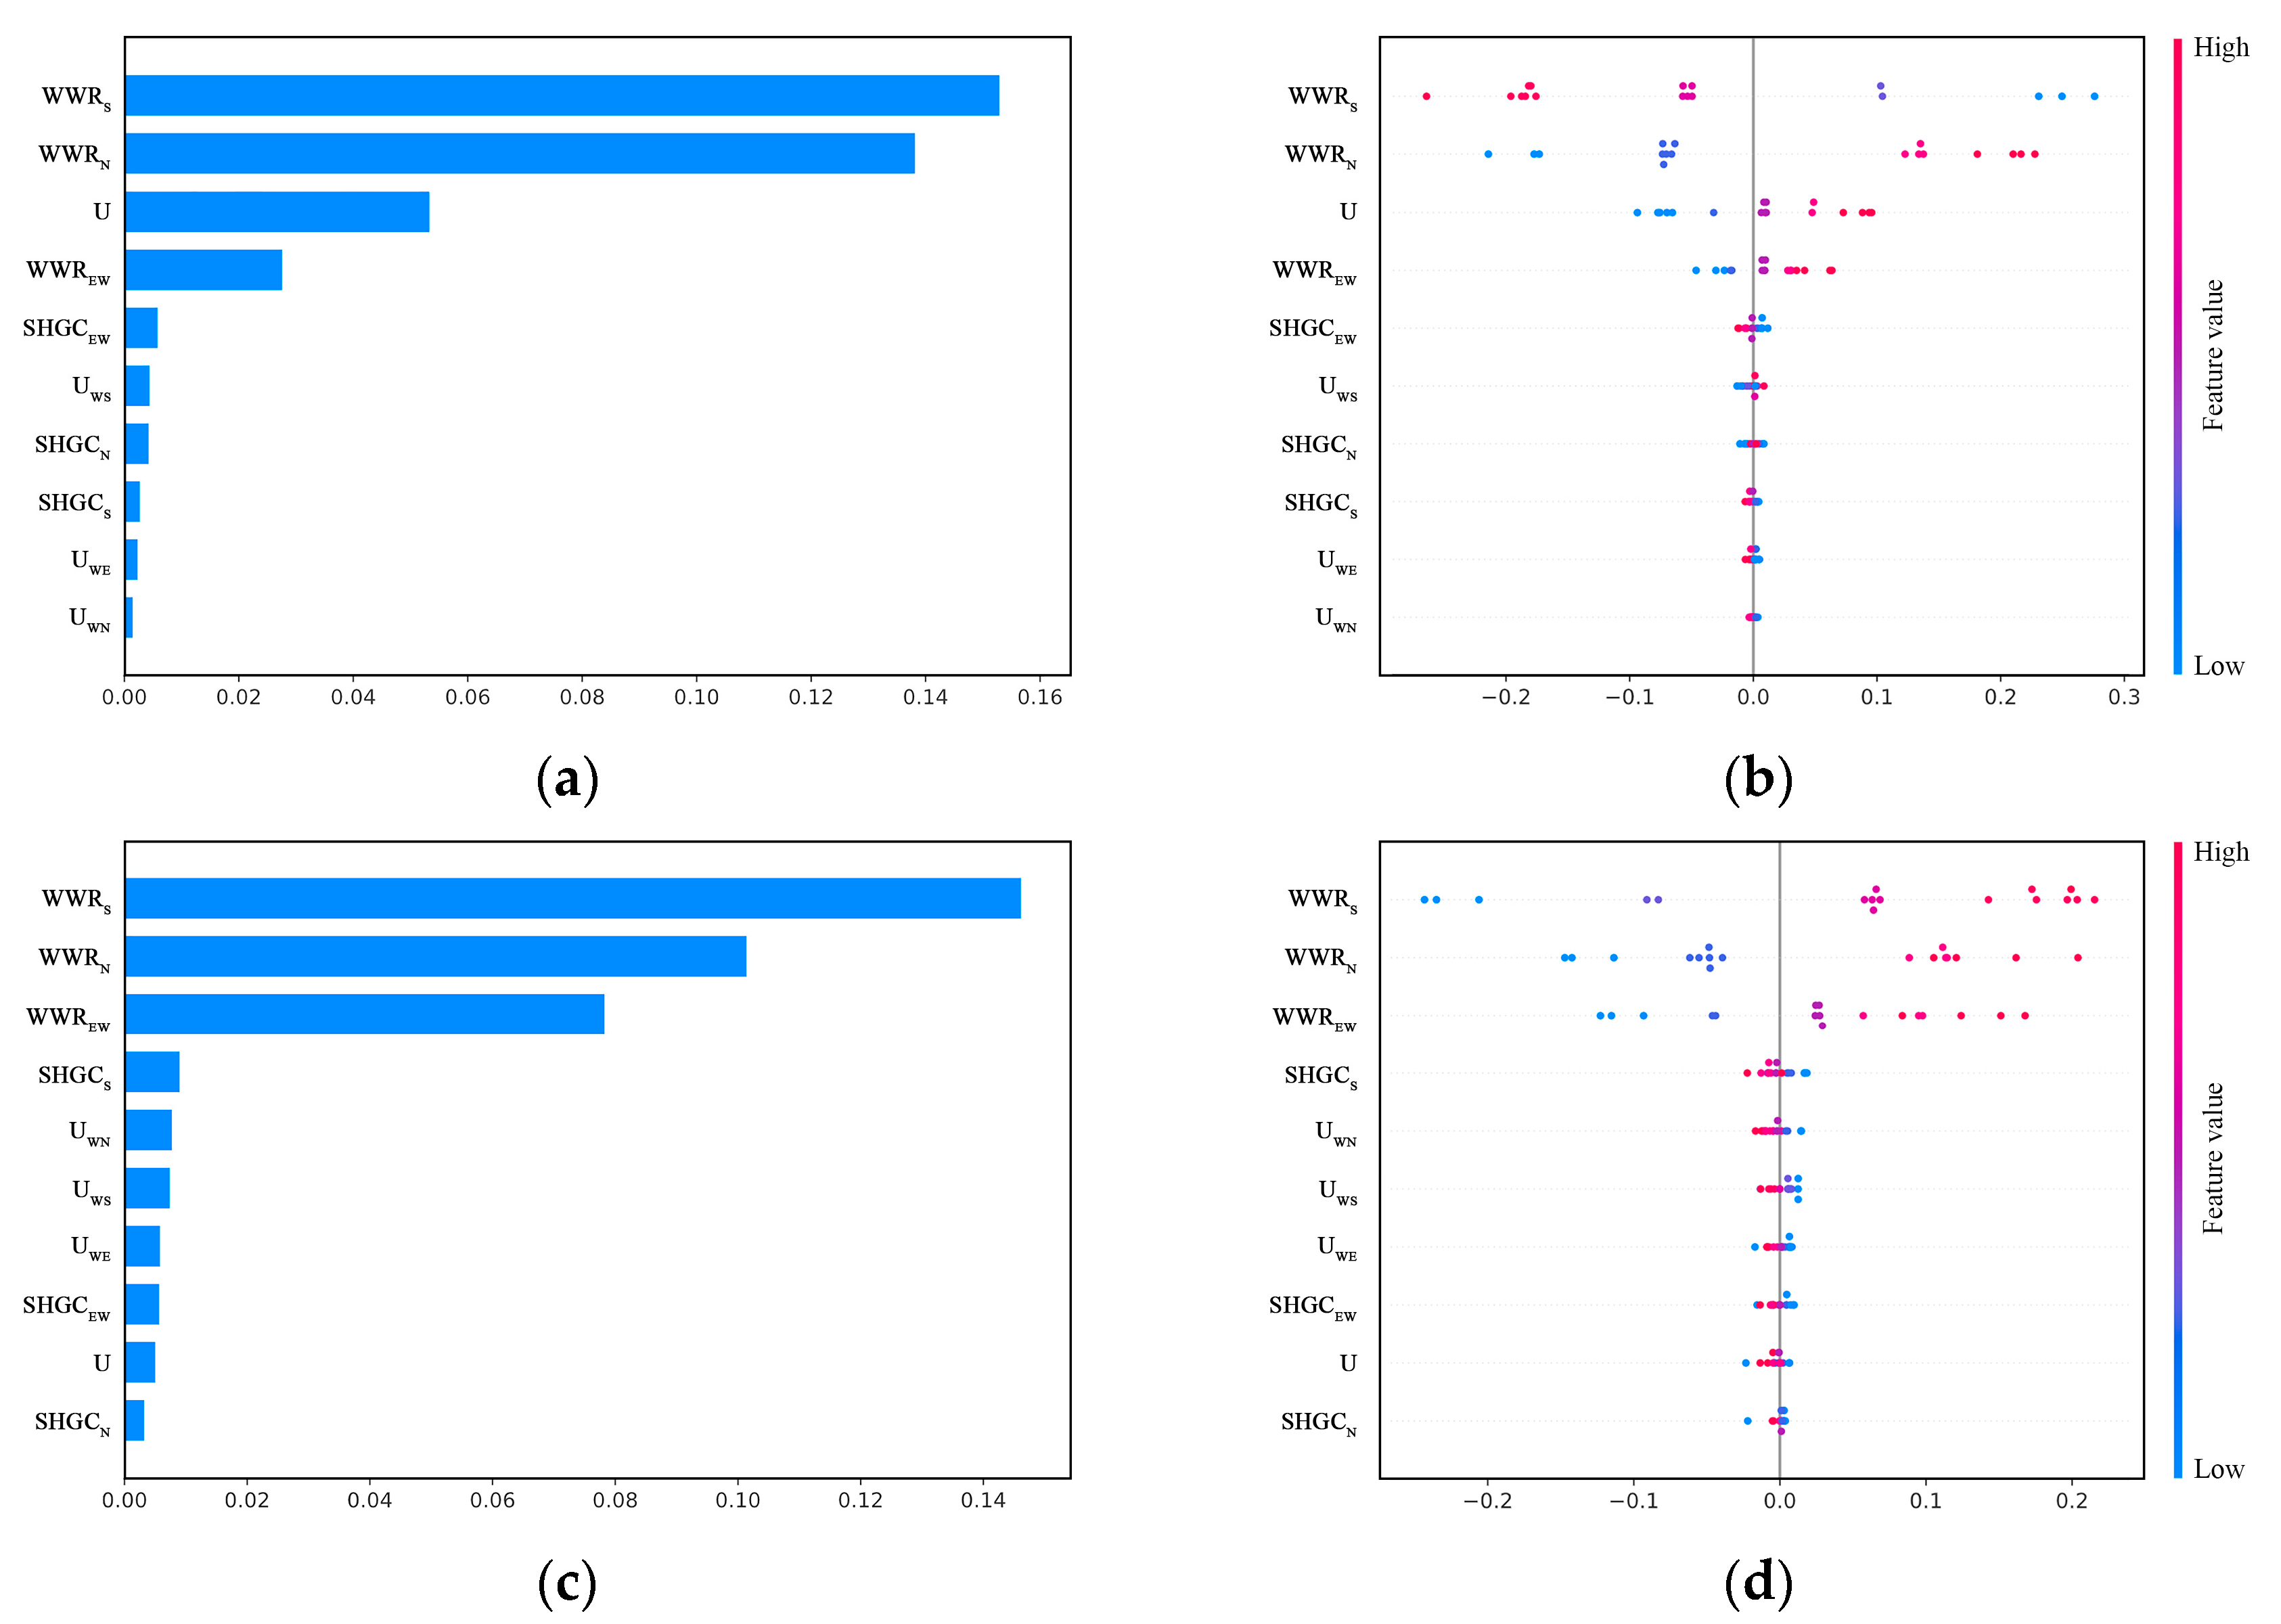
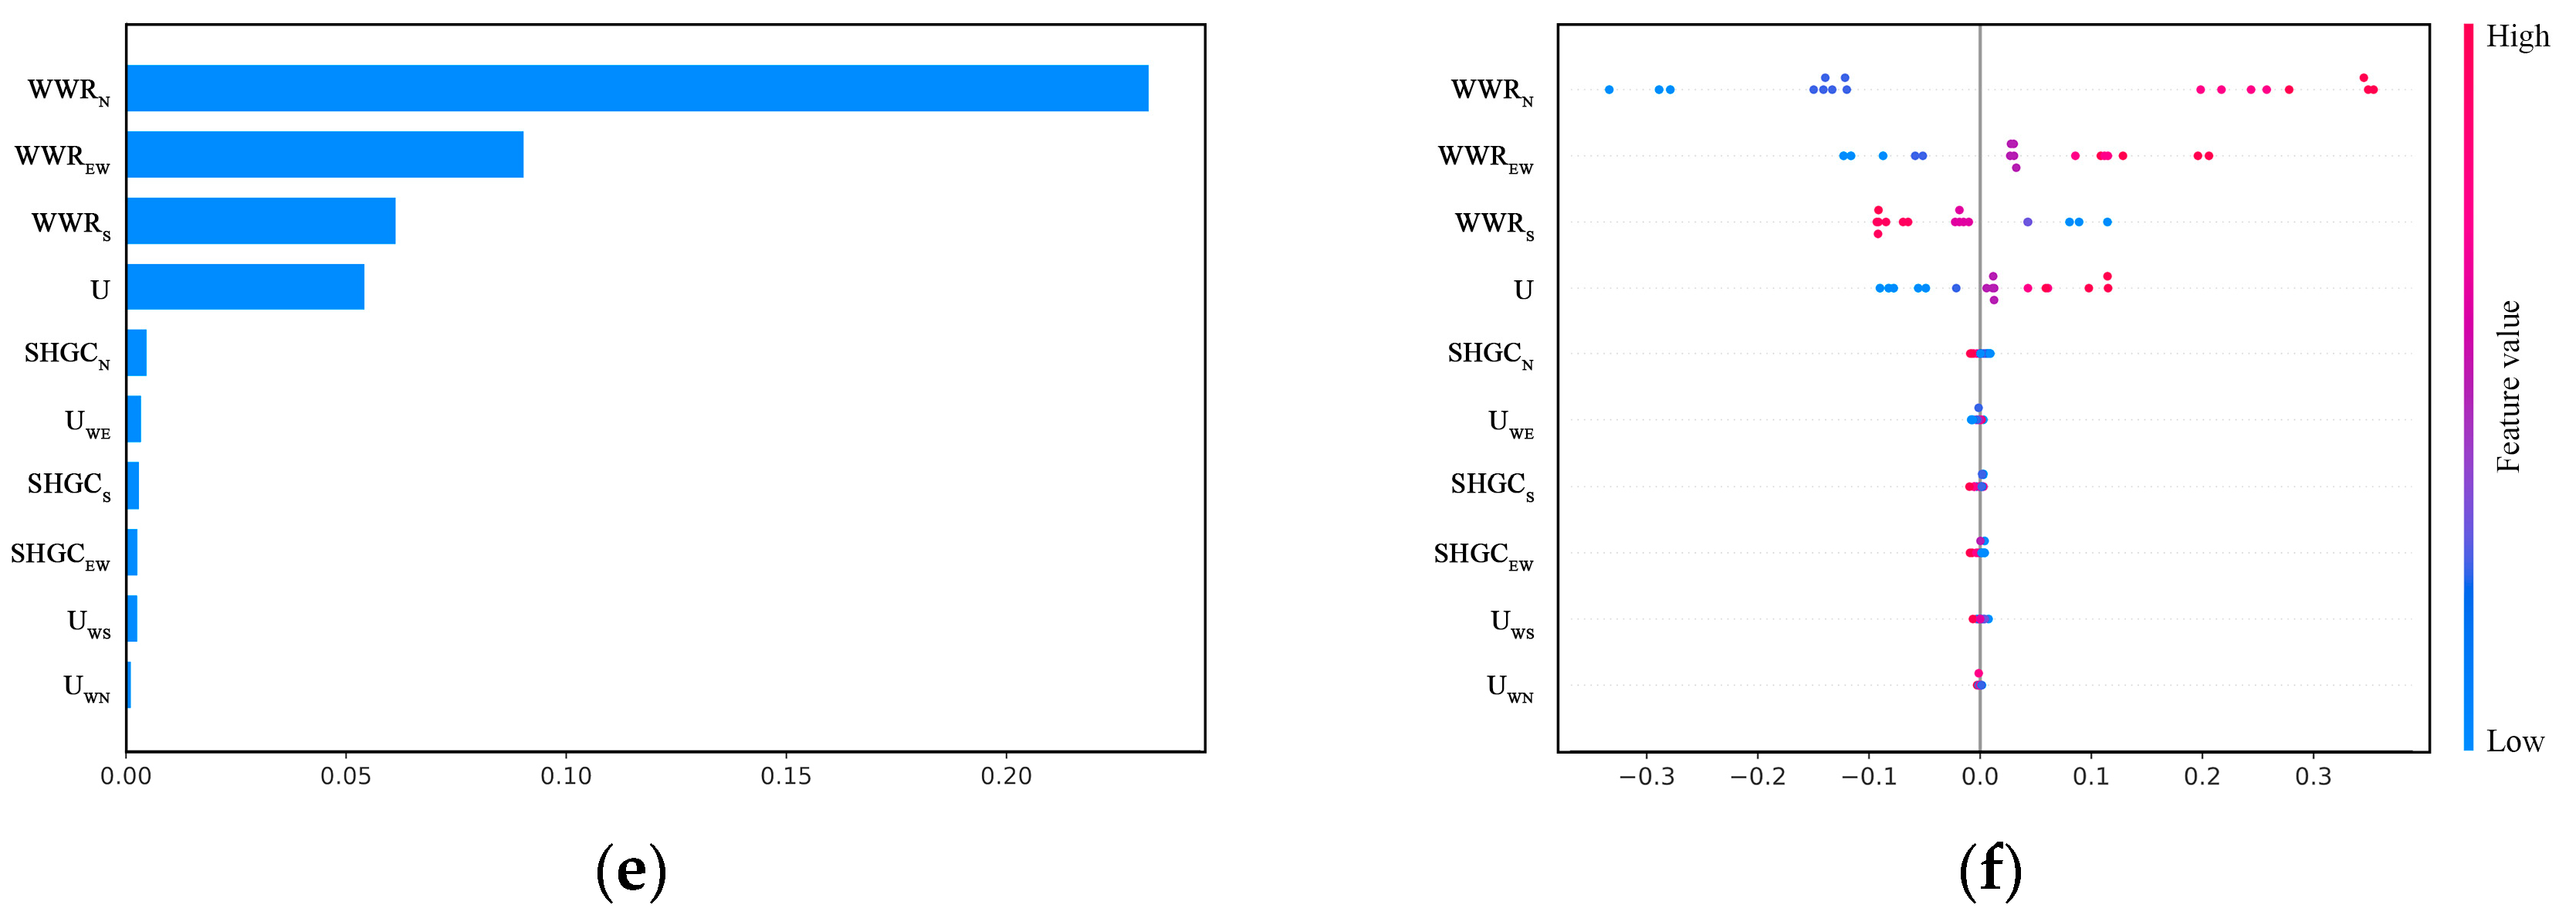
Based on the multiple linear regression equation, architects can obtain accurate energy consumption values through envelope design parameters during the design phase. However, the relationship between design parameters and energy consumption remains unknown. Interpretability analysis is used to reveal the mechanism between various parameters and energy consumption. SHAP analysis is performed in Python based on a trained backpropagation neural network (BPNN) model. The model has an input layer with 10 nodes, a hidden layer with 17 nodes, and an output layer with one node. There are three hidden layers in total. The activation function is Sigmoid, and the MinMaxScaler was used for normalization, with the first 80% as the training set and the remaining 20% as the testing set. The Adam optimizer was used uniformly, with a learning rate of 0.05, batch size of 128, epochs of 256, and Shap.DeepExplainer was selected as the interpreter. To balance computational efficiency and estimation accuracy, 100 samples are randomly selected from the training set to establish a reference baseline for feature distribution. This sample size ensures computational feasibility while adequately representing the fundamental distribution of the data. After training, the adjusted R2 and RMSE are 0.933 and 0.089, respectively. The mean absolute SHAP value summary and the detailed SHAP value summary of heating, cooling, and total energy consumption are shown in Figure 10. Heating energy consumption is significantly influenced by WWRS and WWRN. It was proportional to WWRN, U, and WWREW, but was inversely proportional to WWRS and SHGCEW. Cooling energy consumption is significantly influenced by WWRS, WWRN, and WWREW. It was proportional to WWRS, WWRN, and WWREW, but was inversely proportional to SHGCS and UWN. Total energy consumption is significantly influenced by WWRN, WWREW, and WWRS. It was proportional to WWRN, WWREW, and U, but was inversely proportional to WWRS and SHGCS.

4.5. Validation

4.5.1. Case Study

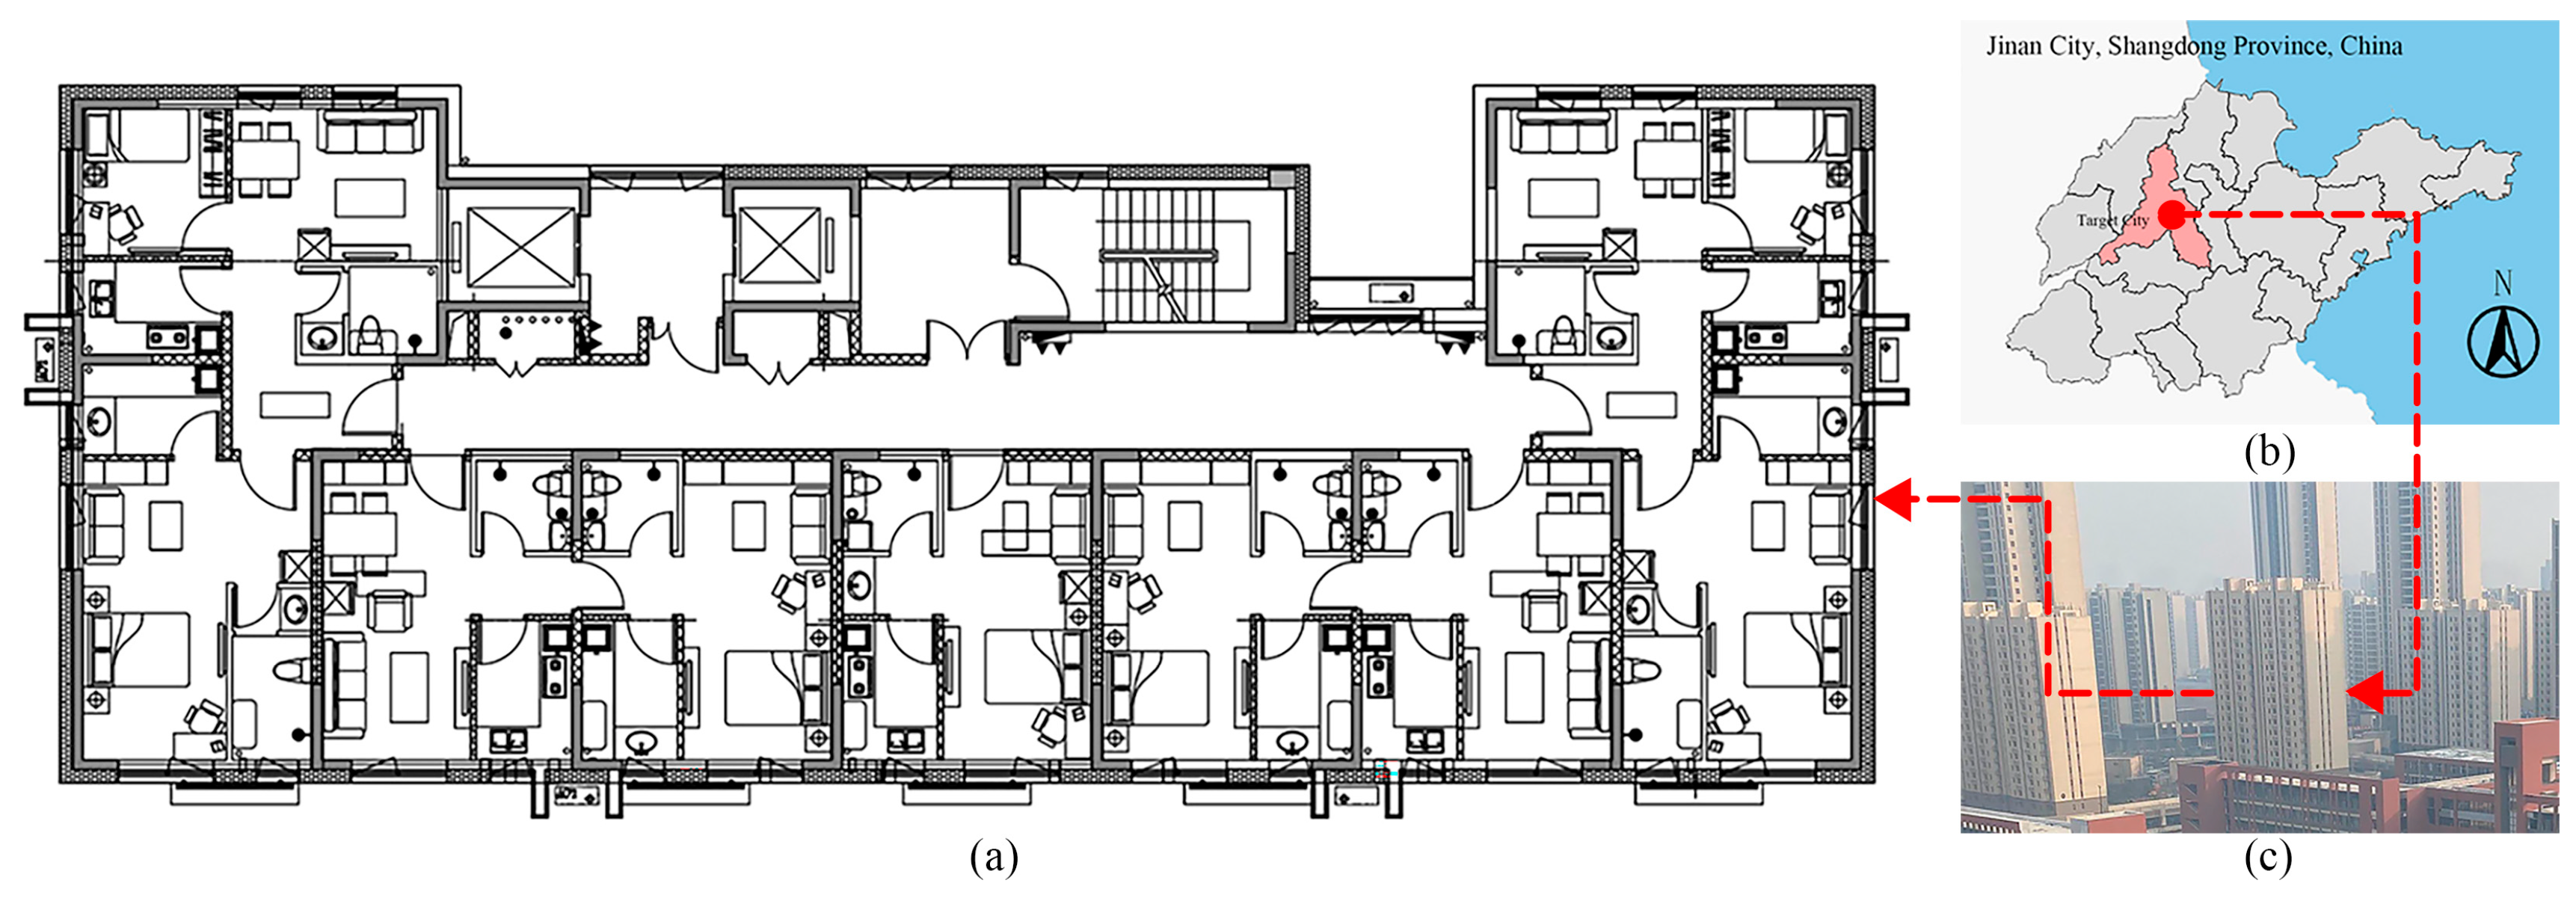
The case study used for the optimization design and the model validation is an NZE residential project in Jinan, as shown in Figure 11. The residential building is 12 floors in height, with a floor height of 3.1 m. The building has a rectangular floor plan, with a length of 34.2 m and a width of 13.1 m.

4.5.2. Case Study Model Validation

To verify the accuracy of the case study model, this study adopted Willmott’s consistency Index (DW) as an indicator to evaluate the model’s precision. This indicator is a standardized measurement parameter for prediction error, and its numerical range is [0, 1]. When the value is 0, the simulation result deviates completely from the measured data; in contrast, when the value is 1, the two are completely consistent. Generally, when the DW value exceeds a threshold of 0.60, the model has practical application value. The calculation formula of DW is as follows:
D W = 1 i = 1 n P i O i 2 i = 1 n P i O ¯ + O i O ¯ 2
where P i represents the simulated results, O i represents the observed values, O ¯ is the mean of the observed values, and n is the number of samples.
The Testo 174 H type temperature and humidity recorder monitored the internal temperature and humidity in the energy-consuming area of the case study building hourly during the heating period from 01:00 on 1 January to 24:00 on 31 January. To verify the reliability of the simulation model, we maintained the same conditions as the actual case study building during the modeling process: the lighting system was turned off, and the windows were closed to simulate an uninhabited state. By comparing the simulated values shown in Figure 12, we calculated the temperature DW value of 0.92 and the humidity DW value of 0.95. Both indicators were significantly higher than the reference value of 0.60, confirming the rationality and accuracy of the model parameters. The research results show that the established case study model has a high degree of credibility.

4.5.3. Validation Schemes

The design parameters were optimized sequentially based on the influence of positive and negative impacts, as well as their magnitudes. This process resulted in nine representative optimization schemes, as shown in Table 4. Scheme 0 represents the actual parameter values of the envelope in the case study. Schemes 1 to 5 indicated that optimization with a negative correlation with energy consumption was influenced primarily by WWRS and WWRN. The impact of the SHGC on energy consumption was negligible. Scheme 6 demonstrated that a reduction in WWRN, even with an increase in UW, resulted in a reduction in energy consumption while concurrently lowering construction costs. Conversely, Scheme 7 revealed that a reduction in WWRN combined with an increase in U resulted in an increase in energy consumption while achieving cost reduction. Scheme 8 indicated that independently lowering UW may result in a higher building energy demand. Scheme 9 demonstrated that, given a constant construction cost, augmenting the WWRS while diminishing the WWRN could assist in reducing energy consumption.
These nine schemes revealed that reducing the WWRN, even with the selection of lower-cost external windows with a higher heat transfer coefficient, achieved energy savings. However, independently adjusting the heat transfer coefficient of external windows may not necessarily lead to lower energy consumption. This finding reinforces the argument that reducing certain design parameters during the design phase is not a sufficient strategy. Rather, a comprehensive optimization of all parameters is required to identify the optimal combination essential for enhancing building energy efficiency and reducing costs.
This study performed energy consumption simulations for the original design scheme and each of the proposed optimizations. The calculated heating and cooling energy consumption results were compared with those from the prediction model. The error rate ranged from 4.19% to 4.61%, thereby demonstrating the reliability and practicality of the energy consumption prediction model. By comparing the calculated values with the simulated values as a whole, it can be found that the calculated values are usually lower than the simulated values. The reason for this analysis result may be the difference in building shape coefficients between the model foundation and the validation case. The regression-based prediction formula was established using an 18-story residential building, while the validation case corresponds to a 12-story building with different shape coefficient features. Fewer floors result in higher heating and cooling demands. In practice, the primary focus of energy consumption prediction during the building design phase is often the relative comparison of multiple design options, rather than the precise calculation of energy consumption values. Therefore, the efficacy of this prediction model in optimizing the energy-saving design parameters of building schemes during the design phase is noteworthy.

4.6. DOEP and Performance-Based Design Process

The substantial number of parameters incorporated within the energy demand calculation model, in conjunction with the multitude of potential combinations, resulted in a considerable workload for screening optimization schemes. To address this challenge, DOEP was developed for NZE residential buildings in Jinan. This software aims to streamline the design process by providing architects with a comprehensive platform to manage both the building design and optimization of key parameters during the design phase. The primary program was coded in HTML, CSS, and JavaScript, with the development environment founded on Node.js and the Webpack module bundler. In addition, it employed open-source frameworks and UI components, including Vue.js and iView.
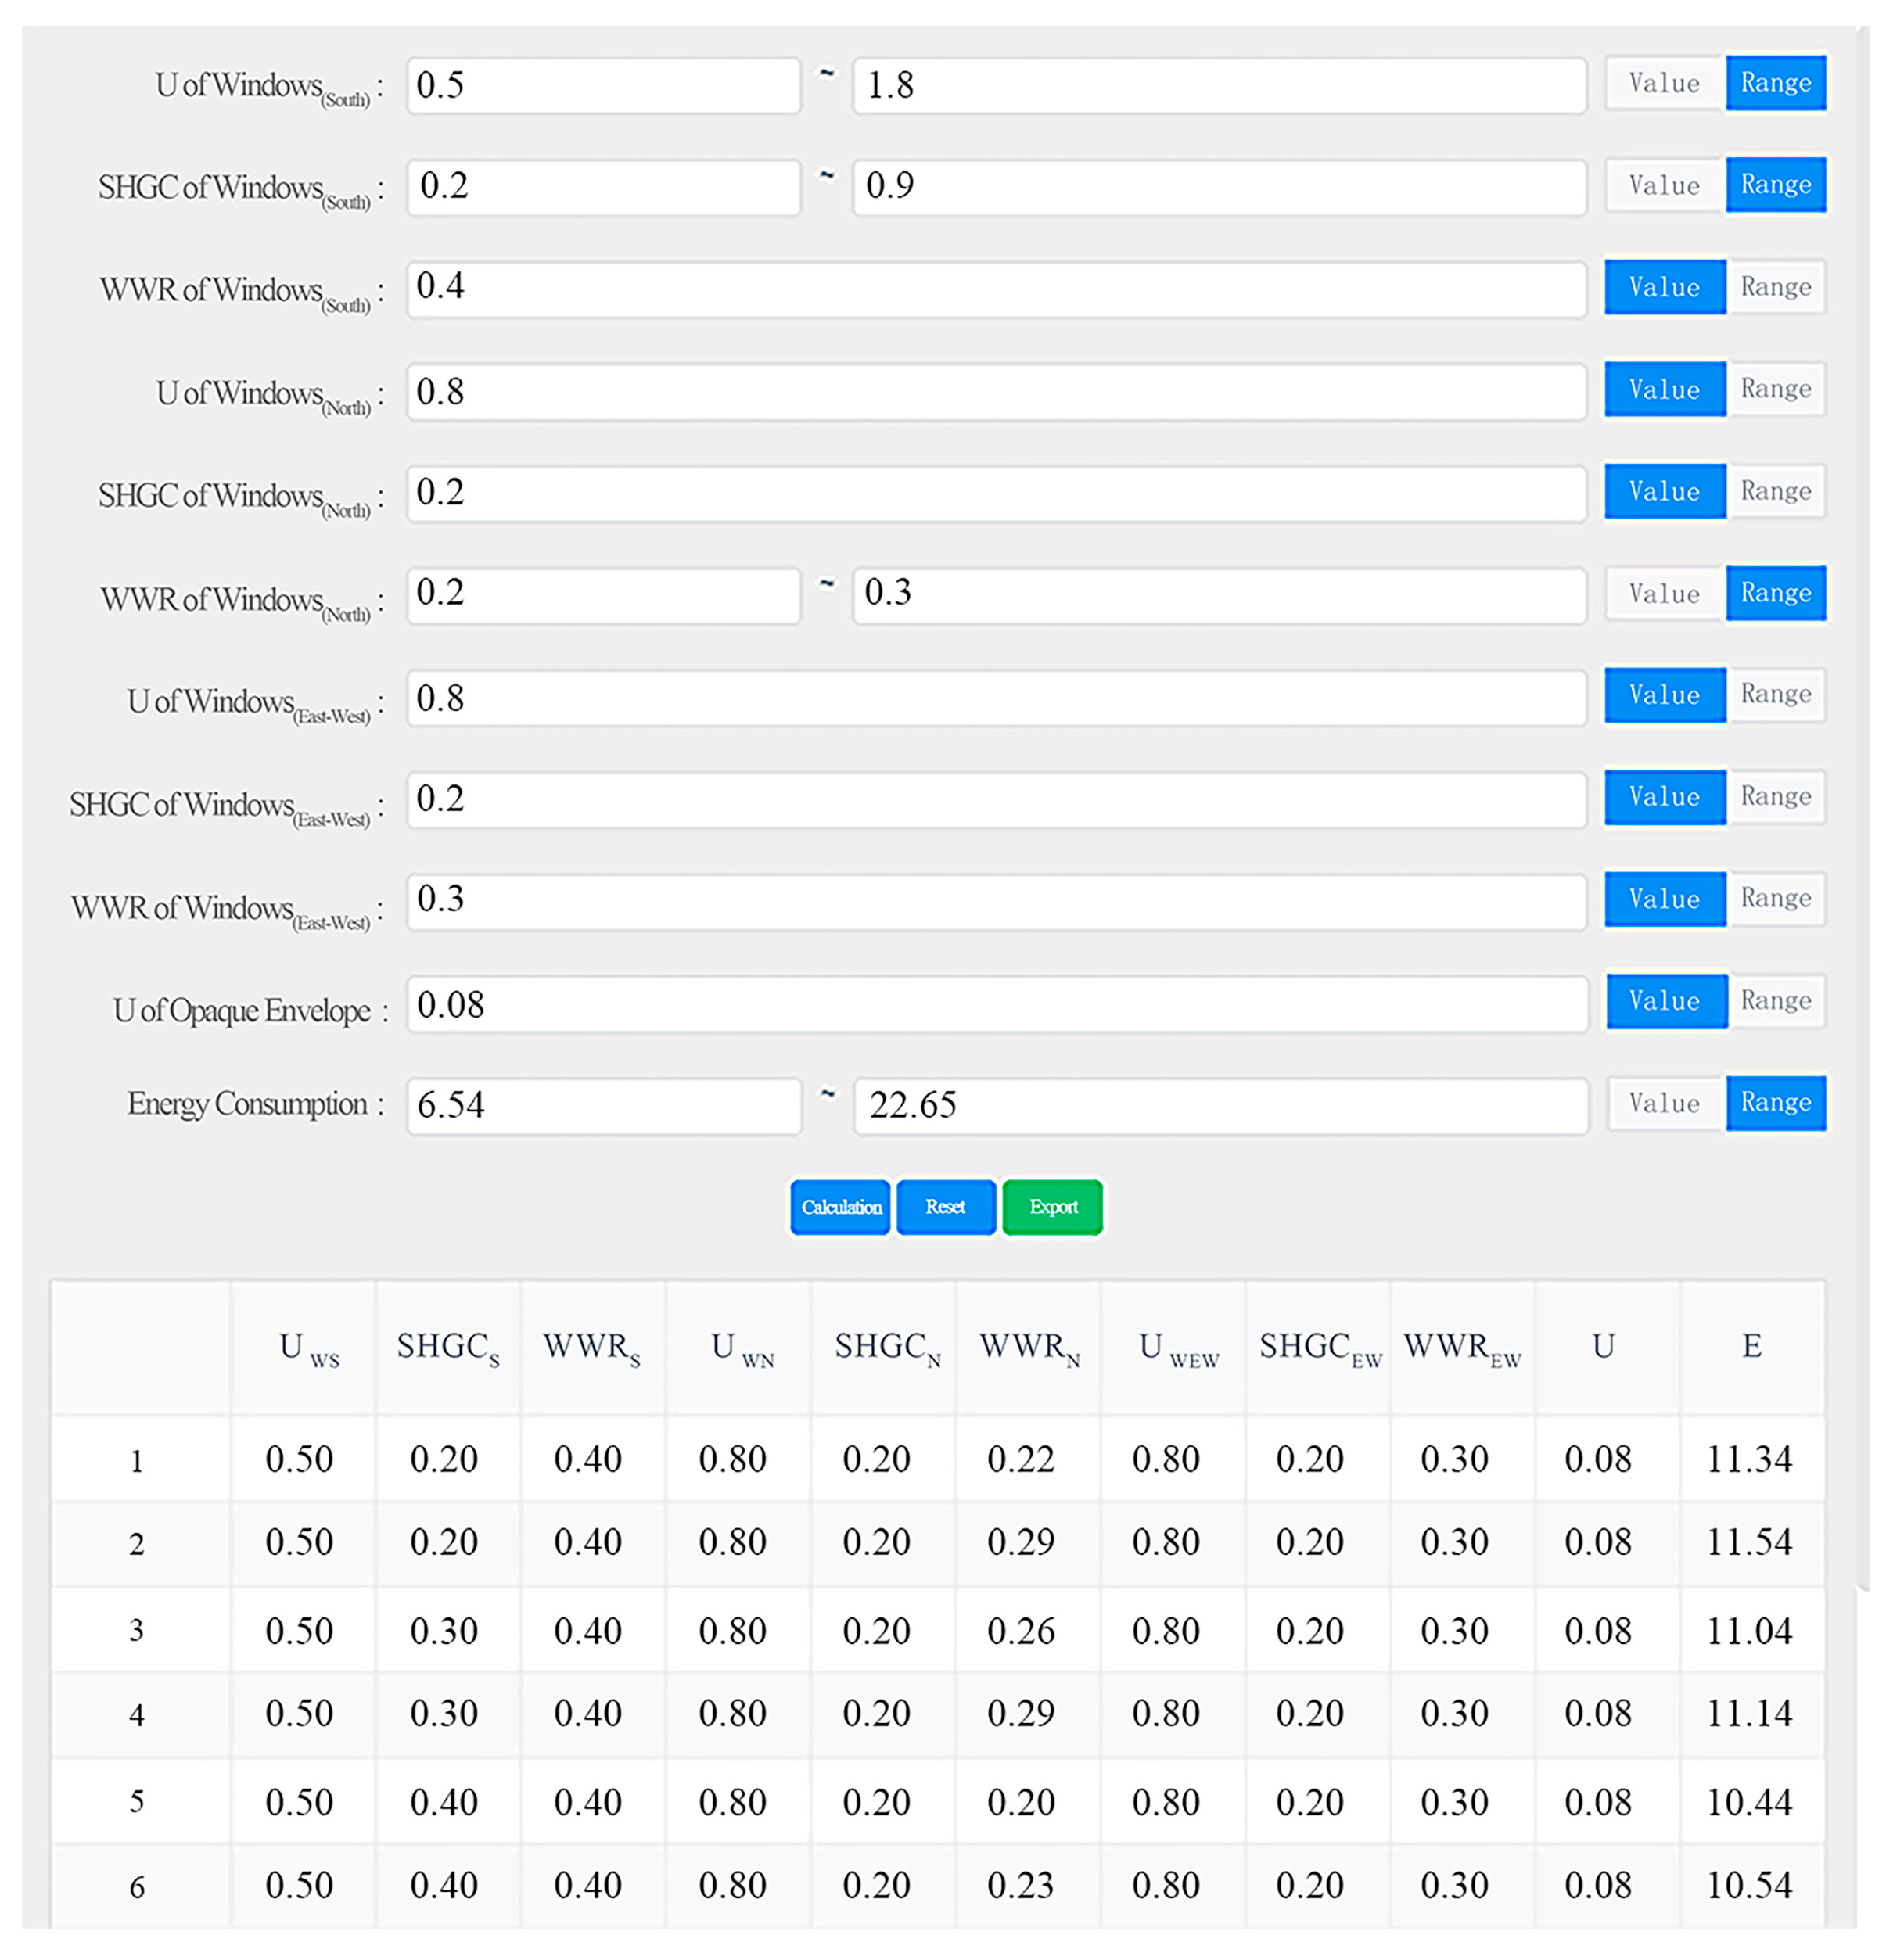
The primary function of the DOEP software is to predict the energy consumption, that is, the energy demand level of the building scheme, when all the design parameters are known. When certain design parameters are known, the software can solve for unknown design parameters and their combinations with the objective function. This helps architects choose suitable design options based on the building design, window and door products, and heating and cooling demand indicators. The software is characterized by its simplicity and efficiency, enabling architects to predict the building’s energy demand level and optimize the key parameters of the building envelope, even in the absence of extensive energy-saving calculation knowledge. This facilitates the coordination of building design and key energy-saving design parameters during the planning phase, as illustrated in Figure 13.
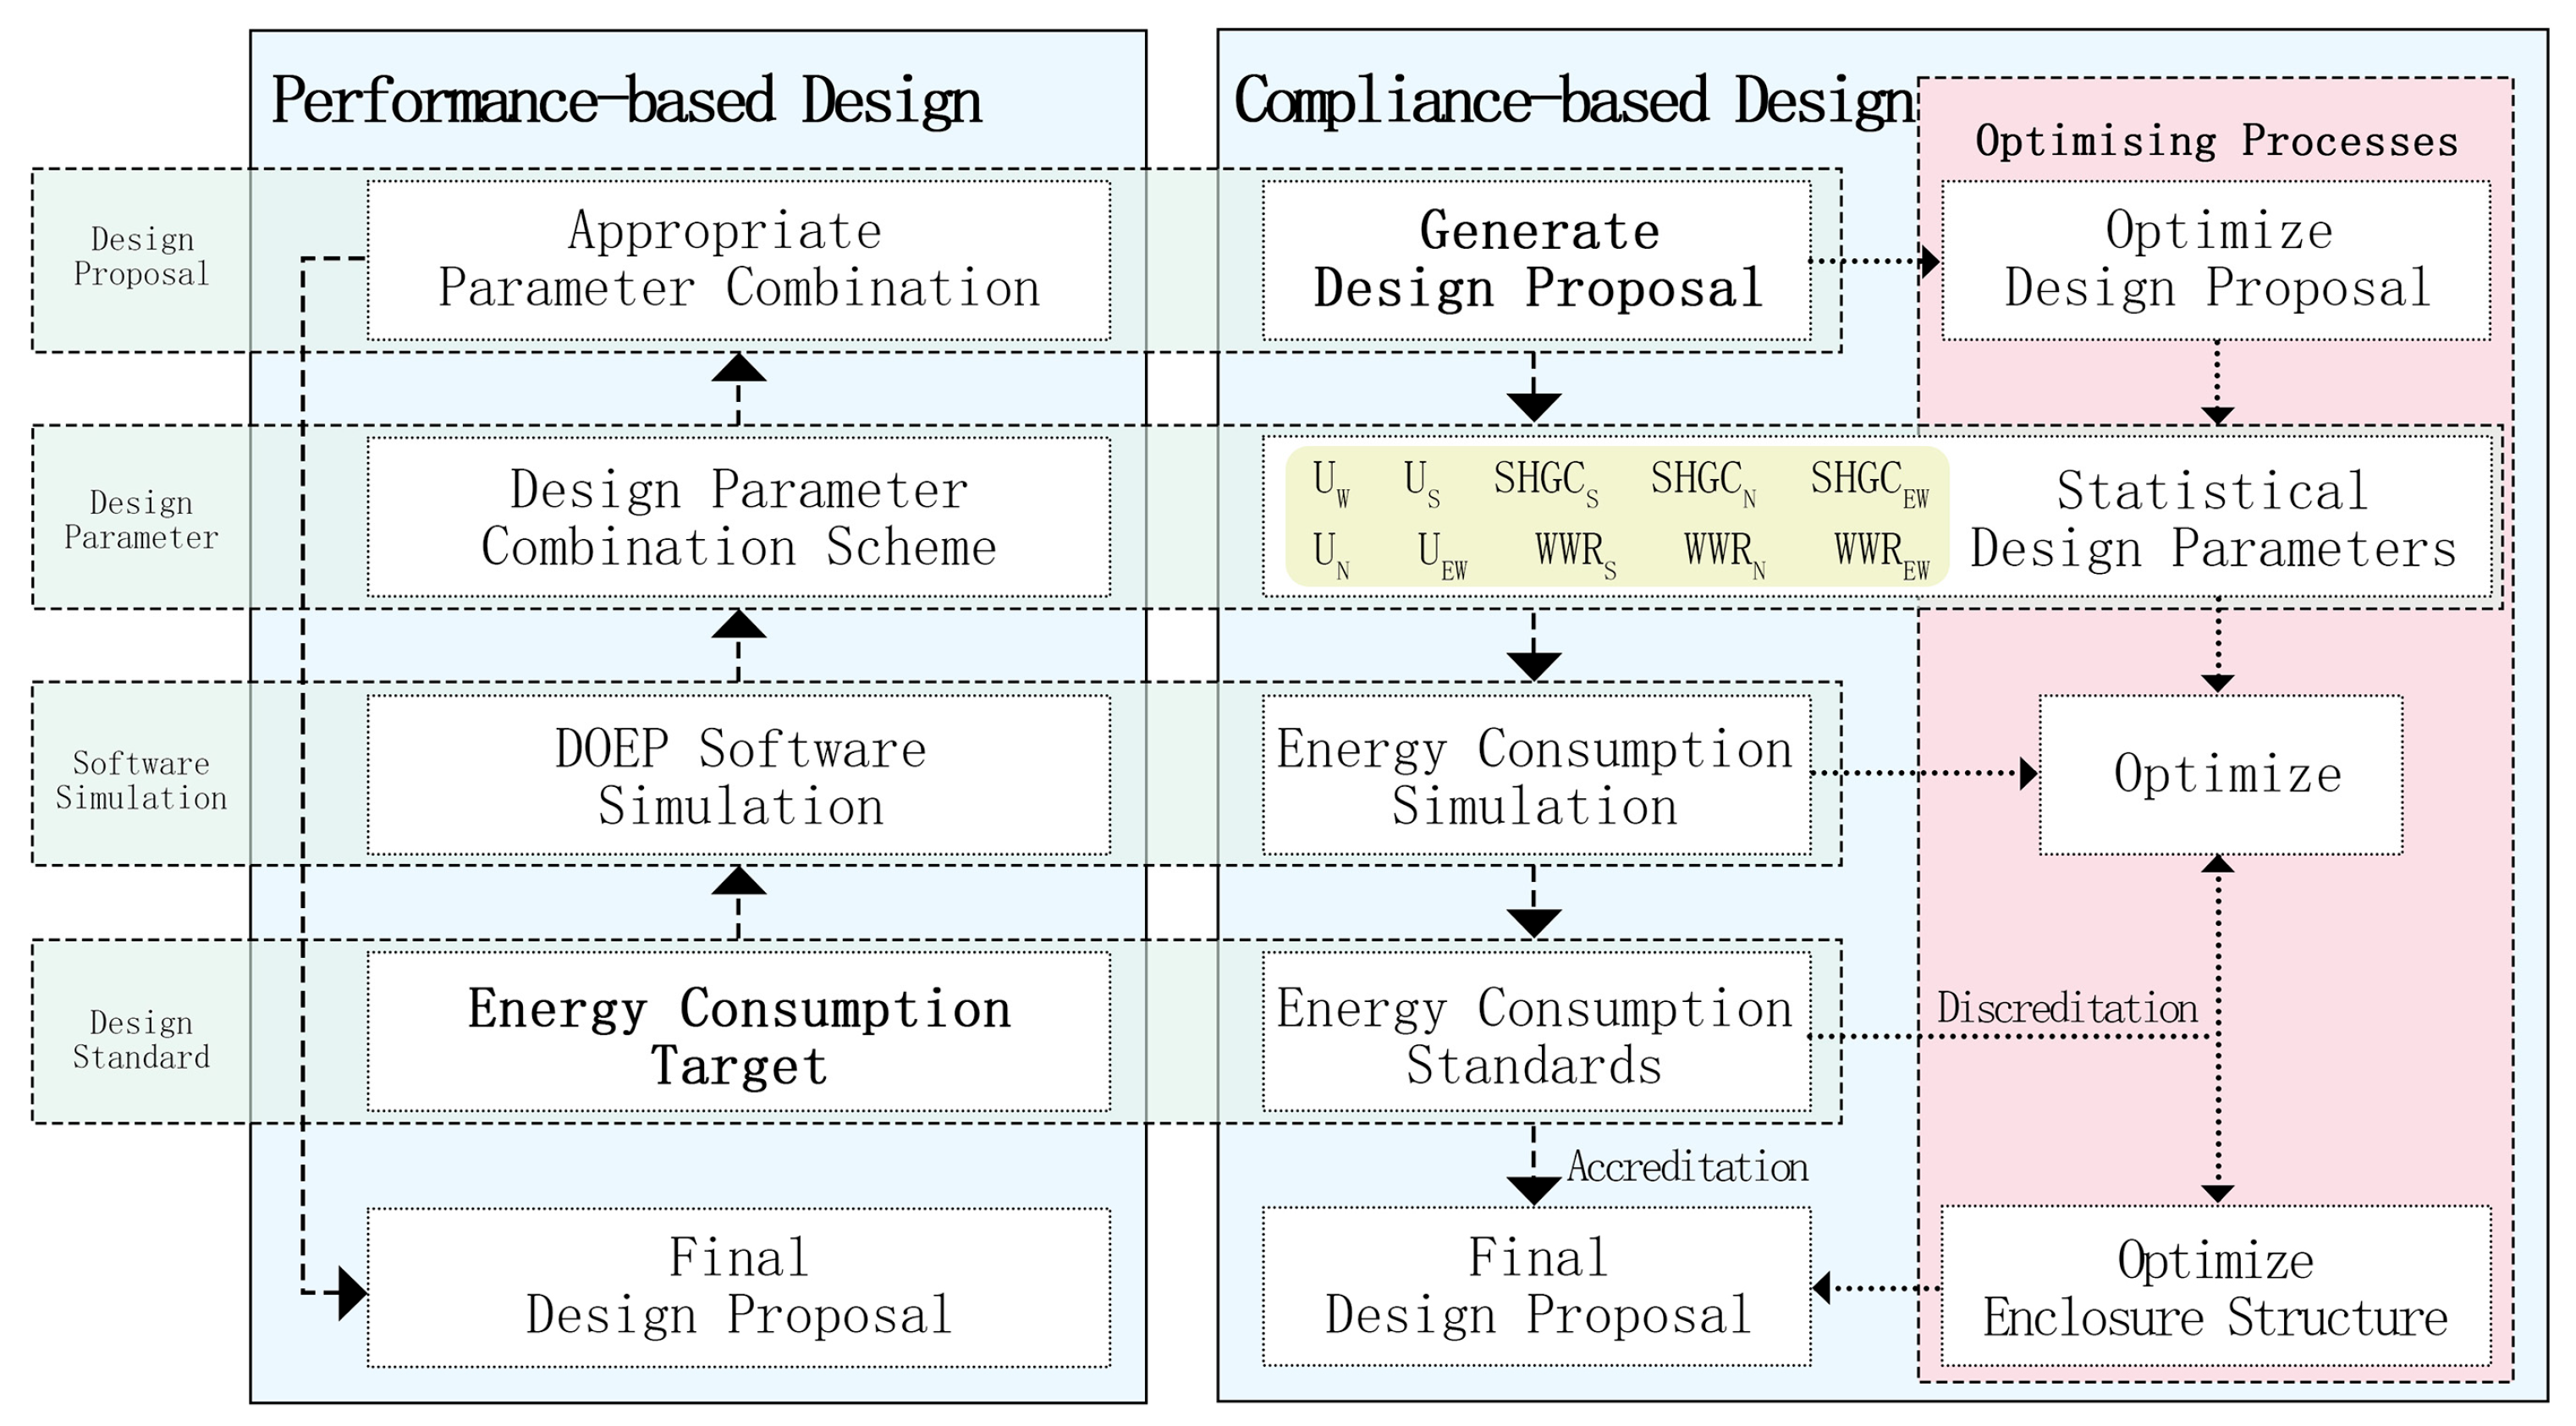
In the context of evolving building energy consumption standards, the optimization of individual design factors is no longer adequate to meet energy consumption requirements. This necessitates the coordination of various design factors to identify the optimal combination scheme. A performance-based design process based on energy consumption allows architects to determine multiple design parameter combinations that meet energy consumption standards before the design phase. Based on DOEP, this approach serves to guide scheme design, thereby ensuring considerable savings in energy verification and optimization costs while concomitantly reducing the duration of the design phase. A comparison and optimization of the design processes is presented in Figure 14.

5. Research Limitations and Future Work

This study has certain shortcomings. In terms of factors affecting energy consumption, only passive design parameters of the envelope were considered, ignoring the influence of different shape coefficients. Furthermore, the boundary conditions and steady-state assumptions used in the simulation process are simplified, which do not fully capture the dynamic effects of occupant behavior, internal heat gains, and urban microclimatic variations. These may cause the current calculation method to underestimate actual energy consumption across the evaluated design schemes. In future work, we will further expand the parameter range, using passive parameters of the overall building design as research variables, and we will refine the calculation method by introducing dynamic coupling between building and urban microclimate models, improving the accuracy of predicted energy use. Furthermore, while this research focused primarily on building-scale simulations, urban climate models such as ENVI-met [51], PALM [52], and MITRAS [53] will be integrated in future studies to represent local boundary conditions more realistically. Coupling these models with the proposed method will allow a comprehensive analysis of heat exchange, solar radiation, and ventilation effects within urban contexts.

6. Conclusions

This study proposed a predictive model for the envelope design parameters and energy consumption of NZE residential buildings in Jinan. The most energy-efficient building shape was identified through simulation and field research, which served as the baseline model for this study. Based on this model, key parameters for the envelope were selected, and multiple linear regression analysis of a large amount of dynamic simulation data was used to establish the predictive model. Finally, the effectiveness of the model was validated through an actual project, and a strategy for optimizing the combination of key parameters of NZE residential building envelopes in Jinan was proposed. The main contributions of this study are as follows.
(1)
This study established a quantitative relationship between the shape coefficient design parameters and energy consumption of residential buildings, and ultimately concluded that the most energy-efficient building shape is an 18-story building with a face length of 52.6 m, a width of 15.1 m, and a floor height of 3 m.
(2)
This study screened key passive parameters for the building envelope of NZE residential buildings and established a prediction model linking design parameters to energy consumption:
E = 3.556 U 0.042 U W S 0.052 S H G C S 1.129 W W R S + 0.063 U W N 0.045 S H G C N + 3.506 W W R N + 0.017 U W E W 0.014 S H G C E W + 1.522 W W R E W + 26.065
(3)
Building energy consumption is significantly influenced by WWR. Improving WWRN, WWREW, and U, and reducing WWRS, SHGCS can contribute to building energy consumption. In addition, heating energy consumption is proportional to WWRN, U, and WWREW, but is inversely proportional to WWRS and SHGCEW. Cooling energy consumption is proportional to WWRS, WWRN, and WWREW, but was inversely proportional to SHGCS and UWN.
(4)
During the design phase of the residential building envelope, architects should not widely decrease design parameters to reduce energy consumption. Rather, a comprehensive approach should be adopted to optimize all design parameters to achieve the best combination of parameter values.
(5)
Optimizing key parameters and implementing the DOEP software based on the energy demand prediction model can assist architects in expeditiously selecting the optimal design parameters based on energy consumption comparisons.
In summary, this study focused on NZE residential buildings in Jinan, explored the most energy-efficient shape coefficient, and revealed the mechanism of passive design parameters between the envelope and energy consumption. Additionally, this study addresses the lack of energy optimization by a performance-based process that first determines energy-efficient parameter combinations and then refines the architectural scheme. However, this study still has certain shortcomings. In terms of factors affecting energy consumption, only passive design parameters of the envelope were considered, ignoring the influence of different shape coefficients.

Author Contributions

Conceptualization, J.X. and X.H.; methodology, J.X.; software, J.X. and X.H.; validation, J.X., T.F., and X.H.; formal analysis, J.X.; investigation, J.X.; resources, T.F., Y.W., and Z.W.; data curation, Z.W. and X.H.; writing—original draft preparation, J.X.; writing—review and editing, T.F.; visualization, J.X.; supervision, T.F., Y.W., and Z.W.; project administration, T.F. and Y.W.; funding acquisition, T.F. All authors have read and agreed to the published version of the manuscript.

Funding

This research was funded by the National Natural Science Foundation of China, grant number 52278024, and the Natural Science Foundation of Shandong Province, China, grant number ZR2022ME015.

Data Availability Statement

The original contributions presented in this study are included in the article. Further inquiries can be directed to the corresponding author.

Conflicts of Interest

Author Yanzheng Wang was employed by the company Shandong Quality Inspection and Testing Center of Construction Engineering Co., Ltd.; Author Zhao Wang was employed by the company Shandong Academy of Building Sciences Co., Ltd. The remaining authors declare that the research was conducted in the absence of any commercial or financial relationships that could be construed as a potential conflict of interest.

Abbreviations

The following abbreviations are used in this manuscript:
NZEBSNearly zero energy buildings
NZENearly zero energy
BIMBuilding information model
WWRWindow-to-wall ratio
HVACHeating, ventilation, and air conditioning
LBuilding plan length
WBuilding plan width
UHeat transfer coefficient of wall
UWHeat transfer coefficient of window
SHGCSolar heat gain coefficient
R2The coefficient of determination
HHeating energy consumption
CCooling energy consumption
BPNNBackpropagation neural network
DOEPDesign optimization and energy prediction
EBuilding energy consumption

References

  1. Zhang, X.L.; Xia, J.J.; Jiang, Z.Y.; Huang, J.Y.; Qing, R.; Zhang, Y.; Liu, Y.; Jiang, Y. DeST—An Integrated Building Simulation Toolkit Part II: Applications. Build. Simul. 2008, 1, 193–209. [Google Scholar] [CrossRef]
  2. Shabunko, V.; Lim, C.M.; Mathew, S. EnergyPlus models for the benchmarking of residential buildings in Brunei Darussalam. Energy Build. 2018, 169, 507–516. [Google Scholar] [CrossRef]
  3. Shi, K.Z.; Ren, J.L.; Cao, X.D.; Kong, X.F. Optimizing thermal comfort in an atrium-structure library: On-site measurement and TRNSYS-CONTAM co-simulation. Build. Environ. 2024, 266, 112041. [Google Scholar] [CrossRef]
  4. Passive House Institute. Passive House Planning Package (PHPP): The Energy Balance and Design Tool. 2018. Available online: https://passivehouse.com/04_phpp/04_phpp.htm (accessed on 20 July 2024).
  5. Xiang, Y.M.; Ma, K.H.; Mahamadu, A.M.; Laura, F.P.; Zhu, K.; Wu, Y.H. Embodied carbon determination in the transportation stage of prefabricated constructions: A micro-level model using the bin-packing algorithm and modal analysis model. Energy Build. 2023, 278, 112640. [Google Scholar] [CrossRef]
  6. GB/T 51350-2019; Technical Standard for Nearly Zero Energy Buildings. China Architecture & Building Press: Beijing, China, 2019.
  7. Schnieders, J.; Feist, W.; Rongen, L. Passive Houses for different climate zones. Energy Build. 2015, 105, 71–87. [Google Scholar] [CrossRef]
  8. Shirzadi, N.; Lau, D.; Stylianou, M. Surrogate Modeling for Building Design: Energy and Cost Trade-offs. Buildings 2025, 15, 2361. [Google Scholar] [CrossRef]
  9. Shadram, F.; Johansson, T.D.; Lu, W.; Schade, J.; Olofsson, T. An integrated BIM-based framework for minimizing embodied energy during building design. Energy Build. 2016, 128, 592–604. [Google Scholar] [CrossRef]
  10. Duan, J.H.; He, Y.; Sun, X.C.; Yu, H.W.; Zhang, Y.L.; Zhang, Y.F. Design and comprehensive assessment of roof photovoltaic retrofits for existing buildings. Sol. Energy 2025, 288, 113280. [Google Scholar] [CrossRef]
  11. Wang, M.; Xu, Y.; Shen, R.T.; Wu, Y. Performance-Oriented Parametric Optimization Design for Rural Residential Buildings Using Grasshopper + Ladybug/Honeybee. Sustainability 2024, 16, 8330. [Google Scholar] [CrossRef]
  12. Aeinfar, S.; Serteser, N. Parametric Study for EUI Optimization via Airflow Management in High-Rise (Istanbul). J. Build. Eng. 2025, 105, 112441. [Google Scholar] [CrossRef]
  13. Nord, N.; Tereshchenko, T.; Qvistgaard, L.H.; Tryggestad, I.S. Influence of occupant behavior and operation on performance of a residential Zero Emission Building in Norway. Energy Build. 2018, 159, 75–88. [Google Scholar] [CrossRef]
  14. Crawley, D.B.; Hand, J.W.; Kummert, M.; Griffith, B.T. Contrasting The Capabilities of Building Energy Performance Simulation Programs. Build. Environ. 2008, 43, 661–673. [Google Scholar] [CrossRef]
  15. Guillen, E.E.; Samuelson, H.W.; Vohringer, C. The impact of cultural assumptions on simulated energy, comfort, and investment returns of design decisions in two desert climates. Build. Simul. 2021, 14, 931–944. [Google Scholar] [CrossRef]
  16. Lédée, F.; Crawford, C.; Evins, R. Improved Surrogate Modeling for Multi-Energy System Design. Appl. Energy 2025, 390, 125812. [Google Scholar] [CrossRef]
  17. Shadram, F.; Mukkavaara, J. An integrated BIM-based framework for the optimization of the trade-off between embodied and operational energy. Energy Build. 2018, 158, 189–205. [Google Scholar] [CrossRef]
  18. Delgarm, N.; Sajadi, B.; Delgarm, S. Multi-objective optimization of building energy performance and indoor thermal comfort: A new method using artificial bee colony. Energy Build. 2016, 131, 42–53. [Google Scholar] [CrossRef]
  19. Pilechiha, P.; Mahdavinejad, M.; Pour Rahimian, F.; Carnemolla, P.; Seyedzadeh, S. Multi-objective optimization framework for designing office windows: Quality of view, daylight and energy efficiency. Appl. Energy 2020, 261, 114356. [Google Scholar] [CrossRef]
  20. Pittarello, M.; Scarpa, M.; Ruggeri, A.G.; Gabrielli, L.; Schibuola, L. Artificial Neural Networks to Optimize Zero Energy Building (ZEB) Projects from the Early Design Stages. Appl. Sci. 2021, 11, 5377. [Google Scholar] [CrossRef]
  21. Harkouss, F.; Fardoun, F.; Biwole, P.H. Multi-objective optimization methodology for net zero energy buildings. J. Build. Eng. 2018, 16, 57–71. [Google Scholar] [CrossRef]
  22. Zhang, X.; Wang, A.; Tian, Z.; Li, Y.; Zhu, S.; Shi, X.; Jin, X.; Zhou, X.; Wei, S. Methodology for developing economically efficient strategies for net zero energy buildings: A case study of a prototype building in the Yangtze River Delta, China. J. Clean. Prod. 2021, 320, 128849. [Google Scholar] [CrossRef]
  23. Biswas, M.A.R.; Robinson, M.D.; Fumo, N. Prediction of residential building energy consumption: A neural network approach. Energy 2016, 117, 84–92. [Google Scholar] [CrossRef]
  24. Gauch, H.L.; Dunant, C.F.; Hawkins, W.; Cabrera Serrenho, A. What really matters in multi-storey building design? A simultaneous sensitivity study of embodied carbon, construction cost, and operational energy. Energy Build. 2025, 333, 120585. [Google Scholar] [CrossRef]
  25. Rosenfelder, M.; Wussow, M.; Gust, G.; Cremades, R.; Neumann, D. Predicting residential electricity consumption using aerial and street view images. Appl. Energy 2021, 301, 117407. [Google Scholar] [CrossRef]
  26. Liu, K.; Xu, X.D.; Zhang, R.; Kong, L.Y.; Wang, W.; Deng, W. Impact of urban form on building energy consumption and solar energy potential: A case study of residential blocks in Jianhu, China. Energy Build. 2023, 280, 112727. [Google Scholar] [CrossRef]
  27. Milovanović, B.; Bagaric, M. How to achieve Nearly zero-energy buildings standard. J. Croat. Assoc. Civ. Eng. 2020, 72, 703–720. [Google Scholar] [CrossRef]
  28. Liao, W.; Wen, C.F.; Luo, Y.M.; Peng, J.Q.; Li, N.P. Influence of different building transparent envelopes on energy consumption and thermal environment of radiant ceiling heating and cooling systems. Energy Build. 2022, 255, 111702. [Google Scholar] [CrossRef]
  29. Feng, W.; Huang, J.; Lv, H.; Guo, D.; Huang, Z. Determination of the economical insulation thickness of building envelopes simultaneously in energy-saving renovation of existing residential buildings. Energy Sources Part A 2019, 41, 665–676. [Google Scholar] [CrossRef]
  30. Vivek, T.; Balaji, K. Heat transfer and thermal comfort analysis of thermally activated building system in warm and humid climate—A case study in an educational building. Int. J. Therm. Sci. 2023, 183, 107883. [Google Scholar] [CrossRef]
  31. Lapisa, R.; Bozonnet, E.; Salagnac, P.; Abadie, M.O. Optimized design of low-rise commercial buildings under various climates—Energy performance and passive cooling strategies. Build. Environ. 2018, 132, 83–95. [Google Scholar] [CrossRef]
  32. Jedrejuk, H.; Marks, W. Optimization of shape and functional structure of buildings as well as heat source utilization example. Build. Environ. 2002, 37, 79–83. [Google Scholar] [CrossRef]
  33. Mechri, H.E.; Capozzoli, A.; Corrado, V. USE of the ANOVA approach for sensitive building energy design. Appl. Energy 2010, 87, 73–83. [Google Scholar] [CrossRef]
  34. Szalay, Z.; Zoeld, A. Definition of nearly zero-energy building requirements based on a large building sample. Energy Policy 2014, 74, 10–21. [Google Scholar] [CrossRef]
  35. Evola, G.; Margani, G.; Marletta, L. Cost-effective design solutions for low-rise residential Net ZEBs in Mediterranean climate. Energy Build. 2014, 68, 7–18. [Google Scholar] [CrossRef]
  36. Alghoul, S.K.; Rijabo, H.G.; Mashena, M.E. Energy consumption in buildings: A correlation for the influence of window to wall ratio and window orientation in Tripoli, Libya. J. Build. Eng. 2017, 11, 82–86. [Google Scholar] [CrossRef]
  37. Ferrante, A.; Cascella, M.T. Zero energy balance and zero on-site CO2 emission housing development in the Mediterranean climate. Energy Build. 2011, 43, 2002–2010. [Google Scholar] [CrossRef]
  38. Whang, S.W.; Kim, S. Determining sustainable design management using passive design elements for a zero emission house during the schematic design. Energy Build. 2014, 77, 304–312. [Google Scholar] [CrossRef]
  39. Thalfeldt, M.; Pikas, E.; Kurnitski, J.; Voll, H. Facade design principles for nearly zero energy buildings in a cold climate. Energy Build. 2013, 67, 309–321. [Google Scholar] [CrossRef]
  40. Wang, L.; Gwilliam, J.; Jones, P. Case study of zero energy house design in UK. Energy Build. 2009, 41, 1215–1222. [Google Scholar] [CrossRef]
  41. Gong, X.; Akshi, Y.; Sumiyoshi, D. Optimization of passive design measures for residential buildings in different Chinese areas. Build. Environ. 2012, 58, 46–57. [Google Scholar] [CrossRef]
  42. Eshraghi, P.; Korsavi, S.S.; Ghahramani, A.; Zomorodian, Z.S. Urban Building Modeling: A Comprehensive Review of Inputs, Outputs, and Tools for Sustainable Development. Environ. Model. Assess. 2025, 1–45. [Google Scholar] [CrossRef]
  43. Imani, E.; Dawood, H.; Williams, S.; Dawood, N. Physics-Based and Data-Driven Retrofitting Solutions for Energy Efficiency and Thermal Comfort in the UK: IoT-Validated Analysis. Buildings 2025, 15, 1050. [Google Scholar] [CrossRef]
  44. Kharvari, F. An empirical validation of daylighting tools: Assessing radiance parameters and simulation settings in Ladybug and Honeybee against field measurements. Sol. Energy 2020, 207, 1021–1036. [Google Scholar] [CrossRef]
  45. Lin, H.K.; Ni, H.; Xiao, Y.Q.; Zhu, X.M. Couple simulations with CFD and ladybug plus honeybee tools for green facade optimizing the thermal comfort in a transitional space in hot-humid climate. J. Asian Archit. Build. Eng. 2023, 22, 1317–1342. [Google Scholar] [CrossRef]
  46. Karim, M.A.; Hasan, M.M.; Khan, M.I.H. A simplistic and efficient method of estimating air-conditioning load of commercial buildings in the sub-tropical climate. Energy Build. 2019, 203, 109396. [Google Scholar] [CrossRef]
  47. Mirfin, A.; Xiao, X.; Jack, M.W. TOWST: A physics-informed statistical model for building energy consumption with solar gain. Appl. Energy 2024, 369, 123488. [Google Scholar] [CrossRef]
  48. Lundberg, S.M.; Lee, S.I. A Unified Approach to Interpreting Model Predictions. Adv. Neural Inf. Process. Syst. 2017, 30, 4765–4774. Available online: https://webofscience.clarivate.cn/wos/woscc/full-record/WOS:000452649404081 (accessed on 15 January 2025).
  49. Wang, Y.; Sun, G.Q.; Wu, Y.M.; Rosenberg, M.W. Urban 3D building morphology and energy consumption: Empirical evidence from 53 cities in China. Sci. Rep. 2024, 14, 12887. [Google Scholar] [CrossRef] [PubMed]
  50. GB55015-2021; General Code for Energy Efficiency and Renewable Energy Application in Buildings. China Architecture & Building Press: Beijing, China, 2021.
  51. Bruse, M.; Fleer, H. Simulating surface–plant–air interactions inside urban environments with a three dimensional numerical model. Environ. Modell softw. 1998, 12, 373–384. [Google Scholar] [CrossRef]
  52. Maronga, B.; Banzhaf, S.; Burmeister, C.; Esch, T.; Forkel, R.; Fröhlich, D.; Fuka, V.; Gehrke, K.F.; Geletič, J.; Giersch, S.; et al. Overview of the PALM model system 6.0. Geosci Model Dev. 2020, 13, 1335–1372. [Google Scholar] [CrossRef]
  53. Salim, M.H.; Schlünzen, K.H.; Grawe, D.; Boettcher, M.; Gierisch, A.M.U.; Fock, B.H. The Microscale Obstacle-Resolving Meteorological Model MITRAS (v2). Geosci. Model Dev. 2018, 11, 3427–3445. [Google Scholar] [CrossRef]
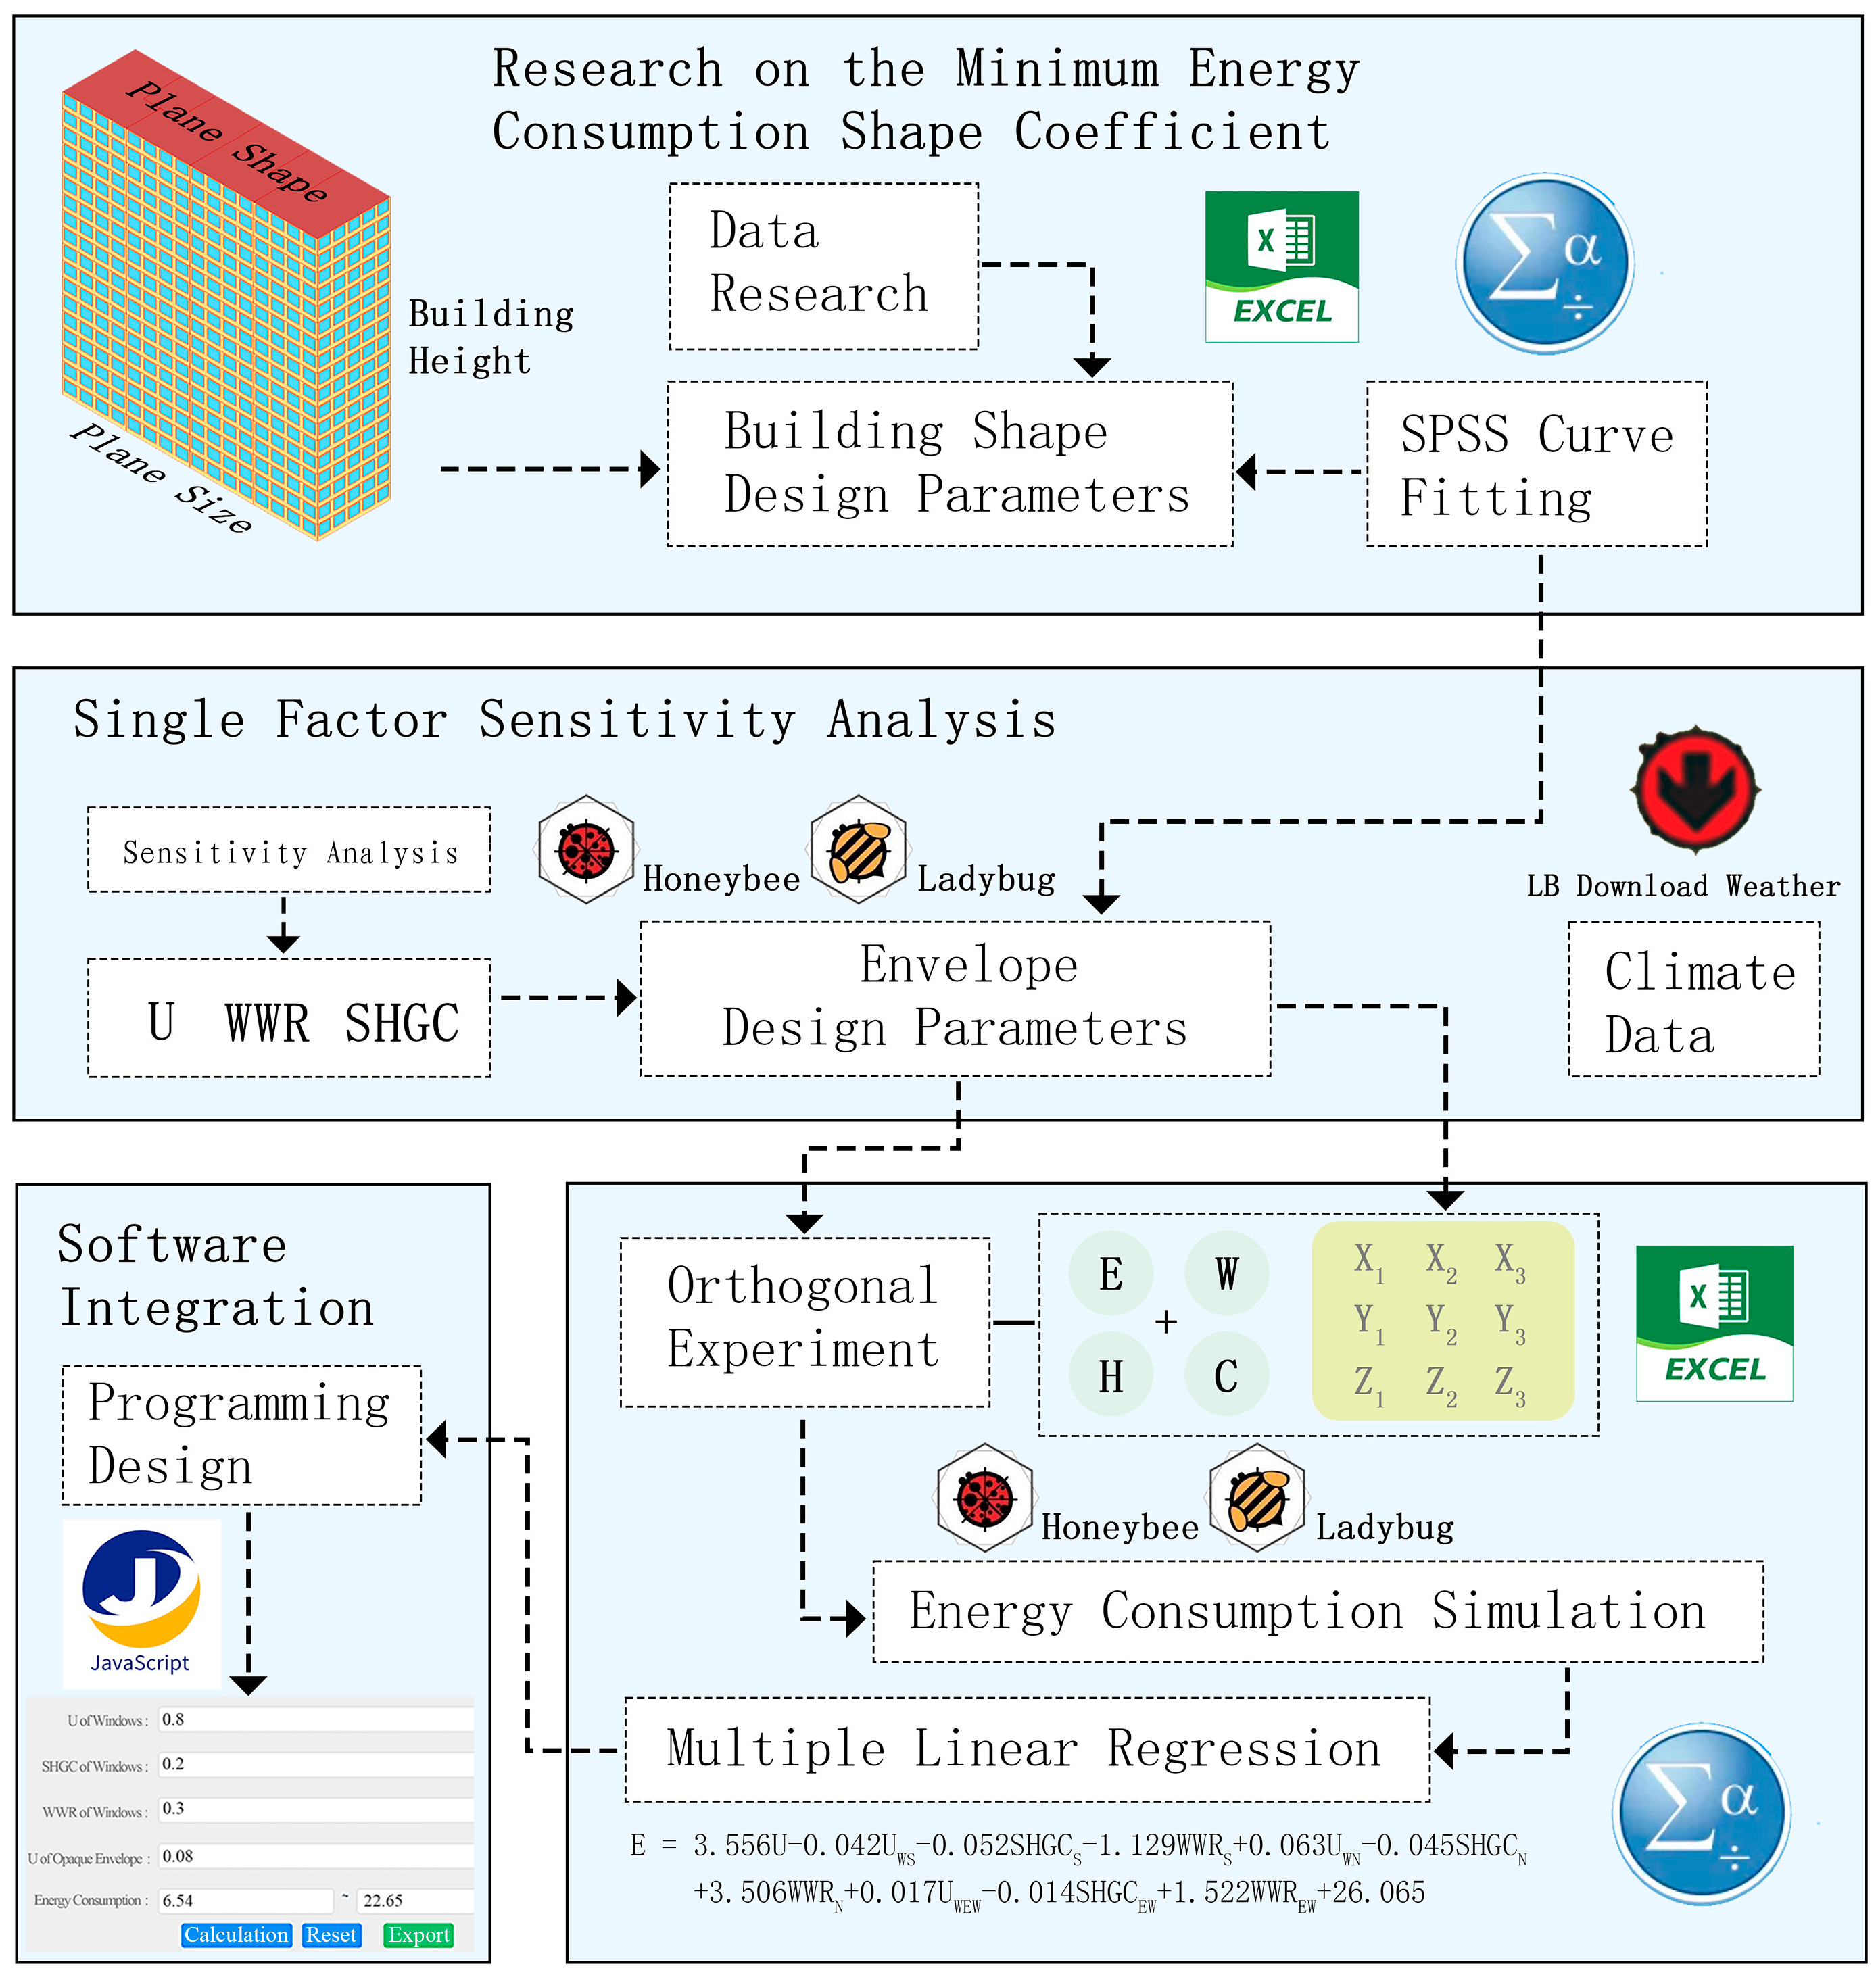
Figure 1. The research framework.
Buildings 15 03785 g001
Figure 2. Simplified schematic of residential building plan.
Buildings 15 03785 g002
Figure 3. Trend of building energy consumption with the increase in floors.
Buildings 15 03785 g003
Figure 4. Statistics of plan dimensions. (a) Plan length statistics. (b) Plan width statistics.
Buildings 15 03785 g004
Figure 5. Variation in energy consumption with building length under different widths.
Buildings 15 03785 g005
Figure 6. Analysis of the trend and correlation between building length and energy consumption.
Buildings 15 03785 g006
Figure 7. Sensitivity analysis of the impact of different orientations on energy consumption. (a) WWR. (b) UW. (c) SHGC.
Buildings 15 03785 g007
Figure 8. Orthogonal experimental schemes and simulation results.
Buildings 15 03785 g008
Figure 9. Correlation analysis.
Buildings 15 03785 g009
Figure 10. Results of the interpretability analysis. (a) The mean absolute SHAP value summary of heating energy consumption. (b) The detailed SHAP value summary of heating energy consumption. (c) The mean absolute SHAP value summary of cooling energy consumption. (d) The detailed SHAP value summary of cooling energy consumption. (e) The mean absolute SHAP value summary of total energy consumption. (f) The detailed SHAP value summary of total energy consumption.
Buildings 15 03785 g010aBuildings 15 03785 g010b
Figure 11. The overview of the case building. (a) Standard floor plan of the building. (b) Building location. (c) Building a real shot.
Buildings 15 03785 g011
Figure 12. Measured instrument and model calibration results. (a) Simulation and measurement values of indoor temperature. (b) Simulation and measurement values of indoor humidity.
Buildings 15 03785 g012
Figure 13. Display of the DOEP interface and results.
Buildings 15 03785 g013
Figure 14. Comparison of compliance-based and performance-based design processes.
Buildings 15 03785 g014
Table 1. Summary of performance-based design in recent years.
Research on Performance-Based Design
YearReferenceBuilding TypePerformance Targets Design ParametersTools
2018Shadram F et al. [17]Residential BuildingEmbodied Energy
Operational Energy
Construction ElementsBIM
Grasshopper
2016Delgarm N et al. [18]Office BuildingAnnual Building Electricity Consumption
Predicted Percentage of Dissatisfied
Room Rotation
Window Size
Envelope Material
EnergyPlus
Matlab
2020Pilechiha P et al. [19]Office BuildingEnergy Consumption
Daylighting
Building Envelope
HVAC 1 System
EnergyPlus
2021Pittarello M et al. [20]Buildings in ItalyEnergy Consumption
Indoor Air Quality
HVAC SystemEnergyPlus
Python
2018Harkouss F [21]Residential BuildingLife Cycle Cost
Electrical Demands
Thermal Demands
Building Envelope
HAVC System
EnergyPlus
2021Zhang XK et al. [22]Office BuildingLife Cycle Cost
Energy Consumption
Building Envelope
HVAC System
Photovoltaic System
EnergyPlus
2016Biswas MAR et al. [23]Residential BuildingTotal Energy ConsumptionDry-bulb Temperature
Solar Radiation
Python
Performance-based Design in Residential Buildings
YearReferenceOptimization TypePerformance Targets Design ParametersTools
2023Gauch HL et al. [24]Shape
Coefficient
Cost
Life Cycle CO2
Energy Consumption
Building Shape
Size
Laylout
EnergyPlus
Python
2021Rosenfelder M et al. [25]Shape
Coefficient
Electricity ConsumptionBuilding Shape
Building Height
Aerial View
EnergyPlus
2023Liu K et al. [26]Shape
Coefficient
Energy Consumption
Solar Potential
Sunlight Hours
Building Shape
Building Height
Grasshopper
Python
2020Milovanoic B et al. [27]Building
Envelope
Energy EfficiencyBuilding EnvelopeEnergyPlus
2021Liao W et al. [28]Building
Envelope
Energy Consumption
Indoor Thermal Environment
Transparent EnvelopeEnergyPlus
2018Feng W et al. [29]Building
Envelope
Investment in Insulation
Investment Payback Period
Life Cycle Net Present Value
Building EnvelopeEnergyPlus
2022Vivek T et al. [30]Building
Envelope
Indoor thermal
Comfort Indices
Building SurfacesTRNSYS
2018Lapisa R et al. [31]Building
Envelope
Energy Demand
Thermal Comfort
Building Envelope
HVAC System
Artificial Lighting
Grasshopper
1 HVAC is heating, ventilating, and air conditioning.
Table 2. Setting the model boundary conditions.
Construction of Building Envelope
NumberMethod of ConstructionThickness (mm)Heat Transfer Coefficient (W/m2·K)
1Elastomeric Coatings50.142
2Plaster20
3Graphite Polystyrene Sheet250
4Steam Pressurized Concrete Horizontal Slabs200
5Mortar15
6Covering5
Construction of Building Roofing
NumberMethod of ConstructionThickness (mm)Heat Transfer Coefficient (W/m2·K)
1Protective Layer of Fine-grained Concrete400.151
2SBS Waterproofing Roll-roofing4
3Fine-grained Concrete Screed30
4XPS Insulating Layer250
5Cement Mortar Screed20
6Expanded Perlite30
7SBS Waterproofing Roll-roofing4
8Reinforced Concrete Slab130
9Mortar20
Infiltration
±50 Pa0.6 h−1
HVAC system
Parameters for EnvironmentalInterior Design Temperature during the Heating Period (°C)Temperature Setting: 20Setback: 18
Interior Design Temperature during the Cooling Period (°C)Temperature Setting: 26Setback: 28
Year-round Indoor Design Relative Humidity (%)60
Parameters for Heating/Cooling PeriodDate of Calculation11/1 to 3/316/1 to 9/30
Number of Heating/Cooling Calculation Days151122
Calculation MethodContinuous OperationContinuous Operation
Table 3. Envelope design parameter settings.
Envelope ParametersSouth-Facing RangeNorth-Facing RangeEast/West-Facing RangeStep
U[0.09, 0.21]0.03
UW[0.8, 1.2][0.8, 1.2][0.8, 1.2]0.1
SHGC[0.2, 0.6][0.2, 0.6][0.2, 0.6]0.1
WWR[0.3, 0.7][0.3, 0.7][0.3, 0.7]0.1
Table 4. Representative optimization schemes.
NumberUW
S
SHGC
S
WWR
S
UW
N
SHGC
N
WWR
N
UW
EW
SHGC
EW
WWR
EW
UCalculation Simulation InaccuracyEfficiency Ratio
010.20.310.40.210.40.150.1527.1928.39−4.23%-
11.20.20.310.40.210.40.150.1527.1828.39−4.26%≈0%
210.20.510.40.210.40.150.1526.9728.18−4.29%7.4%
310.40.310.40.210.40.150.1527.1828.39−4.26%≈0%
410.20.310.60.210.40.150.1527.1828.39−4.26%≈0%
510.20.310.40.210.60.150.1527.1928.39−4.23%≈0%
61.20.20.31.20.60.151.20.40.150.1527.0228.20−4.18%6.7%
710.20.310.40.1510.40.150.1827.1228.43−4.61%−1.4%
80.80.10.30.80.20.20.80.20.150.1527.2028.39−4.19%≈0%
910.20.3510.40.1510.40.150.1526.9628.17−4.29%7.7%
Disclaimer/Publisher’s Note: The statements, opinions and data contained in all publications are solely those of the individual author(s) and contributor(s) and not of MDPI and/or the editor(s). MDPI and/or the editor(s) disclaim responsibility for any injury to people or property resulting from any ideas, methods, instructions or products referred to in the content.