Article

An Experimental Evaluation of Steel Beam-HSST/CFSST Column Connection with Varying Joint Configurations

1
School of Civil Engineering and Transportation, North China University of Water Resources and Electric Power, Zhengzhou 450045, China
2
Faculty of Built Environment, Universiti Teknologi MARA (UiTM), Shah Alam 40450, Selangor, Malaysia
*
Author to whom correspondence should be addressed.
Buildings 2025, 15(20), 3774; https://doi.org/10.3390/buildings15203774
Submission received: 9 September 2025 / Revised: 15 October 2025 / Accepted: 16 October 2025 / Published: 19 October 2025
(This article belongs to the Section Building Structures)

Abstract

Sixteen beam–column joints with different column types and connection configurations were designed and tested to identify suitable joints for low-rise prefabricated square steel tube (SST) columns and H-beams. The columns included hollow square steel tube (HSST) and concrete-filled square steel tube (CFSST) types, while the joints consisted of welded, end plate, flange-connected, and angle connector plate configurations. Cyclic loading tests were conducted to examine failure modes, hysteresis and skeleton curves, stiffness degradation, and cumulative energy dissipation. The results showed that joints with angle connector plates outperformed welded, end-plate, and flange-connected joints. The height of the triangular stiffener was found to be a critical factor, with a 144 mm stiffener increasing the ultimate bending moment by 78.65% for CFSST and 79.3% for HSST columns, along with notable improvements in stiffness and energy dissipation. Based on Eurocode 3, angle connector plate joints with high stiffeners were classified as semi-rigid and full-strength. A combined assessment of mechanical behavior and economic efficiency indicated that this joint type provides the highest cost-effectiveness and significant application potential.

1. Introduction

H-section steel and square steel tube (SST) columns are commonly employed in prefabricated buildings. Unlike H-section columns, SST columns provide identical moments of inertia and load-bearing capacity along both principal axes, while their flat surfaces allow easier connections [1]. For this reason, SST columns are more frequently adopted in practice. They are classified as hollow square steel tube (HSST) or concrete-filled square steel tube (CFSST) columns. Although CFSST columns are costlier than HSST columns, they offer enhanced seismic performance [2] and fire resistance [3].
One of the key factors in earthquake-resistant structures is beam–column connections with appropriate detailing [4,5]. Previous research has examined different connection types between SST columns and H-beams, including (1) inner diaphragm joints [6,7,8,9], (2) outer ring plate joints [10,11,12], (3) diaphragm-through joints [13,14], and (4) end-plate joints [15,16,17,18,19,20,21,22]. With the increasing adoption of prefabricated buildings, the modifications of these conventional methods have been proposed. Liu et al. [23] introduced a connection between HSST columns with spliced ring plates and H-beams with end plates, while Zhan et al. [24] investigated its behavior through experiments and finite element analysis, subsequently establishing a capacity calculation method. Cho et al. [25] developed a cruciform through-diaphragm joint for CFST columns and H-beams, confirming favorable seismic performance under cyclic loading, with beam flange fracture identified as the dominant failure mode. Lee et al. [26] proposed T-shaped vertical diaphragm joints for CFST columns and H-beams, with their failure mode and hysteretic behavior evaluated experimentally. Ahmadi et al. [27] investigated beam–column joints with vertical through-diaphragms, analyzing the influence of geometric parameters on joint performance. Paul et al. [28] examined bidirectional bolted joints between drilled-cut reduced H-beams and CFST columns. Cao et al. [29] designed a joint incorporating a T-stub between the lower through-diaphragm and upper outer ring plate, reporting excellent ductility and energy dissipation capacity.
The previous studies have shown that the above beam–column joints exhibit favorable seismic performance; however, most were developed for large-section SST columns [29]. These configurations are also relatively complex and costly. By contrast, current rural prefabricated housing projects in China typically employ small-section SST columns with side lengths below 300 mm. For such columns, the existing joint types are unsuitable for several reasons. First, installing diaphragms inside narrow tubes is difficult [30], and diaphragms can impair concrete pouring quality [31]. Second, inner diaphragm and outer ring plate joints require extensive welding, which limits their applicability in prefabricated construction [32]. Furthermore, since the inner diaphragm aligns with the beam flange, the column wall at the joint region must be welded on both sides at the same level [33], which can reduce ductility in the welded region [34]. Third, while bolt hole weakening in large-section SST columns is negligible, it significantly alters the load transfer path in small-section columns [26], potentially causing premature yielding of the steel plate. In addition, through-column bolts complicate the installation of end-plate joints [35].
This study develops a simplified connection for low-rise, cost-sensitive structures, diverging from conventional diaphragm-through, end-plate, and outer-ring joints de-signed for high-load applications. By eliminating internal and external reinforcing elements and directly welding angle connector plates to the column face, the proposed design prioritizes constructability and economy. This solution provides a superior balance of adequate seismic performance and low cost for its target applications. The connector plates are factory-welded to the SST columns, where controlled heat treatment ensures high weld quality and dimensional accuracy. During on-site assembly, steel beams are efficiently bolted to the pre-installed angle connector plates.
A practical beam–column joint must ensure both mechanical reliability and cost-effectiveness. Accordingly, this study evaluated the proposed joint’s mechanical performance along with two critical factors. The first was the steel quantity for connection (SQC), defined as the steel used in the joint, excluding the beam and column, which directly determines connection cost. The second was the presence of concrete infill in the SST column. Concrete-filling is generally considered to improve joint stiffness [7] while reducing ductility [27,36], although its influence has not been fully clarified.
In summary, cyclic loading tests were conducted on 16 scaled specimens with different beam–column joint configurations. Failure modes, hysteretic response, load capacity, stiffness degradation, and energy dissipation were examined, and the effects of joint type and configuration parameters were analyzed. A comprehensive evaluation integrating mechanical performance and cost was then carried out, guiding the design and application of similar structural systems.

2. Experiment Design

2.1. Specimens

In this study, 16 scaled beam–column joints with different parameters were fabricated and classified into two groups based on column type. The first group included eight HSST column–H-beam joints: a welded joint (J1-H), an end-plate joint (J2-H), a web-connected joint (J3-H), a flange-connected joint (J4-H), a web-flange-connected joint (J5-H), and three joints with angle connector plates (J6-H, J7-H, and J8-H) (Figure 1). Connecting plates P1, P3, P4, P6, P7, and P8 were 6 mm thick, while P2 and P5 were 4 mm. The second group comprised eight CFSST column–H-beam joints of identical types and dimensions, designated J1-F to J8-F. All HSST and CFSST columns had a side length of 100 mm and a wall thickness of 4 mm, with the steel ratio of CFSST columns being 0.154 [37]. The steel beams measured 150 × 100 × 4 × 4 mm.
Table 1 presents the assembly method and SQC of each specimen, while the dimensions of the connecting plates are provided in Figure 1.

2.2. Material Properties

The steel tubes and connecting plates were fabricated from Q235B steel, with material properties determined in accordance with the Chinese national standard GB/T228.1-2021 [38] (Table 2). The CFSST columns were filled with recycled concrete containing 100% coarse aggregate replacement, with an average compressive strength of 43.4 MPa. Beam–column connections were assembled using 8.8-grade M12 bolts. To ensure ease of installation, all bolt holes were made 2 mm larger than the nominal bolt diameter. During testing, bolts were tightened with a torque wrench in accordance with the torque requirements and procedures specified in the Technical Specification for High Strength Bolt Connections of Steel Structures (JGJ82-2011) [39].

2.3. Loading Schemes

A customized loading device was designed for the test (Figure 2a), consisting of a trapezoidal steel frame. The device was bolted to the base of an electrohydraulic servo-testing machine. Before loading, the upper and lower column ends were inserted into the device (Figure 2b), after which a square cover was placed over the square hole and fixed with bolts. The column end was further secured with bolts to restrict displacement. Finally, the loading beam of the device was mechanically connected to the specimen beam end to apply cyclic loading (Figure 2c).
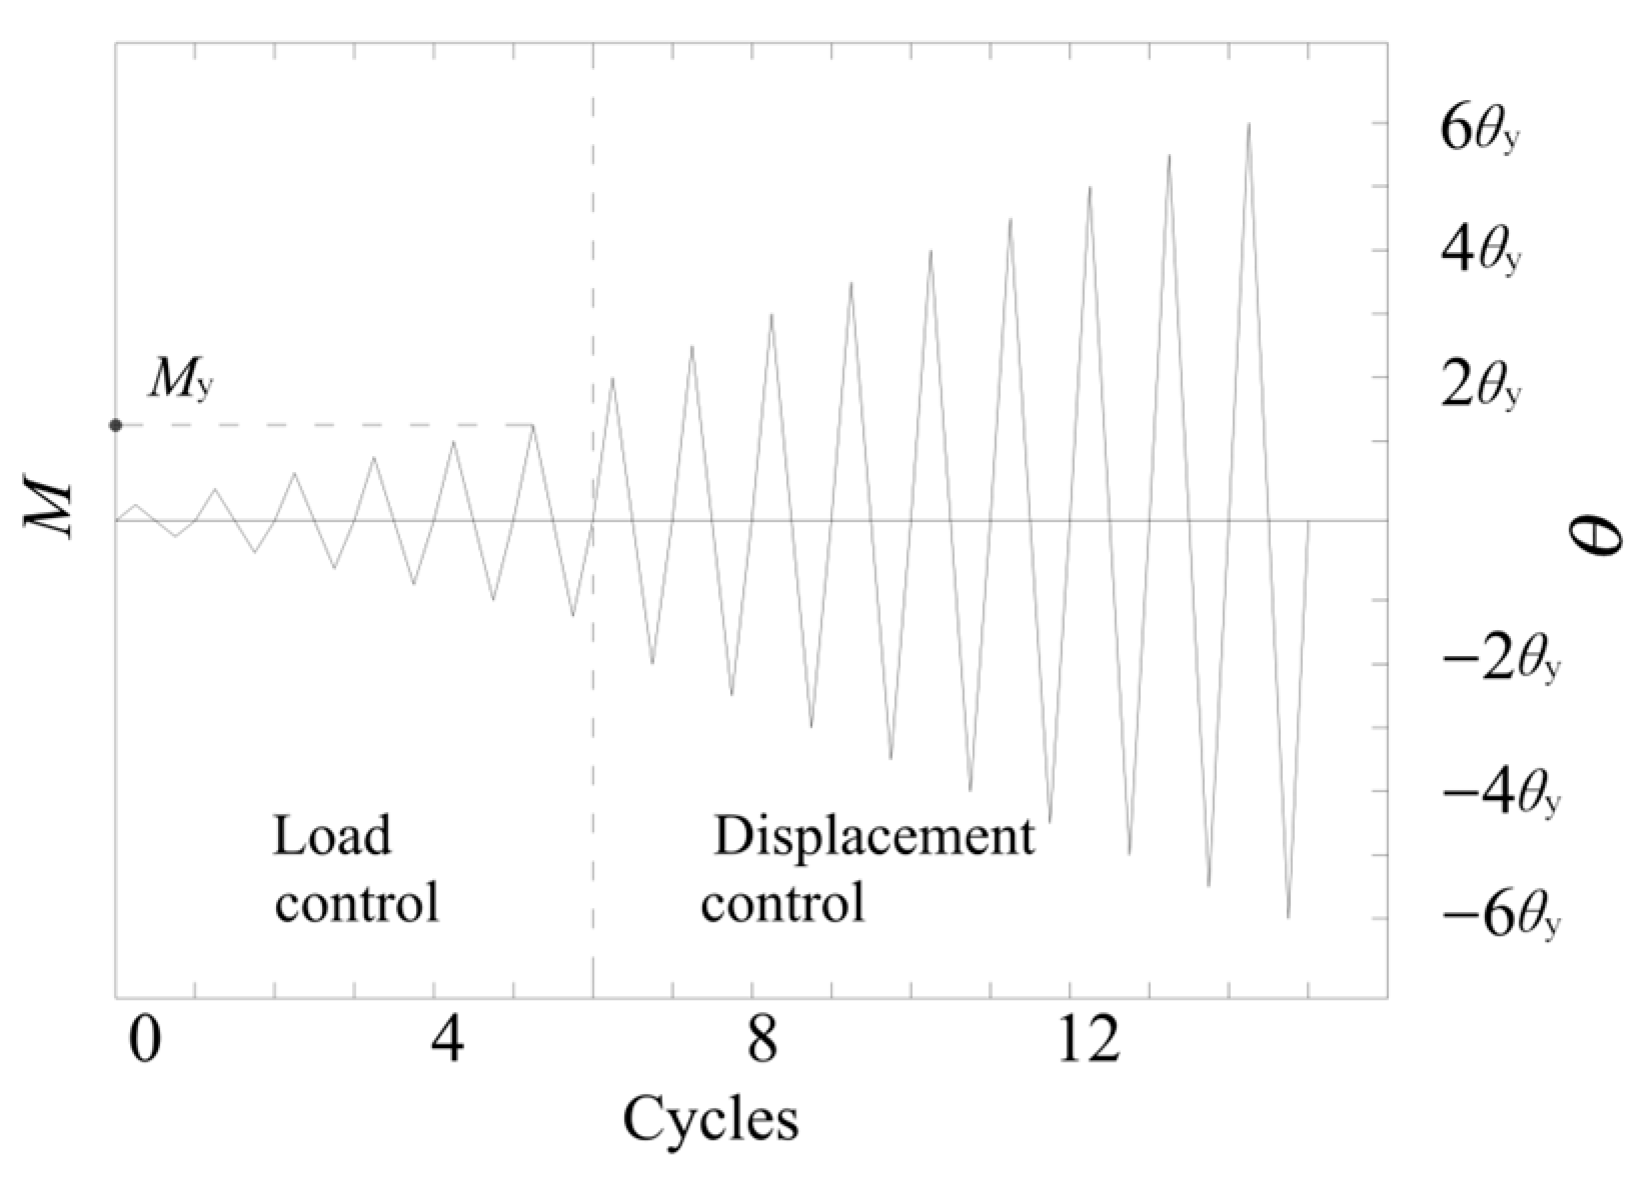
The loading procedure is illustrated in Figure 3. Before yielding, specimens were subjected to a graded load-controlled protocol. After reaching the yield moment (My), a graded rotation-controlled protocol based on the beam–column rotation (θ) was adopted. The yield rotation (θy) served as the reference deformation, with its integer multiples defining the loading increments. To avoid fatigue damage, each loading level was applied for only one cycle. The test was terminated when the applied load dropped to 85% of the peak load or excessive deformation occurred.

2.4. Data Collection

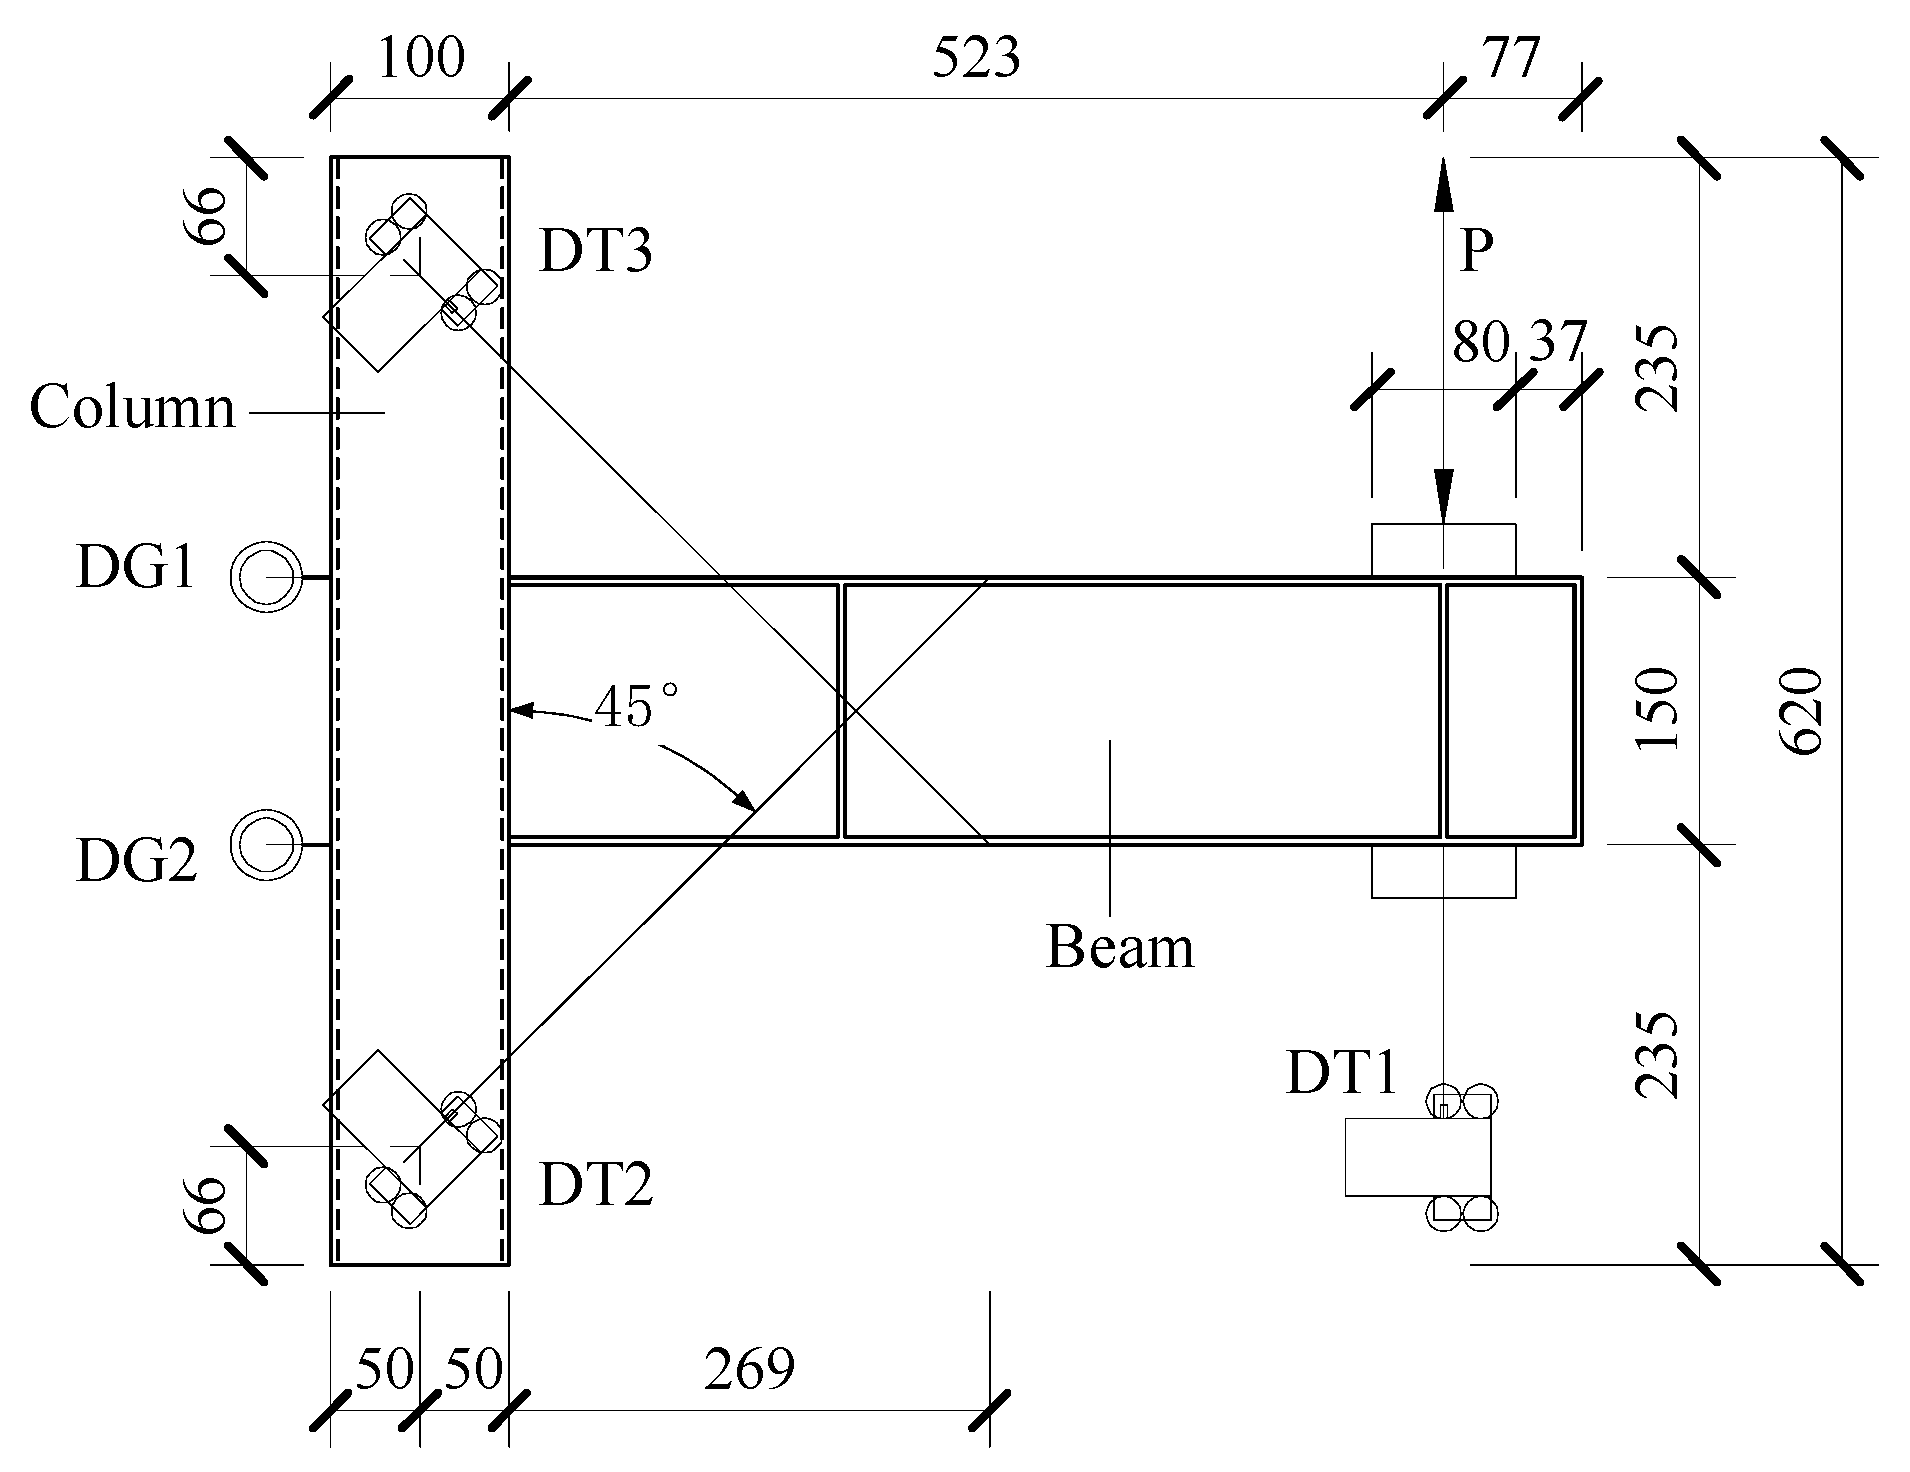
Figure 4 shows the arrangement of displacement transducers and dial gauges. Transducer #1 measured the vertical displacement at the beam end under loading, while transducers #2 and #3 captured the relative rotation between the beam and column. Dial gauges #1 and #2 were positioned on the column face opposite the beam, aligned with the beam’s upper and lower flanges, respectively, to record the overall rotation joint. A force sensor was installed above the beam end to monitor the applied vertical load P.
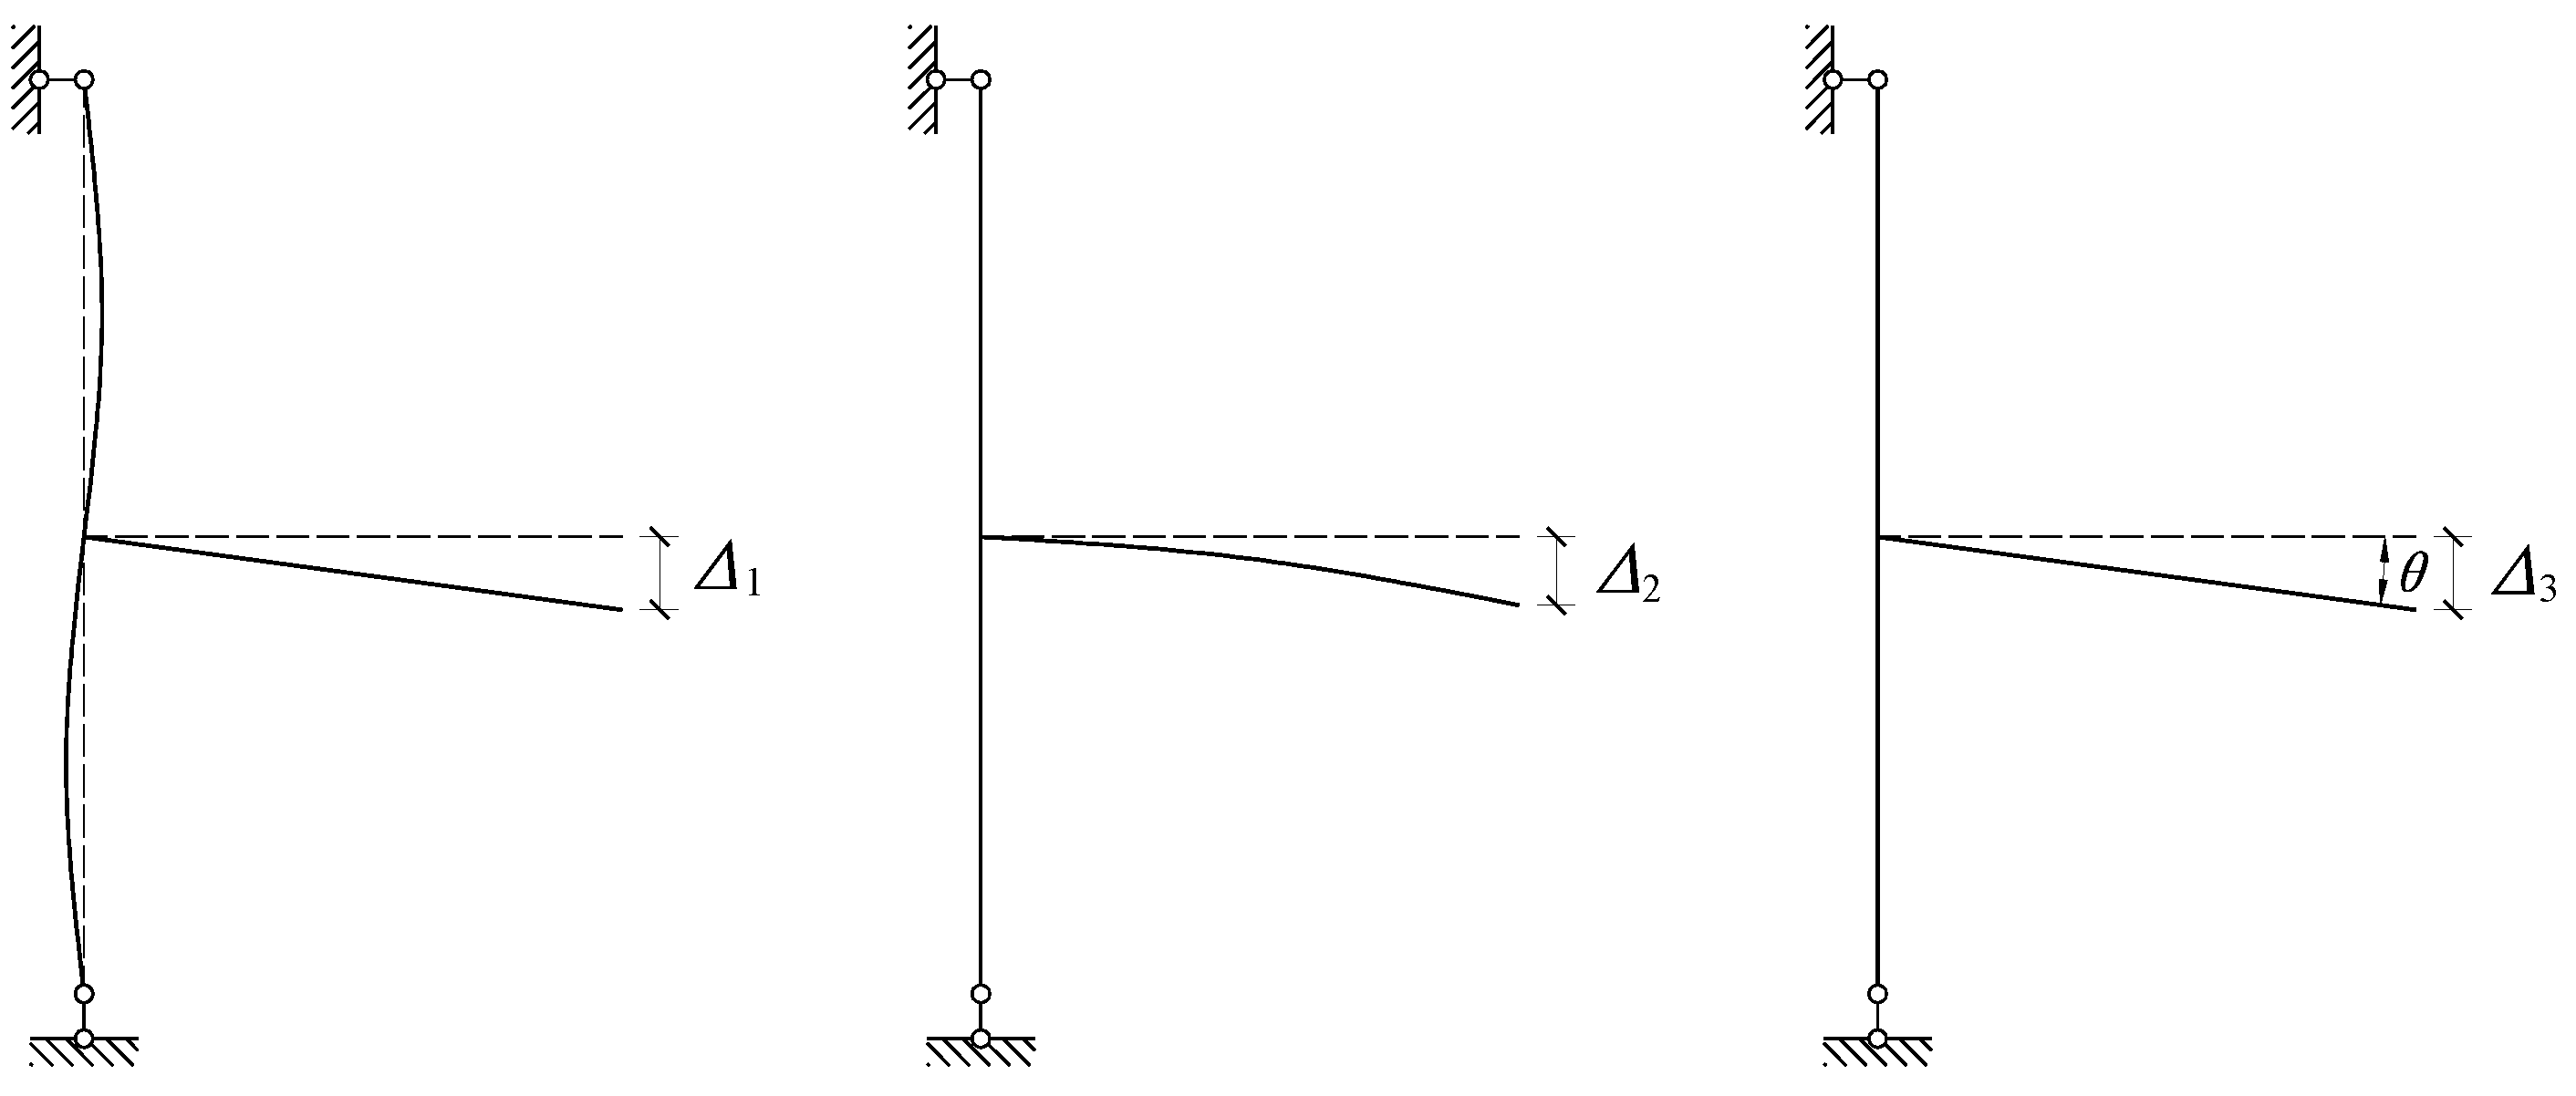
The horizontal distance L between the loading point and the column edge was 523 mm. Under a vertical concentrated load P applied at the beam end, the bending moment M at the beam–column joint was calculated as M = P × 523 mm. The vertical displacement Δ at the beam end, recorded by displacement transducer #1, represented the combined deformations of the specimen components at the beam end. These deformations consisted of three components (Figure 5):
(1) Vertical displacement of the beam end, ⊿1, caused by beam–column rotation (Equation (1)), where D1 and D2 were measured by dial gauges #1 and #2.
(2) Vertical displacement ⊿2 (Equation (2)) at the beam end due to beam bending under the applied load P, where E denotes the elastic modulus of the steel beam and Ib represents its moment of inertia about the horizontal centroidal axis.
(3) Vertical displacement ⊿3 at the beam end induced by the relative rotation between the beam and column under load P (Equation (3)):
1 = D 1 D 2 150 L
2 = P L 3 3 E I b
3 = 1 2
The relative rotation between the beam and column under the applied vertical load P was determined using Equation (4):
θ = 3 L

3. Results and Analysis

3.1. Failure Modes

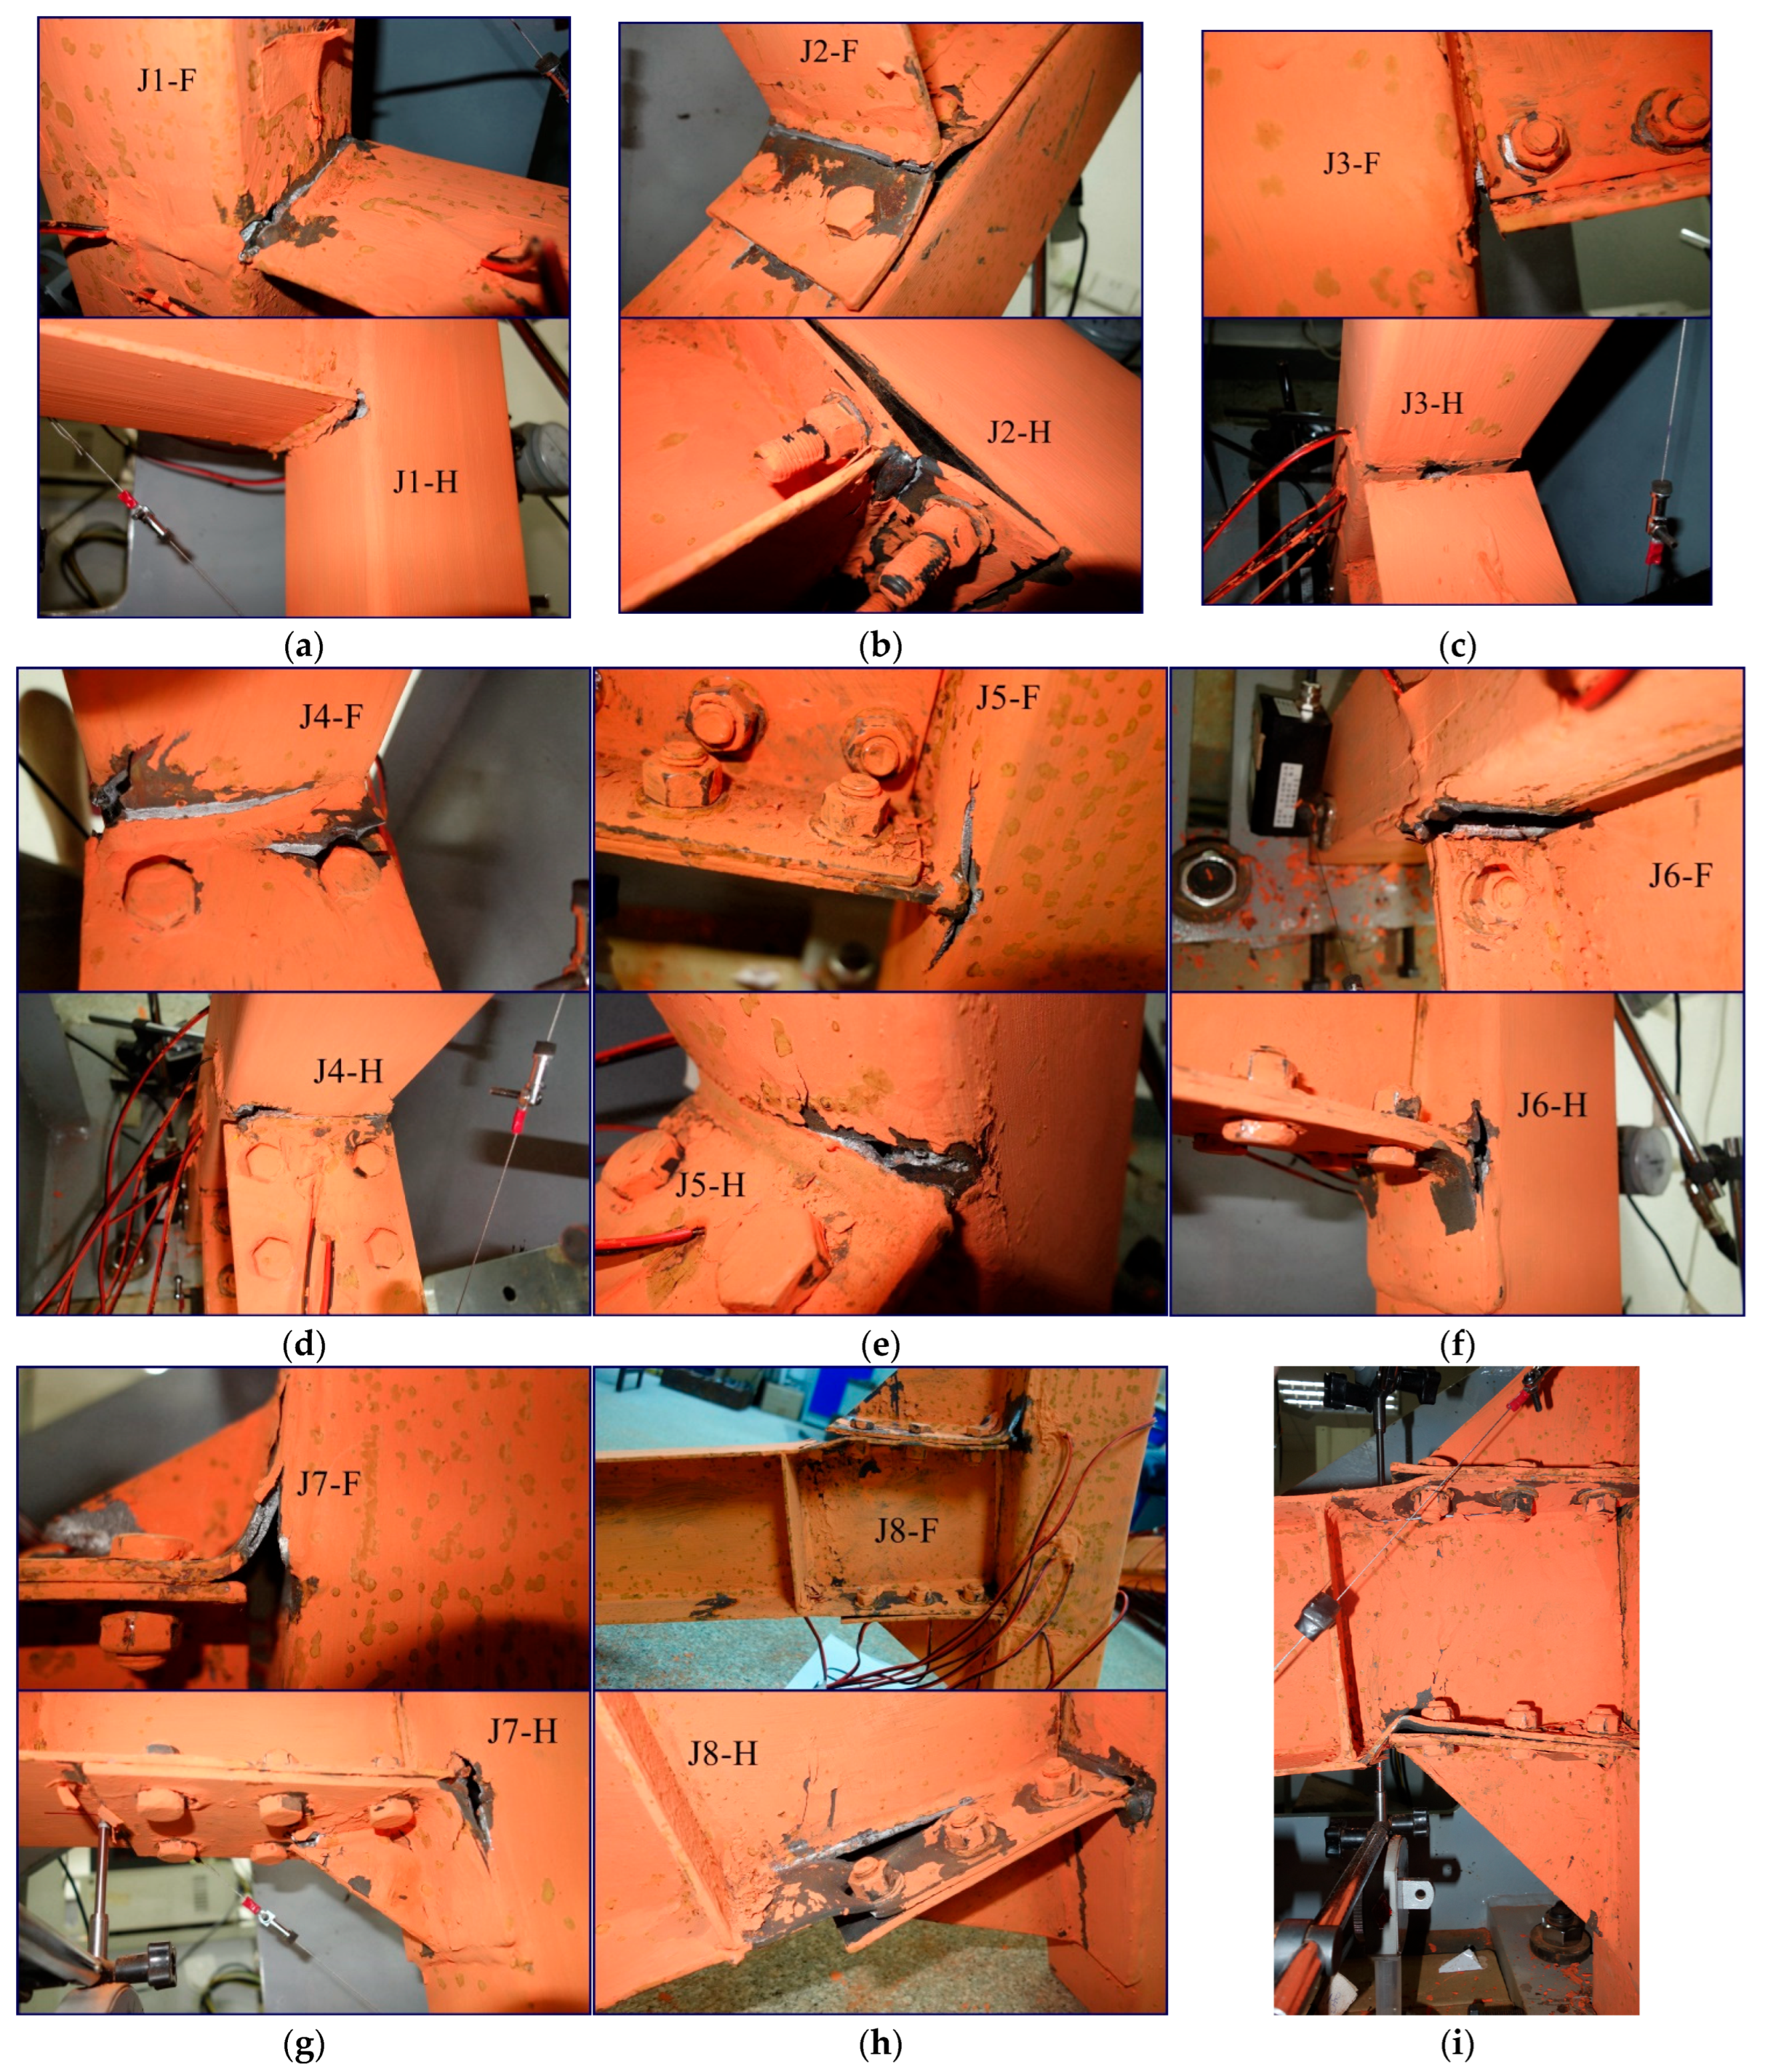
The failure modes of all specimens are shown in Figure 6, revealing notable differences in failure characteristics. Specimens with CFSST and HSST columns of identical configurations exhibited comparable failure behavior.
(1) J1-H and J1-F: With increasing load, cracks formed in the welds between the beam flange and column. These cracks gradually propagated, leading to the sudden failure of both specimens.
(2) J2-H and J2-F: The end plates P1 at the beam ends deformed under load, undergoing significant plastic bending before fracturing, which caused specimen failure.
(3) J3-H and J3-F: Loading-induced stress concentration on the outer side of the connecting plate P2, initiating cracks that propagated from the top and bottom toward the center. This progression resulted in deformation and rapid failure of the specimens.
(4) J4-H and J4-F: Failure occurred mainly in the weld zone between connecting plate P3 and the column. J4-H exhibited a weld fracture, while J4-F showed both a weld fracture and bolt-hole fractures.
(5) J5-H and J5-F: Failure in both specimens was located in the weld zone between connecting plate P4 and the column. In J5-F, cracks occurred in the column steel plate near the joint, whereas in J5-H, cracks appeared in the weld between the plate and the column. J5-F also exhibited brittle failure.
(6) J6-H and J6-F: In J6-F, a complete fracture occurred in the weld between the plate and column, while in J6-H, the weld was torn. The failure of J6-F also displayed brittle characteristics.
(7) J7-H and J7-F: Failure was concentrated in the weld zone between connecting plate P7 and the column, although with smaller crack sizes compared to J6-H and J6-F. Additional cracking occurred at the weld ends connecting the triangular stiffeners to the angle connector plates.
(8) J8-H and J8-F: Cracks of varying severity developed in the welds between connecting plate P8 and the column; however, these were not the primary cause of strength reduction. Both specimens exhibited beam bending outside the region of the connecting plate (Figure 6h). In J8-H, a severe fracture occurred at the bolt hole connecting the beam’s lower flange to plate P8. This indicated that the joint’s bending capacity exceeded that of the beam, consistent with the design principle of “strong joint, weak member” (Figure 6i).

3.2. Hysteresis Curve

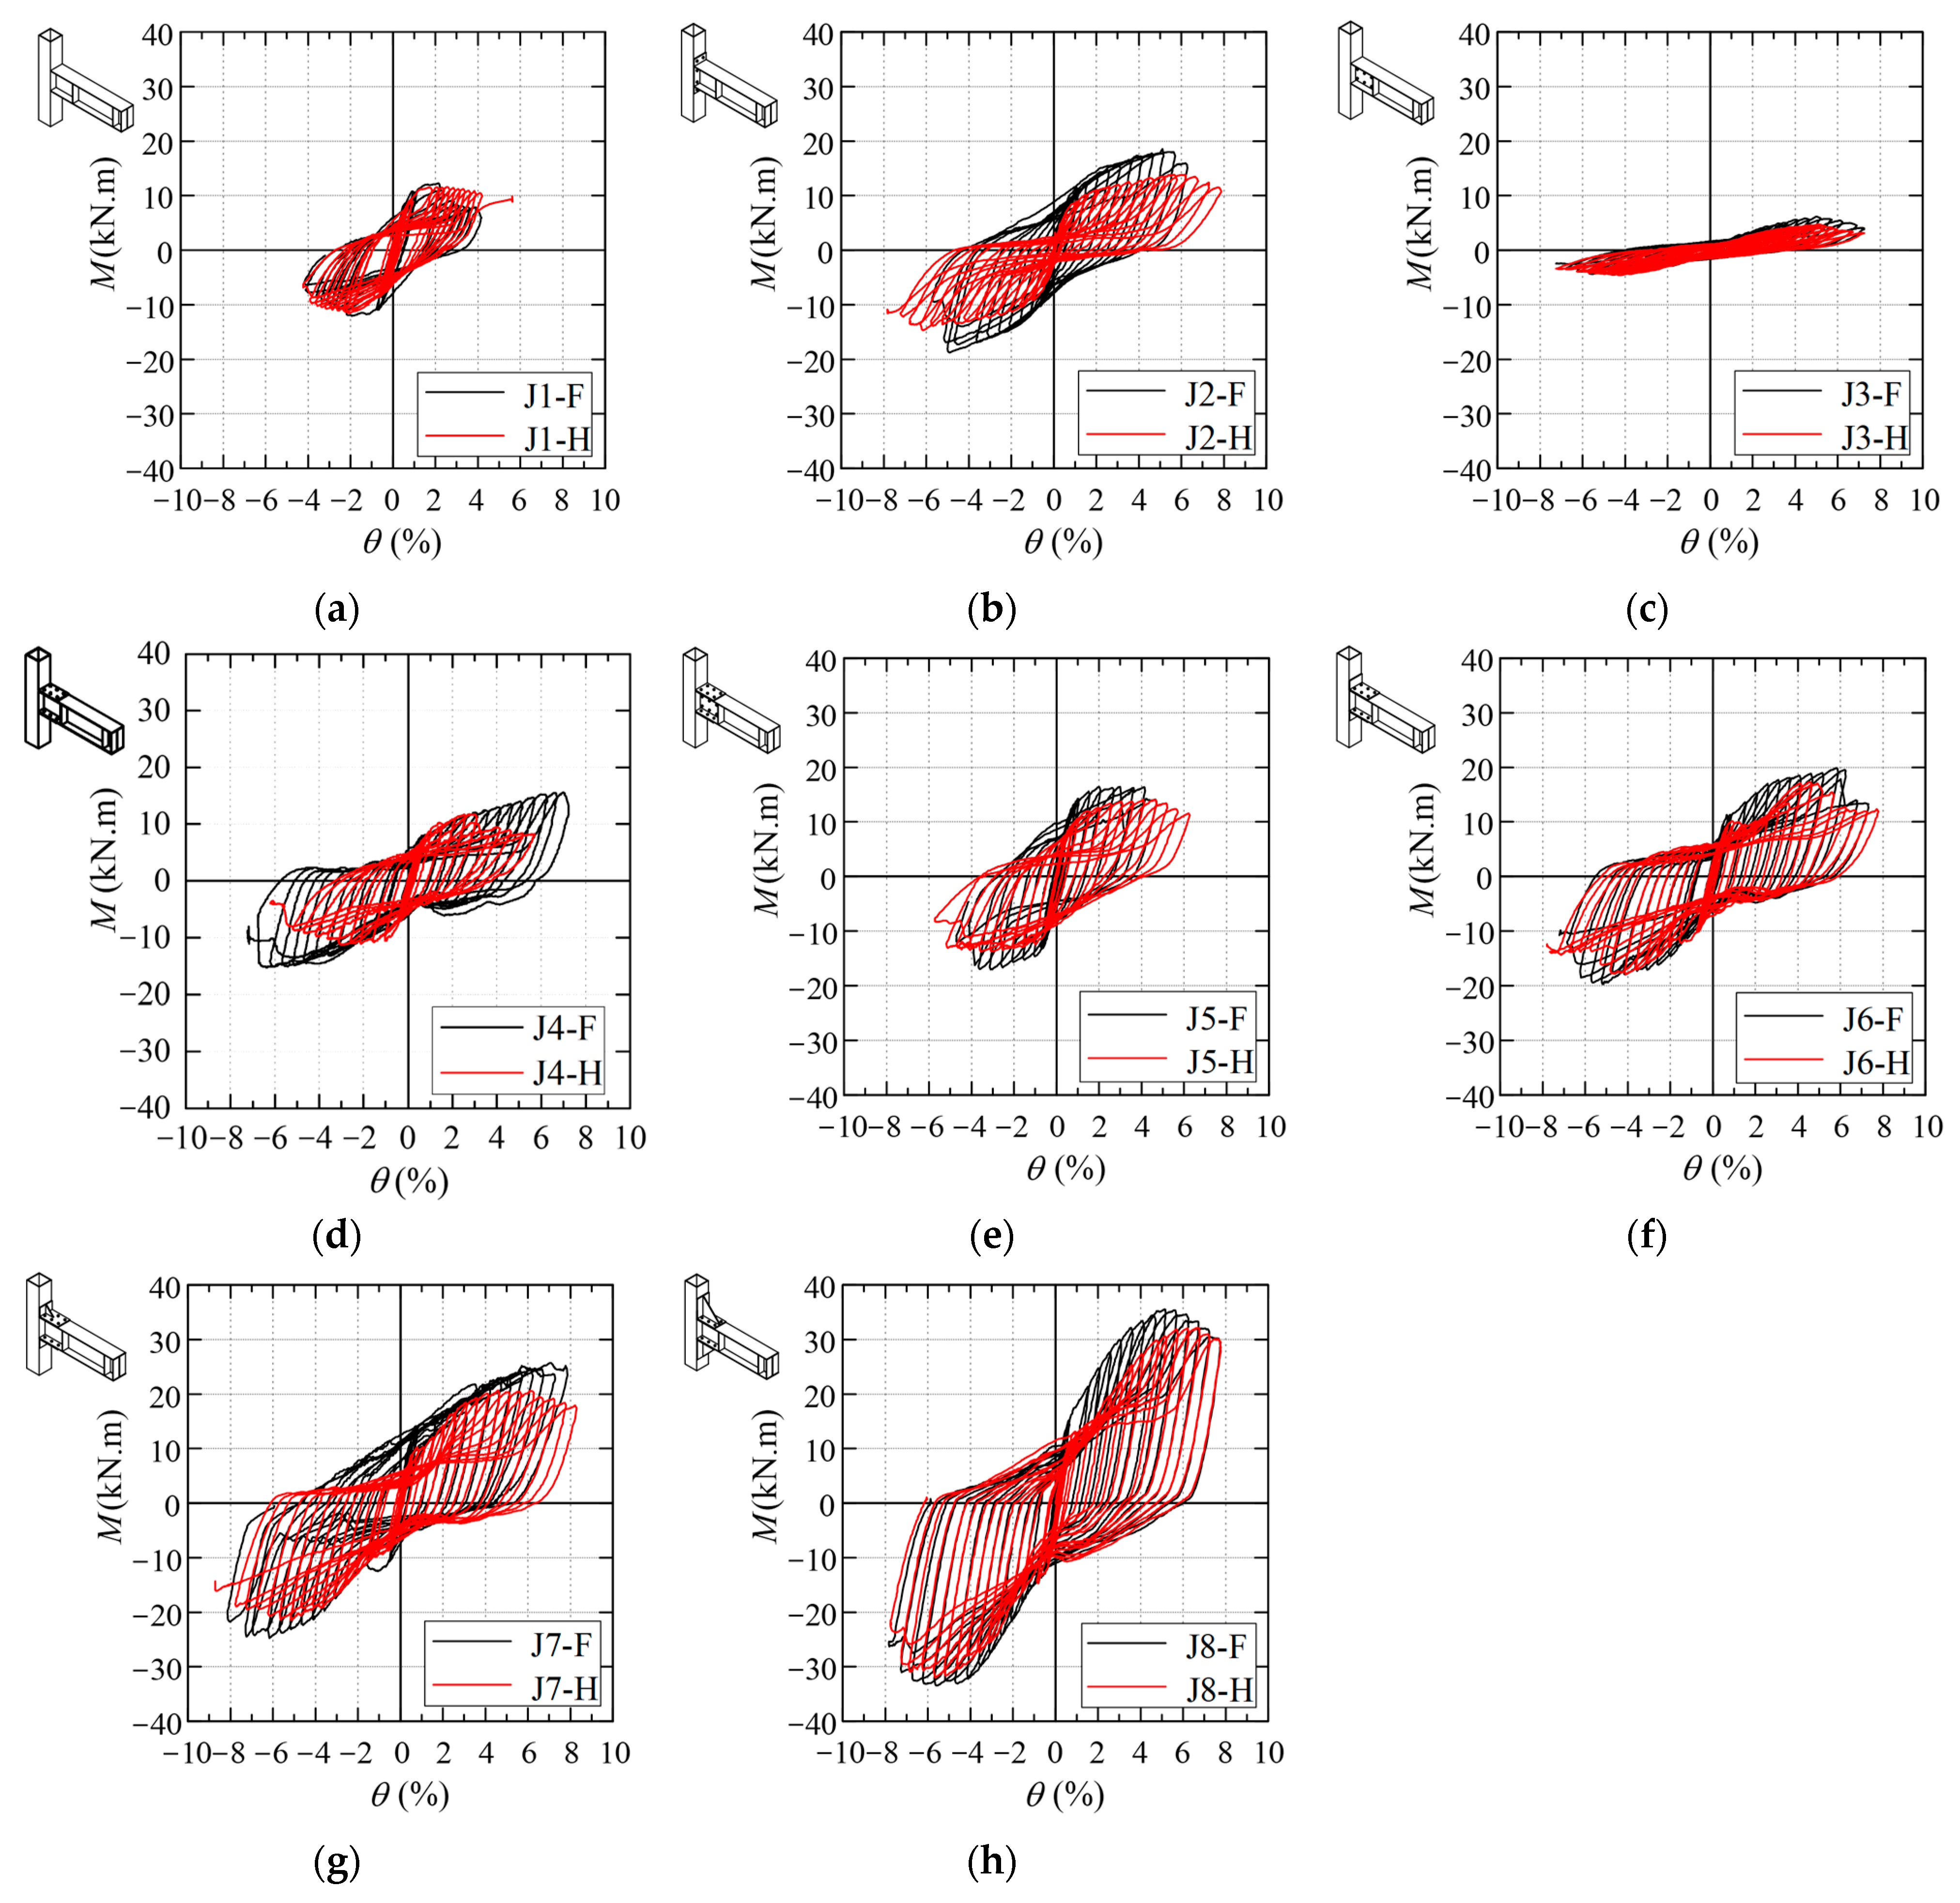
The bending moment (M)–rotation (θ) hysteresis curves of all specimens are presented in Figure 7. The results show that:
(1) During loading, all specimens progressed through the elastic, elastoplastic, and failure stages. In the elastic stage, the hysteresis loops were nearly spindle-shaped, with negligible difference between the loading and unloading paths. In the elastoplastic stage, certain regions of the steel within the joint area yielded, as a result, distinct moment-rotation data were recorded during loading and unloading cycles, leading to hysteretic loops that exhibited distinct pinching. Furthermore, owing to differences in the geometry and failure modes of the specimens, their hysteretic loops demonstrated considerable variations in the failure stage.
(2) J1-F and J1-H: Both specimens exhibited plump hysteresis curves but relatively low bearing capacities compared with the others. Their peak bending moments were similar; however, J1-F experienced a rapid capacity drop after reaching its peak, while J1-H maintained its peak capacity for several cycles before failure. This difference was attributed to the concrete infill in J1-F, which restricted concave deformation of the steel tube and accelerated crack propagation.
(3) J2-F: The bearing capacity was considerably higher than that of J2-H, with smaller joint rotation and fuller hysteresis curves. This demonstrated that concrete infill effectively restrained steel tube deformation, thereby increasing initial stiffness, enhancing peak bending moment, and improving energy dissipation capacity.
(4) Specimens J3-F and J3-H, where the beam was connected to the column only through the web, exhibited very low bearing capacity (Figure 7c–e). When the beam flange was connected via plate P3 (J4-F and J4-H), the bearing capacity increased significantly, and the hysteresis curves became fuller. With both the web and flange connected (J5-F and J5-H), the bearing capacity reached a level comparable to that of the end-plate joint, accompanied by reduced deformation and well-developed hysteresis behavior.
(5) Joints with angle connector plates exhibited superior performance in peak bending moment and hysteresis plumpness level (Figure 7f–h). Compared with J5-F and J5-H, specimens J6-F and J6-H achieved higher bearing capacity while reducing SQC by 11.4%. For this joint type, increasing the height of the triangular stiffener further enhanced bending capacity, stabilized hysteresis behavior, and improved seismic performance.

3.3. Skeleton Curves and Feature Points

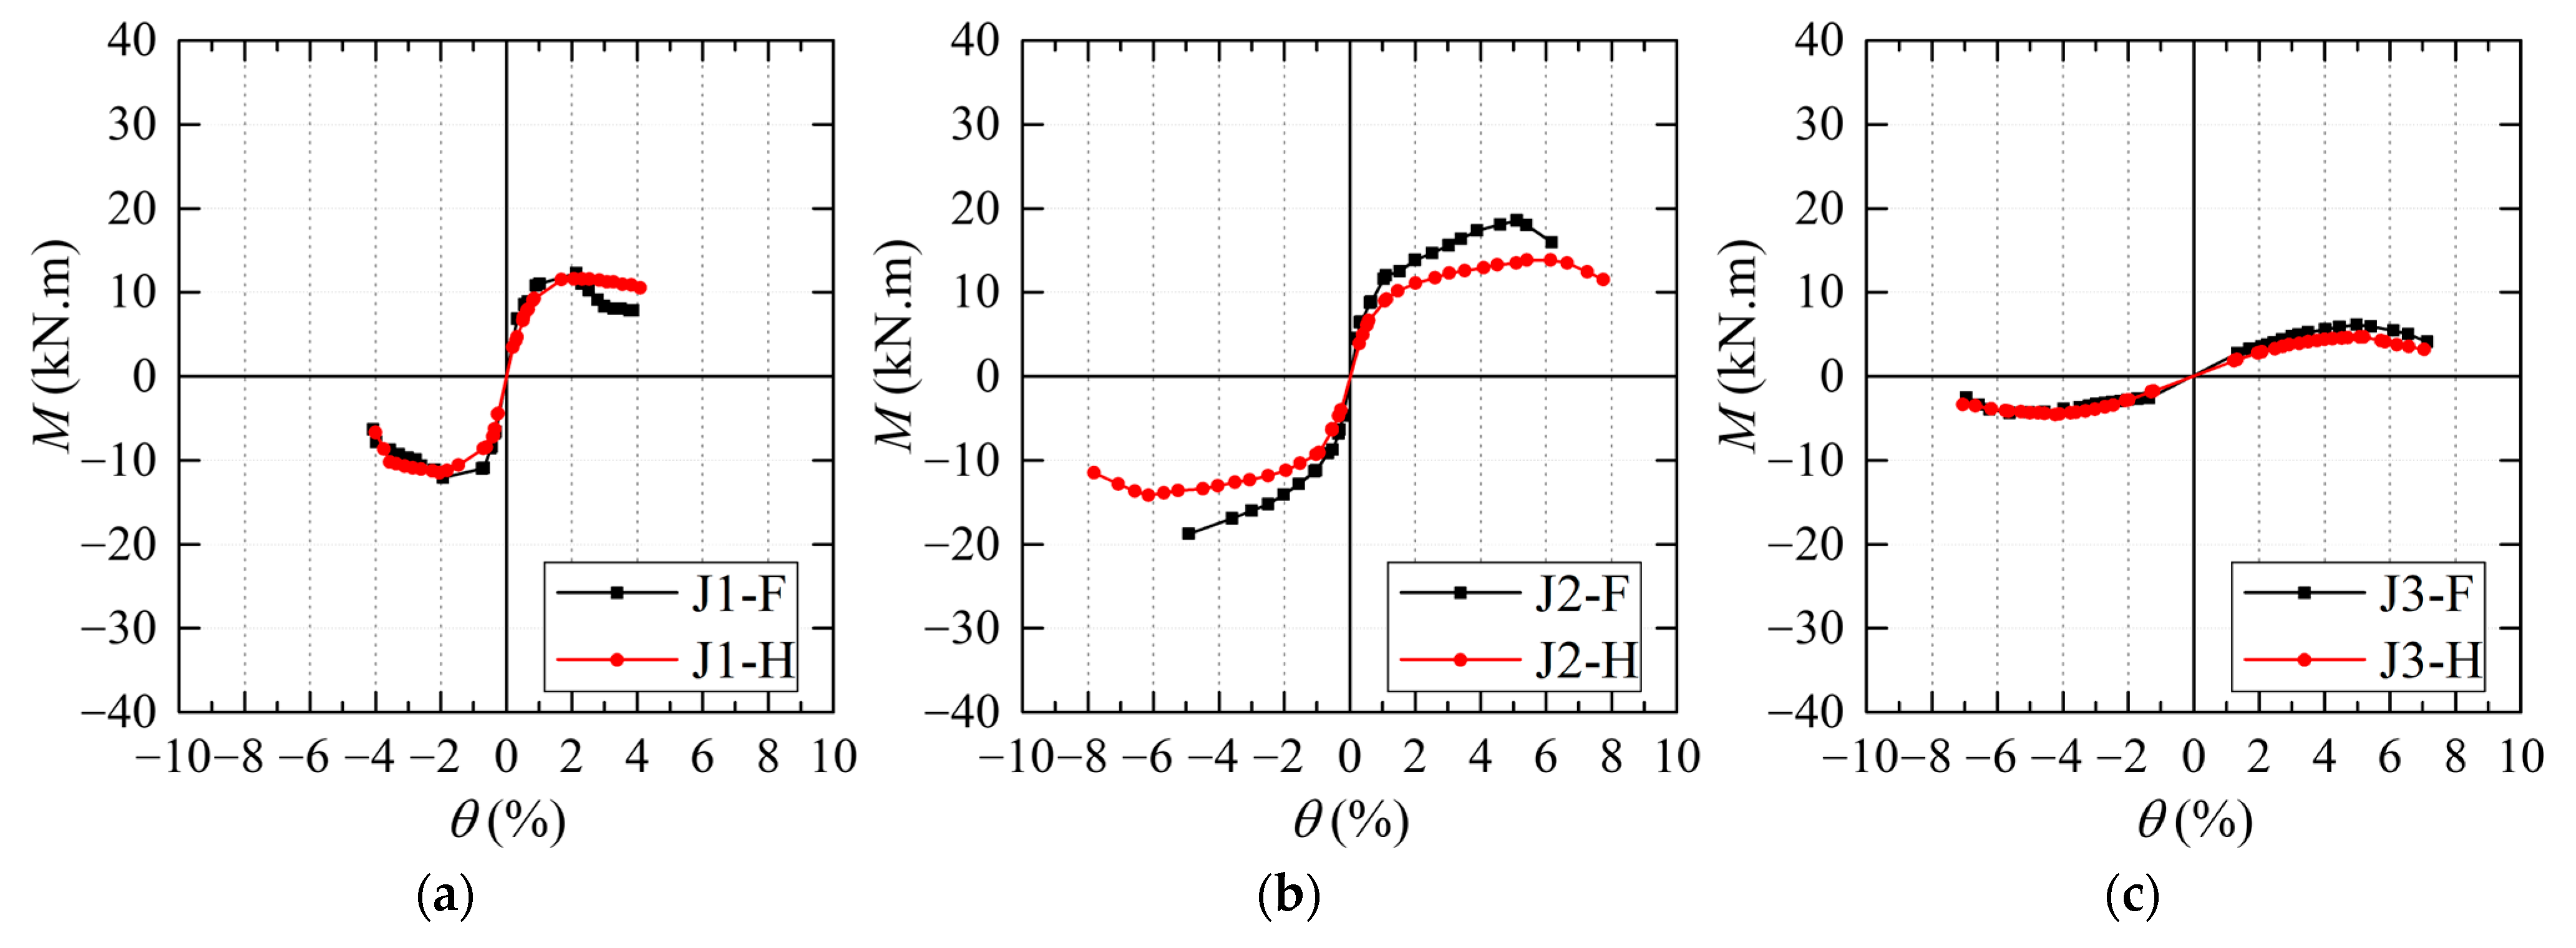
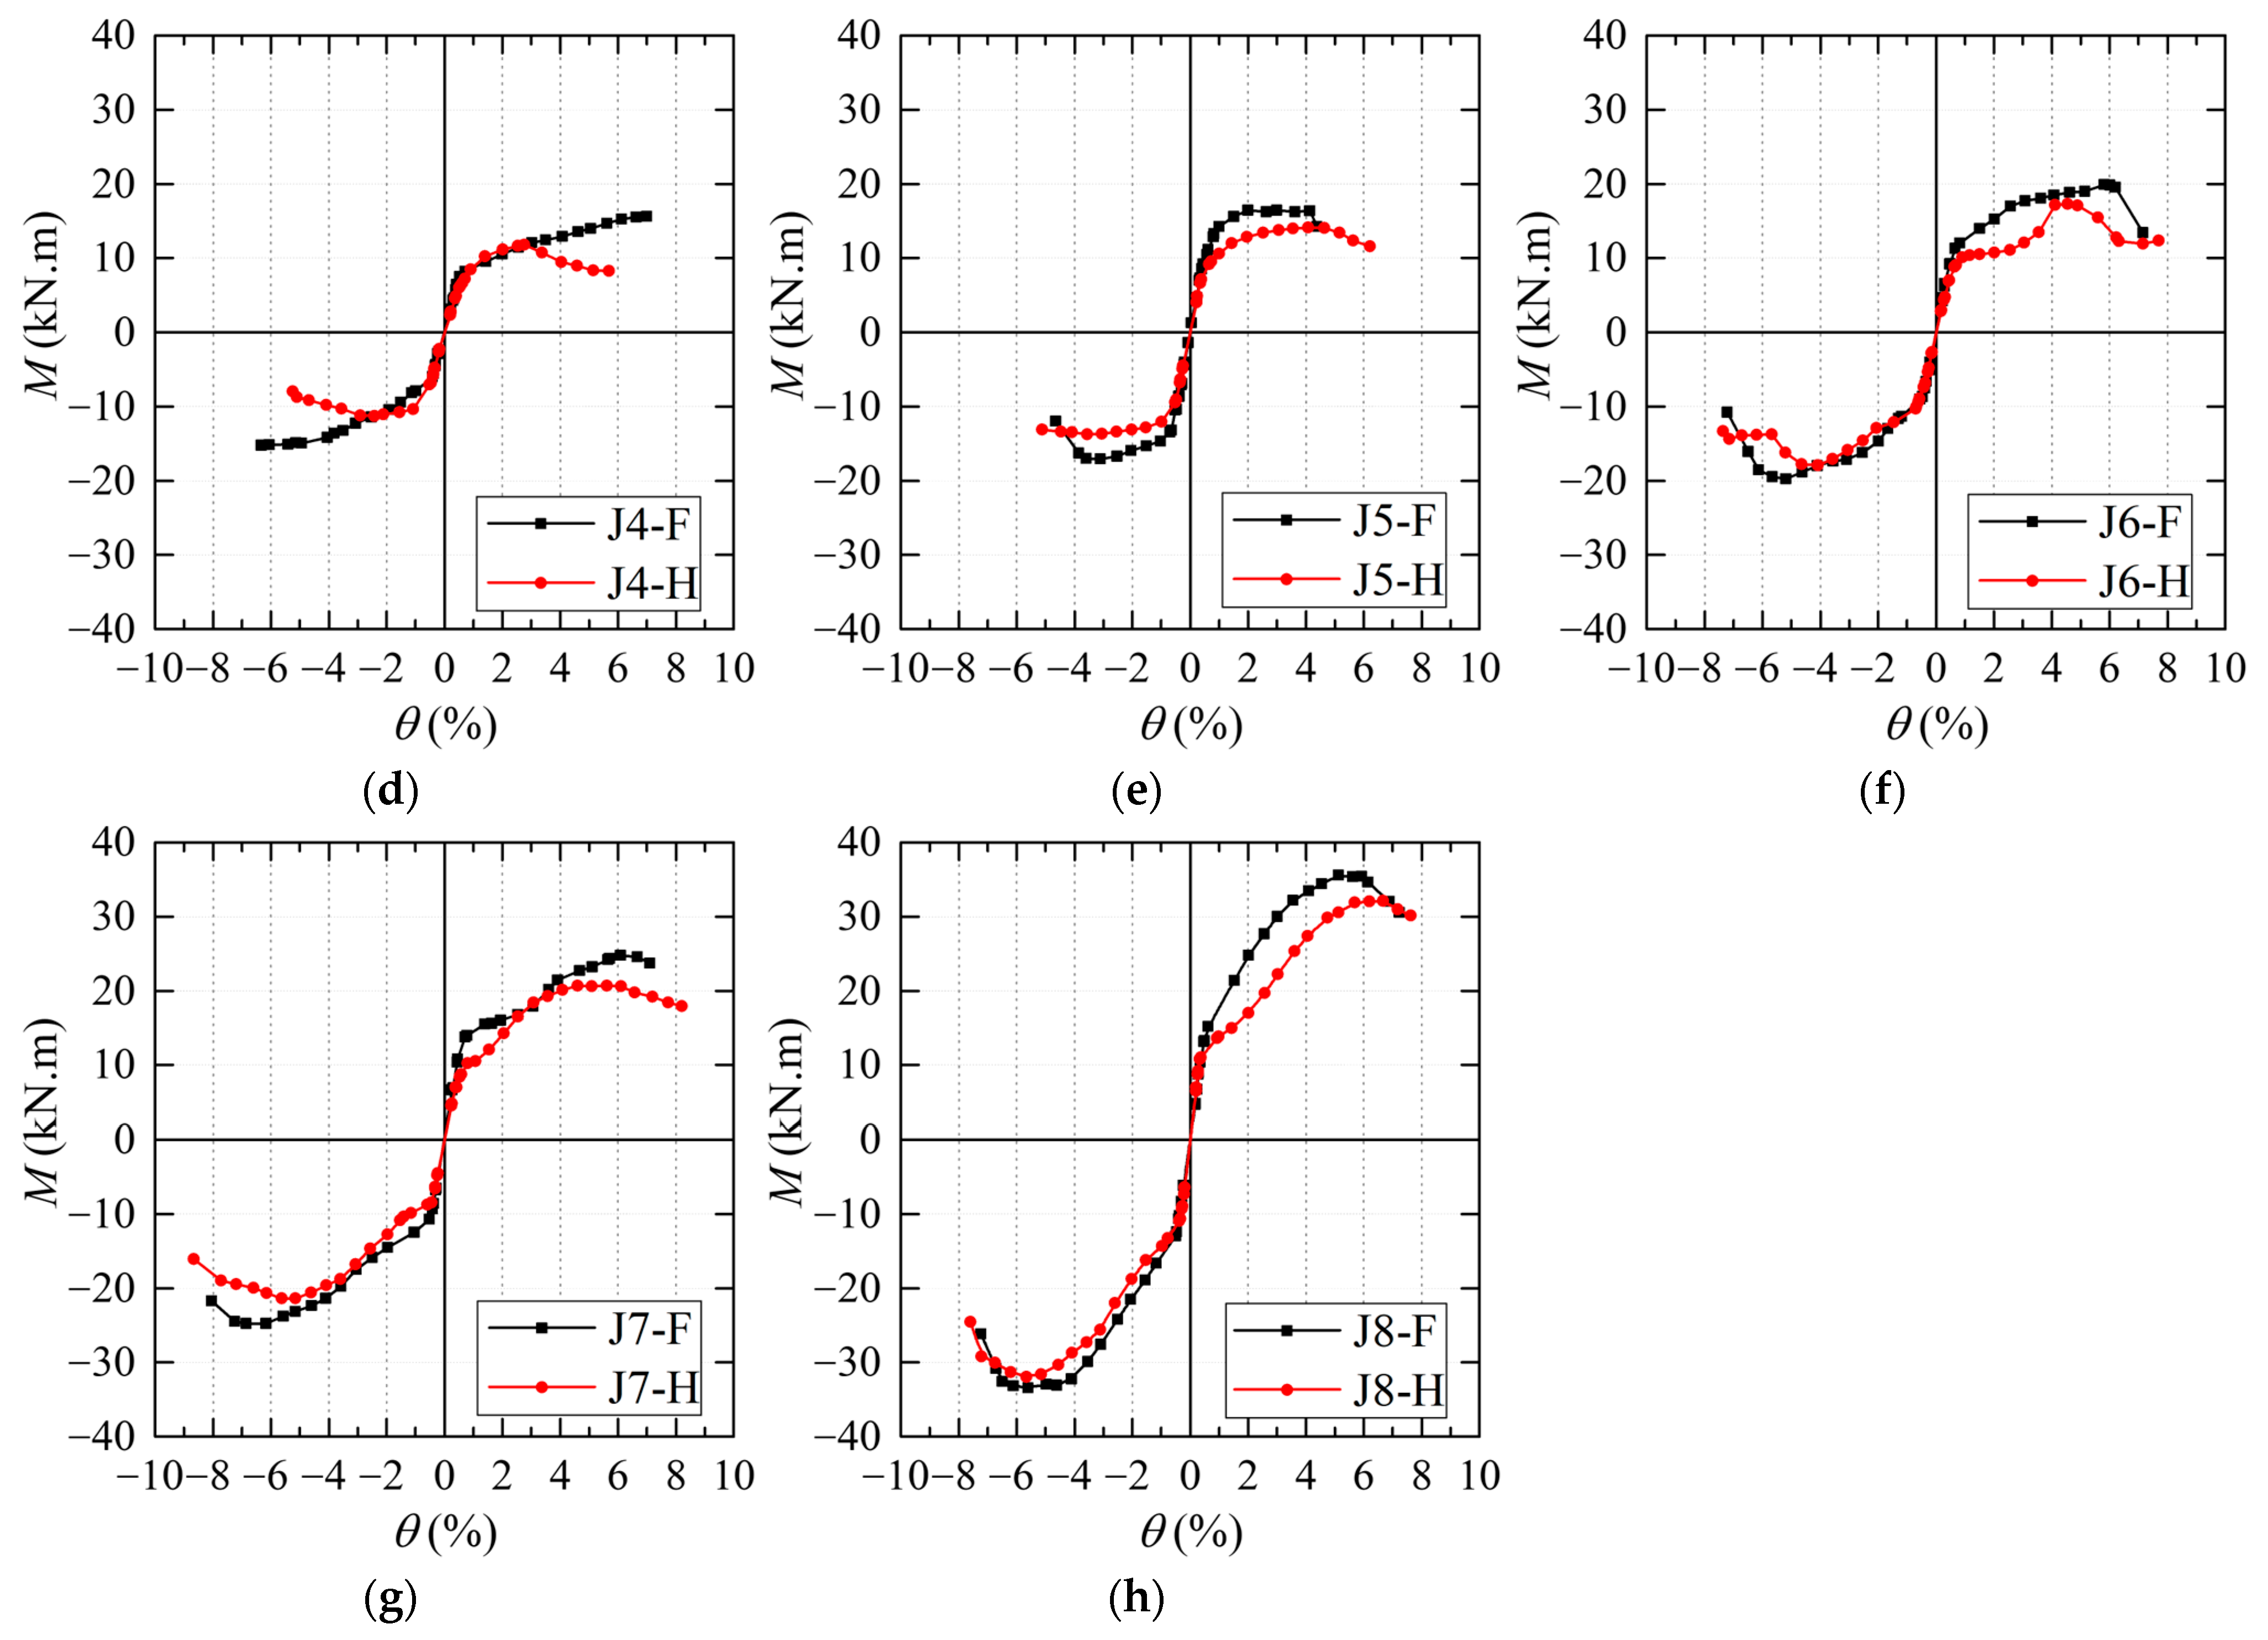
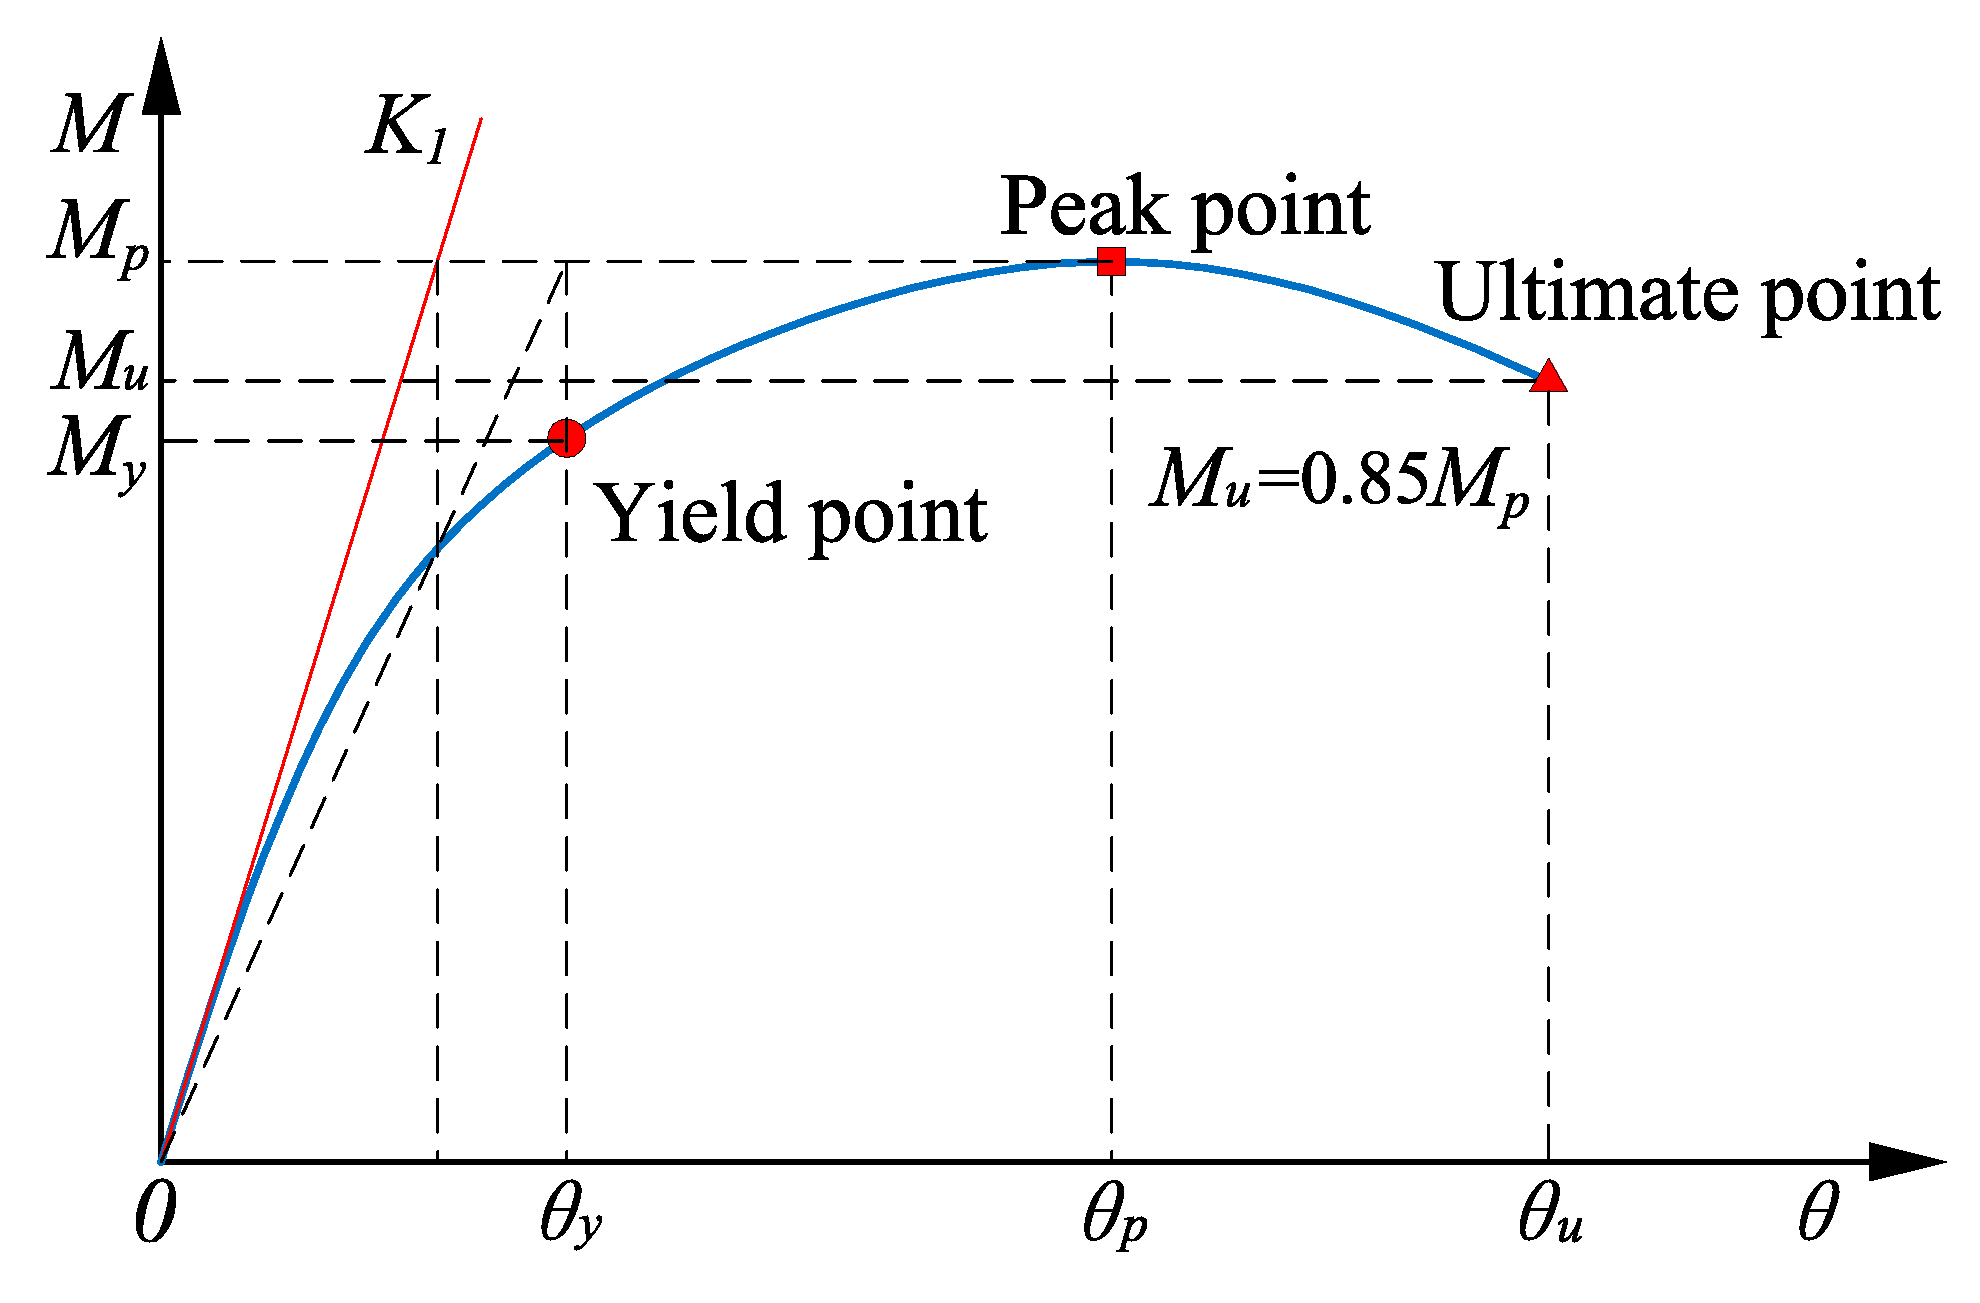
The skeleton curve of each specimen was obtained by connecting the peak points of each loading level in the same direction on the hysteresis curve. The bending moment (M)–rotation (θ) skeleton curves are presented in Figure 8, and the corresponding hysteretic performance indicators are listed in Table 3 where My, Mp, and Mu represent the yielding, peak, and ultimate moments, respectively, while θy, θp, and θu denote the corresponding rotations. The characteristic points of the skeleton curves were determined using the yield moment method, as illustrated in Figure 9. From Figure 8, it can be observed that:
μ = θ u θ y
(1) The skeleton curves of all specimens exhibited an “S” shape with three distinct stages: elastic, elastoplastic, and plastic. Under forward and reverse loading, the curves were not symmetrical, mainly due to random effects, such as fabrication tolerances and residual welding stresses.
(2) In the initial loading stage, the bending moments of two specimen groups showed minimal differences. At later stages, however, the load capacity of the second group were significantly higher than that of the first group, suggesting that deformation of the HSST columns in the first group had begun. In the plastic stage, specimens with concrete-filled columns developed higher bending moments than their hollow counterparts, but the ultimate bending moments of each pair remained similar. This implies that ultimate failure was governed by steel yielding. Although concrete infill reduced column deformation, it did not fundamentally change the joint’s failure mode.
(3) A comparison of Figure 8a,b shows that beam end-plate joints achieved higher peak bending moments than welded joints and exhibited a distinct plastic deformation stage, demonstrating superior ductility.
(4) When the column was connected only through the beam web (J3-F and J3-H), the peak bending moments were only 6.15 and 4.67 kN·m, respectively (Figure 8c–e). With the beam flange connected to plate P3 (J4-F and J4-H), the peak bending moments increased to 14.69 and 11.78 kN·m, accompanied by a steeper elastic phase slope, indicating greater bending stiffness. When both the web and flange were connected (J5-F and J5-H), the peak bending moments further increased to 17.07 and 14.09 kN·m, while the yielding moments rose by 20.20% and 26.09% compared with J4-F and J4-H, respectively. Therefore, J3-F and J3-H are unsuitable for moment-resisting frames, whereas J5-F and J5-H, with higher initial stiffness and peak bending moments, are more suitable for engineering applications.
(5) The six specimens exhibited similar slopes in the initial loading stage, but their behaviors diverged as loading progressed (Figure 8f–h). For J7-H, the reduction in bearing capacity was primarily caused by weld failure between the column and the angle connector plate, which was clearly reflected in its skeleton curve. In J7-F, the capacity decreased due to two factors: weld failure between the column and the angle connector plate, and weld failure at the end of the triangular stiffener. These failures produced a less smooth skeleton curve with multiple inflection points. Similar behavior was also observed in J6-F and J6-H.
Compared with J6-F and J6-H, the addition of 64 mm-high triangular stiffeners in J7-F and J7-H increased the peak bending moments by 24.51% and 19.20%, respectively. When the stiffener height was further increased to 144 mm in J8-F and J8-H, the peak bending moments rose by 78.65% and 79.30% relative to J6-F and J6-H. These results demonstrate that triangular stiffener height is a key parameter affecting seismic performance. For practical engineering applications, triangular stiffeners should be designed with adequate height to ensure the required load-bearing capacity while remaining within the limits imposed by floor slab thickness.
(6) The average ultimate drift ratio, θu, of the specimens with angle connector plates was 1/14. This value is substantially greater than the elasto-plastic inter-story drift limit of 1/50 specified by the code [40] to prevent collapse. The fact that structures with these connections possess considerable deformation capacity beyond the code’s collapse prevention limit demonstrates their excellent seismic resilience.

3.4. Stiffness Degradation

The secant stiffness Ki of a specimen in a given loading cycle was calculated using Equation (6), where M i + and M i denote the peak bending moments in the positive and negative directions in the i-th loading cycle, θ i + and θ i represent the corresponding rotations. The relationship between secant stiffness K and the joint rotation θ is presented in Figure 10. The comparisons of stiffness in the early loading phase for two groups of specimens were listed in Table 4 where K1 denote Ki of the first loading cycle, Ka denote the rotational secant stiffness of each specimen at θ = 0.5, respectively, obtained by linear interpolation. The results indicate that:
K i = M i + + M i θ i + + θ i
(1) The initial rotational stiffness of the welded joint specimen J1-F was 23.23% higher than that of J1-H, whereas the initial rotational stiffness of the end-plate joint specimen J2-F was 51.28% higher than that of J2-H (Figure 10a, Table 4). These results indicate that, under identical configurations and dimensions, CFSST column–H-beam joint specimens provide significantly higher initial rotational stiffness than HSST column–H-beam joint specimens, with the improvement magnitude depending on the joint type. By contrast, the initial rotational stiffness of welded and end-plate joints was generally comparable.
(2) The rotational stiffness of web-connected joint specimens (i.e., J3-F and J3-H) was significantly lower than that of the other specimens (Figure 10b, Table 4). The initial rotational stiffness of J5-F was 23.49% higher than that of J4-F, while that of J5-H was 50.58% higher than that of J4-H. However, when θ exceeded 2%, the rotational stiffness of all four specimens converged to similar values. This indicates that incorporating a web connection into a flange-connected joint considerably enhances initial rotational stiffness but has little influence on stiffness at later deformation stages.
(3) The initial rotational stiffness of J6-F was 22.39% higher than that of J6-H, while J7-F exhibited a 24.82% higher value than J7-H. By contrast, the initial rotational stiffness of J8-F was nearly identical to that of J8-H. This indicates that for beam–column joints where the primary failure occurs at the beam end, an increase in column stiffness only leads to a marginal improvement in the joint’s rotational stiffness.
(4) As shown in Figure 10, when θ < 2.5%, the specimens showed rapid stiffness degradation, whereas for θ > 2.5%, the degradation became gradual. The degradation of stiffness during the early loading phase is attributed to several factors: the deformation of steel plates, the development of micro-cracks induced by stress concentration, and the slip of shear connectors. As the load continued to increase, the cracked portions ceased to carry load, leading to stress redistribution. This effect, combined with the material hardening of the steel plates, resulted in a slower degradation of stiffness.

3.5. Energy Dissipation

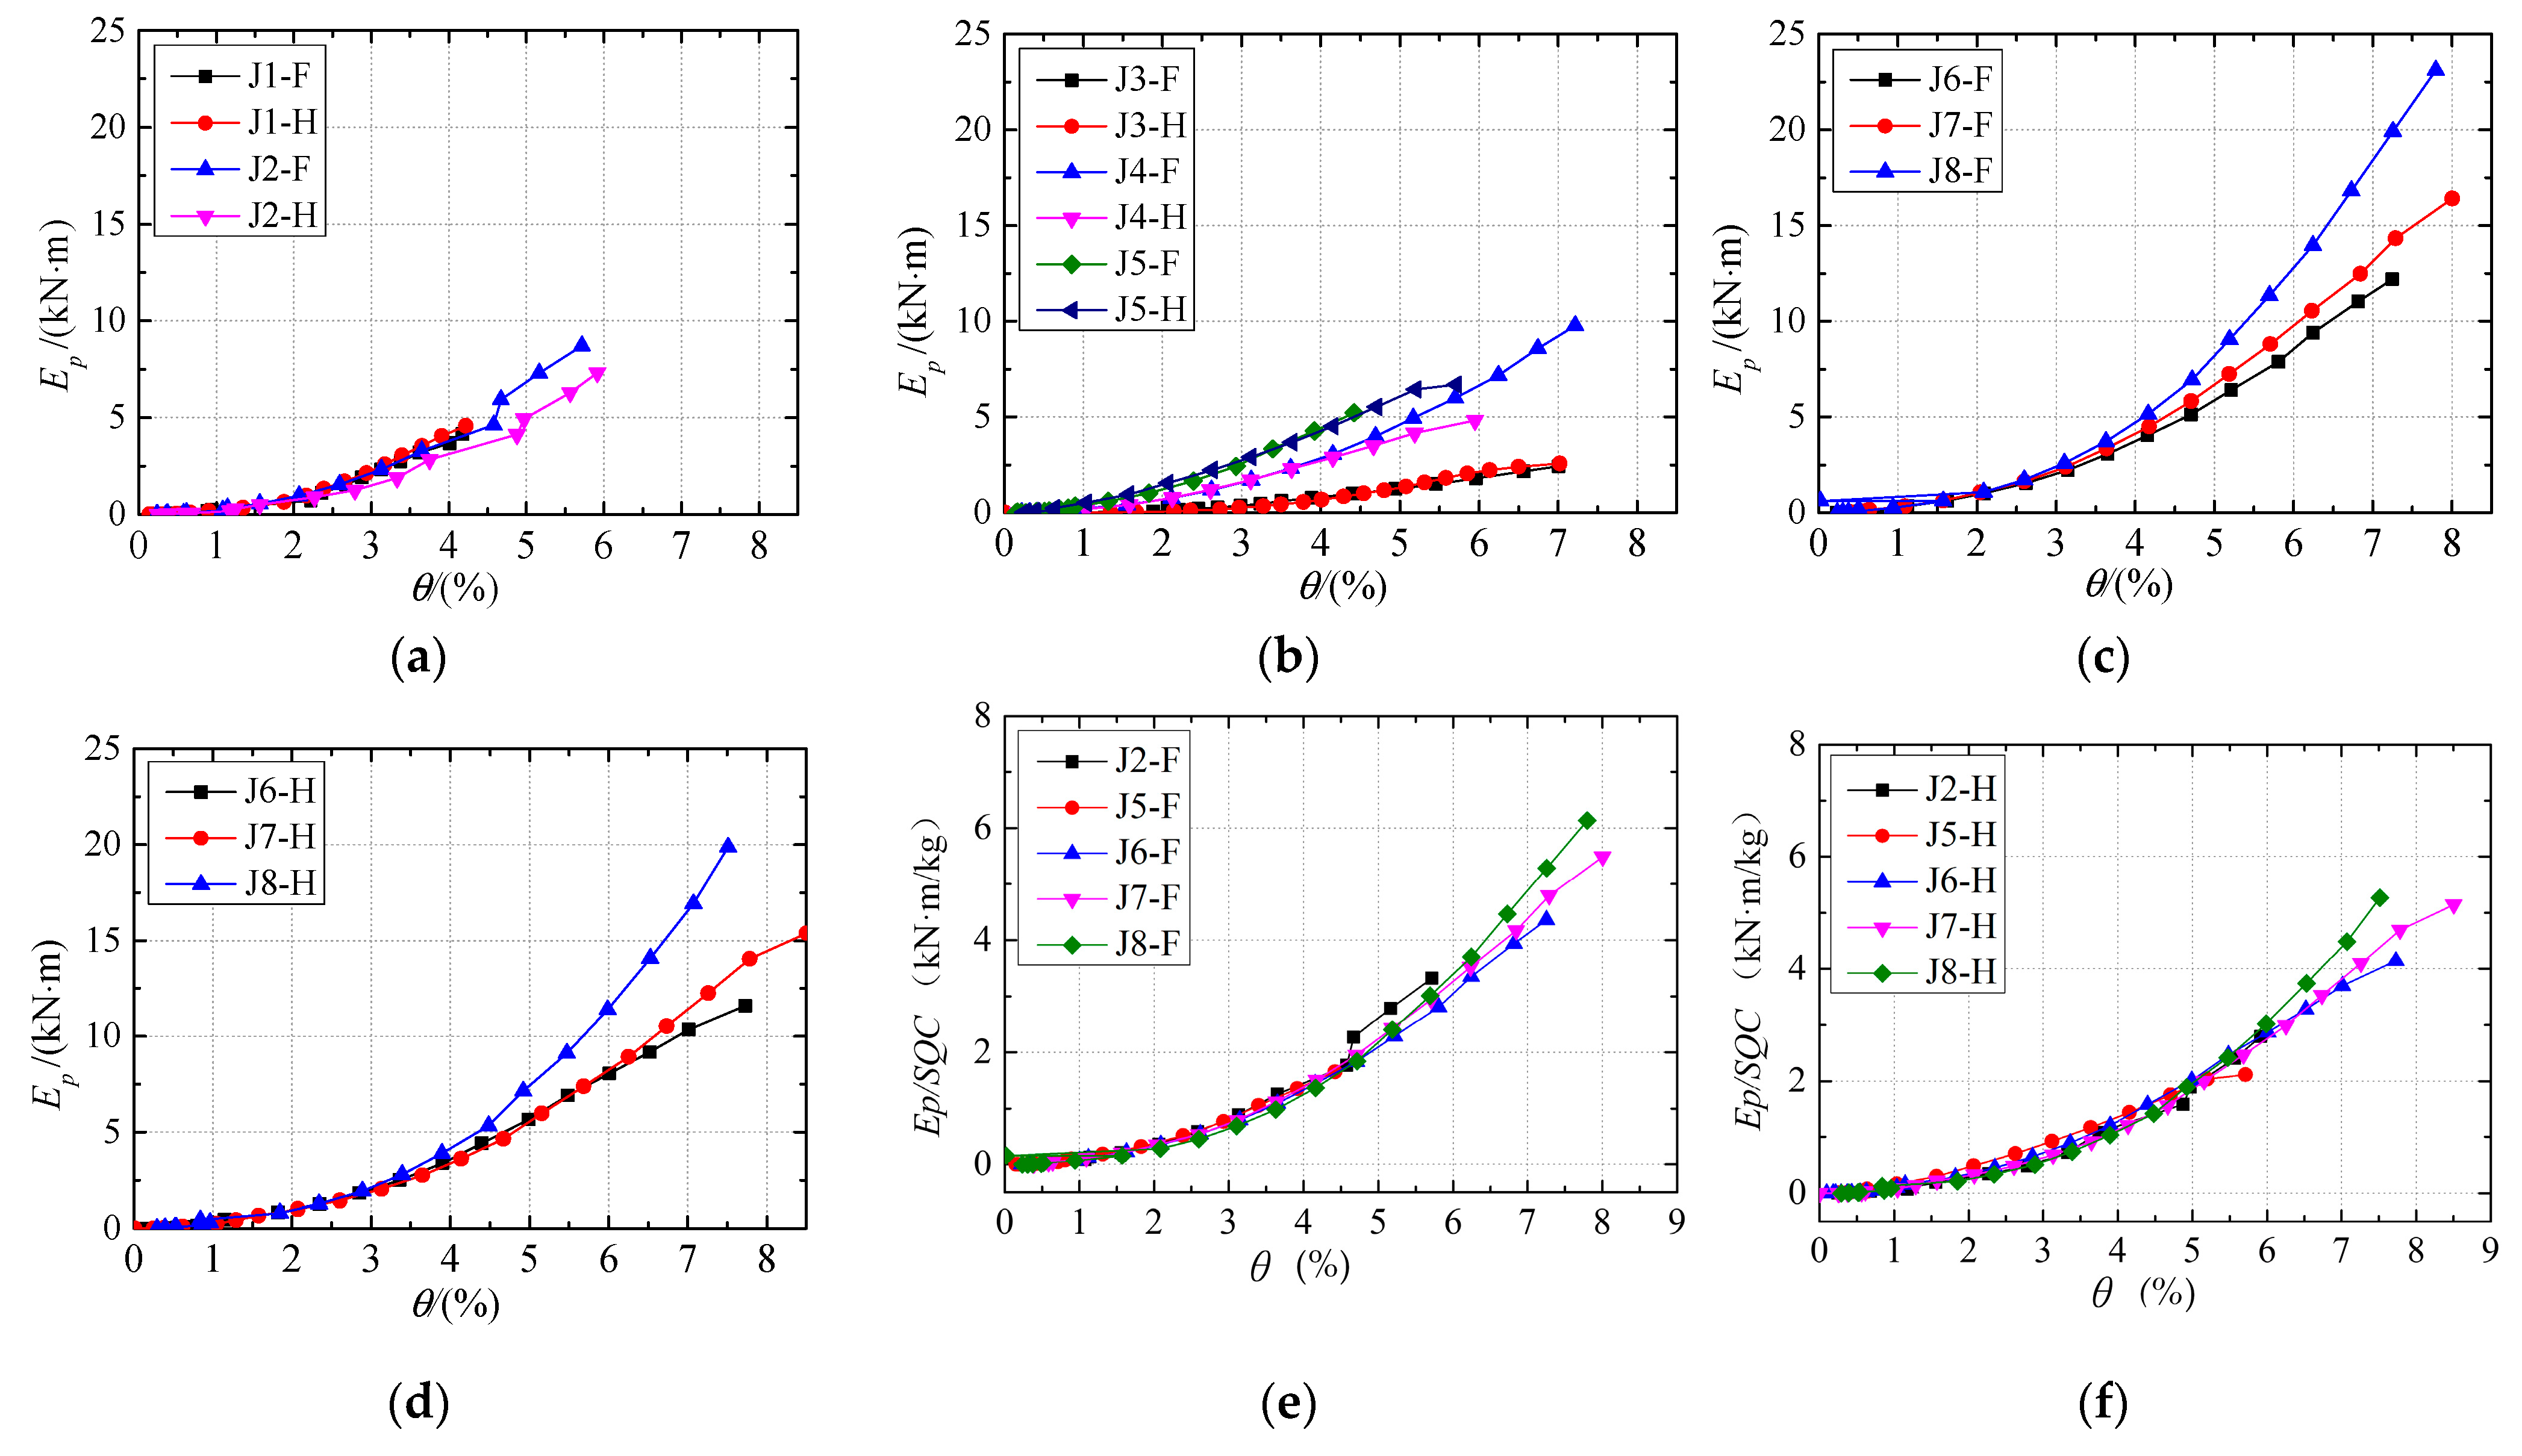
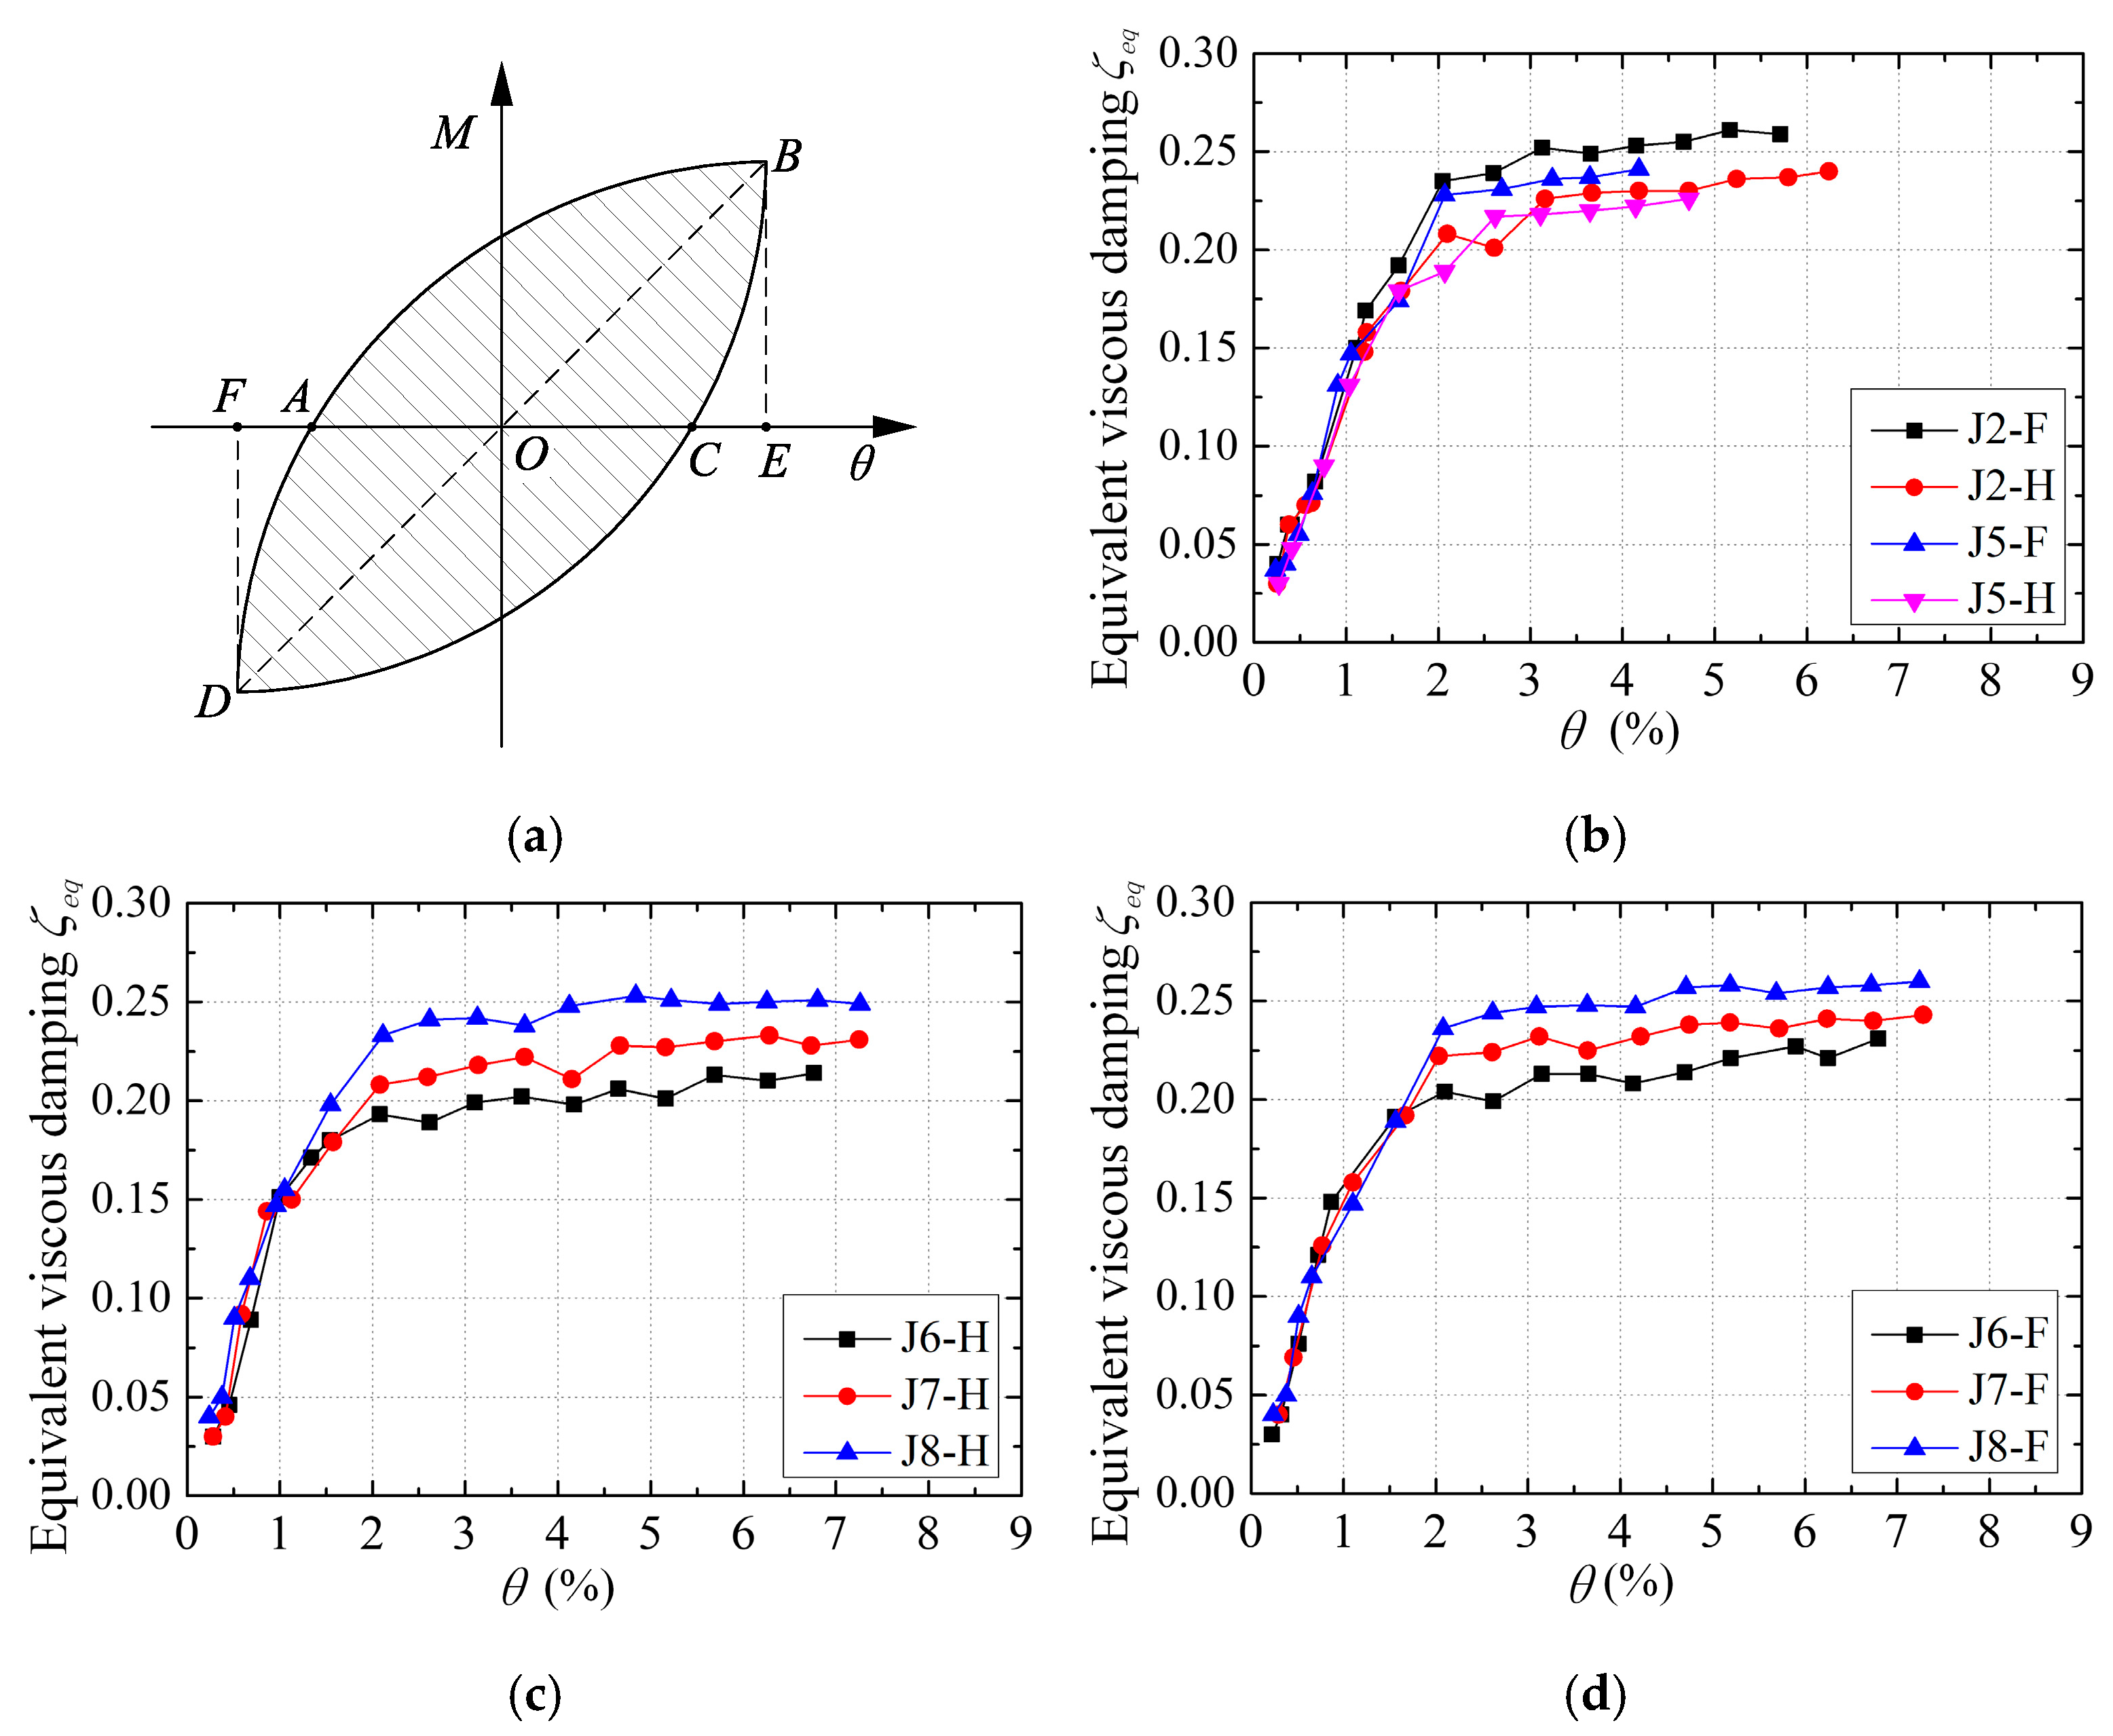
The energy dissipation of a specimen during one loading cycle corresponded to the area enclosed by its hysteresis loop. The cumulative energy dissipation after the first i cycles was defined as Ep. The relationship between Ep and the maximum joint rotation θ in the i-th cycle is presented in Figure 11. Figure 11e,f show the Ep-θ relationships incorporating the SQC factor, enabling a direct comparison of the cost-performance ratio among the various joints. To evaluate the energy dissipation capacity of connections, the eouivalent viscous damping coeficient ζeq was used in this study. Based on JGJ/T 101-2015 [41], ζeq was calculated using Equation (7) from the hysteresis curves of the specimens.
ζ e q = 1 2 π × S A B C D S ( O B E + O D F )
In the equation, SABCD is the area surrounded by the hysteresis curve, and SOBE and SODF are the areas of the triangles OBE and ODF, respectively (Figure 12a). The ζeq curves of main specimens are presented in Figure 12b–d.
The results indicate that:
(1) As the rotation θ increased, the cumulative energy dissipation of all specimens exhibited a stepwise growth trend. When θ ˂ 2%, the cumulative energy dissipation of each specimen remained low, whereas when θ ˃ 2%, a significant increase was observed. Experimental observations indicated that the cumulative energy dissipation of a joint specimen was mainly governed by two mechanisms: frictional slip at microfractures and plastic deformation of steel. At small rotation angles, both slip and plastic deformation were minimal, leading to low energy dissipation. With increasing θ, these effects became more pronounced, resulting in a sharp rise in cumulative energy dissipation.
(2) The cumulative energy dissipation of welded and end-plate joints was nearly identical, suggesting that both joint types exhibited comparable energy dissipation capacities at equal rotation angles (Figure 11a). Figure 11b shows that web-connected joints (i.e., J3-F and J3-H) exhibited relatively low energy dissipation. For the same rotation θ, the cumulative energy dissipation of web-flange-connected joints (i.e., J5-F and J5-H) was approximately 30–40% higher than that of flange-connected joints (i.e., J4-F and J4-H).
(3) According to Figure 11c,d, when θ ˂ 3%, the cumulative energy dissipation of the specimens was nearly identical. However, when θ > 3%, the slopes of the cumulative energy dissipation curves for J8-F and J8-H increased markedly. At θ = 7%, the cumulative energy dissipation of J8-F was 40.1% higher than that of J7-F, and that of J8-H was 45.2% higher than J7-H. These findings indicate that incorporating high triangular stiffeners in beam–column joints with angle connector plates can substantially improve the energy dissipation capacity of the specimens.
(4) At θ = 4%, the cumulative energy dissipation of J7-F was 19.9% higher than that of J7-H, and that of J8-F was 13.6% higher than J8-H. At θ = 6%, the cumulative energy dissipation of J7-F was 18.6% higher than that of J7-H, and that of J8-F was 11.8% higher than that of J8-H. These results suggest that concrete infill in the column provides a moderate improvement in the energy dissipation capacity of beam–column joints with angle connector plates, generally in the range of 10–20%.
(5) As can be seen from Figure 11e,f, the Ep/SQC ratios for all specimens are very similar when θ is less than 4.5%. This indicates that to enhance the cumulative energy dissipation of the beam–column connection, an appropriate increase in SQC is essential. Beyond θ = 4.5%, some specimens began to gradually lose their load-bearing capacity due to failure. However, joints with angle connector plates continued to dissipate energy, benefiting from its superior deformation capacity. Furthermore, discernible differences in the Ep/SQC values among the specimens emerged in this stage, confirming the advantage of specimens J8-F and J8-H.
(6) When θ ˂ 2%, ζeq increased rapidly from an initial value of less than 0.05. Beyond a value of 2 for θ, ζeq entered a stage of slow increase, with its value ranging from 0.2 to 0.27 for all specimens in this stage. Specimens J2-F, J8-F, and J8-H exhibited higher ζeq, which signifies better energy dissipation capacity. ζeq was further improved by concrete infill in the columns, resulting in an increase of up to 10% for the SST column-H-beam joints. Additionally, for the angle connector plate joints, an increase in the height of the stiffeners also leads to a higher value of ζeq.

3.6. Joint Classification

The initial rotational stiffness of a beam–column joint, denoted as R0, was obtained from the elastic portion of the moment-rotation curve. According to Eurocode 3 [42], joints are classified based on stiffness and strength.
Based on the initial rotational stiffness, joints can be categorized as follows:
(1) When R0 ≤ 0.5 EIb/lb, the joint is nominally pinned.
(2) When R0 ≥ 8 EIb/lb for a braced frame or R0 ≥ 25 EIb/lb for an unbraced frame, the joint is rigid.
(3) Joints that do not fall into the above categories are classified as semirigid.
Where E denotes the elastic modulus of the beam steel, Ib represents the moment of inertia of the beam section about the horizontal axis of symmetry, and lb indicates the beam length.
According to the joint strength, the classification is as follows:
(1) When Mu ≤ 0.25 Mbp, the joint is nominally pinned.
(2) When MuMbp, the joint is full-strength.
(3) The remaining cases are partial-strength joints.
Where Mu denotes the ultimate bending moment of the joint, and Mbp represents the plastic moment resistance of the beam. For an H-beam, Mbp is defined as the product of the plastic section modulus Wp of the beam section and the yield strength fy of the steel. In this study, the calculated Mbp of the H-beam is 28.93 kN·m.
The relevant parameters for each specimen are presented in Table 5 based on the stiffness classification criteria, all specimens except J3-H and J3-F were classified as semi-rigid joints. According to the strength classification criteria, J3-H and J3-F were nominally pinned joints, whereas J8-H and J8-F were full-strength joints, indicating full utilization of the component strength. The remaining 12 specimens were classified as partial-strength joints.

3.7. Comprehensive Evaluation

Five indices, peak bending moment, initial stiffness, cumulative energy dissipation, concrete filling, and SQC, were adopted for evaluating beam–column joints. An optimal joint was required to exhibit high mechanical performance with minimal cost. For a comprehensive comparison, all indices were normalized to dimensionless values. Peak bending moment, initial stiffness, and cumulative energy dissipation, representing mechanical performance, were normalized by dividing each value by 1.1 times the maximum among all specimens. Concrete filling and SQC, representing construction cost, were normalized using their reciprocals to obtain economic performance indices. A pentagon plot was generated for each specimen based on the five indices (Figure 13), and the enclosed area was defined as the practicality indicator S. The S values of all 16 specimens are presented in Table 6.
The practicality indicator S for specimens J3-H and J3-F was below 0.330, indicating limited suitability for use in moment-resisting frames (Table 6). Most specimens exhibited S values between 0.437 and 0.674, reflecting moderate practicality. Specimens J7-H and J7-F achieved S values of 0.822 and 0.844, respectively, while J8-H and J8-F attained the highest values of 1.240 and 1.247. These findings indicate that the proposed beam–column joint with angle connector plates offers a balanced combination of mechanical performance and cost-effectiveness, thereby demonstrating strong potential for practical engineering applications.
It should be noted that this evaluation considers only joint performance. When additional column properties, such as axial compression and bending, are taken into account, the practicality of the CFSST column–F–beam joint would be further improved [43].

4. Conclusions

In this study, pseudo-static loading tests were performed on 16 SST column–H-beam joint specimens to investigate their failure modes and hysteresis behavior. The key conclusions are as follows:
(1) The seismic performance of beam–column joints was strongly influenced by structural configuration. Traditional welded joints exhibited plump hysteresis loops but low peak bending moments and brittle failure. Bolt-assembled joints displayed varying degrees of pinching in the hysteresis curves. End-plate joints achieved substantially higher peak bending moments than welded joints, with enhanced deformation capacity and ductile failure behavior.
(2) Web-connected joints exhibited low peak bending moments and bending stiffness, rendering them unsuitable for moment-resisting frames. Flange-connected joints improved peak bending moments but retained limited initial stiffness and energy dissipation. Web-flange-connected joints increased peak bending moments by 15.59% for CFSST column–H-beam joints and 20.52% for HSST column–H-beam joints, while initial bending stiffness increased by 23.43% and 50.58%, respectively. This joint type also demonstrated significantly enhanced energy dissipation capacity.
(3) The joint with angle connector plates exhibited superior seismic performance compared with other specimens, particularly when triangular stiffeners were incorporated. With a stiffener height of 144 mm, the peak bending moment increased by 78.65% for the CFSST column–H-beam joint and by 79.30% for the HSST column–H-beam joint. Significant improvements were also observed in initial stiffness and energy dissipation capacity, along with reduced stiffness degradation. According to Eurocode 3, this specimen was classified as a semi-rigid full-strength joint. These findings indicate that triangular stiffener height is a critical parameter influencing the mechanical behavior of this joint type.
(4) Compared with HSST column–H-beam joints, CFSST column–H-beam joints of identical configuration exhibited peak bending moments 5.52–32.65% higher and initial stiffness values 15.59–51.28% higher, while ultimate bending moments showed no significant difference. Energy dissipation of CFSST joints with angle connector plates was 10–20% greater than that of the corresponding HSST joints.
(5) A comprehensive evaluation of mechanical performance and cost identified the SST column–H-beam joint with angle connector plates as the most practical configuration. In engineering applications, increasing the height of triangular stiffeners in the connector plates can further enhance overall joint performance.

Author Contributions

Conceptualization, Z.Z. and Y.L.; methodology, Z.Z.; test, L.C. (Lanhua Chen) and Y.L.; investigation, L.C. (Lanhua Chen) and Y.L.; data curation, L.C. (Ling Cai) and Z.M.Y.; writing—original draft preparation, L.C. (Ling Cai) and Z.M.Y.; writing—review and editing, Z.Z. and L.C. (Lanhua Chen); funding acquisition, Y.L. and Z.Z. All authors have read and agreed to the published version of the manuscript.

Funding

This research was funded by Key R&D and Promotion Projects in Henan Province (No. 242102321151) and Doctoral Research Foundation of North China University of Water Resources and Electric Power (No. 202009006).

Data Availability Statement

The original contributions presented in the study are included in the article, further inquiries can be directed to the corresponding author.

Conflicts of Interest

The authors declare that the research was conducted in the absence of any commercial or financial relationships that could be construed as a potential conflict of interest.

Abbreviations

The following abbreviations are used in this manuscript:
SSTSquare steel tube
HSSTHollow square steel tube
CFSSTConcrete-filled square steel tube
CFSTConcrete-filled steel tube
SQCSteel quantity for connection
DTDisplacement transducer
DGDial gauge

References

  1. Derakhshan, H.; Shekastehband, B. Seismic performance of bolted T-stub Beam-to-Box column connection. Structures 2023, 56, 104873. [Google Scholar] [CrossRef]
  2. Han, L.-H.; Li, W.; Bjorhovde, R. Developments and advanced applications of concrete-filled steel tubular (CFST) structures: Members. J. Constr. Steel Res. 2014, 100, 211–228. [Google Scholar] [CrossRef]
  3. Rong, B.; Zhang, Y.; Sun, J.; Zhang, R. Experimental and numerical research on hysteretic behavior of CFST frame with diaphragm-through connections. J. Build. Eng. 2022, 45, 103529. [Google Scholar] [CrossRef]
  4. Kassem, M.M.; Nazri, F.M.; Farsangi, E.N.; Ozturk, B. Development of a uniform seismic vulnerability index framework for reinforced concrete building typology. J. Build. Eng. 2022, 47, 103838. [Google Scholar] [CrossRef]
  5. Kassem, M.M.; Nazri, F.M.; Farsangi, E.N.; Ozturk, B. Improved vulnerability index methodology to quantify seismic risk and loss assessment in reinforced concrete buildings. J. Earthq. Eng. 2022, 26, 6172–6207. [Google Scholar] [CrossRef]
  6. Doung, P.; Sasaki, E. Load-deformation characteristics and performance of internal diaphragm connections to box columns. Thin-Walled Struct. 2019, 143, 106221. [Google Scholar] [CrossRef]
  7. Doung, P.; Leelataviwat, S.; Sasaki, E. Tensile strength and failure mechanism of internal diaphragms in wide flange beam-to-box column connections with concrete filling. J. Build. Eng. 2021, 34, 102037. [Google Scholar] [CrossRef]
  8. Zhang, N.; Jiang, S.; Chen, X.; Bao, L.; Zhou, F.; Zhao, H.; Shi, G. Experimental study on seismic behaviour of thick-flange steel beam to square CFST column joints with internal diaphragms. Eng. Struct. 2024, 319, 118792. [Google Scholar] [CrossRef]
  9. Chen, C.-C.; Lin, C.-C.; Tsai, C.-L. Evaluation of reinforced connections between steel beams and box columns. Eng. Struct. 2004, 26, 1889–1904. [Google Scholar] [CrossRef]
  10. Tong, L.; Huang, J.; Wu, H.; Wang, K.; Dong, B. Experimental behavior of steel-beam to flat rectangular CFST column connections with small-sized external diaphragms. J. Constr. Steel Res. 2022, 198, 107520. [Google Scholar] [CrossRef]
  11. Tong, L.; Zheng, J.; Wu, H.; Wang, K.; Dong, B.; Liu, B. Parametric study of steel-beam to flat-rectangular CFST column connections with small-size diaphragms. J. Constr. Steel Res. 2023, 211, 108156. [Google Scholar] [CrossRef]
  12. Xu, P.; Wang, Z.; Mou, B.; Gao, D. Seismic performance of CFST column to steel beam joint with outer annular stiffener. J. Build. Eng. 2022, 54, 104679. [Google Scholar] [CrossRef]
  13. Ye, Q.; Wang, Y.; Wang, Z.; Lin, Y.; Shu, C.; Zhang, F. Experimental study of through diaphragm bolted joint between H-beam to CFST column. J. Constr. Steel Res. 2021, 182, 106647. [Google Scholar] [CrossRef]
  14. Lin, Y.; Ye, Q.; Wang, Y.; Shu, C.; Zhang, F.; Zhang, Y.; Zhao, Y.; Cao, H. Seismic behaviour of diaphragm-through bolted-welded joints between CFST column to steel beam. J. Constr. Steel Res. 2023, 200, 107651. [Google Scholar] [CrossRef]
  15. Wang, J.; Wang, J.; Wang, H. Seismic behavior of blind bolted CFST frames with semi-rigid connections. Structures 2017, 9, 91–104. [Google Scholar] [CrossRef]
  16. Thai, H.-T.; Uy, B.; Yamesri; Aslani, F. Behaviour of bolted endplate composite joints to square and circular CFST columns. J. Constr. Steel Res. 2017, 131, 68–82. [Google Scholar] [CrossRef]
  17. Waqas, R.; Uy, B.; Thai, H.-T. Experimental and numerical behaviour of blind bolted flush endplate composite connections. J. Constr. Steel Res. 2019, 153, 179–195. [Google Scholar] [CrossRef]
  18. Wang, P.; Sun, L.; Liu, M.; Zhang, B.; Hu, X.; Yu, J. Experimental studies on thread-fixed one-side bolted connection of beam to hollow square steel tube under static bending moment. Eng. Struct. 2020, 214, 110655. [Google Scholar] [CrossRef]
  19. Zhang, B.; Yuan, H.; Xia, C.; Liu, X.; Liu, M.; Liu, F.; Wang, P. Seismic behavior of thread-fixed one-side bolted endplate connection of steel beam to hollow square column. J. Build. Eng. 2021, 43, 102557. [Google Scholar] [CrossRef]
  20. Liu, M.; Zhang, B.; Liu, Q.; Liu, Y.; Tang, L.; Zhang, W.; Liu, F.; Wang, P. Experimental studies on thread-fixed one-side bolted endplate connection with internal strengthening structure. Eng. Struct. 2021, 246, 112977. [Google Scholar] [CrossRef]
  21. Sun, L.; Liang, Z.; Cai, M.; Liu, L.; Bai, Y.; Geng, Z.; Cheng, Y.; Wang, P.; Liu, M. Seismic behaviour of I-beams bolted CFST column connection using extended TSOBs. Structures 2023, 48, 882–900. [Google Scholar] [CrossRef]
  22. Cai, M.; Liu, X.; Wang, Q.; Gu, H.; Wang, P.; Liu, Y.; Liu, F. Seismic performance of thread-fixed one-side bolts bolted extended endplate connection to HSST column with internal strengthening components. J. Build. Eng. 2022, 45, 103615. [Google Scholar] [CrossRef]
  23. Liu, X.C.; Cui, F.Y.; Zhan, X.X.; Yu, C.; Jiang, Z.Q. Seismic performance of bolted connection of H-beam to HSS-column with web end-plate. J. Constr. Steel Res. 2019, 156, 167–181. [Google Scholar] [CrossRef]
  24. Zhan, X.-X.; Liu, X.-C.; Feng, S.; Yu, C. Seismic performance of a square HSS column to H-section beam bolted connection with double cover plate. Eng. Struct. 2021, 231, 111729. [Google Scholar] [CrossRef]
  25. Cho, Y.; Wang, F.; Seo, S.-Y.; Lee, K.; Kim, T. Experimental and numerical investigation of through-diaphragm in H-shaped steel beam to CFST column connections. Thin-Walled Struct. 2024, 199, 111852. [Google Scholar] [CrossRef]
  26. Lee, H.-J.; Choi, I.-R.; Oh, M.-W. Vertical diaphragms for moment connection of thin-walled CFT column to steel beam. J. Build. Eng. 2024, 97, 110607. [Google Scholar] [CrossRef]
  27. Ahmadi, M.M.; Mirghaderi, S.R. Experimental studies on through-plate moment connection for beam to HSS/CFT column. J. Constr. Steel Res. 2019, 161, 154–170. [Google Scholar] [CrossRef]
  28. Paul, S.; Deb, S.K.; Rangoonwala, A.H. Seismic performance of bidirectional bolted drilled cut RBS-CFT connections under cyclic loads. J. Build. Eng. 2023, 77, 107185. [Google Scholar] [CrossRef]
  29. Cao, S.; Shu, G.; Lin, K.; Qin, Y. Experimental seismic behaviour of bottom-through-diaphragm and top-ring connection to SST columns. J. Constr. Steel Res. 2018, 150, 249–260. [Google Scholar] [CrossRef]
  30. Xu, X.; Cheng, R.; Yang, P.; Yu, Y. Experimental and numerical investigations on square CFST column to U-shaped steel-concrete composite beam joints with internal T-shaped diaphragms. J. Build. Eng. 2022, 60, 105172. [Google Scholar] [CrossRef]
  31. Habibi, A.; Fanaie, N.; Shahbazpanahi, S. Experimental and numerical investigation of I-beam to concrete-filled tube (CFT) column moment connections with pipe-stiffened internal diaphragm. J. Constr. Steel Res. 2023, 200, 107648. [Google Scholar] [CrossRef]
  32. Ding, C.; Bai, Y.; Yang, K.; Zhang, J. Cyclic behaviour of prefabricated connections for steel beam to concrete filled steel tube column. J. Constr. Steel Res. 2021, 176, 106422. [Google Scholar] [CrossRef]
  33. Wang, W.; Fang, C.; Qin, X.; Chen, Y.; Li, L. Performance of practical beam-to-SHS column connections against progressive collapse. Eng. Struct. 2016, 106, 332–347. [Google Scholar] [CrossRef]
  34. Wang, W.; Fang, C.; Chen, Y.; Wang, M. Seismic performance of steel H-beam to SHS-column cast modular panel zone joints. Eng. Struct. 2016, 117, 145–160. [Google Scholar] [CrossRef]
  35. Fanaie, N.; Moghadam, H.S. Experimental study of rigid connection of drilled beam to CFT column with external stiffeners. J. Constr. Steel Res. 2019, 153, 209–221. [Google Scholar] [CrossRef]
  36. Rezaifar, O.; Younesi, A. Experimental study discussion of the seismic behavior on new types of internal/external stiffeners in rigid beam-to-CFST/HSS column connections. Constr. Build. Mater. 2017, 136, 574–589. [Google Scholar] [CrossRef]
  37. GB 50936-2014; Technical Code for Concrete Filled Steel Tubular Structures. China Architecture & Building Press: Beijing, China, 2014.
  38. GB/T 228.1-2021; Metallic Materials—Tensile Testing—Part 1: Method of Test at Room Temperature. China Planning Press: Beijing, China, 2021.
  39. JGJ 82-2011; Technical Specification for High Strength Bolt Connections of Steel Structures. China Planning Press: Beijing, China, 2011.
  40. GB 50011-2010; Code for Seismic Design of Buildings, 2016 ed. China Architecture & Building Press: Beijing, China, 2016.
  41. JGJ/T 101-2015; Specification for Seismic Test of Buildings. China Architecture & Building Press: Beijing, China, 2015.
  42. EN 1993-1-8; Eurocode 3: Design of Steel Structures—Part 1.8: Design of Joints. CEN: Brussels, Belgium, 2005.
  43. Koloo, F.A.; Badakhshan, A.; Fallahnejad, H.; Jamkhaneh, M.E.; Ahmadi, M. Investigation of Proposed Concrete Filled Steel Tube Connections under Reversed Cyclic Loading. Int. J. Steel Struct. 2018, 18, 163–177. [Google Scholar] [CrossRef]
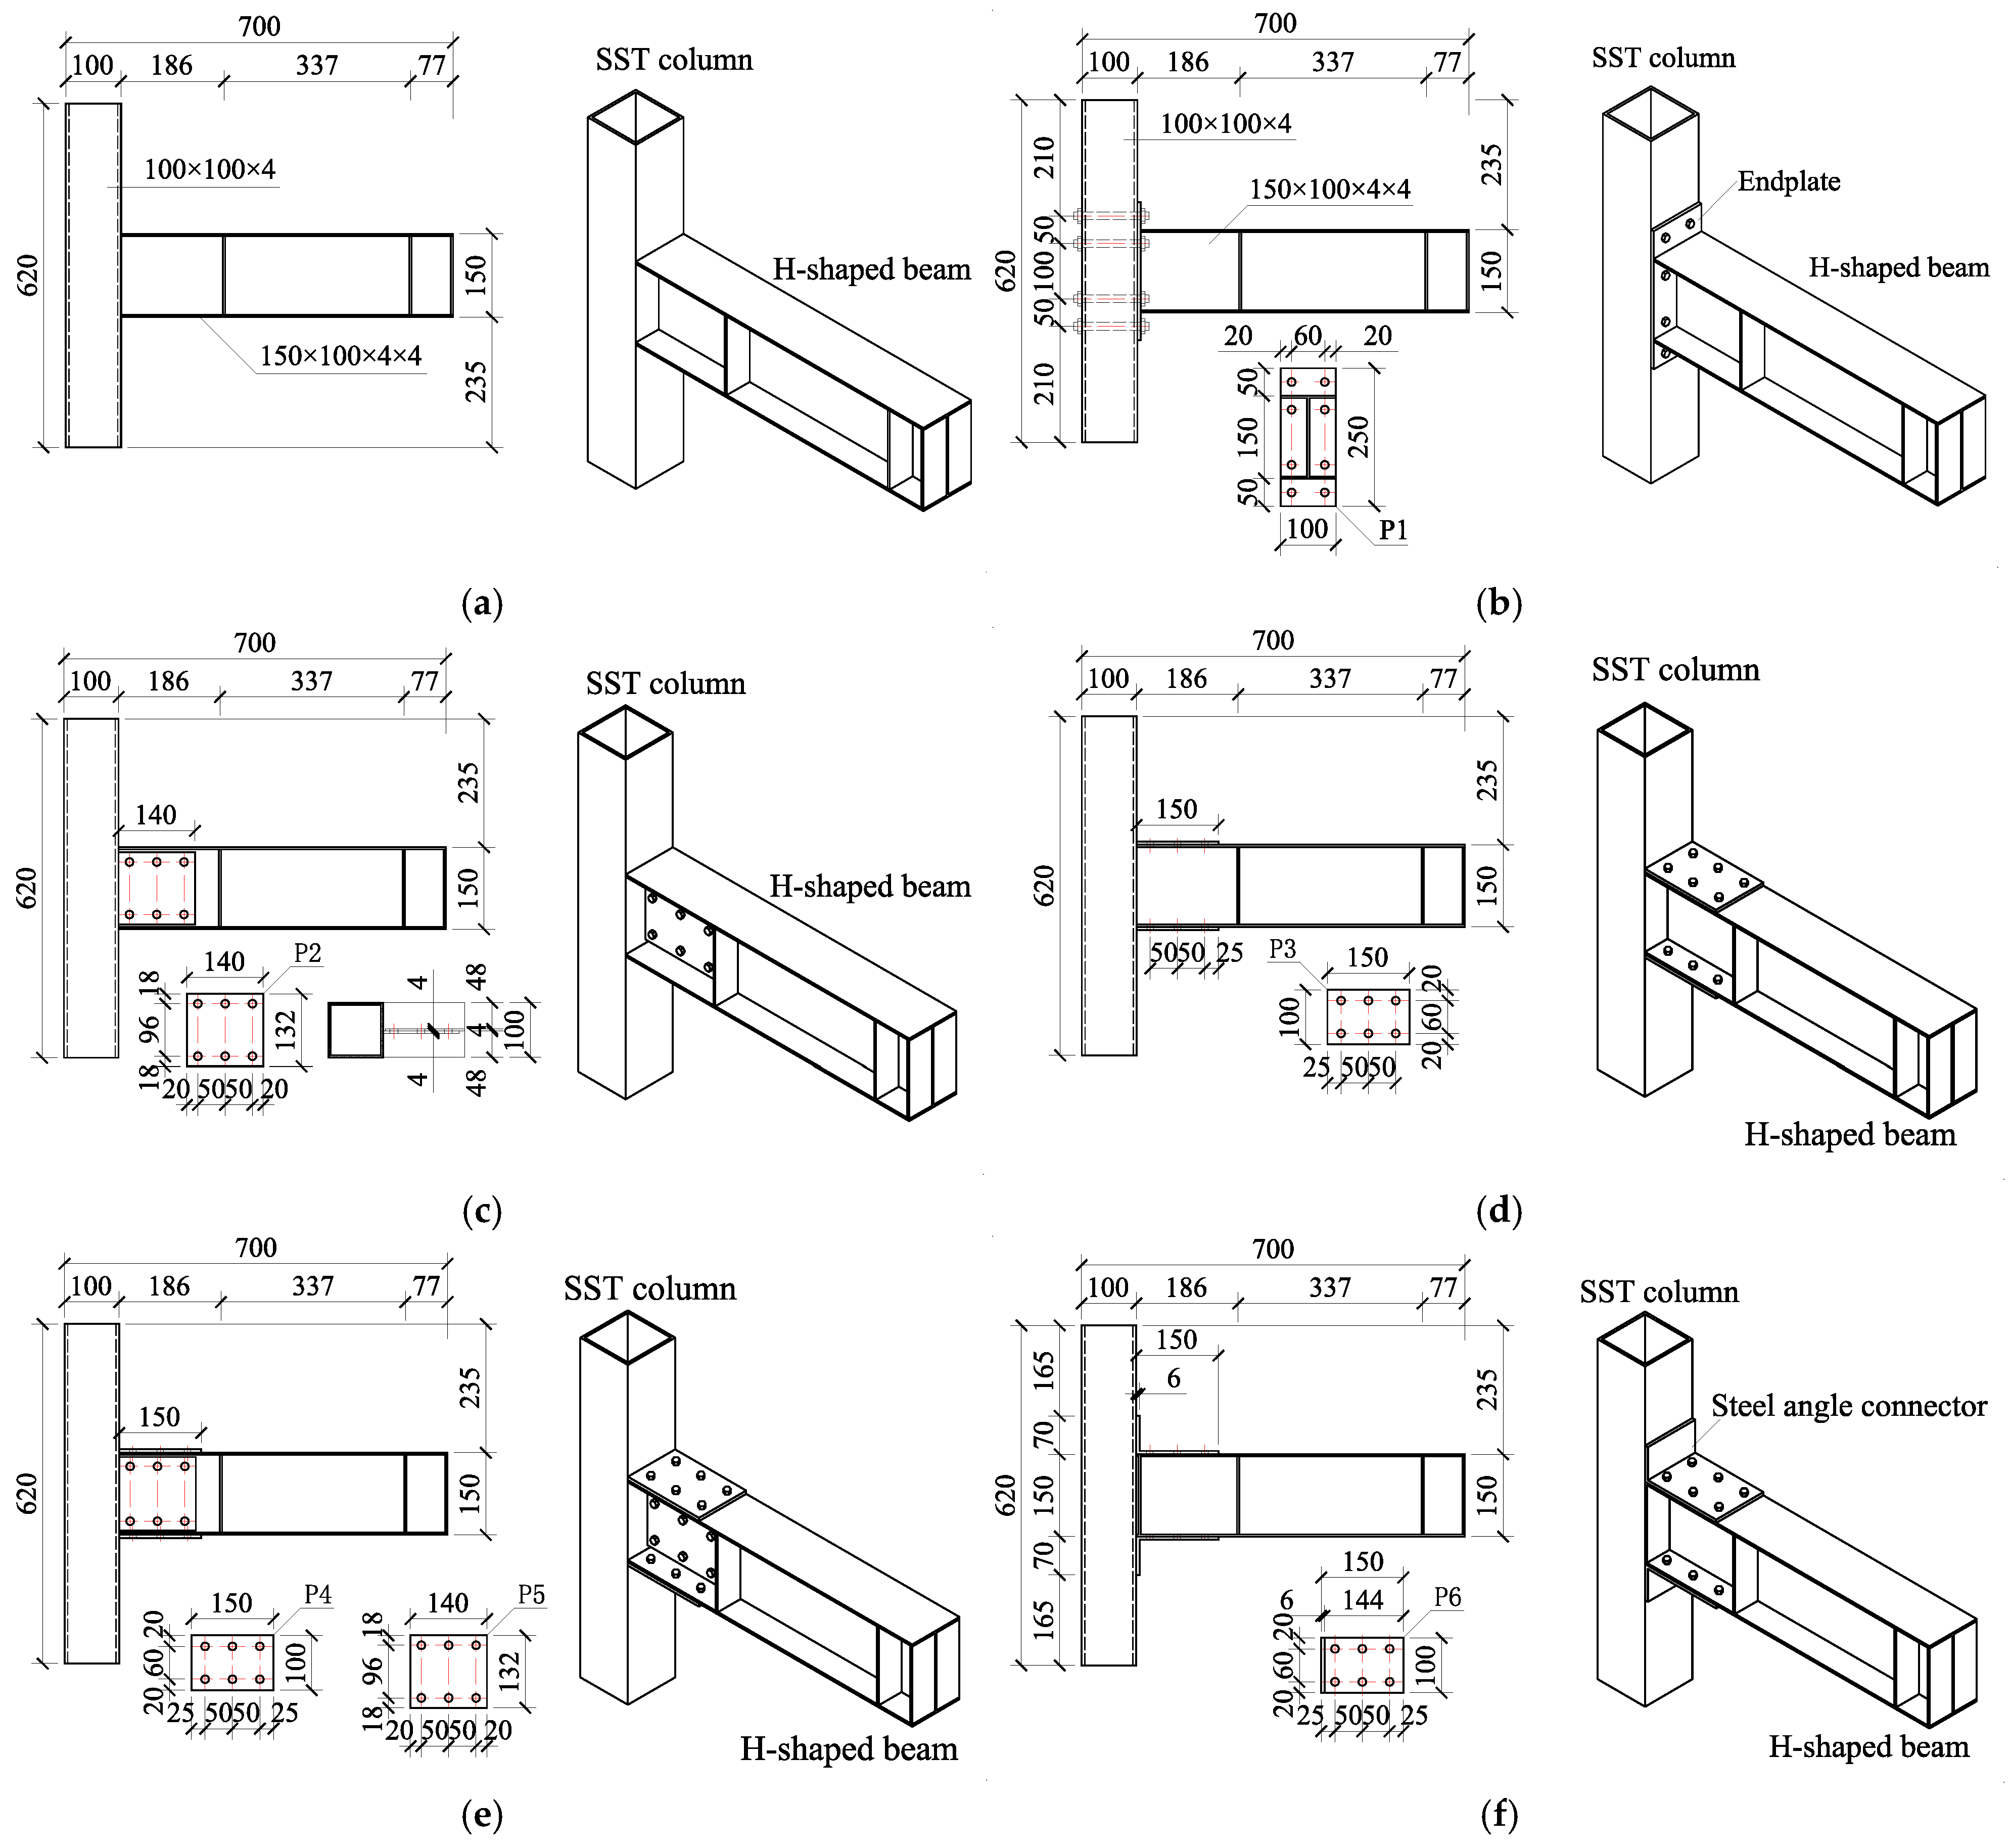
Figure 1. Tested specimens: (a) J1-H, (b) J2-H, (c) J3-H, (d) J4-H, (e) J5-H, (f) J6-H, (g) J7-H, (h) J8-H.
Buildings 15 03774 g001aBuildings 15 03774 g001b
Figure 2. Test setup. (a) Device, (b) specimen installation, (c) device installation.
Buildings 15 03774 g002
Figure 3. Loading protocol.
Buildings 15 03774 g003
Figure 4. Displacement sensors (DT: displacement transducer; DG: dial gauge).
Buildings 15 03774 g004
Figure 5. Beam-end displacement decomposition.
Buildings 15 03774 g005
Figure 6. Failure modes of specimens: (a) J1-F & J1-H; (b) J2-F & J2-H; (c) J3-F & J3-H; (d) J4-F & J4-H; (e) J5-F & J5-H; (f) J6-F & J6-H; (g) J7-F & J7-H; (h) J8-F & J8-H; (i) J8-F.
Buildings 15 03774 g006
Figure 7. Moment-rotation hysteresis curves: (a) J1-F & J1-H; (b) J2-F & J2-H; (c) J3-F & J3-H; (d) J4-F & J4-H; (e) J5-F & J5-H; (f) J6-F & J6-H; (g) J7-F & J7-H; (h) J8-F & J8-H.
Buildings 15 03774 g007
Figure 8. Skeleton curves: (a) J1-F & J1-H; (b) J2-F & J2-H; (c) J3-F & J3-H; (d) J4-F & J4-H; (e) J5-F & J5-H; (f) J6-F & J6-H; (g) J7-F & J7-H; (h) J8-F & J8-H.
Buildings 15 03774 g008aBuildings 15 03774 g008b
Figure 9. Yield moment methodology.
Buildings 15 03774 g009
Figure 10. Stiffness degradation comparison: (a) J1-F, J1-H, J2-F & J2-H; (b) J3-F, J3-H, J4-F, J4-H, J5-F & J5-H; (c) J6-F, J7-F & J8-F; (d) J6-H, J7-H, & J8-H; (e) J7-F & J7-H; (f) J8-F & J8-H.
Buildings 15 03774 g010aBuildings 15 03774 g010b
Figure 11. Energy dissipation comparison: (a) J1-F, J1-H, J2-F & J2-H; (b) J3-F, J3-H, J4-F, J4-H, J5-F & J5-H; (c) J6-F, J7-F & J8-F; (d) J6-H, J7-H, & J8-H; (e) Ep/SQC of J2-F, J5-F, J6-F, J7-F & J8-F; (f) Ep/SQC of J2-H, J5-H, J6-H, J7-H & J8-H.
Buildings 15 03774 g011
Figure 12. Diagram of equivalent viscous damping coefficient. (a) Calculation method of ζeq. (b) ζeq-θ curves of J2-F, J2-H, J5-F& J5-H. (c) ζeq curves of J6-H, J7-H & J8-H. (d) ζeq curves of J6-F, J7-F & J8-F.
Buildings 15 03774 g012
Figure 13. Comparison of five key indices: (a) J1-H, J1-F, J2-H & J2-F; (b) J3-H, J3-F, J4-H & J4-F; (c) J5-H, J5-F, J6-H & J6-F; (d) J7-H, J7-F, J8-H & J8-F.
Buildings 15 03774 g013
Table 1. Specimen assembly and SQC values.
SpecimenFabrication ProcessOn-Site ProcessSQC (kg)
J1-H & J1-FNoneBeam flanges and webs are welded to the column0
J2-H & J2-FThe beam flange and web are welded to the end plate P1End plate P1 and the column are connected with bolts2.62
J3-H & J3-FConnecting plate P2 is welded to the columnThe beam, web, and the connecting plate P2 are connected with bolts0.97
J4-H & J4-FConnecting plate P3 is welded to the columnThe upper and lower flanges of the beam are connected to the connecting plate P3 with bolts2.19
J5-H & J5-FConnecting plates P4 and P5 are welded to the columnsThe upper and lower flanges of the beam are connected to the connecting plate P4 with bolts.
The beam, web, and the connecting plate P5 are connected with bolts
3.16
J6-H & J6-FAngle connector plate P6 is welded to the columnThe upper and lower flanges of the beam are connected to the angle connector plate P6 with bolts2.80
J7-H & J7-FAngle connector plate P7 is welded to the columnThe upper and lower flanges of the beam are connected to the angle connector plate P7 with bolts2.99
J8-H & J8-FAngle connector plate P8 is welded to the columnThe upper and lower flanges of the beam are connected to the angle connector plate P8 with bolts3.77
Table 2. Mechanical properties of steel.
Materialt (mm) f y (Mpa) f u (Mpa)δ (%)E (Gpa)
Beam webs, beam flanges, column webs4373444.321.5214
column flange6346429.119.2202
End plates, L-shaped connecting plates, stiffening ribs6355423.819.7202
Note: t denotes steel thickness, fy represents yield strength, fu indicates ultimate strength, δ signifies elongation, and E refers to the elastic modulus of steel.
Table 3. Feature points of skeleton curves.
SpecimensLoading DirectionMy (kN·m) θ y (%)Mp (kN·m) θ p (%)Mu (kN·m) θ u (%)μΩ
J1-HForward10.941.7611.602.3510.164.082.321.08
Negative9.981.3111.522.049.793.832.92
J1-FForward10.401.0512.242.1510.492.292.181.13
Negative10.750.9412.041.9410.232.462.62
J2-HForward11.612.6813.856.1411.787.052.631.19
Negative11.322.8014.156.1512.036.732.40
J2-FForward14.112.5418.545.1115.976.182.431.26
Negative14.642.5918.774.9118.774.911.90
J3-HForward4.164.084.655.083.956.091.491.14
Negative3.813.074.564.233.886.061.97
J3-FForward5.264.046.154.995.236.141.521.28
Negative3.624.025.385.624.576.261.56
J4-HForward9.621.5411.782.7610.013.192.071.19
Negative9.010.8411.292.419.604.034.80
J4-FForward11.682.1915.577.0115.577.013.201.32
Negative11.132.1715.226.3315.226.332.92
J5-HForward11.701.5614.094.0811.986.113.921.14
Negative12.131.1813.743.5513.105.214.42
J5-FForward14.121.1516.872.0114.344.393.821.15
Negative14.581.2717.073.6214.514.553.58
J6-HForward12.132.3117.314.5414.715.922.561.33
Negative13.332.1917.924.0915.235.562.54
J6-FForward16.081.9419.915.8116.926.463.331.25
Negative15.152.0919.745.1816.786.313.02
J7-HForward17.262.2520.644.6017.548.113.601.31
Negative14.382.1721.365.6318.167.893.64
J7-FForward17.252.0124.746.0923.687.103.531.47
Negative15.292.0824.786.8521.748.023.86
J8-HForward18.832.2232.136.6930.117.323.301.59
Negative19.672.1432.665.6527.767.593.55
J8-FForward25.872.1635.575.2130.237.073.271.34
Negative24.642.2933.495.6728.477.953.47
Table 4. Comparisons of stiffness in the early loading phase for two groups of specimens.
SpecimenK1Increase (%)KaIncrease (%)
J1-H17.09 14.76
J1-F21.0623.2316.6312.67
J2-H14.02 11.79
J2-F21.2151.2816.5840.63
J3-H1.47 ——
J3-F1.9532.65————
J4-H12.08 12.63
J4-F19.7963.8217.1836.03
J5-H18.19 16.98
J5-F24.4434.3620.2018.96
J6-H17.06 15.77
J6-F20.8822.3918.1014.77
J7-H19.38 17.01
J7-F24.1924.8221.9328.92
J8-H29.16 23.55
J8-F29.691.8225.638.83
Note: (1) The “increase” value in the third column represents the percentage growth in K1 relative to the previous row. (2) The “increase” value in the fifth column represents the percentage growth in Ka relative to the previous row. (3) For specimens J3-H and J3-F, θ surpassed the 0.5% threshold at the first load level, so Ka could not be obtained.
Table 5. Classification of joint specimens.
SpecimensR0
(kN·m/rad)
Mu
(kN·m)
EIb/lb
(kN·m)
R0lb/EIbMu/MbpJoint Classification
J1-H1708.79.831791.860.950.34Semi-rigid, partial-strength
J1-F2105.810.361791.861.180.36Semi-rigid, partial-strength
J2-H1402.311.911791.860.780.41Semi-rigid, partial-strength
J2-F2121.117.371791.861.180.60Semi-rigid, partial-strength
J3-H147.53.921791.860.080.14Nominal pinned, nominal pinned
J3-F195.34.911791.860.110.17Nominal pinned, nominal pinned
J4-H1207.99.811791.860.670.34Semi-rigid, partial-strength
J4-F1979.815.391791.861.100.53Semi-rigid, partial-strength
J5-H1819.512.541791.861.020.43Semi-rigid, partial-strength
J5-F2444.314.371791.861.360.50Semi-rigid, partial-strength
J6-H1805.614.971791.861.010.52Semi-rigid, partial-strength
J6-F2088.116.851791.861.170.58Semi-rigid, partial-strength
J7-H1897.718.041791.861.060.62Semi-rigid, partial-strength
J7-F2428.922.711791.861.360.78Semi-rigid, partial-strength
J8-H2957.229.681791.861.651.03Semi-rigid, full strength
J8-F2969.429.991791.861.661.04Semi-rigid, full strength
Table 6. Practicality indicator S of specimens.
SpecimensJ1-HJ2-HJ3-HJ4-HJ5-HJ6-HJ7-HJ8-H
S value0.5710.5090.3300.4370.4940.6840.8221.240
SpecimensJ1-FJ2-FJ3-FJ4-FJ5-FJ6-FJ7-FJ8-F
S value0.4820.5640.2550.6010.5070.6420.8441.247
Disclaimer/Publisher’s Note: The statements, opinions and data contained in all publications are solely those of the individual author(s) and contributor(s) and not of MDPI and/or the editor(s). MDPI and/or the editor(s) disclaim responsibility for any injury to people or property resulting from any ideas, methods, instructions or products referred to in the content.