Article

Experimental and Numerical Study on Ultra-High Performance Concrete Repair of Uniformly Corroded Reinforced Concrete Pipes

1
Faculty of Engineering, China University of Geosciences, Wuhan 430074, China
2
Hubei Communications Planning and design Institute Co., Ltd., Wuhan 430050, China
*
Author to whom correspondence should be addressed.
Buildings 2025, 15(20), 3772; https://doi.org/10.3390/buildings15203772
Submission received: 10 September 2025 / Revised: 14 October 2025 / Accepted: 15 October 2025 / Published: 19 October 2025
(This article belongs to the Section Building Materials, and Repair & Renovation)

Abstract

This study investigates the deterioration of corroded reinforced concrete pipes and their restoration using ultra-high performance concrete (UHPC), utilizing Three-Edge Bearing Tests and 3D finite element analysis under uniform corrosion-induced wall thinning. Unrepaired pipes exhibit elastic behavior, crack propagation, and yield stages, with failure driven by concrete cracking and rebar yielding. UHPC repair mitigates load drop during crack propagation, extends the yield phase, and enhances plastic deformation capacity. Pipe load-bearing capacity is negatively correlated with corrosion thickness and positively correlated with repair thickness (R2 > 0.979) and repair compensation ratio. Interfacial performance analysis indicates natural bond degradation under sustained loading, transitioning the pipe to a unitized structure. Embedding steel nails significantly improves interfacial bond strength, increasing failure bearing capacity by 2.91 and 3.56 times compared to natural and PE film interfaces, respectively. Numerical simulations reveal that interface shear strength is five times more influential on bearing capacity decay than interface fracture energy, underscoring its critical role in durability design. An optimization strategy is proposed: reinforce stress-concentrated areas with nails to enhance shear strength and prioritize monitoring interfacial slip to ensure service safety.

1. Introduction

Urban underground pipe networks are critical components of city infrastructure, serving as lifelines to ensure normal urban functionality [1]. Most drainage pipes are constructed using reinforced concrete pipes (RCPs), particularly susceptible to corrosion in groundwater environments [2]. Sulfides in groundwater are reduced to H2S by sulfate-reducing bacteria (SRB) and subsequently oxidized by sulfur-oxidizing bacteria, forming biogenic sulfuric acid that corrodes the inner surface of RCPs. This leads to the thinning of the pipe’s inner wall, compromising the load-bearing capacity of the concrete and resulting in severe structural failure, as illustrated in Figure 1.
Sprayed lining, a common trenchless rehabilitation method, applies mortar to pipe interiors to form a structural layer [3]. Traditional mortar linings primarily act as protective barriers, contributing little to structural capacity [4]. In contrast, ultra-high performance concrete (UHPC), with its exceptional compressive strength, crack resistance, high stiffness, durability, and low creep, enables thinner, lighter structures with superior load-bearing and crack-control capabilities, making it increasingly vital for structural repairs [5,6,7]. These attributes position UHPC as a transformative material for structural repairs in demanding environments.
Scholars have approached UHPC’s application from diverse perspectives. Bolina et al. [8,9] highlight UHPC’s thermal stability, noting minimal compressive strength loss compared to normal-strength concrete (NSC), high-strength concrete (HSC), and ultra-high-strength concrete (UHSC) at elevated temperatures (degradation onset at 400 °C), with UHPC structures exhibiting significantly higher average cross-sectional temperatures under extreme conditions. In terms of mechanical behavior, Yang et al. [10] underscore the role of fiber reinforcement—straight, deformed, non-steel, or hybrid fibers—in enhancing UHPC’s tensile and impact properties, proposing fiber factor-based predictions to classify performance. Similarly, Shi et al. [11] emphasize that UHPC’s superior tensile strength and toughness, driven by fiber reinforcement, result in a fourfold increase in impact fracture energy compared to NSC, a finding that aligns with its structural repair potential.
The durability of UHPC in harsh environments is another focal point of research, with studies converging on its low permeability and resistance to corrosive agents. Yuan et al. [12] attribute UHPC’s reduced permeability to its low water-cement ratio and dense microstructure, which limit chloride and carbon dioxide ingress. Wu [13] and Yang et al. [14] further demonstrate UHPC’s resilience in corrosive settings, such as seawater dry-wet cycles and simulated wastewater environments (e.g., industrial wastewater, inorganic, and organic acids), where it outperforms conventional concrete, significantly extending the service life of drainage pipes. However, Cheng [15] notes that UHPC’s macroscopic performance degrades in sulfuric acid, with tensile strength most affected, followed by flexural strength, and compressive strength least impacted, highlighting a time-dependent corrosion pattern.
Interface behavior and structural interactions also attract significant attention, with some controversy regarding failure mechanisms. Liu et al. [16] analyze UHPC-based composites (e.g., mesh-reinforced UHPC, UHPC-filled steel tubes, and UHPC-strengthened NSC structures) under blast loading, noting that steel rebar in UHPC members causes strain concentration, leading to larger mid-span cracks and reduced ductility compared to NSC. Zhang et al. [17] and Liao [18] focus on UHPC-NC interface performance, observing that failures typically involve NC shear or mixed interface-NC failure rather than full delamination, with bond strength reaching 95% within 7 days and wet conditions enhancing strength by 28–59%. In contrast, studies on pipe failure by Buda-Ozog et al. [19] and Silva et al. [20] identify crown compression and longitudinal crack growth as dominant failure modes in reinforced concrete pipes, influenced by reinforcement ratio, section height, and wall thickness. For trenchless repairs, Shi et al. [21] and Zhang [22] highlight challenges with liner-host interactions, noting that grout detachment under high external loads and insufficient interface resistance can compromise the composite system, limiting the liner’s structural contribution.
Although UHPC is well-established for improving planar structural elements, its use in repairing corrosion-damaged pipes remains underexplored. This study fills this gap by systematically examining UHPC as a repair material for corrosion-thinned pipes. By assuming uniform wall thinning to simplify corrosion variability, we facilitate a controlled assessment of structural impacts. Using TEBT and nonlinear finite element modeling, we analyze the mechanics of UHPC-lined pipes across varying corrosion severities. This work provides innovative practical insights for enhancing the load-carrying capacity of urban pipeline infrastructure, advancing UHPC applications in pipe rehabilitation.

2. Experiments

2.1. Experimental Scheme

Tests were conducted on two pipe diameters, with the larger diameter chosen to facilitate interfacial pretreatment. Detailed specifications are provided in Table 1. The pipes were constructed using P.O. 42.5 cement (Jiuqi Building Materials Co., Ltd., Huaifang, China), with a mix ratio of cement/sand/water = 2.27:2.73:1. The test scheme is outlined in Table 2 and Table 3. For the repair thickness study, DN200 reinforced concrete pipes were evaluated under different corrosion and repair thickness conditions. To explore interfacial pretreatment, DN400 pipes were tested with three different interface types.

2.2. Material Properties

The UHPC (JiaGu Building Materials Co., Ltd., Zhengzhou, China) repair material was composed of P.O. 52.5 Portland cement, Class I fly ash, silica fume, quartz sand, 9 mm PVA fibers, VAE polymer powder, and polycarboxylate superplasticizer. Specimens were prepared according to Chinese Standards GB/T 50080-2016 [23] and GB/T 17671-2021 [24]. Mechanical properties were assessed based on standard protocols, with the results presented in Table 4. After curing for 1 and 7 days, the UHPC specimens exhibited superior compressive and flexural strengths, meeting the requirements for spray-applied repair materials. As depicted in Figure 2, the specimens remained intact following flexural strength testing. Fiber pull-out effects caused micro-cracking on the surface without complete fiber failure, contributing to ductility. This behavior facilitated sustained or enhanced strength after testing, confirming UHPC’s effectiveness as a repair material for improving the residual load-bearing capacity of existing pipes.

2.3. Specimen Preparation

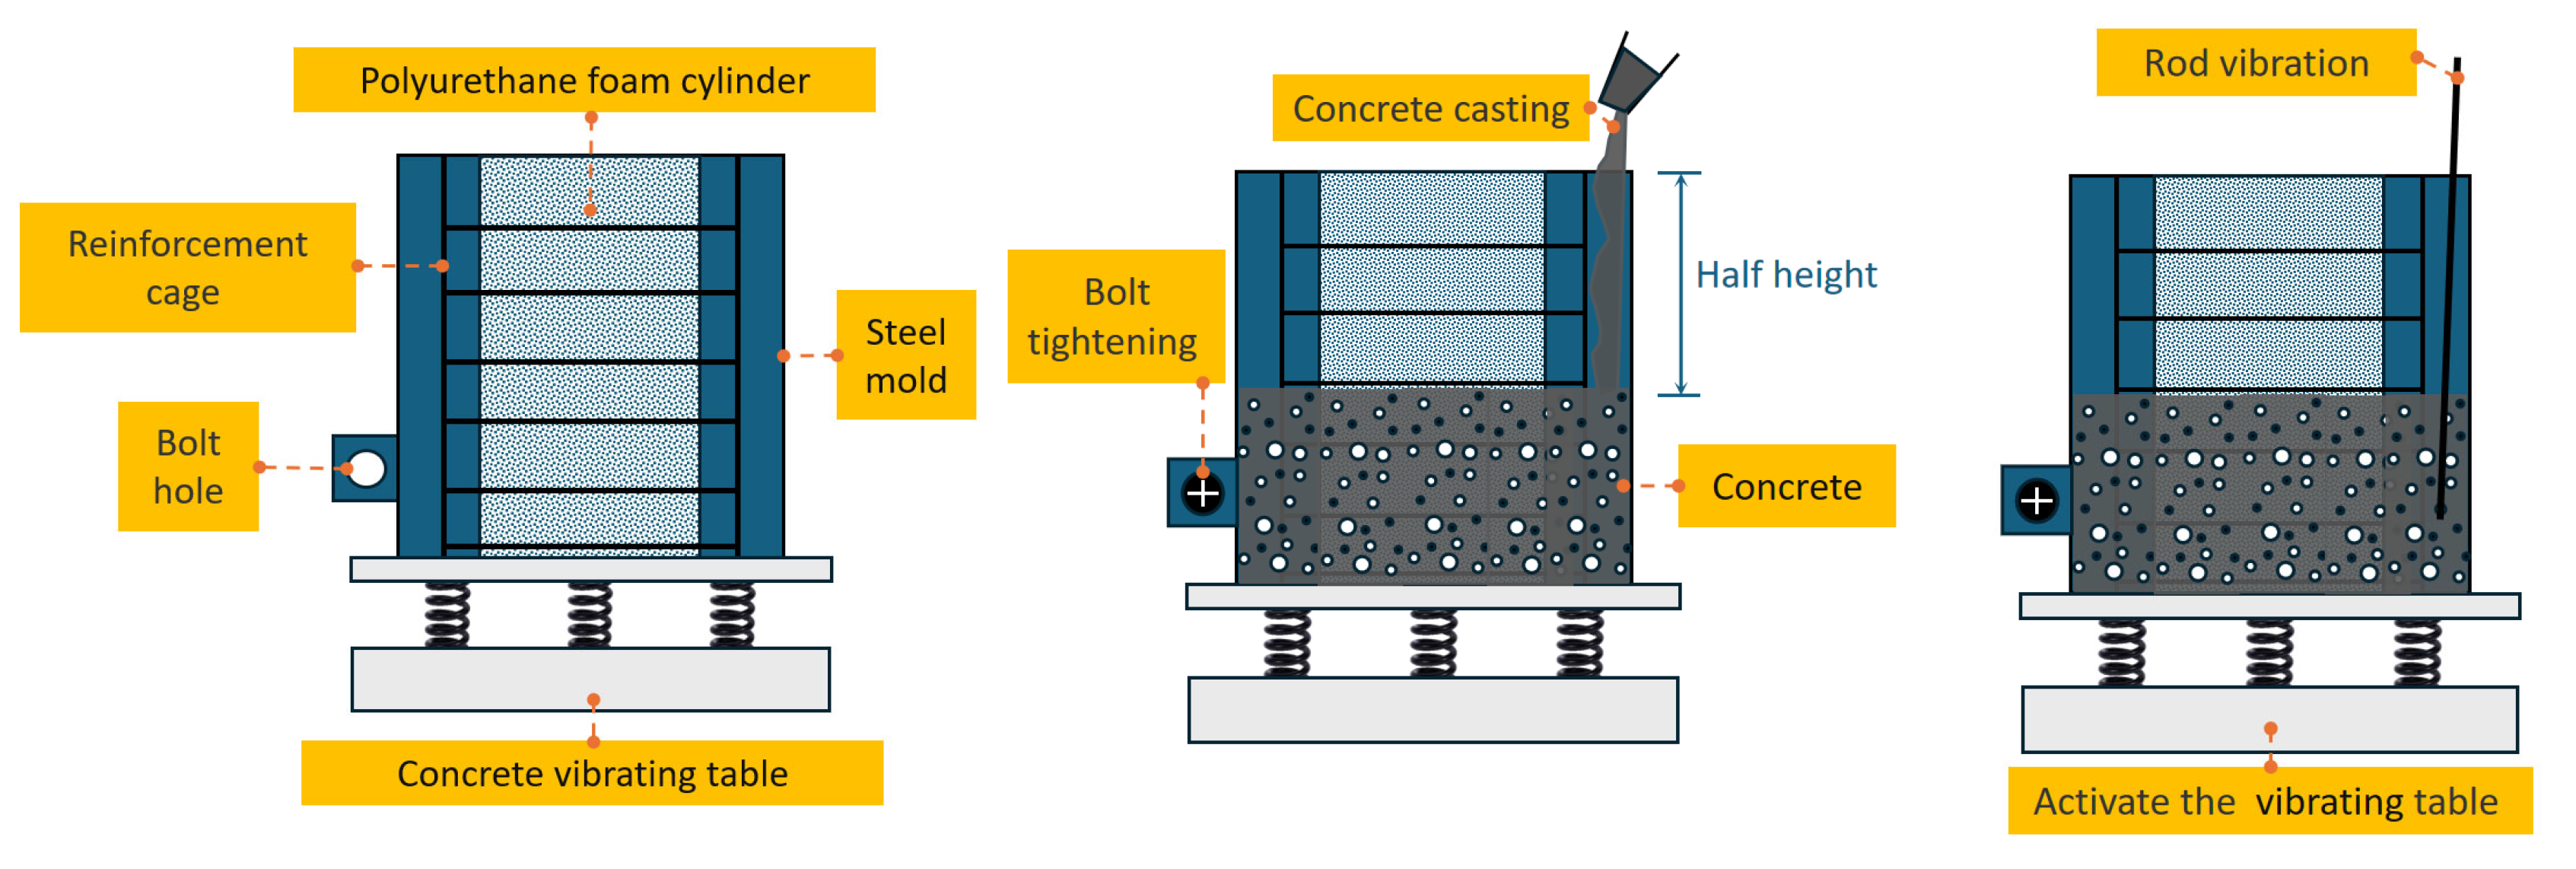
The pipe fabrication process is illustrated in Figure 3. A uniform layer of lubricating oil was applied to the inner surface of the steel mold and the outer surface of the polyurethane (PU) foam cylinder. Subsequently, the reinforcement cage was positioned to ensure proper alignment of all components. The mold was then securely bolted and placed on a vibrating table. Concrete, prepared according to the designed mix ratio, was cast in two successive stages. Following casting, the mold was subjected to natural curing for 1 day before demolding. Thereafter, all pipes were cured indoors for 28 days.
Steel molds for DN200 pipes, uniformly with a diameter of 260 mm, were used, and the dimensions of the PU foam cylinders, corresponding to varying corrosion levels and repair thicknesses, are listed in Table 5.
For DN400 pipes, steel molds had an outer diameter of 480 mm. Three types of interface treatments were applied: (1) Natural Bonding: A 350 mm diameter PU foam cylinder was used, followed by secondary casting with UHPC. (2) Steel nail embedding: The arrangement of the steel nails is depicted in Figure 4, with an axial spacing of 50 mm and a vertical spacing of 15 mm. The nails were secured in the holes using epoxy resin, followed by secondary casting after the resin had cured. (3) PE film adhesion: The inner wall was cleaned and polished, then covered with a PE film bonded using adhesive. The film was tightly clamped and left to cure for 1 day before secondary casting.

2.4. Three-Edge Bearing Test

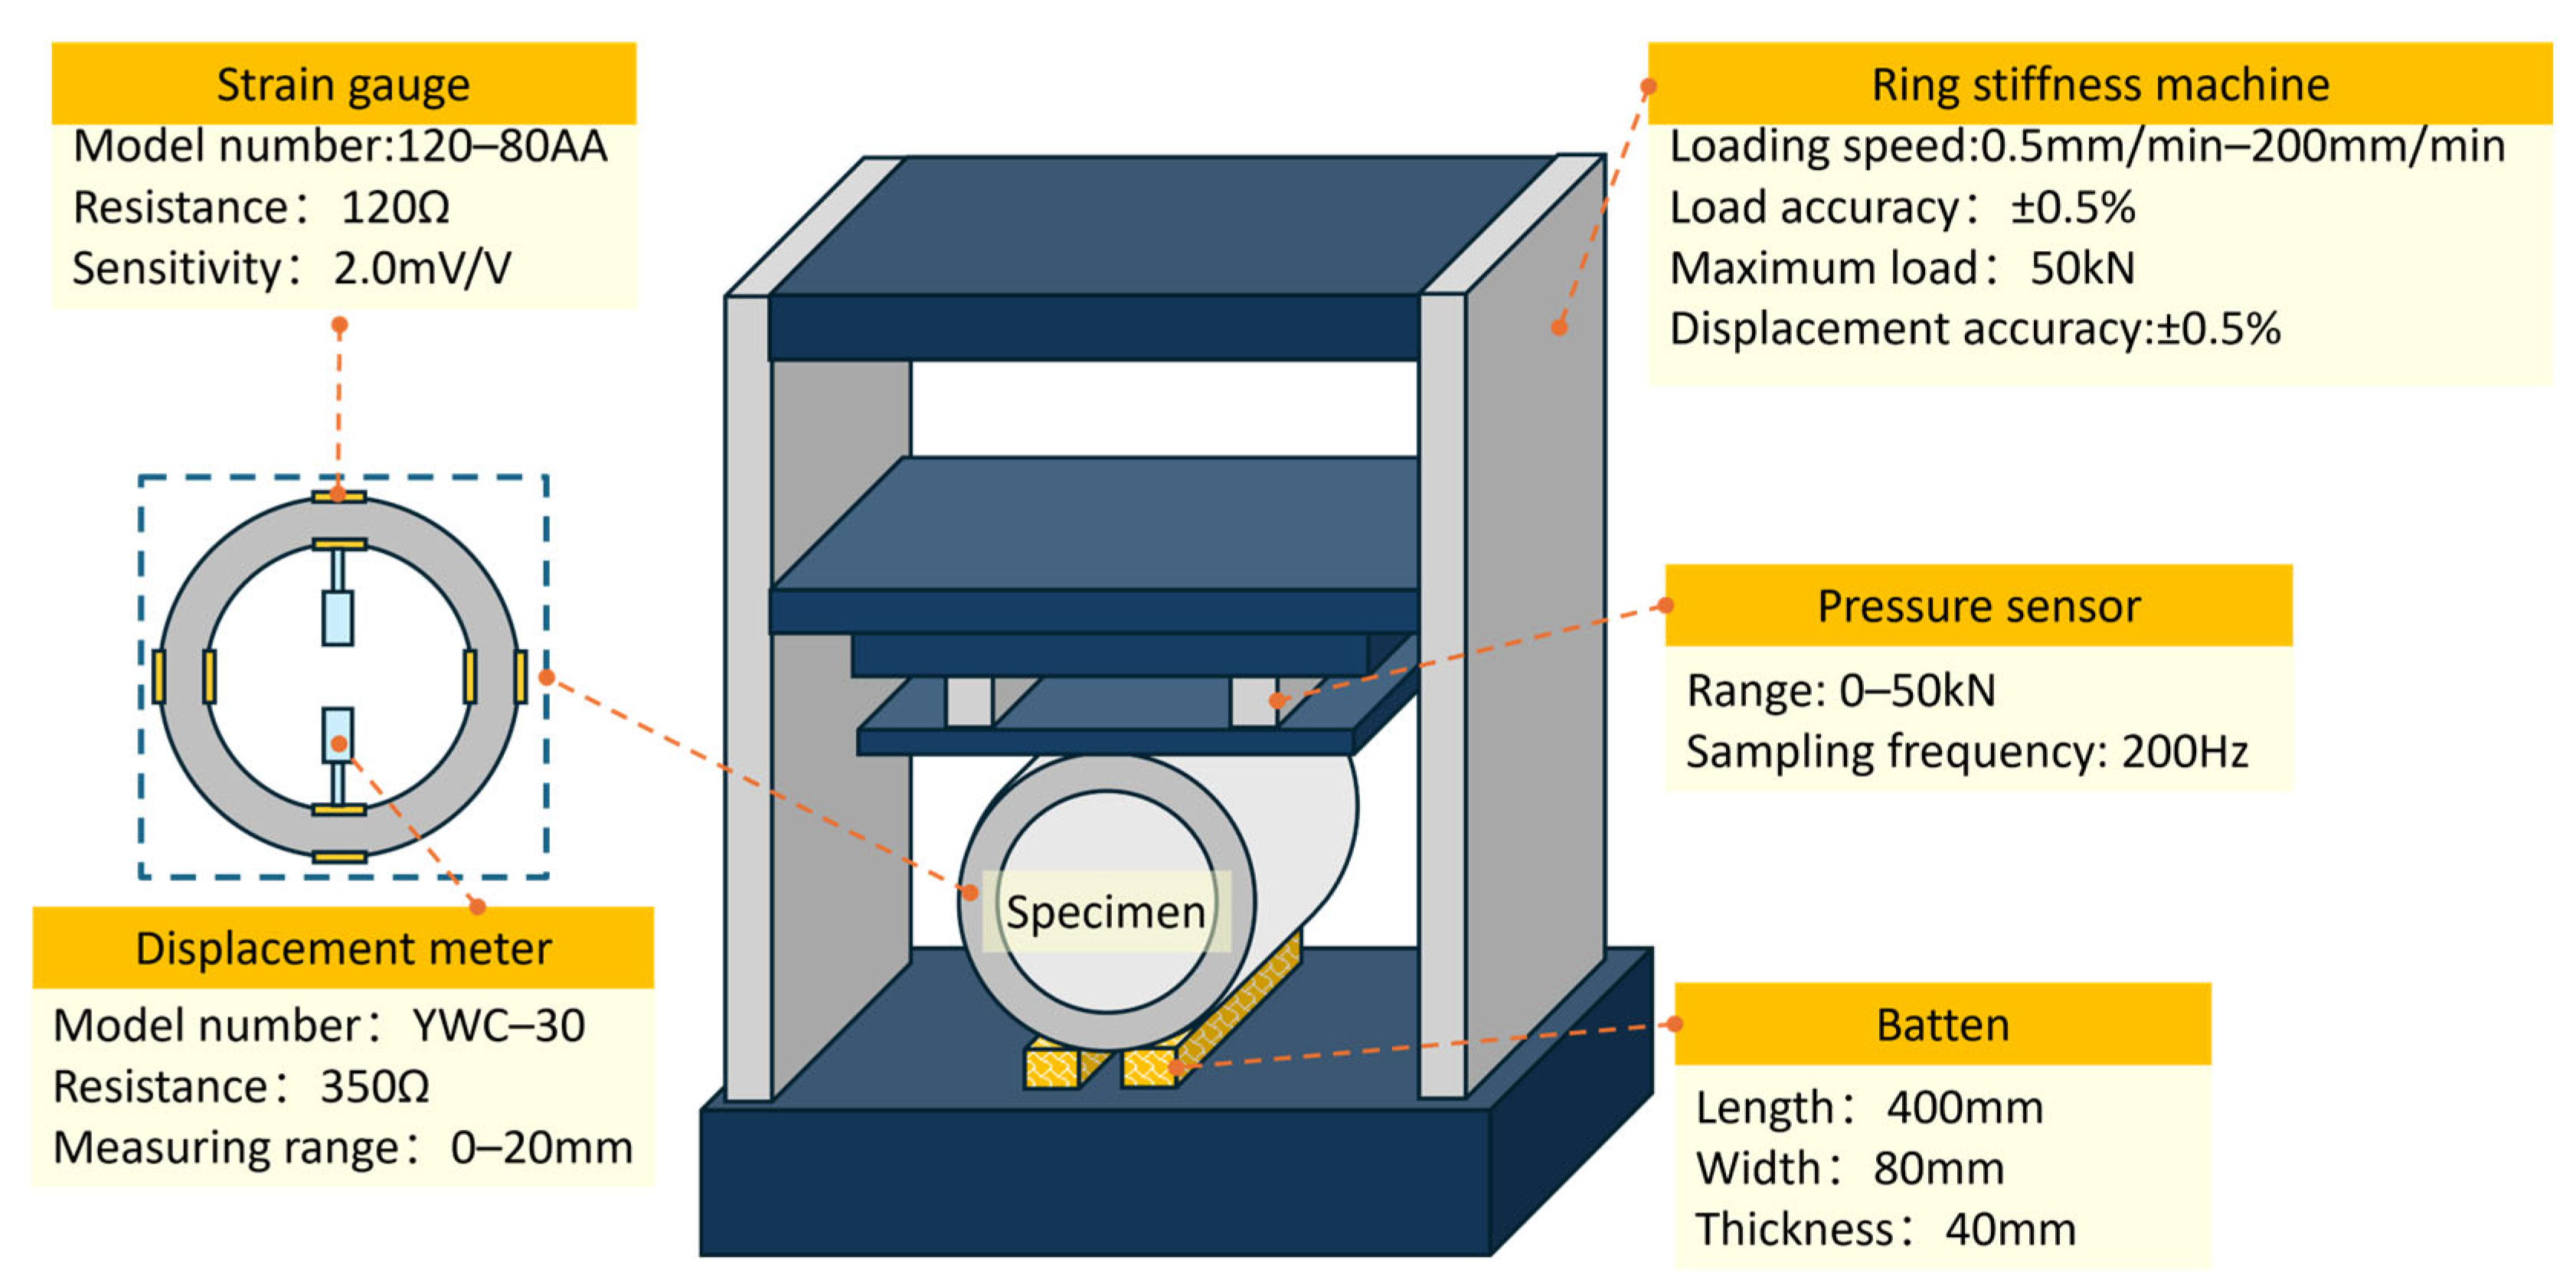
The test followed the load method outlined in GB/T 16752-2017 [25]. As shown in Figure 5, a flat-plate loading test was conducted using a ring stiffness testing machine (Jin Jian Testing Instrument Co., Ltd., Chengde, China), equipped with an integrated system for controlling displacement and recording load–displacement data. Batten spacing was set at 25 mm for DN 200 pipes and 40 mm for DN 400 pipes. The loading rate was fixed at 5 mm/min, with a displacement limit of 10% of the pipe diameter. Strain gauges were installed at the crown, invert, and springlines on both the inner and outer pipe surfaces to measure strain at critical points. To account for spacer deformation during loading, YWC-30 displacement sensors (Jincheng Testing Instrument Factory, Liyang, China) were employed to monitor vertical displacement, thereby minimizing measurement errors.

3. Numerical Simulations

Three-dimensional reinforced concrete pipe models, comprising the pipe body (meshed with C3D8R solid elements, as shown in Figure 6, feature a mesh division of 2° circumferentially, 10 mm radially, and 30 mm axially) and reinforcement (modeled with T3D2 truss elements, consists of circumferential ribs meshed at 2° intervals and longitudinal ribs divided into eight segments), were developed in ABAQUS 2024 using the concrete damage plasticity (CDP) model, with hinged constraints applied at the timber-pipe interface to simulate fixed support boundaries, as detailed in Section 2.1 [26].
Per the Chinese standard GB 50010-2010 [27], plastic damage factors for tension and compression are defined. The constitutive model in this study is established using Equations (1) and (2), and the plastic parameters of concrete and steel bars are shown in Table 6:
σ c = 1 d c E c ε c ε c p l
σ t = 1 d t E c ε t ε t p l
where σc, σt are axial compressive and tensile stresses of concrete; dc, dt are axial compressive and tensile damage factors of concrete; εc, εt are axial compressive and tensile strains of concrete; εcpl, εtpl are Axial plastic compressive and tensile strains of concrete; Ec is the elastic modulus of concrete (MPa).
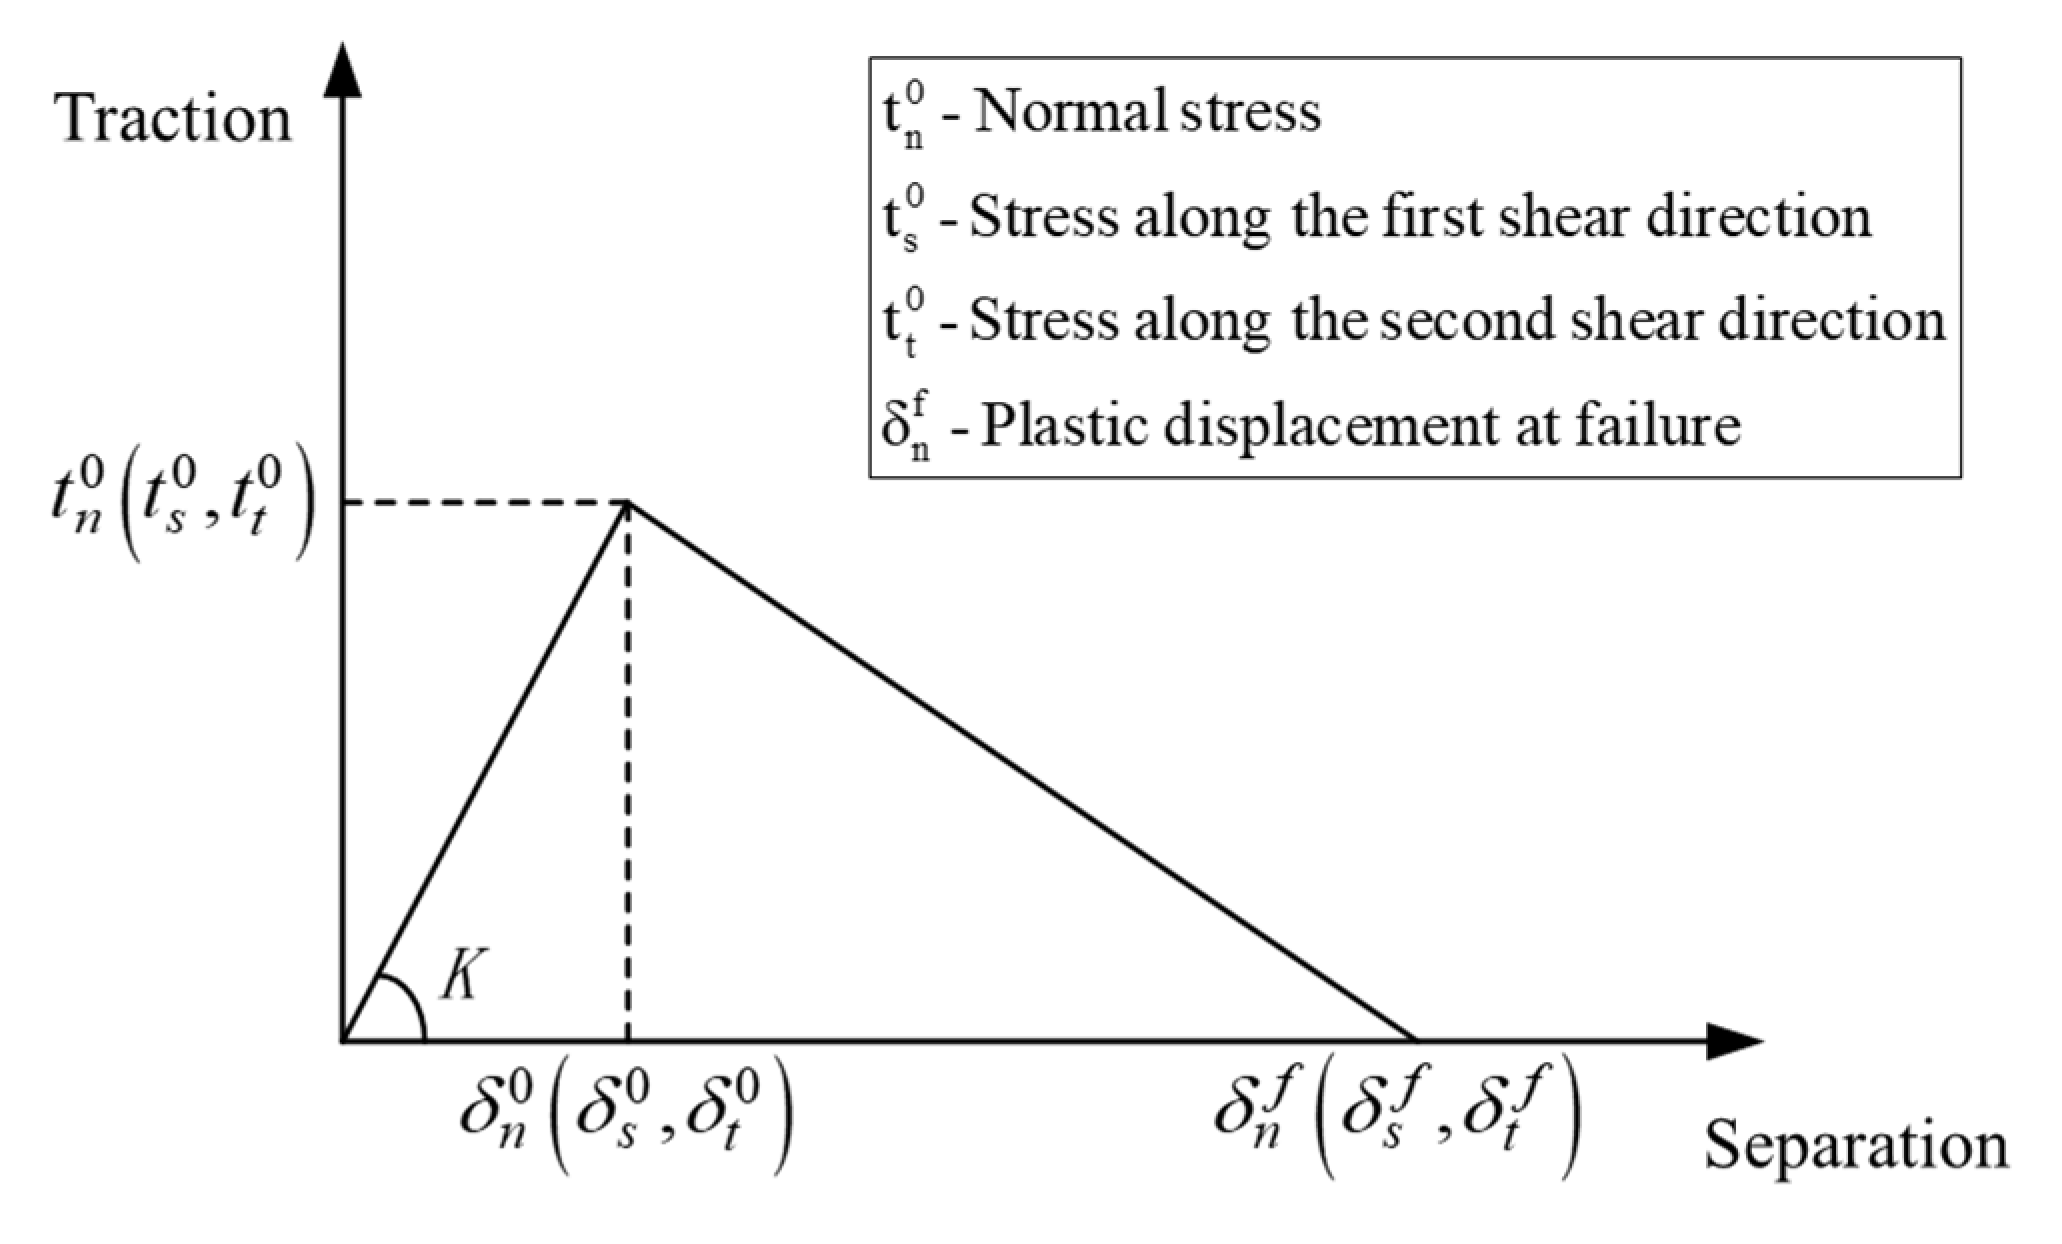
The interface between the UHPC repair layer and the original pipe is modeled using a bilinear traction-separation cohesive model, which effectively captures material cracking and interfacial debonding. The cohesive interface model (Figure 7) relies on two key parameters: fracture energy (Gc), defined by the area under the traction-separation curve, and stiffness, characterized by normal and tangential components (Knn, Kss, and Ktt), with specific values presented in Table 7.
The compressive stress–strain curve model proposed by Yang and Fang [34] is presented as follows:
σ c = f c n ξ ξ 2 1 + ( n 2 ) ξ       ε ε 0 f c ξ 2 ( ξ 1 ) 2 + ξ       ε > ε 0
where fc is peak stress; n is the ratio of initial elastic modulus to peak secant modulus, taken as 1.2; ξ is ε/ε0, ε0 is peak strain, taken as 3500 με.
The ductility of ultra-high-performance cement-based materials is relatively high. The bilinear stress–strain curve model proposed by Zhang et al. [35] is presented as follows:
σ ( ε ) = f c t ε c a       0 < ε ε c a f c t       ε c a < ε ε p c
where fct is the Average stress during the strain-hardening stage; εca is the initial cracking strain; εpc is the failure strain.

4. Results and Analysis

4.1. Model Validation

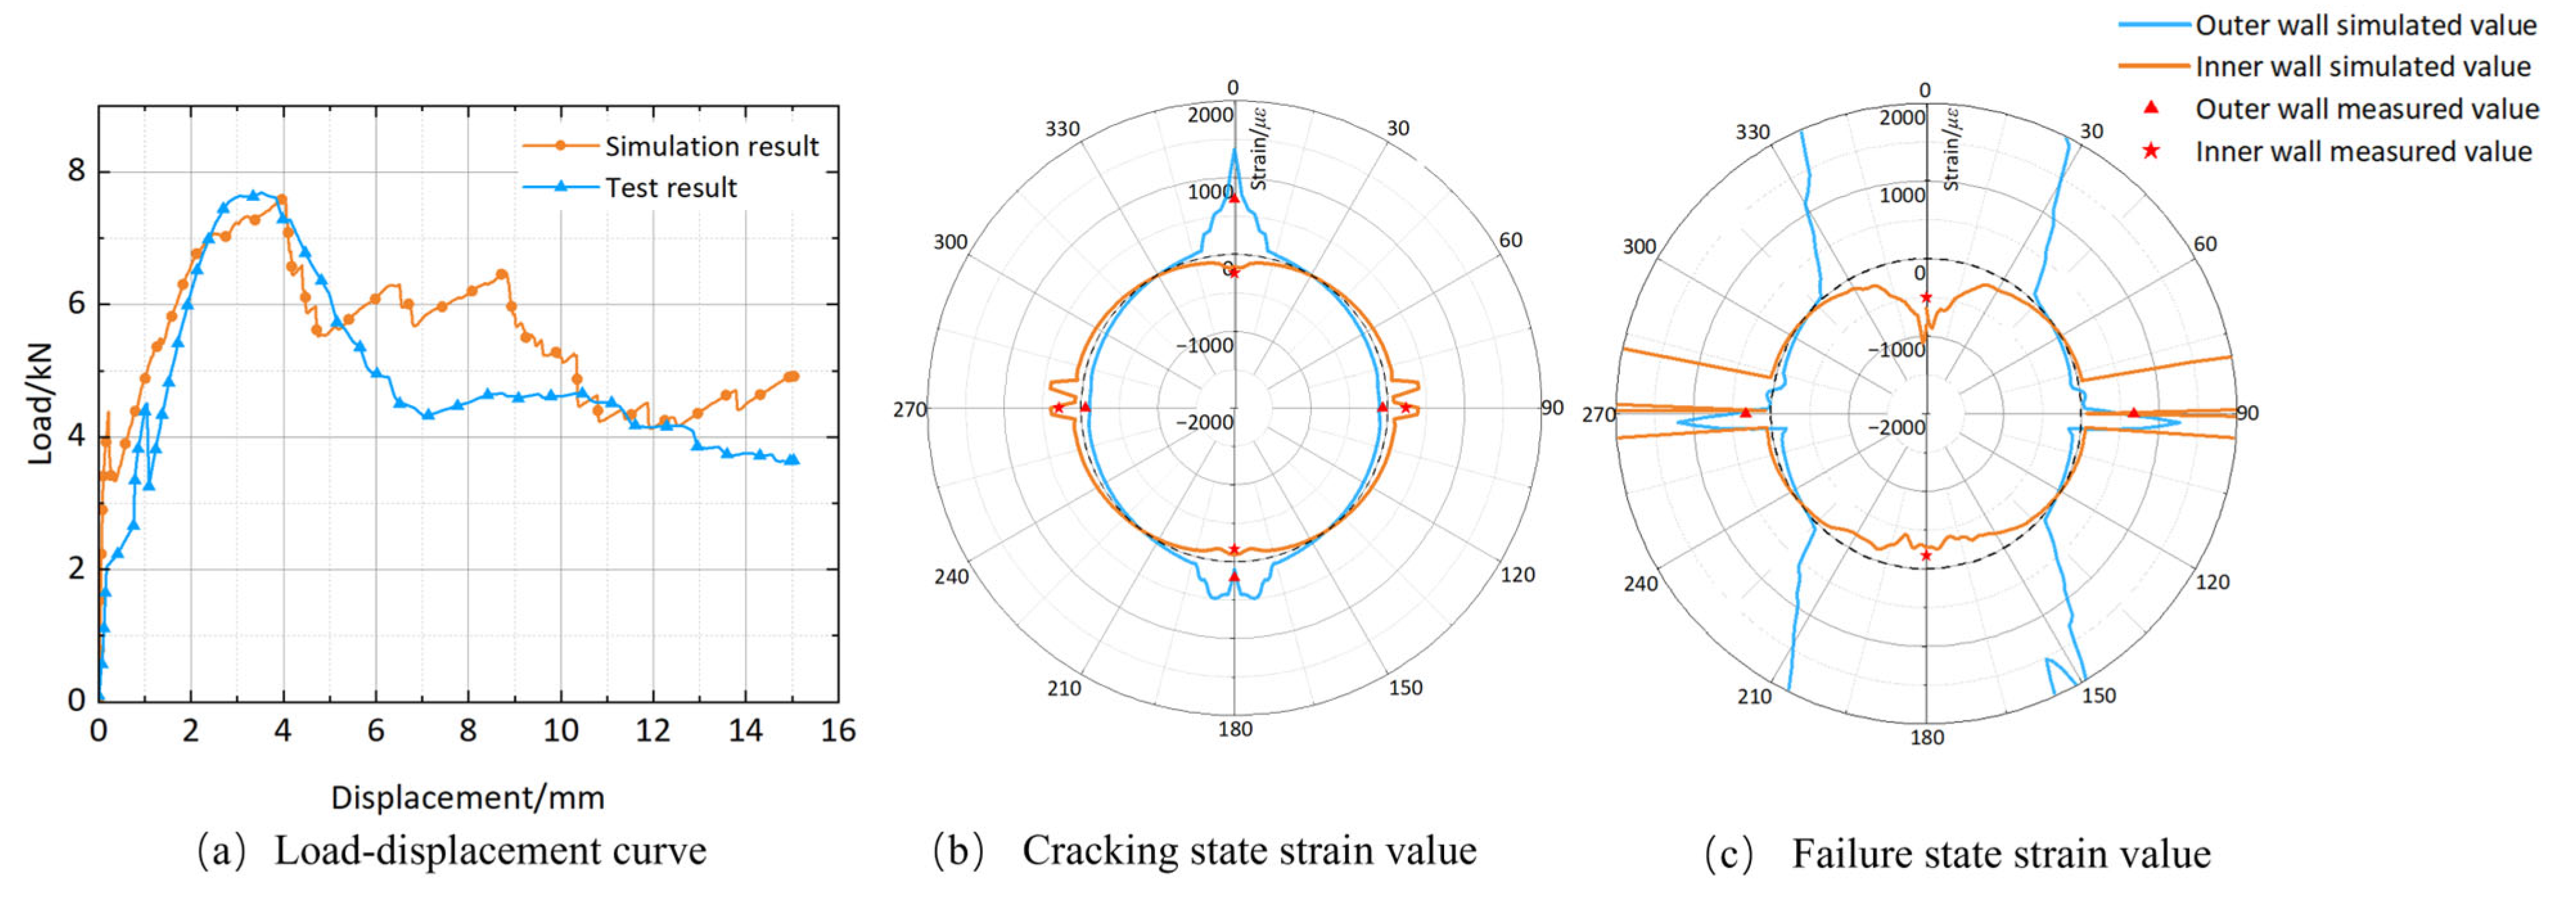
A finite element model of a DN200 pipe with a corrosion depth of 10 mm was validated against laboratory tests (Figure 8). The load–displacement responses exhibited strong agreement, with failure loads of 7.61 kN (numerical) and 7.69 kN (experimental), corresponding to a discrepancy of only 1%. Circumferential strains at critical locations also aligned with experimental measurements. In the cracked state, the model accurately reproduced stress distributions, showing compressive stresses on the outer wall and tensile stresses on the inner wall at the crown and invert, with reversed patterns and reduced strain magnitudes at the springlines. At failure, however, the simulated bearing capacity and crack-tip strains exceeded experimental results, attributable to the residual stiffness retained in damaged zones by the CDP model. Overall, the realistic reproduction of strain evolution lends confidence to the model’s reliability and applicability for engineering analysis.

4.2. Effect of Corrosion Thickness on Load-Bearing Capacity

4.2.1. Effect on Unrepaired Pipes

Load capacities of pipe models FS0, FS1, FS4, and FS7 are presented in Table 8. Given the engineering relevance of failure load (Fmax), this study investigates its correlation with corrosion thickness (x). Linear regression analysis of the data provides the following relationship:
Measured failure load (Fmax):
F max = 12.849 0.612 x , R 2 = 0.979
Simulated failure load (Fmax’):
F max = 12.631 0.599 x , R 2 = 0.984
A robust negative linear relationship exists between failure load and corrosion thickness. Thus, regular wall thickness measurements of corroded reinforced concrete pipes, such as through ultrasonic techniques, allow for straightforward estimation of remaining load-carrying capacity, offering a dependable foundation for structural integrity evaluations.
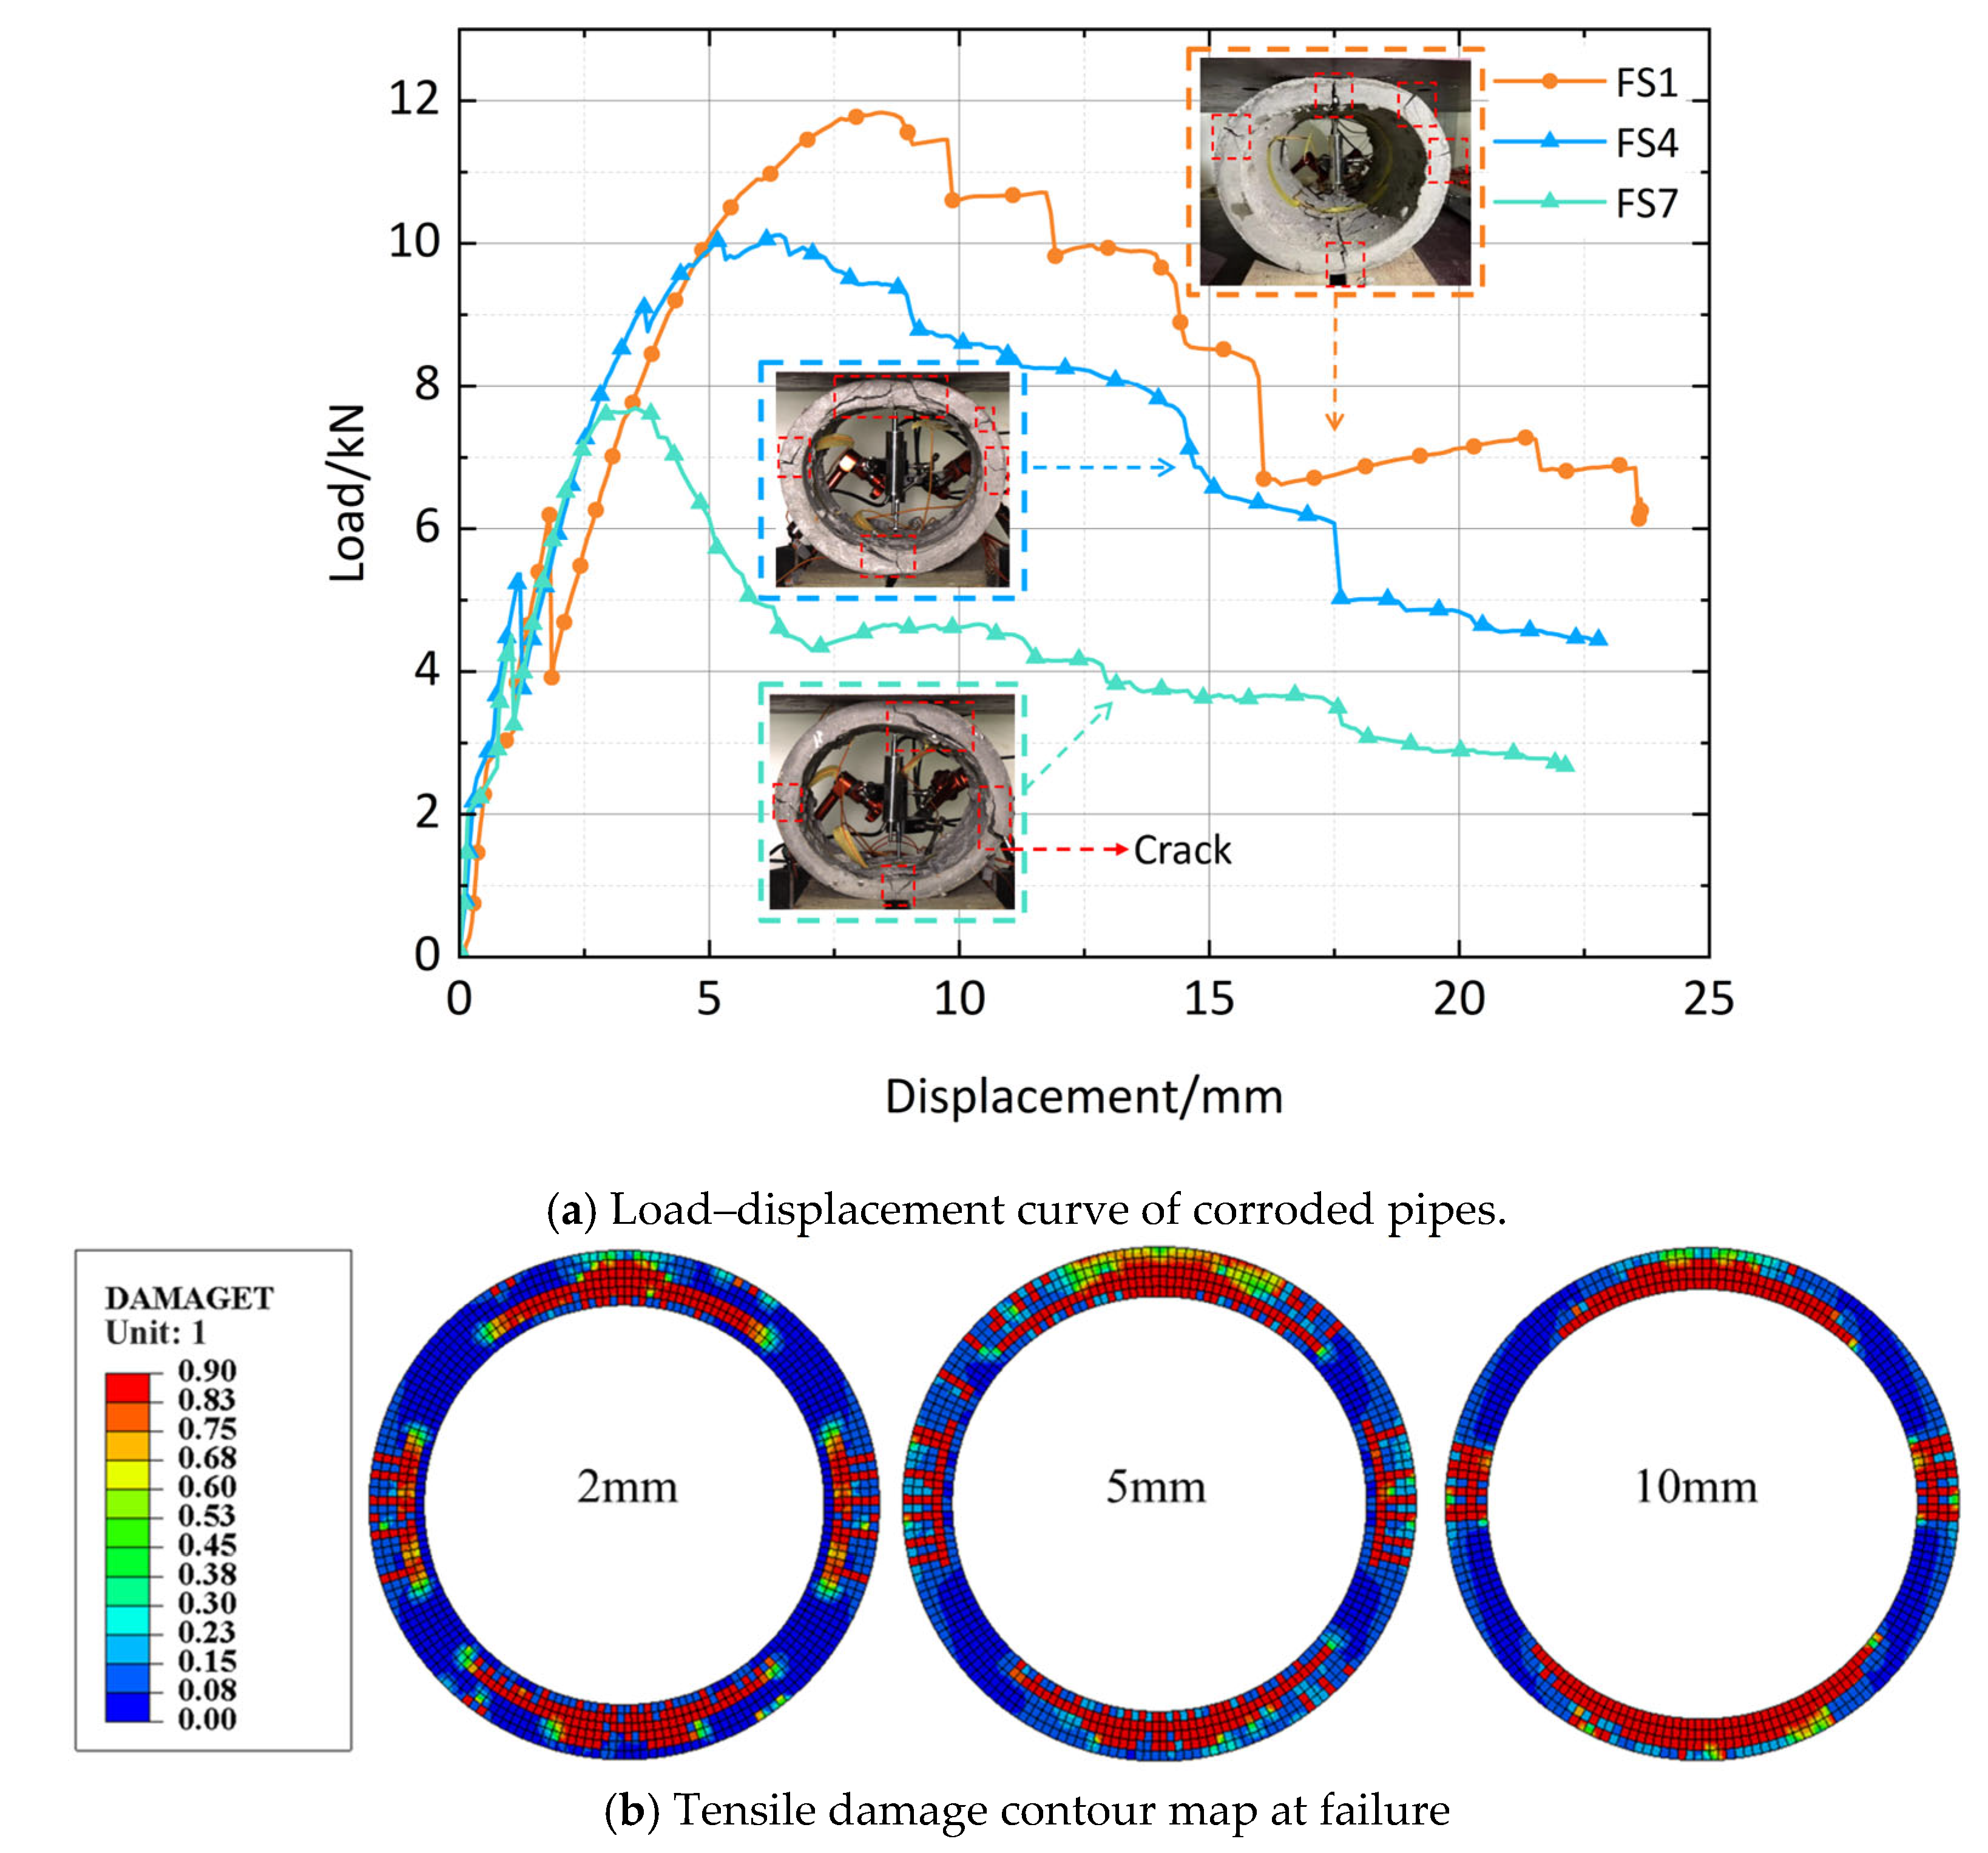
The test results for corroded pipes, shown in Figure 9, highlight the evolution of tensile damage, with damage distribution varying spatially based on corrosion thickness. As the corrosion thickness increases from 2 mm to 5 mm, the tensile damage zone at the pipe crown expands by 46.15%, while damage on the lateral sides decreases by 28.57%. As shown in Figure 9b, when corrosion thickness increases from 5 mm to 10 mm, the damage area stabilizes, but the fraction of severely damaged units rises from 67.50% to 84.38%. Critical points show near-total deterioration, consistent with experimental findings. This results from rapid crack initiation and propagation at critical points under external loads once corrosion reaches the effective thickness. Although the damage area ceases to grow, severe concrete degradation at these points causes pipeline failure.
This behavior occurs because external loading causes rapid crack initiation and propagation at vulnerable points once a critical corrosion threshold is reached. Beyond this point, the further expansion of the damage zone is halted, but the damage at critical areas intensifies, leading to severe degradation of the concrete and eventual pipe failure. This pattern underscores the influence of corrosion on the pipe’s structural integrity, particularly when the corrosion reaches a critical level where localized damage dominates.
As depicted in Figure 8, the load-crack propagation relationship of a corroded pipe prior to repair is characterized across three distinct stages:
  • Elastic Stage: a linear correlation between load and displacement is observed from the onset of loading until crack initiation. During this phase, short vertical cracks are formed in high-stress regions, specifically at the crown, invert, and springlines.
  • Crack growth Stage: From crack initiation to failure load, cracks propagate to critical widths, causing concrete failure and a sharp load drop due to brittle capacity loss. Re-inforcing bars remain unyielding, supporting the load increase. Vertical cracks at the crown and invert develop into bending-shear diagonal fractures, tapering from wider bases to narrower tips at a 45° inclination toward the load point.
  • Yield Stage: Post-reinforcement yield, the pipe fails with gradual load decline and ac-celerated deformation, marked by widespread structural degradation.

4.2.2. Effect on the Repaired Pipes

The above research highlights that corrosion thickness critically affects the evolution of structural damage in pipes. To quantitatively assess its sensitivity, this study establishes a model with a fixed repair layer thickness of 25 mm to investigate the load-bearing capacity of repaired pipes across different corrosion thicknesses. Results in Table 9 show that the numerical model closely replicates the observed load response, with a mean error of 3.61%. Linear regression is conducted to correlate corrosion thickness (x) with failure load (Fmax).
Measured failure load (Fmax):
F max = 28.778 1.652 x , R 2 = 0.957
Simulated failure load (Fmax’):
F max = 29.272 1.838 x , R 2 = 0.988
Equations (7) and (8) demonstrate a pronounced linear inverse relationship between the failure load of repaired pipes and initial corrosion thickness.
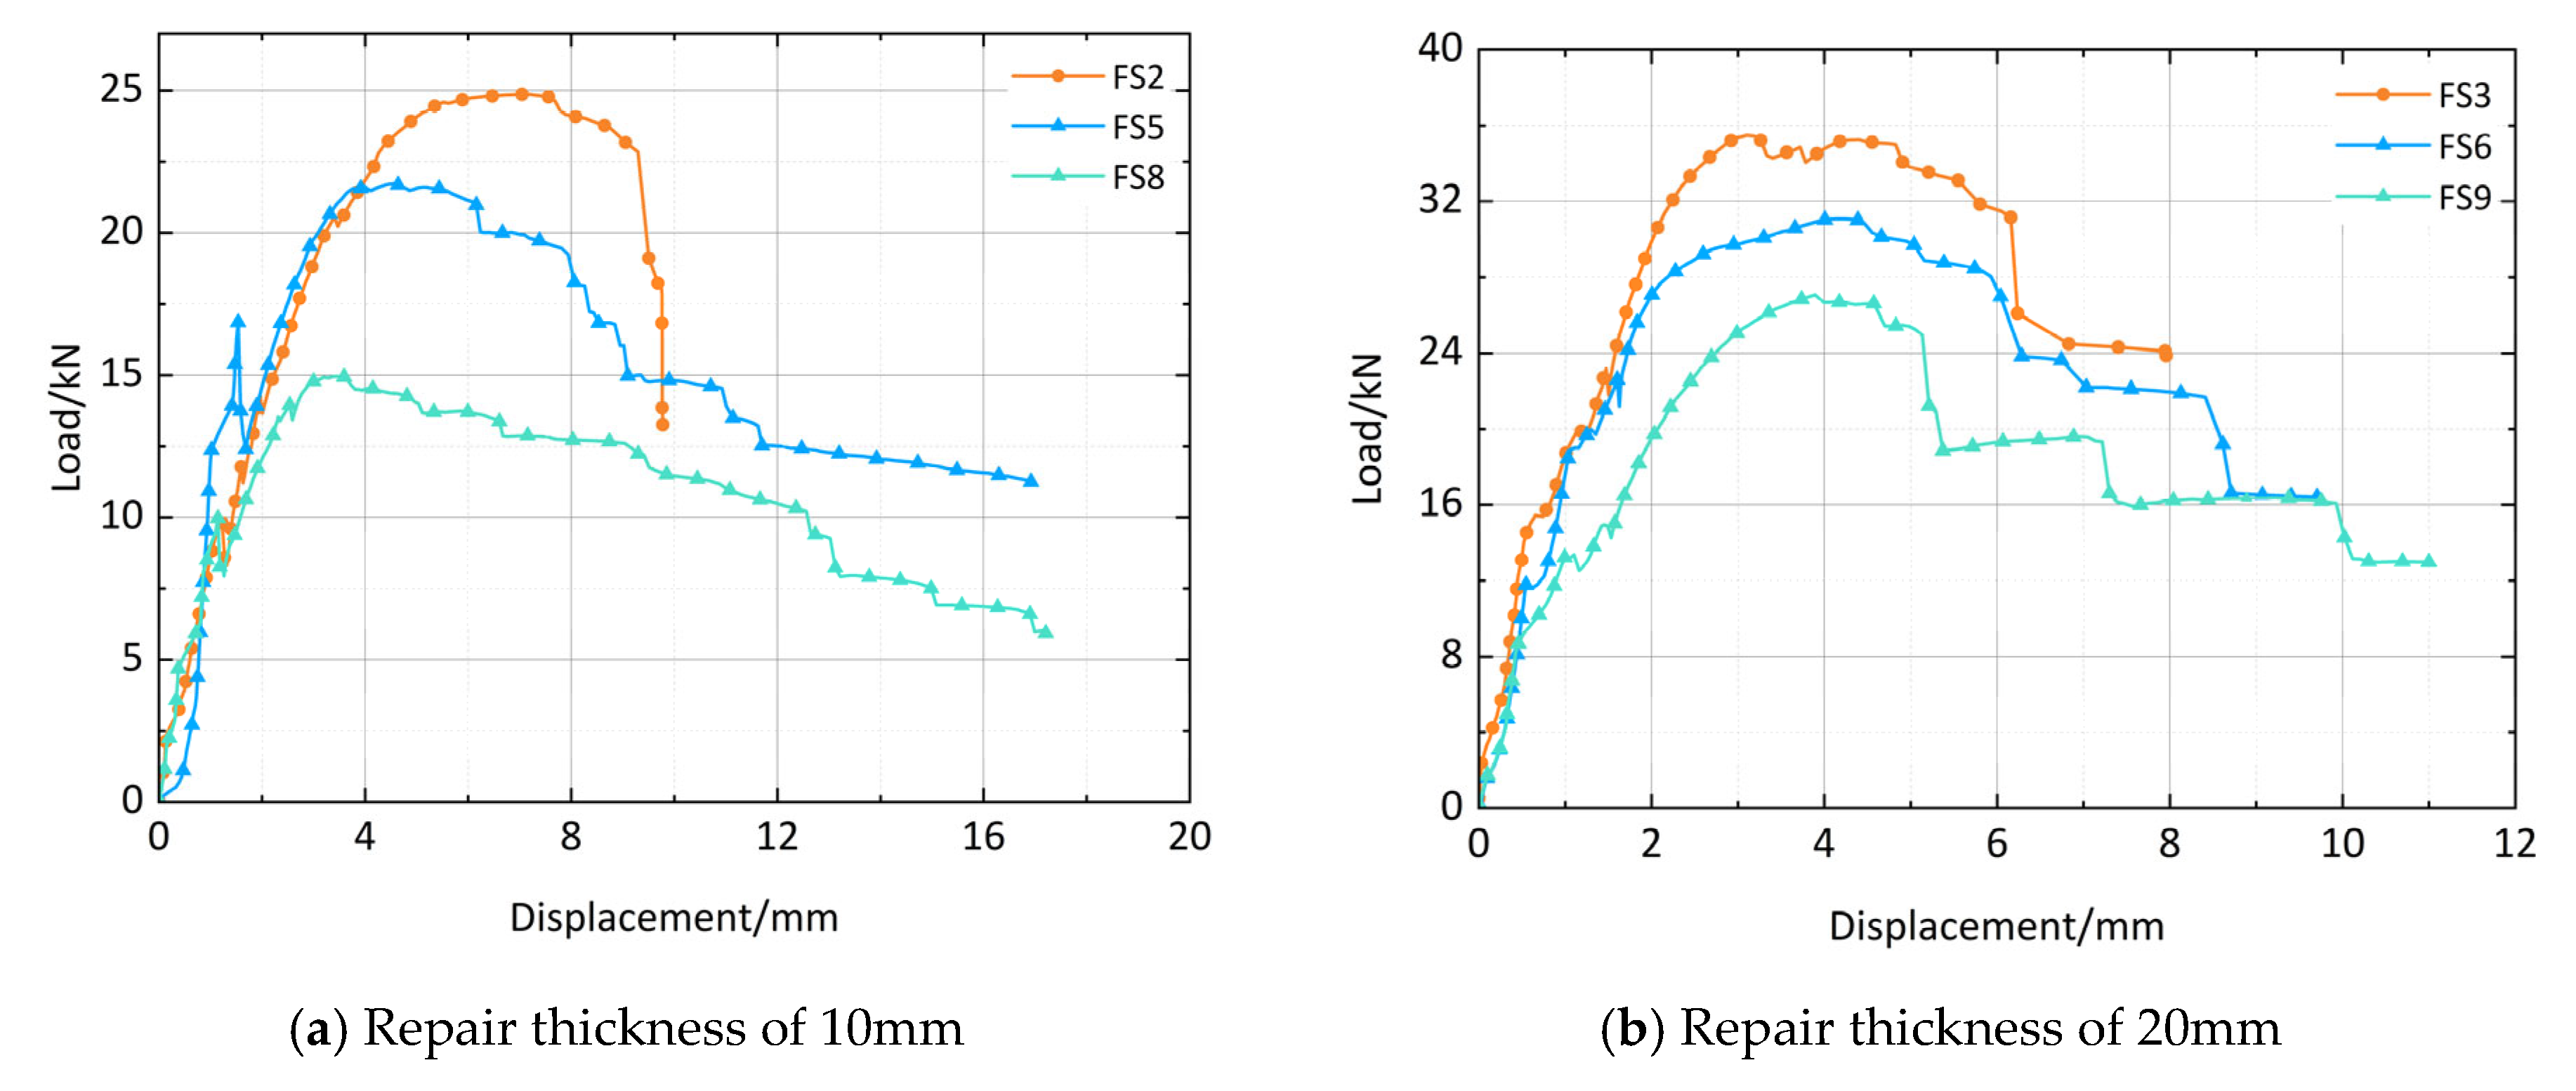
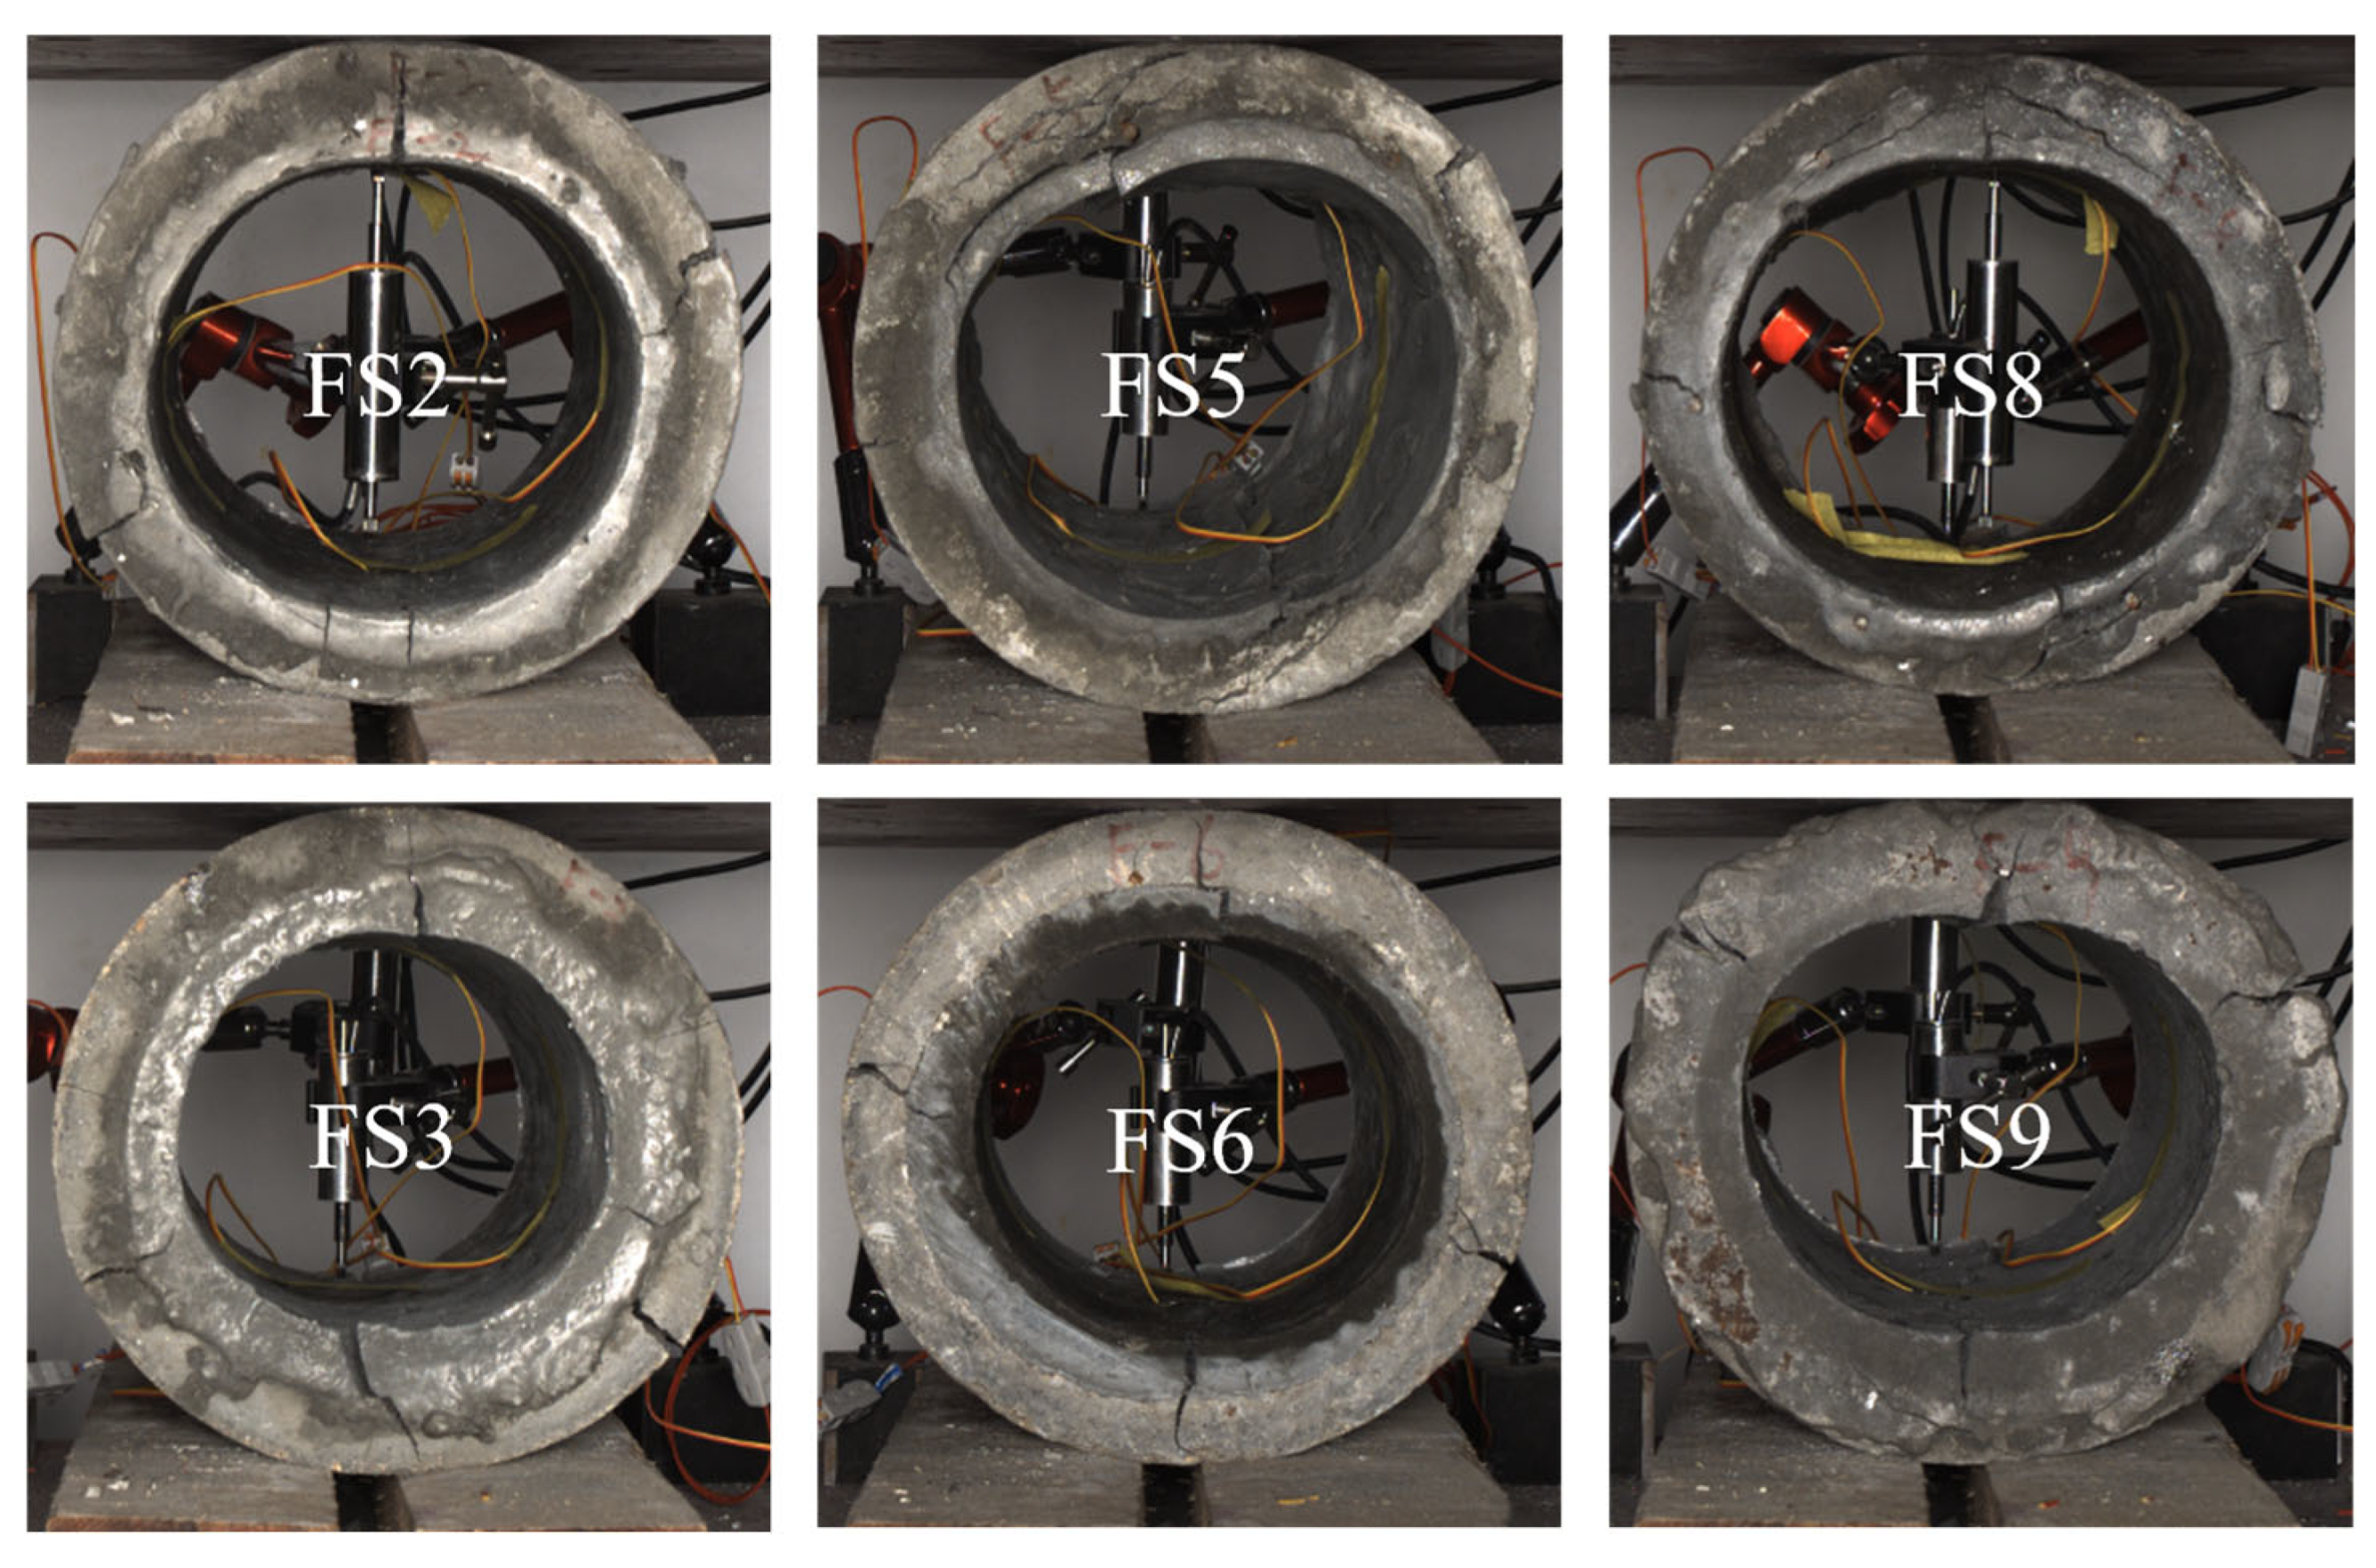
Figure 10 and Figure 11 presents the test results for repaired pipes, highlighting key failure mechanisms and load–displacement behavior:
  • Before crack initiation, repaired pipes exhibit a near-linear load–displacement response, reflecting strong elastic compatibility between the UHPC lining and host pipe, with a consistent equivalent elastic modulus
  • At crack onset, repaired pipes experience less load reduction than unrepaired ones, with the reduction decreasing as UHPC lining thickness increases, owing to the lining’s sustained post-cracking strength and enhanced flexural capacity.
  • During yielding, repaired pipes show an extended yield plateau, indicating improved ductility. The UHPC lining’s high stiffness limits localized deformation, while fiber pullout restricts crack growth, allowing greater plastic strain and delaying buckling, shifting failure from brittle to ductile.
  • With progressive loading and crack propagation, the equivalent elastic modulus gradually declines, especially in pipes with a corrosion thickness of 10 mm. Increased corrosion reduces the host pipe’s load-bearing capacity, transitioning the structure to a UHPC-dominated load-carrying system, with reduced interfacial friction accelerating modulus decline.
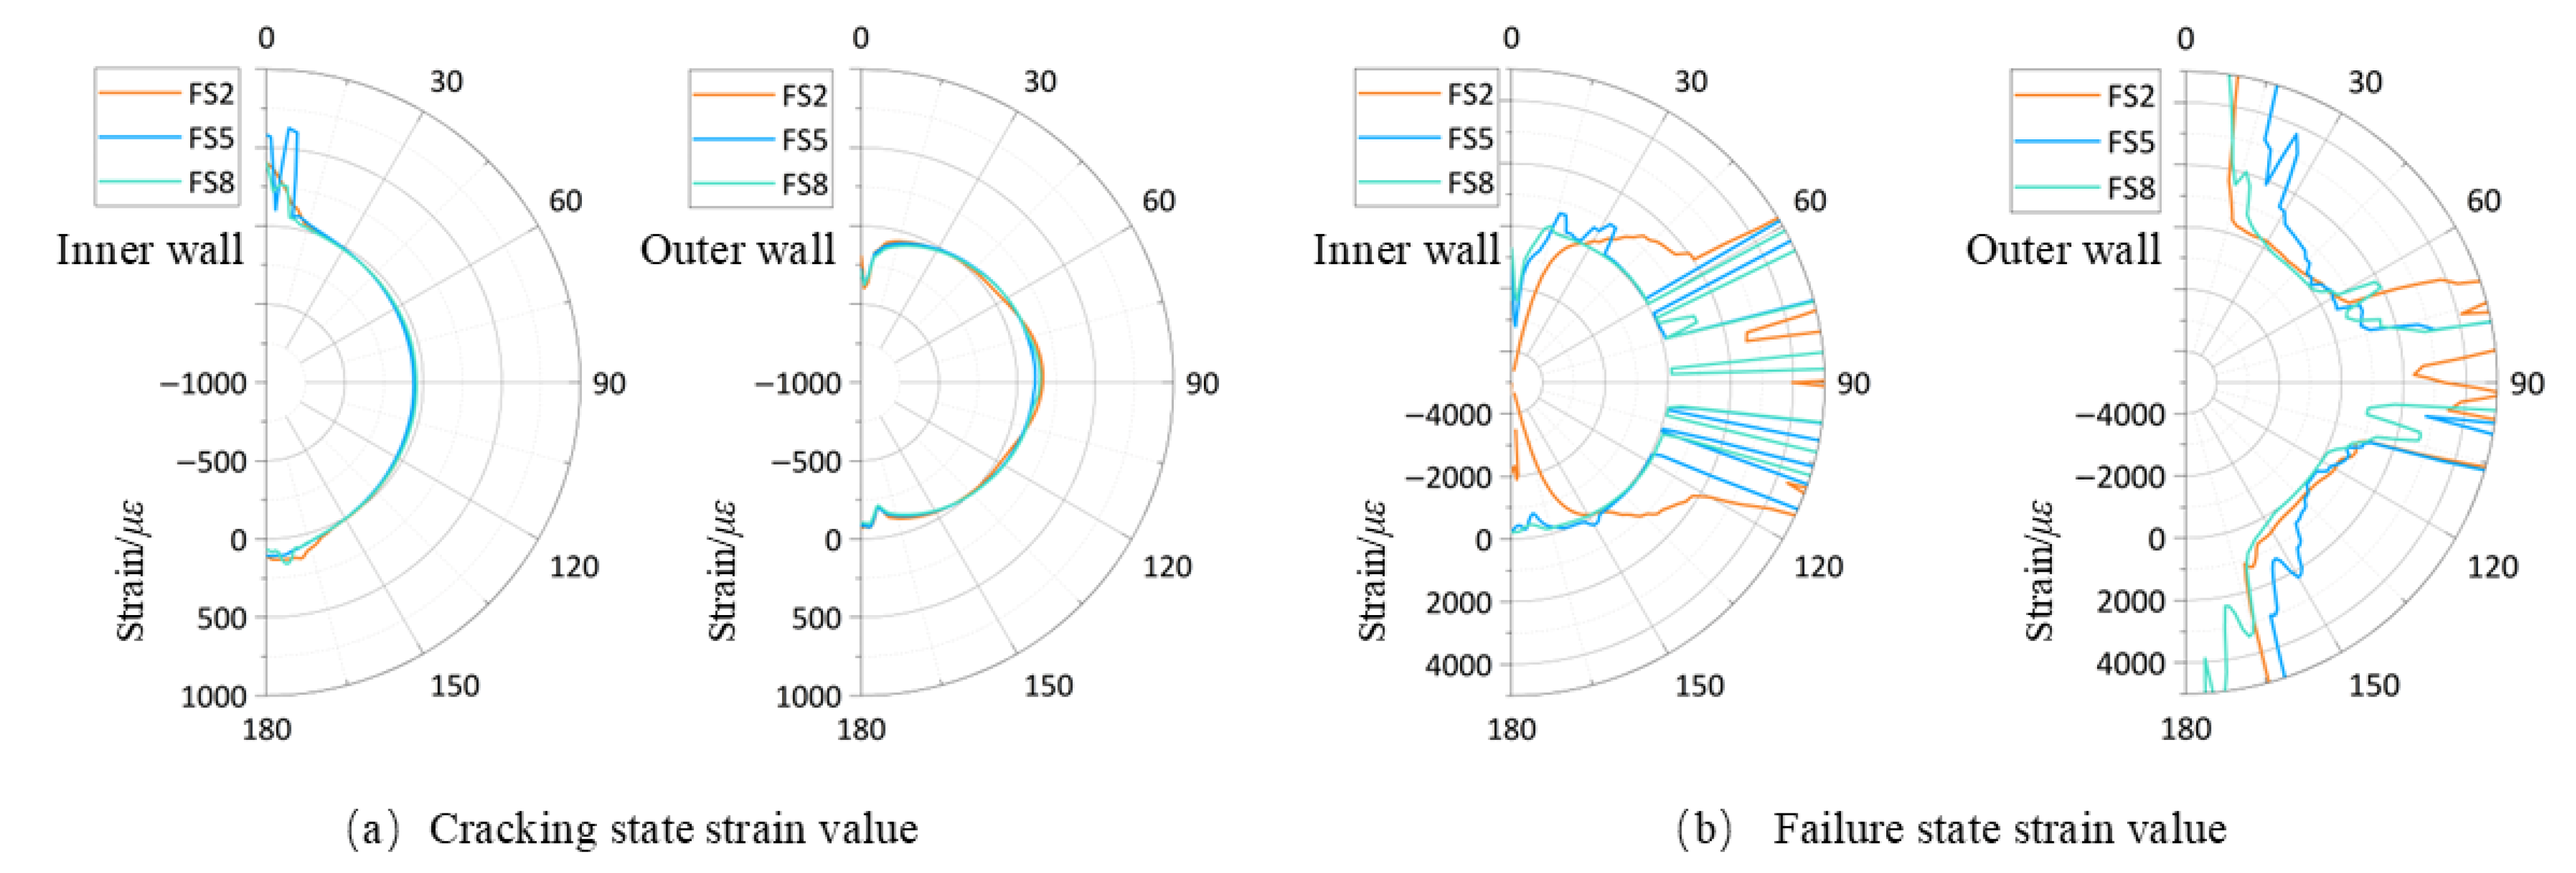
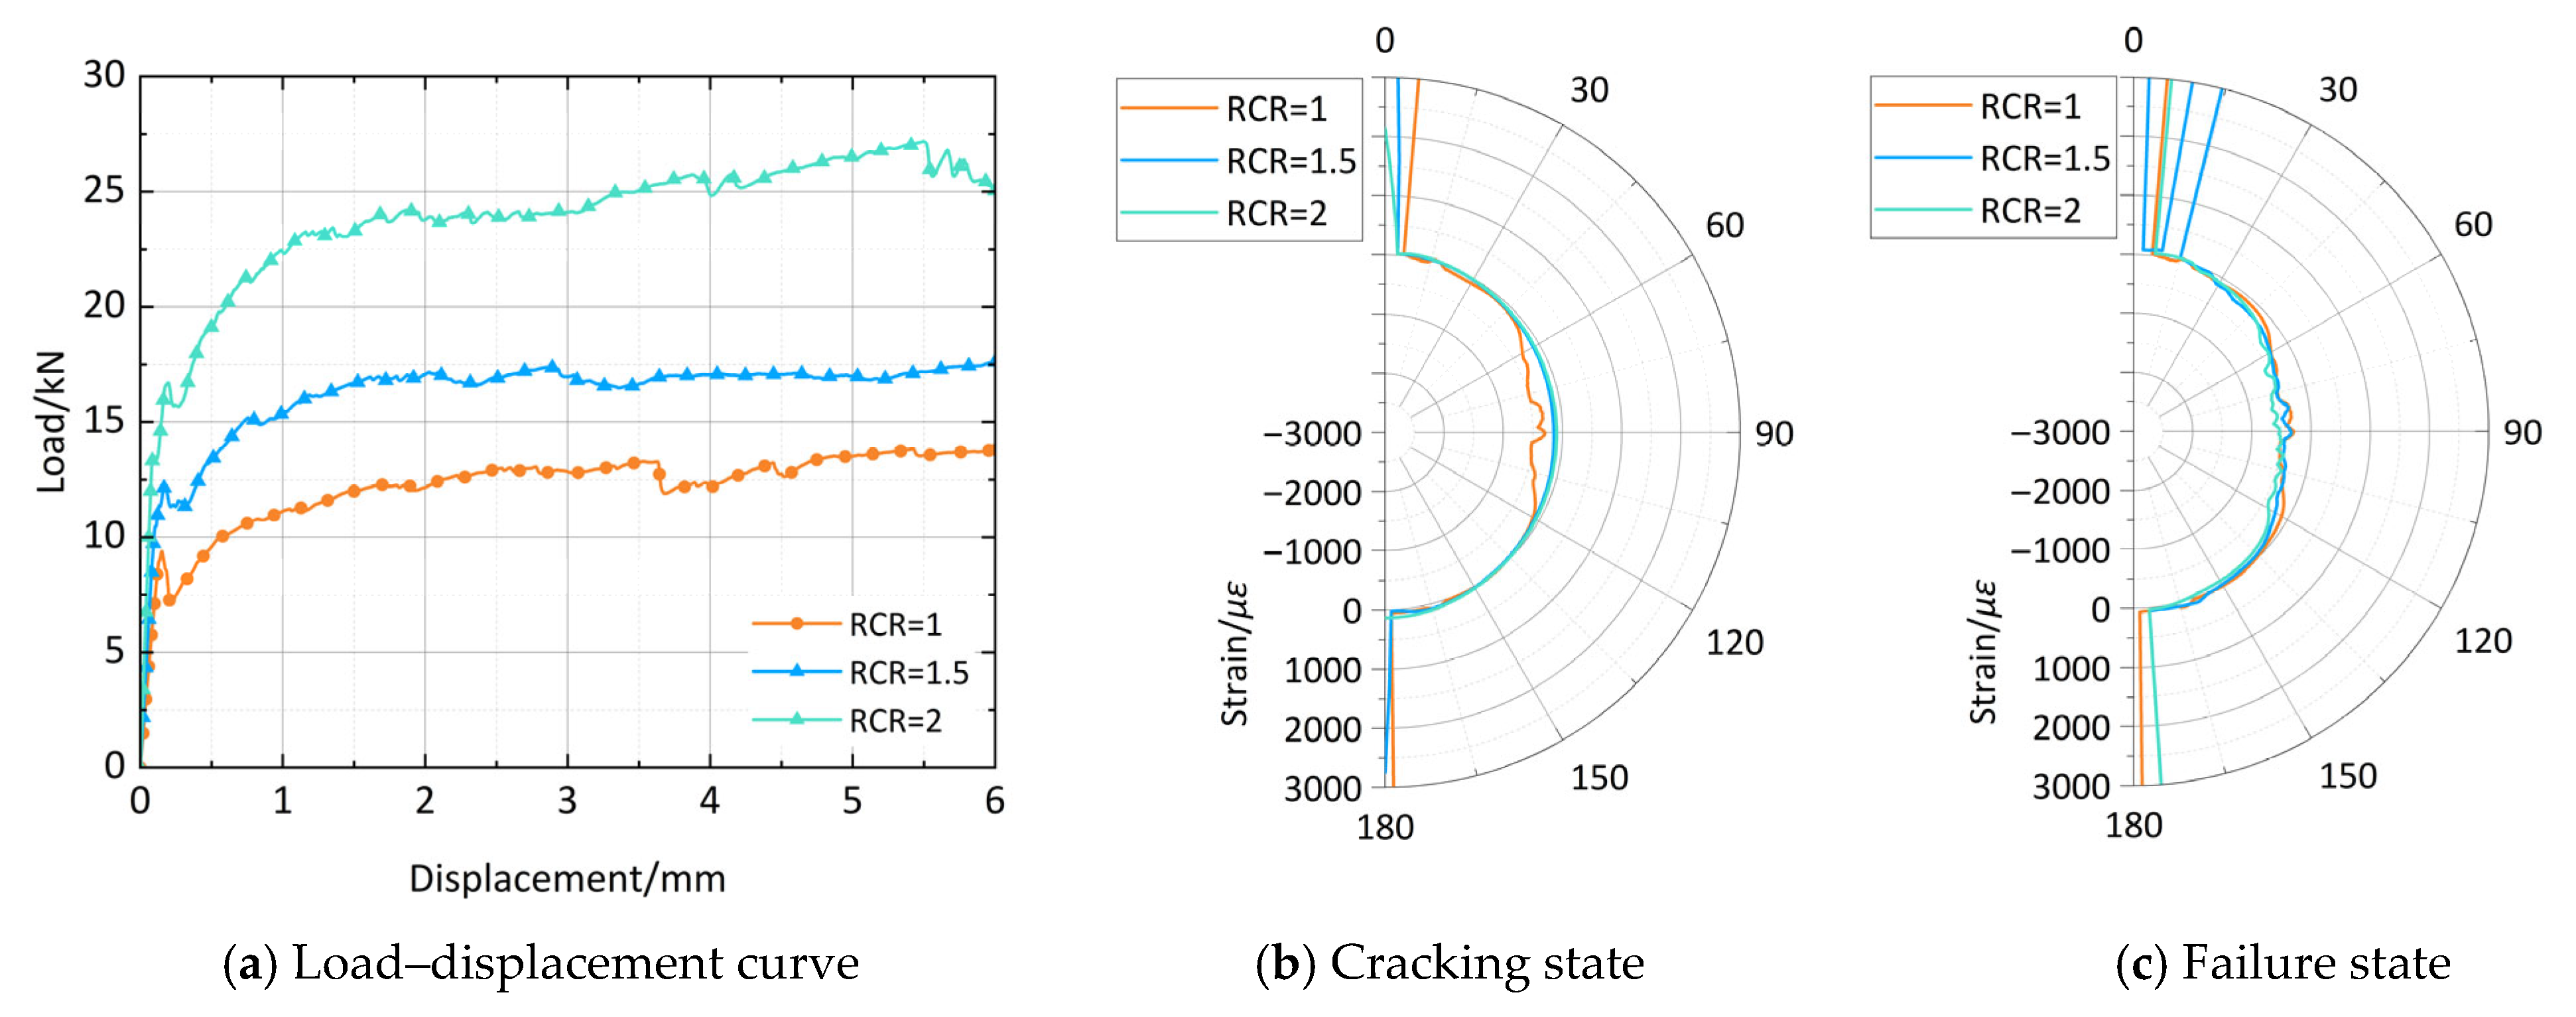
As illustrated in Figure 12, the circumferential strain profiles of repaired pipes with varying corrosion depths are presented under both cracking and ultimate failure states. In the cracking state, minimal variation in circumferential strain is observed across pipes with different corrosion thicknesses. Notably, strains at critical locations in repaired sections are significantly reduced compared to their pre-repair condition. This reduction is primarily attributed to the increased stiffness imparted by the repair layer, which effectively mitigates early crack propagation. In contrast, at the ultimate limit state, strains at critical points are observed to increase with greater corrosion depth, indicating that diminished wall thickness substantially impairs the pipe’s ability to withstand deformation.
The analysis reveals that the pipe corrosion thickness exhibits a strong linear negative correlation with load-bearing capacity in the natural bonding state, regardless of the repair status. However, greater corrosion thickness diminishes the pipe’s deformation resistance, reducing interface strength and consequently impacting the composite performance of the repaired system.

4.3. Effect of Repair Thickness on Load-Bearing Capacity

Table 10 presents the results of the indoor test. Linear regression was performed on pipe data with consistent corrosion thickness to examine the relationship between repair thickness (y) and failure load (Fmax).
Corrosion thickness of 2 mm:
F max 1 = 1.191 y + 12.208 , R 2 = 0.997
Corrosion thickness of 5 mm:
F max 2 = 1.048 y + 10.497 , R 2 = 0.996
Corrosion thickness of 10 mm:
F max 3 = 0.970 y + 6.880 , R 2 = 0.979
UHPC repair markedly enhanced the load-carrying capacity of reinforced concrete pipes. A strong linear positive correlation (R2 > 0.979) was observed between repair thickness and performance improvement. For each 5 mm increment in repair thickness, the load capacity of pipes with 2 mm, 5 mm, and 10 mm corrosion increased by 48.78%, 49.92%, and 70.49%, respectively. Increased repair layer thickness augments the cross-sectional moment of inertia, effectively mitigating crack propagation.
A Repair Compensation Ratio (RCR), defined as the ratio of repair thickness to corrosion loss, was introduced to evaluate the combined influence of repair and corrosion on load-carrying capacity. As depicted in Figure 13b,c, during the cracking phase, repair thickness exhibits a negative correlation with circumferential strain at critical points; however, at the failure load state, a positive correlation emerges. This indicates that thicker repair layers effectively bolster initial crack resistance and long-term deformation resistance in repaired pipes.

4.4. Effect of Interface Type on Load-Bearing Capacity

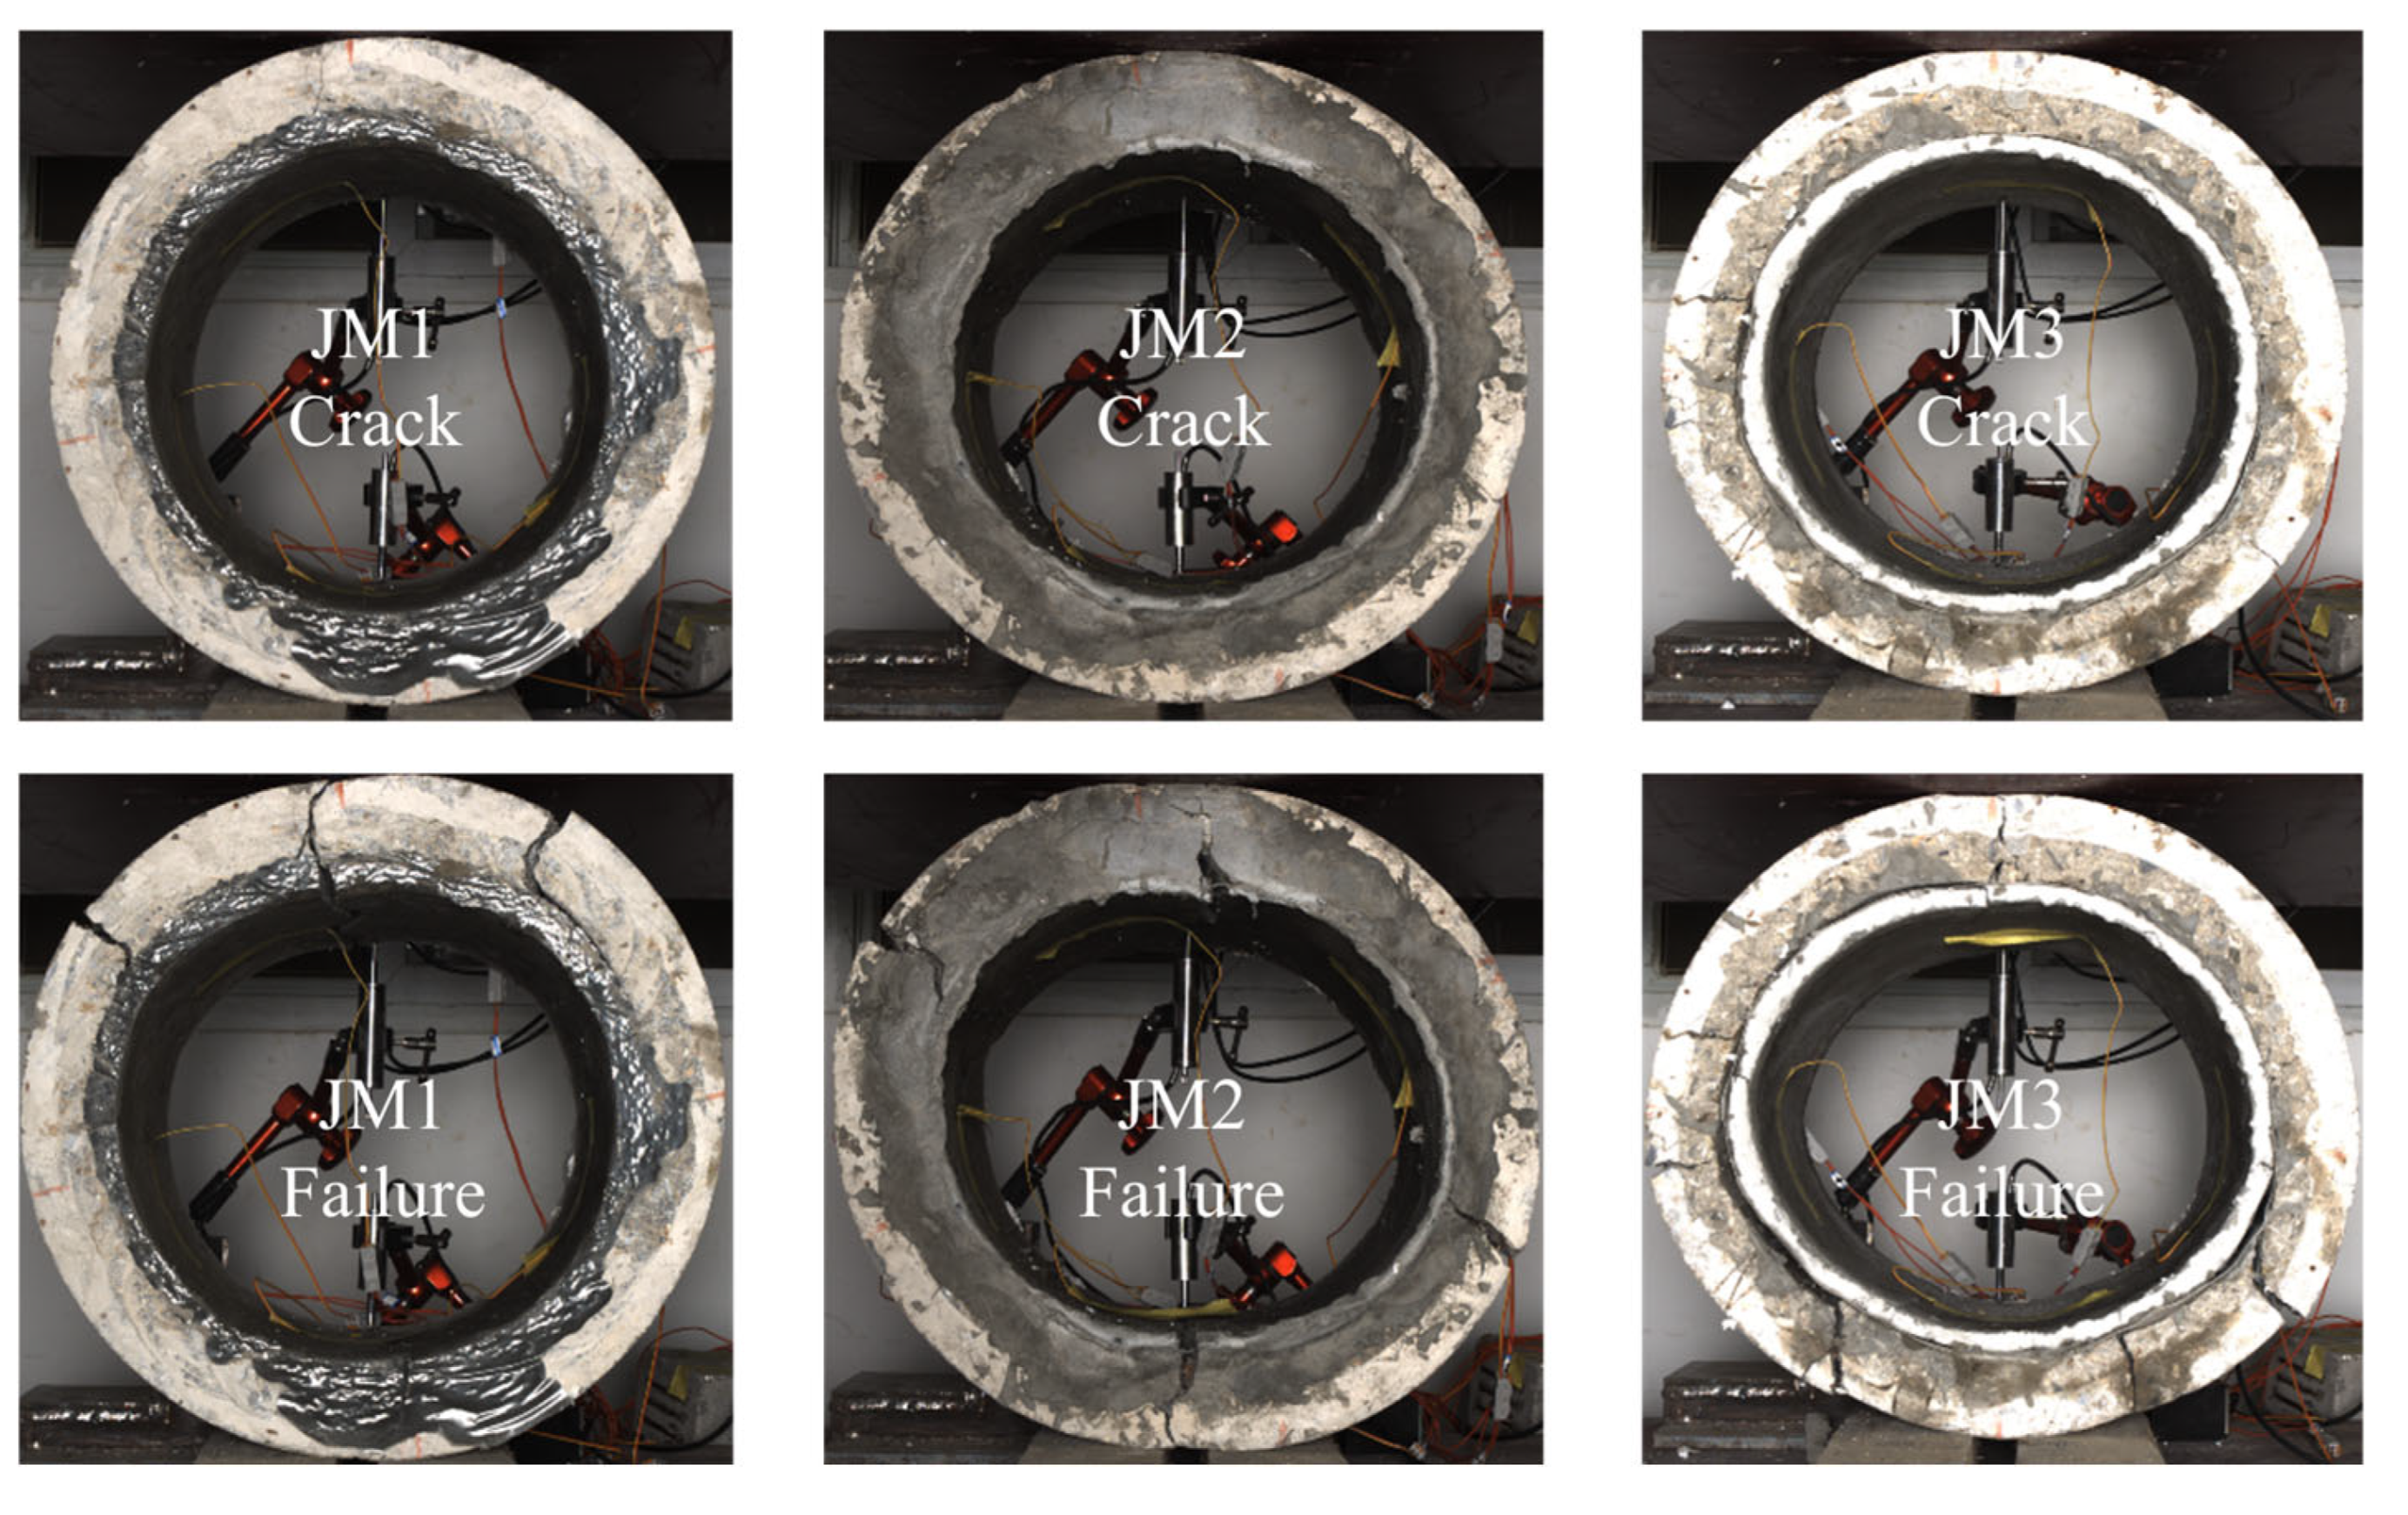
Experimental results indicate failure loads of 6.32 kN, 11.70 kN, 21.96 kN, and 10.71 kN for pipe groups JM0, JM1, JM2, and JM3, respectively. Post-repair, load capacities increased by 69.46%, 85.13%, and 247.47%, with JM2 (nail-embedded interface) showing the highest enhancement, 3.56 and 2.91 times greater than other groups.
The loading process diagrams of each group of specimens are shown in Figure 14. JM1 and JM2 developed cracks at the pipe’s top and bottom at displacements of 2.30 mm and 2.60 mm, respectively, while JM3 cracked at 1.32 mm, indicating lower crack resistance. JM1 and JM3 exhibited interfacial debonding; in JM1, debonding occurred post-failure load, enabling a slight load capacity increase post-cracking, whereas JM3’s debonding aligned with failure load, causing rapid lining failure and load stagnation. JM2 showed no debonding, retained partial load capacity post-cracking, and failed only due to excessive crack widening. These results highlight that nail embedding effectively prevents debonding, enhances bond strength, maintains composite integrity, and optimizes the lining’s supportive role.
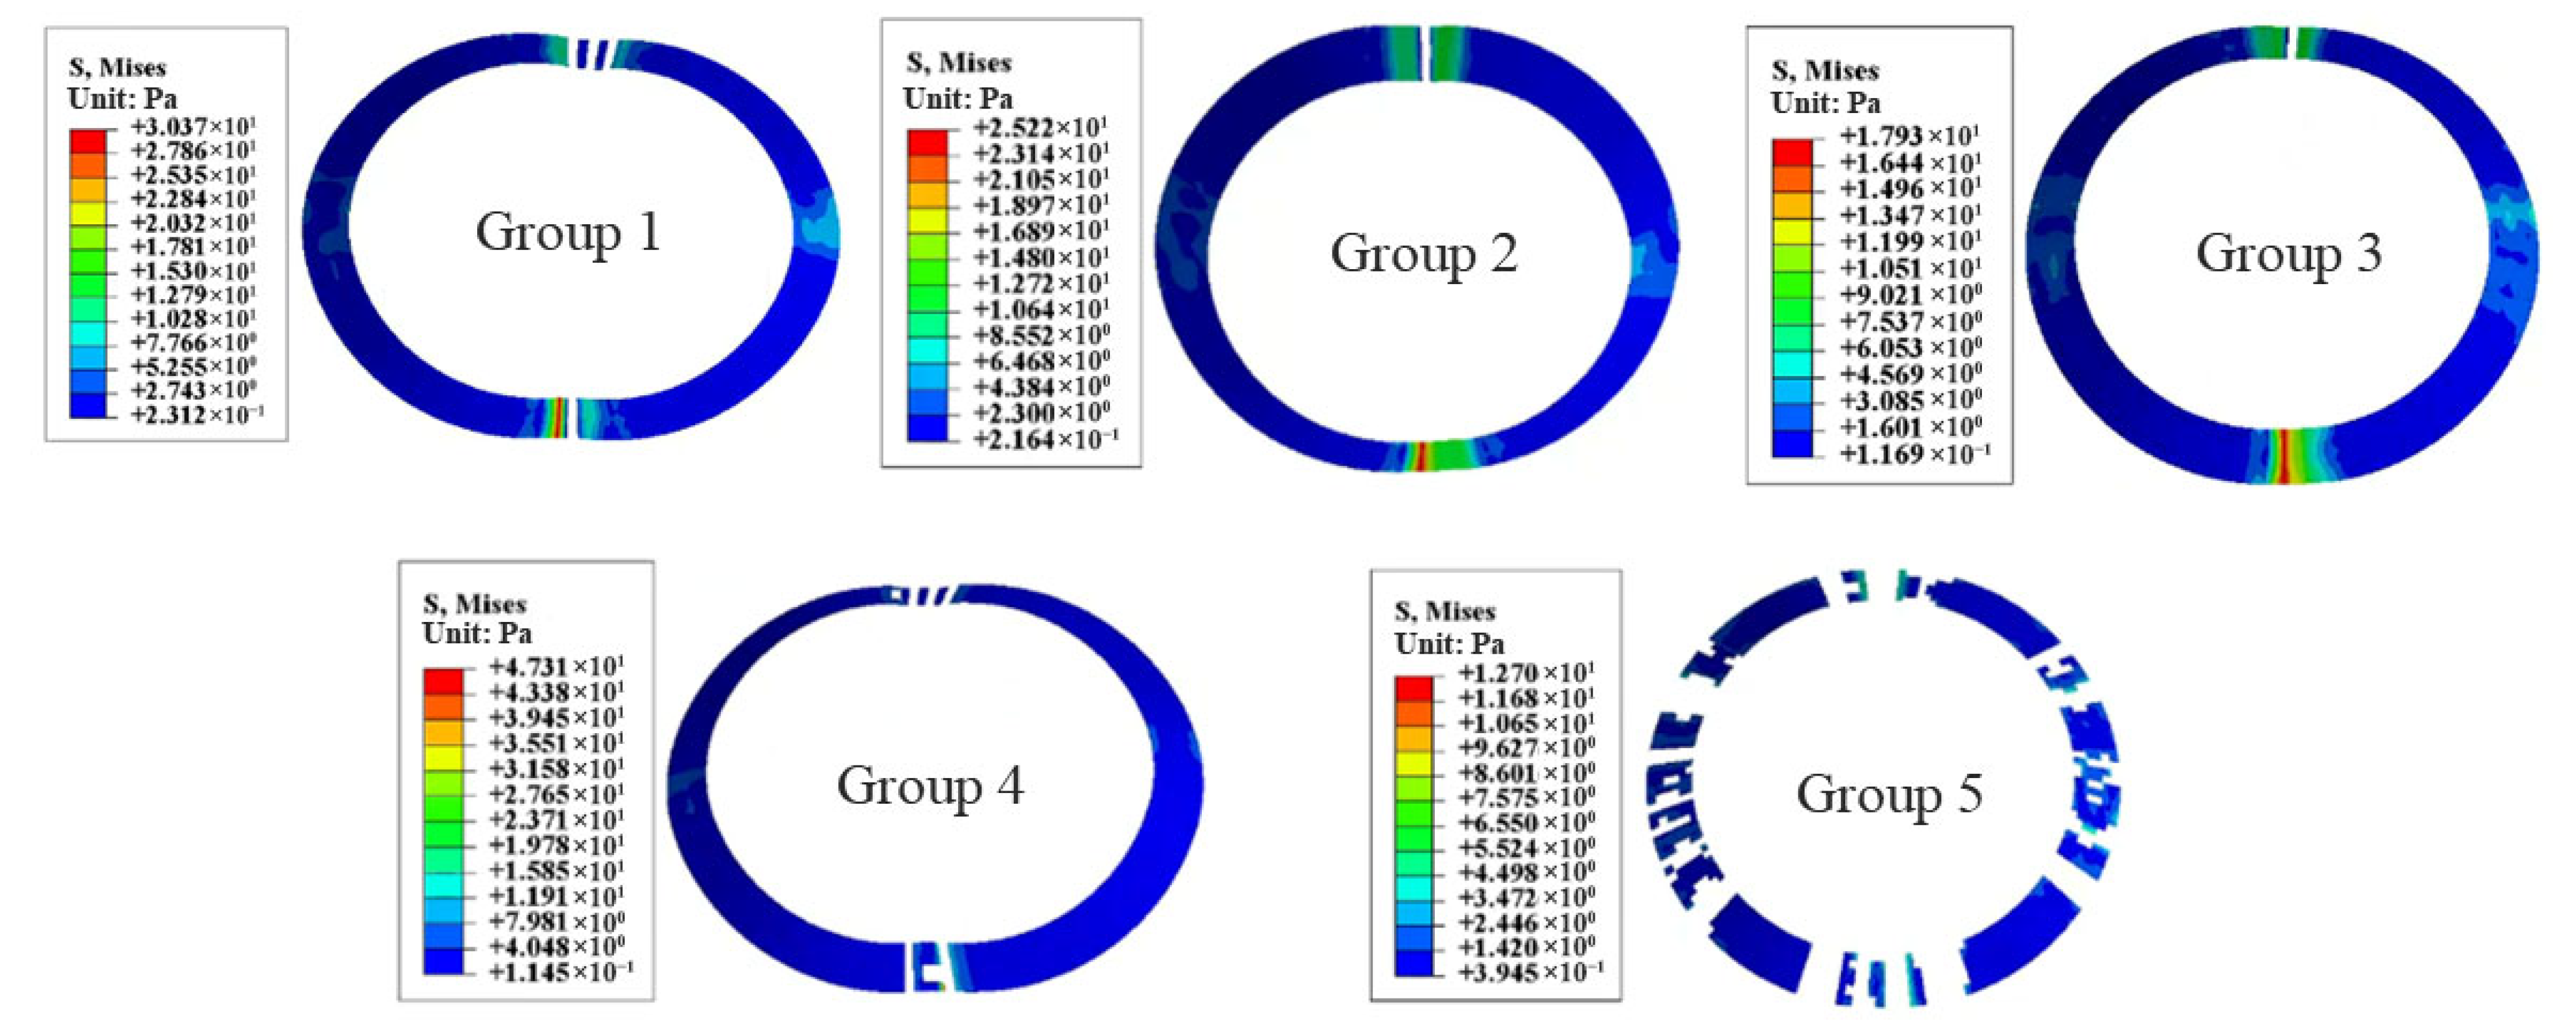
Table 11 presents failure load values for varying interface parameters, highlighting the combined influence of interface fracture energy and shear strength on the composite system’s load-bearing capacity. When interfacial shear strength is fixed at 16.1 MPa, increasing fracture energy from 0.1 N/mm to 0.9 N/mm results in a failure load variation of 1.9%. Conversely, with fracture energy held at 0.9 N/mm, reducing shear strength from 4.5 MPa to 0.45 MPa leads to a 9.5% decrease in failure load, five times the impact of fracture energy. This underscores the dominant role of interfacial shear strength in load-carrying capacity, as it governs resistance to interlayer slip under internal pressure, bending, and other loads. Slip triggers rapid structural instability, whereas fracture energy primarily mitigates delamination propagation more slowly, with less direct influence on failure load.
Figure 15 illustrates the Mises stress distribution, elucidating the mechanical response of interface parameters. Comparisons across conditions 1 to 3 show that increasing fracture energy markedly reduces the interfacial debonding area. Conversely, comparisons from conditions 3 to 5 reveal that decreasing interfacial shear strength significantly exacerbates interfacial slip, with a substantially greater impact than that of fracture energy.
TEBT results show that a smooth interface between the inner lining and existing pipe forms a unitized structure with a failure load 15.67% lower than a naturally bonded interface. A surface-to-surface contact model (friction coefficient μ = 0.1, normal hard contact) was developed to analyze load-bearing behavior, with results shown in Figure 16. At 93% of the failure load, tensile damage initiated at the crown of the existing pipeline, causing an abrupt load drop. The load then gradually recovered, supported by the inner lining until its failure triggered a second sudden load drop, aligning with experimental observations. Damage primarily affected the existing pipeline, with a noticeable gap between it and the inner lining. This suggests independent bending deformation of the pipeline and lining during loading, with no significant interface bonding. The existing pipeline reached its strength limit before the inner lining could contribute substantially, and interface slip limited the lining’s capacity, resulting in minimal enhancement of the repaired structure’s overall load-bearing capacity.
The results indicate that interfacial bonding depends on the combined effects of fracture energy and shear strength, with shear strength exerting a fivefold greater influence than fracture energy. Enhanced fracture energy can suppress debonding propagation, provided no interfacial sliding occurs. However, when sliding dominates failure, the benefits of increased fracture energy are diminished. Therefore, to enhance pipeline repair, locally reinforce shear strength at stress concentration zones (e.g., pipeline top, bottom, and spring line) using interface bolt fixation. During service, prioritize monitoring the interface sliding in these zones. Effective monitoring techniques include linear variable differential transformers (LVDTs), fiber Bragg grating (FBG) sensors, and inclinometers/inertial measurement units (IMUs).

5. Conclusions

This study investigates the load-bearing capacity of corroded reinforced concrete pipes through experimental and numerical methods, focusing on corrosion depth, repair thickness, and interface properties. Strain, load–displacement behavior, and damage progression were analyzed. Key findings are:
  • Load–displacement response includes elastic, crack propagation, and yield phases. UHPC linings reduce crack-induced load drops, delay buckling, enhance yield capacity, and shift failure from brittle to ductile.
  • The residual load-bearing capacity of corroded pipes exhibits a linear decrease with increasing corrosion depth, while it improves with greater repair thickness, enhancing both crack resistance and deformation capacity. Specifically, for each 5 mm increase in UHPC lining thickness, the load-bearing capacity of pipes with 2 mm, 5 mm, and 10 mm corrosion depths rises by 48.78%, 49.92%, and 70.49%, respectively.
  • Interface shear strength and fracture energy significantly affect repaired pipe capacity. Higher fracture energy minimizes debonding, while lower shear strength increases sliding, impacting capacity fivefold more than debonding. Independent damage in composite systems reduces capacity compared to fully bonded structures. Interface design should optimize shear strength.
  • Nail embedding enhances shear strength, increasing capacity by 2.91 times over natural bonding and preventing debonding. Unitized systems with polyethylene films reduce load-sharing due to sliding, lowering failure load by 15.67%. Localized shear reinforcement, such as nail embedding, is recommended for high-stress zones, with continuous monitoring of interfacial sliding for durability. Future research is advisable to optimize UHPC composition and investigate diverse interface treatments, including roughening and varied steel nail configurations, to further elucidate their impact on pipeline load capacity.

Author Contributions

Conceptualization, D.W. and P.Z.; methodology, C.Z. and C.G.; software, D.W.; validation, D.W., P.Z. and C.Z.; formal analysis, D.W. and C.G.; investigation, P.Z.; resources, P.Z.; data curation, D.W. and C.G.; writing—original draft preparation, D.W. and C.G.; writing—review and editing, C.Z.; visualization, P.Z.; supervision, P.Z. All authors have read and agreed to the published version of the manuscript.

Funding

This research received no external funding.

Data Availability Statement

All data that support the findings of this study are available from the corresponding author upon reasonable request.

Conflicts of Interest

Author Chenkun Gong was employed by the company Hubei Communications Planning and design Institute Co., Ltd. The remaining authors declare that the research was conducted in the absence of any commercial or financial relationships that could be construed as a potential conflict of interest.

Abbreviations

The following abbreviations are used in this manuscript:
RCPsReinforced concrete pipes
SRBSulfate-reducing bacteria
UHPCUltra-high performance concrete
NCNormal concrete
TEBTThree-Edge Bearing Test
CDPConcrete damage plasticity

References

  1. Wang, M.; Wang, Y.; Tan, Z. Exploration on the Comprehensive Utilization of Underground Space in China’s Smart City. Beijing Jiaotong Univ. 2016, 40, 1–8. [Google Scholar]
  2. Liu, H.; Liu, J.B.; Zhu, Z.H.; Zhao, Y.H.; Wang, Z.G.; Qiao, L.X.; Luan, Q.X.; Zhang, P. Influence of Corrosion-Induced Concrete Thinning on the Bearing Capacity of Reinforced Concrete Pipes. Civ. Eng. Manag. 2022, 39, 62–75. [Google Scholar]
  3. Wang, F. Theoretical Analysis and Experimental Study on Stress Characteristics of Damaged Concrete Pipes Repaired by In-Situ Spraying. Ph.D. Thesis, China University of Geosciences, Wuhan, China, 2022. [Google Scholar]
  4. Kong, Y. Study and Application of Cast In-Situ Method for Pipeline and Manhole Trenchless Rehabilitation. Ph.D. Thesis, China University of Geosciences, Wuhan, China, 2017. [Google Scholar]
  5. Lin, S.; Huang, Q.; Chen, B.; Chen, Y. Design of U-RC Composite Pier of Sea-Crossing Bridge. Traffic Transp. Eng. 2017, 17, 55–65. [Google Scholar]
  6. Wang, C. Global Structure Analysis and Optimal Design of the Pier in T-Type Rigid Bridge Constructed with Rotation Method. Ph.D. Thesis, Southwest Jiaotong University, Chengdu, China, 2017. [Google Scholar]
  7. Hu, Y. The Axial Compressive Performance Study of a Reactive Powder Concrete Precast Tube Concrete Composite Columns. Ph.D. Thesis, Hunan University, Changsha, China, 2015. [Google Scholar]
  8. Bolina, F.L.; Poleto, G.; Carvalho, H. Proposition of parametric data for UHPC at high temperatures. J. Build. Eng. 2023, 76, 107222. [Google Scholar] [CrossRef]
  9. Bolina, F.L.; München, R.M.; Lago, B.D.; Kodur, V. A comparative study between ultra-high-performance concrete structures and normal strength concrete structures exposed to fire. Structures 2024, 68, 107197. [Google Scholar] [CrossRef]
  10. Yang, J.; Chen, B.; Su, J.; Xu, G.; Zhang, D.; Zhou, J. Effects of fibers on the mechanical properties of UHPC: A review. J. Traffic Transp. Eng. Engl. Ed. 2022, 9, 363–387. [Google Scholar] [CrossRef]
  11. Shi, C.J.; He, W.; Wu, Z.; Wu, L.; Zhu, D.; Huang, Z. Influence of Fibers on Mechanical Properties of UHPC. Bull. Chin. Ceram. Soc. 2015, 34, 2227–2247. [Google Scholar]
  12. Yuan, C.; Xu, S.; Raza, A.; Wang, C.; Wang, D. Influence and Mechanism of Curing Methods on Mechanical Properties of Manufactured Sand UHPC. Materials 2022, 15, 6183. [Google Scholar] [CrossRef]
  13. Wu, T.R. Durability of UHPC-Normal Concrete Bond Interface under Marine and Freeze-Thaw Conditions. Ph.D. Thesis, Guangdong University of Technology, Guangdong, China, 2025. [Google Scholar]
  14. Yang, Y.B.; Yue, X.D.; Zheng, F.B.; Liu, F.C.; Guo, W.Y.; Wang, H.C. Research on sewage corrosion resistance of ultra high performance concrete. Ind. Constr. 2020, 50, 82–87. [Google Scholar]
  15. Cheng, X.Y. Study on Durability of UHPC in Sulfuric Acid Environment. Ph.D. Thesis, Guangdong University of Technology, Guangzhou, China, 2024. [Google Scholar]
  16. Liu, J.; Wei, J.; Li, J.; Su, Y.; Wu, C. A comprehensive review of ultra-high performance concrete (UHPC) behaviour under blast loads. Cem. Concr. Compos. 2024, 148, 105449. [Google Scholar] [CrossRef]
  17. Zhang, Y.; Wu, J.; Shao, X.; Hou, C. Experiment on Interfacial Shear Properties Between Ultra-High Performance Concrete and Normal Strength Concrete. China Civ. Eng. J. 2021, 54, 81–89. [Google Scholar]
  18. Liao, Z. Experimental Research on Bond Strength of UHPC-NC Interface. Ph.D. Thesis, Hunan University, Changsha, China, 2018. [Google Scholar]
  19. Buda-Ozog, L.; Skrzypczak, I.; Kujda, J. Cracks Analysis in the Reinforced Concrete Pipes. Balt. Road Bridge Eng. 2017, 12, 88–93. [Google Scholar] [CrossRef]
  20. Silva, J.D.; Debs, M.K.; Beck, A.T. Reliability Evaluation of Reinforced Concrete Pipes in Crack Opening Limit State. Rev. IBRACON Estrut. Mater. 2008, 1, 314–330. [Google Scholar] [CrossRef]
  21. Shi, Z.; Masaki, N.; Yoshifumi, T. Structural Analysis and Renovation Design of Ageing Sewers; De Gruyter Open: Berlin, Germany, 2016. [Google Scholar]
  22. Zhang, H.F. Theoretical and Experimental Study on Structural Performance of the Sprayed-on Cement Mortar Liners Rehabilitating Precast Concrete Drainage Pipe. Ph.D. Thesis, China University of Geosciences, Wuhan, China, 2019. [Google Scholar]
  23. GB/T 50080-2016; Standard for Test Method of Performance on Ordinary Fresh Concrete. Ministry of Housing and Urban-Rural Development of China: Beijing, China, 2016.
  24. GB/T 17671-2021; Test Method of Cement Mortar. State Administration for Market Regulation: Beijing, China, 2021.
  25. GB/T 16752-2017; Test Methods of Concrete and Reinforced Concrete Sewer Pipes. General Administration of Quality Supervision, Inspection and Quarantine of China: Beijing, China, 2017.
  26. Fang, H.; Tan, P.; Du, X.; Li, B.; Yang, K.; Zhang, Y. Mechanical Response of Buried HDPE Double-Wall Corrugated Pipe Under Traffic-Sewage Coupling Load. Tunn. Undergr. Space Technol. 2021, 108, 103664. [Google Scholar] [CrossRef]
  27. GB 50010-2010; Code for Design of Concrete Structures. Ministry of Housing and Urban-Rural Development of China: Beijing, China, 2010.
  28. Li, Q.; Kuang, Y.; Guo, W. CDP Model Parameters Calculation and Value Method Verification. Zhengzhou Univ. Eng. Sci. 2021, 42, 43–48. [Google Scholar]
  29. Alfarah, B.; Lopez-Almansa, F.; Oller, S. New Methodology for Calculating Damage Variables Evolution in Plastic Damage Model for RC Structures. Eng. Struct. 2017, 132, 70–86. [Google Scholar] [CrossRef]
  30. Demir, A.; Ozturk, H.; Dok, G. 3D Numerical Modeling of RC Deep Beam Behavior by Nonlinear Finite Element Analysis. Disaster Sci. Eng. 2016, 2, 13–18. [Google Scholar]
  31. Darabnoush Tehrani, A. Finite Element Analysis for ASTM C-76 Reinforced Concrete Pipes with Rebar Steel Cage. Ph.D. Thesis, University of Texas Arlington, Arlington, TX, USA, 2016. [Google Scholar]
  32. Zhang, G.; Su, J. Nonlinearity Analysis of Reinforced Concrete Based on ABAQUS. Sci. Technol. Eng. 2008, 20, 5620–5624. [Google Scholar]
  33. Oyang, N.; Deng, S. Study on the Interfacial Properties of UHPC-NC Composite Component. Chongqing Univ. 2021, 44, 63–74. [Google Scholar]
  34. Yang, J.; Fang, Z. Research on Stress-Strain Relation of Ultra High Performance Concrete. Concrete 2008, 7, 11–15. [Google Scholar]
  35. Zhang, Z.; Shao, X.D.; Li, W.G.; Zhu, P.; Chen, H. Axial Tensile Behavior Test of Ultra High Performance Concrete. China J. Highw. Transp. 2015, 28, 50–58. [Google Scholar]
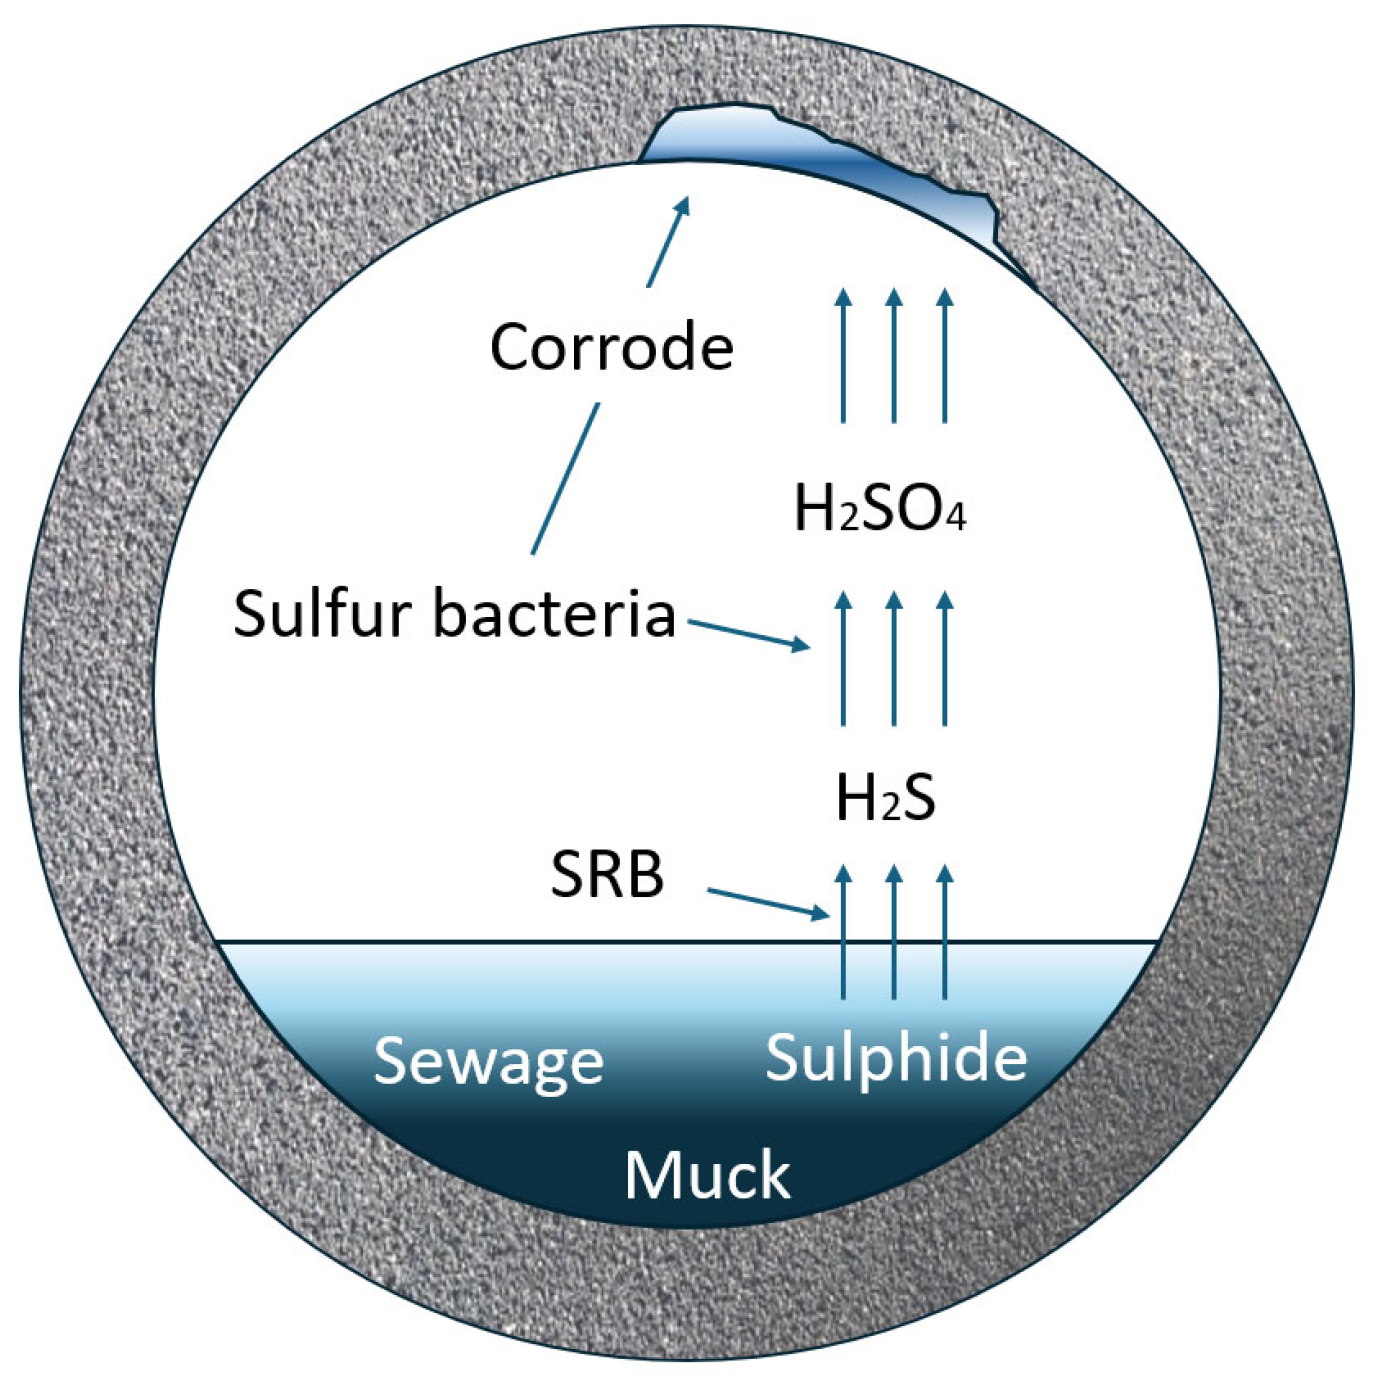
Figure 1. Corrosion mechanism of drainage pipes.
Buildings 15 03772 g001
Figure 2. UHPC flexural test.
Buildings 15 03772 g002
Figure 3. Specimen preparation.
Buildings 15 03772 g003
Figure 4. The position of the steel nail.
Buildings 15 03772 g004
Figure 5. TEBT.
Figure 5. TEBT.
Buildings 15 03772 g005
Figure 6. Finite element meshing.
Buildings 15 03772 g006
Figure 7. Bilinear constitutive model.
Buildings 15 03772 g007
Figure 8. Comparison of simulated and experimental Values.
Buildings 15 03772 g008
Figure 9. The test results of corroded pipes.
Buildings 15 03772 g009
Figure 10. Load–displacement curves for the same-thickness repaired pipes.
Buildings 15 03772 g010
Figure 11. Failure state of the repaired pipe.
Buildings 15 03772 g011
Figure 12. Adaptation of the repaired pipe.
Buildings 15 03772 g012
Figure 13. Simulation results of DN200 pipes with different RCR.
Buildings 15 03772 g013
Figure 14. The failure forms of JM1, JM2, and JM3.
Buildings 15 03772 g014
Figure 15. Stress failure cloud maps.
Buildings 15 03772 g015
Figure 16. Stress failure cloud maps.
Buildings 15 03772 g016
Table 1. Pipe design parameters.
Design IndicatorsValue
DN200DN400
SizeWall thickness/mm3040
Cover thickness/mm10
Length/mm300
Circumferential
reinforcement
Diameter/mm35
Inner diameter of the ring/mm221427
Number of rings18.520.6
Pitch/mm54.148.5
Longitudinal tendonDiameter/mm5
Number6
Table 2. Test scheme of DN200.
DiameterGroupCorrosion Thickness/mmRepair Thickness/mm
DN200FS000
FS1
FS2
FS3
20
10
20
FS4
FS5
FS6
50
10
20
FS7
FS8
FS9
100
10
20
Table 3. Test scheme of DN400.
DiameterGroupStructure TypeProcessing MethodRepair Thickness/mm
DN400JM0CompositeNatural bonding0
JM1Natural bonding25
JM2Steel nail embedding25
JM3UnitizedPE film adhesion25
Table 4. Performance test results of UHPC.
GroupFluidity/mmCuring Time/dFlexural Strength/MPaCompressive Strength/MPa
118416.055.7
2181710.464.3
31852817.984.7
Table 5. PU foam mold size for DN200 pipes.
CorrosionDiameter/mmRepair/mmDiameter/mm
220410184
20164
521010190
20170
1022010200
20180
Table 6. Plastic parameters [28,29,30,31,32].
ElementParameterValue
C30 concreteDilation angle, Ψ *36°
Elastic modulus, Ec30,000 MPa
Poisson’s ratio, ν0.2
Eccentricity, e0.1
Ratio of biaxial to uniaxial compressive strength, fb0/fc01.16
Ratio of second stress invariants, kc0.667
Viscosity parameter, μ0.0001
Reinforcing steelElastic modulus, Ecr200,000 MPa
Poisson’s ratio, νr0.3
* The dilatation angle (Ψ) controls shear dilatancy, which is the material’s tendency to expand in volume under plastic deformation.
Table 7. Cohesive interface model parameters [33].
KnnKss/Ktt t n 0 t s 0 / t t 0 Gc
2887739.316.10.9
Table 8. Load values for DN200 pipes.
GroupCorrosion Thickness/mmTEBTNumerical Simulations
Crack Load/kNFailure Load/kNCrack Load/kNFailure Load/kN
FS007.5012.575.6512.52
FS126.1911.836.2911.39
FS455.3610.125.1710.02
FS7104.517.694.387.61
Table 9. Failure load for repaired pipes.
GroupCorrosion Thickness/mmFailure Load/kNError
TEBTNumerical Simulation
FS2224.8725.241.49%
FS5521.7320.79−4.33%
FS81014.9614.21−5.01%
Table 10. Results of TEBT.
GroupCrack Load/kNFailure Load/kN
FS16.1911.83
FS29.8024.87
FS315.4135.64
FS45.3610.12
FS516.8521.73
FS622.8331.08
FS74.517.69
FS89.9714.96
FS913.3727.09
Table 11. Failure load of DN400 models.
Group t n 0 /MPa t s 0 / t t 0 Gc/(N/mm)Failure Load/kN
19.316.10.117.77
29.316.10.517.42
39.316.10.917.57
43.34.50.916.46
50.330.450.915.78
Disclaimer/Publisher’s Note: The statements, opinions and data contained in all publications are solely those of the individual author(s) and contributor(s) and not of MDPI and/or the editor(s). MDPI and/or the editor(s) disclaim responsibility for any injury to people or property resulting from any ideas, methods, instructions or products referred to in the content.