Article

Assessment of Visual Effectiveness of Metro Evacuation Signage in Fire and Flood Scenarios: A VR-Based Eye-Movement Experiment

1
School of Architecture and Planning, Hunan University, Changsha 410082, China
2
Hunan Provincial Engineering Technology Research Center for Intelligent Disaster Prevention and Resilient City Construction, Changsha 410082, China
3
Architectural Media Laboratory, School of Architecture and Planning, Hunan University, Changsha 410082, China
4
School of Geographic Sciences, Hunan Normal University, Changsha 410081, China
*
Author to whom correspondence should be addressed.
These authors contributed equally to this work.
Buildings 2025, 15(20), 3771; https://doi.org/10.3390/buildings15203771
Submission received: 29 July 2025 / Revised: 15 October 2025 / Accepted: 17 October 2025 / Published: 19 October 2025

Abstract

Emergency evacuation signage in metro stations plays a critical role in guiding occupants to evacuate quickly and safely. However, variations in placement height and other display attributes can affect the perceptual efficiency of signage. This study takes a metro station in Changsha, China, as an example and constructs two virtual disaster scenarios—fire and flood. An eye-tracking experiment was designed and conducted, yielding 164 valid experimental samples (89 fire, 75 flood). We compared the visual effectiveness of signage at three heights: low (0–0.8 m), medium (0.8–2 m), and high (>2 m). The results indicate that (1) low-position signage exhibits superior immediacy and should be prioritized for emergency response; (2) medium-position signage strikes a balance between perceived importance and immediacy, serving effectively as central nodes for both routine and emergency purposes; (3) high-position signage presents significant advantages in perceived importance and is suitable for conveying comprehensive, multi-level evacuation information. This research provides empirical evidence for optimizing the spatial layout of emergency evacuation signage in metro stations, offering valuable guidance for enhancing emergency evacuation capabilities in subway environments.

1. Introduction

In recent years, disaster incidents in metro stations have become increasingly frequent worldwide, resulting in significant casualties and property damage [1]. For example, on 18 February 2003, the Daegu subway arson in South Korea caused 198 deaths, 146 injuries, and 298 people missing [2]; the 20 July 2021 heavy-rain flood event in the Zhengzhou metro in China trapped over 500 individuals and led to 14 fatalities [3]; and in 2021, subway stations in New York City were inundated due to Hurricane Ida, causing subway service suspensions and trapping multiple passengers [4]. Metro stations function as critical nodes within urban public transportation networks and are characterized by high passenger density, confined underground spaces, and a limited number of entry and exit points [5]. These complex and hazardous conditions make efficient evacuation a critical challenge, which fundamentally constitutes a wayfinding process under extreme pressure and cognitive load. Apart from the influence of crowd movement [6], individuals typically rely on environmental cues to make wayfinding decisions, especially at critical locations such as intersections [7]. Among these cues, emergency evacuation signage in metro stations plays the most decisive role. Consequently, a well-designed signage system, with appropriate placement, is crucial for providing clear guidance during emergencies. Such systems can substantially enhance evacuation speed and efficiency [8], making signage a fundamental safeguard for public safety.
Virtual reality (VR) technology enables the construction of highly realistic virtual environments, allowing users to experience scenarios that closely approximate real-world conditions [9], and even those that are otherwise difficult to replicate. Its immersive and interactive features [10] have led to its growing use in disaster research and evacuation studies [11,12]. The integration of VR with eye-tracking provides an objective and comprehensive approach for capturing patterns of visual attention and understanding perceptual processes [13], thereby offering a safe and controllable medium for disaster simulation. Recent studies demonstrate that VR combined with eye-tracking has been successfully applied to evacuation analyses in transportation hubs such as tunnels [14] and metro stations [15,16], providing scientific evidence to support emergency response planning.
In terms of evaluating the effectiveness of emergency evacuation signage systems, existing research has primarily focused on intrinsic characteristics of signs in ordinary building interiors—such as text and pictogram design [17,18], color schemes [18,19,20,21], lighting conditions [18], and physical materials [22]. In representative studies, Wong (2007) demonstrated that in building corridor environments, signs displaying the English word “EXIT” on a green background exhibit superior visibility, and he also pointed out that mounting height influences signage effectiveness [18]. Kobes et al. (2010) discovered that, within fire-evacuation scenarios, low-positioned exit signs outperform traditional ceiling-level signs [23]. Olander et al. (2016) confirmed that, during building fire evacuation, dissuasive exit signage featuring a green background overlaid with a red “X”, combined with red flashing lights, can significantly improve both attention to the signage and information transmission [24]. Ding’s (2020) study conducted in a university laboratory building similarly indicated that signs with green arrow graphics achieved the best evacuation outcomes and highlighted signage placement as a key influencing factor [20]. These investigations have laid the foundation for the standardization and regulation of signage design and provided methodological references for subsequent signage experiments. However, although some studies have explored how spatial attributes—such as display format, installation angle, and height—affect the perceptual effectiveness of emergency signage, a systematic quantitative analysis of the effect of signage height is still lacking. Moreover, the applicability of these findings within the complex and unique environments of metro stations remains to be validated.
Regarding research on subway spaces, existing studies have primarily proceeded along two directions. The first involves disaster scenario simulation, where various technical methods have been used to explore passenger evacuation behavior and station layout optimization under multiple disaster types within subway spaces—such as fires [25,26], floods [27], and toxic gas leaks [28]. Although these studies do not directly address the design and evaluation of emergency evacuation signage, they reveal how visual perception obstacles in disaster environments (e.g., smoke diffusion during fires, inundation during floods) and the complexity of human behaviors (e.g., individual risk-perception levels, familiarity with subway spaces [28]) affect the evacuation process, underscoring the urgency of evacuation behavior and, by extension, highlighting the necessity of appropriately placed emergency evacuation signage. The second direction concerns non-disaster signage design, focusing on the rationality of signage-system layout [29,30] or user satisfaction [31] under normal operating conditions. The conclusions of these studies provide foundational insights for experimental design and layout strategies of signage in disaster scenarios. However, because disaster conditions impose more stringent requirements on signage visibility and information-transmission effectiveness, optimization strategies from routine environments cannot be directly transferred. For example, Wang et al. (2024) identified that high-quality signage characterized by concise, intuitive symbols and complete, accurate information is the primary factor affecting user satisfaction [31], a requirement that aligns closely with the demands placed on emergency evacuation signage in disaster scenarios and can serve as a core evaluation point for signage effectiveness in subsequent research.
In comparison, targeted studies of subway-space signage systems under disaster scenarios remain extremely scarce, and there is especially a lack of systematic analysis on how signage placement and disaster type interact. Only a few studies touch on related topics: Chen et al. (2020) conducted a virtual subway fire-escape experiment and, through a comparative analysis of four color-combination schemes, found that green and black safety signs performed best [21]; and Zhou et al. (2022) proposed a Social Force (SF) model and carried out evacuation simulations for a station on Beijing’s metro, quantitatively analyzing and comparing the evacuation performance of different emergency-signage deployment schemes [32].
This study aims to improve the effectiveness of emergency signage systems in subway spaces under disaster scenarios by examining how signage placement at different heights affects eye-tracking perceptual efficiency. To achieve this goal, a station on Changsha Metro Line 4 was selected, and virtual disaster scenarios were constructed. VR-based eye-tracking technology was employed to quantitatively analyze differences in perceptual efficiency for signage at three vertical height levels: low, medium, and high. We developed an evaluation framework that considers both signage importance and immediacy, and propose targeted optimization recommendations. The findings offer a scientifically grounded and practically applicable basis for the spatial layout of emergency evacuation signage in real-world subway environments.

2. Theoretical Framework

2.1. The “Visual Behavior–Information Processing–Decision Formation” Cognitive Pathway

Vision, as a primary perceptual channel, provides fundamental information inputs for humans [33]. Visual perception comprises two interrelated components: sensory reception and cognitive processing. The former—visual behavior—involves ocular movements such as fixation, tracking, and scanning to observe and extract environmental information. The latter—perceptual processing, also termed information processing or information integration [34]—relies on prior knowledge, experience, and memory stores to interpret and integrate visual stimuli [35]. Through the iterative interplay of these two processes, the brain continuously filters and extracts relevant information, transforming sensory signals into decision-making inputs, which ultimately culminate in action execution [36]. Based on the concept of situation awareness (SA), Hasanzadeh et al. (2018) proposed an attention-allocation model called “Sensory Input–Situation Awareness–Decision Making–Performance of Action”, in which SA encompasses three hierarchical levels: perceiving the current environment, comprehending the significance of the situation, and projecting future states [37].
Based on the foregoing, with respect to visual perceptual behavior, humans process external environmental stimuli in three primary steps, following the “visual behavior–information processing–decision formation” cognitive pathway. For example, in the context of evacuation within a metro space, an individual visually observes the emergency evacuation signage system and other environmental features—such as the physical attributes of signage (color, location, content), the positions of elevators or stairways, and the direction of exits—to collect fundamental external information. The brain then combines existing knowledge and experience (e.g., the semantic meaning of signage content) with memory stores (e.g., the layout of the metro space) to interpret the information acquired through visual perception, thereby integrating and evaluating the guidance provided by the signage system. Based on the results of this information processing, the individual forms clear decisions regarding evacuation direction and route selection, which are subsequently translated into actual escape actions.
Visual tracking and attentional analysis provide quantitative tools for uncovering this process by detecting various physiological responses generated when subjects observe their surroundings, thus enabling analysis of human behavior, intention, and cognition [38]. Among these tools, eye-tracking technology serves as a core method: by recording, in real time, eye movement and gaze-position changes during the sensory input stage, it objectively elucidates attentional distribution mechanisms [39] and helps infer subsequent modes of information processing and decision-making, especially when combined with virtual simulation technologies.

2.2. Evaluation Framework for Signage Effectiveness Based on “Importance–Immediacy”

This study, grounded in the previously introduced “visual behavior–information processing–decision formation” cognitive pathway of visual perception behavior, divides signage effectiveness into two principal dimensions—importance and immediacy—and employs quantitative indicators to measure individual visual behaviors and evaluate signage effectiveness, thereby constructing the theoretical framework of this paper (Figure 1).
Signage importance assesses a signage system’s capacity to convey critical information and sustain evacuees’ attention, reflecting the depth of information processing. Signage with greater importance is theorized to require more extensive cognitive engagement, which manifests as longer total fixation durations, more fixation counts, and a stronger tendency for attention to concentrate on key regions (see Section 3.3.3 for detailed metrics).
Signage immediacy refers to a sign’s ability to prompt rapid decision-making under emergency conditions, representing real-time information-transmission efficiency. Higher immediacy enables a sign to be captured and recognized quickly, effectively reducing the duration of the cognitive processing sequence. This is expected to be reflected in eye-tracking metrics related to the speed and efficiency of initial detection (see Section 3.3.3 for detailed metrics).

3. Experimental Design and Data Collection

3.1. Construction of Virtual Disaster Simulation Scenarios
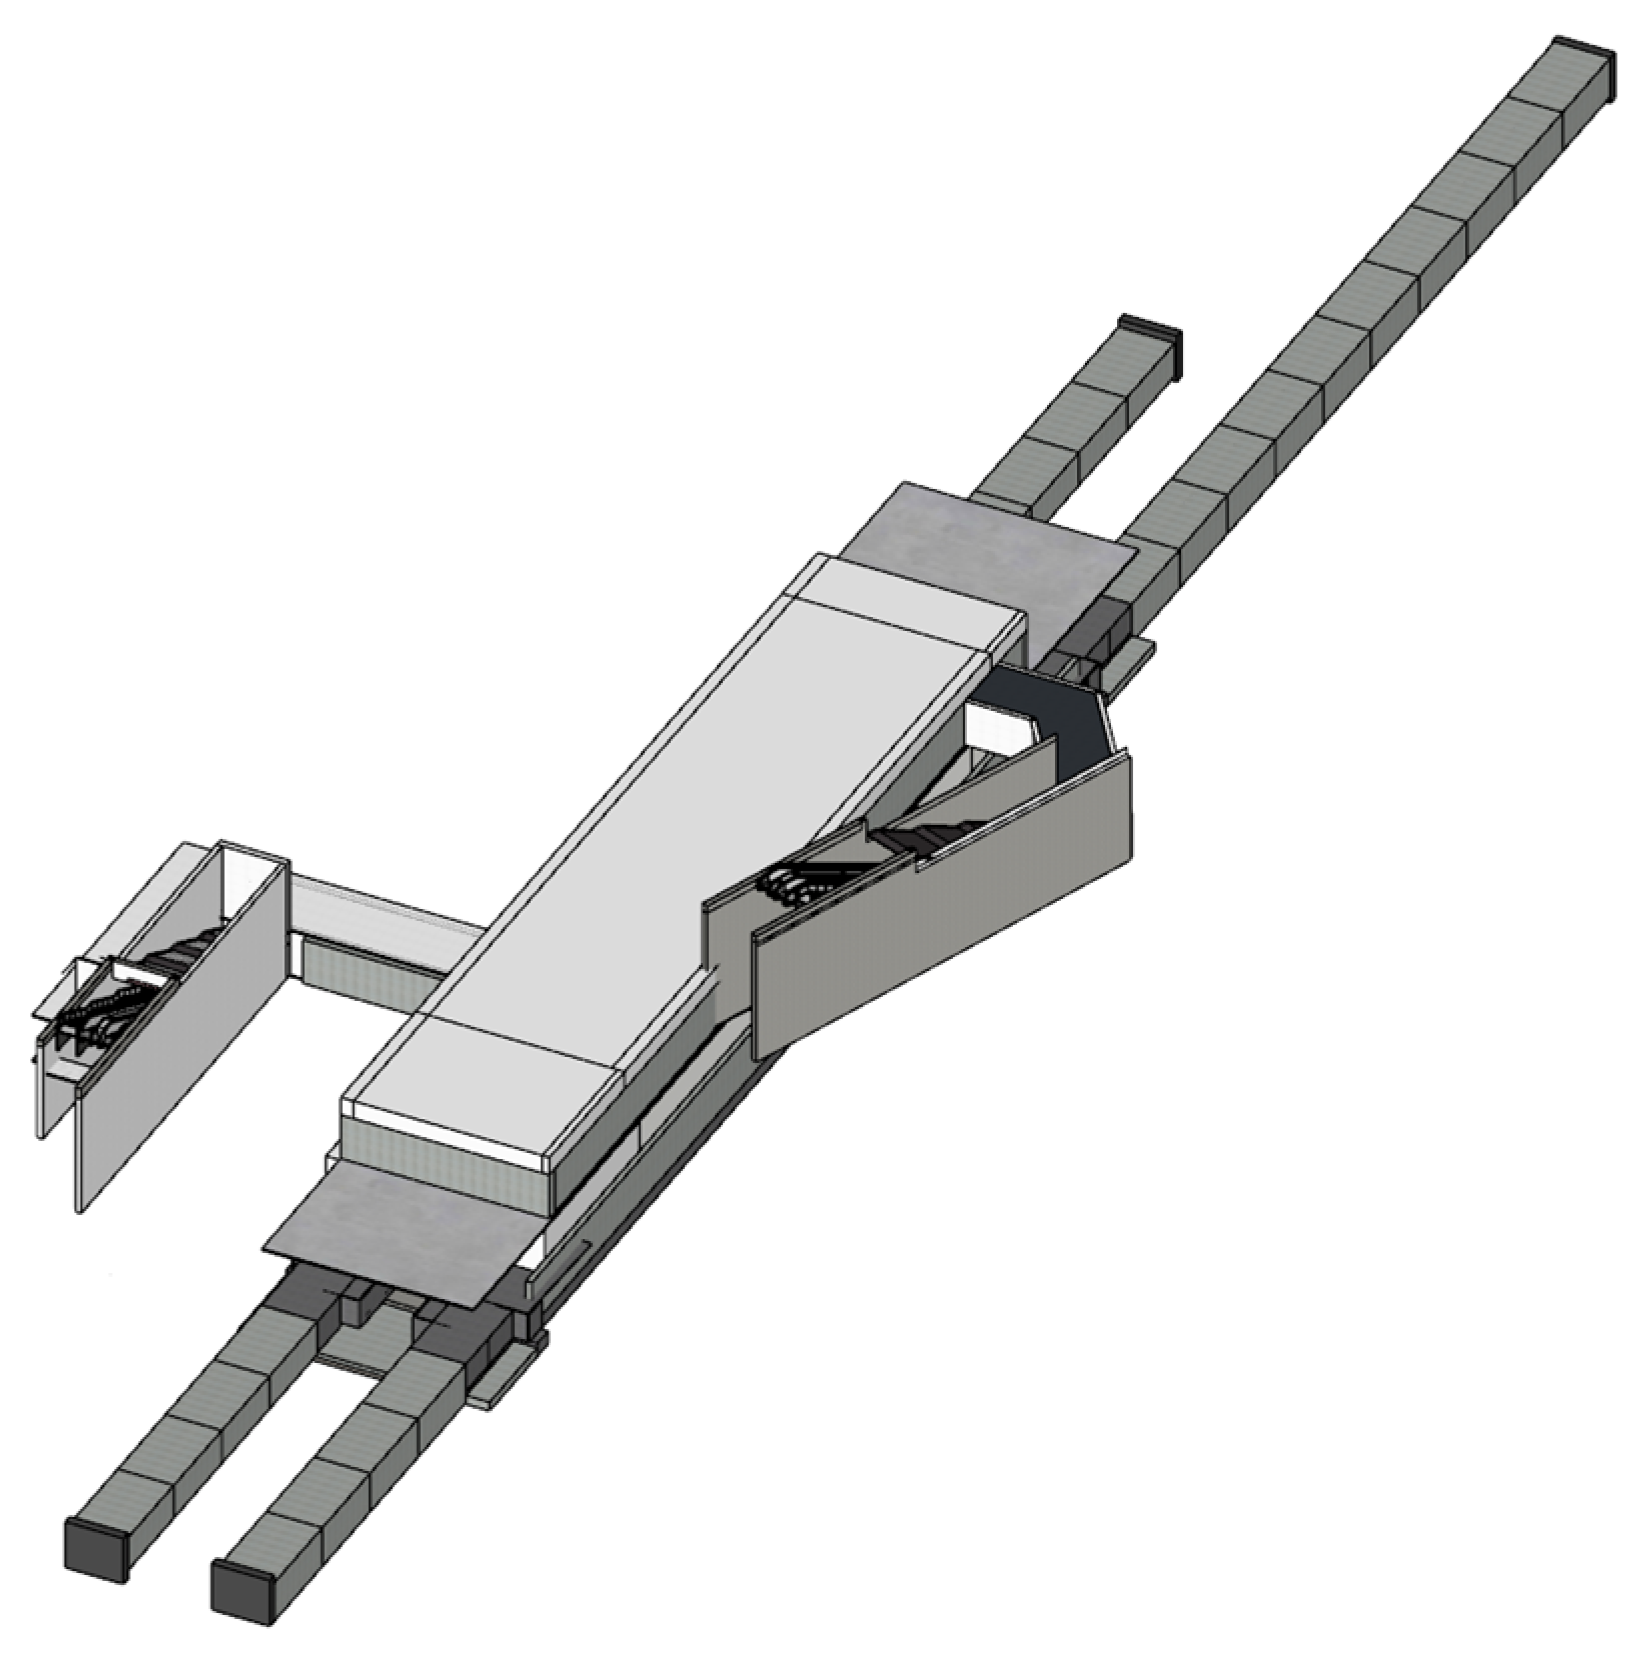
Based on real-world investigations of the spatial configuration and signage layout in multiple metro stations in Changsha, this experiment aims to summarize general rules of evacuation-route selection under emergency conditions in typical metro stations. We selected a representative intermediate station on Changsha Metro Line 4 (comprising the concourse level, platform level, and two ground-level exits) as the study environment. Its simple spatial structure, complete signage system, and clear evacuation routes render it both generalizable and broadly applicable.
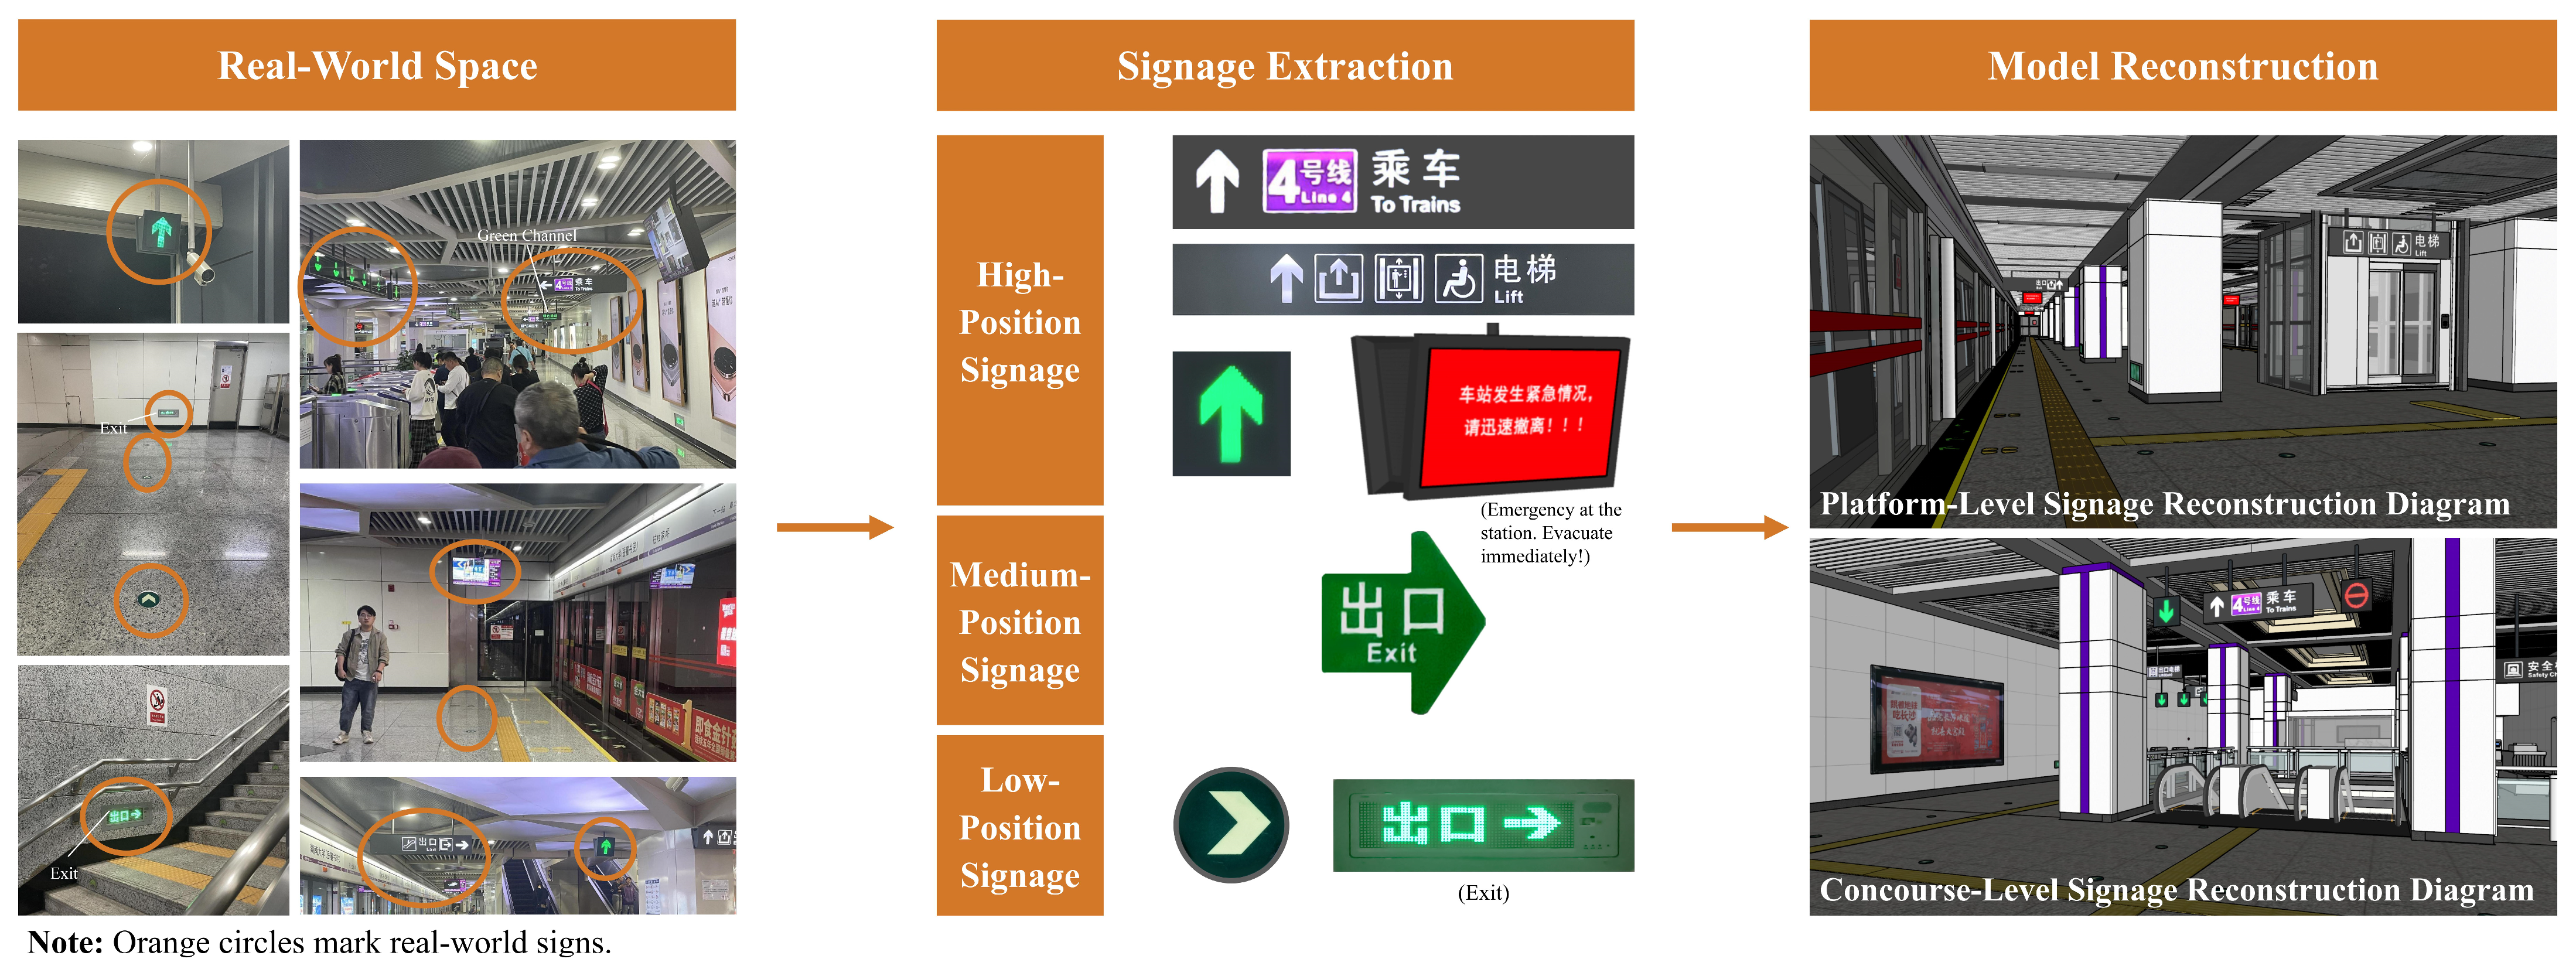
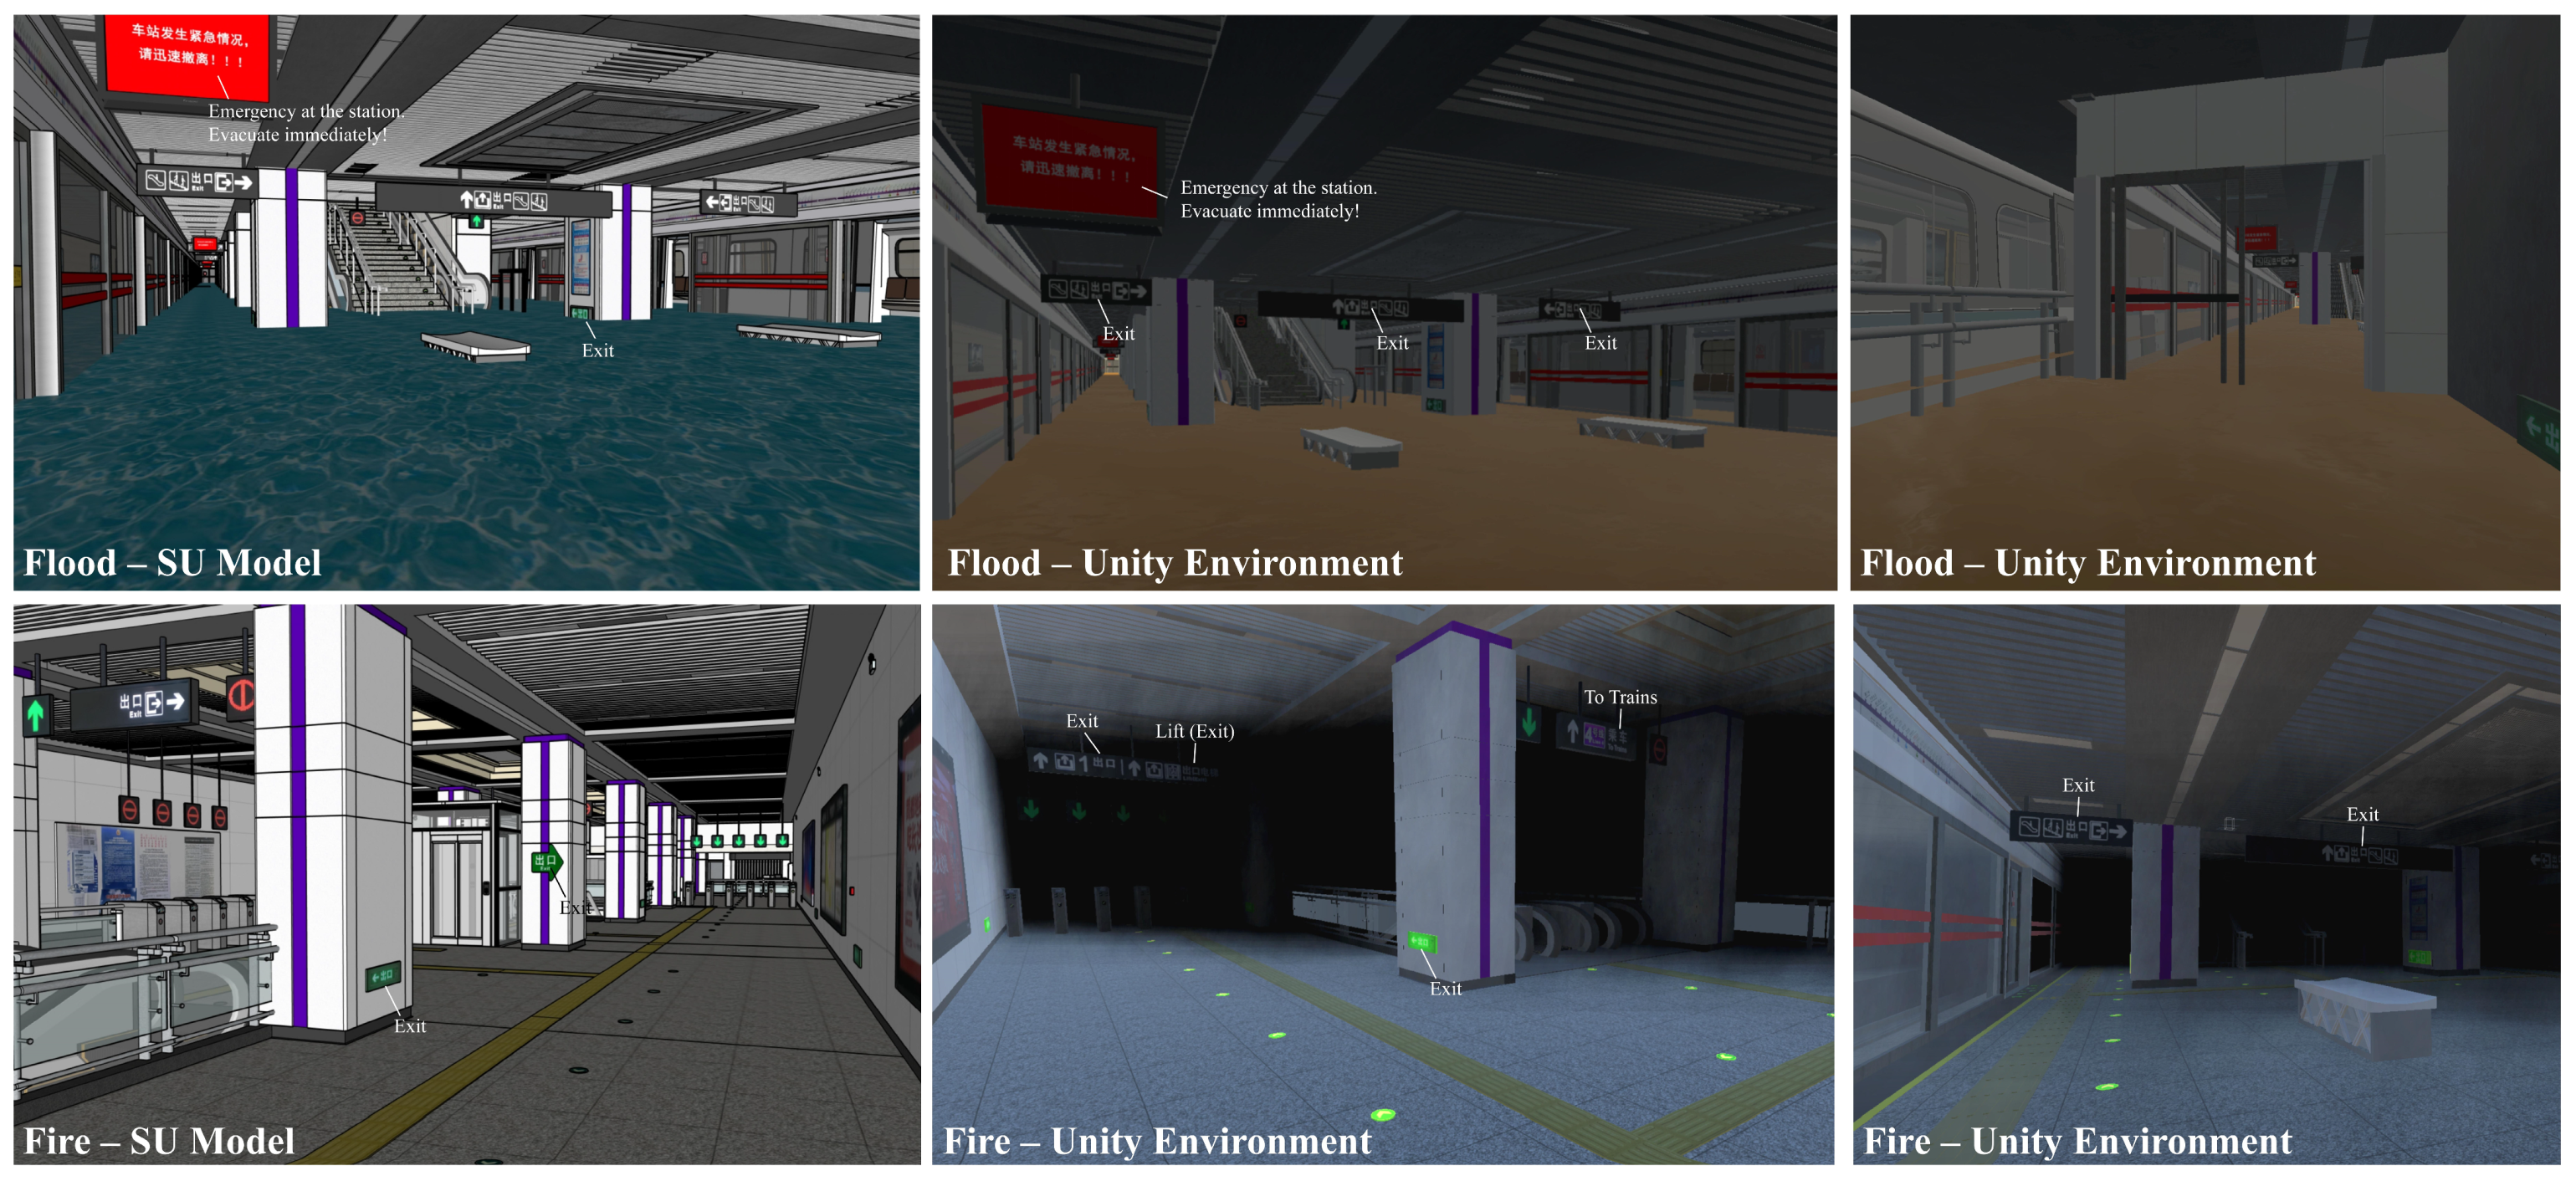
A three-dimensional model of the metro space was created in SketchUp 2021 (Figure 2). The modeling process was based on design drawings and supplemented by measurements and photographs obtained during multiple field surveys. All spatial details, including existing evacuation signage, were reproduced at their original positions and appearances on a one-to-one scale, a process of extraction and reconstruction detailed in Figure 3. Given the prevalence and ease of replication of fire and flood scenarios, Unity 3D 2022 was employed to construct realistic disaster environments. The simulation was designed with reference to the key characteristics of real-world fire and flood events, with a particular focus on their visual impacts (Figure 4). The fire scenario features a particle system simulating black smoke moving at a constant speed, with the smoke concentrated near the ceiling to produce a hazy, dimly lit atmosphere. The flood scenario employs a murky, yellow-tinted floodwater simulation approximately 40 cm high, with flowing water effects to reproduce both inundation and reduced visibility.
Subsequently, based on evacuation-route analysis and signage sightlines, representative nodes were selected under both fire and flood conditions. In line with the typical average human eye height range of 1.5 m to 1.7 m [40], a virtual camera was positioned at a fixed height of 1.5 m to simulate average human eye level for general observation consistency. With this camera setup, Enscape 3.3 was used to render panoramic images at a resolution of 16,384 × 8192 pixels. These panoramas were then imported into Tobii Pro Lab 1.162 for use in the subsequent eye-tracking experiment.
It is important to note that the experiment was conducted in a crowd-free environment, with the scenario assuming that only the participant was present. This simulated a situation where they were trapped alone and attempting to escape. During the experiment, an emergency alarm sound was played at a moderate volume to enhance the realism of the disaster environment and heighten participants’ sense of tension. Furthermore, a brief post-experiment survey was conducted to validate the realism of the virtual scenarios. The majority of participants reported that the overall atmosphere and specific details closely resembled real metro emergency environments, effectively immersing them in the evacuation context.
Figure 2. SketchUp Model of the Metro Station.
Buildings 15 03771 g002
Figure 3. Extraction and Reconstruction of Signage in Subway Spaces.
Buildings 15 03771 g003
Figure 4. Construction of Experimental Scenes and Realistic Disaster Simulations.
Buildings 15 03771 g004

3.2. Experimental Design: Classification and Comparative Effectiveness of Signage Heights

For classifying the vertical placement of interior signage, existing research typically relies on either the relative position to the human eye line or the absolute height above the floor. Wan et al. (2020) proposed a method based on eye-level partitioning, defining low-position signage as those on or slightly above the floor, mid-position signage as those approximately at eye level, and high-position signage as those at ceiling height or above 1.8 m [41]. In a subsequent 2024 study, they set participant eye level at 1.7 m in a large-space building and classified signage heights within the 1.7 m–6 m range into six discrete groups (1.7 m, 2 m, 3 m, 4 m, 5 m, 6 m) [42]. Following similar criteria, Shi et al. (2025) defined the high-position category as signs at 2 m, and the low-position category as signs at 30 cm above the ground [43].
Combining these approaches, the present study adopts the following height classifications (Figure 5):
(1)
Low Position: Signs placed on or near the floor, below the human eye line, approximately within 0–0.8 m above the ground.
(2)
Medium Position: Signs located within the natural eye-level range, approximately 0.8–2 m above the ground.
(3)
High Position: Signs positioned above the eye line, requiring occupants to look upward, at heights exceeding 2 m above the ground.
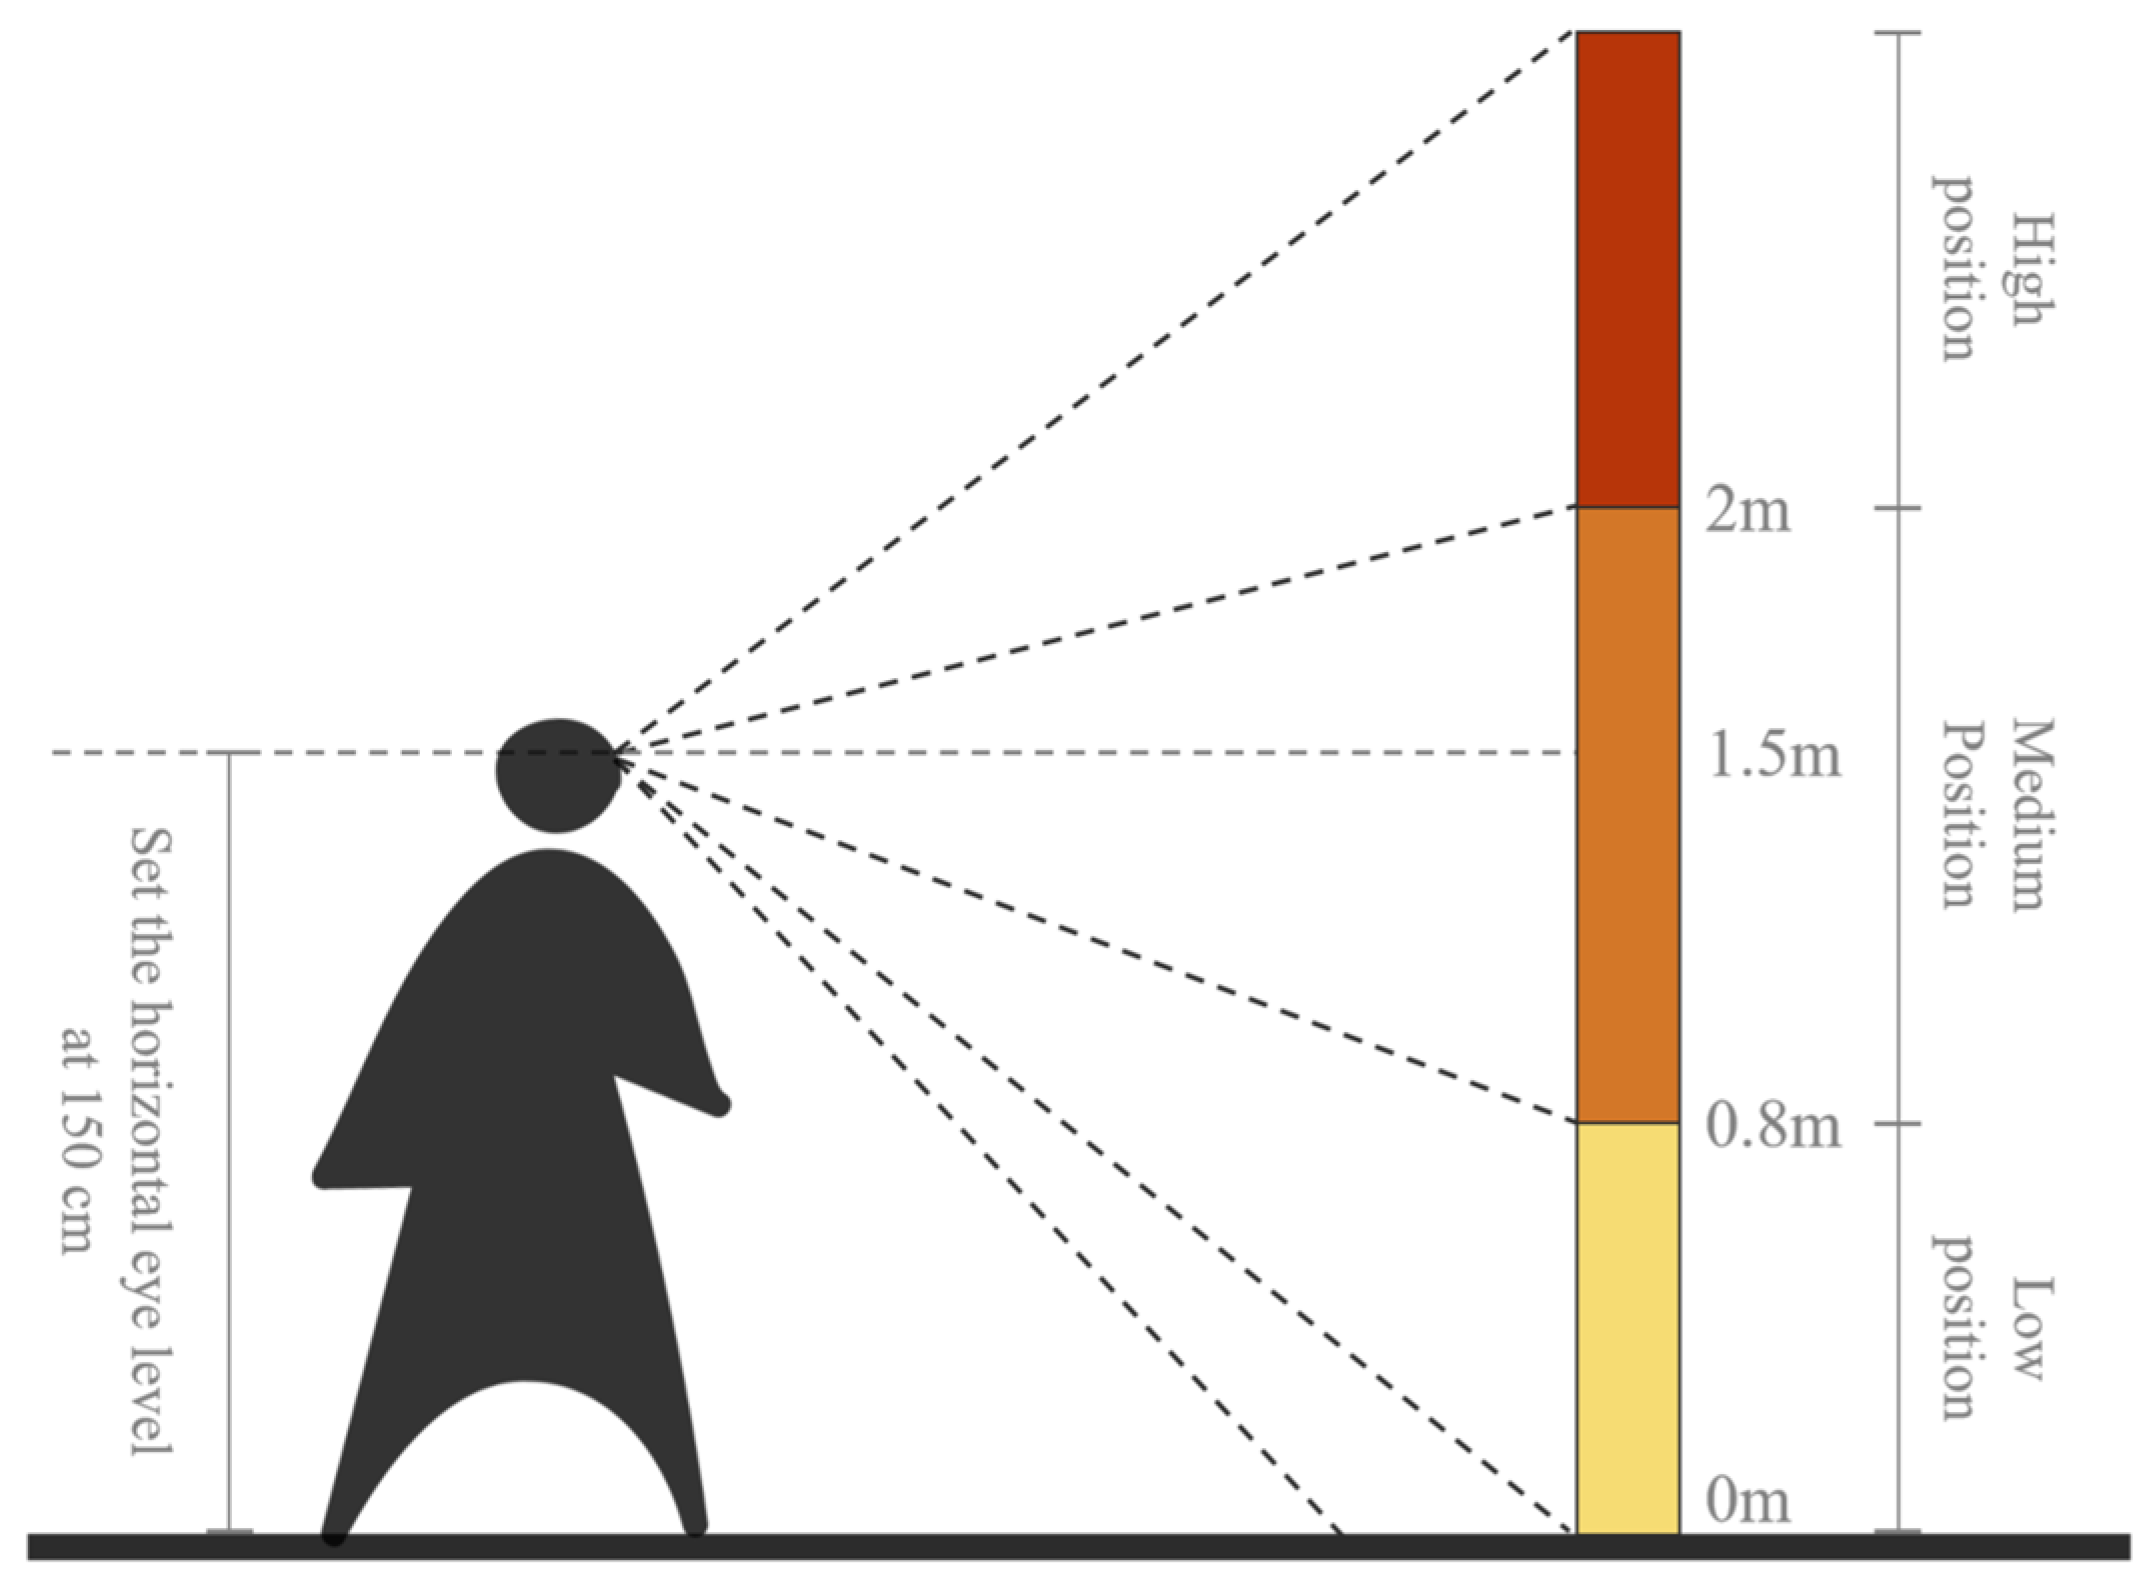
In real metro environments, low-position signage mainly consists of floor-level circular directional arrows and exit indicators placed near the base of walls or columns. Medium-position signage, typically located in concourse areas, includes evacuation maps and exit indicators mounted on walls or columns at eye level. High-position signage encompasses various types of suspended guide signs, such as elevator identifiers and overhead exit indicators, installed above 2 m. These three categories form the basis for comparing perception efficiency and overall signage effectiveness in the subsequent experiments.
Figure 5. Vertical position division diagram for signage.
Buildings 15 03771 g005
This experiment uses signage height as the core independent variable to investigate how low, medium, and high placements affect the importance and immediacy of information conveyed by the signage. Because people’s eye-level height in daily life is relatively fixed, signs positioned too high or too low may fall outside the natural field of view, and signs at different heights may also compete differently for attention in a complex environment, thus leading to differences in effectiveness. Disaster type (fire, flood) is included as a moderating variable. By comparing data across scenarios, we analyze how disaster conditions modulate the relationship between signage height and effectiveness, thereby evaluating the generalizability of signage design. Given that in a fire scenario, black smoke tends to accumulate at higher elevations. In contrast, in a flood scenario, turbid water inundates lower areas. This study focuses specifically on how fire might occlude high-position signage and how flood might occlude low-position signage. Based on these considerations, we propose two main hypotheses:
Hypothesis 1.
Signage height has a significant effect on both the importance and the immediacy of the signage.
Hypothesis 2.
Disaster type significantly influences signage importance and immediacy. Specifically, fire will reduce the effectiveness of high-position signage, whereas flood will reduce the effectiveness of low-position signage.

3.3. Experimental Procedure and Data Analysis

3.3.1. Experimental Procedure

The experiment consisted of two phases: a pilot study and the formal experiment. In the pilot study, 17 participants were recruited, and the formal experiment involved 110 participants. The participants, recruited from a university campus, were aged between 18 and 23 years, had normal vision with no color blindness, and possessed basic knowledge of metro spaces and emergency evacuation procedures.
The pilot study was designed to select representative nodes and to refine data-analysis protocols. During this phase, preliminary data were collected at 24 fire-scenario nodes and 21 flood-scenario nodes. After comprehensively analyzing the primary eye-tracking metrics, 14 representative panoramic images were selected from each disaster scenario. These images were organized along a timeline in spatial-route order (platform level → concourse level → exit level) to align with participants’ cognitive processes during evacuation.
The formal experiment employed the optimized set of nodes. Each participant completed an observation task comprising 28 panoramic images (14 fire, 14 flood). The total duration per participant was approximately 10 min, balancing data quality with collection efficiency. The experimental equipment and procedure are illustrated in Figure 6. The detailed procedure was as follows:
(1)
Task Briefing. Before the experiment, each participant was informed of the task objective (i.e., quickly determining the correct evacuation direction) and received instructions on VR equipment usage and safety precautions. After obtaining informed consent, participants were guided to stand within the designated experimental area.
(2)
Eye-Tracker Calibration. Once participants understood the experimental procedure, they donned the eye-tracking headset and completed a five-point calibration, a standard procedure in VR eye-tracking research [44]. Only after successful calibration did participants proceed to the formal experiment.
(3)
Dual-Scenario Experiment. Each panoramic image—whether from the fire or flood scenario—was displayed for 10 s, allowing participants sufficient time to observe and perceive the environment. Participants scanned the surroundings, used the displayed evacuation signage system to identify the correct escape direction from that viewpoint, and then experienced a 4-s black-screen interlude as a buffer. Throughout the experiment, all participants remained in the same controlled environment, and apart from the emergency alarm sound, ambient conditions were kept quiet to minimize external interference.
The experiment utilized the HTC VIVE Pro eye-tracking system. The VR headset incorporated two 3.5-inch AMOLED screens, each with a 1440 × 1600 resolution, yielding a combined 3K resolution (2880 × 1600) at 90 Hz. The eye-tracker’s internal display was projected onto a 75-inch external monitor with a 4K resolution (3840 × 2160). All experimental data were synchronized, recorded, and automatically collected via Tobii Pro Lab 1.162.
Figure 6. Eye-tracking experiment equipment (left) and experiment process recordings (center,right).
Buildings 15 03771 g006

3.3.2. Area of Interest Definition

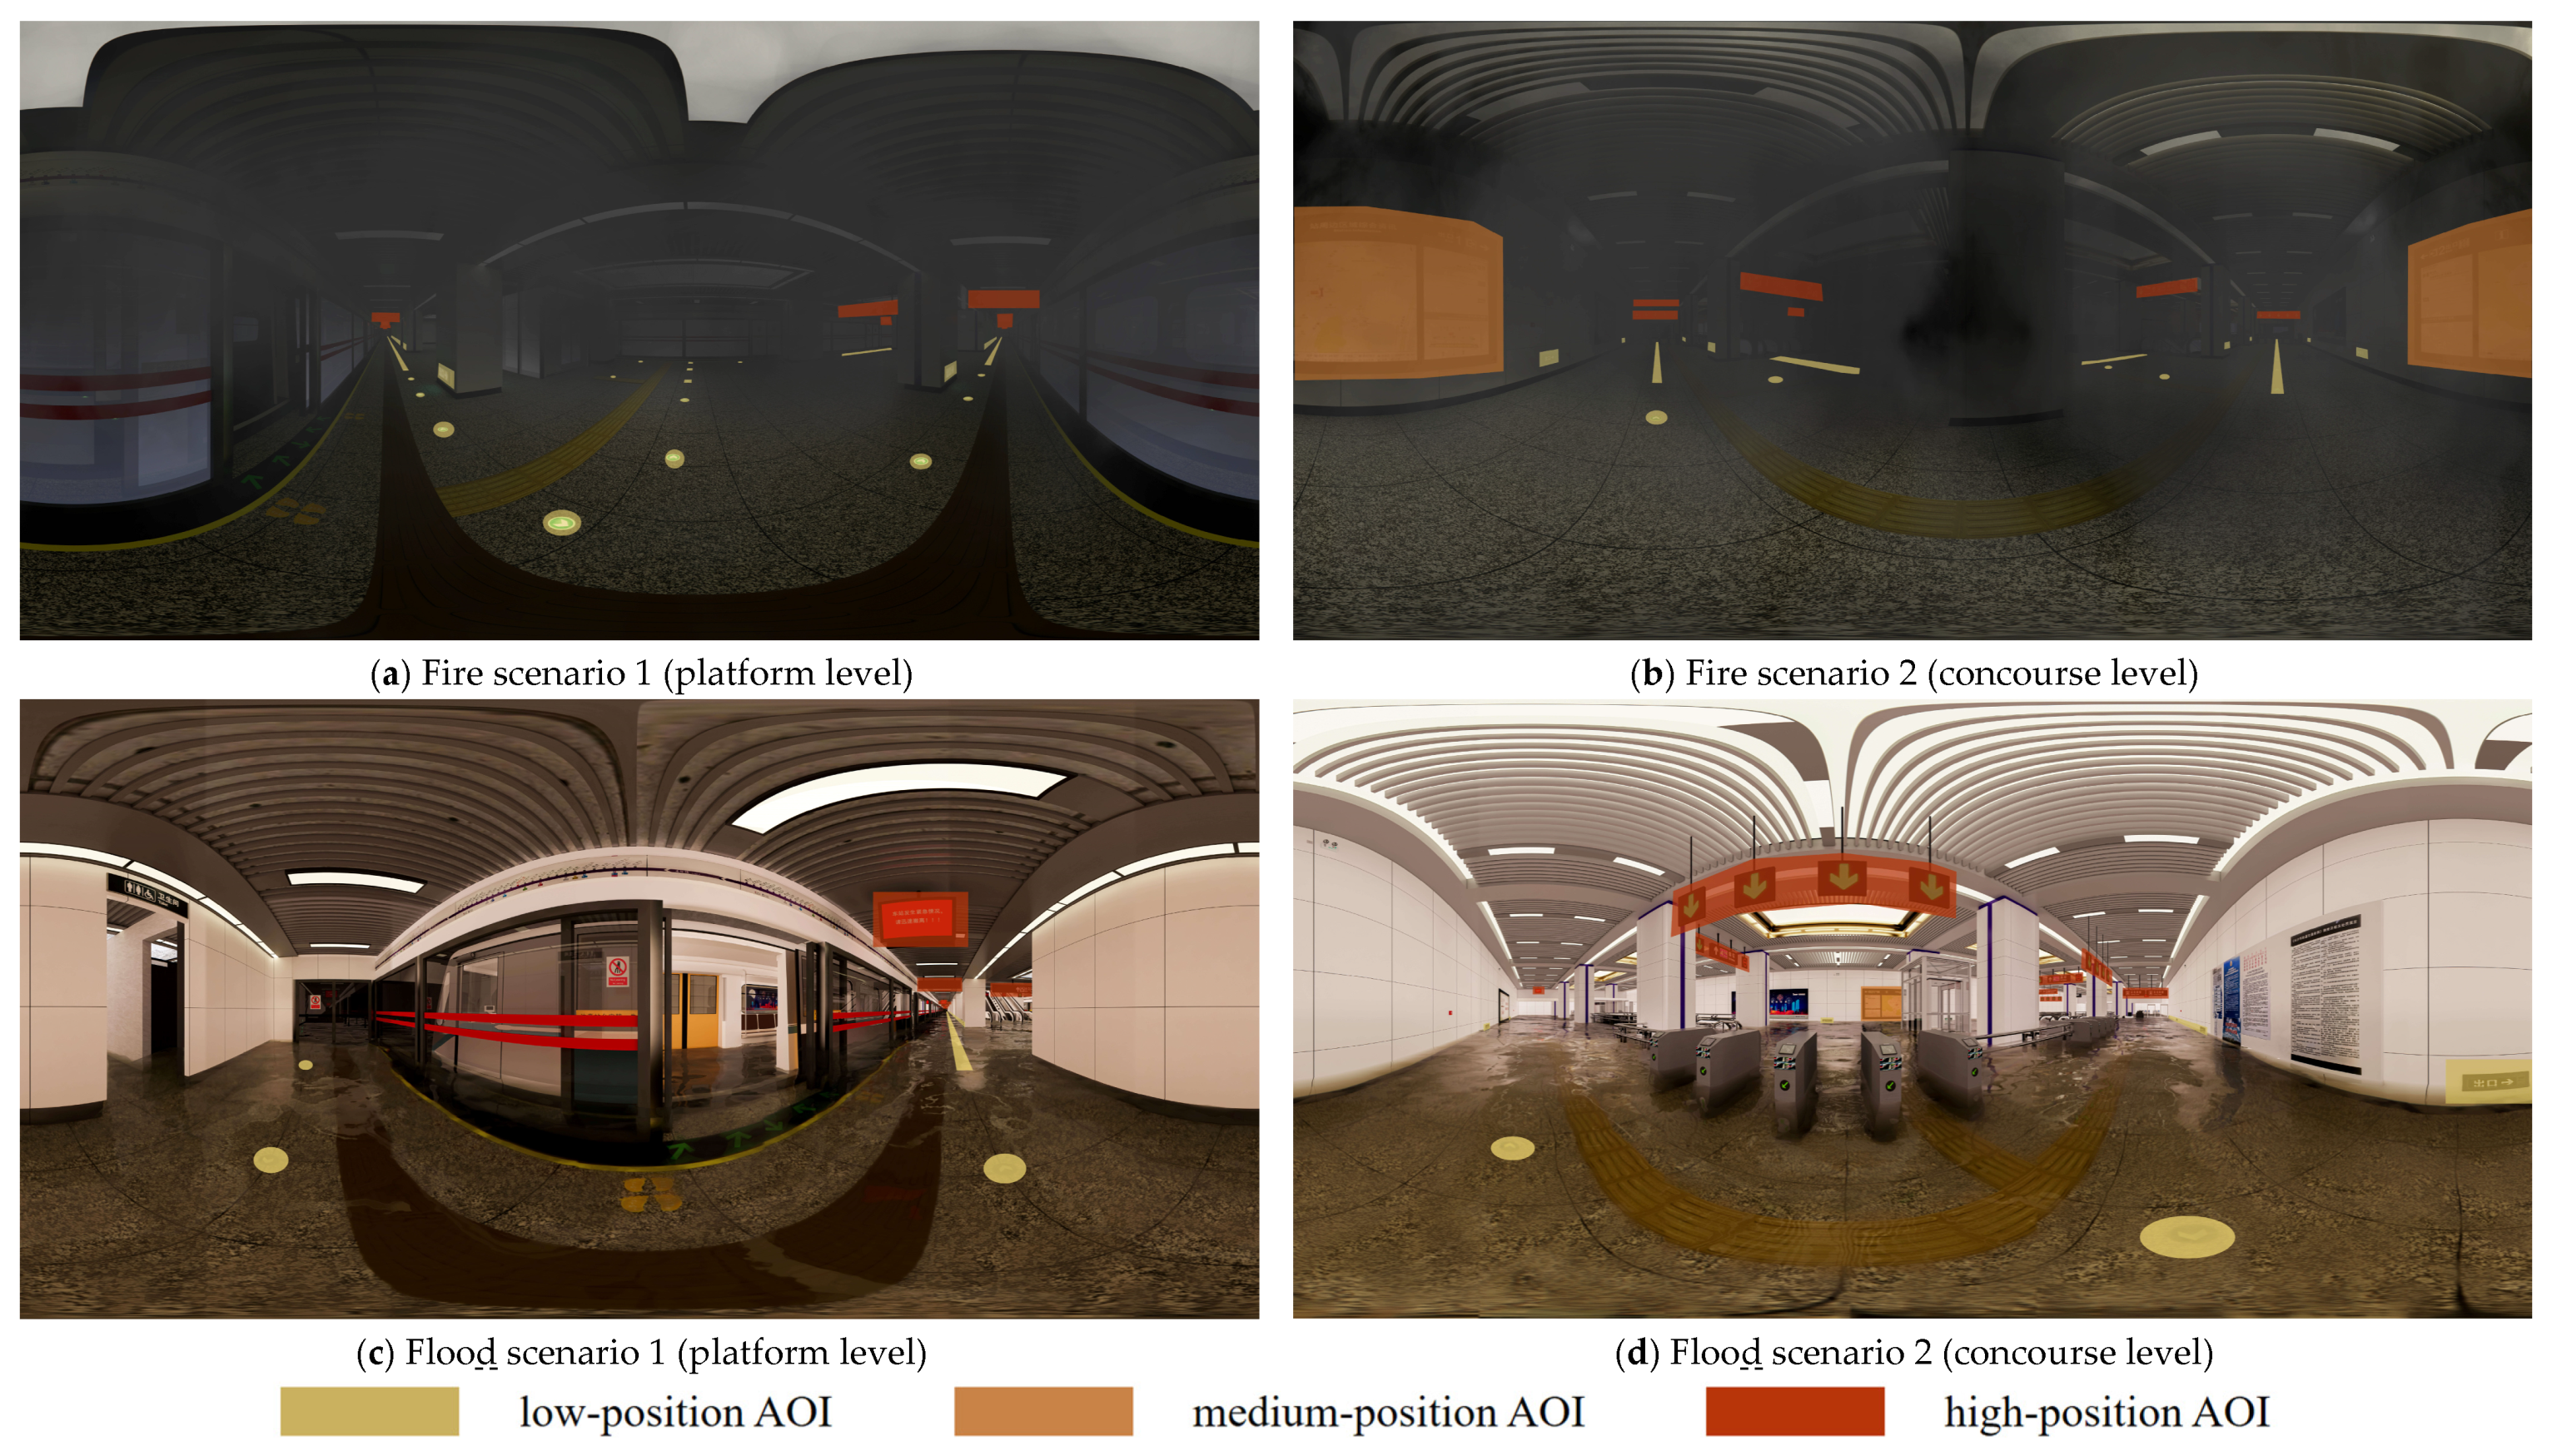
An Area of Interest (AOI) is the target region for eye-tracking analysis [45]. In this study, it corresponds to the spatial distribution of emergency signage within the metro environment. By delineating AOIs on the scene images, eye-tracking data can be collected for each sign, reflecting participants’ level of attention to the signage system. During implementation, the AOI boundaries were slightly extended beyond the physical edges of the signs to account for oculomotor bias [46]. In the experimental scenarios, AOIs were categorized into three height-based levels—low, medium, and high. Representative examples of the AOI divisions are provided in Figure 7.

3.3.3. Metric Selection

Common eye-tracking metrics include fixations, visits, saccades, and glances. To investigate how the vertical placement of evacuation signage in a metro environment affects eye-tracking perception efficiency, this study focuses on AOI-based fixation data and divides signage effectiveness into two primary dimensions—importance and immediacy (see Table 1)—to quantitatively evaluate the functional attributes of signage in emergency evacuation scenarios.
First, we introduce Perception Rate (PR) as a foundational metric. PR is defined as the proportion of signs that are successfully observed, reflecting whether a sign is easily detected. A low PR indicates potential visibility issues (e.g., occlusion or insufficient lighting) at that location, causing some participants to miss or fail to recognize the sign; such cases necessitate optimization of spatial placement to enhance evacuees’ attention. PR serves as a prerequisite for subsequent analyses of signage importance and immediacy, effectively preventing bias that would result from evaluating signs that were not perceived.
For the importance dimension, we employ two indicators. The first is Total Duration of Fixations (TDF), which measures the cumulative time that participants fixate on a single area of interest [47,48,49]. TDF, therefore, reflects the depth and intensity of information processing in the time domain. Metrics such as Average Duration of Fixations (ADF), Number of Fixations (NF), and Number of Visits (NV) operate on the same principle as TDF, since they all indicate how persistently signage holds visual attention. Consequently, our temporal analysis of importance focuses on TDF. The second indicator is Fixation Density (FD), defined as the number of fixations per unit area within an AOI (NF divided by the AOI area) [50]. FD captures the spatial concentration of attention to an AOI. To compute the AOI area, we apply the Shoelace Formula (also known as Gauss’s area formula): by iterating through the polygon’s vertex coordinates, summing the cross-product differences in adjacent vertex pairs, taking half of the absolute value [51], and then dividing the result by 10,000 to bring the area into a manageable range.
For the immediacy dimension, two metrics are selected for evaluation: Time to First Fixation (TFF) [48,49] and First Fixation Dwell Ratio (FFDR) [52]. TFF is defined as the interval from stimulus onset to the first fixation on a given AOI, reflecting both the speed and difficulty of visual attention capture. FFDR is defined as the ratio of the Duration of First Fixation (DFF) to TDF on that AOI, indicating the efficiency of initial information capture. Here, DFF denotes the duration of the first fixation on an AOI. Taken together, TFF and FFDR assess participants’ initial response speed as well as the efficiency of subsequent information processing and decision-making.
Table 1. Eye-tracking data measurement indicators and definitions.
Indicator CategoryIndicator NameUnitSourceDefinition and Calculation Formula
Perception RatePerception Rate (PR)%CalculationProportion of AOIs that were viewed. PR = (Number of effective AOIs/Total AOIs) × 100%.
Signage ImportanceTotal Duration of Fixations (TDF)msExported from TobiiTotal time spent fixating within a single AOI.
Average Duration of Fixations (ADF)msExported from TobiiAverage duration of a single fixation within an AOI.
Number of Fixations (NF)countExported from TobiiTotal number of fixation points within an AOI, indicating the depth of information processing.
Number of Visits (NV)countExported from TobiiNumber of times an AOI was visited, reflecting repeated attention to the signage.
Fixation Density (FD)count/pixel2CalculationNumber of fixations per unit area of the AOI. FD = NF/AOI area.
Signage ImmediacyTime to First Fixation (TFF)msExported from TobiiTime interval from stimulus onset to the first fixation on an AOI.
First Fixation Dwell Ratio (FFDR)%CalculationRatio of first fixation duration to total dwell time, reflecting initial information capture efficiency. FFDR = DFF/TDF × 100%.
Note: The AOI area denotes the spatial extent of an Area of Interest, expressed in pixels2, computed using the Gaussian area theorem, with the resulting value divided by 10,000; Duration of First Fixation (DFF) denotes the duration of the initial fixation on a given AOI, expressed in milliseconds; the five metrics highlighted in bold are the primary analysis indicators, since the evaluation logic of ADF, NF, and NV parallels that of TDF.

4. Experimental Results Analysis: Signage Importance and Immediacy

In the formal experiment, 105 fire-scenario and 103 flood-scenario evacuation trials were completed, and eye-tracking data were collected using the VR eye-tracker in conjunction with Tobii Pro Lab 1.162. After preliminary data screening, samples with failed eye-tracker calibration and those with an effective sampling rate (Gaze Samples) below 90% (i.e., fixation-point loss rate >10%) were excluded. Ultimately, 164 valid samples were retained (89 fire, 75 flood). For the subsequent analyses, any observations with missing values for the selected metrics were filtered out to ensure that the data analysis could validly assess the impact of signage location on eye-tracking perception efficiency, aside from the calculation of PR.

4.1. Normality Testing and Nonparametric Test Results

To examine how low, medium, and high signage positions affect eye-tracking perception metrics under fire and flood conditions, this study selected TDF, TFF, FD, and FFDR as core analysis indicators, systematically assessing signage importance and immediacy across positions. The Kolmogorov–Smirnov test indicated that all primary data metrics deviated from a normal distribution (p < 0.001), and Levene’s test showed unequal variances (p < 0.05). Accordingly, we employed the nonparametric Kruskal–Wallis H test to analyze the effect of signage position on eye-tracking metrics.
The nonparametric results (Table 2) reveal significant heterogeneity in the distributions of the core eye-tracking metrics across signage positions for both fire and flood scenarios (p < 0.05), in both the overall comparison and within each scenario. Pairwise comparisons using the Bonferroni correction showed that, in the overall comparison, TFF did not differ significantly between low- and high-position signage (p = 0.067) or between medium- and high-position signage (p = 1). Within the fire scenario, TDF did not differ significantly between low- and medium-position signage (p = 0.356), FD did not differ between low- and medium-position signage (p = 1), TFF did not differ between medium- and high-position signage (p = 1), and FFDR did not differ between low- and medium-position signage (p = 0.361). Within the flood scenario, FD did not differ between low- and high-position signage (p = 1), TFF did not differ between medium- and high-position signage (p = 1), and FFDR between low- and medium-position signage approached, but did not reach, significance (p = 0.083). All other pairwise comparisons were statistically significant (p < 0.05). These findings confirm that signage position exerts a hierarchical, position-specific effect on eye-tracking behavior, supporting Hypothesis 1. Additionally, specific metrics for adjacent positions show similar functional characteristics.
In addition, a Mann–Whitney U test was performed to compare fire and flood scenarios (Table 3). Although TDF (p = 0.113) and TFF (p = 0.066) did not differ significantly between disaster types, FD (p = 0.001) and FFDR (p = 0.016) showed significant differences between groups. This indicates that participants’ processing of the signage system includes both commonalities and scenario-specific traits: the similarity in TDF and TFF may result from similar attention distribution to basic signage features (e.g., icons, colors) across positions, while differences in FD and FFDR likely reflect how disaster type specifically influences spatial information integration efficiency. Furthermore, when analyzing individual positions across both scenarios, all metrics differ significantly—except for FFDR at low positions (p = 0.280) and medium positions (p = 0.058)—supporting Hypothesis 2, which states that disaster type significantly impacts both the importance and immediacy of signage.
Table 2. Non-parametric test results for the effect of signage position on key indicators across different scenarios.
IndicatorTest DimensionOverall Comparison
(Fire, Flood) (N = 4523)
Within-Group Comparison (Fire Scenario) (N = 2447)Within-Group Comparison (Flood Scenario) (N = 2076)
Test Value
(H)
pTest Value
(H)
pTest Value
(H)
p
TDFOverall Test (Low, Medium, High)130.454<0.001 ***165.997<0.001 ***26.447<0.001 ***
Low vs. Medium147.3900.019 *55.9600.356288.3570.002 **
Low vs. High−520.280<0.001 ***−406.695<0.001 ***−371.701<0.001 ***
Medium vs. High−372.889<0.001 ***−350.734<0.001 ***−83.3440.007 **
FDOverall Test (Low, Medium, High)219.439<0.001 ***45.746<0.001 ***187.709<0.001 ***
Low vs. Medium172.9900.004 **9.5691.000316.578<0.001 ***
Low vs. High459.579<0.001 ***198.416<0.001 ***56.8051.000
Medium vs. High632.568<0.001 ***207.985<0.001 ***373.383<0.001 ***
TFFOverall Test (Low, Medium, High)7.3690.025 *22.265<0.001 ***7.1290.028 *
Low vs. Medium139.8480.029 *141.499<0.001 ***−211.4760.034 *
Low vs. High−115.5850.067−137.203<0.001 ***220.5670.023 *
Medium vs. High24.2631.0004.2951.0009.0901.000
FFDROverall Test (Low, Medium, High)150.391<0.001 ***136.376<0.001 ***26.023<0.001 ***
Low vs. Medium−171.0840.002 **−52.1850.361−175.0490.083
Low vs. High535.964<0.001 ***346.838<0.001 ***280.7970.001 **
Medium vs. High364.880<0.001 ***294.653<0.001 ***105.748<0.001 ***
Note: The Kruskal–Wallis test was used, with pairwise comparisons conducted using the Bonferroni correction; * p < 0.05, ** p < 0.01, *** p < 0.001.
Table 3. Non-parametric test results of disaster types on key indicators across different positions.
IndicatorOverall Comparison (Low, Medium, High) (N = 4523)Low Position (N = 975)Medium Position (N = 2088)High Position (N = 1460)
Test Value
(Z)
pTest Value
(Z)
pTest Value
(Z)
pTest Value
(Z)
p
TDF−1.586 0.113 −3.141 0.002 ** −2.392 0.017 * −3.351 < 0.001 ***
FD−3.180 0.001 ** −2.864 0.004 ** −2.362 0.018 * −3.875 < 0.001 ***
TFF−1.837 0.066 −3.141 0.002 ** −2.392 0.017 * −3.351 < 0.001 ***
FFDR−2.403 0.016 * −1.081 0.280 −1.898 0.058 −3.737 < 0.001 ***
Note: Mann–Whitney test was used; * p < 0.05, ** p < 0.01, *** p < 0.001.

4.2. Comparative Analysis of Data for Different Signage Positions Under Fire and Flood Scenarios

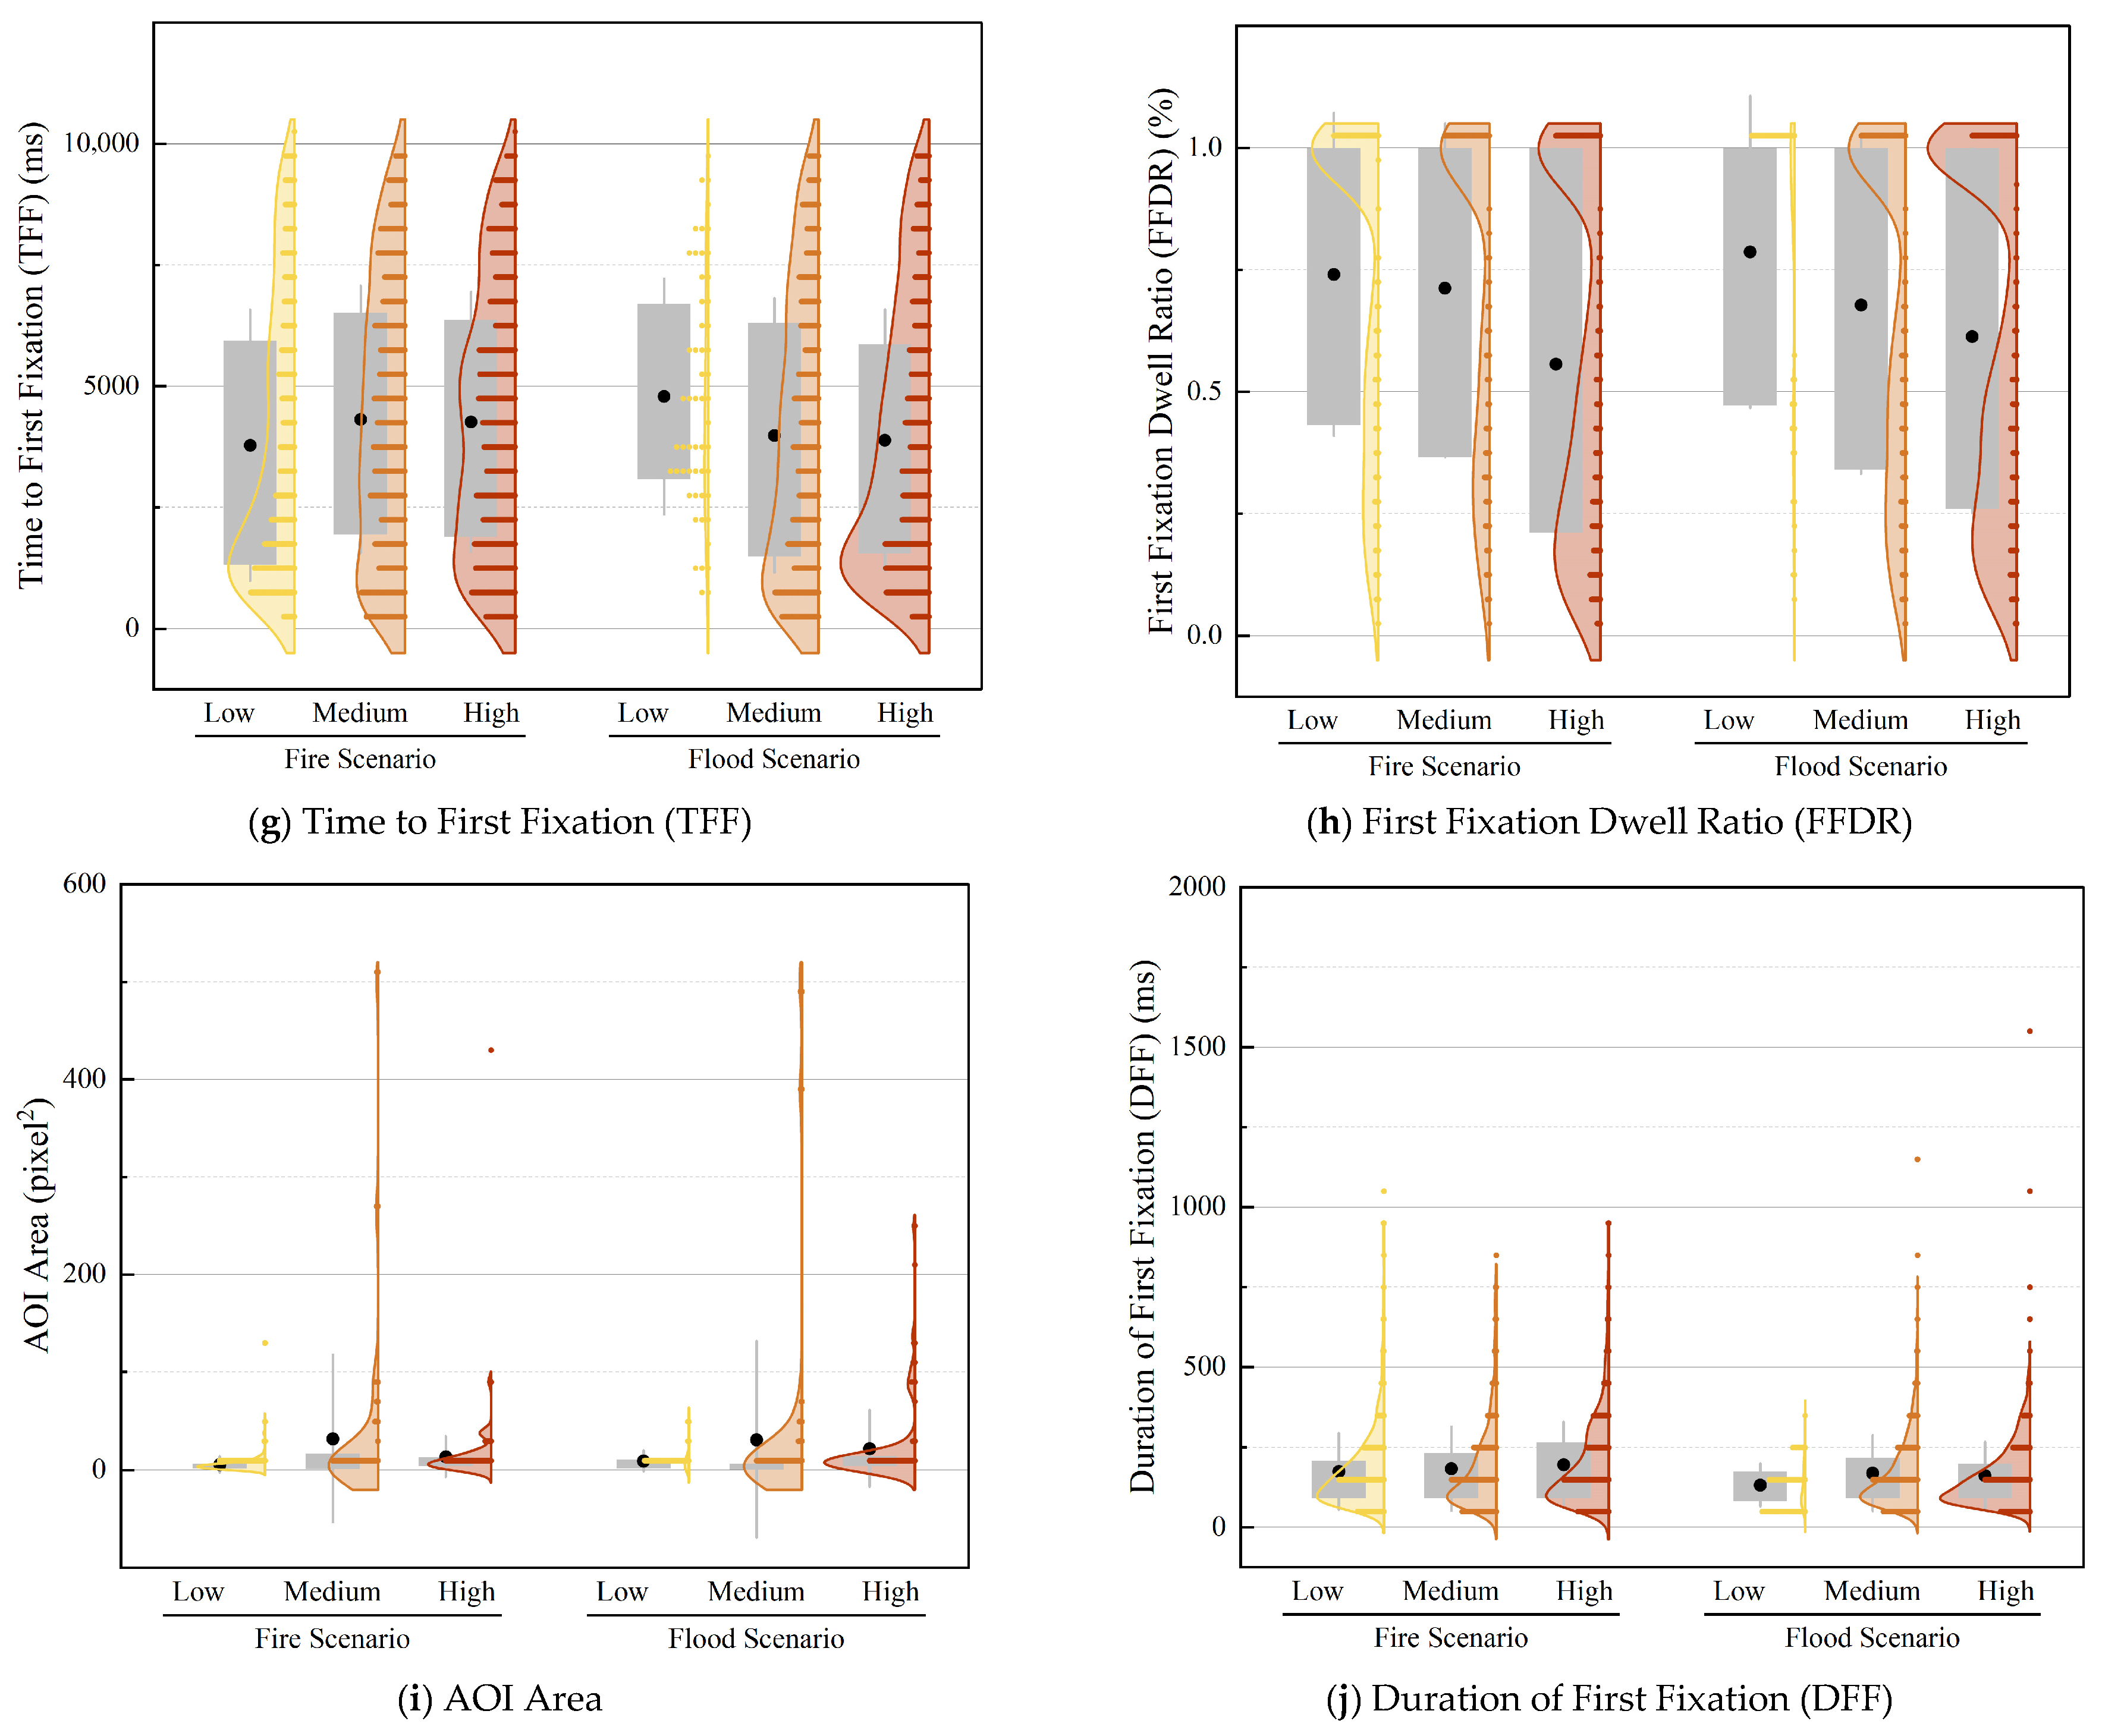
In this study, data from the fire and flood scenarios were classified and aggregated according to signage position—low, medium, and high (Table 4). Building on the dual-dimension framework of signage effectiveness, the following analysis is organized around three main aspects: signage importance, signage immediacy, and auxiliary metrics. The eye-tracking metric results for both scenarios are summarized in Figure 8.

4.2.1. Analysis of Perception Rate Differences

PR was used to verify the basic visual accessibility of emergency evacuation signage. The PR results show that, in the fire scenario, PR increases progressively as signage position rises; in the flood scenario, both medium- and high-position signage exhibit relatively high PRs (90.63% and 95.52%, respectively). In both scenarios, high-position signage achieves very high PR values (94.23% in fire, 95.52% in flood), indicating a stable advantage in perception—meaning that, even in complex disaster conditions, these signs reliably attract participants’ attention and ensure efficient transmission of critical information. At the same time, low-position signage in both scenarios has lower PR values (84.87% in fire, 78.86% in flood), which may be related to their smaller AOI areas (5.90 pixel2 in fire, 9.52 pixel2 in flood) and lower layout density. Notably, the PR for low-position signage in the flood scenario declines more sharply compared to medium- and high-position signage, further confirming that turbid floodwater occlusion reduces the probability of these signs being fixated.

4.2.2. Analysis of Signage Importance Differences

Across both disaster scenarios, TDF and its related indicators (ADF, NF, NV) exhibit an apparent low–medium–high hierarchical increase. In the fire scenario, high-position signage has an average TDF of 645.22 ms, which is approximately 1.89 times that of low-position signage (342.58 ms). Likewise, in the flood scenario, high-position signage (463.26 ms) has a TDF that is 2.16 times that of low-position signage (214.45 ms). On one hand, this suggests that high-position signage carries multilayered critical information, requiring participants to allocate more cognitive resources for information integration; the longer TDF thus reflects a deeper level of processing for high-position information. On the other hand, the elevated TDF at high positions may also indicate reduced visual accessibility due to spatial placement or excessive information redundancy, forcing participants to extend TDF to compensate for decreased processing efficiency. Supporting this conclusion, related fundamental indicators follow a similar hierarchical pattern: ADF, NF, and NV are all relatively higher at high-position despite minor variations at some levels. For example, in both fire and flood scenarios, high-position signage yields higher metrics than low-position signage. Specifically, it shows NF values of 3.03 and 2.56 fixations, NV values of 1.61 and 1.48 visits, and ADF values of 210.71 ms and 173.55 ms. This indicates that high-position information is perceived as more important, prompting participants to revisit and process it more deeply to ensure decision accuracy. Medium-position signage demonstrates balanced characteristics across TDF (354.83 ms in fire, 383.32 ms in flood) and NF (1.90 fixations in fire, 2.10 fixations in flood). Its moderate fixation duration and frequency effectively mitigate the risk of insufficient visual information supply seen in low-position signage while avoiding potential attentional diffusion associated with high-position signage’s complex information hierarchy. Thus, medium-position signage achieves a balance between information load and perceptual efficiency.
However, FD displays an inverse pattern relative to TDF. In both fire and flood scenarios, FD for high-position signage (0.49 fixations/pixel2 in fire, 0.39 fixations/pixel2 in flood) is significantly lower than for low- and medium-position signage, generally following the trend medium > low > high. FD differences stem not only from AOI area variations but also from signage-layout characteristics. Despite having the largest AOI area (32.23 pixel2 in fire, 31.37 pixel2 in flood), medium-position signage still achieves the highest FD. This likely derives from its placement near eye level, aligning with natural visual perceptual patterns and effectively concentrating participants’ gaze, thereby increasing fixations per unit area. Consequently, medium-position signage leverages balanced information density and visual accessibility to enhance fixation concentration and optimize attentional distribution. In contrast, although high-position signage AOI areas (13.86 pixel2 in fire, 22.12 pixel2 in flood) are smaller than those of medium positions, their high information complexity or dispersed layout reduces fixations per unit area (FD), revealing spatial inefficiency. This finding indicates that relying solely on temporal metrics like TDF or NF to assess signage importance may overlook shortcomings in spatial efficiency; FD must be integrated to reveal the true level of fixation-resource allocation per unit area.
From the perspective of signage importance, height exerts a significant effect, consistent with Hypothesis 1. High-position signage demonstrates the strongest performance in TDF and related temporal indicators, but its relatively low FD suggests that its spatial layout should be optimized to balance information quantity and visual accessibility. Medium-position signage excels in FD while maintaining moderate values for time-based metrics like TDF, yielding the best overall performance. Conversely, low-position signage performs relatively poorly in terms of importance.

4.2.3. Analysis of Signage Immediacy Differences
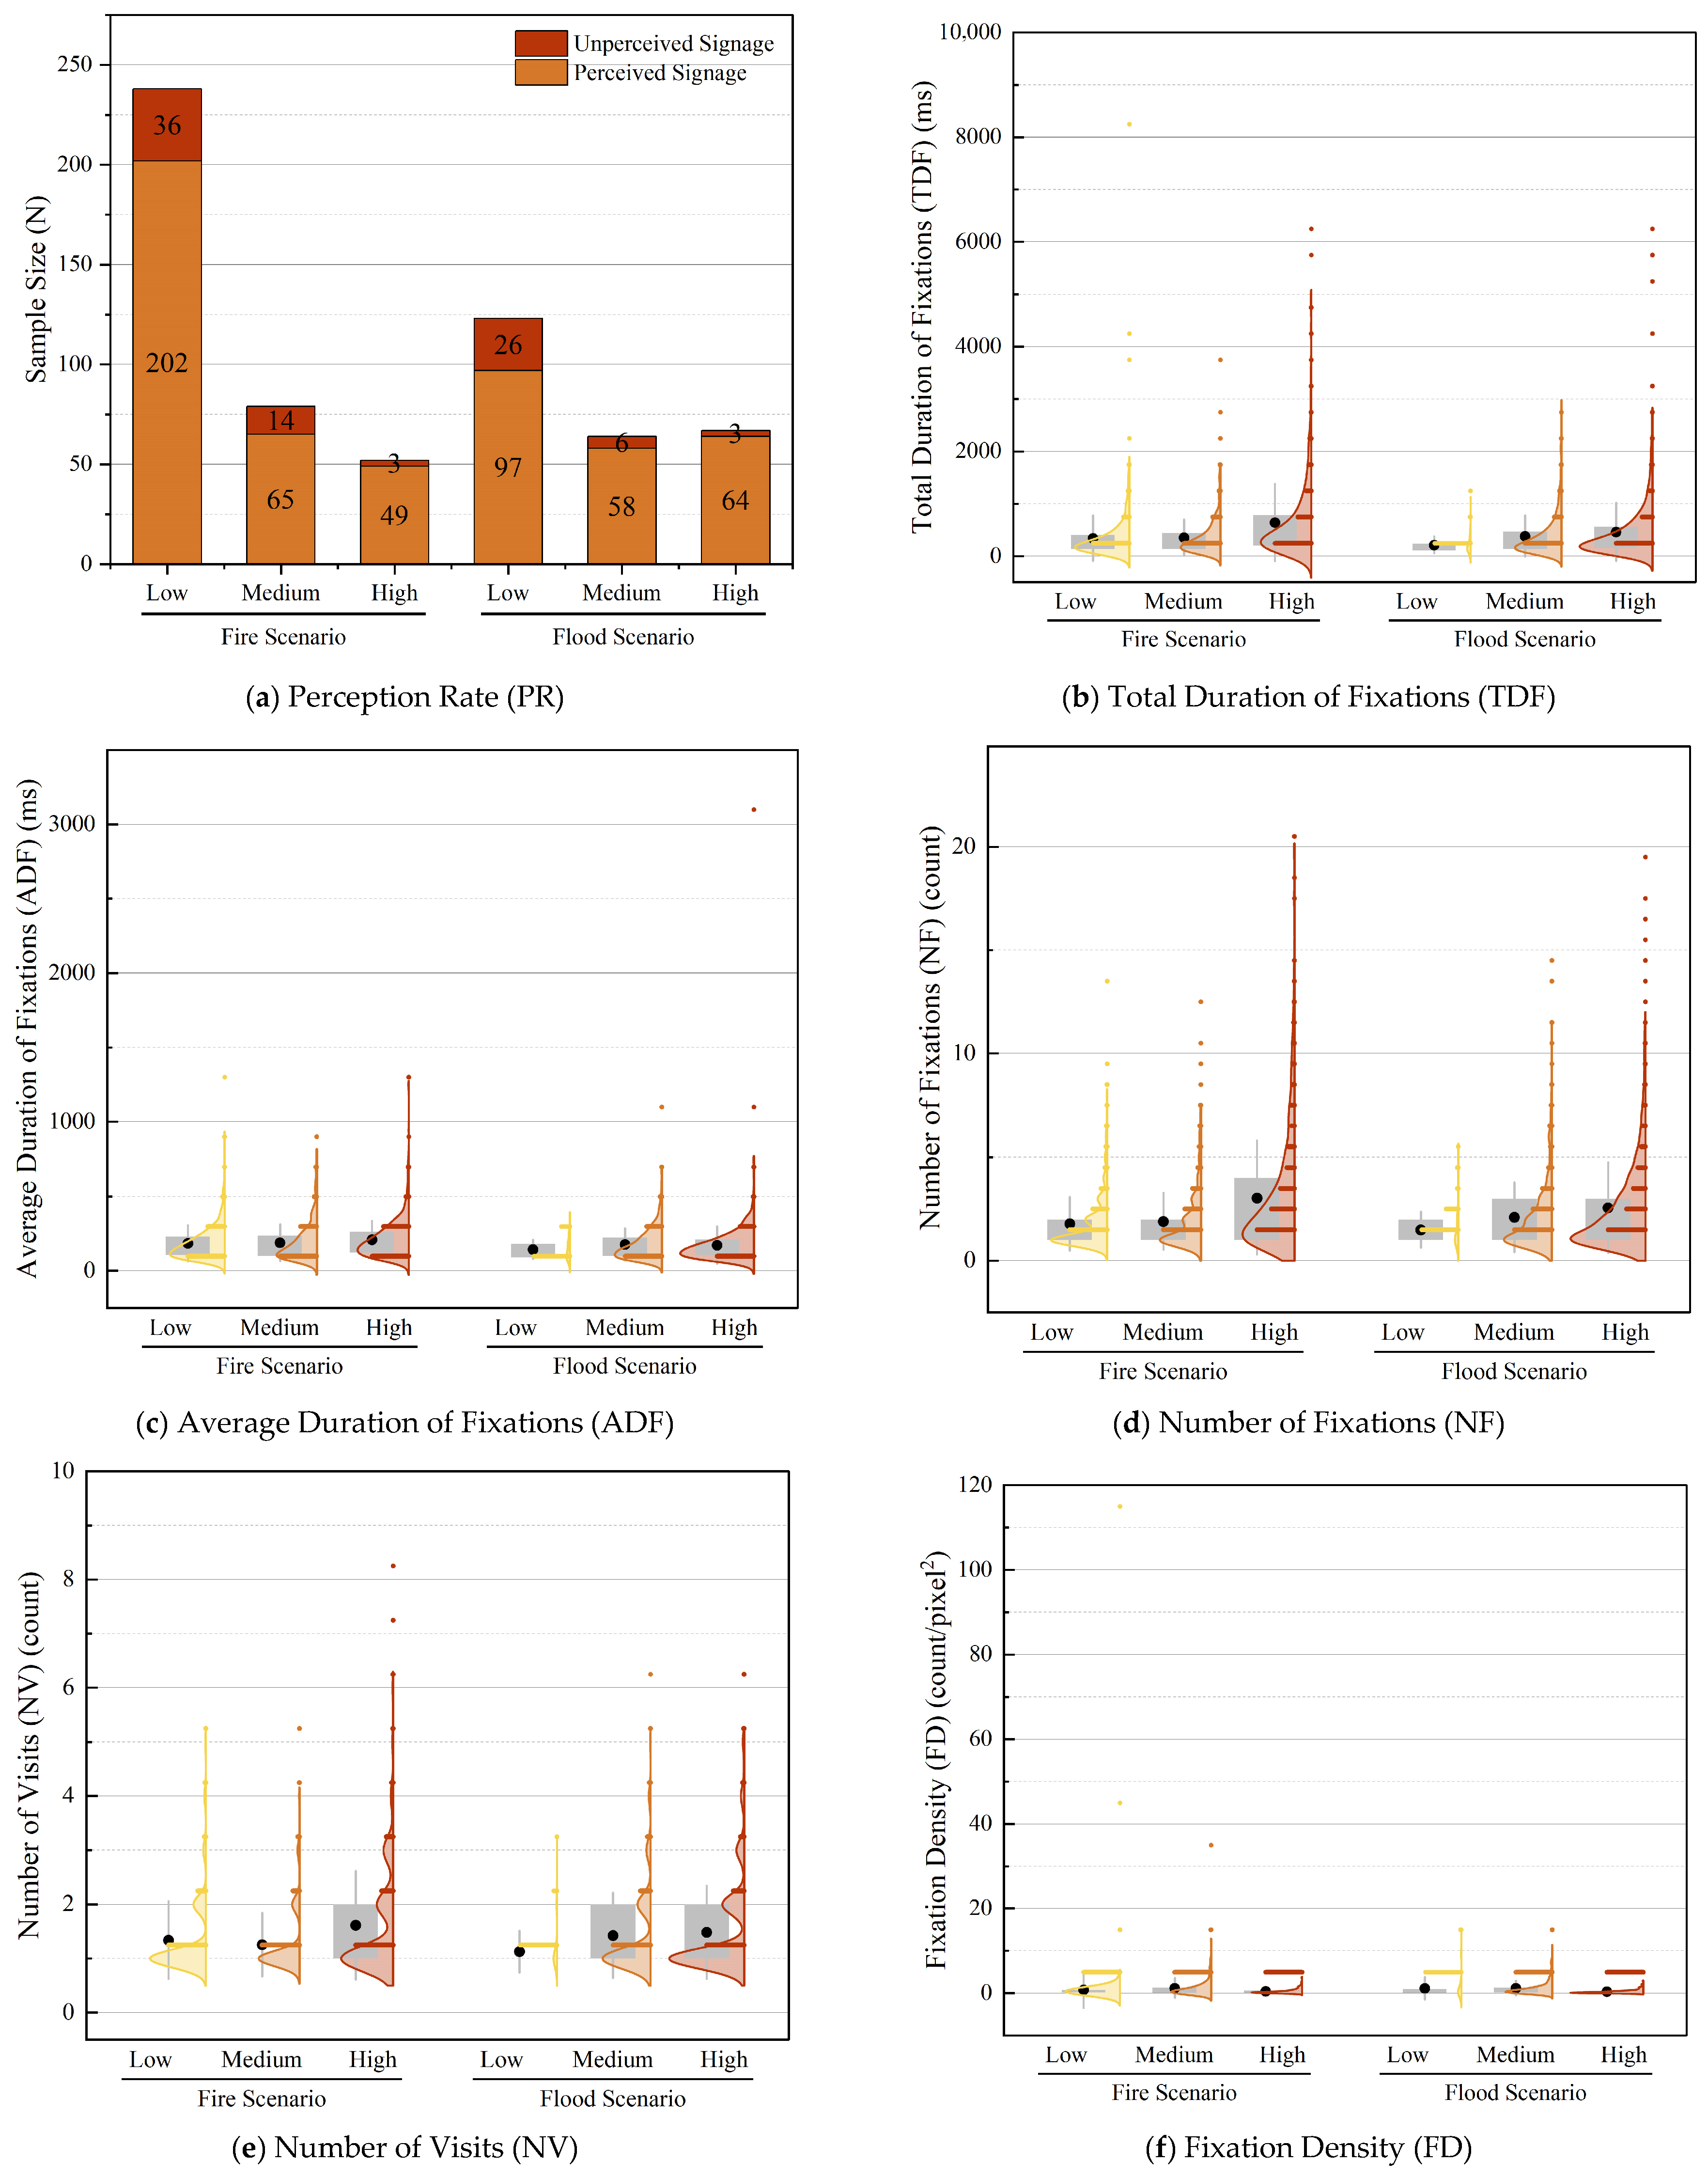
TFF exhibits significant scenario-dependent heterogeneity between fire and flood conditions. In the fire scenario, low-position signage has the shortest TFF (3786.32 ms), compared with medium (4316.71 ms) and high positions (4265.93 ms). Conversely, in the flood scenario, low-position signage shows a substantially longer TFF (4791.24 ms) than medium (3987.44 ms) and high positions (3889.01 ms). The shorter TFF for low-position signage in the fire scenario reflects its advantage in immediate guidance, likely because their information is more concise or visually salient, enabling participants to capture initial details and form a decision more rapidly; this also helps explain why low-position signage has relatively smaller TDF and ADF. In contrast, the longer TFF for low-position signage in the flood scenario likely results from turbid water obscuring ground-level signage, forcing participants to spend more time locating and interpreting critical information. This comparison indicates that reduced visibility caused by floodwater turbidity significantly diminishes the immediacy of low-position signage.
Moreover, the nonparametric test results reveal no significant difference in TFF between medium- and high-position signage for either scenario, with mean differences very small (50.78 ms in fire, 98.43 ms in flood), suggesting that decision-initiation efficiency is similar for medium- and high-position signage.
FFDR further confirms the influence of vertical placement on decision-making efficiency. In both scenarios, low-position signage has significantly higher FFDR (74.08% in fire, 78.70% in flood) than medium and high positions (fire: 71.26%, 55.71%; flood: 67.80%, 61.36%), indicating that participants obtain core information during the initial fixation more often on low-position signage, reducing the need for repeated information retrieval and accelerating the decision process. The lower FFDR for high-position signage likewise demonstrates its richer information hierarchy, compelling participants to rely on multiple refixations to read, verify, and integrate information to ensure decision accuracy. Overall, low-position signage is characterized by simplicity and efficiency, offering superior immediate guidance under emergency conditions; although the flood environment forces participants to extend search time, the high FFDR indicates that its negative impact on final decision efficiency is limited. Medium- and high-position signage should improve the conversion rate of initial fixation to information acquisition in order to balance decision speed and accuracy, thereby optimizing overall immediacy.
From the perspective of signage immediacy, vertical placement has a significant effect, corroborating Hypothesis 1. Low-position signage demonstrates the best immediacy (shortest TFF in the fire scenario and highest FFDR in both scenarios). In contrast, in the flood scenario, environmental interference clearly impairs its TFF performance, supporting Hypothesis 2’s assertion that “floods will reduce the effectiveness of low-position signage.” Medium-position signage exhibits moderate immediacy, and high-position signage performs relatively poorly overall.
Figure 8. Eye-tracking metric statistics for fire and flood scenarios.
Buildings 15 03771 g008aBuildings 15 03771 g008b

4.3. Analysis of Heat Maps and Gaze Plots

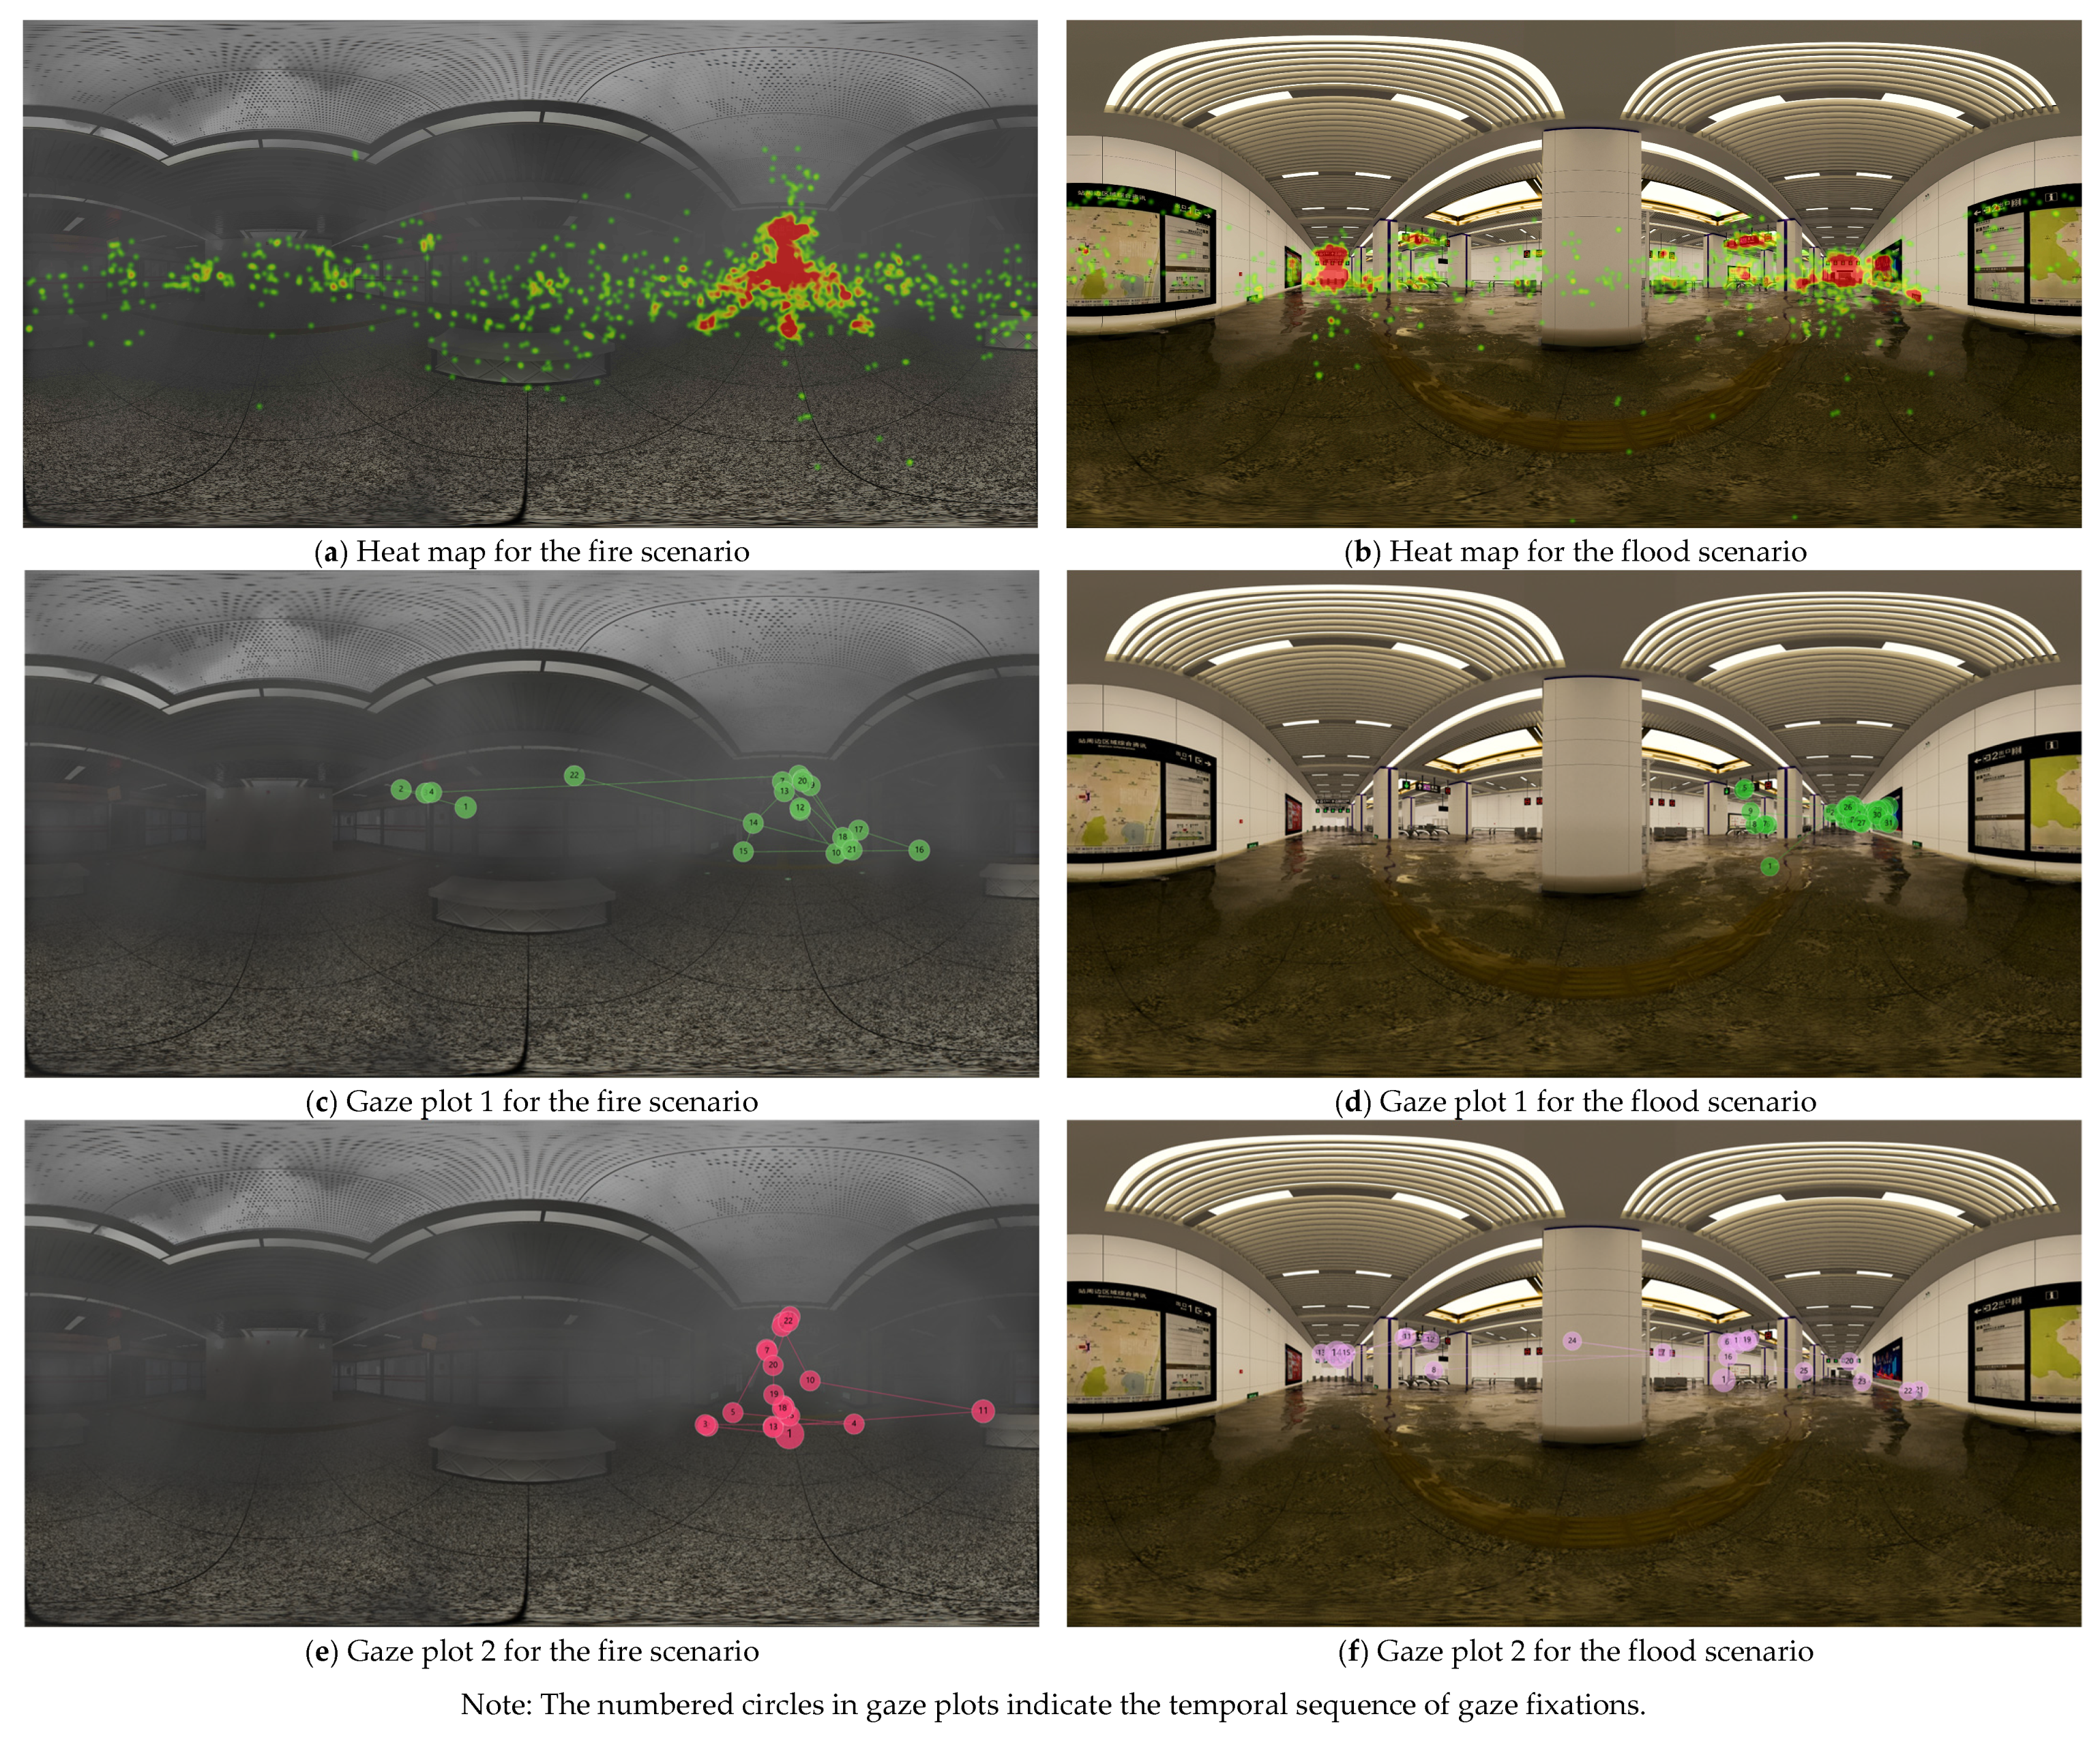
Heat maps and gaze plots are essential tools for visualizing eye-tracking behavior data. Heat maps depict the duration and spatial distribution of fixations using varying colors and densities, thereby revealing the information-attraction properties and visual dwell patterns of signage regions. Gaze plots, on the other hand, trace fixation sequences in temporal order, exposing the logic of visual scene search and evacuation-direction selection [53]. Figure 9 presents typical nodes selected from the fire and flood scenarios. The heat maps integrate fixation data from all participants to reveal common patterns at the group level, while the gaze plots show records from two representative participants, illustrating typical individual search paths and strategies. In the fire scenario, the analysis shows that most participants, after an initial environmental assessment, quickly extract critical information from high-position signage and correctly choose their evacuation direction; the corresponding areas in the heat map form high-density (red) regions. A similar pattern emerges in the flood scenario: high-position exit signs in both directions receive the highest fixation density at the selected node, indicating that participants have effectively identified their escape routes. These visualizations provide data-driven support for optimizing signage layout.

5. Optimization Strategies for Subway Emergency Evacuation Signage

Based on the “importance–immediacy” dual-dimensional analytical framework derived from the VR eye-tracking experiment and the observed eye movement behaviors under disaster scenarios, this study proposes signage optimization strategies in two aspects: common design principles and hierarchical adaptation.

5.1. Common Optimization Strategies

Signage design within subway spaces should conform to principles of spatial cognition and behavioral guidance, achieving systemic and effective improvements through the coordinated optimization of spatial layout and content structure. The spatial layout of signage should ensure clear overall guidance and continuous functional flow, avoiding both excessive dispersion and concentration. In accordance with the spatial characteristics of the platform and concourse levels, the distribution density of signage should be dynamically adjusted at different locations. Unrelated obstructions that visually interfere with key information should be minimized to improve PR and visual accessibility.
In terms of content design, visual salience should be enhanced by eliminating redundant text and graphical elements, employing a consistent high-contrast color scheme, and integrating dynamic lighting features (e.g., flashing arrow modules) [54] to attract evacuees’ attention. Furthermore, digital signage technology can provide environmental sensing and monitoring functions, issuing warnings and intelligently guiding evacuation routes during disasters to facilitate safer egress [55].
Simultaneously, power outages during disasters can create dark environments that hinder the visibility of evacuation paths [56]. In such cases, emergency signage must remain illuminated to maintain visibility. Therefore, it is crucial to ensure the proper functioning of fundamental systems such as emergency lighting. Moreover, signage should be designed to accommodate environmental variability across different disaster scenarios by enhancing resistance to interference and overall adaptability. This includes improving properties such as light transmittance and heat resistance, as well as incorporating mechanisms for dynamically adjusting exit route guidance in real time according to the specific disaster context [57].
Experimental data demonstrate that flood conditions impose significant negative impacts on low-position signage. To mitigate these effects, innovative solutions such as waterproof and anti-fouling coatings [58] and high-brightness LED light sources [55] should be employed to counteract the visual degradation caused by murky floodwaters. For fire scenarios, in response to visual interference from smoke, signage visibility can be improved by using high-temperature-resistant translucent materials, phosphorescent guidance devices [59], and strobe light sources [19]. Additionally, the integration of dynamic smoke concentration warning functions may support early-stage disaster alerts and evacuation actions. For other disaster types, protective measures should also be reinforced through material innovation or embedded technologies to ensure the adaptive functionality and sustained visibility of evacuation signage systems.

5.2. Hierarchical Adaptation Strategies

High-position hanging signage should serve as global guidance carriers, conveying overarching evacuation information such as escape routes and exit directions. A modular design approach should be adopted to distribute auxiliary textual and symbolic elements rationally, balancing the salience and complexity of critical information. This prevents information overload on individual signs and enhances guiding efficiency through spatial layout optimization. Currently, most high-position signage lack self-illumination and exist merely as non-luminous text-based indicators, which renders them ineffective under power outages or smoke-filled conditions. Therefore, adaptive lighting solutions should be integrated to ensure visibility in complex environments.
Mid-position wall-mounted signage, in line with the concept of peacetime-emergency integration, can leverage its advantageous spatial positioning by transforming conventional guidance signage into switchable emergency guidance systems. For instance, facilities such as advertisement panels or map boards can display routine service information under normal conditions but convert into evacuation maps or real-time disaster monitoring interfaces via electronic displays during emergencies. These should be equipped with synchronized voice prompts to enhance evacuees’ decision-making efficiency through audiovisual coordination.
Low-position near-ground signage should focus on rapid-response needs by optimizing information format and spatial layout. Simple, visually prominent emergency lighting or photoluminescent evacuation signage (e.g., directional arrows) [60] should be installed to minimize evacuees’ reaction time through straightforward indications. These signs must also be designed for high visual accessibility even in turbid flood conditions.
When implementing such a hierarchical signage system on a large scale, it is important to balance cost-effectiveness, technical feasibility, and long-term maintenance requirements. Modular and standardized designs are recommended to reduce manufacturing costs. Existing infrastructure should be leveraged for retrofitting to enhance technical feasibility. Durable materials that resist aging and damage should be selected to minimize future maintenance burdens.
Future research and design should explore standardized spacing systems for signage—such as mandatory low-mid-high level guidance within a specified range—alongside dynamic height adjustment technologies that adapt to environmental changes like water level or smoke density. Moreover, disaster-specific design features and the integration of intelligent interaction technologies should be considered to develop a fully adaptive, all-scenario emergency evacuation signage system.

6. Conclusions and Discussion

6.1. Conclusions

This study employed VR-based eye-tracking experiments under simulated fire and flood scenarios to analyze individual visual perception behaviors during evacuation in metro spaces. A dual-dimensional analytical framework of “importance–immediacy” was developed based on the vertical positioning of signage, systematically revealing the heterogeneous characteristics of signage at low, medium, and high heights and proposing corresponding hierarchical optimization strategies. The key findings are as follows:
(1)
Low-position signage (0–0.8 m) demonstrates significant advantages in terms of immediacy and should be used for concise, visually salient emergency-response signage. In fire scenarios, TFF was the shortest, and FFDR was the highest, indicating rapid information acquisition. However, in flood environments, the presence of turbid water notably impaired visual accessibility. To mitigate this, low-position signage should incorporate waterproof and anti-fouling coatings as well as high-brightness LED light sources to enhance resistance to environmental interference.
(2)
Medium-position signage (0.8–2 m) exhibits balanced performance across both importance and immediacy dimensions. It achieved high FD and moderate values across other indicators, suggesting that signage at this height should serve as a transitional guidance node between low- and high-position signage. It can effectively balance importance, immediacy, and accuracy by hosting intermediary directional cues. Additionally, medium-position signage is suitable for implementing switchable emergency guidance systems aligned with the “peacetime-emergency integration” concept.
(3)
High-position signage (>2 m) performs prominently in the dimension of importance. It achieved the highest values for TDF, NF, and PR, indicating its suitability for conveying global, multi-level evacuation information. In practical applications, the use of high-temperature-resistant translucent materials, phosphorescent guidance devices, and strobe lighting can enhance visibility under fire conditions, leading to improved perceptual efficiency of core evacuation information.
Furthermore, the flood environment posed notable visual interference to low-position signage due to reduced visibility caused by turbid water. However, in this study, smoke interference in fire scenarios did not result in statistically significant differences in eye-tracking metrics for high-position signage. This may mainly be attributed to the larger size of high-position signage, which maintained sufficient visual accessibility even in smoke conditions, thereby reducing the interference effect. Therefore, the part of Hypothesis 2 regarding fire conditions impairing high-position signage was not supported, and no further analysis or discussion was conducted on this aspect.

6.2. Discussion

This study preliminarily established an evaluation framework for signage effectiveness based on vertical placement height. However, further research is needed in the following directions:
(1)
The methodology employed in this study should be extended to additional types of disaster scenarios to explore the generalizability and variability in signage performance across different environments.
(2)
The current vertical classification of signage (low, medium, high) can be further refined, for instance, by using 0.5 m intervals. Additionally, the lack of consideration for horizontal positioning may influence conclusions regarding the variability in vertical signage performance. Future studies should incorporate both vertical and horizontal spatial dimensions for a more comprehensive analysis.
(3)
This study’s sample is limited to university students aged 18–23, which may not fully represent populations of various ages, social groups, or cultural backgrounds. These factors could influence signage perception and limit the applicability of the conclusions to groups with different wayfinding habits. Future research should include a broader sample range.
(4)
This study was conducted in idealized unoccupied environments, without directly simulating the impact of crowd congestion on the signage system. In crowded scenes, low-position signage may be obscured, significantly reducing its effectiveness, which is a critical issue in actual evacuations. In contrast, high-position signage maintains high visibility across all crowd densities. Therefore, in crowded situations, reliance on high-position signage should be prioritized, with medium-position signage serving as a supplementary guide.
(5)
Due to limitations in equipment and experimental techniques, this study collected eye-tracking data based solely on static panoramic images. This means that this study could not fully simulate the dynamic, real-time factors present in actual emergencies, leading to reduced realism and a lower sense of urgency in the experimental environment. Although the VR environment can overcome physical constraints and simulate complex scenarios that are difficult to achieve in reality, it can only approximate real scenes and cannot fully reproduce the panic and dynamic behaviors that occur during emergencies. This difference may influence the allocation of visual attention. Future research should explore methods for real-time monitoring in dynamic environments. Additionally, quantifying the effects of smoke density in fire scenarios and water turbidity in flood scenarios on signage effectiveness and visual accessibility would provide a more scientifically grounded evaluation of signage performance under actual disaster conditions.

Author Contributions

Y.L.: Writing—original draft, Conceptualization, Visualization, Validation, Software, Methodology, Investigation. T.M.: Software, Investigation, Resources, Writing—original draft, Data curation, Validation. X.C.: Software, Investigation, Conceptualization, Methodology, Validation. K.W.: Investigation, Visualization, Validation. L.Z.: Investigation, Software, Methodology. J.R.: Methodology, Conceptualization, Supervision, Writing—Review and Editing, Funding Acquisition, Project administration. H.X.: Resources, Supervision, Project administration. H.L.: Project administration, Supervision. All authors have read and agreed to the published version of the manuscript.

Funding

This work was supported by the National Natural Science Foundation of China, Young Scientists Fund (Project No. 42501539), titled “Research on Spatiotemporal Dynamic Route Optimization Methods for Vehicles in Urban Flood Disaster Scenarios”; Hunan Students’ Platform for innovation and entrepreneurship training program (Project No. S202310532235), titled “A Study on Emergency Shelter and Evacuation Signage in Subway Spaces Based on Visual Perception—A Case Study of Fubuhe Road Subway Station in Changsha”; and the Scientific Research Project of Hunan Geological Society (Project No. HNGSTP202154), titled “Research on Disaster Vulnerability Assessment Methods for Historic and Cultural Villages”.

Institutional Review Board Statement

This study was conducted according to the guidelines of the Declaration of Helsinki and approved by the Institutional Review Board of Hunan University on 2 October 2024.

Informed Consent Statement

Informed consent was obtained from all subjects involved in this study.

Data Availability Statement

The original contributions presented in this study are included in this article. Further inquiries can be directed to the corresponding author.

Acknowledgments

The authors are grateful to the editor and anonymous reviewers for their valuable comments and suggestions that helped improve this manuscript. The authors also sincerely thank the Architectural Media Laboratory, School of Architecture and Planning, Hunan University, for providing equipment and space for this study.

Conflicts of Interest

The authors declare no conflicts of interest.

Abbreviations

The following abbreviations are used in this manuscript:
VRVirtual Reality
AOIArea of Interest
PRPerception Rate
TDFTotal Duration of Fixations
ADFAverage Duration of Fixations
NFNumber of Fixations
NVNumber of Visits
FDFixation Density
TFFTime to First Fixation
FFDRFirst Fixation Dwell Ratio
DFFDuration of First Fixation

References

  1. Li, Y.; Xu, X.; Hou, S.; Dang, X.; Li, Z.; Gong, Y. Flood risk management-level analysis of subway station spaces. Water 2025, 17, 1084. [Google Scholar] [CrossRef]
  2. Jin, B.; Wang, J.; Wang, Y.; Gu, Y.; Wang, Z. Temporal and spatial distribution of pedestrians in subway evacuation under node failure by multi-hazards. Saf. Sci. 2020, 127, 104695. [Google Scholar] [CrossRef]
  3. The State Council Investigation Team. Investigation Report on the Extremely Heavy Rainfall Disaster in Zhengzhou, Henan on July 20 [R/OL]. Available online: https://www.mem.gov.cn/gk/sgcc/tbzdsgdcbg/202201/P020220121639049697767.pdf (accessed on 18 April 2025). (In Chinese)
  4. New York Post. Flash Flooding Causes Mayhem on NYC Streets and Subways [EB/OL]. Available online: https://nypost.com/2021/09/01/nyc-streets-subway-stations-overrun-by-flash-floods/ (accessed on 18 April 2025).
  5. Liao, P.; Chen, L.; Liang, Z.; Huang, Y.; Chen, H.; Sun, L. Investigating the optimal scale for subway station hall designs based on psychological perceptions and eye-tracking methods. J. Build. Eng. 2025, 103, 112175. [Google Scholar] [CrossRef]
  6. Zhang, M.; Xu, R.; Siu, M.F.F.; Luo, X. Human decision change in crowd evacuation: A virtual reality-based study. J. Build. Eng. 2023, 68, 106041. [Google Scholar] [CrossRef]
  7. Fu, M.; Liu, R.; Liu, Q. How individuals sense environments during indoor emergency wayfinding: An eye-tracking investigation. J. Build. Eng. 2023, 79, 107854. [Google Scholar] [CrossRef]
  8. Fan, R.; Dai, Z.; Tian, S.; Xia, T.; Huang, C. Research on spatial information transmission efficiency and capability of safety evacuation signs. J. Build. Eng. 2023, 71, 106448. [Google Scholar] [CrossRef]
  9. Luo, S.; Shi, J.; Lu, T.; Furuya, K. Sit down and rest: Use of virtual reality to evaluate preferences and mental restoration in urban park pavilions. Landsc. Urban Plan. 2022, 220, 104336. [Google Scholar] [CrossRef]
  10. Kim, J.H.; Kim, M.; Park, M.; Yoo, J. Immersive interactive technologies and virtual shopping experiences: Differences in consumer perceptions between augmented reality (AR) and virtual reality (VR). Telemat. Inform. 2023, 77, 101936. [Google Scholar] [CrossRef]
  11. Wang, Z.; He, R.; Rebelo, F.; Vilar, E.; Noriega, P. Human interaction with virtual reality: Investigating pre-evacuation efficiency in building emergency. Virtual Real. 2023, 27, 1039–1050. [Google Scholar] [CrossRef]
  12. Vukelic, G.; Ogrizovic, D.; Bernecic, D.; Glujic, D.; Vizentin, G. Application of VR technology for maritime firefighting and evacuation training—A review. J. Mar. Sci. Eng. 2023, 11, 1732. [Google Scholar] [CrossRef]
  13. Moreno-Arjonilla, J.; López-Ruiz, A.; Jiménez-Pérez, J.R.; Callejas-Aguilera, J.E.; Jurado, J.M. Eye-tracking on virtual reality: A survey. Virtual Real. 2024, 28, 38. [Google Scholar] [CrossRef]
  14. Zhang, X.; Chen, L.; Jiang, J.; Ji, Y.; Han, S.; Zhu, T.; Xu, W.; Tang, F. Risk analysis of people evacuation and its path optimization during tunnel fires using virtual reality experiments. Tunn. Undergr. Space Technol. 2023, 137, 105133. [Google Scholar] [CrossRef]
  15. Wang, Z.; Mao, Z.; Li, Y.; Yu, L.; Zou, L. VR-based fire evacuation in underground rail station considering staff’s behaviors: Model, system development and experiment. Virtual Real. 2023, 27, 1145–1155. [Google Scholar] [CrossRef]
  16. Xia, X.; Chen, J.; Zhang, J.; Li, N. How the strength of social relationship affects pedestrian evacuation behavior: A multi-participant fire evacuation experiment in a virtual metro station. Transp. Res. Part C Emerg. Technol. 2024, 167, 104805. [Google Scholar] [CrossRef]
  17. Xie, H.; Galea, E.R. A survey-based study concerning public comprehension of two-component EXIT/NO-EXIT signage concepts. Fire Mater. 2022, 46, 876–887. [Google Scholar] [CrossRef]
  18. Wong, L.T.; Lo, K.C. Experimental study on visibility of exit signs in buildings. Build. Environ. 2007, 42, 1836–1842. [Google Scholar] [CrossRef]
  19. Nilsson, D.; Frantzich, H.; Saunders, W.L. Coloured Flashing Lights to Mark Emergency Exits-Experiences from Evacuation Experiments. Fire Saf. Sci. 2005, 8, 569–579. [Google Scholar] [CrossRef]
  20. Ding, N. The effectiveness of evacuation signs in buildings based on eye tracking experiment. Nat. Hazards 2020, 103, 1201–1218. [Google Scholar] [CrossRef]
  21. Chen, N.; Zhao, M.; Gao, K.; Zhao, J. The physiological experimental study on the effect of different color of safety signs on a virtual subway fire escape—An exploratory case study of zijing mountain subway station. Int. J. Environ. Res. Public Health 2020, 17, 5903. [Google Scholar] [CrossRef]
  22. Tonikian, R.; Proulx, G.; Bénichou, N.; Reid, I. Literature review on photoluminescent material used as a safety wayguidance system. PLM V6-2 2006, 1, 3–31. [Google Scholar] [CrossRef]
  23. Kobes, M.; Helsloot, I.; De Vries, B.; Post, J.G.; Oberijé, N.; Groenewegen, K. Way finding during fire evacuation; an analysis of unannounced fire drills in a hotel at night. Build. Environ. 2010, 45, 537–548. [Google Scholar] [CrossRef]
  24. Olander, J.; Ronchi, E.; Lovreglio, R.; Nilsson, D. Dissuasive exit signage for building fire evacuation. Appl. Ergon. 2017, 59, 84–93. [Google Scholar] [CrossRef]
  25. Liu, Z.; Zou, R. Dynamic evacuation path planning for subway station fire based on IACO. J. Build. Eng. 2024, 86, 108828. [Google Scholar] [CrossRef]
  26. Zhang, N.; Liang, Y.; Zhou, C.; Niu, M.; Wan, F. Study on fire smoke distribution and safety evacuation of subway station based on BIM. Appl. Sci. 2022, 12, 12808. [Google Scholar] [CrossRef]
  27. Cao, S.; Wang, M.; Zeng, G.; Li, X. Simulation of crowd evacuation in subway stations under flood disasters. IEEE Trans. Intell. Transp. Syst. 2024, 25, 11858–11867. [Google Scholar] [CrossRef]
  28. Feng, J.R.; Gai, W.; Yan, Y. Emergency evacuation risk assessment and mitigation strategy for a toxic gas leak in an underground space: The case of a subway station in Guangzhou, China. Saf. Sci. 2021, 134, 105039. [Google Scholar] [CrossRef]
  29. Zhang, Y.; Chen, X.; Jiang, J. Wayfinding-oriented design for passenger guidance signs in large-scale transit center in China. Transp. Res. Rec. 2010, 2144, 150–160. [Google Scholar] [CrossRef]
  30. Hu, X.; Xu, L. How Guidance Signage Design Influences Passengers’ Wayfinding Performance in Metro Stations: Case Study of a Virtual Reality Experiment. Transp. Res. Rec. 2023, 2677, 1118–1129. [Google Scholar] [CrossRef]
  31. Wang, K.; Shen, C.; Li, M.; Li, J. Research on Users’ Willingness to Use the Urban Subway Wayfinding Signage System Based on the DeLone & McLean Model Theory: A Case Study of Wuxi Subway. Systems 2024, 12, 529. [Google Scholar] [CrossRef]
  32. Zhou, M.; Dong, H.; Wang, X.; Hu, X.; Ge, S. Modeling and simulation of crowd evacuation with signs at subway platform: A case study of Beijing subway stations. IEEE Trans. Intell. Transp. Syst. 2022, 23, 1492–1504. [Google Scholar] [CrossRef]
  33. Cavanagh, P. Visual cognition. Vis. Res. 2011, 51, 1538–1551. [Google Scholar] [CrossRef]
  34. Wickens, C.D.; Carswell, C.M. Information processing. In Handbook of Human Factors and Ergonomics; John Wiley & Sons: Hoboken, NJ, USA, 2021; pp. 114–158. [Google Scholar] [CrossRef]
  35. Schneck, C.M. Visual perception. Occup. Ther. Child. 2005, 3, 357–386. [Google Scholar]
  36. Bitzer, S.; Park, H.; Maess, B.; Von Kriegstein, K.; Kiebel, S.J. Representation of perceptual evidence in the human brain assessed by fast, within-trial dynamic stimuli. Front. Hum. Neurosci. 2020, 14, 9. [Google Scholar] [CrossRef] [PubMed]
  37. Hasanzadeh, S.; Esmaeili, B.; Dodd, M.D. Examining the relationship between construction workers’ visual attention and situation awareness under fall and tripping hazard conditions: Using mobile eye tracking. J. Constr. Eng. Manag. 2018, 144, 04018060. [Google Scholar] [CrossRef]
  38. Guo, F.; Ding, Y.; Liu, W.; Liu, C.; Zhang, X. Can eye-tracking data be measured to assess product design?: Visual attention mechanism should be considered. Int. J. Ind. Ergon. 2016, 53, 229–235. [Google Scholar] [CrossRef]
  39. Carter, B.T.; Luke, S.G. Best practices in eye tracking research. Int. J. Psychophysiol. 2020, 155, 49–62. [Google Scholar] [CrossRef]
  40. Chen, Y.; Jia, J.; Che, G. Simulation of large-scale tunnel belt fire and smoke characteristics under a water curtain system based on CFD. ACS Omega 2022, 7, 40419–40431. [Google Scholar] [CrossRef]
  41. Wan, Z.; Zhou, T.; Luo, N. A Literature Review on Layout of Emergency Evacuation Signs of Exhibition Hall in Exhibition and Convention Center Based on Visibility. Build. Sci. 2020, 36, 160–168. (In Chinese) [Google Scholar] [CrossRef]
  42. Wan, Z.; Zhou, T.; Xiong, J.; Pan, G. Smart Safety Design for Evacuation Signs in Large Space Buildings Based on Height Setting and Visual Range of Evacuation Signs. Buildings 2024, 14, 2875. [Google Scholar] [CrossRef]
  43. Shi, J.; Ding, N.; Zhang, Z. Evacuation Decision-Making in Fire Situation: Base on Eye Movement Experiment in Physical and Virtual Environments. Case Stud. Therm. Eng. 2025, 71, 106148. [Google Scholar] [CrossRef]
  44. Tang, Z.; Liu, X.; Huo, H.; Tang, M.; Qiao, X.; Chen, D.; Dong, Y.; Fan, L.; Wang, J.; Du, X.; et al. Eye movement characteristics in a mental rotation task presented in virtual reality. Front. Neurosci. 2023, 17, 1143006. [Google Scholar] [CrossRef] [PubMed]
  45. Li, X.; Wang, P.; Li, L.; Liu, J. The influence of architectural heritage and tourists’ positive emotions on behavioral intentions using eye-tracking study. Sci. Rep. 2025, 15, 1447. [Google Scholar] [CrossRef] [PubMed]
  46. Hao, S.; Hou, R.; Zhang, J.; Shi, Y.; Zhang, Y.; Wang, C. Visual behavior characteristics of historical landscapes based on eye-tracking technology. J. Asian Arch. Build. Eng. 2025, 24, 487–506. [Google Scholar] [CrossRef]
  47. Ding, N.; Zhong, Y.; Li, J.; Xiao, Q. Study on selection of native greening plants based on eye-tracking technology. Sci. Rep. 2022, 12, 1092. [Google Scholar] [CrossRef]
  48. Lin, W.; Mu, Y.; Zhang, Z.; Wang, J.; Diao, X.; Lu, Z.; Guo, W.; Wang, Y.; Xu, B. Research on cognitive evaluation of forest color based on visual behavior experiments and landscape preference. PLoS ONE 2022, 17, e0276677. [Google Scholar] [CrossRef]
  49. Xu, J.; Baliutaviciute, V.; Swan, G.; Bowers, A.R. Driving with hemianopia X: Effects of cross traffic on gaze behaviors and pedestrian responses at intersections. Front. Hum. Neurosci. 2022, 16, 938140. [Google Scholar] [CrossRef]
  50. Miscenà, A.; Arato, J.; Rosenberg, R. Absorbing the gaze, scattering looks: Klimt’s distinctive style and its two-fold effect on the eye of the beholder. J. Eye Mov. Res. 2020, 13, 1–13. [Google Scholar] [CrossRef]
  51. Tobii. [Eye Tracking Has No Problem] Issue 8—How to Calculate AOI Area? [EB/OL]. Available online: https://zhuanlan.zhihu.com/p/621346101 (accessed on 18 April 2025). (In Chinese).
  52. Linka, M.; Broda, M.D.; Alsheimer, T.; De Haas, B.; Ramon, M. Characteristic fixation biases in Super-Recognizers. J. Vis. 2022, 22, 17. [Google Scholar] [CrossRef]
  53. Villegas, E.; Fonts, E.; Fernández, M.; Fernández-Guinea, S. Visual Attention and Emotion Analysis Based on Qualitative Assessment and Eyetracking Metrics—The Perception of a Video Game Trailer. Sensors 2023, 23, 9573. [Google Scholar] [CrossRef]
  54. Galea, E.R.; Xie, H.; Lawrence, P.J. Experimental and survey studies on the effectiveness of dynamic signage systems. Fire Saf. Sci. 2014, 11, 1129–1143. [Google Scholar] [CrossRef]
  55. Cheimaras, V.; Trigkas, A.; Papageorgas, P.; Piromalis, D.; Sofianopoulos, E. A low-cost open-source architecture for a digital signage emergency evacuation system for cruise ships, based on IoT and LTE/4G technologies. Future Internet 2022, 14, 366. [Google Scholar] [CrossRef]
  56. Kinkel, E.; van der Wal, C.N.; Hoogendoorn, S.P. The effects of three environmental factors on problem-solving abilities during evacuation. J. Build. Eng. 2025, 99, 111546. [Google Scholar] [CrossRef]
  57. Zhao, H.; Schwabe, A.; Schläfli, F.; Thrash, T.; Aguilar, L.; Dubey, R.K.; Karjalainen, J.; Hölscher, C.; Helbing, D.; Schinazi, V.R. Fire evacuation supported by centralized and decentralized visual guidance systems. Saf. Sci. 2022, 145, 105451. [Google Scholar] [CrossRef]
  58. Hong, C.; Li, J.; Zhang, J.; Zhai, R.; Fei, B.; Zhou, C. Rational design of a novel siloxane-branched waterborne polyurethane coating with waterproof and antifouling performance. Prog. Org. Coat. 2024, 194, 108576. [Google Scholar] [CrossRef]
  59. Jeon, G.Y.; Hong, W.H. An experimental study on how phosphorescent guidance equipment influences on evacuation in impaired visibility. J. Loss Prev. Process Ind. 2009, 22, 934–942. [Google Scholar] [CrossRef]
  60. GB/T 33668-2017; Code for Safety Evacuation of Metro [S/OL]. China Standards Press: Beijing, China, 2017. Available online: https://openstd.samr.gov.cn/bzgk/gb/newGbInfo?hcno=27AA44A76DD3ADF2A3F5701238E3951A&refer=outter (accessed on 1 April 2025). (In Chinese)
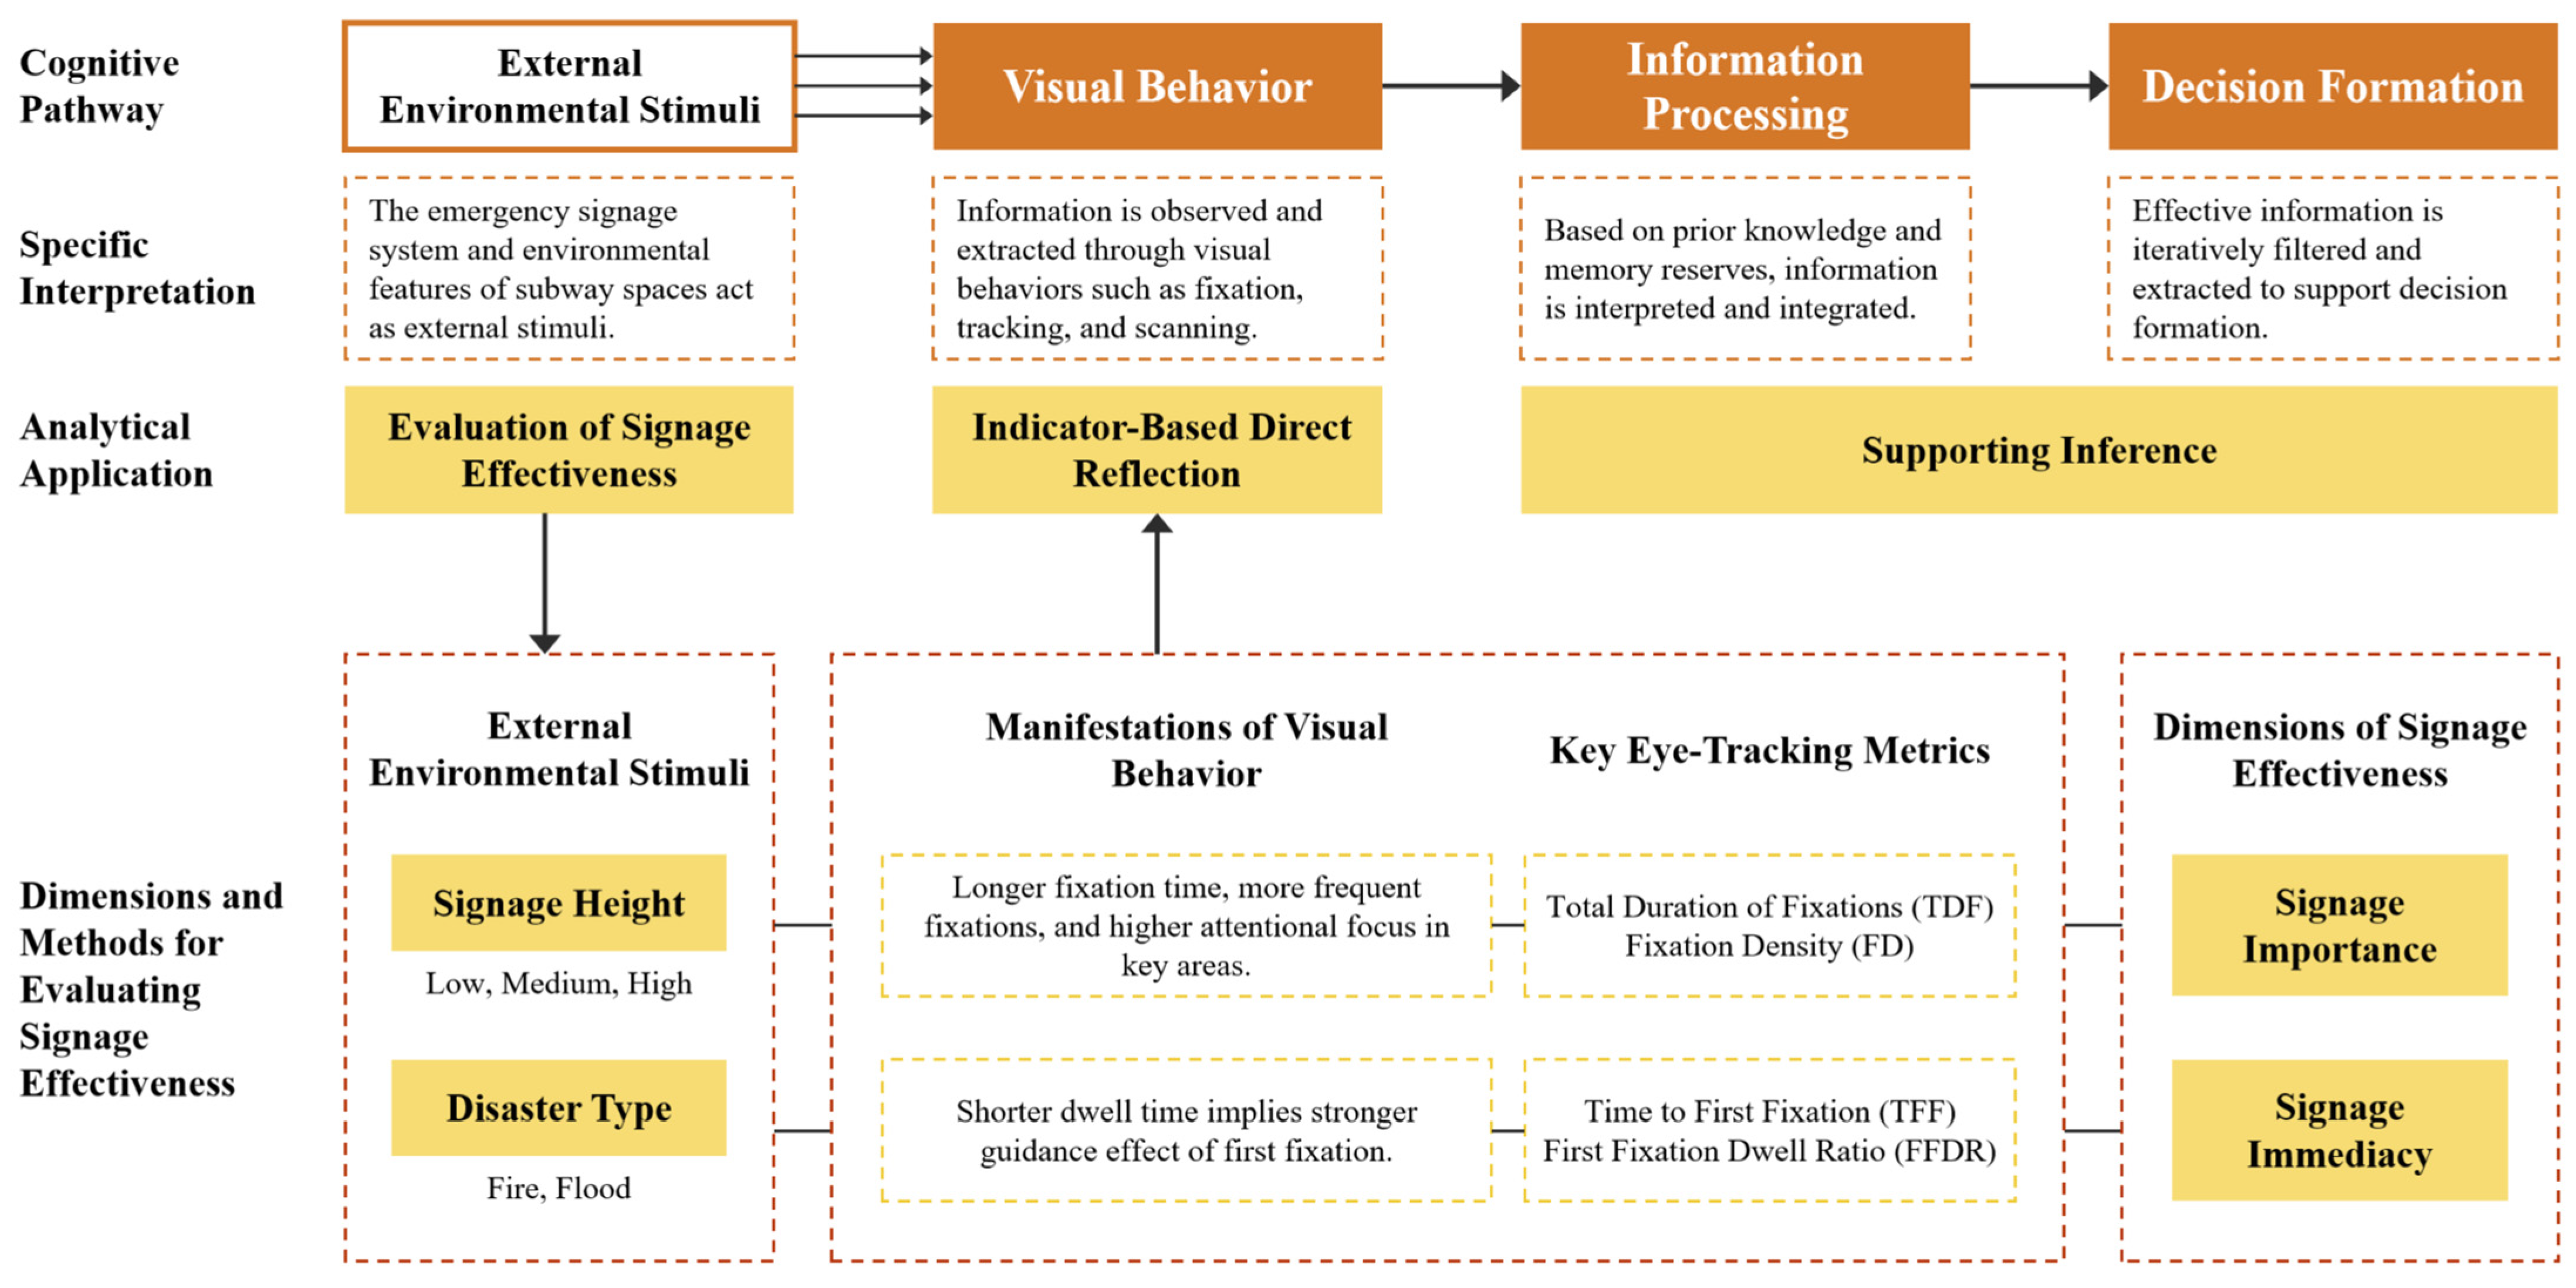
Figure 1. Theoretical Framework.
Buildings 15 03771 g001
Figure 7. AOI division of fire and flood scenario images.
Buildings 15 03771 g007
Figure 9. Eye-tracking heat maps and gaze plots for fire and flood scenarios.
Buildings 15 03771 g009
Table 4. Eye-tracking metrics under fire and flood scenarios.
Indicator CategoryIndicator NameFire ScenarioFlood Scenario
LowMediumHighLowMediumHigh
Perception RatePerception Rate (PR)Mean84.87%82.28%94.23%78.86%90.63%95.52%
Signage ImportanceTotal Duration of Fixations (TDF)Mean342.58354.83645.22214.45383.32463.26
SD437.17347.40739.67168.94397.39559.31
Average Duration of Fixations (ADF)Mean185.73190.48210.71144.91178.73173.55
SD120.99125.28126.6165.33109.76125.80
Number of Fixations (NF)Mean1.791.903.031.492.102.56
SD1.311.382.750.881.692.21
Number of Visits (NV)Mean1.341.251.611.131.431.48
SD0.720.591.010.390.790.86
Fixation Density (FD)Mean0.821.240.491.191.200.39
SD4.342.420.652.691.760.50
Signage ImmediacyTime to First Fixation (TFF)Mean3786.324316.714265.934791.243987.443889.01
SD2801.652761.672685.512436.352832.092697.02
First Fixation Dwell Ratio (FFDR)Mean74.08%71.26%55.71%78.70%67.80%61.36%
SD0.330.340.370.320.350.36
Note: The five indicators in bold are the primary metrics used for analysis, as the evaluation logic of ADF, NF, and NV is similar to that of TDF. SD refers to Standard Deviation.
Disclaimer/Publisher’s Note: The statements, opinions and data contained in all publications are solely those of the individual author(s) and contributor(s) and not of MDPI and/or the editor(s). MDPI and/or the editor(s) disclaim responsibility for any injury to people or property resulting from any ideas, methods, instructions or products referred to in the content.