Article

Thermal Performance and Energy Efficiency Evaluation of Thermally Activated Composite Panel for Retrofitted Buildings Across Diverse Climate Zones of Gansu, China

1
Gansu Institute of Architectural Design and Research Co., Ltd., Lanzhou 730030, China
2
College of Architecture and Urban Planning, Anhui Jianzhu University, Hefei 230601, China
3
College of Architecture and Art, Hefei University of Technology, Hefei 230601, China
*
Authors to whom correspondence should be addressed.
Buildings 2025, 15(20), 3763; https://doi.org/10.3390/buildings15203763
Submission received: 27 September 2025 / Revised: 13 October 2025 / Accepted: 16 October 2025 / Published: 18 October 2025
(This article belongs to the Special Issue Urban Climatic Suitability Design and Risk Management)

Abstract

This study investigates the use of thermally activated composite panels (TACP) as an energy-efficient retrofitting solution for existing buildings. By utilizing low-grade heat sources, TACP offers significant energy efficiency and carbon emission reduction. To address the challenges posed by high embodied carbon, exterior envelope delamination, and fire safety risks associated with conventional insulation materials, three TACP configurations were proposed: external insulation with externally embedded pipes (EE-TACP), external insulation with internally embedded pipes (EI-TACP), and internal insulation with internally embedded pipes (II-TACP). These were proposed for adapting TACP-walls to the diverse climate zones of Gansu Province. To clarify the thermal performance, energy-saving potential, and reduction effect on conventional insulation thickness of TACP-walls under different climatic conditions and heat source temperatures, dynamic heat transfer models of the TACP-wall were developed and validated. Three energy-saving rate (ε) indicators were introduced to analyze the dynamic thermal behavior in typical cities across the three climate zones of Gansu Province. A comparison was made among the three configurations in terms of instantaneous thermal response characteristics, cumulative internal surface heat load, and ε, relative to both non-insulated walls (NI-walls) and conventional insulated energy-saving walls (CE-walls). The results demonstrate that the application of TACP-walls significantly enhances thermal performance under all three climatic conditions. Irrespective of operating conditions, the ε remains essentially constant corresponding to the four insulation thicknesses, indicating that traditional thickness can be drastically curtailed. EE-TACP, EI-TACP, and II-TACP achieve pronounced ε values of 7.57/7.97/7.50 relative to NI-wall and CE-wall at inlet temperatures of 28–36 °C. Among the three configurations, EI-TACP performs most prominently across all climate zones. The findings provide a valuable reference for the application and optimization of thermally activated technology in energy-efficient retrofits of existing buildings.

1. Introduction

Building energy consumption is a significant contributor to global energy usage and greenhouse gas emissions. Energy efficiency in buildings is not only crucial for improving energy utilization but also an essential strategy for addressing climate change and mitigating global warming [1]. According to statistics, the total floor area of existing buildings in China has far surpassed that of newly constructed buildings. Driven by urban renewal and the growing demand for improved living standards, both national and local governments have introduced policies to promote energy-efficient retrofitting of existing buildings [2]. Among various retrofitting measures, improving the building envelope has become a core focus due to its foundational role, widespread applicability, and significant energy-saving potential [3]. As the key interface for heat exchange between the interior and exterior, the thermal performance of the building envelope directly impacts the building energy consumption and carbon emissions. Therefore, enhancing its insulation properties is a critical means to meet the energy-saving and emission-reduction requirements in different climatic regions [4].
Currently, wall insulation technologies are mainly divided into passive static insulation and active dynamic insulation technologies [5]. The former controls the heat transfer coefficient (K-value) of the envelope structure through the use of insulation materials; however, it faces issues such as high embedded carbon emissions, insufficient durability, high costs, and fire safety risks. In contrast, the latter regulates the temperature difference (ΔT-value) across the envelope, utilizing low-grade renewable energy sources such as air energy and geothermal energy to form a dynamic thermal barrier within the envelope, which reduces heat exchange at its source. Compared to traditional passive methods, active dynamic insulation not only reduces the space occupied by the insulation layer, mitigates fire risks, and extends system life, but also demonstrates greater adaptability and energy-saving potential in the retrofitting of existing buildings [6]. Among various dynamic insulation methods, Thermo-activated Building Systems (TABS) have become a research hotspot both domestically and internationally in recent years [7,8]. TABS embeds hydraulic circulation pipes into the walls, injecting low-grade thermal sources to create an invisible thermal barrier parallel to the interior space, thereby suppressing the heat transfer between the indoor and outdoor environments, achieving both improved building energy efficiency and enhanced indoor environmental quality. Li et al. [9] highlighted that integrating low-grade thermal sources into conventional embedded-pipe wall systems can effectively reduce building thermal loads, which is of significant importance for future low-energy and low-carbon buildings. Yang et al. [10] proposed a novel modular embedded-pipe wall design and, through both experimental and numerical simulations, investigated the effects of pipe cavity dimensions and the thermal conductivity of filler materials on the dynamic thermal behavior and performance metrics of the system. Karanaft et al. [11] further emphasized that using the building framework as a medium for low-grade energy injection and storage represents an effective strategy for achieving both energy savings and occupant comfort.
In recent years, the research on TABS has gradually expanded to the energy retrofitting of existing buildings. Rajput et al. [12] proposed a statistical model of spatial variability of weather for use in building simulation practice. This model effectively simulates the impact of weather variations on the thermal performance of buildings, providing an important reference for optimizing building energy-saving designs using thermally activated technologies. Wu et al. [13] demonstrated significant energy efficiency improvements in retrofitted buildings within dynamic multi-energy building environments by optimizing the resource management system. Especially in cold regions, the heating demand of buildings was reduced by approximately 25%. Zhao et al. [14] further analyzed the application of TABS technology in different climatic regions, noting that in dry and cold areas, TABS can provide a more flexible and efficient energy utilization model compared to traditional static insulation methods. The study revealed that the dynamic thermal barrier of the TABS system not only reduced the intrusion of external heat but also enhanced indoor thermal comfort, particularly during seasonal temperature fluctuations.
However, existing research has mainly focused on areas with single or minimal climatic variation. In regions like Gansu, where there is significant climate diversity and a large geographical span, there remains a lack of systematic performance evaluation and optimization studies. This limits the applicability of existing results in areas with significant seasonal changes and spatial climatic differences. Furthermore, in the retrofitting of existing buildings, structural limitations often prevent the placement of the embedded pipe layer in the middle of the structure, which further restricts the application of TABS in retrofitting projects. The commonly used method of thickening external insulation presents issues such as fire safety risks, high embodied carbon, and excessive thickness that occupy valuable space, while also struggling to meet the demanding retrofitting requirements of cold regions.
To address the above issues, this study integrates TABS technology with existing building envelope structures. It proposes three types of thermally activated composite panel (TACP) (external insulation with external embedded pipes, external insulation with internal embedded pipes, and internal insulation with internal embedded pipes). Unlike previous studies that mainly focused on single climate zones or conventional insulation materials, this research applies thermally activated technology to the energy-efficient retrofitting of existing buildings in Gansu Province, exploring its applicability under multiple climatic conditions. Through numerical simulations, the effects of pipe position, insulation thickness, and heat input temperature on the thermal performance and energy-saving potential are systematically analyzed. Using non-insulated walls and conventional external insulation walls as references, the dynamic thermal characteristics and energy-saving potential of the three TACP configurations are compared across severe cold, cold, and hot summer–cold winter climatic regions, thereby determining the optimal configuration for different climate zones in Gansu.
The paper is structured as follows: Section 2 introduces the research methods and the development of the numerical simulation model; Section 3 investigates the dynamic thermal performance and energy-saving potential of different TACP configurations across the three climate zones of Gansu Province under varying parameters. Specifically, Section 3.1 analyses the effects of the three parameters on TACP thermal performance and determines the optimal scheme. In contrast, Section 3.2 compares the energy-saving potential of TACP with that of two reference walls. Section 4 presents the conclusions and outlook.

2. Methodology

2.1. Working Principle of Thermally Activated Composite Panel

The thermally activated composite panel (TACP) forms an invisible thermal barrier within the wall by circulating low-grade energy available from the building’s surroundings through its embedded pipe layer, thereby actively reducing heat transfer between indoor and outdoor environments. Depending on the inlet temperature of the heat source, the TACP operates in three typical modes across different seasons.
The heat transfer principles for three typical winter operational modes are compared between a conventional external insulation wall and TACP walls, using the example of the external insulation with externally embedded pipes TACP (EE-TACP), which are schematically shown in Figure 1. When the inlet temperature lies between the outdoor and indoor air temperatures (Te < Tc < Ti), the system operates in the active insulation mode, which significantly increases the inner surface temperature of the wall and substantially reduces the thermal load (Figure 1b). When the inlet temperature approximates or equals the indoor air temperature (Te < Tc = Ti), the system operates in the neutral mode (Figure 1c), where the negligible temperature difference between the inner wall surface and the indoor environment effectively eliminates heating energy demand caused by envelope heat losses. When the inlet temperature exceeds the indoor air temperature during winter (Te < Ti < Tc), the system operates in the auxiliary heating mode (Figure 1d). In this case, the thermal load of the envelope becomes negative, indicating that the TACP can provide supplementary heating or even serve as a direct heating source for the indoor environment.

2.2. Physical and Mathematical Models

2.2.1. Geometry Model of TACP

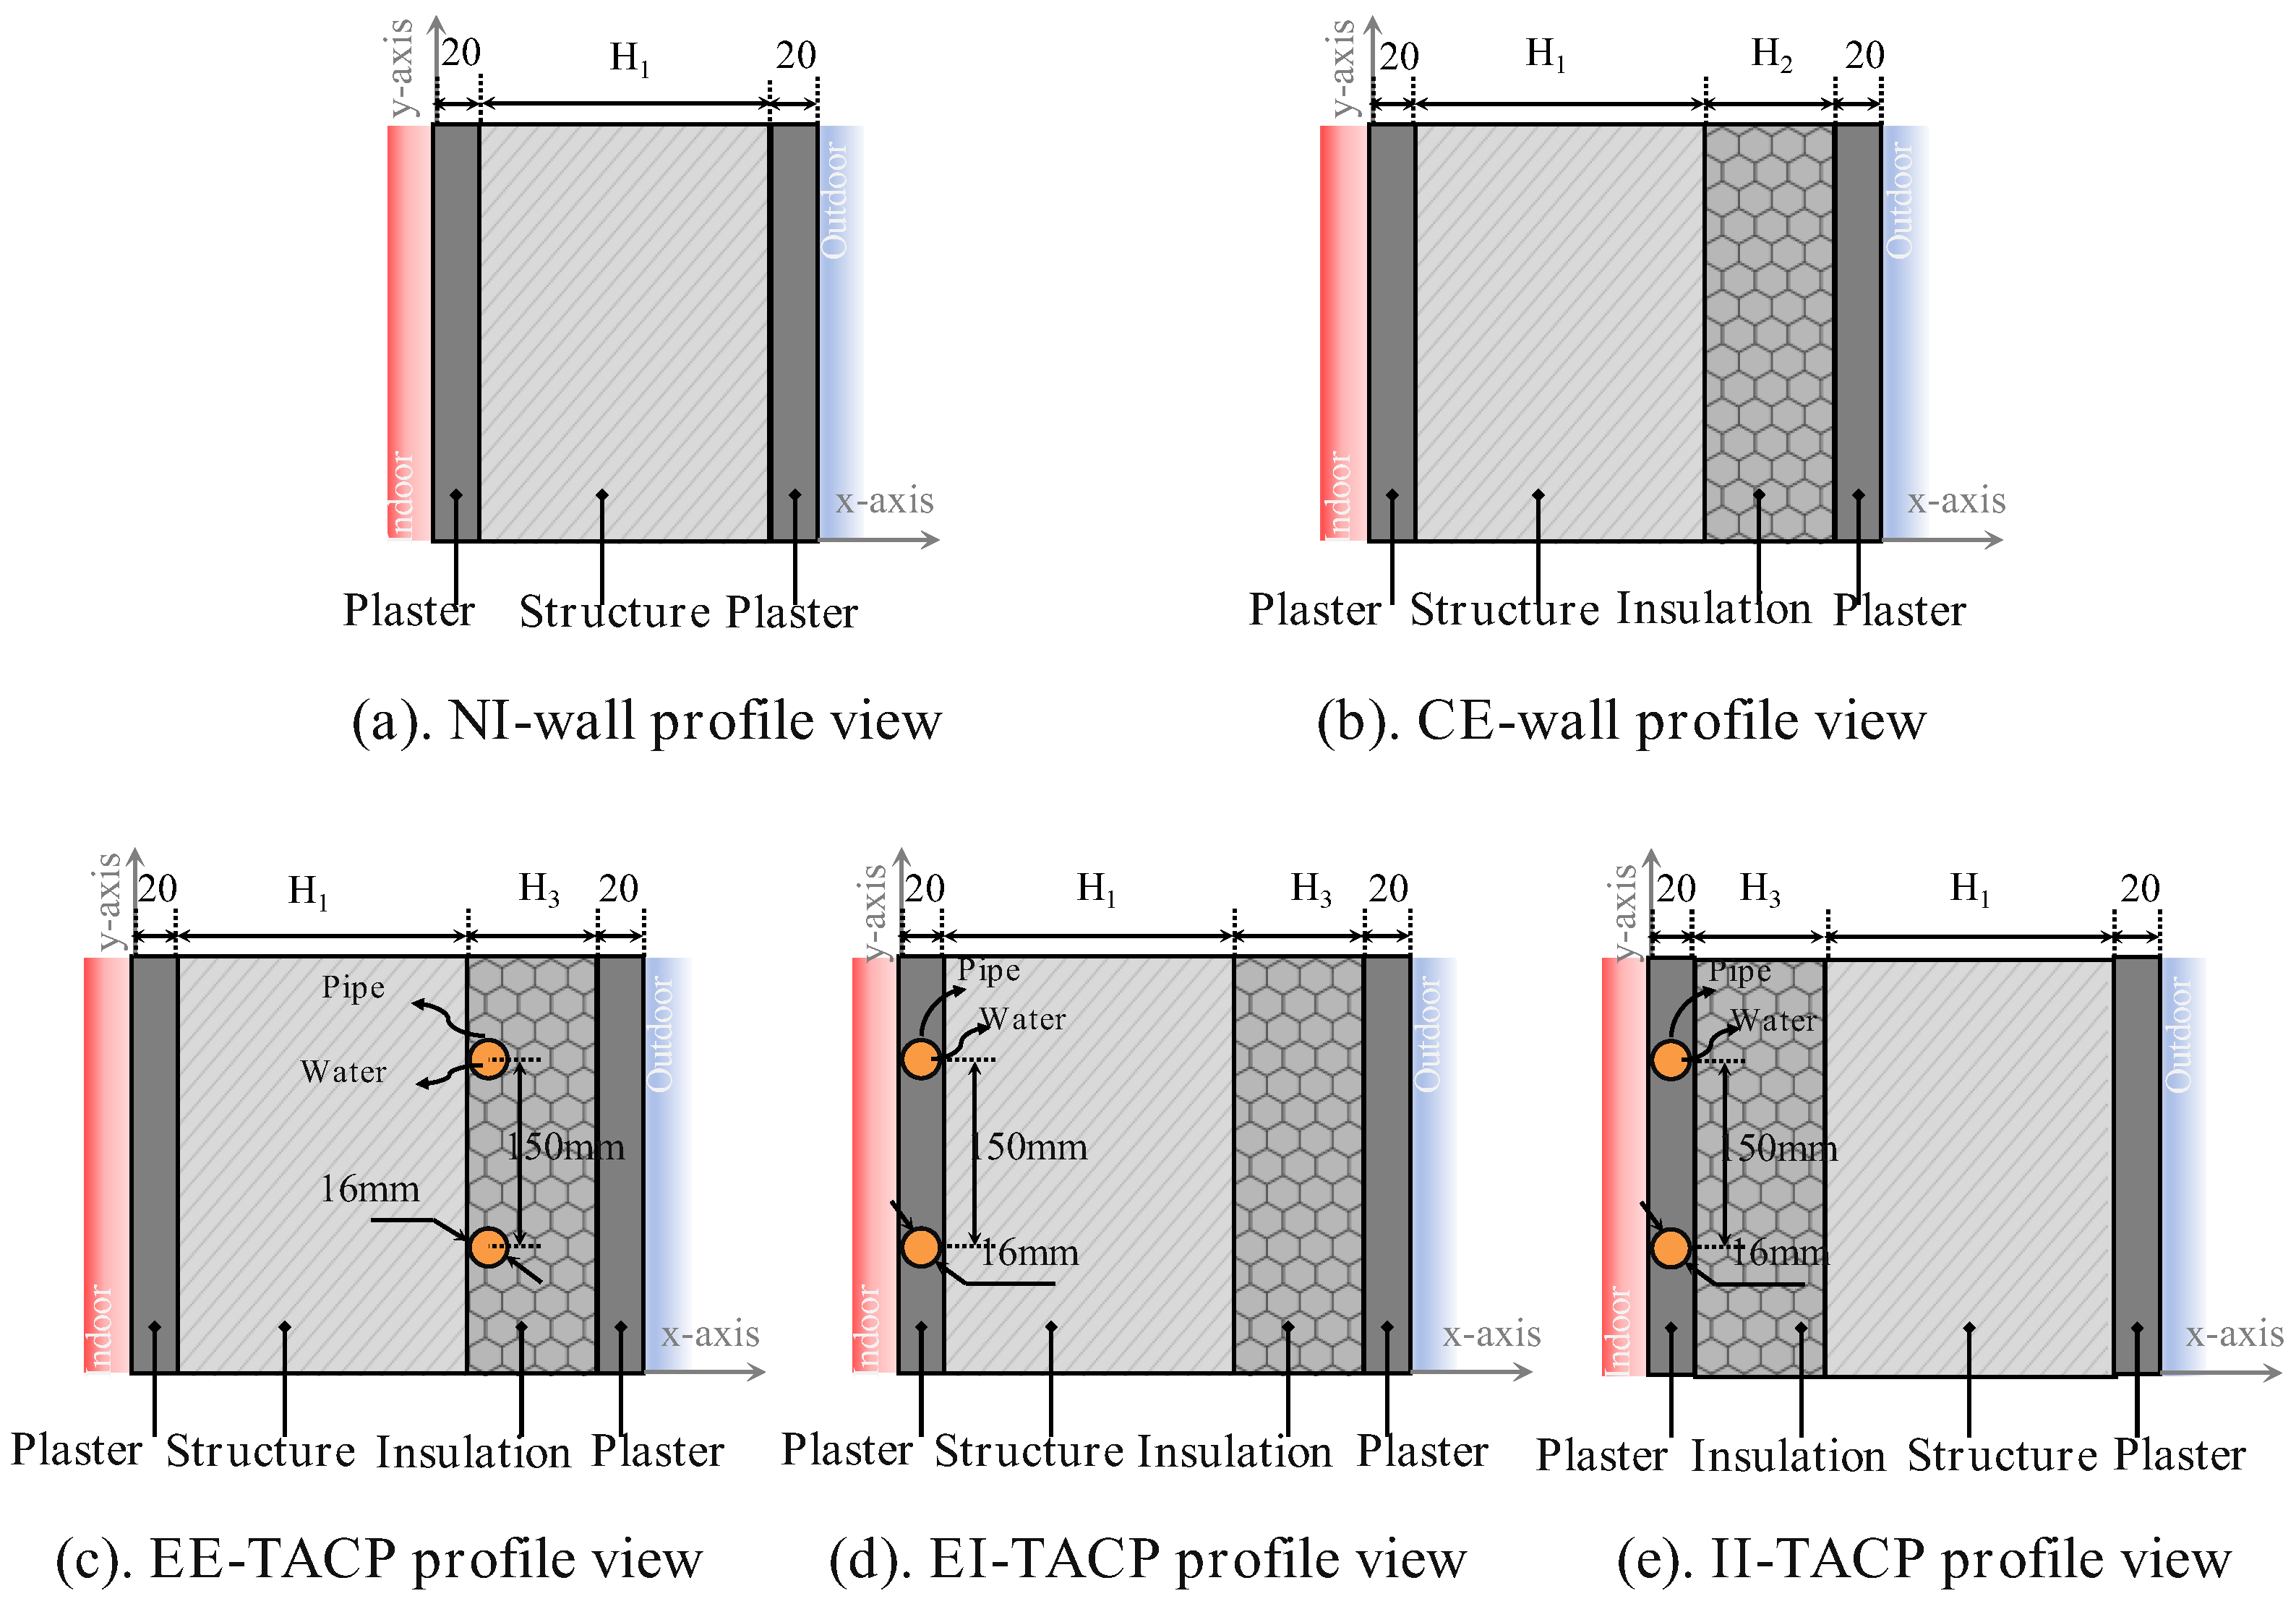
This study uses existing buildings with non-insulated walls (NI-wall) and conventional insulated energy-saving walls (CE-wall) as reference wall types, with their structural and physical models shown in Figure 2a,b. Figure 2c–e illustrate three different configurations of TACP walls: external insulation with externally embedded pipes (EE-TACP), external insulation with internally embedded pipes (EI-TACP), and internal insulation with internally embedded pipes (II-TACP). The NI-wall, lacking an insulation layer, exhibits high heat transfer and poor thermal stability. The CE-wall reduces heat loss through conventional insulation materials; however, it remains a passive thermal control system with limited effectiveness. In contrast, the TACP-wall combines embedded low-temperature water pipes with an insulation layer, enabling active thermal regulation and enhanced heat storage capacity. This configuration significantly improves thermal stability and indoor thermal comfort while achieving higher energy efficiency and carbon-reduction potential. Parametric analysis will be conducted to determine the thermal characteristics and energy-saving potential of these three configurations in the energy retrofitting of existing buildings across three climate zones in Gansu Province, namely, the severe cold climate zones, cold climate zones, and hot summer–cold winter climate zones. The geometric parameters and thermal properties of the five wall types are presented in Table 1. In these configurations, the insulation thickness of the TACP walls (denoted as H3) is treated as a variable, aimed at comparing the reduction in insulation thickness achieved by TACP relative to the traditional insulation layer. Therefore, the insulation thickness of the CE-wall is set equal to that of the maximum insulation thickness in three TACP configurations, with thicknesses varying according to the energy-saving requirements of each climate zone. In the severe cold climate zones (Jiuquan city), the insulation thickness is set between 60 mm and 120 mm; in the cold climate zones (Lanzhou city), it ranges from 40 mm to 100 mm; and in the hot summer–cold winter climate zones (Wudu city), the thickness ranges from 30 mm to 70 mm [15]. Since most existing buildings in Gansu Province are constructed with brick walls, the structural layer in the model is assumed to be brick, with thicknesses of 370 mm in Jiuquan city and Lanzhou city, and 240 mm in Wudu city.

2.2.2. Meshing Method

All numerical simulations in this study were performed using the commercial finite element analysis software ANSYS Workbench 2023 R1 (Ansys, Inc., Canonsburg, PA, USA). First, the geometry modeling for all cases was completed in the DesignModeler module, and mesh generation and boundary naming were further carried out after importing them into the Mesh module. Next, all simulation operations were conducted in the Fluent solver, including setting up the energy and viscosity models, specifying material properties and operating parameters, initializing the computational model, configuring computational settings, running the simulation, and ensuring that the computational model met the convergence criteria.
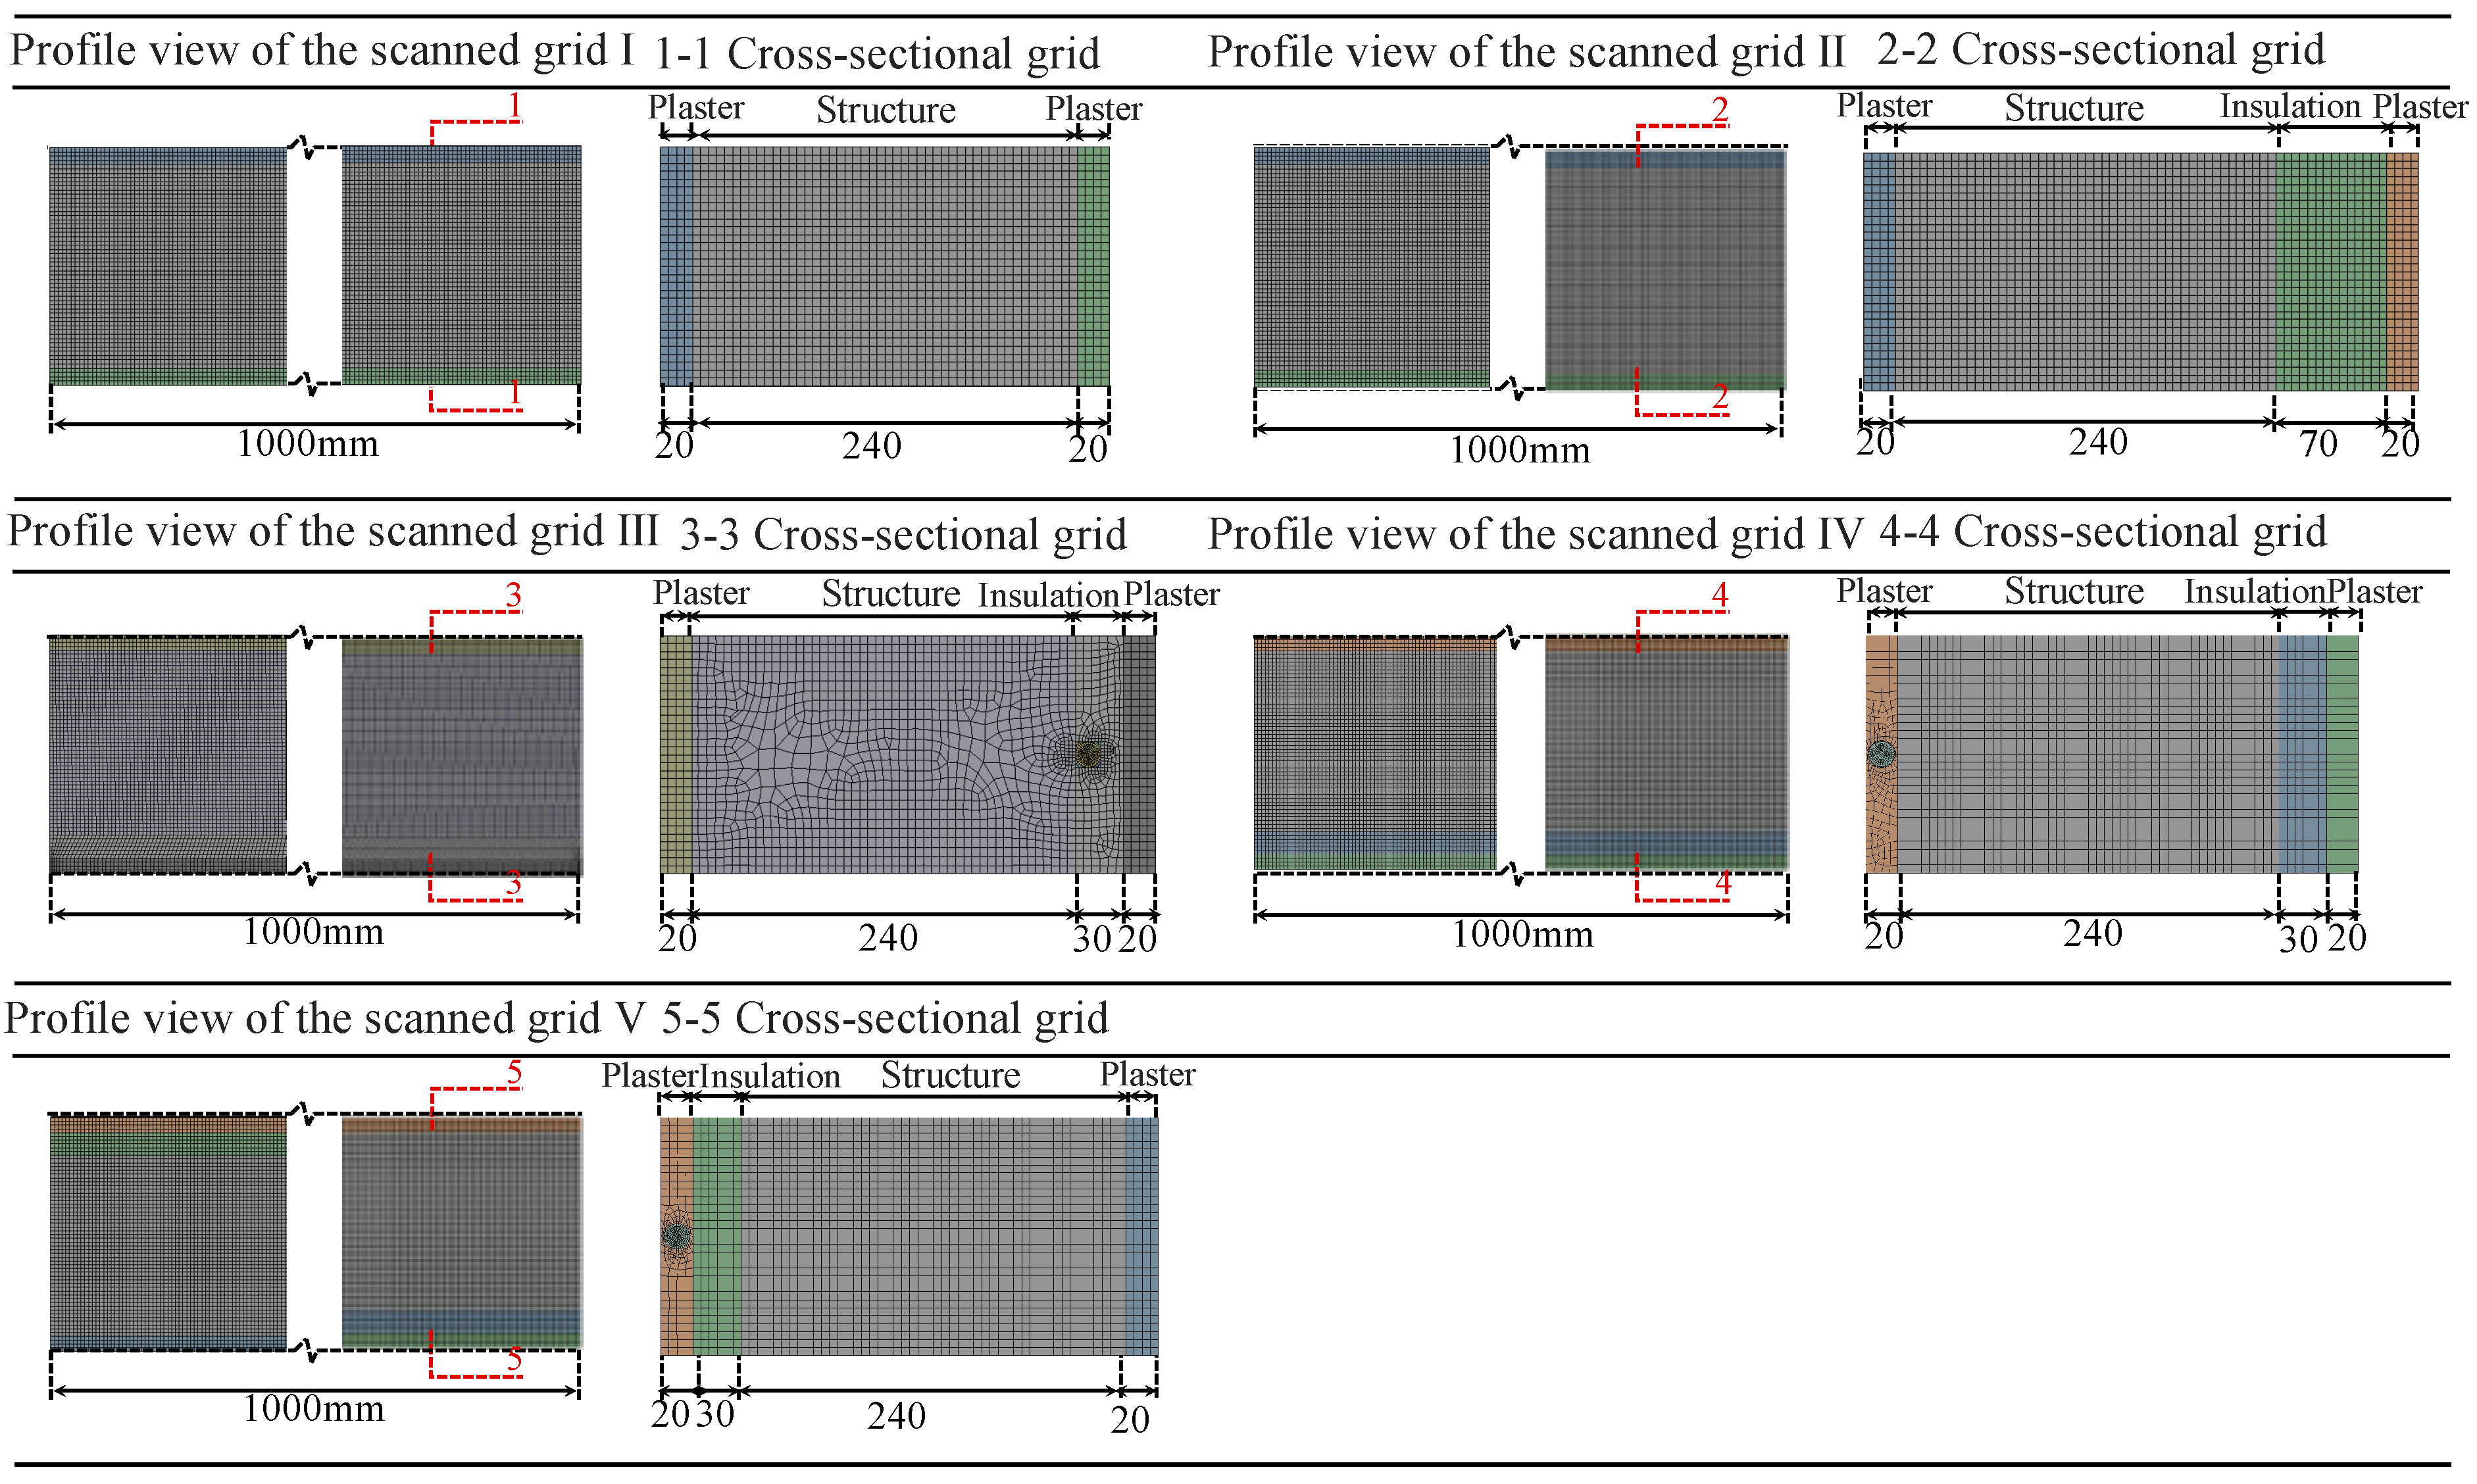
To avoid the adverse effects of grid quantity and division methods on the simulation results, all cases were generated using the same meshing strategy. The grids were optimized under the prerequisite of ensuring mesh quality, thereby balancing accuracy with computational efficiency. For all five wall types, a structured hexahedral meshing method was applied to the computational domains. This process comprised two core steps: firstly, the radial boundary ends of each domain were divided proportionally to generate high-quality surface meshes; secondly, the radial boundaries in the depth direction were further subdivided proportionally, followed by the sweeping method to create the volume meshes. The mesh quality of all simulation cases was maintained above 0.8, with no non-physical harmful volume elements, ensuring computational stability and reliable results. As illustrated in Figure 3, the examples include the mesh division results for the NI-wall and CE-wall with a 70 mm insulation layer, as well as three types of TACP walls (EE-TACP, EI-TACP, II-TACP), based on a case study in Wudu City, a representative region with hot summers–cold winters.

2.2.3. Boundary and Initial Conditions

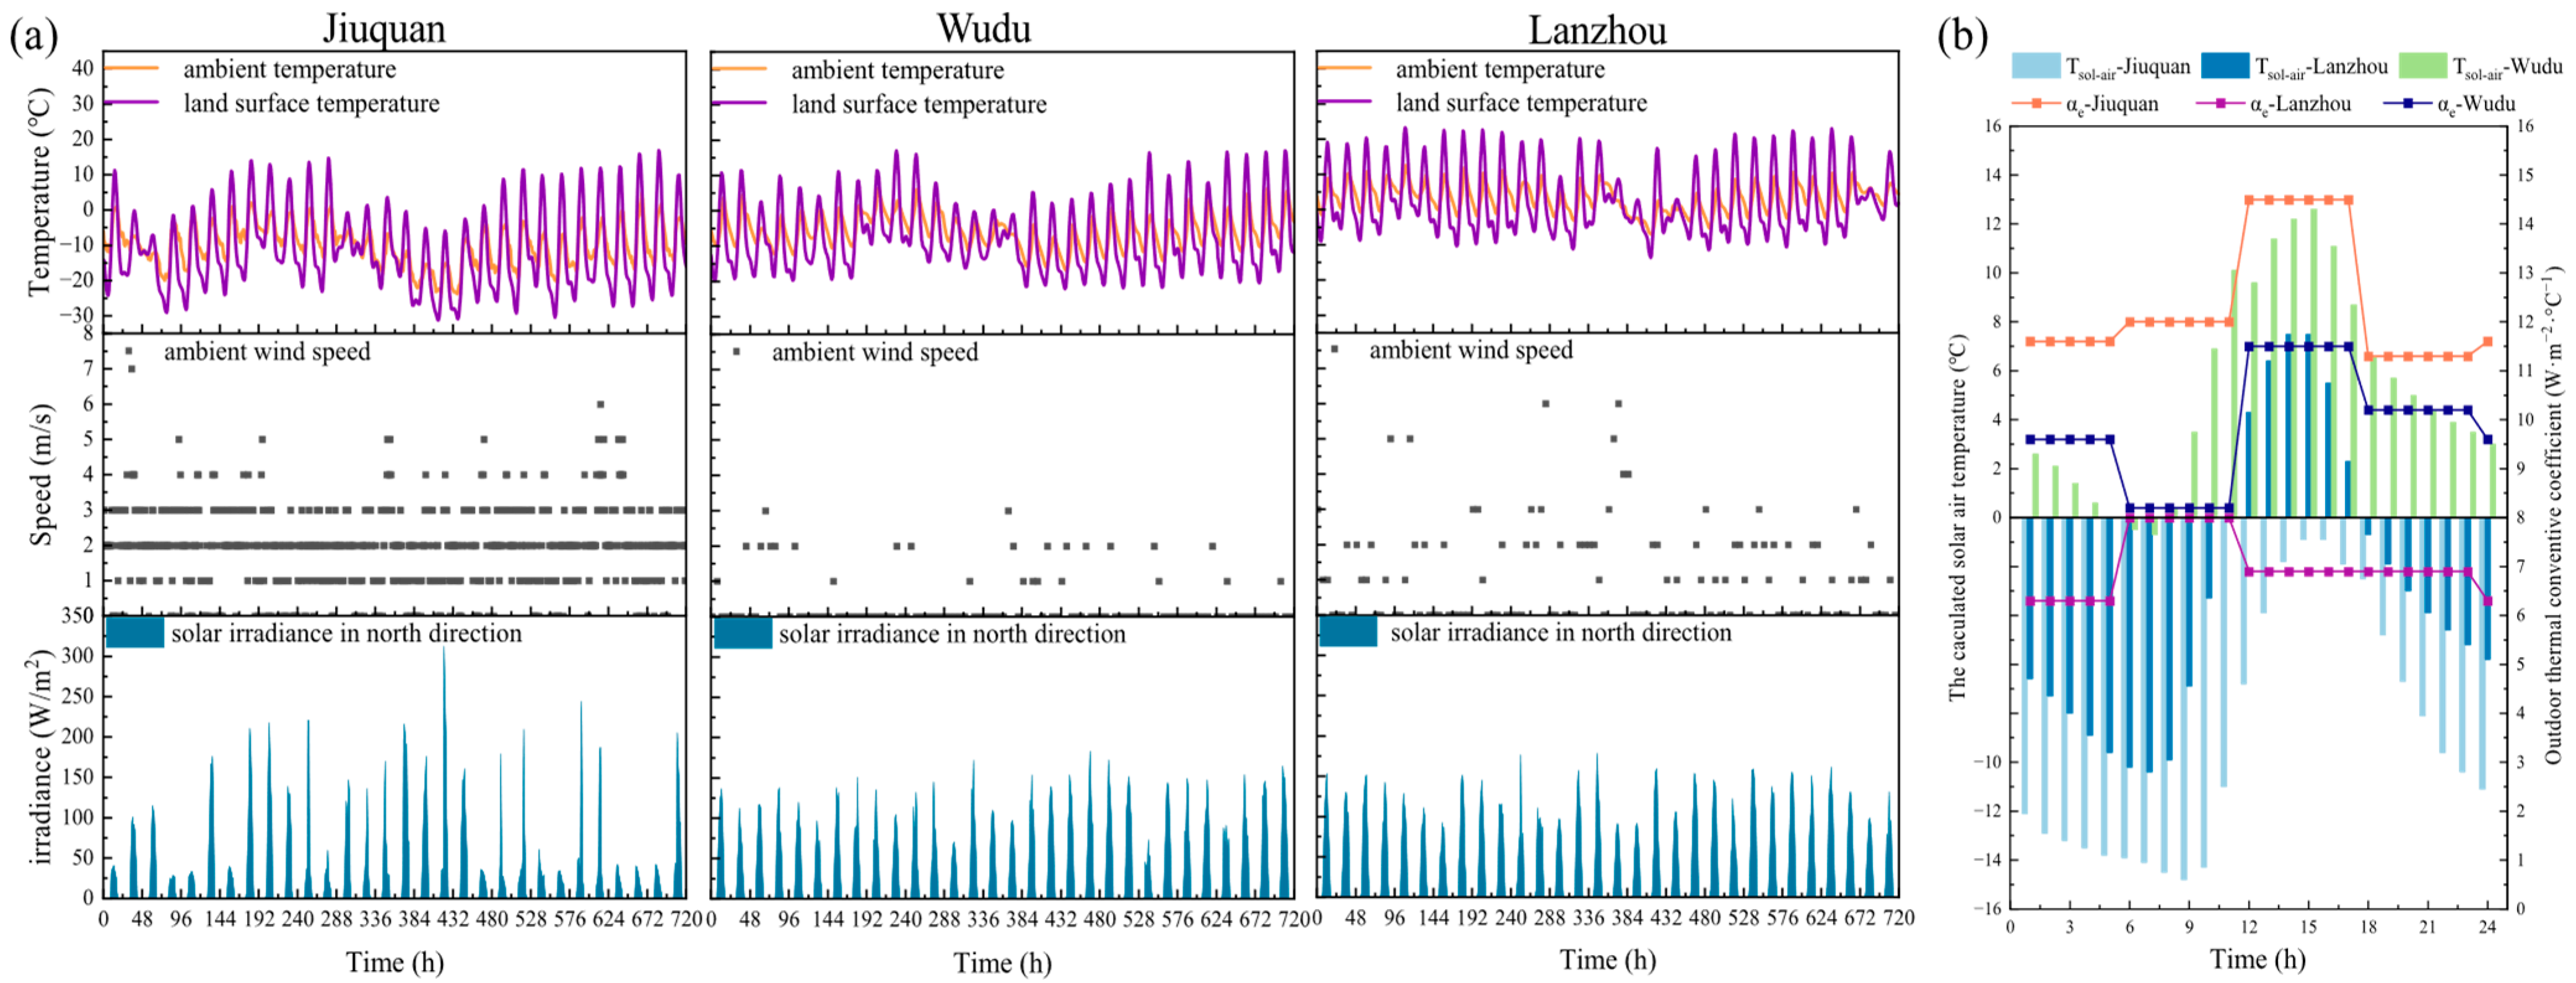
This study selected the hourly meteorological data for the coldest month of January from the meteorological stations in three typical cities of Gansu Province, namely Jiuquan, Lanzhou, and Wudu, as the external boundary conditions for the simulations. All cases were transiently simulated based on these observed meteorological data, with the corresponding hourly data shown in Figure 4.
To simplify the mathematical model, the following necessary basic assumptions are made: (a) The fluid water injected into the embedded pipe and the air that undergoes convective heat transfer with the inner surface and outer surfaces of the wall are treated as incompressible fluids with constant density, and their thermal properties are assumed to be constant. (b) All solid materials involved in the model (Table 1) are considered homogeneous and isotropic in terms of thermal properties. (c) It is assumed that there are no gaps between different material layers inside the wall, and additional thermal resistance due to poor contact is neglected. (d) The arrangement of embedded tubes inside the wall follows a parallel configuration; thus, the interface between adjacent pipes, due to its symmetrical heat transfer behavior, can be treated as a symmetry boundary condition.
Based on the above assumptions, the energy equation for the solid region is as follows:
ρ k c p , k / λ k T / τ = 2 T / x 2 + 2 T / y 2 + 2 T / z 2 + S m   k = 1 ,   2 ,   3 ,   4
In the formula, ρk (kg·m−3), t (s), cp,k (J·kg−1·°C−1), λ (W·m−1·°C−1), T (°C), Sm (/) are the density of solid region, time, specific heat, thermal conductivity, temperature, and source term of momentum, respectively; and k = 1 to 4 denotes the four solid layers of TACP, exterior plaster, insulation layer, structural layer, pipe-embedded layer, and interior plaster, respectively.
The energy equation for the liquid region is as follows:
( ρ x c p , x F ) t + ( ρ x U F ) = ( Γ φ grad F ) + S φ
In the formula, ρx (kg·m−3), cp,x (J·kg−1·°C−1), F (°C), t (s), U (/), ΓΦ (/), and SΦ (/) are the density of working fluid (water), specific heat, temperature, time, velocity vector, diffusion coefficient, and source term of energy conservation equation, respectively.
The heat transfer boundary at the inner surface of the TACP wall is as follows:
λ 0 T x x = 0 = α i ( T i T x = 0 ) ,
In the formula, λ0 (W·m−1·°C−1), αi (W·m−2·°C−1), Ti (°C), Tx=0 (°C) represent the thermal conductivity of inner plaster layer, the convective heat transfer coefficient of room side (αi = 8.7 W·m−2·°C−1) [22], room set point (Ti = 24 °C), and inner surface temperature, respectively.
The heat transfer boundary at the outer surface of the TACP wall is as follows:
λ L T x x = L = α e ( T a T x = L ) + ρ s I R es
In the formula, λL (W·m−1·°C−1), αe (W·m−2·°C−1), Ta (°C), Tx=L (°C), ρs (m2), I (W·m−2), Res(K·W−1) represent the thermal conductivity of exterior plaster layer, the convective heat transfer coefficient of outer side, outer surface temperature, radiative temperature of the outdoor environment, absorption coefficient of outer surface (ρs = 0.65), solar radiation at the outer surface, and resistance heating, respectively. Among them, the αe calculation method is as follows [23,24]:
α e = 5.62 + 3.9 v
In the formula, v (m·s−1) is the air velocity of the outdoor environment.
The solar radiation absorption on the outer surface of the TACP wall and the convective heat transfer between the wall and the outdoor environment are based on the outdoor air composite temperature, as given by the following equation [23,24]:
T 0 = I · ρ s α e + T a
In the formula, T0 (°C) is the comprehensive outdoor air temperature.
The numerical model in this study employs a Pressure-Based Segregated Solver for fluid–structure interaction calculations. The coupling between pressure and velocity is achieved through the SIMPLE algorithm, a type of pressure correction method. This algorithm iteratively solves the momentum and pressure correction equations to ensure that the velocity field satisfies both mass conservation and momentum conservation. The convective terms in all governing equations are discretized using a second-order upwind scheme. This scheme interpolates between the nearest upstream node and the next upstream node, offering higher accuracy compared to the first-order upwind scheme, which helps reduce numerical diffusion.
The convergence of the calculations is determined by the residuals of the governing equations. The convergence criteria for the residuals are set as follows:
(1). The residual for the mass conservation (continuity) equation is set to 1 × 10⁻⁵;
(2). The residual for the momentum equation is set to 1 × 10⁻⁶;
(3). The residual for the energy equation is set to 1 × 10⁻⁸.
In this study, the temperature of the injected heat in the embedded pipe is set between 24 °C and 36 °C, representing low-grade hot water. The inlet velocity is set to 0.5 m·s−1, while the indoor air temperature is maintained at a constant 24 °C.

2.3. Model Validation

The dynamic heat transfer model used in this study is an improvement of the previous research on the concrete traditional thermally activated wall (CTAW), based on the structural features and heat transfer characteristics of the TACP. The fundamental assumptions and validity of the model have been fully verified in prior studies [25]. The primary difference between TACP and CTAW lies in the placement of the embedded pipe layer: TACP positions the pipe layer adjacent to the structural layer, either within the plaster or insulation layer, whereas CTAW places the pipe layer within the concrete structural layer. By adjusting the layout of the embedded pipes, this study aims to explore the optimal wall structure of TACP in the context of various climate zones in Gansu. Furthermore, in the heat transfer simulation of the building envelope, replacing materials that do not undergo phase changes typically does not affect the reliability of the heat transfer model itself. This ensures the consistency and credibility of the results in this study.

2.4. Simulation Scheme and Performance Evaluation Methods

2.4.1. Research Variables and Simulation Scheme

For TACP, the key factors influencing the thermal performance and energy-saving potential of existing building envelope structures are the pipe position, insulation thickness, and injected heat source temperature. Therefore, this study designs simulation scenarios based on these three parameters (Table 2). Using the NI-wall of existing buildings and the CE-wall as reference walls, the study compares the impact of these parameters on the thermal performance and energy-saving potential of TACP. Section 3.1 analyses the thermal performance of TACP by comparing the hourly thermal response of cumulative heat load on the inner and outer surfaces under the influence of the three parameters. Section 3.2 evaluates the impact of the three parameters on TACP energy-saving potential by comparing it with the reference walls.

2.4.2. Performance Evaluation

This study evaluates the thermal performance and energy-saving potential of wall structures by comparing the cumulative heat load and energy-saving rate (ε) indicators of TACP and two reference wall types. Thermal performance is assessed using the temperature distribution and heat flux of the internal/external surface of the wall and embedded pipe. The energy-saving rate, ε, is calculated using the following formula. When the cumulative heat load on the inner surface of the wall is negative, it indicates that no additional heat load is required indoors, with the wall providing auxiliary heating. Moreover, a higher ε value signifies greater energy-saving potential for the building. In Equation (7), ε1 represents the calculation formula for the energy-saving potential of TACP relative to NI-wall, while in Equation (8), ε2 represents the energy-saving potential of TACP relative to CE-wall. In addition, in Equation (9), ε3 represents the energy-saving potential of the NI-wall relative to the CE-wall:
ε 1 = Q ni Q tacp Q ni
ε 2 = Q ce Q tacp Q ce
ε 3 = Q ni Q ce Q ni
In the formula, Qni (kW·h·m−2), Qtacp (kW·h·m−2), Qce (kW·h·m−2) represent the daily cumulative heat load per unit area on the inner surface of the wall for existing buildings with no insulation, the daily cumulative heat load per unit area on the inner surface of the wall for the TACP, the daily cumulative heat load per unit area on the inner surface of the wall for the conventional insulation-retrofitted wall, respectively.

3. Results and Discussions

3.1. Thermal Performance of TACP-Wall Configurations in Different Climate Zones

3.1.1. Analysis of Wall Thermal Response Characteristics in Three Climate Zones

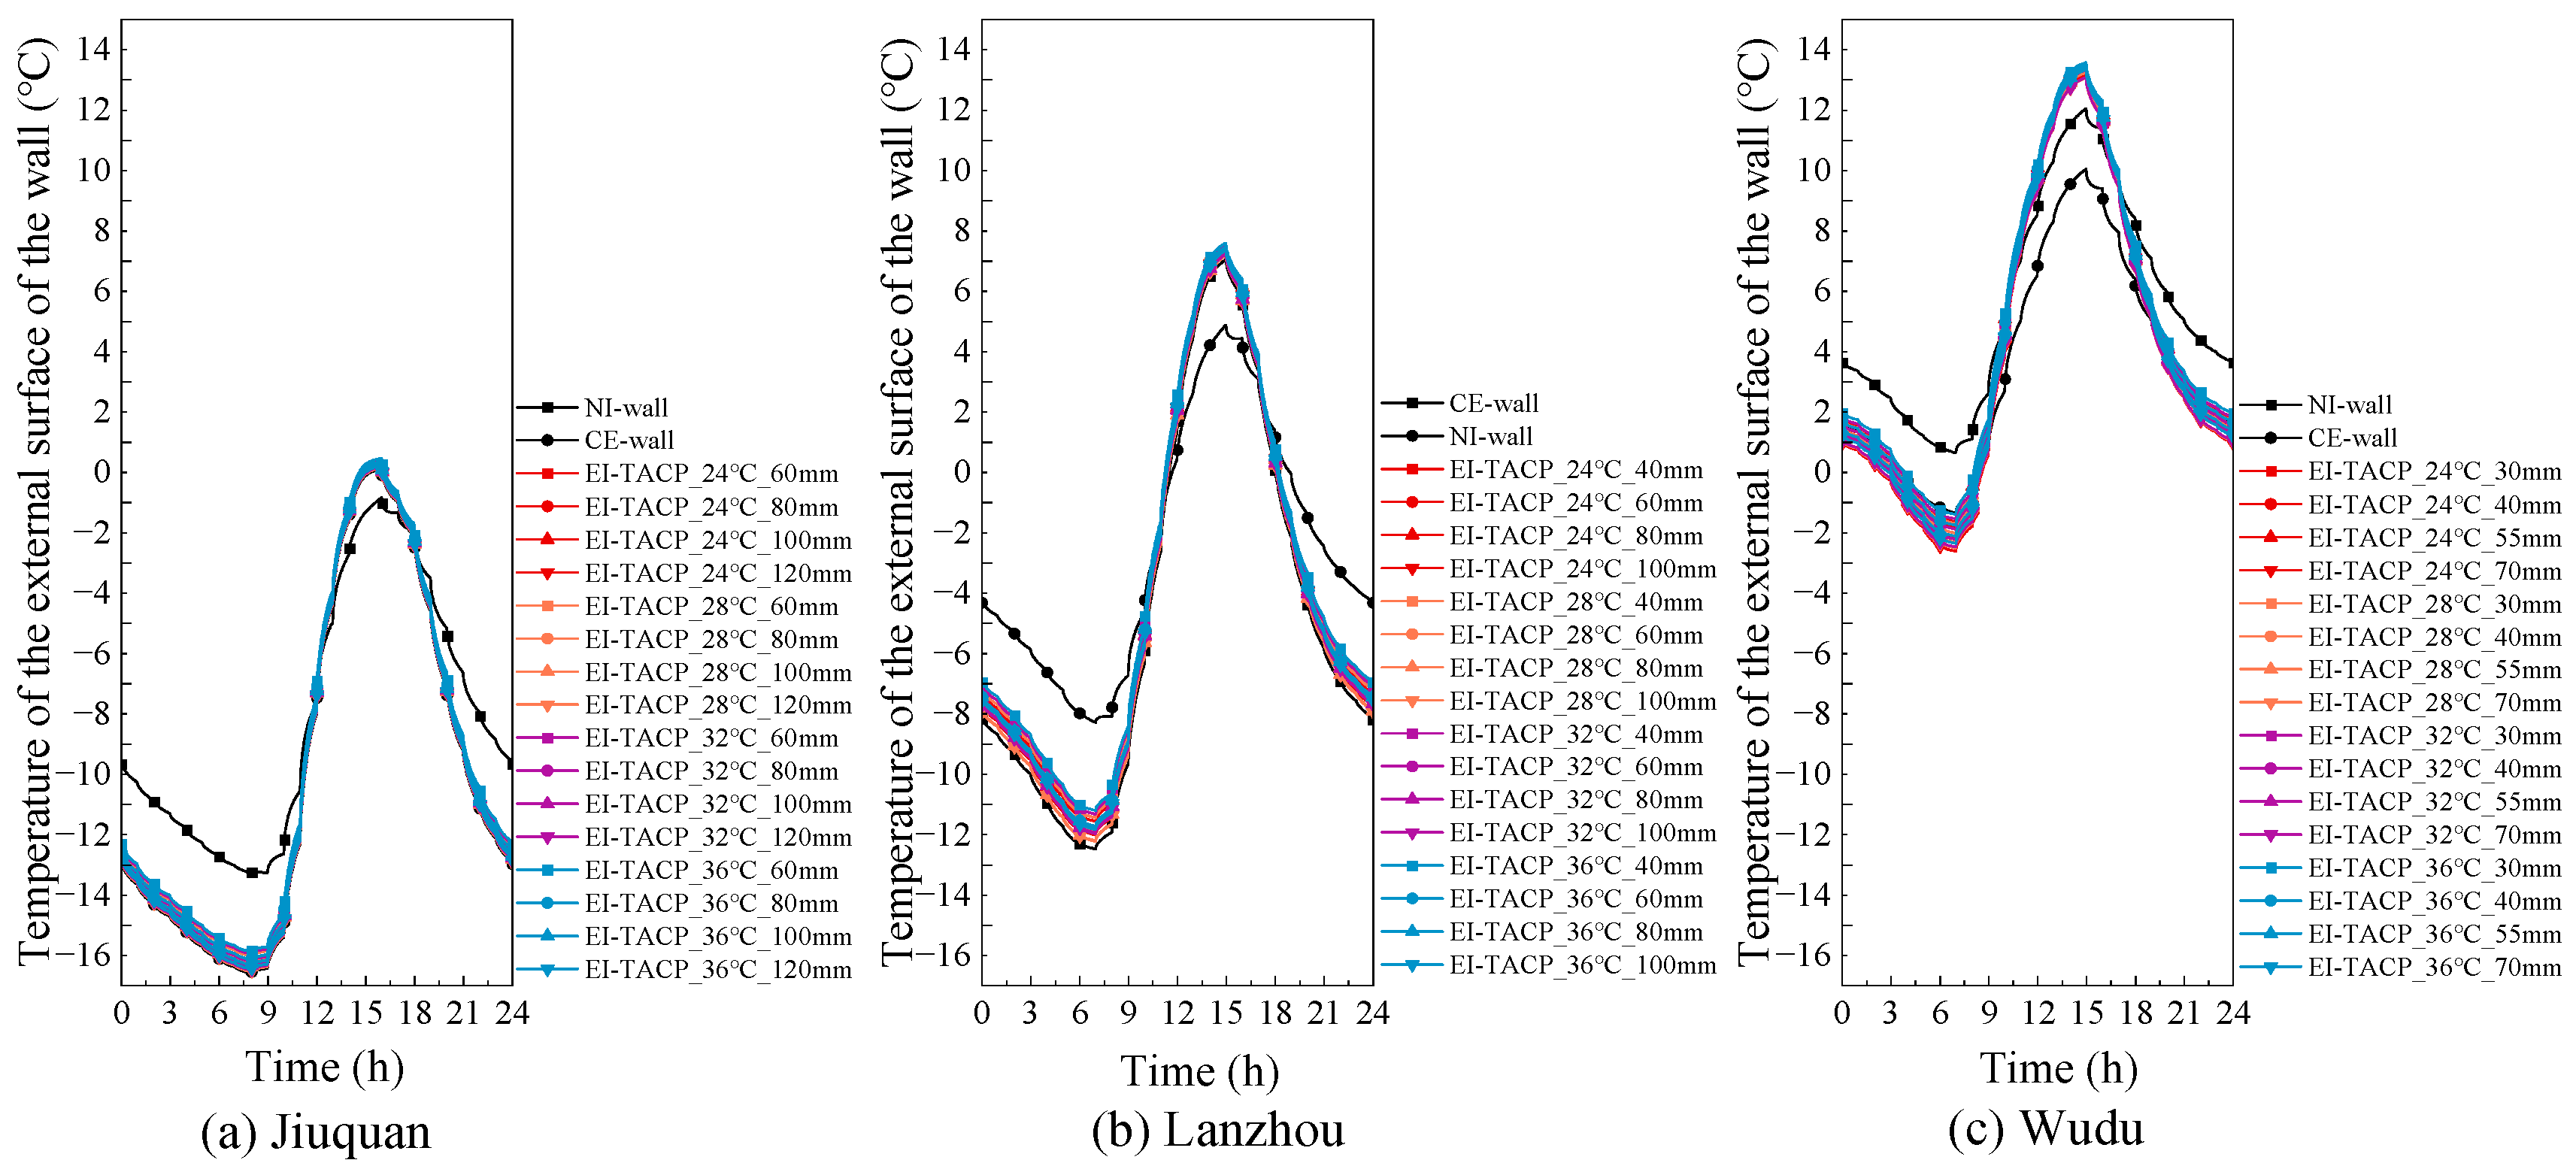
Figure 5 illustrates the variation in the exterior surface temperature of the EI-wall over time under different inlet temperatures (Ti) for representative cities (Jiuquan, Lanzhou, Wudu) across the climate zones of Gansu Province. It can be observed that the exterior surface temperatures differ in magnitude across the three climate zones due to differences in ambient temperatures. Nevertheless, their overall variation pattern remains identical during stable TACP operation. For all three TACP configurations, the exterior surface temperature is lower than that of the NI-wall when the outdoor temperature is relatively low during the day, and higher than that of the NI-wall when the sol-air temperature is high. This indicates that the heat loss through the energy-efficient wall assemblies is consistently lower than that of the original walls prior to retrofitting. As Ti increases, the exterior surface temperature of the EI-wall generally rises relative to the CE-wall, though the increase is modest. Taking a 60 mm insulation thickness in Jiuquan city as an example, the average increases in exterior surface temperature at Ti = 24 °C, 28 °C, 32 °C, and 36 °C are 0.44 °C, 0.45 °C, 0.51 °C, and 0.58 °C, respectively. This suggests that raising Ti does not significantly affect outward heat loss. Furthermore, under the same climatic zone and Ti condition, increasing the insulation thickness leads to a decrease in the exterior surface temperature. For instance, in Lanzhou at Ti = 28 °C, the average exterior surface temperatures of the EI-wall are −2.87 °C (60 mm), −3.30 °C (80 mm), −3.42 °C (100 mm), and −3.43 °C (120 mm). This implies that greater insulation thickness reduces heat loss through the exterior surface during winter, as the heat transfer from the pipe-embedded layer to the outdoors is diminished.
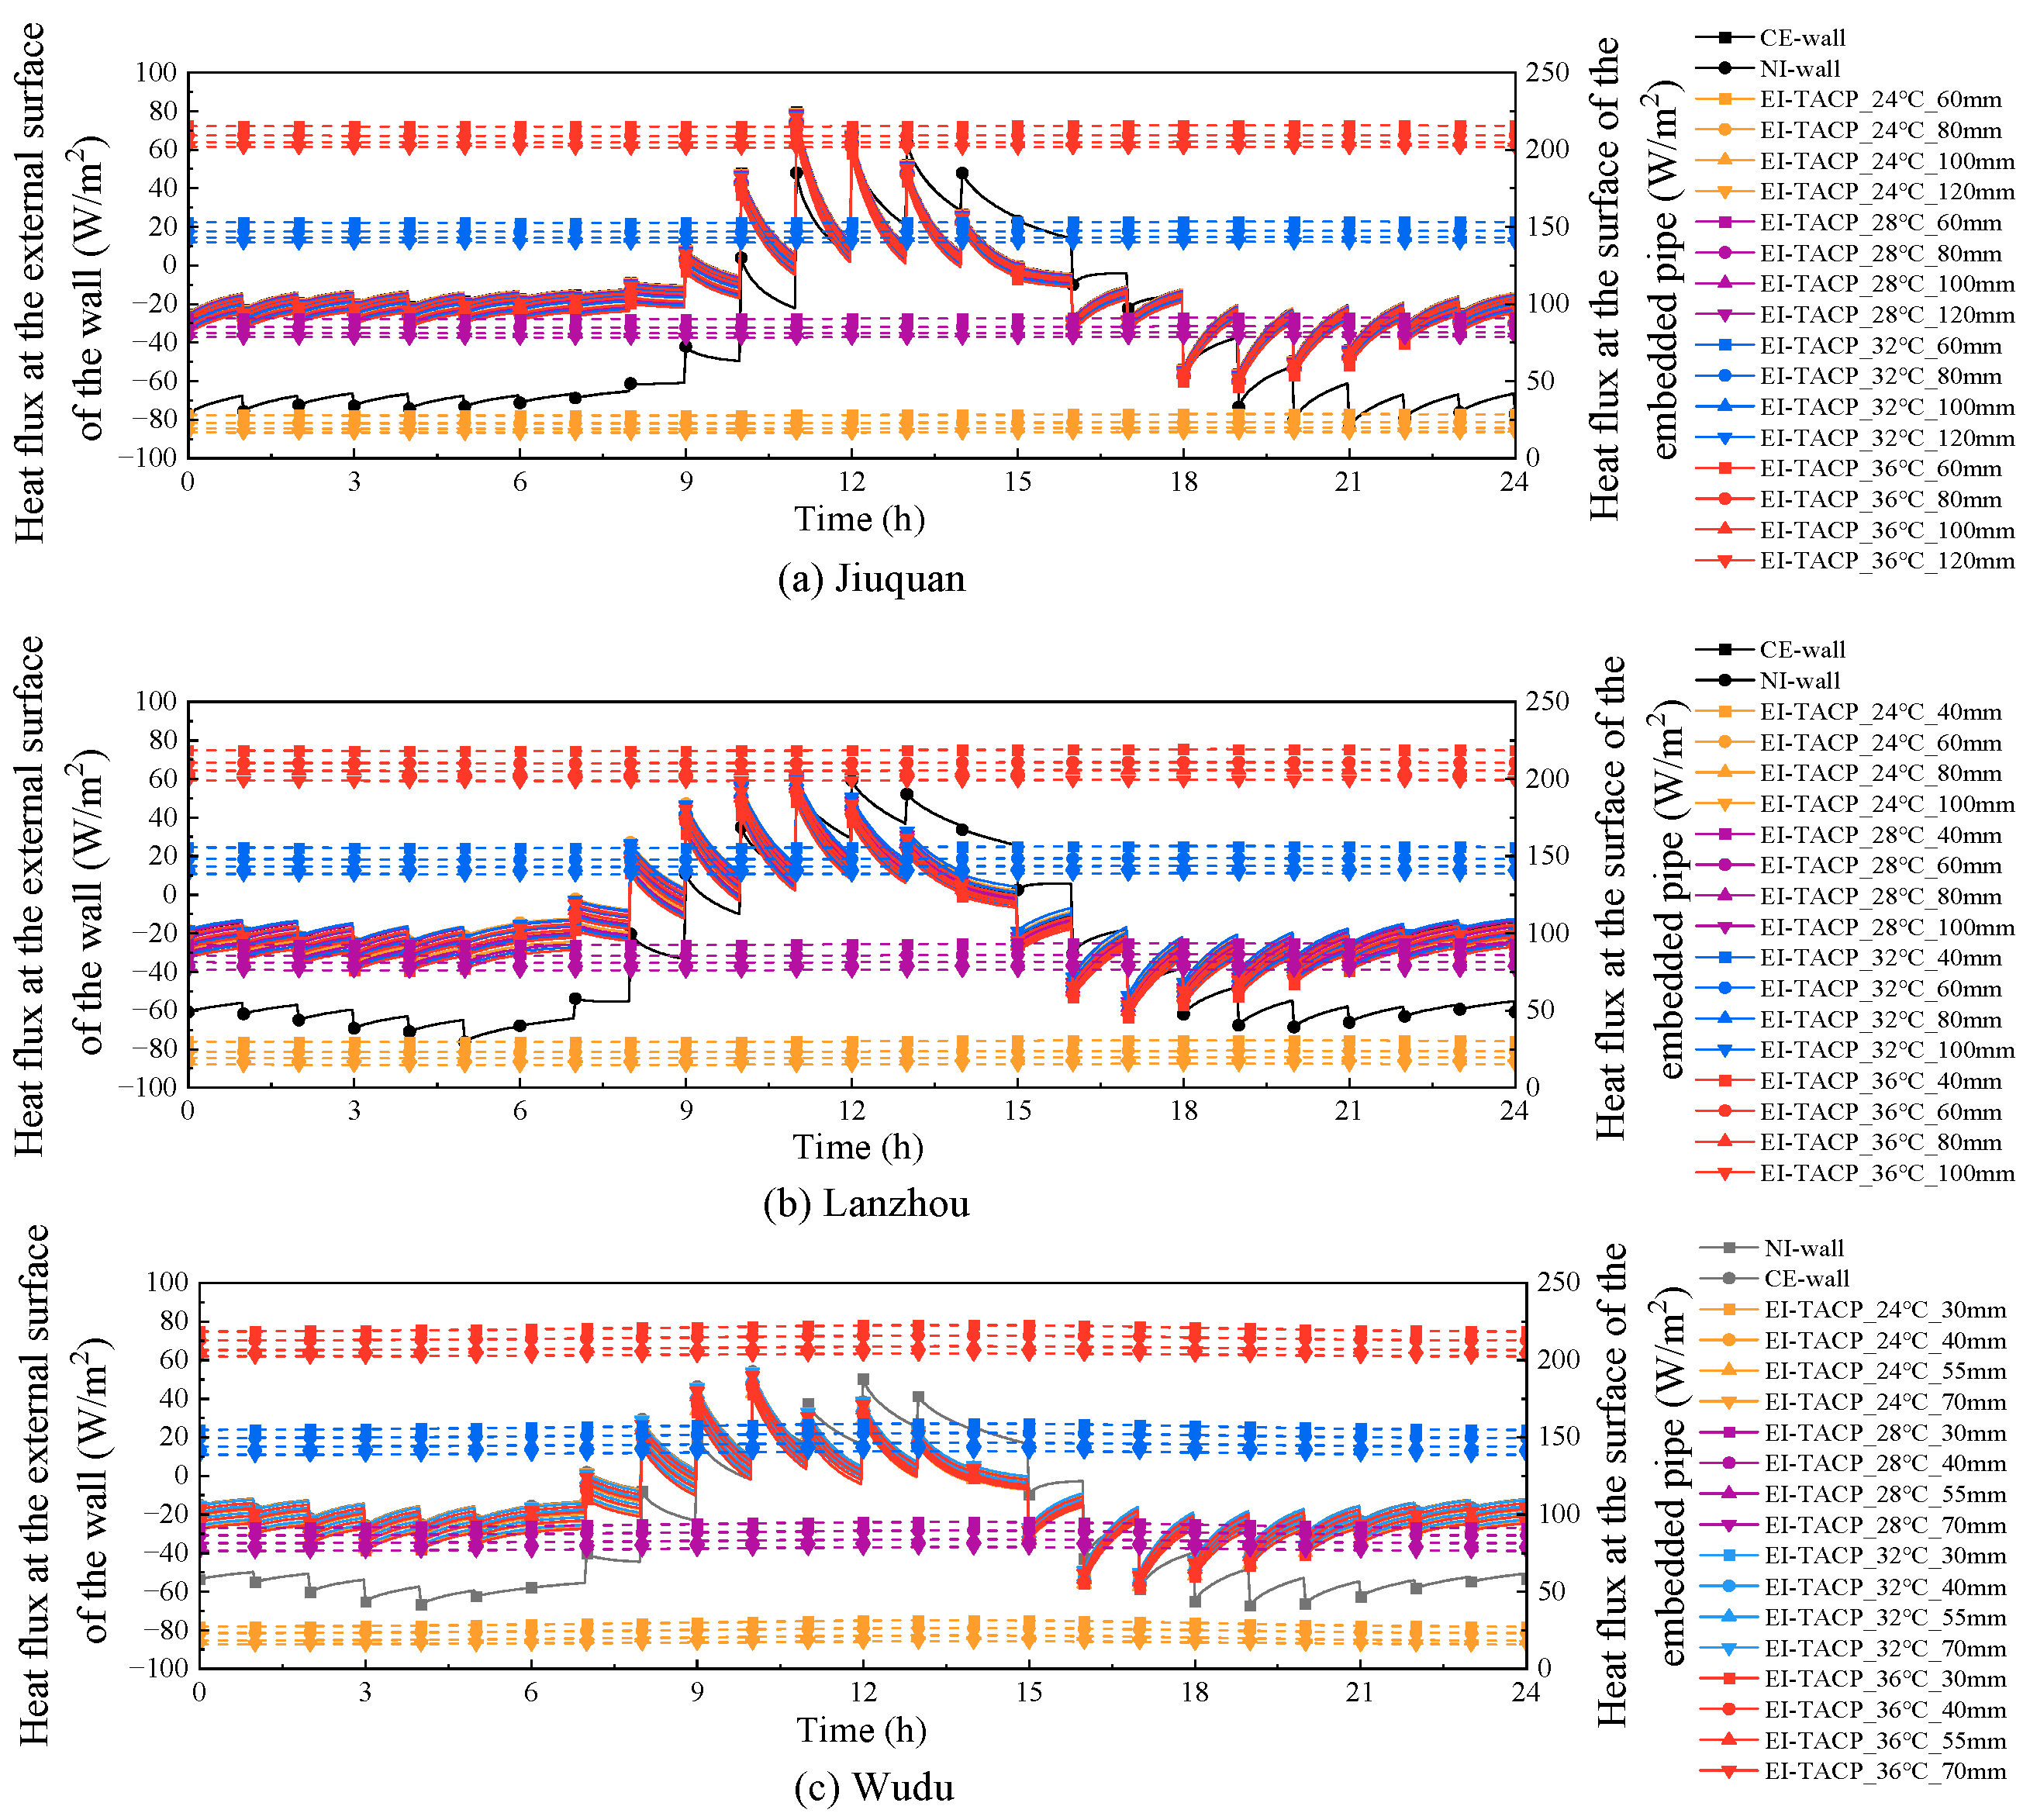
Figure 6 illustrates the variation in heat flux over time at the exterior surface and the pipe-embedded surface of the EI-wall under different inlet temperatures (Ti) for representative cities (Jiuquan, Lanzhou, Wudu) across the climate zones of Gansu Province. It can be seen that the heat flux at the pipe-embedded surface remains highly stable during operation, showing little influence from climatic variations or outdoor temperature fluctuations, while increasing significantly with rising Ti. In contrast, the exterior surface heat flux exhibits periodic variations in response to changes in outdoor temperature. Although the sol-air temperature in the severe cold climate zones is significantly lower than that in the hot summer–cold winter climate zones, leading to greater heat loss through the exterior wall surface, the heat flux on the surface of the embedded pipe remains unaffected. This does not affect the heat flux at the pipe-embedded surface. This further demonstrates that although the TACP retrofitting scheme increases heat loss at the exterior surface due to the active heat injection, the increase is not significant. For example, in Jiuquan, with an insulation thickness of 60 mm, the heat flux at the exterior and pipe-embedded surfaces of the EI-wall increases relative to the NI-wall/CE-wall by 23.82/−6.16 W/m2 (at 24 °C), 22.70/−7.30 W/m2 (at 28 °C), 21.57/−8.41 W/m2 (at 32 °C), and 20.44/−9.54 W/m2 (at 36 °C), respectively. Additionally, for every 4.0 °C increase in Ti, the heat flux at the pipe-embedded surface decreases by approximately 1.1, 2.2 W/m2, and 3.3 W/m2, indicating that the heating performance of the EI-wall is largely unaffected by the sol-air temperature. The results also show that variations in insulation thickness have an insignificant impact on the heat flux density at the pipe-embedded surface. For instance, at Ti = 36 °C, when the insulation thickness increases from 60 mm to 120 mm, the maximum increase in heat flux density is only about 7.36 W/m2 (in Jiuquan), 10.40 W/m2 (in Lanzhou), and 9.04 W/m2 (in Wudu). Therefore, while the insulation layer mitigates heat loss from the pipe-embedded layer, additional increments in thickness confer negligible further benefit to the overall energy performance of the wall. From the perspective of reducing the embodied carbon of the insulation material, a thicker layer is, in fact, counterproductive.
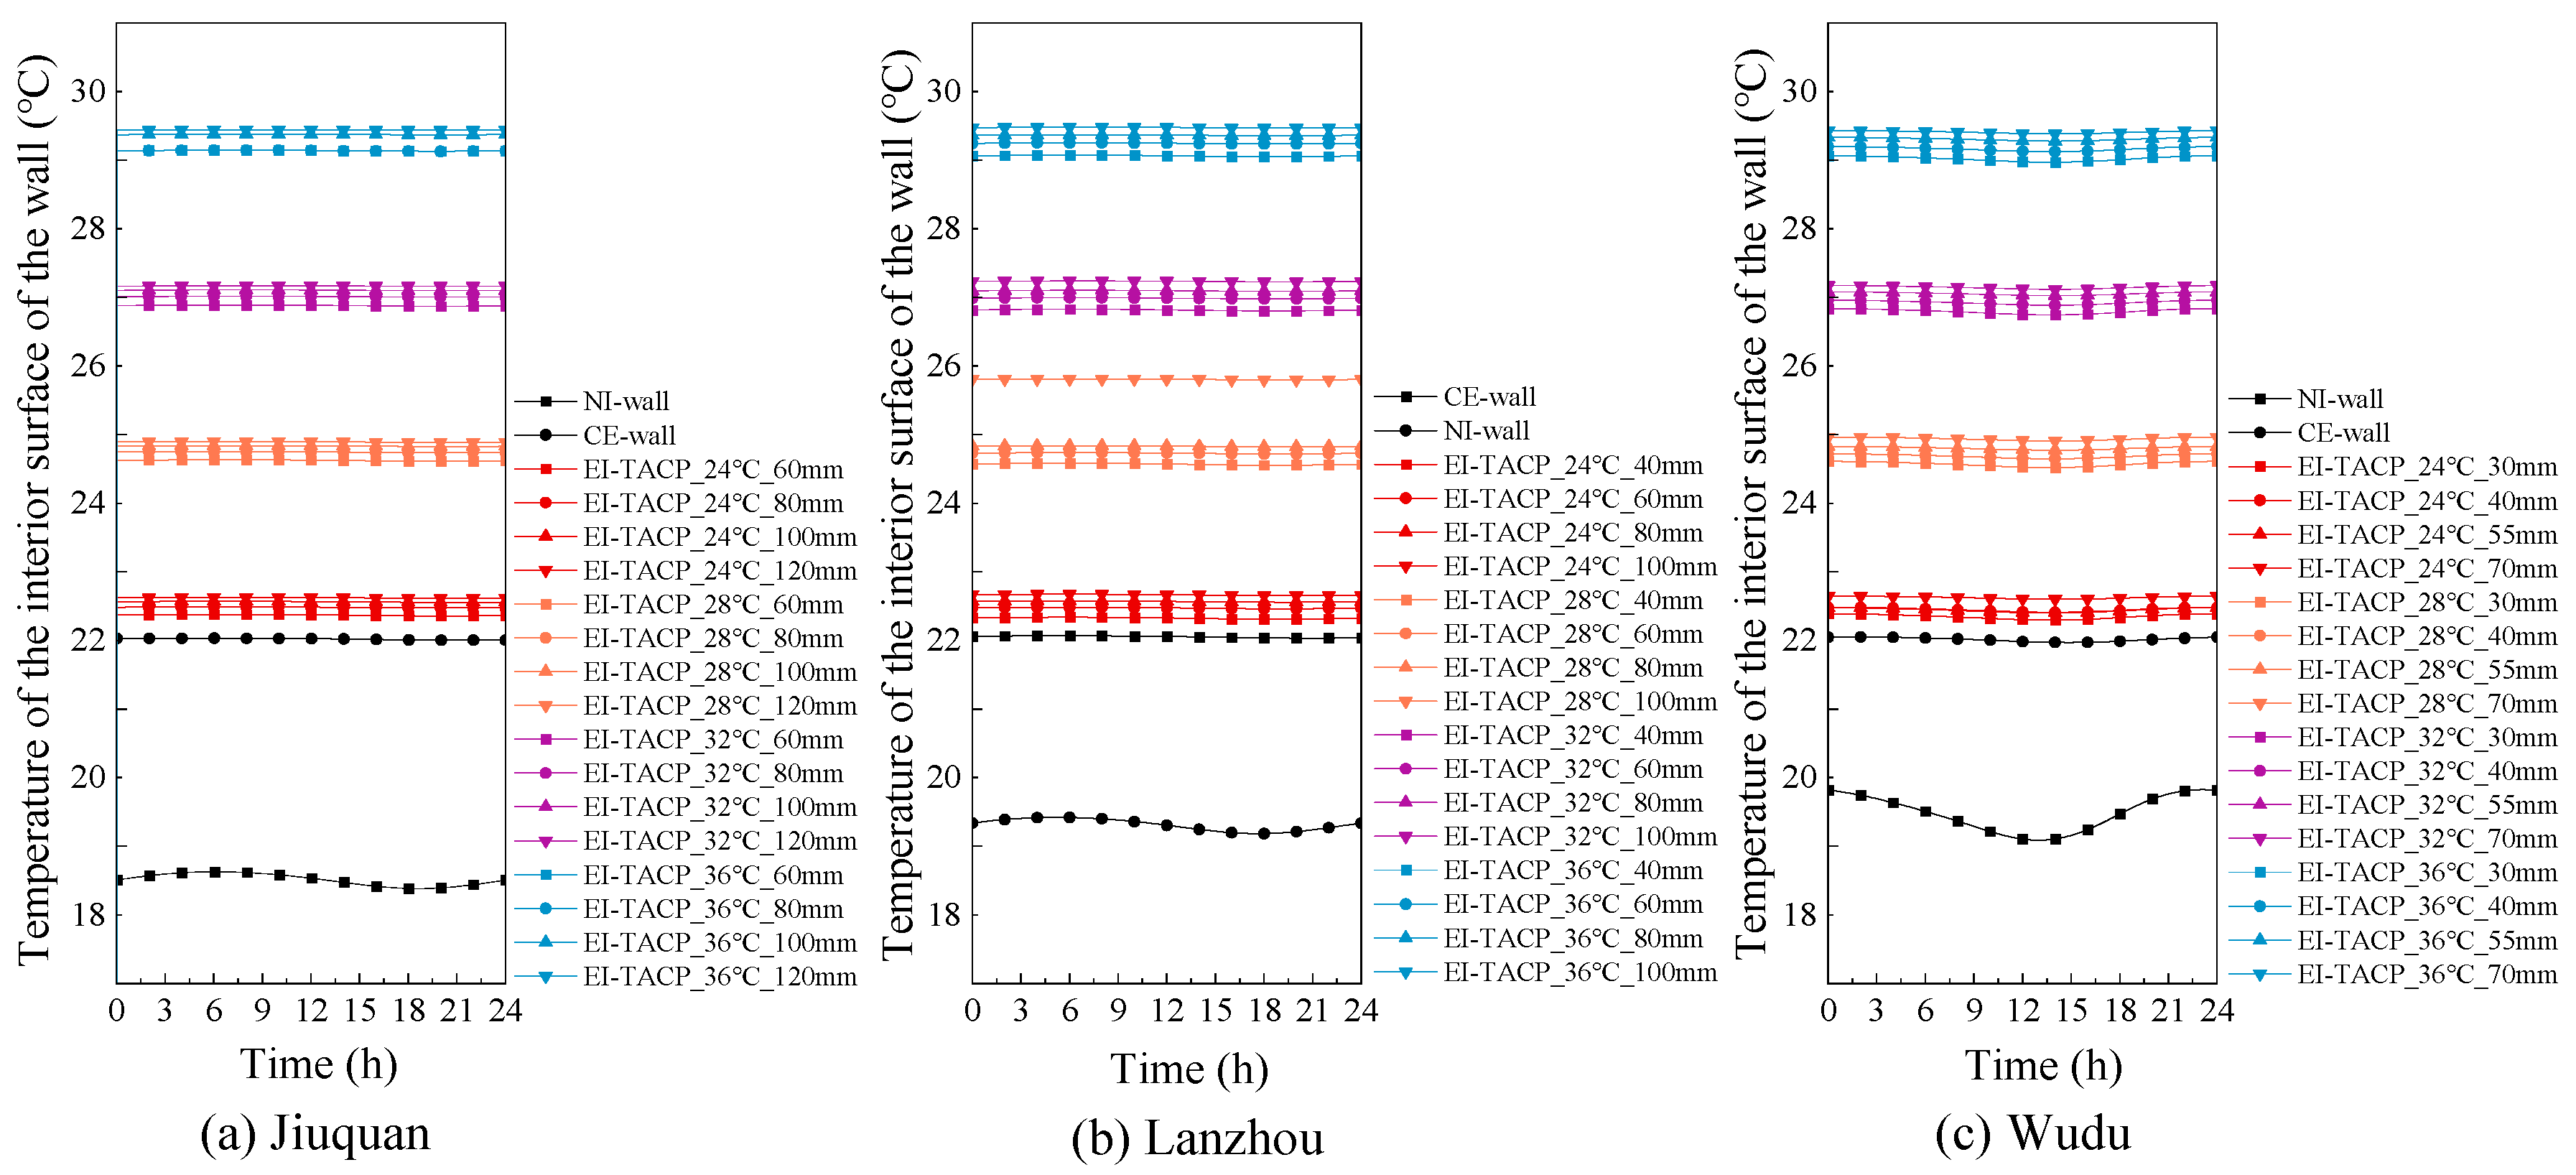
Figure 7 illustrates the variation in the interior surface temperature of the EI-wall over time under different inlet temperatures (Ti) for representative cities (Jiuquan, Lanzhou, Wudu) across the climate zones of Gansu Province. In contrast to the exterior surface temperature, the interior surface temperature under the energy-efficient retrofitting remains highly stable, whereas that of the non-retrofitted wall not only fluctuates but is also significantly lower than the interior surface temperatures of the other wall. Under various operating conditions in the three climate zones, the interior surface temperatures of the three TACP-wall configurations are consistently higher than those of the CE-wall, and increase with rising Ti. As Ti increases, the TACP transitions from a load-reduction mode to an auxiliary heating mode. For instance, at Ti = 28 °C, the interior surface temperature reaches 25.76 °C, indicating that with higher Ti, the interior surface temperature of the EI-wall can be further stabilized and approach the indoor setpoint temperature. Figure 7 also shows that the interior surface temperature is largely unaffected by meteorological conditions in different climate zones. For example, at Ti = 36 °C, the average interior surface temperatures of the EI-wall with insulation thicknesses of 60, 80, 100, and 120 mm are 30.13 °C, 30.14 °C, 30.37 °C, and 30.44 °C in Jiuquan; 30.06 °C, 30.24 °C, 30.36 °C, and 30.47 °C in Lanzhou; and 30.02 °C, 30.16 °C, 30.30 °C, and 30.40 °C in Wudu, respectively. This demonstrates that during winter, the EI-wall enhances the thermal performance of the building envelope, maintaining the interior surface temperature at a consistently high level. This not only substantially reduces heat loss through the wall but also contributes to improved indoor thermal comfort.
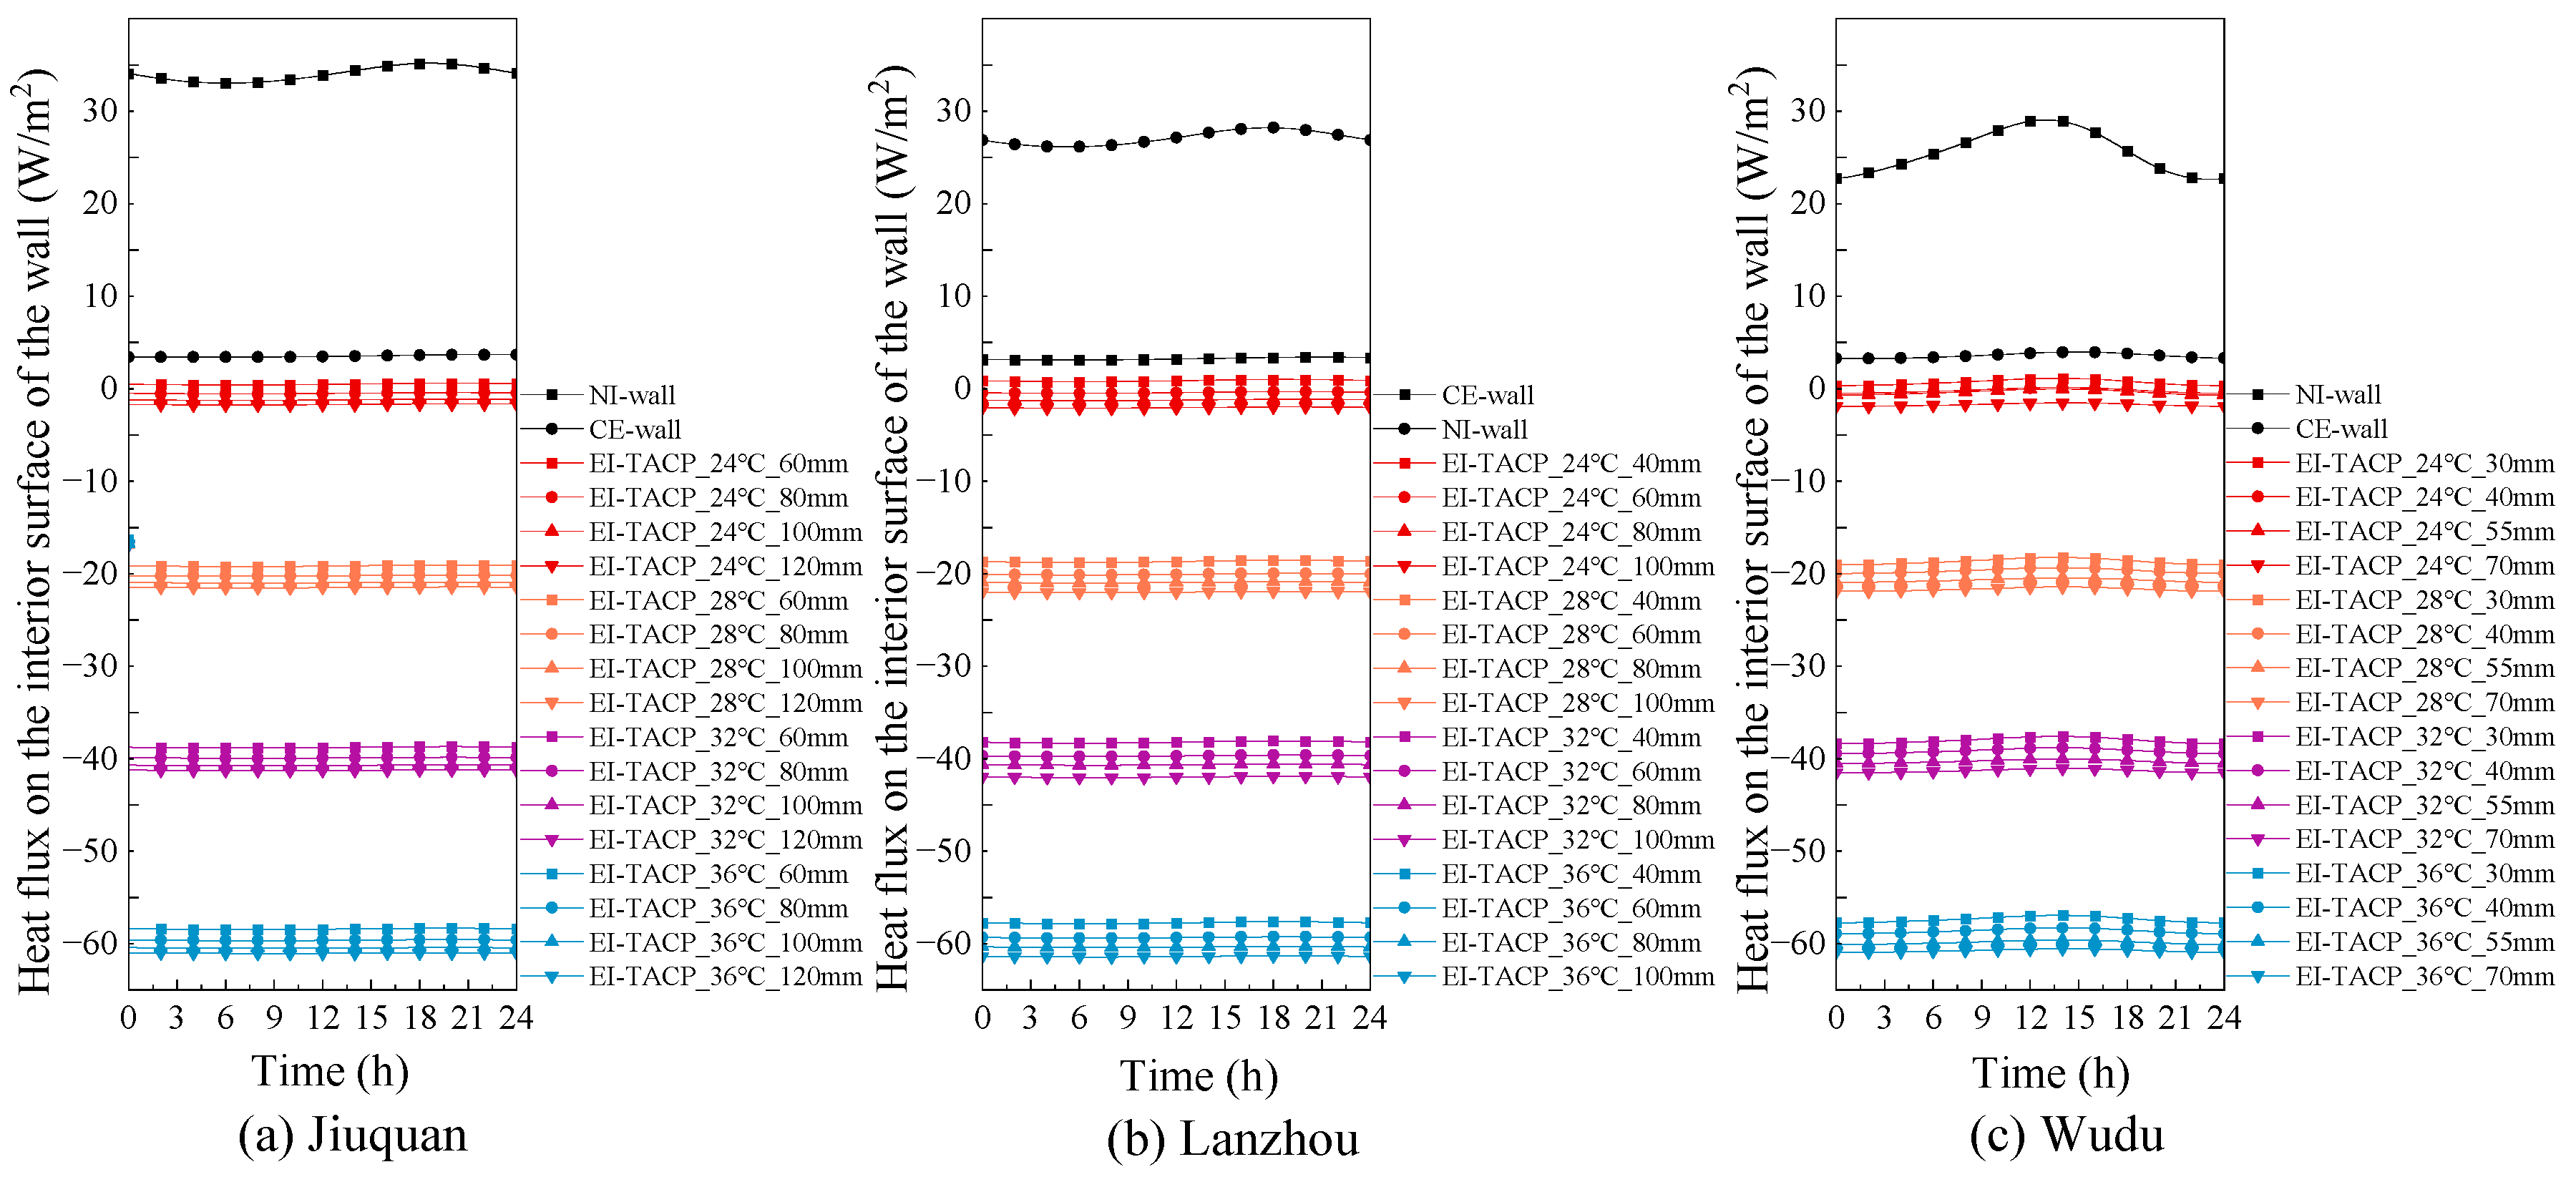
Figure 8 illustrates the variation in heat flux at the interior surface of the EI-wall over time under different inlet temperatures (Ti) for representative cities (Jiuquan, Lanzhou, Wudu) across the climate zones of Gansu Province. In sharp contrast to the heat flux at the exterior surface, the interior surface heat flux of the three TACP configurations is negative at all heat injection temperatures except Ti = 24 °C, indicating that the TACP system not only prevents indoor heat loss to the outdoors but also provides additional heat to the interior space. In comparison, the interior surface heat flux of the non-insulated wall reaches approximately 30 W/m2 in all climate zones, with obvious fluctuations throughout the day. Within the same climatic zone, the heat flux released to the interior space increases notably with higher heat source temperatures. Furthermore, under different climatic conditions, the changes in interior surface heat flux for the EI-wall with a 60 mm insulation thickness at Ti = 24 °C relative to the NI-wall/CE-wall are 33.54/3.03 W/m2 (Jiuquan), 26.23/2.37 W/m2 (Lanzhou), and 24.97/2.88 W/m2 (Wudu). This demonstrates that the interior surface heat flux is strongly influenced by the heat source temperature, while the impact of outdoor climate conditions is negligible. Additionally, when the insulation thickness is fixed, for example, at 100 mm for the EI-wall, the interior surface heat flux decreases by approximately 19.75 W/m2 (Jiuquan), 19.70 W/m2 (Lanzhou), and 19.82 W/m2 (Wudu) for every 4.0 °C increase in Ti. This further confirms that the interior surface heat flux of the EI-wall is consistently governed by the heat source temperature under winter conditions. The insulation thickness also has a discernible influence on the interior surface heat flux. For instance, in Wudu, at Ti = 36 °C, the interior surface heat fluxes of the EI-wall relative to the NI-wall/CE-wall are 83.0/60.9 W/m2 (60 mm), 84.3/62.2 W/m2 (80 mm), 85.5/63.4 W/m2 (100 mm), and 86.4/64.3 W/m2 (120 mm). These results indicate that variations in insulation thickness have only a minor effect on the interior surface heat flux.

3.1.2. Performance Evaluation of Three TACP Configurations in the Severe-Cold

  • Climate Zones
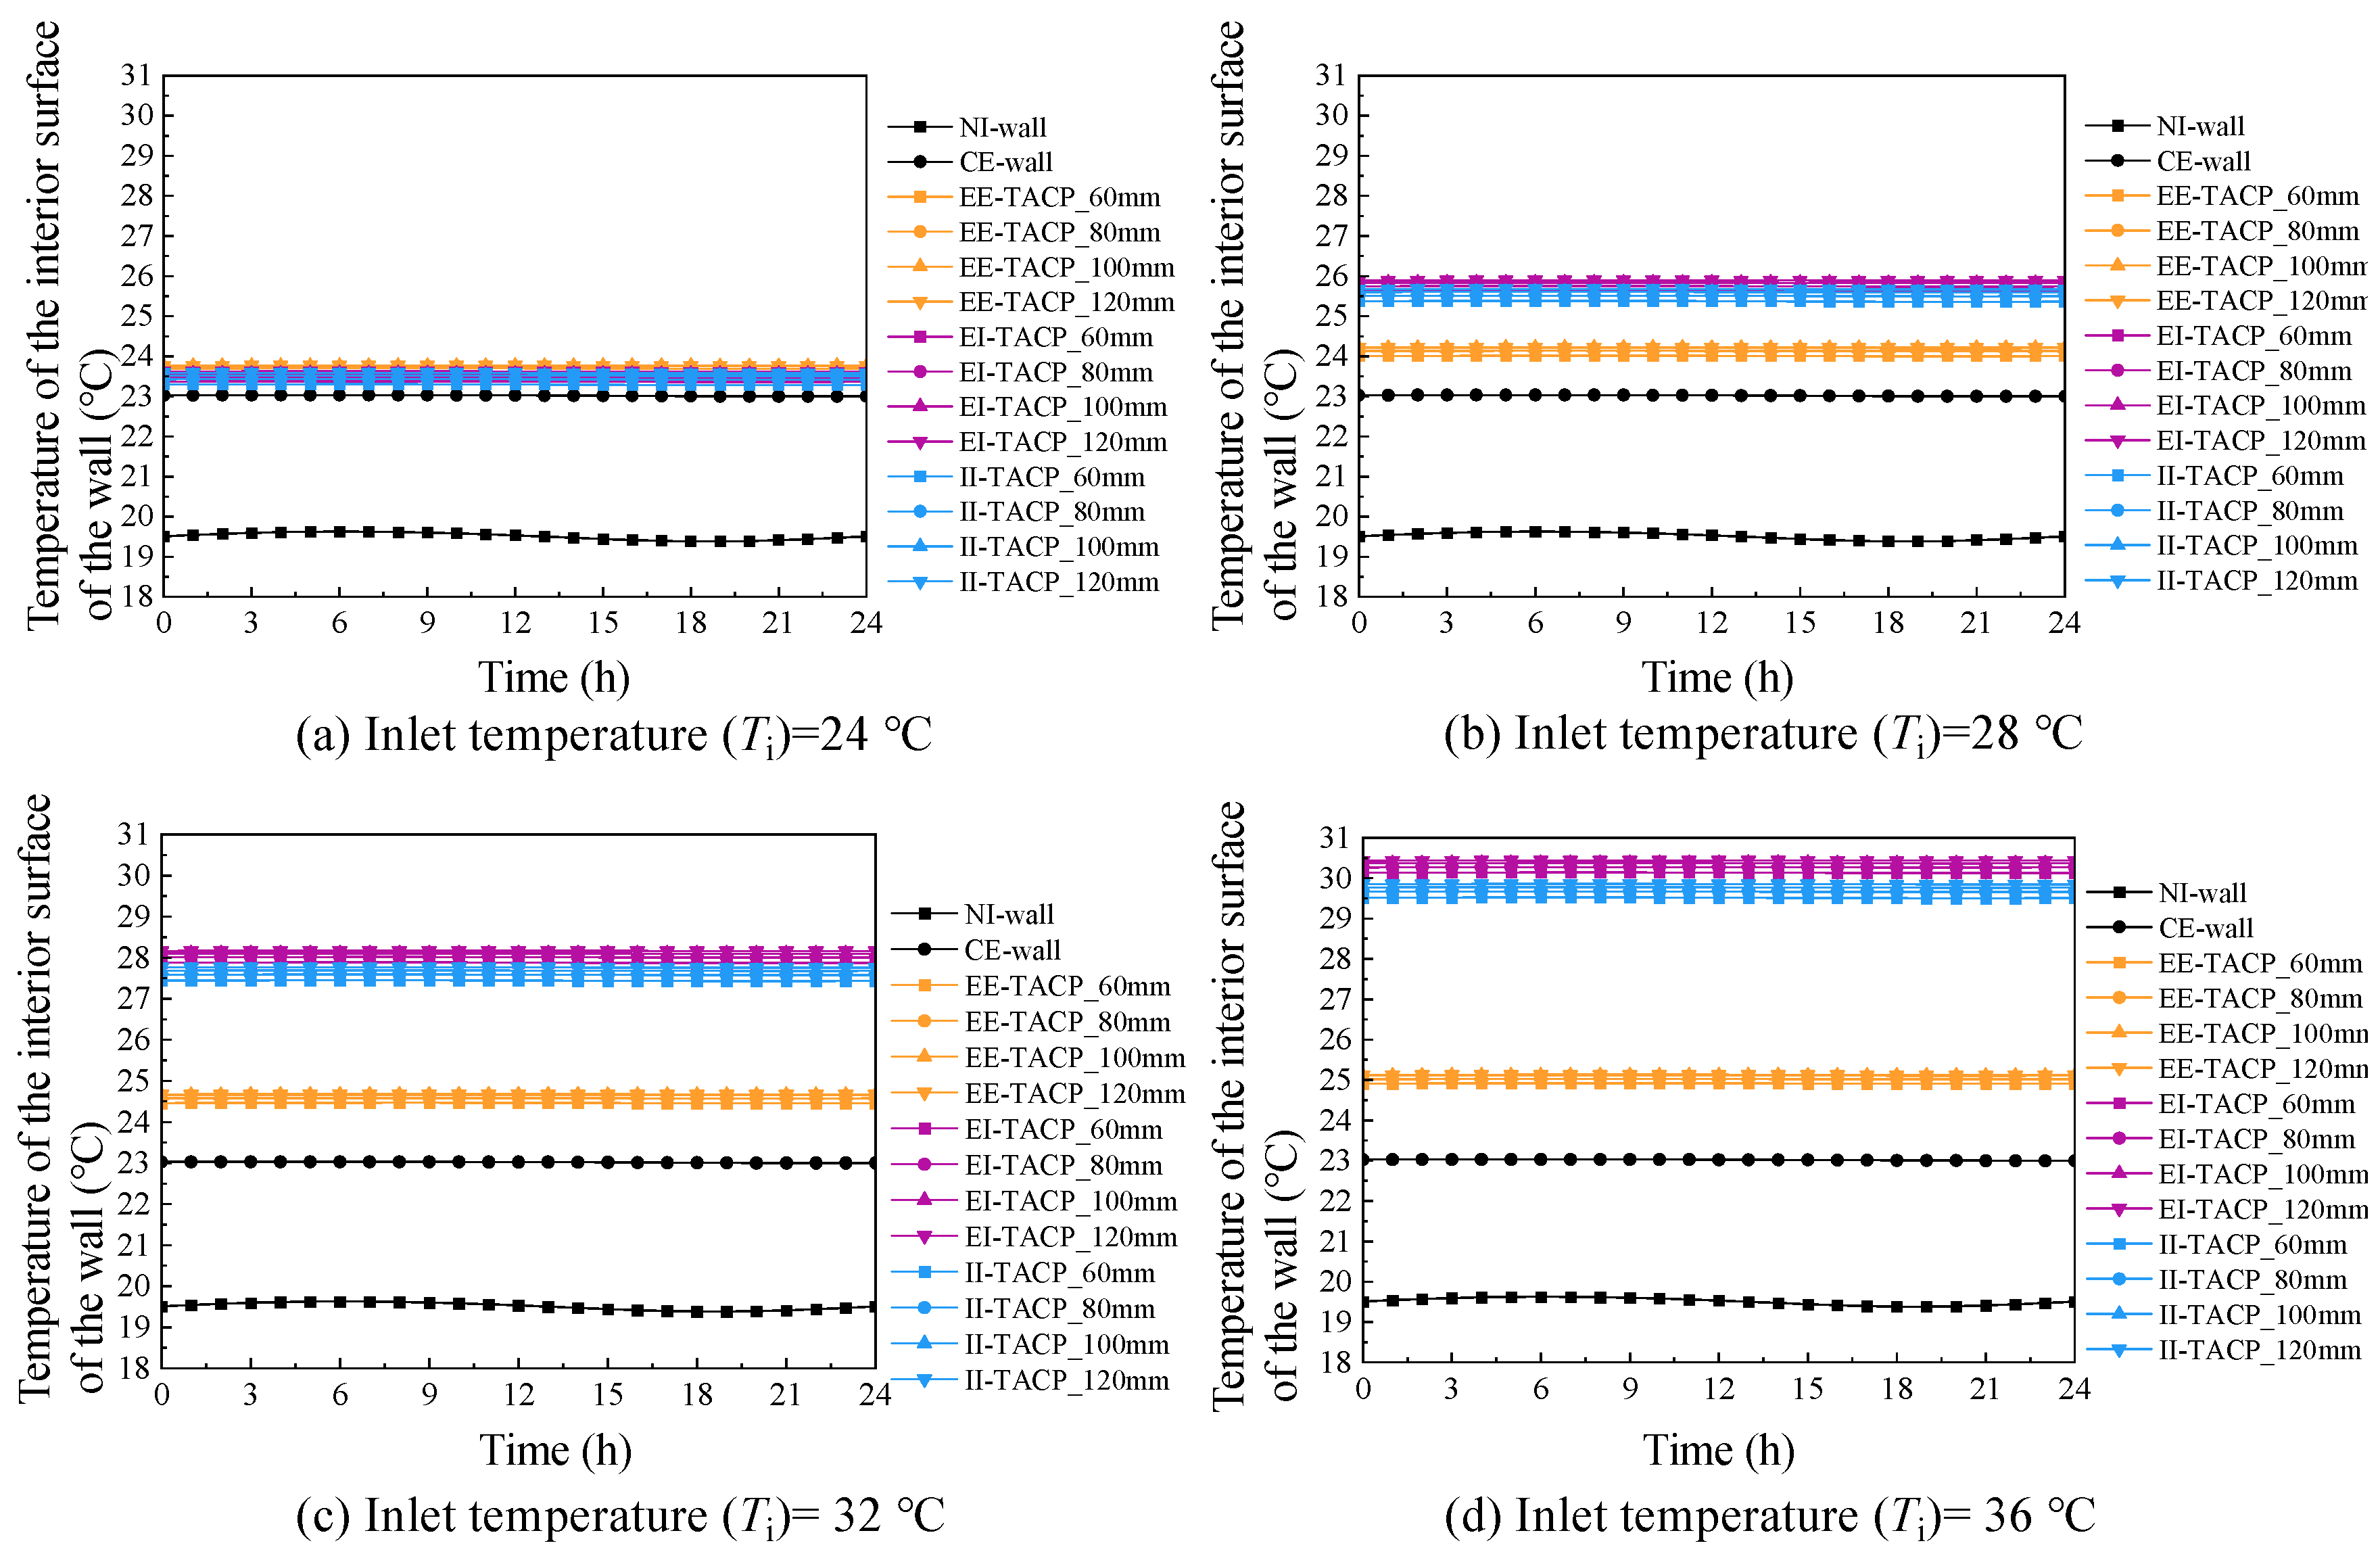
Figure 9 and Figure 10 present the variations in interior surface temperature and cumulative interior surface heat load for the three TACP configurations, EE-TACP, EI-TACP, and II-TACP, under different inlet temperatures (Ti = 24, 28, 32, and 36 °C) and insulation thicknesses (60, 80, 100, and 120 mm), relative to two types of reference walls. As observed in Figure 9a–d, when the Ti is 24 °C, the interior surface temperatures of all walls except the non-insulated wall are relatively similar. However, as Ti increases from 28 °C to 36 °C, the differences in interior surface temperature among the three types of TACP-walls compared to the CE-wall, as well as among the EE-TACP, EI-TACP, and II-TACP systems, become more pronounced. Among these, the interior surface temperature of EI-TACP is significantly higher than that of EE-TACP and II-TACP. For example, with an insulation thickness of 120 mm, the interior surface temperature of EI-TACP increases relative to the NI-wall/CE-wall by 6.38/2.87 °C (at 28 °C), 8.66/5.15 °C (at 32 °C), and 10.93/7.42 °C (at 36 °C). Compared to the EE-TACP/II-TACP walls, the increases are 1.67/0.22 °C (28 °C), 3.49/0.40 °C (32 °C), and 5.31/0.58 °C (36 °C), respectively. Furthermore, under the studied operating conditions, increasing the insulation thickness has an insignificant effect on the interior surface temperature. For instance, at Ti = 36 °C, increasing the insulation thickness of the EI-TACP wall from 60 mm to 120 mm raises the temperature by only 0.34 °C. Figure 10 clearly shows that the cumulative interior surface heat load of the three TACP-walls nearly approaches zero at a heat source temperature of 24 °C and turns increasingly negative as the injection temperature rises. This confirms that the TACP-walls are supplying heat to the indoor space. Moreover, under all four Ti conditions, the performance of EI-TACP is significantly superior to that of EE-TACP and II-TACP.

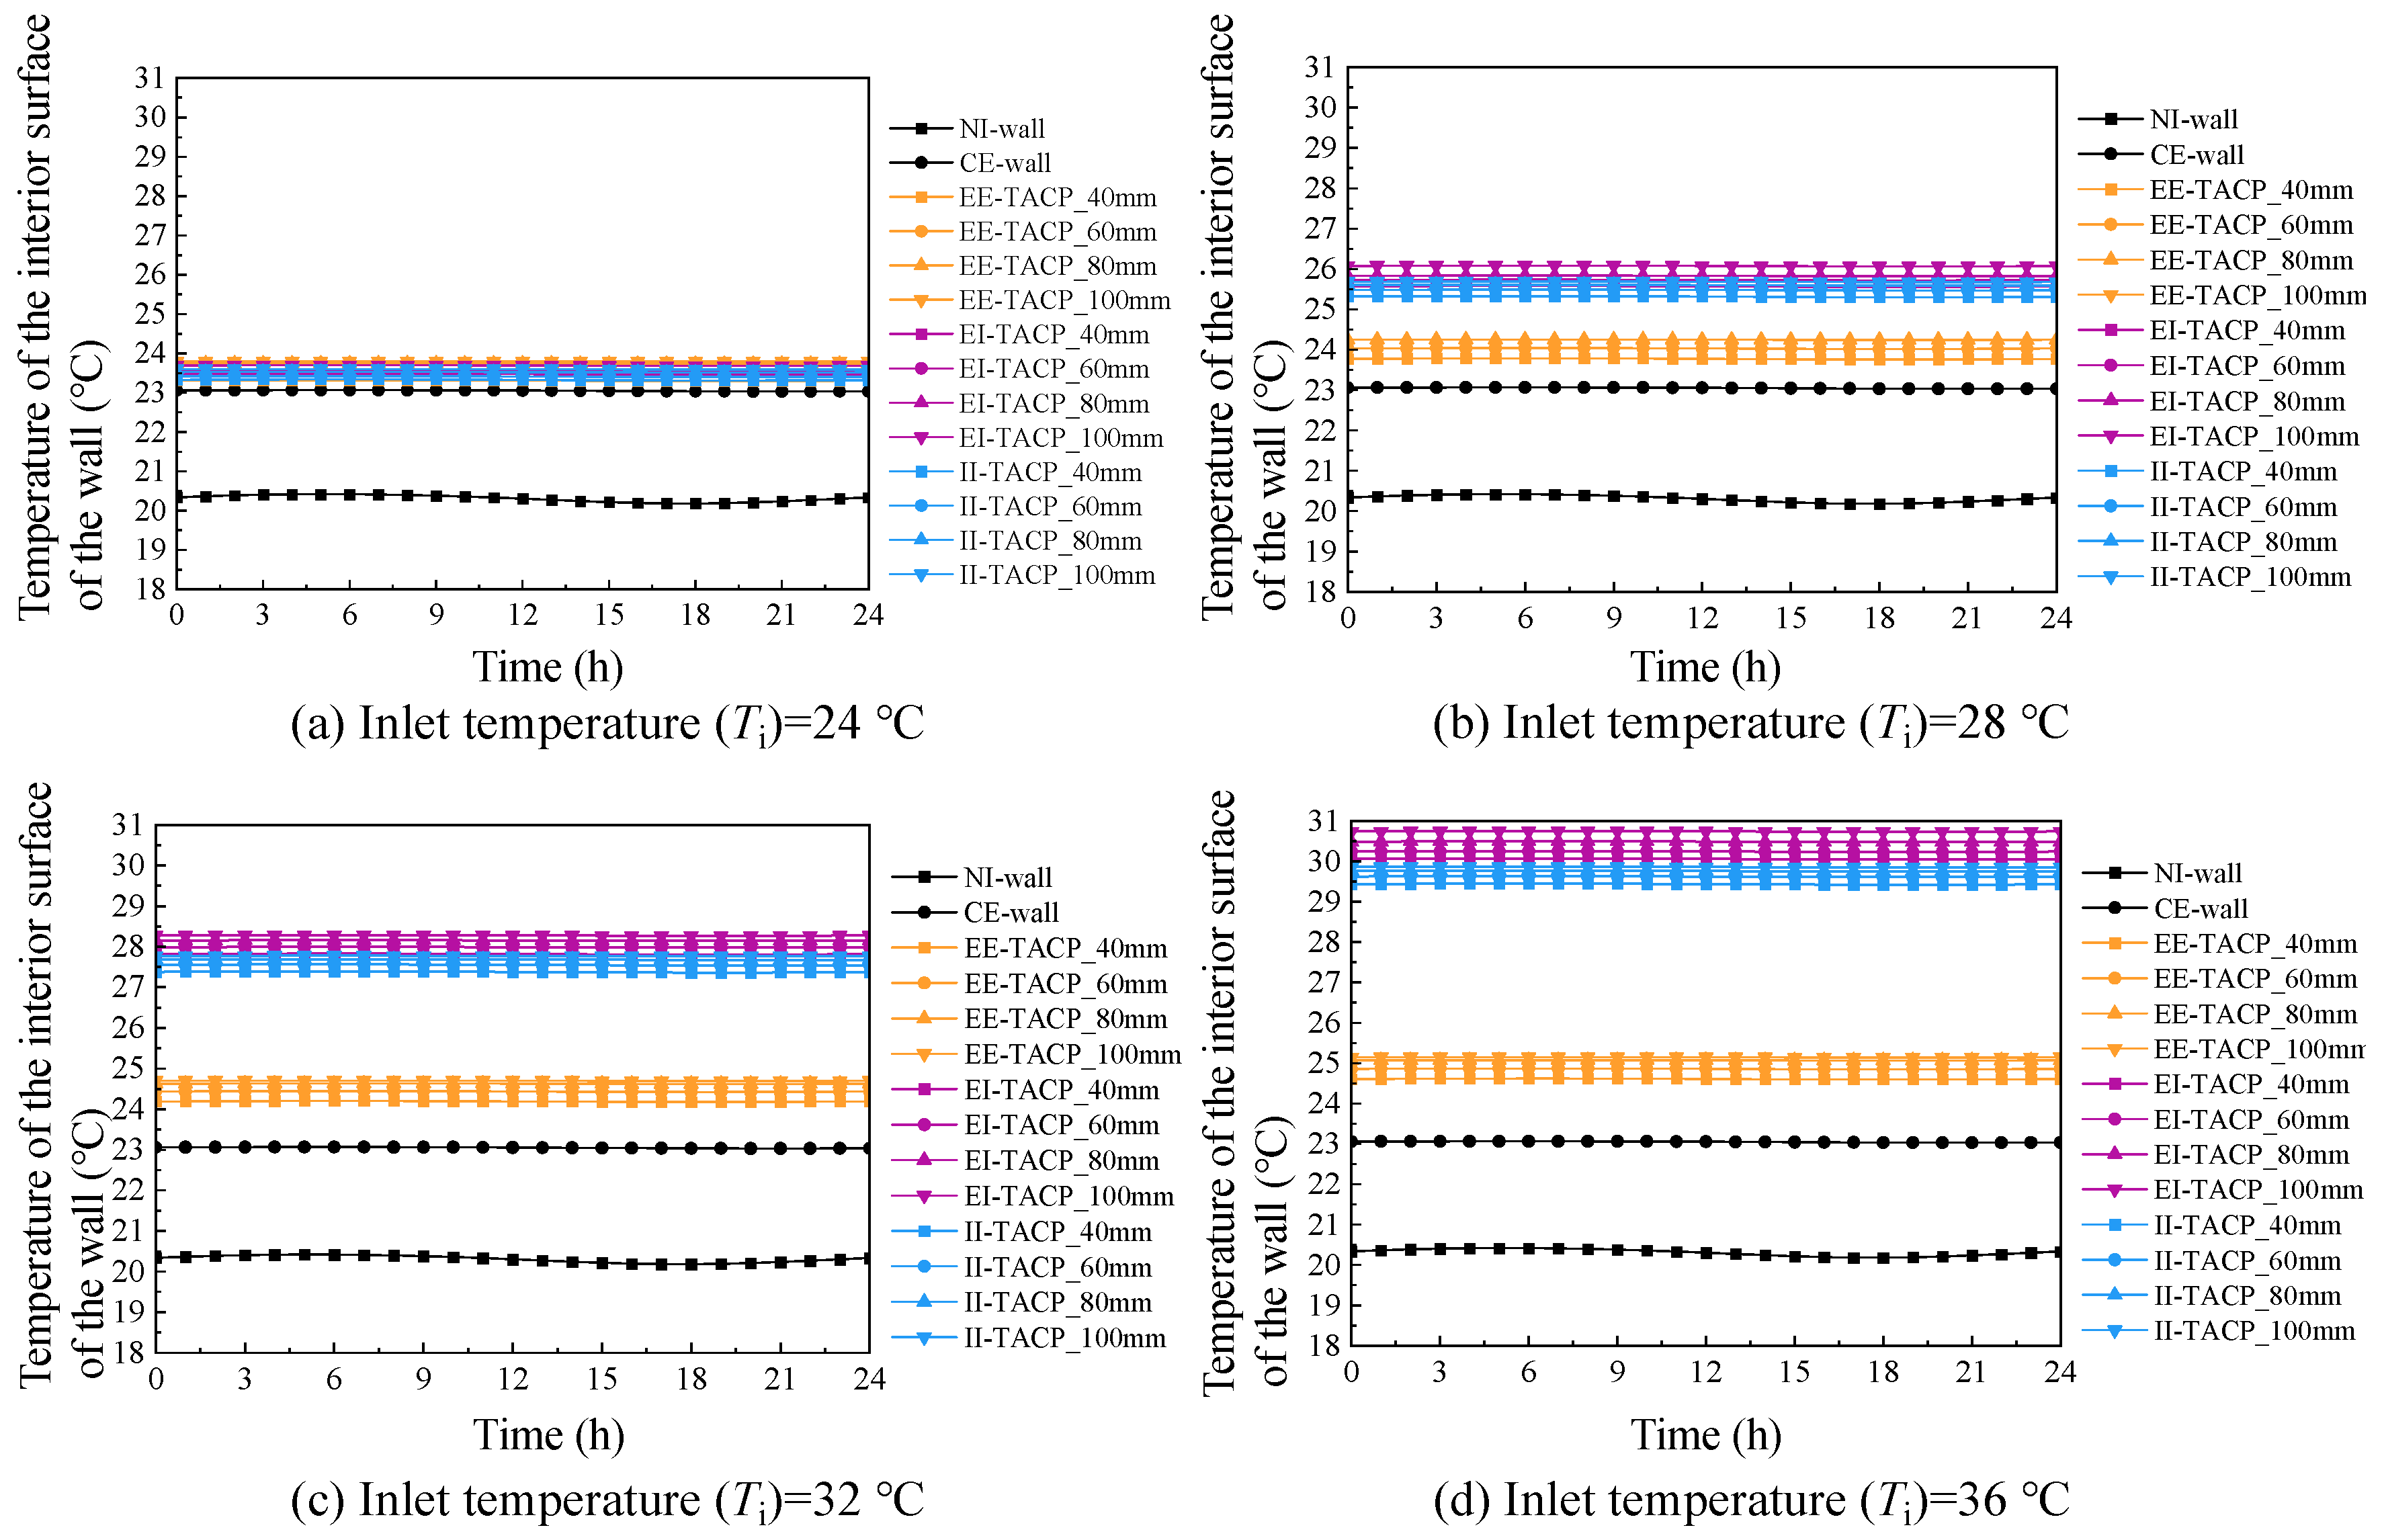
3.1.3. Performance Evaluation of Three TACP Configurations in the Cold Climate Zones

Figure 11 and Figure 12 present the variations in interior surface temperature and cumulative interior surface heat load for the three TACP configurations, EE-TACP, EI-TACP, and II-TACP, under different inlet temperatures (Ti = 24, 28, 32, and 36 °C) and insulation thicknesses (40, 60, 80, and 100 mm), relative to the non-insulated wall (NI-wall) and the conventional energy-saving wall (CE-wall). Consistent with the patterns observed in the severe cold climate zones, when the Ti is 24 °C, the interior surface temperatures of all wall types, except the NI-wall, are relatively similar, as shown in Figure 11a–d. However, as Ti increases from 28 °C to 36 °C, the differences in interior surface temperature between the three types of TACP-walls and the CE-wall become more pronounced. In particular, the interior surface temperature of EI-TACP increases significantly compared to that of EE-TACP as Ti rises, while the difference relative to II-TACP remains minimal. Furthermore, at Ti = 24 °C, the interior surface temperatures of the EE-TACP, EI-TACP, and II-TACP walls already approach the indoor setpoint temperature and increase noticeably with higher heat injection temperatures. For example, at Ti = 36 °C and an insulation thickness of 40 mm, the interior surface temperatures of EE-TACP, EI-TACP, and II-TACP increase by 4.30/1.56 °C, 9.75/7.01 °C, and 9.13/6.38 °C relative to the NI-wall and CE-wall, respectively. This clearly demonstrates that the invisible thermal barrier formed by the low-grade heat injected into the wall can effectively enhance the dynamic thermal behavior of the building envelope, with EI-TACP exhibiting the most favorable performance. As also observed in Figure 12, in the cold climate zones, the cumulative interior surface heat load of the three types of TACP-walls approaches zero at a heat source temperature of 24 °C and increases with higher injection temperatures, indicating that the TACP-walls are supplying heat to the indoor space. Under all four inlet temperature conditions, II-TACP outperforms EE-TACP, while EI-TACP delivers superior performance compared to II-TACP. When the insulation thickness increases from 40 mm to 100 mm, the maximum increase in cumulative interior surface heat load for EI-TACP is 0.23 W/m2 (at 24 °C), 0.28 W/m2 (at 28 °C), 1.97 W/m2 (at 32 °C), and 0.73 W/m2 (at 36 °C).

3.1.4. Performance Evaluation of Three TACP Configurations in the Hot Summer–Cold Winter Climate Zones

Figure 13 and Figure 14 present the variations in interior surface temperature and cumulative interior surface heat load for the three wall configurations, EE-TACP, EI-TACP, and II-TACP, under different inlet temperatures (Ti = 24, 28, 32, and 36 °C) and insulation thicknesses (30, 40, 55, and 70 mm), relative to the NI-wall and the CE-wall. As shown in Figure 13a–d, the interior surface temperature of the NI-wall exhibits more pronounced fluctuations compared to those observed in the severe cold and cold climate zones, which may be attributed to the thinner insulation layers typically used in the hot summer–cold winter climate zones. In addition, as Ti increases, the interior surface temperatures of the EE-TACP, EI-TACP, and II-TACP walls are significantly elevated relative to both reference walls. However, a distinct pattern emerges at Ti = 32 °C that differs from the other two climate zones: under insulation thicknesses of 55 mm and 70 mm, the interior surface temperature of the II-TACP wall slightly exceeds that of the EI-TACP wall. Under the other three Ti conditions, the differences in interior surface temperature and heat flux between the II-TACP and EI-TACP walls are negligible. For example, at Ti = 36 °C, the maximum increases in cumulative interior surface heat load for EI-TACP relative to the NI-wall and CE-wall are 7.18/5.27 W/m2 (30 mm), 7.29/5.38 W/m2 (40 mm), 7.40/5.49 W/m2 (55 mm), and 7.48/5.57 W/m2 (70 mm). Similarly, the corresponding values for II-TACP are 8.91/6.37 W/m2 (30 mm), 9.07/6.53 W/m2 (40 mm), 9.23/6.70 W/m2 (55 mm), and 7.42/6.88 W/m2 (70 mm). Therefore, in the hot summer–cold winter climate zones, based on the thermal response characteristics and cumulative interior surface heat load of the TACP-walls, both EI-TACP and II-TACP represent viable retrofitting options, depending on the heat source temperature applied to the pipe-embedded layer.

3.2. Energy-Saving Potential of Alternative TACP-Wall Configurations in Different

  • Climate Zones
This section presents a comparative analysis of the energy-saving potential of three types of thermally activated composite panel wall (TACP-wall) configurations, i.e., external insulation with externally embedded pipes (EE-TACP), external insulation with internally embedded pipes (EI-TACP), and internal insulation with internally embedded pipes (II-TACP), under varying injected heat temperatures (Ti = 24, 28, 32, and 36 °C) and insulation thicknesses (severe cold climate zones: 60–120 mm; cold climate zones: 40–100 mm; hot summer–cold winter climate zones: 30–70 mm), relative to both non-insulated wall (NI-wall) and conventional insulated energy-saving wall (CE-wall). The energy savings of the CE-wall relative to the NI-wall are also assessed to identify optimal TACP-wall retrofitting strategies for each climatic zone of Gansu Province.

3.2.1. Energy-Saving Potential of TACP-Wall Configurations in Severe Cold

  • Climatic Zone
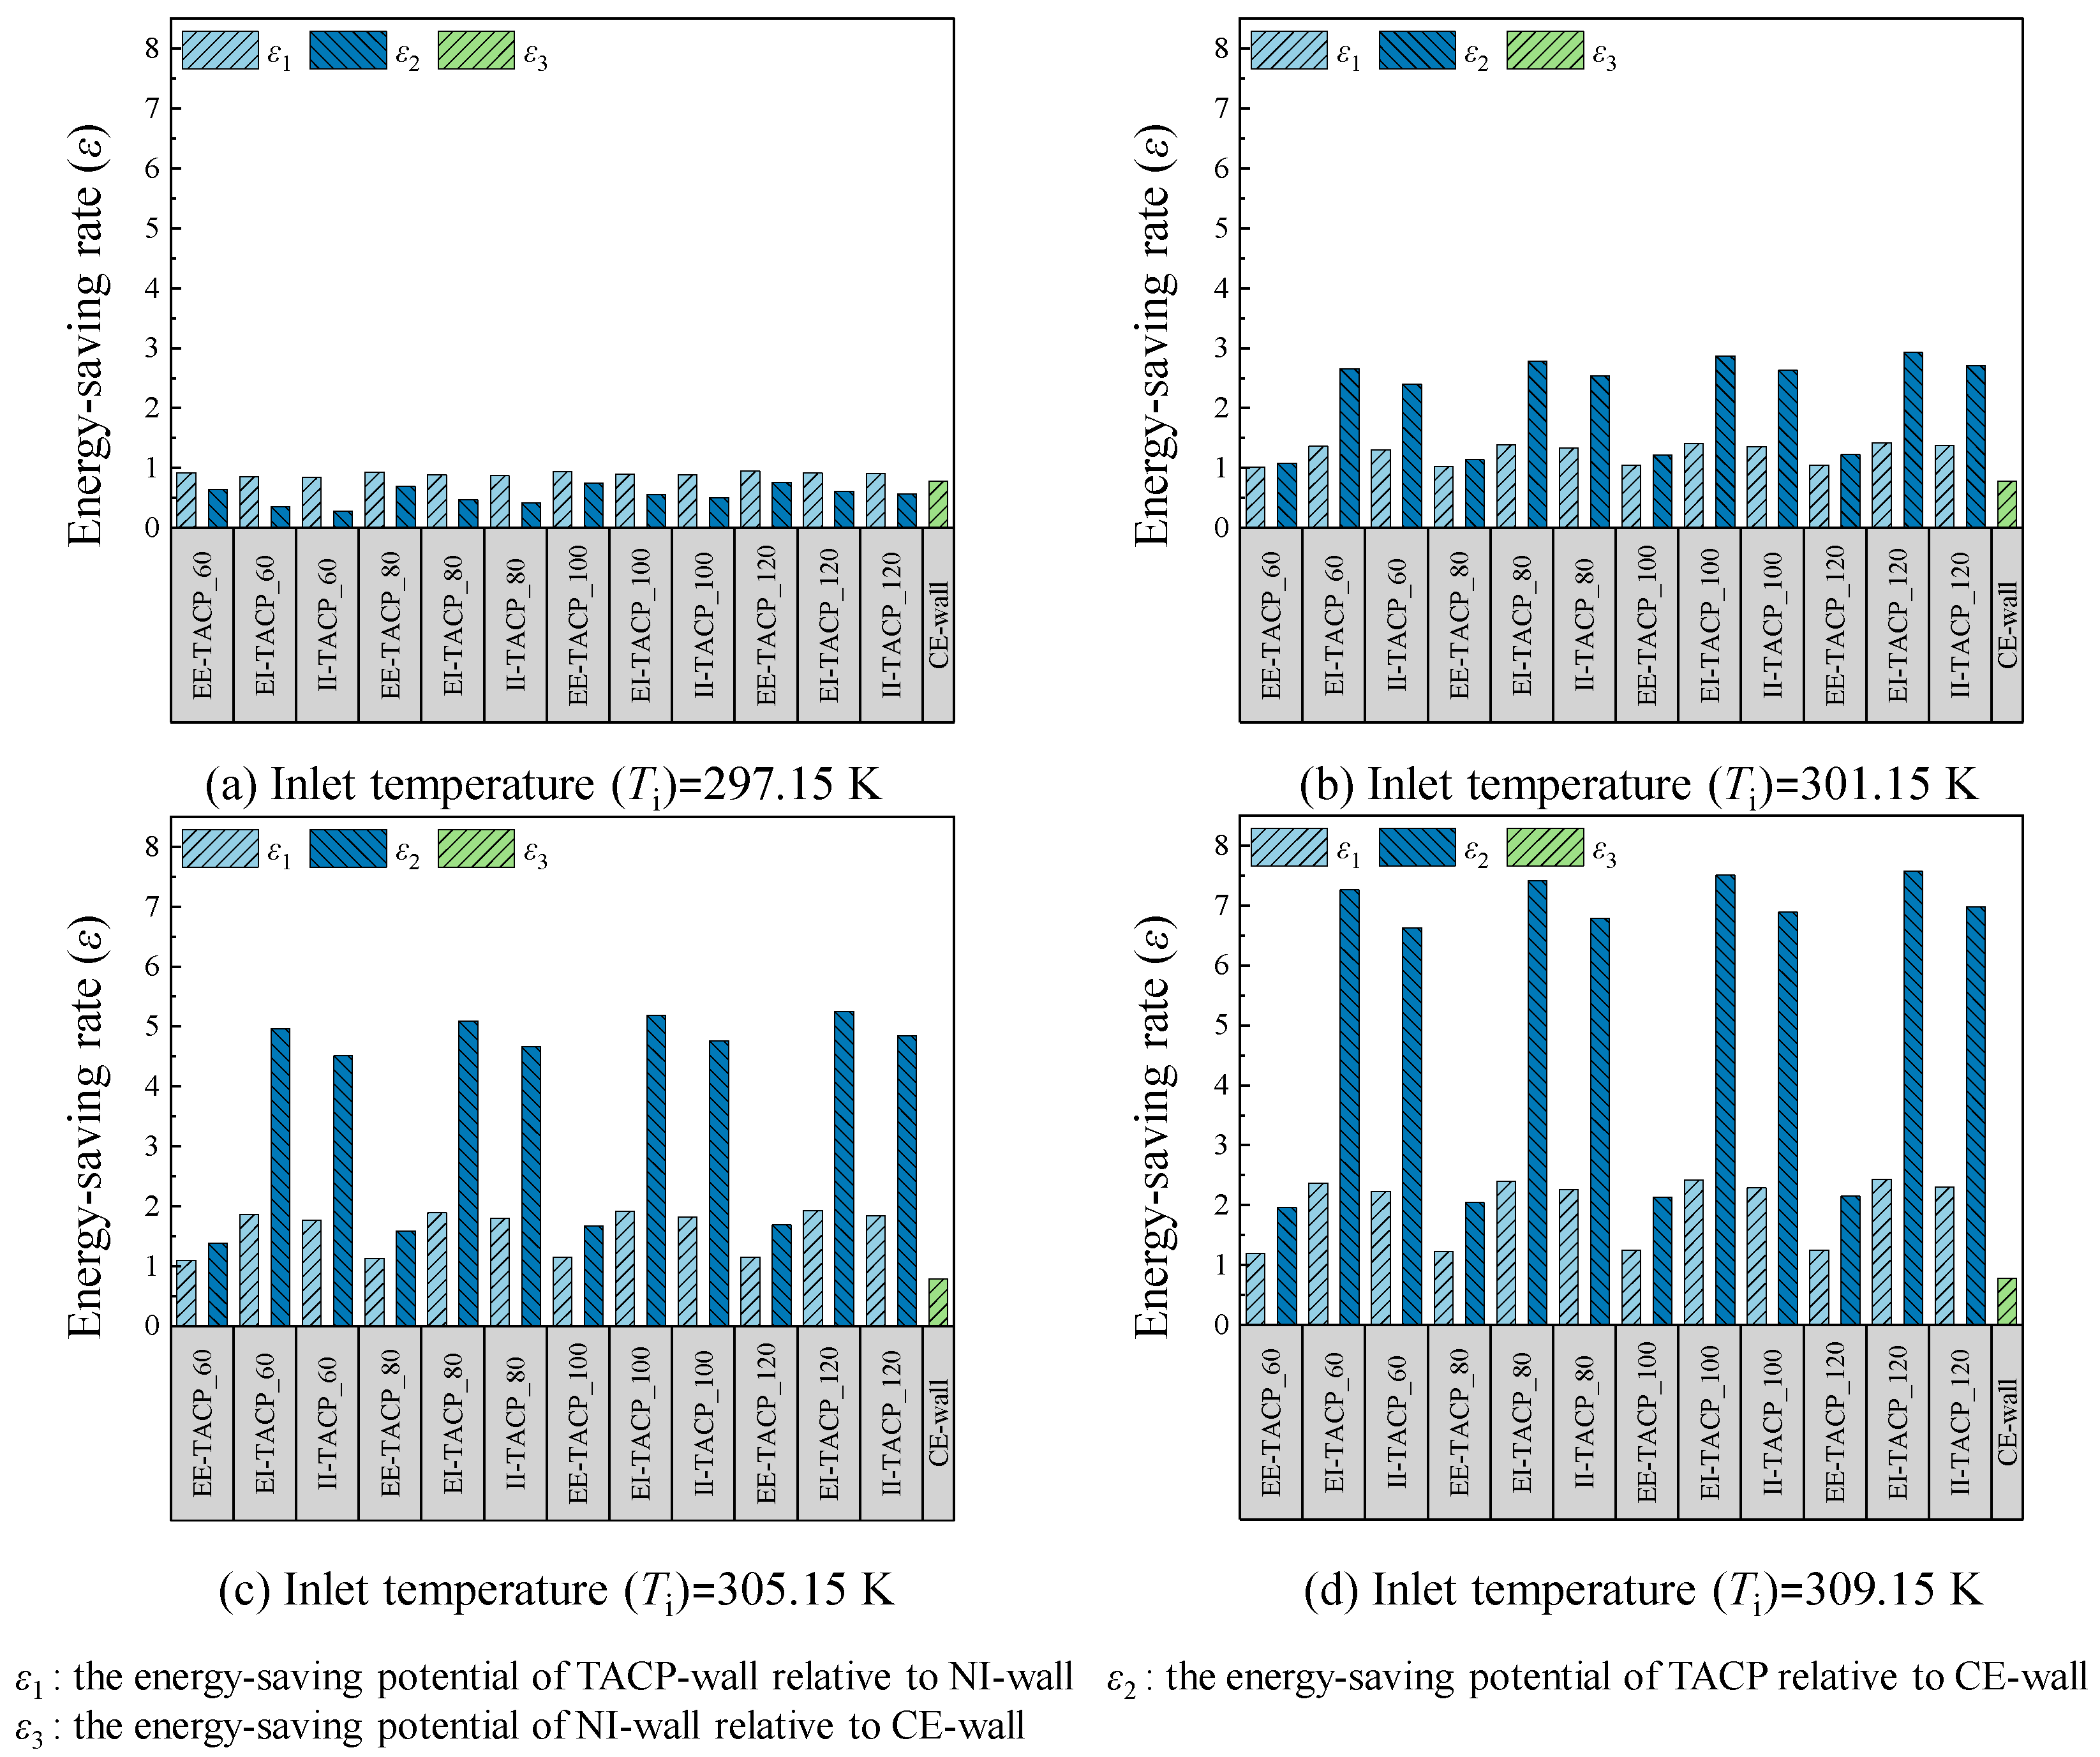
Figure 15 illustrates the variations in energy-saving potential of retrofitted walls using EE-TACP, EI-TACP, and II-TACP relative to both the non-insulated (NI) and the conventional insulated (CE) reference walls in Jiuquan city (severe-cold climate zones), under different inlet temperatures (Ti = 24, 28, 32, and 36 °C) and insulation layer thicknesses (60, 80, 100, and 120 mm). The results indicate that in the severe cold climate zones, the energy-saving rates of the three retrofitting schemes range from 0.28 to 7.57 across the different inlet temperatures (Ti). Furthermore, as shown in Figure 15a–d, under the same Ti, the improvement in energy-saving rate due to changes in insulation thickness is not significant for a given wall type. For example, for the EE-TACP configuration at Ti = 24 °C, when the insulation thickness increases from 60 mm to 120 mm, the energy-saving rate increases by only 0.026 (compared to the NI-wall) to 0.12 (compared to the CE-wall). Therefore, from the perspectives of economy and embodied carbon emissions, using the minimum insulation thickness can adequately meet energy-saving requirements. Additionally, except under the Ti = 24 °C condition, the energy-saving rates of EI-TACP and II-TACP are significantly higher than that of EE-TACP, with the difference becoming more pronounced as the inlet temperature increases. At Ti = 36 °C, the energy-saving rates of EI-TACP and II-TACP increase markedly compared to EE-TACP, with EI-TACP performing particularly well, showing improvements of 2.37–2.44 and 7.26–7.57 relative to the NI-wall and CE-wall, respectively. This study further reveals that, under conditions where the CE-wall is more energy-efficient than the NI-wall, the energy-saving rates of the three types of TACP-wall configurations relative to the CE-wall are substantially higher than those relative to the NI-wall, with the disparity increasing at higher inlet temperatures. This suggests that the reduction in heat loss to the outdoors is far greater in TACP-walls with insulation layers than in CE-walls. In summary, considering energy-saving performance, economic feasibility, and carbon emissions, the EI-TACP configuration with the minimum insulation thickness is identified as the most suitable retrofitting option among the three TACP-wall types in the severe cold climate zones.

3.2.2. Energy-Saving Potential of TACP-Wall Configurations in Cold Climatic Zone

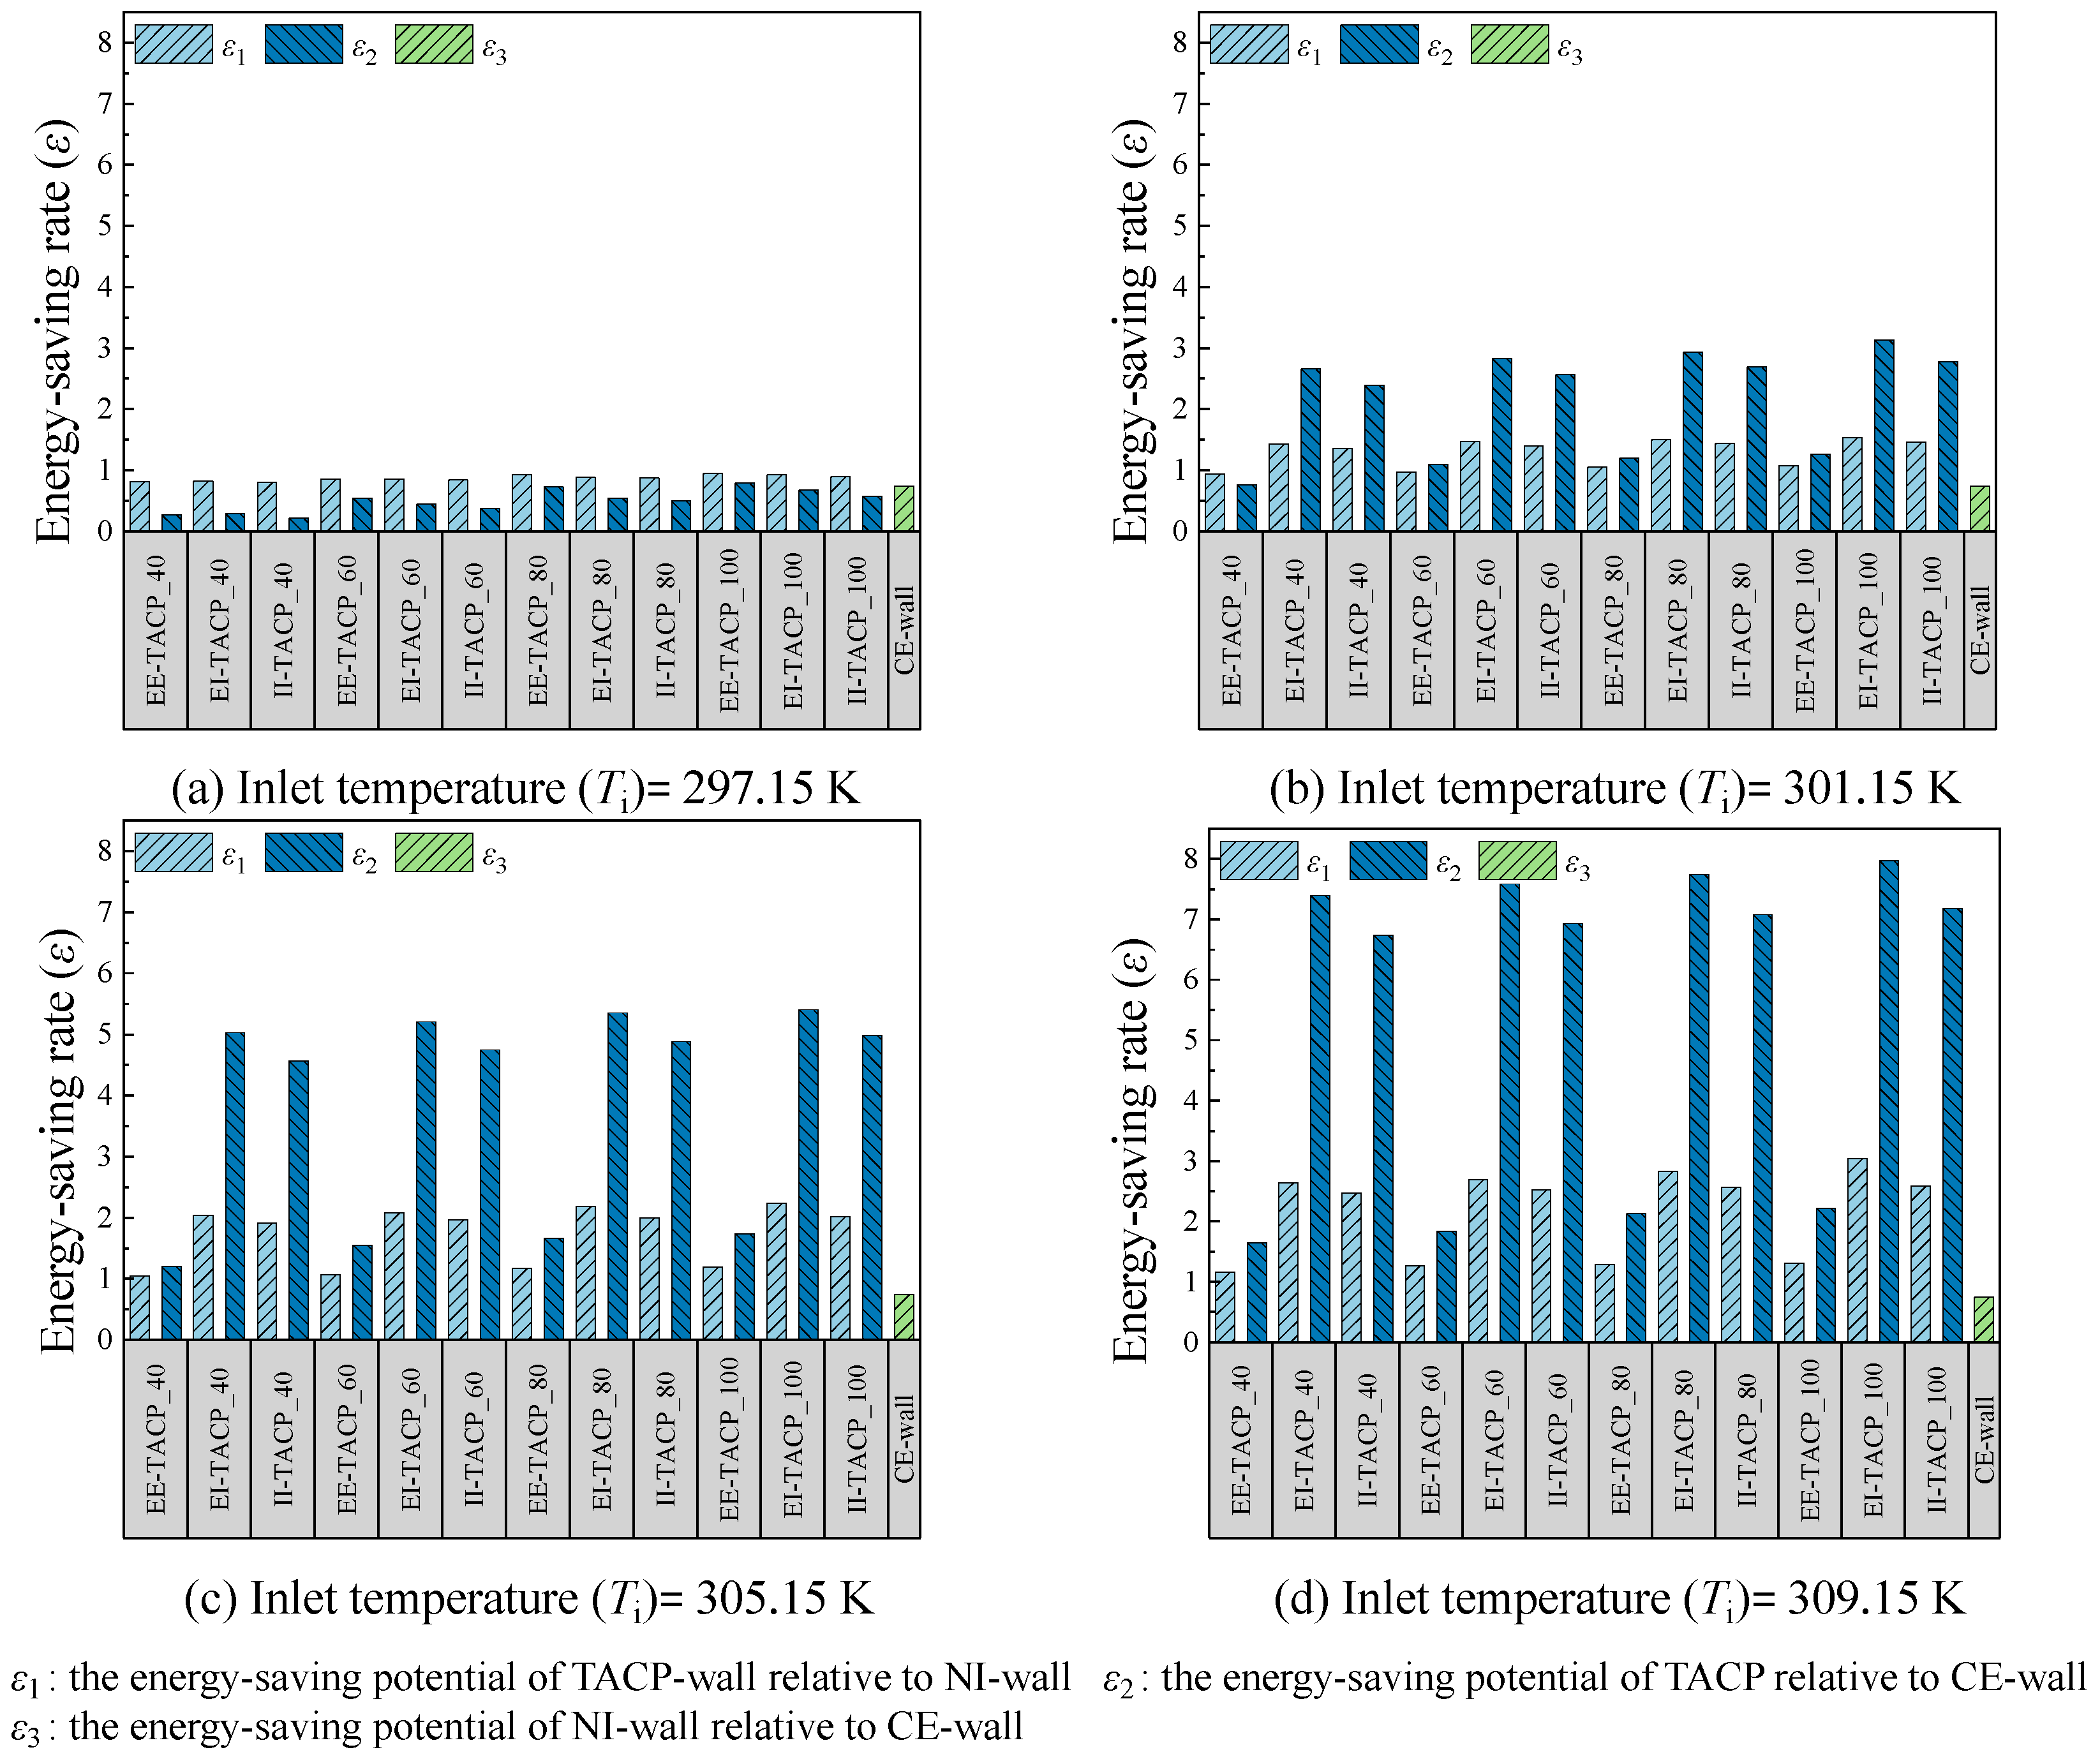
Figure 16 presents the variations in energy-saving potential of retrofitted walls using EE-TACP, EI-TACP, and II-TACP active energy-saving schemes in Lanzhou city under different inlet temperatures (Ti = 24, 28, 32, and 36 °C) and insulation thicknesses (40, 60, 80, and 100 mm), relative to two types of reference walls. Figure 16a–d showed that the energy-saving rate of the three retrofitting schemes increases with rising Ti in the cold climate zones. Compared to the NI-wall/CE-wall, the improvements in energy-saving rate for EE-TACP, EI-TACP, and II-TACP range from 0.81–0.95/0.27–0.79 (Ti = 24 °C), 0.82–0.93/0.29–0.67 (Ti = 28 °C), and 0.81–0.95/0.27–0.79 (Ti = 32 °C), to 0.80–0.89/0.21–0.58 (Ti = 36 °C). Moreover, within any single Ti scenario, the increase in energy-saving rate resulting from variations in insulation thickness remains insignificant for each wall type. For instance, when the insulation thickness of EE-TACP increases from 40 mm to 100 mm, the improvement relative to the NI-wall/CE-wall is only 0.13/0.45 (Ti = 24 °C), 0.13/0.50 (Ti = 28 °C), 0.14/0.54 (Ti = 32 °C), and 0.15/0.57 (Ti = 36 °C). Therefore, considering both economic efficiency and embodied carbon emissions, the use of the minimum insulation thickness is sufficient to meet energy-saving requirements. The result further reveals that, except under the Ti = 24 °C condition, the energy-saving rates of EI-TACP and II-TACP are significantly higher than that of EE-TACP as Ti increases, with EI-TACP demonstrating particularly outstanding performance. For instance, at Ti = 36 °C, EI-TACP exhibits improvements relative to the NI-wall/CE-wall of 2.64/7.40 (40 mm), 2.70/7.59 (60 mm), 2.83/7.74 (80 mm), and 3.05/7.97 (100 mm). Consequently, integrating thermal performance, energy-saving magnitude, cost-effectiveness, and carbon footprint, the EI-TACP configuration with the minimal insulation thickness emerges as the optimal retrofit solution among the three TACP-wall variants in cold-climate regions.

3.2.3. Energy-Saving Potential of TACP-Wall Configurations in Hot Summer–Cold Winter Climatic Zone

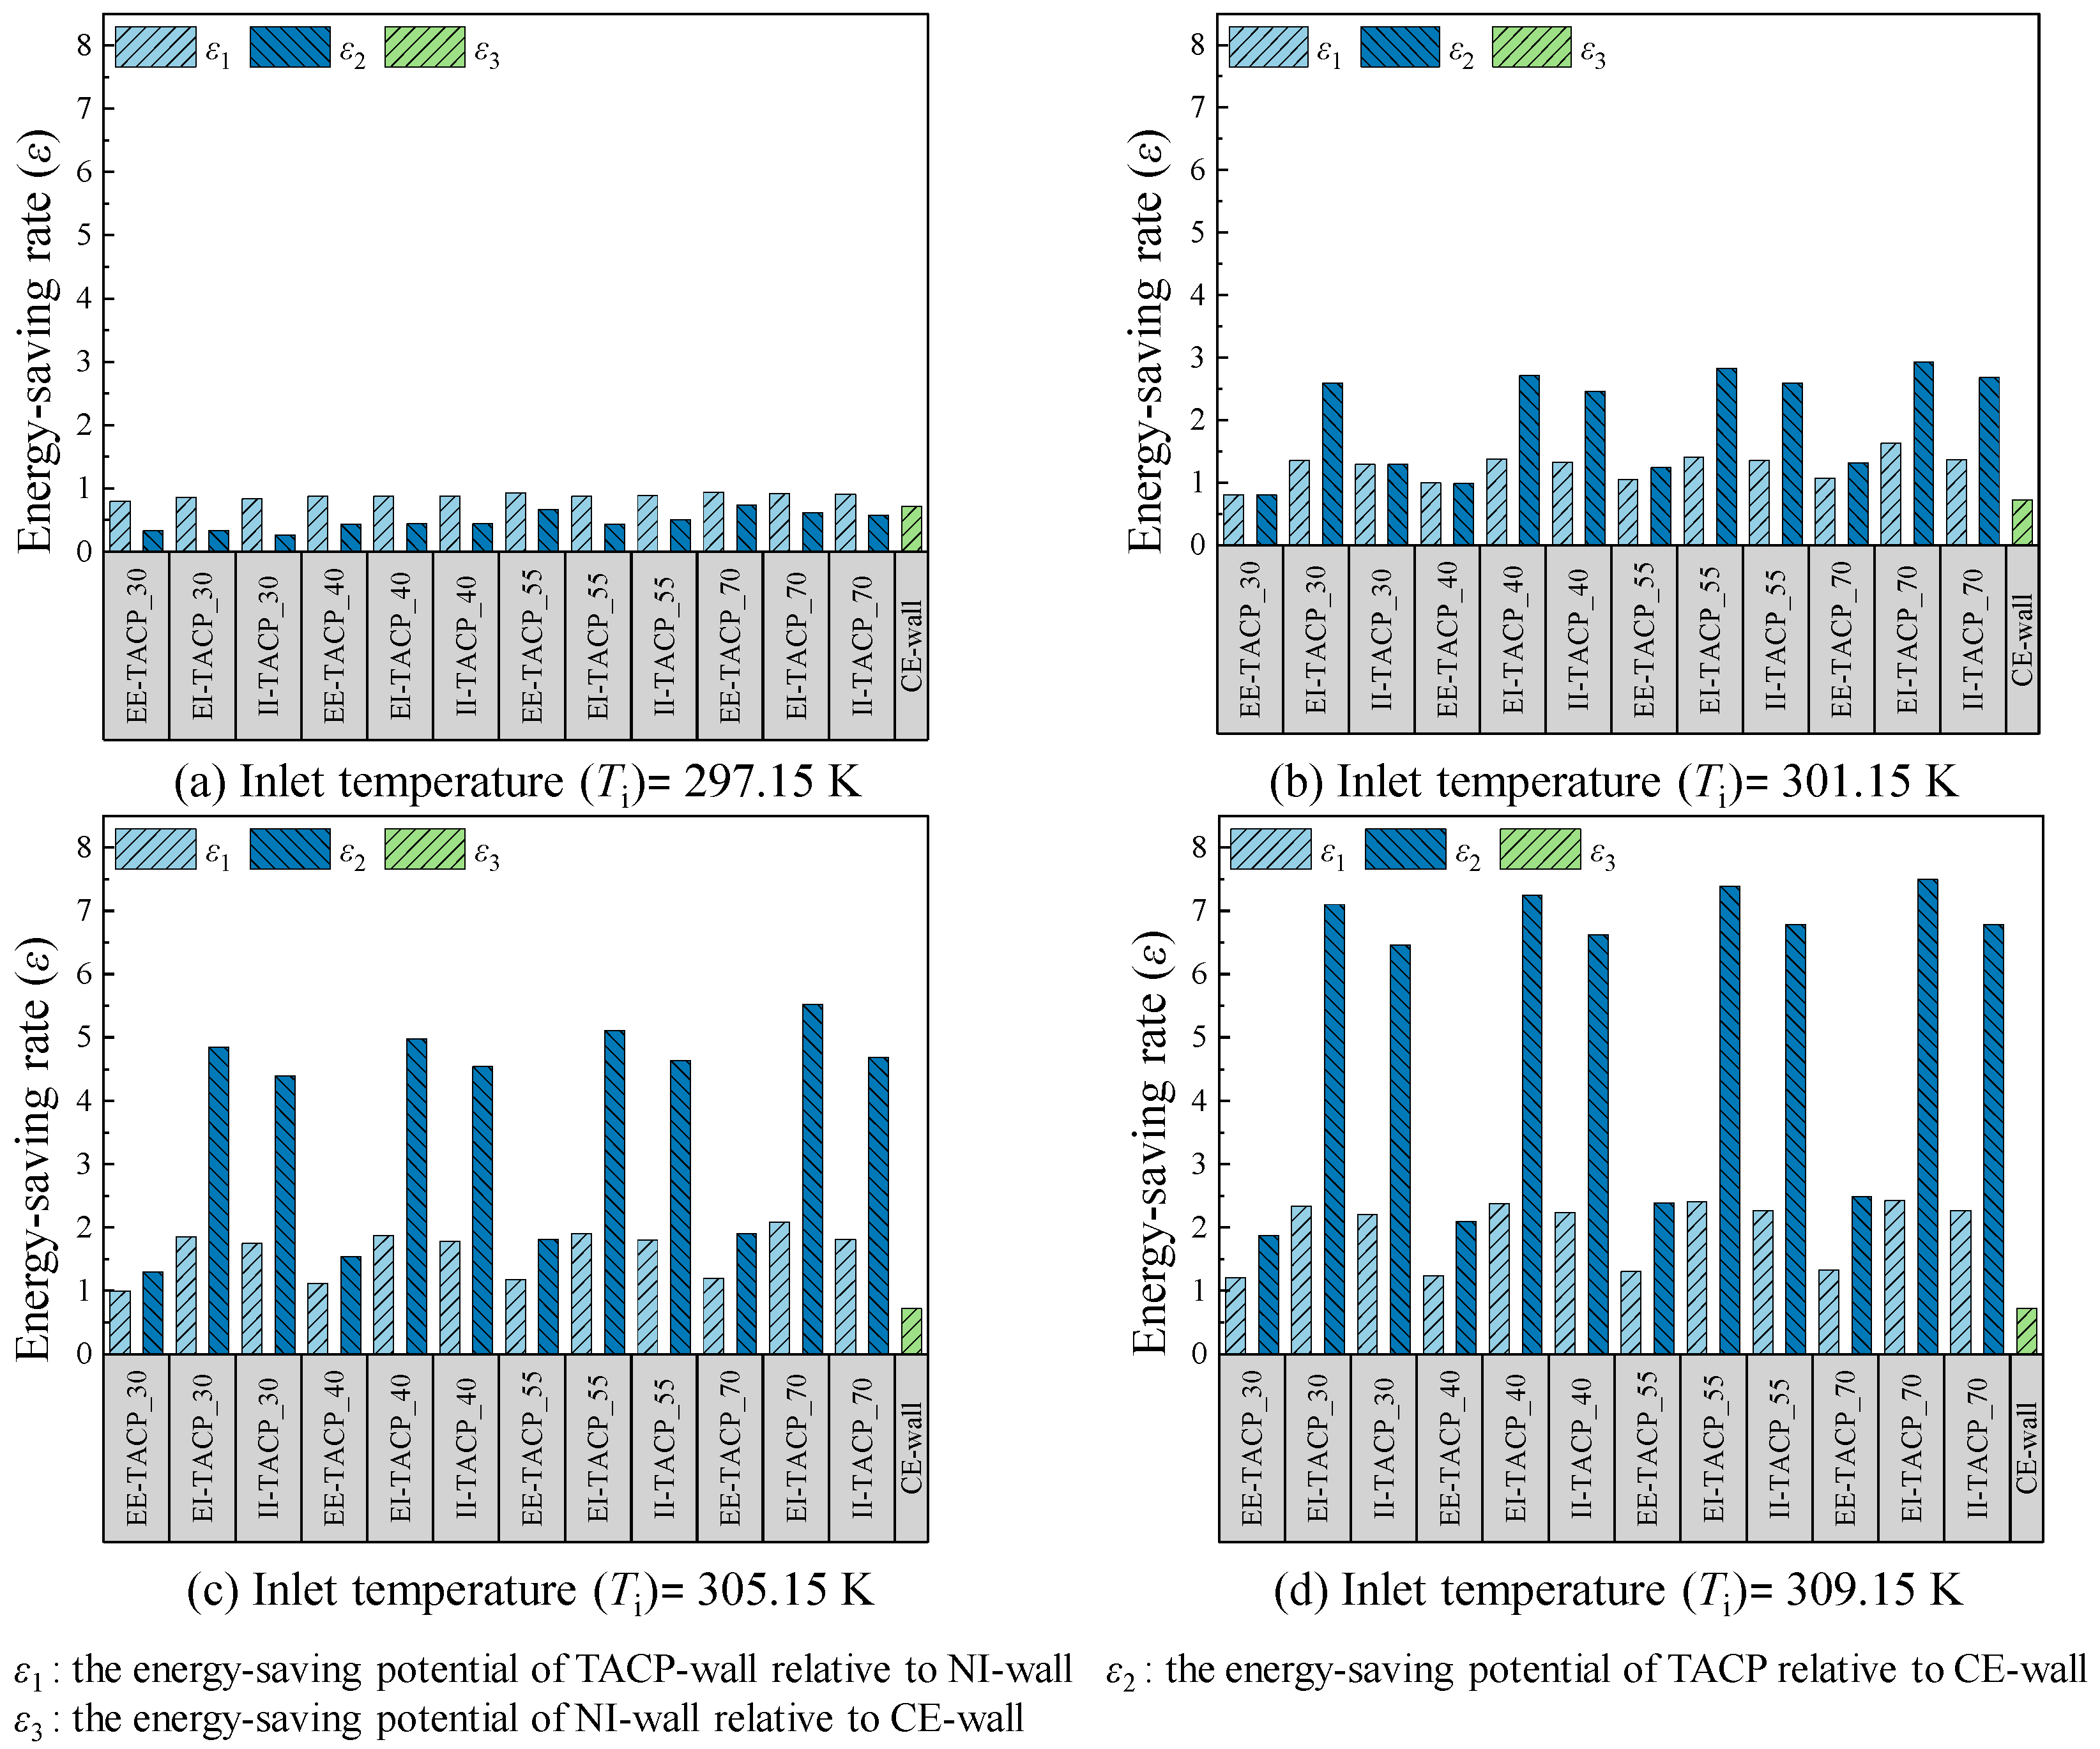
Figure 17 quantifies the energy-saving potential of retrofitted existing building walls using EE-TACP, EI-TACP, and II-TACP schemes in the Wudu area, evaluated under different inlet temperatures (Ti = 24, 28, 32, and 36 °C) and insulation layer thicknesses (30, 40, 55, and 70 mm), relative to non-insulated walls (NI-walls) and conventional insulated energy-saving walls (CE-walls). The results showed that in the hot summer–cold winter climate zones, the energy-saving rate (ε) of the three retrofitting schemes varies considerably with Ti. At Ti = 24 °C, the values of ε1 and ε2 differ significantly from those at Ti = 28, 32, and 36 °C, with a wide range of 0.33–7.50. Overall, ε exhibits an increasing trend as Ti rises, with particularly notable performance under high-temperature conditions of Ti = 36 °C. Furthermore, as observed in Figure 17a–d, increasing the insulation thickness under the same injected heat temperature has a minimal influence on ε. Taking the EE-TACP scheme at Ti = 24 °C as an example, ε relative to the NI-wall and CE-wall increases only marginally across the four insulation thicknesses: 0.79/0.33 (30 mm), 0.88/0.43 (40 mm), 0.93/0.67 (55 mm), and 0.94/0.74 (70 mm). It can be seen that variations in ε due to changes in insulation thickness are negligible when compared to the NI-wall, while the increase relative to the CE-wall remains modest, ranging from 0.10 to 0.41, a trend consistent across all Ti levels.
The results further indicate that, except at Ti = 24 °C, the EI-TACP configuration consistently exhibits superior performance under all other operating conditions. Its energy-saving rate shows substantial improvement relative to both the NI-wall and CE-wall, with increases of 1.35–1.63/2.60–2.93 (at 28 °C), 1.85–2.08/4.85–5.52 (at 32 °C), and 2.34–2.43/7.10–7.50 (at 36 °C). In conclusion, based on a comprehensive consideration of the thermal performance results presented in Section 3.1 and the energy-saving potential analyzed in this section, the EI-TACP scheme with the minimum insulation thickness emerges as the most economically efficient and low-carbon option among the three TACP-wall retrofitting strategies in the hot summer–cold winter climate zones.

4. Conclusions

This study presents three configurations of thermally activated composite panels (TACP) as effective solutions for improving energy efficiency and reducing carbon emissions in existing buildings, particularly in areas with diverse climates like Gansu Province. The configurations of thermally activated composite panels (TACP) are external insulation with externally embedded pipes (EE-TACP), external insulation with internally embedded pipes (EI-TACP), and internal insulation with internally embedded pipes (II-TACP). To elucidate the performance of the three configurations under varying conditions, a systematic analysis was conducted on the effects of insulation thickness and injection temperature on thermal performance and energy-saving potential in the severe cold, cold, and hot summer–cold winter climate zones. The key findings of this study can be summarized as follows:
(1) The three TACP-wall configurations exhibit superior thermal performance and economic efficiency compared with non-insulated walls (NI-wall) and conventional insulated energy-saving walls (CE-wall) under all operating conditions. These results demonstrate the feasibility of the proposed retrofit solution across different climate zones in Gansu Province and provide a practical technical pathway for energy-efficient renovation of existing buildings.
(2) Increasing the insulation thickness has a negligible effect on the interior surface temperature, interior heat flux, and energy-saving rate of the TACP-wall. However, due to the presence of the insulation layer, the heat loss from the TACP-wall to the outdoors is significantly smaller relative to the CE-wall than to the NI-wall. Hence, under identical heat injection temperatures and outdoor climatic conditions, the energy-saving rate ε2 is considerably greater than ε1 for the same TACP configuration.
(3) The energy-saving rates of the three configurations, EE-TACP, EI-TACP, and II-TACP, all increased with rising heat injection temperature, reaching maximum values of up to 7.57 in the severe cold climate zones, 7.97 in the cold climate zones, and 7.50 in the hot summer–cold winter climate zones. When the injection temperature exceeded the room temperature, the absolute value of the cumulative heat load at the interior surface also increased significantly with higher injection temperatures.
(4) Under identical operating conditions across the three climate zones, the performance of both EI-TACP and II-TACP walls is significantly superior to that of the EE-TACP wall. In the severe cold and cold climate zones, the overall performance of the EI-TACP wall exceeds that of the II-TACP wall. However, in the hot summer–cold winter zones, the performance of the EI-TACP and II-TACP walls is comparable, with the II-TACP wall performing slightly better than the EI-TACP wall, particularly at a heat injection temperature of 24 °C. Therefore, based on a comprehensive evaluation, the most suitable scheme for the severe cold zones is EI-TACP. For the cold zones, EI-TACP is the primary recommendation, followed by II-TACP as a secondary option. In the hot summer–cold winter zones, if only the energy-saving rate is considered, EI-TACP is recommended, yet II-TACP may be selected when retrofit constraints and whole winter operation are also taken into account.

5. Research Prospect

Future research will focus on implementing continuous on-site monitoring in retrofitted buildings across different climatic zones of Gansu Province to verify the long-term thermal performance and energy-saving effectiveness of TACP under real meteorological conditions. In addition, efforts will be made to optimize economic performance, enhance material sustainability, and improve system integration, providing support for the large-scale application of TACP technology in energy-efficient retrofitting of existing buildings.

Author Contributions

H.Z.: Project administration; Resources; Funding acquisition. R.C.: Project administration; Resources. Z.C.: Validation; Formal analysis; Data curation; Writing—original draft. S.L.: Investigation; Data curation; Writing—review and editing. X.B.: Visualization; Funding acquisition; Data curation. S.C.: Methodology; Investigation; Writing—original draft; Supervision. K.C.: Formal analysis; Data curation; Visualization. Y.Y.: Methodology; Supervision; Software; Validation; Writing—original draft. All authors have read and agreed to the published version of the manuscript.

Funding

The research was supported by Research on Planning and Aesthetic Renewal Technologies for Existing Urban Districts (NO. JK2023-20; NO. KY2023-05), the National Natural Science Foundation of China (NO. 52208103), and Anhui Provincial University Research Project (NO. 2024AH050240).

Institutional Review Board Statement

Not applicable.

Informed Consent Statement

Not applicable.

Data Availability Statement

The data presented in this study are available upon request from the corresponding author.

Conflicts of Interest

Authors Huajun Zou and Ruiwen Chai were employed by the company Gansu Institute of Architectural Design and Research Co., Ltd. The remaining authors declare that the research was conducted in the absence of any commercial or financial relationships that could be construed as a potential conflict of interest.

Nomenclature

V/vSpeed, m/sAbbreviation
QHeat exchange intensity, MJ·m−2TACPThermally activated composite panel
HLength size, mmEE-TACPExternally embedded pipes
qHeat flux, W·m−2EI-TACPExternal insulation with internally embedded pipes
TTemperature,°CII-TACPInternal insulation with internally embedded pipes
cpSpecific heat capacity, J·kg−1·°C−1NI-wallsNon-insulated walls
gGravitational acceleration, m·s−2CE-wallsConventional insulated energy-saving walls
hThermal convective coefficient, W/(m2·°C−1)CTAWConcrete traditional thermally activated wall
tSimulation time, s
DPipe diameter, mmSubscripts
ISolar radiance, W·m−2iInterior surface
eExterior surface
Greek symbolsabAmbient air
ρMass density, kg·m−3cWater pipe
εThe energy-saving rateinsThermal insulation layer
λHeat conductivity factor. W/(m.°C)idIndoor set
αHeat transfer coefficient, W/(m2·°C−1)pPlaster layer

References

  1. Chen, X.; Vand, B.; Baldi, S. Challenges and strategies for achieving high energy efficiency in building districts. Buildings 2024, 14, 1839. [Google Scholar] [CrossRef]
  2. GB 50189-2015; Building Energy Efficiency Design Standard. Architecture & Building Press: Beijing, China, 2015. (In Chinese)
  3. Zhang, Y.; Hu, S.; Guo, F.; Mastrucci, A.; Zhang, S.; Yang, Z.; Yan, D. Assessing the potential of decarbonizing China’s building construction by 2060 and synergy with industry sector. J. Clean. Prod. 2022, 359, 132086. [Google Scholar] [CrossRef]
  4. Yang, Y.; Chen, S. Comprehensive investigation on dynamic energy performances of pipe-embedded enclosure structures with thermal anisotropic injection and diffusion features. Energy Convers. Manag. 2025, 343, 120261. [Google Scholar] [CrossRef]
  5. Yang, Y.; Chen, S. Thermal insulation solutions for opaque envelope of low-energy buildings: A systematic review of methods and applications. Renew. Sustain. Energy Rev. 2022, 167, 112738. [Google Scholar] [CrossRef]
  6. Zhao, H.; Wu, Y.; Jiang, G.; Zhong, M.; Sun, H.; Lin, B. Material and Structural Optimization of Novel Phase-Change Thermal Diode for Dynamic Building Envelope. Engineering, 2025; in press. [Google Scholar] [CrossRef]
  7. Chen, S.; Yang, Y.; Olomi, C.; Zhu, L. Numerical study on the winter thermal performance and energy saving potential of thermo-activated PCM composite wall in existing buildings. Build. Simul. 2020, 13, 237–256. [Google Scholar] [CrossRef]
  8. Dharmasastha, K.; Samuel, D.; Nagendra, S.; Maiya, M.P. Thermal comfort of a radiant cooling system in glass fiber reinforced gypsum roof-An experimental study. Appl. Therm. Eng. 2022, 214, 118842. [Google Scholar] [CrossRef]
  9. Jiang, S.; Li, X.; Lyu, W.; Wang, B.; Shi, W. Numerical investigation of the energy efficiency of a serial pipe-embedded external wall system considering water temperature changes in the pipeline. J. Build. Eng. 2020, 31, 101435. [Google Scholar] [CrossRef]
  10. Yang, Y.; Chen, S.; Zhang, J. A comprehensive study on transient thermal behaviors and performances of the modular pipe-embedded energy wall system under intermittent operation conditions. Energy 2023, 280, 128083. [Google Scholar] [CrossRef]
  11. Karanafti, A.; Theodosiou, T.; Tsikaloudaki, K. Assessment of buildings’ dynamic thermal insulation technologies—A review. Appl. Energy 2022, 326, 119985. [Google Scholar] [CrossRef]
  12. Rajput, M.; Reisi Gahrooei, M.; Augenbroe, G. A statistical model of the spatial variability of weather for use in building simulation practice. Build. Environ. 2021, 206, 108331. [Google Scholar] [CrossRef]
  13. Wu, H.; Qiu, D.; Zhang, L.; Sun, M. Adaptive multi-agent reinforcement learning for flexible resource management in a virtual power plant with dynamic participating multi-energy buildings. Appl. Energy 2024, 374, 123998. [Google Scholar] [CrossRef]
  14. Zhao, X.; Zhang, Z.; Li, W. Performance analysis of TABS in retrofitting buildings in cold and arid regions. J. Build. Perform. 2021, 12, 1402. [Google Scholar] [CrossRef]
  15. Zhao, Y.; Li, X. Energy efficiency and economic performance of a low-temperature heating system combining double-layer pipe-embedded wall and ground source heat pump. Renew. Energy 2025, 239, 122087. [Google Scholar] [CrossRef]
  16. Chen, Y.; Sun, Y.; Yang, J.; Liu, Y.; Gao, D.-C. Demand response with PCM-based pipe-embedded wall in commercial buildings: Combined passive and active energy storage in envelopes. Energy 2024, 308, 132980. [Google Scholar] [CrossRef]
  17. Arroyo, J.; Spiessens, F.; Helsen, L. Comparison of Model Complexities in Optimal Control Tested in a Real Thermally Activated Building System. Buildings 2022, 12, 539. [Google Scholar] [CrossRef]
  18. Yang, Y.; Chen, S.; Chang, T.X.; Ma, J.; Sun, Y. Uncertainty and global sensitivity analysis on thermal performances of pipe embedded building envelope in the heating season. Energy Convers. Manag. 2021, 244, 114509. [Google Scholar] [CrossRef]
  19. Jung, S.; Yoon, Y.; Im, P.; Salonvaara, M.; Dong, J.; Cui, B.; Lapsa, M. Peak cooling load shift capability of a thermal energy storage system integrated with an active insulation system in US climate zones. Energy Build. 2022, 277, 112484. [Google Scholar] [CrossRef]
  20. Atkins, C.; Hun, D.; Im, P.; Post, B.; Slattery, B.; Iffa, E.; Cui, B.; Dong, J.; Barnes, A.; Vaughan, J.; et al. Empower Wall: Active insulation system leveraging additive manufacturing and model predictive control. Energy Convers. Manag. 2022, 266, 115823. [Google Scholar] [CrossRef]
  21. Hwang, Y.; Wasti, A.; Borca-Tasciuc, T.; Shultz, J.; Vanfretti, L.; Tsamis, A. Modeling, Simulation and evaluation of a double-sided hydronic layer embedded opaque climate-adaptive building envelope. In Proceedings of the Building Performance Analysis Conference and SimBuild, Chicago, IL, USA, 14–16 September 2022. [Google Scholar] [CrossRef]
  22. GB/T 50378-2024; Green Building Evaluation Standard. Architecture & Building Press: Beijing, China, 2024. (In Chinese)
  23. Zhu, L.; Yang, Y.; Chen, S.; Sun, Y. Numerical study on the thermal performance of lightweight temporary building integrated with phase change materials. Appl. Therm. Eng. 2018, 138, 35–47. [Google Scholar] [CrossRef]
  24. DB13(J)185-2020; Energy-Saving Design Standards for Residential Buildings (Energy Saving 75 %). China Architecture & Building Press: Beijing, China, 2020. (In Chinese)
  25. Yan, Y.; Chen, S. Global sensitivity analysis on thermal performances of pipe-embedded thermo-activated composite wall. Acta Energiae Solaris Sin. 2023, 44, 248–255. (In Chinese) [Google Scholar]
Figure 1. Temperature and heat flux distribution profiles of TACP in different operation modes in winter.
Buildings 15 03763 g001
Figure 2. Profiles of two-dimensional geometric structure and model size: (a) non-insulated walls; (b) conventional insulated energy-saving wall; (c) external insulation with externally embedded pipes; (d) external insulation with internally embedded pipes; (e) internal insulation with internally embedded pipes.
Buildings 15 03763 g002
Figure 3. Meshing method of TACP wall profiles and meshing results of 5 different wall configurations.
Buildings 15 03763 g003
Figure 4. (a) Variation in outdoor meteorological parameters over time for typical cities in three climatic regions of Gansu Province in January; (b) Hourly average values of outdoor composite temperature and external surface heat transfer coefficient.
Buildings 15 03763 g004
Figure 5. The variation in the exterior surface temperature of the EI-TACP wall over time under the same configuration scheme in different climate zones.
Buildings 15 03763 g005
Figure 6. The heat flux variation at the exterior surface and the pipe-embedded surface of the EI-wall over time under the same configuration scheme in different climate zones.
Buildings 15 03763 g006
Figure 7. The variation in the interior surface temperature of the EI-TACP wall over time under the same configuration scheme in different climate zones.
Buildings 15 03763 g007
Figure 8. The heat flux variation at the interior surface of the EI-wall over time under the same configuration scheme in different climate zones.
Buildings 15 03763 g008
Figure 9. Variation in interior surface temperature among EE-TACP, EI-TACP, II-TACP, NI-wall, and CE-wall under varying inlet temperatures and insulation thicknesses in the severe cold climate zones.
Buildings 15 03763 g009
Figure 10. Cumulative heat load at the interior surface among EE-TACP, EI-TACP, II-TACP, NI-wall, and CE-wall under varying inlet temperatures and insulation thicknesses in the severe cold climate zones.
Buildings 15 03763 g010
Figure 11. Variation in interior surface temperature among EE-TACP, EI-TACP, II-TACP, NI-wall, and CE-wall under varying inlet temperatures and insulation thicknesses in the cold climate zones.
Buildings 15 03763 g011
Figure 12. Cumulative heat load at the interior surface among EE-TACP, EI-TACP, II-TACP, NI-wall, and CE-wall under varying inlet temperatures and insulation thicknesses in the cold climate zones.
Buildings 15 03763 g012
Figure 13. Variation in interior surface temperature among EE-TACP, EI-TACP, II-TACP, NI-wall, and CE-wall under varying inlet temperatures and insulation thicknesses in the hot summer–cold winter climate zones.
Buildings 15 03763 g013
Figure 14. Cumulative heat load at the interior surface among EE-TACP, EI-TACP, II-TACP, NI-wall, and CE-wall under varying inlet temperatures and insulation thicknesses in the hot summer–cold winter climate zones.
Buildings 15 03763 g014
Figure 15. Energy-saving potential (ε) of different TACP wall configurations under different inlet temperatures and insulation thicknesses compared to NI-wall and CE-wall in severe cold climate zones, Jiuquan City.
Buildings 15 03763 g015
Figure 16. Energy-saving rate (ε) of different TACP-wall configurations under different inlet temperatures and insulation thicknesses compared to NI-wall and CE-wall in cold climate zones, Lanzhou City.
Buildings 15 03763 g016
Figure 17. Energy-saving rate (ε) of different TACP-wall configurations under different inlet temperatures and insulation thicknesses compared to NI-wall and CE-wall in hot summer–cold winter climate zones, Wudu City.
Buildings 15 03763 g017
Table 1. Geometric parameters and thermal properties of TABS and two reference walls.
ReferenceLayerMaterialSize (mm)Density (Kg·m−3)Cp
(J·kg−1·°C−1)
Thermal Conductivity (W·m−1·°C−1)
[16,17]Plaster
layers
Brick20140010500.58
[18]Thermal
insulation
XPSvariable3013800.042
[19]Embedded pipePPRdiameter 16, spacing 150900185.2050.21
[20]Structure layerKP1 Clay Brick370/24014001062.30.58
[21]Thermal greaseLaird Tflex 600/270016003.5
Table 2. The variable range and default values adopted under different TACP configurations.
TACP
Configurations
Insulation Thickness (mm)Climate Zones/Typical CityInlet Temperature
(°C)
Inlet Velocity
(m/s)
external insulation with externally embedded pipes60 80 100 120severe cold climate zones, Jiuquan city 24,
28,
32,
36
0.5
40 60 80 100cold climate zones, Lanzhou city
30 40 55 70hot summer–cold winter climate zones, Wudu city
external insulation with internally embedded pipes60 80 100 120severe cold climate zones, Jiuquan city
40 60 80 100cold climate zones, Lanzhou city
30 40 55 70hot summer–cold winter climate zones, Wudu city
internal insulation with internally embedded pipes60 80 100 120severe cold climate zones, Jiuquan city
40 60 80 100cold climate zones, Lanzhou city
30 40 55 70hot summer–cold winter climate zones, Wudu city
Disclaimer/Publisher’s Note: The statements, opinions and data contained in all publications are solely those of the individual author(s) and contributor(s) and not of MDPI and/or the editor(s). MDPI and/or the editor(s) disclaim responsibility for any injury to people or property resulting from any ideas, methods, instructions or products referred to in the content.