Article

Impact of Facade Photovoltaic Retrofit on Building Carbon Emissions for Residential Buildings in Cold Regions

1
School of Human Settlements and Civil Engineering, Xi’an Jiaotong University, No. 28, Xianning West Road, Xi’an 710049, China
2
School of Economics and Finance, Xi’an Jiaotong University, No. 28, Xianning West Road, Xi’an 710049, China
3
XJTU-POLIMI Joint School, Xi’an Jiaotong University, No. 28, Xianning West Road, Xi’an 710049, China
4
School of Humanities and Social Sciences, Xi’an Jiaotong University, No. 28, Xianning West Road, Xi’an 710049, China
*
Author to whom correspondence should be addressed.
Buildings 2025, 15(20), 3762; https://doi.org/10.3390/buildings15203762
Submission received: 21 September 2025 / Revised: 14 October 2025 / Accepted: 15 October 2025 / Published: 18 October 2025

Abstract

China’s urbanisation has transitioned from an era of rapid, coarse expansion to one of refined and targeted development. In accordance with China’s “dual-carbon” strategy, the building sector—presently the third-largest source of domestic carbon emissions—is compelled to pursue emission optimisation in its forthcoming evolution. Photovoltaic-building technologies offer an effective response to this imperative. Within the context of accelerating high-rise residential construction, the architectural integration of scientifically configured photovoltaic façades has emerged as a critical challenge. Employing an integrated methodology of urban surveying and simulation, this study examines the façade characteristics of residential buildings in northern Chinese cities, selecting Xi’an as the representative case. Three PV-facade integration strategies for existing stock are presented: window retrofitting, wall retrofitting, and full-façade renovation. Utilising the EnergyPlus platform, the manuscript simulates the electrical demand profiles and clean-electricity generation of typical dwellings under varying photovoltaic materials and configuration schemes, while concurrently assessing economic performance. It demonstrates that a judicious determination of photovoltaic installation scale and layout strategy markedly amplifies energy-saving efficacy, diminishes aggregate energy consumption and carbon emissions, and simultaneously reduces the capital expenditure of photovoltaic systems. For multi-story buildings, a full façade retrofit yielded the highest annual electricity generation of 514,703.56 kWh and an annual carbon reduction of 15,521.50 kgCO2. For high-rise buildings, installing PV modules only above the 20th floor increased the effective generation ratio from 45.24% to 87.17%, while the carbon reduction efficiency per unit investment improved from 0.05 to 0.22 kgCO2/¥.

1. Introduction

1.1. Background

Amid the escalating global climate crisis and growing concerns over energy security, low-carbon transition has become a global consensus. The building sector is one of the key areas for carbon emission reduction, accounting for approximately 40% of global carbon emissions and 36% of energy consumption. In response, by 2023, over 60% of countries have pledged to achieve operational carbon neutrality for new buildings by 2030 and net-zero emissions for existing buildings by 2050 [1].
As the predominant urban building type by scale, residential buildings have become the focus of multiple strategies from architects and urban planners. These include upgrading energy efficiency standards, improving envelope performance, promoting retrofit of existing buildings, and developing prefabricated construction and low-carbon materials [2,3,4,5]. However, these traditional energy-saving approaches mainly target energy demand reduction and material optimization, and still fall short in addressing the high total energy use and low share of renewable energy during the operational phase of buildings.
Building photovoltaic retrofit, which involves integrating photovoltaic systems into building surfaces, effectively enhances the use of clean energy. When combined with passive energy-saving techniques, it can simultaneously reduce building energy demand and supply additional green electricity. Furthermore, photovoltaic facade design of building envelopes provides benefits such as shading and thermal insulation, achieving both energy conservation and power generation without increasing land use or spatial burden. As residential buildings become increasingly high-rise, the potential of photovoltaic facades to contribute to energy saving and carbon reduction is becoming more prominent.
Despite its advantages, the implementation of building photovoltaic retrofit still faces various challenges: insufficient integration between photovoltaic performance and architectural aesthetics or thermal performance [6]; high initial investment costs and long economic payback periods; and a lack of unified design standards and policy incentives [7]. Existing studies from mechanical, electrical, and material science perspectives have proposed technical pathways such as improving photovoltaic efficiency, enhancing structural safety, and optimizing system integration. However, these efforts mostly focus on component-level improvements, with insufficient attention to layout strategies in real-world architectural scenarios.
In architectural design and construction practice, where façades vary in form and orientation, performance improvement of components alone is not enough to guide low-carbon design. The layout strategy directly affects the power output efficiency and economic performance of building photovoltaic retrofit, ultimately determining its applicability and effectiveness in residential buildings.
To promote scientifically grounded photovoltaic facade design in residential buildings, three key design questions remain: 1. Where on the façade should PV panels be installed? 2. How many PV panels should be used? 3. What layout strategies are optimal?
These design decisions directly influence the energy efficiency and economic feasibility of photovoltaic systems and form the core bottleneck for moving from “technical possibility” to “design feasibility” in building photovoltaic retrofit.
This study takes Xi’an as the case city and focuses on the impact of controllable parameters in the photovoltaic facade design of representative residential buildings on carbon emissions. Based on simulations using the EnergyPlus platform, the study quantitatively analyzes how different PV installation patterns affect annual cooling and heating carbon emissions per unit area. Furthermore, it explores the economic implications of different façade design structures on HVAC electricity consumption, and the overall energy demand of buildings.
By proposing an integrated performance evaluation framework and optimized design strategies, this research provides quantitative guidance for building photovoltaic retrofit in various residential contexts. The results aim to enhance both the energy and economic performance of PV-integrated facades and offer actionable design principles for architects and construction teams in photovoltaic layout decision-making.

1.2. Literature Review

Building photovoltaic renovation technology integrates photovoltaic modules with building envelope components—such as roofs, façades, and windows—to simultaneously achieve energy generation and energy saving. As the global energy transition accelerates, photovoltaic envelope design for buildings has emerged as a research hotspot due to its potential to reduce building carbon emissions, improve energy self-sufficiency, and integrate architectural aesthetics. This section reviews current research progress from the perspectives of technological development, performance evaluation, application domains, challenges, and future directions.
Using databases such as Web of Science and CNKI, we searched for literature published between 2018 and 2024 with the following keywords: BIPV, photovoltaic façade, cold climate, PV degradation, economic viability, and low-carbon design.

1.2.1. Technological Development of Building Photovoltaic Renovation

As a key strategy for energy conservation and carbon reduction in buildings, building photovoltaic renovation has gained increasing global attention in recent years. With the advancement of carbon neutrality targets, this technology has transitioned from theoretical exploration to practical application and has become a critical pathway for the low-carbon transformation of the existing building stock.
In China, research focuses on practical engineering applications, emphasizing system integration, design methods, economic evaluation, and climate-adaptive optimization. The functionality of building-integrated photovoltaic systems has evolved from single-purpose power generation to multifunctional systems, involving material innovation, intelligent control, and life cycle assessment. In terms of materials, monocrystalline silicon remains dominant due to its high efficiency, while thin-film PV technologies such as perovskite—featuring transparency and flexibility—are gradually applied to façades and windows [8]. Design-wise, researchers advocate for multi-dimensional integration strategies based on building types (e.g., public buildings, rural houses, university campuses), highlighting the synergy between advanced digital design tools (e.g., BIM, parametric modeling) and system integration to optimize performance and ensure feasibility [9,10].
Parametric modeling and simulation tools (e.g., Rhino + Grasshopper + EnergyPlus) have been widely adopted in domestic public projects. Fine-tuned designs have proven to significantly enhance photovoltaic efficiency and reduce energy consumption. For example, parametric design at the Guangzhou Art Museum improved façade PV efficiency by 15% [11]. In residential and rural buildings, climate-based design optimization is emphasized, where key parameters such as orientation, tilt angle, and window-to-wall ratio must be adapted to local conditions to achieve both energy-saving and energy-generating goals [12]. In university buildings, A study conducted a technical and economic analysis of rooftop photovoltaic systems at three universities located in different solar regions in China. The results indicate that universities situated in areas with abundant solar resources demonstrate better economic feasibility when installing photovoltaic systems. Among them, the investment payback periods for the rooftop photovoltaic systems at Tibet University, Qinghai University, and Qilu University of Technology under the “fully self-used” mode were 1 year, 6–8 years, and 5–8 years respectively. verifying the economic feasibility of building photovoltaic renovation in educational facilities [9].
Empirical studies confirm the significant energy-saving potential and financial viability of building photovoltaic renovation. However, comprehensive economic analyses—such as life cycle cost and static payback time—remain essential to its large-scale adoption [3].
Modular photovoltaic systems are gaining momentum in China due to their high integration, simplified installation, low maintenance, and climate adaptability. In particular, in cold regions, PV/T (photovoltaic-thermal) modular systems that combine heat pumps have been shown to greatly enhance system efficiency by addressing both electricity and thermal demands [13].
Climate-adaptive design has become a core concern in photovoltaic envelope design for buildings. In hot-summer, warm-winter regions, dynamic shading strategies—such as angle-adjustable PV shading panels—can reduce cooling loads by 10–25% [14]. In tropical climates, The CdTe-based double-layer ventilated curtain wall design demonstrates superior performance in tropical climates, particularly during the cooling season (April to October), effectively reducing cooling load by up to 30% through increased ventilation chamber depth [12]. In severe cold climates, improving insulation and implementing heat recovery are essential. Wang studied a PV/T coupled multi-source heat pump heating system that incorporates phase-change energy storage. The application of this system in cold regions of China demonstrates that compared to traditional gas boiler systems, it can reduce energy consumption by 56% and operating costs by 27.7% [15]. Thus, region-specific dynamic control strategies are key to optimizing photovoltaic renovation performance.
Beyond performance, building photovoltaic renovation must also consider architectural aesthetics and function. Studies on high-rise office façades show that PV module color, texture, and installation configuration significantly affect visual quality. Advances in colored PV technologies have provided new opportunities for aesthetic integration. For instance, the Victory Tower project applied colored PV with digital design methods to achieve both energy efficiency and visual appeal [3,7].
On the policy level, Shenzhen’s first batch of pilot projects for building photovoltaic renovation launched in 2024 with a total installed capacity exceeding 14 MW, covering ultra-low-energy and net-zero buildings—demonstrating the critical role of policy in driving technology adoption.
International research places greater emphasis on innovation and system optimization, focusing on materials, algorithms, and multi-objective performance improvements. For instance, PDMS/ITO/PET spectral-selective films have been developed for PV skylights; experiments show they can reduce indoor temperatures by 4.7 °C, lower annual solar heat gain by 18.3%, and only reduce PV efficiency by 9% [16]. On the intelligent systems front, Gholamian used their hybrid-solar system as a two-way grid-connected system where surplus energy can be sold and electricity can be bought from the grid when the energy generated is not enough to meet the building demand. Such a transformation could transform existing urban communities into positive energy zones that rely less on the grid and make them self-sufficient [17]. In cross-disciplinary research, Aseel used the random forest algorithm to effectively predict the energy performance of building envelopes, helping to reduce energy consumption, thereby reducing costs and carbon emissions [18].

1.2.2. Performance Evaluation and Technical Application of Photovoltaic Renovation for Facades

The performance evaluation of building-integrated photovoltaic renovation primarily includes three aspects: energy performance, thermal environment performance, and economic and environmental benefits.
In terms of energy performance, the core focus lies in optimizing both power generation efficiency and energy consumption within the building envelope PV design. Empirical studies have shown that well-designed PV facades can significantly reduce building cooling/heating loads—by up to 34.7%—and cover 15% to 106% of the building’s electricity demand [19]. Salameh simulated and compared the annual electricity consumption of two commercial buildings in Sharjah, UAE (with or without PV curtain walls) through PVSYST software 6.7. After optimizing the building orientation, solar radiation, weather and wind cooling conditions, it was found that the building with BIPV curtain wall could save 27.69% energy [20].
Regarding thermal environment performance, key factors include the shading, insulation, ventilation, and heat dissipation features of the PV-integrated façade. Studies demonstrate that PV shading systems can effectively reduce indoor temperatures during summer and lower air conditioning energy use. A well-ventilated design reduces the operating temperature of PV modules, enhancing generation efficiency. For example, The research of Han shows that compared with the traditional transparent glass curtain wall, the ventilated double-sided photovoltaic curtain wall can significantly reduce the indoor temperature [21]. The research of Wu [12] found that in the humid subtropical climate, the naturally ventilated photovoltaic double-layer curtain wall can effectively reduce the operating temperature of photovoltaic modules, thus improving the power generation efficiency.
Numerous studies have confirmed that façade PV is already profitable. IEA data show retrofits in sunny regions pay back in 6.8 ± 1.9 years [22], and a university case study achieved 7.2 years-one-third of the 25-year module life-with an IRR of 12.4% [23,24]. Emitting 50 kg CO2eq·m−2 less over the lifetime [25], such retrofits could deliver 7–9% of buildings’ share of the global carbon budget [26], turning envelopes into carbon-neutral assets.
Building photovoltaic renovation has been widely applied in public buildings and urban renewal, residential and rural architecture, and special emerging scenarios.
In public building renovation, for instance, the Kaixuan Building in Dalian, China, adopted a colored PV facade retrofit, achieving a carbon reduction intensity of 48.6 kgCO2/m2·a while improving its aesthetic value by 32% [27]. In Singapore, a double-layer PV/T curtain wall system applied in tropical buildings achieved a 34% reduction in cooling load and 106% net annual energy savings [28].
In the residential sector, Yang pointed out that in cold climates, The application of photovoltaic can significantly improve the thermal environment [13], indicating good suitability for cold climates. In Switzerland, PV façade renovations for residential buildings covered 52% of household electricity needs with a static payback period of only 6.3 years [3].
In Non-traditional sectors, Such as the preservation of historic buildings, some of the building photovoltaic renovation lend themselves optimally to solving the problems of energy efficiency in historical buildings. In addition, the laminating technology developed using nanotechnology allows the photovoltaic elements to be combined with traditional building materials (such as bricks, tiles and mortar) to reduce visual impact [29].

1.2.3. Challenges and Future Directions of Photovoltaic Facade Retrofitting for Building Envelopes

Despite the rapid development of photovoltaic (PV) technologies, challenges remain in improving the power conversion efficiency and durability of PV modules to meet the long-term demands of building facades. The integration of photovoltaic retrofitting into building envelopes also requires careful consideration of technical details, such as installation angles, shading effects, and ventilation strategies, to ensure optimal performance. Key technical bottlenecks include durability issues in humid and hot environments (efficiency degradation exceeding 4% per year [30]) and the complexity of system integration (e.g., electrical safety and compatibility with building structures).
Economic and market-related challenges are also significant. Although PV retrofitting systems offer considerable long-term benefits, their high initial investment cost remains a barrier to widespread adoption. The market acceptance and policy support for building-integrated photovoltaic retrofitting are therefore critical. It is necessary to enhance the competitiveness of PV retrofitting systems through governmental incentives and optimized financial models.
In the future, PV retrofitting for building envelopes will place greater emphasis on intelligent operation and dynamic control. With real-time monitoring and automated regulation, systems can be optimized for both energy production and thermal performance. The development of this field increasingly reflects interdisciplinary integration, combining knowledge from architecture, materials science, and energy engineering to foster innovation in photovoltaic retrofitting technologies.
Key future directions of development include: 1. Smart control systems, such as the application of digital twin technologies to enable real-time visualization, monitoring, and dynamic optimization of retrofitted PV systems [10]; 2. Advanced material applications, including organic photovoltaics (OPV) and flexible perovskite-based solutions, which offer greater design flexibility and higher system performance for retrofitted envelopes. Such as perovskite PV modules that have achieved power conversion efficiencies above 25% while reducing production costs by approximately 30% [31]; 3. Multi-objective optimization, integrating genetic algorithms (GA) with CFD simulations to balance energy generation, aesthetics, and thermal performance [32];
Photovoltaic facade retrofitting, in terms of both system integration and performance assessment, plays a crucial role in the building sector’s carbon reduction strategies. In recent years, research in this area has advanced considerably, reflecting both academic interest and practical potential. Studies have explored material properties, technical innovations, and possible applications while also identifying limitations and associated risks.
However, existing research often focuses on single performance metrics (e.g., electricity generation or thermal insulation) and lacks a systematic evaluation of the comprehensive performance of PV-retrofitted facades. To address this gap, this study proposes a “climate–design–performance” correlation model and develops a modular design framework for photovoltaic retrofitting of building facades. Taking Xi’an as a case study—where both cooling in summer and heating in winter are necessary—the study focuses on residential buildings, the most common building type in urban areas. It evaluates how different photovoltaic facade design strategies influence building carbon emissions and proposes a comprehensive performance evaluation method and design optimization strategy, providing a quantitative basis for the integration of photovoltaic retrofitting in residential architecture.

2. Methods

This manuscript follows the overall research approach of “identifying representative residential building spatial characteristics”—“establishing building energy consumption models”—“calculating operational carbon emissions of buildings”. The representative residential building spatial characteristics were obtained through field surveys. The energy consumption of different types of residential buildings was simulated using EnergyPlus, a simulation platform that has been widely recognized by scholars for its accuracy in building energy consumption calculations. Finally, the operational carbon emissions of buildings were calculated using the “standard coal method”.

2.1. Representative Spatial Model of Residential Buildings

2.1.1. Overview of Research Methods

To gain a comprehensive understanding of the spatial configurations and façade characteristics of representative residential buildings, this study employed the following research methods.
(1)
Zoning of the Study Area
As Shown in Figure 1, the selected study area covers the central urban districts of Xi’an. This area was chosen to reflect a diverse range of residential environments shaped by different historical periods and social strata. The entire area was divided into a grid of 12 by 16 cells, with each grid cell measuring approximately 1.5 km by 1.3 km. (Xi’an’s urban layout follows a grid-based road network that subdivides the city into distinct blocks; the selected scale roughly corresponds to four adjacent neighborhood blocks in Xi’an. To ensure that each grid contains residential buildings, the sampling did not strictly include every block but was adjusted based on residential presence.)
(2)
Selection of Representative Residential Buildings
Within each grid cell, the residential community with the highest number of residential buildings was selected for investigation. This selection criterion ensures the typicality and representativeness of the chosen communities, thereby better reflecting the dominant residential patterns of the area. We combined Baidu Maps with on-site surveys to extract building traits for every grid cell. First, field observation determined the predominant floor-plan type in each grid. Next, we identified the name of a representative residential compound, retrieved its street-view imagery from the online map, and recorded the façade colour and window-to-wall ratio (WWR) of its buildings. The most frequent colour and WWR observed were assigned as the façade type for that grid.
(3)
Survey of Building Plan Characteristics
The spatial layouts of the buildings within each selected residential community were observed and documented. These layouts were categorized into three main typologies: linear (bar-shaped), T-shaped, and point-block (tower-shaped) forms.
(3.1)
Linear (Bar-Shaped) Form
These buildings are typically arranged in straight lines, parallel to the surrounding environment and streets. This is one of the most traditional forms of residential architecture.
(3.2)
T-Shaped Form
Characterized by a distinctive structural configuration, T-shaped buildings are often used to make full use of irregular urban land parcels, offering greater visual access and green space.
(3.3)
Point-Block (Tower) Form
These structures are typically freestanding, surrounded by relatively large amounts of open space. They are often used in high-density or small urban sites.
(4)
Survey of South Façade Characteristics
The focus of the façade analysis was on the south-facing façade, specifically distinguishing between window-wall and curtain wall types. The south façade is the most critical surface for solar exposure and thus is the primary façade for Building-Integrated Photovoltaic applications. Its configuration directly influences both the building’s energy efficiency and daylighting performance.
(4.1)
Window-Wall Type
This façade design emphasizes the spatial distribution of windows and wall surfaces and is the most commonly used façade treatment in residential buildings.
(4.2)
Curtain Wall Type
Curtain wall façades typically consist of large areas of glass or other transparent materials, offering a clean, modern appearance. This approach is conducive to introducing natural light and enhancing visual aesthetics.

2.1.2. Representative Plan Typologies of Residential Buildings

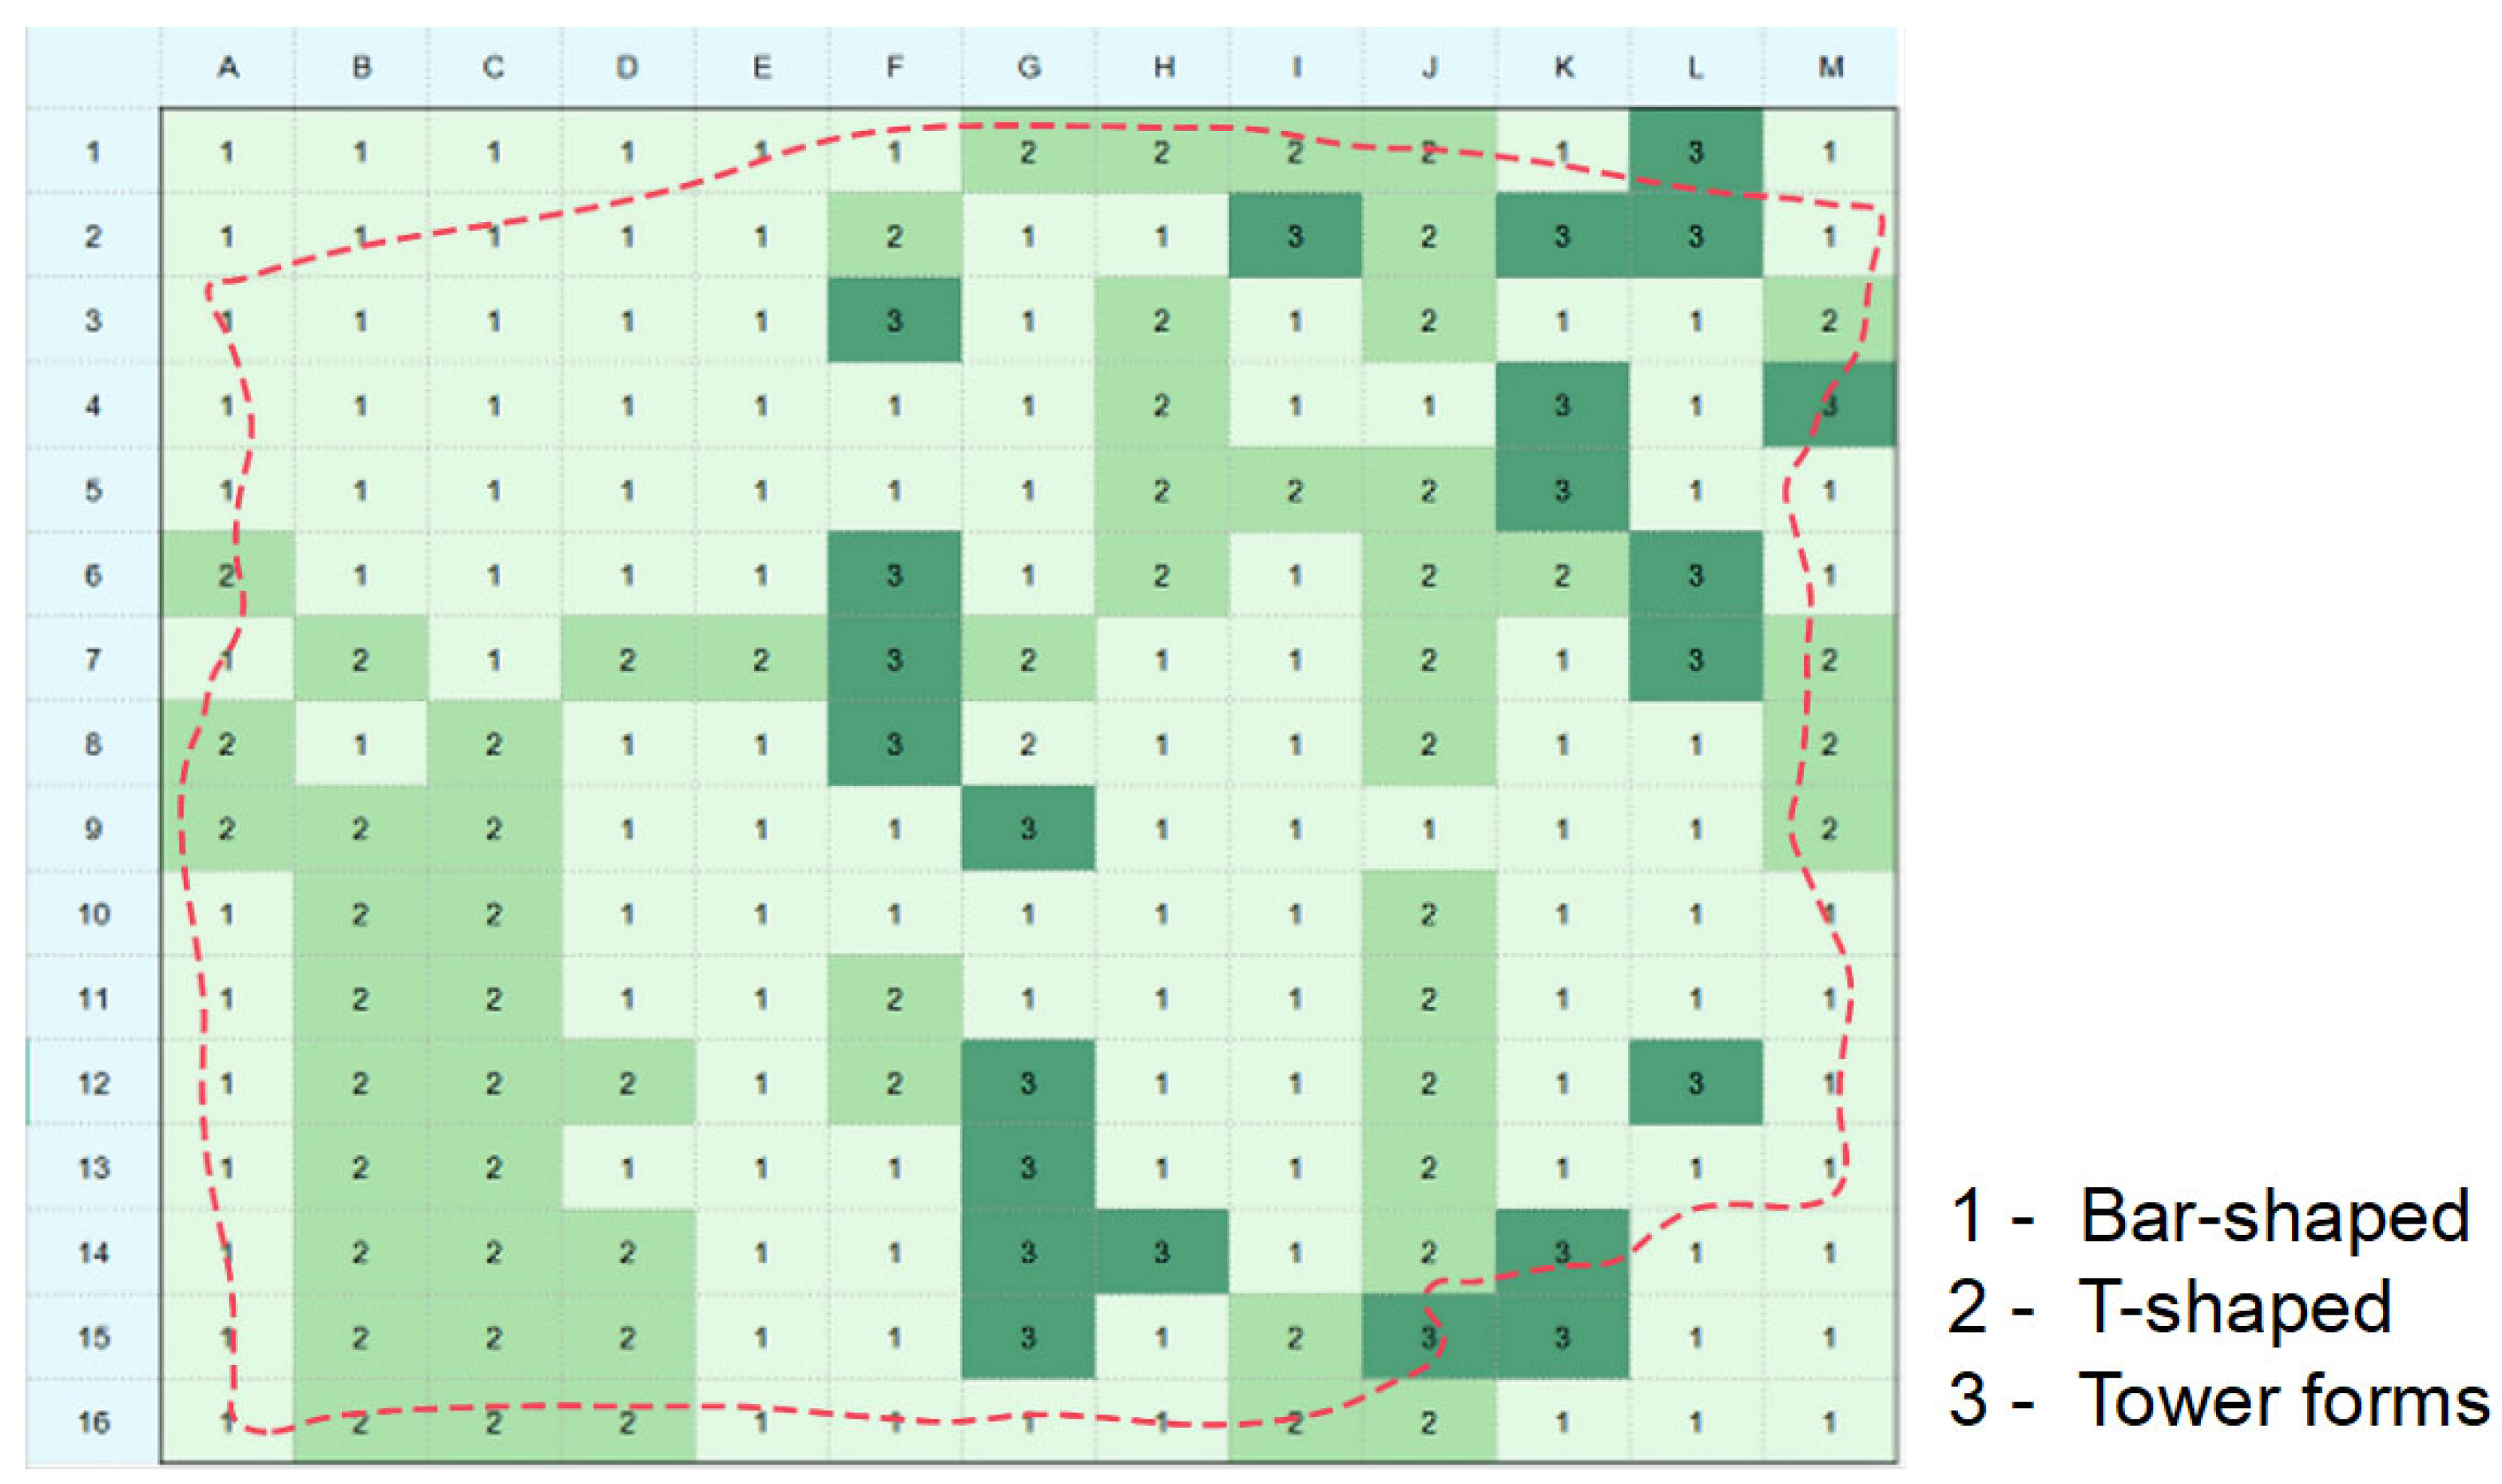
As shown in Figure 2, the plan configurations of residential buildings are categorized as follows: 1 represents linear (bar-shaped), 2 represents T-shaped, and 3 represents point-block (tower) forms.
The linear (bar-shaped) configuration is the most prevalent residential building form in Xi’an. This layout is well-suited to compact urban environments and efficiently accommodates dense city blocks (accounting for 60.57% of all grid cells). The T-shaped layout ranks second in prevalence and, compared to the linear type, is better adapted to irregular plots, offering greater access to natural light and enhanced spatial efficiency. Point-block (tower) buildings are the least common in the city and are typically deployed in small urban plots or high-density developments. Overall, the linear form exhibits the widest application and can be considered the most representative residential plan typology in Xi’an.

2.1.3. Representative Façade Typologies of Residential Buildings

As shown in Figure 3, façade types are classified as follows: 1 represents the window-wall type, and 2 represents the curtain wall type.
Window-wall façades dominate the residential building landscape in Xi’an, accounting for the vast majority of all grid cells (representing 95.67%). Characterized by the arrangement of multiple windows, this façade type ensures ample daylight access and clearly reflects the building’s functional and practical design logic.
The use of large-area curtain wall systems in residential buildings has emerged in recent years. However, with the slowdown of urbanization and the declining rate of new construction, the overall proportion of curtain wall residential buildings in the city remains relatively low.

2.1.4. Representative Façade Color Characteristics of Residential Buildings

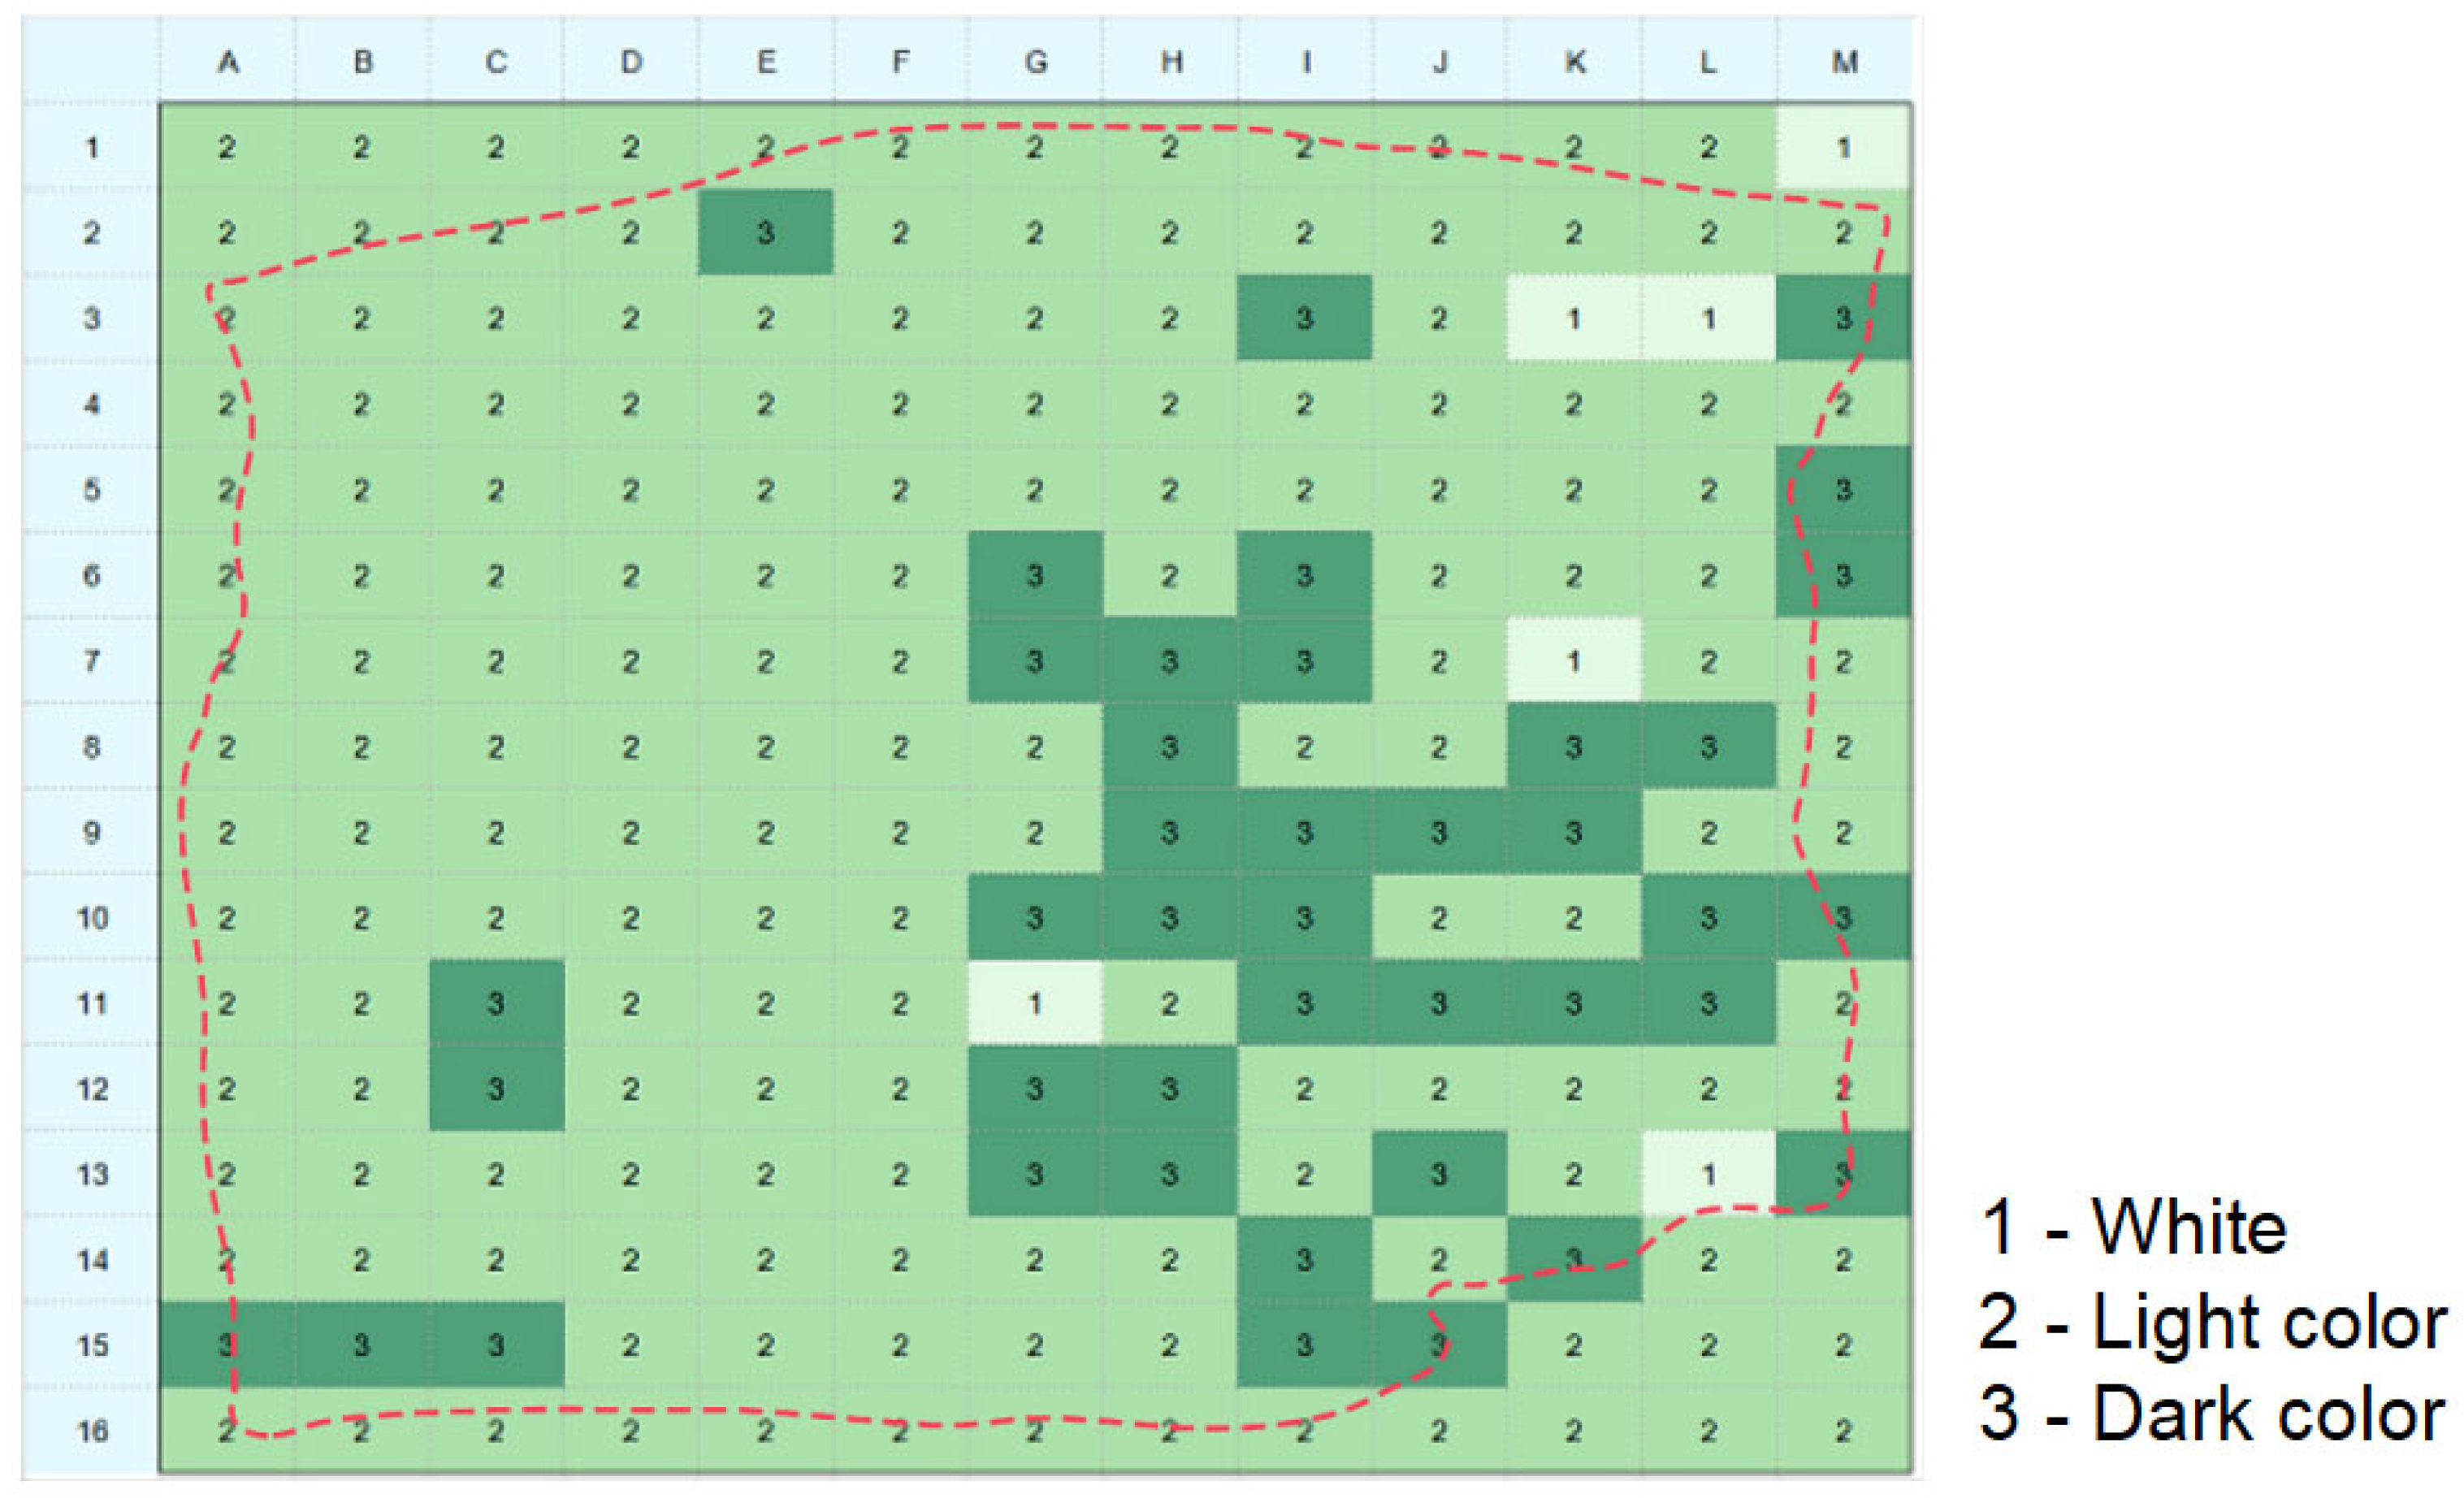
As shown in Figure 4, the façade colors of residential buildings in this study are categorized into four main groups: white, light colors (non-white), dark colors (non-black), and black. These color classifications reflect not only the characteristics of the materials used but also influence the façade’s absorption and reflection of solar radiation. In Figure 4, the codes are defined as follows: 1 represents white, 2 represents light color, 3 represents dark color, 4 represents black. It should be noted that no black façades were observed on any residential buildings across the entire city of Xi’an. Therefore, colour patch number 4 does not appear in the figure.
Light-colored façades are the dominant exterior color among residential buildings in Xi’an (representing 77.88%) This color trend suggests an urban planning preference for creating bright and spacious visual environments. Light-colored buildings reflect more sunlight during the day, thereby reducing solar heat gain and limiting the amount of heat absorbed by the building envelope.

2.2. Initialization of the Simulation Model

A variety of models and software are available for calculating indoor thermal loads in building performance simulations. In this study, EnergyPlus was selected to simulate and evaluate the performance of different photovoltaic façade design approaches. Developed jointly by Lawrence Berkeley National Laboratory (LBNL), the National Renewable Energy Laboratory (NREL), Oak Ridge National Laboratory (ORNL), and the Pacific Northwest National Laboratory (PNNL), EnergyPlus is a comprehensive building energy simulation tool capable of modeling cooling, heating, ventilation, lighting, carbon emissions, and economic costs over user-defined time periods.
This study is based on EnergyPlus version 22.1, and draws upon the findings of Section 2.1 to define the simulation parameters. A typical residential building with a linear (bar-shaped) layout, light-colored façade, and a window-to-wall ratio (WWR) of 0.4 was selected as the basic model. This building type represents the most common residential form in Xi’an, and thus has strong regional representativeness.
Two types of building models were constructed:
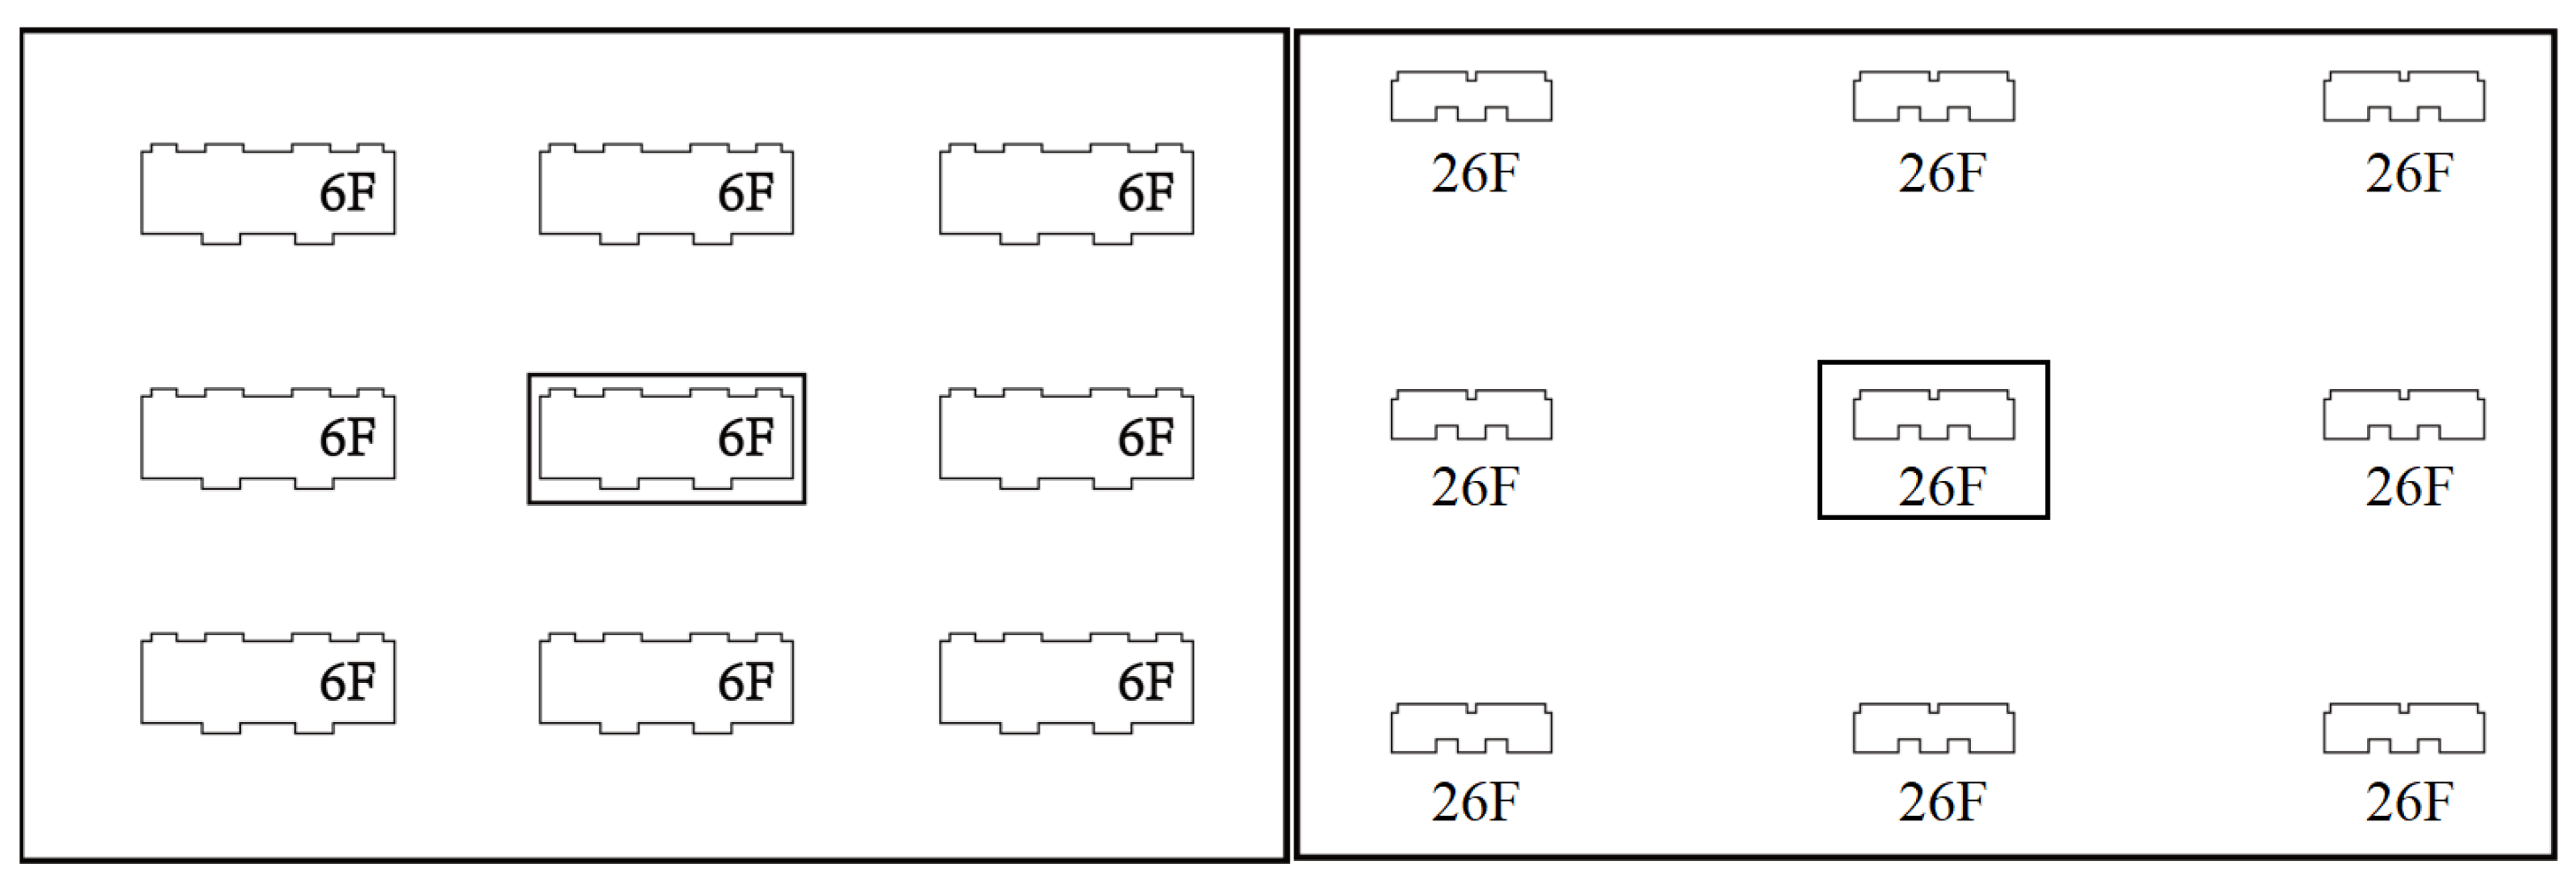
  • A low-rise building with 6 stories, a floor-to-floor height of 3 m, and plan dimensions of 9 m × 24 m.
  • A high-rise building with 26 stories, a floor height of 3 m, and plan dimensions of 13 m × 41 m.
Both building types were arranged in a 9 × 9 matrix configuration (as illustrated in Figure 5). The east–west spacing was set according to China’s GB500368-2005 [33] code for fire separation distances in low-rise and high-rise residential buildings—9 m for low-rise and 13 m for high-rise buildings. The north–south spacing was determined through simulation to meet minimum daylighting requirements, resulting in distances of 24 m and 94 m, respectively. The simulation was conducted on the central building in the matrix, whose south-facing façade was integrated with the photovoltaic façade system (The study focuses on the building highlighted within the box in Figure 5).
For the layout of facade photovoltaic, the setting method for the model is shown in Table 1.

2.3. Meteorological Data Settings

For climatic data, this study uses the Typical Meteorological Year (TMY) dataset for Xi’an with the simulation covering a full calendar year. The building’s annual energy consumption is estimated based on this representative dataset. TMY data do not represent actual weather records from a specific year but rather a set of statistically averaged values composed of 12 representative months. These months are selected by comparing monthly weather parameters over the past 10 years with the 30-year long-term average and choosing the months that most closely match the historical norms.
The meteorological parameters included in the simulation are: Atmospheric pressure, outdoor dry-bulb and wet-bulb temperatures, outdoor dew point temperature, wind speed, relative humidity, direct solar radiation and global (total) solar radiation.

2.4. Energy Consumption Calculation Settings

During the model setup, the thermal performance parameters for the building’s exterior walls and roof were configured according to the Chinese national building energy efficiency standard GB50189-2015 [34].
Specific parameter values for the building envelope and HVAC systems are detailed in Table 2, including: Thermal conductivity of walls specific heat capacity, simulation location coordinates, heating and cooling set points, coefficient of performance (COP) for cooling and thermal efficiency for heating systems.

2.5. Material and Envelope Parameters

During the model setup, the thermal performance parameters for the building’s exterior walls and roof were configured according to the Chinese national building energy efficiency standard GB50189-2015.
Two PV materials are examined: monocrystalline-silicon photovoltaic (c-Si) and thin-film photovoltaic. Opaque c-Si modules—typically dark blue or black—cannot be used in window areas, so semi-transparent thin-film photovoltaic is introduced for the window sections; their parameters follow the most common commercial CdTe products.
In the modeling of photovoltaic shading systems, a simplified computational approach was adopted, with the photovoltaic conversion efficiency assumed to be constant. The specific parameter settings used in the simulation are presented in Table 3.

3. Results

3.1. Effective Power Generation of Residential Buildings

Effective power generation refers to the amount of electricity that a power system can actually output and deliver to meet load demand within a specific time period. It is a key indicator for evaluating the power generation capacity and operational efficiency of the system. It reflects the usable electricity produced by the system, considering operational losses, equipment efficiency, environmental factors, and grid dispatching.
Considering the high cost of constructing large-scale energy storage systems, it is economically impractical to build such systems in residential buildings. Therefore, in this simulation, the ineffective portion of photovoltaic (PV) power generation that exceeds the building’s air conditioning, equipment, and lighting loads—and thus cannot be stored—is excluded. Only the hourly effective power generation is discussed.

3.1.1. Effective Power Generation of Low-Rise Buildings

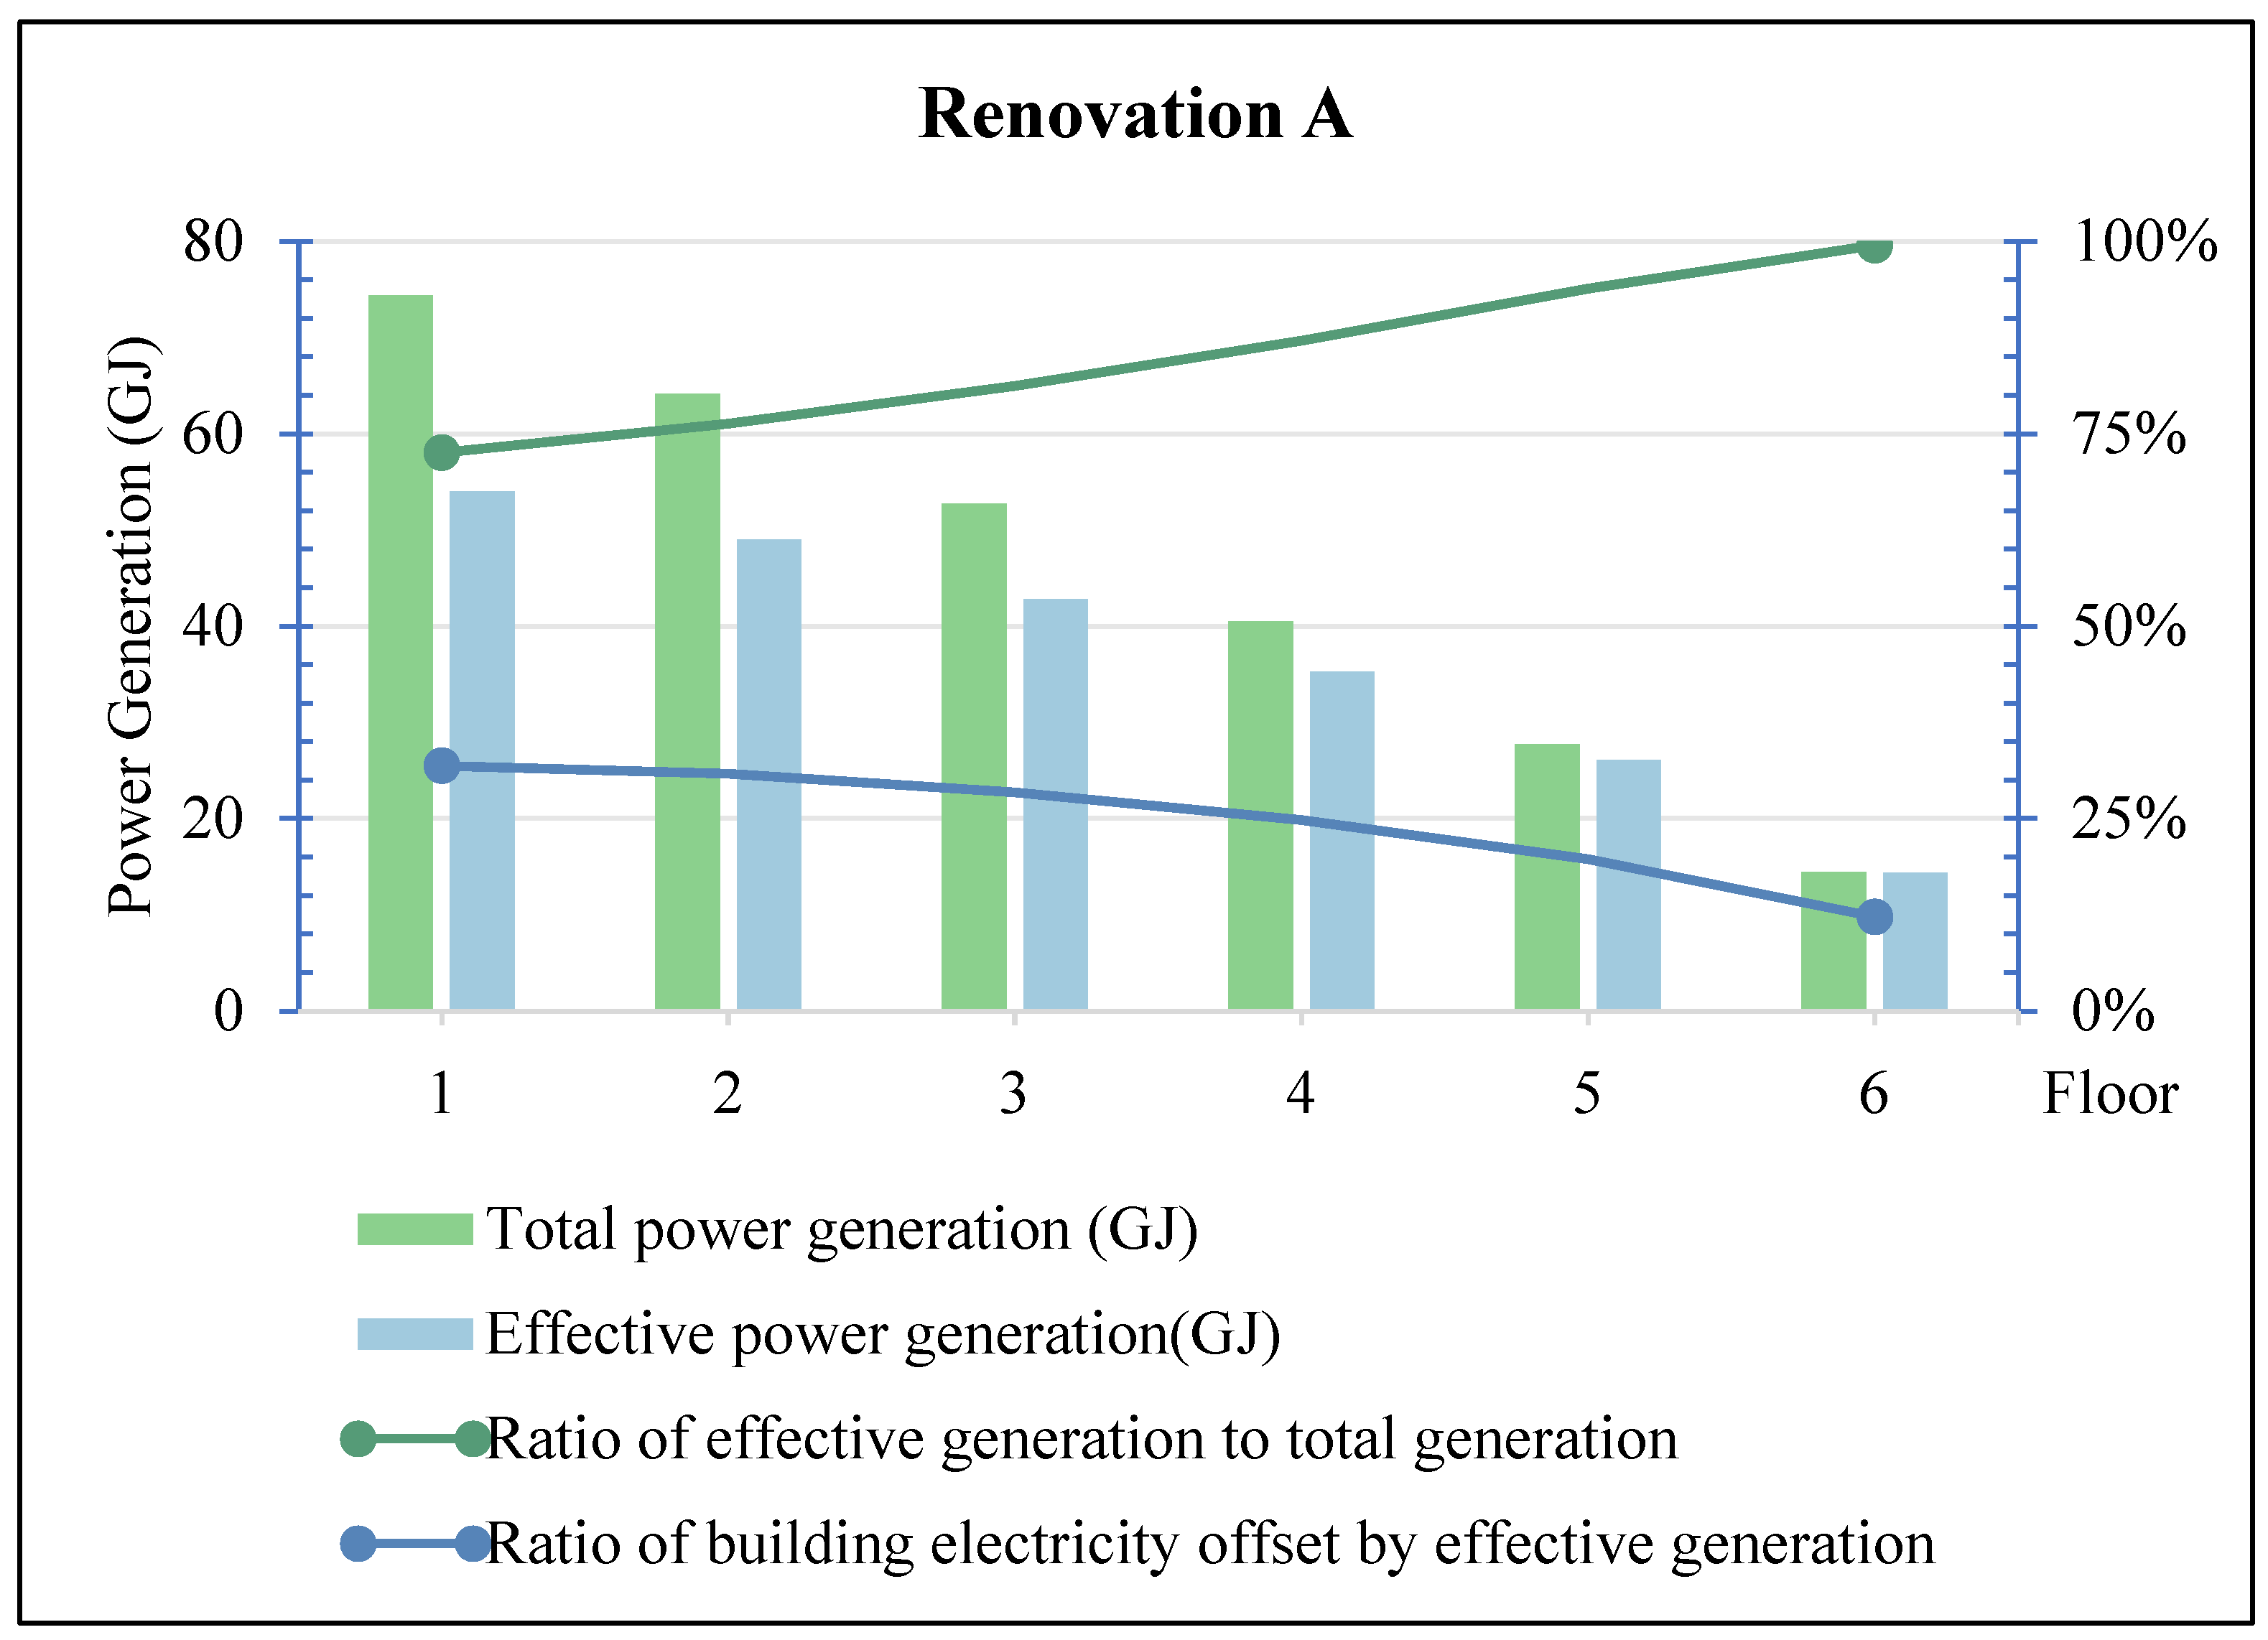
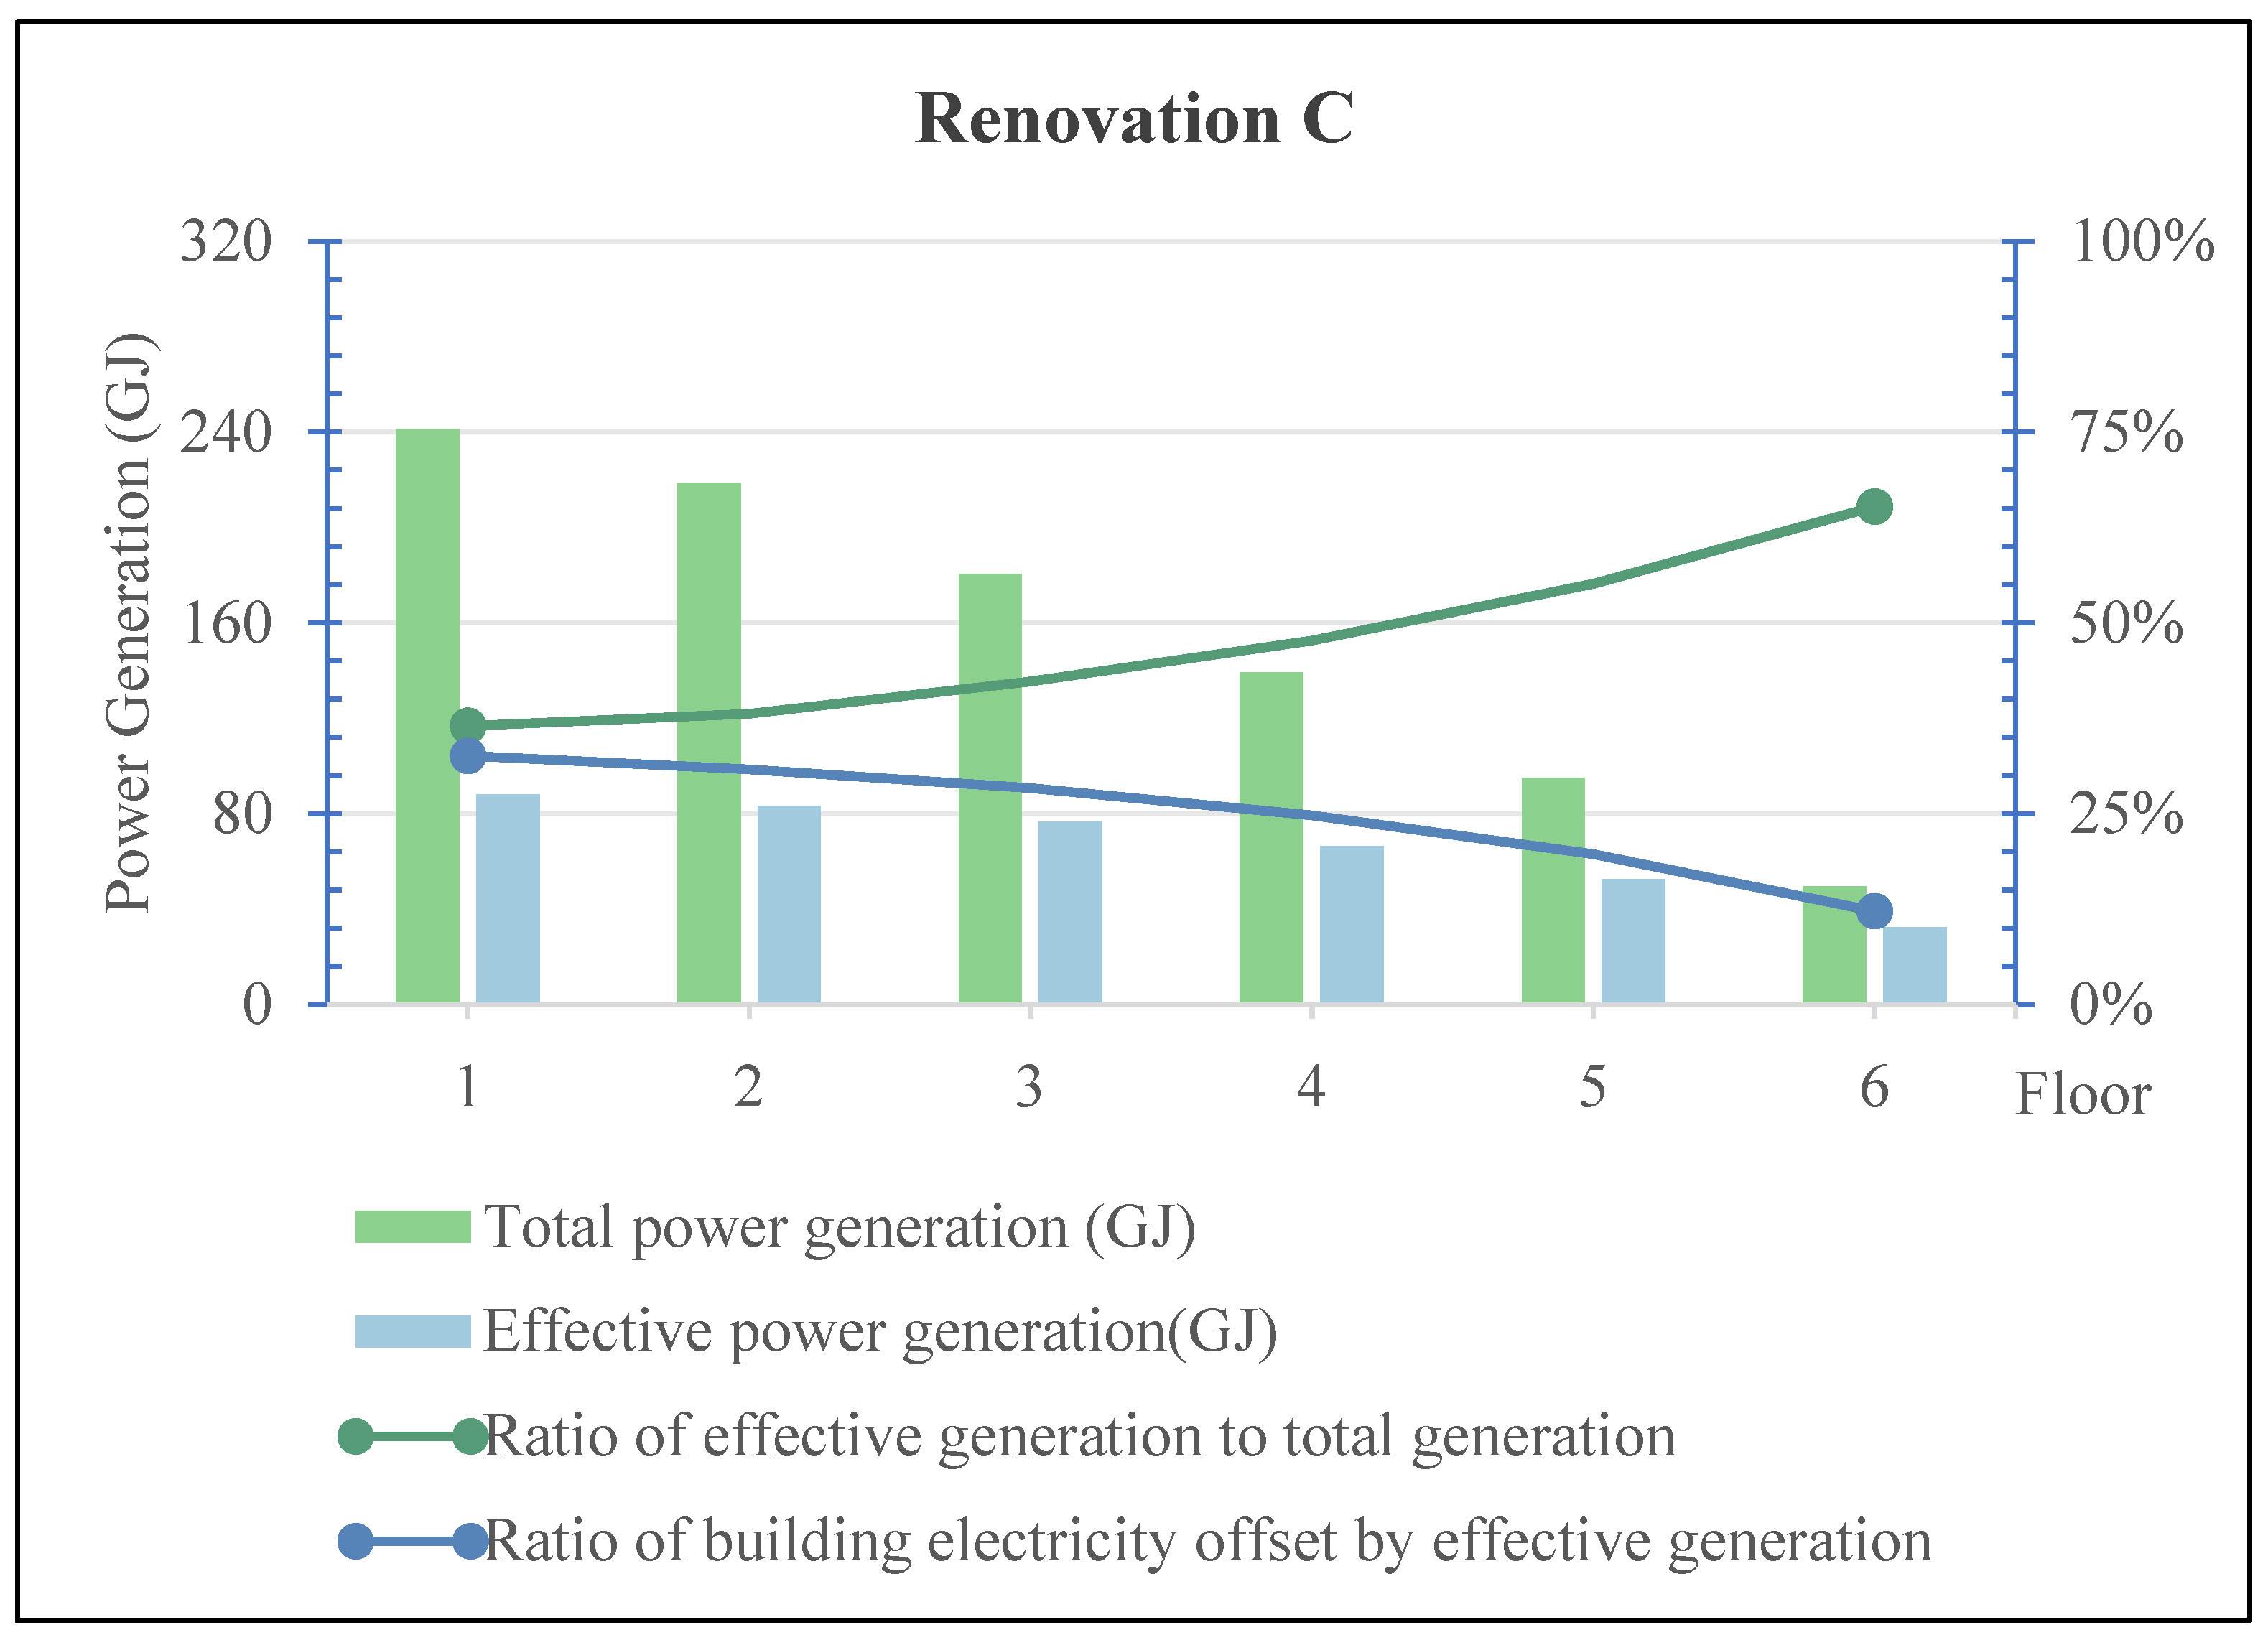
As shown in Figure 6, Figure 7 and Figure 8, the values “1, 2, 3, 4, 5, 6” represent “PV installed on every floor”, “no PV on the first floor”, “no PV on the first and second floors”, “no PV on the first to third floors” and so on, up to “no PV on the first to fifth floors”.
In the case of PV installation Method 1, as more floors omit PV installation, both total and effective power generation gradually decrease. However, the effective generation ratio increases significantly (from 72.57% to 99.52%). Nevertheless, the decline in total generation leads to a reduced building demand offset ratio, dropping from 31.79% to 12.25%.
For Method 2, the trend is similar: with fewer floors having PV panels, both total generation and effective generation decline, while the effective generation ratio increases—from 49.35% to 87.17%. The building demand offset ratio decreases from 31.33% to 11.66%. Method 3 combines elements of Methods 1 and 2. Its power generation characteristics are also similar to the first two: as PV devices on lower floors are removed, the effective generation ratio rises from 36.54% to 65.27%, while the building demand offset ratio drops from 32.61% to 12.25%.
Among the three installation methods, Method 3 performs best in terms of total generation due to its hybrid strategy—reaching a maximum of 241.38 GJ when PV is installed on all floors. In terms of effective generation, Method 3 also leads with 88.19 GJ, followed by Method 2 (82.41 GJ) and Method 1 (53.98 GJ). Though effective generation decreases with fewer PV-installed floors across all methods, Method 3 maintains a relatively high level.
For the effective generation ratio, Method 1 shows the highest value (72.57%), which increases steadily as PV is removed from lower floors. In comparison, Methods 2 and 3 have lower starting ratios of 49.35% and 36.54%, respectively.
Regarding the building demand offset ratio, the three methods present similar values and declining trends: 31.90% for Method 1, 31.33% for Method 2, and 32.61% for Method 3, all gradually decreasing as fewer floors are equipped with PV panels.

3.1.2. Effective Power Generation in High-Rise Buildings

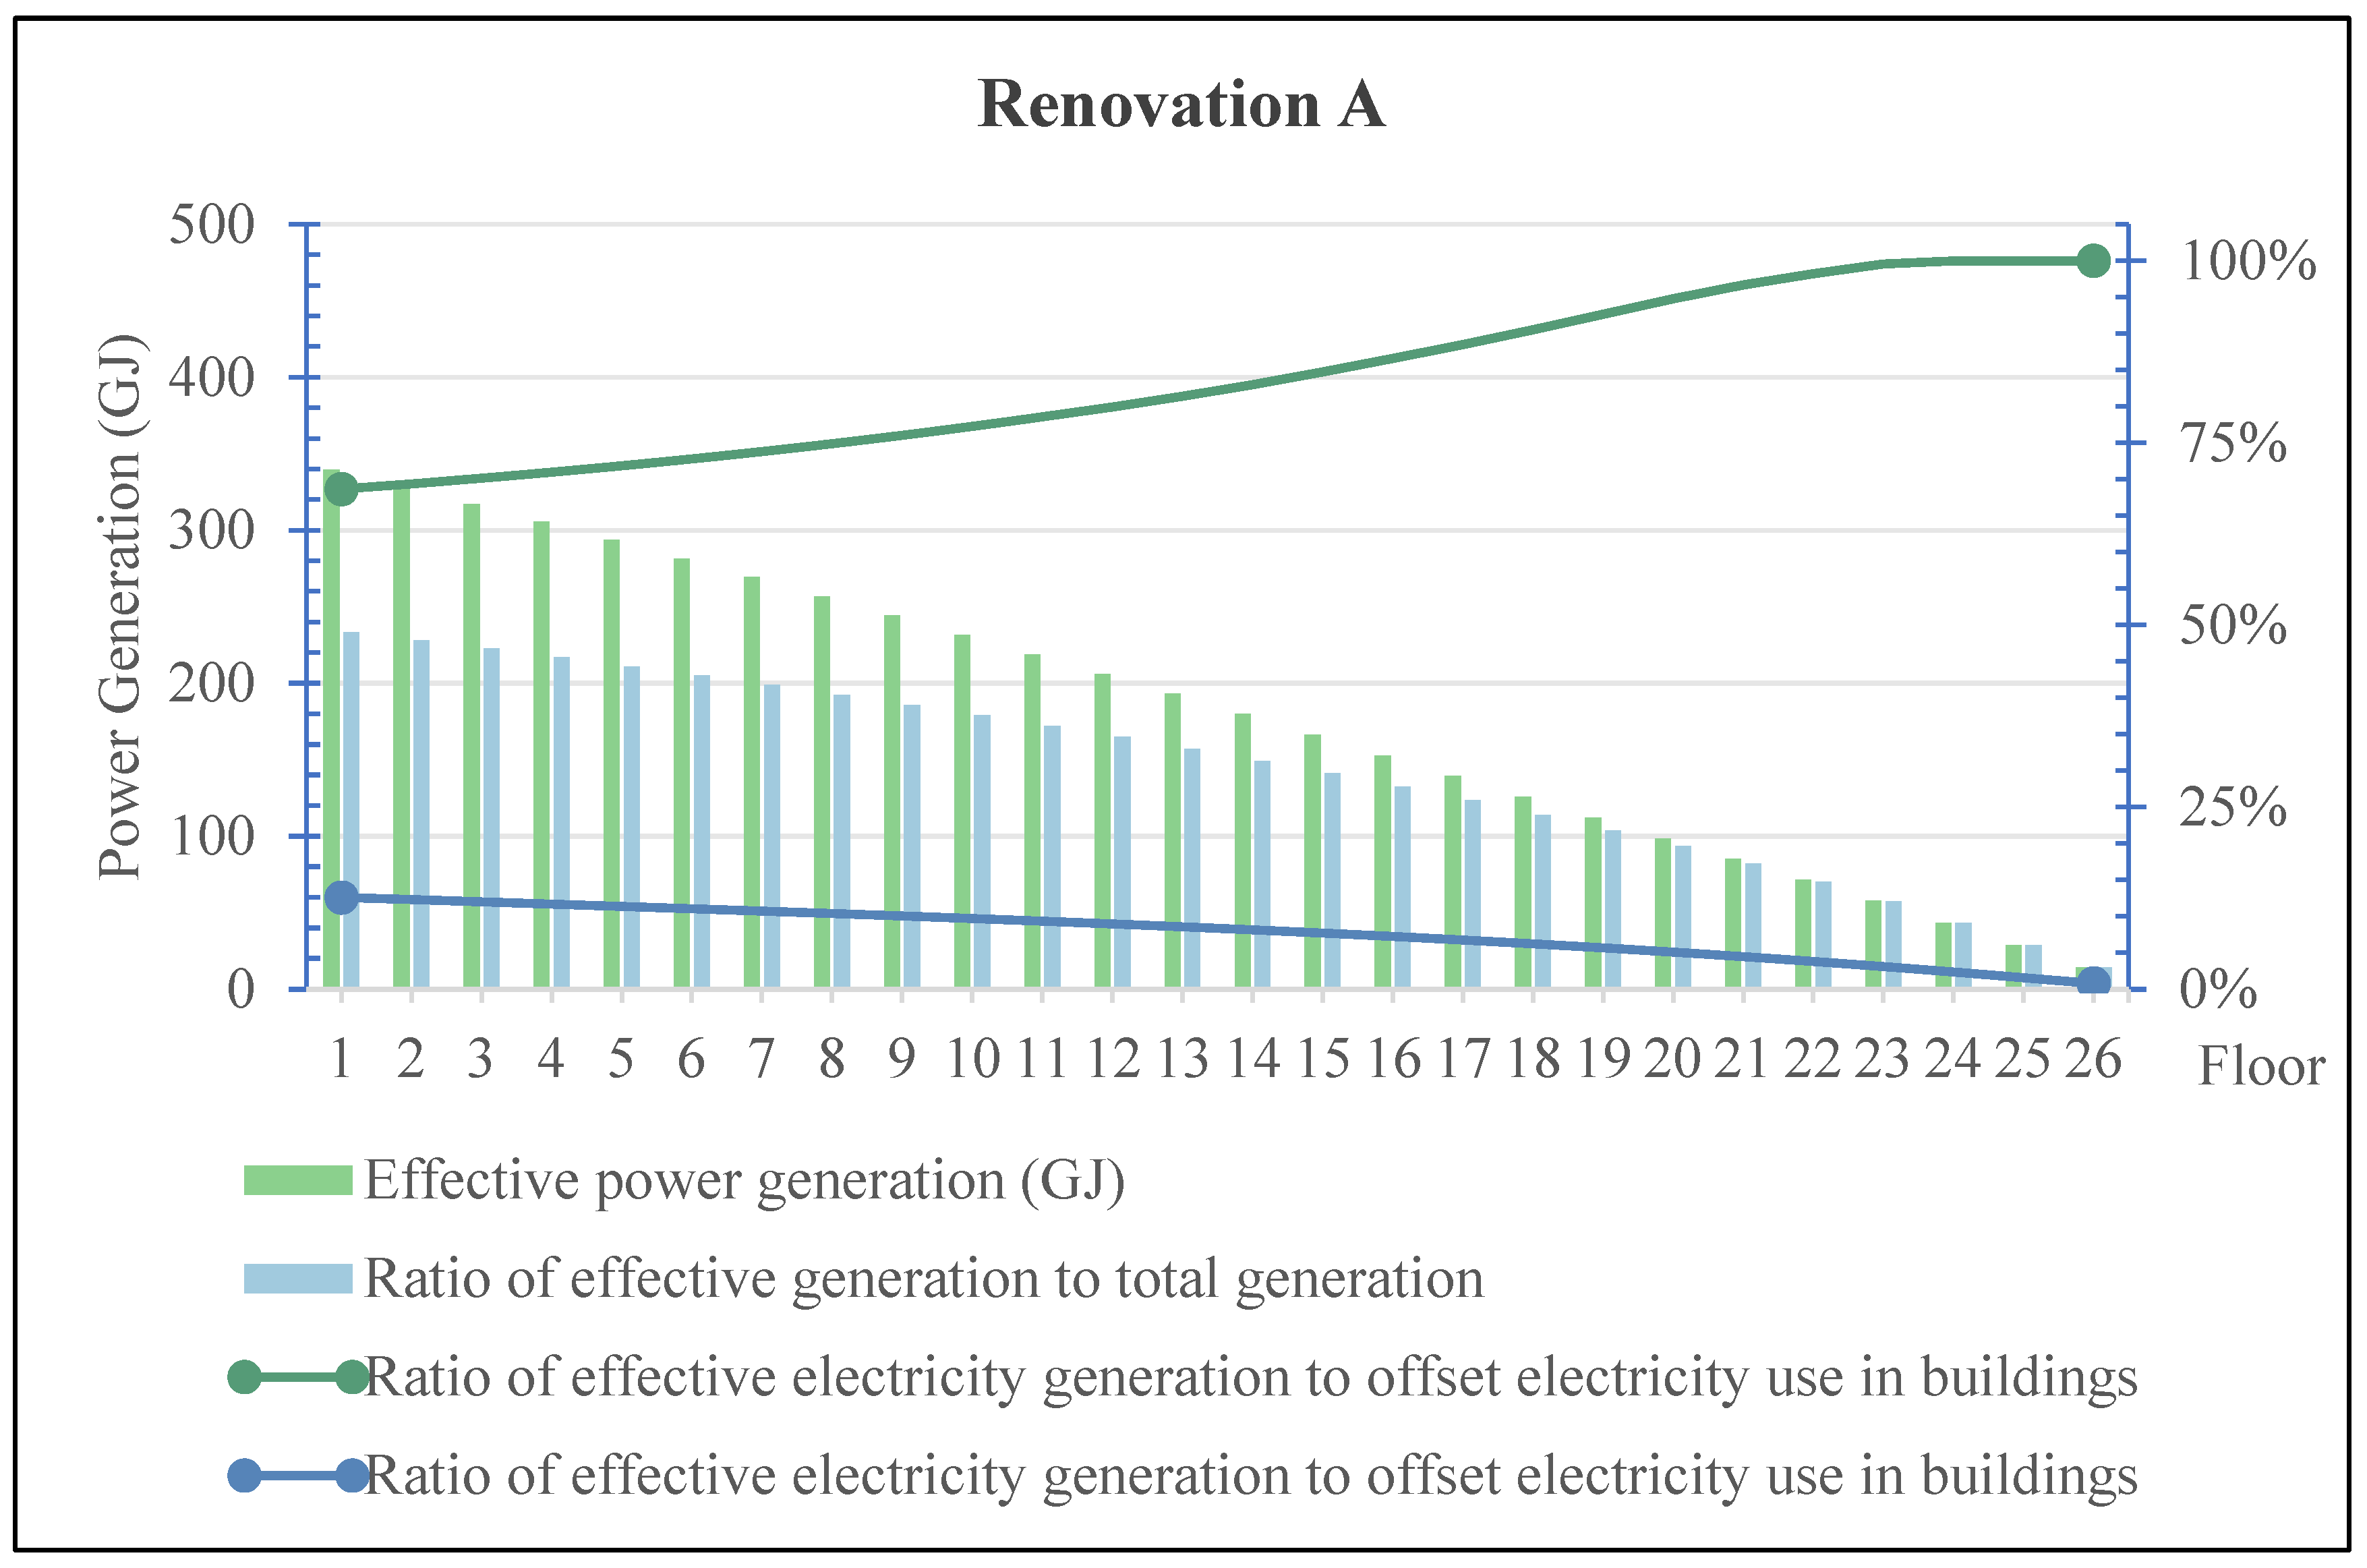
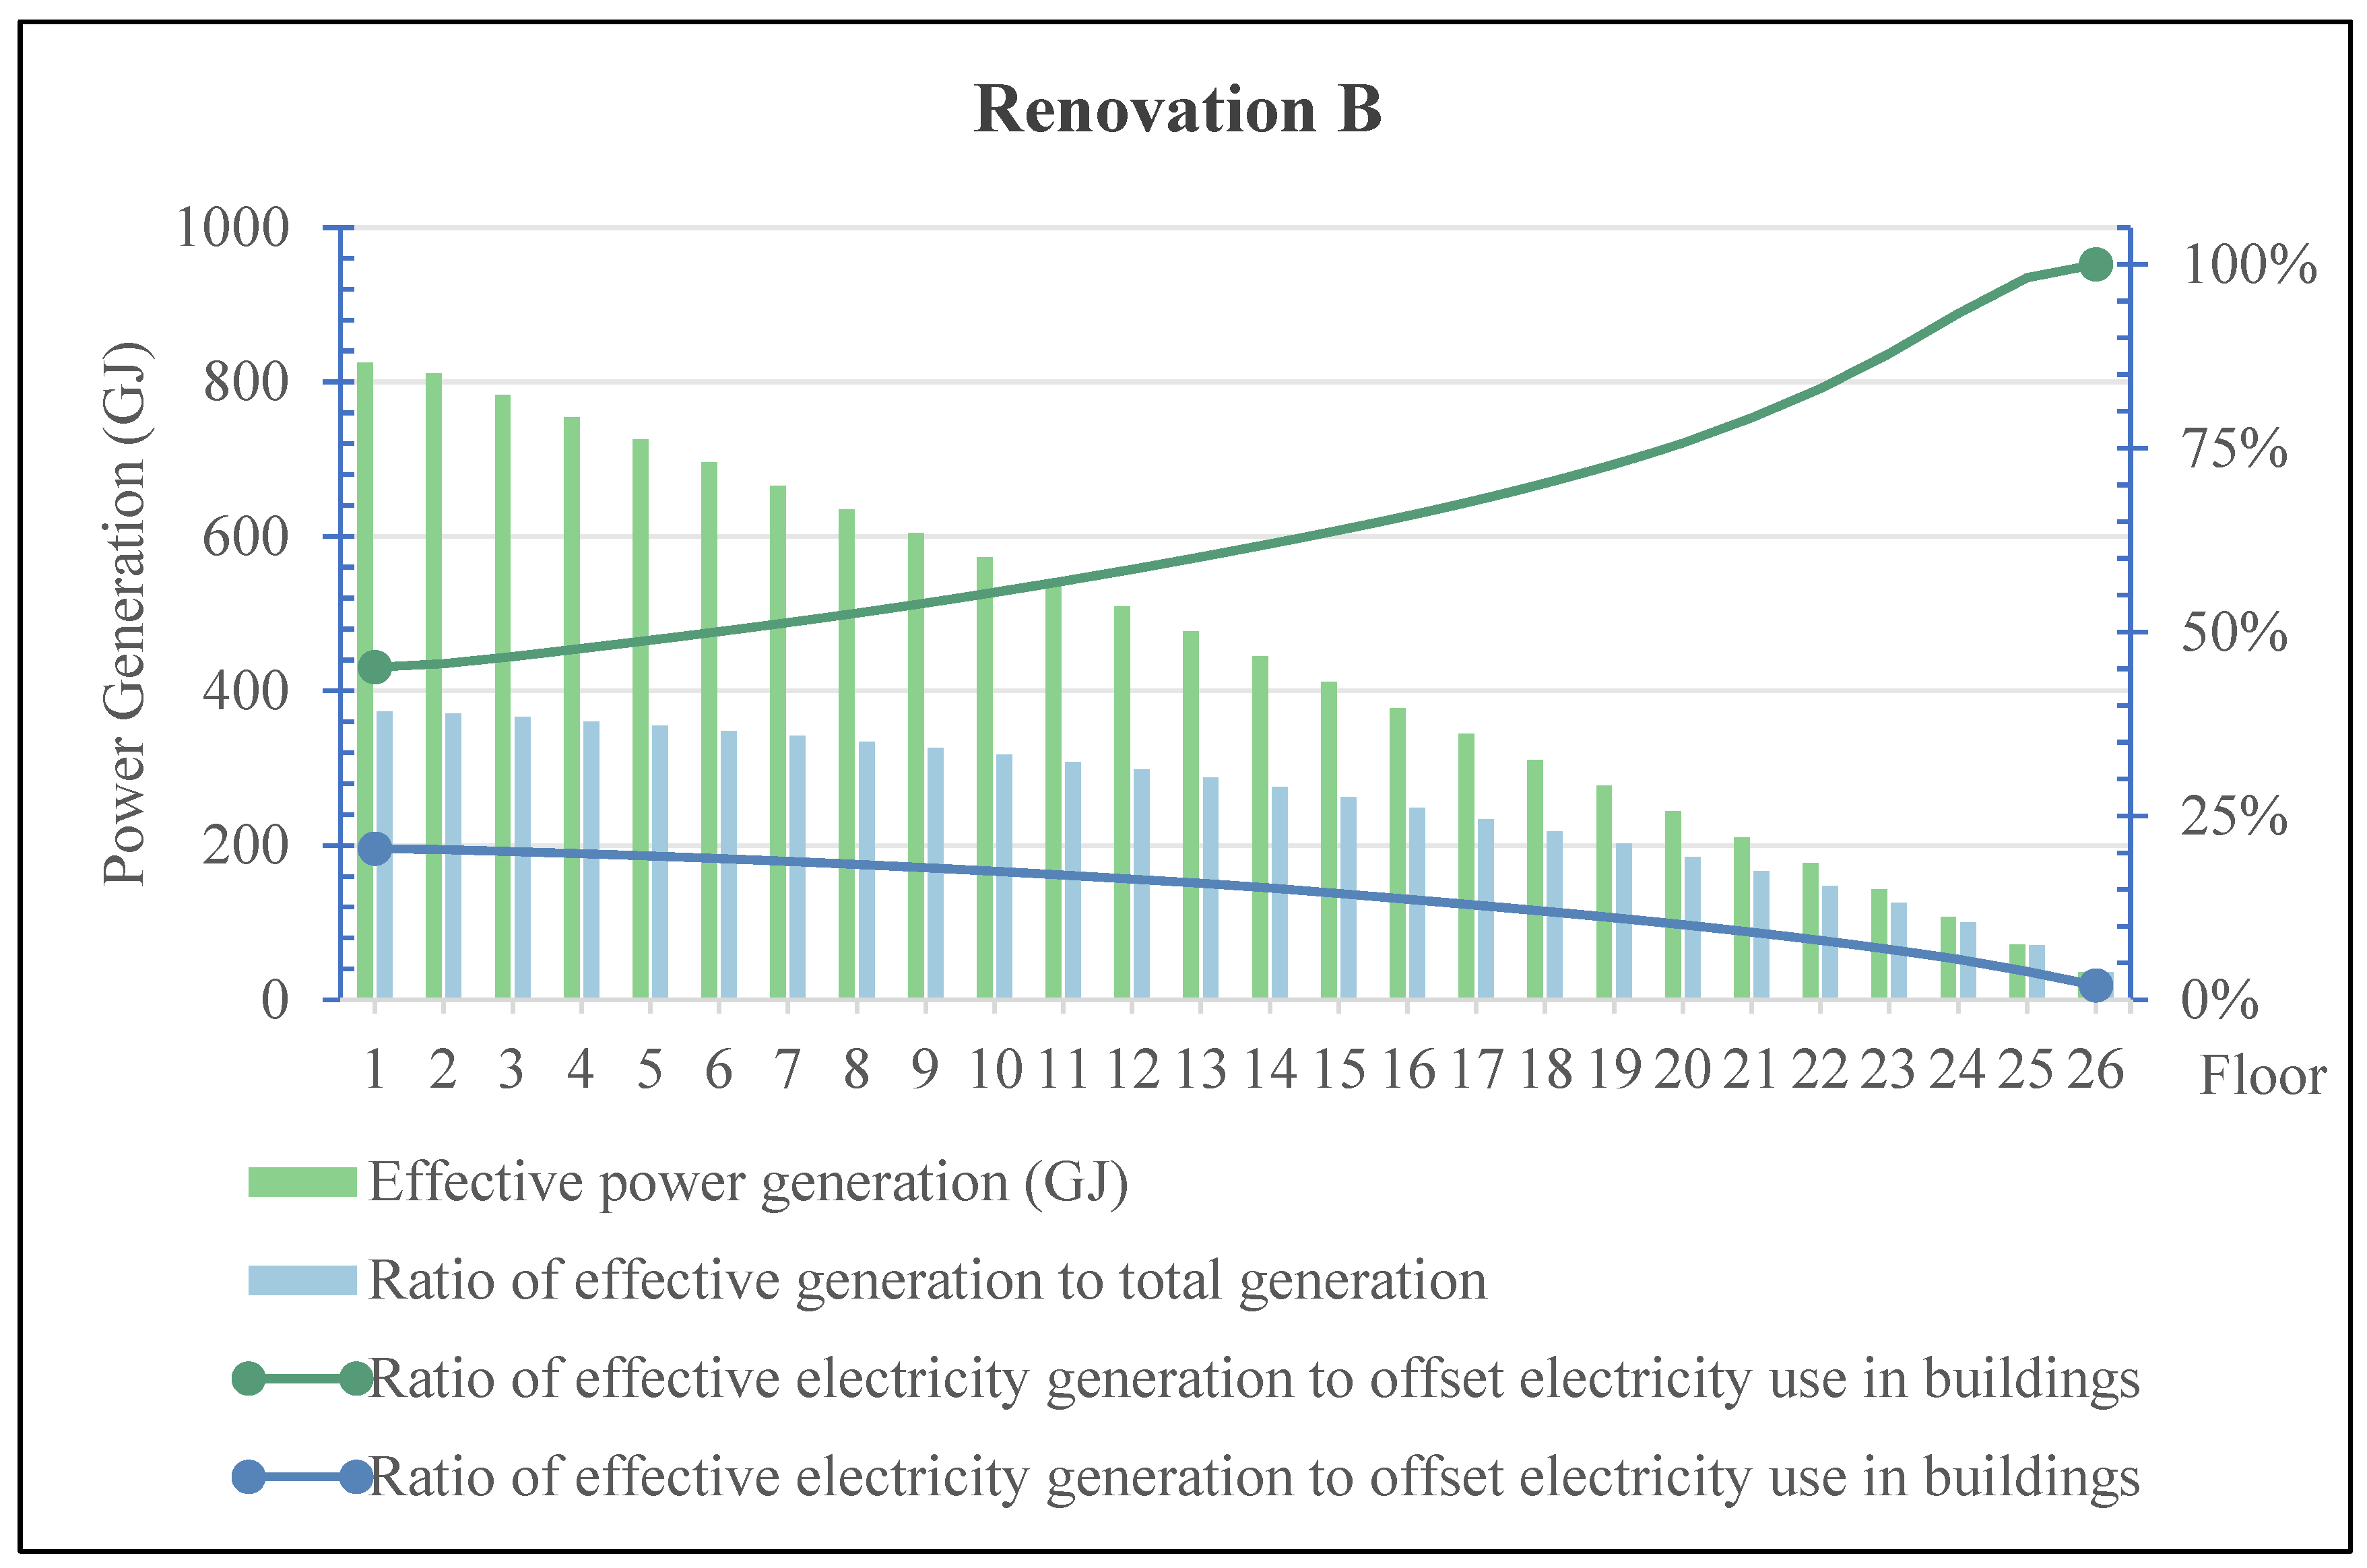
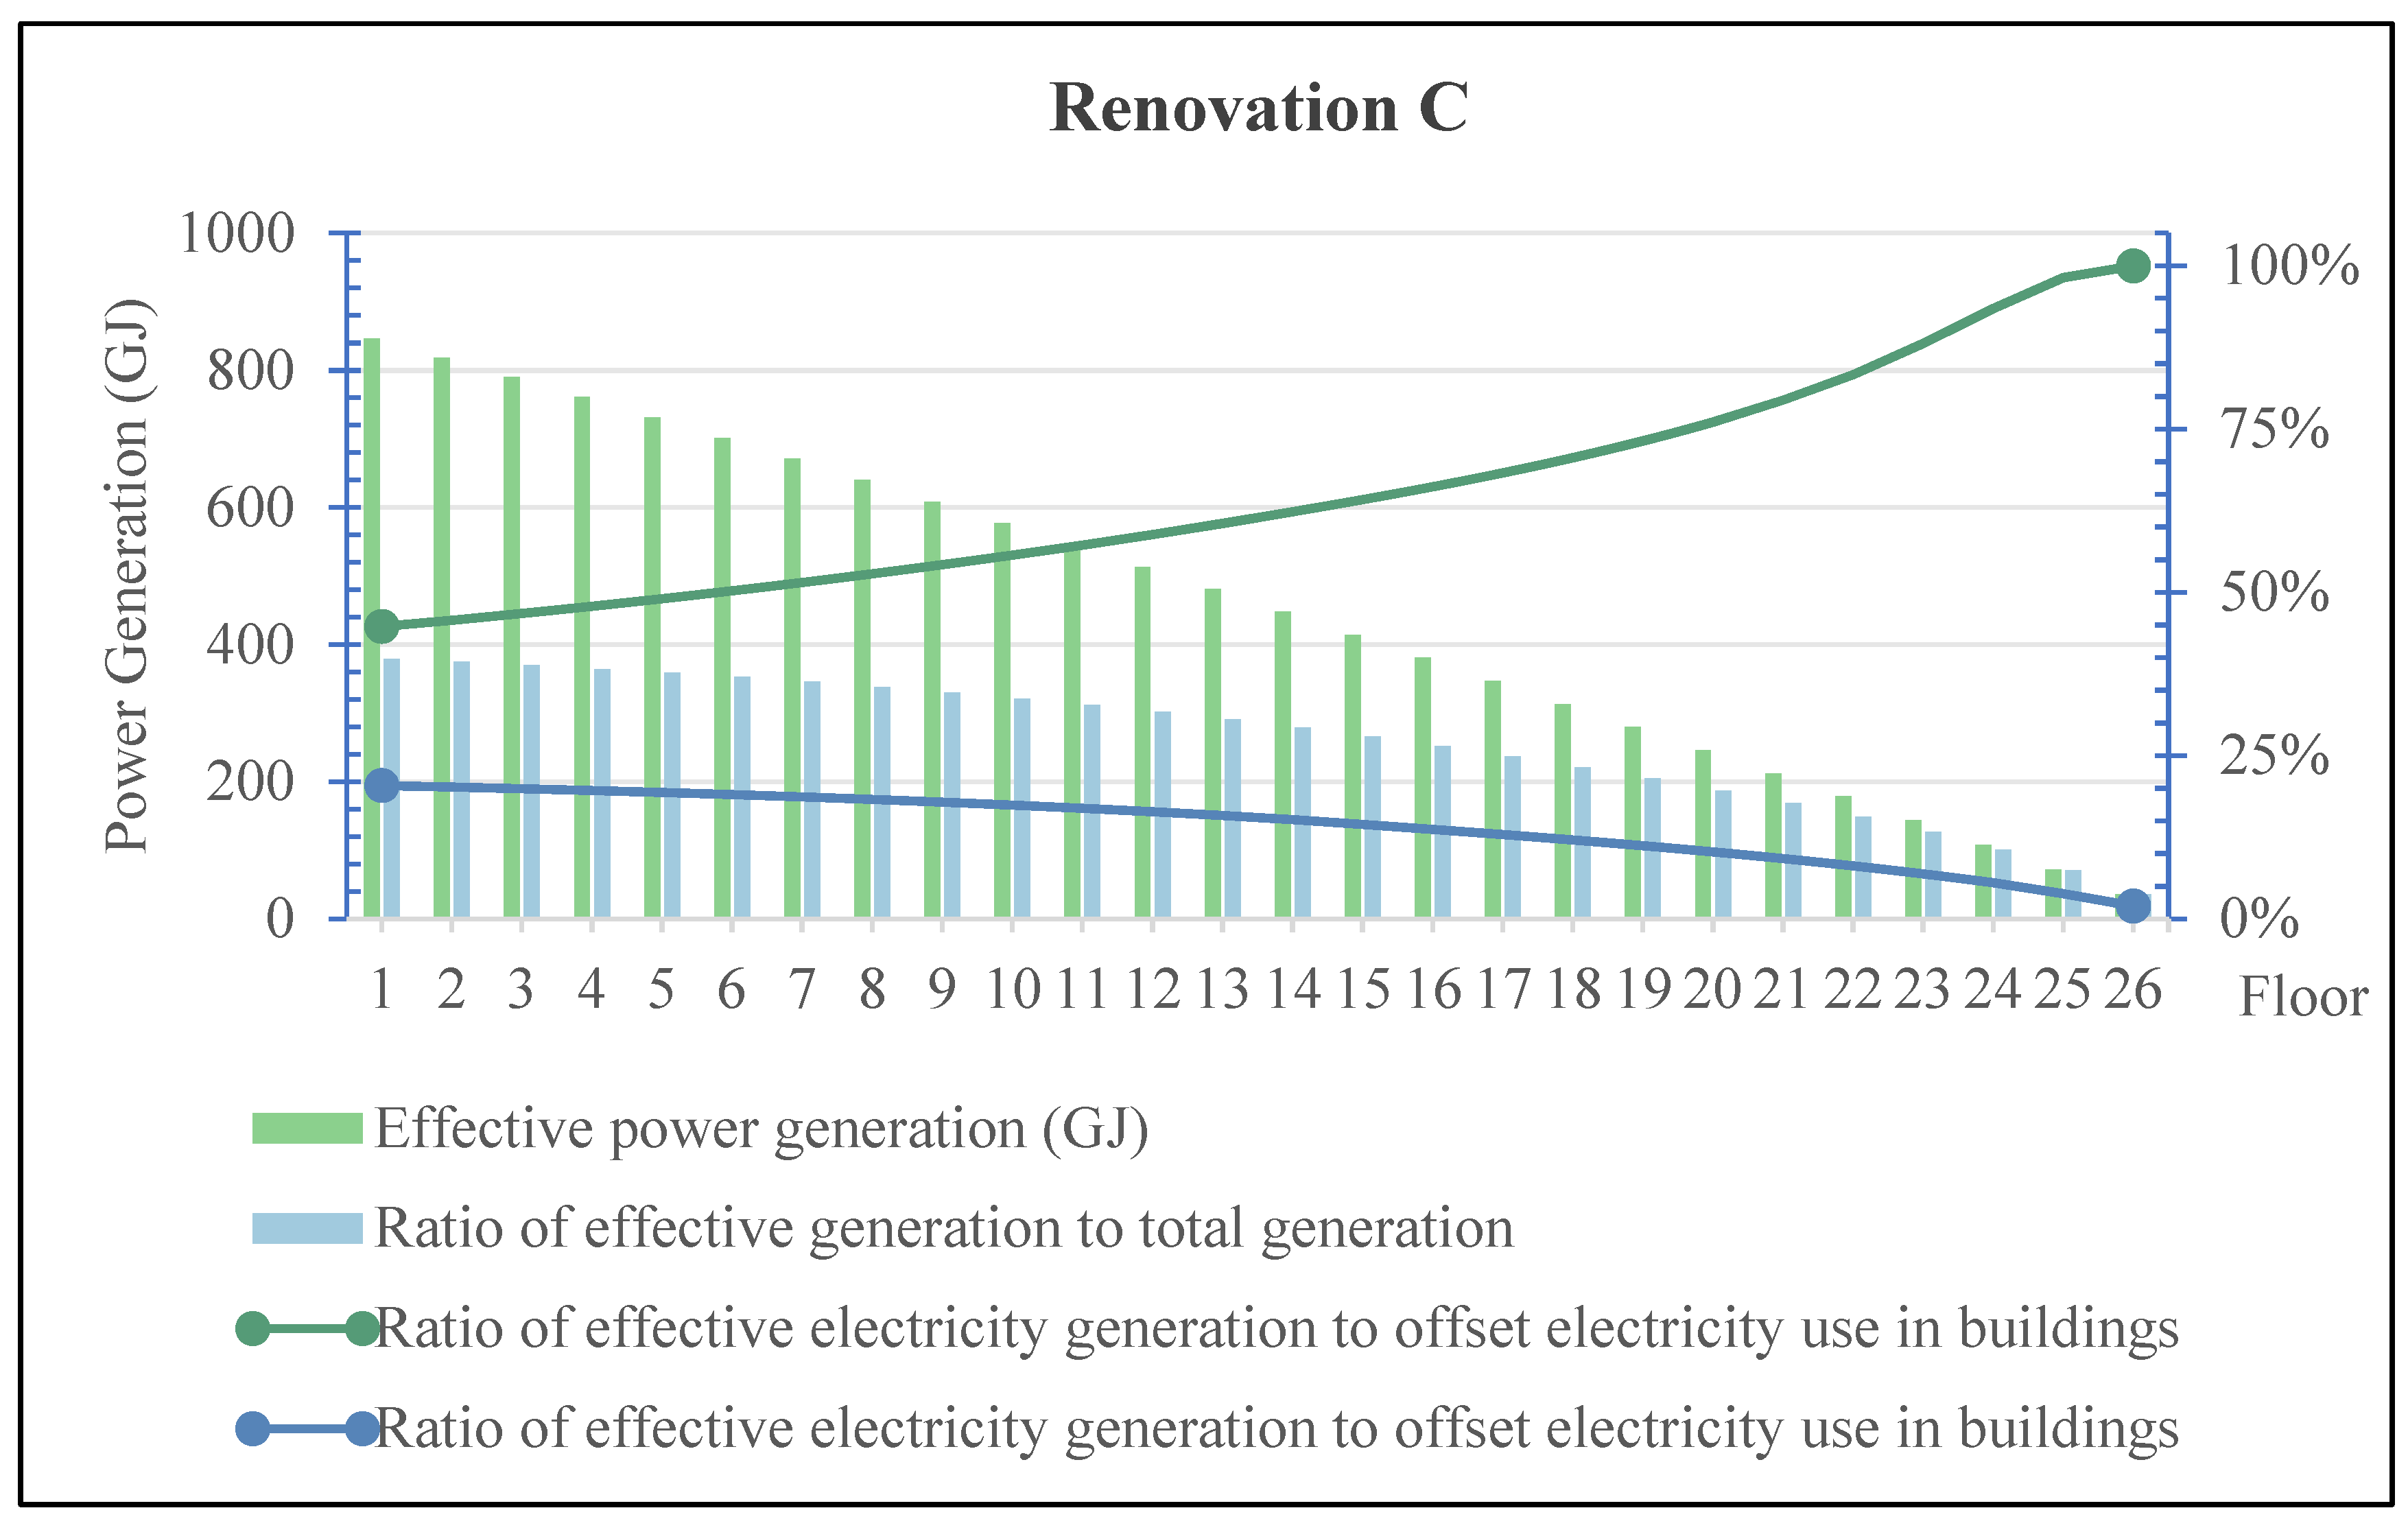
The simulation results for high-rise buildings are shown in Figure 9, Figure 10 and Figure 11. Cases “1” through “26” represent scenarios ranging from “PV installed on all floors” to “PV not installed on the first 25 floors.”
For renovation 1, the data show that as more floors are excluded from PV installation, both the total and effective electricity generation decrease. However, the effective generation ratio—the proportion of usable electricity out of the total generation—increases steadily, from 72.57% to 99.52%. Notably, this ratio begins to rise more rapidly after the 19th floor is excluded. Despite the increasing efficiency, the ability of the PV system to offset building electricity consumption declines sharply, dropping from 12.59% to just 0.80%. A significant decline is observed after the 23rd floor, indicating that the increasing efficiency cannot compensate for the drop in total electricity production.
In the case of renovation 2, a similar trend is observed. As PV systems are removed floor by floor, total electricity generation decreases from 825.11 GJ to 35.85 GJ. A turning point occurs after the 22nd floor, where the decline becomes more pronounced. Meanwhile, the effective generation ratio increases from 45.24% to nearly 100%. However, the ratio of effective generation used to offset the building’s electricity demand decreases steadily—from 20.58% down to 1.98%—as fewer floors contribute to generation.
For renovation 3, the pattern mirrors the other two. As PV panels are removed from more floors, the total generation decreases from 845.82 GJ to 35.97 GJ, while the effective generation ratio increases from 44.80% to 100%. This indicates greater PV system efficiency as low-performing installations are removed. Nonetheless, the offset capability continues to decline—from 20.44% to 1.98%—as a result of the significant drop in total generation.
Total Generation: Renovation 3 performs the best, reaching 845.82 GJ when PV is installed on all floors, outperforming renovation 1 (339.62 GJ) and renovation 2 (825.11 GJ). Effective Generation: Renovation 3 again leads, with a maximum of 378.90 GJ. Although effective generation decreases as fewer floors include PV, renovation 3 maintains the highest levels throughout. Effective Generation Ratio: Renovation 1 shows the highest ratio overall, followed by renovation 2. Renovation 3 starts with the lowest ratio but increases steadily with fewer floors, indicating improving self-sufficiency. Offset Ratio: Renovation 1 has the lowest performance, dropping from 12.59% to near zero. Renovation 2 performs better (20.58%), and renovation 3 performs comparably (20.44%) when PV is fully installed. Moreover, renovation 3 exhibits a more stable offset trend as floor installations are reduced.

3.2. Economic Performance of Electricity Savings in Buildings

Given the relatively poor power generation efficiency and economic performance of PV systems installed on the lower floors of residential buildings—largely due to shading and related factors—this section investigates the optimal starting floor for PV installation that yields the best economic return.
To explore this, multiple building models were developed based on the existing simulation framework. In these models, the lower floors are excluded from PV installation, starting from the 1st floor and gradually increasing the number of floors without PV. The economic benefit of each configuration was then assessed using the following evaluation metric:
The formula estimates the cost per kilowatt-hour (kWh) of air-conditioning electricity saved due to PV installation.
If the coefficient is positive, it indicates that the PV system contributes to reducing electricity demand for air conditioning. The closer this value is to zero, the lower the cost for saving each unit of electricity, and the more economically efficient the installation becomes.
Conversely, if the coefficient is negative, it suggests that PV installation increases air-conditioning electricity consumption—possibly due to thermal effects or inadequate design. In this case, the closer the value is to zero, the lower the additional cost, and therefore, relatively better economic performance.
The specific calculation method is as follows:
C - value = Total   PV   Installation   Cost   ( Area   ×   Unit   Price ) Cooling   electricity   consumption   without   PV   panels Cooling   electricity   consumption   with   PV   panels   installed
The EPC (Engineering, Procurement, and Construction) unit cost used in this study (3.3 ¥/W) is estimated based on PV module and system price data published by Gessey PV Consulting [35]. and aligned with typical Chinese residential solar system installation costs reported in the market (3–6 ¥/W).

3.2.1. Economic Performance of Facade PV Systems in Low-Rise Residential Buildings

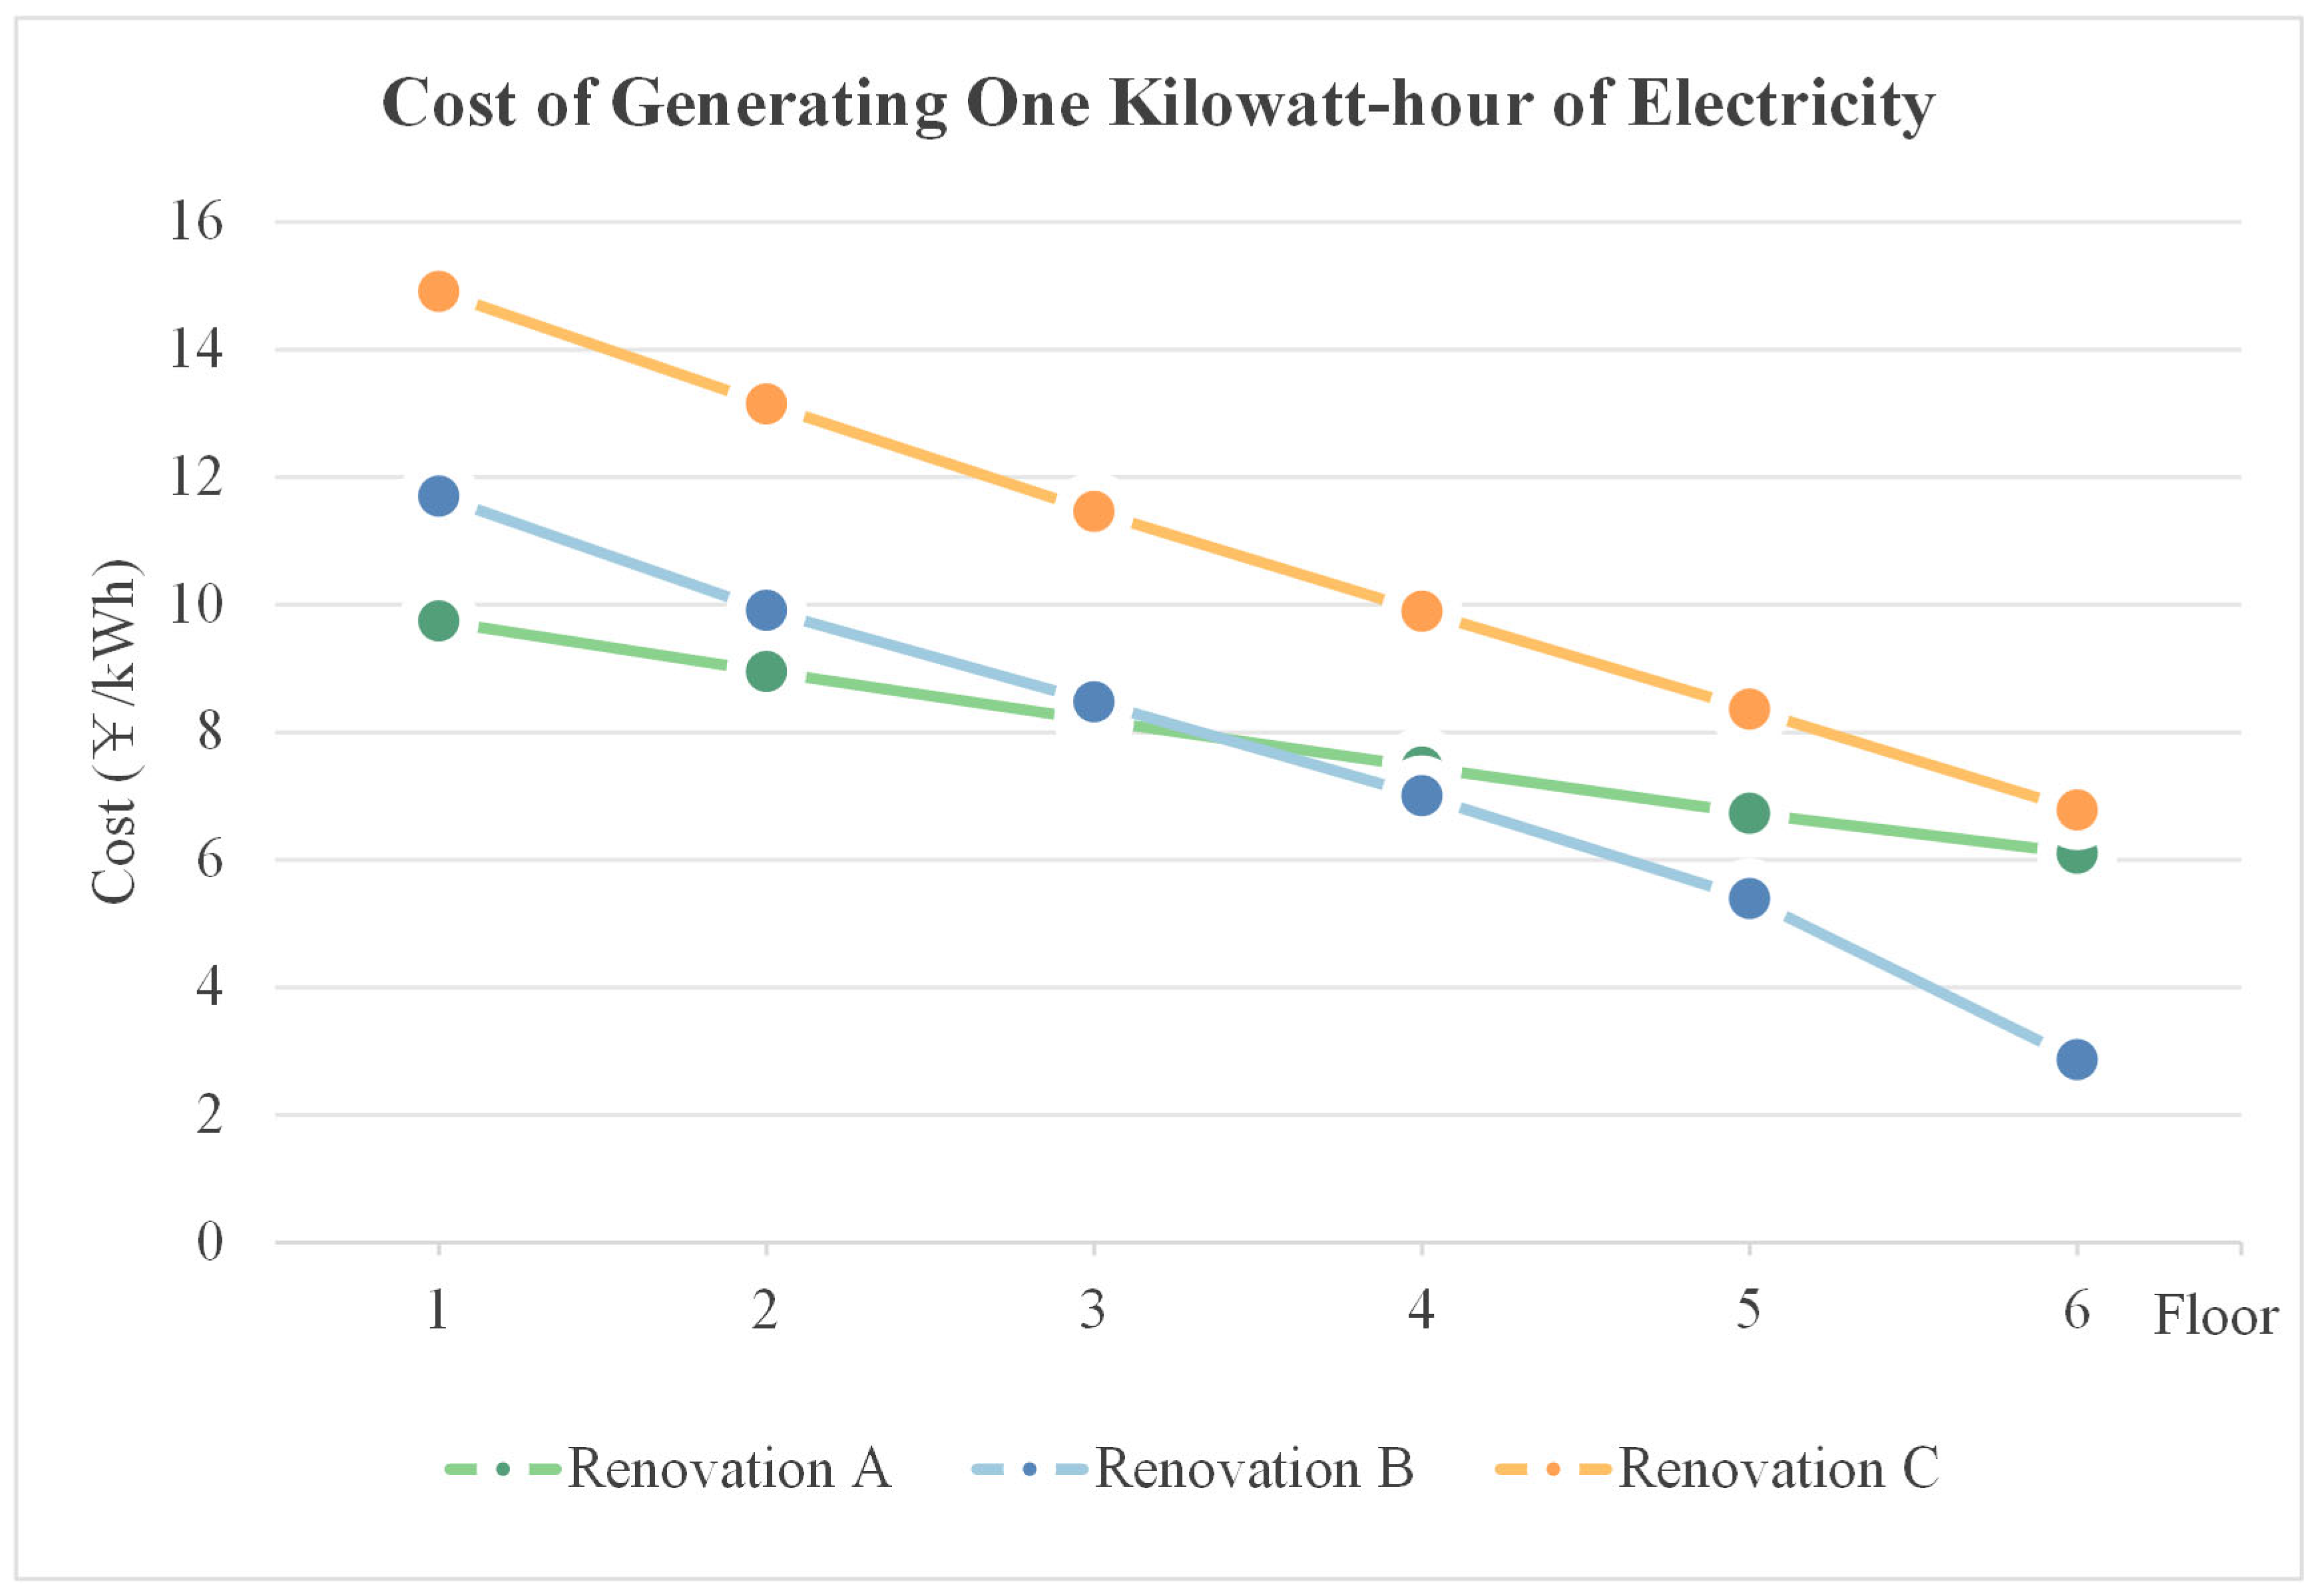
As shown in Figure 12, for low-rise buildings, if renovation 1 (window-mounted PV) is adopted, the corresponding c-values (same below) are all negative. This indicates that the installation of PV panels increases indoor air-conditioning energy consumption. When PV modules are installed on every floor, the c-value is closest to zero at −26.42 ¥/kWh, which is significantly higher (i.e., more favorable) than in other scenarios. The lowest c-value appears when the bottom two floors are excluded from installation, suggesting that this configuration incurs the greatest additional cost due to increased cooling loads caused by PV shading. Other configurations yield similar results, with c-values generally ranging between −60 and −70 ¥/kWh.
In the case of renovation 2 (PV installed on exterior walls), the impact on indoor air-conditioning loads is minor and shows no clear trend. However, the c-values remain consistently low, falling in the range of approximately −1000 to −2000 ¥/kWh, indicating poor economic performance due to high installation costs and relatively low energy offset.
If renovation 3 (a combination of window and wall PV installation) is implemented, the c-value is −195.33 ¥/kWh when PV is installed on every floor. The most favorable c-value appears when the bottom three floors are excluded from PV installation, reaching −148.21 ¥/kWh. Overall, c-values for renovation 3 range between −140 and −200 ¥/kWh.
Renovation 1 shows the least increase in air-conditioning costs, suggesting relatively better economic viability. Renovation 2, with PV installed only on exterior walls, leads to the highest additional costs, as reflected by the lowest c-values. Renovation 3, being a hybrid strategy, performs better than renovation 2, but its c-values are still 2–3 times lower than those of renovation 1, indicating moderate cost-effectiveness.
In terms of unit cost per kWh of electricity generated, all configurations are relatively low. However, renovation 3 presents the highest cost per kWh. Notably, when PV is not installed on the bottom two floors, renovation 1 demonstrates the most favorable cost-performance ratio. Conversely, if more than three floors are excluded from PV installation, renovation 2 performs better economically.

3.2.2. Economic Performance of Facade PV Systems in High-Rise Residential Buildings

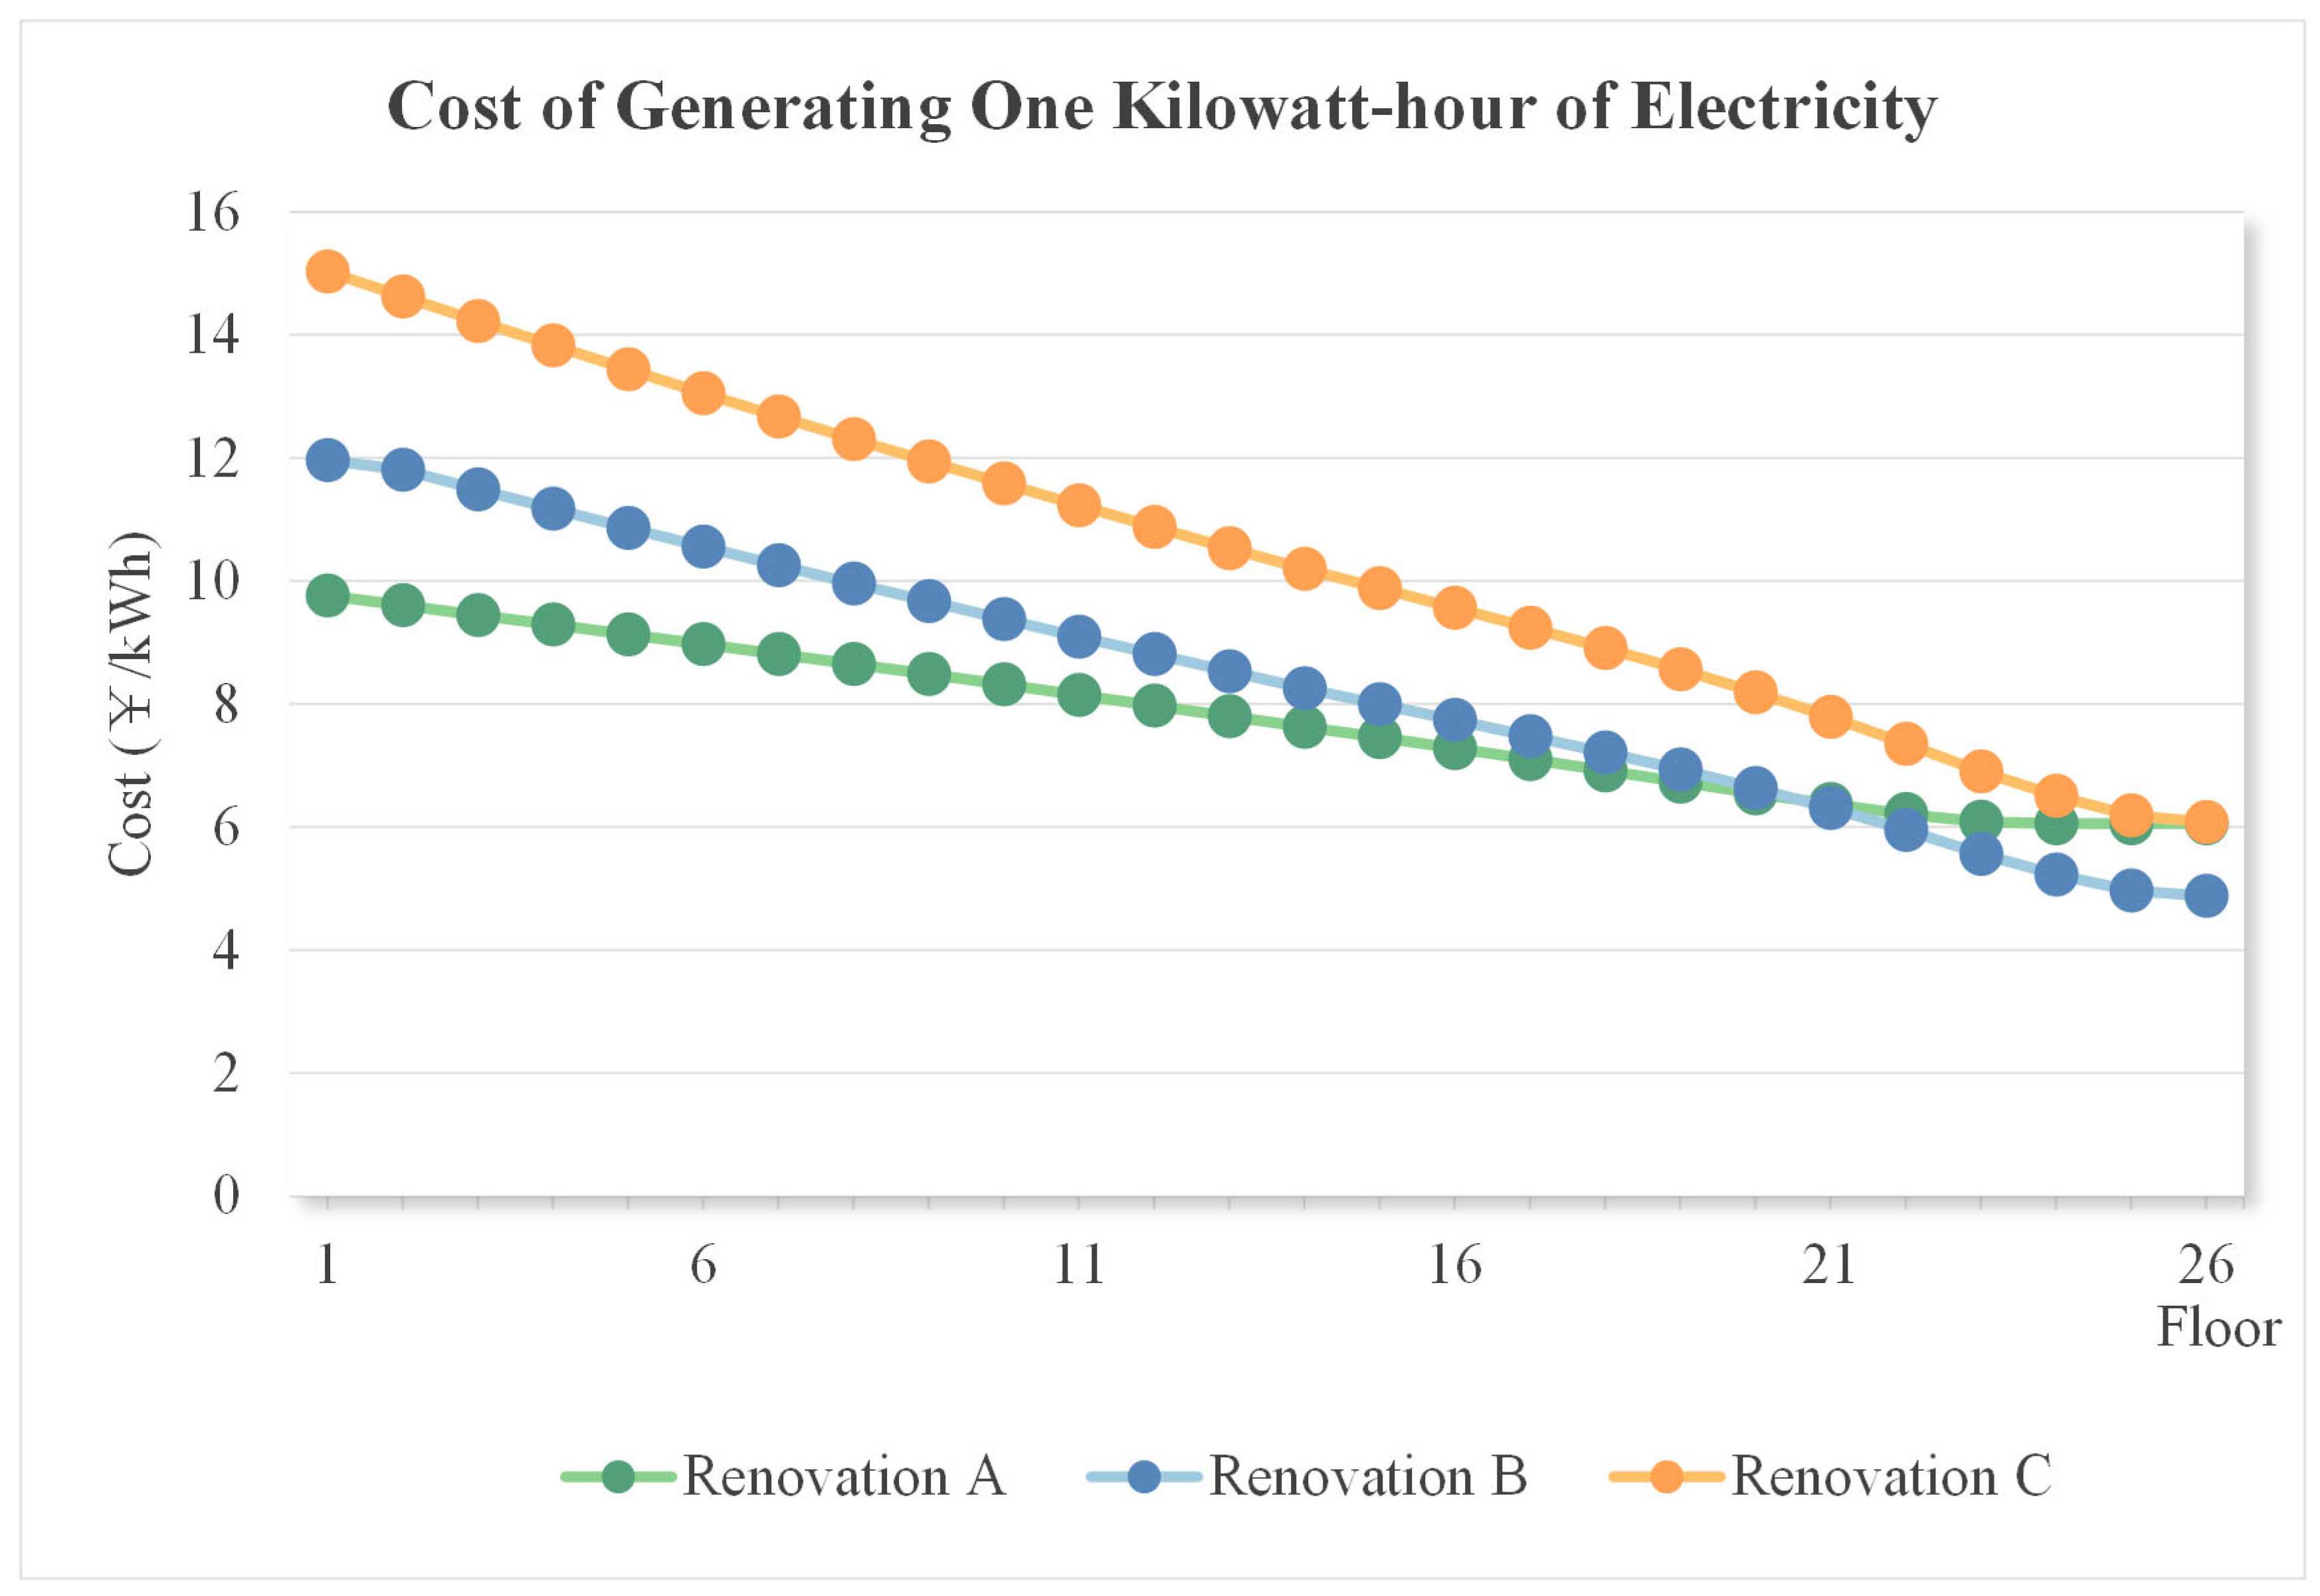
For high-rise buildings, if renovation 1 (window-mounted PV panels) is adopted, the c-values are all negative, as shown in Figure 13, indicating that installing PV panels increases indoor air-conditioning energy consumption. When PV panels are installed on the first eight floors, the c-value is closest to zero at approximately −50.48 ¥/kWh. In scenarios where PV is installed on every floor or on the top 25 floors only, the c-values are the lowest, suggesting these configurations incur the greatest additional cost due to increased cooling loads, and thus have the worst economic performance. Other configurations show relatively similar c-values, generally ranging between −50 and −60 ¥/kWh.
In the case of renovation 2 (PV modules installed on exterior walls), the influence on air-conditioning energy use is minimal, with no clear trend observed. However, the c-values remain very low, typically between −4000 and −8000 ¥/kWh, indicating that despite low energy impact, the high installation cost severely affects cost-effectiveness.
If renovation 3 (combining window and wall-mounted PV) is adopted, all c-values are also negative, implying an increase in air-conditioning energy demand due to PV installation. The lowest c-value of −142.65 ¥/kWh occurs when the bottom 25 floors are excluded from PV installation. The c-value closest to zero appears when PV is not installed on the first seven or eight floors, marking a turning point in the trend, with c-values around −120 ¥/kWh.
Renovation 1 leads to the least increase in air-conditioning-related costs due to PV installation, making it relatively more economical in terms of additional system burden. Renovation 2 has minimal impact on cooling loads but suffers from extremely low cost-effectiveness due to high upfront costs. Renovation 3, while combining both approaches, shows the greatest increase in total costs related to PV installation.
In terms of cost per kWh of effective electricity generated, all three strategies yield low absolute values. As the number of low floors without PV installation increases, the cost per effective kWh tends to decrease. However, renovation 3 consistently shows the highest generation cost among the three. When PV is installed below the 19th floor, renovation 1 proves to be the most cost-effective; however, if installation on floors above the 19th is omitted, renovation 2 becomes more economically favorable.

3.2.3. Carbon Reduction Potential in Multi-Story Residential Buildings

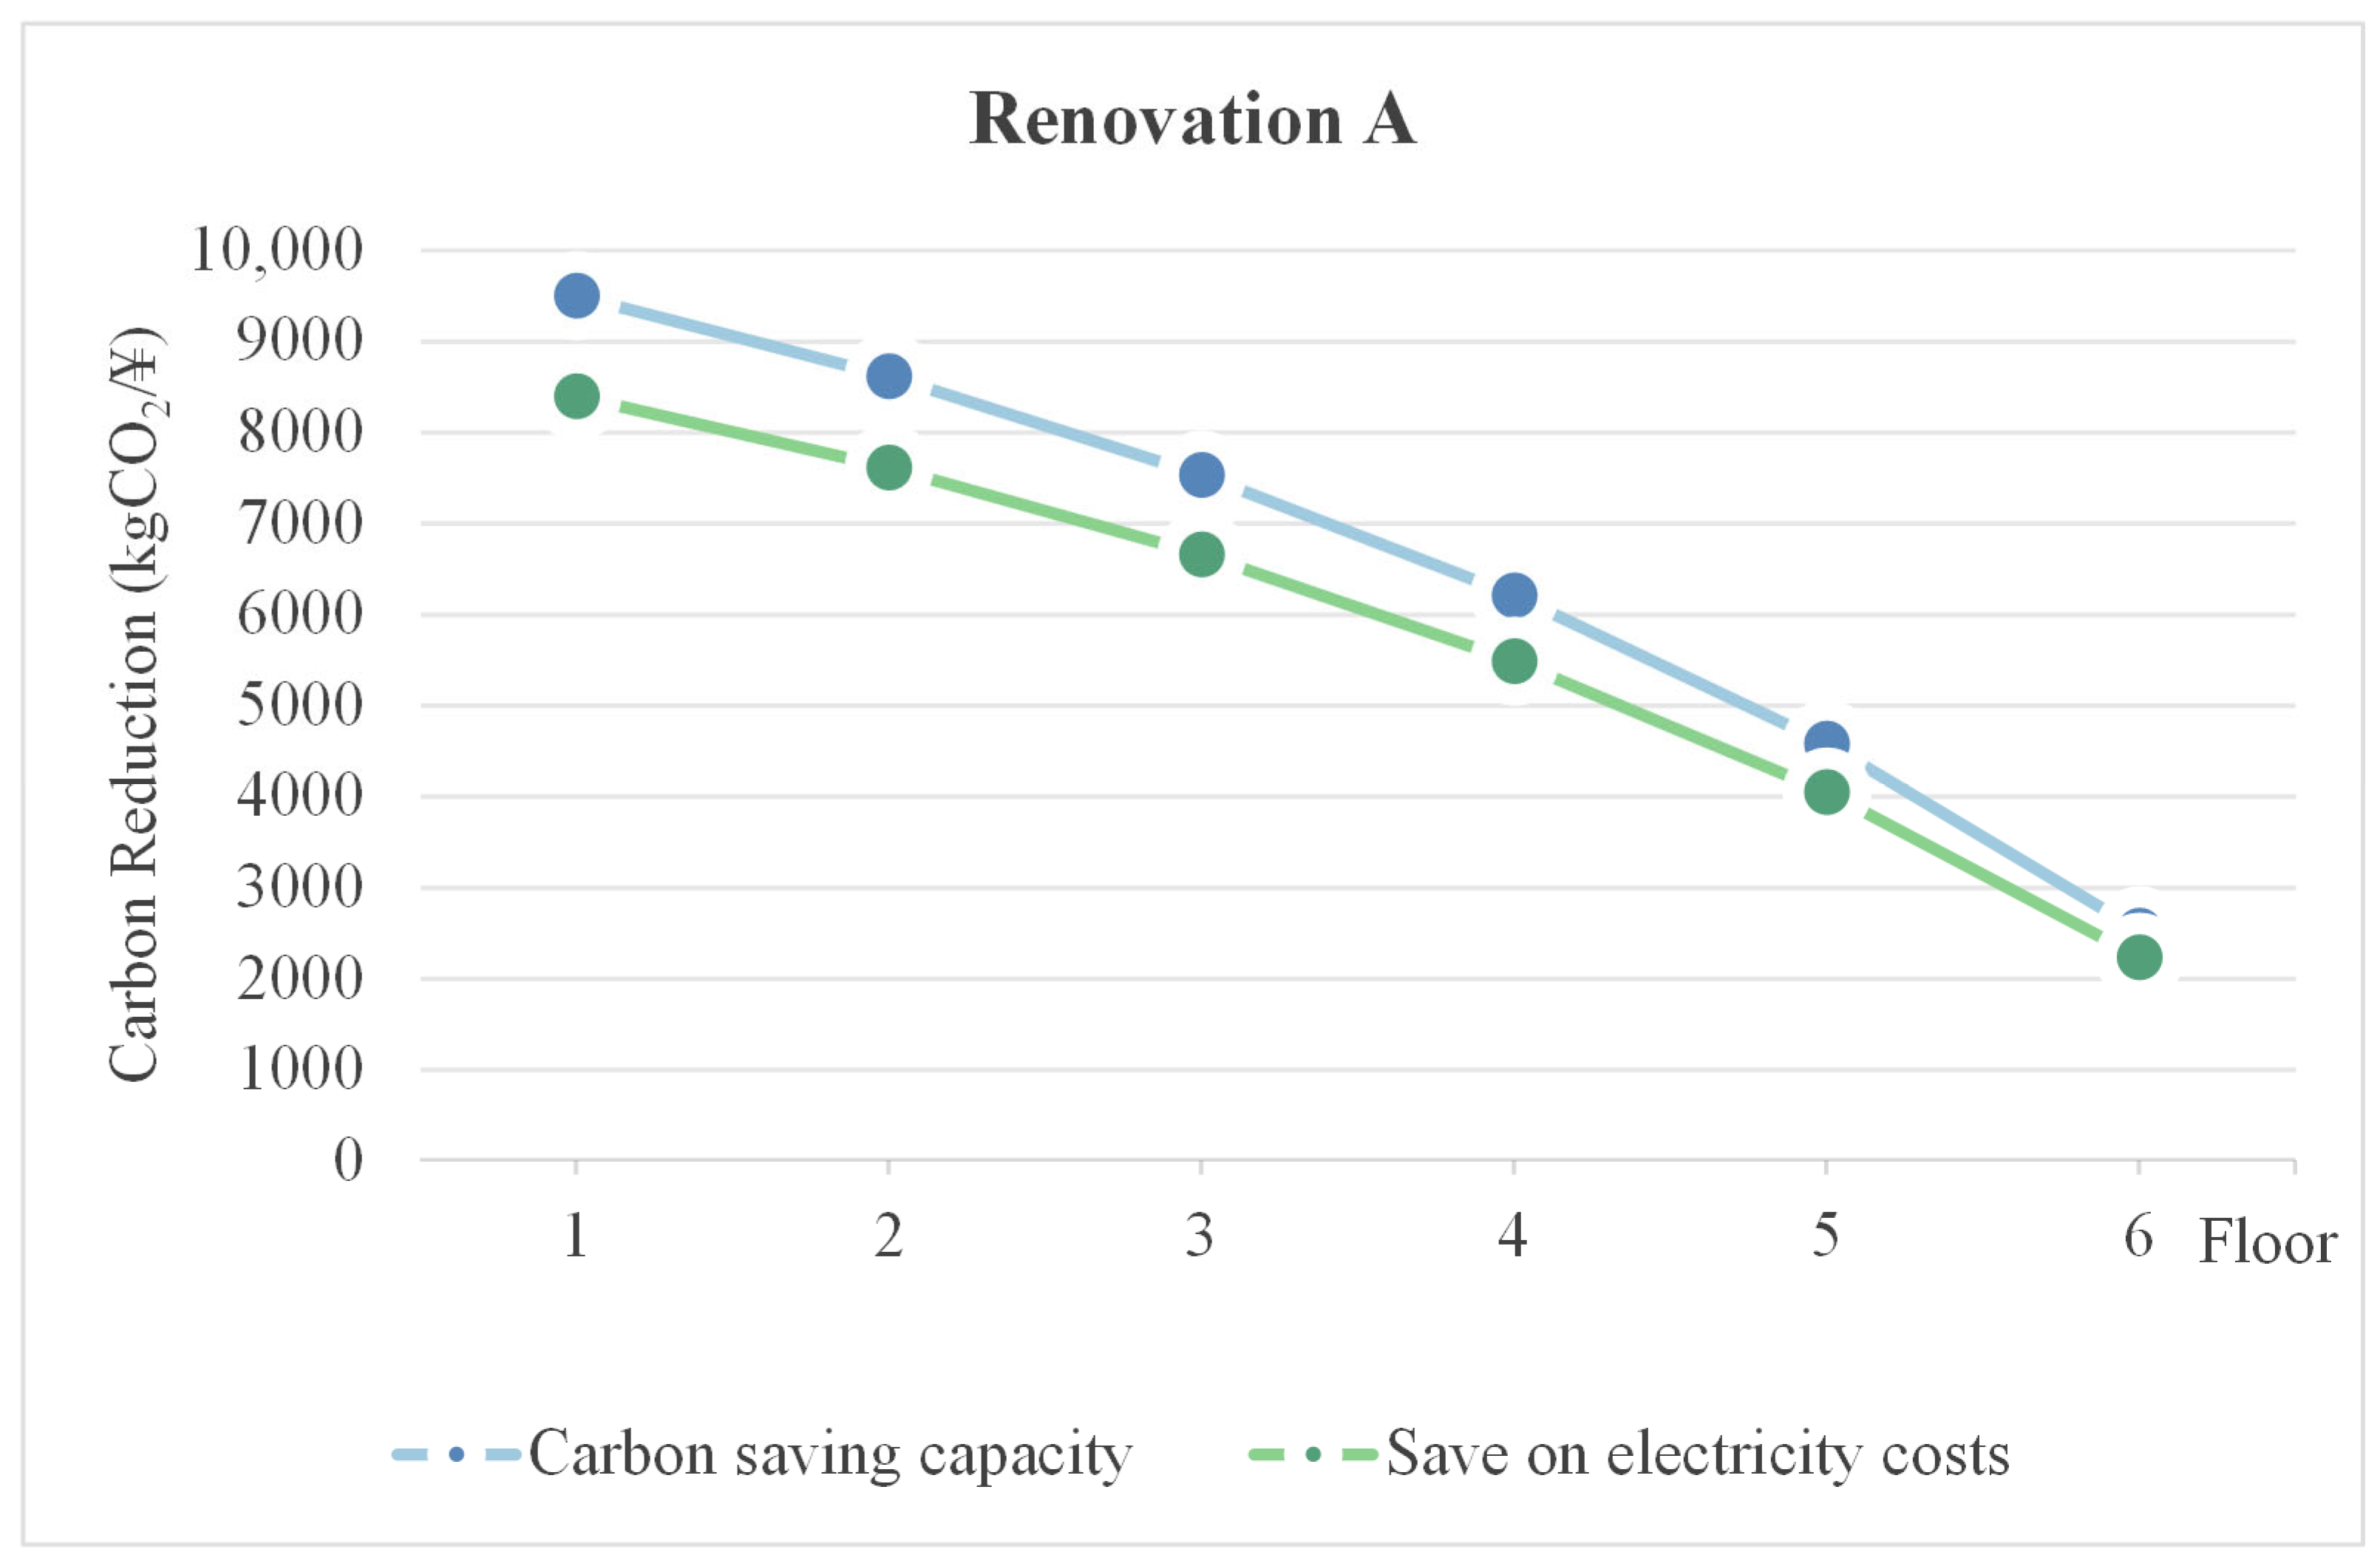
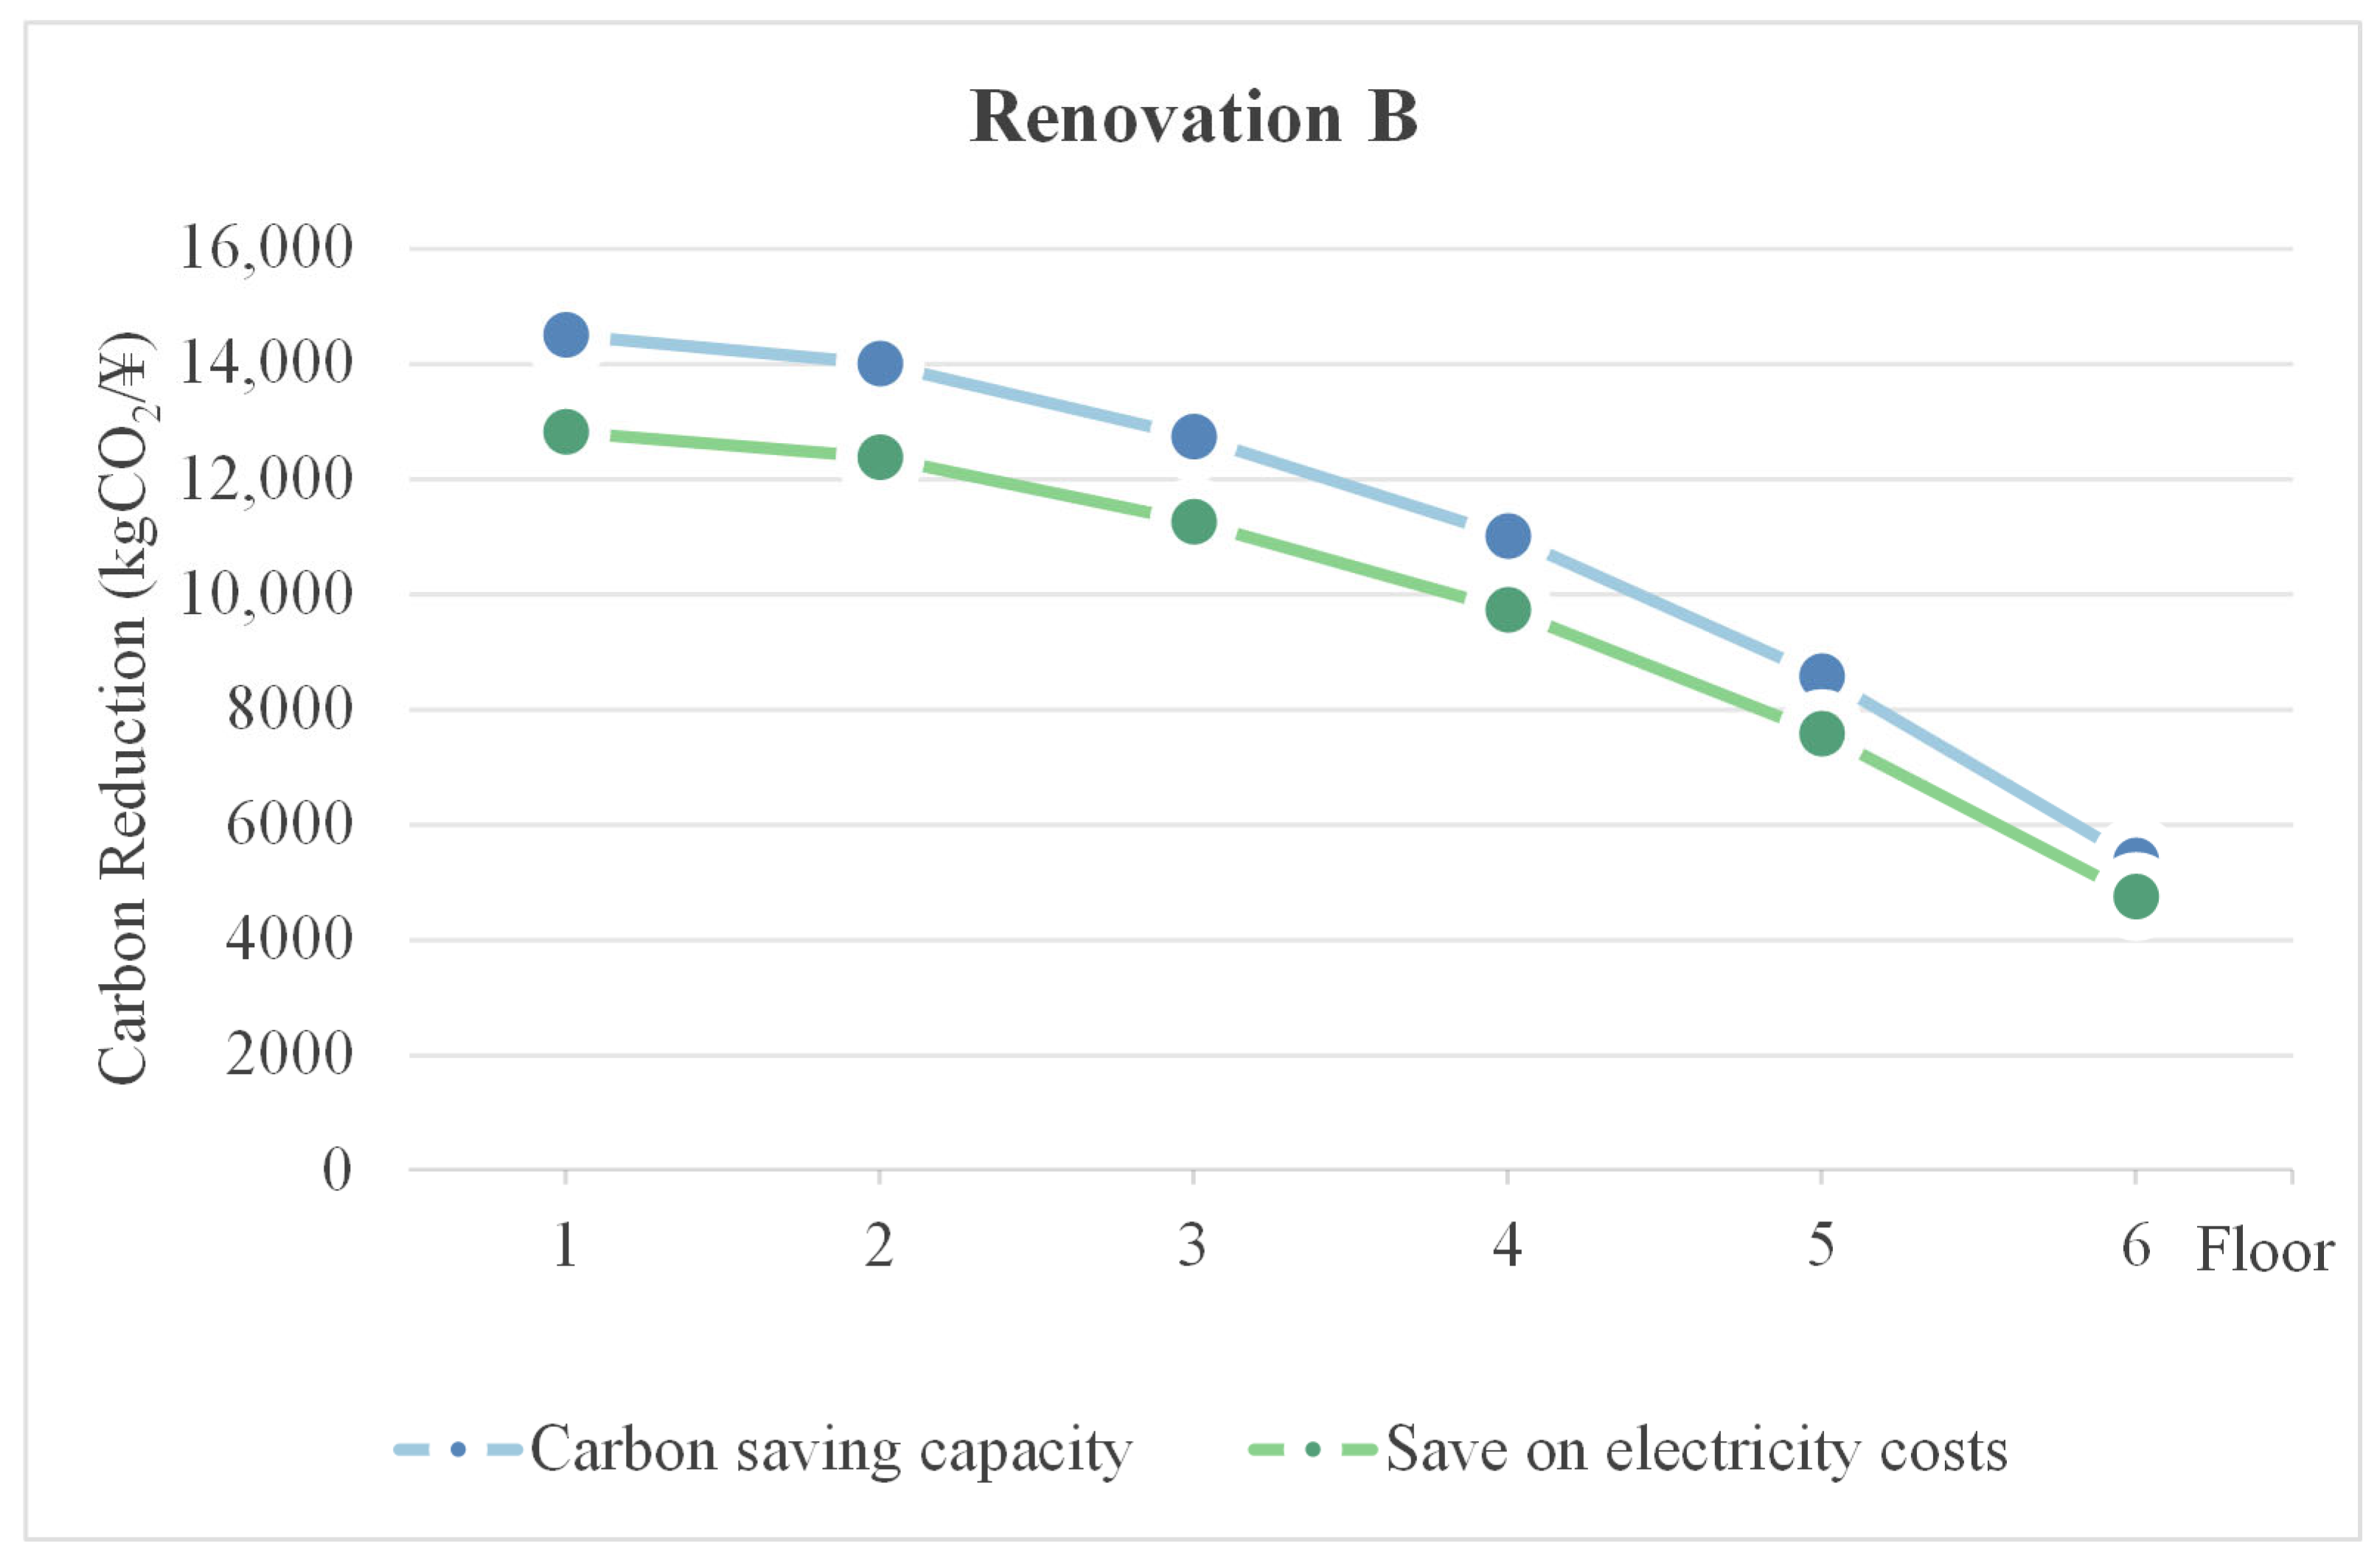
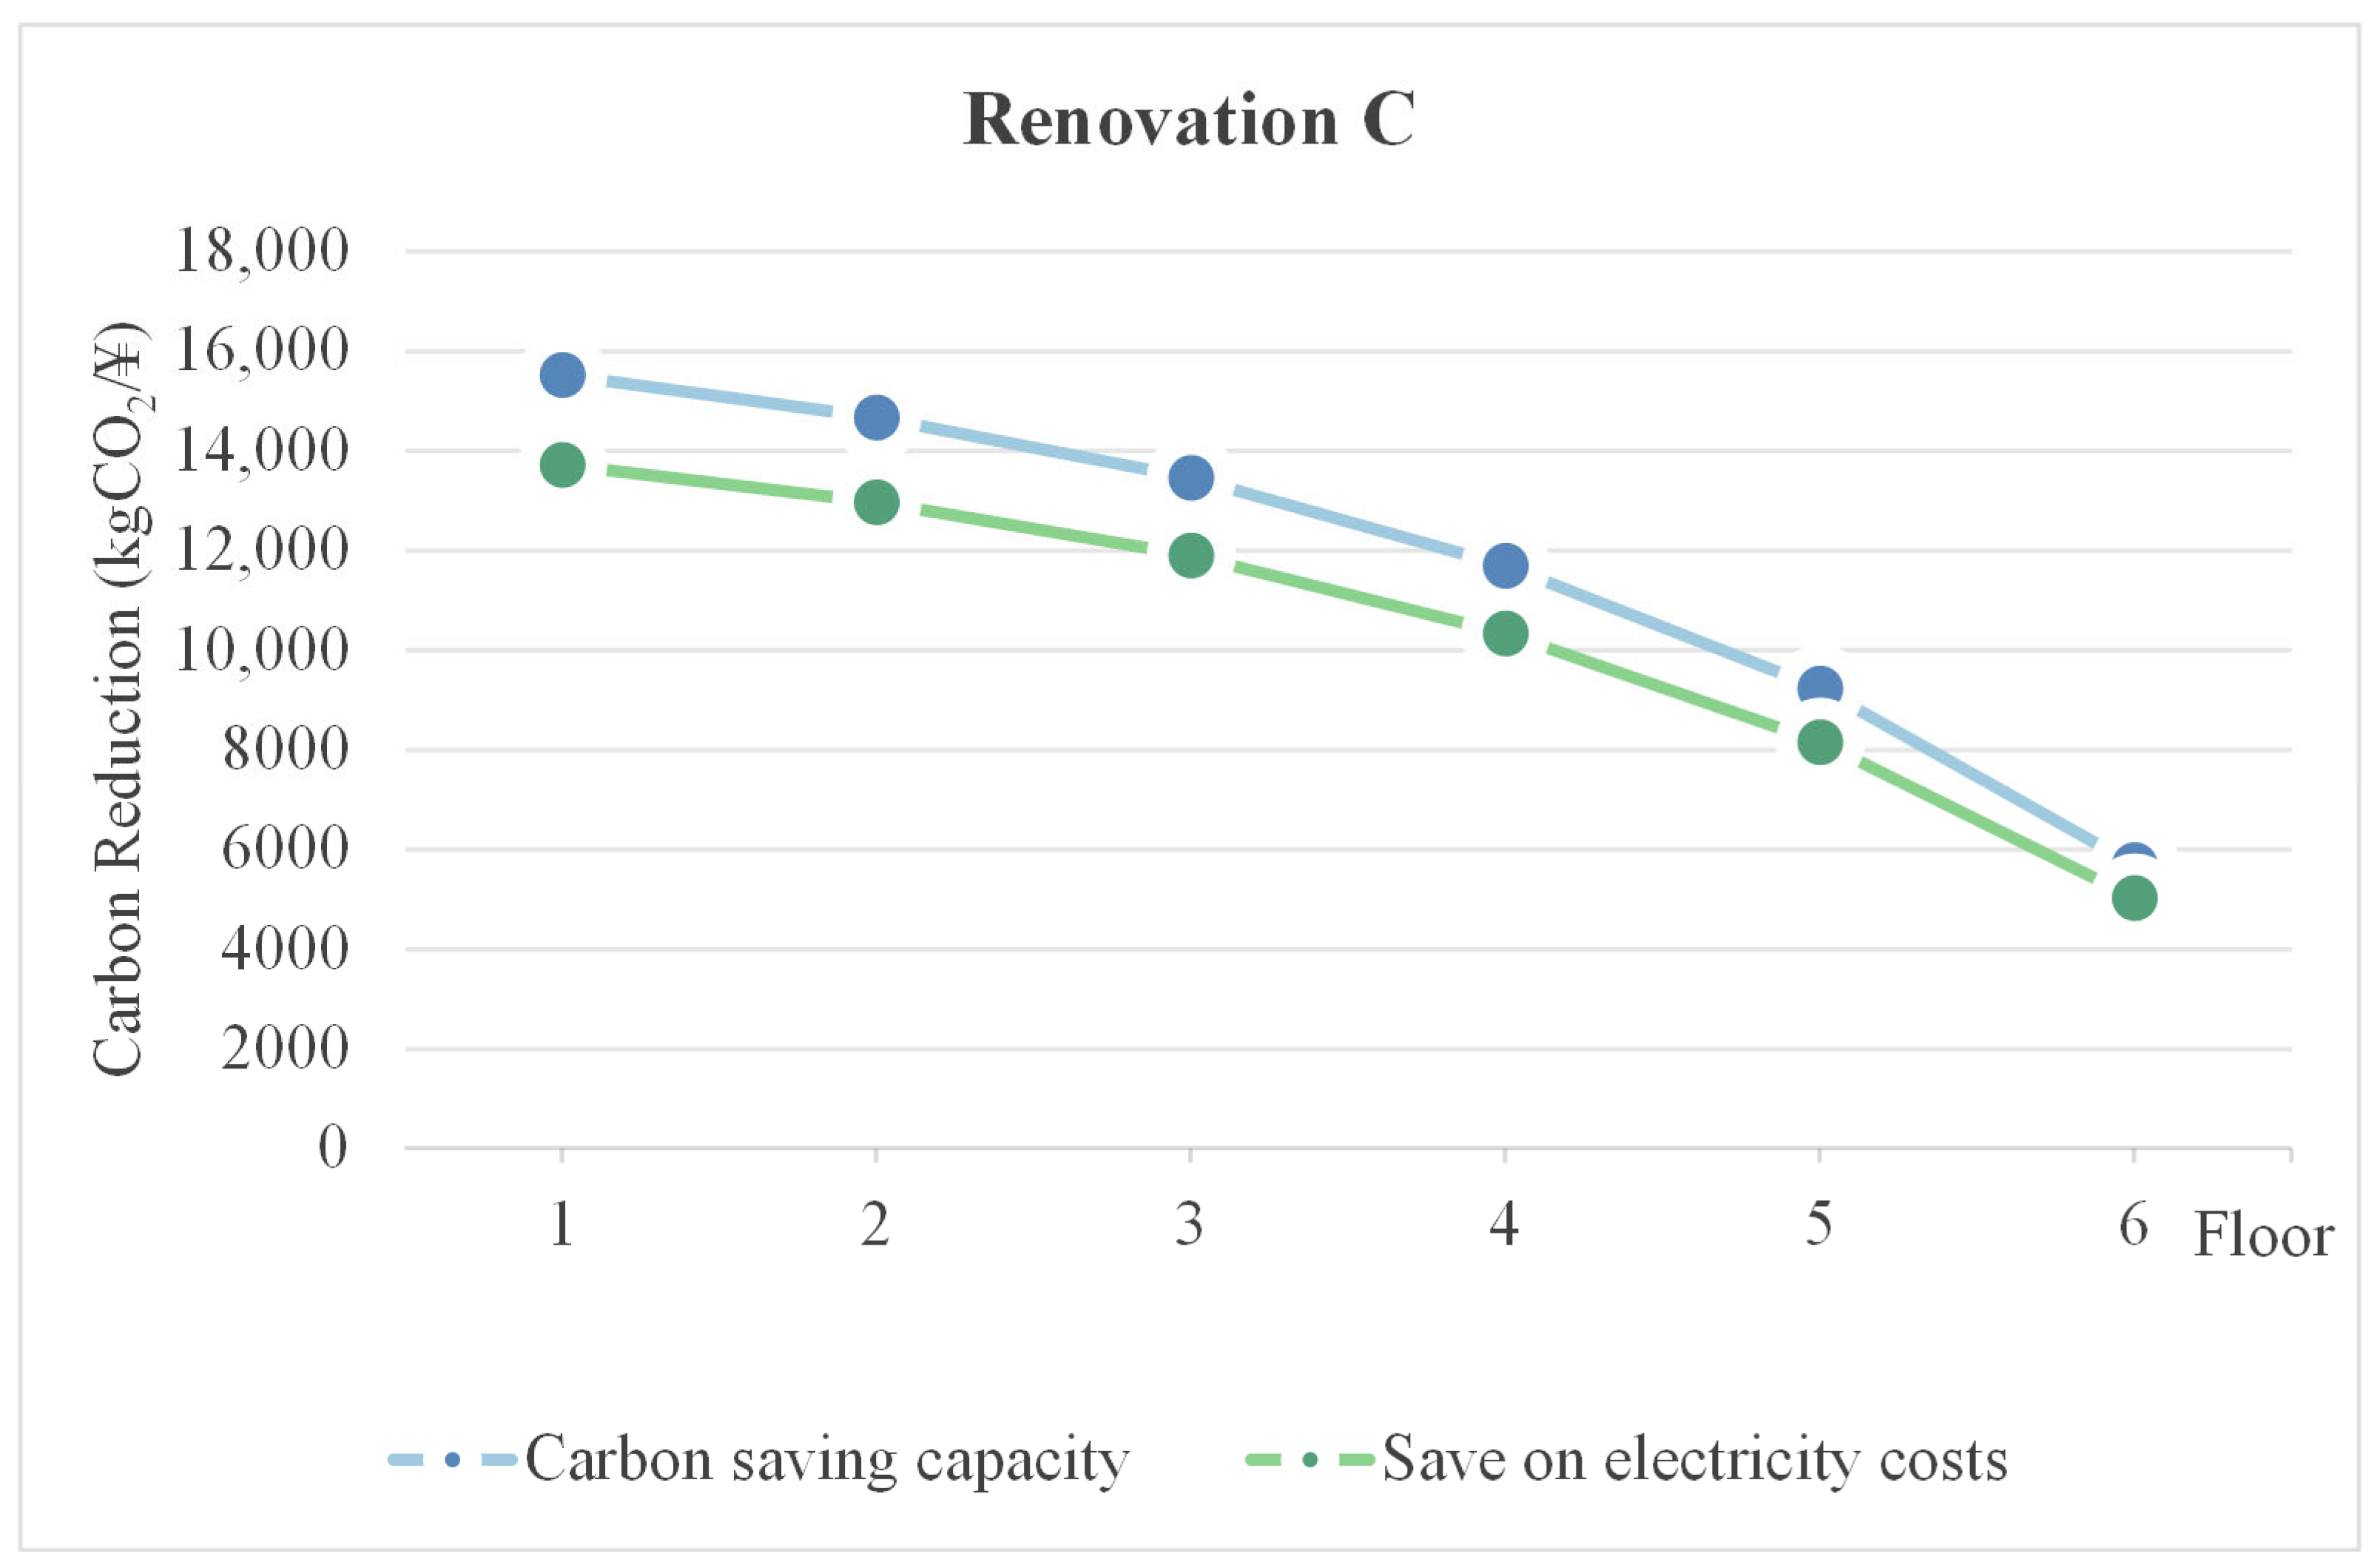
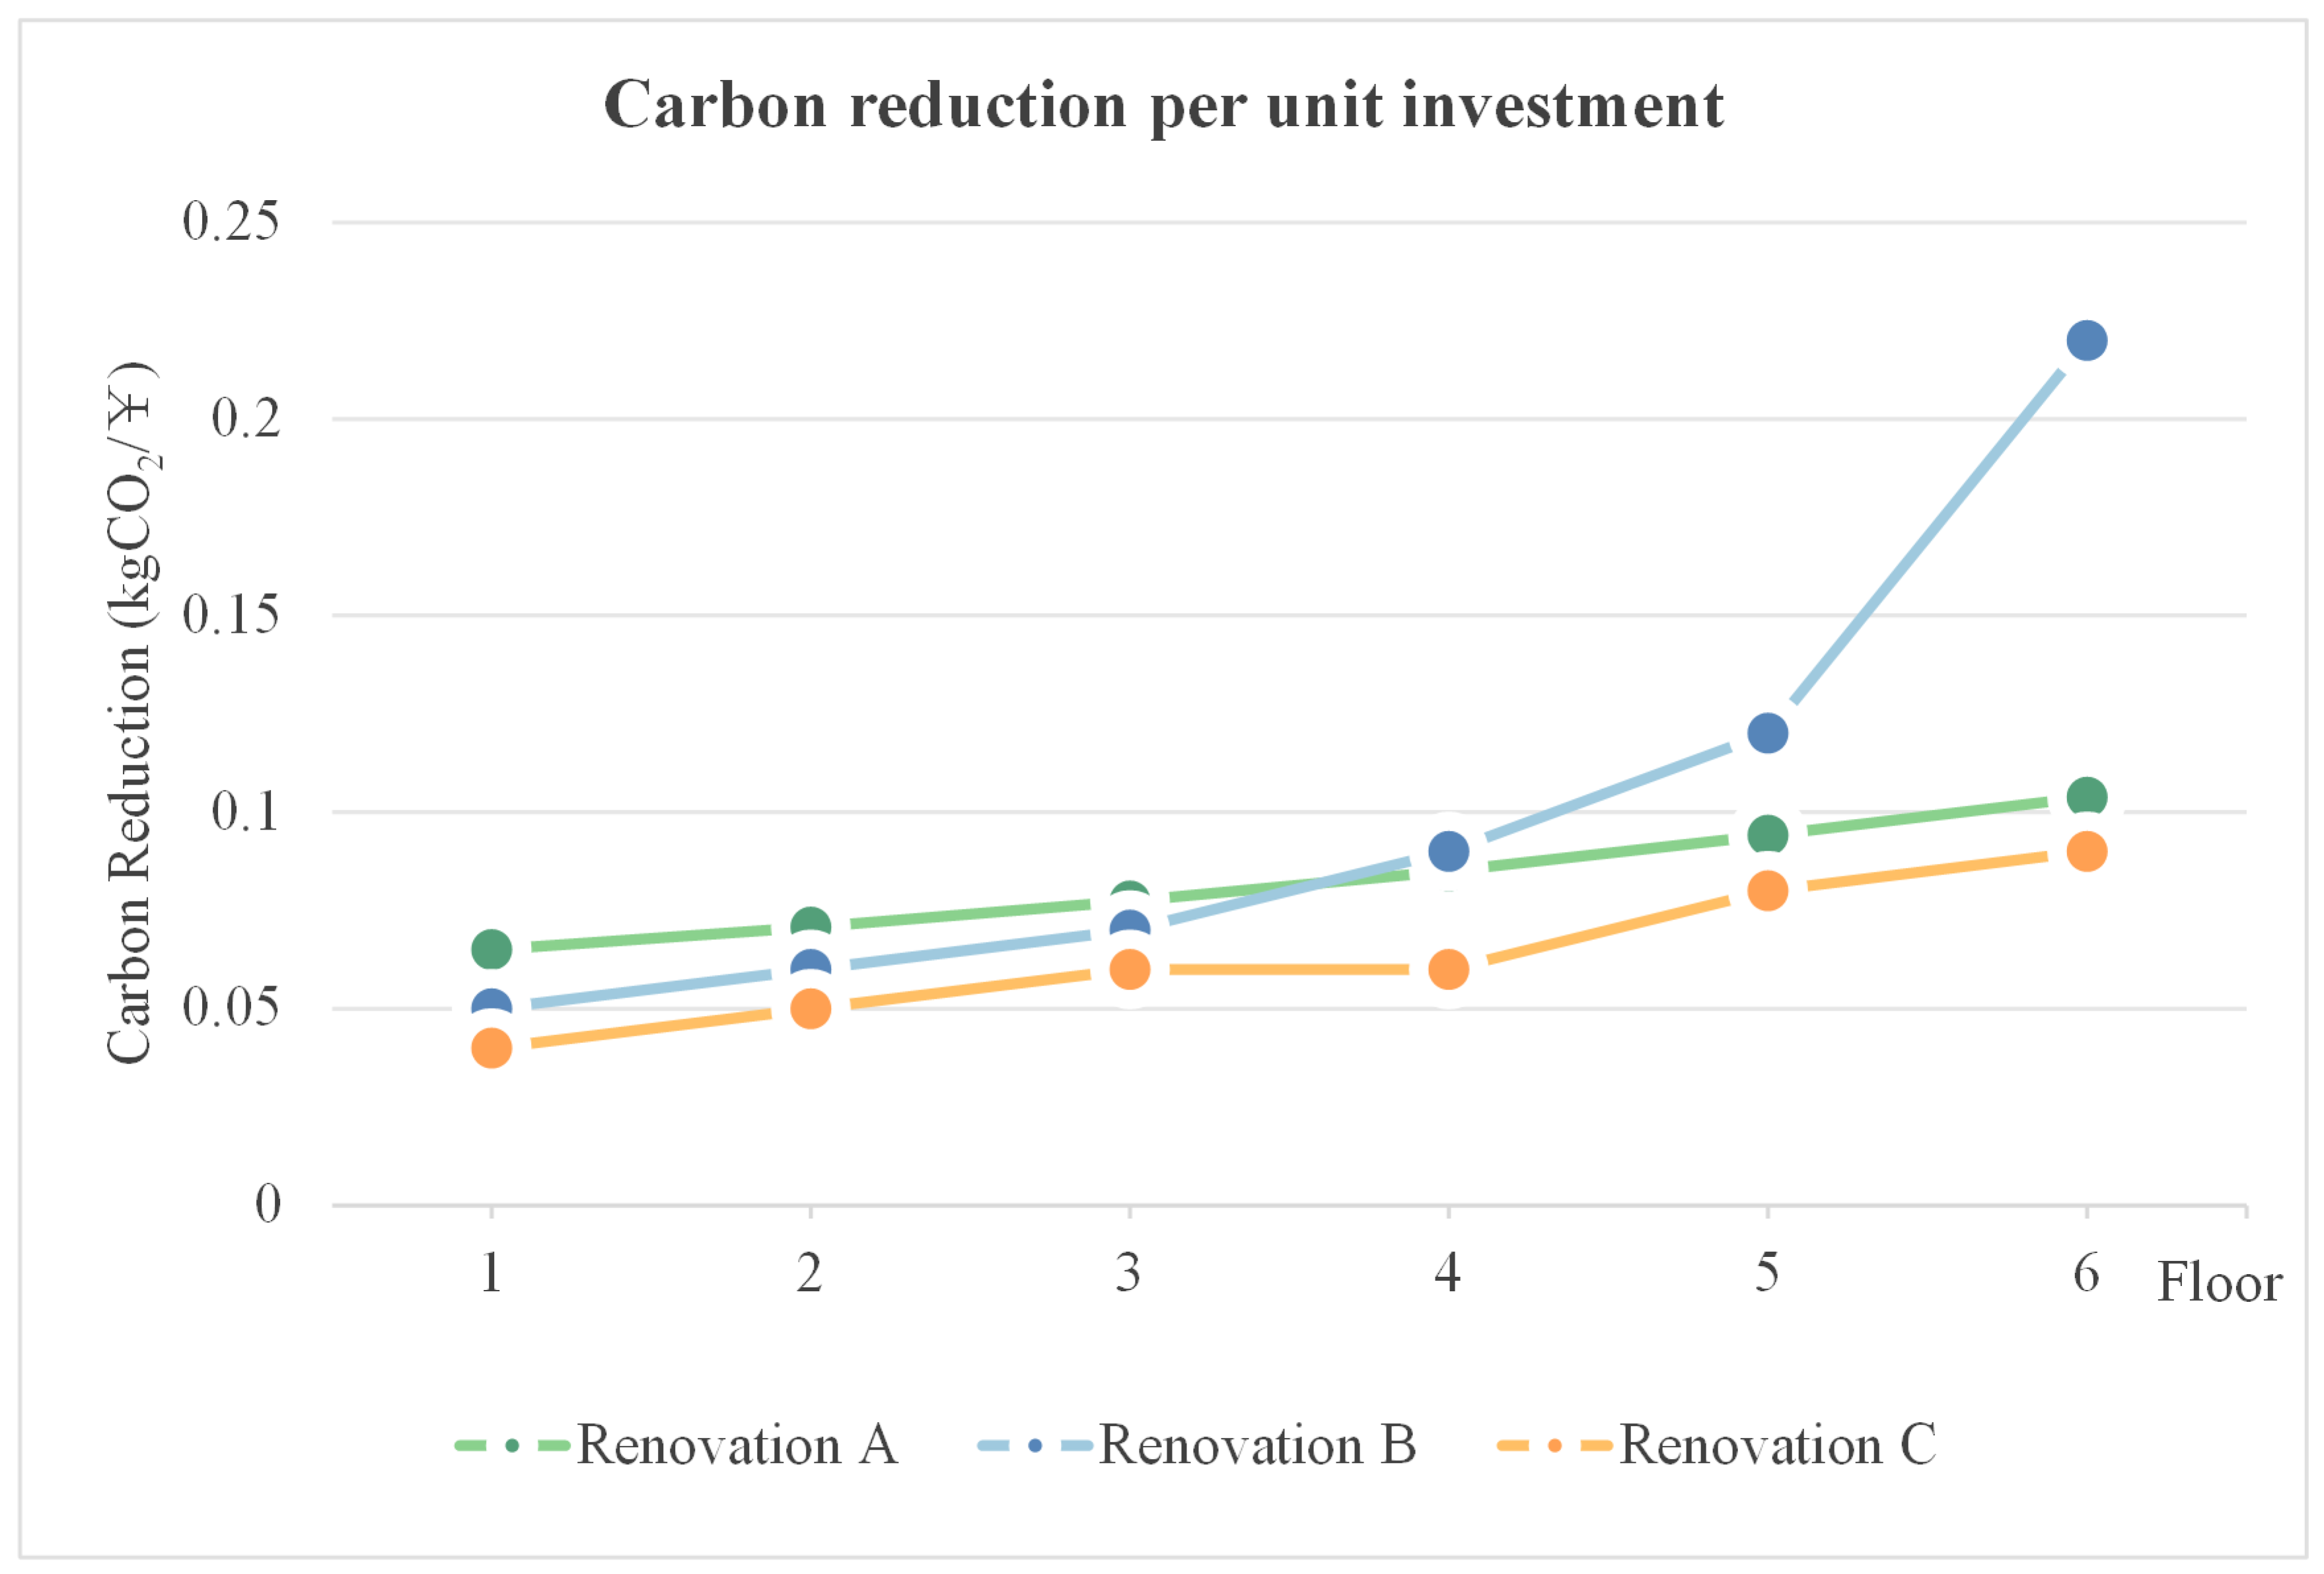
As shown in Figure 14, Figure 15, Figure 16 and Figure 17, for low-rise buildings, under renovation 1, when PV systems are installed on every floor, the total carbon reduction potential reaches 9501.12 kgCO2. However, as the number of non-PV-installed floors increases, the carbon savings gradually decline. Meanwhile, the carbon reduction per unit investment (kgCO2/¥) increases from 0.07 kgCO2/¥ to 0.10 kgCO2/¥, indicating that although expanding the PV installation area improves overall carbon reduction, the marginal return diminishes, and reducing a few installation floors may lead to higher carbon-saving efficiency per unit cost. In renovation 2, the total carbon reduction is significantly higher than that of renovation 1. When PV systems are installed on all floors, the carbon reduction potential reaches 14,505.15 kgCO2, well above renovation 1. The carbon savings per yuan (kgCO2/¥) increase from 0.05 kgCO2/¥ to 0.22 kgCO2/¥, particularly when PV installation is omitted from the bottom five floors. This suggests that excluding less efficient PV areas can substantially enhance the return on investment in terms of carbon reduction, potentially due to higher efficiency or better positioning of the remaining PV systems. Under renovation 3, the carbon reduction potential is also significant. When all floors are equipped with PV, the carbon reduction reaches 15,521.50 kgCO2, the highest among the three configurations. However, the carbon reduction per yuan (kgCO2/¥) initially exhibits a diminishing return trend, increasing from 0.04 kgCO2/¥ to 0.09 kgCO2/¥ as fewer floors are equipped with PV. This suggests that while total carbon reduction increases with expanded PV coverage, economic efficiency improves when low-performing areas are excluded.

3.2.4. Carbon Reduction Capacity of High-Rise Buildings

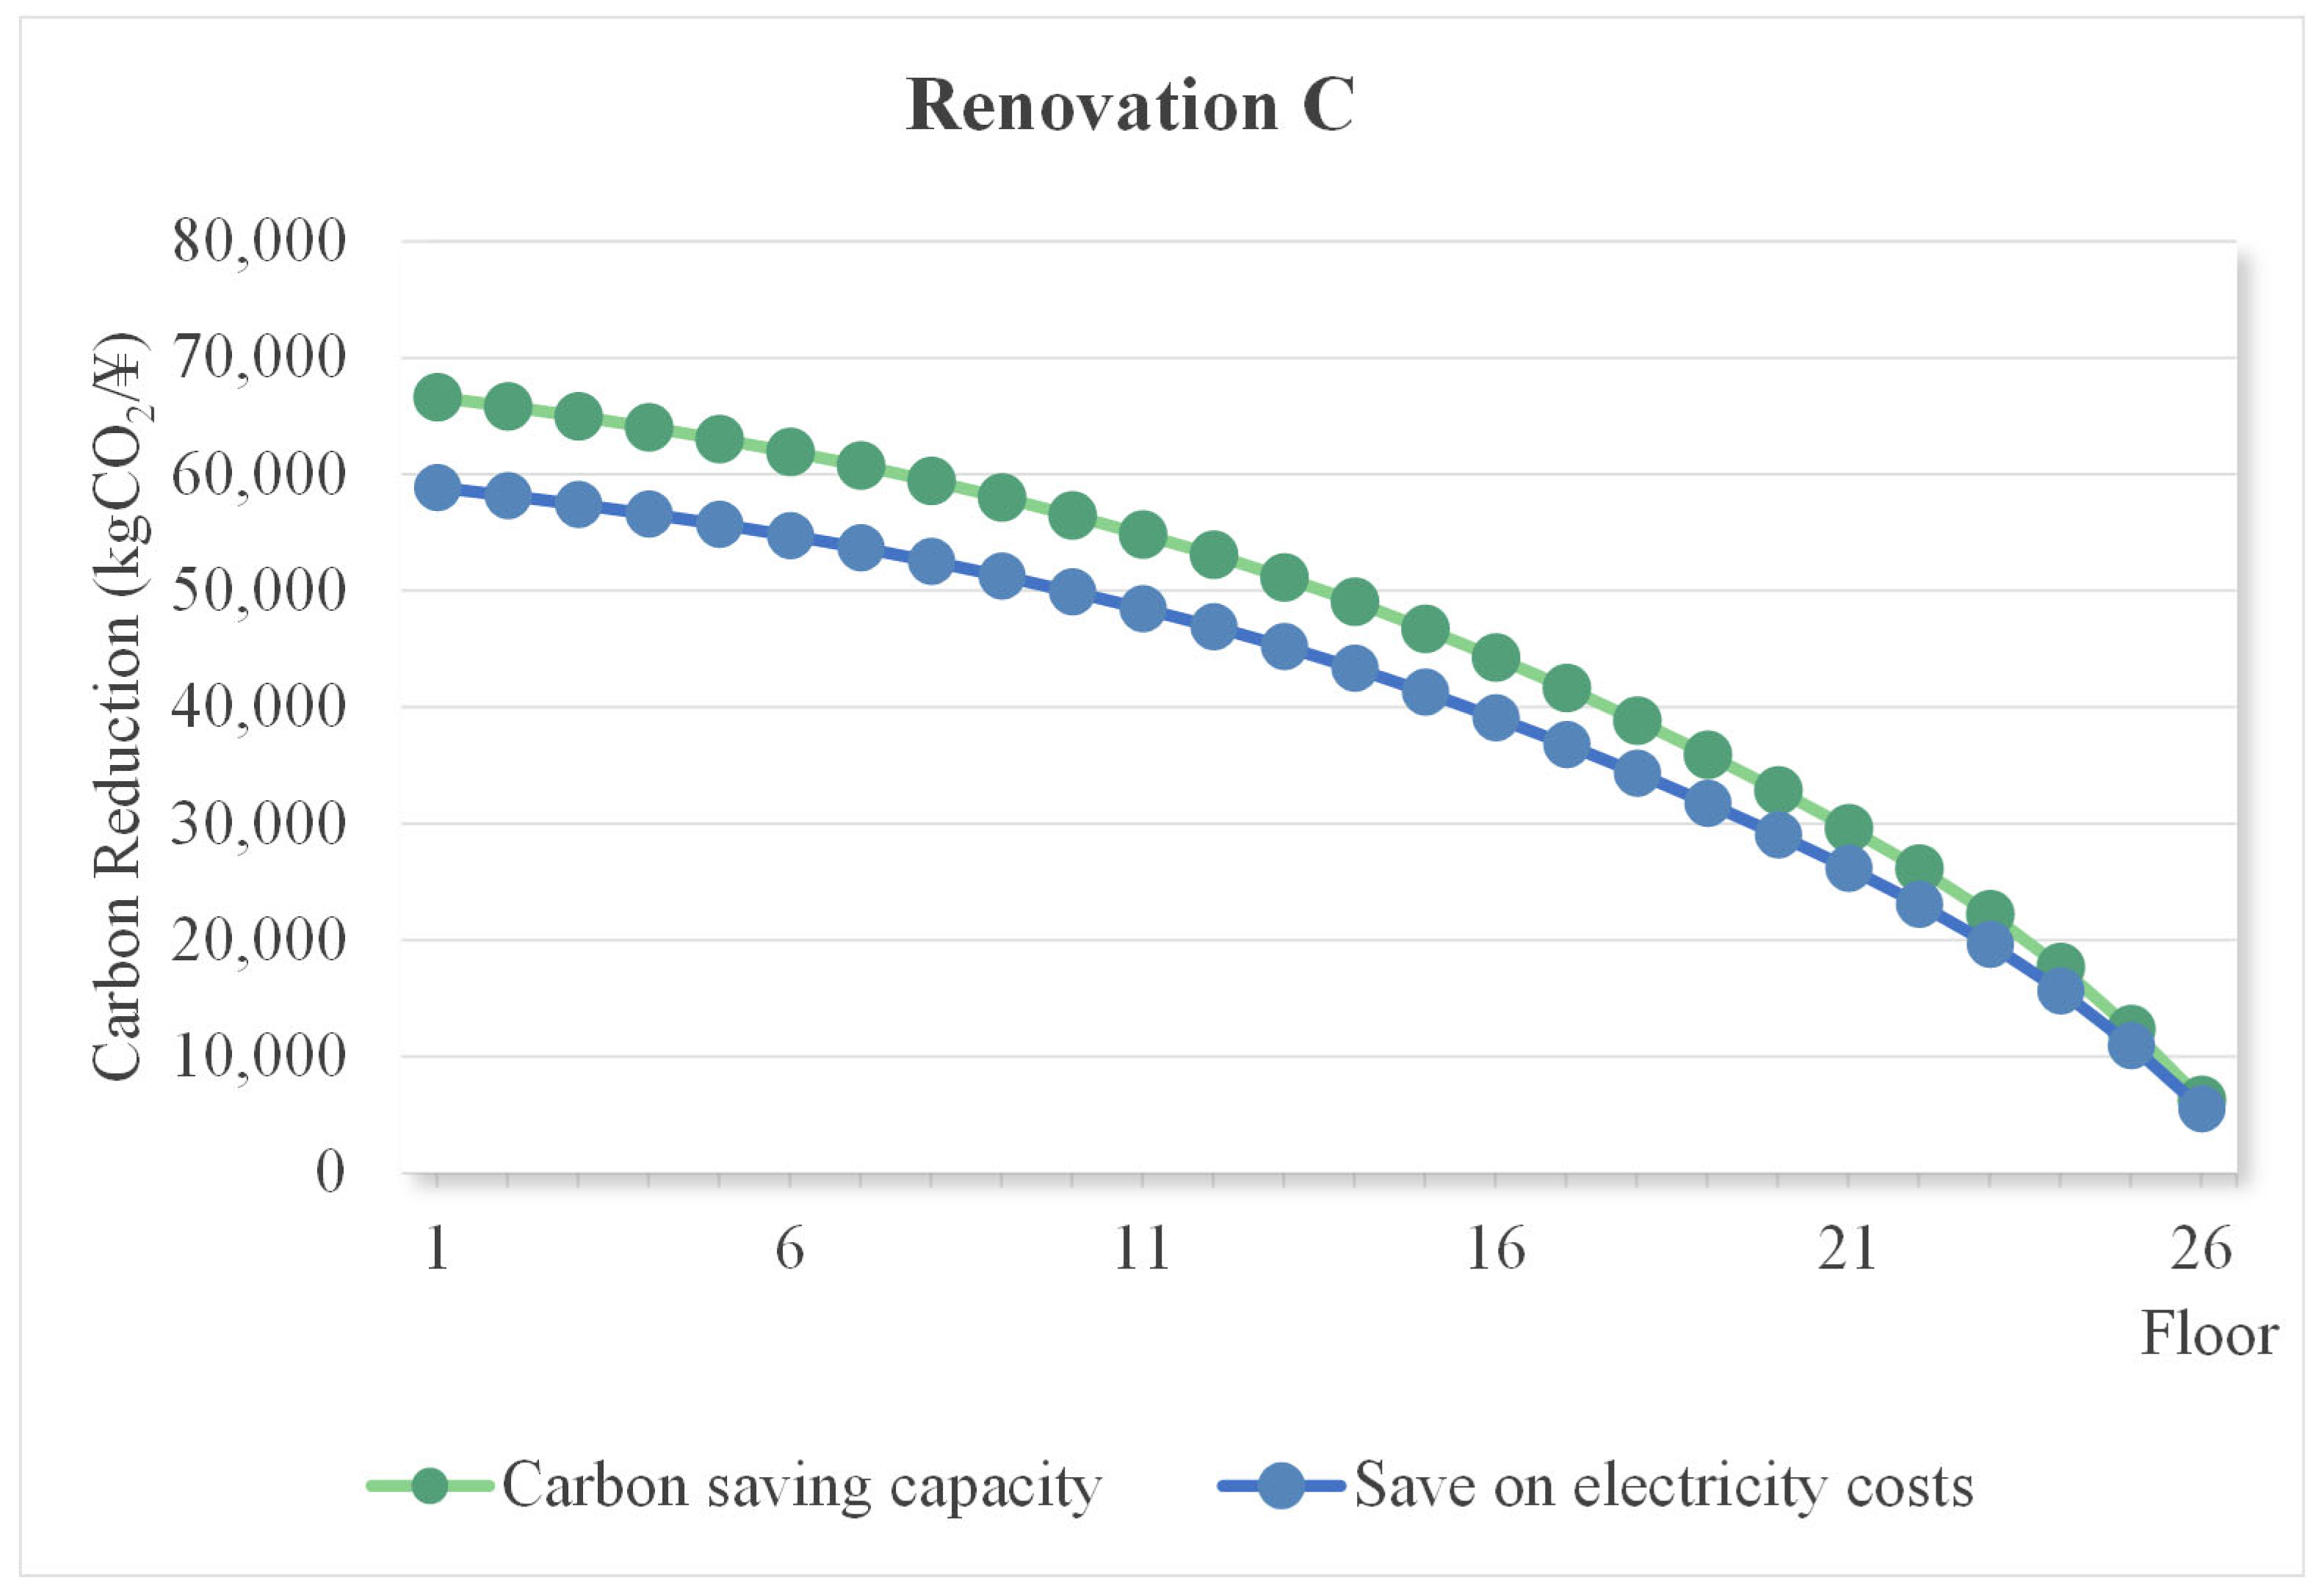
As shown in Figure 18, Figure 19, Figure 20 and Figure 21, for high-rise buildings, under renovation 1, the carbon reduction capacity reaches 41,041.81 kgCO2 when PV systems are installed on every floor. As the number of floors without PV installations increases, the total carbon reduction gradually decreases. Meanwhile, the carbon reduction per unit investment (kgCO2/¥) shows a slight upward trend, increasing from 0.06 kgCO2/¥ to 0.10 kgCO2/¥ as installation coverage decreases. Compared to renovation 1, renovation 2 exhibits a significantly higher overall carbon reduction capacity. When PV panels are installed on all floors, the carbon savings reach 65,697.35 kgCO2, substantially exceeding the 41,041.81 kgCO2 of renovation 1. However, the carbon reduction efficiency per unit investment increases only slightly—from 0.05 kgCO2/¥ to 0.10 kgCO2/¥—as the number of installation floors decreases, indicating an insignificant change. In renovation 3, the carbon reduction performance is similarly substantial, reaching 66,686.34 kgCO2 with PV panels installed on every floor—higher than both renovation 1 and renovation 2. However, as with the other two approaches, the change in carbon reduction efficiency per unit investment remains limited, increasing gradually from 0.04 kgCO2/¥ to 0.10 kgCO2/¥.

4. Discussion

This manuscript explores the impact of photovoltaic (PV) panel installation on building facades on building energy consumption and carbon emissions. The results indicate that façade-integrated photovoltaics demonstrate significant potential in reducing both energy use and carbon emissions. Three façade renovation strategies were simulated and analyzed for their energy performance, carbon mitigation potential, and economic feasibility.

4.1. Impact of PV Façade Design on Building Energy Performance

Simulation results show that renovation 3 (comprehensive renovation) performs best in terms of total electricity generation (multistory: 514,703.56 kWh; high-rise: 234,968.79 kWh). This aligns with the findings of Ordoumpozanis [36], who concluded that maximizing solar exposure on south-facing façades significantly improves PV output. However, this study further reveals that the effective generation ratio (i.e., the proportion of effective to total generation) increases significantly as lower floors are excluded from PV installation. For example, in renovation 1 (window-integrated PV), the ratio improves from 72.57% to 99.52%, indicating better economic performance for window-based PV systems.
This trend is similar to the empirical findings by Wu [12] in hot climates. However, due to the lower cooling demand in Xi’an’s spring and summer seasons (a cold climate), the effective generation ratio here is even higher (72.57–99.52%). Both studies confirm that although the initial investment may be high, such strategies deliver long-term benefits in energy output. Moreover, full-scale PV installation significantly enhances effective energy generation, reinforcing the conclusions drawn by Ordoumpozanis [36].
That said, the current study diverges from Ordoumpozanis [36] in warm climates: while maximizing sunlit area boosts PV performance, the reduction in cooling load due to BIPV is limited in Xi’an, and in some cases, cooling energy demand increases. For instance, in multistory buildings under renovation 1, the coefficient for cooling energy savings becomes negative (–26.42 ¥/kWh). This finding complements the observations by Wu [12], where in tropical regions with high cooling loads, PV generation is immediately consumed. In contrast, Xi’an’s relatively low cooling demand during spring and summer leads to underutilization of surplus electricity.
This contradiction can be attributed to two mechanisms: shading-induced load increase and module temperature rise effects. In winter, Xi’an requires maximum solar heat gain, while PV panels partially block direct radiation, increasing heating demand. In summer, insufficient ventilation of PV modules leads to elevated panel temperatures, which in turn increase building cooling loads, similar to the conclusion of Han [21].
These results challenge the generalized belief that “PV shading necessarily saves energy” and highlight the crucial influence of climate conditions on BIPV performance. In cold climates, co-optimization of shading and insulation is essential. For instance, Pu [16] proposed spectrally selective films that reduce indoor temperature by 4.7 °C while sacrificing only 9% of PV efficiency—offering new strategies for cold-region applications. This supports the conclusion of Yang [13], who emphasized the need to optimize PV layouts to match seasonal load profiles in cold climates.
For high-rise buildings, this study suggests that eliminating PV systems from lower floors improves overall system efficiency. In renovation 2 (wall-integrated PV), when PV is removed from the bottom 20 floors, the effective generation ratio reaches 87.17%. This strategy aligns with Dehwah [37], who observed that PV panels on lower floors experience up to 18% efficiency loss due to vegetation shading. This study’s quantitative model further demonstrates that removing lower-floor PV panels significantly improves unit carbon reduction per investment (renovation 2: from 0.05 to 0.22 kgCO2/¥). It thus offers a practical threshold floor level (≥20 floors) for optimal PV placement—filling the methodological gap left by prior qualitative research.

4.2. Economic Feasibility and Carbon Reduction Performance

Although fully deploying photovoltaic (PV) systems increases electricity generation, it also results in higher upfront investment costs. Simulation results indicate that reducing PV installations on lower floors can effectively lower capital expenditure while maintaining relatively high energy self-sufficiency. For example, in high-rise buildings, renovation 2 (wall-based PV) achieves optimal cost performance when PV modules are omitted on the first 20 floors. This finding provides a new perspective for optimizing the economic feasibility of BIPV, complementing literature 25, which showed that the static payback period of colorful PV windows on the Arc de Triomphe is slightly shorter than that of traditional wall-mounted PV systems. This aligns with our study’s conclusion that renovation 1 (window-based PV) offers the best economic performance, largely due to the lightweight nature and lower installation costs of thin-film PV modules.
Our study further reveals that the economic advantage of renovation 1 originates from the lower material density of thin-film PV (Table 3 1800 kg/m3 vs. 2500 kg/m3 for monocrystalline silicon), which reduces costs by more than 30%. This conclusion is consistent with the results of Gholami, H et al. [38], who showed that the energy payback period of thin film photovoltaic technology was significantly lower than that of crystalline silicon technology. In contrast, renovation 2 can achieve positive net returns under specific high-rise configurations by avoiding inefficient investments, closely aligning with the goal of “gradient PV distribution strategy” optimized by Sun et al. (2024) using genetic algorithms [39].
Although renovation 3 (integrated PV on both walls and windows) yields the highest total carbon reduction (high-rise: 66,686.34 kgCO2), its carbon reduction per unit of investment decreases progressively as installation area expands (renovation 3: 0.05 kgCO2/¥ vs. renovation 2: 0.17 kgCO2/¥). Life Cycle Assessment (LCA) studies have indicated that embodied carbon of PV systems may account for 12–25% of total carbon savings [3]. Thus, over-scaling can diminish net carbon benefits. Our findings confirm that removing lower-floor PV improves carbon efficiency per yuan invested (renovation 2: 0.05 → 0.22 kgCO2/¥), validating this optimization logic.
Therefore, the proposed “precision floor-cutting” strategy—installing PV modules only on floors above the 20th level in high-rise buildings—can significantly enhance carbon reduction cost-effectiveness, aligning with the IPCC (2023)’s emphasis on “regionally differentiated emission reduction pathways” [1], and offering novel insights for policy-makers.
The 3–6 ¥/W interval spans observed Chinese BIPV quotations: the lower bound (about 3 ¥/W) aligns with bulk thin-film laminates integrated into repeatable curtain-wall tracks, whereas the upper bound (about 6 ¥/W) corresponds to small-batch mono-Si framed modules that demand bespoke brackets, perimeter sealing and possible grid upgrades. Within this EPC range, a one-unit cost reduction consistently yields a steeper improvement in carbon-efficiency than an equivalent expansion of module area. Taking renovation-3 as an example, each additional square metre beyond the 20th-floor threshold generates progressively less electricity (owing to sub-optimal orientation and heightened mutual shading), so the marginal CO2 saving per extra yuan invested declines. Conversely, when the same investment is allocated to cost-control measures—bulk procurement, standardized mounting rails, or repetitive curtain-wall integration—the embodied carbon per watt is lowered without compromising generation potential. At EPC values above about 4 ¥/W, curtailing area and prioritizing cost-minimization raises the kg CO2 abated per yuan by up to 0.10, whereas further area increments improve the metric by less than 0.02. Under current price structures, suppressing installed cost is a more effective lever for enhancing life-cycle carbon cost-effectiveness than indiscriminate enlargement of the PV envelope.

4.3. Research Limitations and Future Directions

Geographical Applicability: The conclusions are based on climate data from Xi’an, a region with both cooling demand in summer and heating demand in winter. These energy use characteristics may not apply to buildings in other climatic zones.
Lack of Energy Storage Consideration: The manuscript assumed that PV electricity is consumed instantaneously on site and that any surplus is curtailed rather than exported; no battery or grid-feed-in pathway was modelled. This treatment inherently discards all energy generated above the real-time load, thereby underestimating the façade’s technical potential and overestimating the building’s residual grid demand during evening peaks. Without storage, these clipped kilowatt-hours cannot be shifted to later high-price periods, so the true economic penalty of PV spillage and the required system oversizing remain hidden. Future analyses will introduce storage capacity as a sensitivity parameter to quantify how on-site batteries or thermal buffers could reclaim clipped energy and further reduce operational carbon and cost.
Aesthetic Integration: The aesthetic enhancement of building facades through colorful PV modules has not been quantified. This aspect holds significant value for the promotion of BIPV systems and should be addressed in future studies.
Life-cycle Carbon Emissions: The present study quantifies the net operational-energy savings attributable to the PV façade, yet it stops at the operational boundary. Embodied carbon phases—raw-material extraction, manufacturing, transport, on-site installation, end-of-life dismantling and recycling—were not included. Both PV-panel and building-component production generate embodied carbon, and because module service life seldom matches that of the building, replacement cycles must also be accounted for. Future work should couple the operational model with cradle-to-grave LCA data to verify if the façade remains carbon-negative when these upstream and downstream burdens are considered.
Based on the above limitations, future research could explore the application potential of next-generation PV materials such as perovskite photovoltaics, and develop climate-adaptive designs to optimize year-round system energy efficiency and carbon performance. Additionally, integrating energy storage systems with BIPV can further improve system stability and economic value. Performance differences of BIPV under diverse climatic conditions should also be investigated to provide more regionally adapted design guidance. Moreover, incorporating intelligent control systems could optimize operational strategies and enhance energy utilization efficiency.

5. Conclusions

Through a combination of urban field investigation and simulation analysis, this study explored integrated design strategies for photovoltaic (PV) building façades and quantitatively evaluated their impacts on building energy performance, carbon reduction potential, and economic benefits. Using Xi’an as a case study, three types of PV-integrated façade retrofitting strategies were proposed.
Simulation results indicate that for multi-story buildings, a full façade retrofit (Renovation 3) yielded the highest annual electricity generation of 514,703.56 kWh and an annual carbon reduction of 15,521.50 kgCO2. For high-rise buildings, a “precision floor-cutting” strategy was identified as optimal: installing PV modules only above the 20th floor increased the effective generation ratio from 45.24% to 87.17%, while the carbon reduction efficiency per unit investment improved from 0.05 to 0.22 kgCO2/¥. Under a full installation scenario, Renovation 3 achieved a maximum total carbon reduction of 66,686.34 kgCO2, although wall-based retrofitting (Renovation 2) exhibited superior cost-effectiveness.
These findings demonstrate that optimizing the number of floors equipped with PV modules and their layout strategies can significantly enhance both energy self-sufficiency and carbon mitigation efficiency in residential PV façade retrofits. Specifically, in multi-story buildings, the full façade retrofit achieved the highest energy generation and carbon savings. In high-rise buildings, although installing PV across all floors resulted in the greatest absolute carbon reduction, diminishing marginal returns were observed. Omitting PV installation on the lower 20 floors not only increased the effective generation ratio substantially but also improved carbon reduction efficiency per unit investment, effectively doubling cost-effectiveness without significantly compromising overall energy self-sufficiency. This supports the adoption of precision “floor-cutting” strategies to simultaneously optimize economic and environmental performance.

Author Contributions

Conceptualization, Y.Y.; Data curation, A.Y. and M.W.; Funding acquisition, Y.Y.; Investigation, X.L., Z.Y., A.Y. and M.W.; Methodology, Y.Y.; Software, X.L.; Formal analysis, X.L. and Z.Y.; Supervision, Y.Y.; Visualization, X.L., Z.Y., A.Y. and M.W.; Writing—original draft, X.L., Z.Y., A.Y. and M.W.; Writing—review and editing, Y.Y. All authors have read and agreed to the published version of the manuscript.

Funding

This work was supported by the National Natural Science Foundation of China (No. 52208032).

Data Availability Statement

The data presented in this study are available on request from the authors.

Conflicts of Interest

The authors declare no conflicts of interest.

References

  1. IPCC. Climate Change 2022: Mitigation of Climate Change; Cambridge University Press: Cambridge, UK, 2023. [Google Scholar] [CrossRef]
  2. Kim, S. Prefabricated and Modularized Residential Construction: A Review of Present Status, Opportunities, and Future Challenges. Buildings 2025, 15, 2889. [Google Scholar] [CrossRef]
  3. Aguacil, S.; Duque, S.; Lufkin, S.; Rey, E. Designing with building-integrated photovoltaics (BIPV): A pathway to decarbonize residential buildings. J. Build. Eng. 2024, 96, 110486. [Google Scholar] [CrossRef]
  4. Kalua, A. Envelope Thermal Design Optimization for Urban Residential Buildings in Malawi. Buildings 2016, 6, 13. [Google Scholar] [CrossRef]
  5. Ascione, F.; Bianco, N.; De Masi, R.F.; Mauro, G.M.; Vanoli, G.P. Energy retrofit of educational buildings: Transient energy simulations, model calibration and multi-objective optimization towards nearly zero-energy performance. Energy Build. 2017, 144, 303–319. [Google Scholar] [CrossRef]
  6. Basher, M.K.; Nur-E-Alam, M.; Rahman, M.M.; Alameh, K.; Hinckley, S. Aesthetically Appealing Building Integrated Photovoltaic Systems for Net-Zero Energy Buildings. Current Status, Challenges, and Future Developments—A Review. Buildings 2023, 13, 863. [Google Scholar] [CrossRef]
  7. Qin, X.; Yin, J.; Haron, N.A.; Alias, A.H.; Law, T.H.; Bakar, N.A. Status, Challenges and Future Directions in the Evaluation of Net-Zero Energy Building Retrofits: A Bibliometrics-Based Systematic Review. Energies 2024, 17, 3826. [Google Scholar] [CrossRef]
  8. Intal, D.; Ebong, A.U. Thin-Film Solar Photovoltaics: Trends and Future Directions. arXiv 2025, arXiv:2508.05589. [Google Scholar] [CrossRef]
  9. Zhu, X.; Lv, Y.; Bi, J.; Jiang, M.; Su, Y.; Du, T. Techno-Economic Analysis of Rooftop Photovoltaic System under Different Scenarios in China University Campuses. Energies 2023, 16, 3123. [Google Scholar] [CrossRef]
  10. Wang, W.; Xu, K.; Song, S.; Bao, Y.; Xiang, C. From BIM to digital twin in BIPV: A review of current knowledge. Sustain. Energy Technol. Assess. 2024, 67, 103855. [Google Scholar] [CrossRef]
  11. Deng, M.H.; Sun, Y.M.; Ye, W.K.; Zhang, W.H. Photovoltaic façade design and experimental measurement in public buildings: Case study of Guangzhou Art Museum (New Wing). Archit. J. 2024, S1, 140–146. (In Chinese) [Google Scholar]
  12. Wu, X.; Wang, Y.; Deng, S.; Su, P. Climate-Responsive Design of Photovoltaic Façades in Hot Climates: Materials, Technologies, and Implementation Strategies. Buildings 2025, 15, 1648. [Google Scholar] [CrossRef]
  13. Yang, H.; Liu, X.; Wang, C.; Shen, C.; Han, R.; Kalogirou, S.A.; Wang, J. Investigation on the heating performance of a BIPV/T façade coupled with direct-expansion heat pump system in severe cold region. Renew. Energy 2024, 232, 121065. [Google Scholar] [CrossRef]
  14. El Samanoudy, G.; Mahmoud, N.S.A.; Jung, C. Analyzing the effectiveness of building integrated Photovoltaics (BIPV) to reduce the energy consumption in Dubai. Ain Shams Eng. J. 2024, 15, 102682. [Google Scholar] [CrossRef]
  15. Wang, X.; Li, T.; Yu, Y.; Liu, X.; Liu, Y.; Wang, S.; Li, G.; Mao, Q. Energy saving and economic analysis of a novel PV/T coupled multi-source heat pump heating system with phase change storage: A case study in cold zone in China. Energy Convers. Manag. 2024, 312, 118574. [Google Scholar] [CrossRef]
  16. Pu, J.; Xu, D.; Shen, C.; Lu, L. Broadband-spectrally selective polymeric film for building integrated photovoltaic (BIPV) skylights cooling. Energy Convers. Manag. 2025, 326, 119453. [Google Scholar] [CrossRef]
  17. Gholamian, E.; Barmas, R.B.; Zare, V.; Ranjbar, S.F. The effect of Incorporating phase change materials in building envelope on reducing the cost and size of the integrated hybrid-solar energy system: An application of 3E dynamic simulation with reliability consideration. Sustain. Energy Technol. Assess. 2022, 52, 102067. [Google Scholar] [CrossRef]
  18. Hussien, A.; Khan, W.; Hussain, A.; Liatsis, P.; Al-Shamma’a, A.; Al-Jumeily, D. Predicting energy performances of buildings’ envelope wall materials via the random forest algorithm. J. Build. Eng. 2023, 69, 106263. [Google Scholar] [CrossRef]
  19. Kong, J.; Dong, Y.; Poshnath, A.; Rismanchi, B.; Yap, P.-S. Application of Building Integrated Photovoltaic (BIPV) in Net-Zero Energy Buildings (NZEBs). Energies 2023, 16, 6401. [Google Scholar] [CrossRef]
  20. Salameh, T.; Assad, M.E.H.; Tawalbeh, M.; Ghenai, C.; Merabet, A.; Öztop, H.F. Analysis of Cooling Load on Commercial Building in UAE Climate Using Building Integrated Photovoltaic Façade System. Sol. Energy 2020, 199, 617–629. [Google Scholar] [CrossRef]
  21. Han, J.; Lu, L.; Peng, J.; Yang, H. Performance of Ventilated Double-Sided PV Façade Compared with Conventional Clear Glass Façade. Energy Build. 2013, 56, 204–209. [Google Scholar] [CrossRef]
  22. IEA. Renewables 2023: Analysis and Forecast to 2028; International Energy Agency: Paris, France, 2023; Available online: https://www.iea.org/reports/renewables-2023 (accessed on 16 September 2024).
  23. Ali, O.M.; Alomar, O.R. Technical and economic feasibility analysis of a PV grid-connected system installed on a university campus in Iraq. Environ. Sci. Pollut. Res. 2023, 30, 15145–15157. [Google Scholar] [CrossRef]
  24. Bus, A.; Hasny, M.; Hewelke, E.; Szelągowska, A. The Power of Sun—A Comparative Cost–Benefit Analysis of Residential PV Systems in Poland. Sustainability 2025, 17, 5446. [Google Scholar] [CrossRef]
  25. Lekbir, A.; Zaoui, F.; Khenfer, R.; Tey, K.S.; Mekhilef, S. A comprehensive energy, exergy, economic, and environmental impact assessment of building-integrated photovoltaic systems. Clean Technol. Environ. Policy 2024, 27, 4711–4726. [Google Scholar] [CrossRef]
  26. GlobalABC. Buildings and Climate Change: Global Status Report 2024. UN Environment Programme. 2024. Available online: https://globalabc.org/index.php/global-status-report (accessed on 1 May 2025).
  27. Fan, X.Y.; Wu, J.W.; Wang, G.; Du, J.F. Low-carbon rebirth of Kaixuan Building: Integrated colored photovoltaic renovation of high-rise buildings. Chin. Overseas Archit. 2024, 7, 102–107. (In Chinese) [Google Scholar] [CrossRef]
  28. Jhumka, H.; Yang, S.; Gorse, C.; Wilkinson, S.; Yang, R.; He, B.-J.; Prasad, D.; Fiorito, F. Assessing heat transfer characteristics of building envelope deployed BIPV and resultant building energy consumption in a tropical climate. Energy Build. 2023, 298, 113540. [Google Scholar] [CrossRef]
  29. Rosa, F. Building-Integrated Photovoltaics (BIPV) in Historical Buildings: Opportunities and Constraints. Energies 2020, 13, 3628. [Google Scholar] [CrossRef]
  30. Khan, Z.U.; Khan, A.D.; Khan, K.; Al Khatib, S.A.K.; Khan, S.; Khan, M.Q.; Ullah, A. A Review of Degradation and Reliability Analysis of a Solar PV Module. IEEE Access 2024, 12, 185036–185056. [Google Scholar] [CrossRef]
  31. Ogundipe, O.B.; Okwandu, A.C.; Abdulwaheed, S.A. Recent advances in solar photovoltaic technologies: Efficiency, materials, and applications. GSC Adv. Res. Rev. 2024, 20, 159–175. [Google Scholar] [CrossRef]
  32. Chen, Z.; Cui, Y.; Cai, H.; Zheng, H.; Ning, Q.; Ding, X. Multi-objective optimization of photovoltaic facades in prefabricated academic buildings using transfer learning and genetic algorithms. Energy 2025, 328, 136470. [Google Scholar] [CrossRef]
  33. GB 50368-2005; Residential Building Code. China Architecture & Building Press: Beijing, China, 2005.
  34. GB 50189-2015; Design Standard for Energy Efficiency of Public Buildings. China Architecture & Building Press: Beijing, China, 2015.
  35. Gessey PV Consulting. China Solar PV Prices Report. 2023. Available online: https://www.linkedin.com/pulse/china-solar-pv-prices-week-37-taiyangnews (accessed on 1 May 2025).
  36. Ordoumpozanis, K.; Theodosiou, T.; Bouris, D.; Tsikaloudaki, K. Energy and thermal modeling of building façade integrated photovoltaics. Therm. Sci. 2018, 22, 921–932. [Google Scholar] [CrossRef]
  37. Dehwah, A.H.A.; Asif, M.; Budaiwi, I.M.; Alshibani, A. Techno-Economic Assessment of Rooftop PV Systems in Residential Buildings in Hot–Humid Climates. Sustainability 2020, 12, 10060. [Google Scholar] [CrossRef]
  38. Gholami, H.; Røstvik, H.N. Economic analysis of BIPV systems as a building envelope material for building skins in Europe. Energy 2020, 204, 117931. [Google Scholar] [CrossRef]
  39. Sun, C.; Lu, Y.; Ju, X. Experimental and numerical study to optimize building integrated photovoltaic (BIPV) roof structure. Energy Build. 2024, 309, 114070. [Google Scholar] [CrossRef]
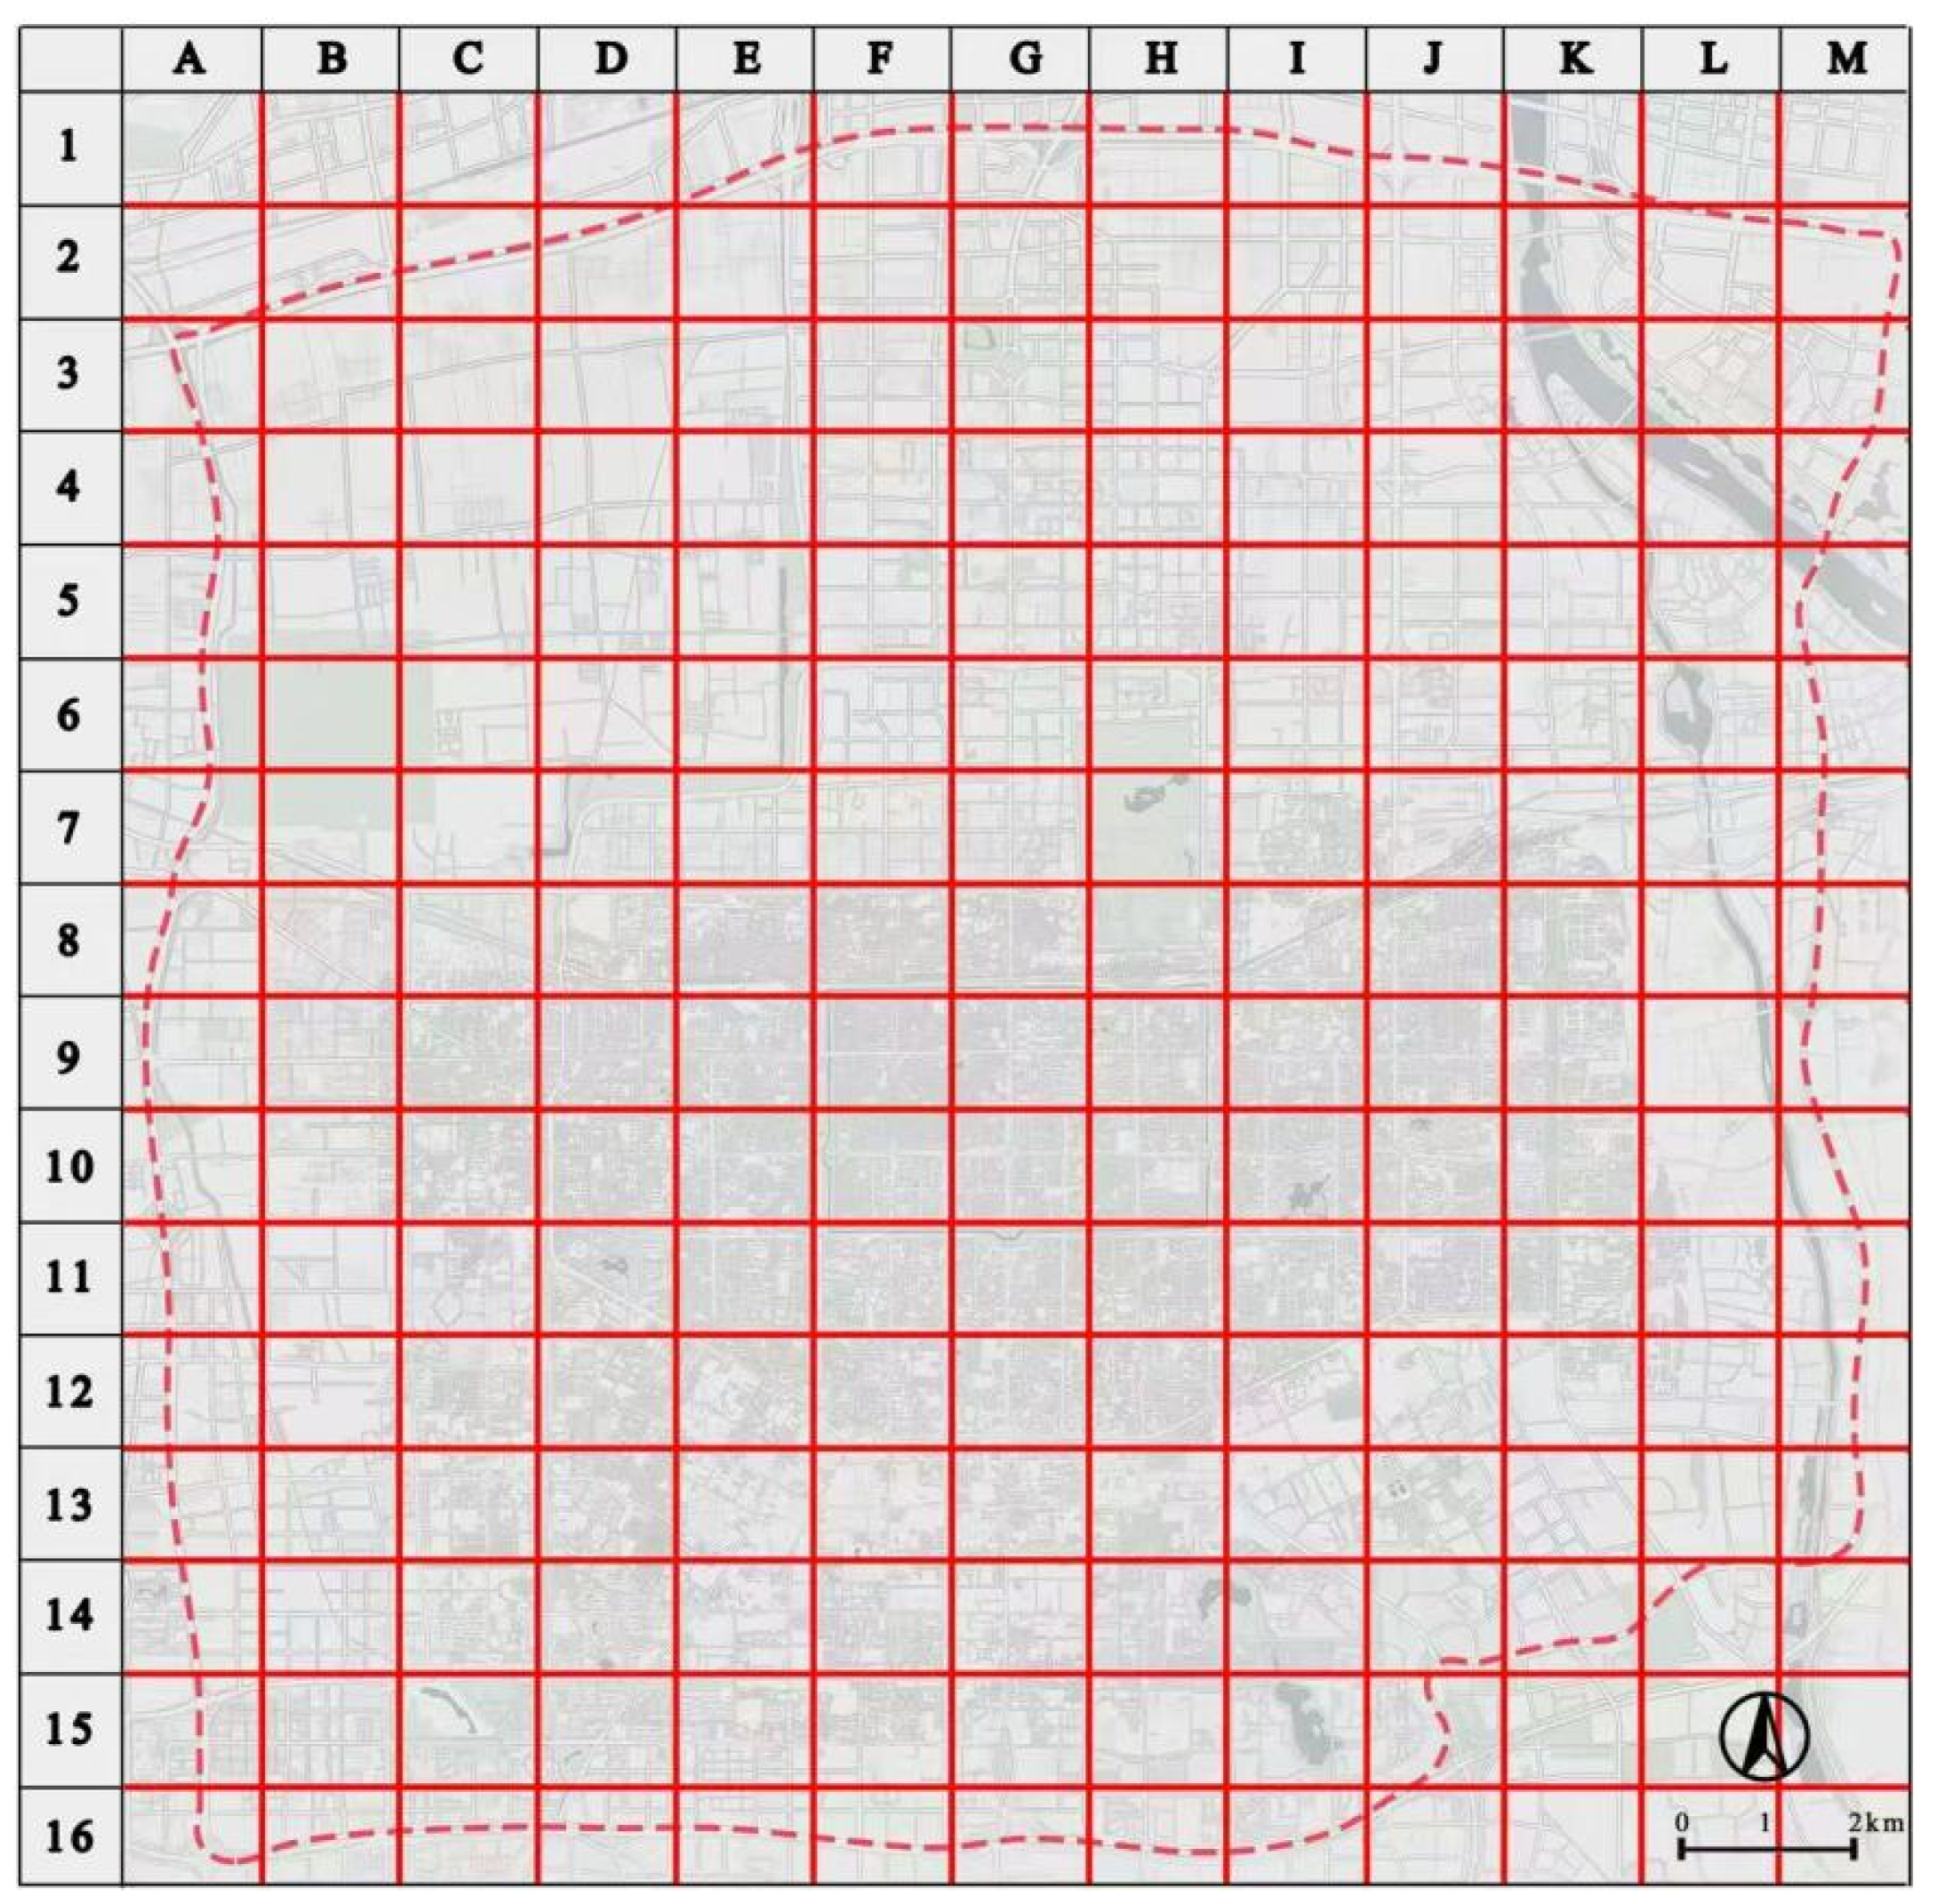
Figure 1. Regional Division.
Buildings 15 03762 g001
Figure 2. Building Plan Morphology.
Buildings 15 03762 g002
Figure 3. Window-Wall Types.
Buildings 15 03762 g003
Figure 4. Facade Colors.
Buildings 15 03762 g004
Figure 5. Model Placement Method.
Buildings 15 03762 g005
Figure 6. Relevant Factors of Effective Power Generation under Renovation A in Low-Rise Buildings.
Buildings 15 03762 g006
Figure 7. Relevant Factors of Effective Power Generation under Renovation B in Low-Rise Buildings.
Buildings 15 03762 g007
Figure 8. Relevant Factors of Effective Power Generation under Renovation C in Low-Rise Buildings.
Buildings 15 03762 g008
Figure 9. Relevant Factors of Effective Power Generation under Renovation A in High-Rise Buildings.
Buildings 15 03762 g009
Figure 10. Relevant Factors of Effective Power Generation under Renovation B in High-Rise Buildings.
Buildings 15 03762 g010
Figure 11. Relevant Factors of Effective Power Generation under Renovation C in High-Rise Buildings.
Buildings 15 03762 g011
Figure 12. Cost of Generating One Kilowatt-hour of Electricity under Three Renovation Strategies in Low-Rise Buildings.
Buildings 15 03762 g012
Figure 13. Cost of Generating One Kilowatt-hour of Electricity under Three Renovation Strategies in High-Rise Buildings.
Buildings 15 03762 g013
Figure 14. Carbon Reduction Performance under Renovation A in Low-Rise Buildings.
Buildings 15 03762 g014
Figure 15. Carbon Reduction Performance under Renovation B in Low-Rise Buildings.
Buildings 15 03762 g015
Figure 16. Carbon Reduction Performance under Renovation C in Low-Rise Buildings.
Buildings 15 03762 g016
Figure 17. Carbon Reduction per Unit Investment under Three Renovation Strategies in Low-Rise Buildings.
Buildings 15 03762 g017
Figure 18. Carbon Reduction Performance under Renovation A in High-Rise Buildings.
Buildings 15 03762 g018
Figure 19. Carbon Reduction Performance under Renovation B in High-Rise Buildings.
Buildings 15 03762 g019
Figure 20. Carbon Reduction Performance under Renovation C in High-Rise Buildings.
Buildings 15 03762 g020
Figure 21. Carbon Reduction per Unit Investment under Three Renovation Strategies in High-Rise Buildings.
Buildings 15 03762 g021
Table 1. Facade Photovoltaic Installation Methods for Models.
Renovation Method
Renovation 1: Renovation of the window part of the façade Thin-film photovoltaics on the south-facing windows of the building
Renovation 2: Renovation of the wall part of the façadeMonocrystalline silicon photovoltaic in the wall portion of the building under the south-facing windows.
Renovation 3: Total renovation of the building façadeThin-film photovoltaics are placed on the south-facing windows of the building and on the part of the wall below the windows of the building.
Table 2. Selected Thermal Performance Parameters.
ParametricRetrieve a Value
Sites34° N, 109° E
Simulation time1.1–12.31
Heat transfer coefficient of walls0.58 W/(m2·K)
Specific heat capacity of walls1062.3 J/(kg·K)
HVAC start-up conditionsHeating: 18 °C
Cooling: 26 °C
Cooling COP3.0
Thermal efficiency0.9
Table 3. Photovoltaic Parameter Settings.
ParameterCrystalline Silicon PhotovoltaicThin Film Photovoltaic
Design thickness7 mm3 mm
Densities2500 kg/m31800 kg/m3
Thermal conductivity0.2 W/(m·K)0.3 W/(m·K)
Specific heat capacity1000 J/(kg·K)1000 J/(kg·K)
Photovoltaic conversion efficiency0.20.12
TransmittanceWindowless60%
Rated power density180 W/m2120 W/m2
Nominal efficiency18%14%
Temperature coefficient−0.0045/°C−0.005/°C
Surface absorption rate0.90.85
Disclaimer/Publisher’s Note: The statements, opinions and data contained in all publications are solely those of the individual author(s) and contributor(s) and not of MDPI and/or the editor(s). MDPI and/or the editor(s) disclaim responsibility for any injury to people or property resulting from any ideas, methods, instructions or products referred to in the content.