Article

Optimized Gradient Boosting Framework for Data-Driven Prediction of Concrete Compressive Strength

1
China Gezhouba Group Co., Ltd., Yichang 443000, China
2
School of Civil Engineering, Chongqing Jiaotong University, Chongqing 400045, China
3
Xinjiang Transport Planning Survey and Design Institute Co., Ltd., Urumqi 830006, China
4
Xinjiang Key Laboratory for Safety and Health of Transportation Infrastructure in Alpine and High-Altitude Mountainous Areas, Urumqi 830006, China
5
Wuhan Era Architectural Design Co., Ltd., Wuhan 430012, China
6
College of Water Conservancy and Architectural Engineering, Shihezi University, Shihezi 832003, China
*
Author to whom correspondence should be addressed.
Buildings 2025, 15(20), 3761; https://doi.org/10.3390/buildings15203761
Submission received: 18 September 2025 / Revised: 12 October 2025 / Accepted: 15 October 2025 / Published: 18 October 2025
(This article belongs to the Section Building Materials, and Repair & Renovation)

Abstract

Given the significant impact of concrete’s compressive strength on structural service life, the development of accurate and efficient prediction methods is critically important. A hybrid machine learning modeling method based on the Whale Optimization Algorithm (WOA)-optimized XGBoost algorithm is proposed. Using 1030 sets of concrete mix proportion data covering eight key parameters—cement, blast furnace slag, fly ash, water, superplasticizer, coarse aggregate, fine aggregate, and curing age—the predictive performance of four models (linear regression, random forest, XGBoost, and WOA-XGBoost) was systematically compared. The results demonstrate that the WOA-XGBoost model achieved the highest goodness of fit (R2 = 0.9208, MSE = 4.5546), significantly outperforming the other models, and exhibited excellent generalization capability and robustness. Feature importance and SHAP analysis further revealed that curing age, cement content, and water content are the key variables affecting compressive strength, with blast furnace slag showing a significant marginal diminishing effect. This study provides a high-precision data-driven tool for optimizing mix proportions and predicting the strength of complex-component concrete, offering significant application value in promoting the resource utilization of industrial waste and advancing the development of green concrete.

1. Introduction

In recent years, the growing demand for sustainable materials in the construction industry has made the utilization of industrial and agricultural waste, such as fly ash, tailings, and sugarcane bagasse ash, as supplementary cementitious materials in concrete a major research focus [1]. These waste materials can partially replace cement, not only reducing carbon emissions and resource consumption but also potentially enhancing the mechanical properties and durability of concrete. However, the complex and highly variable composition of these wastes makes it difficult to optimize mix designs efficiently using traditional experimental methods [2]. Machine learning (ML) techniques, with their powerful capabilities for nonlinear fitting and high-dimensional data processing, offer a novel approach for predicting concrete strength. Models such as Random Forest (RF), Gradient Boosting Decision Tree (GBDT), Support Vector Machine (SVM), and Artificial Neural Networks (ANNs) have been successfully employed to predict the compressive strength of concrete incorporating fly ash, tailings, and sugar-cane bagasse ash [3,4,5,6]. Beyond predicting mechanical properties, the integration of interpretable machine learning (ML) is also advancing structural assessment and sustainable design. For instance, ML interpretation techniques like SHAP and LIME have been crucial for assessing cumulative damage in reinforced concrete frames under seismic sequences, identifying key drivers such as initial damage and ground motion intensity [7]. Meanwhile, at the micro-scale, Izadifar et al. [8] combined machine learning force fields with density functional theory to systematically investigate the dissolution mechanism of aluminate species in metakaolin, revealing the significant effects of hydration shell configuration and van der Waals interactions on activation energy. This underscores the value of explainable, data-driven models not only for optimizing concrete performance and promoting green materials [9] but also for enhancing structural resilience, highlighting their transformative potential across civil engineering. Through feature importance analysis and Partial Dependence Plots (PDPs), these studies have elucidated the influence mechanisms of key factors and identified their optimal ranges [10,11,12].
Al-Jamimi et al. [13] proposed a hybrid model combining SVM with a Genetic Algorithm (GA), achieving accurate prediction of the compressive strength for both ordinary and blended concrete (with a coefficient of determination, R2, reaching 0.99). Tayeh et al. [14] investigated the effects of sand gradation and supplementary cementitious materials on Ultra-High-Performance Concrete (UHPC), demonstrating that appropriate gradation and mix proportions can achieve compressive strengths of up to 175 MPa. Regarding aggregate selection, studies have indicated that angular, rough-textured crushed aggregates, along with an optimized ratio of coarse to fine aggregates, contribute to enhanced strength while maintaining permeability [15,16,17,18]. Sathiparan et al. [19] compared algorithms including XGBoost and ANN, finding that XGBoost could predict the strength of pervious concrete with high accuracy (R2 = 0.92) and confirmed that chemical components, primarily CaO and SiO2, had the most significant influence.
For long-term strength prediction, Ghafoorian Heidari et al. [20] integrated chemical admixtures with the NARX algorithm to study their combined effects, revealing that certain admixture combinations might lead to a decrease in strength over time. Khan et al. [21] utilized an ANN based on the Levenberg–Marquardt algorithm and a large dataset to achieve precise prediction of the compressive strength for both conventional and high-strength concrete, demonstrating excellent model generalizability.
Although machine learning has shown significant advantages in predicting the strength of concrete containing complex supplementary materials, existing research has predominantly focused on systems with single or limited types of additives [22,23,24]. There remains a relative lack of systematic studies on the synergistic effects of multiple parameters. Therefore, this study aims to develop machine learning prediction models based on eight key parameters—cement, blast furnace slag, fly ash, water, superplasticizer, coarse aggregate, fine aggregate, and curing age—to reveal the evolution mechanism of concrete compressive strength under the coupling effects of multiple factors. This work seeks to provide a comprehensive and reliable theoretical and modeling tool for optimizing mix proportions and predicting the performance of concrete incorporating complex waste components.

Research Significance and Objectives

The production of green concrete using industrial and agricultural waste is a crucial pathway for promoting low-carbon development in the construction sector. However, the significant performance variability of these wastes renders traditional mix design methods inefficient. While machine learning has excelled in predicting the strength of concrete with single additives, systematic research on the synergistic effects of multiple parameters and diverse waste materials is still insufficient. This research aims to establish a multi-parameter ML model to uncover the evolution patterns of concrete strength under the influence of complex, coupled factors, thereby providing data-driven support for the material design and engineering application of green concrete.
The specific objectives are as follows:
(1) In contrast to previous studies, which predominantly considered the interactions of only a limited number of variables, this research introduces a predictive model that incorporates eight parameters, namely, cement, blast furnace slag, fly ash, water, superplasticizer, coarse aggregate, fine aggregate, and curing age.
(2) Compared to the Linear Regression (LR) and Random Forest (RF) models, the XGBoost model demonstrated significantly superior performance on both evaluation metrics: the coefficient of determination (R2) and the mean squared error (MSE). Furthermore, the WOA-XGBoost model, enhanced by the Whale Optimization Algorithm (WOA), exhibited a marked advantage in hyperparameter search efficiency when compared to both manual tuning and grid search methods.
(3) Based on feature importance analysis and Partial Dependence Plots (PDPs), this study elucidates the influence mechanisms of multi-factor interactions on compressive strength and identifies the optimal ranges of key parameters, thereby providing both data-driven support and a theoretical basis for mix proportion optimization and performance regulation of complex composite industrial and agricultural waste concrete.
This study aims to systematically predict the compressive strength of concrete under multi-parameter coupling effects using machine learning methods, offering an intelligent solution for the mix design and engineering application of green, high-performance concrete.

2. Database of Concrete Compressive Strength

The compressive strength of high-strength concrete is not only determined by cement content, water-to-cement ratio, and curing time but also involves complex interaction mechanisms with various supplementary cementitious materials (such as blast furnace slag and fly ash) and chemical admixtures (such as superplasticizers). Based on this, the present study identifies eight core independent variables: cement (kg/m3), blast furnace slag (kg/m3), fly ash (kg/m3), water (kg/m3), superplasticizer (kg/m3), coarse aggregate (kg/m3), fine aggregate (kg/m3), and curing age (days). To meet the requirements of machine learning algorithms for large-scale, high-quality datasets, a total of 1030 sets of concrete mix proportions and strength data with clearly defined compositions and covering a wide range of mix ratios were collected and systematically visualized [25].
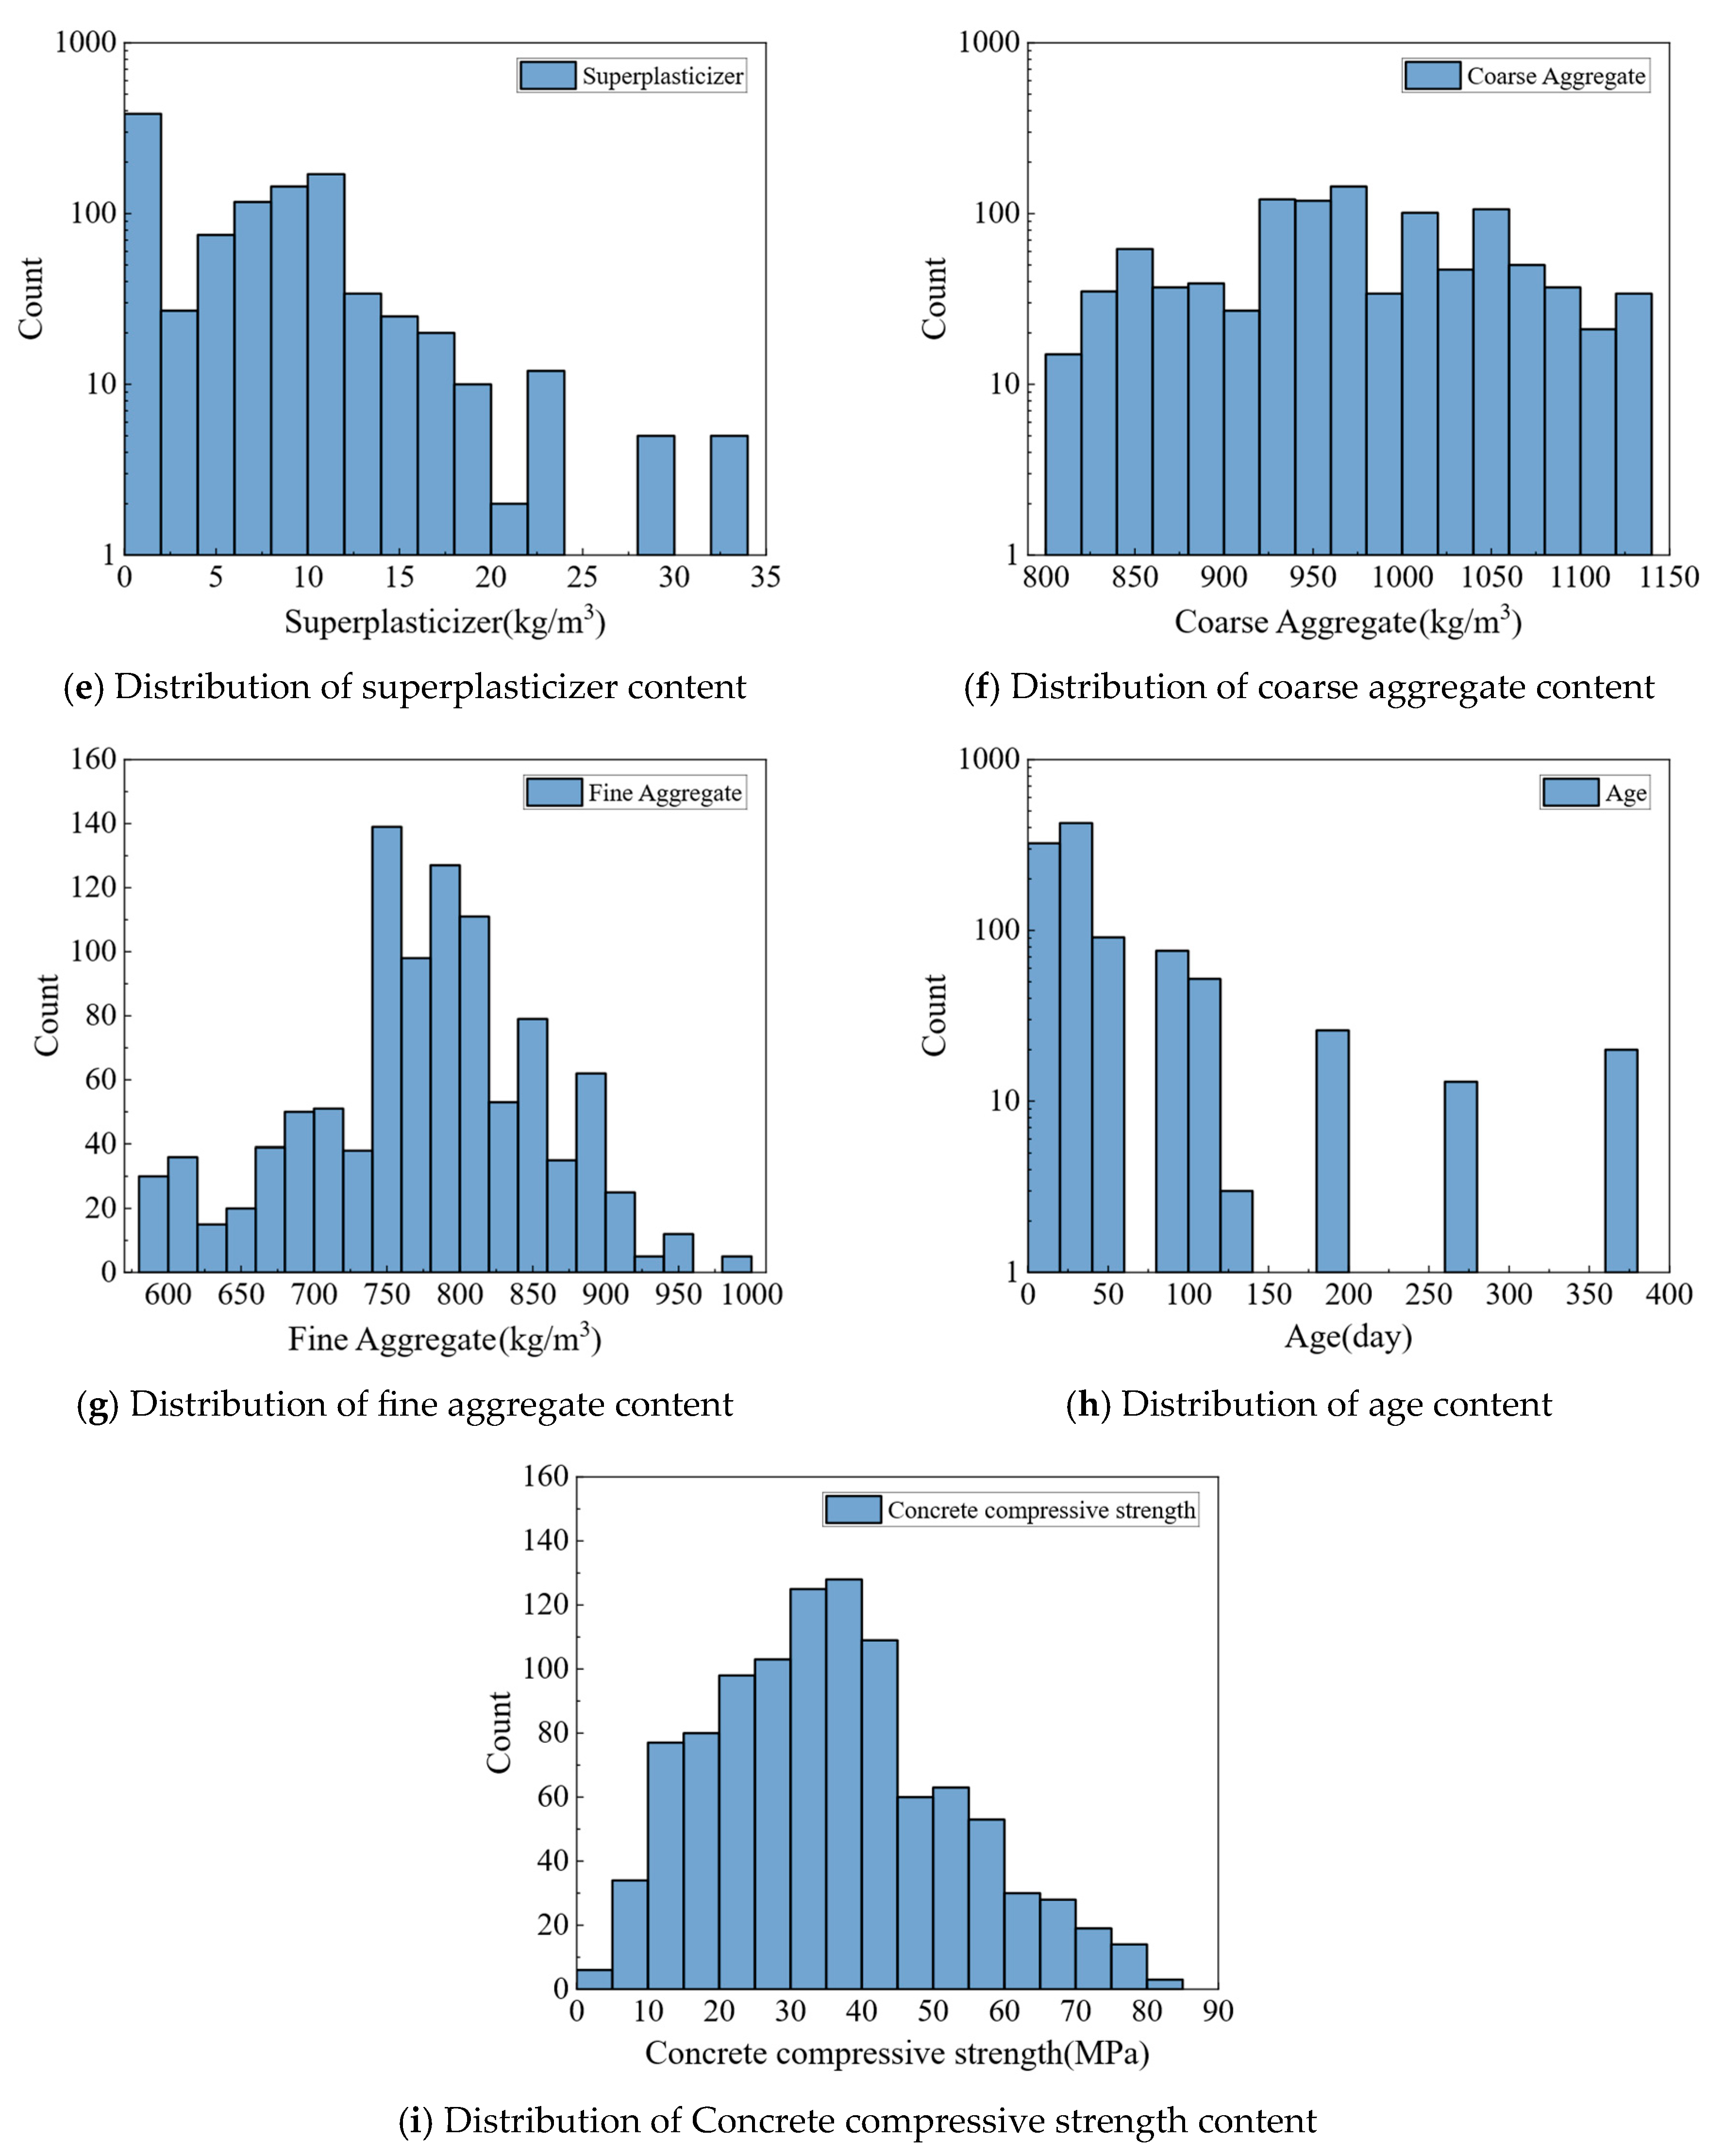
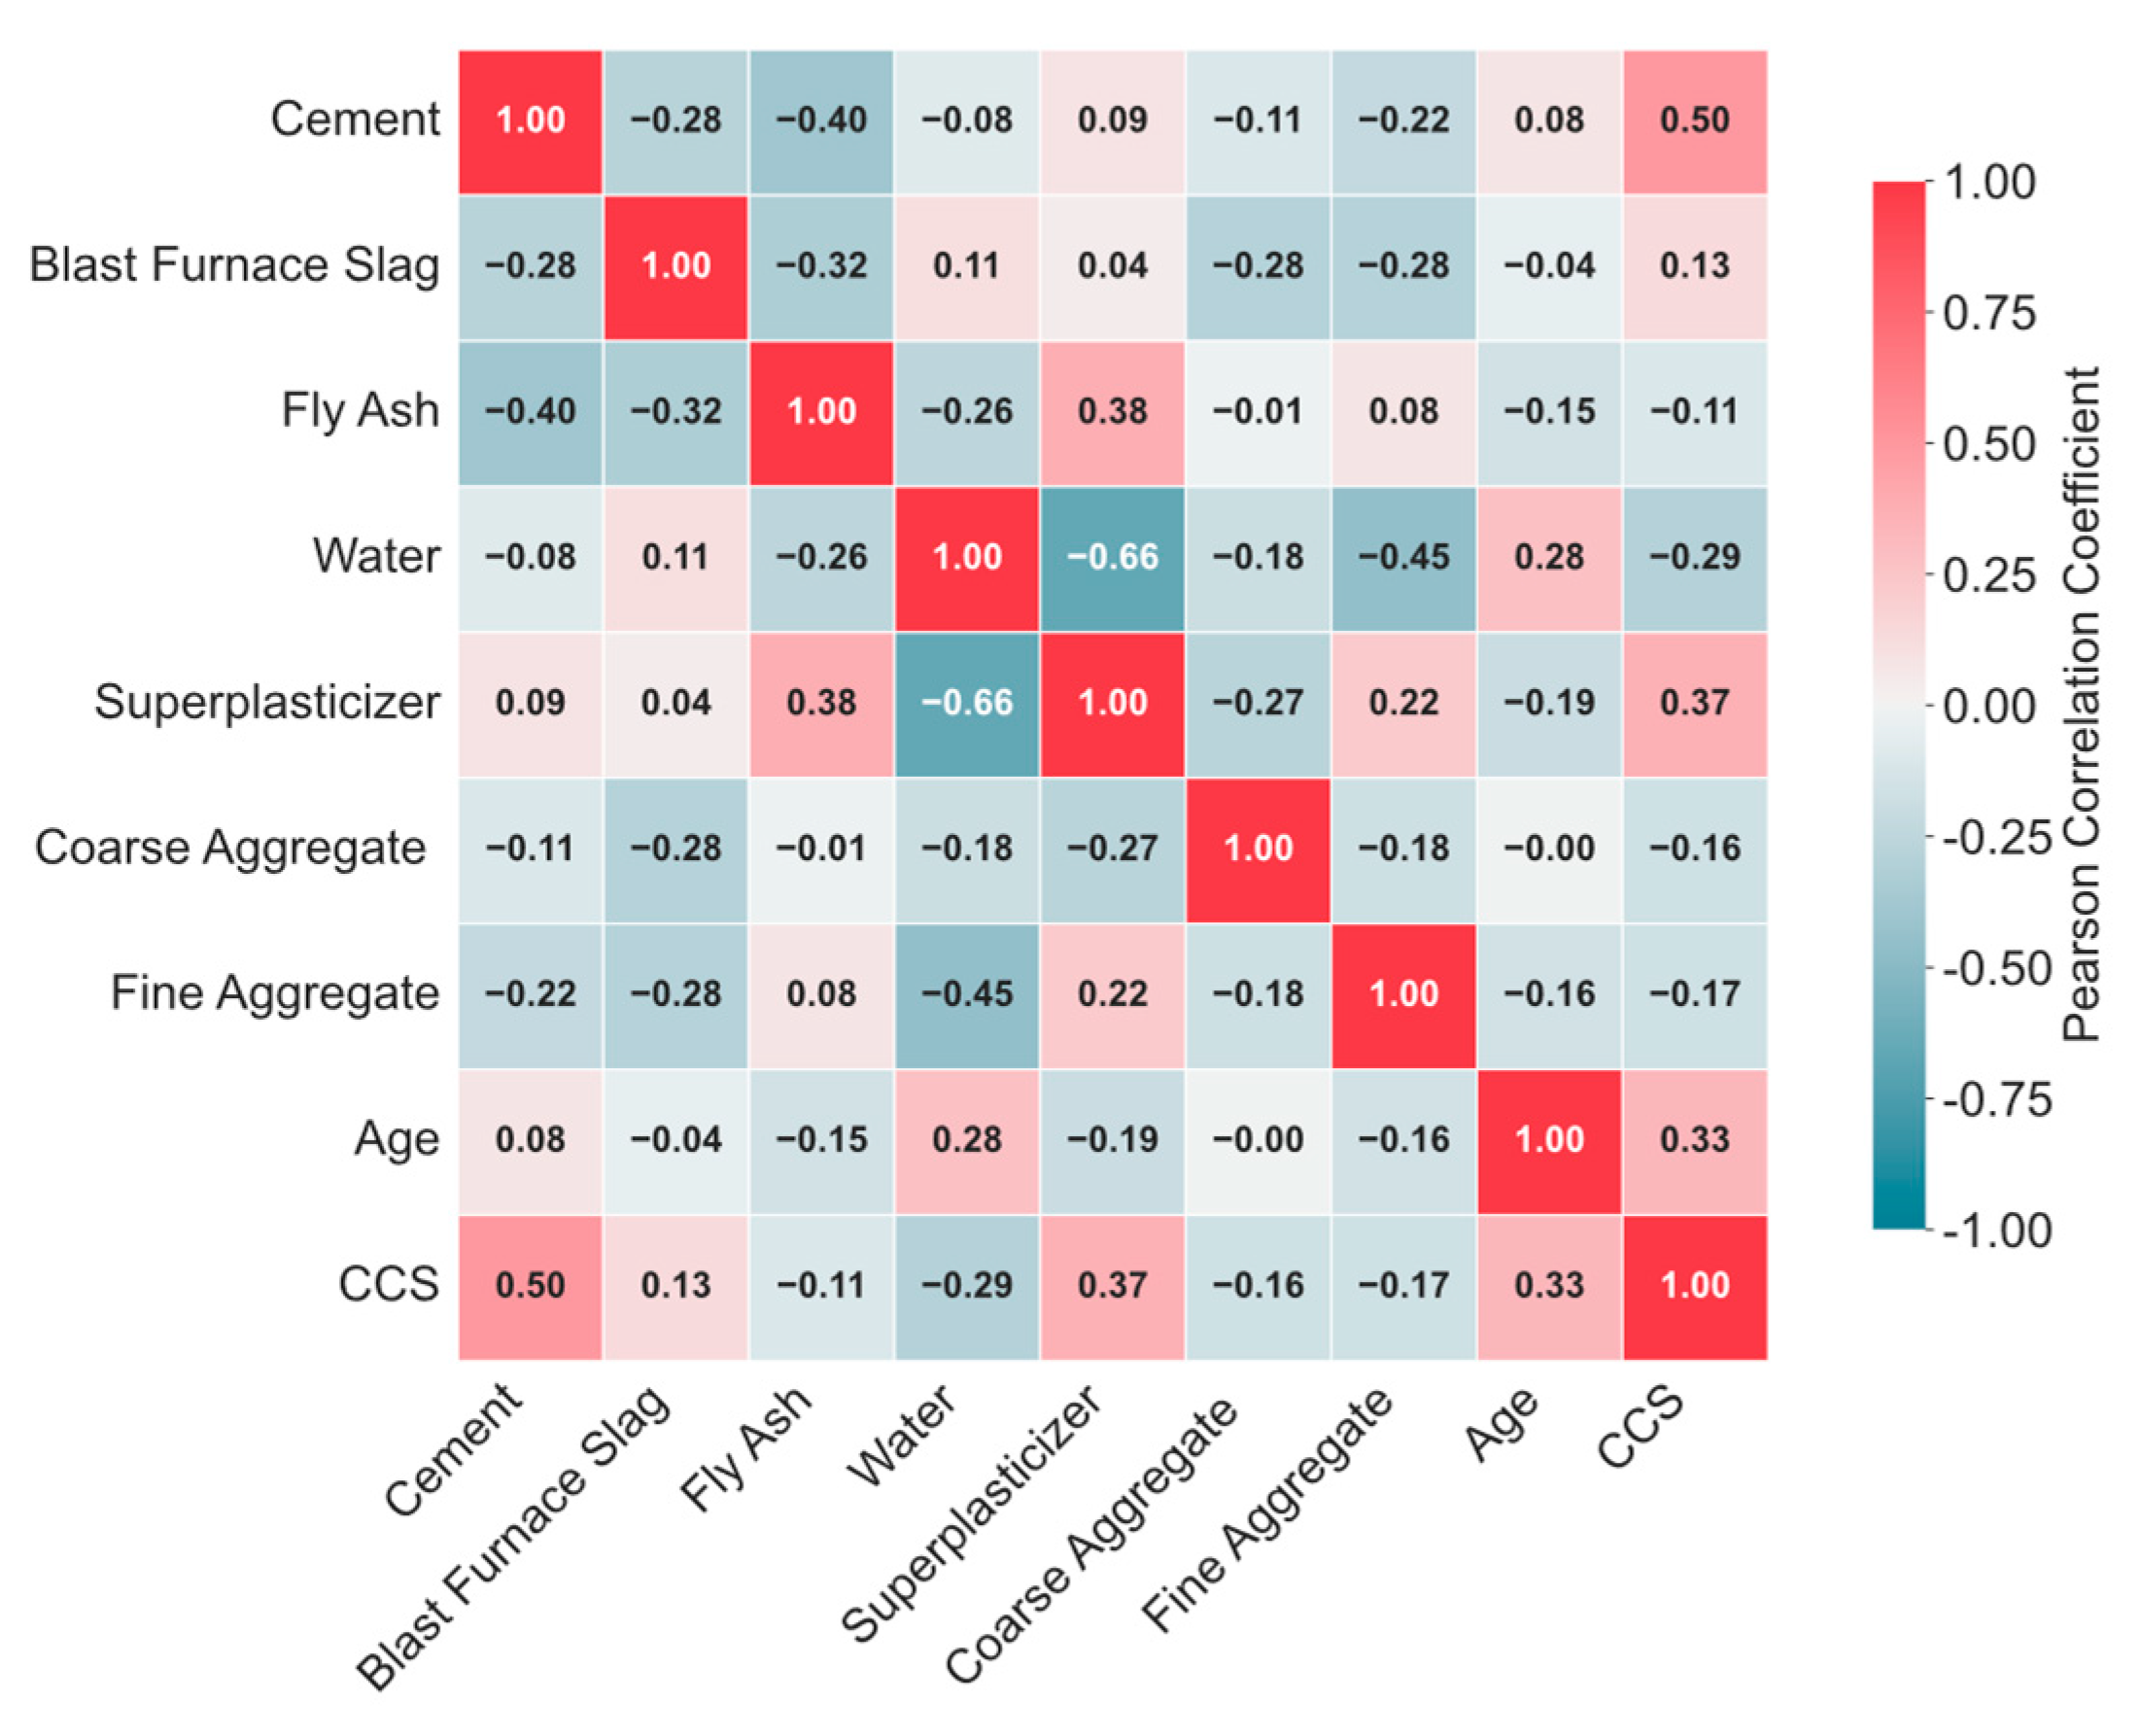
As shown in Figure 1, the variables exhibit broad distribution ranges and sufficient sample size, which contribute to enhancing the generalization capability and prediction accuracy of the model during both training and testing phases. Figure 2 further presents the Pearson correlation coefficient matrix among the variables, where coefficients range from −1 to 1, indicating perfect negative correlation, perfect positive correlation, and no linear correlation, respectively. The analysis reveals statistically significant correlations between each raw material component and compressive strength, confirming the rationality of selecting these variables as input features.
Figure 2 accurately captures the core principles of modern concrete mix proportion design through the correlations demonstrated. The strong negative correlation between water and high-efficiency water reducers (−0.66) is expected, as it reveals a key technology for achieving high-performance concrete: significantly reducing the water-binder ratio through the use of superplasticizers, thereby improving strength and durability while maintaining workability. The negative correlation between water and fine aggregate (−0.45) reflects the volume balance between paste and aggregate: a larger paste (water being a key component) can relatively reduce the reliance on fine aggregate for filling and lubrication. The negative correlation between cement and fly ash (−0.4) directly reflects the strategy of partial replacement of cement with supplementary cementitious materials, a common practice to optimize cost, improve workability, enhance long-term performance, and promote sustainable development. Together, these relationships outline a synergistic, optimized material system.
Previous studies have often been limited to examining the influence of single or a limited combination of variables on the compressive strength of concrete, failing to fully account for potential coupling effects among multiple factors. Moreover, much of the existing literature has focused on dimensionless parameters such as water-to-cement ratio, overlooking qualitative changes in material behavior resulting from differences in absolute dosage in practical mix designs. To address these limitations, this study adopts the actual mass of each component per cubic meter of concrete as variables, aiming to provide a more comprehensive and realistic revelation of the intrinsic relationship between material proportions and macroscopic mechanical properties.
Due to the orders of magnitude differences between the superplasticizer, compressive strength, and other factors, the use of normalization is a justified choice. To ensure that the data in the output results presentation graphs remain consistent with the input data, the data were restored to their original scales during output. Z-score standardization (StandardScaler) is a linear data transformation method based on statistical distribution. This method transforms the original data into a normal distribution with a mean of 0 and a standard deviation of 1 by subtracting the feature mean and dividing by the standard deviation. Its mathematical expression is:
Z = ( x μ ) / δ
where μ represents the feature mean and σ represents the standard deviation.
This standardization eliminates dimensional discrepancies and disparities in numerical scales between different features while preserving the distribution shape and variation structure of the original data. Compared to Min-Max normalization, Z-score standardization demonstrates superior robustness toward outliers and does not alter the probability distribution characteristics of the data. In machine learning applications, this method enhances numerical stability and convergence efficiency for distance-based algorithms and gradient descent optimization processes, while simultaneously improving the interpretability and comparability of model parameters.

3. Machine Learning Predictive Models

3.1. Model Introduction

3.1.1. Linear Regression

Linear Regression (LR) is a statistics-based modeling method aimed at establishing a linear relationship between a dependent variable and one or more independent variables. This approach fits an optimal linear equation by minimizing the sum of squared residuals between predicted values and actual observations, typically represented as a regression line. The mathematical expression of the model is as follows:
y = x i β i + ε
where y denotes the target vector, X represents the feature matrix, β is the regression coefficient vector, and ε signifies the error vector.
Ridge Regression is a regularized variant of linear regression that introduces an L2 penalty term to the loss function to mitigate overfitting and handle multicollinearity. By adding the squared magnitude of coefficients to the objective function, it shrinks coefficient estimates towards zero, enhancing model stability and generalization capability. This technique is particularly beneficial when predictor variables are highly correlated, as it reduces model variance while maintaining a bias-efficiency trade-off.
LR offers advantages such as computational simplicity, high efficiency, and strong interpretability. However, the method also has several limitations, including a weak ability to model nonlinear relationships, instability in coefficient estimation when features are highly correlated, and a susceptibility to overfitting.

3.1.2. Random Forest

Random Forest (RF) is an ensemble learning-based supervised algorithm designed for regression tasks by constructing multiple decision trees and aggregating their predictions. Its core mechanisms include Bootstrap sampling to generate diverse training subsets and random feature selection at each node split, aimed at reducing model variance and mitigating overfitting risks. The final prediction is obtained by averaging the outputs of all decision trees in the forest, mathematically expressed as:
y ^ = 1 B B = 1 B T b ( x )
where y ^ denotes the final predicted value for a sample, B represents the number of decision trees, and b  T b ( x ) indicates the prediction of the b tree for sample x.
The algorithm exhibits strong resistance to overfitting, effectively handles high-dimensional features, and demonstrates robustness to missing data and noise. It also enables feature importance evaluation through Out-of-Bag (OOB) error and mean decrease in impurity. However, Random Forest requires substantial computational and storage resources during training, offers lower interpretability compared to linear models, and necessitates careful tuning of hyperparameters—such as the number of trees, maximum depth, and feature subset size—to balance performance and complexity.

3.1.3. XGBoost

eXtreme Gradient Boosting (XGBoostXGBoost) is an efficient machine learning algorithm based on Gradient Boosting Decision Trees (GBDT), widely applied to regression, classification, and ranking tasks. The algorithm iteratively constructs multiple weak learners (typically decision trees), each one correcting the prediction errors of its predecessor, and ultimately integrates them into a strong learner. Key improvements in XGBoostXGBoost include the introduction of a regularization term to mitigate overfitting, the use of second-order Taylor expansion to more accurately approximate the loss function, enhanced training efficiency through parallel computing and a weighted quantile strategy, as well as a splitting algorithm capable of automatically handling missing values.
The objective function consists of both a loss function and a regularization term, formulated as follows:
O b j ( θ ) = i = 1 n L ( y i , y ^ i ) + k = 1 K Ω ( f k )
Ω ( f k ) = γ T + 0.5 λ ω 2
y ^ i = k = 1 K f k ( x i ) , f k F
where L ( y i , y ^ i ) denotes the loss function, which measures the discrepancy between predicted and true values; Ω ( f k ) represents the regularization term that controls model complexity; T indicates the number of leaf nodes in a tree; w refers to the weights of the leaf nodes; and γ and λ are hyperparameters that penalize complex models.
XGBoostXGBoost has demonstrated excellent predictive performance and computational efficiency across numerous domains, along with favourable scalability and interpretability. However, the algorithm involves a relatively large number of hyperparameters (e.g., learning rate, tree depth, and regularization coefficients), which require careful tuning—often via cross-validation—thereby increasing the complexity of model training to some extent.

3.1.4. Whale Optimization Algorithm-Optimized XGBoostoost

The Whale Optimization Algorithm (WOA) is a nature-inspired metaheuristic optimization algorithm that simulates the unique hunting behavior of humpback whales, specifically their bubble-net feeding strategy [26]. This algorithm is widely recognized for its ability to efficiently tackle complex optimization problems with high-dimensional search spaces and multiple local optima, making it particularly suitable for engineering applications where computational efficiency and solution quality are paramount [27,28,29]. In civil engineering contexts, where predictive models often require careful parameter tuning, WOA provides a robust and intuitive framework for achieving high-performance results with moderate computational overhead.
In WOA, the population of whales is guided by a set of mathematical equations that emulate the encircling of prey and the spiral-shaped bubble-net attack mechanism. The algorithm distinguishes between three primary behaviors: encircling prey, bubble-net attacking (exploitation phase), and random search (exploration phase). These behaviors are modeled to allow a seamless transition from global exploration to local refinement over successive iterations, enhancing the algorithm’s ability to avoid local optima while converging toward near-optimal solutions.
The mathematical formulation of WOA begins with the encircling behavior, where whales update their positions relative to the best solution found so far. This is expressed by Equations (6) and (7):
X ( t + 1 ) = X p ( t ) A D
D = C X p ( t ) X ( t )
where X p ( t ) denotes the estimated position of the optimum (prey), X ( t ) is the current position of a wolf, and t represents the iteration step. The coefficient vectors A and C are computed as:
A = 2 α r 1 α
C = 2 r 2
where α is a control parameter that decreases linearly from 2 to 0 over the iterations, and r 1 , r 2 are random vectors in the interval [0, 1]. This formulation allows the algorithm to dynamically balance between exploration and exploitation: larger values of α promote exploration, while smaller values enhance local refinement.
To simulate the bubble-net behavior, whales either shrink their encircling circle or follow a spiral path toward the prey. This dual behavior is modeled with a 50% probability for each strategy:
X ( t + 1 ) = X ( t ) A D D e b l cos ( 2 π l ) + X ( t ) i f i f p < 0.5 p 0.5
where D = X ( t ) X ( t ) , b is a constant defining the spiral shape, l is a random number in 1 , 1 , and p is a random number in 1 , 0 [0, 1]. This approach enables a natural balance between local intensification and global diversification.
During the exploration phase, whales search randomly based on the positions of other individuals, enhancing population diversity:
X ( t + ) = X r a n d A D
D = C X r a n d ( t ) X
where X r a n d is a randomly selected whale from the current population. This phase is activated when |A| ≥ 1.
The present model incorporates the Interquartile Range (IQR) method for outlier detection, which constitutes a robust statistical technique for identifying anomalies. This methodology operates based on data quartiles, calculating Q1 (25th percentile) and Q3 (75th percentile) to determine IQR = Q3 − Q1. The outlier boundaries are mathematically defined as [Q1 − 1.5 × IQR, Q3 + 1.5 × IQR], wherein data points falling beyond this range are classified as statistical outliers. This approach remains distribution-agnostic, effectively detecting extreme values without being unduly influenced by their magnitude, demonstrating particular efficacy in handling engineering datasets with non-normal distributions.
Due to these adaptive mechanisms, WOA is highly effective for optimizing the hyperparameters of machine learning models such as XGBoostXGBoost, which are increasingly applied in civil engineering for tasks like damage detection, resource allocation, and risk assessment. In this study, WOA is utilized to automate the selection of critical XGBoost parameters—including learning rate, maximum tree depth, regularization terms, and column subsampling—superseding conventional methods such as manual tuning or exhaustive search. WOA-XGBoostXGBoost inherits all the characteristics of XGBoostXGBoost, including automatic handling of missing values, regularization mechanisms, and the robustness of tree-based models, while further enhancing model performance and generalization capability through WOA optimization of key hyperparameters. This strategy not only enhances predictive accuracy and model robustness but also considerably reduces the time and computational resources required to identify optimal hyperparameter settings.

3.1.5. LightBoost

LightGBM (Light Gradient Boosting Machine) is a high-performance gradient boosting framework developed by Microsoft, designed for efficient training and prediction on large-scale datasets. It introduces two innovative techniques: Gradient-based One-Side Sampling (GOSS) and Exclusive Feature Bundling (EFB), which significantly reduce computational cost and memory usage while maintaining high accuracy. GOSS retains instances with large gradients and randomly samples those with small gradients, thereby focusing on under-trained samples without substantially altering the data distribution. EFB combines mutually exclusive features into fewer dense features, effectively reducing the dimensionality of the feature space.
The objective function of LightGBM follows the gradient boosting framework, with the addition of a regularization term to control model complexity:
O b j ( θ ) = i = 1 n L ( y i , y ^ i ) + k = 1 K Ω ( f k )
where L is the loss function, y ^ i is the predicted value, f k denotes the k-th tree, and Ω is the regularization term.
LightGBM supports parallel and distributed training, offers fast inference speed, and is well-suited for high-dimensional data and large-scale applications. However, it may be prone to overfitting on small datasets and requires careful tuning of hyperparameters such as the number of leaves, learning rate, and feature fraction.

3.1.6. CatBoost

CatBoost (Categorical Boosting) is an advanced gradient boosting algorithm developed by Yandex, specifically designed to handle categorical features effectively without extensive preprocessing. It employs an ordered boosting strategy and permutation-driven encoding of categorical variables, which reduces overfitting and target leakage. The algorithm also incorporates a symmetric tree structure that accelerates prediction and improves model robustness.
The training process of CatBoost iteratively builds decision trees by optimizing the following objective function:
O b j = i = 1 n L ( y i , y ^ i ) + t = 1 T Ω ( f t )
where T is the number of trees, and Ω ( f t ) regularizes the complexity of the t-th tree.
CatBoost automatically handles categorical variables, reduces the need for feature engineering, and provides strong performance with minimal hyperparameter tuning. It is particularly effective in datasets with mixed data types and noisy real-world data. However, the model can be computationally intensive during training and may require more memory compared to other gradient boosting implementations.

3.1.7. Neural Networks

Neural Networks (NNs) are computational models inspired by the structure and function of biological neural networks. They consist of interconnected layers of nodes (neurons), including an input layer, one or more hidden layers, and an output layer. Each connection between neurons has an associated weight, which is adjusted during training to minimize the prediction error. The training process typically involves forward propagation, loss calculation, and backward propagation (backpropagation) to update weights using optimization algorithms such as Stochastic Gradient Descent (SGD) or Adam.
The output of a neuron is computed as:
y = Φ i = 1 n ω i x i + b
where x i are the inputs, ω i are the weights, b is the bias term, and Φ is the activation function (ReLU).
NNs are capable of modeling complex nonlinear relationships and have been successfully applied in various regression and classification tasks. However, they often require large amounts of data for training, are computationally expensive, and can be prone to overfitting if not properly regularized. Additionally, their “black-box” nature poses challenges for interpretability compared to tree-based models.

3.2. Training of Machine Learning Models

3.2.1. Grid Search for Training Machine Learning

The values of hyperparameters have a significant impact on the accuracy and reliability of machine learning models. Grid Search, as a classical hyperparameter optimization method, systematically traverses all possible combinations within a specified parameter space to identify the hyperparameter configuration that yields the optimal performance. In this study, with the exception of the WOA-XGBoost model, all other models employed the Grid Search method for hyperparameter optimization.
For the Random Forest model, the hyperparameter search space was defined as follows: the number of trees ranged from 100 to 1000; the maximum depth varied from 3 to 20; the minimum number of samples required to split an internal node was set between 2 and 10; the minimum number of samples required at a leaf node ranged from 1 to 10; and the feature proportion considered for splitting was explored between 0.2 and 0.8.
Regarding the classical XGBoostXGBoost model, the hyperparameter configuration space included: the number of trees ranging from 100 to 10,000; the maximum tree depth varying from 3 to 20; the feature sampling ratio ranging between 0.1 and 1; and the learning rate optimized within the range of 0.01 to 1.

3.2.2. Whale Optimization Algorithm XGBoostXGBoost

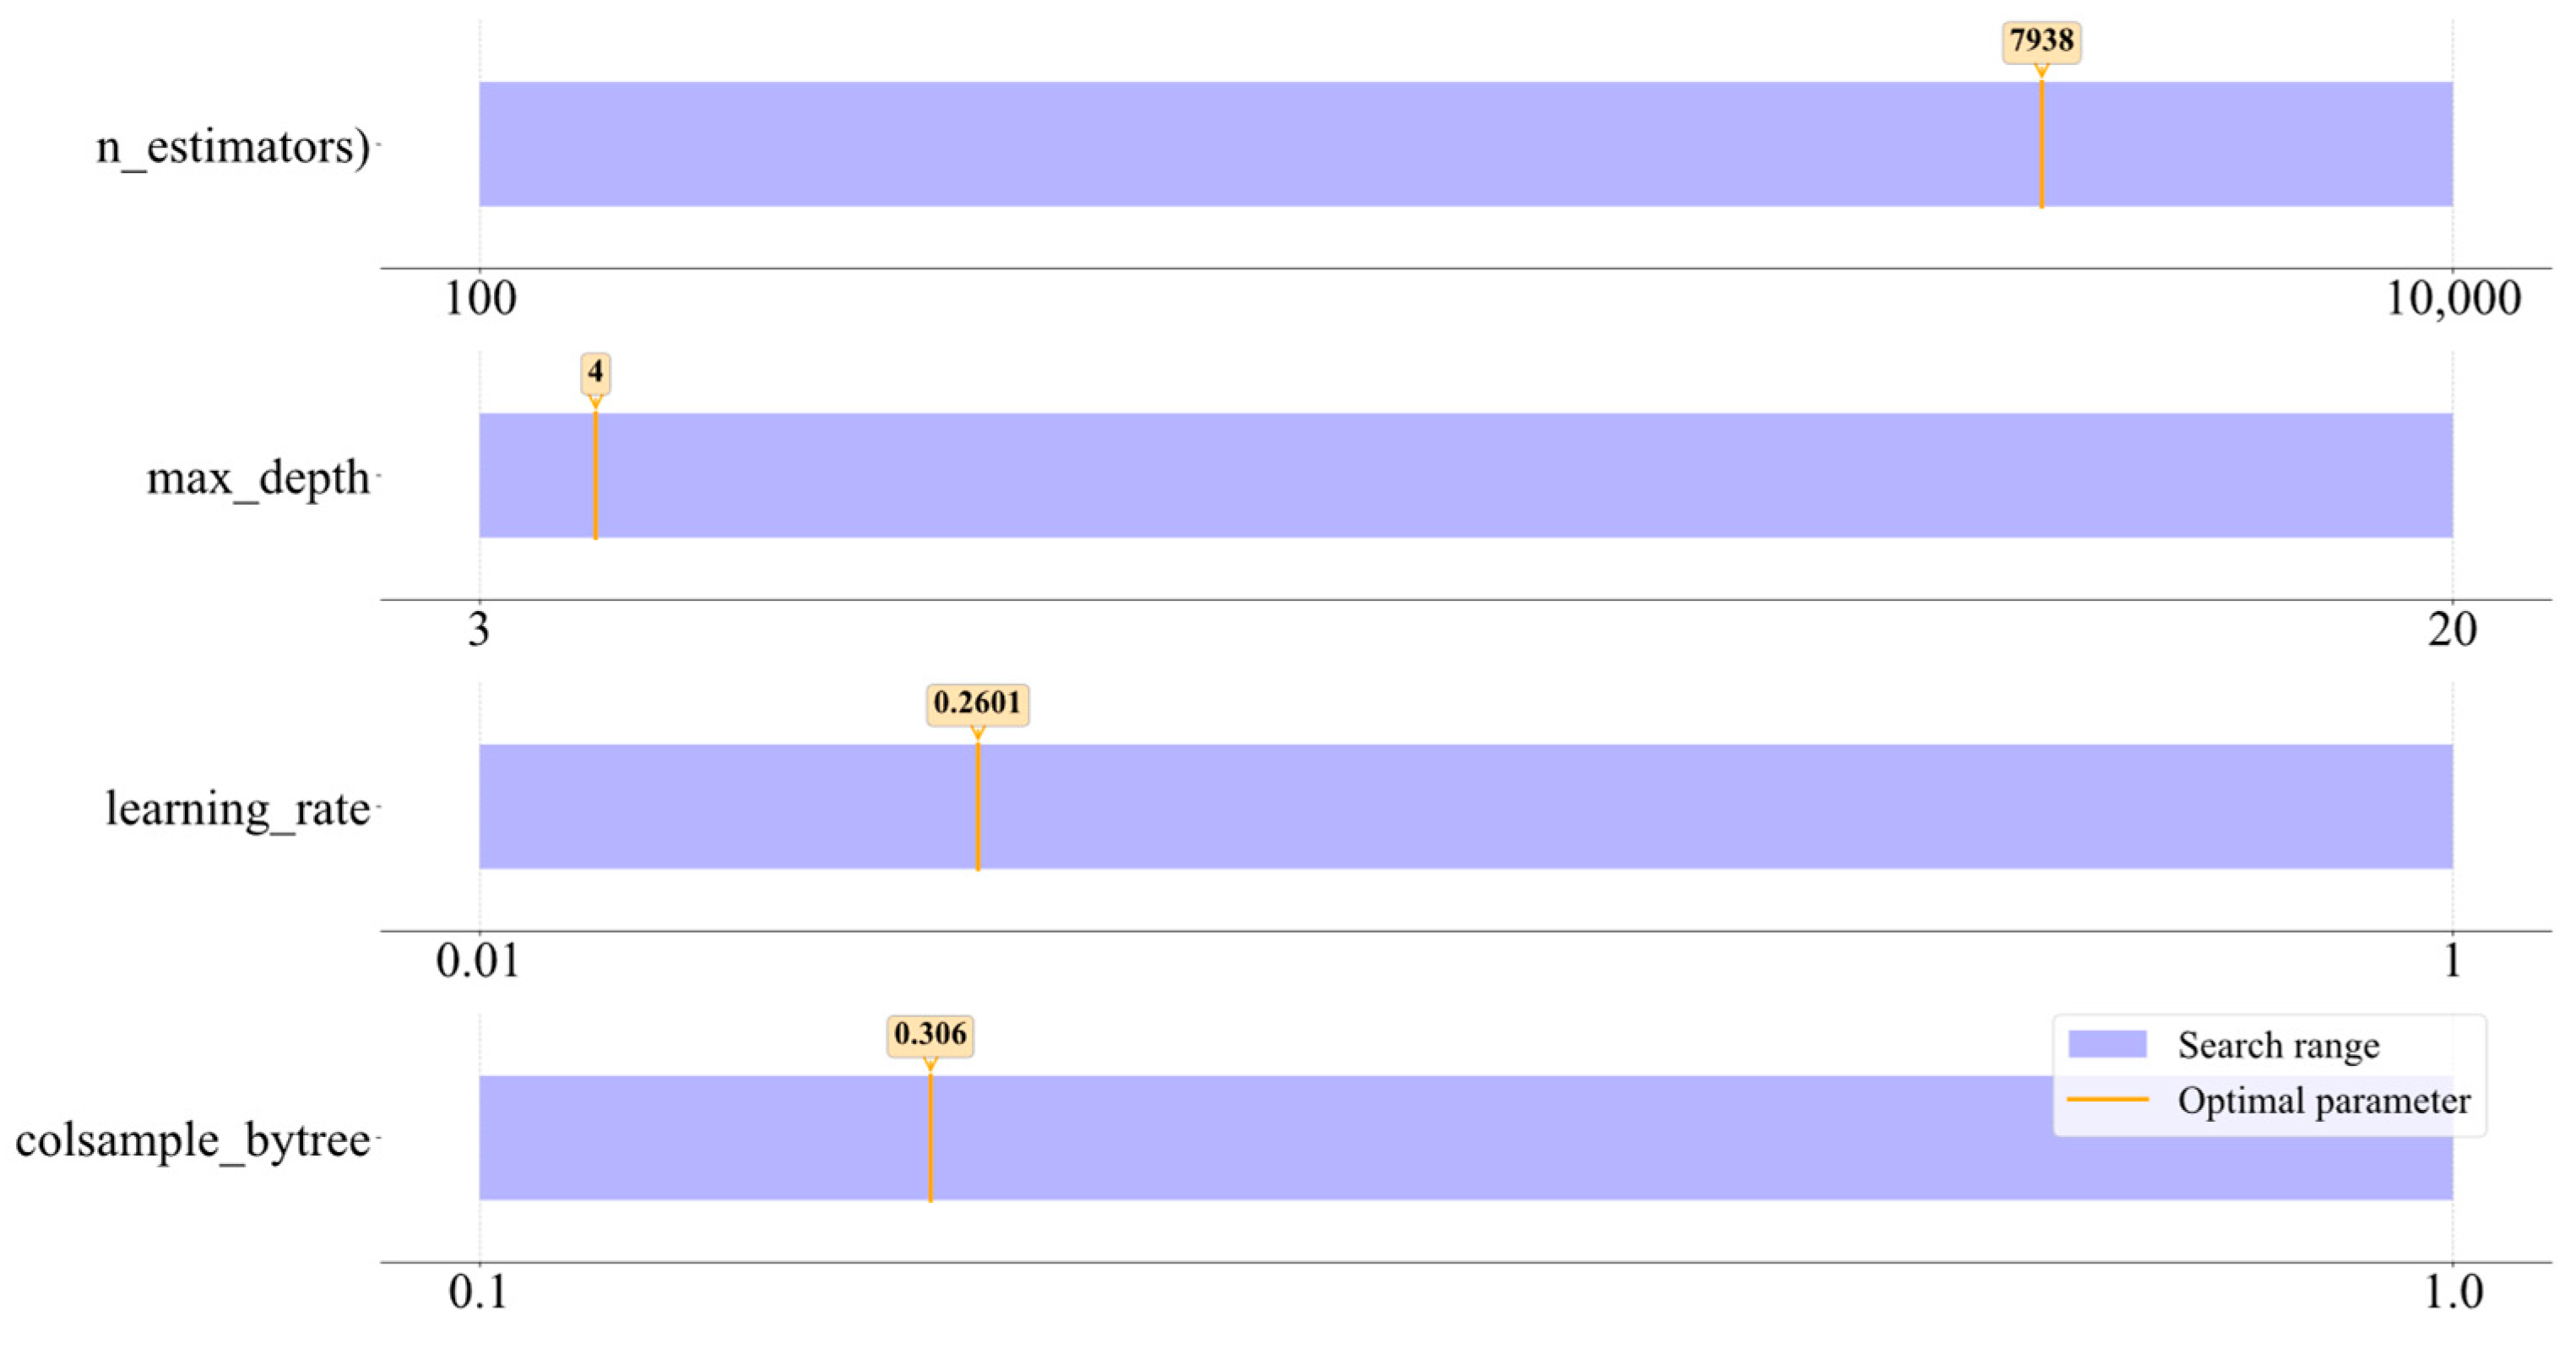
Although the Grid Search method offers advantages such as intuitive principles, systematic traversal of the parameter space, and guaranteed discovery of the global optimal solution, its computational cost increases exponentially with the number of parameter dimensions and candidate values, resulting in excessively high time consumption for large-scale parameter optimization. To overcome the computational inefficiency of Grid Search, this study introduces the Whale Optimization Algorithm (WOA) for efficiently optimizing four key hyperparameters of the XGBoostXGBoost model. The optimization process is illustrated in Figure 3. In this figure, the purple areas represent the search ranges of each hyperparameter, while the orange line indicates the trajectory of the best hyperparameter values identified during the iterative process.
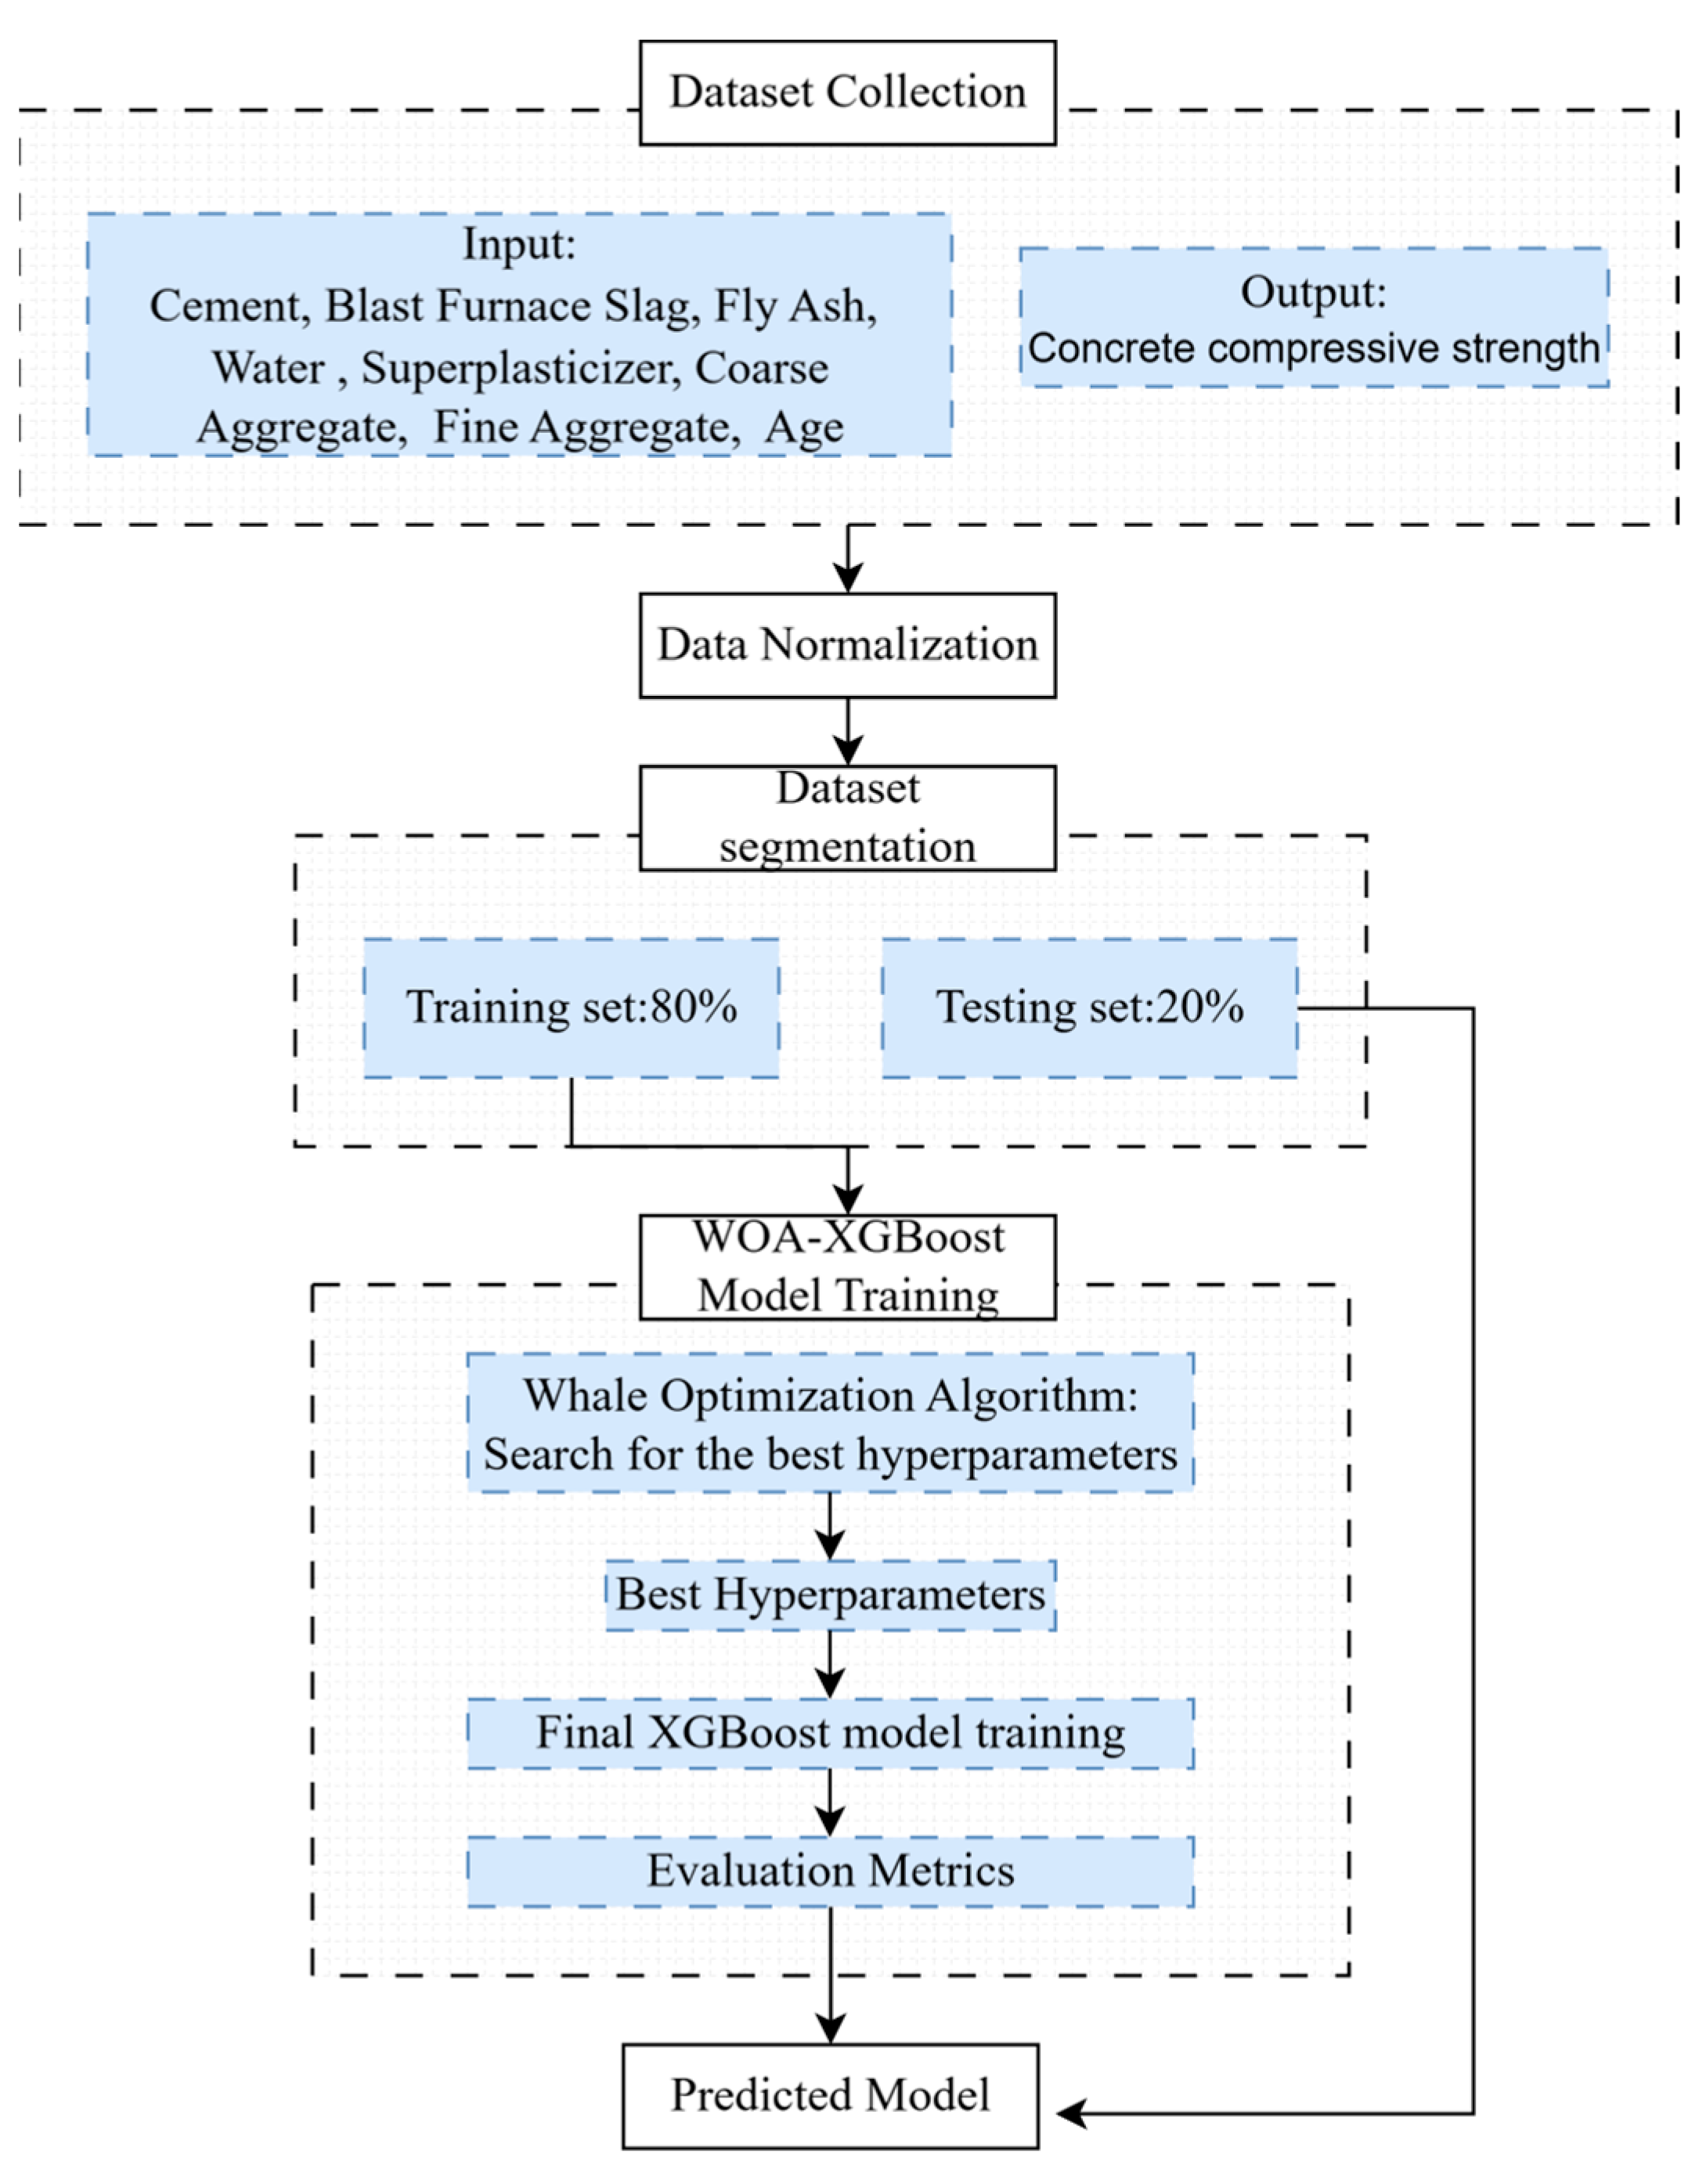
To objectively evaluate the rationality of the hyperparameter configurations and the performance of each model, this study employs Mean Squared Error (MSE) and the Coefficient of Determination (R2) as performance evaluation metrics to quantitatively validate the optimization process. Figure 4 illustrates the overall workflow of the WOA-XGBoostXGBoost algorithm, including key steps of hyperparameter optimization and model validation.
The coefficient of determination (R2) is used to quantify the extent to which a regression model explains the variation (fluctuation) in the observed data, with its value ranging from 0 to 1. An R2 value closer to 1 indicates a better fit of the model to the data and a stronger explanatory power of the independent variables with respect to the dependent variable. Its formula is expressed as:
R 2 = 1 i = 1 n y i y i ^ 2 i = 1 n y i y i ¯ 2
where y i represents the true value of the i-th observation, y ^ i denotes the predicted value of the i-th observation, and y ¯ is the mean of the true values of all observed data.
The Mean Squared Error (MSE) is used to measure the average magnitude of the differences between predicted values and true values. It is an absolute error metric; the closer the MSE is to 0, the higher the predictive accuracy of the model and the smaller the error. Its formula is expressed as:
M S E = i = 1 n y i y i ^ / n
where y i represents the true value of the i-th observation, y i ^ denotes the predicted value of the i-th observation, and n is the sample size.
This optimization strategy not only significantly enhances the model’s predictive accuracy and robustness but also substantially reduces the time and computational resources required for hyperparameter tuning. In practical training, the WOA-XGBoost model completed the training process in approximately 5 min on a standard computer (with 4 GB RAM), whereas the conventional grid search method typically required over 30 min under the same conditions, with relatively higher memory consumption.
In the hyperparameter optimization framework of Extreme Gradient Boosting (XGBoost) model based on the Whale Optimization Algorithm (WOA), the key algorithmic control parameters are configured as follows: the population size is set to 20 search agents, the maximum number of iterations is fixed at 30 generations, and the convergence criterion adopts a fixed iteration count rather than a dynamic error threshold. The average performance from 5-fold cross-validation serves as the fitness evaluation metric. During the iterative process, the linearly decreasing distance control parameter *a* balances global exploration and local exploitation behaviors, while the current optimal cross-validation score is output each generation to monitor the optimization progress. To enhance experimental reproducibility and facilitate visual analysis of the process, it is recommended to systematically record the best fitness values across generations and plot the “Iteration Number vs. Best Fitness” relationship curve. This visualization intuitively reveals the convergence characteristics and search efficiency of the algorithm within the hyperparameter space. Furthermore, conducting multiple independent repeated trials could be considered to assess the statistical significance of the optimization results, or an early stopping mechanism based on fitness plateaus could be introduced to improve computational efficiency. These measures align with the stringent requirements for robustness and efficiency in optimizing predictive models for civil engineering material properties.

4. Result and Discussion

4.1. Model Comparison and Proposed Model

Table 1 presents the performance evaluation results of various models, including the Coefficient of Determination (R2) and Mean Squared Error (MSE). Analysis reveals that the XGBoost algorithm significantly outperforms other comparative models in terms of prediction accuracy. Furthermore, the XGBoost model optimized by the Whale Optimization Algorithm (WOA), denoted as WOA-XGBoost, demonstrates further improved performance, achieving a Coefficient of Determination of 0.9412 and a Mean Squared Error of 3.8920, indicating excellent fitting capability.
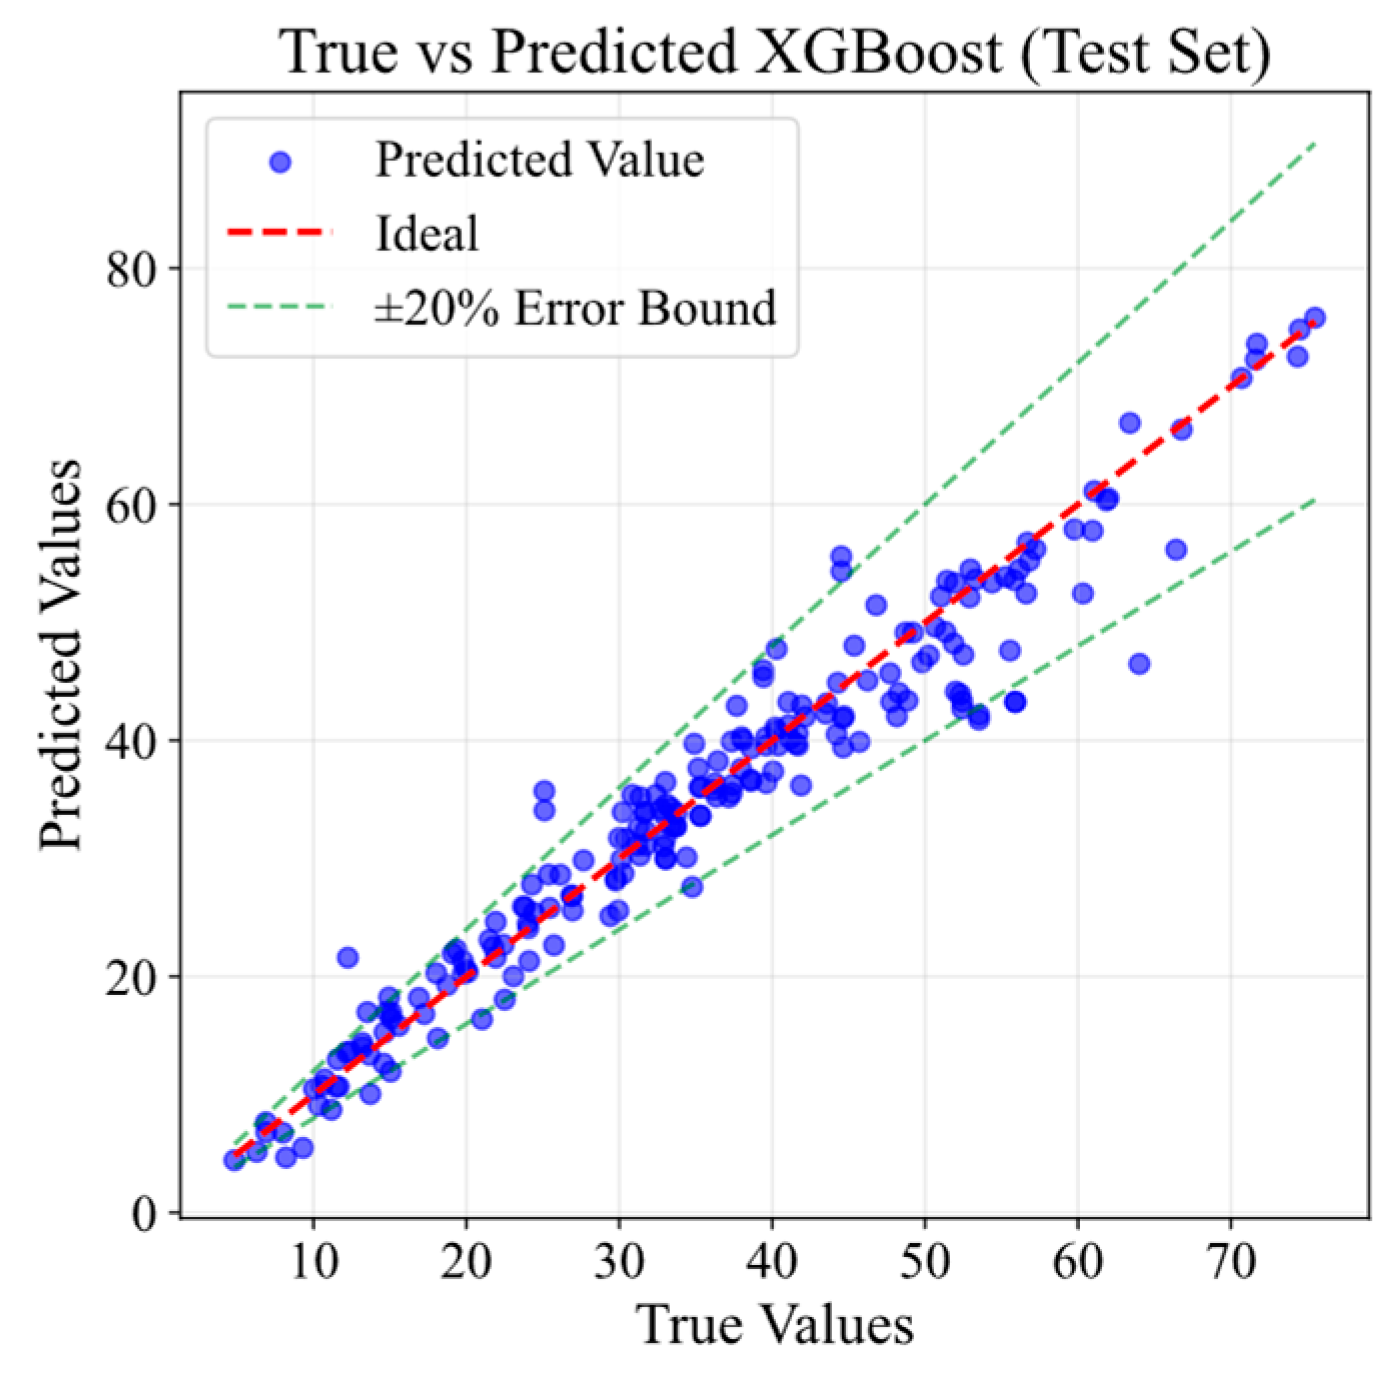
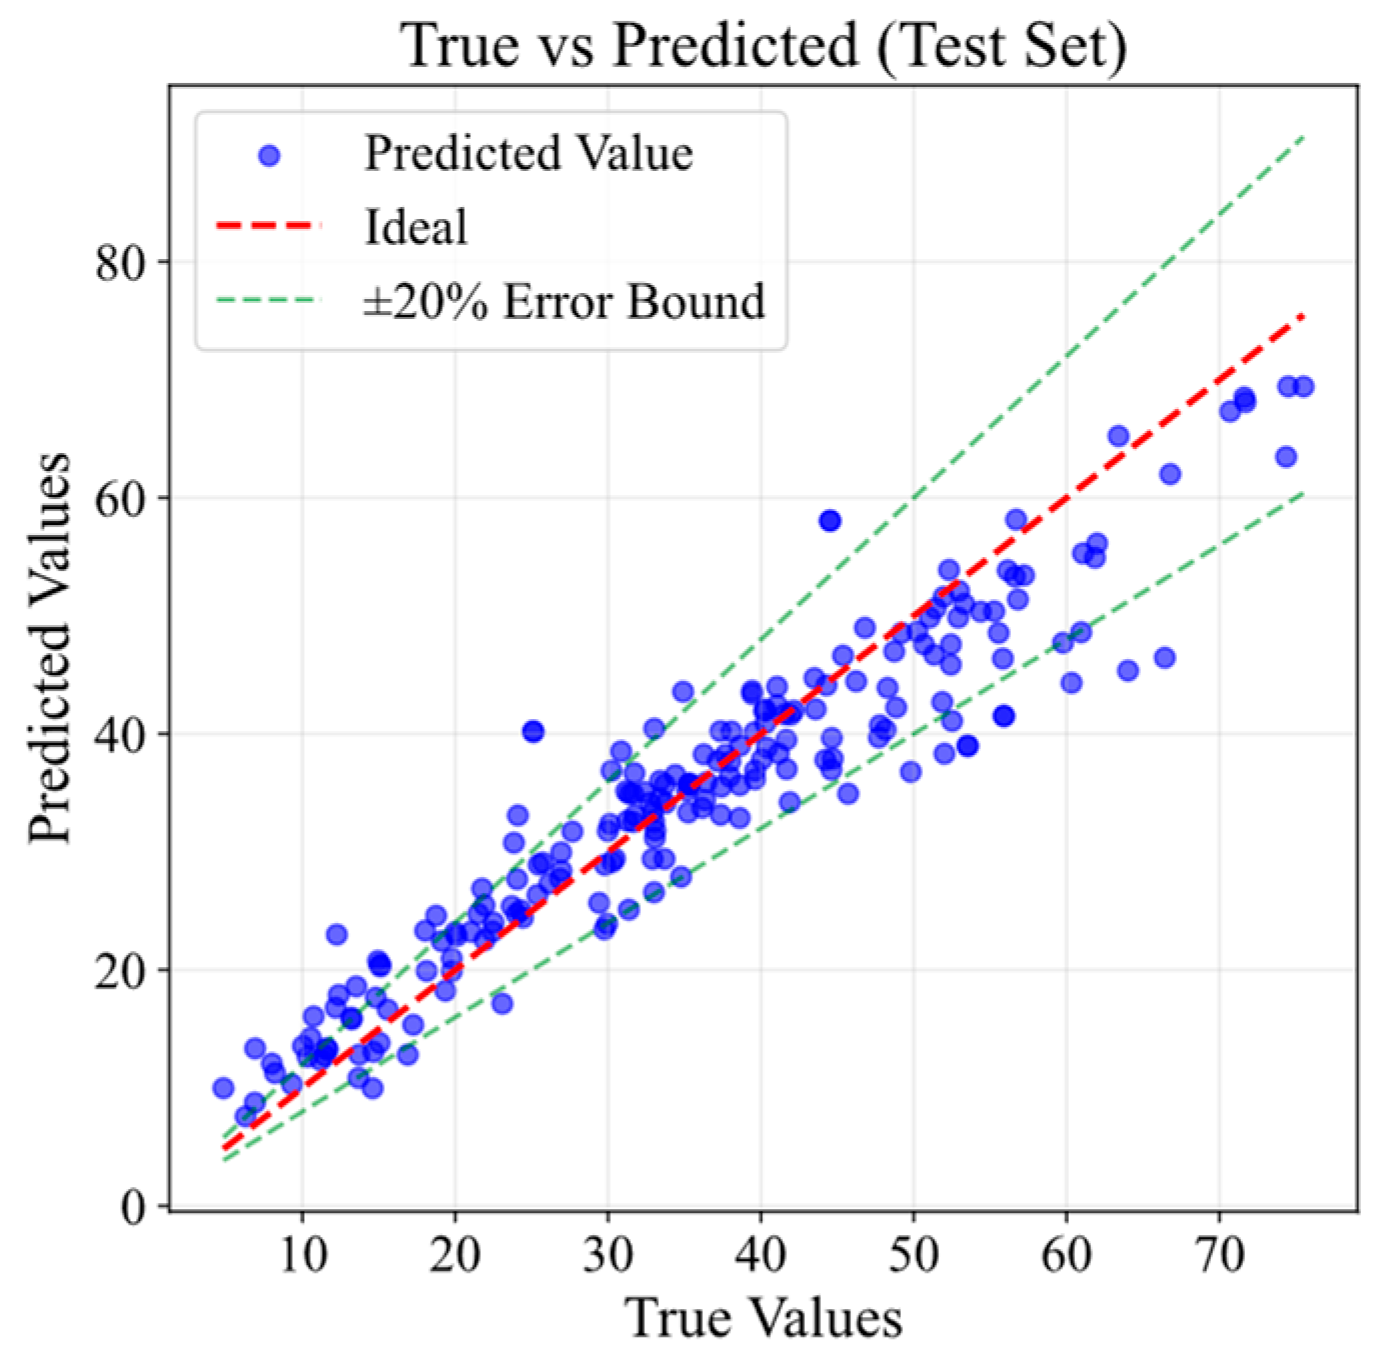
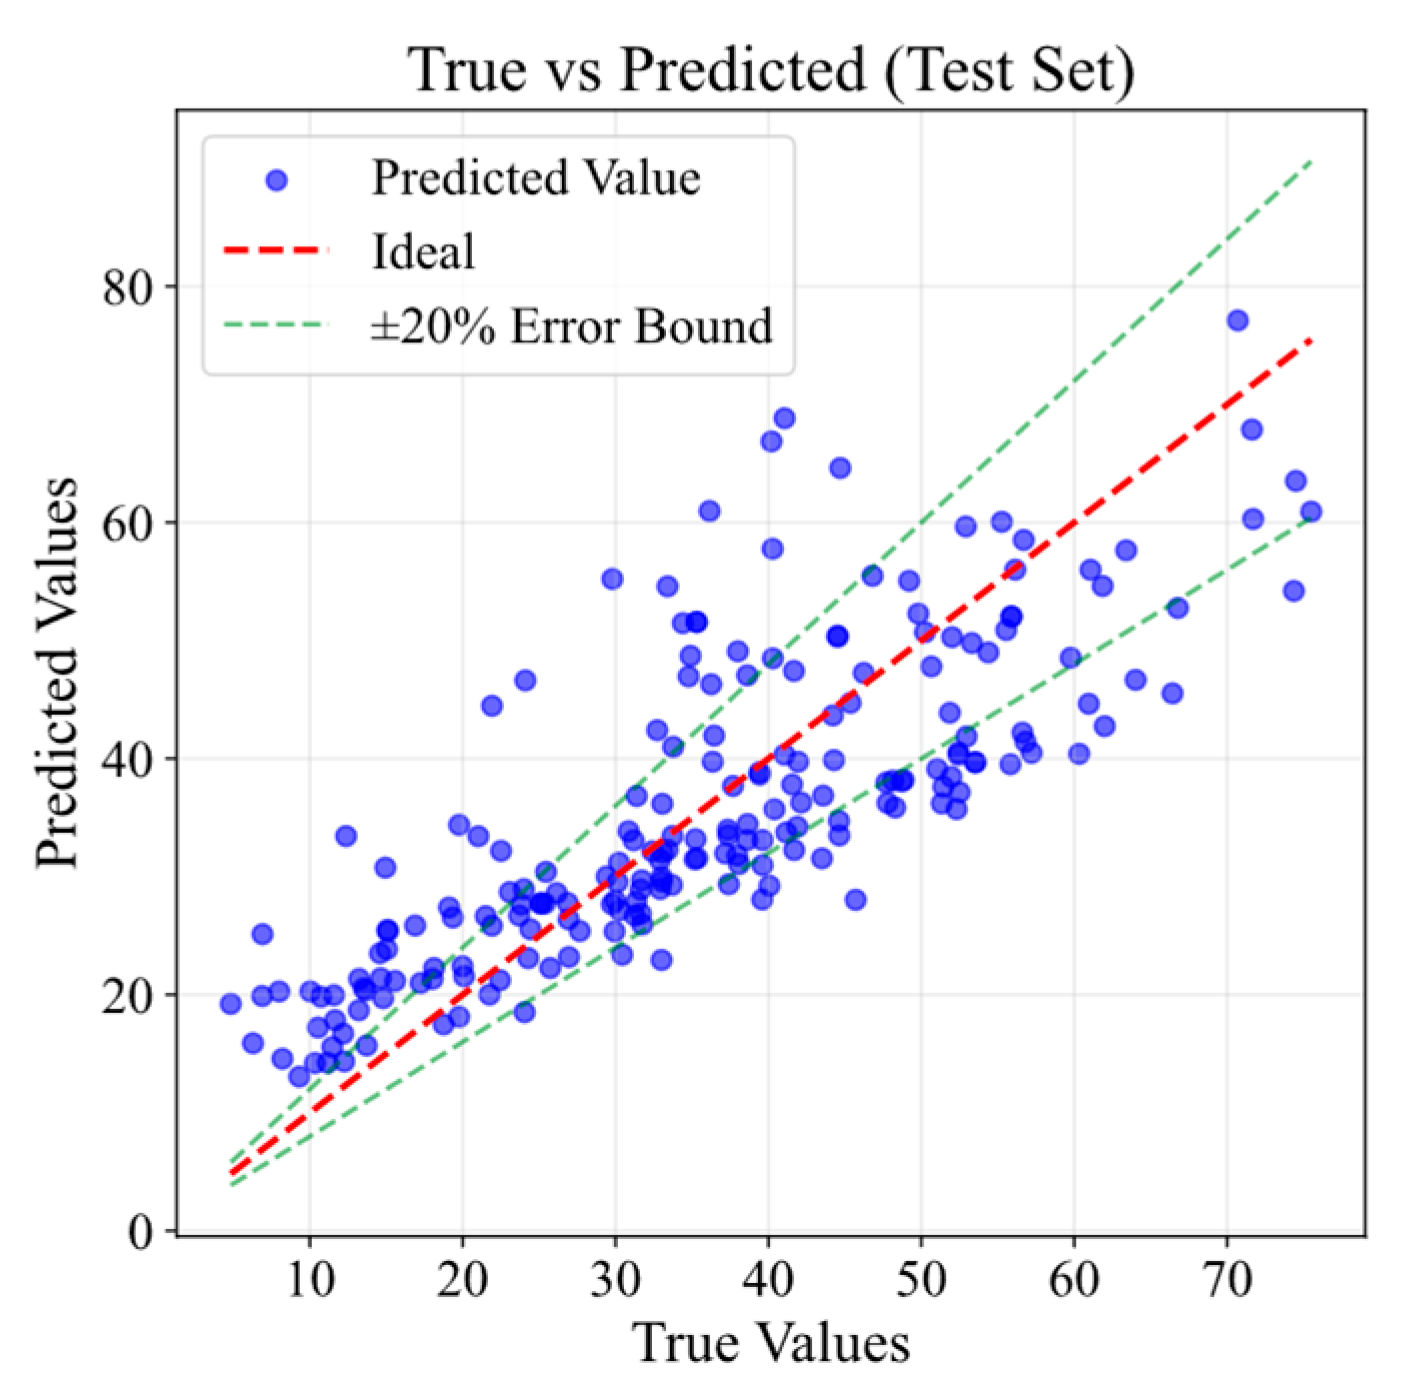
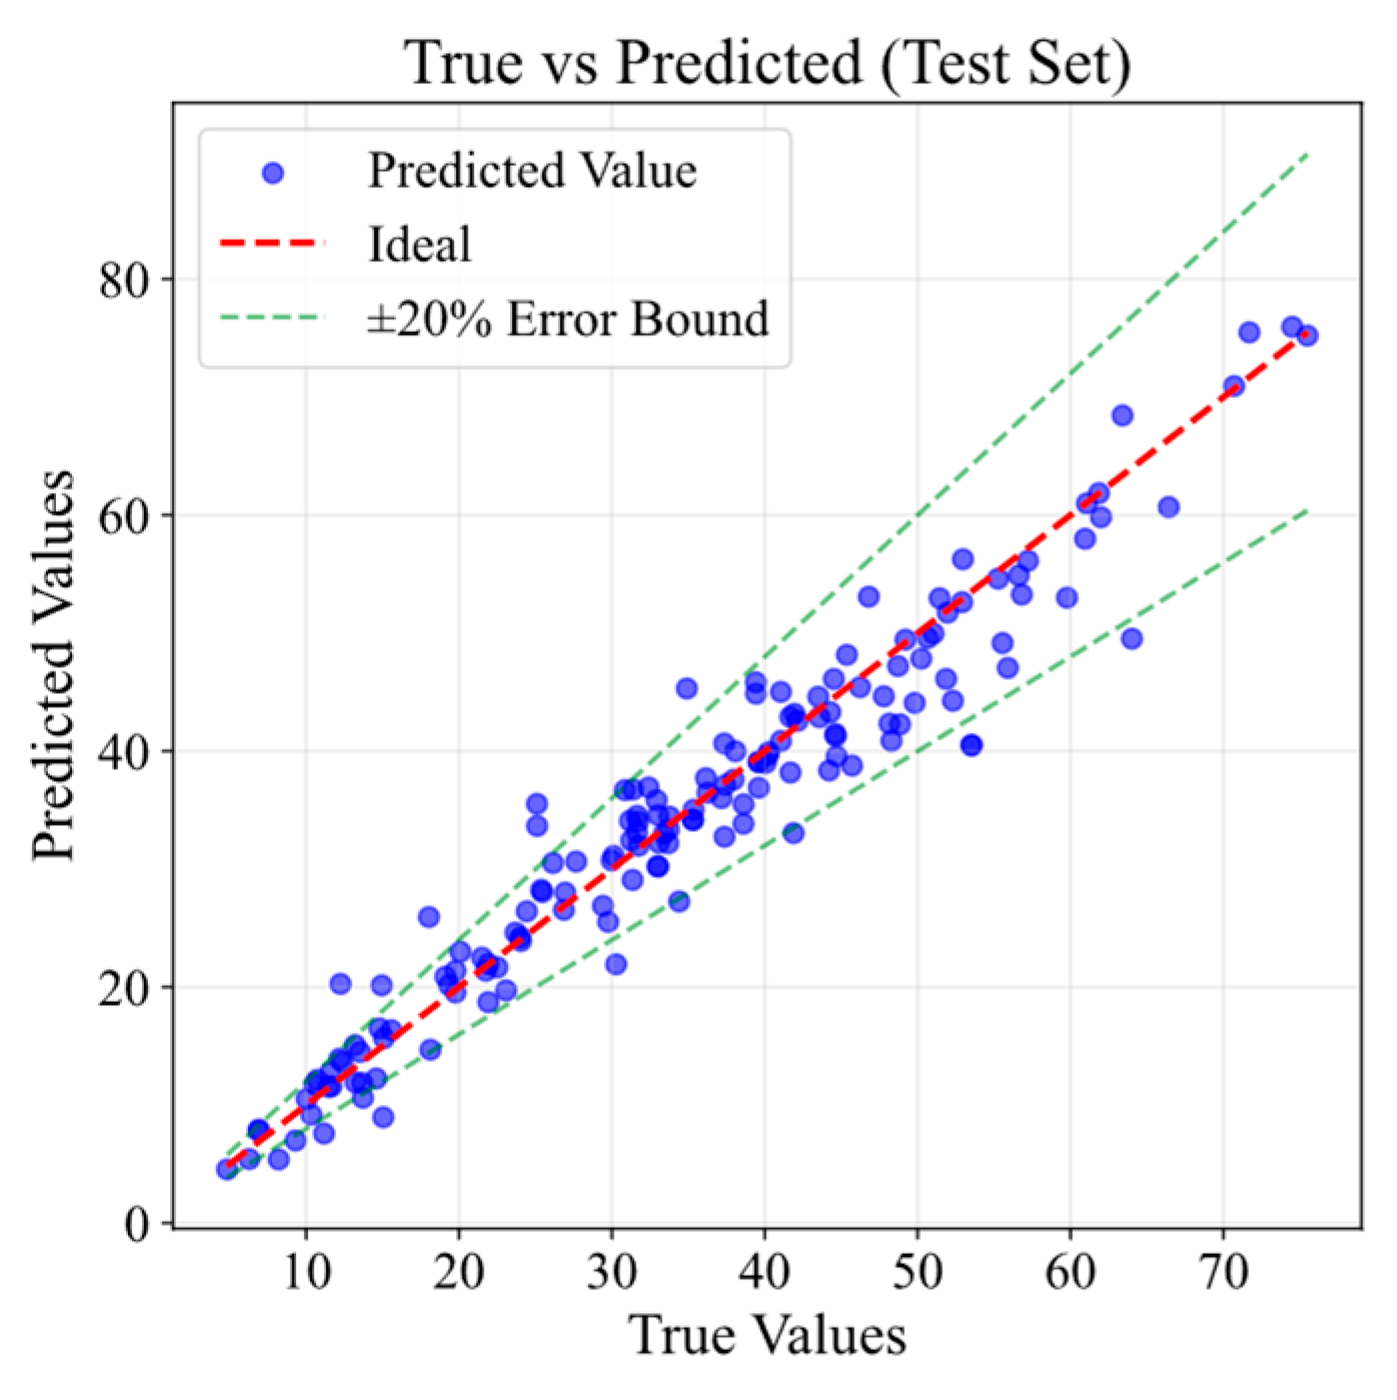
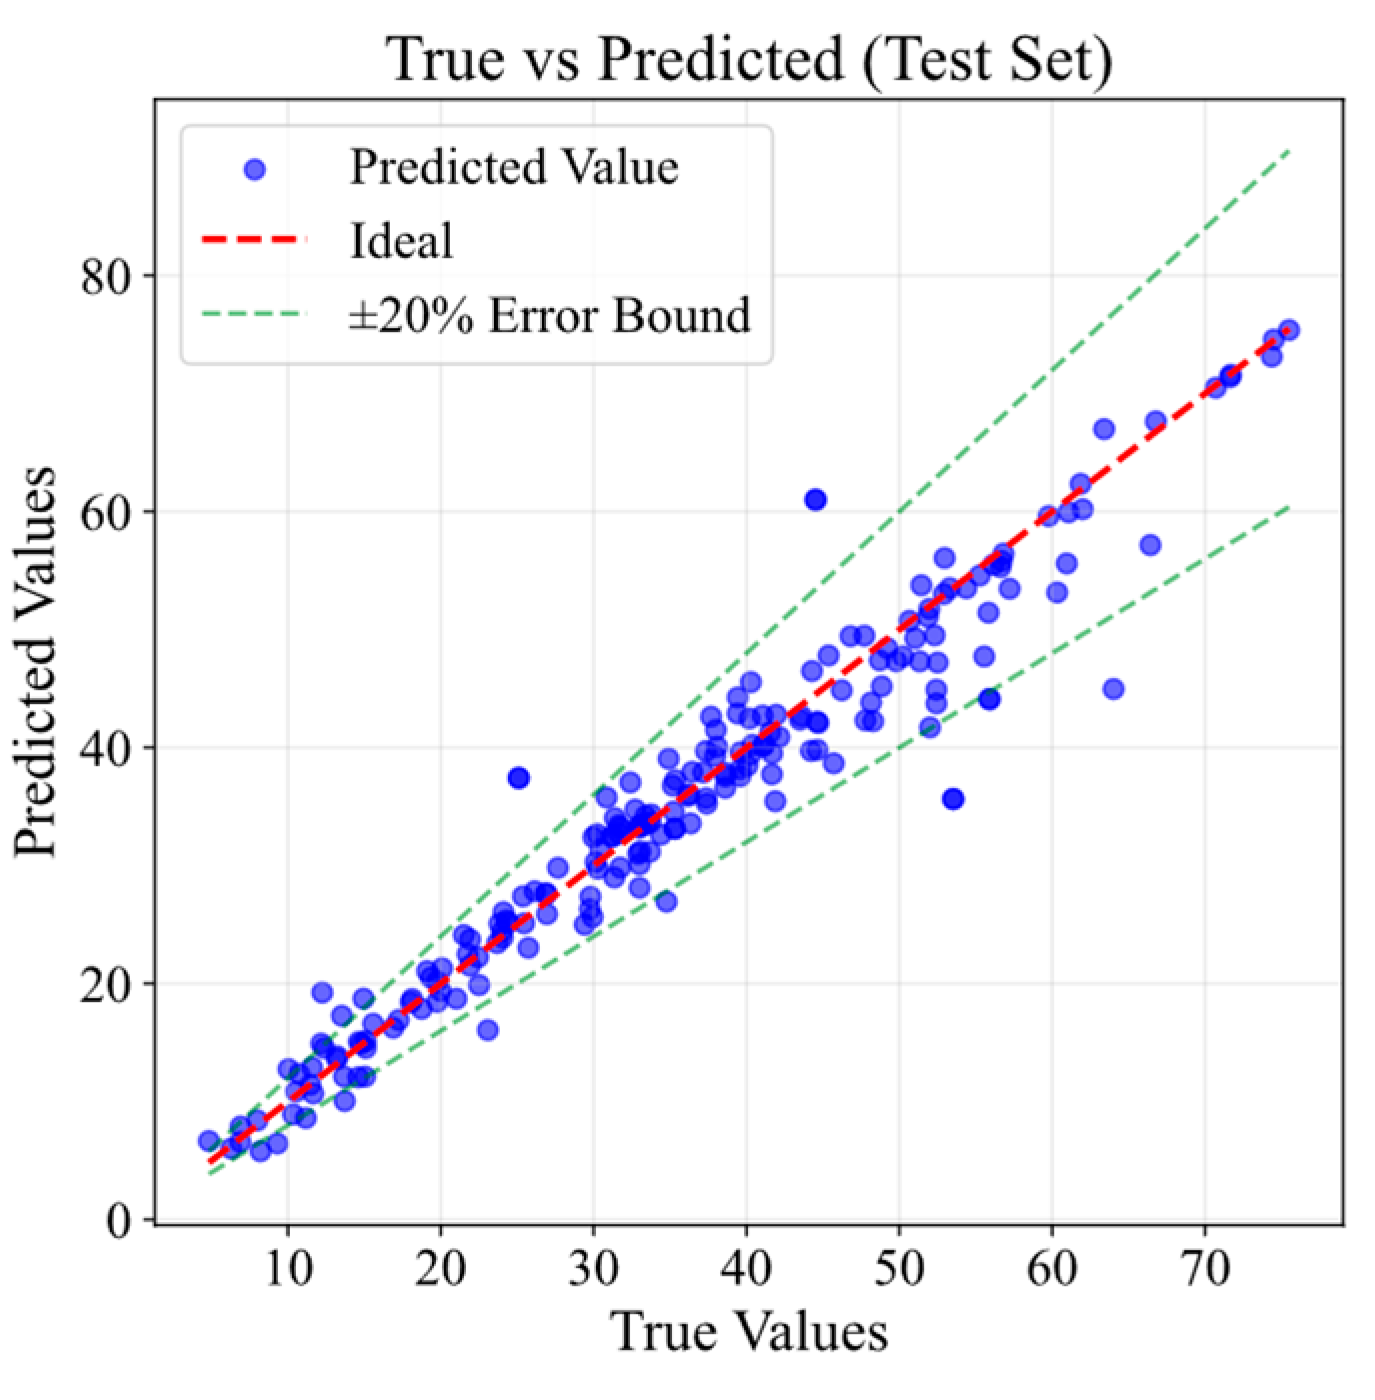
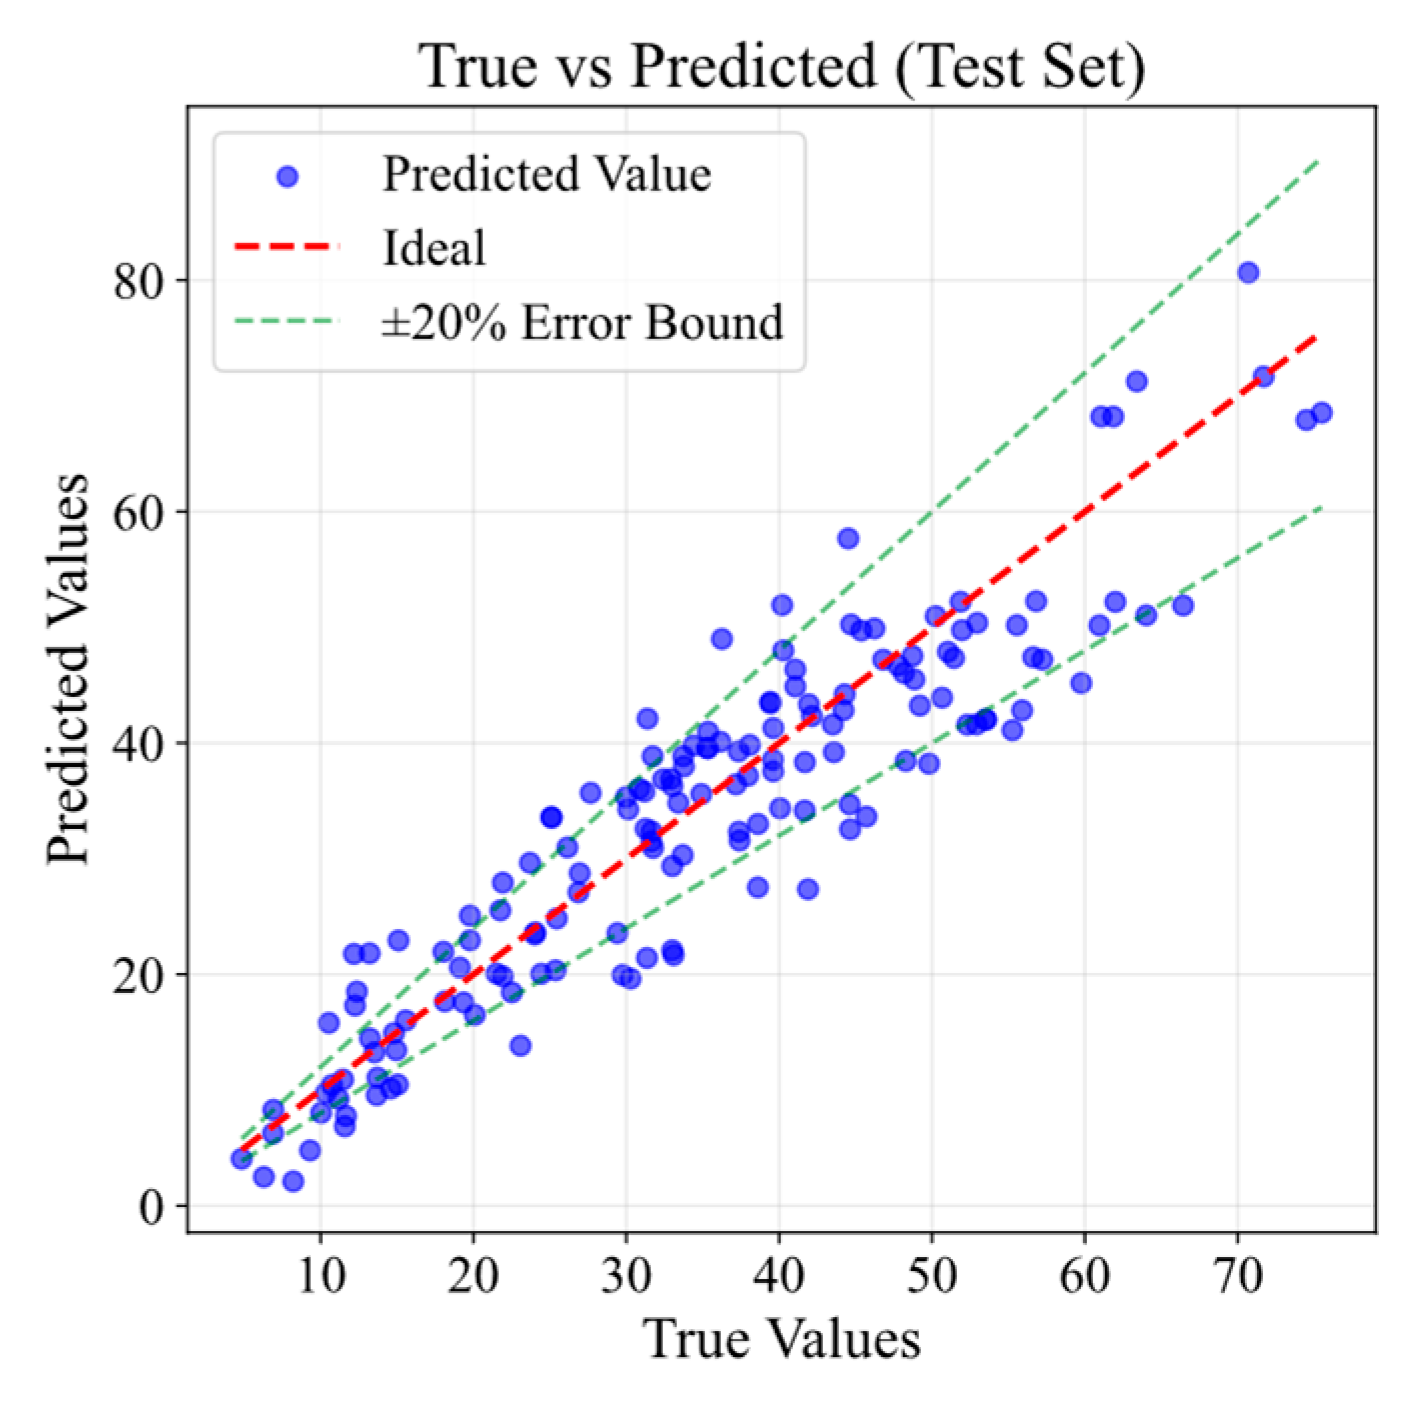
Figure 5 and Figure 6 illustrate the comparison between predicted values and true values of the WOA-XGBoost model on the training set and test set, respectively. As shown, both sets exhibit points closely distributed around the reference line y = x, with the vast majority of samples falling within the 20% error band. The distribution patterns are highly consistent between the training and testing phases, and the errors display a uniform and random pattern without significant systematic bias or heteroscedasticity, indicating that the model possesses good goodness of fit and stable generalization performance.
As shown in Figure 6, Figure 7, Figure 8, Figure 9, Figure 10 and Figure 11, notable differences in predictive performance exist among the different models, with the overall ranking being WOA-XGBoost > LIGHTBOOST > CATBOOST > NN > Random Forest > Linear Regression. Specifically, the predicted values of the Linear Regression model are relatively scattered. Although a positive correlation with the true values is observable, the degree of deviation is considerable, and the prediction errors are significant. In summary, leveraging the highest R2 value, the lowest MSE, and the efficient hyperparameter search capability of the Whale Optimization Algorithm, the WOA-XGBoost model achieves more accurate predictions of concrete compressive strength.

4.2. Data Variability Analysis

4.2.1. Feature Importance Analysis

The importance of individual features in predictive models plays a crucial role in enhancing both model performance and interpretability. Feature importance analysis quantifies the overall contribution of a feature to the model training process, where a higher ranking indicates that the feature provides the greatest information gain in constructing a well-fitted model. This analysis offers a clear hierarchical understanding of the factors influencing compressive strength and helps formulate more effective strategies for predicting and improving the compressive strength of concrete in subsequent research.
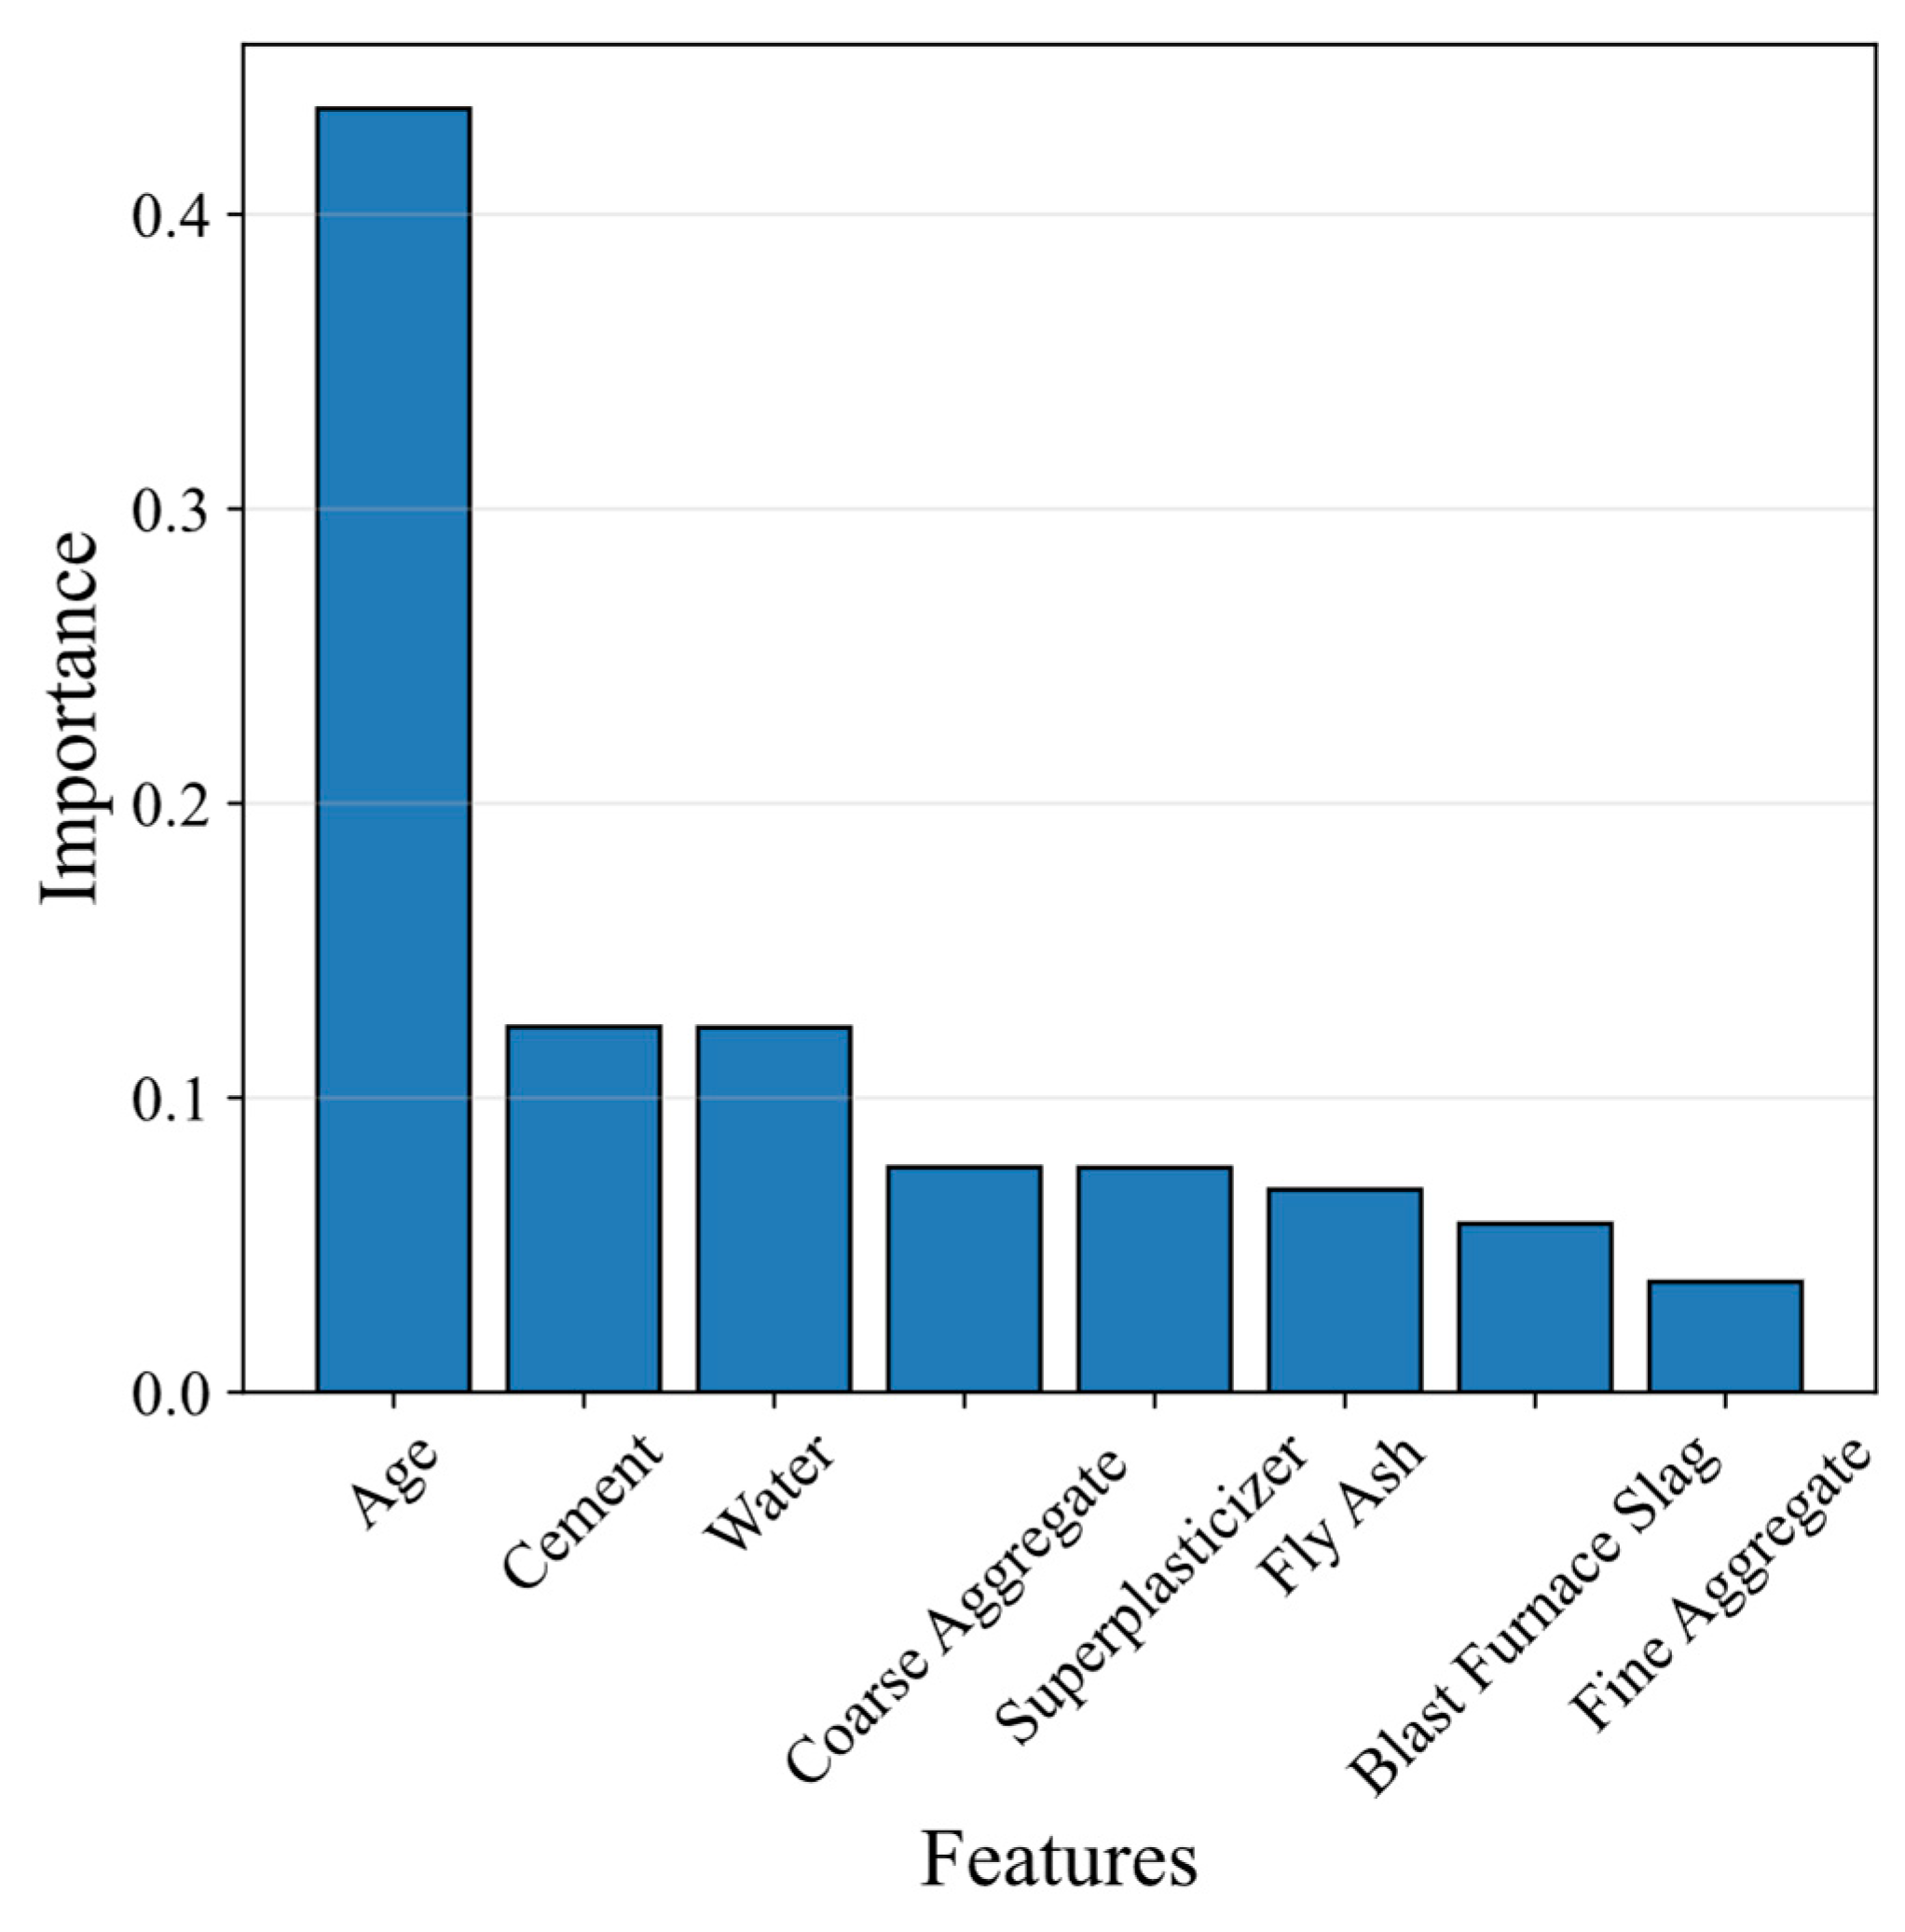
XGBoost feature importance is calculated based on Gain. This method measures the average reduction in the loss function when a feature is used for splitting nodes across all decision trees. Specifically, it calculates the difference in the loss function before and after each split (i.e., information gain) and averages these gains for the feature across all trees. A higher gain value indicates a greater contribution of the feature to improving prediction accuracy, reflecting its importance. This approach directly quantifies how effectively each feature enhances model performance.
Figure 12 illustrates the features considered in the recommended model and their respective importance scores. The importance scores, in descending order, are as follows: Age, Cement, Water, Fly Ash, Blast Furnace Slag, Superplasticizer, Fine Aggregate, and Coarse Aggregate. It is noteworthy that Age is the most important feature, indicating its significant impact on the compressive strength of concrete and its role as a key parameter in the model. Therefore, increasing the curing time of concrete in practical engineering is of utmost importance for enhancing its compressive strength.

4.2.2. Feature Sensitivity Analysis

To enhance the reliability and interpretability of the model, this study employs SHapley Additive exPlanations (SHAP) and Partial Dependence Plots (PDP) to interpret the contributions of input variables in predicting the compressive strength of concrete.
Figure 13 presents the distribution of SHAP values for the eight input variables, reflecting the degree of influence each feature has on the prediction outcome. Among them, the SHAP value ranges for Age, Cement, and Water are significantly larger than those of other variables, indicating that these three factors exert a stronger influence on the model’s predictions, which is consistent with the conclusions drawn from the feature importance analysis in the previous section. Further observation reveals that the direction of influence of these variables aligns with engineering common sense: higher values of Age and Cement contribute positively to compressive strength, whereas Water exhibits a clear negative impact.
The different effects of fly ash and slag on strength stem from their inherent differences in chemical activity. Slag possesses latent hydraulic properties, and when stimulated by cement hydration products, it can directly generate large quantities of high-strength C-S-H gel, acting like “reinforced cement,” thereby continuously improving density and strength. Fly ash, on the other hand, possesses only pozzolanic activity and lacks inherent gelling properties. Initially, it primarily acts as a physical filler, “diluting” the cement concentration and resulting in reduced strength. Later, it slowly reacts with the calcium hydroxide produced by cement hydration to generate a cementitious substance that fills the pores, enabling later strength growth and optimizing the microstructure.
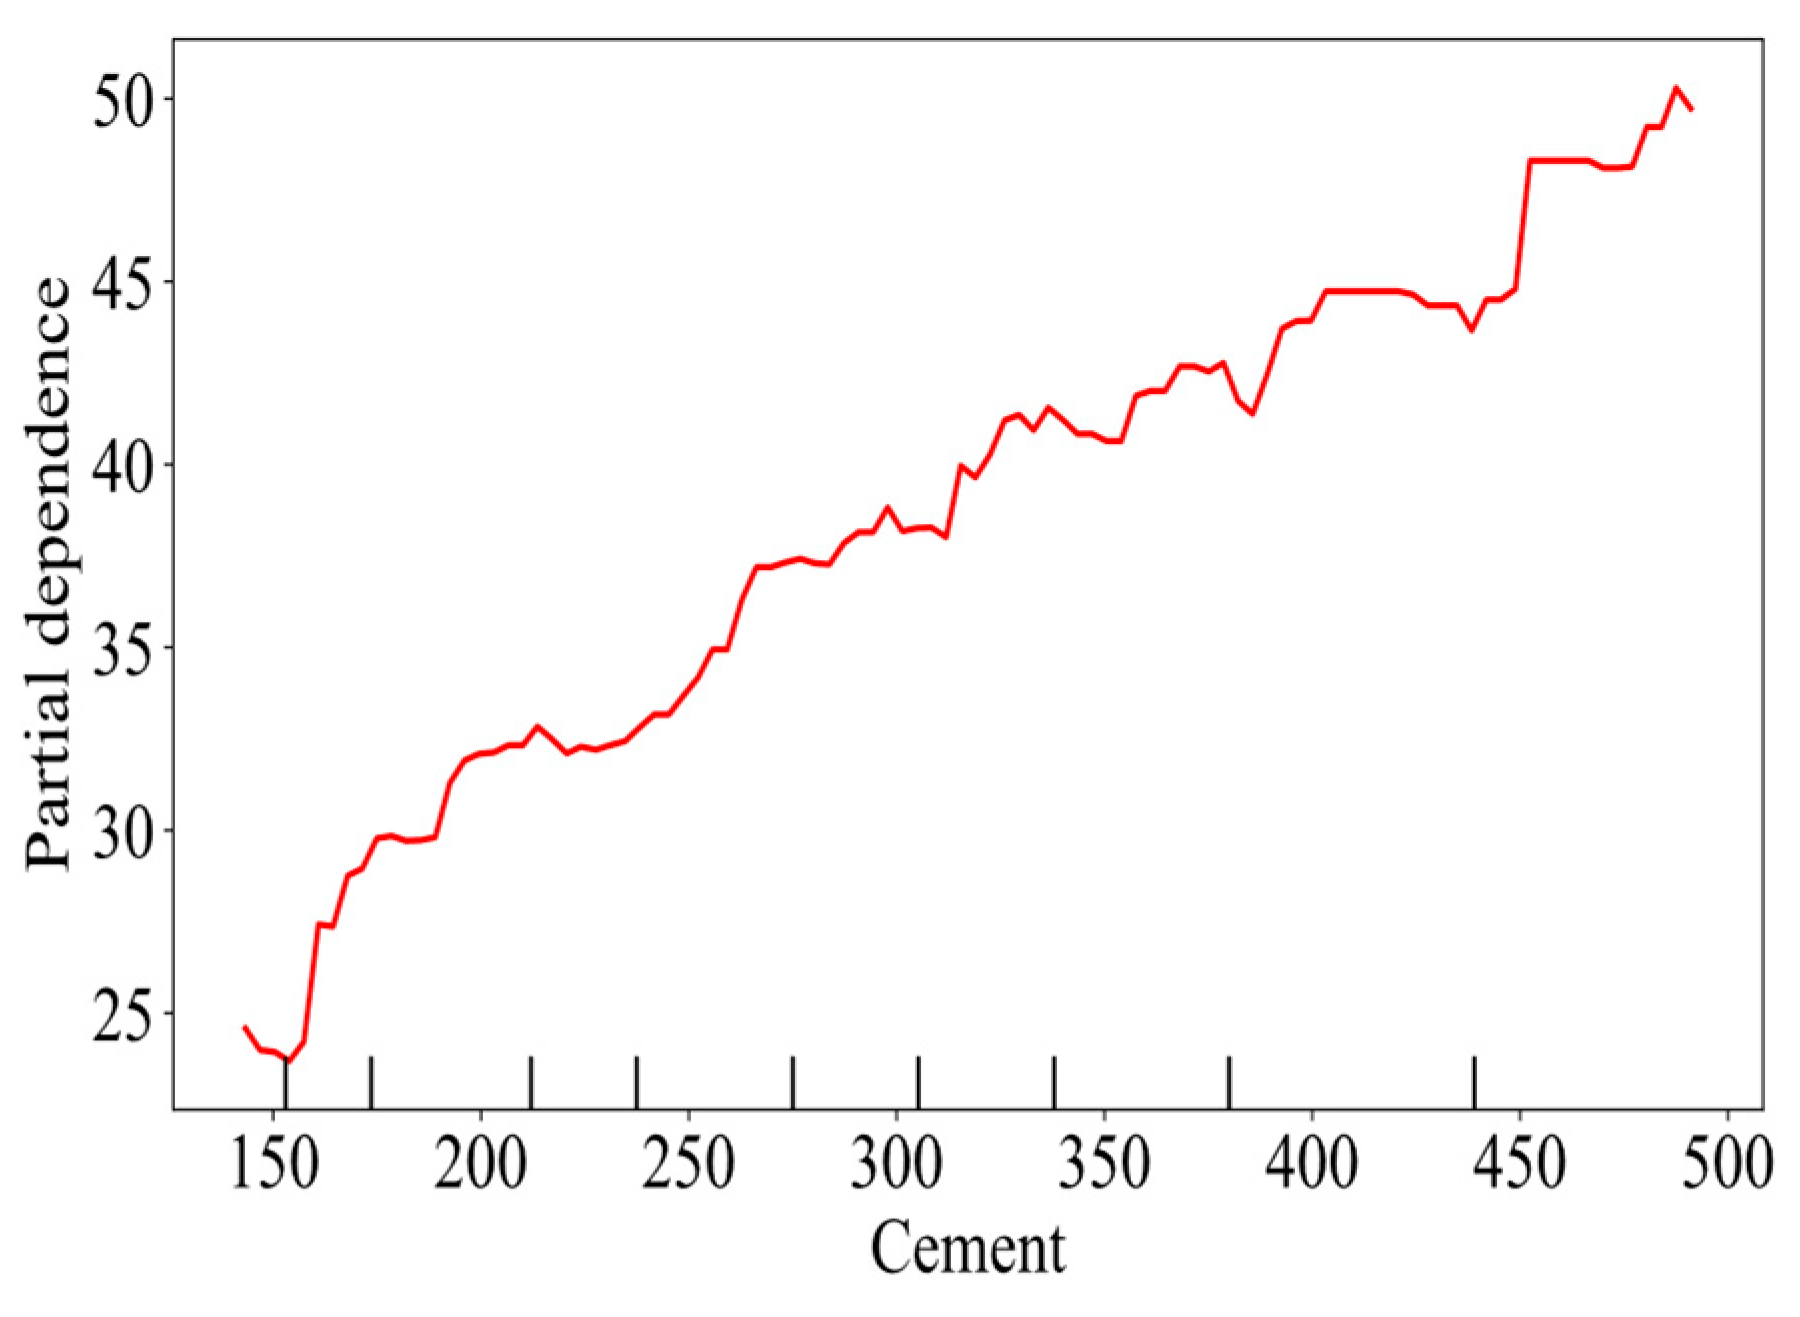
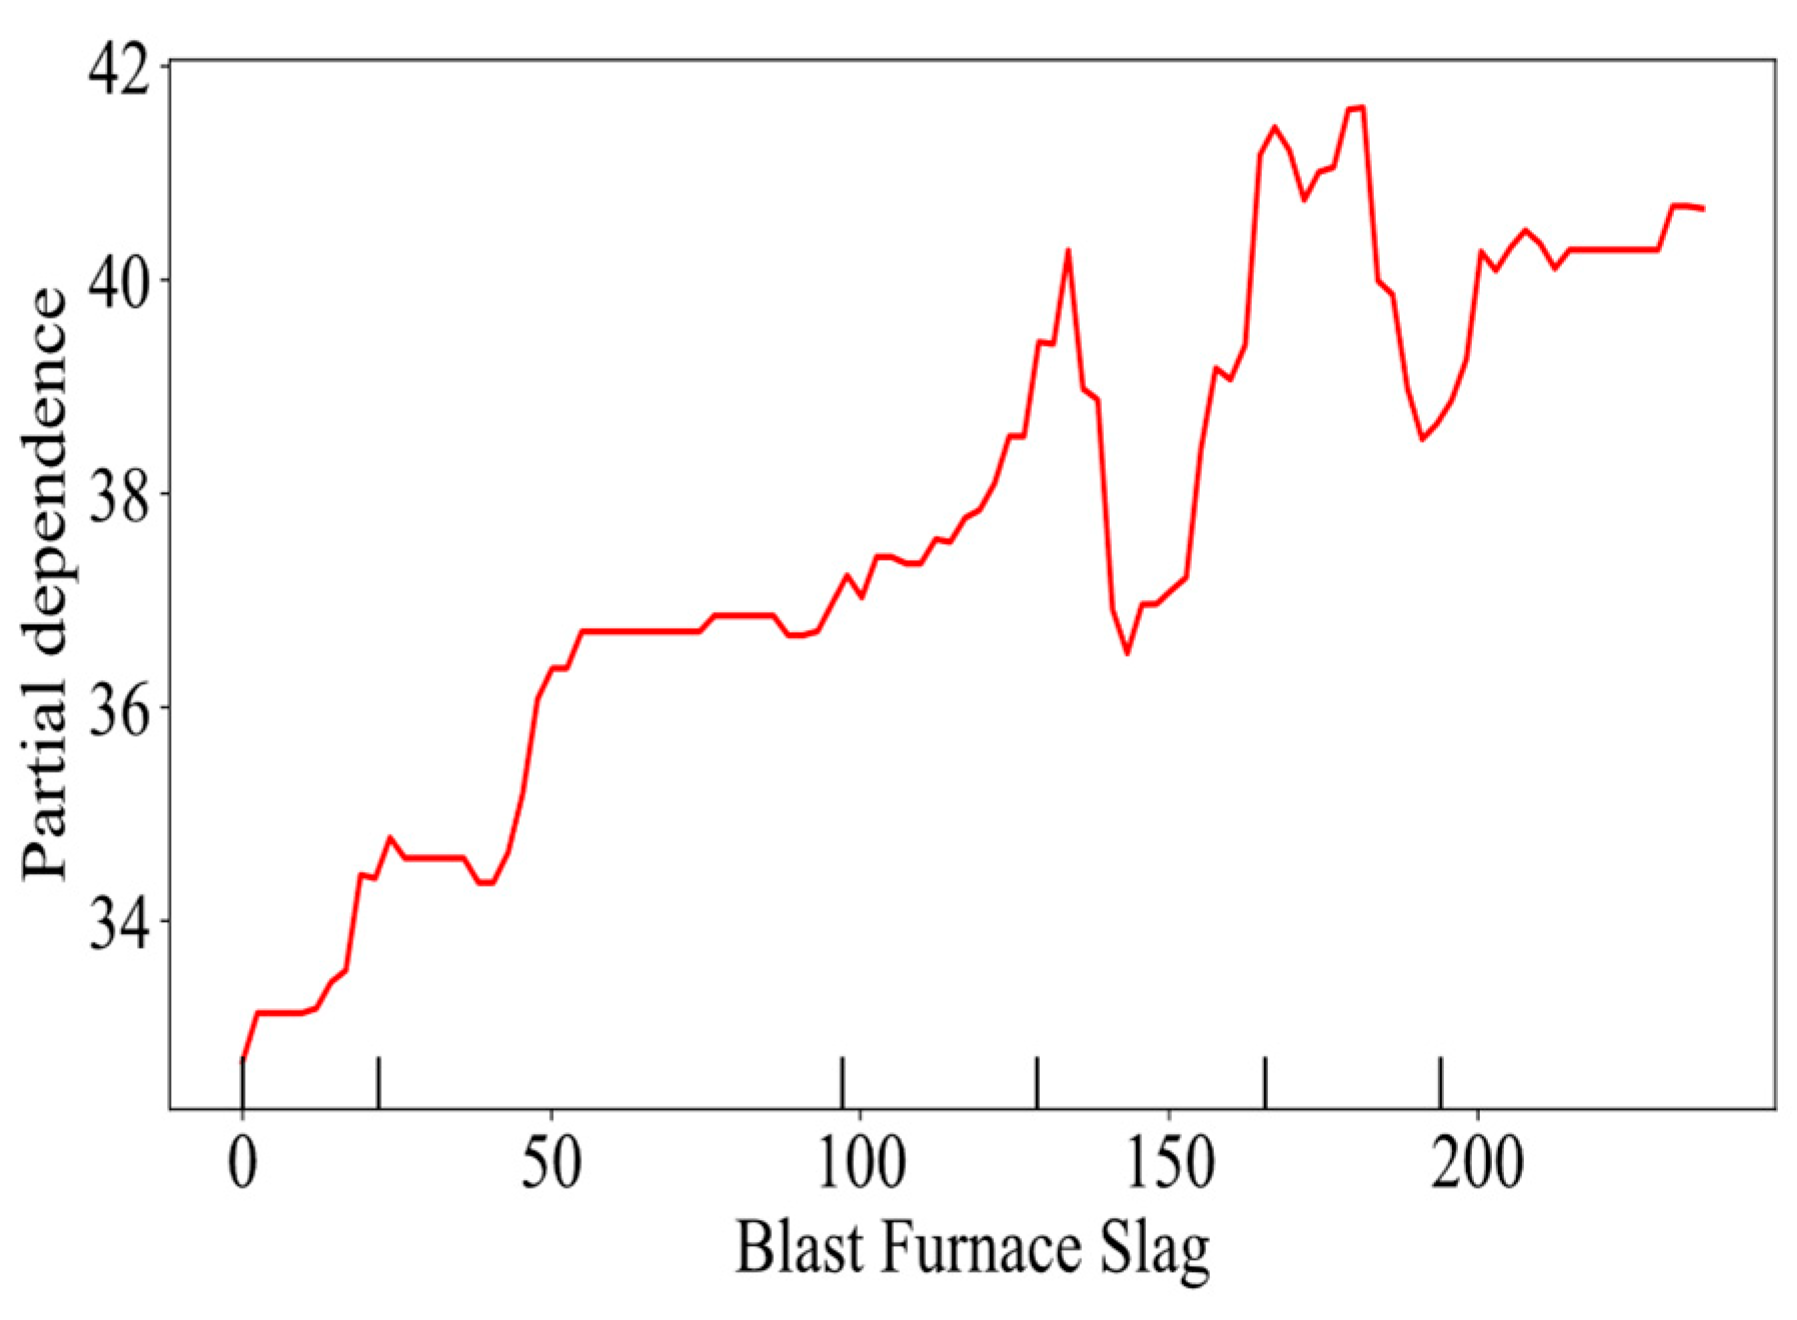
Figure 14 and Figure 15 display the partial dependence relationships for two important variables, respectively. Figure 14 illustrates a monotonic positive correlation between Cement and the predicted compressive strength—as cement content increases, the model output continues to rise without evident saturation or decline, suggesting a sustained positive contribution of this feature to the prediction. Figure 15 illustrates the influence of blast furnace slag content on concrete performance (e.g., compressive strength). As the slag content increases, the performance indicator shows an upward trend. A significant improvement is observed in the low dosage range (0–50), attributed to the pozzolanic reactivity and micro-filler effect of slag. The rate of increase slows in the medium-high dosage range (50–150), and the curve plateaus beyond 150, indicating a performance gain plateau and diminishing marginal returns. Engineering practice demonstrates that a slag content within the 100–150 range effectively reduces cement consumption while ensuring mechanical performance, enhances concrete durability, and lowers the carbon footprint, making it a key parameter for optimizing green high-performance concrete.

5. Conclusions

This study integrates the Whale Optimization Algorithm (WOA) with the XGBoost framework to propose a high-accuracy, data-driven predictive model for concrete compressive strength. Four machine learning models were constructed and systematically compared, including Linear Regression, Random Forest, conventional XGBoost, and WOA-XGBoost. The results demonstrate that the proposed WOA-XGBoost model achieves the best predictive performance and effectively characterizes the compressive strength behavior of concrete under the coupling effects of multiple factors. The main conclusions of this study are as follows:
(1) Outstanding Predictive Performance: The WOA-XGBoost model outperforms all other comparative models across all evaluation metrics. Its high coefficient of determination (R2) and low mean square error (MSE) indicate excellent fitting and prediction capabilities. The model effectively captures the complex nonlinear relationships between multiple input variables and compressive strength, providing a robust and reliable modeling framework for concrete strength prediction.
(2) Efficient Hyperparameter Optimization: The integration of the Whale Optimization Algorithm with XGBoost significantly enhances the efficiency and quality of hyperparameter search. The WOA algorithm systematically explores the parameter space, effectively avoids overfitting, and ensures high generalization performance of the model on test sets. This optimization strategy is key to achieving high accuracy and strong robustness.
(3) Strong Generalization and Robustness: The WOA-XGBoost model consistently demonstrates high predictive accuracy across multiple randomly partitioned test sets, indicating its insensitivity to sample partitioning and strong robustness. It can be reliably applied to predict the compressive strength of concrete under various mix proportion conditions.
(4) Identification of Key Influencing Variables: Feature importance analysis based on SHAP values reveals that Age, Cement, and Water are the most significant factors affecting compressive strength. Partial Dependence Plots (PDPs) further demonstrate that Blast Furnace Slag exhibits a clear marginal diminishing effect on compressive strength. These findings highlight the necessity of comprehensively considering the complex interactions among multiple variables in strength prediction models.
The proposed WOA-XGBoost model not only improves the accuracy and robustness of concrete compressive strength prediction but also facilitates the optimization of concrete mix design, reduces material waste, and promotes the transformation of the construction industry toward resource conservation and low-carbon emissions. It provides reliable data-driven support for green concrete technology and the achievement of sustainable development goals.
While the proposed WOA-XGBoost model has demonstrated excellent performance in predicting the compressive strength of concrete with complex compositions, several avenues remain open for further investigation. Future research could focus on expanding the dataset to include a wider variety of industrial and agricultural waste materials, such as rice husk ash, silica fume, or recycled aggregates, to enhance the model’s applicability across diverse green concrete formulations. Additionally, exploring the integration of other metaheuristic optimization algorithms—such as Particle Swarm Optimization (PSO) or Grey Wolf Optimizer (GWO)—with advanced ensemble learning methods could further improve prediction accuracy and computational efficiency. The incorporation of real-time monitoring data from construction sites, along with environmental factors such as temperature and humidity, may also help in developing dynamic strength prediction models that adapt to varying curing conditions. Finally, extending the current framework to predict other mechanical properties, such as tensile strength, elastic modulus, or durability indicators, would provide a more comprehensive tool for the multi-objective optimization of sustainable concrete mixtures.

Author Contributions

Conceptualization, P.Z.; Methodology, P.Z.; Software, D.S.; Validation, J.Z. and L.C.; Formal analysis, D.S.; Investigation, D.S., P.Z. and L.C.; Data curation, J.Z.; Writing—original draft, D.S.; Writing—review & editing, P.Z.; Visualization, P.Z., J.Z. and L.C.; Funding acquisition, P.Z. All authors have read and agreed to the published version of the manuscript.

Funding

This research was supported by the Key Science and Technology Project of the Transportation Industry (Grant No. 2022-ZD6-090) and the Xinjiang Transportation Science and Technology Project (Grant No. 2122-ZD-006).

Data Availability Statement

The dataset is available upon request from the authors.

Conflicts of Interest

Author Dawei Sun was affiliated with the company China Gezhouba Group Co., Ltd. Authors Ping Zheng, Jun Zhang and Liming Cheng were affiliated with the company Xinjiang Transport Planning Survey and Design Institute Co., Ltd. Authors declare that the research was conducted in the absence of any commercial or financial relationships that could be construed as a potential conflict of interest.

References

  1. Liu, G.; Sun, B. Concrete compressive strength prediction using an explainable boosting machine mode. Case Stud. Constr. Mater. 2023, 18, e01845. [Google Scholar]
  2. Asteris, P.G.; Mokos, V.G. Concrete compressive strength using artificial neural networks. Neural Comput. Appl. 2020, 32, 11807–11826. [Google Scholar] [CrossRef]
  3. Moccia, F.; Yu, Q.; Fernández Ruiz, M.; Muttoni, A. Concrete compressive strength: From material characterization to a structural value. Struct. Concr. 2021, 22, E634–E654. [Google Scholar] [CrossRef]
  4. Güçlüer, K.; Özbeyaz, A.; Göymen, S.; Günaydın, O. A comparative investigation using machine learning methods for concrete compressive strength estimation. Mater. Today Commun. 2021, 27, 102278. [Google Scholar] [CrossRef]
  5. Paudel, S.; Pudasaini, A.; Shrestha, R.K.; Kharel, E. Compressive strength of concrete material using machine learning techniques. Clean. Eng. Technol. 2023, 15, 100661. [Google Scholar] [CrossRef]
  6. Amar, M. Comparative use of different AI methods for the prediction of concrete compressive strength. Clean. Mater. 2025, 15, 100299. [Google Scholar] [CrossRef]
  7. Lazaridis, P.C.; Kavvadias, I.E.; Demertzis, K.; Iliadis, L.; Vasiliadis, L.K. Interpretable machine learning for assessing the cumulative damage of a reinforced concrete frame induced by seismic sequences. Sustainability 2023, 15, 12768. [Google Scholar] [CrossRef]
  8. Izadifar, M.; Ukrainczyk, N.; Schönfeld, K.; Koenders, E. Activation energy of aluminate dissolution in metakaolin: MLFF-accelerated DFT study of vdW and hydration shell effects. Nanoscale Adv. 2025, 7, 4325–4335. [Google Scholar] [CrossRef]
  9. Dinesh, A.; Prasad, B.R. Predictive models in machine learning for strength and life cycle assessment of concrete structures. Autom. Constr. 2024, 162, 105412. [Google Scholar] [CrossRef]
  10. Hu, H.; Jiang, M.; Tang, M.; Liang, H.; Cui, H.; Liu, C.; Ji, C.; Wang, Y.; Jian, S.; Wei, C.; et al. Prediction of compressive strength of fly ash-based geopolymers concrete based on machine learning. Results Eng. 2025, 27, 106492. [Google Scholar] [CrossRef]
  11. Wang, Z.; Liu, S.; Liang, W.; Liu, J.; Zhou, Y.; Lei, K.; Gao, Y.; Ou, W. Predictive Modeling of Compressive Strength in Tailings Concrete Using Explainable Machine Learning Approaches. Results Eng. 2025, 27, 105516. [Google Scholar] [CrossRef]
  12. Pazouki, G.; Tao, Z.; Saeed, N.; Kang, W.-H. Using artificial intelligence methods to predict the compressive strength of concrete containing sugarcane bagasse ash. Constr. Build. Mater. 2023, 409, 134047. [Google Scholar] [CrossRef]
  13. Al-Jamimi, H.A.; Al-Kutti, W.A.; Alwahaishi, S.; Alotaibi, K.S. Prediction of compressive strength in plain and blended cement concretes using a hybrid artificial intelligence model. Case Stud. Constr. Mater. 2022, 17, e01238. [Google Scholar] [CrossRef]
  14. Tayeh, B.A.; Akeed, M.H.; Qaidi, S.; Abu Bakar, B.H. Influence of sand grain size distribution and supplementary cementitious materials on the compressive strength of ultrahigh-performance concrete. Case Stud. Constr. Mater. 2022, 17, e01495. [Google Scholar] [CrossRef]
  15. Ma, Q.; Xiao, J.; Ding, T.; Duan, Z.; Song, M.; Cao, X. The prediction of compressive strength for recycled coarse aggregate concrete in cold region. Case Stud. Constr. Mater. 2023, 19, e02546. [Google Scholar] [CrossRef]
  16. Sánchez-Mendieta, C.; Galán-Díaz, J.J.; Martinez-Lage, I. Relationships between density, porosity, compressive strength and permeability in porous concretes: Optimization of properties through control of the water-cement ratio and aggregate type. J. Build. Eng. 2024, 97, 110858. [Google Scholar] [CrossRef]
  17. Mengistu, G.M.; Nemes, R. Predicting the compressive strength of sustainable recycled aggregate concrete using multi-NDT methods. Results Eng. 2025, 26, 105650. [Google Scholar] [CrossRef]
  18. Li, Y.; Zhong, R.; Yu, J.; Song, J.; Wang, Q.; Chen, C.; Li, X.; Liu, E. Uniaxial Compressive Strength of Concrete Inversion using Machine Learning and Computational Intelligence Approach. Results Eng. 2025, 26, 105627. [Google Scholar] [CrossRef]
  19. Sathiparan, N.; Jeyananthan, P.; Subramaniam, D.N. A comparative study of machine learning techniques and data processing for predicting the compressive strength of pervious concrete with supplementary cementitious materials and chemical composition influence. Next Mater. 2025, 9, 100947. [Google Scholar] [CrossRef]
  20. Heidari, S.I.G.; Safehian, M.; Moodi, F.; Shadroo, S. Predictive modeling of the long-term effects of combined chemical admixtures on concrete compressive strength using machine learning algorithms. Case Stud. Chem. Environ. Eng. 2024, 10, 101008. [Google Scholar] [CrossRef]
  21. Khan, A.Q.; Awan, H.A.; Rasul, M.; Siddiqi, Z.A.; Pimanmas, A. Optimized artificial neural network model for accurate prediction of compressive strength of normal and high strength concrete. Clean. Mater. 2023, 10, 100211. [Google Scholar] [CrossRef]
  22. Wang, Q.; Yao, G.; Kong, G.; Wei, L.; Yu, X.; Jianchuan, Z.; Ran, C.; Luo, L. A data-driven model for predicting fatigue performance of high-strength steel wires based on optimized XGBoost. Eng. Fail. Anal. 2024, 164, 108710. [Google Scholar] [CrossRef]
  23. Yu, X.; Hu, T.; Khodadadi, N.; Liu, Q.; Nanni, A. Modeling chloride ion diffusion in recycled aggregate concrete: A fuzzy neural network approach integrating material and environmental factors. Structures 2025, 73, 108372. [Google Scholar] [CrossRef]
  24. Elshaarawy, M.K.; Alsaadawi, M.M.; Hamed, A.K. Machine learning and interactive GUI for concrete compressive strength prediction. Sci. Rep. 2024, 14, 16694. [Google Scholar] [CrossRef] [PubMed]
  25. Concrete Compressive Strength. Available online: http://dx.doi.org/10.24432/C5PK67 (accessed on 22 May 2025).
  26. Monteiro, D.K.; Miguel, L.F.F.; Zeni, G.; Becker, T.; de Andrade, G.S.; de Barros, R.R. Whale Optimization Algorithm for structural damage detection, localization, and quantification. Discov. Civ. Eng. 2024, 1, 98. [Google Scholar] [CrossRef]
  27. Nguyen, H.; Cao, M.T.; Tran, X.L.; Tran, T.H.; Hoang, N.D. A novel whale optimization algorithm optimized XGBoost regression for estimating bearing capacity of concrete piles. Neural Comput. Appl. 2023, 35, 3825–3852. [Google Scholar] [CrossRef]
  28. Wei, J.; Gu, Y.; Lu, B.; Cheong, N. RWOA: A novel enhanced whale optimization algorithm with multi-strategy for numerical optimization and engineering design problems. PLoS ONE 2025, 20, e0320913. [Google Scholar] [CrossRef]
  29. Rahimnejad, A.; Akbari, E.; Mirjalili, S.; Gadsden, S.A.; Trojovský, P.; Trojovská, E. An improved hybrid whale optimization algorithm for global optimization and engineering design problems. PeerJ Comput. Sci. 2023, 9, e1557. [Google Scholar] [CrossRef]
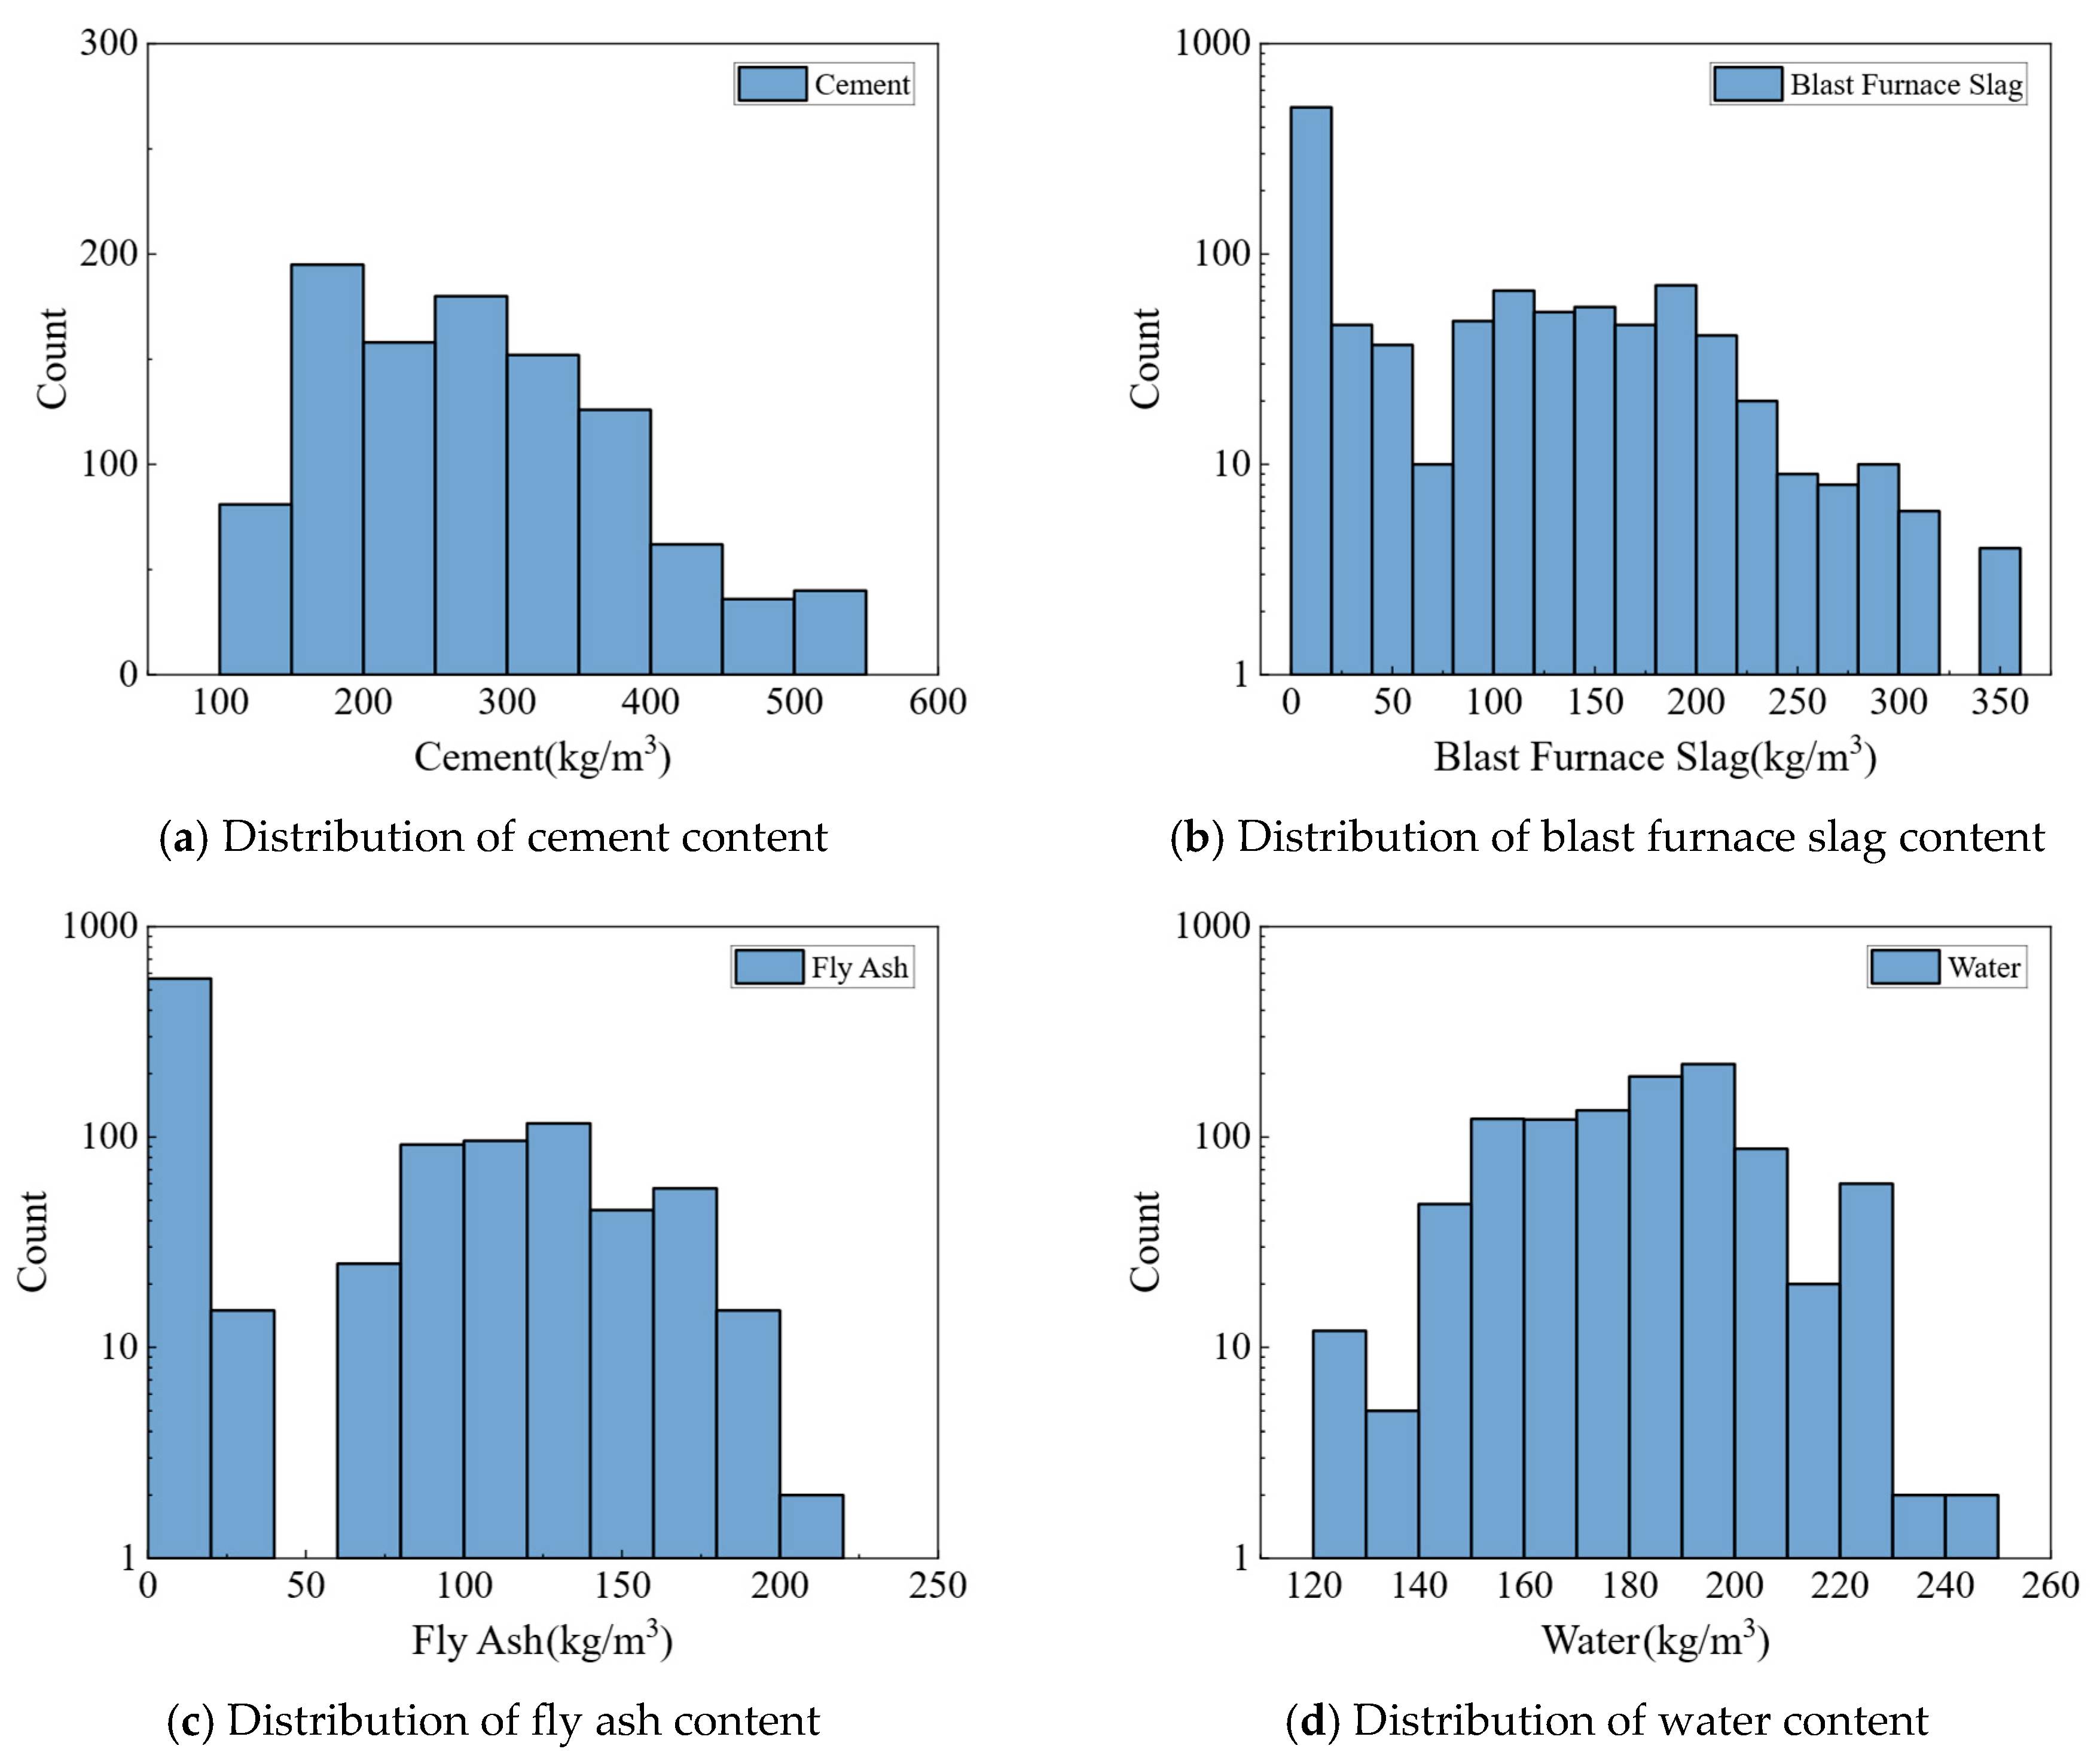
Figure 1. Distribution of databases.
Buildings 15 03761 g001aBuildings 15 03761 g001b
Figure 2. Pearson’s correlation matrix for each variable.
Buildings 15 03761 g002
Figure 3. WOA Optimizes Hyperparameter Setting Range for XGBoostXGBoost.
Buildings 15 03761 g003
Figure 4. Flowchart of WOA-XGBoostXGBoost.
Buildings 15 03761 g004
Figure 5. WOA-XGBoost: Predicted vs. True (Training Set).
Buildings 15 03761 g005
Figure 6. WOA-XGBoost: Predicted vs. True (Test Set).
Buildings 15 03761 g006
Figure 7. Random Forest: Predicted vs. True (Test Set).
Buildings 15 03761 g007
Figure 8. Linear Regression: Predicted vs. True (Test Set).
Buildings 15 03761 g008
Figure 9. LIGHTBOOST: Predicted vs. True (Test Set).
Buildings 15 03761 g009
Figure 10. CATBOOST: Predicted vs. True (Test Set).
Buildings 15 03761 g010
Figure 11. NN: Predicted vs. True (Test Set).
Buildings 15 03761 g011
Figure 12. Feature Importance Analysis for Regression Models.
Buildings 15 03761 g012
Figure 13. Feature importance analysis using SHAP value.
Buildings 15 03761 g013
Figure 14. Partial Dependence Plot: Cement.
Buildings 15 03761 g014
Figure 15. Partial Dependence Plot: Blast Furnace Slag.
Buildings 15 03761 g015
Table 1. Average predicted performance metrics for the test set.
WOXGBoost TrainingWOXGBoost TestXGBoostRandom ForestRidge Regression
R20.98080.94120.90510.87620.6275
MSE2.32773.89204.94408.91839.7967
Continuation
R20.98080.94120.93830.92940.8424
MSE2.32773.89204.01814.26406.4248
Disclaimer/Publisher’s Note: The statements, opinions and data contained in all publications are solely those of the individual author(s) and contributor(s) and not of MDPI and/or the editor(s). MDPI and/or the editor(s) disclaim responsibility for any injury to people or property resulting from any ideas, methods, instructions or products referred to in the content.