Abstract
This study uses the case of substituting natural river sand with molybdenum tailings in concrete production in China to propose a methodological framework for evaluating the life cycle environmental impact of concrete materials. This approach addresses the mechanical performance adaptability and environmental friendliness, as well as the resource utilization of solid waste. The resource consumption, environmental impact, and economic costs are systematically analyzed using a life cycle assessment (LCA) approach, and the circular economy potential of tailings-based concrete is explored. A three-dimensional evaluation framework is constructed, encompassing raw material production, transportation, and construction stages. The environmental impacts of concrete with different molybdenum tailings replacement rates and strength grades are quantified using a willingness-to-pay (WTP) model. The results indicate that increasing the dosage of molybdenum tailings can significantly reduce environmental indicators such as global warming potential and acidification potential value. Specifically, C30 concrete with a 100% replacement rate shows an 8.5% reduction in total WTP compared to ordinary concrete, with a 2.85% reduction in energy consumption during the production stage. High-strength concrete further optimizes the environmental cost per unit strength through the “strength dilution effect,” with a 44.9% reduction in carbon footprint for 60 MPa concrete compared to 30 MPa concrete. Regional analysis reveals that the environmental contribution of the production stage dominates in short-distance transportation scenarios, while logistics optimization has a significant emission reduction effect in long-distance transportation scenarios. The study demonstrates that the proposed LCA methodology provides a scientific approach for the development of green building materials and the sustainable resource utilization of solid waste through case-informed generalization.
1. Introduction
As a fundamental pillar of modern industrial civilization, the extraction and utilization of mineral resources consistently pose significant environmental challenges. The issue of tailings storage is particularly prominent, with adverse impacts manifesting across multiple dimensions [1,2,3]. Ecologically, tailings not only occupy vast tracts of land, leading to topographical damage and soil degradation [4], but also generate complex pollution chains through heavy metal leaching, sulfide oxidation, and the release of toxic substances, resulting in surface water pollution [5], atmospheric acidification, and dust dispersion [6]. In terms of safety, the risk of tailings dam failures and slope instability poses ongoing threats to surrounding communities [7,8]. Concurrently, the global surge in infrastructure development has driven a sharp increase in demand for natural aggregates, causing the rapid depletion of high-quality sand and gravel resources and escalating costs. This dual pressure of supply–demand imbalance and ecological stress necessitates the sustainable utilization of tailings as a critical solution [9]. Transforming tailings into green building materials can mitigate aggregate shortages [10]. This approach also reduces solid waste and helps control pollution, thereby delivering both economic and environmental benefits [11].
Within the realm of molybdenum tailings utilization in construction materials, researchers have made notable progress through multifaceted approaches. The team led by Cui et al. [12] successfully formulated high-performance concrete with a compressive strength of 157.16 MPa by incorporating 20% molybdenum tailings sand and optimizing plasticizer ratios. Jiang et al. [13] investigated the pollution characteristics and biotoxicity of molybdenum-nickel mine tailings and smelting waste, revealing that while heavy metal concentrations in smelting waste were lower compared to raw ore, residual concentrations of nickel, molybdenum, and zinc remained significantly elevated. Yuan et al. [14,15] explored the feasibility of using molybdenum tailings (MoTs) as a partial substitute for fine aggregate in concrete, targeting ecological concerns related to the increasing demand for natural sand. Xie et al. [16] revealed that 25% molybdenum tailings concrete retained relatively high mechanical performance under the coupled effects of elevated temperature and sulfuric acid attack.
The application of life cycle assessment (LCA) methodologies offers a robust framework for evaluating the environmental benefits of utilizing tailings-based construction materials. Zhang et al. [17] quantified the non-linear reduction in energy consumption and carbon emissions associated with cement replacement, revealing that the efficiency of carbon emission reduction exceeded the decrease in energy consumption by 37%. Li et al. [18] developed an LCA model for copper tailings-autoclaved concrete, showing that a combined substitution of 35% sand and 10% cement reduced global warming potential (GWP) by 19.5%. Lin et al. [19] conducted a comprehensive life cycle analysis of tungsten tailings concrete, revealing reductions of 28% and 21% in acidification potential (AP) and eutrophication potential (EP), respectively, compared to conventional concrete, confirming the benefits of process optimization on ecotoxicity indicators. Kurda et al. [20] discovered that recycled aggregates were more effective for optimizing specific environmental indicators, providing theoretical support for solid waste co-blending techniques.
Current research on tailings-based concrete primarily concentrates on optimizing material mechanical properties, with limited systematic evaluation of life cycle sustainability [21,22]. Traditional life cycle assessment (LCA) methodologies often face limitations in capturing the synergistic trade-offs between environmental impacts and economic costs. Conventional LCA frameworks typically compartmentalize environmental and economic analyses, neglecting their dynamic interdependencies, such as the nonlinear relationship between tailings substitution rates and cost-effectiveness of emission reduction strategies. This gap hinders the ability to optimize material designs for both ecological and economic viability.
To address these limitations, this study proposes an innovative three-dimensional evaluation framework integrating resource consumption, environmental impact, and economic costs, advancing traditional LCA methodology by systematically coupling these dimensions into a unified analytical approach. Through the case study of molybdenum tailings concrete in China, we demonstrate the framework’s effectiveness in quantifying trade-offs between mechanical performance, circular economy potential, and sustainability metrics, offering a replicable model for green material development. By integrating key performance parameters, such as compressive strength and durability, with environmental emission data and monetized cost indicators (e.g., willingness-to-pay models), this study establishes a ‘performance–sustainability–economics’ tripartite coupling model for tailings-based construction materials. By integrating key performance parameters, such as compressive strength and durability, with environmental emission data, this study establishes a “performance–sustainability” coupling model for tailings-based construction materials. Furthermore, the expected value of the disaster loss calculation method is introduced to compute the full life cycle risk costs of tailings concrete structures, forming a multi-objective decision support framework for resource utilization technologies [23,24]. This research not only reveals the non-linear relationships between tailings content, mechanical performance, and environmental impacts, but also establishes a standardized sustainability indicator system that supports low-carbon design, policy formulation, and technology selection for solid waste utilization, demonstrating both practical engineering value and ecological benefit [25,26].
2. Materials and Methods
2.1. Production of Molybdenum Tailings Concrete
Based on in-depth investigations into the concrete mix proportions for a particular hydraulic structure and our team’s previous research, the mix proportions per cubic meter of concrete with different molybdenum tailings replacement rates are presented in Appendix A, Table A1.
In this study, we considered four concrete compressive strength grades: C30, C40, C50, and C60. For each strength grade, five molybdenum tailings replacement rates of river sand were taken into account, namely 0% (designated as M0), 25% (M25), 50% (M50), 75% (M75), and 100% (M100). For example, the designation M25-C30 implies that “M” represents the use of molybdenum tailings, “25” indicates that molybdenum tailings replace 25% of river sand, and “C30” is the designed compressive strength of the concrete.
To comprehensively understand the environmental implications of molybdenum tailings concrete, a quantitative assessment was carried out. This was achieved by leveraging computational models specifically developed for each stage of the concrete production process, from raw material extraction to final product formation.
2.2. Life Cycle Assessment Methodology
2.2.1. Theoretical Foundation of the Three-Dimensional LCA Framework
The selection of the three dimensions—resource, environment, and economic cost—in this framework is based on rigorous methodological considerations. First, resource consumption and environmental impact constitute the core elements of life cycle assessment as mandated by the ISO 14040 standards [27], forming the foundational basis of the evaluation. Second, the introduction of the economic cost dimension, innovatively integrated through the willingness-to-pay (WTP) model for monetization, aims to overcome the limitation of conventional LCA that treats environmental and economic assessments in isolation [28]. This enables a coupled evaluation of sustainability performance, representing a key innovation of this study. As for the exclusion of other dimensions, it is because they fall outside the research scope centered on “circular economy potential” and “waste valorization,” and would require distinctly different methodologies, thereby ensuring the study remains focused on addressing the critical scientific issue of synergies and trade-offs among resource, environment, and economy.
2.2.2. Resource–Environment–Economy LCA
The collaborative decision-making flowchart depicted in Figure 1 presents a systematic methodology for integrating resource consumption, environmental impact, and economic costs to achieve comprehensive life cycle assessment. This visualization strategically categorizes key quantitative metrics—including material substitution rates, global warming potential values, and willingness-to-pay models—into distinct dimensions while illustrating their inherent interconnections.
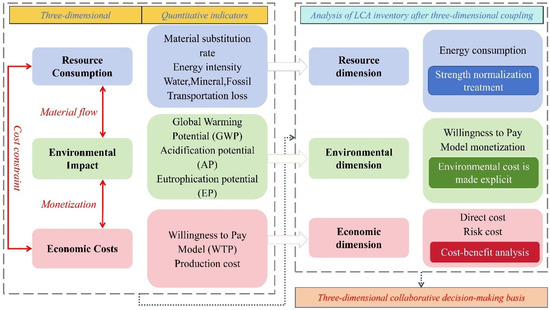
Figure 1.
Collaborative decision-making flowchart (source: developed for this study).
The left panel enumerates input indicators across three primary evaluation dimensions, while the right section demonstrates their integrated analysis through three methodological approaches: energy normalization, environmental cost monetization, and cost-benefit analysis. Employing color-coded modules and directional arrows, the diagram effectively delineates relationships between various sustainability assessment criteria, thereby establishing a practical framework for multidimensional decision-making in life cycle assessment.
2.2.3. LCA Framework
The system boundary for the life cycle assessment (LCA) of molybdenum tailings concrete, as visually illustrated in Figure 2, comprehensively spans from raw material extraction to the final product’s factory dispatch. This scope explicitly includes the extraction and processing of raw materials—such as molybdenum tailings sand, natural river sand, cement, stone, and water-reducing agents—as well as their transportation and the production and delivery of finished concrete. By incorporating material and concrete transportation links, the study extends beyond conventional LCA boundaries, which often limit their focus to raw material production, construction, use, and demolition phases. Through color-coded segments and clear visual differentiation, the figure highlights the expanded system boundary adopted for molybdenum tailings concrete LCA. It accounts for all relevant inputs and outputs. This delineation focuses the assessment on the upstream impacts most directly influenced by material substitution, such as resource consumption and production-related emissions, while providing a comparative reference to conventional concrete. The approach ensures methodological consistency, enhances the reliability of results for decision-making in green material design, and establishes a scalable framework capable of incorporating downstream phases—such as use, maintenance, and end-of-life recycling—in future studies when relevant data become available.
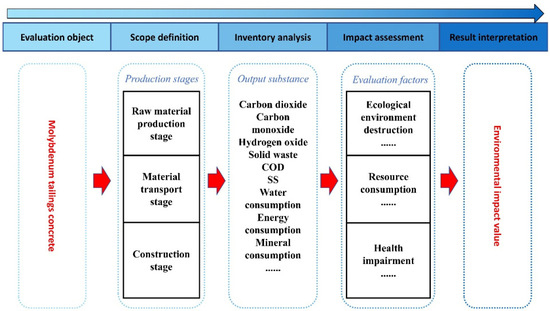
Figure 2.
Molybdenum tailings concrete sustainability assessment framework (adapted from [29,30]).
2.2.4. Evaluation Framework for BEPAS and BHIAS Based on Willingness to Pay
In the realm of construction engineering, the environmental impacts throughout a building’s life cycle are typically categorized into three primary dimensions: ecosystem quality degradation, human health risks, and natural resource depletion. To systematically quantify these impacts, our research team at Tsinghua University has developed complementary assessment tools based on life cycle assessment (LCA) principles: the Building Environmental Performance Analysis System (BEPAS) [29] and the Building Human Health Impact Assessment System (BHIAS) [30]. Through methodological integration, these tools form a comprehensive evaluation framework that encompasses the entire “resource–ecology–health” chain, as illustrated in Figure 2.
2.3. Life Cycle Inventory Analysis
The life cycle inventory (LCI) analysis for this study was constructed to quantify the inputs and outputs associated with 1 m3 of C30 molybdenum tailings concrete. To establish the foundational model, the material proportions (cement, natural aggregates, molybdenum tailings, and water-reducing agents) were first defined based on our specific mix proportion design [31], with detailed data provided in Appendix A, Table A1. The system boundary, critical to this methodology, was explicitly delineated into three stages to ensure a consistent and replicable assessment framework.
- (1)
- Raw Material Production Stage: This stage accounts for the environmental burdens of each input. The core of our methodological approach here was the selection of specific, relevant data sources for each material to accurately represent the production processes defined in our study.
- (2)
- Raw Material Transportation Stage: A key part of our modeling was the dynamic calculation of transportation impacts. The distances, vehicle types, and efficiencies were not generic but were determined through GIS analysis and supplier interviews specifically for this study, making the transport assessment a defined part of our methodology.
- (3)
- Concrete Preparation Stage: The inventory for this stage was built by applying standardized energy consumption factors to the operational parameters of the mixing plant assumed in our experimental setup.
2.3.1. Raw Material Production Stage
Environmental Impact Inventory of Cement
From an environmental sustainability perspective, the environmental footprint of cement production has become a focal point of academic interest. The team led by Gong [32] compared the production processes of three different grades of cement, revealing that the clinker calcination stage contributes the most to the environmental load. Furthermore, the resource consumption and environmental impact factors exhibit a positive correlation with increasing cement grade. Xu’s [33] systematic study further expanded the research scope. Through a life cycle assessment of six types of general-purpose cement, it was found that Portland cement had the highest comprehensive environmental impact value, while slag Portland cement demonstrated the best environmental performance, reducing the environmental load by an average of 34% compared to the former.
Based on the above research findings and field survey data, this study selects ordinary Portland cement, the most widely used type in the construction engineering field, as the research object. It focuses on constructing a core parameter system for resource consumption and environmental emissions during its production process. Specific data can be found in Appendix A, Table A2. This inventory system integrates material and energy flow data from raw material extraction to final product delivery, providing fundamental support for the subsequent green assessment of concrete production.
Environmental Impact Inventory of Natural Coarse and Fine Aggregates
Aggregates, as fundamental components of concrete systems, serve dual roles in construction engineering: providing structural support and ensuring volumetric stability. The quality and performance of aggregates directly influence the durability and safety of building structures. Natural aggregates, traditional construction materials, are produced through a process involving geological resource exploration, open-pit mining, crushing, screening, and gradation control, resulting in sand and gravel materials that meet engineering standards.
It is noteworthy that the process characteristics associated with variations in aggregate particle size are attracting increasing attention within the academic community. This study adopts the innovative research methodology of Zhu [34], dividing natural aggregates into coarse and fine components for material flow analysis. The resulting resource consumption and environmental emission inventory is detailed in Table 1. This approach effectively reveals the differentiated environmental impacts of the production processes for aggregates of varying particle sizes, providing data support for refined environmental management. This layered research paradigm overcomes the limitations of traditional holistic assessments, more accurately reflecting the complex characteristics of aggregate production systems.

Table 1.
Resource Consumption and Environmental Impact Inventory for Producing 1 kg of Coarse and Fine Aggregate.
Environmental Impact Inventory of Molybdenum Tailings
Molybdenum tailings, a byproduct of polymetallic mining and smelting, pose a significant environmental risk due to heavy metal migration, dust pollution, and leachate diffusion. Despite advancements in resource utilization technologies, large quantities of historical tailings remain untreated globally, leading to escalating soil and water contamination and ecotoxicological effects. A comprehensive life cycle environmental load assessment is urgently needed to quantify resource consumption and pollutant emissions from extraction, beneficiation, smelting, and storage. This will provide a scientific basis for developing precise ecological restoration strategies and risk management pathways, facilitating the transformation of tailings from an “environmental burden” to a “resource carrier.” According to statistical data [35], resource consumption and environmental impacts during molybdenum tailings production exhibit significant stage differences. The primary production stage consumes 1.10 tons of low-grade ore per unit, contributing over 99% of energy consumption and CO2 emissions. Secondary processes and allocation mechanisms have a marginal impact on SO2 and NO2 emissions, as shown in Table 2; however, their environmental load is significantly reduced after economic allocation, highlighting the critical role of technological optimization in the core production stage for emission reduction. It is noteworthy that while the economic allocation method reduces the environmental load per unit of concrete by accounting for the value weight of by-products, its applicability depends heavily on the market value and economic weight of tailings as secondary products—factors that remain highly uncertain under current techno-economic conditions where large-scale utilization of molybdenum tailings has not yet formed a stable market chain. In contrast, the absence of economic allocation method more directly reflects the environmental benefits of tailings substitution without introducing subjective economic biases, making it more suitable for evaluating the resource utilization of solid waste in the current context. Therefore, this study primarily adopts the absence of economic allocation approach to quantify the environmental advantages of molybdenum tailings concrete, ensuring that the assessment aligns with present technological and economic realities.
Table 2.
Production Resource Consumption and Material Emission Inventory for 1 t Molybdenum Tailings.
Environmental Impact Inventory of High-Efficiency Water Reducers
As a core functional component in modern concrete technology, high-efficiency water-reducing agents, through molecular interfacial action, significantly reduce mixing water demand while maintaining constant slump, thereby enhancing concrete density and mechanical strength. Their environmental footprint has become a critical issue in green building materials research. Empirical studies by Li [36] indicate that the production chain of this admixture imposes a significant environmental load: each ton of product consumes 16 MJ of energy and is accompanied by emissions of 0.69 kg of CO2, 2.1 × 10⁻³ kg of CO, 1.2 × 10⁻³ kg of CxHγ, 3.5 × 10⁻³ kg of NOx, 6.6 × 10⁻³ kg of SO2, and other diverse pollutants. This study presents a case-specific analysis of naphthalene-based high-efficiency water-reducing agents, grounded in the actual type and dosage applied in the investigated concrete mix. While alternative formulations or dosages could yield different results, the primary aim here is to validate the proposed LCA methodology’s applicability, rather than to generalize performance across all water-reducing agents. By focusing on this representative case, we demonstrate how the framework systematically quantifies environmental impacts under defined conditions, providing a replicable model for future assessments of other admixture types or dosages, with powder dosages ranging from 0.75% to 1.5% of the cementitious material mass, and liquid product dosages from 1.5% to 2.5%. The relevant environmental parameters are based on the full life cycle inventory data constructed by Tao [37], detailed in Appendix A, Table A3. This dataset covers resource and emission quantification indicators from raw material synthesis to finished product factory output, providing data support for the precise assessment of the environmental impact of concrete systems.
Environmental Impact Inventory of Water, Electricity, Fossil Fuels, and Derived Energy Sources
The environmental footprint of municipal water production systems, a critical resource for modern urban infrastructure, has emerged as a key area of investigation for sustainable water resource management. A life cycle assessment conducted by Wang et al. [38] indicates that the production of one cubic meter of potable water consumes 0.08 kg of standard coal equivalent and results in various environmental emissions. These include atmospheric pollutants such as 0.213 kg of CO2, 0.001 kg of NOx, and 0.002 kg of SO2, alongside waterborne pollutants like 5.4 × 10⁻⁶ kg of COD and 0.04 kg of solid waste. Detailed data are presented in Table 3. This quantitative model elucidates the inherent relationship between energy conversion and pollution control within water treatment processes, providing essential baseline data for evaluating the comprehensive environmental impact of construction materials such as concrete.
Table 3.
Consumption of 1 m3 of Tap Water Resources and Material Emissions Inventory.
According to data from the China Energy Statistical Yearbook [39], the national power supply structure in 2020 exhibited a coal-dominated pattern: thermal power generation accounted for 70.85% of total output, with hydro, nuclear, and wind power contributing 18.01%, 4.87%, and 6.2% respectively, while imported electricity constituted merely 0.06% as shown in Figure 3. Given the pivotal role of coal-fired power in the energy system, this study adopts the life cycle environmental load model for thermal power plants developed by Ding [40] as baseline data. The model systematically quantifies resource consumption and pollutant emissions across the entire supply chain, from coal mining and transportation to power generation terminals (see Appendix A Table A4), providing scientific substantiation for a systematic assessment of electricity-related environmental impacts.
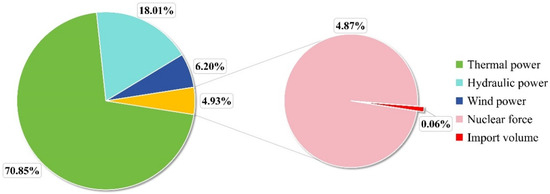
Figure 3.
Percentage distribution of electricity generation by energy (source: data from [39]).
As the foundational pillar of the modern industrial system, fossil energy covers the entire industrial chain of geological exploration, mining, refining, storage, and transportation to terminal applications, and exhibits significant resource-intensive and energy-dependent characteristics. The emissions of multimedia pollutants such as CO2, PM2.5, and heavy metals generated by the operation of the industrial chain exert compound pressure on the atmosphere, water bodies, and soil ecosystems. Given this, this study adopts the systematic research results of Yang [41]. Through the material flow-energy flow coupling analysis method, a database of environmental impacts for the entire life cycle covering coal, oil, natural gas, and their derivative energy is constructed. See Table A5 in Appendix A for details. The ecological and environmental interaction mechanism from in-situ resource allocation to energy conversion and utilization is accurately quantified, providing a scientific benchmark for energy structure optimization and low-carbon technology pathway selection.
Given the diverse characteristics and unit heterogeneity of fossil energy and its derivative energy, establishing a unified energy accounting benchmark has become a necessary condition for cross-system environmental load comparison research. This study is based on the calorific value equivalent conversion principle of “General Rules for Comprehensive Energy Consumption Calculation” (GB/T 2589-2020) [42] and uses standard coal (29.3076 MJ/kg) as the equivalent carrier to systematically integrate the standardized conversion coefficients of 28 types of energy sources, including coal, crude oil, natural gas, and electricity (see Table 4). Through thermodynamic equivalence calculation, this system effectively eliminates the influence of differences in energy categories and measurement dimensions on the analysis results, ensuring the objectivity and cross-system comparability of energy intensity assessments and carbon emission accounting.
Table 4.
Chinese various energy-deducting standard coal coefficients.
2.3.2. Raw Material Transportation Stage
The environmental load assessment of modern logistics systems must account for the differentiated characteristics of multimodal transportation systems. The research divides transportation modes into four categories: highway, railway, waterway, and pipeline. Among them, road transportation is refined into energy consumption models of gasoline trucks and diesel trucks based on power type, while railway transportation distinguishes between internal diesel locomotives and electric locomotives. Water transportation focuses on the fuel efficiency differences between dry bulk carriers and container ships. Pipeline transportation primarily considers methane elimination and compression energy consumption during natural gas transportation. This study integrates the transportation energy intensity accounting framework and a multimedia emission factor database to construct a transportation environment impact matrix covering 12 types of pollutants, including CO2, NOₓ, PM2.5, and others. See Table 5 for details. The system reveals the ecological environment costs of operations per ton-kilometer in different transportation modes, providing a quantitative basis for green supply chain decisions.
Table 5.
Summary of main transportation methods of building materials.
In the building materials logistics sector, transportation loading and unloading losses are key factors affecting resource utilization efficiency. In this study, based on systematic determination of the transportation loss rate of conventional building materials, the sand loss of 1 m3 is 2.5%, stone consumption for 1 m3 is 2.0%, cement consumption for 1 t is 1.5%, and molybdenum tailings consumption for 1 m3 is 2.5%. In particular, due to the characteristics of molybdenum tailings as a sand substitute material, the transportation loss rate is set to 2.5% based on its particle grading and physical stability test data. Given that Henan, Shaanxi, and Jilin provinces account for 72.6% of national molybdenum ore reserves (China Mineral Resources Annual Report, 2022), Zhengzhou, Xi’an, and Changchun were selected as representative sample areas. Through GIS path analysis and field research, the average road transportation distance between the molybdenum tailings ponds and the main concrete mixing stations in the region was calculated. The measured transportation distances between molybdenum tailings ponds and concrete mixing stations revealed significant regional variations, with average values of 75.80 km in Zhengzhou, 37.89 km in Xi’an, and 152.40 km in Changchun. These geographically distributed metrics comprehensively characterize the logistics network configurations of mining operations across different scales, establishing critical geospatial parameters for subsequent spatial modeling of environmental loads in mining-related transportation systems, as shown in Figure 4.
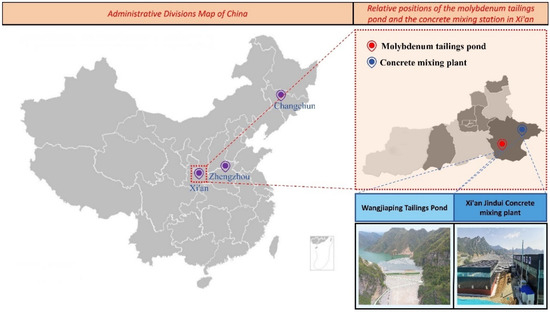
Figure 4.
Average transport distance of concrete mixing plant in the city (source: GIS analysis).
2.3.3. Concrete Preparation Stage
In the full life cycle evaluation of molybdenum tailings concrete’s construction stage, its environmental load is mainly concentrated in core activities such as mixing and pouring, mechanical vibration, and maintenance technology. Zhang [17] systematically constructed the environmental impact factor database of concrete construction equipment (see Table 6 for details). It quantifies the differential characteristics of different pouring equipment and provides key parameter support for the optimization of green construction technology.
Table 6.
List of environmental impacts of production machinery and production methods in the construction stage.
2.4. Model and Calculation
2.4.1. Environmental Cost List Model
The full life cycle inventory model of molybdenum tailings concrete constructed in this paper covers the system boundary of “cradle to gate” (Cradle-to-Gate) and consists of three major modules: the raw material production stage, the raw material transportation stage, and the construction stage. Through multi-scale data integration, a total inventory mathematical model, as shown in Equation (1), is established:
where A is the total inventory data of molybdenum tailings concrete; Ai is the inventory data representing the i-th stage of molybdenum tailings concrete; and i has values of 1, 2, and 3, respectively, representing the raw material production stage, the transportation stage, and the construction stage.
Raw Material Production-Stage List Model
The inventory model of the raw material production stage is shown in the following Equation (2):
where j is the type of raw materials required for type j concrete; Qj is the amount of the j-th concrete raw material, with units t, kg, or m3; Ej represents the input and output list of raw materials for the j-th production; QMy is the amount of molybdenum tailings under the y substitution rate, with units such as g or kg; EMu is the life cycle input and output list of the u-th distribution method of molybdenum tailings; u is the values of u are 1, 2, and 3, respectively, representing the three distribution methods of the molybdenum tailings production stage, as detailed in the subsection on raw material production; and y is the values are 0, 25%, 50%, 75%, and 100%, respectively, indicating the substitution rate of molybdenum tailings under the same strength of concrete.
Raw Material Transportation Stage Inventory Model
The inventory model of the raw material transportation stage is shown in the following Equation (3):
where aj is the loss rate in the transportation of the j-th molybdenum tailings concrete raw material; Lj is the transportation distance of the j-th molybdenum tailings concrete raw material, in km; t is a type of transportation method; Ct is the input and output list of the t-th transportation method; aM is the loss rate in molybdenum tailings transportation; z is the values 1, 2, and 3 represent Xi’an, Zhengzhou, and Changchun, respectively; LMz is the molybdenum tailings transportation distance under the z-th city, in km; and CM is the input and output list of molybdenum tailings.
Construction Stage List Model
The construction stage inventory model is shown in the following Equation (4):
where n is the types of n-th construction machinery or production methods; rn is the number of n-th construction machinery or production modes; Rn is the input and output inventory of n-th construction machinery or production methods; w is the amount of water, in kg; W is the input and output inventory per kilogram of water.
2.4.2. Classification and Quantification of Environmental Impacts
The purpose of the classification and characterization method is to classify the results of the inventory analysis into impact categories during the impact assessment stage. Based on the societal willingness to pay, the BEPAS and BHIAS evaluation models divide environmental impact into three categories: resource consumption, ecological environment damage, and health damage. Ecological damage is divided into global warming, ozone layer depletion, acidification, eutrophication, solid waste, photochemical pollution, water suspension, and ecological toxicity; resource consumption is divided into water resource loss, fossil energy depletion, and mineral resource loss; health damage is divided into global warming-related diseases, carcinogenic effects, respiratory system damage, and circulatory system loss. According to the characteristics of resource consumption and pollution emissions in the production process of molybdenum tailings concrete, this study selected the environmental impact type indicators shown in Table 7 for calculation and analysis.
Table 7.
Environmental type index of molybdenum tailings concrete life cycle model.
Characterization refers to the process of modeling the impact types to summarize inventory results belonging to the same category. For example, for global warming, the global warming potential (GWP) value of a given substance is selected as the characterization factor. The United Nations Intergovernmental Panel on Climate Change (IPCC) uses CO2 as a reference. The characterization factor expresses the potential impact of other substances in terms of their equivalence to CO2. In addition to CO2, gases such as CH4, CO, and N2O also contribute to and must be converted equivalently to CO2. According to the environmental impact type indicators listed in Table 7, different emission types are converted into equivalent emission pollutants through characterization factors. This study applies these characterization factors for calculation (see Table A6 in Appendix A).
2.5. Weighted Comprehensive Evaluation
The purpose of a weighted assessment is to determine the weights of various types of environmental impacts and then summarize them into the total environmental impact.
This study uses willingness-to-pay (WTP) to evaluate material emissions and resource consumption in the raw material production stage, raw material transportation stage, and construction stage in the molybdenum tailings concrete production process. Since molybdenum tailings in this study are used as a replacement for river sand, according to the “Implementation Rules of the Mineral Resources Law of the People’s Republic of China”, river sand is natural quartz sand and a non-metallic mineral in the mineral resource classification, so the weight of mineral resource consumption is updated. According to the 2011 “Implementation Rules for the Interim Regulations on Resource Taxation of the People’s Republic of China” and the 2020 “Resource Tax Law of the People’s Republic of China”, it is determined that the mineral resource rights studied in this article are 0.0195 yuan per kilogram of heavy iron ore, 0.0079 yuan per kilogram of manganese ore, 0.0022 yuan per kilogram of river sand, 0.003 yuan per kilogram of limestone, and 0.0014 yuan per kilogram of gravel. The findings from Cao [43], as presented in Table 8 and Table 9 summarize the mineral resource weights used in the resource consumption analysis.
Table 8.
Ecological and environmental damage weight table.
Table 9.
Resource consumption weight table.
2.6. Methodological Note on Global Applicability of WTP Model
While the willingness-to-pay (WTP) model provides a powerful monetized weighting system to aggregate and compare multifaceted environmental impacts into a single metric (Yuan/m3), it is crucial to acknowledge the inherent contextual limitations of its weighting coefficients. The values applied in this study, as detailed in Table 8 and Table 9, are derived from Chinese policies, economic valuations, and societal preferences, ensuring high accuracy and relevance for assessments within China. However, the absolute WTP values and the resultant priority rankings of impact categories could vary significantly if applied in other global regions. This variability arises from differing national policy priorities, socioeconomic conditions, resource endowments, and energy structures. Nevertheless, the core methodological framework—integrating life cycle inventory analysis with a monetized weighting approach to balance resource, environmental, and economic dimensions—remains universally valid and replicable. The primary contribution of this study lies in providing this adaptable and comprehensive evaluation structure, which can be effectively recalibrated using locally specific WTP coefficients to inform sustainable decision-making in diverse regional contexts.
2.7. Research Limitations
This study has established a comprehensive life cycle assessment (LCA) framework for evaluating the environmental impact of molybdenum tailings concrete; however, it is subject to significant geographical generalizability limitations. These limitations primarily stem from the setting of system boundaries, the use of region-specific data, and constraints related to transportation networks. The following provides an in-depth analysis of the second point, “geographical generalizability limitations,” covering its specific manifestations, causes, and implications for the study’s conclusions.
- (1)
- Incompleteness of the system boundary: This study adopts a “cradle-to-gate” system boundary, focusing on raw material production, transportation, and construction stages, but does not include the use, maintenance, and end-of-life recycling stages. This may lead to an underestimation of the full life cycle environmental impact and limits the generalizability of the conclusions across different regions or long-term scenarios.
- (2)
- Limitations of region-specific data and transportation networks: The evaluation framework is based on data specific to China, which means that the results need to be recalibrated according to local policies, economic preferences, and logistical conditions when applied to other regions to ensure accuracy.
3. Results and Discussion
3.1. Life Cycle Impact of Molybdenum Tailings Concrete Production Process
Our three-dimensional evaluation framework (resource consumption, environmental impact, economic cost) reveals critical patterns that traditional LCA methods fail to capture, particularly through the integration of willingness-to-pay (WTP) as a monetized composite indicator. Key findings are outlined below.
3.1.1. Production Stage
Based on the original data in Table 1, combined with the molybdenum tailings concrete inventory analysis model constructed in Section 2.4, the environmental impact of the concrete production stage was quantified by the non-allocation method and the economic allocation method. The results show that the core indicators, such as global warming potential and acidification potential value, under the two distribution methods show significant differences. The economic distribution method considers the value weight of by-products, which significantly lowers the environmental load per unit of concrete.
Based on the data from Table 7 and Table 8, it can be seen that the increase in molybdenum tailings dosage significantly reduces the environmental impact and energy consumption in the concrete production stage. Taking C30 concrete as an example, the decline in environmental impact under the no distribution method is more prominent: when molybdenum tailings completely replace natural aggregates, its global warming potential is 1.15 kg CO2-equivalent lower than the economic distribution method, indicating that the no distribution method can better reflect the environmental gain advantages of molybdenum tailings and is suitable for evaluation needs at the current technical and economic level. However, since the economic allocation method accounts for value-sharing of by-products, it may become more applicable in future large-scale applications of molybdenum tailings.
Energy consumption analysis shows that the energy saving efficiency of the non-allocation method is generally higher than that of the economic distribution method, with the maximum decline of 2.85% and 2.11%, respectively. It is worth noting that the increase in the amount of molybdenum tailings in low-strength concrete can lead to more significant energy consumption reduction, while as the strength level increases, the marginal benefits of energy saving decrease. This reveals that molybdenum tailings have better energy efficiency adaptability in ordinary-strength concrete, providing a quantitative basis for the selection of engineering application scenarios. See Table A9, Table A10 and Table A11 in Appendix A for details.
As demonstrated in Figure 5, the comprehensive weighted evaluation reveals that ecological environment destruction constitutes the highest proportion (70.15–73.41%) of willingness-to-pay (WTP) across all molybdenum tailings concrete mixtures (M0-C30 to M100-C30), followed by nearly equivalent contributions from resource consumption (14.68–16.15%) and health damage (12.91–15.64%). The progressive incorporation of molybdenum tailings—from 0% (M0-C30) to 100% (M100-C30) substitution—systematically reduces the total WTP from 28 yuan/m3 for conventional concrete to 25.63 yuan/m3 (an 8.5% decrease), with each incremental substitution (25%, 50%, 75%) showing intermediate values (e.g., 27.41 yuan/m3 at 25% substitution). This trend, visually reinforced by the declining stacked bars in Figure 6, confirms that tailings utilization effectively lowers social costs while maintaining the economic advantage of high-strength concrete (evident in the higher absolute WTP values compared to ordinary strength grades).
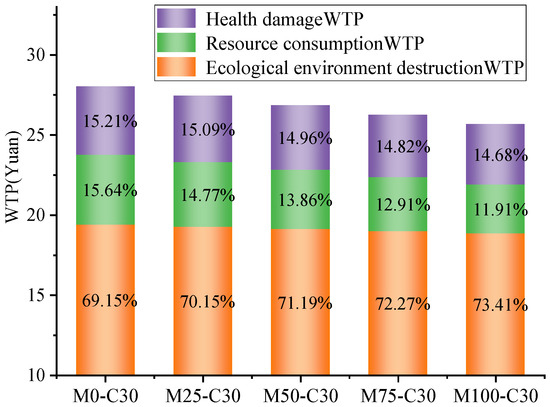
Figure 5.
C30 non-allocation molybdenum tailing concrete production-stage WTP.
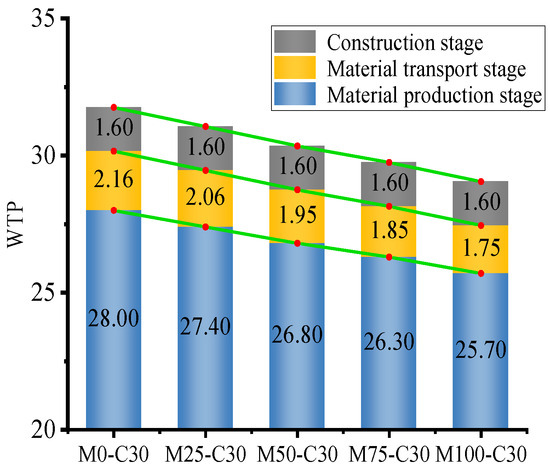
Figure 6.
Non-allocation method for C30 molybdenum tailings concrete WTP.
3.1.2. Transportation Stage
Applying the same evaluation method used in the production stage, this study quantified the environmental impact of the molybdenum tailings concrete transportation stage. Based on the transportation distance of 120 km in Xi’an, the environmental impact data of the transportation stage was calculated through the inventory model, showing that diesel-based transportation dominates carbon emissions. After applying weighting factors, the WTP value of concrete transportation per cubic meter is 3.2 yuan, of which ecological environment damage accounts for 67%, primarily due to dust and exhaust gas. Resource consumption and health damage account for 21% and 12%, respectively. Although WTP in the transportation stage is lower than in the production stage, its proportion increases significantly with longer transport distances, highlighting the importance of regional logistics optimization to sustainability. See Table A12 and Table A13 in Appendix A.
3.1.3. Construction Stage
Continuing the evaluation framework of the production and transportation stages, this study conducted an environmental impact analysis on the construction stage of molybdenum tailings concrete. Based on the mix ratio from Table 1 and data on energy consumption at the mixing station and emissions from the maintenance process, the environmental impact of the construction stage was calculated using the inventory model. The results showed that concrete mixing power consumption accounts for 76% of the total energy consumption in the construction stage, and carbon emissions in the maintenance process accounted for about 18%. After applying weighting factors, the WTP value of each cubic meter of concrete in the construction stage is 1.8 yuan, with ecological environment damage accounting for 61%, and resource consumption and health damage accounting for 24% and 15%, respectively. See Table A14 and Table A15 in Appendix A for details. Although the absolute value of WTP during the construction stage is low, its cumulative impact throughout the life cycle cannot be ignored, and the mixing efficiency and maintenance processes should be optimized in a targeted manner.
3.1.4. Summary of Molybdenum Tailings Concrete Production Process
As systematically illustrated in Figure 6, Figure 7 and Figure 8, the life-cycle WTP analysis of molybdenum tailings concrete reveals three key dimensions of environmental economic performance: (1) The material production stage consistently dominates WTP allocation (84.21–88.47%), yet demonstrates a distinct inverse correlation with transportation distance—decreasing by 3.95% in Changchun (long-distance, 152.40 km) versus increasing by 0.31% in Xi’an (short-distance, 37.89 km) at full replacement (M100-C30), a spatial pattern visually emphasized through the color-coded stacked bars where blue (production), yellow (transport) and grey (construction) segments dynamically redistribute based on logistical constraints. (2) Total WTP exhibits progressive reduction with higher tailings substitution, particularly evident in C30 concrete’s 8.5% cost decline (28→25.63 yuan/m3) at 100% replacement, where transport-stage WTP decreases most significantly from 6.80% to 5.42%, though this advantage is constrained by a critical transport distance threshold of approximately 88 km beyond which additional transportation emissions begin to offset production-stage gains. (3) Strength grade elevation amplifies production-stage dominance (>90% for C60) while simultaneously extending the critical distance due to enhanced material efficiency, though regional variances persist as medium-distance cities like Zhengzhou (75.80 km) exhibit a 1.13% production-stage reduction versus Xi’an’s 0.31% gain, demonstrating the complex interplay between material properties, spatial economics, and environmental performance across the life cycle. For comprehensive data on strength-grade variations, detailed WTP values for C40-C60 concrete are provided in Appendix A, Table A16 and Table A17, completing the analytical framework presented in the graphical representations.
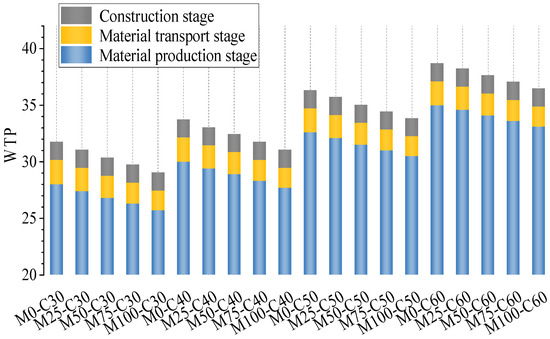
Figure 7.
Non-allocation method for molybdenum tailings concrete WTP.
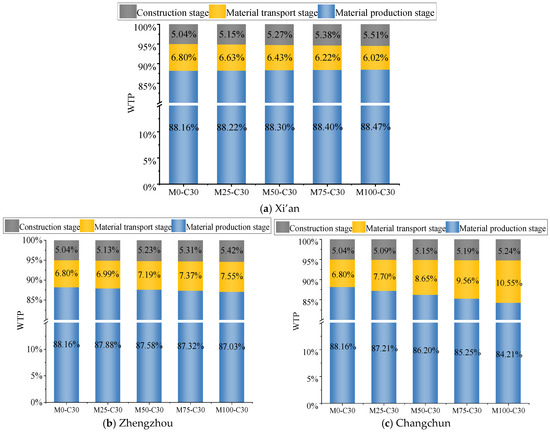
Figure 8.
C30 molybdenum tailings concrete non-allocation method three cities and three stages WTP and proportion.
Molybdenum tailings, as a substitute for river sand, can not only reduce environmental burden and resource consumption but also mitigate potential harm to ecosystems and human health. Its environmentally friendly characteristics indicate that systematically studying the coordinated mechanisms between mechanical properties and environmental impacts of molybdenum tailings concrete can provide scientific support for promoting the development of green building materials.
3.2. Mechanical Properties, Energy Consumption, Environmental Impact, and WTP of Molybdenum Tailings Concrete
Based on the correlation between the influence of molybdenum tailings substituted river sand on concrete mechanical properties and environmental performance, this section further couples environmental cost and mechanical performance indicators based on the quantitative analysis of the doping-energy consumption relationship and the monetization evaluation of environmental cost. According to the mechanical model [44,45,46,47,48,49] established in the literature, Table 10 lists the calculated values of compressive strength, elastic modulus, and tensile strength under different mix ratios, providing data support for multi-objective optimization.
where fc,p(rMOT) is the compressive strength of concrete with different substitution rates of molybdenum tailings; fc is the compressive strength of molybdenum tailings concrete; rMOT is the substitution rate of molybdenum tailings.
where fspt(rMOT) is the tensile strength of concrete with different substitution rates of molybdenum tailings.
where Ec(rMOT) is the elastic modulus of concrete with different substitution rates of molybdenum tailings.
Table 10.
Three mechanical properties of molybdenum tailings concrete under different mix ratios.
3.2.1. Energy Consumption Impact
To interpret these graphs effectively, it’s essential to understand how the dynamic relationship between energy consumption and mechanical properties of molybdenum tailings concrete is visualized. Figure 9 presents a 3D line graph where energy consumption (in MJ) is plotted against both the substitution rate (r) and compressive strength (MPa). Each line corresponds to a different concrete grade (C30 to C60), with higher-strength grades like C60 generally exhibiting greater energy demands. However, the graph also demonstrates that optimizing the substitution rate can achieve high compressive strength while maintaining relatively lower energy consumption, underscoring the material’s energy-saving potential.
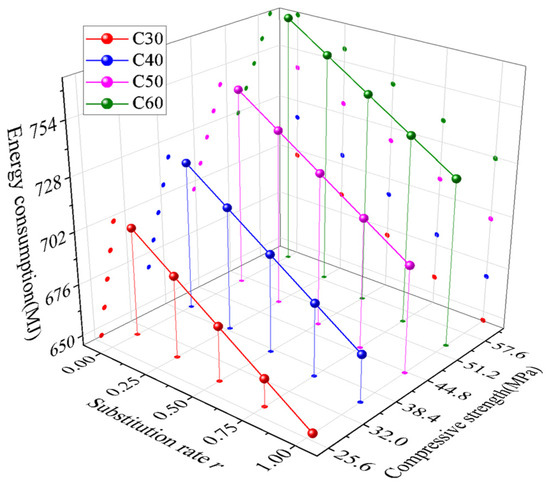
Figure 9.
Comparison of energy consumption between C30–C60.
Figure 10 complements this analysis with a 3D scatter plot, mapping energy consumption against substitution rate and elastic modulus (GPa) across three regions: Xi’an, Zhengzhou, and Changchun. The data points reveal a positive correlation between mechanical properties (compressive strength, split tensile strength, and elastic modulus) and both substitution rate and energy consumption. Notably, regional disparities in energy consumption follow a clear gradient (Changchun > Zhengzhou > Xi’an), likely influenced by transportation distances and local conditions, which impact overall system efficiency. A “well-balanced point” in these contexts refers to an optimal combination of substitution rate, mechanical performance, and energy efficiency, where high strength is achieved without disproportionately high energy costs. These graphs collectively highlight the trade-offs and synergies in tailoring molybdenum tailings concrete for sustainable construction.
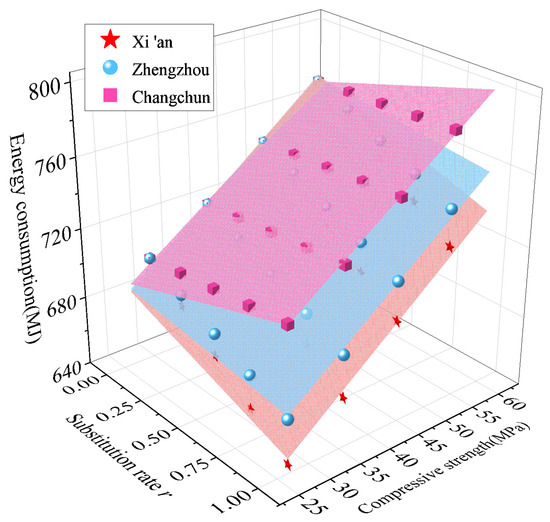
Figure 10.
Effect of compressive strength and resilient modulus on energy consumption in three cities.
3.2.2. Environmental Implications
After the unified conversion of various environmental impacts into monetized WTP values, the increase in compressive strength is positively correlated with the eight categories of environmental cost. As shown in Figure 11, the contributions of environmental impacts are ranked in the following order: global warming > acidification > water eutrophication > atmospheric suspension > photochemical pollution > water toxicity > water suspension > solid waste. The impacts of all categories increase simultaneously with rising compressive strength.
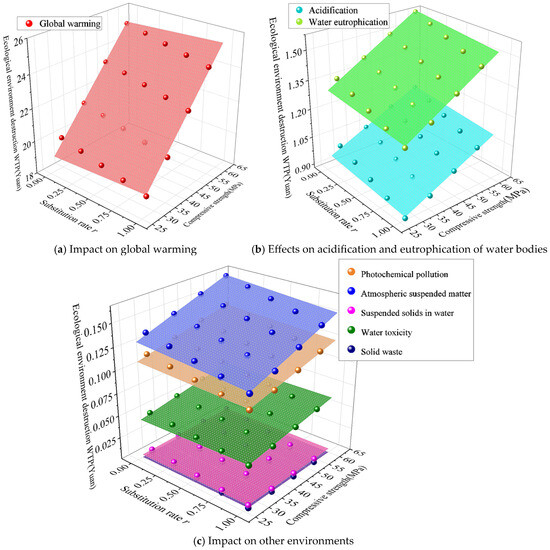
Figure 11.
Effect of compressive strength on the environment.
3.2.3. Environmental Cost Impact
Analysis shows that the increase in compressive strength systematically drives up environmental costs. After decomposing the total WTP into three stages of production, transportation, and construction, as shown in Figure 12, the cost differences in the transportation stage across cities are significant: Changchun > Zhengzhou > Xi’an. This gradient is vividly illustrated in Figure 13, where the WTP cost planes for the three cities are clearly stratified, a direct correlation to the increasing molybdenum tailings transportation distance. Further breaking down the total WTP by cost type, Figure 14 reveals a consistent linear increasing trend across all components with rising compressive strength. Taking Xi’an as an example, resource consumption accounts for the highest proportion of the total WTP composition, followed by ecological environment damage, while health damage accounts for the smallest proportion. The distinct planes in Figure 14 visually confirm this composition hierarchy. The trends shown in both figures collectively reveal the positive coupling mechanism between mechanical performance enhancement and environmental cost.
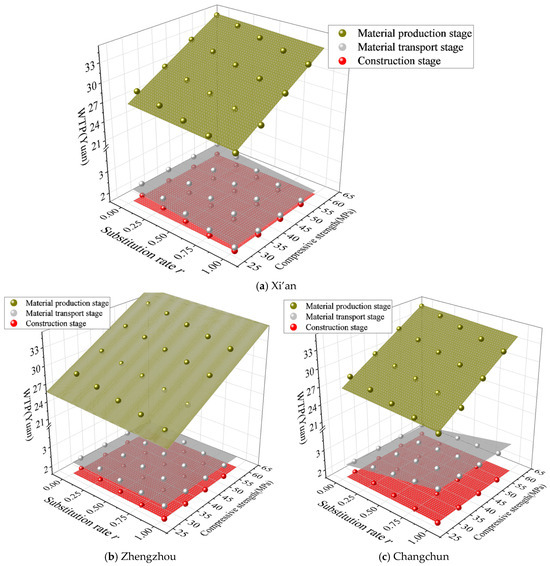
Figure 12.
Effect of compressive strength on three-stage WTP.
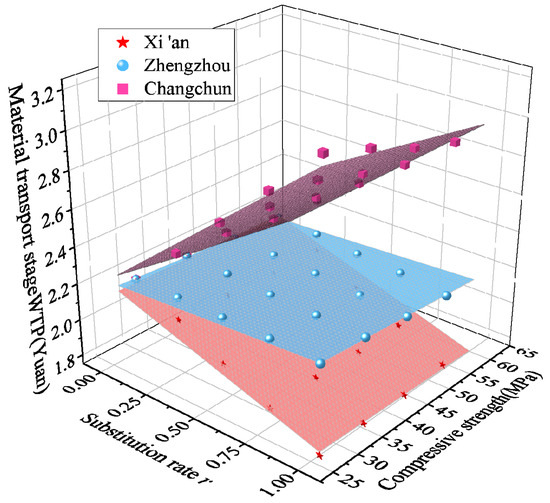
Figure 13.
Effect of compressive strength on WTP in raw material transportation stage.
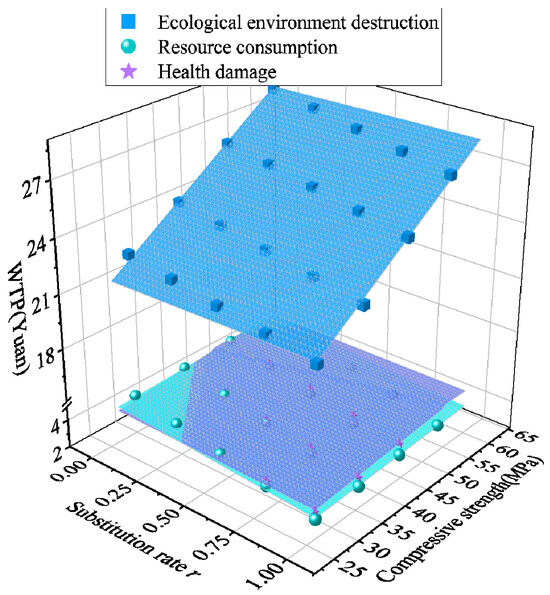
Figure 14.
Effect of compressive strength on total WTP.
3.3. Environmental and Mechanical Analysis
In the environmental efficiency assessment of concrete materials, to eliminate the interference of strength or modulus differences on the evaluation results, standardized environmental performance indicators must be constructed. This study proposes the following coupled evaluation model, based on functional unit normalization:
where i is environmental impacts such as global warming and acidification, denoted by GWP, AP, etc.; j is compressive strength, tensile strength of splitting, and elastic modulus, denoted by c, s, and m; EC is the energy consumption value, in units of MJ; EDi is the value of the i-th environmental impact indicator, in units such as kg/CO2, kg/SO2, etc.; Fj is the value corresponding to the j-th strength or modulus, in MPa.
The trends of unit strength/modulus-energy consumption, unit strength/modulus-energy impact, and unit strength/modulus-energy cost are similar. Specific values are not introduced individually here. Instead, unit strength–energy consumption, unit strength–environmental impact, and unit strength–environmental cost are used as examples, where “strength” refers specifically to compressive strength.
3.3.1. Unit Strength-Energy Consumption
According to Figure 15, a quantitative analysis of the energy consumption per unit strength of molybdenum tailings concrete reveals the following:
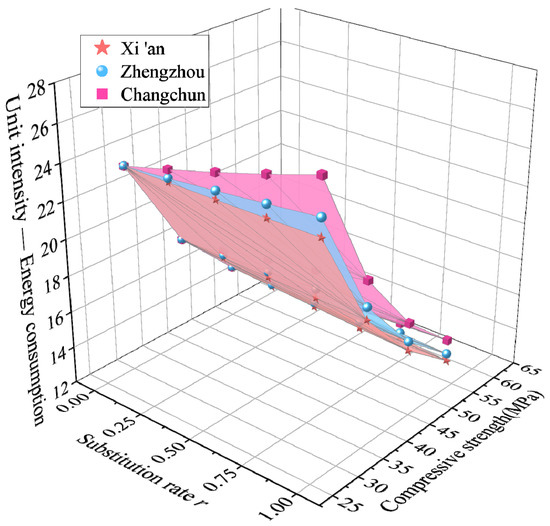
Figure 15.
Energy consumption per unit strength of molybdenum tailings concrete.
Positive correlation between substitution rate and energy consumption: As the substitution rate of molybdenum tailings increases, the energy consumption per unit strength increases linearly. On average, every 10% increase in substitution rate corresponds to an energy consumption increase of approximately 8.5%. This trend is primarily attributed to increased energy use during the mixing process and the greater dosage of high-efficiency water-reducing agents required due to the irregular morphology of tailings particles.
Marginal energy-saving effect of strength improvement: When compressive strength increases from 30 MPa to 60 MPa at a fixed substitution rate, the energy consumption per unit strength shows a significant downward trend. The rate of reduction, however, follows a nonlinear pattern: energy consumption decreases by 22.85% when strength increases from 30 MPa to 40 MPa, while the reduction narrows to 6.4% when increasing from 50 MPa to 60 MPa. This phenomenon can be attributed to the improved hydration efficiency of cementitious materials in high-strength concrete and the aggregate compaction effect resulting from optimized particle grading.
3.3.2. Unit Strength Environmental Impact
The unit strength carbon footprint and energy efficiency of molybdenum tailings concrete show a significant coordinated evolution pattern (Figure 16). Research shows that the global warming potential GWP increases linearly with the replacement rate. At a 30% substitution rate, the GWP difference coefficient of Zhengzhou, Xi’an, and Changchun is only 0.08, due to the minimal marginal contribution of transportation distance differences to the carbon footprint at low substitution levels.
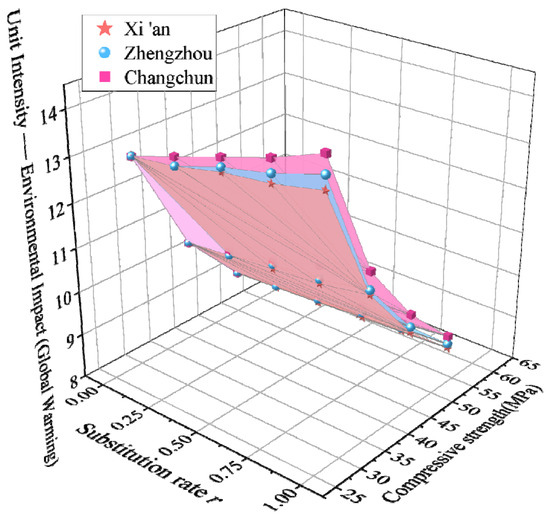
Figure 16.
Environmental impact of unit strength of molybdenum tailings concrete (global warming).
Unlike traditional LCA focusing solely on emission inventories, as shown in Figure 17, the WTP 3D model first quantifies the “cost dilution effect” from strength enhancement: 60 MPa concrete reduces environmental cost per unit strength by 44.9% compared to 30 MPa, achieved through three synergistic mechanisms:
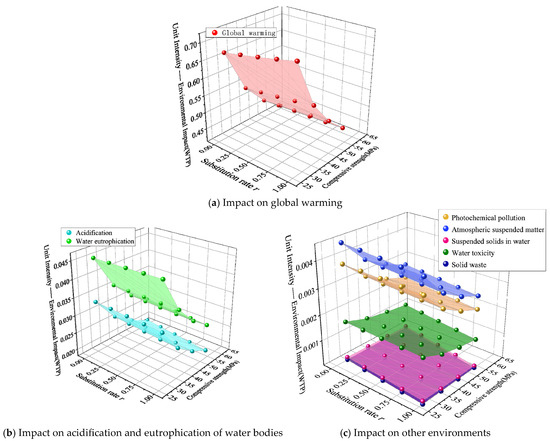
Figure 17.
Environmental impact of unit strength of molybdenum tailings concrete (WTP).
- (1)
- Improvement of hydration efficiency, which reduces binder content by 22–28%, directly reducing carbon emissions from raw material production;
- (2)
- Process carbon reduction, due to a 30% shortening of the steam curing cycle;
- (3)
- Densified microstructure, which extends the service life and achieves carbon sharing optimization throughout the life cycle.
This finding demonstrates that within the 10–60% replacement rate range, the regulatory effect of strength enhancement on carbon intensity consistently outweighs the emission-increasing effect of higher substitution rates. These results provide theoretical support for low-carbon strength-based design of tailings concrete.
3.3.3. Unit Strength Environmental Cost
Research on the unit strength environmental cost of molybdenum tailings concrete reveals that the difference coefficients among Zhengzhou, Xi’an, and Changchun remain within a narrow range of 0.05–0.12, as shown in Figure 18. This indicates that geographical factors exert comparatively lower sensitivity on unit strength cost than energy consumption and carbon emissions, primarily due to the convergence of tailings transportation distances and regional energy structures across these locations. Further analysis of the Xi’an case demonstrates that as the replacement rate increases from 10% to 60%, the environmental cost proportion in the construction stage decreases from 32% to 18%, whereas the proportion attributable to the raw material production stage rises from 45% to 61%, underscoring the dominant role of energy consumption during tailings pretreatment. Regarding cost composition, health damage increases owing to potential heavy metal risks associated with tailings, and resource consumption exhibits a linear upward trend. In contrast, ecological damage shows a mitigated increase after the replacement rate exceeds 40%, reflecting the compensatory ecological benefits of tailings in reducing natural sand extraction. The study also confirms that high-strength concrete significantly reduces environmental cost per unit strength through the “strength dilution effect,” while simultaneously accommodating higher substitution rates without triggering substantial cost surges.
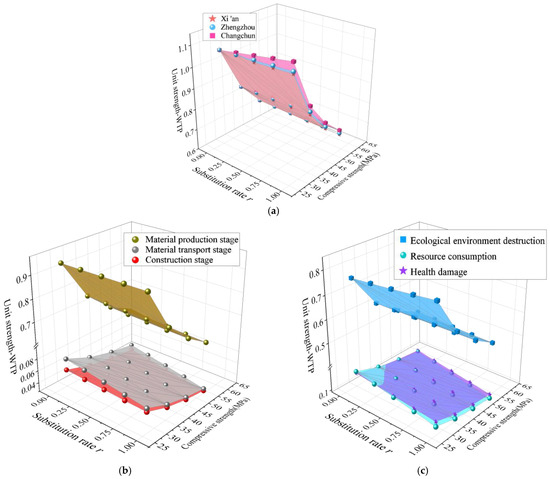
Figure 18.
Environmental cost per unit strength of molybdenum tailings concrete. (a) Three cities, (b) Three stages, (c) Summary of ecological environment damage, resource consumption, and health damage WTP.
4. Conclusions
To provide a clear and consolidated overview of the extensive data supporting the life cycle assessment, the following comprehensive table categorizes and summarizes every analytical table within the study (Table 11).
Table 11.
Naming the summary table.
This study evaluates the environmental performance and circular economy potential of molybdenum tailings concrete through a comprehensive life cycle assessment (LCA). A three-dimensional evaluation framework was developed to assess resource consumption, environmental load, and economic cost across the production, transportation, and construction stages of raw materials. The framework’s universal value in solid waste utilization decision-making lies in its ability to systematically quantify the “resource–environment–economy” nexus, providing a replicable model for evaluating diverse industrial byproducts in construction materials.
The findings offer key insights across four dimensions:
- (1)
- Molybdenum tailings, as a substitute for river sand, demonstrate significant environmental advantages. Their use reduces resource consumption, alleviates ecological pressure, and improves energy efficiency, particularly in low- to medium-strength concrete. The incorporation of tailings also contributes to reduced greenhouse gas emissions through the “strength dilution effect,” especially in high-strength concrete grades.
- (2)
- A synergistic relationship between substitution rate and concrete strength was observed. Within the 10–60% replacement range, increasing strength consistently offsets the environmental cost rise associated with higher substitution rates. The optimal balance was found at 20–40% substitution with C40–C50 strength levels, providing a practical pathway for performance–sustainability optimization.
- (3)
- Regional analysis indicates that transportation distance significantly affects energy consumption and carbon emissions. Short-distance regions such as Xi’an exhibit lower marginal costs in the transportation stage, while longer distances in cities like Changchun amplify logistical burdens. These findings underscore the importance of localized supply chain strategies in sustainable construction.
- (4)
- The coupling of environmental cost and mechanical performance reveals a multidimensional optimization strategy. By improving compressive strength and controlling substitution rates, molybdenum tailings concrete can achieve high strength and low environmental cost simultaneously. This supports a viable path toward green, low-carbon material innovation.
Overall, this research provides theoretical and empirical support for the integration of industrial waste materials into sustainable construction. The conclusions contribute to material selection, structural design and life cycle cost modeling in engineering practice.
The study supports the advancement of circular economy strategies and carbon neutrality goals. The three-dimensional framework’s standardized indicator system and monetization methodology offer cross-material applicability for assessing other solid wastes (e.g., fly ash, slag), enabling the comparative analysis of alternative resource utilization technologies.
Author Contributions
C.R.: Methodology, Conceptualization. J.X.: Writing—Original Draft Investigation. S.G.: Writing—Review & Editing, Conceptualization. Z.H.: Writing—Review & Editing, Formal analysis. T.N.: Supervision, Resources, Conceptualization. All authors have read and agreed to the published version of the manuscript.
Funding
The project is supported by Natural Science Basic Research Program of Shaanxi Province (Program No. 2024JC-YBMS-439), National Natural Science Foundation of China (52411540027), Scientific Research Program for Youth Innovation Team of Shaanxi Provincial Department of Education (24JP201) and Open Fund for Engineering Research Center of Ministry of Education of Mine Underground Engineering (JYBGCZX2022101).
Data Availability Statement
The original contributions presented in this study are included in the article. Further inquiries can be directed to the corresponding author(s).
Conflicts of Interest
The authors declare no conflict of interest.
Appendix A
Table A1.
Input and output list of 1 t Portland cement resource consumption and environmental impact.
Table A1.
Input and output list of 1 t Portland cement resource consumption and environmental impact.
| Material Flow | Resource Consumption and Material Emissions | Unit | Data |
|---|---|---|---|
| Enter | Limestone | kg | 1.10 × 10³ |
| Sandstone | kg | 5.95 × 101 | |
| Iron powder | kg | 3.11 × 101 | |
| Fly ash | kg | 1.38 × 10² | |
| Plaster | kg | 5.68 × 101 | |
| Slag | kg | 1.31 × 10² | |
| Electricity | kWh | 9.53 × 101 | |
| Water | kg | 9.05 × 10² | |
| Output | CO2 | kg | 7.94 × 10² |
| SO2 | kg | 9.02 × 10⁻¹ | |
| NOx | kg | 1.87 × 100 | |
| CO | kg | 4.72 × 10⁻¹ | |
| COD | kg | 2.15 × 10⁻² | |
| SS | kg | 4.56 × 10⁻² | |
| Oil | kg | 1.30 × 10⁻³ | |
| Dust | kg | 1.03 × 100 |
Table A2.
Environmental impact list for the production of 1 kg nitrile water reducing agent.
Table A2.
Environmental impact list for the production of 1 kg nitrile water reducing agent.
| Material Flow | Resource Consumption and Environmental Impact | Unit | Data |
|---|---|---|---|
| Enter | Run-of-coal | kg | 5.62 × 10⁻¹ |
| Crude | kg | 4.81 × 10⁻² | |
| Natural gas | m3 | 2.67 × 10⁻¹ | |
| Gravel | kg | 4.49 × 10⁻² | |
| Iron ore | kg | 1.00 × 10⁻² | |
| Barite | kg | 3.61 × 10⁻⁴ | |
| Sulfur | kg | 1.04 × 10⁻⁷ | |
| Output | CO2 | kg | 9.93 × 10⁻¹ |
| CH4 | kg | 2.68 × 10⁻³ | |
| SO2 | kg | 1.04 × 10⁻² | |
| NMVOC | kg | 3.41 × 10⁻⁴ | |
| COD | kg | 5.38 × 10⁻⁴ | |
| CO | kg | 3.95 × 10⁻³ | |
| NOx | kg | 5.15 × 10⁻³ | |
| N2O | kg | 6.98 × 10⁻⁶ | |
| Zn | kg | 3.52 × 10⁻⁶ | |
| Cr | kg | 2.61 × 10⁻⁶ | |
| Cd | kg | 4.91 × 10⁻⁸ | |
| Pb | kg | 6.54 × 10⁻⁷ | |
| As | kg | 1.96 × 10⁻⁷ | |
| Ni | kg | 4.05 × 10⁻⁶ | |
| V | kg | 9.96 × 10⁻⁷ | |
| Hg | kg | 2.26 × 10⁻⁸ | |
| Dust | kg | 5.08 × 10⁻³ |
Table A3.
Mix ratio data of 1 m3 molybdenum tailings concrete.
Table A3.
Mix ratio data of 1 m3 molybdenum tailings concrete.
| Serial Number | River Sand | Molybdenum Tailings | Water | P.O Cement | Stone | Water Reducing Agent |
|---|---|---|---|---|---|---|
| M0-C30 | 775.00 | 0.00 | 180 | 390 | 1040 | 3.90 |
| M25-C30 | 581.25 | 193.75 | 180 | 390 | 1040 | 3.90 |
| M50-C30 | 387.50 | 387.50 | 180 | 390 | 1040 | 3.90 |
| M75-C30 | 193.75 | 581.25 | 180 | 390 | 1040 | 3.90 |
| M100-C30 | 0.00 | 775.00 | 180 | 390 | 1040 | 3.90 |
| M0-C40 | 730.00 | 0.00 | 174 | 425 | 1065 | 4.25 |
| M25-C40 | 547.50 | 182.50 | 174 | 425 | 1065 | 4.25 |
| M50-C40 | 365.00 | 365.00 | 174 | 425 | 1065 | 4.25 |
| M75-C40 | 182.50 | 547.50 | 174 | 425 | 1065 | 4.25 |
| M100-C40 | 0.00 | 730.00 | 174 | 425 | 1065 | 4.25 |
| M0-C50 | 675.00 | 0.00 | 170 | 472 | 1085 | 4.72 |
| M25-C50 | 506.25 | 168.75 | 170 | 472 | 1085 | 4.72 |
| M50-C50 | 337.50 | 337.50 | 170 | 472 | 1085 | 4.72 |
| M75-C50 | 168.75 | 506.25 | 170 | 472 | 1085 | 4.72 |
| M100-C50 | 0.00 | 675.00 | 170 | 472 | 1085 | 4.72 |
| M0-C60 | 628.00 | 0.00 | 165 | 516 | 1110 | 5.16 |
| M25-C60 | 471.00 | 157.00 | 165 | 516 | 1110 | 5.16 |
| M50-C60 | 314.00 | 314.00 | 165 | 516 | 1110 | 5.16 |
| M75-C60 | 157.00 | 471.00 | 165 | 516 | 1110 | 5.16 |
| M100-C60 | 0.00 | 628.00 | 165 | 516 | 1110 | 5.16 |
Note: The scientific notation method is used for tables involving the environment. (Source: Data partially from [31,37], calculated and compiled for this study).
Table A4.
List of 1 kWh thermal power production resource consumption and material emission environment.
Table A4.
List of 1 kWh thermal power production resource consumption and material emission environment.
| Material Flow | Resource Consumption and Environmental Impact | Unit | Shaanxi | National |
|---|---|---|---|---|
| Enter | Run-of-coal | g | 3.28 × 10⁻² | 4.59 × 10² |
| Clean coal | g | 0.00 × 100 | 1.50 × 10⁻¹ | |
| Other coal washing | g | 1.20 × 10² | 6.74 × 100 | |
| Coke oven gas | m3 | 1.31 × 10⁻² | 3.41 × 100 | |
| Blast furnace gas | m3 | 1.85 × 10⁻² | 2.47 × 101 | |
| Converter gas | m3 | 0.00 × 100 | 2.46 × 100 | |
| Crude | g | 0.00 × 100 | 2.79 × 10⁻² | |
| Diesel fuel | g | 3.55 × 10⁻² | 9.15 × 10⁻² | |
| Fuel oil | g | 0.00 × 100 | 1.11 × 10⁻¹ | |
| Natural gas | m3 | 7.42 × 10⁻⁴ | 5.25 × 100 | |
| Heat | MJ | 5.13 × 10⁻¹ | 9.61 × 100 | |
| Output | CO2 | g | 7.91 × 10² | 1.04 × 10³ |
| CH4 | g | 1.19 × 10⁻² | 1.56 × 10⁻² | |
| N2O | g | 9.01 × 10⁻³ | 1.19 × 10⁻² | |
| SO2 | g | 6.81 × 100 | 2.23 × 101 | |
| CO | g | 1.71 × 10⁻¹ | 8.85 × 100 | |
| NOx | g | 3.13 × 100 | 4.08 × 100 | |
| Dust | g | 7.81 × 100 | 1.01 × 101 |
Table A5.
List of resource consumption and material emission environments for various fossil energy.
Table A5.
List of resource consumption and material emission environments for various fossil energy.
| Resource Consumption and Material Emissions | Raw Coal (g/MJ) | Crude (g/MJ) | Natural Gas (g/MJ) | Gasoline (g/kg) | Diesel Fuel (g/kg) |
|---|---|---|---|---|---|
| Raw coal | 5.02 × 101 | 1.33 × 10⁻¹ | 1.33 × 10⁻¹ | 3.74 × 100 | 3.71 × 100 |
| Clean coal | 2.76 × 10⁻² | 0.00 × 100 | 0.00 × 100 | 3.05 × 100 | 3.02 × 100 |
| Coke | 3.69 × 10⁻³ | 1.40 × 10⁻⁴ | 1.40 × 10⁻⁴ | 0.00 × 100 | 0.00 × 100 |
| Crude | 0.00 × 100 | 2.66 × 101 | 4.07 × 10⁻¹ | 1.37 × 10³ | 1.36 × 10³ |
| Gasoline | 8.03 × 10⁻² | 1.96 × 10⁻² | 1.18 × 10⁻¹ | 0.00 × 100 | 0.00 × 100 |
| Diesel fuel | 1.91 × 10⁻¹ | 1.74 × 10⁻¹ | 3.38 × 10⁻¹ | 0.00 × 100 | 0.00 × 100 |
| Kerosene | 0.00 × 100 | 0.00 × 100 | 0.00 × 100 | 8.70 × 10⁻² | 8.60 × 10⁻² |
| Fuel oil | 3.34 × 10⁻⁴ | 2.78 × 10⁻² | 0.00 × 100 | 3.37 × 101 | 3.34 × 101 |
| LPG | 1.99 × 10⁻⁵ | 1.73 × 10⁻³ | 1.73 × 10⁻³ | 1.86 × 100 | 1.84 × 100 |
| Coke oven gas | 1.36 × 10⁻⁴ | 0.00 × 100 | 0.00 × 100 | 0.00 × 100 | 0.00 × 100 |
| Natural gas | 3.14 × 10⁻³ | 1.12 × 10⁻¹ | 3.79 × 10⁻² | 0.00 × 100 | 0.00 × 100 |
| Heat | 2.18 × 10⁻³ | 0.00 × 100 | 0.00 × 100 | 0.00 × 100 | 0.00 × 100 |
| Electricity | 1.55 × 10⁻¹ | 3.69 × 10⁻² | 4.09 × 10⁻² | 0.00 × 100 | 0.00 × 100 |
| CO2 | 4.10 × 100 | 3.07 × 100 | 3.33 × 100 | 5.42 × 10² | 5.36 × 10² |
| CH4 | 4.53 × 10⁻⁴ | 1.74 × 10⁻⁴ | 1.89 × 10⁻⁴ | 1.91 × 10⁻² | 1.89 × 10⁻² |
| N2O | 8.74 × 10⁻⁵ | 6.18 × 10⁻⁵ | 4.89 × 10⁻⁵ | 6.34 × 10⁻³ | 6.24 × 10⁻³ |
| SO2 | 2.67 × 10⁻² | 2.58 × 10⁻² | 2.73 × 10⁻² | 1.90 × 100 | 1.87 × 100 |
| CO | 6.96 × 10⁻² | 3.71 × 10⁻² | 4.05 × 10⁻² | 2.50 × 100 | 2.43 × 100 |
| NOx | 1.56 × 10⁻² | 7.31 × 10⁻³ | 6.85 × 10⁻³ | 1.28 × 100 | 1.26 × 100 |
| Dust | 2.97 × 10⁻² | 8.91 × 10⁻³ | 8.38 × 10⁻² | 6.97 × 10⁻¹ | 6.10 × 10⁻³ |
Table A6.
Characterization factors of environmental impact of related projects.
Table A6.
Characterization factors of environmental impact of related projects.
| Type of Impact | Emissions (kg) | Equivalent Pollutants (kg) | Characterization Factors (kg/kg) |
|---|---|---|---|
| Global Warming | CO2 | CO2 | 1.00 × 100 |
| CO | CO2 | 3.00 × 100 | |
| CH4 | CO2 | 2.50 × 101 | |
| N2O | CO2 | 2.98 × 10² | |
| Acidification | SO2 | SO2 | 1.00 × 100 |
| NOx | SO2 | 7.00 × 10⁻¹ | |
| Eutrophication of water | NOx | NO3- | 1.35 × 100 |
| N2O | NO3- | 1.41 × 100 | |
| COD | NO3- | 2.30 × 10⁻¹ | |
| Photochemical pollution | CH4 | C2H4 | 3.03 × 10⁻⁴ |
| NOx | C2H4 | 3.00 × 10⁻² | |
| N2O | C2H4 | 3.00 × 10⁻⁴ | |
| NMVOC | C2H4 | 3.00 × 10⁻² | |
| Solid waste | Solid waste | Solid waste | 1.00 × 100 |
| Atmospheric suspension | Dust | Atmospheric suspension | 1.00 × 100 |
| Water suspension | SS | SS | 1.00 × 100 |
| Water toxicity | Pb | Pb | 1.00 × 100 |
| Zn | Pb | 3.48 × 10² | |
| Cr | Pb | 3.80 × 100 | |
| Cd | Pb | 2.77 × 101 | |
| As | Pb | 3.91 × 101 | |
| Ni | Pb | 7.59 × 101 | |
| V | Pb | 2.94 × 10² | |
| Hg | Pb | 8.22 × 101 |
Table A7.
Environmental impact of molybdenum tailings concrete transportation stage in Xi’an.
Table A7.
Environmental impact of molybdenum tailings concrete transportation stage in Xi’an.
| Serial Number | Global Warming | Acidification | Eutrophicate | Pollution |
|---|---|---|---|---|
| M0-C30 | 2.63 × 101 | 2.89 × 10⁻¹ | 4.86 × 10⁻¹ | 1.08 × 10⁻² |
| M25-C30 | 2.50 × 101 | 2.75 × 10⁻¹ | 4.62 × 10⁻¹ | 1.03 × 10⁻² |
| M50-C30 | 2.38 × 101 | 2.61 × 10⁻¹ | 4.39 × 10⁻¹ | 9.79 × 10⁻² |
| M75-C30 | 2.25 × 101 | 2.48 × 10⁻¹ | 4.15 × 10⁻¹ | 9.27 × 10⁻² |
| M100-C30 | 2.13 × 101 | 2.34 × 10⁻¹ | 3.92 × 10⁻¹ | 8.75 × 10⁻² |
| M0-C40 | 2.61 × 101 | 2.87 × 10⁻¹ | 4.82 × 10⁻¹ | 1.08 × 10⁻² |
| M25-C40 | 2.50 × 101 | 2.74 × 10⁻¹ | 4.60 × 10⁻¹ | 1.03 × 10⁻² |
| M50-C40 | 2.38 × 101 | 2.61 × 10⁻¹ | 4.38 × 10⁻¹ | 9.78 × 10⁻² |
| M75-C40 | 2.26 × 101 | 2.48 × 10⁻¹ | 4.16 × 10⁻¹ | 9.29 × 10⁻² |
| M100-C40 | 2.14 × 101 | 2.35 × 10⁻¹ | 3.94 × 10⁻¹ | 8.79 × 10⁻² |
| M0-C50 | 2.58 × 101 | 2.84 × 10⁻¹ | 4.76 × 10⁻¹ | 1.06 × 10⁻² |
| M25-C50 | 2.48 × 101 | 2.72 × 10⁻¹ | 4.56 × 10⁻¹ | 1.02 × 10⁻² |
| M50-C50 | 2.37 × 101 | 2.59 × 10⁻¹ | 4.35 × 10⁻¹ | 9.71 × 10⁻² |
| M75-C50 | 2.26 × 101 | 2.47 × 10⁻¹ | 4.15 × 10⁻¹ | 9.26 × 10⁻² |
| M100-C50 | 2.15 × 101 | 2.35 × 10⁻¹ | 3.95 × 10⁻¹ | 8.80 × 10⁻² |
| M0-C60 | 2.57 × 101 | 2.82 × 10⁻¹ | 4.73 × 10⁻¹ | 1.05 × 10⁻² |
| M25-C60 | 2.47 × 101 | 2.71 × 10⁻¹ | 4.54 × 10⁻¹ | 1.01 × 10⁻² |
| M50-C60 | 2.37 × 101 | 2.59 × 10⁻¹ | 4.35 × 10⁻¹ | 9.70 × 10⁻² |
| M75-C60 | 2.27 × 101 | 2.48 × 10⁻¹ | 4.16 × 10⁻¹ | 9.28 × 10⁻² |
| M100-C60 | 2.17 × 101 | 2.37 × 10⁻¹ | 3.97 × 10⁻¹ | 8.86 × 10⁻² |
Table A8.
Calculate the environmental impact of molybdenum tailings concrete raw materials production stage according to the non-allocation method.
Table A8.
Calculate the environmental impact of molybdenum tailings concrete raw materials production stage according to the non-allocation method.
| Serial Number | Global Warming | Acidification | Eutrophicate | Pollution | Atmospheric Suspension | Water Suspension | Water Toxicity |
|---|---|---|---|---|---|---|---|
| M0-C30 | 3.38 × 10² | 1.15 × 100 | 1.15 × 100 | 2.55 × 10⁻² | 6.06 × 10⁻¹ | 1.78 × 10⁻² | 7.71 × 10⁻³ |
| M25-C30 | 3.36 × 10² | 1.13 × 100 | 1.13 × 100 | 2.52 × 10⁻² | 5.88 × 10⁻¹ | 1.78 × 10⁻² | 7.71 × 10⁻³ |
| M50-C30 | 3.34 × 10² | 1.11 × 100 | 1.12 × 100 | 2.49 × 10⁻² | 5.70 × 10⁻¹ | 1.78 × 10⁻² | 7.71 × 10⁻³ |
| M75-C30 | 3.32 × 10² | 1.08 × 100 | 1.11 × 100 | 2.46 × 10⁻² | 5.52 × 10⁻¹ | 1.78 × 10⁻² | 7.71 × 10⁻³ |
| M100-C30 | 3.30 × 10² | 1.06 × 100 | 1.10 × 100 | 2.43 × 10⁻² | 5.34 × 10⁻¹ | 1.78 × 10⁻² | 7.71 × 10⁻³ |
| M0-C40 | 3.66 × 10² | 1.23 × 100 | 1.24 × 100 | 2.75 × 10⁻² | 6.43 × 10⁻¹ | 1.94 × 10⁻² | 8.40 × 10⁻³ |
| M25-C40 | 3.64 × 10² | 1.21 × 100 | 1.22 × 100 | 2.72 × 10⁻² | 6.26 × 10⁻¹ | 1.94 × 10⁻² | 8.40 × 10⁻³ |
| M50-C40 | 3.62 × 10² | 1.19 × 100 | 1.21 × 100 | 2.69 × 10⁻² | 6.09 × 10⁻¹ | 1.94 × 10⁻² | 8.40 × 10⁻³ |
| M75-C40 | 3.60 × 10² | 1.17 × 100 | 1.20 × 100 | 2.66 × 10⁻² | 5.92 × 10⁻¹ | 1.94 × 10⁻² | 8.40 × 10⁻³ |
| M100-C40 | 3.58 × 10² | 1.15 × 100 | 1.19 × 100 | 2.64 × 10⁻² | 5.75 × 10⁻¹ | 1.94 × 10⁻² | 8.40 × 10⁻³ |
| M0-C50 | 4.03 × 10² | 1.34 × 100 | 1.36 × 100 | 3.01 × 10⁻² | 6.91 × 10⁻¹ | 2.15 × 10⁻² | 9.33 × 10⁻³ |
| M25-C50 | 4.02 × 10² | 1.32 × 100 | 1.35 × 100 | 2.99 × 10⁻² | 6.75 × 10⁻¹ | 2.15 × 10⁻² | 9.33 × 10⁻³ |
| M50-C50 | 4.00 × 10² | 1.30 × 100 | 1.34 × 100 | 2.96 × 10⁻² | 6.59 × 10⁻¹ | 2.15 × 10⁻² | 9.33 × 10⁻³ |
| M75-C50 | 3.98 × 10² | 1.28 × 100 | 1.32 × 100 | 2.94 × 10⁻² | 6.44 × 10⁻¹ | 2.15 × 10⁻² | 9.33 × 10⁻³ |
| M100-C50 | 3.96 × 10⁻² | 1.26 × 100 | 1.31 × 100 | 2.91 × 10⁻² | 6.28 × 10⁻¹ | 2.15 × 10⁻² | 9.33 × 10⁻³ |
| M0-C60 | 4.39 × 10² | 1.44 × 100 | 1.47 × 10−0 | 3.26 × 10⁻² | 7.37 × 10⁻¹ | 2.35 × 10⁻² | 1.02 × 10⁻² |
| M25-C60 | 4.37 × 10² | 1.42 × 100 | 1.46 × 100 | 3.24 × 10⁻² | 7.22 × 10⁻¹ | 2.35 × 10⁻² | 1.02 × 10⁻² |
| M50-C60 | 4.35 × 10² | 1.41 × 100 | 1.45 × 100 | 3.22 × 10⁻² | 7.07 × 10⁻¹ | 2.35 × 10⁻² | 1.02 × 10⁻² |
| M75-C60 | 4.34 × 10² | 1.39 × 100 | 1.44 × 100 | 3.19 × 10⁻² | 6.93 × 10⁻¹ | 2.35 × 10⁻² | 1.02 × 10⁻² |
| M100-C60 | 4.32 × 10² | 1.37 × 100 | 1.43 × 100 | 3.17 × 10⁻² | 6.78 × 10⁻¹ | 2.35 × 10⁻² | 1.02 × 10⁻² |
Table A9.
Calculate the environmental impact of molybdenum tailings concrete raw materials production stage according to the economic distribution method.
Table A9.
Calculate the environmental impact of molybdenum tailings concrete raw materials production stage according to the economic distribution method.
| Serial Number | Global Warming | Acidification | Eutrophicate | Pollution | Atmospheric Suspension | Water Suspension | Water Toxicity |
|---|---|---|---|---|---|---|---|
| M0-C30 | 3.38 × 10² | 1.15 × 100 | 1.15 × 100 | 2.55 × 10⁻² | 6.06 × 10⁻¹ | 1.78 × 10⁻² | 7.71 × 10⁻³ |
| M25-C30 | 3.36 × 10² | 1.13 × 100 | 1.14 × 100 | 2.52 × 10⁻² | 5.91 × 10⁻¹ | 1.78 × 10⁻² | 7.71 × 10⁻³ |
| M50-C30 | 3.34 × 10² | 1.11 × 100 | 1.12 × 100 | 2.49 × 10⁻² | 5.75 × 10⁻¹ | 1.78 × 10⁻² | 7.71 × 10⁻³ |
| M75-C30 | 3.32 × 10² | 1.09 × 100 | 1.11 × 100 | 2.47 × 10⁻² | 5.60 × 10⁻¹ | 1.78 × 10⁻² | 7.71 × 10⁻³ |
| M100-C30 | 3.31 × 10² | 1.07 × 100 | 1.10 × 100 | 2.44 × 10⁻² | 5.44 × 10⁻¹ | 1.78 × 10⁻² | 7.71 × 10⁻³ |
| M0-C40 | 3.66 × 10² | 1.23 × 100 | 1.24 × 100 | 2.75 × 10⁻² | 6.43 × 10⁻¹ | 1.94 × 10⁻² | 8.40 × 10⁻³ |
| M25-C40 | 3.64 × 10² | 1.22 × 100 | 1.23 × 100 | 2.72 × 10⁻² | 6.28 × 10⁻¹ | 1.94 × 10⁻² | 8.40 × 10⁻³ |
| M50-C40 | 3.62 × 10² | 1.20 × 100 | 1.22 × 100 | 2.70 × 10⁻² | 6.14 × 10⁻¹ | 1.94 × 10⁻² | 8.40 × 10⁻³ |
| M75-C40 | 3.61 × 10² | 1.18 × 100 | 1.21 × 100 | 2.67 × 10⁻² | 5.99 × 10⁻¹ | 1.94 × 10⁻² | 8.40 × 10⁻³ |
| M100-C40 | 3.59 × 10² | 1.16 × 100 | 1.20 × 100 | 2.65 × 10⁻² | 5.84 × 10⁻¹ | 1.94 × 10⁻² | 8.40 × 10⁻³ |
| M0-C50 | 4.03 × 10² | 1.34 × 100 | 1.36 × 100 | 3.01 × 10⁻² | 6.91 × 10⁻¹ | 2.15 × 10⁻² | 9.33 × 10⁻³ |
| M25-C50 | 4.02 × 10² | 1.32 × 100 | 1.35 × 100 | 2.99 × 10⁻² | 6.77 × 10⁻¹ | 2.15 × 10⁻² | 9.33 × 10⁻³ |
| M50-C50 | 4.00 × 10² | 1.31 × 100 | 1.34 × 100 | 2.97 × 10⁻² | 6.64 × 10⁻¹ | 2.15 × 10⁻² | 9.33 × 10⁻³ |
| M75-C50 | 3.99 × 10² | 1.29 × 100 | 1.33 × 100 | 2.95 × 10⁻² | 6.50 × 10⁻¹ | 2.15 × 10⁻² | 9.33 × 10⁻³ |
| M100-C50 | 3.97 × 10² | 1.27 × 100 | 1.32 × 100 | 2.92 × 10⁻² | 6.37 × 10⁻¹ | 2.15 × 10⁻² | 9.33 × 10⁻³ |
| M0-C60 | 4.39 × 10² | 1.44 × 100 | 1.47 × 100 | 3.26 × 10⁻² | 7.37 × 10⁻¹ | 2.35 × 10⁻² | 1.02 × 10⁻² |
| M25-C60 | 4.37 × 10² | 1.43 × 100 | 1.46 × 100 | 3.24 × 10⁻² | 7.24 × 10⁻¹ | 2.35 × 10⁻² | 1.02 × 10⁻² |
| M50-C60 | 4.36 × 10² | 1.41 × 100 | 1.45 × 100 | 3.22 × 10⁻² | 7.11 × 10⁻¹ | 2.35 × 10⁻² | 1.02 × 10⁻² |
| M75-C60 | 4.34 × 10² | 1.39 × 100 | 1.44 × 100 | 3.20 × 10⁻² | 6.99 × 10⁻¹ | 2.35 × 10⁻² | 1.02 × 10⁻² |
| M100-C60 | 4.33 × 10² | 1.38 × 100 | 1.43 × 100 | 3.18 × 10⁻² | 6.86 × 10⁻¹ | 2.35 × 10⁻² | 1.02 × 10⁻² |
Table A10.
Environmental impact of molybdenum tailings concrete construction stage.
Table A10.
Environmental impact of molybdenum tailings concrete construction stage.
| Serial Number | Global Warming | Acidification | Eutrophicate | Pollution | Atmospheric Suspension | Solid Waste |
|---|---|---|---|---|---|---|
| M0-C30 | 1.84 × 101 | 1.18 × 10⁻¹ | 2.10 × 10⁻¹ | 4.67 × 10 | 7.91 × 10⁻³ | 7.20 × 10⁻⁴ |
| M25-C30 | 1.84 × 101 | 1.18 × 10⁻¹ | 2.10 × 10⁻¹ | 4.67 × 10 | 7.91 × 10⁻³ | 7.20 × 10⁻⁴ |
| M50-C30 | 1.84 × 101 | 1.18 × 10⁻¹ | 2.10 × 10⁻¹ | 4.67 × 10 | 7.91 × 10⁻³ | 7.20 × 10⁻⁴ |
| M75-C30 | 1.84 × 101 | 1.18 × 10⁻¹ | 2.10 × 10⁻¹ | 4.67 × 10 | 7.91 × 10⁻³ | 7.20 × 10⁻⁴ |
| M100-C30 | 1.84 × 101 | 1.18 × 10⁻¹ | 2.10 × 10⁻¹ | 4.67 × 10 | 7.91 × 10⁻³ | 7.20 × 10⁻⁴ |
| M0-C40 | 1.85 × 101 | 1.18 × 10⁻¹ | 2.11 × 10⁻¹ | 4.69 × 10 | 7.94 × 10⁻³ | 6.96 × 10⁻⁴ |
| M25-C40 | 1.85 × 101 | 1.18 × 10⁻¹ | 2.11 × 10⁻¹ | 4.69 × 10 | 7.94 × 10⁻³ | 6.96 × 10⁻⁴ |
| M50-C40 | 1.85 × 101 | 1.18 × 10⁻¹ | 2.11 × 10⁻¹ | 4.69 × 10 | 7.94 × 10⁻³ | 6.96 × 10⁻⁴ |
| M75-C40 | 1.85 × 101 | 1.18 × 10⁻¹ | 2.11 × 10⁻¹ | 4.69 × 10 | 7.94 × 10⁻³ | 6.96 × 10⁻⁴ |
| M100-C40 | 1.85 × 101 | 1.18 × 10⁻¹ | 2.11 × 10⁻¹ | 4.69 × 10 | 7.94 × 10⁻³ | 6.96 × 10⁻⁴ |
| M0-C50 | 1.86 × 101 | 1.18 × 10⁻¹ | 2.12 × 10⁻¹ | 4.71 × 10 | 7.97 × 10⁻³ | 6.80 × 10⁻⁴ |
| M25-C50 | 1.86 × 101 | 1.18 × 10⁻¹ | 2.12 × 10⁻¹ | 4.71 × 10 | 7.97 × 10⁻³ | 6.80 × 10⁻⁴ |
| M50-C50 | 1.86 × 101 | 1.18 × 10⁻¹ | 2.12 × 10⁻¹ | 4.71 × 10 | 7.97 × 10⁻³ | 6.80 × 10⁻⁴ |
| M75-C50 | 1.86 × 101 | 1.18 × 10⁻¹ | 2.12 × 10⁻¹ | 4.71 × 10 | 7.97 × 10⁻³ | 6.80 × 10⁻⁴ |
| M100-C50 | 1.86 × 101 | 1.18 × 10⁻¹ | 2.12 × 10⁻¹ | 4.71 × 10 | 7.97 × 10⁻³ | 6.80 × 10⁻⁴ |
| M0-C60 | 1.87 × 101 | 1.19 × 10⁻¹ | 2.13 × 10⁻¹ | 4.74 × 10 | 8.02 × 10⁻³ | 6.60 × 10⁻⁴ |
| M25-C60 | 1.87 × 101 | 1.19 × 10 | 2.13 × 10⁻¹ | 4.74 × 10 | 8.02 × 10⁻³ | 6.60 × 10⁻⁴ |
| M50-C60 | 1.87 × 101 | 1.19 × 10⁻¹ | 2.13 × 10⁻¹ | 4.74 × 10 | 8.02 × 10⁻³ | 6.60 × 10⁻⁴ |
| M75-C60 | 1.87 × 101 | 1.19 × 10⁻¹ | 2.13 × 10⁻¹ | 4.74 × 10 | 8.02 × 10⁻³ | 6.60 × 10⁻⁴ |
| M100-C60 | 1.87 × 101 | 1.19 × 10⁻¹ | 2.13 × 10⁻¹ | 4.74 × 10 | 8.02 × 10⁻³ | 6.60 × 10⁻⁴ |
Table A11.
Molybdenum tailings non-allocation concrete production stage WTP.
Table A11.
Molybdenum tailings non-allocation concrete production stage WTP.
| Serial Number | Ecological Environment Damage WTP | Resource Consumption WTP | Health Damage WTP | Total WTP |
|---|---|---|---|---|
| M0-C30 | 1.94 × 101 | 4.38 × 100 | 4.26 × 100 | 2.80 × 101 |
| M25-C30 | 1.92 × 101 | 4.05 × 100 | 4.14 × 100 | 2.74 × 101 |
| M50-C30 | 1.91 × 101 | 3.72 × 100 | 4.02 × 100 | 2.68 × 101 |
| M75-C30 | 1.90 × 101 | 3.39 × 100 | 3.89 × 100 | 2.63 × 101 |
| M100-C30 | 1.88 × 101 | 3.06 × 100 | 3.77 × 100 | 2.57 × 101 |
| M0-C40 | 2.10 × 101 | 4.48 × 100 | 4.52 × 100 | 3.00 × 101 |
| M25-C40 | 2.08 × 101 | 4.17 × 100 | 4.40 × 100 | 2.94 × 101 |
| M50-C40 | 2.07 × 101 | 3.86 × 100 | 4.29 × 100 | 2.89 × 101 |
| M75-C40 | 2.06 × 101 | 3.55 × 100 | 4.17 × 100 | 2.83 × 101 |
| M100-C40 | 2.05 × 101 | 3.23 × 100 | 4.05 × 100 | 2.77 × 101 |
| M0-C50 | 2.31 × 101 | 4.61 × 100 | 4.86 × 100 | 3.26 × 101 |
| M25-C50 | 2.30 × 101 | 4.32 × 100 | 4.75 × 100 | 3.21 × 101 |
| M50-C50 | 2.29 × 101 | 4.03 × 100 | 4.64 × 100 | 3.15 × 101 |
| M75-C50 | 2.27 × 101 | 3.74 × 100 | 4.53 × 100 | 3.10 × 101 |
| M100-C50 | 2.26 × 101 | 3.45 × 100 | 4.43 × 100 | 3.05 × 101 |
| M0-C60 | 2.51 × 101 | 4.74 × 100 | 5.18 × 100 | 3.50 × 101 |
| M25-C60 | 2.50 × 101 | 4.47 × 100 | 5.08 × 100 | 3.46 × 101 |
| M50-C60 | 2.49 × 101 | 4.21 × 100 | 4.98 × 100 | 3.41 × 101 |
| M75-C60 | 2.48 × 101 | 3.94 × 100 | 4.88 × 100 | 3.36 × 101 |
| M100-C60 | 2.47 × 101 | 3.67 × 100 | 4.78 × 100 | 3.31 × 101 |
Table A12.
Molybdenum tailings economic distribution method concrete production-stage WTP.
Table A12.
Molybdenum tailings economic distribution method concrete production-stage WTP.
| Serial Number | Ecological Environment Damage WTP | Resource Consumption WTP | Health Damage WTP | Total WTP |
|---|---|---|---|---|
| M0-C30 | 1.94 × 101 | 4.38 × 100 | 4.26 × 100 | 2.80 × 101 |
| M25-C30 | 1.93 × 101 | 4.05 × 100 | 4.16 × 100 | 2.75 × 101 |
| M50-C30 | 1.91 × 101 | 3.72 × 100 | 4.05 × 100 | 2.69 × 101 |
| M75-C30 | 1.90 × 101 | 3.39 × 100 | 3.94 × 100 | 2.64 × 101 |
| M100-C30 | 1.89 × 101 | 3.06 × 100 | 3.84 × 100 | 2.58 × 101 |
| M0-C40 | 2.10 × 101 | 4.48 × 100 | 4.52 × 100 | 3.00 × 101 |
| M25-C40 | 2.09 × 101 | 4.17 × 100 | 4.42 × 100 | 2.95 × 101 |
| M50-C40 | 2.08 × 101 | 3.86 × 100 | 4.32 × 100 | 2.89 × 101 |
| M75-C40 | 2.06 × 101 | 3.55 × 100 | 4.22 × 100 | 2.84 × 101 |
| M100-C40 | 2.05 × 101 | 3.24 × 100 | 4.12 × 100 | 2.79 × 101 |
| M0-C50 | 2.31 × 101 | 4.61 × 100 | 4.86 × 100 | 3.26 × 101 |
| M25-C50 | 2.30 × 101 | 4.32 × 100 | 4.77 × 100 | 3.21 × 101 |
| M50-C50 | 2.29 × 101 | 4.03 × 100 | 4.67 × 100 | 3.16 × 101 |
| M75-C50 | 2.28 × 101 | 3.74 × 100 | 4.58 × 100 | 3.11 × 101 |
| M100-C50 | 2.27 × 101 | 3.46 × 100 | 4.49 × 100 | 3.06 × 101 |
| M0-C60 | 2.51 × 101 | 4.74 × 100 | 5.18 × 100 | 3.50 × 101 |
| M25-C60 | 2.50 × 101 | 4.47 × 100 | 5.10 × 100 | 3.46 × 101 |
| M50-C60 | 2.49 × 101 | 4.21 × 100 | 5.01 × 100 | 3.41 × 101 |
| M75-C60 | 2.48 × 101 | 3.94 × 100 | 4.92 × 100 | 3.37 × 101 |
| M100-C60 | 2.47 × 101 | 3.67 × 100 | 4.84 × 100 | 3.32 × 101 |
Table A13.
WTP in Xi’an molybdenum tailings concrete transportation stage.
Table A13.
WTP in Xi’an molybdenum tailings concrete transportation stage.
| Serial Number | Ecological Environment Damage WTP | Resource Consumption WTP | Health Damage WTP | Total WTP |
|---|---|---|---|---|
| M0-C30 | 2.63 × 101 | 2.89 × 10⁻¹ | 4.86 × 10⁻¹ | 1.08 × 10⁻² |
| M25-C30 | 2.50 × 101 | 2.75 × 10⁻¹ | 4.62 × 10⁻¹ | 1.03 × 10⁻² |
| M50-C30 | 2.38 × 101 | 2.61 × 10⁻¹ | 4.39 × 10⁻¹ | 9.79 × 10⁻³ |
| M75-C30 | 2.25 × 101 | 2.48 × 10⁻¹ | 4.15 × 10⁻¹ | 9.27 × 10⁻³ |
| M100-C30 | 2.13 × 101 | 2.34 × 10⁻¹ | 3.92 × 10⁻¹ | 8.75 × 10⁻³ |
| M0-C40 | 2.61 × 101 | 2.87 × 10⁻¹ | 4.82 × 10⁻¹ | 1.08 × 10⁻² |
| M25-C40 | 2.50 × 101 | 2.74 × 10⁻¹ | 4.60 × 10⁻¹ | 1.03 × 10⁻² |
| M50-C40 | 2.38 × 101 | 2.61 × 10⁻¹ | 4.38 × 10⁻¹ | 9.78 × 10⁻³ |
| M75-C40 | 2.26 × 101 | 2.48 × 10⁻¹ | 4.16 × 10⁻¹ | 9.29 × 10⁻³ |
| M100-C40 | 2.14 × 101 | 2.35 × 10⁻¹ | 3.94 × 10⁻¹ | 8.79 × 10⁻³ |
| M0-C50 | 2.58 × 101 | 2.84 × 10⁻¹ | 4.76 × 10⁻¹ | 1.06 × 10⁻² |
| M25-C50 | 2.48 × 101 | 2.72 × 10⁻¹ | 4.56 × 10⁻¹ | 1.02 × 10⁻² |
| M50-C50 | 2.37 × 101 | 2.59 × 10⁻¹ | 4.35 × 10⁻¹ | 9.71 × 10⁻³ |
| M75-C50 | 2.26 × 101 | 2.47 × 10⁻¹ | 4.15 × 10⁻¹ | 9.26 × 10⁻³ |
| M100-C50 | 2.15 × 101 | 2.35 × 10⁻¹ | 3.95 × 10⁻¹ | 8.80 × 10⁻³ |
| M0-C60 | 2.57 × 101 | 2.82 × 10⁻¹ | 4.73 × 10⁻¹ | 1.05 × 10⁻² |
| M25-C60 | 2.47 × 101 | 2.71 × 10⁻¹ | 4.54 × 10⁻¹ | 1.01 × 10⁻² |
| M50-C60 | 2.37 × 101 | 2.59 × 10⁻¹ | 4.35 × 10⁻¹ | 9.70 × 10⁻³ |
| M75-C60 | 2.27 × 101 | 2.48 × 10⁻¹ | 4.16 × 10⁻¹ | 9.28 × 10⁻³ |
| M100-C60 | 2.17 × 101 | 2.37 × 10⁻¹ | 3.97 × 10⁻¹ | 8.86 × 10⁻³ |
Table A14.
WTP in the construction stage of molybdenum tailings concrete.
Table A14.
WTP in the construction stage of molybdenum tailings concrete.
| Serial Number | Ecological Environment Damage WTP | Resource Consumption WTP | Health Damage WTP | Total WTP |
|---|---|---|---|---|
| M0-C30 | 1.20 × 100 | 3.35 × 10⁻¹ | 6.20 × 10⁻² | 1.60 × 100 |
| M25-C30 | 1.20 × 100 | 3.35 × 10⁻¹ | 6.20 × 10⁻² | 1.60 × 100 |
| M50-C30 | 1.20 × 100 | 3.35 × 10⁻¹ | 6.20 × 10⁻² | 1.60 × 100 |
| M75-C30 | 1.20 × 100 | 3.35 × 10⁻¹ | 6.20 × 10⁻² | 1.60 × 100 |
| M100-C30 | 1.20 × 100 | 3.35 × 10⁻¹ | 6.20 × 10⁻² | 1.60 × 100 |
| M0-C40 | 1.21 × 100 | 3.27 × 10⁻¹ | 6.22 × 10⁻² | 1.59 × 100 |
| M25-C40 | 1.21 × 100 | 3.27 × 10⁻¹ | 6.22 × 10⁻² | 1.59 × 100 |
| M50-C40 | 1.21 × 100 | 3.27 × 10⁻¹ | 6.22 × 10⁻² | 1.59 × 100 |
| M75-C40 | 1.21 × 100 | 3.27 × 10⁻¹ | 6.22 × 10⁻² | 1.59 × 100 |
| M100-C40 | 1.21 × 100 | 3.27 × 10⁻¹ | 6.22 × 10⁻² | 1.59 × 100 |
| M0-C50 | 1.21 × 100 | 3.21 × 10⁻¹ | 6.24 × 10⁻² | 1.59 × 100 |
| M25-C50 | 1.21 × 100 | 3.21 × 10⁻¹ | 6.24 × 10⁻² | 1.59 × 100 |
| M50-C50 | 1.21 × 100 | 3.21 × 10⁻¹ | 6.24 × 10⁻² | 1.59 × 100 |
| M75-C50 | 1.21 × 100 | 3.21 × 10⁻¹ | 6.24 × 10⁻² | 1.59 × 100 |
| M100-C50 | 1.21 × 100 | 3.21 × 10⁻¹ | 6.24 × 10⁻² | 1.59 × 100 |
| M0-C60 | 1.22 × 100 | 3.15 × 10⁻¹ | 6.28 × 10⁻² | 1.60 × 100 |
| M25-C60 | 1.22 × 100 | 3.15 × 10⁻¹ | 6.28 × 10⁻² | 1.60 × 100 |
| M50-C60 | 1.22 × 100 | 3.15 × 10⁻¹ | 6.28 × 10⁻² | 1.60 × 100 |
| M75-C60 | 1.22 × 100 | 3.15 × 10⁻¹ | 6.28 × 10⁻² | 1.60 × 100 |
| M100-C60 | 1.22 × 100 | 3.15 × 10⁻¹ | 6.28 × 10⁻² | 1.60 × 100 |
Table A15.
Molybdenum tailings concrete no allocation method.
Table A15.
Molybdenum tailings concrete no allocation method.
| Serial Number | Raw Material Production-Stage WTP | Raw Material Transportation Stage WTP | Construction Stage WTP | Total WTP |
|---|---|---|---|---|
| M0-C30 | 2.80 × 101 | 2.16 × 100 | 1.60 × 100 | 3.18 × 101 |
| M25-C30 | 2.74 × 101 | 2.06 × 100 | 1.60 × 100 | 3.11 × 101 |
| M50-C30 | 2.68 × 101 | 1.95 × 100 | 1.60 × 100 | 3.04 × 101 |
| M75-C30 | 2.63 × 101 | 1.85 × 100 | 1.60 × 100 | 2.97 × 101 |
| M100-C30 | 2.57 × 101 | 1.75 × 100 | 1.60 × 100 | 2.90 × 101 |
| M0-C40 | 3.00 × 101 | 2.15 × 100 | 1.59 × 100 | 3.37 × 101 |
| M25-C40 | 2.94 × 101 | 2.05 × 100 | 1.59 × 100 | 3.31 × 101 |
| M50-C40 | 2.89 × 101 | 1.95 × 100 | 1.59 × 100 | 3.24 × 101 |
| M75-C40 | 2.83 × 101 | 1.86 × 100 | 1.59 × 100 | 3.18 × 101 |
| M100-C40 | 2.77 × 101 | 1.76 × 100 | 1.59 × 100 | 3.11 × 101 |
| M0-C50 | 3.26 × 101 | 2.12 × 100 | 1.59 × 100 | 3.63 × 101 |
| M25-C50 | 3.21 × 101 | 2.03 × 100 | 1.59 × 100 | 3.57 × 101 |
| M50-C50 | 3.15 × 101 | 1.94 × 100 | 1.59 × 100 | 3.51 × 101 |
| M75-C50 | 3.10 × 101 | 1.85 × 100 | 1.59 × 100 | 3.45 × 101 |
| M100-C50 | 3.05 × 101 | 1.76 × 100 | 1.59 × 100 | 3.39 × 101 |
| M0-C60 | 3.50 × 101 | 2.11 × 100 | 1.60 × 100 | 3.87 × 101 |
| M25-C60 | 3.46 × 101 | 2.03 × 100 | 1.60 × 100 | 3.82 × 101 |
| M50-C60 | 3.41 × 101 | 1.94 × 100 | 1.60 × 100 | 3.76 × 101 |
| M75-C60 | 3.36 × 101 | 1.86 × 100 | 1.60 × 100 | 3.71 × 101 |
| M100-C60 | 3.31 × 101 | 1.78 × 100 | 1.60 × 100 | 3.65 × 101 |
Table A16.
Economic distribution method of molybdenum tailings concrete WTP.
Table A16.
Economic distribution method of molybdenum tailings concrete WTP.
| Serial Number | Raw Material Production-Stage WTP | Raw Material Transportation Stage WTP | Construction Stage WTP | Total WTP |
|---|---|---|---|---|
| M0-C30 | 2.80 × 101 | 2.16 × 100 | 1.60 × 100 | 3.18 × 101 |
| M25-C30 | 2.75 × 101 | 2.06 × 100 | 1.60 × 100 | 3.11 × 101 |
| M50-C30 | 2.69 × 101 | 1.95 × 100 | 1.60 × 100 | 3.05 × 101 |
| M75-C30 | 2.64 × 101 | 1.85 × 100 | 1.60 × 100 | 2.98 × 101 |
| M100-C30 | 2.58 × 101 | 1.75 × 100 | 1.60 × 100 | 2.92 × 101 |
| M0-C40 | 3.00 × 101 | 2.15 × 100 | 1.59 × 100 | 3.37 × 101 |
| M25-C40 | 2.95 × 101 | 2.05 × 100 | 1.59 × 100 | 3.31 × 101 |
| M50-C40 | 2.89 × 101 | 1.95 × 100 | 1.59 × 100 | 3.25 × 101 |
| M75-C40 | 2.84 × 101 | 1.86 × 100 | 1.59 × 100 | 3.19 × 101 |
| M100-C40 | 2.79 × 101 | 1.76 × 100 | 1.59 × 100 | 3.12 × 101 |
| M0-C50 | 3.26 × 101 | 2.12 × 100 | 1.59 × 100 | 3.63 × 101 |
| M25-C50 | 3.21 × 101 | 2.03 × 100 | 1.59 × 100 | 3.57 × 101 |
| M50-C50 | 3.16 × 101 | 1.94 × 100 | 1.59 × 100 | 3.51 × 101 |
| M75-C50 | 3.11 × 101 | 1.85 × 100 | 1.59 × 100 | 3.46 × 101 |
| M100-C50 | 3.06 × 101 | 1.76 × 100 | 1.59 × 100 | 3.40 × 101 |
| M0-C60 | 3.50 × 101 | 2.11 × 100 | 1.60 × 100 | 3.87 × 101 |
| M25-C60 | 3.46 × 101 | 2.03 × 100 | 1.60 × 100 | 3.82 × 101 |
| M50-C60 | 3.41 × 101 | 1.94 × 100 | 1.60 × 100 | 3.77 × 101 |
| M75-C60 | 3.37 × 101 | 1.86 × 100 | 1.60 × 100 | 3.71 × 101 |
| M100-C60 | 3.32 × 101 | 1.78 × 100 | 1.60 × 100 | 3.66 × 101 |
Table A17.
Ratio of energy consumption and energy saving in molybdenum tailings concrete non-allocation method and economic distribution method in production stage.
Table A17.
Ratio of energy consumption and energy saving in molybdenum tailings concrete non-allocation method and economic distribution method in production stage.
| Serial Number | No Allocation Method | Allocation Method | ||
|---|---|---|---|---|
| Energy Consumption MJ | Energy Saving Ratio | Energy Consumption MJ | Energy Saving Ratio | |
| M0-C30 | 3.10 × 10² | / | 3.10 × 10² | / |
| M25-C30 | 3.02 × 10² | 2.63% | 3.04 × 10² | 1.98% |
| M50-C30 | 2.94 × 10² | 2.70% | 2.98 × 10² | 2.02% |
| M75-C30 | 2.86 × 10² | 2.77% | 2.92 × 10² | 2.06% |
| M100-C30 | 2.77 × 10² | 2.85% | 2.85 × 10² | 2.11% |
| M0-C40 | 3.29 × 10² | / | 3.29 × 10² | / |
| M25-C40 | 3.22 × 10² | 2.33% | 3.24 × 10² | 1.76% |
| M50-C40 | 3.14 × 10² | 2.38% | 3.18 × 10² | 1.79% |
| M75-C40 | 3.06 × 10² | 2.44% | 3.12 × 10² | 1.82% |
| M100-C40 | 2.99 × 10² | 2.50% | 3.06 × 10² | 1.85% |
| M0-C50 | 3.55 × 10² | / | 3.55 × 10² | / |
| M25-C50 | 3.48 × 10² | 2.00% | 3.50 × 10² | 1.51% |
| M50-C50 | 3.41 × 10² | 2.04% | 3.44 × 10² | 1.53% |
| M75-C50 | 3.34 × 10² | 2.08% | 3.39 × 10² | 1.55% |
| M100-C50 | 3.27 × 10² | 2.12% | 3.34 × 10² | 1.58% |
| M0-C60 | 3.80 × 10² | / | 3.80 × 10² | / |
| M25-C60 | 3.73 × 10² | 1.74% | 3.75 × 10² | 1.31% |
| M50-C60 | 3.67 × 10² | 1.77% | 3.70 × 10² | 1.33% |
| M75-C60 | 3.60 × 10² | 1.80% | 3.65 × 10² | 1.35% |
| M100-C60 | 3.53 × 10² | 1.83% | 3.60 × 10² | 1.36% |
References
- Zhang, L.; Zhu, Y.; Zhang, Y.; Zhong, J.; Li, J.; Yang, S.; Ta, W.; Zhang, Y. Characteristics, source analysis, and health risk assessment of potentially toxic elements pollution in soil of dense molybdenum tailing ponds area in central China. Environ. Geochem. Health 2024, 46, 129. [Google Scholar] [CrossRef]
- Shettima, A.; Hussin, M.; Ahmad, Y.; Mirza, J. Evaluation of iron ore tailings as replacement for fine aggregate in concrete. Constr. Build. Mater. 2016, 72, 72–79. [Google Scholar] [CrossRef]
- Anshassi, M. Global warming potential implications of US waste LCA assumptions: A perturbation-based approach for decision support. Waste Manag. 2025, 204, 114953. [Google Scholar] [CrossRef]
- Feng, J.; Yang, Y.; Ruan, K.; Wu, D.; Xu, Y.; Jacobs, D.F.; Zeng, S. Combined application of sewage sludge, bagasse, and molybdenum tailings ameliorates rare earth mining wasteland soil. J. Soils Sediments 2023, 23, 1775–1788. [Google Scholar] [CrossRef]
- Di, Y.; Cui, X.; Ning, N.; Zhou, C. Hydration reaction of cementitious materials prepared with molybdenum tailings. Chem. Eng. Trans. 2018, 66, 7–12. [Google Scholar] [CrossRef]
- Antonelli, P.M.; Fraser, L.H.; Gardner, W.C.; Broersma, K.; Karakatsoulis, J.; Phillips, M.E. Long term carbon sequestration potential of biosolids-amended copper and molybdenum mine tailings following mine site reclamation. Ecol. Eng. 2018, 117, 38–49. [Google Scholar] [CrossRef]
- Sordo, B.; Rathje, E.; Kumar, K. Runout of liquefaction-induced tailings dam failure: Influence of earthquake motions and residual strength. Soil Dyn. Earthq. Eng. 2025, 194, 109371. [Google Scholar] [CrossRef]
- Onesorge Miranda Lopes, T.; Rodrigues da Silveira, C.; Araujo da Silva, J.; Guedes, T.; Adler Tavella, R.; Coimbra Rola, R.; Aparecida Marques, J.; Delfino Vieira, C.E.; Bianchini, A.; de Martinez Gaspar Martins, C. A six-year ecotoxicological assessment of the Doce River and coastal marine areas impacted by the Fundão tailings dam failure, Brazil. Environ. Pollut. 2025, 371, 125897. [Google Scholar] [CrossRef]
- Deng, P.; Chang, Z.; Leng, H.; Zhong, H.; Chen, Y.; Ren, Y. Experimental investigation on properties of gold tailings recycled brick-concrete aggregate concrete under microwave curing. J. Build. Eng. 2024, 95, 110104. [Google Scholar] [CrossRef]
- Zhang, B.; Zhang, H.; Xu, R.; Wang, L.; Tang, H. Research on resource comprehensive utilization of granite-type sulfide mine tailings. J. Phys. Conf. Ser. 2024, 2738, 012036. [Google Scholar] [CrossRef]
- Mao, J.; He, M.; Qin, Y.; Chen, Y.; Wang, X.; Che, H.; Cheng, C.; Wang, T.; Wang, W.; Sun, B.; et al. Resource utilization of waste tailings: Simulated removal of nitrogen from secondary effluent by autotrophic denitrification based on pyrite tailings. Front. Environ. Sci. 2022, 10, 949618. [Google Scholar] [CrossRef]
- Cui, X.; Li, J.; Wang, Y. Basic research on the preparation of mineral admixtures with iron ore tailings. Non-Met. Mines 2020, 43, 88–91. [Google Scholar]
- Jiang, L.; Yang, A.; Zhang, Q. Pollution and Biotoxicity of Molybdenum-nickel Mine Tailing and Smelting Waste. Environ. Sci. Technol. 2014, 37, 199–204. [Google Scholar]
- Gao, S.; Su, R.X.; Yuan, J.; Ma, H.Y. Experimental study on the frost resistance of molybdenum tailings concrete. Eur. J. Environ. Civ. Eng. 2024, 28, 3313–3327. [Google Scholar] [CrossRef]
- Yuan, J.; Bai, Q.; Gao, S.; Wang, Y.; Yu, S. Uniaxial compressive stress-strain model of Molybdenum tailings concrete after high-temperature exposure. Constr. Build. Mater. 2024, 428, 136343. [Google Scholar] [CrossRef]
- Xie, B.; Yuan, J.; Jiang, C.-J. Experimental study on the mechanical properties of C30 molybdenum tailings concrete after high-temperature and sulfate corrosion. Heliyon 2024, 10, e40323. [Google Scholar] [CrossRef]
- Zhang, Y. Comprehensive Assessment of Environmental Impact of Fly Ash Concrete Life Cycle. Ph.D. Thesis, Beijing Jiaotong University, Beijing, China, 2016. (In Chinese). [Google Scholar]
- Li, C. Research on the Life Cycle Evaluation of a Copper Tailings Resource Utilization Process in Jiangxi Province. Master’s Thesis, Jiangxi University of Science and Technology, Ganzhou, China, 2020. (In Chinese). [Google Scholar]
- Lin, J. Research on the Life Cycle Evaluation of Copper and Tungsten Tailings Resource Utilization Process. Master’s Thesis, Jiangxi University of Science and Technology, Ganzhou, China, 2022. (In Chinese). [Google Scholar]
- Kurda, R.; Silvestre, J.; de Brito, J. Life cycle assessment of concrete made with high volume of recycled concrete aggregates and fly ash. Resour. Conserv. Recycl. 2018, 139, 407–417. [Google Scholar] [CrossRef]
- Aziminezhad, M.; Habibi, A.; Jamhiri, B.; Bamshad, O.; Aziminezhad, M. Beyond carbon: An integrated LCA–MCDA framework for circularity measurement of ordinary and geopolymer concrete. Environ. Impact Assess. Rev. 2026, 116, 108133. [Google Scholar] [CrossRef]
- Keykha, M.; Einollahipeer, F.; Abyar, H.; Erfani, M. Life cycle assessment of copper concentrate production and improvement potentials for tailing management. Integr. Environ. Assess. Manag. 2025, 21, 455–465. [Google Scholar] [CrossRef]
- Lappalainen, H.; Rinne, M.; Elomaa, H.; Aromaa, J.; Lundström, M. Environmental impacts of lithium hydroxide monohydrate production from spodumene concentrate—Life Cycle Assessment Based on Simulation. Miner. Eng. 2024, 209, 108632. [Google Scholar] [CrossRef]
- Lugas, R.A.; Luca, C.; Stephan, P.; Stefanie, H. Toward sustainable reprocessing and valorization of sulfidic copper tailings: Scenarios and prospective LCA. Sci. Total Environ. 2023, 871, 162038. [Google Scholar] [CrossRef]
- Sporchia, F.; Bruno, M.; Neri, E.; Pulselli, F.M.; Patrizi, N.; Bastianoni, S. Complementing emergy evaluation and life cycle assessment for enlightening the environmental benefits of using engineered timber in the building sector. Sci. Total Environ. 2025, 970, 179030. [Google Scholar] [CrossRef]
- Emily, G.S.; Kíra, L.; Henrikke, B.; Thomas, E. Transparent or hidden choices: Exploring perceptions and practices of LCA in building projects. Build. Environ. 2025, 285 Pt A, 113439. [Google Scholar] [CrossRef]
- Naghibalsadati, F.; Karimi, N.; Mim, S.J.; Ng, K.T.W. Thematic evolution of Life Cycle Assessment in construction and demolition waste management: Before and after ISO 14040 and the Paris Agreement. J. Build. Eng. 2025, 111, 113482. [Google Scholar] [CrossRef]
- Abdulrahman, B.; Aoife, H.W.; Jonathan, N.; Ellie, M.; Stephen, A. Hybrid life cycle assessment (H-LCA) for buildings and construction materials: A systematic review and meta-analysis. Build. Environ. 2025, 272, 112630. [Google Scholar] [CrossRef]
- Wu, X. Research on Environmental Impact Assessment System and Application of Construction Engineering. Master’s Thesis, Tsinghua University, Beijing, China, 2005. (In Chinese). [Google Scholar]
- Kong, X. Research on Human Health Damage Evaluation System During the Life Cycle of Construction Engineering. Master’s Thesis, Tsinghua University, Beijing, China, 2010. (In Chinese). [Google Scholar]
- Dandautiya, R.; Singh, P. Utilization potential of fly ash and copper tailings in concrete as partial replacement of cement along with life cycle assessment. Waste Manag. 2019, 99, 90–101. [Google Scholar] [CrossRef]
- Gong, Z.; Zhang, Z. Research on the physical and chemical environment status in the life cycle of cement. J. Civ. Eng. 2004, 37, 86–91. (In Chinese) [Google Scholar]
- Xu, X. Life Cycle Evaluation of China’s Cement Industry. Master’s Thesis, Dalian University of Technology, Dalian, China, 2013. (In Chinese). [Google Scholar]
- Zhu, K. Research on the Preparation of Recycled Concrete and Mortar Using Construction Waste. Master’s Thesis, South China University of Technology, Guangzhou, China, 2017. (In Chinese). [Google Scholar]
- Wang, K.; Zhang, Z.; Zhu, L.; Yang, X.; Chen, M.; Yang, C. Comparative life cycle assessment of conventional and dry stack tailings disposal schemes: A case study in northern China. Minerals 2022, 12, 1603. [Google Scholar] [CrossRef]
- Li, X. Research on the High-Performance Concrete Properties of High-Titanium Slag and Its Slurry-Bone Interface Action Mechanism. Master’s Thesis, Southwest University of Science and Technology, Guangzhou, China, 2021. (In Chinese). [Google Scholar]
- Tao, R. Environmental Coordination Evaluation of Naphthalene and Polycarboxylic Acid Water Reducing Agents. Master’s Thesis, Beijing University of Technology, Beijing, China, 2018. (In Chinese). [Google Scholar]
- Wang, S. Research on Environmental Impact Assessment of Life Cycle of Commercial Concrete. Master’s Thesis, Tsinghua University, Beijing, China, 2009. (In Chinese). [Google Scholar]
- National Bureau of Statistics of China. China Statistical Yearbook; China Statistics Press: Beijing, China, 2023. (In Chinese) [Google Scholar]
- Ding, N.; Yang, J.; Lu, B. Analysis of the life cycle list of provincial thermal power supply in China. Acta Ecol. Sin. 2016, 36, 7192–7201. [Google Scholar] [CrossRef]
- Ding, N.; Yang, J. Analysis of the life cycle list of fossil energy in China. China Environ. Sci. 2015, 35, 1592–1600. (In Chinese) [Google Scholar]
- GB/T 2589-2020; General Rules for Calculation of the Comprehensive Energy Consumption. State Administration for Market Regulation; Standardization Administration of the People’s Republic of China: Beijing, China, 2020.
- Cao, X. Environmental Impact Assessment and Comparative Study on Industrialized Residential and Traditional Residential Construction. Ph.D. Thesis, Tsinghua University, Beijing, China, 2012. (In Chinese). [Google Scholar]
- Gao, S.; Cui, X.; Kang, S.; Ding, Y. Sustainable applications for utilizing molybdenum tailings in concrete. J. Clean. Prod. 2020, 266, 122020. [Google Scholar] [CrossRef]
- Gao, S.; Cui, X.; Zhang, S. Utilization of molybdenum tailings in concrete manufacturing: A review. Appl. Sci. 2020, 10, 138. [Google Scholar] [CrossRef]
- Gao, S.; Li, W.; Yuan, K.K.; Rong, C.X. Properties and application of thixotropic cement paste backfill with molybdenum tailings. J. Clean. Prod. 2023, 391, 136169. [Google Scholar] [CrossRef]
- Thomas, B.; Damare, A.; Gupta, R. Strength and durability characteristics of copper tailing concrete. Constr. Build. Mater. 2013, 48, 894–900. [Google Scholar] [CrossRef]
- Al-Jabri, K.; Hisada, M.; Al-Saidy, A.; Al-Oraimi, S. Performance of high strength concrete made with copper slag as a fine aggregate. Constr. Build. Mater. 2009, 23, 2132–2140. [Google Scholar] [CrossRef]
- Gao, S.; Qu, J.; Zhang, S.; Guo, L.; Huang, Z. A comparative study on mechanical and environmental performance of concrete-filled steel tubes using molybdenum tailing aggregate. J. Constr. Steel Res. 2022, 186, 107100. [Google Scholar] [CrossRef]
Disclaimer/Publisher’s Note: The statements, opinions and data contained in all publications are solely those of the individual author(s) and contributor(s) and not of MDPI and/or the editor(s). MDPI and/or the editor(s) disclaim responsibility for any injury to people or property resulting from any ideas, methods, instructions or products referred to in the content. |
© 2025 by the authors. Licensee MDPI, Basel, Switzerland. This article is an open access article distributed under the terms and conditions of the Creative Commons Attribution (CC BY) license (https://creativecommons.org/licenses/by/4.0/).