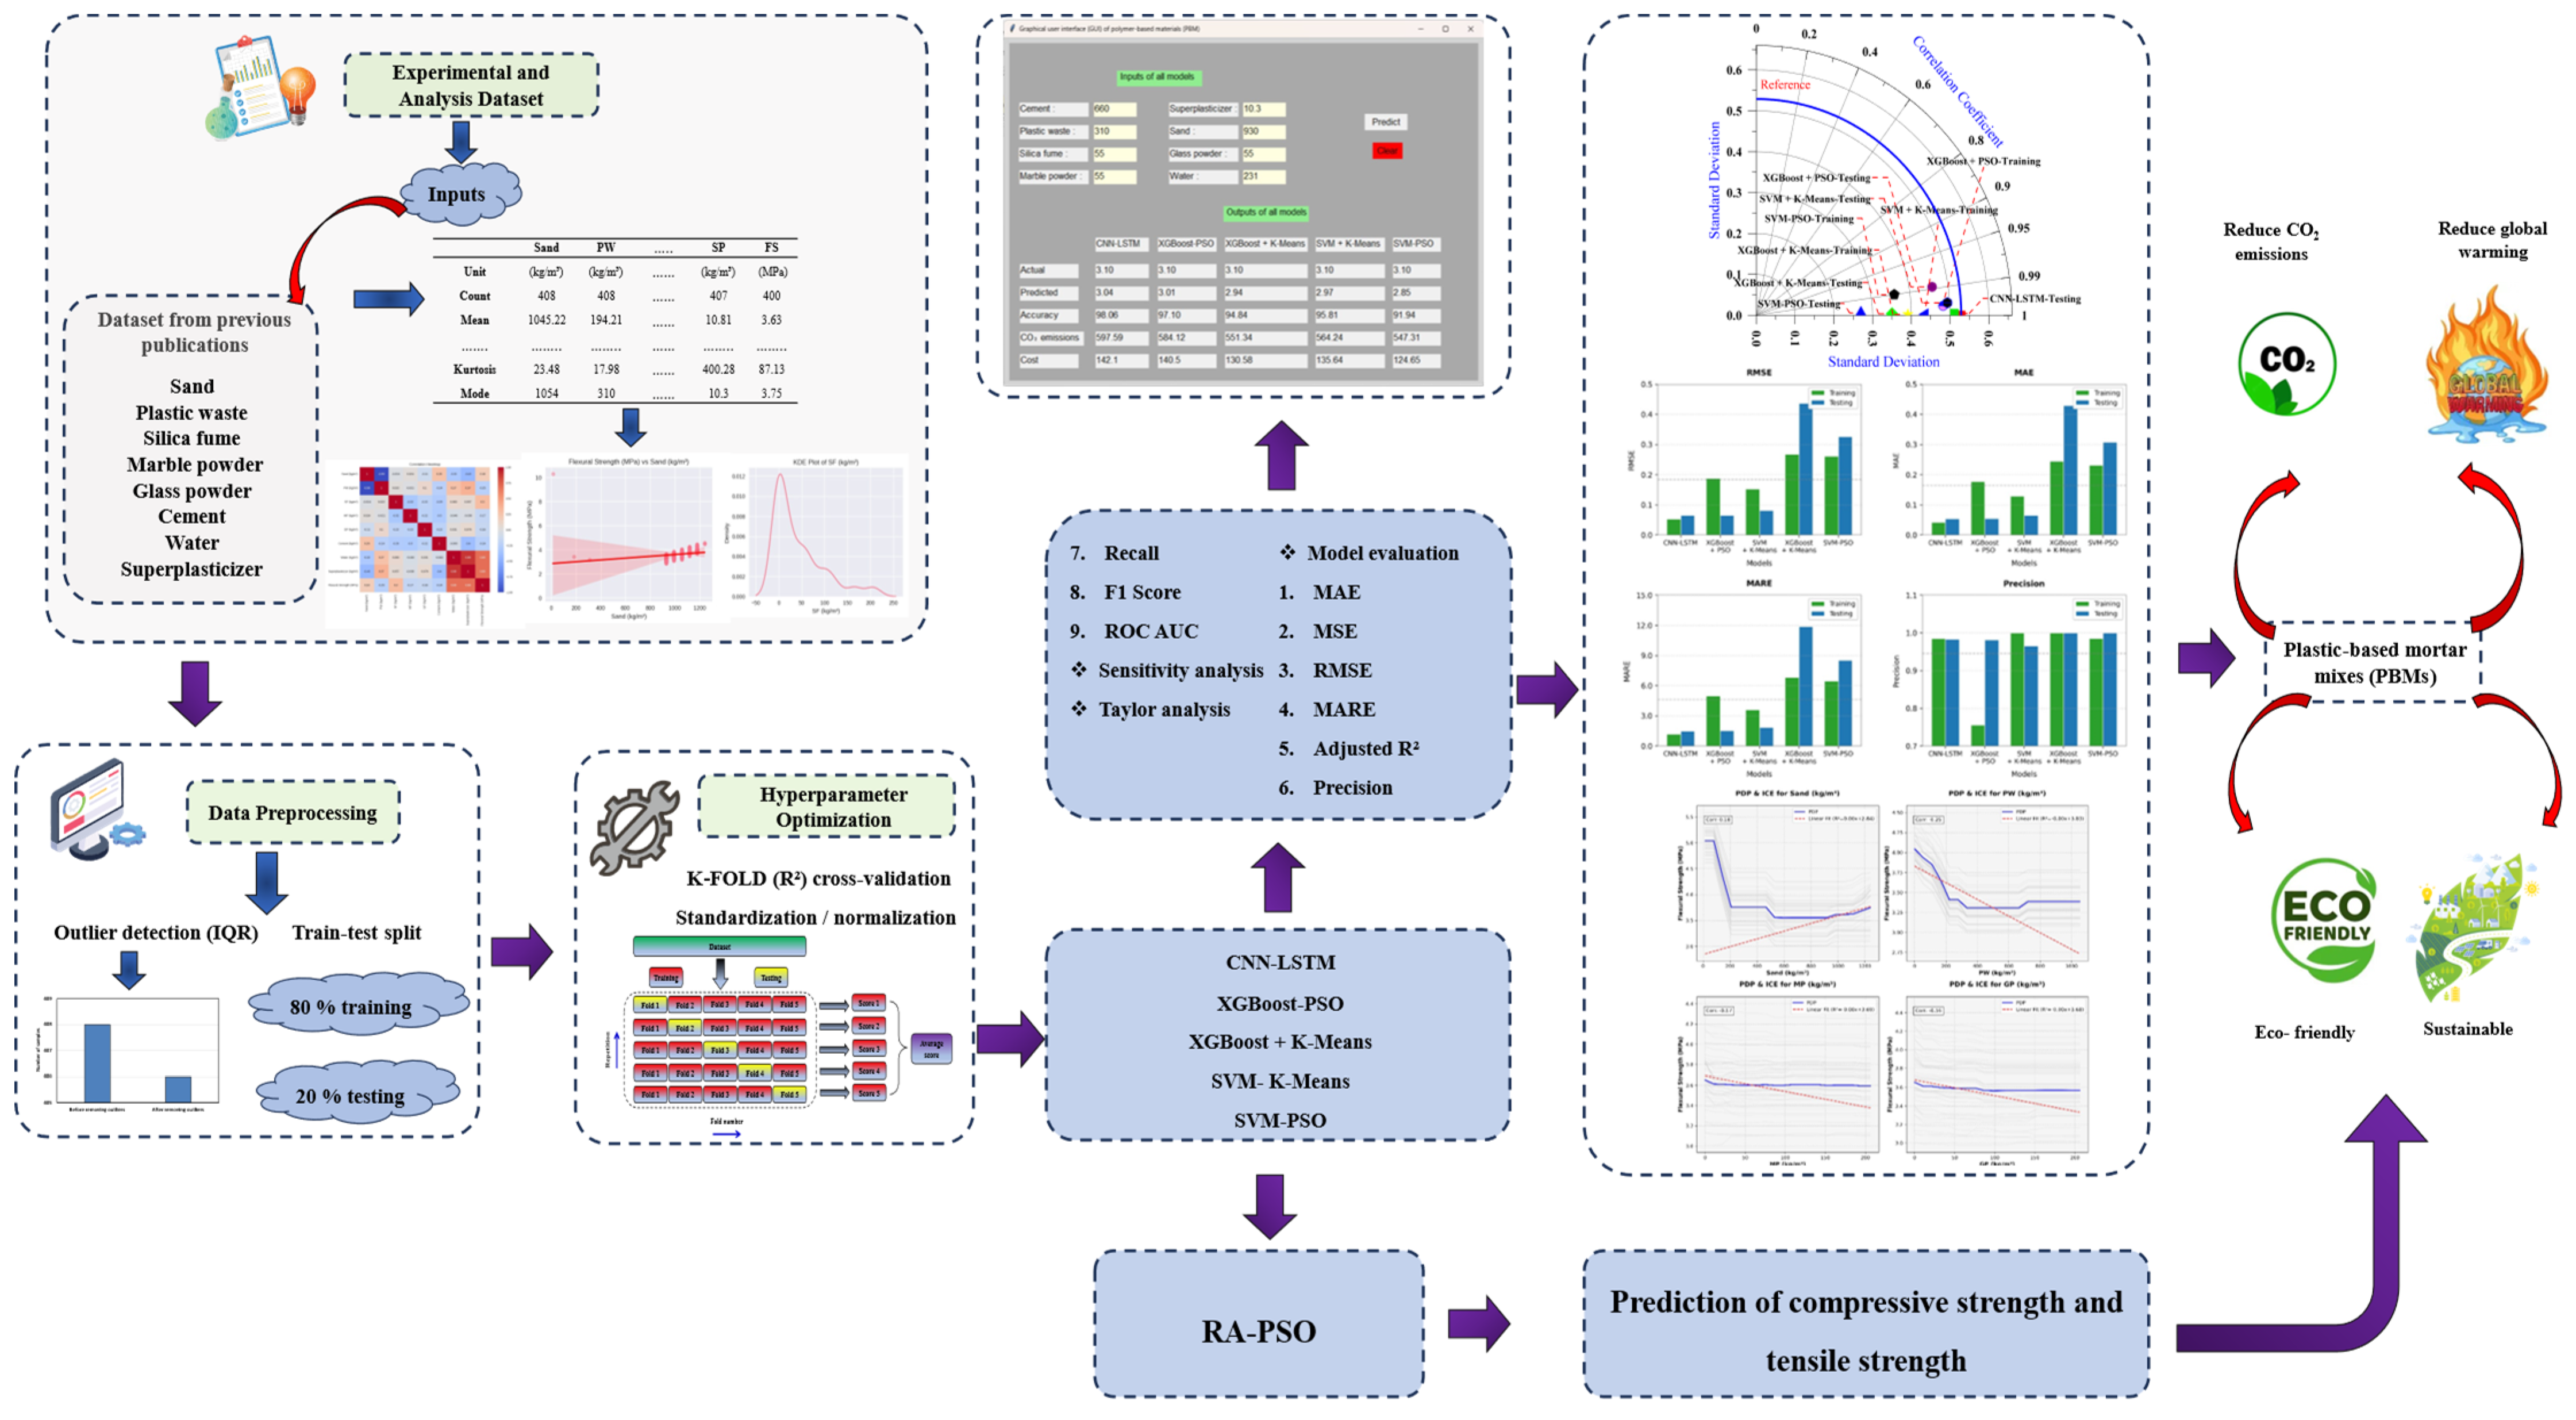
Article

AI-Driven Optimization of Plastic-Based Mortars Incorporating Industrial Waste for Modern Construction

College of Engineering, Imam Mohammad Ibn Saud Islamic University (IMSIU), Riyadh 11432, Saudi Arabia
Buildings 2025, 15(20), 3751; https://doi.org/10.3390/buildings15203751
Submission received: 3 September 2025 / Revised: 6 October 2025 / Accepted: 10 October 2025 / Published: 17 October 2025

Abstract

Cementitious composites with recycled plastic often suffer from reduced strength. This study explores the partial substitution of cement with industrial by-products in plastic-based mortar mixes (PBMs) to enhance performance while reducing environmental impact. To achieve this, five hybrid machine learning (ML) models CNN-LSTM, XGBoost-PSO, SVM + K-Means, SVM-PSO, and XGBoost + K-Means were developed to predict flexural strength, production cost, and CO2 emissions using a large dataset compiled from peer-reviewed sources. The CNN-LSTM model consistently outperformed the other approaches, showing high predictive capability for both mechanical and sustainability-related outputs. Sensitivity analysis revealed that water content and superplasticizer dosage are the most influential factors in improving flexural strength, while excessive cement and plastic waste were found to negatively impact performance. The proposed ML framework was also successful in estimating production cost and CO2 emissions, demonstrating strong alignment between predicted and actual values. Beyond mechanical and environmental predictions, the framework was extended through the RA-PSO model to estimate compressive and tensile strengths with high reliability. To support practical adoption, the study proposes a graphical user interface (GUI) that allows engineers and researchers to efficiently evaluate durability, cost, and environmental indicators. In addition, the establishment of an open access data-sharing platform is recommended to encourage broader utilization of PBMs in the production of paving blocks and non-structural masonry units. Overall, this work highlights the potential of hybrid ML approaches to optimize sustainable cementitious composites, bridging the gap between performance requirements and environmental responsibility.

1. Introduction

Cementitious composites, particularly those incorporating waste plastic, have emerged as promising avenues in the construction sector, driven by the global push for sustainable and environmentally friendly materials [1]. Plastic-modified mortars are sustainable but limited by low strength [1,2]. The strength reduction is mainly due to the weak bond between plastic particles and the cement matrix, as well as the lower stiffness and durability of plastic compared to natural aggregates such as sand or gravel [3]. Despite these challenges, substituting industrial waste, including waste plastic, for cement in PBMs presents an environmentally preferable and long-term sustainable alternative [4]. This approach not only reduces the demand for virgin materials but also mitigates the environmental impact of plastic waste accumulation, which is a growing concern worldwide [4,5]. According to recent studies, the construction industry consumes approximately 40% of global raw materials, making the adoption of recycled materials a critical step toward sustainability [6]. The incorporation of waste plastic into cementitious composites is motivated by the need to address the environmental consequences of plastic pollution [7]. Globally, over 300 million tons of plastic waste are generated annually, with a significant portion ending up in landfills or incinerators, contributing to environmental degradation. By repurposing this waste into construction materials, the industry can reduce landfill dependency, lower carbon emissions associated with cement production, and promote a circular economy [8]. However, the trade-offs in mechanical performance, such as reduced compressive and tensile strength, pose a significant barrier. For instance, studies have shown that replacing natural aggregates with plastic can lead to a strength reduction of up to 30% in some cases, depending on the type and proportion of plastic used [9]. This limitation necessitates innovative approaches to enhance the performance of PBMs while maintaining their environmental benefits [10].
The advent of machine learning (ML) has revolutionized material science, offering powerful tools to address the limitations of cementitious composites with waste plastic [3]. ML techniques enable researchers to model complex relationships between material composition, processing parameters, and mechanical properties, which are often difficult to capture using traditional experimental methods [11]. By leveraging large datasets from experimental studies, ML algorithms can predict the performance of PBMs, optimize mix designs, and identify the most effective combinations of waste plastic and other industrial by-products [12]. For example, supervised learning models, such as regression and neural networks, have been used to predict compressive strength based on variables like plastic content, curing time, and cement type [13]. These models provide insights into the fac tors that most significantly impact performance, enabling engineers to design composites with improved strength and durability. Moreover, ML facilitates the exploration of sustainable alternatives by reducing the need for extensive and costly experimental trials. Through predictive modeling, researchers can simulate the behavior of PBMs under various conditions, such as different environmental exposures or loading scenarios, without the need for physical testing [14,15]. This capability is particularly valuable in the context of waste plastic, where variability in plastic type, size, and chemical composition introduces significant uncertainty. For instance, ML algorithms can account for the heterogeneity of recycled plastic, which may include polyethylene terephthalate (PET), high-density polyethylene (HDPE), or polypropylene (PP), each with distinct mechanical and chemical properties. In addition, the type of plastic waste plays a crucial role in determining the performance of PBMs [14]. For example, polyethylene terephthalate (PET) generally enhances durability but may reduce compressive strength due to its smooth surface texture, whereas high-density polyethylene (HDPE) often leads to lower stiffness because of its low bonding capacity with the cement matrix [16]. Polypropylene (PP), on the other hand, can improve toughness and crack resistance but may negatively influence workability. These differences highlight the need for tailored mix designs depending on the plastic type employed, which this study seeks to address [17]. By analyzing these variables, ML can guide the development of PBMs that balance environmental benefits with structural performance. Despite the advantages of ML, traditional approaches have certain limitations when ap plied to cementitious composites with waste plastic [18]. One major challenge is the reliance on high-quality, comprehensive datasets. Experimental data on PBMs are often limited, scattered, or inconsistent due to variations in testing conditions, material sources, and mix proportions [19]. This scarcity can lead to overfitting or poor generalization in ML models, reducing their predictive accuracy. Additionally, traditional ML models may struggle to capture the complex, non-linear interactions between the diverse components of PBMs, such as the interfacial bonding between plastic and cement or the effects of chemical additives [20]. These shortcomings have prompted researchers to explore hybrid ma chine learning approaches, which combine multiple algorithms or integrate ML with other computational techniques, such as finite element modeling or physics-based simulations [21]. Hybrid ML methods offer several advantages over traditional approaches. For example, ensemble methods, which combine predictions from multiple models (e.g., random forests, gradient boosting, and neural networks), can improve accuracy and robustness by leveraging the strengths of individual algorithms [22]. Similarly, integrating ML with domain-specific knowledge, such as material science principles or empirical equations, can enhance model interpretability and performance [23]. For instance, a hybrid model might use ML to predict the mechanical properties of PBMs while incorporating physical constraints, such as the maximum allowable plastic content to maintain structural integrity [7]. These approaches have shown promise in addressing the variability and complexity of waste plastic composites, enabling more reliable predictions and optimized designs [24].
While ML approaches represent a significant advancement, they are not without their challenges [25]. One general shortcoming is the computational complexity and resource intensity of these methods, which can be prohibitive for large-scale applications [26]. Additionally, the interpretability of models remains a concern, as complex algorithms like deep neural networks often function as “black boxes”, making it difficult to understand the underlying relationships between inputs and outputs [27]. This lack of transparency can hinder the adoption of ML-based solutions in the construction industry, where engineers prioritize reliability and traceability [28]. Furthermore, the generalizability of models across different types of waste plastic or environmental conditions requires further validation, as most existing studies focus on specific plastic types or laboratory-controlled settings [29]. These challenges underscore the need for continued research into the application of ML techniques for cementitious composites with waste plastic [30]. The significance of this research lies in its potential to bridge the gap between sustainability and performance in the construction sector [30,31]. By developing robust, interpretable, and scalable ML models, this study aims to optimize the use of waste plastic in PBMs, thereby reducing environmental impact while meeting the structural requirements of modern construction [32]. The research will focus on addressing the limitations of existing ML approaches, exploring novel methods, and validating their applicability across diverse plastic waste streams [33]. Ultimately, this work seeks to contribute to the development of sustainable construction materials that align with global efforts to combat plastic pollution and promote resource efficiency [34]. In summary, cementitious composites incorporating waste plastic offer a sustainable alternative for the construction industry, but their limited mechanical performance necessitates innovative solutions [35]. Machine learning, particularly approaches, provides a powerful framework for optimizing these materials, addressing their complexities, and overcoming the limitations of traditional methods [36]. However, challenges such as data scarcity, model interpretability, and computational demands highlight the need for further advancements [37].
Instead of previous studies that focused solely on predicting the performance of a single objective, this research adopted hybrid predictive modeling to provide comprehensive tools for predicting flexural strength, production cost, and CO2 emissions in PBMs to bridge the knowledge gaps. Approaches such as CNN-LSTM, XGBoost-PSO, SVM + K-Means, XGBoost + K-Means, and SVM-PSO were used to achieve this, with detailed explanations of their computational concepts. All hybrid models are based on a large-scale database compiled from peer-reviewed scientific publications to develop a unified framework for predicting flexural strength, production cost, and CO2 emissions in plastic-based mortar mixtures. The study used two types of statistical metrics—regression metrics such as adjusted R2, MSE, RMSE, MARE, and MAE, and classification metrics such as precision, recall, F1 score, and ROC AUC—to evaluate and compare the performance of all models. Out-of-Bag (OOB) error, stepwise sensitivity analysis (OAT), feature importance, and ICE plots with PDPs were used to evaluate the influence of input parameters on the prediction of the flexural strength model. The RA-PSO model was applied to predict compressive and tensile forces by estimating the actual values using empirical equations and then predicting them. Furthermore, machine learning can estimate carbon dioxide emissions and concrete production costs, contributing to the promotion of sustainable construction practices. A graphical user interface (GUI) was developed using Python (version 3.9.13) based on the model, highlighting the originality of this study.

2. Methodology

2.1. Experimental and Analysis Dataset

The dataset used in this study consists of 408 samples collected from multiple previously published studies (Table S5 [3]). These samples were selected to cover influential parameters of concrete performance, such as cement content, water-to-cement ratio, sand, and aggregate proportions. The dataset focuses on normal-strength concrete, excluding high- or low-strength mixes, and all flexural strength values were obtained under standardized curing and testing conditions (age, temperature, humidity, and equipment). While a minor bias may exist due to the focus on normal-strength concrete, the integration of data from independent experimental campaigns inherently provides an external validation component, as the model is trained and tested on results produced under different laboratories, materials, and procedures. The final dataset incorporates eight input variables: cement, plastic waste (PW), silica fume (SF), marble powder (MP), sand, water, superplasticizer (SP), and glass powder (GP). These materials were sourced as follows:
  • Cement (C): China National Building Material Group Corporation (CNBM), Beijing, China
  • Plastic Waste (PW): Veolia Huafei Plastic Recycling Plant, Anji, Zhejiang, China
  • Silica Fume (SF): Henan Superior Abrasives Import and Export Co., Ltd., Zhengzhou, Henan, China
  • Marble Powder (MP): Laiyang Guangshan Stone Processing Factory Co., Ltd., Laiyang, Shandong, China
  • Sand: Shijiazhuang Hanbang Minerals Co., Ltd., Shijiazhuang, Hebei, China
  • Water: Local Municipal Supply, Not Specified, China
  • Superplasticizer (SP): WOTAIchem, Shijiazhuang, Hebei, China
  • Glass Powder (GP): Jiangsu Shengtian New Materials Co., Ltd., Nanjing, Jiangsu, China
The Flexural strength, production cost, and CO2 emissions in PBMs were designated as the output variables. Table 1 summarizes the characteristics of the flexural strength dataset, thereby enhancing its interpretability. All data preprocessing, model training, and performance evaluation were conducted using Python (version 3.9.13).
Statistical analysis of the dataset was conducted on 408 concrete mixes to evaluate the properties of their components and their impact on flexural strength. The study found that the average sand concentration was 1045 kg/m3, with a low standard deviation of ±116.8, indicating a consistent distribution across samples. Conversely, the plastic waste (PW) content was more dispersed, averaging 194 kg/m3, but reaching a maximum of 1054 kg/m3. This reflects the presence of mixes containing unconventionally high proportions of this component, which may have been due to experimental designs or special applications in some samples [38]. Regarding active additives such as SF + MP, the average for each was approximately 42.6 kg/m3, while the median value (the range within which most of the data is concentrated) was much lower, indicating that these materials were used in small proportions in most samples, while some mixes contained unusually high proportions [39]. This result is supported by the high positive skewness values for both SF and MP, which indicate that there are few large values affecting the overall distribution [40]. Glass powder (GP), the data showed that the majority of mixes did not contain it, with the median being zero, indicating very limited use of this component in the studied group. Regarding the cement content, the average was 703.9 kg/m3, a relatively high figure reflecting the high binder content of these mixes. The standard deviation was 85.6, indicating acceptable variation in the proportions used. Water content showed a remarkable homogeneity in distribution, with the median, lower, and upper quartiles all reaching a similar value (231 kg/m3), indicating that most mixes contained a near-constant amount of water. However, some high outliers, up to 783.75 kg/m3, resulted in a significantly high skewness value (9.12), indicating the presence of atypical samples that could affect the overall analysis. Superplasticizers, on the other hand, had a mean of approximately 10.8 kg/m3, but their data were the most extreme, recording extremely high values for both skewness (20.03) and flatness (400.28), indicating that the majority of mixes used very low amounts, while only a few contained unusually high amounts. This large gap calls for caution when using this variable in prediction models, as it can bias the results [41]. The flexural strength of concrete ranged from 2.85 to 10.3 MPa, with a mean of 3.63 MPa and a low standard deviation, indicating mechanical homogeneity. However, the data showed a significant positive skew and high flatness, indicating the presence of a few mixes with very high strength, likely resulting from special designs or improvements in the proportions of active ingredients. Figure 1 shows box plot illustrating the effect of mortar components on flexural strength. Sand exhibited a clear strengthening effect, with higher sand contents corresponding to increased strength. Cement also showed the expected positive effect, with higher categories providing strengths above 4.0 MPa. Silica fume (SF) significantly enhanced strength, reaching some of the highest values among all mixes. In contrast, material powder (MP) and volcanic ash (GP) tended to reduce strength when used at higher levels. Water content demonstrated only a slight effect, while the superplasticizer showed variable behavior depending on its interaction with other constituents [31]. Overall, sand, cement, and SF were the most influential in improving flexural strength, while excessive MP and GP reduced performance [42]. Detailed numerical values corresponding to each component category are summarized in Table S1.
Figure S1 presents the linear regression relationships between flexural strength and individual material components of the mortar. The relationships for sand and silica fume (SF) showed weak positive trends, suggesting that both may contribute to modest improvements in mechanical performance [43]. In contrast, marble powder (MP) and glass powder (GP) exhibited weak negative correlations, indicating minimal or even adverse effects on strength [44]. Cement showed an unexpected inverse trend, which may be influenced by interactions with w/c ratio or curing conditions rather than cement content alone. Water content demonstrated the most notable positive correlation, while the superplasticizer exhibited irregular behavior, likely due to data variability or outliers. Detailed numerical values and regression coefficients are provided in Table S2. Figure S2 shows kernel density estimation (KDE) plots of the distribution of concrete mix components and flexural strength. Sand and cement exhibited near-normal distributions, with values concentrated within relatively narrow high-value ranges, suggesting standardized mix design practices [45]. PW and additives such as MP, GP, and SF showed highly skewed distributions, concentrated near zero, indicating that they were used in small amounts and only in limited mixes. Water and the superplasticizer demonstrated very steep distributions centered on specific values, reflecting consistent application across most samples [46]. Flexural strength was mainly distributed between moderate values, with only a few cases achieving higher performance, highlighting the potential for optimization. Detailed distribution ranges are summarized in Table S3.

2.2. Data Preprocessing

The dataset was curated to include only concrete mixtures with complete records for the primary mix constituents: Sand (kg/m3), Plastic Waste (kg/m3), Silica Fume (kg/m3), Marble Powder (kg/m3), Glass Powder (kg/m3), Cement (kg/m3), Water (kg/m3), and Superplasticizer (kg/m3). Mixtures lacking values for any of these components were excluded. Extreme or unrealistic compositions, such as cement contents exceeding practical ranges (>800 kg/m3) or water contents significantly deviating from typical practice (>750 kg/m3), were also excluded to ensure data reliability. Additionally, only mixtures with well-documented proportions and consistent unit systems were retained. Data preprocessing is critical to model performance after data collection and characterization [47]. This phase includes outlier detection, data encoding, feature scaling, feature engineering, and training and test set separation [48]. Outliers are often found using the Interquartile Range (IQR) method, especially in non-normal data [49]. The quartile analysis finds figures outside the conventional data range. Sort the dataset before using IQR. Q1 and Q3 are 25th and 75th percentiles [50]. IQR is their difference.
The interquartile range measures the spread of the middle 50% of a dataset by finding the difference between the third and first quartiles. This range serves as a basis for identifying potential outliers. To determine whether a data point is considered an outlier, two thresholds are established: a lower bound and an upper bound. The lower threshold is set below the first quartile by a margin proportional to the interquartile range, while the upper threshold extends above the third quartile by the same margin. Any values falling outside these two boundaries are classified as outliers.
Any value outside this range is considered an outlier. This method is simple, distribution-independent, and effective for improving the quality of data analysis.
Figure 2 shows that the number of samples decreased after the outlier removal process. Before processing, the number of samples was 408, while after applying the outlier removal algorithm, it decreased to approximately 406. This small difference indicates that only a limited number of data were considered abnormal or extreme, reflecting the quality of the original data and its low variability. To evaluate the suggested models fairly, the dataset was split into two sets. The model was trained with 80% of the data and tested with 20% [51]. Machine learning often splits data to let the model learn patterns from training data and then test its generalization using new data. This method reduces overfitting and ensures that the model can perform well with new data as well as training data. It improves results dependability and gives precise indicators of model performance in real-world circumstances.

2.3. Data-Driven Hyperparameter Optimization via K-Fold Splits

ML model performance depends on hyperparameter adjustment, which controls model complexity and reduces overfitting [52]. In this study, several models, including CNN LSTM, XGBoost PSO, SVM integrated with K Means, XGBoost combined with K Means, and SVM optimized by PSO, were fine-tuned using the 5-fold cross-validation technique to improve generalization capability and mitigate overfitting. Five equal folds were then created from the training subset. Each iteration trained the model using four folds and validated with the remaining fold. The method was performed five times to validate each fold once. Model predicted error was calculated from the average validation loss across five iterations [53]. This approach allowed for a balanced assessment of model performance while preventing both underfitting and overfitting during training. The multi-fold validation also enhanced the robustness of hyperparameter tuning by exposing the model to different data subsets in each round. Furthermore, before training, feature values were normalized using the Min Max scaling method [54]. This normalization process scaled the input features to the range from 0 to 1, improving training stability and convergence behavior of the machine learning models. Normalization also prevented features with different units or scales from unduly affecting the model [55]. Figure 3 shows the feature normalization requirements, the most suitable methods for machine learning models, and runed key parameters of all models. Hyperparameter selection for all models was guided through a validation strategy (5-fold cross-validation), ensuring robust performance estimation and avoiding overfitting. For optimization-based models, particle swarm optimization (PSO) and genetic algorithm (GA) were implemented with a population size of 30 and 100 iterations, providing the sufficient exploration of the parameter search space and guaranteeing fairness in the comparison.

3. Description of ML Models

CNN LSTM blends convolutional neural networks’ spatial feature collecting with LSTM units’ temporal sequence modelling. A 1000-vocabulary embedding layer creates 10-sized output vectors and receives 5-sized inputs [56]. Following that, a one-dimensional convolutional layer with 128 filters and a kernel size of 2 retrieves local patterns from the input sequence [57]. ReLU activation functions improve training convergence over sigmoid functions [58]. A max-pooling layer with a pooling size of 2 decreases dimensionality and retains important information after convolution [59]. A 100-memory-unit LSTM layer efficiently manages feature map sequential dependencies in small datasets [60]. LSTM output becomes final forecasts with fully connected dense layers. The Adam optimiser trains the model using MAE loss metric for 200 epochs [61]. SVMs are preprocessed using K-Means clustering to better capture complex cementitious material system interactions in this hybrid method [62]. SVM is adept at handling high-dimensional, nonlinear relationships by identifying optimal separating hyperplanes [63], making it suitable for applications involving heterogeneous materials like concrete. By grouping samples with similar characteristics such as porosity, mix ratios, and admixture levels—K-Means introduces structural segmentation into the dataset [64]. These clusters can either be used to train specialized SVMs per group or serve as categorical features that enrich the input representation [64,65]. This combined approach enables SVM to adapt more precisely to localized data patterns. The synergy between SVM’s classification strength and K-Means’ pattern detection enhances model adaptability and interpretability [66].
The SVM PSO approach fuses the classification power of Support Vector Machines with the parameter search capabilities of Particle Swarm Optimization [67]. In this model, PSO automates the selection of critical SVM hyperparameters (C, gamma, and epsilon) by simulating the social learning behavior of particles in a swarm [68]. This optimization mechanism helps achieve better regression performance by reducing manual intervention and enhancing generalization [69]. The use of kernel functions enables the model to learn nonlinear relationships effectively, even with limited data. However, this approach introduces computational overhead due to the iterative nature of PSO [70]. Additionally, model interpretability may be compromised, as the decision boundaries are influenced by transformed high-dimensional feature spaces [71]. XGBoost PSO combines the decision-tree-based gradient boosting framework of XGBoost with the adaptive global search capabilities of PSO [72]. XGBoost leverages an ensemble of trees to learn from structured datasets, capturing both linear and nonlinear relationships with high predictive accuracy [73]. However, its effectiveness is tightly linked to well-tuned hyperparameters such as learning rate, max depth, and number of estimators [74]. To automate this tuning process, PSO explores the hyperparameter space by adjusting each particle’s configuration based on personal and collective best performance. This self-organizing optimization enhances model accuracy while minimizing the need for exhaustive manual tuning procedures like grid search [75]. XGBoost PSO is particularly effective for high-dimensional problems due to its built-in regularization mechanisms, feature importance capabilities, and resilience to multicollinearity [76]. Nonetheless, the model may demand substantial computational resources, and the interpretability of results may be reduced when dealing with large ensembles [77]. The integration of Extreme Gradient Boosting (XGBoost) with K-Means clustering represents a powerful hybrid framework that combines the strengths of both supervised and unsupervised learning techniques [78]. XGBoost is appropriate for complex regression problems with nonlinear and high-dimensional feature interactions due to its accuracy and overfitting resilience [79]. Unsupervised K-Means groups data by feature similarity to uncover structures that supervised learning may miss [80]. Applying K-Means to water-to-cement ratio, lithium carbonate concentration, porosity, and material density reveals natural groups associated to hydration mechanisms, mixture formulations, and curing dynamics. XGBoost has many uses for these data clusters. Cluster IDs can be used to train models inside each cluster to focus on local behaviours or broaden input space as categorical characteristics [81].
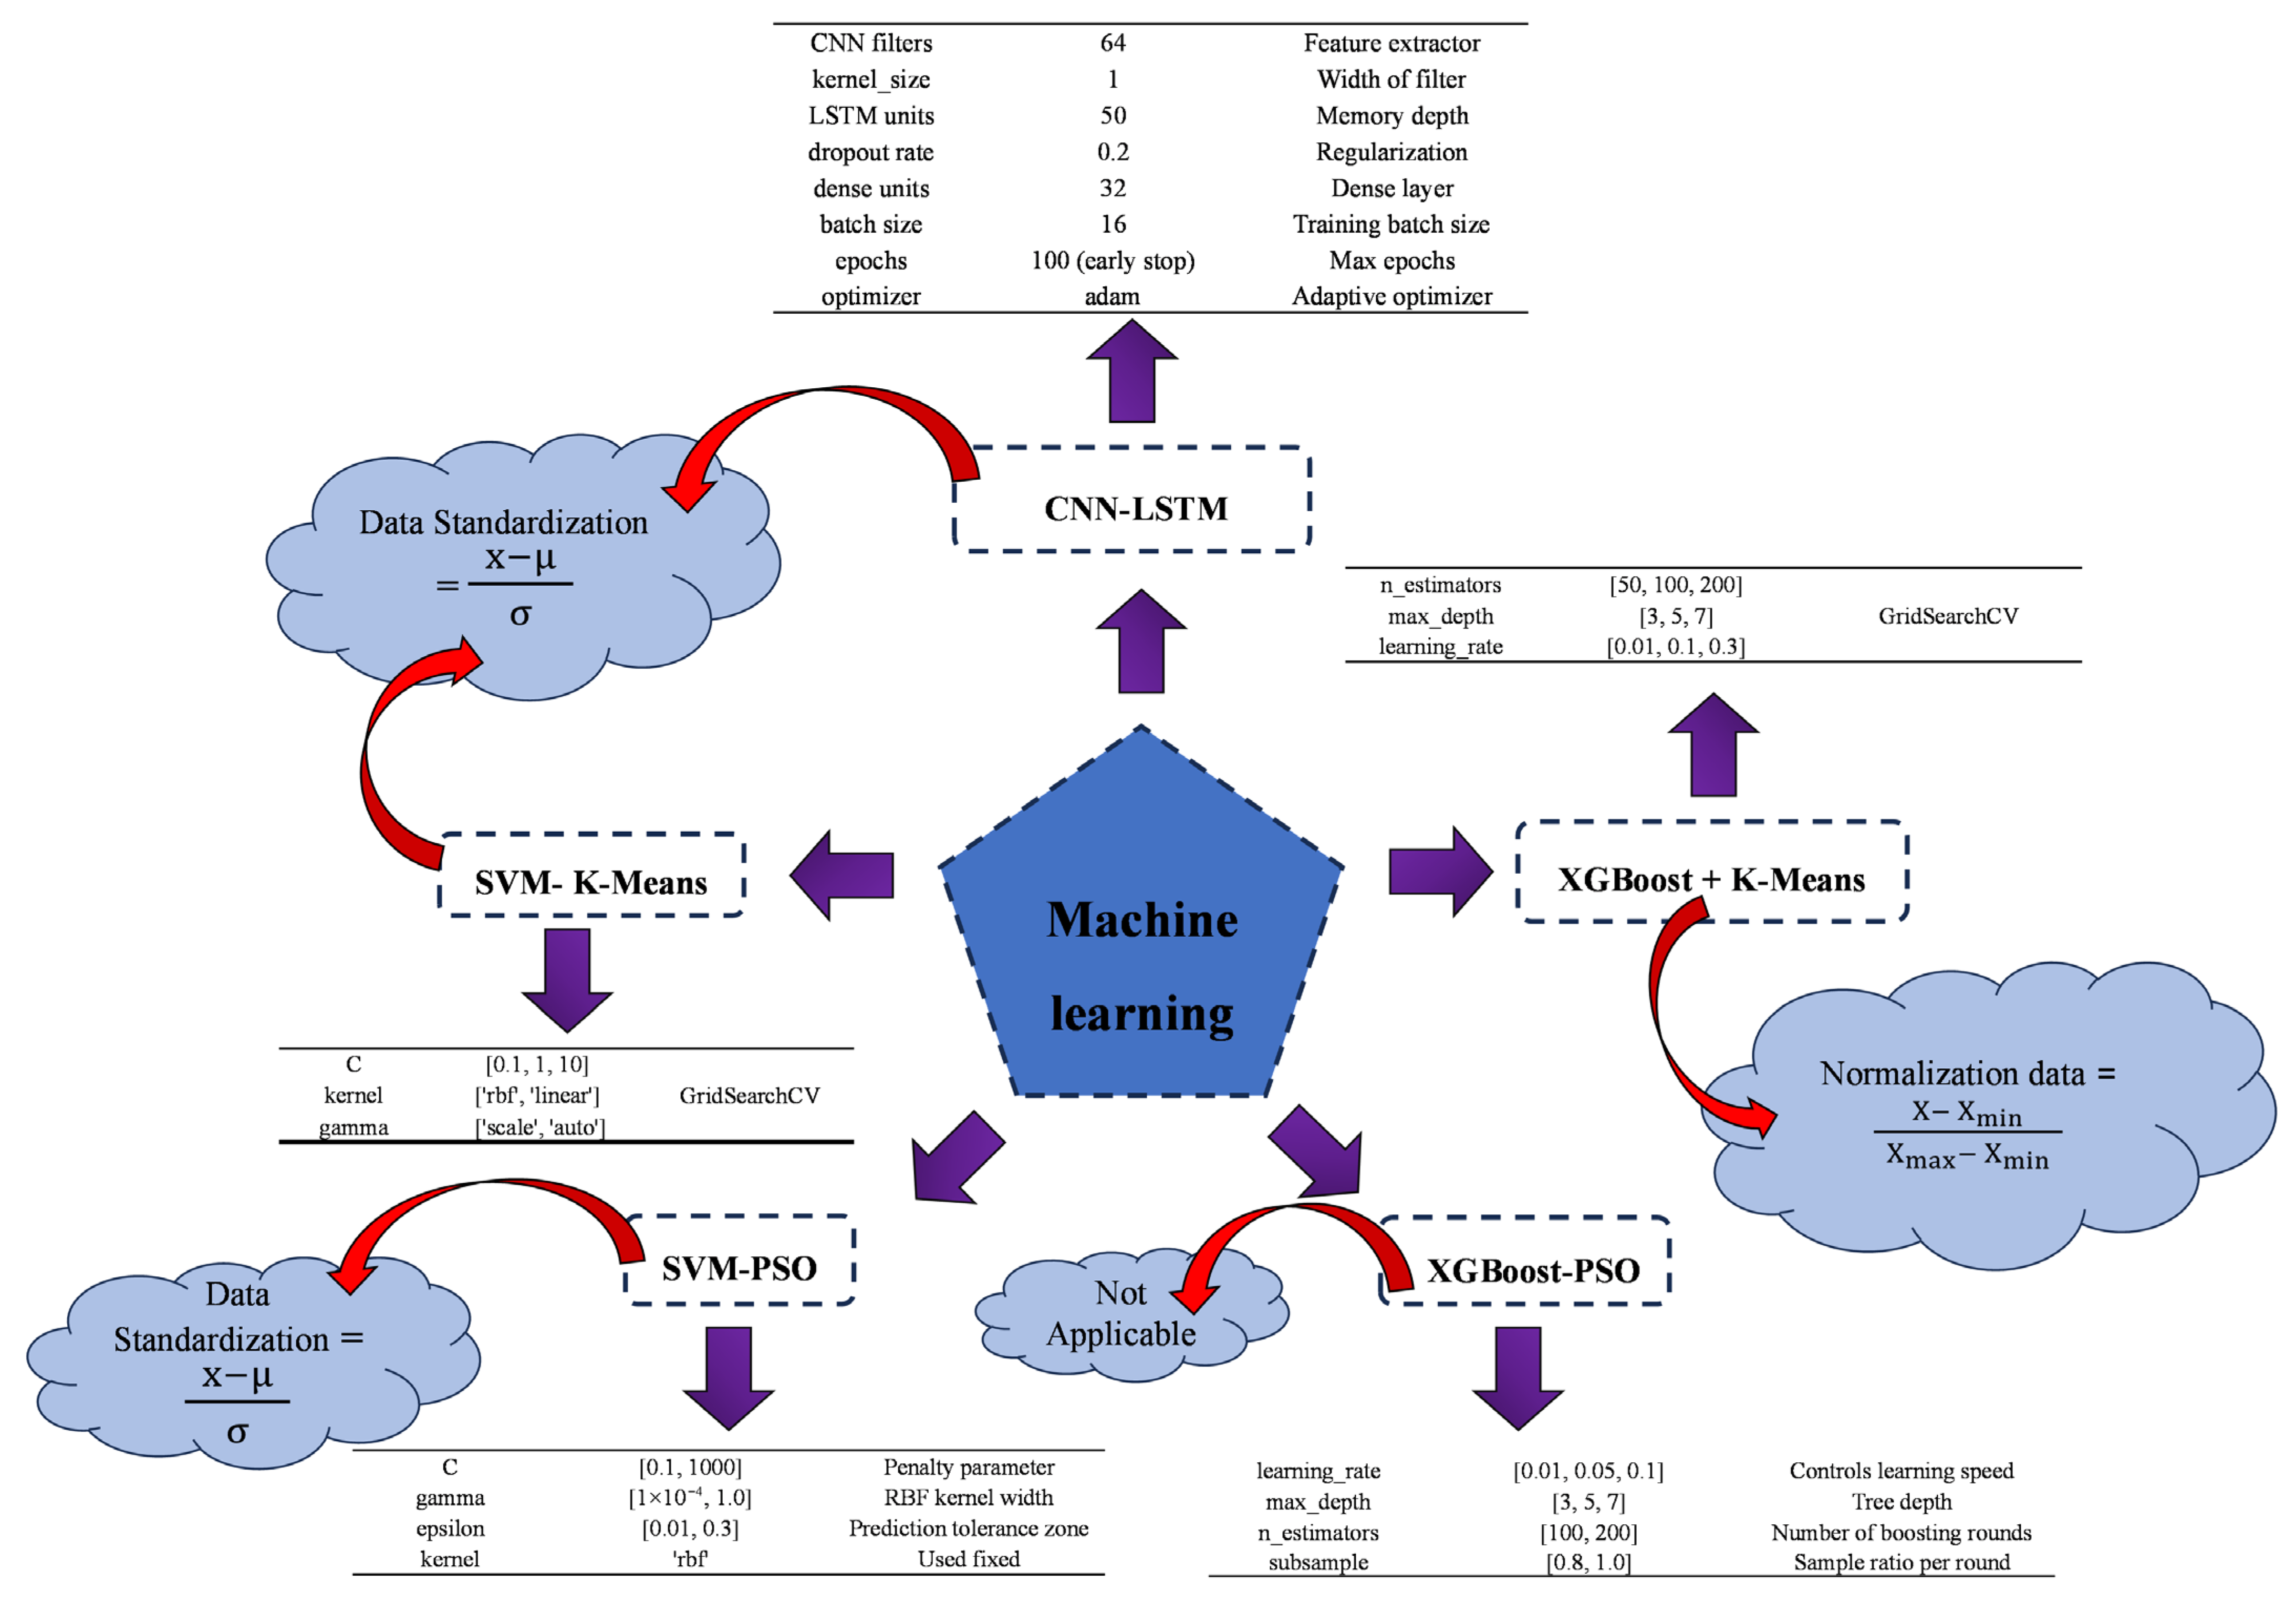
Overall, the XGBoost + K-Means model provides a robust tool for modeling advanced cement-based materials, supporting more precise design strategies and reliable forecasting of performance under varying compositional and environmental conditions. The Randomized Adaptive Particle Swarm Optimization (RA-PSO) technique improves convergence and prevents stagnation by combining adaptive control and randomization [82]. This technique adjusts particle placements based on personal and global best experiences and dynamic and stochastic updates to sustain swarm variety [83]. This randomization helps the algorithm avoid local minima. This paper trains an ANN by globally optimizing weights and biases with RA-PSO [82]. A particle represents an ANN configuration, and the fitness function measures the network’s prediction error. RA-PSO excels at complex, nonlinear regression applications where gradient-based learning fails [84]. Exploration and exploitation are balanced by the adaptive process, boosting learning stability and convergence reliability. The model’s repetitive evaluations over a huge population require a lot of processing power [85]. RA-PSO enhances prediction accuracy but does not provide feature influence interpretability. Figure 4 shows the architecture of CNN-LSTM, XGBoost-PSO, SVM + K-Means, XGBoost + K-Means, RA-PSO and SVM-PSO.

Model Evaluation Indicators

In addition to conventional regression metrics (MAE, MSE, RMSE, MARE), classification metrics (Precision, Recall, F1, ROC-AUC) were intentionally employed after discretizing the continuous outputs into performance categories using domain-specific thresholds. This dual evaluation strategy was adopted for two main reasons: (i) to reflect the practical decision-making context, where mixtures must be judged as “acceptable” or “unacceptable” rather than only by exact numerical accuracy, and (ii) to ensure that the model not only predicts values close to the ground truth but also reliably distinguishes between critical performance classes [52]. While regression metrics capture overall numerical fidelity, classification metrics highlight the robustness of the model in identifying edge cases and critical categories that are most relevant in engineering practice [78]. Such hybrid evaluation frameworks have also been reported in prior studies, and therefore our approach aims to provide both numerical accuracy and practical relevance. Table 2 lists seven indicators for evaluating proposed ML model prediction performance [86,87].

4. Results

4.1. Accuracy and k Fold Cross-Validation

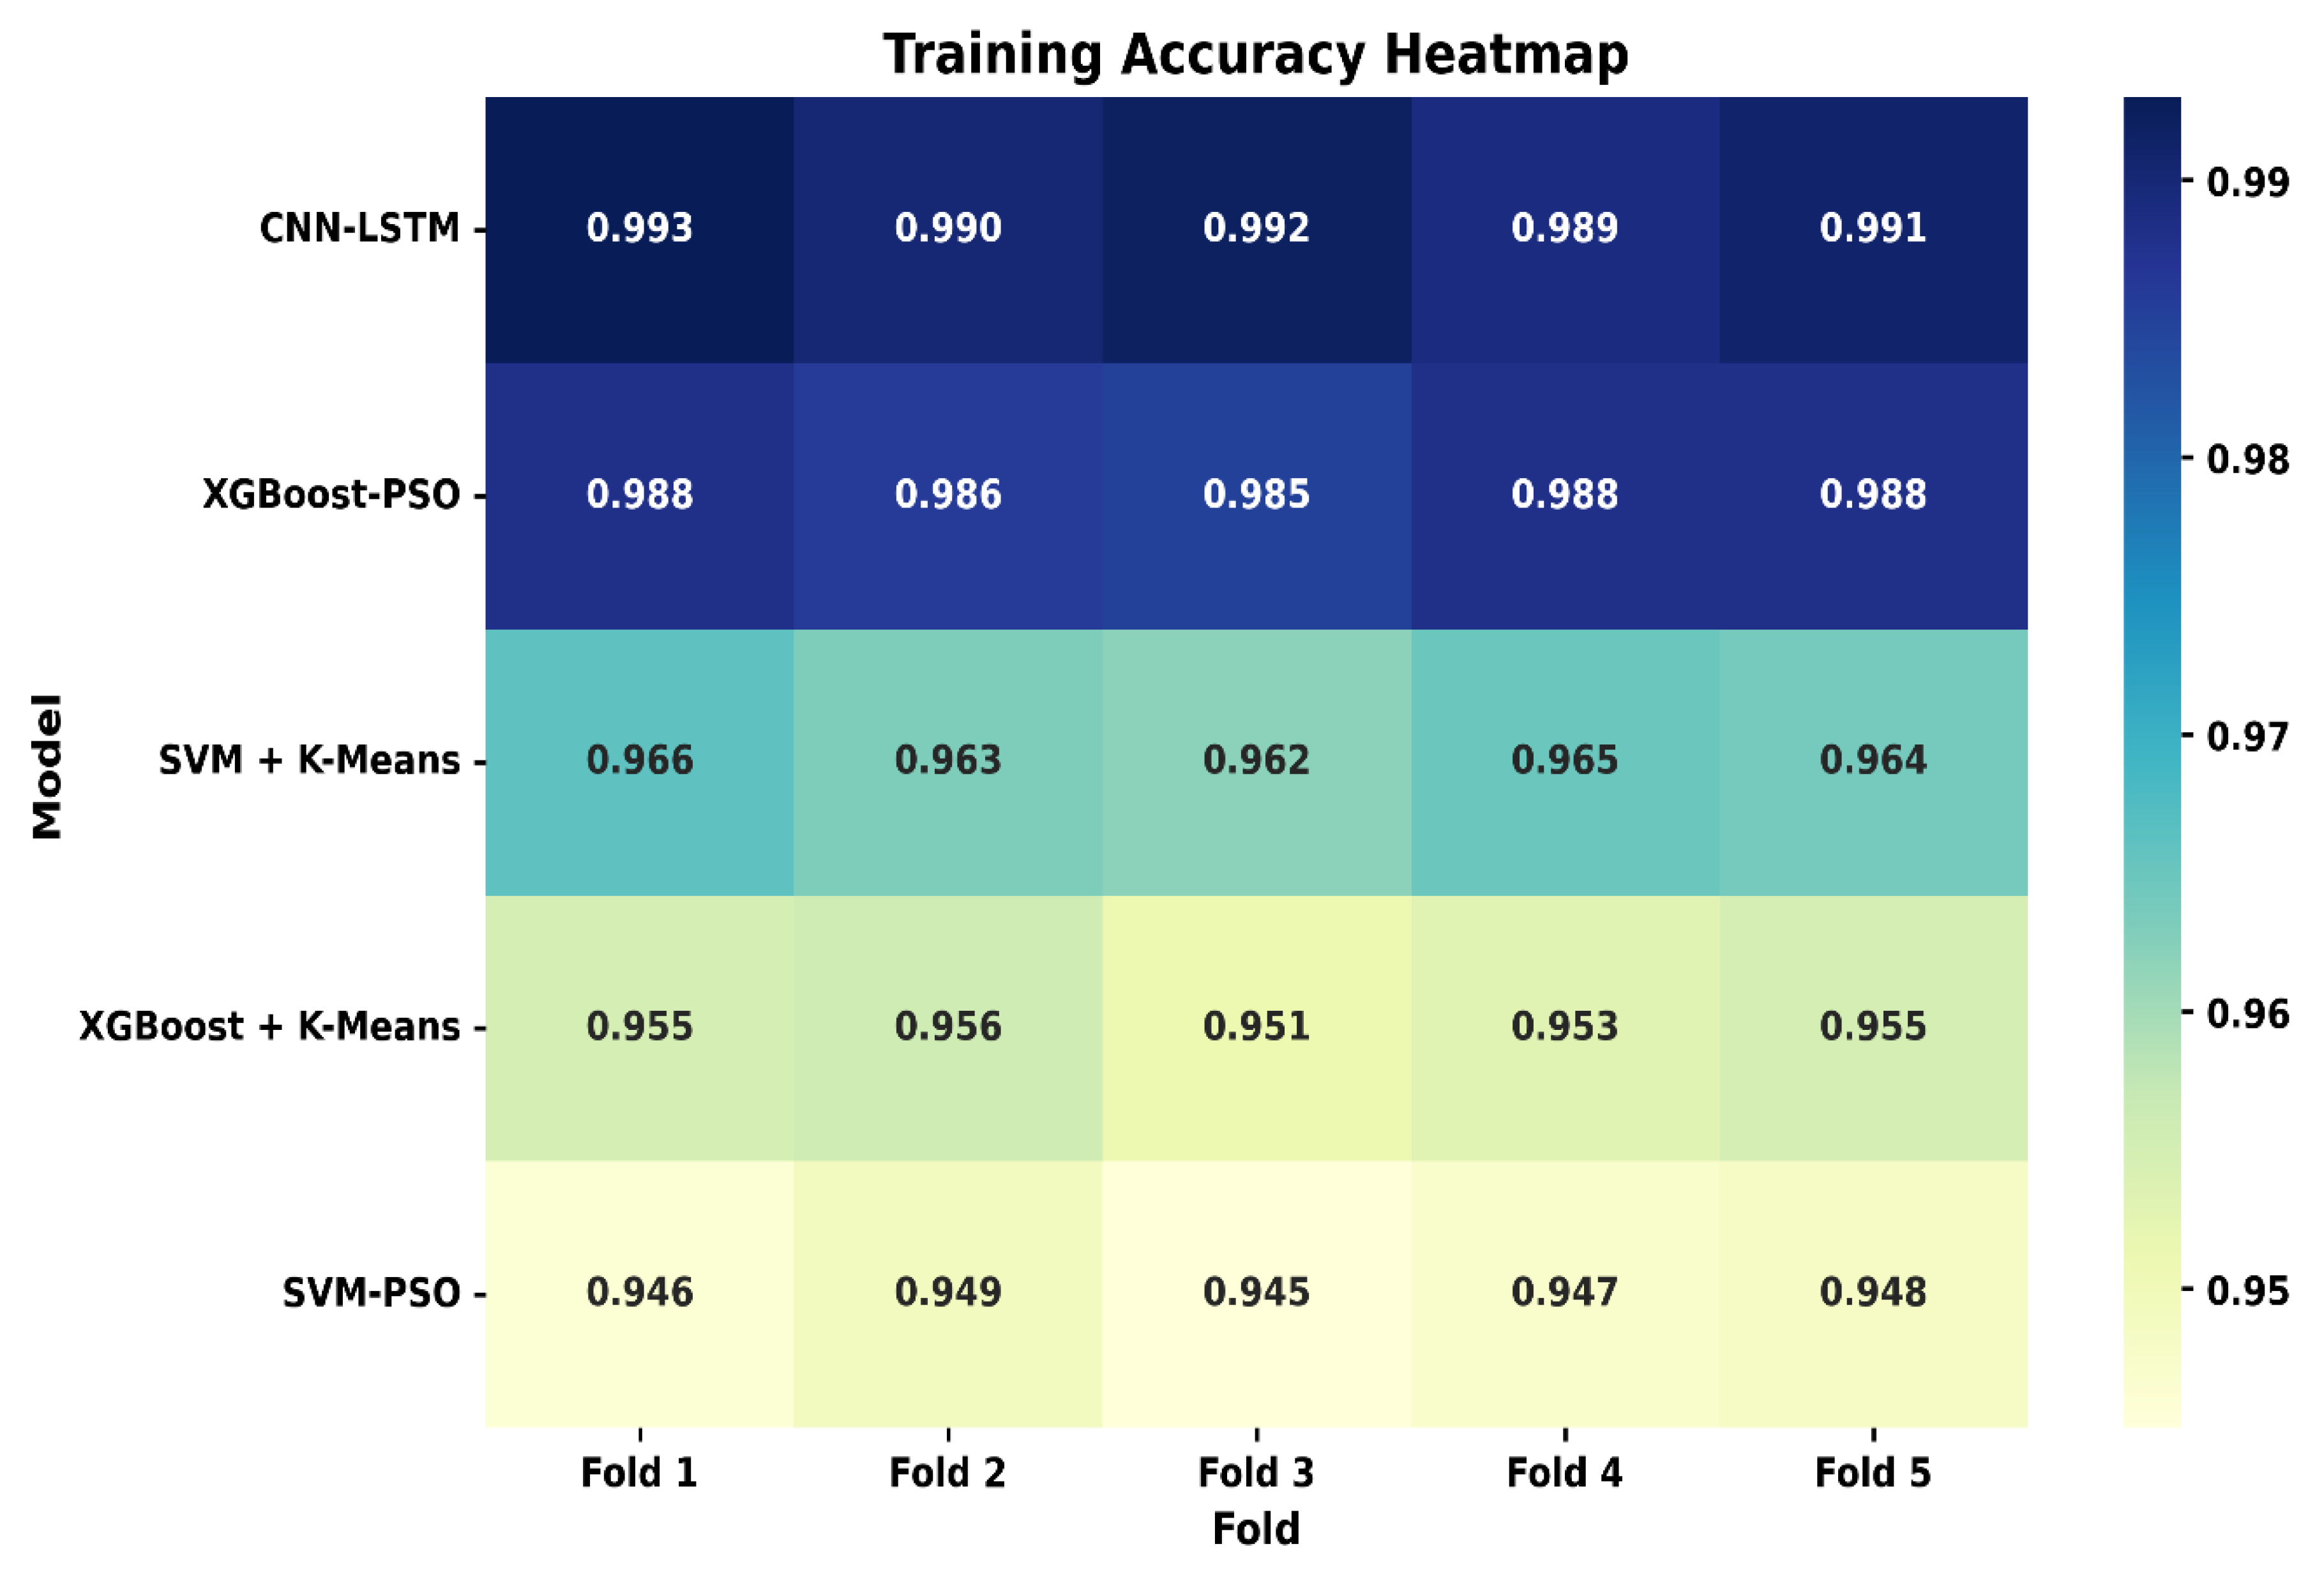
Five algorithms’ training accuracy across five folds is shown in Figure 5. Among them, the CNN-LSTM model achieved the best performance, with an average training accuracy of 0.991 and an average testing accuracy of 0.975, peaking at 0.977. These results confirm its superiority in both accuracy and stability across folds. XGBoost-PSO ranked second, with high consistency and average accuracies of 0.987 in training and 0.965 in testing, reflecting robust and balanced behavior. Figure 6 illustrates the test accuracy trends of the five evaluated models. The SVM + K-Means model followed, demonstrating stable performance with averages of 0.964 (training) and 0.958 (testing). XGBoost + K-Means exhibited moderate accuracy, with averages of 0.954 in training and 0.931 in testing, showing sensitivity to data variations. Finally, the SVM-PSO model recorded the lowest accuracies, with 0.947 and 0.918 for training and testing, respectively [88]. Overall, CNN-LSTM clearly outperformed all other models in terms of both accuracy and stability, making it the most reliable choice for predictive learning. Detailed fold-by-fold accuracy values for all models are provided in the Table S4.
Refer to Figure 7 for the average R2 values for five machine learning models throughout training and testing. The dotted line shows the ideal relationship with identical R2 values for training and testing. The table offers model performance data, including mean, standard deviation, and median R2 [89]. The CNN-LSTM model exhibits excellent agreement with R2 values of 0.991 for training and 0.975 for testing. Additionally, the XGBoost-PSO model is highly stable, with an average R2 of 0.987 for training and 0.965 for testing, and a low standard deviation of 0.001. The SVM + K-Means model performs well with low variation, reaching an average R2 of 0.964 for training and 0.958 for testing [90]. However, the XGBoost + K-Means model has a low average R2 of 0.954 for training and 0.931 for testing, indicating overtraining. The SVM-PSO model ranks last with an average R2 of 0.947 for training and 0.918 for testing, with a little difference. The CNN-LSTM model is more accurate and stable on the graph than the other models, which need to develop to close the training-testing gap [91].

4.2. Training vs. Testing Performance of Hybrid ML Models

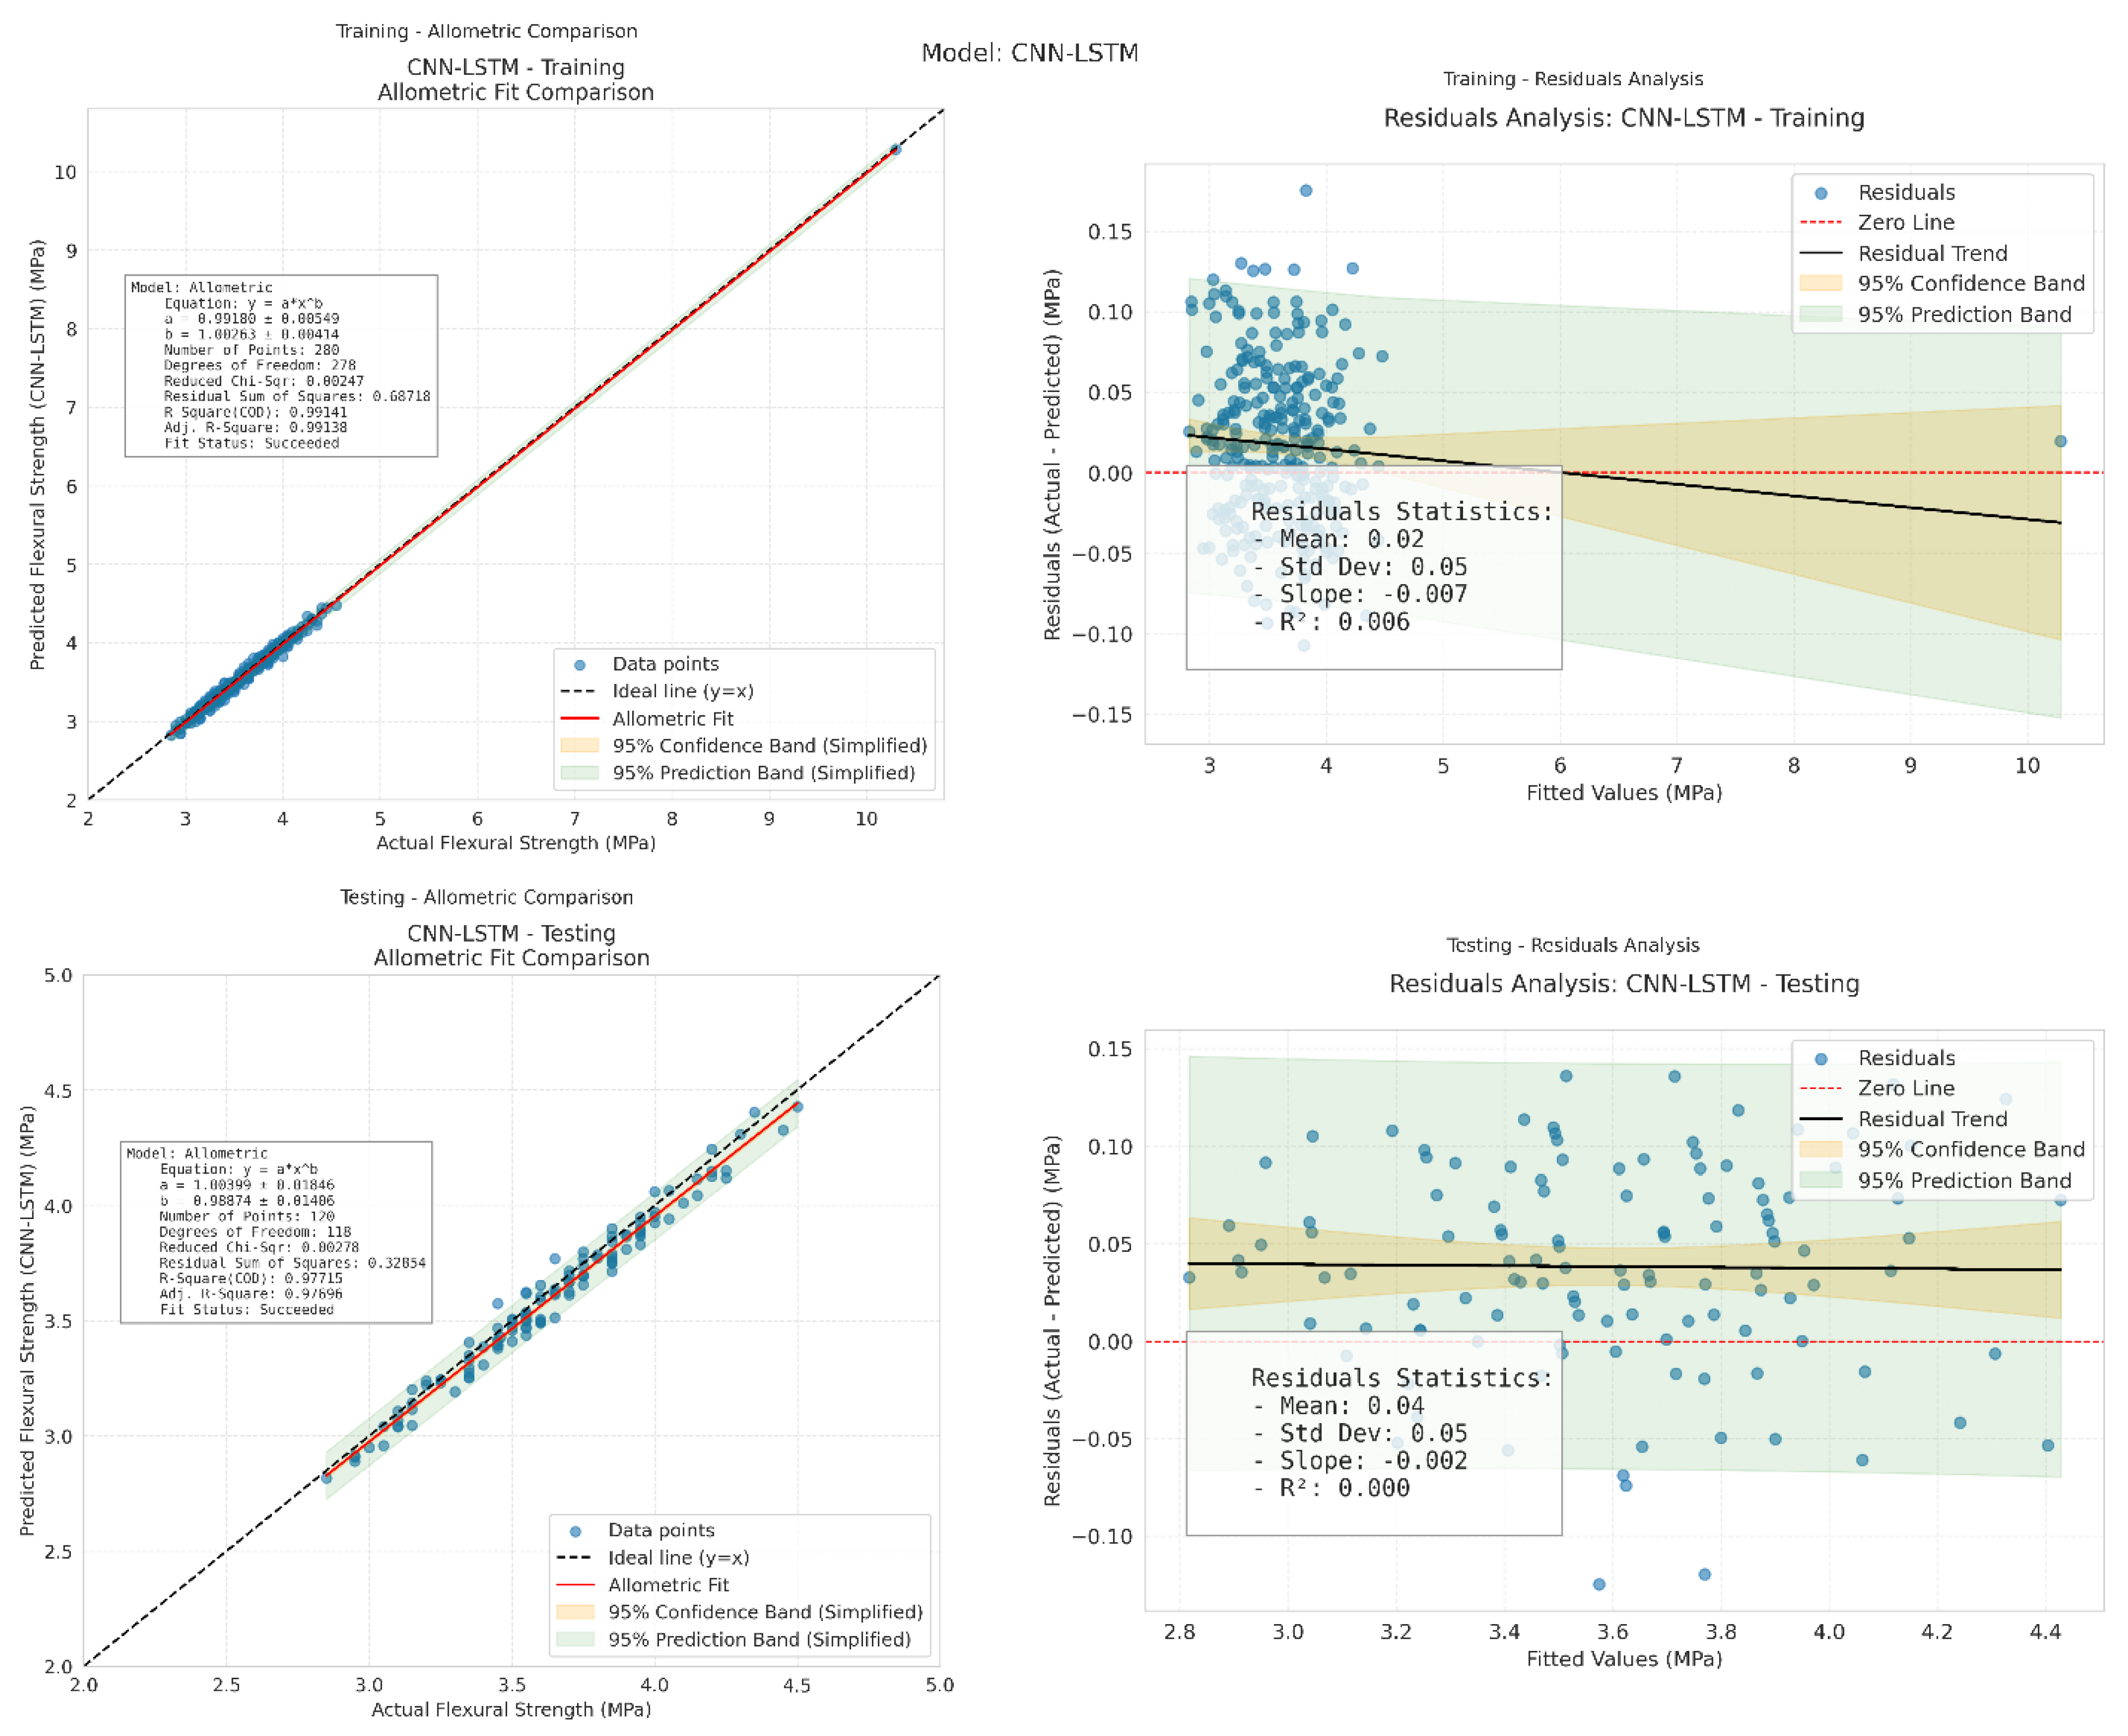
CNN-LSTM accurately predicted flexural strength in training and testing as shown in Figure 8. addition to conventional performance metrics (R2, MAE, RMSE), an uncertainty analysis was performed. This included cross-validation and residual diagnostics, as well as the construction of 95% confidence and prediction intervals for model outputs (Figure 8). These analyses confirm that errors are unbiased and randomly distributed, while providing quantitative bounds on prediction reliability. R2 = 0.9914 indicating the model explained 99.14% of the variation during training. A near match to the ideal line is the allometric fit equation, y = 0.9710 · x1.0142. A low sum of squared residuals of 0.687 implies good agreement between actual and predicted values [25]. In this phase, residual analysis showed stable performance with a mean of 0.02 and a standard deviation of 0.05, a slight slope of −0.007, and a value of R2 = 0.006, indicating a random residual distribution around the zero line, improving model reliability and unbiasedness during training [92]. The model’s coefficient of determination was 0.9766, suggesting its ability to generalize to new data. The allometric equation for this phase, y = 1.0891 · x0.8146, is close to the ideal line with little deviation [28]. The residual sum of squares was 0.328, below the training average, demonstrating prediction accuracy. Residual analysis showed no significant dispersion with a mean of 0.04 and a standard deviation of 0.05. The residuals’ trend line slope was −0.002 and their coefficient of determination was practically zero, demonstrating random and unbiased errors [29]. CNN-LSTM model forecasts engineering material flexural strength accurately and reliably without confusion or overlearning.
Figure S3 shows four graphs of the SVM with K-Means model’s flexural strength prediction. The Training–Allometric Comparison plot shows a weak correlation between actual and anticipated strength, with an allometric equation (y = a * x^b) and R2 of 0.0623, indicating low agreement [93]. In the second figure (Training–Residuals Analysis), residual distribution around the zero line has a mean of 0.11 and an STD of 0.026, indicating minimal variance. In the last plot (Testing–Allometric Comparison), test data shows lower accuracy with a comparable equation and R2 of 0.0063. The fourth figure (Testing–Residuals Analysis) shows a mean residual of 0.02 and a standard deviation of 0.017, with a R2 of 0.006, showing near-zero residuals with moderate the model matches data moderately, better in training than testing [94]. Figure S4 features four graphs evaluating the effectiveness of an SVM-PSO model in forecasting flexural strength. The initial graph (Training–Allometric Comparison) illustrates the correlation between actual and predicted strength using an allometric equation (y = a * x^b), with an R2 of 0.0485, suggesting a modest fit. The second graph (Training–Residuals Analysis) reveals the spread of residuals around the zero line, with a mean of 0.23, a standard deviation of 0.041, and an R2 of 0.031, indicating some variability. The third graph (Testing–Allometric Comparison) displays test data with a similar equation and an R2 of 0.0104, pointing to reduced precision [95]. The final graph (Testing–Residuals Analysis) shows a mean residual of 0.31, a standard deviation of 0.070, and an R2 of 0.054, highlighting residuals with notable dispersion [33]. In general, the model demonstrates a reasonable alignment with the data, performing more effectively during training than testing. Figure S5 showcases four charts that evaluate how well an XGBoost with K-Means model predicts flexural strength. The opening chart (Training–Allometric Comparison) maps the link between actual and forecasted strength via an allometric equation (y = a * x^b), boasting an R2 of 0.0587, which hints at a fair degree of alignment. The next chart (Training–Residuals Analysis) tracks the scatter of residuals around the zero line, recording a mean of 0.24, a standard deviation of 0.011, and an R2 of 0.000, suggesting very little spread [96]. The third chart (Testing–Allometric Comparison) presents test data with a matching equation and an R2 of 0.9435, signaling a strong fit. The final chart (Testing–Residuals Analysis) notes a mean residual of 0.43, a standard deviation of 0.008, and an R2 of 0.000, indicating residuals with minimal variation. An in-depth analysis was conducted for the underperforming model, XGBoost + K-Means. Its relatively poor performance may be attributed to several factors, including the inappropriate clustering of input features by K-Means, which could have introduced noise or irrelevant groupings, and potential overfitting of XGBoost on certain feature clusters [96]. Additionally, the model might be sensitive to the distribution of the training data, leading to reduced generalization on the test set [91]. Figure S6 includes four charts that assess the performance of an XGBoost with PSO model in predicting flexural strength. The first chart (Training–Allometric Comparison) illustrates the connection between actual and predicted strength using an allometric equation (y = a * x^b), with an R2 of 0.0871, suggesting a reasonable fit [97]. The second chart (Training–Residuals Analysis) shows the residuals distributed around the zero line, with a mean of −0.18, a standard deviation of 0.006, and an R2 of 0.000, indicating minimal variation. The third chart (Testing–Allometric Comparison) displays test data with a similar equation and an R2 of 0.0680, reflecting a decent alignment. The fourth chart (Testing–Residuals Analysis) presents a mean residual of 0.02, a standard deviation of 0.008, and an R2 of 0.002, showing residuals with slight scatter. Overall, the model demonstrates a solid performance, with consistent results across both training and testing phases [97].

4.3. Statistical Analysis

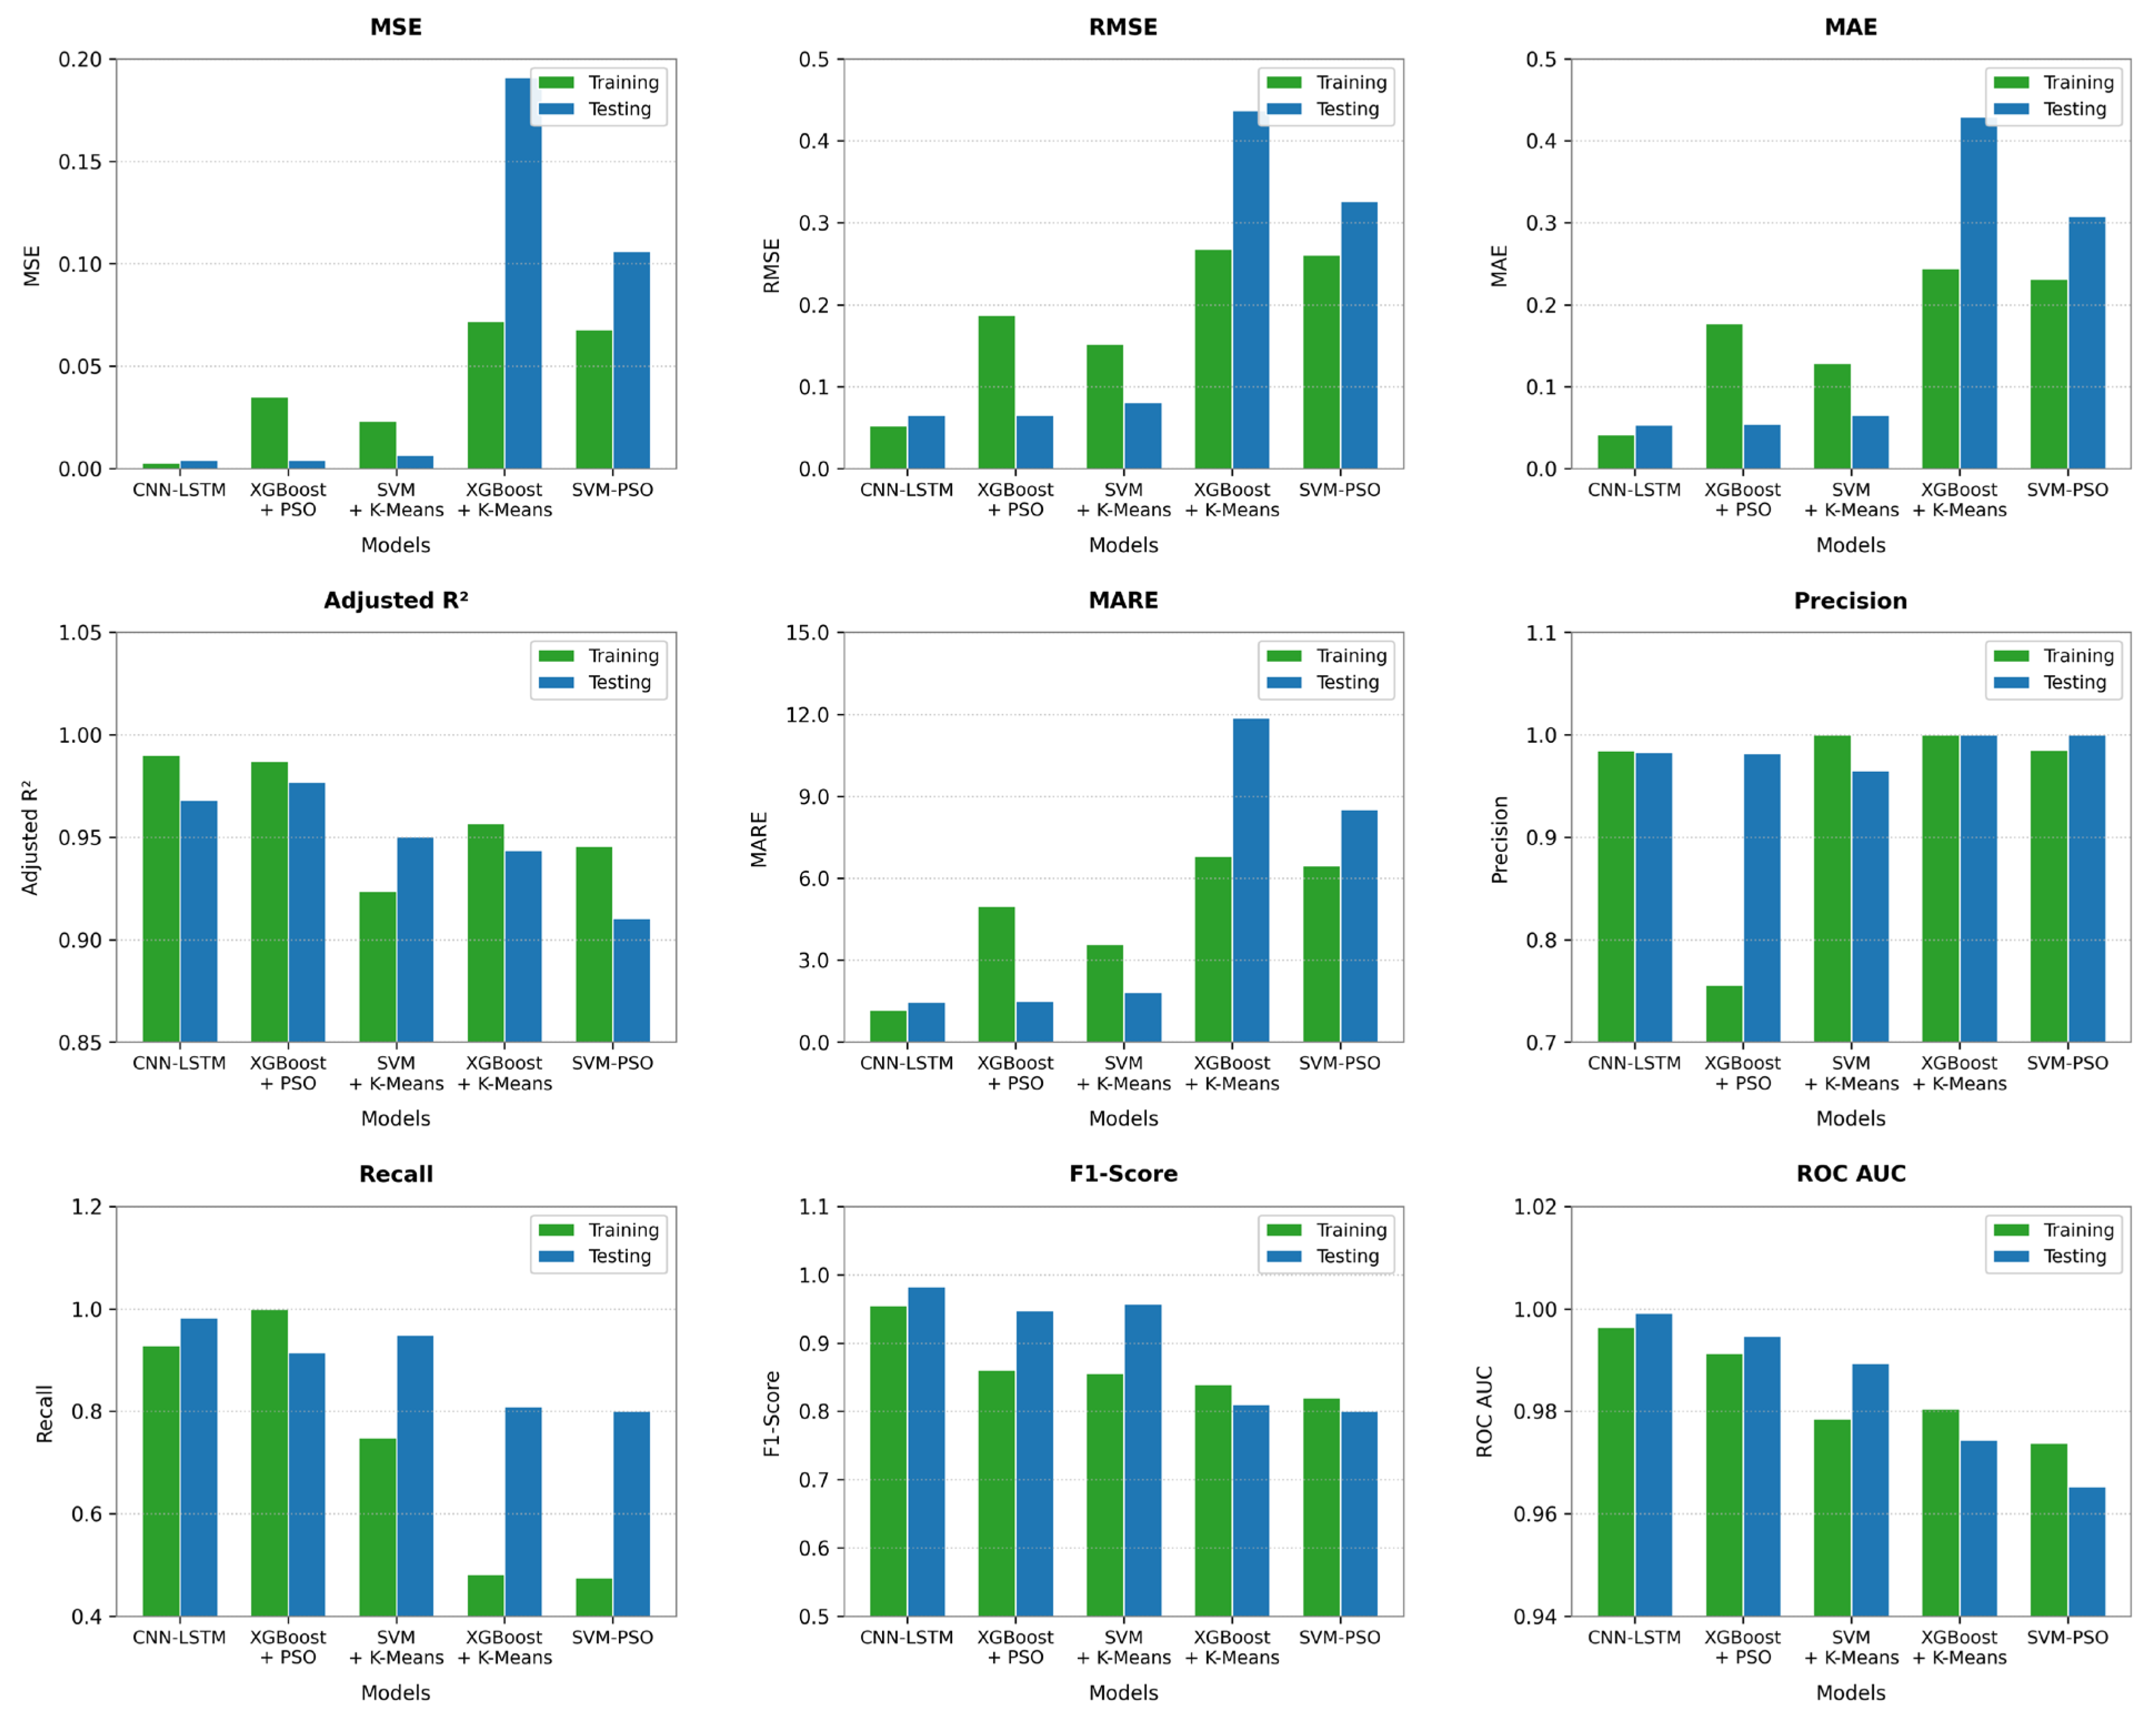
Figure 9 shows the statistical performance analysis of predictive models for Flexural strength forecasting of PBMs. For training phase, the CNN-LSTM model emerges as the best model overall, with the lowest error metrics (MSE = 0.0027, RMSE = 0.052, MAE = 0.041), indicating high predictive accuracy. It also has the highest coefficient of determination (R2 = 0.990), demonstrating its ability to explain 99% of the variance in the data [39]. On classification metrics, the model achieves an excellent balance between accuracy and coverage (F1-Score = 0.956) and near-perfect discrimination between classes (ROC AUC = 0.996). The XGBoost + PSO model ranks second, with error metrics (MSE = 0.035, RMSE = 0.187) showing acceptable performance, albeit lower than the optimal model. This model has perfect recall (Recall = 1.0) but at the cost of lower precision (Precision = 0.755), causing a poorly balanced classification performance (F1-Score = 0.861). The SVM + K-Means model exhibits average performance, with an improved MSE (0.023) compared to the XGBoost + PSO model, but suffers from poor recall (Recall = 0.748) despite achieving perfect accuracy (Precision = 1.0). The F1-Score (0.856) reflects this imbalance between precision and recall. The XGBoost + K-Means model exhibits poor performance, with an MSE of 0.071 and a significantly lower recall (Recall = 0.482), causing a poorly balanced classification performance (F1-Score = 0.82) despite achieving perfect accuracy [45,98]. The SVM-PSO model performs the worst among the models, with an MSE of 0.067 and a recall of 0.475, causing overall poor classification performance (F1-Score = 0.81) despite achieving high accuracy (Precision = 0.985). For testing phase, the CNN-LSTM model is the undisputed winner, with numbers demonstrating its overwhelming superiority in almost every aspect [39]. The MSE of 0.00425 significantly outperforms other models, reaching 44.9 times lower than the worst-case performance. Its predictive accuracy is also evident in the RMSE of 0.0652, which is six and a half times lower than the worst-case performance. In terms of classification efficiency, the model achieves impressive results, achieving an F1-Score of 0.983, 24.4% higher than the lowest score recorded by other models [93]. The ROC AUC value is 0.999, demonstrating near-perfect class discrimination, outperforming the weakest model by 3.5%. In contrast, XGBoost + PSO appears to be a strong, albeit less effective, competitor, with an MSE that is only 0.21% higher than the optimal model, but suffers from a 6.9% decrease in recall. Despite this, it boasts a training speed that is 3–5 times faster than CNN-LSTM, with slightly higher interpretability (0.977 vs. 0.968). The other models exhibit a significant deterioration in performance. SVM + K-Means achieves a 55.4% increase in MSE, while XGBoost + K-Means performs disastrously, with an MSE that is 44.9 times higher than the optimal model. SVM-PSO shows the worst results, with an MSE of 0.106, 24.9 times higher than the optimal model, and a training time 60% longer than the regular SVM. This numerical comparison clearly demonstrates the significant superiority of CNN-LSTM, which outperforms 9 out of 10 key metrics, with margins of superiority ranging from 24% to 704% on critical metrics [98]. The other models, however, exhibit exponential performance degradation, particularly on metrics such as MSE, which ranges from 0.004 to 0.191, and Recall, which ranges from 98.3% to 25.4%. These significant quantitative differences confirm that CNN-LSTM remains the best choice for the vast majority of practical applications [99].

4.4. Taylor Diagram of ML Models

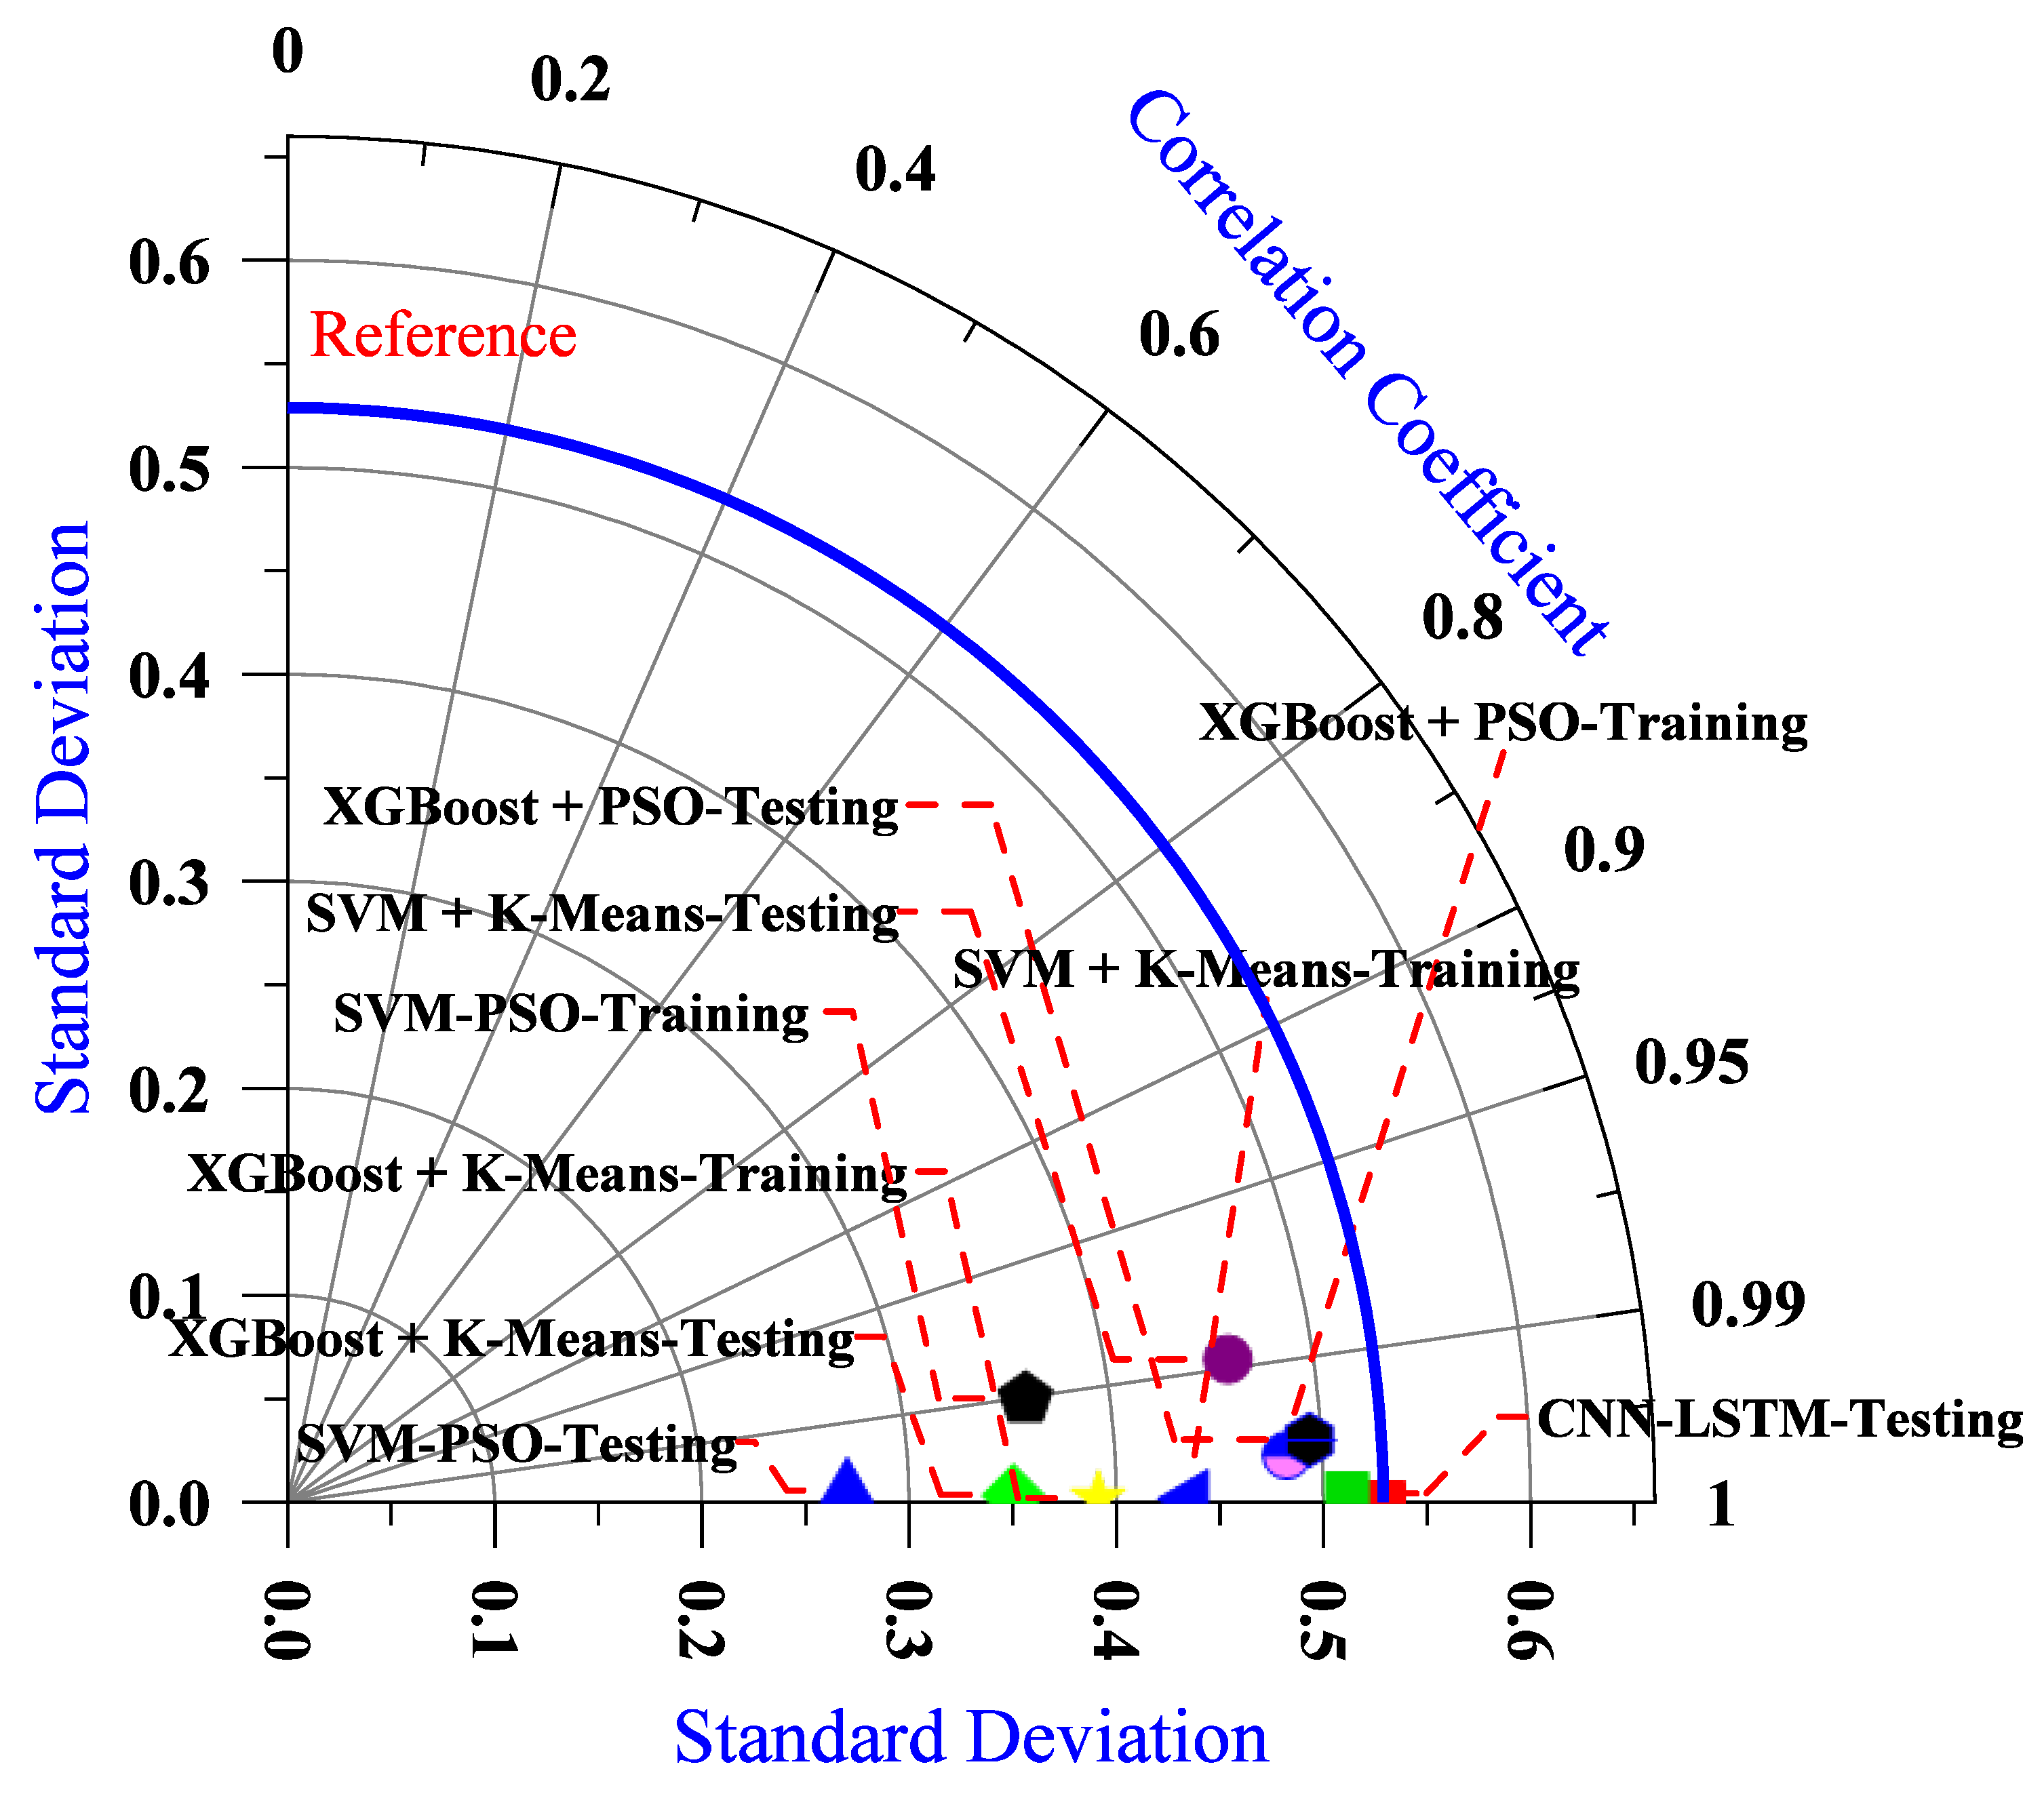
Figure 10 shows the Taylor diagram comparison of machine learning models for Flexural strength. The Taylor plot shows a comprehensive comparison of the performance of five machine learning models in the training and testing phases, with the CNN-LSTM model clearly outperforming all the models. This deep neural model achieves the highest correlation coefficient (R2 = 0.990 in training and 0.968 in testing) and the lowest root mean square error (RMSE = 0.05 in training and 0.07 in testing), demonstrating its superior ability to understand complex patterns in data while maintaining high stability when applied to new data. In contrast, the XGBoost model powered by the swarm optimization (PSO) algorithm performs well but is less consistent, recording an unexpected improvement in the testing phase (R2 = 0.977 compared to 0.987 in training), which may indicate some generalization issues. Meanwhile, the SVM model combined with the K-Means clustering algorithm delivers average but consistent performance, maintaining a correlation coefficient above 0.95 in both phases, making it a suitable choice for situations requiring a balance between accuracy and stability [100]. On the other hand, the XGBoost model combined with K-Means suffers from a significant performance degradation, with the RMSE jumping from 0.27 in training to 0.44 in testing, reflecting fundamental problems with the model’s generalization ability [101]. The SVM model supported by the PSO algorithm exhibits erratic performance, with the correlation coefficient decreasing significantly from 0.946 to 0.911 from training to testing, indicating its over-sensitivity to parameter tuning. Looking at the spatial distribution of points on the Taylor plot, the CNN-LSTM points are located closer to the ideal reference point, while the other points are spread out, proportional to their poor performance [102]. This distribution confirms the superiority of the neural model in terms of accuracy and consistency, as it combines a high correlation coefficient, low standard deviation, and limited root mean square error [101].

4.5. Sensitivity Analysis

Figure 11 shows the relationship between the number of trees in a Random Forest model and the Out-of-Bag Error (OOB) error. It is observed that the OOB error starts at a relatively high value of around 0.64 when using 10 trees, then rapidly decreases as the number of trees increases to 30, reaching its lowest value of 0.6373. After this point, the error roughly stabilizes around 0.64 with some minor fluctuations, indicating that increasing the number of trees beyond 30 does not lead to a significant improvement in model accuracy [103]. The horizontal red line in the graph represents the minimum OOB error (0.6373) achieved at 10 trees. This indicates that the model performs well even with a small number of trees, and that increasing the number does not significantly affect performance beyond this point [104]. Subsequent fluctuations in error may be due to the random nature of the Random Forest model, but they remain within a narrow range around the stable value. In general, it is concluded that the model reaches a stable performance after about 30 trees, and that using more than 200 trees does not provide a significant improvement in error reduction [105].
Some anomalous findings were observed in the sensitivity analysis. In the Random Forest model (Figure 11), the minimum OOB error (0.6373) occurred at only 10 trees, whereas increasing the number of trees to 30 caused minor fluctuations around 0.64 before stabilizing. This early minimum and subsequent slight increase are unexpected, likely due to the inherent randomness of the model.
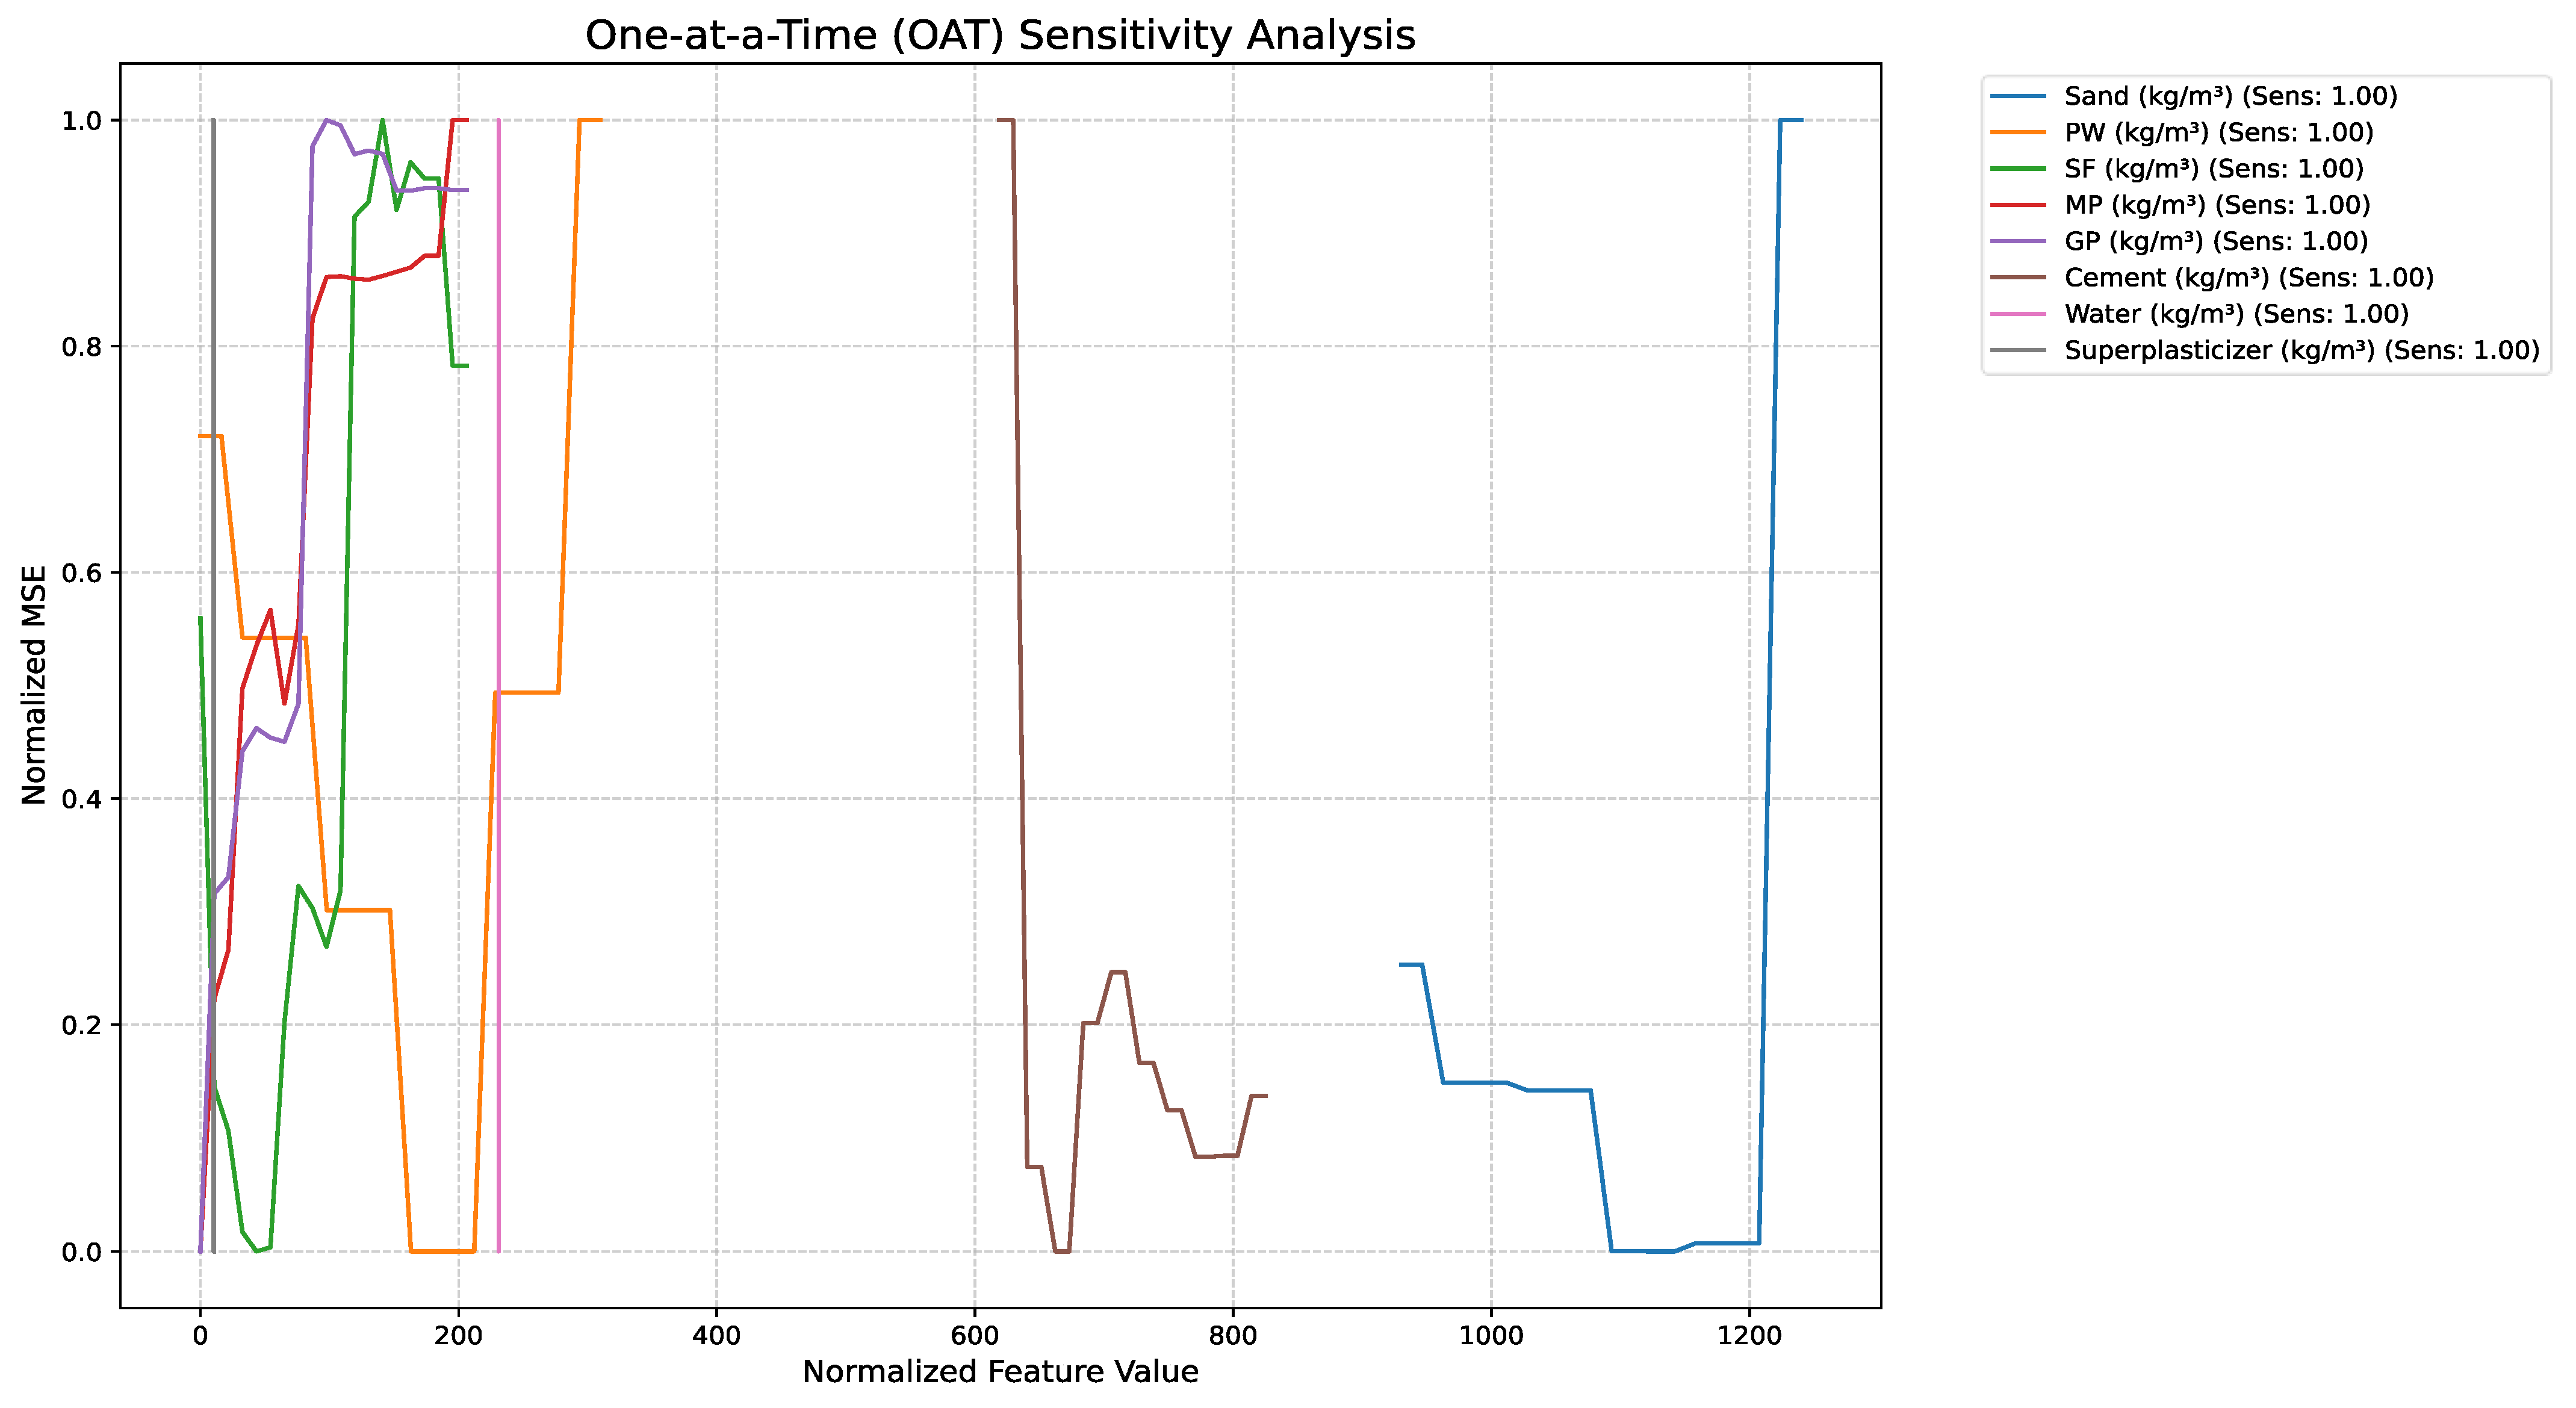
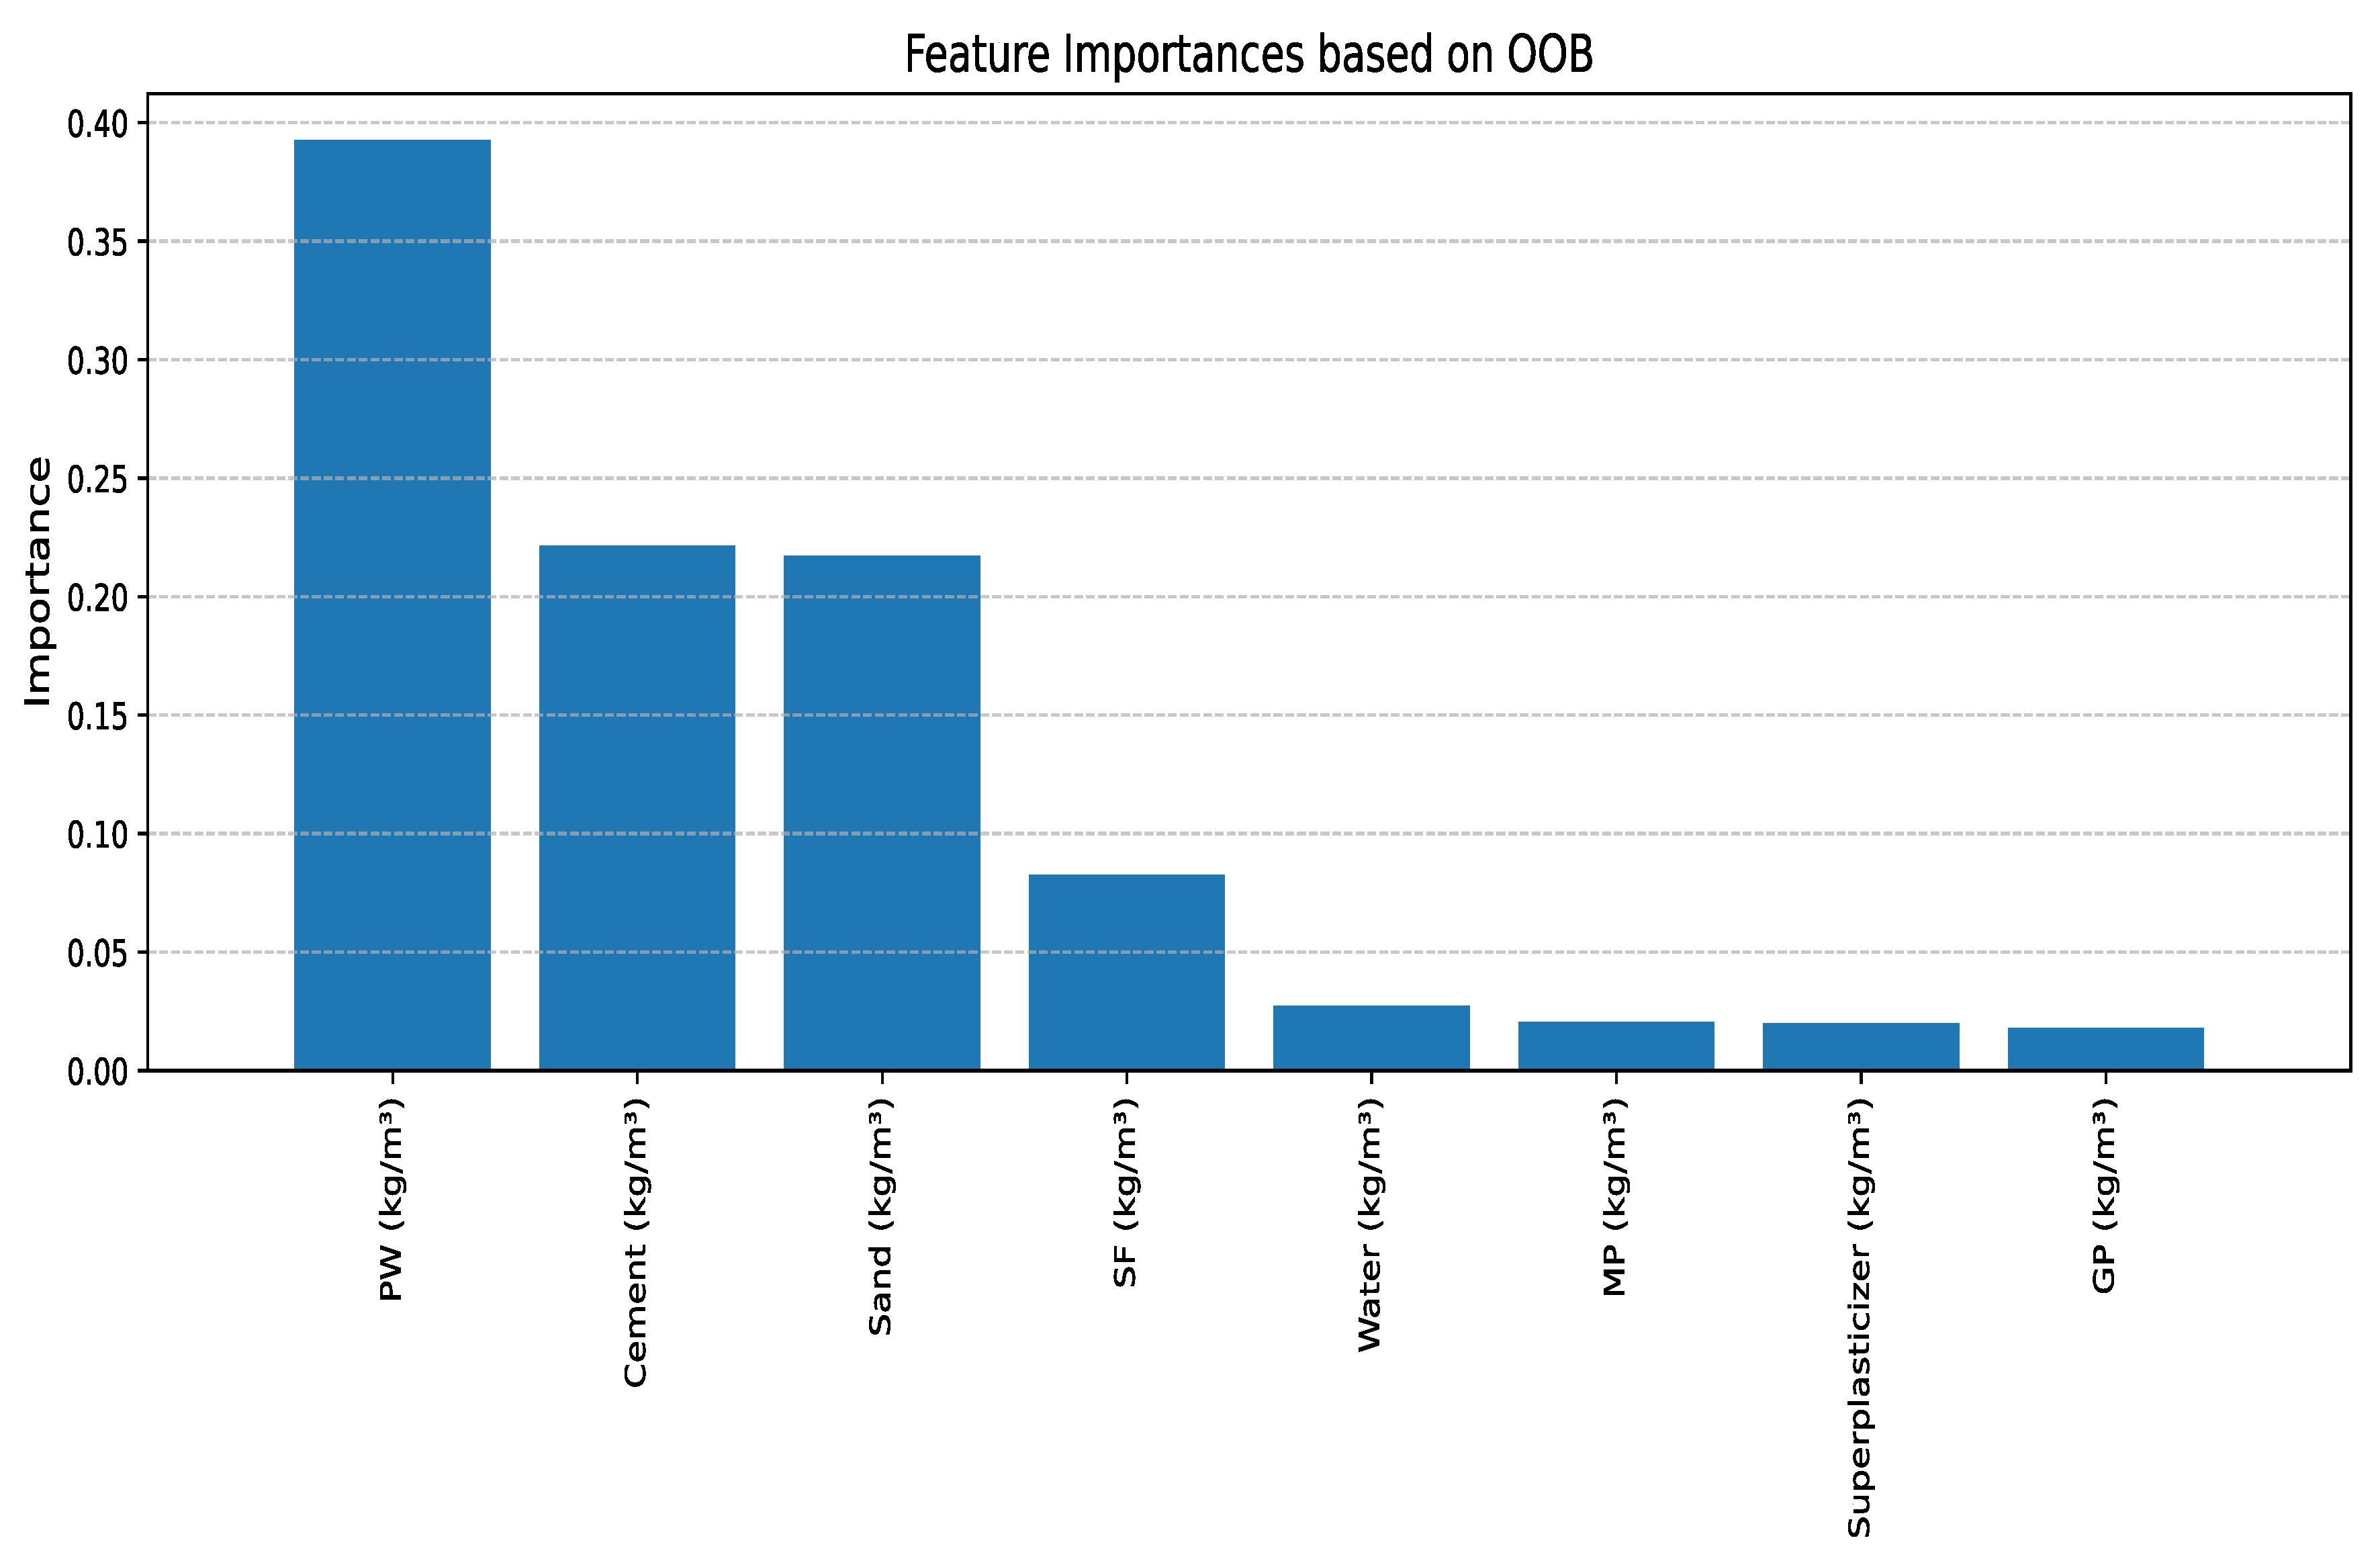
Mean Squared Error (MSE) is an important indicator for assessing the accuracy of a predictive model, as it reflects the variance between actual and predicted values of concrete properties as shown in Figure 12. In the context of sensitivity analysis, MSE can be affected by changes in basic components such as sand. Imbalances in its quantity can lead to variability in mixing, increasing the MSE value due to heterogeneous data. Furthermore, an imperfect or excessive amount of cement can affect the predicted concrete strength, increasing the MSE due to prediction errors resulting from deviations from the ideal proportions [105]. As for water, an inappropriate proportion—either too much, causing weak concrete, or too little, causing a dry mix—increases the variability of results compared to predictions, enhancing the MSE value. For cementitious additives (SF) and granular aggregates (PW, MP, GP), imprecise adjustments can result in unexpected results in mechanical properties, increasing the cumulative error [104]. Finally, superplasticizers, if excessively added or deficient, can alter the behavior of the mixture, reduce the accuracy of predictions and increase the MSE if the model does not take these changes into account. Thus, MSE decreases when the components are balanced and consistent with the predictions on which the model was trained, while it increases with large deviations in the inputs, requiring careful analysis of the actual data to improve predictive performance [104,106]. PW recorded the highest significance with a value of 0.40, indicating its significant impact on the model as shown in Figure 13. Cement and sand followed with significances of 0.15 and 0.14, respectively, highlighting their key role. Water and superplasticizer showed intermediate significances of 0.10 and 0.08. The remaining features such as silica fume (SF) and aggregate (GP) recorded values below 0.05, indicating their limited impact. These results confirm that PW is the most decisive factor, while the other components play minor roles in the model [107].
Regarding the impact of concrete components (Figure 12 and Figure 13), Plastic Waste (PW) showed the highest effect on MSE (0.40), with a non-linear increase in error for higher proportions, which was somewhat surprising. Cement and sand demonstrated moderate effects, yet minor variations in MSE were observed at specific proportions, indicating sensitivity that was not entirely anticipated.
The variation in flexural strength is governed by several mixture design components, as illustrated in Figure 14 through the Partial Dependence Plots (PDP) with Individual Conditional Expectation (ICE) curves [108]. The results indicate that water content and superplasticizer dosage have the strongest positive effect on flexural strength (r = 0.69). Higher water availability and improved dispersion from superplasticizers enhance hydration and internal structure, leading to better tensile performance. However, the effect levels off beyond certain thresholds, as shown in the PDP curves [109]. Cement content shows a moderately negative impact (r = −0.24), which may result from oversaturation beyond the optimal level, hindering particle packing or increasing brittleness. Similarly, higher PW content reduces strength (r = −0.25), suggesting that it functions as a less effective binder or introduces internal flaws [110]. Silica fume (SF) demonstrates a modest positive influence (r = 0.17), consistent with its role in refining pore structure. By contrast, mineral powders such as MP and GP display slight negative effects (r = −0.17 and −0.16, respectively), likely because they dilute binder concentration. Sand exerts a weak positive effect (r = 0.18), contributing to structural stability when properly graded [111]. Overall, the findings highlight that water and superplasticizer exert a stronger influence than any other variable, emphasizing the importance of workability and dispersion efficiency in maximizing flexural performance. Table 3 shows the correlation analysis of flexural strength with concrete mixture variables.
In the Partial Dependence Plots and ICE curves for flexural strength (Figure 14 and Table 3), cement exhibited a moderate negative effect (−0.24), which may be counterintuitive as it is generally expected to increase strength; this is likely due to oversaturation beyond optimal levels. PW also had a negative impact (−0.25), which was stronger than initially expected. Marble Powder (MP) and Glass Powder (GP) showed slight negative effects (−0.17 and −0.16, respectively), representing smaller but unexpected influences. Minor fluctuations in the effect of sand and silica fume (SF) were also observed at certain levels.
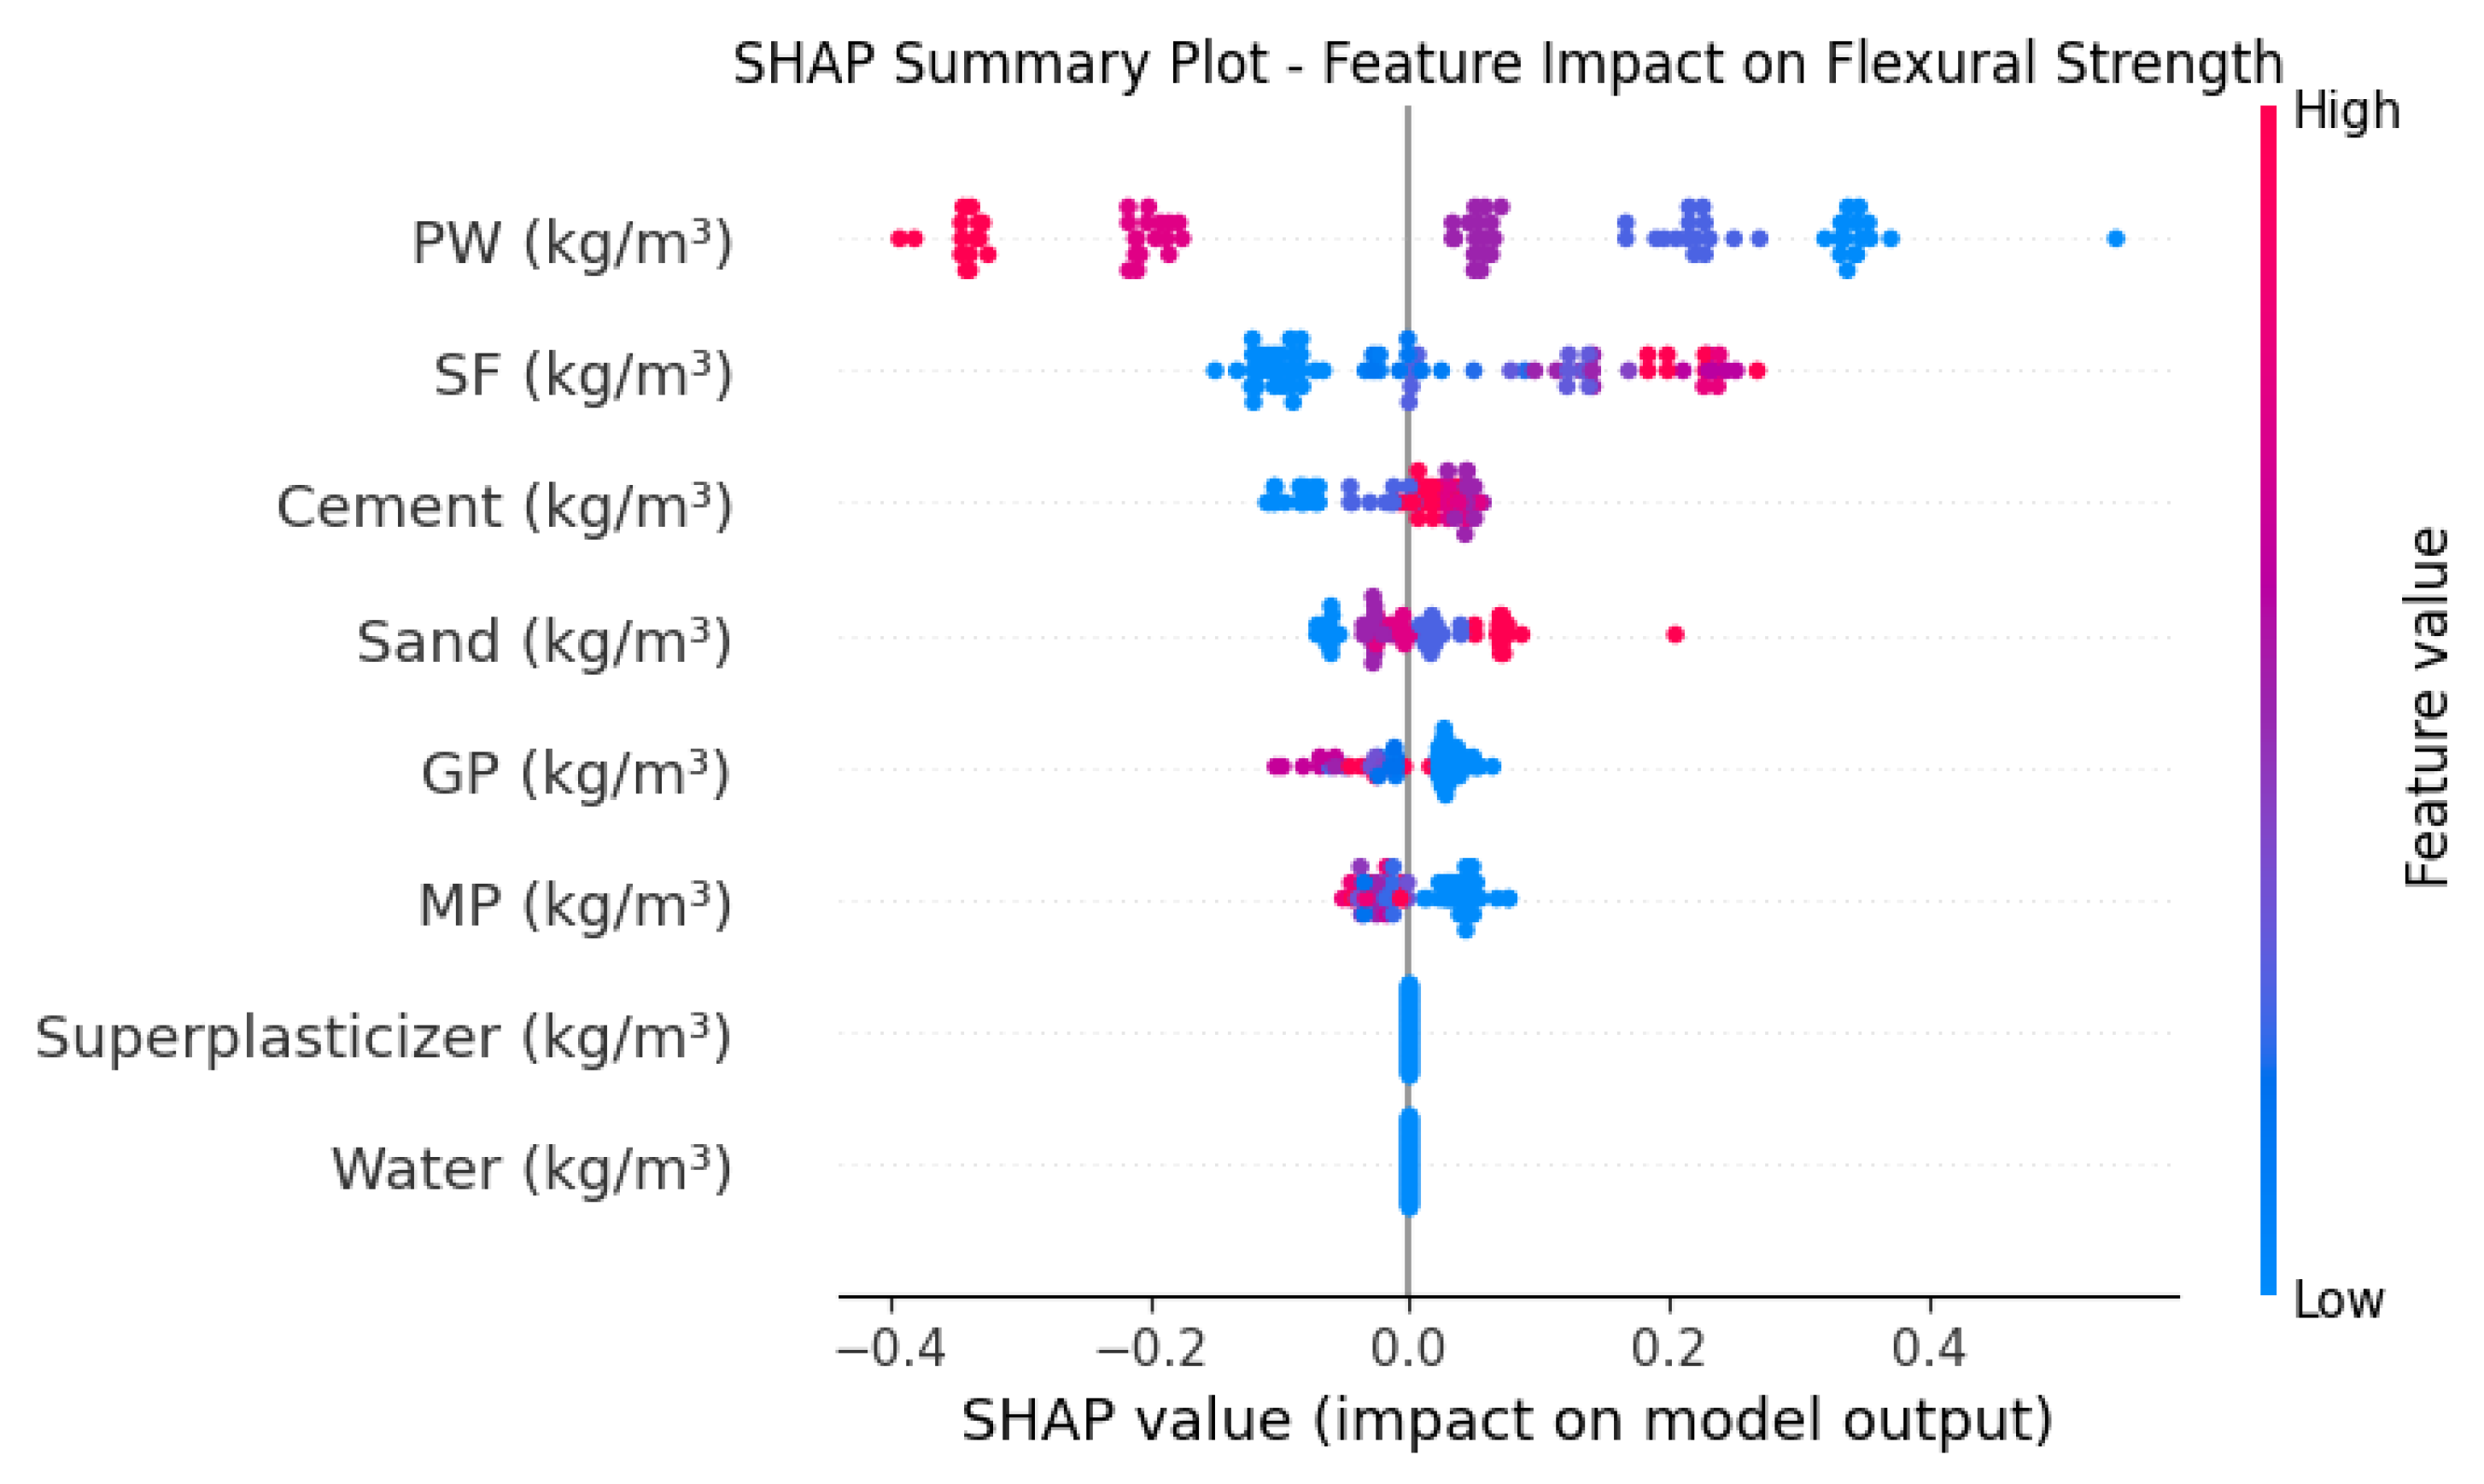
The SHAP summary analysis (Figure 15) highlights that packing water (PW) is the most influential parameter in predicting flexural strength, followed by silica fume (SF), cement, and sand. High PW and SF contents exhibit positive SHAP values, indicating a beneficial contribution to flexural performance, whereas excessive sand content tends to reduce strength. In contrast, the contributions of water and superplasticizer remain close to zero across the dataset, suggesting negligible overall influence on the predictive model. These results reconcile the apparent discrepancy observed between correlation-based sensitivity plots and global feature importance, by demonstrating that water and SP exert only marginal effects when considered in the multivariate context. This finding is also consistent with materials science principles, where their impact is more appropriately captured through composite indices such as the water-to-cement ratio or SP-to-binder ratio.

4.6. Prediction of Cost Production and CO2 Emissions

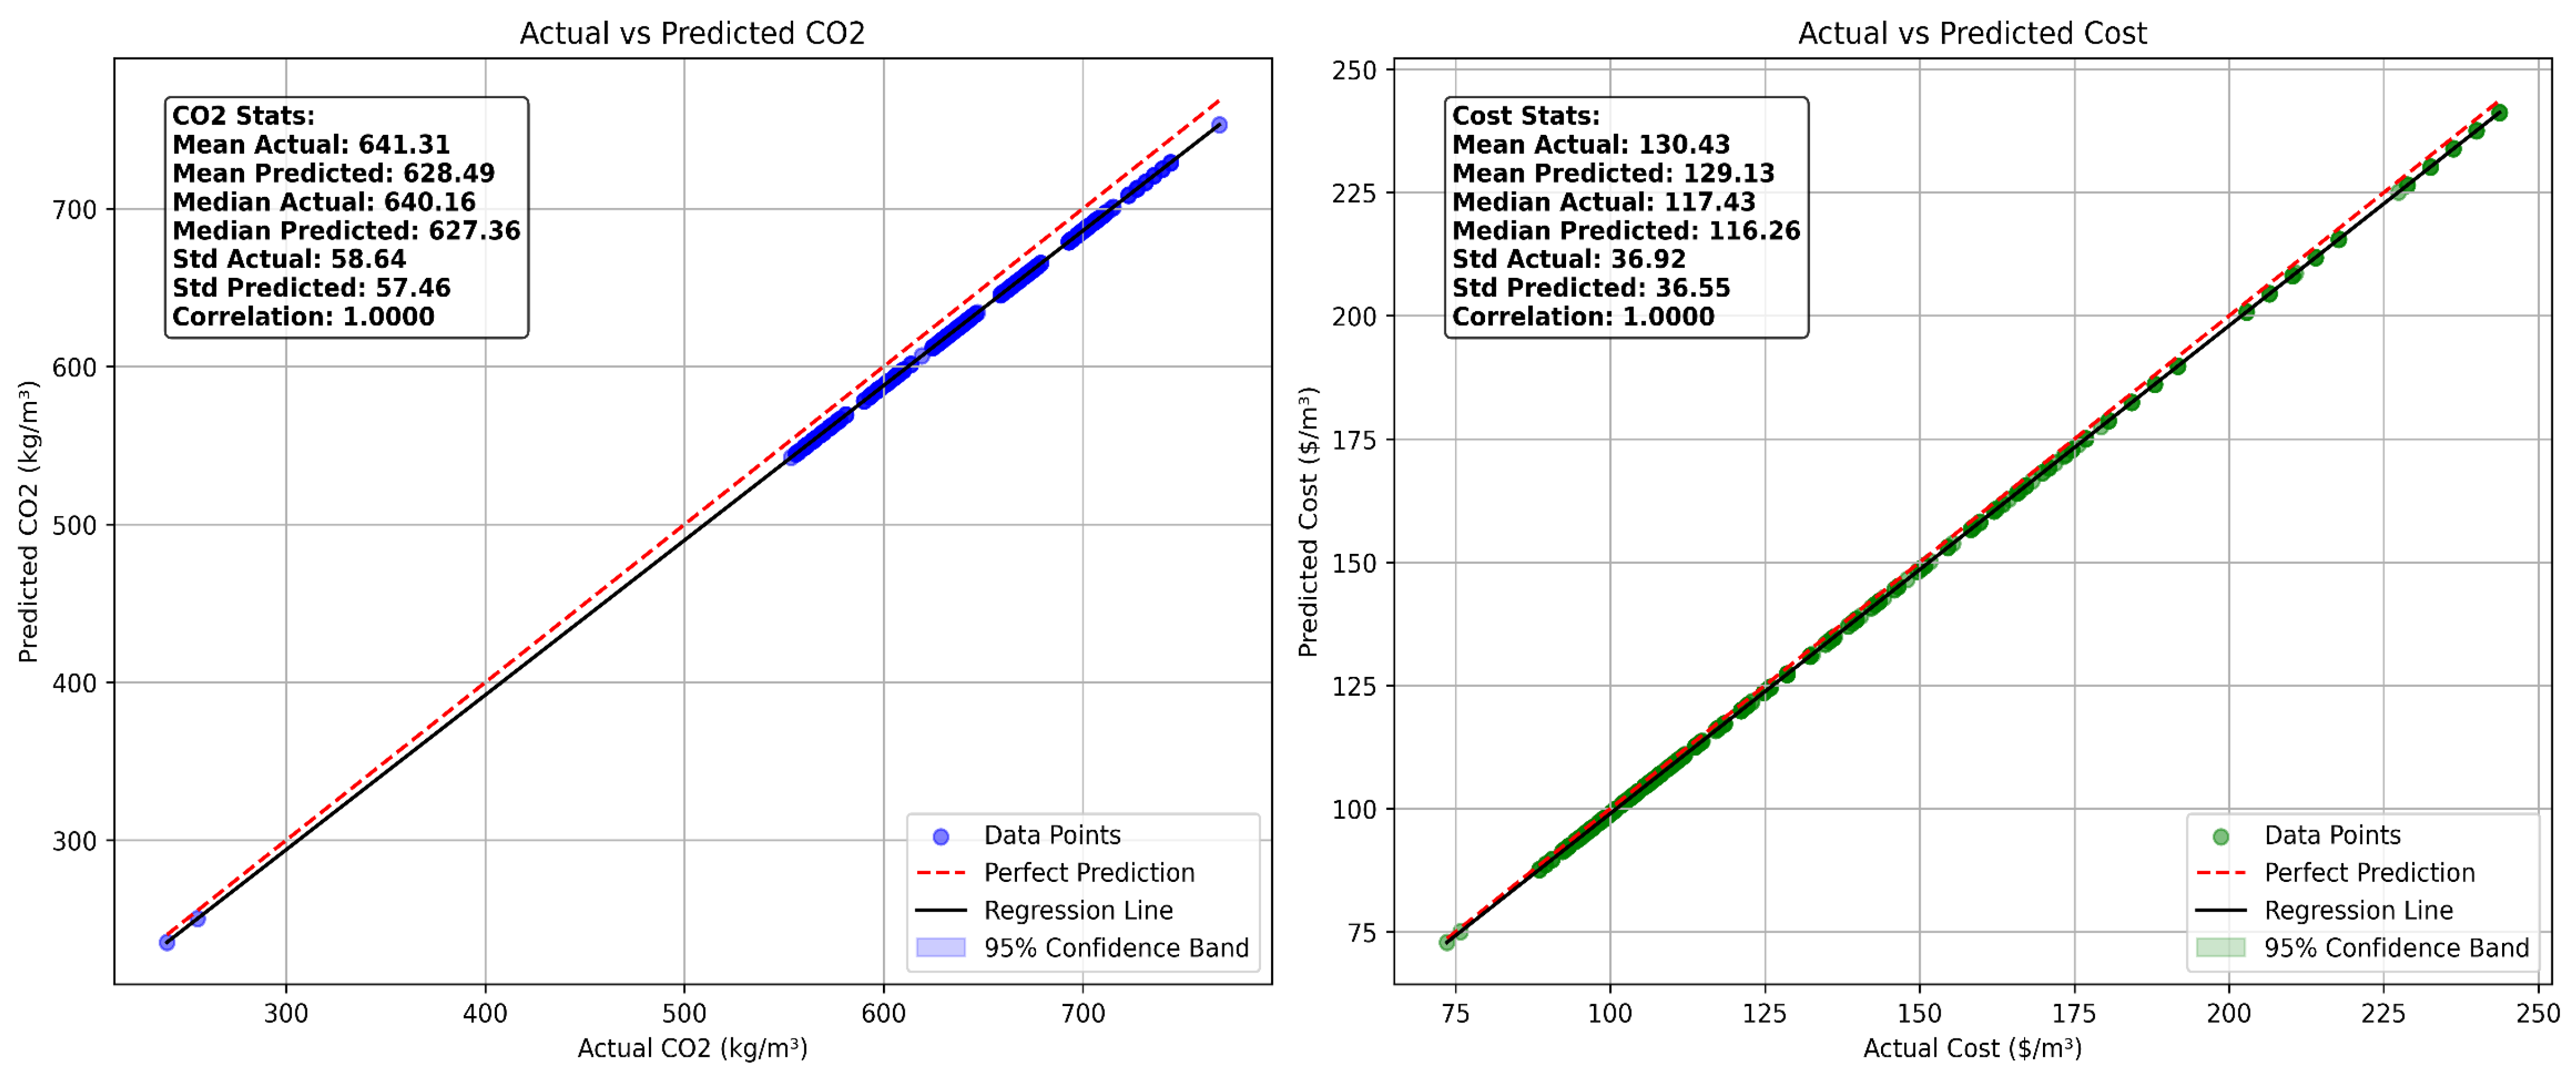
In order to evaluate the predictive performance of the proposed CNN-LSTM model, a detailed comparison was conducted between the actual and predicted values of both CO2 emissions and production cost for concrete mixtures. As illustrated in Figure 16, the model exhibited exceptional predictive accuracy, with both regression analyses producing a perfect Pearson correlation coefficient (R = 1.0000). On the left side of the figure, the scatter plot represents the relationship between the actual and predicted CO2 emissions (kg/m3). The data points (in blue) are densely clustered along the diagonal line representing perfect prediction, with minimal dispersion, indicating that the model’s estimations are highly consistent with the real values [33]. The mean actual CO2 emission was recorded at 641.31 kg/m3, while the predicted mean was slightly lower at 628.49 kg/m3. Similarly, the median values (640.16 vs. 627.36 kg/m3) and standard deviations (58.64 vs. 57.46 kg/m3) show a close match, underscoring the model’s ability to generalize across different concrete formulations [33,112]. The narrow confidence band surrounding the regression line further supports the robustness and low variance of the model’s predictions [113]. On the right side, a parallel analysis was performed for the cost prediction in US dollars per cubic meter ($/m3). The green data points also align closely along the ideal prediction line, reflecting high agreement [114]. The mean actual cost was $130.43/m3, while the mean predicted cost was $129.13/m3. The median values were likewise closely aligned ($117.43 actual vs. $116.26 predicted), and the standard deviations for both sets (~36.9) indicate a well-distributed and stable prediction. The 95% confidence interval around the regression line confirms a high level of certainty in the model’s outputs [115]. These results collectively affirm that the CNN-LSTM model is not only capable of capturing the complex nonlinear relationships between input variables and both cost and CO2 emissions but also does so with a remarkable level of accuracy [116]. The visual proximity of the predicted values to the perfect prediction line, in both cases, reflects a high degree of model calibration, minimal systematic bias, and excellent generalizability. This level of precision makes the model a valuable decision-support tool for sustainable concrete mix design, particularly in contexts where environmental regulations and economic constraints must be jointly optimized. The emission and cost inventories for the input materials were compiled from published studies conducted in 2024 (Table 4). In this study, a cradle-to-gate system boundary is adopted, encompassing raw material extraction, processing, and transportation to the batching plant, while excluding use and end-of-life stages.
The sensitivity analysis (±5% variation in input quantities) revealed that sand and cement are the dominant contributors to both CO2 emissions and production cost as shown in Figure 17. A ±5% change in sand content resulted in ΔCO2 ≈ 14.2 kg/m3 and ΔCost ≈ 2.9 $/m3, while cement showed ΔCO2 ≈ 9.7 kg/m3 and ΔCost ≈ 2.0 $/m3. Other components such as plastic waste, silica fume, marble, and glass powders exhibited minor impacts (<3 kg/m3 CO2 or <1 $/m3). These results confirm that the predictive accuracy of the proposed model is primarily driven by its ability to capture the dominant influence of cement and sand, whereas the small contributions of secondary materials explain the very low observed errors in CO2 and cost estimations.

4.7. Prediction of Compressive and Tensile Strength

A dataset of concrete mixes containing components including sand, plastic waste, silica fume, glass powder, marble powder, cement, water, and superplasticizer was analyzed, with flexural strength (FS) as the main output in MPa. Due to the lack of direct data for compressive strength (CS) and tensile strength (TS), established empirical relationships in civil engineering were used to estimate these values based on flexural strength.
The compressive strength was estimated using the empirical equation:
f S = f s 0.62 2 ,
according to standards such as ACI 318 [121]
The tensile strength was also estimated using the equation:
T S = 0.7 f s ,
derived from standards such as Eurocode 2 [122]
Although the empirical equations of ACI and EC2 were originally developed for conventional concretes, they are adopted here as a rational baseline for benchmarking the performance of PBMs. Their long-standing acceptance in structural design provides a consistent reference framework against which deviations induced by plastic inclusions can be quantified. This comparative use does not assume identical microstructural behavior but rather highlights the extent to which PBMs diverge from well-established design norms, thereby underlining the need for new models. To predict compressive and tensile strengths, a RA-PSO model was used using the mix components as inputs. The data was split into two training and test sets at a ratio of 80:20, and two separate models were trained to predict CS and TS. The results showed good performance, with a coefficient of determination (R2) of approximately 0.9764 and 0.9765 for compressive and tensile strength.
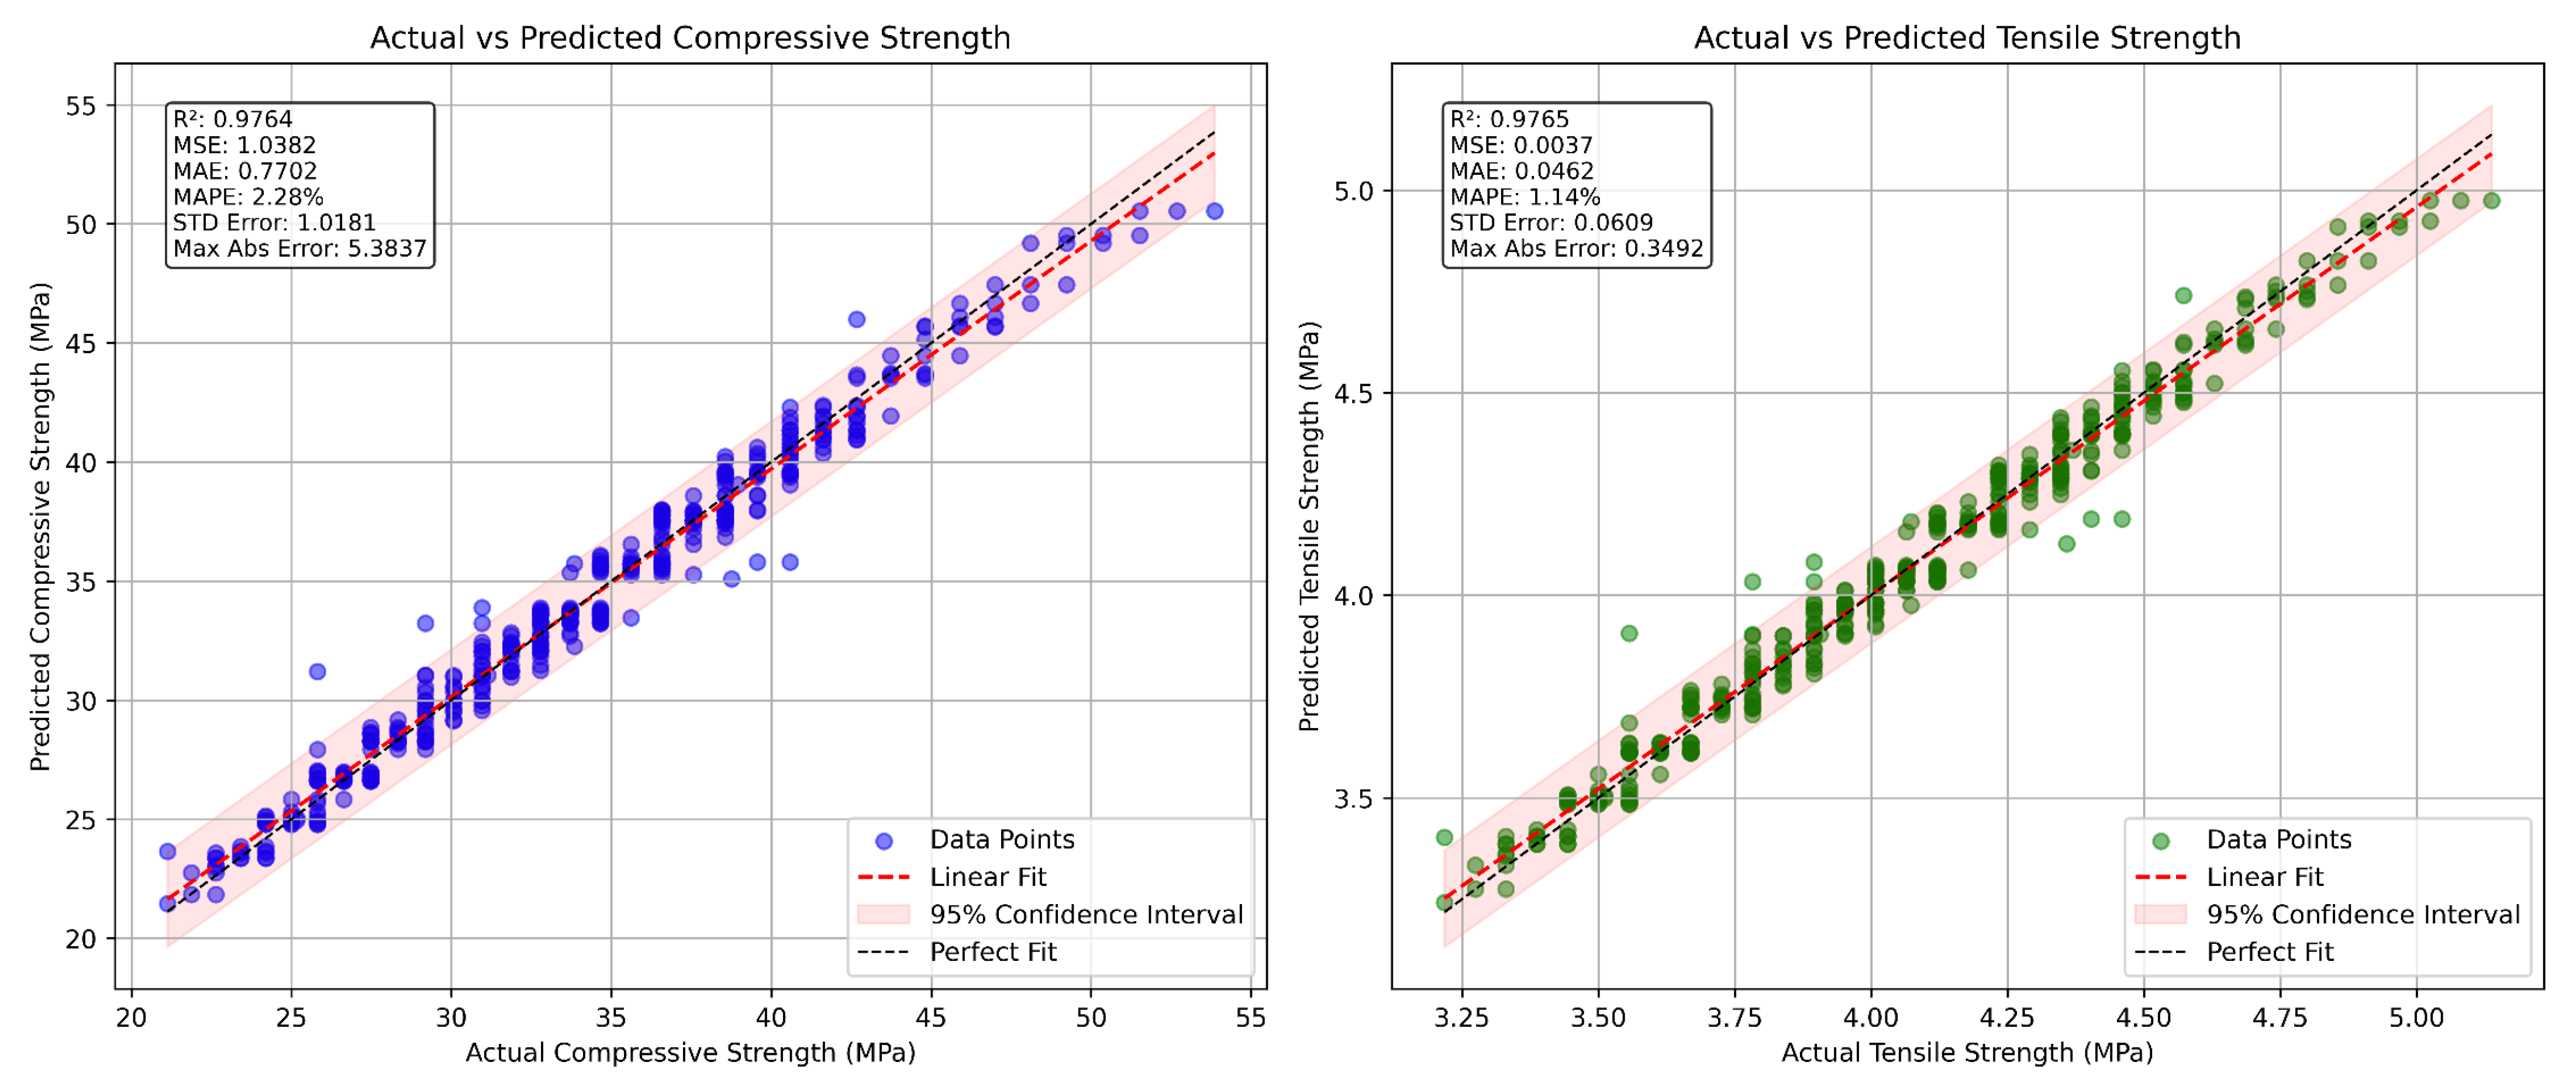
Figure 18 shows comparisons between the actual and predicted values of the prediction model used for both compressive strength (left part of the figure) and tensile strength (right part). The model demonstrates high predictive accuracy in both cases, as evidenced by the high coefficient of determination (R2) of 0.9764 for compressive strength and 0.9765 for tensile strength, indicating that the model explains over 97% of the variance in the data. For compressive strength, the mean square error (MSE) was 1.0382, the mean absolute error (MAE) was 0.7702, and the mean absolute relative error (MAPE) was very low at 2.28%. This indicates that the prediction errors are relatively small compared to the actual values [123].
The standard deviation of the error is 1.0181, with a maximum absolute error of 5.3837, indicating that there are some individual cases with significant deviations, but these remain limited. For tensile strength, better prediction results were achieved in terms of absolute accuracy, with the MSE reaching a very low value of 0.0037 and the MAE of only 0.0462. The MAPE did not exceed 1.14%, reflecting superior prediction accuracy. The maximum absolute error was 0.3492, which is very marginal compared to the overall data range [124]. The fact that the data points fit the perfect fit line (dashed black line) in both graphs enhances the model’s reliability, while the pink confidence band around the linear regression line (dashed red) indicates the narrowness of the 95% confidence intervals, demonstrating the model’s stability and the absence of significant variability in the results [109].

4.8. Graphical User Interface (GUI) of PBMs

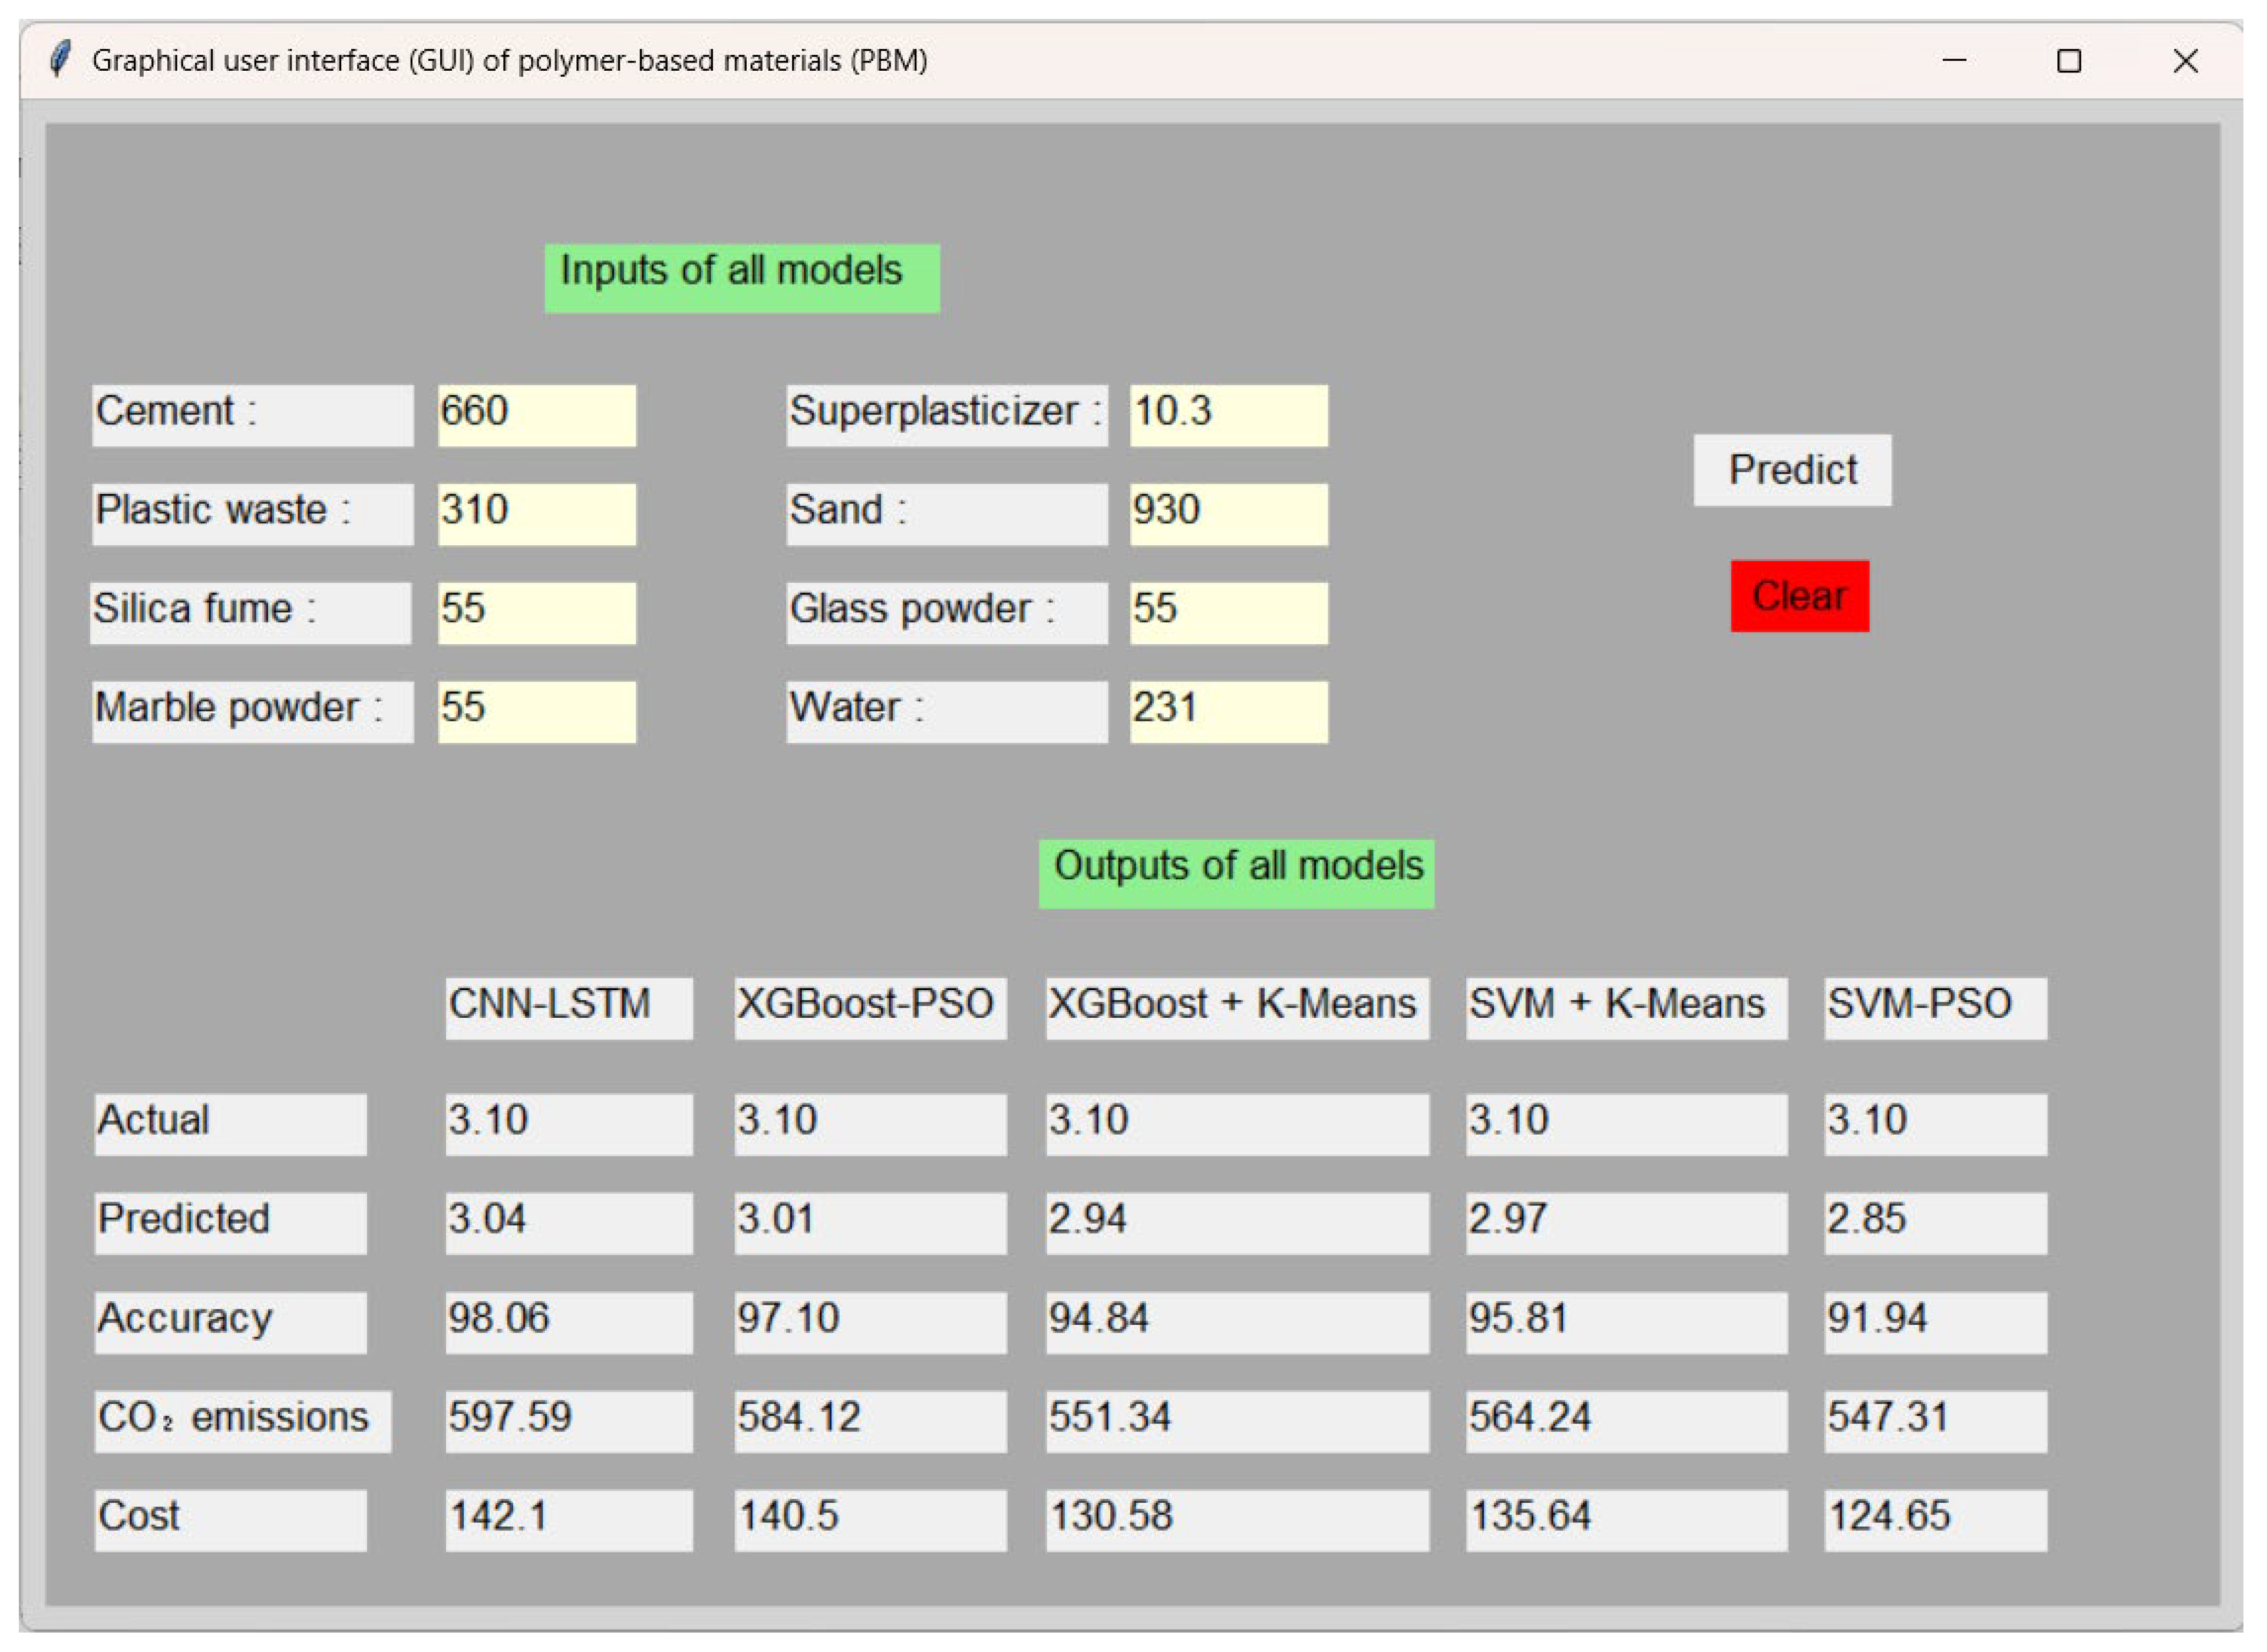
In the context of concrete, the graphical user interface (GUI) is crucial because it offers an interactive tool that enables engineers and researchers to enter data, analyse properties, and forecast performance without the need for extensive technical knowledge of mathematical models or programming [125]. The GUI enables users, including civil engineers and materials specialists, to input variables such as cement, plastic waste (PW), silica fume (SF), marble powder (MP), sand, water, superplasticizer (SP), and glass powder (GP). This enhances cement mix design and guarantees optimal performance in engineering applications [126]. The GUI facilitates straightforward comparison of findings from several predictive models, including CNN-LSTM and XGBoost + K-Means, so enhancing the speed and efficiency of data-driven decision-making while minimizing human error in intricate computations [127]. Figure 19 displays the predictions of five hybrid models: CNN-LSTM, XGBoost-PSO, XGBoost + K-Means, SVM + K-Means, and SVM-PSO. The CNN-LSTM model outperformed the others with the highest prediction accuracy of 98.06%, where the predicted value (3.04) was the closest to the actual value (3.10). It was followed by XGBoost-PSO with 97.10%, then SVM + K-Means with 95.81%. XGBoost + K-Means achieved 94.84%, while SVM-PSO had the lowest accuracy at 91.94%. In terms of CO2 emissions, CNN-LSTM recorded the highest value (597.59), followed by XGBoost-PSO (584.12), SVM + K-Means (564.24), and XGBoost + K-Means (551.34), while SVM-PSO showed the lowest emissions at 547.31. Regarding cost, the highest was associated with CNN-LSTM (142.1), followed by XGBoost-PSO (140.5), SVM + K-Means (135.64), and XGBoost + K-Means (130.58). The SVM-PSO model resulted in the lowest cost at 124.65. It should be noted that the proposed models are valid within the compositional ranges of the dataset (e.g., plastic waste content up to 30%, flexural strength between 2.8 and 10.3 MPa). Predictions outside this domain should be interpreted with caution, as extrapolation may not capture the actual mechanical behavior.

5. Discussion

PBMs are composite cementitious materials incorporating recycled plastics such as PET, PE, PP, or PVC as partial replacements for fine aggregates or additives to enhance specific properties [128]. Typically, 5–20% of the fine aggregate volume is substituted with plastic particles in the form of fibers, granules, flakes, or powder, while maintaining standard cement, water, and admixture ratios [129]. This approach promotes sustainability by reducing landfill waste and conserving natural aggregates, aligning with circular economy principles [130]. PBMs offer lower density than conventional mortars, making them suitable for lightweight applications such as partition walls or panels [130,131]. Plastics, especially when used as fibers, can improve flexibility, crack resistance, and thermal/acoustic insulation [25]. However, challenges remain: high plastic contents reduce compressive strength due to the lower stiffness of plastics and their weak interfacial bonding with the cement matrix. Workability is also impaired at higher plastic dosages, sometimes requiring additional superplasticizers. The heterogeneity of recycled plastics further complicates achieving consistent performance, restricting PBMs primarily to non-structural applications. These complexities underline the necessity of predictive modeling approaches to optimize mix designs.
In light of the results obtained in this study, the observed experimental and predictive trends can be coherently explained through the underlying materials science mechanisms. A relatively higher water-to-binder ratio, when combined with reactive admixtures such as silica fume or fly ash, enhances particle dispersion, facilitates hydration, and leads to additional C–S–H gel formation [132]. This densifies the microstructure and improves compressive strength. Mineral and chemical admixtures also refine pore structure and reduce capillary porosity, thereby enhancing durability and strength [133]. Conversely, excessive plastic incorporation diminishes performance because plastics are chemically inert and hydrophobic, generating weak interfacial transition zones and limiting load transfer [134]. Likewise, higher cement content accelerates hydration and heat release, which can promote microcracking and autogenous shrinkage that compromise mechanical integrity [135]. These mechanistic insights provide a robust physical basis for the statistical outcomes, demonstrating that the improvements and reductions in strength align with well-established materials science principles rather than representing mere numerical correlations [123]. Given these mechanistic complexities, accurate prediction of compressive strength becomes essential, yet challenging. Predicting compressive strength in PBMs is complex due to non-linear relationships between mix components, plastic properties, and mechanical performance [92]. Traditional empirical models often fail to capture these complexities, leading to the adoption of hybrid machine learning methods like CNN-LSTM, XGBoost-PSO, SVM + K-Means, XGBoost + K-Means, and SVM-PSO. These methods leverage flexural strength as a key input, alongside variables like plastic content, curing time, and water-cement ratio, to predict compressive strength accurately [99]. Hybrid models combine the strengths of multiple algorithms, handling heterogeneous data and improving prediction reliability [72]. They reduce reliance on costly lab experiments, accelerating mix design and supporting sustainable construction material development [136]. Table 5 show the comparison of statistical parameters for flexural strength prediction using hybrid ML models.
The comparative performance Table 6 above illustrates the superiority of the CNN-LSTM hybrid model in terms of the coefficient of determination (R2) for both training and testing datasets. The CNN-LSTM model achieved an R2 of 0.99141 on training data and 0.97715 on testing data, outperforming all other models evaluated in this study. The XGBoost-PSO model showed the closest performance to CNN-LSTM, with only a 0.43% reduction in training R2 and a 0.90% reduction in testing R2, indicating that while it is effective, it still falls short of capturing the underlying data relationships as well as CNN-LSTM. More traditional models like SVM combined with K-Means and SVM optimized with PSO, exhibited significantly lower R2 values. In particular, the SVM-PSO model demonstrated the weakest performance, with a 4.28% decrease in training R2 and a 6.75% drop in testing R2, indicating limited generalization capabilities and a higher likelihood of underfitting or misrepresenting the data structure. The CNN-LSTM model’s strong generalization is primarily due to its architecture, which combines Convolutional Neural Networks (CNNs) for extracting spatial features and Long Short-Term Memory (LSTM) networks for capturing temporal or sequential dependencies in the data. This hybrid structure enables the model to learn both local and long-range patterns effectively, making it particularly suitable for complex regression tasks involving high-dimensional or structured datasets. In contrast, ensemble models such as XGBoost + K-Means and XGBoost-PSO, although powerful, tend to rely heavily on feature engineering and optimization techniques, which may not fully capture intricate patterns as deep learning-based models do. Overall, the CNN-LSTM model not only achieves the highest predictive accuracy but also demonstrates robust consistency across training and testing phases, thereby validating its effectiveness for real-world applications where model generalization is critical.
Predicting production costs and CO2 emissions associated with PBMs is a critical step toward achieving sustainable material design. Machine learning (ML) models, including algorithms such as XGBoost and artificial neural networks (ANNs), offer robust tools for forecasting these metrics based on input variables like raw material composition, processing methods, and energy usage [33]. Furthermore, manufacturing processes such as injection molding and resin transfer molding are energy-intensive, with energy demands ranging between 5 and 20 kilowatt-hours per kilogram, thereby contributing to increased environmental impacts [138]. The integration of recycled fillers, including waste plastics and rubber, has been shown to reduce material costs by 10 to 20 percent and decrease associated emissions by 15 to 30 percent [139]. Leveraging such data, ML models have demonstrated high predictive accuracy, with coefficients of determination (R2) exceeding 0.90 in many cases [140]. For instance, XGBoost optimized with Particle Swarm Optimization (PSO) has been employed to predict production costs with a root mean square error (RMSE) of approximately 5 US dollars per cubic meter and CO2 emissions with an RMSE near 10 kg per cubic meter. These findings highlight the potential of ML-driven frameworks to support decision-making in eco-efficient material development. To strengthen the external validation, Table 7 compares the predicted cost and CO2 emissions of PBMs in this study with independent datasets and regional scenarios from the literature. The results demonstrate consistency with previously reported ranges, confirming that the model outputs are both realistic and generalizable. Figure 20 show the Benefits of machine learning for PBMs. Although this study predicts CO2 emissions and production costs, it does not provide a complete life cycle assessment (LCA), which would require considering environmental impacts across the entire service life of the material, including transportation, use, and end-of-life stages. Nevertheless, the presented framework offers a critical first step to-ward integrating predictive modeling with LCA by quantifying key indicators at the production stage. Future research can extend this approach to full LCA models to pro-vide a more comprehensive sustainability evaluation.
From a practical engineering perspective, the findings have significant implications. The developed hybrid ML framework and the accompanying GUI can support decision-making by enabling engineers, designers, and material producers to balance mechanical performance, cost efficiency, and environmental impact when selecting mixture designs. Such tools can contribute to optimizing material use in real construction projects, promoting sustainable practices, and aligning with emerging green building codes and policies [141]. In this way, the study not only advances predictive modeling techniques but also highlights their direct relevance to practical engineering applications.
Table 7. The cost and CO2 emissions of sustainable PBMs.
Type of Concrete MixCO2 Emissions (kg CO2/kg of Concrete)Production Cost (USD/Ton)NotesRef.
Conventional Concrete (no plastic)160140Based on cement (0.9 tons CO2/ton cement) and traditional aggregates. Costs vary by region.[142]
Concrete with 20% Virgin Plastic250200Slightly higher emissions due to virgin plastic production (2–3 tons CO2/ton plastic). Higher cost due to plastic price.[143]
Concrete with 20% Recycled Plastic250145Lower emissions due to recycled plastic (1–1.5 tons CO2/ton). Lower cost from using waste materials.[144]
Concrete with 20% Bio-based Plastic (e.g., PLA)420180Lower emissions from renewable sources (0.5–1 ton CO2/ton). Higher cost due to PLA production complexity.[145]
Concrete with 20% CO2-based Plastic520220Very low or negative emissions due to CO2 sequestration. Higher cost due to advanced catalyst technologies.[146]
This study240.1873.61

6. Conclusions

The flexural strength, cost production, and CO2 emissions were predicted in this study using the hybrid CNN-LSTM, XGBoost-PSO, SVM + K-Means, and XGBoost + K-Means algorithms. The models were trained utilizing eight input variables. The models’ proficiency in handling novel data and their accuracy was evaluated using statistical metrics such as adjusted R2, MSE, RMSE, MARE, MAE, precision, recall, F1 score, and ROC AUC. Additionally, techniques such as Out-of-Bag Error (OOB) error, progressive sensitivity analysis (OAT), feature importances, and ICE plots with PDPs were employed to elucidate the model’s predictions and identify relationships among the variables. The study’s principal conclusions encompass the following:
  • The CNN-LSTM model achieved the highest accuracy and stability across all training and testing phases, recording the highest average training (0.991) and testing (0.975) accuracy, and the highest R2 (0.9914 in training and 0.9766 in testing), with a balanced random distribution of residuals and a significant decrease in the sum of squared errors, confirming its efficiency in generalization without overfitting, especially in predicting mechanical properties such as flexural strength.
  • The CNN-LSTM model showed the lowest training error values (MSE = 0.0027, RMSE = 0.052, MAE = 0.041) and the highest classification efficiency (F1-Score = 0.956, ROC AUC = 0.996), and continued to outperform during testing (F1-Score = 0.983, ROC AUC = 0.999, MSE = 0.00425).
  • According to the Taylor plot, CNN-LSTM came closest to the sweet spot, achieving the highest correlation coefficient (R2 = 0.990 training and 0.968 testing) and the lowest RMSE (0.05 and 0.07, respectively).
  • Sensitivity analysis results (OAT and PDP) showed that plastic waste (PW) has the greatest influence on flexural strength (significance = 0.40), followed by cement (0.15) and sand (0.14), making them the key determinants of prediction accuracy.
  • The model achieved perfect Pearson correlation (R = 1.0000) in predicting both CO2 emissions (628.49 kg/m3 vs. actual 641.31 kg/m3) and production cost ($129.13/m3 vs. actual $130.43/m3), with clear convergence in the mean and standard deviation in both cases.
  • RA-PSO model achieved high accuracy in predicting compressive and tensile strengths, with R2 values of 0.9764 and 0.9765, a compressive strength MSE of 1.0382, MAE of 0.7702, and a low MARE of 2.28%, capturing over 97% of variance with minimal relative error.
  • An interactive graphical user interface (GUI) was developed that enables the user to enter concrete mix components and directly obtain the predicted values for flexural strength, cost, and CO2 emissions accurately and easily.
  • Hence, it can be concluded that the developed models have demonstrated strong predictive performance. However, certain limitations remain. The CNN-LSTM model requires large and diverse datasets along with substantial computational resources for effective training. The XGBoost + PSO approach shows sensitivity to feature selection and clustering techniques, which may affect its generalization across different datasets. Similarly, the GA-ANN and ANFIS models may experience reduced accuracy when dealing with highly complex or high-dimensional input variables. Therefore, to address these limitations, future research should focus on improving the quality and diversity of datasets, applying more robust hyperparameter optimization techniques, and exploring advanced deep learning architectures to enhance both the predictive accuracy and generalizability of hybrid modeling frameworks.

Supplementary Materials

The following supporting information can be downloaded at: https://www.mdpi.com/article/10.3390/buildings15203751/s1, Figure S1: Linear regression on concrete mix components and flexural strength; Figure S2: Probability density curves (KDE) for concrete mix component distribution and flexural strength; Figure S3: Performance Evaluation of SVM + K-Means Model: Prediction and Residual Analysis for Training and Testing Data for Flexural strength; Figure S4: Performance Evaluation of SVM-PSO Model: Prediction and Residual Analysis for Training and Testing Data for Flexural strength; Figure S5: Performance Evaluation of XGBoost-K-Means Model: Prediction and Residual Analysis for Training and Testing Data for Flexural strength; Figure S6: Performance Evaluation of XGBoost-PSO Model: Prediction and Residual Analysis for Training and Testing Data for Flexural strength; Table S1: The numerical values corresponding to each component category; Table S2: Linear regression summary between flexural strength and mix components; Table S3: Distribution summary of mix components and flexural strength; Table S4: (Supplementary Material): Fold-by-fold accuracies.

Funding

This work was supported and funded by the Deanship of Scientific Research at Imam Mohammad Ibn Saud Islamic University (IMSIU) (grant number IMSIU-DDRSP2502).

Data Availability Statement

The original contributions presented in this study are included in the article/Supplementary Material. Further inquiries can be directed to the corresponding author.

Conflicts of Interest

The author declares no conflicts of interest.

References

  1. Thiam, M.; Fall, M.; Diarra, M. Mechanical properties of a mortar with melted plastic waste as the only binder: Influence of material composition and curing regime, and application in Bamako. Case Stud. Constr. Mater. 2021, 15, e00634. [Google Scholar] [CrossRef]
  2. Yun, M.; Li, X.; Amin, M.N.; Khan, Z.; Al-Naghi, A.A.A.; Latifee, E.R.; Nazar, S. Experimenting the effectiveness of waste materials in improving the compressive strength of plastic-based mortar. Case Stud. Constr. Mater. 2024, 21, e03543. [Google Scholar] [CrossRef]
  3. Li, Y.; Wang, G.; Amin, M.N.; Khan, A.; Qadir, M.T.; Arifeen, S.U. Towards improved flexural behavior of plastic-based mortars: An experimental and modeling study on waste material incorporation. Mater. Today Commun. 2024, 40, 109391. [Google Scholar] [CrossRef]
  4. Saikia, N.; De Brito, J. Use of plastic waste as aggregate in cement mortar and concrete preparation: A review. Constr. Build. Mater. 2012, 34, 385–401. [Google Scholar] [CrossRef]
  5. Kaur, G.; Pavia, S. Chemically treated plastic aggregates for eco-friendly cement mortars. J. Mater. Cycles Waste Manag. 2021, 23, 1531–1543. [Google Scholar] [CrossRef]
  6. Lazorenko, G.; Kasprzhitskii, A.; Fini, E.H. Polyethylene terephthalate (PET) waste plastic as natural aggregate replacement in geopolymer mortar production. J. Clean. Prod. 2022, 375, 134083. [Google Scholar] [CrossRef]
  7. Elbialy, S. Compressive Strength Evaluation of Cured Cement Mortar including Rubber, Foam, Plastic and Paper Wastes as Partial Replacement with Sand. J. Sustain. Cities Built Environ. 2023, 1, 24–33. [Google Scholar] [CrossRef]
  8. Tayebani, B.; Memari, A.M.; Said, A. Evaluation of Cement-and Water-Free Concrete Using Waste Plastic Binder (Plasticrete). J. Mater. Civ. Eng. 2025, 37, 04025119. [Google Scholar] [CrossRef]
  9. Alqahtani, F.K.; Zafar, I. Plastic-based sustainable synthetic aggregate in Green Lightweight concrete—A review. Constr. Build. Mater. 2021, 292, 123321. [Google Scholar]
  10. Arulrajah, A.; Perera, S.; Wong, Y.C.; Maghool, F.; Horpibulsuk, S. Stabilization of PET plastic-demolition waste blends using fly ash and slag-based geopolymers in light traffic road bases/subbases. Constr. Build. Mater. 2021, 284, 122809. [Google Scholar] [CrossRef]
  11. Shiuly, A.; Hazra, T.; Sau, D.; Maji, D. Performance and optimisation study of waste plastic aggregate based sustainable concrete–A machine learning approach. Clean. Waste Syst. 2022, 2, 100014. [Google Scholar] [CrossRef]
  12. Rezvan, S.; Moradi, M.J.; Dabiri, H.; Daneshvar, K.; Karakouzian, M.; Farhangi, V. Application of machine learning to predict the mechanical characteristics of concrete containing recycled plastic-based materials. Appl. Sci. 2023, 13, 2033. [Google Scholar] [CrossRef]
  13. Sau, D.; Hazra, T.; Shiuly, A. Assessment of sustainable green concrete properties using recycled plastic waste as replacement for fine aggregate using machine learning technique. Compos. Mech. Comput. Appl. Int. J. 2023, 14, 1–12. [Google Scholar] [CrossRef]
  14. Islam, M.H.; Prova, Z.N.; Sobuz, M.H.R.; Nijum, N.J.; Aditto, F.S. Experimental investigation on fresh, hardened and durability characteristics of partially replaced E-waste plastic concrete: A sustainable concept with machine learning approaches. Heliyon 2025, 11, e41924. [Google Scholar] [CrossRef]
  15. Sapkota, S.C.; Yadav, A.; Khatri, A.; Singh, T.; Dahal, D. Explainable hybridized ensemble machine learning for the prognosis of the compressive strength of recycled plastic-based sustainable concrete with experimental validation. Multiscale Multidiscip. Model. Exp. Des. 2024, 7, 6073–6096. [Google Scholar] [CrossRef]
  16. Iftikhar, B.; Alih, S.C.; Vafaei, M.; Alkhattabi, L.; Althoey, F.; Ali, M.; Javed, M.F. Sustainable use of plastic waste in plastic sand paver blocks: An experimental and modelling-based study. Structures 2024, 62, 106285. [Google Scholar] [CrossRef]
  17. Sau, D.; Shiuly, A.; Hazra, T. Study on green concrete replacing natural fine and coarse aggregate by plastic waste–An experimental and machine learning approach. Mater. Today Proc. 2023. [Google Scholar] [CrossRef]
  18. Xiong, B.; Falliano, D.; Restuccia, L.; Di Trapani, F.; Demartino, C.; Marano, G.C. Concrete Incorporating Recycled Plastic Aggregates: Physical and Mechanical Properties and Predictive Models. J. Mater. Civ. Eng. 2024, 36, 04024138. [Google Scholar] [CrossRef]
  19. Ali, A.; Riaz, R.D.; Malik, U.J.; Abbas, S.B.; Usman, M.; Shah, M.U.; Kim, I.-H.; Hanif, A.; Faizan, M. Machine learning-based predictive model for tensile and flexural strength of 3D-printed concrete. Materials 2023, 16, 4149. [Google Scholar] [CrossRef] [PubMed]
  20. Rezzoug, A.; Elabbasy, A.A.A.; Alqurashi, M.; AlAteah, A.H. Predictive Models with Applicable Graphical User Interface (GUI) for the Compressive Performance of Quaternary Blended Plastic-Derived Sustainable Mortar. Buildings 2025, 15, 1932. [Google Scholar] [CrossRef]
  21. Amin, M.N.; Nassar, R.-U.-D.; Khan, K.; Ul Arifeen, S.; Khan, M.; Qadir, M.T. Integrating testing and modeling methods to examine the feasibility of blended waste materials for the compressive strength of rubberized mortar. Rev. Adv. Mater. Sci. 2024, 63, 20240081. [Google Scholar] [CrossRef]
  22. Khaleel, Y.U.; Qubad, S.D.; Mohammed, A.S.; Faraj, R.H. Reinventing concrete: A comprehensive review of mechanical strength with recycled plastic waste integration. J. Build. Pathol. Rehabil. 2024, 9, 111. [Google Scholar] [CrossRef]
  23. Hussain, F.; Ali Khan, S.; Khushnood, R.A.; Hamza, A.; Rehman, F. Machine learning-based predictive modeling of sustainable lightweight aggregate concrete. Sustainability 2022, 15, 641. [Google Scholar] [CrossRef]
  24. Duarte, G.; Duarte, J.P.; Memari, A.; Brown, N.; Gevaudan, J.P. Towards a model for structural performance in concrete printing based on buildability and toolpath design. J. Build. Eng. 2023, 69, 106325. [Google Scholar] [CrossRef]
  25. Moein, M.M.; Saradar, A.; Rahmati, K.; Mousavinejad, S.H.G.; Bristow, J.; Aramali, V.; Karakouzian, M. Predictive models for concrete properties using machine learning and deep learning approaches: A review. J. Build. Eng. 2023, 63, 105444. [Google Scholar] [CrossRef]
  26. Chaabene, W.B.; Flah, M.; Nehdi, M.L. Machine learning prediction of mechanical properties of concrete: Critical review. Constr. Build. Mater. 2020, 260, 119889. [Google Scholar] [CrossRef]
  27. Ziolkowski, P.; Niedostatkiewicz, M. Machine learning techniques in concrete mix design. Materials 2019, 12, 1256. [Google Scholar] [CrossRef]
  28. Nguyen, H.; Vu, T.; Vo, T.P.; Thai, H.-T. Efficient machine learning models for prediction of concrete strengths. Constr. Build. Mater. 2021, 266, 120950. [Google Scholar] [CrossRef]
  29. Asteris, P.G.; Skentou, A.D.; Bardhan, A.; Samui, P.; Pilakoutas, K. Predicting concrete compressive strength using hybrid ensembling of surrogate machine learning models. Cem. Concr. Res. 2021, 145, 106449. [Google Scholar] [CrossRef]
  30. Feng, D.-C.; Liu, Z.-T.; Wang, X.-D.; Chen, Y.; Chang, J.-Q.; Wei, D.-F.; Jiang, Z.-M. Machine learning-based compressive strength prediction for concrete: An adaptive boosting approach. Constr. Build. Mater. 2020, 230, 117000. [Google Scholar] [CrossRef]
  31. Paudel, S.; Pudasaini, A.; Shrestha, R.K.; Kharel, E. Compressive strength of concrete material using machine learning techniques. Clean. Eng. Technol. 2023, 15, 100661. [Google Scholar] [CrossRef]
  32. Pham, A.-D.; Ngo, N.-T.; Nguyen, Q.-T.; Truong, N.-S. Hybrid machine learning for predicting strength of sustainable concrete. Soft Comput. 2020, 24, 14965–14980. [Google Scholar] [CrossRef]
  33. Shahrokhishahraki, M.; Malekpour, M.; Mirvalad, S.; Faraone, G. Machine learning predictions for optimal cement content in sustainable concrete constructions. J. Build. Eng. 2024, 82, 108160. [Google Scholar] [CrossRef]
  34. Reuter, U.; Sultan, A.; Reischl, D.S. A comparative study of machine learning approaches for modeling concrete failure surfaces. Adv. Eng. Softw. 2018, 116, 67–79. [Google Scholar] [CrossRef]
  35. Liu, Y. High-Performance Concrete Strength Prediction Based on Machine Learning. Comput. Intell. Neurosci. 2022, 2022, 5802217. [Google Scholar] [CrossRef]
  36. Shen, Z.; Deifalla, A.F.; Kamiński, P.; Dyczko, A. Compressive strength evaluation of ultra-high-strength concrete by machine learning. Materials 2022, 15, 3523. [Google Scholar] [CrossRef]
  37. Sandeep, M.S.; Tiprak, K.; Kaewunruen, S.; Pheinsusom, P.; Pansuk, W. Shear strength prediction of reinforced concrete beams using machine learning. Structures 2023, 47, 1196–1211. [Google Scholar]
  38. Young, B.A.; Hall, A.; Pilon, L.; Gupta, P.; Sant, G. Can the compressive strength of concrete be estimated from knowledge of the mixture proportions?: New insights from statistical analysis and machine learning methods. Cem. Concr. Res. 2019, 115, 379–388. [Google Scholar] [CrossRef]
  39. Chou, J.-S.; Tsai, C.-F.; Pham, A.-D.; Lu, Y.-H. Machine learning in concrete strength simulations: Multi-nation data analytics. Constr. Build. Mater. 2014, 73, 771–780. [Google Scholar] [CrossRef]
  40. Li, Z.; Yoon, J.; Zhang, R.; Rajabipour, F.; Srubar, W.V., III; Dabo, I.; Radlińska, A. Machine learning in concrete science: Applications, challenges, and best practices. npj Comput. Mater. 2022, 8, 127. [Google Scholar] [CrossRef]
  41. Kamath, M.V.; Prashanth, S.; Kumar, M.; Tantri, A. Machine-Learning-Algorithm to predict the High-Performance concrete compressive strength using multiple data. J. Eng. Des. Technol. 2024, 22, 532–560. [Google Scholar] [CrossRef]
  42. Hoang, N.-D. Machine learning-based estimation of the compressive strength of self-compacting concrete: A multi-dataset study. Mathematics 2022, 10, 3771. [Google Scholar] [CrossRef]
  43. Gupta, P.; Gupta, N.; Saxena, K.K. Predicting compressive strength of geopolymer concrete using machine learning. Innov. Emerg. Technol. 2023, 10, 2350003. [Google Scholar] [CrossRef]
  44. Nafees, A.; Khan, S.; Javed, M.F.; Alrowais, R.; Mohamed, A.M.; Mohamed, A.; Vatin, N.I. Forecasting the mechanical properties of plastic concrete employing experimental data using machine learning algorithms: DT, MLPNN, SVM, and RF. Polymers 2022, 14, 1583. [Google Scholar] [CrossRef]
  45. Chopra, P.; Sharma, R.K.; Kumar, M.; Chopra, T. Comparison of machine learning techniques for the prediction of compressive strength of concrete. Adv. Civ. Eng. 2018, 2018, 5481705. [Google Scholar] [CrossRef]
  46. Aghaee, K.; Roshan, A. Predicting Time to Cracking of Concrete Composites Subjected to Restrained Shrinkage: A Review with Insights from Statistical Analysis and Ensemble Machine Learning Approaches. J. Build. Eng. 2024, 97, 110856. [Google Scholar] [CrossRef]
  47. Habib, M.; Okayli, M. Evaluating the sensitivity of machine learning models to data preprocessing technique in concrete compressive strength estimation. Arab. J. Sci. Eng. 2024, 49, 13709–13727. [Google Scholar] [CrossRef]
  48. Habib, A.; Barakat, S.; Al-Toubat, S.; Junaid, M.T.; Maalej, M. Developing machine learning models for identifying the failure potential of fire-exposed FRP-strengthened concrete beams. Arab. J. Sci. Eng. 2024, 50, 8475–8490. [Google Scholar] [CrossRef]
  49. Sah, A.K.; Hong, Y.-M. Performance comparison of machine learning models for concrete compressive strength prediction. Materials 2024, 17, 2075. [Google Scholar] [CrossRef]
  50. Rathnayaka, M.; Karunasinghe, D.; Gunasekara, C.; Wijesundara, K.; Lokuge, W.; Law, D.W. Machine learning approaches to predict compressive strength of fly ash-based geopolymer concrete: A comprehensive review. Constr. Build. Mater. 2024, 419, 135519. [Google Scholar] [CrossRef]
  51. Taffese, W.Z.; Espinosa-Leal, L. A machine learning method for predicting the chloride migration coefficient of concrete. Constr. Build. Mater. 2022, 348, 128566. [Google Scholar] [CrossRef]
  52. Zhao, Y.; Zhang, K.; Guo, A.; Hao, F.; Ma, J. Predictive Model for Erosion Rate of Concrete Under Wind Gravel Flow Based on K-Fold Cross-Validation Combined with Support Vector Machine. Buildings 2025, 15, 614. [Google Scholar] [CrossRef]
  53. Jamal, A.S.; Ahmed, A.N. Estimating compressive strength of high-performance concrete using different machine learning approaches. Alex. Eng. J. 2025, 114, 256–265. [Google Scholar] [CrossRef]
  54. Siddiq, B.; Javed, M.F.; Khan, M.; Aladbuljabbar, H. Machine learning models to predict sewer concrete strength exposed to sulfide environments: Unveiling the superiority of Bayesian-optimized prediction models. Multiscale Multidiscip. Model. Exp. Des. 2024, 7, 6045–6071. [Google Scholar] [CrossRef]
  55. Parhi, S.K.; Panda, S.; Dwibedy, S.; Panigrahi, S.K. Metaheuristic optimization of machine learning models for strength prediction of high-performance self-compacting alkali-activated slag concrete. Multiscale Multidiscip. Model. Exp. Des. 2024, 7, 2901–2928. [Google Scholar] [CrossRef]
  56. Kumar, M.; Singh, S.; Kim, S.; Anand, A.; Pandey, S.; Hasnain, S.M.; Ragab, A.E.; Deifalla, A.F. A hybrid model based on convolution neural network and long short-term memory for qualitative assessment of permeable and porous concrete. Case Stud. Constr. Mater. 2023, 19, e02254. [Google Scholar] [CrossRef]
  57. Ding, L.; Fang, W.; Luo, H.; Love, P.E.; Zhong, B.; Ouyang, X. A deep hybrid learning model to detect unsafe behavior: Integrating convolution neural networks and long short-term memory. Autom. Constr. 2018, 86, 118–124. [Google Scholar] [CrossRef]
  58. Chen, H.; Li, X.; Wu, Y.; Zuo, L.; Lu, M.; Zhou, Y. Compressive strength prediction of high-strength concrete using long short-term memory and machine learning algorithms. Buildings 2022, 12, 302. [Google Scholar] [CrossRef]
  59. Demiss, B.A.; Elsaigh, W.A. Application of novel hybrid deep learning architectures combining Convolutional Neural Networks (CNN) and Recurrent Neural Networks (RNN): Construction duration estimates prediction considering preconstruction uncertainties. Eng. Res. Express 2024, 6, 032102. [Google Scholar] [CrossRef]
  60. Zhang, X.; Xie, X.; Tang, S.; Zhao, H.; Shi, X.; Wang, L.; Wu, H.; Xiang, P. High-speed railway seismic response prediction using CNN-LSTM hybrid neural network. J. Civ. Struct. Health Monit. 2024, 14, 1125–1139. [Google Scholar] [CrossRef]
  61. Yazdanpanah, O.; Chang, M.; Ali Bakhshi, E. Attention-based hybrid convolutional-long short-term memory network for bridge pier hysteresis and backbone curves prediction. Integr. Comput.-Aided Eng. 2024, 32, 176–195. [Google Scholar] [CrossRef]
  62. Yu, B.; Liang, J.; Ju, J.-W.W. Classification method for crack modes in concrete by acoustic emission signals with semi-parametric clustering and support vector machine. Measurement 2025, 244, 116474. [Google Scholar]
  63. Nguchu, B.A.; Han, Y.; Wang, Y.; Shaw, P. Identifying network state-based Parkinson’s disease subtypes using clustering and support vector machine models. Front. Psychiatry 2025, 16, 1453852. [Google Scholar]
  64. Li, S.-L.; Chen, S.-H.; Li, M.; Wu, G.-M.; Wang, C.; Hou, S.-T.; Jiang, N. Separation method for acoustic emission signals of prestressing steel strand fracture and concrete cracking. Measurement 2025, 245, 116607. [Google Scholar] [CrossRef]
  65. Zhang, C.; Yang, M. Evapotranspiration Prediction Method Based on K-Means Clustering and QPSO-MKELM Model. Appl. Sci. 2025, 15, 3530. [Google Scholar] [CrossRef]
  66. Raju, A.S.N.; Venkatesh, K.; Gatla, R.K.; Konakalla, E.P.; Eid, M.M.; Titova, N.; Ghoneim, S.S.; Ghaly, R.N. Colorectal cancer detection with enhanced precision using a hybrid supervised and unsupervised learning approach. Sci. Rep. 2025, 15, 3180. [Google Scholar] [CrossRef]
  67. Du, J.; Liu, Y.; Yu, Y.; Yan, W. A prediction of precipitation data based on support vector machine and particle swarm optimization (PSO-SVM) algorithms. Algorithms 2017, 10, 57. [Google Scholar] [CrossRef]
  68. Alsaykhan, L.K.; Maashi, M.S. A hybrid detection model for acute lymphocytic leukemia using support vector machine and particle swarm optimization (SVM-PSO). Sci. Rep. 2024, 14, 23483. [Google Scholar] [CrossRef]
  69. Kuo, R.; Chiu, T.-H. Hybrid of jellyfish and particle swarm optimization algorithm-based support vector machine for stock market trend prediction. Appl. Soft Comput. 2024, 154, 111394. [Google Scholar] [CrossRef]
  70. Zhao, H.; Wei, A.; Ma, F.; Dai, F.; Jiang, Y.; Li, H. Comparison of debris flow susceptibility assessment methods: Support vector machine, particle swarm optimization, and feature selection techniques. J. Mt. Sci. 2024, 21, 397–412. [Google Scholar] [CrossRef]
  71. Elsedimy, E.; AboHashish, S.M.; Algarni, F. New cardiovascular disease prediction approach using support vector machine and quantum-behaved particle swarm optimization. Multimed. Tools Appl. 2024, 83, 23901–23928. [Google Scholar] [CrossRef]
  72. Kumar, P.; Shekhar Kamal, S.; Kumar, A.; Kumar, N.; Kumar, S. Compressive strength of bentonite concrete using state-of-the-art optimised XGBoost models. Nondestruct. Test. Eval. 2024, 4868–4891. [Google Scholar] [CrossRef]
  73. Utkarsh; Jain, P.K. Predicting bentonite swelling pressure: Optimized XGBoost versus neural networks. Sci. Rep. 2024, 14, 17533. [Google Scholar] [CrossRef]
  74. Kadkhodaei, M.H.; Amirkiyaei, V.; Ghasemi, E. Developing two robust hybrid models for predicting tunnel deformation in squeezing prone grounds. Transp. Geotech. 2024, 45, 101231. [Google Scholar] [CrossRef]
  75. Ghadamyari, M. Advancing Energy Forecasting: Integrating Data Mining and Hybrid Machine Learning Techniques for Enhanced Peak Load and Demand Prediction. Available at SSRN 4764479. Available online: https://papers.ssrn.com/sol3/papers.cfm?abstract_id=4764479 (accessed on 2 September 2025).
  76. Gebretsadik, A.; Kumar, R.; Fissha, Y.; Kide, Y.; Okada, N.; Ikeda, H.; Mishra, A.K.; Armaghani, D.J.; Ohtomo, Y.; Kawamura, Y. Enhancing rock fragmentation assessment in mine blasting through machine learning algorithms: A practical approach. Discov. Appl. Sci. 2024, 6, 223. [Google Scholar] [CrossRef]
  77. Rustad, S.; Akrom, M.; Sutojo, T.; Dipojono, H.K. A feature restoration for machine learning on anti-corrosion materials. Case Stud. Chem. Environ. Eng. 2024, 10, 100902. [Google Scholar] [CrossRef]
  78. Doost, Z.H.; Goliatt, L.; Aldlemy, M.S.; Ali, M.; Macêdo, B.d.S. Enhancing Predictive Accuracy of Compressive Strength in Recycled Concrete Using Advanced Machine Learning Techniques with K-means Clustering. AUIQ Tech. Eng. Sci. 2024, 1, 10. [Google Scholar] [CrossRef]
  79. Beskopylny, A.N.; Stel’makh, S.A.; Shcherban’, E.M.; Razveeva, I.; Kozhakin, A.; Pembek, A.; Kondratieva, T.N.; Elshaeva, D.; Chernil’nik, A.; Beskopylny, N. Prediction of the Properties of Vibro-Centrifuged Variatropic Concrete in Aggressive Environments Using Machine Learning Methods. Buildings 2024, 14, 1198. [Google Scholar] [CrossRef]
  80. Mandal, A.; Rajput, S.P. Computational Optimization of Ceramic Waste-Based Concrete Mixtures: A Comprehensive Analysis of Machine Learning Techniques. Arch. Comput. Methods Eng. 2025, 32, 3081–3100. [Google Scholar] [CrossRef]
  81. Kazemi, F.; Asgarkhani, N.; Shafighfard, T.; Jankowski, R.; Yoo, D.-Y. Machine-learning methods for estimating performance of structural concrete members reinforced with fiber-reinforced polymers. Arch. Comput. Methods Eng. 2025, 32, 571–603. [Google Scholar] [CrossRef]
  82. Arif, M.; Rehman, F.U.; Sekanina, L.; Malik, A.S. A comprehensive survey of evolutionary algorithms and metaheuristics in brain EEG-based applications. J. Neural Eng. 2024, 21, 051002. [Google Scholar] [CrossRef] [PubMed]
  83. Meir, I.; Bechar, A.; Sintov, A. Kinematic Optimization of a Robotic Arm for Automation Tasks with Human Demonstration. In Proceedings of the 2024 IEEE International Conference on Robotics and Automation (ICRA), Yokohama, Japan, 13–17 May 2024; pp. 7172–7178. [Google Scholar]
  84. Raja, M.N.A.; Abdoun, T.; El-Sekelly, W. Exploring the potential of machine learning in stochastic reliability modelling for reinforced soil foundations. Buildings 2024, 14, 954. [Google Scholar] [CrossRef]
  85. Salehi, F.; Eskofier, B.M.; Salin, E.; Bayat, S.; Schett, G.; Kleyer, A.; Smarr, B.; Fritsch-Stork, R. PRECISE-RA: Predicting Remission and StratifyingRisk in Rheumatoid Arthritis Patients Treated withbDMARDs—A Robust Machine Learning Approach. 2025. Available online: https://www.researchsquare.com/article/rs-5941518/v1 (accessed on 2 September 2025).
  86. Liu, W.; Liu, G.; Zhu, X. Applicability of machine learning algorithms in predicting chloride diffusion in concrete: Modeling, evaluation, and feature analysis. Case Stud. Constr. Mater. 2024, 21, e03573. [Google Scholar] [CrossRef]
  87. Miao, X.; Zhu, J.-X.; Zhu, W.-B.; Wang, Y.; Peng, L.; Dong, H.-L.; Xu, L.-Y. Intelligent prediction of comprehensive mechanical properties of recycled aggregate concrete with supplementary cementitious materials using hybrid machine learning algorithms. Case Stud. Constr. Mater. 2024, 21, e03708. [Google Scholar] [CrossRef]
  88. Pham, A.-D.; Ngo, N.-T.; Nguyen, T.-K. Machine learning for predicting long-term deflections in reinforce concrete flexural structures. J. Comput. Des. Eng. 2020, 7, 95–106. [Google Scholar] [CrossRef]
  89. Ling, H.; Qian, C.; Kang, W.; Liang, C.; Chen, H. Combination of Support Vector Machine and K-Fold cross validation to predict compressive strength of concrete in marine environment. Constr. Build. Mater. 2019, 206, 355–363. [Google Scholar] [CrossRef]
  90. Beskopylny, A.N.; Stel’makh, S.A.; Shcherban’, E.M.; Mailyan, L.R.; Meskhi, B.; Razveeva, I.; Kozhakin, A.; Pembek, A.; Elshaeva, D.; Chernil’nik, A. Prediction of the compressive strength of vibrocentrifuged concrete using machine learning methods. Buildings 2024, 14, 377. [Google Scholar] [CrossRef]
  91. Alahmari, T.S.; Ashraf, J.; Sobuz, M.H.R.; Uddin, M.A. Predicting the compressive strength of fiber-reinforced self-consolidating concrete using a hybrid machine learning approach. Innov. Infrastruct. Solut. 2024, 9, 446. [Google Scholar] [CrossRef]
  92. Gamil, Y. Machine learning in concrete technology: A review of current researches, trends, and applications. Front. Built Environ. 2023, 9, 1145591. [Google Scholar] [CrossRef]
  93. Güçlüer, K.; Özbeyaz, A.; Göymen, S.; Günaydın, O. A comparative investigation using machine learning methods for concrete compressive strength estimation. Mater. Today Commun. 2021, 27, 102278. [Google Scholar] [CrossRef]
  94. Khan, K.; Ahmad, W.; Amin, M.N.; Ahmad, A. A systematic review of the research development on the application of machine learning for concrete. Materials 2022, 15, 4512. [Google Scholar] [CrossRef] [PubMed]
  95. Shang, M.; Li, H.; Ahmad, A.; Ahmad, W.; Ostrowski, K.A.; Aslam, F.; Joyklad, P.; Majka, T.M. Predicting the mechanical properties of RCA-based concrete using supervised machine learning algorithms. Materials 2022, 15, 647. [Google Scholar] [CrossRef]
  96. Jia, H.; Qiao, G.; Han, P. Machine learning algorithms in the environmental corrosion evaluation of reinforced concrete structures-A review. Cem. Concr. Compos. 2022, 133, 104725. [Google Scholar] [CrossRef]
  97. Wattanapanich, C.; Imjai, T.; Sridhar, R.; Garcia, R.; Thomas, B.S. Optimizing recycled aggregate concrete for severe conditions through machine learning techniques: A review. Eng. Sci. 2024, 31, 1191. [Google Scholar] [CrossRef]
  98. DeRousseau, M.A.; Laftchiev, E.; Kasprzyk, J.R.; Rajagopalan, B.; Srubar, W.V., III. A comparison of machine learning methods for predicting the compressive strength of field-placed concrete. Constr. Build. Mater. 2019, 228, 116661. [Google Scholar] [CrossRef]
  99. Zhang, Y.; Jiang, Y.; Li, C.; Bai, C.; Zhang, F.; Li, J.; Guo, M. Prediction of cement-stabilized recycled concrete aggregate properties by CNN-LSTM incorporating attention mechanism. Mater. Today Commun. 2025, 42, 111137. [Google Scholar] [CrossRef]
  100. Ansari, S.S.; Ansari, H.; Khateeb, A.; Ibrahim, S.M. Comparative study of machine learning models for predicting the compressive strength of concrete using Non-Destructive Testing methods. Mater. Today Proc. 2024. [Google Scholar] [CrossRef]
  101. Zhang, J.; Huang, Y.; Wang, Y.; Ma, G. Multi-objective optimization of concrete mixture proportions using machine learning and metaheuristic algorithms. Constr. Build. Mater. 2020, 253, 119208. [Google Scholar] [CrossRef]
  102. Keshtegar, B.; Gholampour, A.; Thai, D.-K.; Taylan, O.; Trung, N.-T. Hybrid regression and machine learning model for predicting ultimate condition of FRP-confined concrete. Compos. Struct. 2021, 262, 113644. [Google Scholar] [CrossRef]
  103. Owais, M.; Idriss, L.K. Modeling green recycled aggregate concrete using machine learning and variance-based sensitivity analysis. Constr. Build. Mater. 2024, 440, 137393. [Google Scholar] [CrossRef]
  104. Li, K.; Long, Y.; Wang, H.; Wang, Y.-F. Modeling and sensitivity analysis of concrete creep with machine learning methods. J. Mater. Civ. Eng. 2021, 33, 04021206. [Google Scholar] [CrossRef]
  105. Yazdani, A.; Nicknam, A.; Dadras, E.Y.; Eftekhari, S.N. Entropy-based sensitivity analysis of global seismic demand of concrete structures. Eng. Struct. 2017, 146, 118–126. [Google Scholar] [CrossRef]
  106. Sarkar, N.; Dasgupta, K. Machine learning-based sensitivity analysis of engineering demand parameters for a reinforced concrete wall-frame building. Structures 2024, 70, 107477. [Google Scholar] [CrossRef]
  107. Zounemat-Kermani, M.; Alizamir, M.; Yaseen, Z.M.; Hinkelmann, R. Concrete corrosion in wastewater systems: Prediction and sensitivity analysis using advanced extreme learning machine. Front. Struct. Civ. Eng. 2021, 15, 444–460. [Google Scholar] [CrossRef]
  108. Dan, W.; Yue, X.; Yu, M.; Li, T.; Zhang, J. Prediction and global sensitivity analysis of long-term deflections in reinforced concrete flexural structures using surrogate models. Materials 2023, 16, 4671. [Google Scholar] [CrossRef]
  109. Amin, M.N.; Khan, K.; Sufian, M.; Al-Ahmad, Q.M.; Deifalla, A.F.; Alsharari, F. Predicting parameters and sensitivity assessment of nano-silica-based fiber-reinforced concrete: A sustainable construction material. J. Mater. Res. Technol. 2023, 23, 3943–3960. [Google Scholar] [CrossRef]
  110. Wang, R.; Kuru, E.; Yan, Y.; Yang, X.; Yan, X. Sensitivity analysis of factors controlling the cement hot spot temperature and the corresponding well depth using a combined CFD simulation and machine learning approach. J. Pet. Sci. Eng. 2022, 208, 109617. [Google Scholar] [CrossRef]
  111. Lin, C.; Chen, S.; Hariri-Ardebili, M.A.; Li, T. An explainable probabilistic model for health monitoring of concrete dam via optimized sparse bayesian learning and sensitivity analysis. Struct. Control Health Monit. 2023, 2023, 2979822. [Google Scholar] [CrossRef]
  112. Al-Fakih, A.; Al-wajih, E.; Saleh, R.A.; Muhit, I.B. Ensemble machine learning models for predicting the CO2 footprint of GGBFS-based geopolymer concrete. J. Clean. Prod. 2024, 472, 143463. [Google Scholar] [CrossRef]
  113. Tavares, C.; Grasley, Z. Machine learning-based mix design tools to minimize carbon footprint and cost of UHPC. Part 2: Cost and eco-efficiency density diagrams. Clean. Mater. 2022, 4, 100094. [Google Scholar] [CrossRef]
  114. Farouk, A.; Abdulrahman, S.; Al-Osta, M.A.; Malami, S.I.; Abba, S.I. Optimizing ultra-high-performance concrete with recycled fine and CO2 reduction strategies: A machine learning and swarm intelligence approach. Innov. Infrastruct. Solut. 2025, 10, 309. [Google Scholar] [CrossRef]
  115. Hadzima-Nyarko, M.; Nyarko, E.K.; Lu, H.; Zhu, S. Machine learning approaches for estimation of compressive strength of concrete. Eur. Phys. J. Plus 2020, 135, 682. [Google Scholar] [CrossRef]
  116. Wakjira, T.G.; Kutty, A.A.; Alam, M.S. A novel framework for developing environmentally sustainable and cost-effective ultra-high-performance concrete (UHPC) using advanced machine learning and multi-objective optimization techniques. Constr. Build. Mater. 2024, 416, 135114. [Google Scholar] [CrossRef]
  117. Zhu, X.; Zhang, Y.; Liu, Z.; Qiao, H.; Ye, F.; Lei, Z. Research on carbon emission reduction of manufactured sand concrete based on compressive strength. Constr. Build. Mater. 2023, 403, 133101. [Google Scholar] [CrossRef]
  118. Lee, J.; Lim, J.; Joo, C.; Ahn, Y.; Cho, H.; Kim, J. Multiobjective optimization of plastic waste sorting and recycling processes considering economic profit and CO2 emissions using nondominated sorting genetic algorithm II. ACS Sustain. Chem. Eng. 2022, 10, 13325–13334. [Google Scholar] [CrossRef]
  119. Tahwia, A.M.; Essam, A.; Tayeh, B.A.; Abd Elrahman, M. Enhancing sustainability of ultra-high performance concrete utilizing high-volume waste glass powder. Case Stud. Constr. Mater. 2022, 17, e01648. [Google Scholar] [CrossRef]
  120. Essam, A.; Mostafa, S.A.; Khan, M.; Tahwia, A.M. Modified particle packing approach for optimizing waste marble powder as a cement substitute in high-performance concrete. Constr. Build. Mater. 2023, 409, 133845. [Google Scholar] [CrossRef]
  121. ACI Committee. Building Code Requirements for Structural Concrete (ACI 318-05) and Commentary (ACI 318R-05); American Concrete Institute: Farmington Hills, MI, USA, 2005. [Google Scholar]
  122. Beckett, D. Eurocode 2: Design of Concrete Structures; CRC Press: Boca Raton, FL, USA, 2004; Volume 1, p. 230. [Google Scholar]
  123. Zhang, Y.; Zhang, Q.; Alateah, A.H.; Essam, A.; Mostafa, S.A. Predictive modeling for mechanical characteristics of ultra high-performance concrete blended with eggshell powder and nano silica utilizing traditional technique and machine learning algorithm. Case Stud. Constr. Mater. 2024, 21, e04025. [Google Scholar] [CrossRef]
  124. Dao, D.V.; Adeli, H.; Ly, H.-B.; Le, L.M.; Le, V.M.; Le, T.-T.; Pham, B.T. A sensitivity and robustness analysis of GPR and ANN for high-performance concrete compressive strength prediction using a Monte Carlo simulation. Sustainability 2020, 12, 830. [Google Scholar] [CrossRef]
  125. Kulasooriya, W.; Ranasinghe, R.; Perera, U.S.; Thisovithan, P.; Ekanayake, I.; Meddage, D. Modeling strength characteristics of basalt fiber reinforced concrete using multiple explainable machine learning with a graphical user interface. Sci. Rep. 2023, 13, 13138. [Google Scholar] [CrossRef]
  126. Alahmari, T.S.; Arif, K. Machine learning approaches to predict the strength of graphene nanoplatelets concrete: Optimization and hyper tuning with graphical user interface. Mater. Today Commun. 2024, 40, 109946. [Google Scholar] [CrossRef]
  127. Dodo, Y.; Arif, K.; Alyami, M.; Ali, M.; Najeh, T.; Gamil, Y. Estimation of compressive strength of waste concrete utilizing fly ash/slag in concrete with interpretable approaches: Optimization and graphical user interface (GUI). Sci. Rep. 2024, 14, 4598. [Google Scholar] [CrossRef]
  128. Lambert, S.; Sinclair, C.; Boxall, A. Occurrence, degradation, and effect of polymer-based materials in the environment. Rev. Environ. Contam. Toxicol. 2013, 227, 1–53. [Google Scholar]
  129. Salami, B.A.; Bahraq, A.A.; ul Haq, M.M.; Ojelade, O.A.; Taiwo, R.; Wahab, S.; Adewumi, A.A.; Ibrahim, M. Polymer-enhanced concrete: A comprehensive review of innovations and pathways for resilient and sustainable materials. Next Mater. 2024, 4, 100225. [Google Scholar] [CrossRef]
  130. Hazarika, A.; Hazarika, I.; Gogoi, M.; Bora, S.S.; Borah, R.R.; Goutam, P.J.; Saikia, N. Use of a plant based polymeric material as a low cost chemical admixture in cement mortar and concrete preparations. J. Build. Eng. 2018, 15, 194–202. [Google Scholar] [CrossRef]
  131. Toto, E.; Lambertini, L.; Laurenzi, S.; Santonicola, M.G. Recent advances and challenges in polymer-based materials for space radiation shielding. Polymers 2024, 16, 382. [Google Scholar] [CrossRef]
  132. Abbasi, A.; Lork, A.; Rostami, V. An innovative machine learning model to formulate the bearing capacity of concrete-filled steel tube column. Arab. J. Sci. Eng. 2025, 50, 1921–1943. [Google Scholar] [CrossRef]
  133. Bouchelil, L.; Shah Bukhari, S.J.; Khanzadeh Moradllo, M. Evaluating the performance of internally cured limestone calcined clay concrete mixtures. J. Sustain. Cem.-Based Mater. 2025, 14, 198–208. [Google Scholar]
  134. Al Fahim, A.; Bukhari, S.J.S.; Moradllo, M.K. Additive manufacturing of carbonatable ternary cementitious systems with cellulose nanocrystals. Constr. Build. Mater. 2025, 495, 143753. [Google Scholar] [CrossRef]
  135. Fan, C.L. Detection of multidamage to reinforced concrete using support vector machine-based clustering from digital images. Struct. Control Health Monit. 2021, 28, e2841. [Google Scholar] [CrossRef]
  136. Al-Taai, S.R.; Azize, N.M.; Thoeny, Z.A.; Imran, H.; Bernardo, L.F.; Al-Khafaji, Z. XGBoost prediction model optimized with bayesian for the compressive strength of eco-friendly concrete containing ground granulated blast furnace slag and recycled coarse aggregate. Appl. Sci. 2023, 13, 8889. [Google Scholar] [CrossRef]
  137. Rosso, M.M.; Cucuzza, R.; Di Trapani, F.; Marano, G.C. Nonpenalty machine learning constraint handling using PSO-SVM for structural optimization. Adv. Civ. Eng. 2021, 2021, 6617750. [Google Scholar] [CrossRef]
  138. Boakye, K.; Simske, S.; Bradley, T.; Troxell, W.; Goemans, C. Raw Material Optimization and CO2 Sensitivity-Predictive Analytics in Cement Manufacturing: A Case Study at Union Bridge Plant, Heidelberg Materials, Maryland. Ph.D. Thesis, Colorado State University, Fort Collins, CO, USA, 2024. [Google Scholar]
  139. Sobuz, M.H.R.; Datta, S.D.; Jabin, J.A.; Aditto, F.S.; Hasan, N.M.S.; Hasan, M.; Zaman, A.A.U. Assessing the influence of sugarcane bagasse ash for the production of eco-friendly concrete: Experimental and machine learning approaches. Case Stud. Constr. Mater. 2024, 20, e02839. [Google Scholar] [CrossRef]
  140. Huang, Y.; Huo, Z.; Ma, G.; Zhang, L.; Wang, F.; Zhang, J. Multi-objective optimization of fly ash-slag based geopolymer considering strength, cost and CO2 emission: A new framework based on tree-based ensemble models and NSGA-II. J. Build. Eng. 2023, 68, 106070. [Google Scholar] [CrossRef]
  141. Tam, V.W.; Butera, A.; Le, K.N.; Da Silva, L.C.; Evangelista, A.C. A prediction model for compressive strength of CO2 concrete using regression analysis and artificial neural networks. Constr. Build. Mater. 2022, 324, 126689. [Google Scholar] [CrossRef]
  142. Tudu, C.; Mohanty, M.; Mohapatra, S.S.; Nayak, S. A systematic review exploring the feasibility of waste plastic as different constituents towards sustainable concrete. Constr. Build. Mater. 2024, 428, 136210. [Google Scholar] [CrossRef]
  143. Hamada, H.M.; Al-Attar, A.; Abed, F.; Beddu, S.; Humada, A.M.; Majdi, A.; Yousif, S.T.; Thomas, B.S. Enhancing sustainability in concrete construction: A comprehensive review of plastic waste as an aggregate material. Sustain. Mater. Technol. 2024, 40, e00877. [Google Scholar] [CrossRef]
  144. Oti, J.; Adeleke, B.O.; Rathnayake, M.; Kinuthia, J.M.; Ekwulo, E. Strength and durability characterization of structural concrete made of recycled plastic. Materials 2024, 17, 1841. [Google Scholar] [CrossRef]
  145. Van Roijen, E.; Miller, S.A. Towards the production of net-negative greenhouse gas emission bio-based plastics from 2nd and 3rd generation feedstocks. J. Clean. Prod. 2024, 445, 141203. [Google Scholar] [CrossRef]
  146. Wang, P.; Robinson, A.J.; Papadokonstantakis, S. Prospective techno-economic and life cycle assessment: A review across established and emerging carbon capture, storage and utilization (CCS/CCU) technologies. Front. Energy Res. 2024, 12, 1412770. [Google Scholar] [CrossRef]
Figure 1. Box plot analysis of the effect of PBMs components on flexural strength.
Buildings 15 03751 g001
Figure 2. The quantity of each class label prior to and subsequent to the elimination of outliers.
Buildings 15 03751 g002
Figure 3. The Feature normalization requirements, the most suitable methods for machine learning models, and runed key parameters of all models.
Buildings 15 03751 g003
Figure 4. The methodology for the prediction of PBMs using ML.
Buildings 15 03751 g004
Figure 5. The training accuracy for each fold for five different algorithms across five folds.
Buildings 15 03751 g005
Figure 6. The testing accuracy for each fold for five different algorithms across five folds.
Buildings 15 03751 g006
Figure 7. Comparison of machine learning models’ performance: train vs. test mean R2.
Buildings 15 03751 g007
Figure 8. Performance evaluation of CNN-LSTM model: prediction and residual analysis for training and testing data for flexural strength.
Buildings 15 03751 g008
Figure 9. Statistical performance analysis of predictive models for flexural strength forecasting of concrete.
Buildings 15 03751 g009
Figure 10. Taylor diagram comparison of machine learning models for flexural strength.
Buildings 15 03751 g010
Figure 11. The OOB error analysis.
Buildings 15 03751 g011
Figure 12. Progressive sensitivity analysis (OAT) of concrete components based on standard values.
Buildings 15 03751 g012
Figure 13. The feature importances based on OOB.
Buildings 15 03751 g013
Figure 14. Analyzing Feature Impacts on Flexural strength: Partial Dependence Plots with ICE Curves for Material Properties.
Buildings 15 03751 g014
Figure 15. SHAP summary plot illustrating the relative contribution of input variables to the prediction of flexural strength.
Buildings 15 03751 g015
Figure 16. Actual and predicted curves for carbon dioxide (CO2) emissions and cost production of concrete for CNN-LSTM.
Buildings 15 03751 g016
Figure 17. Sensitivity analysis of input materials (±5% variation) showing their relative impact on (a) CO2 emissions and (b) production cost.
Buildings 15 03751 g017
Figure 18. Comparison of Actual and Predicted Values for Compressive and Tensile Strengths Using the Proposed Machine Learning Model.
Buildings 15 03751 g018
Figure 19. GUI of all models for predicted flexural strength, carbon dioxide (CO2) emissions and cost production.
Buildings 15 03751 g019
Figure 20. The Benefits of machine learning for PBMs.
Buildings 15 03751 g020
Table 1. The statistical analysis for of the dataset.
SandPWSFMPGPCementWaterSPFS
UnitKg/m3Kg/m3Kg/m3Kg/m3Kg/m3Kg/m3Kg/m3Kg/m3MPa
Mean1045.22194.2142.8542.632.23708.29230.4610.33.63
Maximum12401054206.25206.25206.2582523110.310.3
Median105418620.6320.630701.2523110.33.6
Variance13,672.712,966.213014.423009.942172.535053.67119.38~00.24
Minimum15000023110.310.32.85
Skewness−3.152.661.41.421.71−1.36−20.2-6.48
First Quartile (Q1)99212400066023110.33.35
Third Quartile (Q3)111624861.8861.8855783.7523110.33.85
Standard Deviation116.93113.8754.954.8646.6171.0910.93~00.49
Kurtosis23.7918.221.31.332.747.57408-87.13
Table 2. Predictive performance metrics.
AbbreviationFormulaDescriptions
MAE 1 n Σ (yi − ŷi)yi: actual value, ŷi: predicted value, ȳ: mean of actual values, n: number of samples
MSE 1 n Σ (yi − ŷi)2
RMSE 1 n Σ y i y ^ i 2
MARE 1 n y i y ^ i y i
Adjusted R21 − 1 R 2 n 1 n p 1 P: number of predictors and n: observations to avoid overfitting
Precision TP TP + FP TP: true positives, FP: false positives, FN: false negatives
Recall TP TP + FN
F1 Score2 × Precision × Recall Precision + Recall
Table 3. The correlation analysis of flexural strength with concrete mixture variables.
VariablePearson’s rExplanationEffect on Flexural Strength
Water0.69Higher water content improves hydration and mixture workability up to a limit.Increase
Superplasticizer0.69Enhances dispersion and reduces required water, improving matrix density.Increase
Sand0.18Proper sand grading slightly improves structure by reducing larger voids.Slight Increase
Silica Fume (SF)0.17Fills micro-pores and enhances the matrix, boosting strength.Slight Increase
MP (Marble Powder)−0.17Excess MP may reduce binder concentration and densification.Slight Decrease
GP (Glass Powder)−0.16High GP content may reduce cohesiveness of the matrix.Slight Decrease
Cement−0.24Overuse may lead to stiffness or poor packing beyond optimal dosage.Decrease
PW (Plastic Waste)−0.25Likely contributes to weaker zones or reduced reactivity.Decrease
Table 4. CO2 emissions from concrete raw materials.
CO2 Emissions (kg CO2/kg)Cost ($/kg)CommentsRef.
Sand0.0020.02Low emissions from extraction and transportation. Cost depends on location.[117]
Plastic Waste0.070.08Low emissions for recycling. Cost depends on the type of plastic.[118]
Silica Fume0.060.7By-product, low emissions. Relatively high cost.[119]
Marble Powder0.020.02Industrial waste, low emissions, low cost as a recycled material.[120]
Glass Powder0.030.03Low emissions for recycling. Cost depends on processing.[119]
Cement0.850.07A major source of emissions due to clinker production. [119]
Water0.0010.001Very low emissions. Cost is approximate for industrial water.
Superplasticizer1.841.2Emissions from PCE production. Cost is high due to chemical composition.
Table 5. The comparison of statistical parameters for flexural strength prediction using hybrid ML models.
ModelR2RMSEMAEKey FindingsRef.
CNN-LSTM0.921.250.95Effective for sequential data; captures temporal degradation patterns.[99]
XGBoost-PSO0.951.10.85PSO optimizes XGBoost, improving accuracy for varied filler compositions.[72]
SVM + K-Means0.891.51.2Clustering improves SVM performance but is sensitive to data heterogeneity.[135]
SVM-PSO0.911.351.05PSO enhances SVM generalization for diverse PBM formulations.[137]
XGBoost + K-Means0.941.150.9K-Means reduces noise, boosting XGBoost accuracy for complex datasets.[136]
Table 6. R2 Comparison Between Models and Percentage Differences from CNN-LSTM.
ModelR2 TrainingR2 Testing% Difference (Training)% Difference (Testing)
CNN-LSTM0.991410.97715
XGBoost-PSO0.987180.96837−0.43%−0.90%
SVM + K-Means0.962490.95063−2.92%−2.71%
SVM-PSO0.9490.91117−4.28%−6.75%
XGBoost + K-Means0.957120.94412−3.45%−3.38%
Disclaimer/Publisher’s Note: The statements, opinions and data contained in all publications are solely those of the individual author(s) and contributor(s) and not of MDPI and/or the editor(s). MDPI and/or the editor(s) disclaim responsibility for any injury to people or property resulting from any ideas, methods, instructions or products referred to in the content.