Article

Quantifying Residential Neighborhood Layout Impact on Pedestrian Wind Environment: CFD Analysis Across China’s Major Climate Zones

1
School of Architecture, Harbin Institute of Technology, Shenzhen 518055, China
2
Department of Architecture and Civil Engineering, City University of Hong Kong, Hong Kong SAR, China
3
School of Architecture and Fine Arts, Dalian University of Technology, Dalian 116024, China
4
Shenzhen International Graduate School, Tsinghua University, Shenzhen 518055, China
*
Author to whom correspondence should be addressed.
Buildings 2025, 15(20), 3750; https://doi.org/10.3390/buildings15203750
Submission received: 12 September 2025 / Revised: 7 October 2025 / Accepted: 13 October 2025 / Published: 17 October 2025

Abstract

This study establishes quantitative relationships between neighborhood layouts, as evaluated by key neighborhood morphological parameters and pedestrian wind environments across China’s five major climate zones. We analyzed 3204 residential neighborhoods using satellite imaging and simulated 281 scenarios by CFD simulations, identifying six typical neighborhood layouts and quantifying their performance in terms of climate specific wind comfort criteria. This work takes an approach that takes into account mechanical wind effects and region-specific criteria for evaluating pedestrian-level wind environment performance, going beyond previous studies that utilize universal evaluation standards. The most influential parameter is building enclosure ratio with sensitivity indices of 0.844 for winter wind proofing. Closed perimeter layout confers 15–20% better winter wind proofing in cold climates and semi-open design enhances summer ventilation by 12–18% in hot climates according to our cross-climate analysis. Quantitative optimization adopting regression technique (R2 = 0.727–0.810) points to an optimal enclosure ratio of 0.25–0.28 or 0.52–0.61 with aspect ratio of 1.75–2.75. The results can provide evidence-based design guidelines for high-rise residential neighborhood planning and pedestrian wind environment, aiming to improve urban livability and support climate adaptation strategies across a broad range of climate zones.

1. Introduction

With the acceleration of global urbanization, increasing populations are concentrating in cities, driving continuous expansion of urban residential areas. According to the China Statistical Yearbook of Urban and Rural Construction, residential land accounts for over 30% of total urban construction land area in Chinese cities [1]. Meanwhile, the scarcity of developable land has established high-rise residential neighborhoods as the dominant urban housing typology in China [2]. These high-rise residential neighborhoods can significantly influence the pedestrian-level wind environment. Due to the wind flow characteristics around high-rise buildings, such areas are prone to the formation of both strong wind zones and stagnant air zones [3,4,5,6], which may cause thermal discomfort for residents by resulting in excessive cold in winter or overheating in summer [7,8]. Additionally, degraded pedestrian wind environments may result in the accumulation of waste heat and pollutants, thereby threatening residents’ health [9,10,11,12,13]. Recent studies have demonstrated that urban heat island effects significantly amplify these challenges, with land use changes, local climate zones, and building configurations playing crucial roles in determining thermal risk patterns across different urban development scenarios [14,15,16]. Additionally, the energy performance implications of buildings require careful consideration alongside wind environments [17,18,19]. The complexity of these issues necessitates further examination of the impact of neighborhood layouts on pedestrian wind environments, which is crucial for fostering healthier and more livable urban communities [20,21].
Existing research focusing on pedestrian wind environments primarily addresses planning and design parameters such as plot ratio, building density [22], road features [11,23,24,25,26,27], and building height [28,29,30,31], which are often dictated by higher-level planning and economic considerations. Alterations to these elements have restricted efficacy in enhancing the pedestrian wind environment. Regarding the effects of neighborhood planar layouts on improving pedestrian wind environments, some scholars advocate for the row-column layout as the optimal option [32,33], while others advocate the perimeter layout [34,35].

2. Literature Review

The current literature primarily focuses on the assessment of wind conditions for pedestrians based on the mechanical and thermal effects of wind on individuals. In terms of wind speed, Penwarden [36] reported that wind speeds exceeding 5 m/s induce mechanical discomfort in humans. Hunt et al. indicated that activities become unfavorable when wind speeds surpass 4 m/s [37]. Moreover, Murakami et al. concluded that wind speeds exceeding 3 m/s can impede normal walking, with speeds over 7 m/s making walking difficult [38]. Utilizing the Beaufort wind scale and their own observations, Lawson and Penwarden delineated that wind speeds below 1.5 m/s are virtually unnoticeable, while speeds ranging from 3.4 m/s to 5.4 m/s may lead to inconvenience in human activities, and speeds from 5.5 m/s to 7.9 m/s are considered unsuitable for human habitation [39]. In response to the multifaceted nature of wind, Murakami and Iwasa undertook field measurements and questionnaire surveys to observe the pedestrian wind environment around high-rise structures, subsequently proposing evaluation criteria that include wind frequency for assorted functional areas [40]. Furthermore, Soligo et al. deliberated on the optimal wind speed range for various activities, including sitting, standing and walking, and identified the range as 0 m/s to 5.0 m/s [41]. In summary, one can anticipate discomfort and hindrance in performing activities when wind speeds exceed 5.4 m/s.
When integrating the effect of wind speed to the outdoor thermal comfort, research conducted as early as in 1962 has already revealed the influence of wind speed on the thermal sensation of the human body. Later, numerous studies have been conducted to better comprehend the relationship between climatic conditions and human thermal comfort assessment. For instance, Nikolopoulou et al. performed a field survey in Greece to formulate an outdoor thermal comfort prediction model, considering factors like temperature, wind speed, and relative humidity under various environmental conditions [42]. Liu et al. explored the interplay between meteorological parameters and human thermal sensation across different seasons in China’s hot summer and cold winter zones [43]. Givoni et al. examined the connection between the thermal sensation of inhabitants in cold and hot zones of Japan and Israel and meteorological variables such as temperature, humidity, radiation, and wind speed, using on-site questionnaire surveys [44]. Cheng and Ng evaluated different thermal comfort prediction models and devised an outdoor environmental comfort evaluation chart for Hong Kong City, focusing on Givoni’s prediction model and considering the wind speed range in which human thermal comfort is achieved under divergent solar radiation and air temperature scenarios [45]. To eliminate the influence of clothing thermal resistance on human thermal sensation, the wind chill index was introduced, leading to the development of wind chill temperature to forecast the risk of frostbite in humans under frigid conditions [46]. There are emerging studies focusing on the outdoor thermal comfort under the dynamic outdoor thermal environment [47] and visual–thermal environment interactions [48] in recent years. However, the pedestrian wind environments inside the residential layout rarely reach consensus, even in terms of a well-established thermal comfort index, especially under various climate zones.
Normally, three primary methodologies are utilized to study the pedestrian wind environment, namely field measurements, wind tunnel tests, and computational fluid dynamics (CFD) simulations [49]. Field measurements and wind tunnel tests enable precise documentation of outdoor wind meteorological parameters, though CFD numerical simulations present a reduced level of accuracy [50]. While wind tunnel tests are esteemed for exploring the wind environment of simple building structures, their elevated experimentation costs hinder widespread application. Conversely, CFD numerical simulations are favored for analyzing the wind environment of intricate building forms or building clusters due to their ease in modeling and minimal investment costs. Investigations from wind tunnel experiments conducted by Tsang et al. [51] and Xu et al. [52] emphasize that a building’s shape significantly dictates the pedestrian wind environment. A broader building structure induces a potent downstream sheltering effect, culminating in reduced wind speeds downstream. In contrast, a taller structure redirects more upper-level winds towards pedestrian areas, thereby augmenting the wind speed on the windward side [51]. Moreover, it is also found that buildings with extended and flatter cross-sections demonstrate intensified wind blocking effects and greater susceptibility to wind direction [52]. The pedestrian wind environment between two high-rise structures is shaped by both the distance and angle between them. Blocken [53] and Li [54] posited that, when the distance between buildings diminishes below a specific threshold, the flow around the corners merges and triggers powerful winds. Additionally, Tsang et al. [51] concluded that broadening the gap between the buildings decreases the high wind speed zone on both sides, enhancing the adjacent building areas’ wind environment. However, this simultaneously enlarges the area of low wind speed farther away.
Previous research on pedestrian wind environments in building clusters has shown divergence in their results. For instance, Feng et al. conducted simulations using ENVI-met 4.0, deducing that the wind environment deteriorates with ascending building density and average height [55]. Conversely, studies by Ying et al. [56] and Ma et al. [33] report that beyond a certain breakeven point, building height ceases to negatively impact the wind environment and may even enhance it [32]. Additional research reveals that plot ratio exerts influence on the wind environment but is overshadowed by building density [57,58]. Analyses on the effect of design factors such as building spacing [32], windward area ratio, and enclosure ratio [59] have identified that reduced building spacing, enlarged windward area, and enclosure ratios contribute to a compromised outdoor wind environment. Research by scholars like Iqbal et al. [60], Jin et al. [58], and Gan et al. [61] have accentuated the interplay between residential neighborhood and wind direction as pivotal in shaping the wind environment.
In studies focusing on the impact of residential building complex layouts, classifications are often made based on building forms and cross-section shapes. Residential layouts can be typified into row-column, perimeter, clustered, and hybrid forms, and point, slab, and slab-point hybrid layouts regarding cross-section shape [62]. Findings from Ma et al. indicate that row-column layouts are conducive to creating better wind environments, while perimeter layouts hinder them [33]. Shui et al. [35] conversely propose that perimeter layouts foster more substantial wind comfort zones than row-column ones. Further, Yu et al. [32] ascertain that among varied combinations of building forms under different cross-sectional shapes, the slab-point hybrid layout is best situated within a row-column layout and worst in a perimeter layout. Residential layouts can also be further classified according to the displacement of buildings and the degree of enclosure [32,63]. Studies by Wei et al. signify that building displacement does not improve wind environments [64], while Zhang et al. [65], Chang et al. [66], and Peng et al. argue that specific displacement arrangements are more conducive to achieving favorable wind environments [67].
Upon examining the existing research on the pedestrian wind environment, several critical methodological and conceptual gaps become evident that fundamentally limit the applicability of current findings. First, the conflicting conclusions regarding optimal layout types stem from a fundamental lack of standardization in evaluation criteria and layout categorization systems across studies. While some researchers advocate for row-column layouts as optimal [32,33], others support perimeter layouts [34,35], these contradictions arise because studies employ different wind speed thresholds, measurement methodologies, and performance metrics, making direct comparisons impossible. This methodological inconsistency has prevented the establishment of evidence-based design guidelines that practitioners can confidently apply. Second, the lack of comprehensive research spanning multiple climatic zones regarding pedestrian wind environments in high-rise residential neighborhoods in China creates a critical knowledge gap that limits the development and implementation of region-specific design strategies.
The above research limitations have practical consequences for urban design practice. Without climate-specific evaluation standards and quantified relationships between design parameters and pedestrian comfort, practitioners must rely on general guidelines that may be inappropriate for local conditions. The absence of systematic parameter sensitivity analysis means that design resources are allocated inefficiently, with equal attention given to high-impact and low-impact design variables. Furthermore, the lack of predictive models linking neighborhood morphology to pedestrian wind performance prevents evidence-based optimization during the design process. The aim of this research is to address these fundamental gaps by establishing quantified relationships between neighborhood layout parameters and pedestrian wind environments across China’s diverse climate zones, using climate-specific comfort criteria that account for both mechanical and thermal wind effects. This approach enables the development of evidence-based design guidelines that can improve the quality of residential neighborhood environments while supporting climate adaptation strategies across different regional contexts.

3. Methodology

3.1. Evaluation of Pedestrian Wind Environment

This section presents the selected assessment criteria for pedestrian wind environments, which are validated, climate zone-specific, and account for both thermal and mechanical wind effects on pedestrians.

3.1.1. Pedestrian Wind Environment Requirements Based on Outdoor Thermal Comfort

Previous studies have studied the spatial distribution of outdoor thermal comfort evaluated by the Universal Thermal Climate Index (UTCI) across different climate zones in China during winter and summer [68]. In winter, zones characterized by hot summer and warm winter, as well as the southern part of the mild zones, can achieve thermal comfort. However, the northern part of the mild zones, areas with hot summer and cold winter, cold zones, and severely cold zones are perceived as thermally cold. In summer, zones with hot summer and warm winter, zones with hot summer and cold winter, and Zone B of the cold zones are all marked as overheated. In contrast, the mild zones, Zone A of the cold zones, and the severely cold regions, except for the Tibetan region, are close to achieving thermal neutrality.
Achieving outdoor thermal comfort in the categorized zones requires consideration of wind speed modulation. For zones experiencing severely cold, mild, and cold zone A, minimizing heat loss and preventing frostbite necessitates the reduction in wind speed during winter, while promoting heat diffusion calls for increased ventilation during summer. Likewise, in hot summer and cold winter zones, cold zone B, winter wind proofing as well as summer heat dissipation must be considered simultaneously. For zones experiencing hot summer and mild winter, increasing wind speed during summer to enhance heat dissipation should be prioritized.

3.1.2. Key Indicators for Evaluating Pedestrian Wind Environment

For zones with hot summer and warm winter, areas with hot summer and cold winter, and Zone B of cold zones that experience intense summer heat, the outdoor thermal comfort assessment chart developed by Cheng and Ng, which is based on a thermal sensation voting prediction model for hot areas [45], is highly valuable to be referred to. Given that the highest monthly average temperatures in these zones are all below 29.6 °C, according to Cheng and Ng’s chart, the acceptable minimum wind speed during summer in these areas is 1.5 m/s. Additionally, since the winter temperatures in zones with hot summer and warm winter are relatively high, the chart also suggests that the maximum acceptable wind speed during winter in these zones is 3.6 m/s.
For severely cold zones, cold zones, hot summer and cold winter climate, and mild climate during winter, it is preferable to have lower wind speeds to avoid discomfort or even frostbite in low-temperature conditions. According to relevant studies on wind-chill temperatures, and as per China’s Building Wind Environment Testing and Evaluation Standards [69], the maximum acceptable wind speed in winter is 1.8 m/s. Moreover, to ensure normal activities of residents in a residential neighborhood, the wind speed should be less than 5.4 m/s [39]. To meet ventilation needs during summer, the residential’s wind speed should be higher than 1 m/s.
In summary, for severely cold zones, mild zones, and Zone A of cold zones, the acceptable wind speeds range from 0 to 1.8 m/s in winter and 1 to 5.4 m/s in summer. For Zone B of cold zones and areas with hot summer and cold winter, the acceptable wind speeds are 0 to 1.8 m/s in winter and 1.5 to 5.4 m/s in summer. For zones with hot summer and warm winter, they are 0 to 3.6 m/s in winter and 1.5 to 5.4 m/s in summer. The summarized acceptable wind speeds of various climate zones can be found in Table 1. Additionally, as high-rise residential neighborhoods tend to form areas of strong and still winds, simply using a specific or average wind speed may not accurately reflect the pedestrian wind environment. Therefore, this study uses the proportion of areas with acceptable wind speeds as an evaluation metric to assess the quality of pedestrian wind environments.

3.1.3. Methodological Approach to Thermal Comfort Integration

While this study references thermal comfort indices such as UTCI to establish climate-specific wind speed thresholds, our CFD simulations employ isothermal wind flow analysis rather than direct integration of comprehensive thermal indices (UTCI, PET) within the computational framework. This methodological choice is made for several justified reasons. First, the primary objective is to establish quantitative relationships between neighborhood morphological parameters and wind flow patterns, which requires isolating the mechanical effects of building arrangements on air movement. Direct integration of thermal indices would introduce additional variables (air temperature, humidity, solar radiation) that would confound the analysis of morphological impacts on wind patterns.
Moreover, the computational complexity of coupled thermal–wind simulations across 281 scenarios would be prohibitively expensive while potentially obscuring the fundamental relationships between layout parameters and wind flow characteristics. Our approach follows established methodologies in urban wind environment research where mechanical wind effects are analyzed separately from thermal effects, with thermal comfort considerations applied through post-processing evaluation criteria [49,50].
The wind speed thresholds employed in our evaluation metrics are derived from established thermal comfort research and climate-specific adaptation studies, ensuring that thermal considerations are appropriately incorporated into the assessment framework without requiring direct thermal index computation within the CFD simulations. This approach enables efficient analysis of morphological parameter effects while maintaining relevance to pedestrian thermal comfort through evidence-based wind speed criteria.

3.2. Modeling of High-Rise Residential Layout

3.2.1. Plan Layout of High-Rise Residential Neighborhood in China

In this study, seven cities representing different climate zones and landform types in China were chosen for examination, including Shenyang (Zone 1), Beijing (Zone 2B), Yinchuan (Zone 2A), Shanghai (Zone 3), Chengdu (Zone 3), Shenzhen (Zone 4), and Kunming (Zone 5). Each city was selected based on distinct climatic and geographical characteristics, and cities with mountainous landform types were omitted due to the challenges in data collection and low demand for high-rise construction.
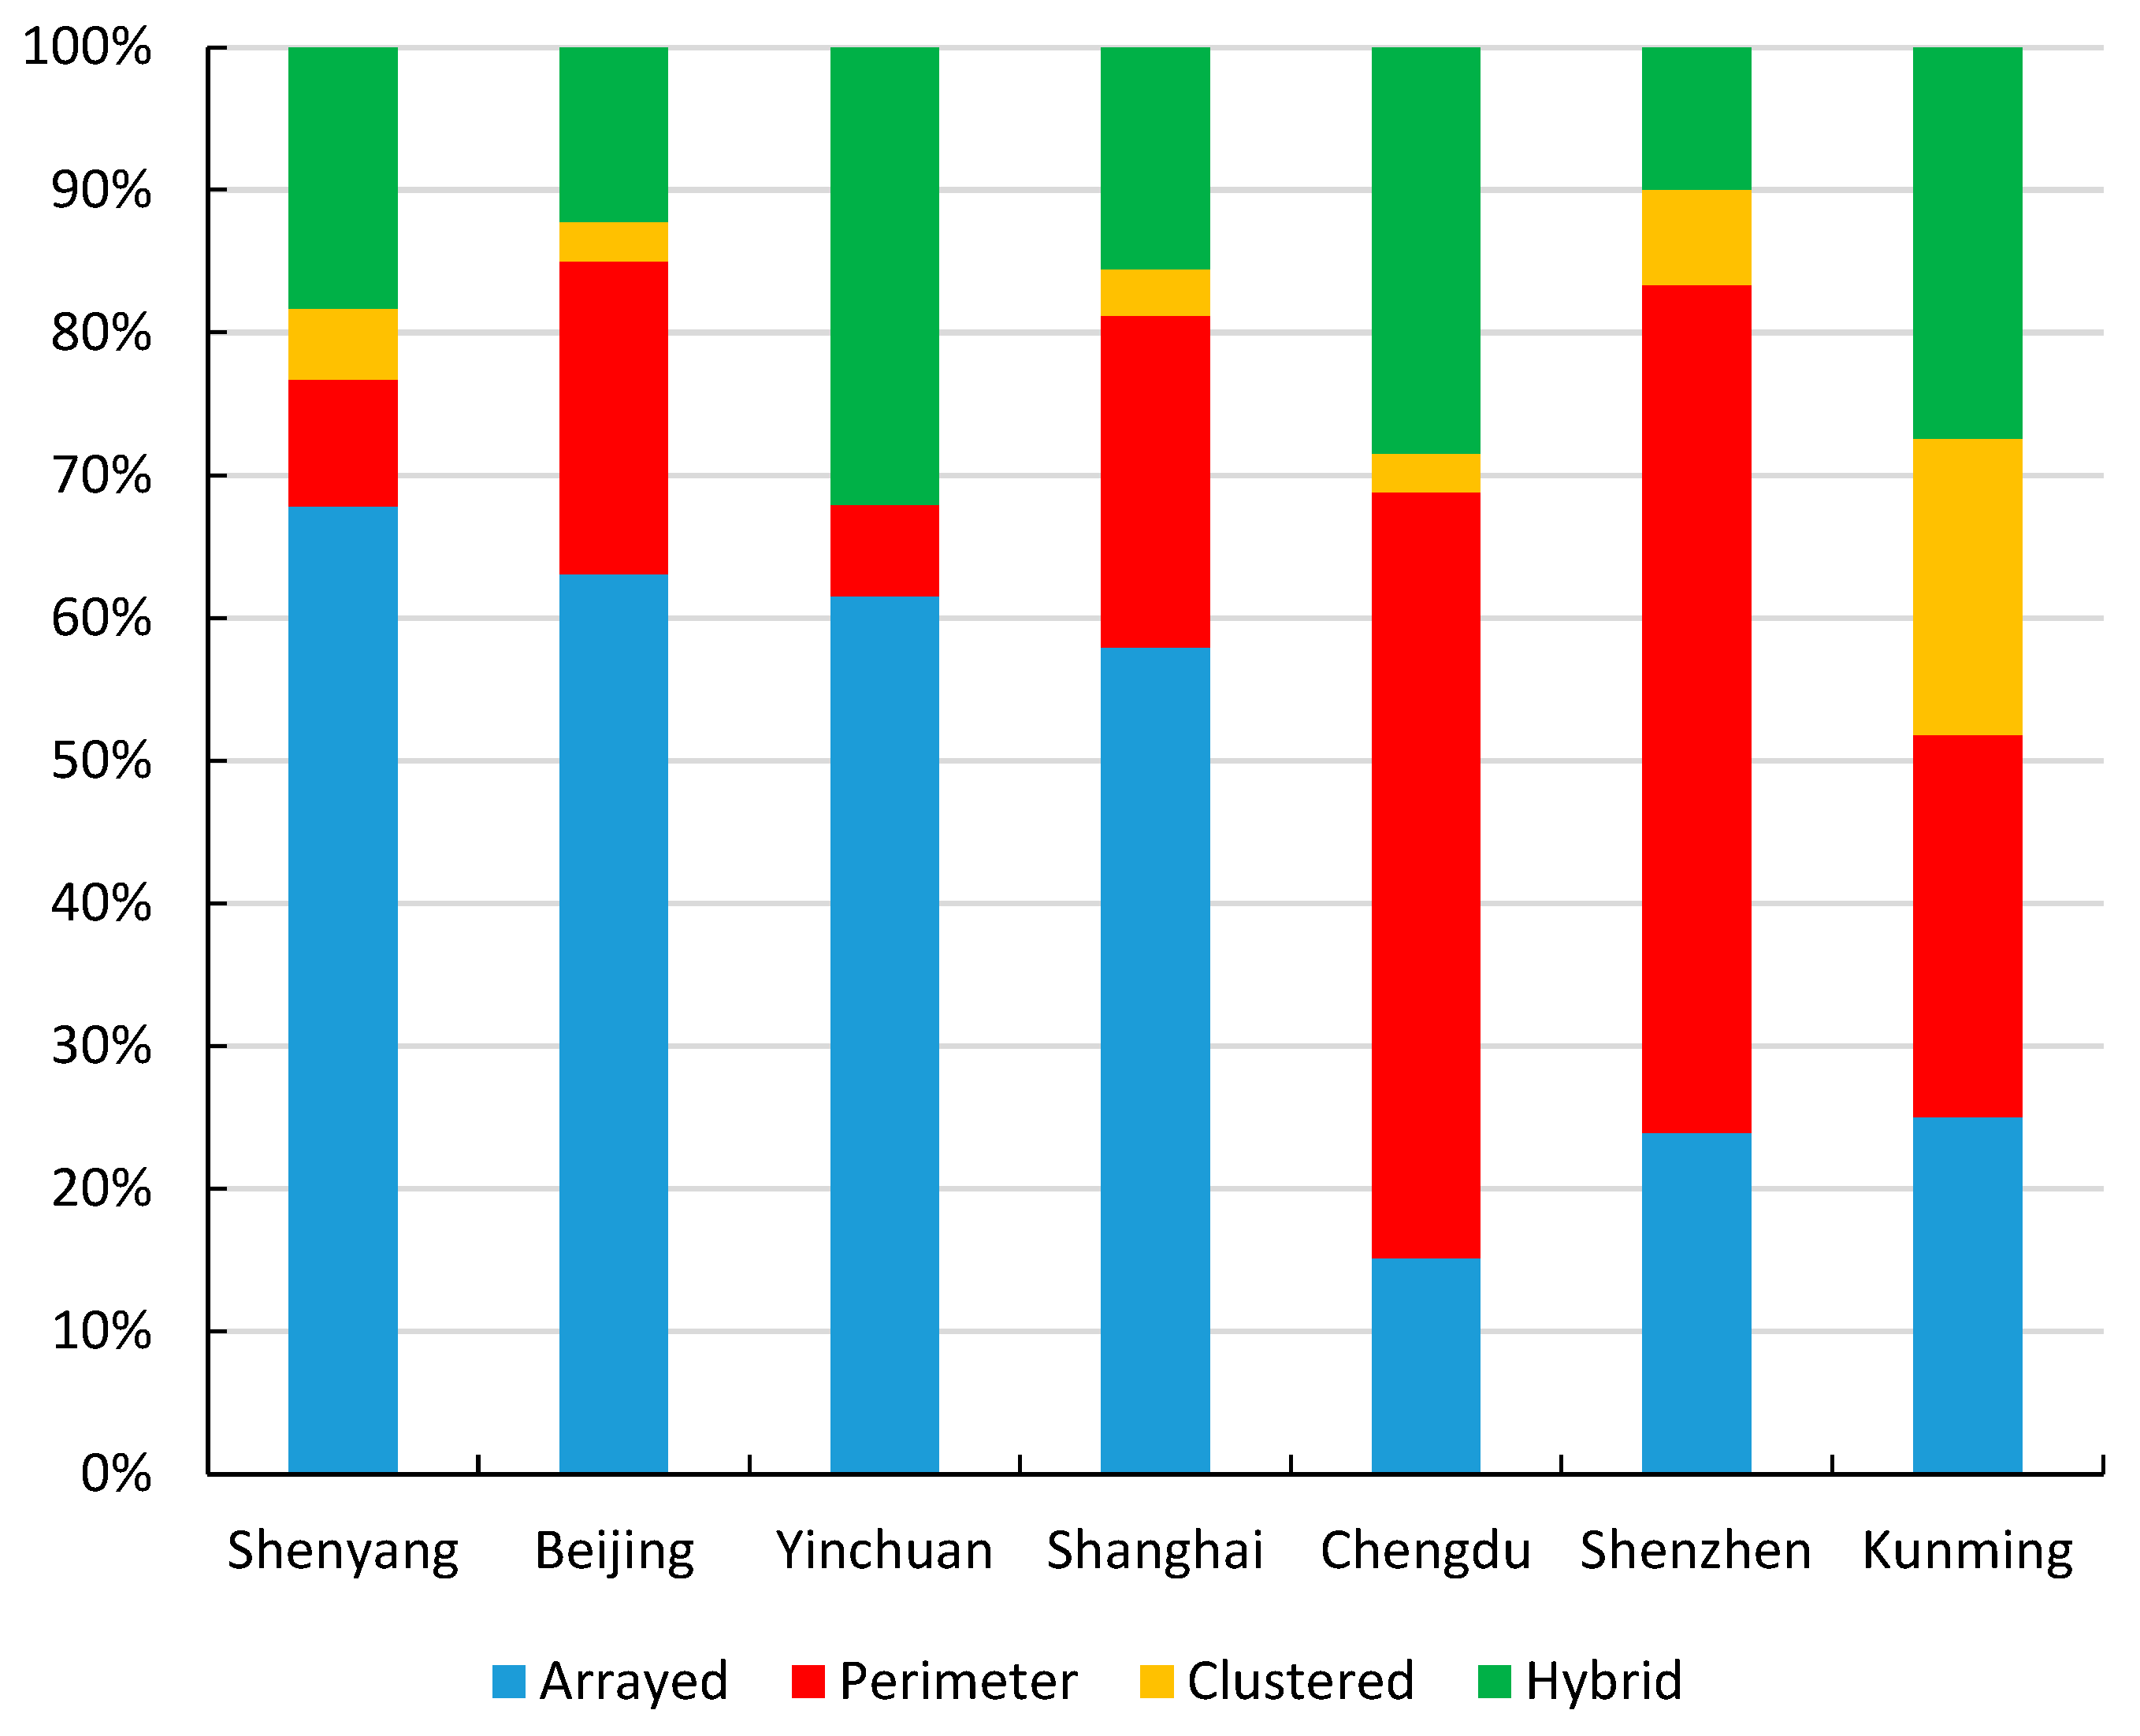
This study employed satellite maps to investigate 3263 high-rise residential neighborhoods in China, revealing specific patterns in building plan layouts. Neighborhoods were selected based on the following criteria: (1) building height ≥ 54 m (approximately 18 floors), (2) predominantly residential land use, (3) clearly identifiable boundary and layout configuration, and (4) construction completed before 2021 to ensure stable neighborhood form. The sampling covered all qualifying neighborhoods within the built-up urban areas of each city, providing comprehensive representation of high-rise residential development patterns across different climate zones. The neighborhood layout distributions in different cities are summarized in Figure 1 and the original collected data has also been shared as Supplementary Materials in an excel file. The categorization of neighborhoods into the six typical layout types followed systematic criteria based on observable morphological characteristics from satellite imagery. Parallel layouts were identified by buildings arranged in parallel rows with consistent orientation (deviation < 15°) and regular spacing. Staggered layouts featured buildings in parallel rows but with alternating positions creating a zigzag pattern. Closed perimeter layouts exhibited continuous building arrangements forming enclosed courtyards with enclosure ratio ≥ 0.60 and minimal openings. Semi-open perimeter designs showed partial courtyard enclosure with enclosure ratio between 0.45–0.60 and one or two deliberate openings. Open perimeter layouts maintain courtyard organization but with enclosure ratio < 0.45 and multiple openings or gaps. Clustered layouts demonstrated dispersed building distribution without clear linear or perimeter organization patterns. Neighborhoods exhibiting characteristics of multiple layout types without clear dominance were classified as hybrid. Two independent reviewers conducted the categorization with discrepancies resolved through discussion, achieving 94% initial inter-rater agreement.
It is found that residential neighborhoods with arrayed and slab layout features often arrange buildings in parallel alignment or in a staggered manner. Areas with perimeter and slab layout features typically form enclosed residential courtyards. Those with a combination of perimeter and point-slab layouts often place point-style buildings at the east and west edges of the site and slab-style buildings at the north and south edges. Residential neighborhoods with perimeter and point-style layouts usually create open residential courtyards, while those with clustered layout features often demonstrate an arrayed distribution. Additionally, for residential neighborhoods with arrayed and point-slab mixed layouts, mixed and slab layouts, and mixed point-slab layouts, due to the significant differences in their plan layout characteristics, this study did not refine the plan layout patterns of these three types of residential neighborhood. Based on the classification methods of plan layouts [29,62,63] and the actual characteristics of high-rise residential plan layouts, six typical high-rise residential plan layouts were ultimately refined via parallel, staggered, closed perimeter, semi-open perimeter, open perimeter, and clustered layouts, as shown in Figure 2.
The examination of land area, building density, and number of floors of high-rise residential neighborhood across China has led to findings that contribute to understanding the prevailing characteristics of these areas. The data reveals that most of the high-rise residential neighborhoods fall within a land area ranging from 2 ha to 4 ha. Furthermore, building density mainly ranged between 14% and 20%, with buildings typically comprising 14 to 18 floors. These key features are reflective of the prevalent construction trends and urban planning considerations within China’s diverse zones. This analysis was further enhanced by reference to the Planning and Design Standards for Urban Residential Neighborhood [70]. By aligning the empirical findings with these established standards, it was possible to determine specific parameters for the high-rise residential examined in this study. Specifically, a plot area of 3.24 ha (180 m * 180 m), a building density of 16%, and a building height of 54 m were identified as a representative residential neighborhood.

3.2.2. Design Parameters of Plan Layout

Four key design parameters are used to assess the plan layout of high-rise residential neighborhoods in this study.
  • Enclosure Ratio (E):
    The enclosure ratio measures the extent to which buildings surround the site and is defined as the proportion of the combined length of building edges along all four sides of the site to the perimeter of the site. The calculation of the enclosure ratio is given by Equation (1):
    E = i = 1 n l i C
    where l i represents the length of each building along the site’s edge, and C denotes the site’s perimeter.
  • Average Windward Area Ratio ξ s ¯ :
    The average windward area ratio is a vital parameter that quantifies the exposure of buildings to wind. It calculates the average ratio of the projected area of all buildings in the site on the incoming wind direction to their maximum projected area. The mathematical expression for the average windward area ratio is provided in Equation (2):
    ξ s ¯ = 1 n i = 1 n A F i A F i m a x
    where A F i represents each building’s projected area in the direction of incoming wind, A F i m a x denotes the maximum projected area, and n indicates the number of buildings in the site.
  • Average Building Aspect Ratio:
    This ratio provides an estimation of the proportional relationship between the length and width of the buildings, and it pertains to the average ratio of the long side of the cross-section of all buildings in the site to the short side.
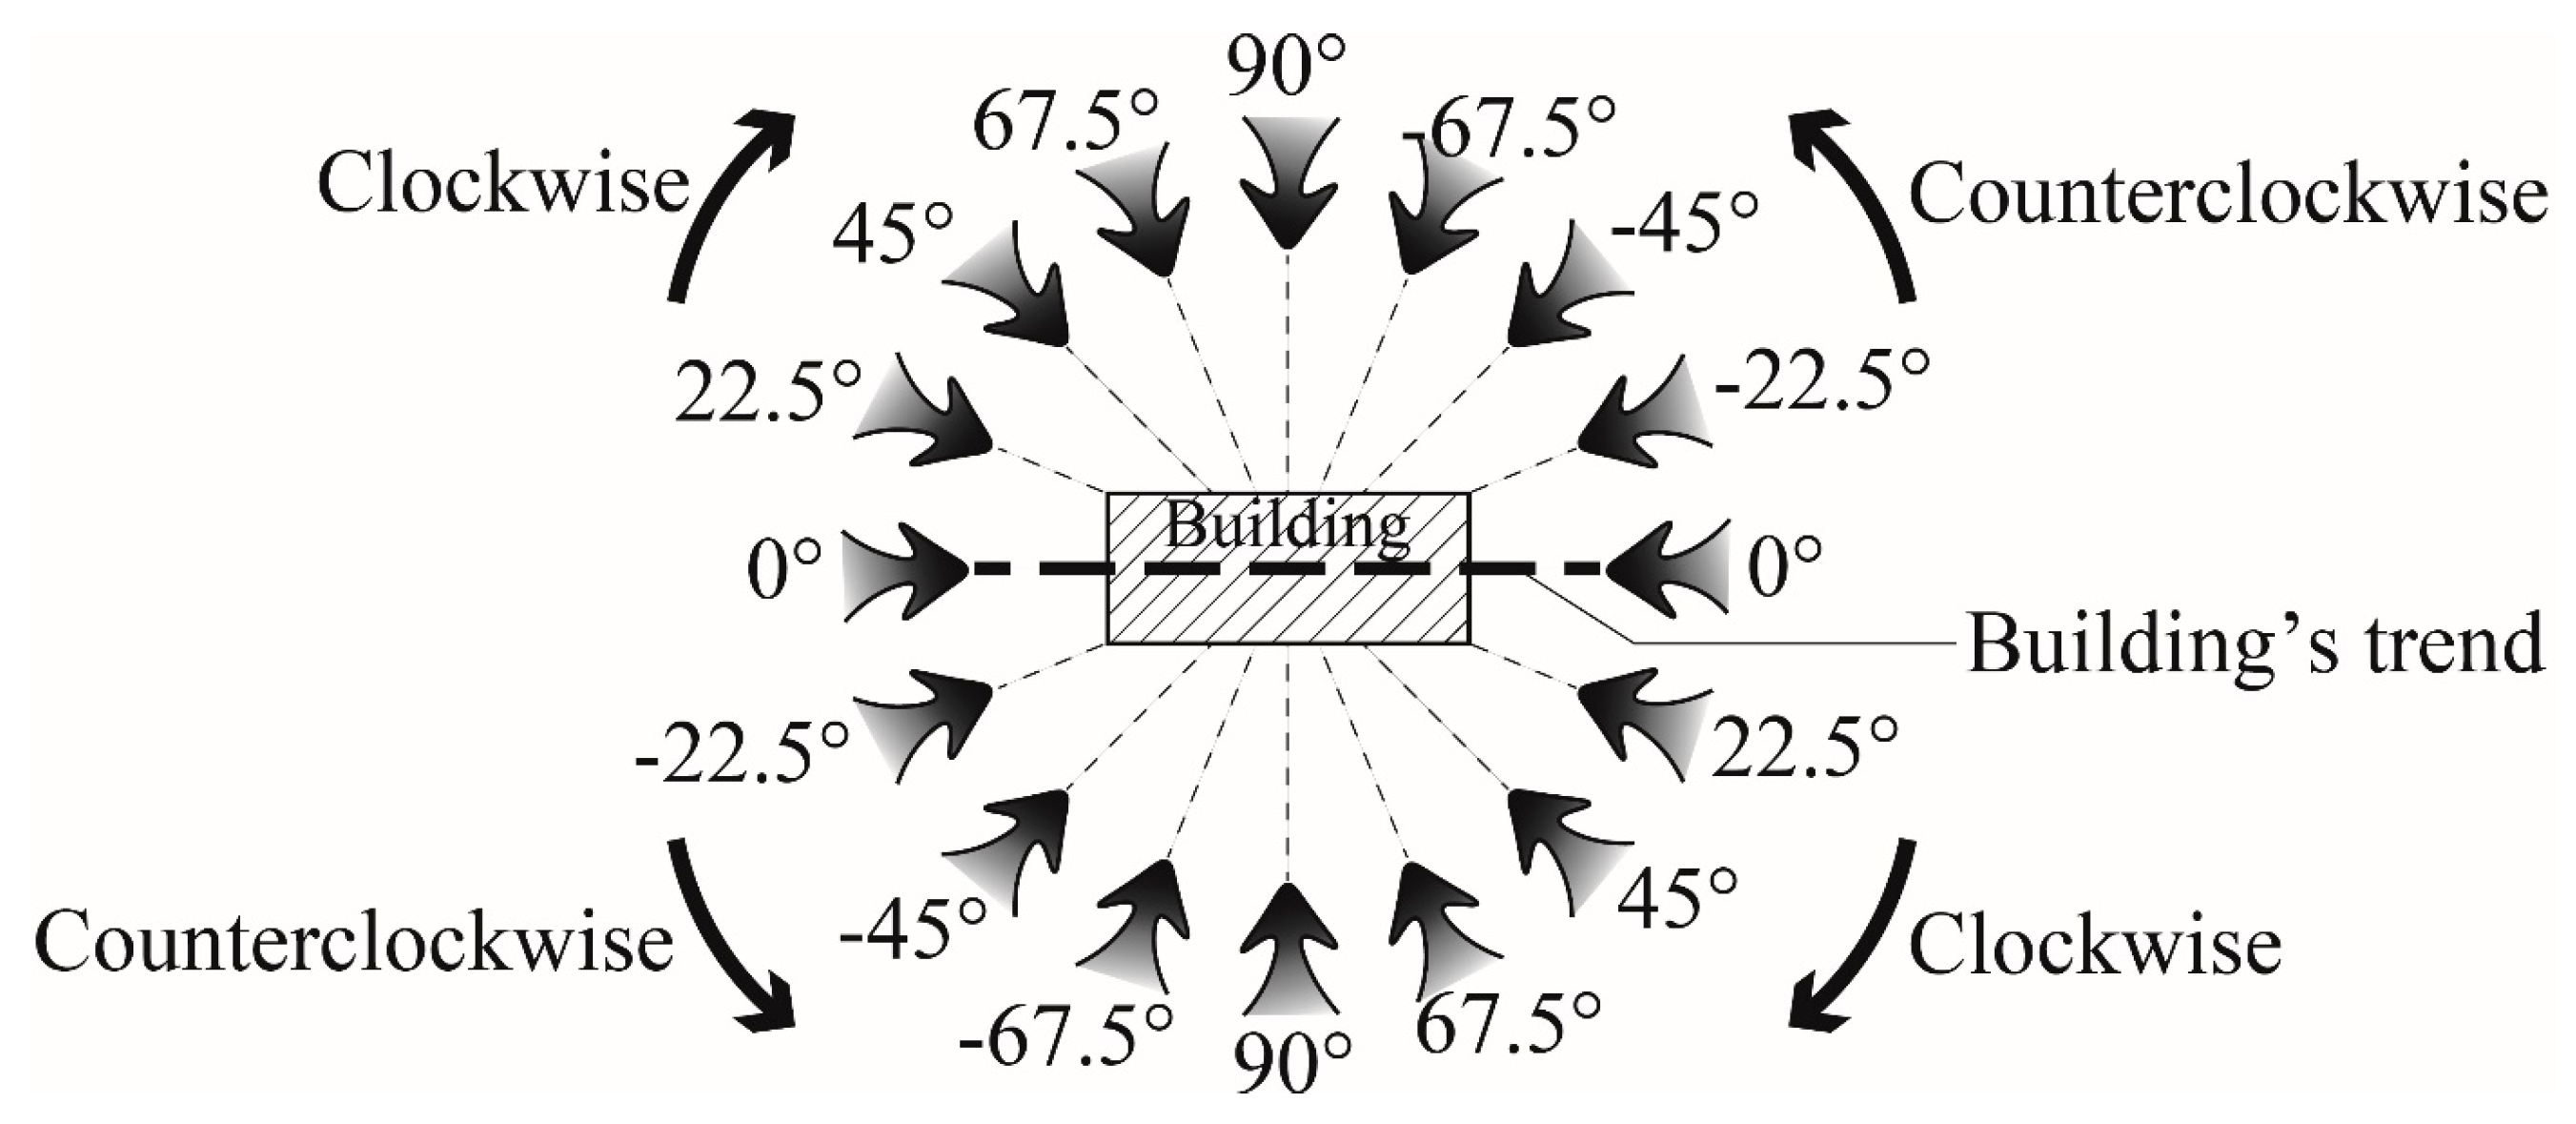
  • Wind direction:
    The wind direction defines the orientation of wind relative to the main building orientation within the site. It follows a specific convention, where clockwise rotation represents the positive direction, and counterclockwise rotation symbolizes the negative direction, as shown in Figure 3.
Detailed information of the design parameters can be found in Table 2.

3.2.3. Incoming Wind Conditions

To assess varying incoming wind conditions, several key wind parameters are considered, including prevailing wind direction, wind frequency, and average wind speed. The data shown in Table 3 illustrates the seasonal variations in the wind direction and average wind speed in various climate zones.
In extremely cold, cold, and hot zones, the prevailing wind direction varies in winter and summer. However, in mild climate zones like Kunming, the prevailing wind direction remains consistent throughout the year (southwest to west wind). In addition to analyzing the wind characteristics, the study identified five different orientation layouts: southwest-facing, southwest-south-facing, south-facing, southeast-south-facing, and southeast-facing. A comprehensive simulation work was conducted by combining these orientation layouts with the six typical floor plan layouts and prevailing wind conditions in each city. This resulted in a total of 281 scenarios, reflecting a thorough analysis and consideration of the unique climatic characteristics of each climate zone.

3.3. Numerical Setups

3.3.1. Numerical Models

Although large-eddy simulations (LESs) have been shown to predict turbulent flow near buildings more accurately than Reynolds-Averaged Navier–Stokes (RANS) approaches [71,72], and advanced RANS models such as the modified k-ε [73], RNG k-ε [74] and SST k-ω [75] offer improved performance over the standard k-ε model, our selection of the standard k-ε model was based on several critical considerations for this comprehensive 281-scenario study. First, computational efficiency was paramount given the extensive parameter space requiring systematic analysis across multiple climate zones, building configurations, and wind conditions. LESs, while more accurate for complex flow phenomena, would require computational resources approximately 100–1000 times greater than RANS approaches, making the comprehensive parameter analysis conducted in this study computationally prohibitive [76,77].
Second, while RNG k-ε and SST k-ω models [75] demonstrate superior performance in capturing complex flow separation and reattachment phenomena around individual buildings, the performance improvement over standard k-ε becomes less pronounced when evaluating area-averaged wind speed metrics across entire neighborhoods, which constitutes our primary evaluation approach. Third, the standard k-ε model, despite its tendency to overpredict turbulence around building windward corners [78], remains the most widely validated turbulence model for urban airflow applications and has demonstrated satisfactory performance in systematic urban wind environment studies [79,80].
The trade-off between accuracy and computational feasibility was carefully considered. Our validation results in the forthcoming Section 3.4 demonstrate acceptable agreement between CFD simulations and experimental data, with average absolute differences ranging from 0.06 to 0.10 across measurement locations. While more advanced turbulence models might provide marginal improvements in local flow prediction accuracy, the systematic bias inherent in the standard k-ε model affects all simulations consistently, allowing for reliable comparative analysis of layout parameter effects. Furthermore, the focus on neighborhood-scale performance metrics rather than detailed local flow phenomena reduces the impact of local turbulence model limitations on overall conclusions.
For the scope of this research, which prioritizes establishing quantitative relationships between morphological parameters and pedestrian-level wind environments across diverse climate conditions, the standard k-ε model provides an appropriate balance between computational efficiency and adequate accuracy for comparative analysis. Future studies focusing on detailed flow physics around specific building configurations would benefit from employing more advanced turbulence models or LES approaches.

3.3.2. Domain Configuration and Grid Generation

The computational domain and grid generation for the simulation follow specific guidelines to ensure accuracy and reliability. Based on the European Cooperation in Science and Technology (COST) CFD Simulation Guidelines [81], the boundaries of the calculation domain were determined. The inlet, side, and top boundaries were set at a distance of 5H from the model’s maximum building height H, and the outlet boundary was set at a distance of 15H from the model. Regarding grid resolution, a validated, physics-based strategy was employed as per COST guidelines, ensuring a grid resolution of at least 10 cells per cube root of building volume and per building separation in the area of interest [81]. The mesh division adhered to the following principles: maintaining at least 3 layers of mesh from the ground up to a height of 1.5 m; ensuring that the ratio of adjacent mesh sizes falls between 1 and 1.2; setting up boundary layer meshes near the building walls with at least 3 layers [81]. The y+ values, which are a key indicator of the near-wall mesh quality for accurately capturing the boundary layer effects, varied across a reasonable range. In this study, y+ values predominantly ranged between 80 and 120, which falls within the acceptable limits for accurate turbulence modeling and boundary layer prediction in CFD simulations of urban wind environments.

3.3.3. Boundary Conditions

The simulation conditions were precisely defined to align with the specific requirements of the study. The inlet and outlet boundaries were assigned the velocity-inlet and pressure-outlet conditions, respectively. The symmetry condition was used for the top and side boundaries. The no-slip wall condition was adopted for both the ground and the building walls. The velocity parameter at the inlet boundary was determined by the following formula:
U z = U r e f   h z h r e f β
Turbulence settings at the inlet and outlet boundaries utilize turbulence kinetic energy and turbulence dissipation rate, defined by the subsequent formulas:
k z = D 1 h z β + D 2
ε z = β C μ 1 2 U z h z D 1 h z 1 2 + D 2
In the formula, U(z) represents the wind speed at height z, k(z) denotes the turbulent kinetic energy at point z, and ε(z) is the turbulence dissipation rate at point z. Uref is the wind speed at the reference height, hz is the height above ground at point z, and href is the height for the reference wind speed. β is the roughness index, while D1 and D2 are constants. Cμ is a constant for the turbulence model, which is taken as 0.09. The parameters β, D1, and D2 correspond to terrain category D (densely populated zones with medium and high-rise buildings) according to Table 4 in Building Wind Environment Testing and Evaluation Standards in China [82]. For this terrain classification, the parameters were set to β = 0.3, D1 = 9.944, and D2 = 298.700, representing the atmospheric boundary layer characteristics appropriate for high-rise residential neighborhoods. The reference wind speed height was maintained at 10 m, consistent with meteorological measurement standards.

3.4. CFD Validation

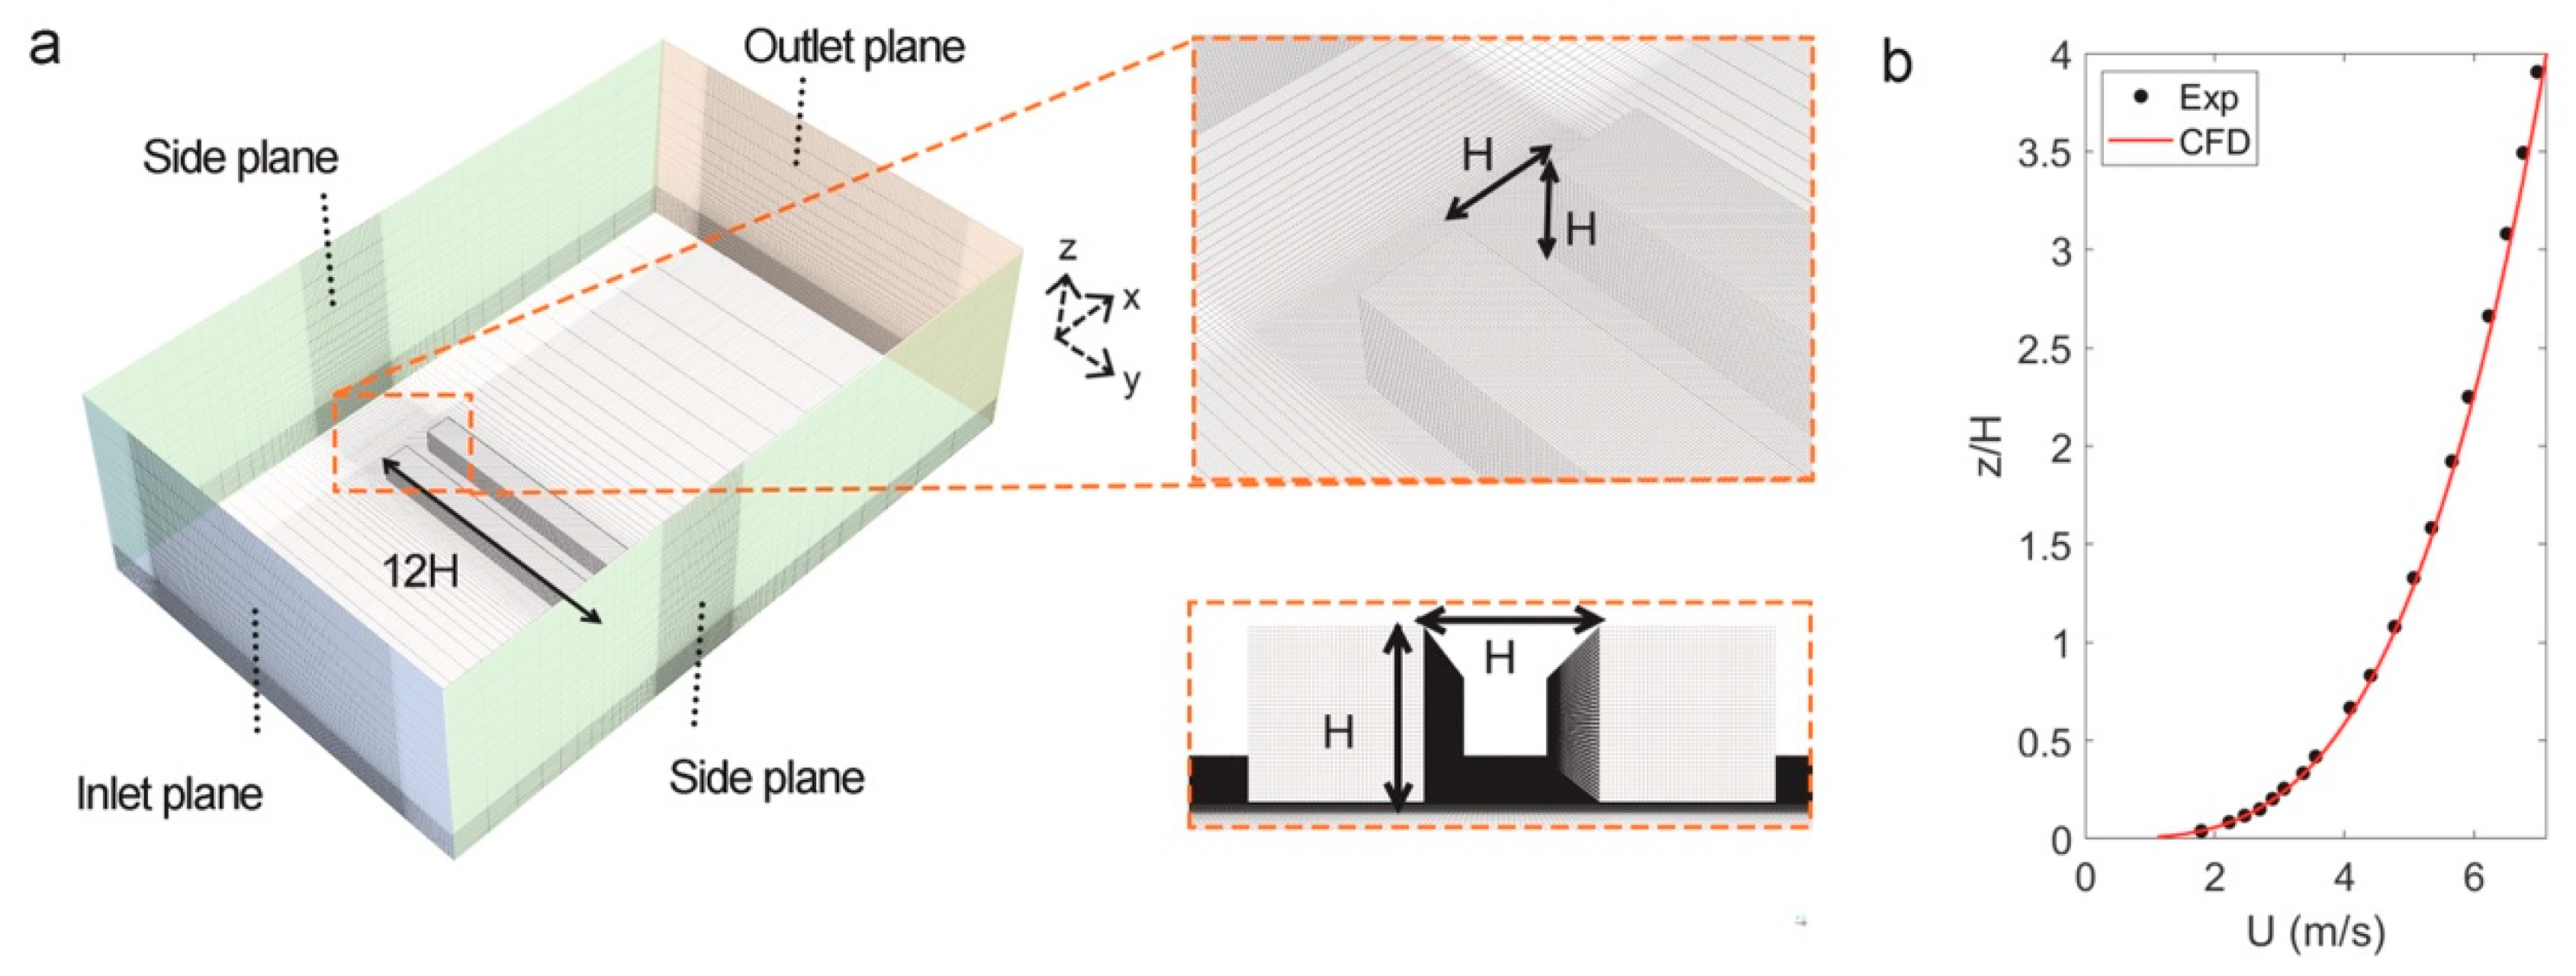
Validation of the model is a crucial aspect of ensuring the simulation’s integrity. To validate the accuracy of RANS in modeling wind flow in street canyons, Wind-tunnel data from the experiment [83,84] are employed. The wind-tunnel experiments were conducted using a simplified street canyon model composed of two parallel buildings, each with dimensions of 0.12 m × 0.12 m × 1.2 m (height × depth × length), and a street width of 0.12 m between them, as shown in Figure 4a. The model was scaled at 1:150, with the approaching wind oriented perpendicular to the street axis. Mean vertical velocity components (W) were measured along four vertical lines (reduced scale: x/H = 0.083, 0.25, 0.75 and 0.917) in the xz-plane that is perpendicular to the canyon axis (y/H = 0.5) using laser-Doppler velocimetry (see Figure 5). This experiment has been widely used for validation purpose [25,71,85]. To replicate the experimental conditions in the simulation, no-slip wall conditions were applied to all building surfaces and domain boundaries. Additionally, the inlet boundary conditions for mean wind velocity and turbulent kinetic energy were prescribed based on the wind tunnel profiles, as shown in Figure 4b. The turbulence model and other numerical settings are the same as those mentioned in Section 3.3.1.
Validation results, shown in Figure 5, compare the dimensionless mean vertical velocity component (W/Uref) from RANS simulations with wind tunnel measurements along four vertical lines. The simulations show good agreement with experiments. The average absolute differences between measurements and CFD along lines x/H = 0.083, 0.25, 0.75 and 0.917 are 0.10, 0.06, 0.08 and 0.10, respectively. These results confirm the accuracy of the CFD setup for analyzing the impact of high-rise neighborhood layout configurations on pedestrian wind environment.
The validation approach in this study using a single wind tunnel case represents a potential limitation in establishing comprehensive CFD setup reliability. The selected street canyon configuration [83,84] was chosen because it represents a fundamental building cluster geometry widely used for CFD validation in urban wind studies [25,71,75], providing a standardized benchmark for turbulence model performance assessment. However, this simple two-building configuration does not fully represent the complex flow interactions present in dense residential neighborhoods with multiple buildings, varying spacing, and diverse orientations. Multiple benchmark cases involving complex building clusters would strengthen validation robustness but were not employed due to limited availability of detailed experimental data for high-rise residential configurations matching our study parameters. Most existing wind tunnel studies focus on simplified geometric configurations or commercial building districts rather than residential neighborhood layouts. The validation results demonstrate acceptable model performance for basic flow phenomena but may not fully capture complex interactions such as flow channeling between multiple buildings, corner flow superposition effects, or wake interference patterns that significantly influence pedestrian-level wind conditions in actual neighborhoods. Despite this validation limitation, the systematic bias inherent in the turbulence model affects all 281 simulation scenarios consistently, enabling reliable comparative analysis of layout parameter effects even if absolute wind speed predictions contain uncertainties. Future studies would benefit from developing comprehensive validation datasets specifically for residential neighborhood configurations to improve CFD model reliability for urban design applications.

4. Results

4.1. Pedestrian-Level Wind Environment Performance by Climate Zone

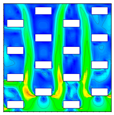
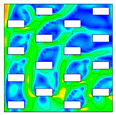
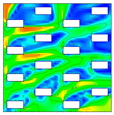
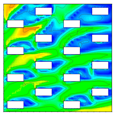
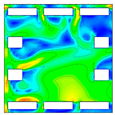
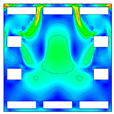
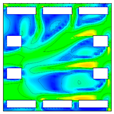
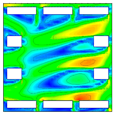
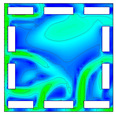
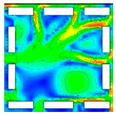
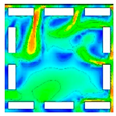
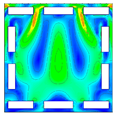
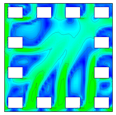
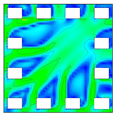
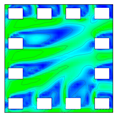
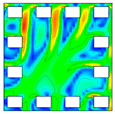
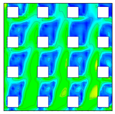
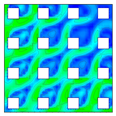
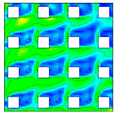
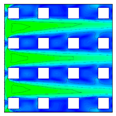
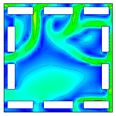
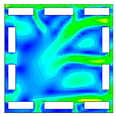
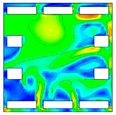
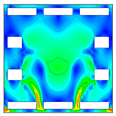
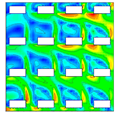
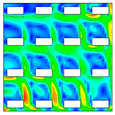
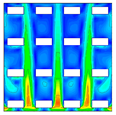
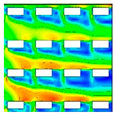
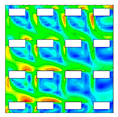
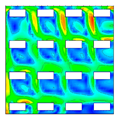
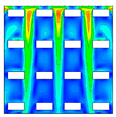
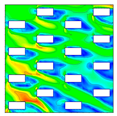
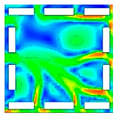
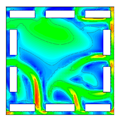
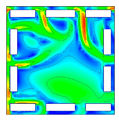
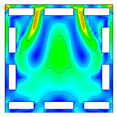
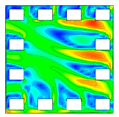
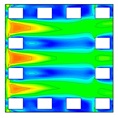
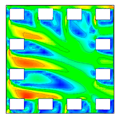
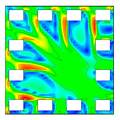
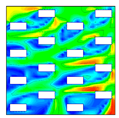
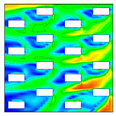
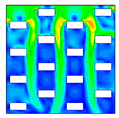
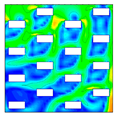
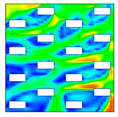
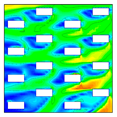
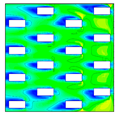
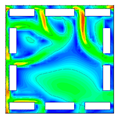
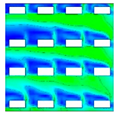
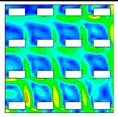
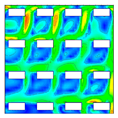
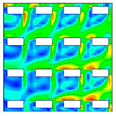
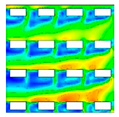
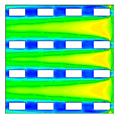
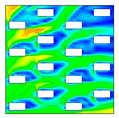
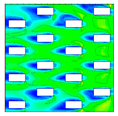
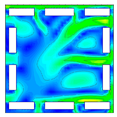
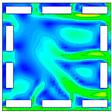
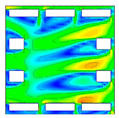
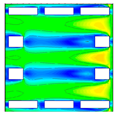
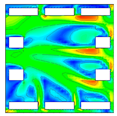
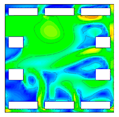
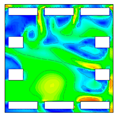
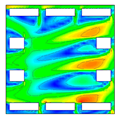
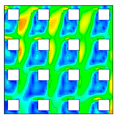
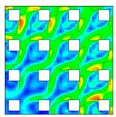
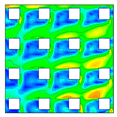
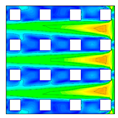
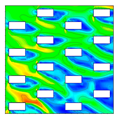
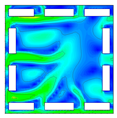
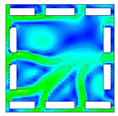
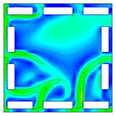
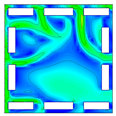
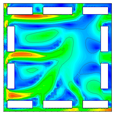
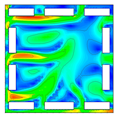
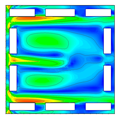
Table 5 and Figure 6 demonstrate the proportion of pedestrian-level acceptable wind speed area ratios for various typical neighborhood plan layouts across all climate zones. All the analysis made in the section and in later discussion section are based on the insights of the results of the intensive CFD simulations conducted in this study, the details of which can be found in Appendix A.

4.1.1. Severely Cold Zones

Shenyang, representing severely cold regions, demonstrates a clear preference for enclosed designs during winter months. The closed perimeter layout emerges as the optimal configuration, achieving pedestrian-level acceptable wind speed area ratios of 70–75% compared to 45–50% for open perimeter layouts during winter conditions. As shown in Table 5, closed perimeter layouts provide superior winter protection with the highest acceptable wind speed coverage across most residential areas, maintaining wind speeds within the 0–1.8 m/s range when outdoor temperatures are critically low.
During summer, the performance hierarchy shifts notably. Semi-open perimeter layouts provide the most favorable conditions with pedestrian-level acceptable wind speed area ratios reaching 80–85%, followed by closed perimeter designs at 75–80%. The parallel and staggered layouts show intermediate performance, with pedestrian-level acceptable wind speed area ratios of 70–75%, while clustered arrangements consistently underperform, achieving only 65–70%. Most layout types achieve acceptable wind conditions across the majority of residential spaces during summer, indicating that winter protection is the primary design driver in these regions.

4.1.2. Cold Zones

Cold zones exhibit distinct characteristics between Zone A and Zone B [68], as detailed in Figure 6. In Cold Zone A, represented by Yinchuan, the closed perimeter layout provides superior winter performance with pedestrian-level acceptable wind speed area ratios of 85–90%, ensuring adequate wind protection across most residential areas. The parallel and staggered layouts also perform well with pedestrian-level acceptable wind speed area ratios of 75–85%, though with slightly reduced effectiveness compared to closed perimeter designs.
Cold Zone B, exemplified by Beijing, presents more challenging conditions with generally lower proportions of acceptable wind speed areas across all layout types during winter. The staggered layout performs best under these demanding conditions with pedestrian-level acceptable wind speed area ratios of 45–50%, followed by parallel (40–45%) and closed perimeter configurations (40–45%). Summer conditions show a clear advantage for semi-open perimeter (65–70%), open perimeter (60–65%), and clustered layouts (55–60%), which consistently outperform closed perimeter designs (50–55%) in providing necessary ventilation.

4.1.3. Hot Summer/Cold Winter Zones

The analysis of Shanghai and Chengdu reveals significant intra-regional variation within hot summer/cold winter zones, as detailed in Figure 6. Shanghai, with higher average wind speeds and seasonal directional variations, shows markedly different performance patterns compared to Chengdu, which experiences lower wind speeds and more consistent wind directions throughout the year.
For winter conditions, closed perimeter layouts demonstrate superior performance in both cities, with Shanghai achieving pedestrian-level acceptable wind speed area ratios of 50–55% and Chengdu reaching 85–95%. In Shanghai, closed perimeter and clustered layouts maintain acceptable wind speeds across most residential areas, while semi-open and open perimeter designs perform less effectively, with pedestrian-level acceptable wind speed area ratios of only 30–40%. Summer performance reveals the inverse pattern, with semi-open perimeter designs providing optimal conditions in both cities, achieving pedestrian-level acceptable wind speed area ratios of 60–65% in Shanghai and 40–50% in Chengdu.

4.1.4. Hot Summer/Warm Winter Zones

Shenzhen, representing hot summer/warm winter conditions, demonstrates relatively balanced performance across layout types during winter, with most configurations achieving pedestrian-level acceptable wind speed area ratios of 85–95%. This characteristic distinguishes these zones from colder regions where winter performance varies dramatically between layout types.
Summer conditions reveal clearer differentiation. Semi-open perimeter and open perimeter layouts provide optimal performance with pedestrian-level acceptable wind speed area ratios of 60–65%, effectively maintaining acceptable conditions across most residential areas for necessary heat dissipation. Parallel, staggered, and clustered layouts show intermediate performance, with pedestrian-level acceptable wind speed area ratios of 50–60%, while closed perimeter designs provide the least favorable summer conditions, achieving only 35–40%.

4.1.5. Mild Climate Zones

Kunming, representing mild climate zones, exhibits performance patterns similar to cold regions, with winter conditions driving design priorities. Closed perimeter layouts provide significantly superior winter performance, achieving pedestrian-level acceptable wind speed area ratios of 55–60% compared to semi-open (35–40%) and open perimeter configurations (35–40%), effectively maintaining acceptable wind speeds across most residential spaces.
Summer performance follows the established pattern observed in other climate zones, with semi-open perimeter layouts providing optimal conditions, with pedestrian-level acceptable wind speed area ratios of 75–80%. Open perimeter (70–75%), parallel (65–70%), and staggered layouts (65–70%) show comparable intermediate performance, while closed perimeter designs achieve more limited pedestrian-level acceptable wind speed area ratios of 50–55%. The clustered layout demonstrates consistent underperformance across both seasons (40–45% winter, 50–55% summer), making it the least recommended configuration for mild climate zones.
Our comprehensive analysis across all climate zones reveals consistent patterns: closed perimeter layouts optimize winter performance in regions where cold protection is critical, while semi-open and open perimeter designs excel in summer conditions across all climate zones. The magnitude of these performance differences varies significantly by region, with more extreme climates showing greater differentiation between optimal and suboptimal layout choices, as summarized in Table 5.

4.2. Effects of Design Parameters and Incoming Wind Conditions

This section presents the quantitative relationships between key design and incoming wind parameters and pedestrian-level wind environment performance, providing the empirical foundation for design optimization. Table 6 summarizes and the key relationships and statistical measures for each parameter, while the following subsections detail the mechanisms underlying these relationships. The analysis reveals distinct patterns in how building enclosure ratio, average building aspect ratio, wind direction, average windward area ratio, and incoming wind speed affect pedestrian comfort across different climate zones. All reported relationships demonstrate statistical significance at p < 0.05 level. The regression models exhibit standard errors ranging from 0.12 to 0.18 for the primary coefficients, with 95% confidence intervals indicating reliable parameter estimates. The high R2 values (0.727–0.810) combined with low p-values confirm the robustness of the predictive relationships for design optimization applications.

4.2.1. Building Enclosure Ratio

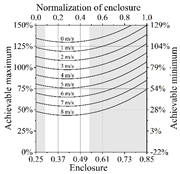
The building enclosure ratio emerges as the most influential parameter affecting pedestrian wind environments across all climate conditions, as summarized in Table 6. A consistent quadratic relationship between enclosure ratio and pedestrian-level wind environment performance is shown, with distinct patterns for winter and summer conditions. For winter wind proofing requirements, the relationship shows an initial deterioration followed by improvement as enclosure ratio increases, with optimal performance occurring at enclosure ratios of approximately 0.25–0.28 and 0.52–0.61.
The quadratic trend is even more pronounced when considering both winter wind proofing and summer heat dissipation requirements simultaneously. The analysis reveals R2 values of 0.75 for winter conditions and 0.71 for combined seasonal requirements, indicating strong predictive relationships. For summer heat dissipation alone, the pattern inverts, with initial improvement followed by deterioration as enclosure ratio increases, achieving R2 values of 0.94 for winter conditions and 0.56 for summer conditions.
The underlying mechanism driving this behavior relates to building spacing and corner flow superposition effects. As enclosure ratio increases, reduced building spacing initially amplifies the area of building corner flow superposition, intensifying wind within residential domains. When building spacing falls below a critical threshold, the corner flow superposition area reaches maximum extent. Further spacing reduction contracts this area, consequently enhancing winter wind protection while diminishing summer ventilation effectiveness.

4.2.2. Average Building Aspect Ratio

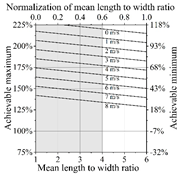
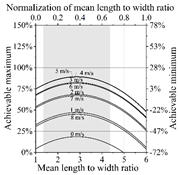
The average building aspect ratio demonstrates significant quadratic relationships with wind environment performance, particularly for summer conditions and combined seasonal requirements, as detailed in Table 6. For summer heat dissipation, the relationship shows R2 values of 0.33 for winter conditions and 0.79 for summer conditions, indicating stronger predictive power for summer performance.
When considering both winter wind proofing and summer heat dissipation simultaneously, the quadratic trend becomes more pronounced with R2 values of 0.83 for winter and 0.69 for summer conditions. The data indicate that increasing average building aspect ratio initially degrades winter wind environments while enhancing summer conditions, with this pattern subsequently inverting at higher aspect ratios.
For winter wind proofing alone, the relationship is less pronounced but still significant, with R2 values of 0.75 for winter and 0.31 for summer conditions. The optimal aspect ratios typically fall within the range of 1.75–2.75 for most climate conditions as shown in Table 6, balancing winter protection needs with summer ventilation requirements.

4.2.3. Wind Direction

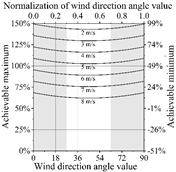
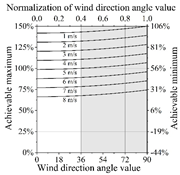
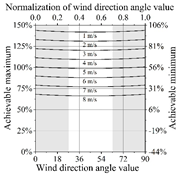
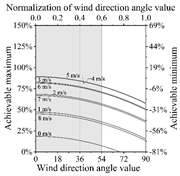
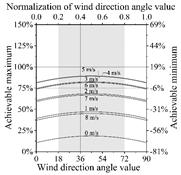
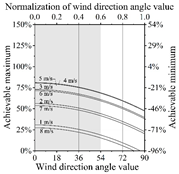
Wind direction effects manifest differently depending on the uniformity of perimeter boundary enclosure within residential neighborhoods, with correlation coefficients ranging from 0.85 to 0.99 as shown in Table 6. For neighborhoods with non-uniform enclosure degrees, clear quadratic function trends emerge for both winter and summer pedestrian wind environments. In non-uniform enclosure scenarios focusing on winter wind proofing, pedestrian-level wind environment performance improves with increasing wind direction angles, achieving R2 values of 0.96 for both winter and summer conditions. Conversely, summer wind environments decline with increased wind direction angles. When both seasonal requirements are considered simultaneously, higher wind environment evaluation indices are observed at 0° and 22.5° compared to 45°, attributed to relatively lower inflow wind speeds at these angles.
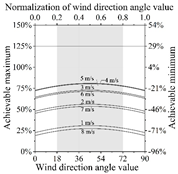
For uniform enclosure conditions, the relationships show different characteristics. Winter wind environments initially worsen then improve as angles increase, while summer environments follow the reverse pattern. The optimal wind direction yielding minimal winter evaluation index and maximal summer evaluation index occurs at approximately 45°, corresponding to differences in representative urban inflow wind speeds for each angle orientation.

4.2.4. Average Windward Area Ratio

The average windward area ratio effects vary significantly based on both wind direction and the uniformity of residential perimeter boundary enclosure, with correlation coefficients ranging from 0.33 to 0.66 as documented in Table 6. Pearson correlation analysis reveals significant negative correlations between windward area ratio and summer pedestrian wind environments for non-uniform enclosure degrees, while significant positive correlations exist for uniform enclosure degrees. For winter conditions, significant positive correlations occur primarily when focusing solely on winter wind proofing. When considering both winter wind proofing and summer heat dissipation, positive correlations emerge for summer performance but negative correlations for winter performance. These correlation coefficients range from 0.33 to 0.66, indicating moderate to strong relationships.
The analysis shows positive correlations between average windward area ratio and summer pedestrian wind environments, with linear trends apparent for winter wind proofing under non-uniform enclosure degrees and for combined seasonal requirements under uniform enclosure degrees. Generally, increasing average windward area ratio leads to winter wind environment degradation but summer wind environment improvement.

4.2.5. Incoming Wind Speed

Incoming wind speed demonstrates pronounced relationships with wind environment evaluation indicators, showing distinct patterns for winter and summer conditions with consistently high predictive power (R2 > 0.88) as summarized in Table 6. For winter conditions, wind environment evaluation indicators decline consistently with increasing incoming wind speed, achieving R2 values of 0.8846 for the 0–1.8 m/s range and 0.946 for the 0–3.6 m/s range. This linear relationship reflects the direct impact of higher incoming wind speeds on winter comfort, where increased incoming wind speed consistently reduces pedestrian-level acceptable wind speed area ratios.
Summer conditions exhibit more complex quadratic relationships, with R2 values of 0.9248 for the 1–5.4 m/s range and 0.9311 for the 1.5–5.4 m/s range. The quadratic pattern shows initial improvement in wind environment indicators with increased incoming wind speed, followed by subsequent deterioration. This behavior reflects the balance between adequate ventilation needs and excessive wind speeds that create discomfort.
The strong predictive relationships (all R2 > 0.88) across different incoming wind speed ranges provide robust foundations for design parameter optimization and performance prediction across various climate conditions and seasonal requirements.

4.3. Regression Analysis Results

To enable quantitative prediction of pedestrian-level wind environment performance across different climate conditions, comprehensive nonlinear regression analysis was conducted based on the parameter relationships identified in the previous section. The regression models incorporate the most significant design parameters and their interactions, providing practical tools for design optimization and performance prediction.

4.3.1. Model Development and Normalization

All design parameters were standardized using min-max normalization to ensure consistency across different parameter scales, following Equation (6). This normalization process converted wind directions of 0°, 22.5°, 45°, 67.5°, and 90° to normalized values of 0, 0.25, 0.5, 0.75, and 1.0, respectively. Normalization ensures that each parameter contributes proportionally to the regression models regardless of their original measurement scales.
X = x x m i n x m a x x m i n

4.3.2. Regression Analysis

Based on significant correlations identified between design parameters and wind environment performance, four primary regression equations were developed for different wind environment evaluation scenarios. These equations represent the most robust predictive models for practical application:
Winter Wind Proofing (0–1.8 m/s range):
S 0 1.8 = 1.029 0.135 v 0 + 1.352 X A 2 0.679 X A + 0.531 X B 2 0.592 X B + 0.256 X C 0.5 c 2 ( R 2 = 0.727 )
Winter Wind Proofing for Warmer Climates (0–3.6 m/s range):
S 0 3.6 = 1.265 0.108 v 0 + 0.6 X A 2 0.338 X A 0.134 X B + 0.081 X C 0.5 c 2 ( R 2 = 0.754 )
Summer Ventilation (1–5.4 m/s range):
S 1 5.4 = 0.028 0.036 v 0 2 + 0.321 v 0 0.803 X A 2 + 0.475 X A 1.043 X B 2 + 0.776 X B 0.317 X C 0.5 c 2 ( R 2 = 0.769 )
Enhanced Summer Ventilation (1.5–5.4 m/s range):
S 1.5 5.4 = 0.298 0.043 v 0 2 + 0.382 v 0 1.336 X A 2 + 0.713 X A 0.825 X B 2 + 0.756 X B 0.334 X C 0.5 c 2 ( R 2 = 0.810 )
The regression equations incorporate five key variables: S represents the proportion of area with acceptable wind speeds for different wind speed ranges, v0 denotes incoming wind speed, Xa represents normalized enclosure ratio, indicates normalized average building aspect ratio, X C signifies normalized wind direction, and c represents the uniformity level of perimeter boundary enclosure (0 for non-uniform, 1 for uniform conditions).
The model performance demonstrates strong predictive capability with R2 values ranging from 0.727 to 0.810, indicating that 72.7% to 81.0% of the variance in pedestrian-level wind environment performance can be explained by the included design parameters. All regression coefficients are statistically significant (p < 0.05), with standard errors below 0.18 for primary terms and 95% confidence intervals confirming parameter reliability. The coefficient patterns align with the individual parameter relationships identified in the previous section, confirming the quadratic relationships for enclosure ratio and building aspect ratio, and the importance of wind direction relative to boundary uniformity.
The regression coefficients show consistent patterns across different wind environment requirements, with enclosure ratio and building aspect ratio demonstrating the strongest influences through their quadratic terms. Wind direction effects are modified by boundary uniformity, as represented by the ( X C 0.5 c )2 term, which captures the interaction between wind direction and enclosure characteristics. The models provide robust foundations for design parameter optimization across various climate conditions and seasonal requirements.

4.4. Sensitivity Analysis Results

To quantify the relative importance of different design parameters and guide design prioritization, sensitivity analysis was conducted using the Elementary Effects (EE) method [86]. This analysis provides insights into which parameters most significantly influence pedestrian-level wind environment performance and should receive primary attention during design development. Equations (11) and (12) have been applied in this study to gauge the influence of different design parameters on the pedestrian wind environment utilizing the EE method:
E E i = S X 1 , X 2 , , X i + , , X k S X 1 , X 2 , , X i , , X k
μ i * = 1 r j = 1 r E E i j
Here, the equations contain multiple variables: E E i signifies the derivative of the independent variable at a specific value, and S represents the dependent variable that encompasses different aspects. Additionally, X i stands for each independent variable included in the equation, while represents an almost infinitesimal change approaching zero. Finally, μ i * denotes the mean absolute value of the derivative.

4.4.1. Parameter Influence Hierarchy

The EE method reveals a clear hierarchy of parameter importance across different wind environment conditions. Table 7 summarizes the results of the EE method, assessing the impact of various layout parameters on distinct wind environments in accordance with evaluation indicators. As shown in Table 7, building enclosure ratio emerges as the most influential parameter across nearly all wind environment scenarios, with sensitivity indices ranging from 0.357 to 0.844. This dominance is particularly pronounced for winter wind proofing conditions, where building enclosure ratio achieves a sensitivity index of 0.844 for the area ratio within the 0–1.8 m/s wind speed range at the pedestrian level.
Average building aspect ratio ranks as the second most influential parameter for most conditions, with sensitivity indices ranging from 0.134 to 0.556. Notably, for summer ventilation conditions (area ratio within the 1–5.4 m/s wind speed range at the pedestrian level), building aspect ratio achieves the highest sensitivity index of 0.556, actually surpassing enclosure ratio (0.468) for this specific scenario. This represents the only condition where building aspect ratio exceeds enclosure ratio in importance.
Wind direction influence demonstrates significant variation based on perimeter boundary uniformity characteristics. For non-uniform enclosure conditions, wind direction sensitivity indices range from 0.083 to 0.345, while uniform enclosure conditions show consistently lower sensitivity ranging from 0.042 to 0.173. The sensitivity difference between non-uniform and uniform conditions is most pronounced for winter wind proofing (area ratio within the 0–1.8 m/s wind speed range at the pedestrian level), where non-uniform conditions yield 0.270 compared to 0.135 for uniform conditions. This pattern confirms that wind direction effects are amplified when perimeter boundaries create non-uniform wind exposure, making orientation optimization more critical for irregular neighborhood configurations than for geometrically consistent layouts.
The sensitivity analysis reveals distinct patterns across different climate requirements. For severe and cold climate winter conditions (area ratio within the 0–1.8 m/s wind speed range at the pedestrian level), the parameter hierarchy follows: enclosure ratio (0.844) > wind direction non-uniform (0.270) > building aspect ratio (0.269) > wind direction uniform (0.135). In contrast, for warm climate winter conditions (area ratio within the 0–3.6 m/s wind speed range at the pedestrian level), the hierarchy shifts to: enclosure ratio (0.357) > building aspect ratio (0.134) > wind direction non-uniform (0.083) > wind direction uniform (0.042).
Summer ventilation requirements show different sensitivity patterns. For general summer conditions (1–5.4 m/s area ratio), building aspect ratio becomes most influential (0.556), followed by enclosure ratio (0.468), wind direction non-uniform (0.343), and wind direction uniform (0.172). However, for hot climate summer conditions (area ratio within the 1.5–5.4 m/s wind speed range at the pedestrian level), enclosure ratio regains dominance (0.817) over building aspect ratio (0.415).

4.4.2. Optimal Parameter Ranges and Design Correlations

Building upon the sensitivity analysis, Table 8 demonstrates how specific parameter ranges correlate with superior wind environment performance. The analysis reveals that neighborhoods with building enclosure ratios, building aspect ratios, and wind directions falling within defined optimal ranges achieve superior pedestrian wind environments compared to 79% of other comparable high-rise residential zones. Even when only two of these parameters fall within optimal ranges, performance still exceeds 64% of comparable areas.
These findings from Table 8 validate the sensitivity analysis results by demonstrating that the most sensitive parameters (building enclosure ratio and average building aspect ratio) are indeed the primary drivers of performance differentiation between neighborhoods. The correlation analysis confirms that optimization efforts should prioritize these high-sensitivity parameters for maximum impact on pedestrian wind comfort.
The sensitivity analysis results provide guidance for design prioritization across different climate contexts. The consistent dominance of enclosure ratio across most conditions (except general summer ventilation) indicates that spatial organization and building arrangement should receive primary design attention. Building aspect ratio optimization emerges as particularly critical for summer conditions, while wind direction effects represent secondary considerations that vary significantly based on neighborhood boundary characteristics.

5. Discussions

5.1. Neighborhood Layout Performance

The comprehensive analysis across China’s diverse climate zones reveals consistent patterns in how neighborhood layout types perform under different environmental conditions. The results demonstrate that while no single layout configuration excels universally, clear performance hierarchies emerge that vary predictably with climate characteristics and seasonal requirements.
Closed perimeter layouts consistently provide superior winter protection across cold climate zones, achieving performance advantages of 15–20% in severely cold regions as shown in Table 7. This finding contrasts with previous research suggesting row-column layouts were universally optimal for wind environments [29,31]. The superior winter performance stems from closed perimeters’ ability to create sheltered interior spaces while maintaining sufficient wind speeds for basic air circulation. Conversely, semi-open and open perimeter layouts demonstrate clear advantages for summer ventilation across all climate zones, providing 12–18% better performance in hot regions compared to closed configurations. This pattern aligns with findings from Shui et al. [35] regarding perimeter layouts creating substantial wind comfort zones.
The most significant finding relates to seasonal trade-offs inherent in different layout types. While closed perimeter layouts excel in winter conditions, they consistently rank lowest for summer performance across all climate zones. This inverse relationship necessitates climate-specific design strategies rather than universal solutions. For severely cold and mild climate zones, closed perimeter designs remain optimal despite summer compromises. However, for hot summer/warm winter zones, the analysis suggests prioritizing summer performance through semi-open perimeter configurations. Hot summer/cold winter zones show the largest performance gaps (12–18%) between optimal and suboptimal layouts, emphasizing the critical importance of appropriate layout selection in transitional climates.

5.2. Design Guidelines and Practical Implementation

To synthesize the results from this study into intuitive neighborhood layout design recommendations considering various climate conditions in China, we present optimal parameter ranges that accommodate diverse climate conditions in Table 9. Thus, refined design recommendations emerge, which integrate both layout type selection and parameter optimization.
For severely cold zones, mild climate zones, and Cold Zone A, closed perimeter layouts with enclosure ratios of 0.25–0.28 or 0.52–0.61 and building aspect ratios of 1.35–2.75 provide optimal winter protection while maintaining acceptable summer conditions. The dual enclosure ratio ranges reflect the quadratic relationship identified in the regression analysis, where both low and moderate-high enclosure values achieve optimal performance through different wind flow mechanisms.
For Cold Zone B and hot summer/cold winter zones, similar enclosure ratios (0.25–0.28 or 0.52–0.61) are recommended but with adjusted building aspect ratios of 1.75–2.75 to better balance seasonal requirements. Hot summer/warm winter zones require distinct strategies prioritizing summer ventilation through enclosure ratios of 0.25–0.40 or 0.54–0.61 with higher aspect ratios of 1.75–4, supporting summer heat dissipation while maintaining adequate winter comfort.
More importantly, to maximize resource efficiency and cost-effectiveness in design practice, prioritization among these parameters must be carefully considered. The sensitivity analysis results provide clear prioritization guidance for design implementation. With enclosure ratio demonstrating sensitivity indices of 0.844 for winter wind proofing and building aspect ratio achieving 0.556 for summer ventilation, designers should focus optimization efforts on these high-impact parameters before addressing secondary considerations. The application framework suggests a hierarchical approach—first, establish appropriate enclosure ratios based on climate zone requirements; second, optimize building aspect ratios for seasonal priorities; third, adjust wind direction orientation based on boundary uniformity conditions.
For practical implementation, the correlation analysis demonstrates that achieving optimal ranges for just two of the three primary parameters results in performance exceeding 64% of comparable neighborhoods. This finding provides flexibility for practitioners facing site constraints or other design limitations. The wind environment optimization guidelines should integrate with broader urban design objectives including solar access, privacy, density requirements, and construction economics. The dual enclosure ratio ranges offer particular value by allowing designers to select approaches that align with density targets and spatial programming requirements.

5.3. Broader Implications

5.3.1. Comparison with International Standards

The wind speed criteria employed in this study align closely with international pedestrian wind comfort standards while providing climate-specific adaptations for Chinese conditions. The winter wind speed limits of 1.8 m/s for cold climates and 3.6 m/s for warm climates correspond to established comfort thresholds identified by Lawson and Penwarden [39] and Soligo et al. [41], while summer ventilation requirements of 1.0–1.5 m/s minimum speeds reflect thermal comfort needs documented by Cheng and Ng [45].
The climate zone-specific approach represents an advancement over universal standards by recognizing that comfort requirements vary with local climate characteristics and seasonal adaptation patterns. The layout performance findings provide validation for international design approaches while revealing climate-specific variations. The superior performance of closed perimeter layouts in cold climates supports northern European design traditions, while summer ventilation advantages of semi-open configurations align with Mediterranean and subtropical design practices.

5.3.2. Policy and Planning Implications

The quantified relationships between neighborhood layout parameters and pedestrian-level wind environment performance provide empirical foundations for developing evidence-based planning policies and building regulations. The parameter sensitivity rankings suggest that planning regulations should prioritize building enclosure ratio controls and average building aspect ratio guidelines over strict orientation requirements. This finding supports flexible zoning approaches that establish performance targets rather than prescriptive design rules.
The climate zone-specific recommendations support developing regionally adapted building codes that reflect local environmental priorities, rather than relying on universal national standards. Implementation of these guidelines through planning policy could significantly improve urban pedestrian-level wind environments at scale, with the correlation analysis indicating that 79% performance improvement is achievable through parameter optimization.

5.4. Limitations and Future Research

While this research provides comprehensive insights into neighborhood layout effects on pedestrian wind environments, several limitations suggest directions for future investigation. The CFD simulation approach, while enabling comprehensive parameter analysis, inherently simplifies complex atmospheric phenomena. The steady-state modeling may not be able to capture dynamic weather conditions, gustiness, or thermal stratification effects that significantly influence real-world wind comfort. The analysis focuses exclusively on high-rise residential neighborhoods with specific morphological characteristics (54 m height, 16% building density), and findings may not directly apply to low-rise or mixed-height developments.
Our analysis focuses on four morphological parameters while excluding other influential factors such as building height variation, vegetation, and urban canopy layer effects. This deliberate scope limitation reduces model comprehensiveness but enables systematic comparison of layout parameter effects without confounding variables. While these exclusions may affect absolute wind speed prediction accuracy in real-world applications, they do not compromise the validity of relative performance comparisons between layout configurations or optimal parameter identification. Future research should systematically incorporate building height variation, vegetation integration, and thermal–morphological interactions to enhance practical applicability.
Moreover, the wind environment evaluation relies on mechanical wind speed criteria without comprehensive integration of thermal comfort factors such as air temperature, humidity, and solar radiation within the CFD simulation framework. While our climate-specific wind speed thresholds incorporate thermal comfort considerations derived from UTCI analysis and established thermal comfort research, future studies could benefit from direct integration of thermal indices within coupled thermal–wind CFD simulations to provide more comprehensive comfort assessment. However, such approaches would require significantly greater computational resources and may obscure the fundamental relationships between morphological parameters and wind flow patterns that constitute the primary focus of this investigation. In addition, this study examines six representative cities across Chinese climate zones, but local microclimate variations within zones may significantly influence optimal design strategies. Future research could consider expanding the parameter space to include additional morphological variables such as building height variation and mixed-use development patterns. Integration of renewable energy considerations, particularly wind energy harvesting and building energy performance, would provide more comprehensive sustainability evaluation frameworks. Advanced computational approaches including machine learning could enhance predictive modeling capabilities while reducing computational requirements [87].
6. Conclusions
This study addressed the critical knowledge gap in understanding pedestrian wind environments within high-rise residential neighborhoods across China’s diverse climate zones. Through systematic investigation of 3204 residential neighborhoods and comprehensive CFD simulations of 281 scenarios, we established quantitative relationships between four key neighborhood layout parameters (building enclosure ratio, average building aspect ratio, average windward area ratio, and wind direction) and pedestrian-level wind environment performance, providing evidence-based foundations for climate-responsive urban design. We identified six typical neighborhood layouts and demonstrated that building enclosure ratio exerts the strongest influence on pedestrian wind conditions, with sensitivity indices reaching 0.844 for winter wind proofing requirements. Average building aspect ratio ranked second in importance (sensitivity index 0.556 for summer conditions), while wind direction effects varied significantly based on perimeter boundary uniformity. These findings challenge previous assumptions about universal optimal layouts and establish parameter-specific design priorities.
Climate zone analysis revealed distinct hierarchies of parameter importance across different wind environment conditions. Closed perimeter layouts provided 15–20% superior winter protection in severely cold regions, while semi-open and open perimeter designs enhanced summer ventilation by 12–18% in hot climates. The parallel layout demonstrated balanced performance across seasons, though at the cost of optimal performance in extreme conditions. Notably, hot summer/cold winter zones exhibited the largest performance gaps between optimal and suboptimal configurations, emphasizing the critical importance of appropriate layout selection in transitional climates. The regression analysis yielded robust predictive models (R2 values 0.727–0.810) enabling quantitative design optimization. For cold zones prioritizing winter comfort, optimal enclosure ratios of 0.25–0.28 or 0.52–0.61 with building aspect ratios of 1.35–2.75 were identified. Hot-warm zones benefited from enclosure ratios of 0.25–0.40 or 0.54–0.61 with aspect ratios of 1.75–4 to maximize summer heat dissipation. These findings provide practitioners with evidence-based guidelines that bridge theoretical understanding and practical application. The parameter sensitivity rankings enable efficient allocation of design resources, while climate-specific recommendations support regionally adapted building codes and planning policies.

Supplementary Materials

The following supporting information can be downloaded at: https://www.mdpi.com/article/10.3390/buildings15203750/s1.

Author Contributions

Conceptualization, L.Y. and P.S.; methodology, Y.Y. and L.Y.; software, Y.Y. and L.L.; validation, C.L., Y.Y. and L.Y.; formal analysis, P.S.; investigation, L.Y. and Y.Y.; resources, C.L. and P.S.; data curation, Y.Y.; writing—original draft preparation, L.Y., Y.Y. and P.S.; writing—review and editing, L.L. and P.S.; visualization, L.Y., Y.Y. and C.L.; supervision, P.S.; project administration, P.S. All authors have read and agreed to the published version of the manuscript.

Funding

This research received no external funding.

Data Availability Statement

Data will be made available on request.

Conflicts of Interest

The authors declare no conflicts of interest.

Appendix A

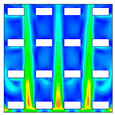
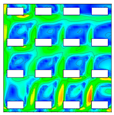
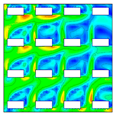
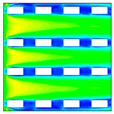
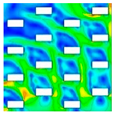
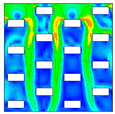
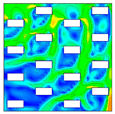
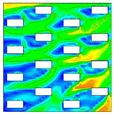
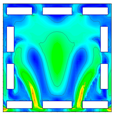
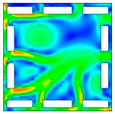
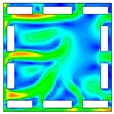
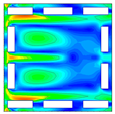
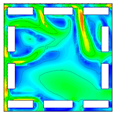
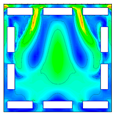
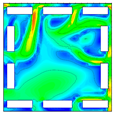
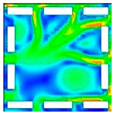
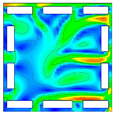
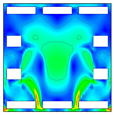
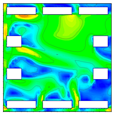
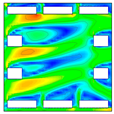
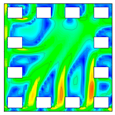
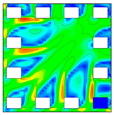
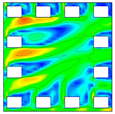
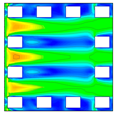
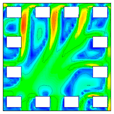
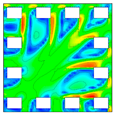
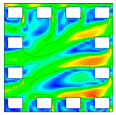
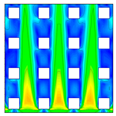
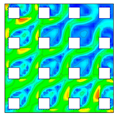
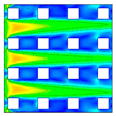
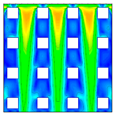
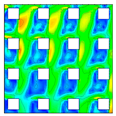
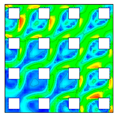
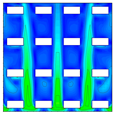
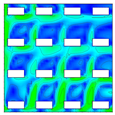
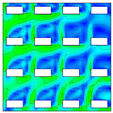
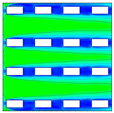
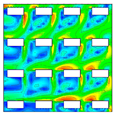
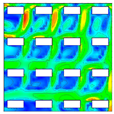
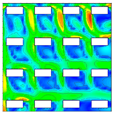
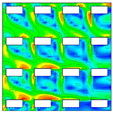
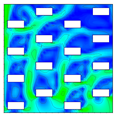
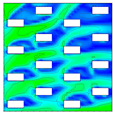
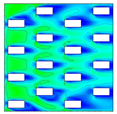
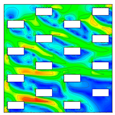
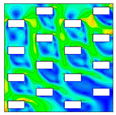
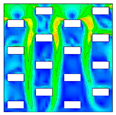
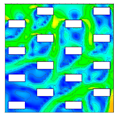
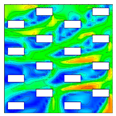
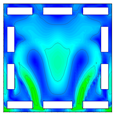
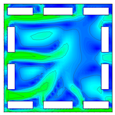
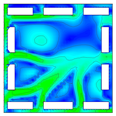
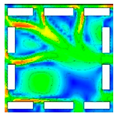
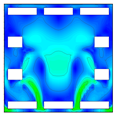
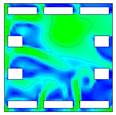
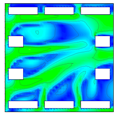
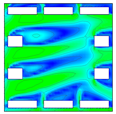
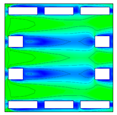
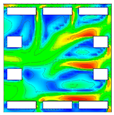
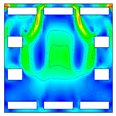
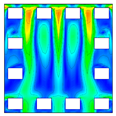
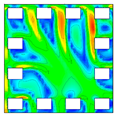
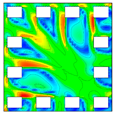
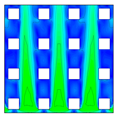
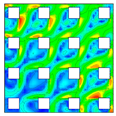
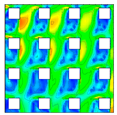
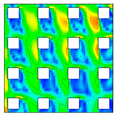
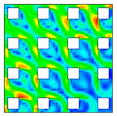
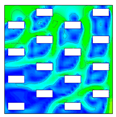
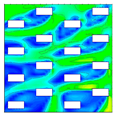
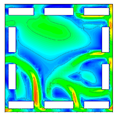
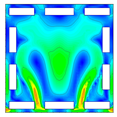
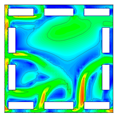
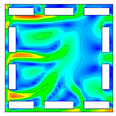
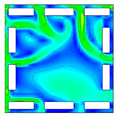
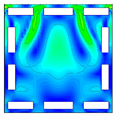
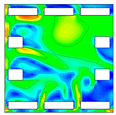
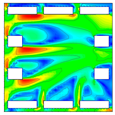
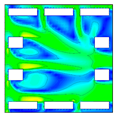
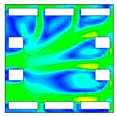
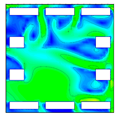
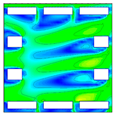
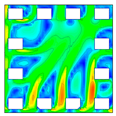
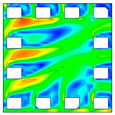
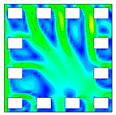
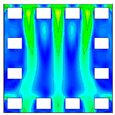
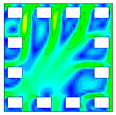
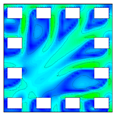
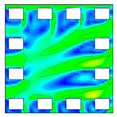
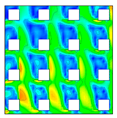
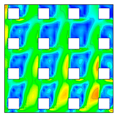
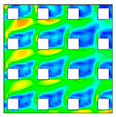
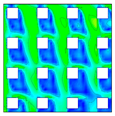
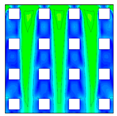
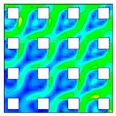
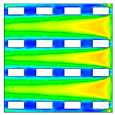
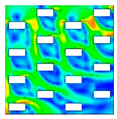
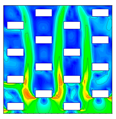
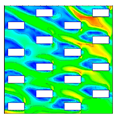
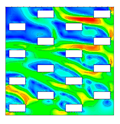
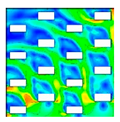
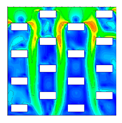
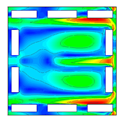
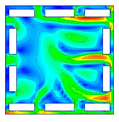
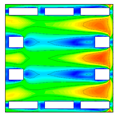
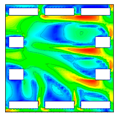
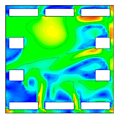
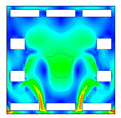
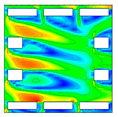
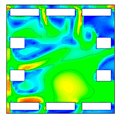
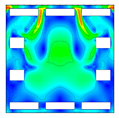
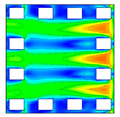
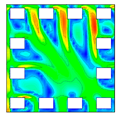
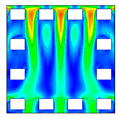
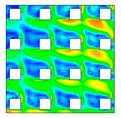
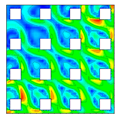
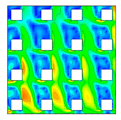
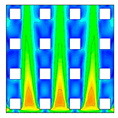
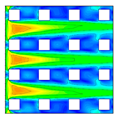
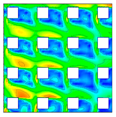
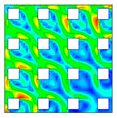
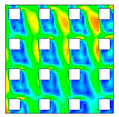
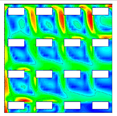
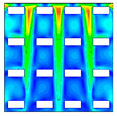
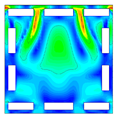
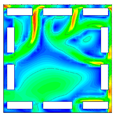
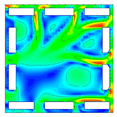
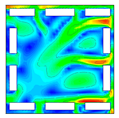
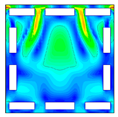
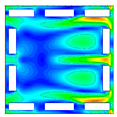
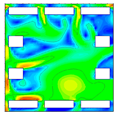
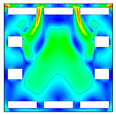
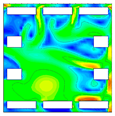
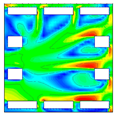
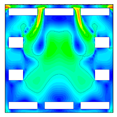
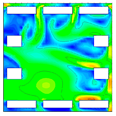
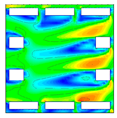
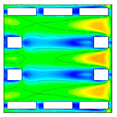
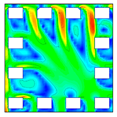
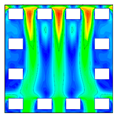
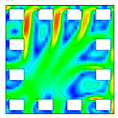
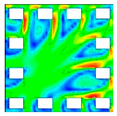
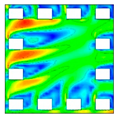
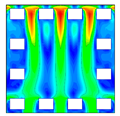
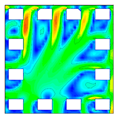
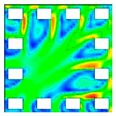
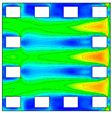
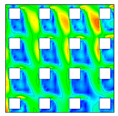
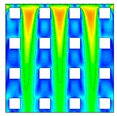
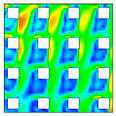
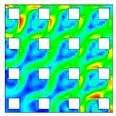
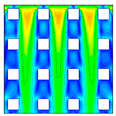
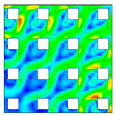
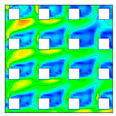
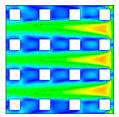
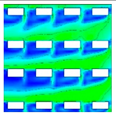
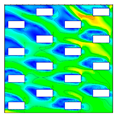
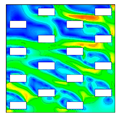
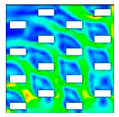
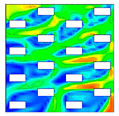
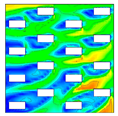
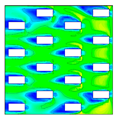
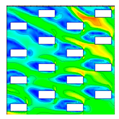
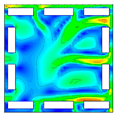
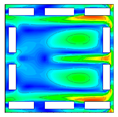
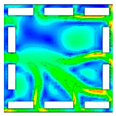
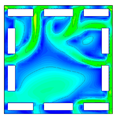
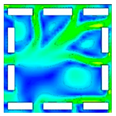
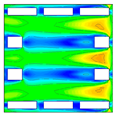
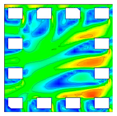
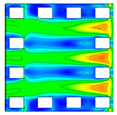
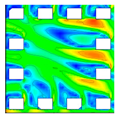
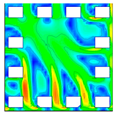
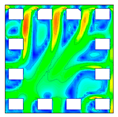
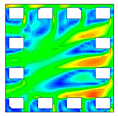
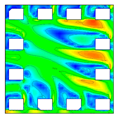
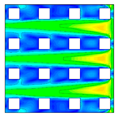
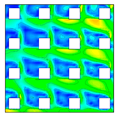
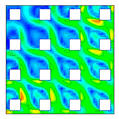
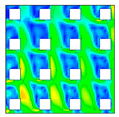
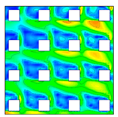
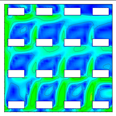
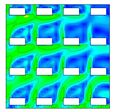
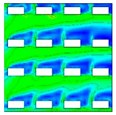
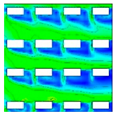
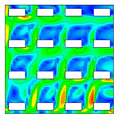
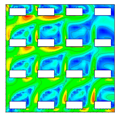
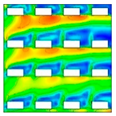
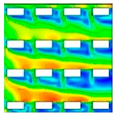
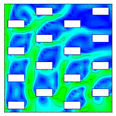
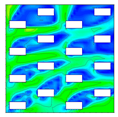
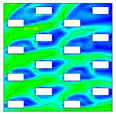
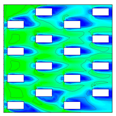
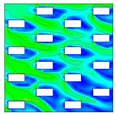
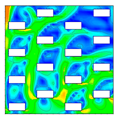
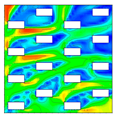
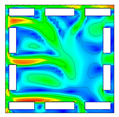
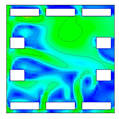
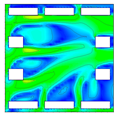
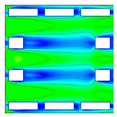
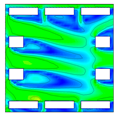
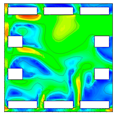
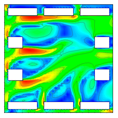
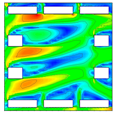
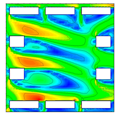
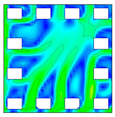
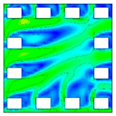
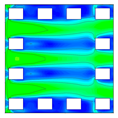
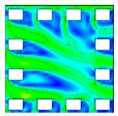
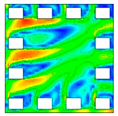
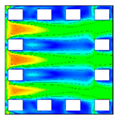
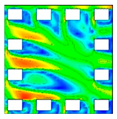
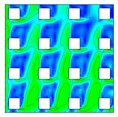
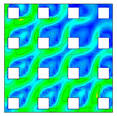
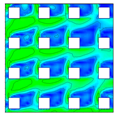
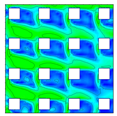
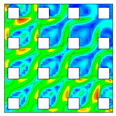
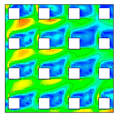
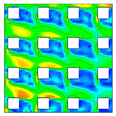
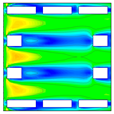
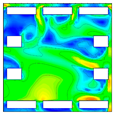
Table A1. Velocity distribution contours of typical layouts of different high-rise residential neighborhoods under Shenyang’s meteorological conditions in summer and winter.
LayoutSeasonOrientation of the Residential LayoutLegend
SWSSWSSSESE
PTSummerBuildings 15 03750 i001Buildings 15 03750 i002Buildings 15 03750 i003Buildings 15 03750 i004Buildings 15 03750 i005Buildings 15 03750 i006
WinterBuildings 15 03750 i007Buildings 15 03750 i008Buildings 15 03750 i009Buildings 15 03750 i010Buildings 15 03750 i011
SCSummerBuildings 15 03750 i012Buildings 15 03750 i013Buildings 15 03750 i014Buildings 15 03750 i015Buildings 15 03750 i016
WinterBuildings 15 03750 i017Buildings 15 03750 i018Buildings 15 03750 i019Buildings 15 03750 i020Buildings 15 03750 i021
CPSummerBuildings 15 03750 i022Buildings 15 03750 i023Buildings 15 03750 i024Buildings 15 03750 i025Buildings 15 03750 i026
WinterBuildings 15 03750 i027Buildings 15 03750 i028Buildings 15 03750 i029Buildings 15 03750 i030Buildings 15 03750 i031
SOPSummerBuildings 15 03750 i032Buildings 15 03750 i033Buildings 15 03750 i034Buildings 15 03750 i035Buildings 15 03750 i036
WinterBuildings 15 03750 i037Buildings 15 03750 i038Buildings 15 03750 i039Buildings 15 03750 i040Buildings 15 03750 i041
OPSummerBuildings 15 03750 i042Buildings 15 03750 i043Buildings 15 03750 i044Buildings 15 03750 i045Buildings 15 03750 i046
WinterBuildings 15 03750 i047Buildings 15 03750 i048Buildings 15 03750 i049Buildings 15 03750 i050Buildings 15 03750 i051
PGTSummerBuildings 15 03750 i052Buildings 15 03750 i053Buildings 15 03750 i054Buildings 15 03750 i055Buildings 15 03750 i056
WinterBuildings 15 03750 i057Buildings 15 03750 i058Buildings 15 03750 i059Buildings 15 03750 i060Buildings 15 03750 i061
Note: PT is Parallel Type; SC is Staggered Column; CP is Closed Perimeter; SOP is Semi-Open Perimeter; OP is Open Perimeter; PGT is Clustered.
Table A2. Velocity distribution contours of typical layouts of different high-rise residential neighborhoods under Beijing’s meteorological conditions in summer and winter.
LayoutSeasonOrientation of the Residential LayoutLegend
SWSSWSSSESE
PTSummerBuildings 15 03750 i062Buildings 15 03750 i063Buildings 15 03750 i064Buildings 15 03750 i065Buildings 15 03750 i066Buildings 15 03750 i067
WinterBuildings 15 03750 i068Buildings 15 03750 i069Buildings 15 03750 i070Buildings 15 03750 i071Buildings 15 03750 i072
SCSummerBuildings 15 03750 i073Buildings 15 03750 i074Buildings 15 03750 i075Buildings 15 03750 i076Buildings 15 03750 i077
WinterBuildings 15 03750 i078Buildings 15 03750 i079Buildings 15 03750 i080Buildings 15 03750 i081Buildings 15 03750 i082
CPSummerBuildings 15 03750 i083Buildings 15 03750 i084Buildings 15 03750 i085Buildings 15 03750 i086Buildings 15 03750 i087
WinterBuildings 15 03750 i088Buildings 15 03750 i089Buildings 15 03750 i090Buildings 15 03750 i091Buildings 15 03750 i092
SOPSummerBuildings 15 03750 i093Buildings 15 03750 i094Buildings 15 03750 i095Buildings 15 03750 i096Buildings 15 03750 i097
WinterBuildings 15 03750 i098Buildings 15 03750 i099Buildings 15 03750 i100Buildings 15 03750 i101Buildings 15 03750 i102
OPSummerBuildings 15 03750 i103Buildings 15 03750 i104Buildings 15 03750 i105Buildings 15 03750 i106Buildings 15 03750 i107
WinterBuildings 15 03750 i108Buildings 15 03750 i109Buildings 15 03750 i110Buildings 15 03750 i111Buildings 15 03750 i112
PGTSummerBuildings 15 03750 i113Buildings 15 03750 i114Buildings 15 03750 i115Buildings 15 03750 i116Buildings 15 03750 i117
WinterBuildings 15 03750 i118Buildings 15 03750 i119Buildings 15 03750 i120Buildings 15 03750 i121Buildings 15 03750 i122
Note: PT is Parallel Type; SC is Staggered Column; CP is Closed Perimeter; SOP is Semi-Open Perimeter; OP is Open Perimeter; PGT is Clustered.
Table A3. Velocity distribution contours of typical layouts of different high-rise residential neighborhoods under Yinchuan’s meteorological conditions in summer and winter.
LayoutSeasonOrientation of the Residential LayoutLegend
SWSSWSSSESE
PTSummerBuildings 15 03750 i123Buildings 15 03750 i124Buildings 15 03750 i125Buildings 15 03750 i126Buildings 15 03750 i127Buildings 15 03750 i128
WinterBuildings 15 03750 i129Buildings 15 03750 i130Buildings 15 03750 i131Buildings 15 03750 i132Buildings 15 03750 i133
SCSummerBuildings 15 03750 i134Buildings 15 03750 i135Buildings 15 03750 i136Buildings 15 03750 i137Buildings 15 03750 i138
WinterBuildings 15 03750 i139Buildings 15 03750 i140Buildings 15 03750 i141Buildings 15 03750 i142Buildings 15 03750 i143
CPSummerBuildings 15 03750 i144Buildings 15 03750 i145Buildings 15 03750 i146Buildings 15 03750 i147Buildings 15 03750 i148
WinterBuildings 15 03750 i149Buildings 15 03750 i150Buildings 15 03750 i151Buildings 15 03750 i152Buildings 15 03750 i153
SOPSummerBuildings 15 03750 i154Buildings 15 03750 i155Buildings 15 03750 i156Buildings 15 03750 i157Buildings 15 03750 i158
WinterBuildings 15 03750 i159Buildings 15 03750 i160Buildings 15 03750 i161Buildings 15 03750 i162Buildings 15 03750 i163
OPSummerBuildings 15 03750 i164Buildings 15 03750 i165Buildings 15 03750 i166Buildings 15 03750 i167Buildings 15 03750 i168
WinterBuildings 15 03750 i169Buildings 15 03750 i170Buildings 15 03750 i171Buildings 15 03750 i172Buildings 15 03750 i173
PGTSummerBuildings 15 03750 i174Buildings 15 03750 i175Buildings 15 03750 i176Buildings 15 03750 i177Buildings 15 03750 i178
WinterBuildings 15 03750 i179Buildings 15 03750 i180Buildings 15 03750 i181Buildings 15 03750 i182Buildings 15 03750 i183
Note: PT is Parallel Type; SC is Staggered Column; CP is Closed Perimeter; SOP is Semi-Open Perimeter; OP is Open Perimeter; PGT is Clustered.
Table A4. Velocity distribution contours of typical layouts of different high-rise residential neighborhoods under Shanghai’s meteorological conditions in summer and winter.
LayoutSeasonOrientation of the Residential LayoutLegend
SWSSWSSSESE
PTSummerBuildings 15 03750 i184Buildings 15 03750 i185Buildings 15 03750 i186Buildings 15 03750 i187Buildings 15 03750 i188Buildings 15 03750 i189
WinterBuildings 15 03750 i190Buildings 15 03750 i191Buildings 15 03750 i192Buildings 15 03750 i193Buildings 15 03750 i194
SCSummerBuildings 15 03750 i195Buildings 15 03750 i196Buildings 15 03750 i197Buildings 15 03750 i198Buildings 15 03750 i199
WinterBuildings 15 03750 i200Buildings 15 03750 i201Buildings 15 03750 i202Buildings 15 03750 i203Buildings 15 03750 i204
CPSummerBuildings 15 03750 i205Buildings 15 03750 i206Buildings 15 03750 i207Buildings 15 03750 i208Buildings 15 03750 i209
WinterBuildings 15 03750 i210Buildings 15 03750 i211Buildings 15 03750 i212Buildings 15 03750 i213Buildings 15 03750 i214
SOPSummerBuildings 15 03750 i215Buildings 15 03750 i216Buildings 15 03750 i217Buildings 15 03750 i218Buildings 15 03750 i219
WinterBuildings 15 03750 i220Buildings 15 03750 i221Buildings 15 03750 i222Buildings 15 03750 i223Buildings 15 03750 i224
OPSummerBuildings 15 03750 i225Buildings 15 03750 i226Buildings 15 03750 i227Buildings 15 03750 i228Buildings 15 03750 i229
WinterBuildings 15 03750 i230Buildings 15 03750 i231Buildings 15 03750 i232Buildings 15 03750 i233Buildings 15 03750 i234
PGTSummerBuildings 15 03750 i235Buildings 15 03750 i236Buildings 15 03750 i237Buildings 15 03750 i238Buildings 15 03750 i239
WinterBuildings 15 03750 i240Buildings 15 03750 i241Buildings 15 03750 i242Buildings 15 03750 i243Buildings 15 03750 i244
Note: PT is Parallel Type; SC is Staggered Column; CP is Closed Perimeter; SOP is Semi-Open Perimeter; OP is Open Perimeter; PGT is Clustered.
Table A5. Velocity distribution contours of typical layouts of different high-rise residential neighborhoods under Chengdu’s meteorological conditions in summer and winter.
LayoutSeasonOrientation of the Residential LayoutLegend
SWSSWSSSESE
PTSummerBuildings 15 03750 i245Buildings 15 03750 i246Buildings 15 03750 i247Buildings 15 03750 i248Buildings 15 03750 i249Buildings 15 03750 i250
WinterBuildings 15 03750 i251Buildings 15 03750 i252Buildings 15 03750 i253Buildings 15 03750 i254Buildings 15 03750 i255
SCSummerBuildings 15 03750 i256Buildings 15 03750 i257Buildings 15 03750 i258Buildings 15 03750 i259Buildings 15 03750 i260
WinterBuildings 15 03750 i261Buildings 15 03750 i262Buildings 15 03750 i263Buildings 15 03750 i264Buildings 15 03750 i265
CPSummerBuildings 15 03750 i266Buildings 15 03750 i267Buildings 15 03750 i268Buildings 15 03750 i269Buildings 15 03750 i270
WinterBuildings 15 03750 i271Buildings 15 03750 i272Buildings 15 03750 i273Buildings 15 03750 i274Buildings 15 03750 i275
SOPSummerBuildings 15 03750 i276Buildings 15 03750 i277Buildings 15 03750 i278Buildings 15 03750 i279Buildings 15 03750 i280
WinterBuildings 15 03750 i281Buildings 15 03750 i282Buildings 15 03750 i283Buildings 15 03750 i284Buildings 15 03750 i285
OPSummerBuildings 15 03750 i286Buildings 15 03750 i287Buildings 15 03750 i288Buildings 15 03750 i289Buildings 15 03750 i290
WinterBuildings 15 03750 i291Buildings 15 03750 i292Buildings 15 03750 i293Buildings 15 03750 i294Buildings 15 03750 i295
PGTSummerBuildings 15 03750 i296Buildings 15 03750 i297Buildings 15 03750 i298Buildings 15 03750 i299Buildings 15 03750 i300
WinterBuildings 15 03750 i301Buildings 15 03750 i302Buildings 15 03750 i303Buildings 15 03750 i304Buildings 15 03750 i305
Note: PT is Parallel Type; SC is Staggered Column; CP is Closed Perimeter; SOP is Semi-Open Perimeter; OP is Open Perimeter; PGT is Clustered.
Table A6. Velocity distribution contours of typical layouts of different high-rise residential neighborhoods under Shenzhen’s meteorological conditions in summer and winter.
LayoutSeasonOrientation of the Residential LayoutLegend
SWSSWSSSESE
PTSummerBuildings 15 03750 i306Buildings 15 03750 i307Buildings 15 03750 i308Buildings 15 03750 i309Buildings 15 03750 i310Buildings 15 03750 i311
WinterBuildings 15 03750 i312Buildings 15 03750 i313Buildings 15 03750 i314Buildings 15 03750 i315Buildings 15 03750 i316
SCSummerBuildings 15 03750 i317Buildings 15 03750 i318Buildings 15 03750 i319Buildings 15 03750 i320Buildings 15 03750 i321
WinterBuildings 15 03750 i322Buildings 15 03750 i323Buildings 15 03750 i324Buildings 15 03750 i325Buildings 15 03750 i326
CPSummerBuildings 15 03750 i327Buildings 15 03750 i328Buildings 15 03750 i329Buildings 15 03750 i330Buildings 15 03750 i331
WinterBuildings 15 03750 i332Buildings 15 03750 i333Buildings 15 03750 i334Buildings 15 03750 i335Buildings 15 03750 i336
SOPSummerBuildings 15 03750 i337Buildings 15 03750 i338Buildings 15 03750 i339Buildings 15 03750 i340Buildings 15 03750 i341
WinterBuildings 15 03750 i342Buildings 15 03750 i343Buildings 15 03750 i344Buildings 15 03750 i345Buildings 15 03750 i346
OPSummerBuildings 15 03750 i347Buildings 15 03750 i348Buildings 15 03750 i349Buildings 15 03750 i350Buildings 15 03750 i351
WinterBuildings 15 03750 i352Buildings 15 03750 i353Buildings 15 03750 i354Buildings 15 03750 i355Buildings 15 03750 i356
PGTSummerBuildings 15 03750 i357Buildings 15 03750 i358Buildings 15 03750 i359Buildings 15 03750 i360Buildings 15 03750 i361
WinterBuildings 15 03750 i362Buildings 15 03750 i363Buildings 15 03750 i364Buildings 15 03750 i365Buildings 15 03750 i366
Note: PT is Parallel Type; SC is Staggered Column; CP is Closed Perimeter; SOP is Semi-Open Perimeter; OP is Open Perimeter; PGT is Clustered.
Table A7. Velocity distribution contours of typical layouts of different high-rise residential neighborhoods under Kunming’s meteorological conditions in summer and winter.
LayoutSeasonOrientation of the Residential LayoutLegend
SWSSWSSSESE
PTSummerBuildings 15 03750 i367Buildings 15 03750 i368Buildings 15 03750 i369Buildings 15 03750 i370Buildings 15 03750 i371Buildings 15 03750 i372
WinterBuildings 15 03750 i373Buildings 15 03750 i374Buildings 15 03750 i375Buildings 15 03750 i376Buildings 15 03750 i377
SCSummerBuildings 15 03750 i378Buildings 15 03750 i379Buildings 15 03750 i380Buildings 15 03750 i381Buildings 15 03750 i382
WinterBuildings 15 03750 i383Buildings 15 03750 i384Buildings 15 03750 i385Buildings 15 03750 i386Buildings 15 03750 i387
CPSummerBuildings 15 03750 i388Buildings 15 03750 i389Buildings 15 03750 i390Buildings 15 03750 i391Buildings 15 03750 i392
WinterBuildings 15 03750 i393Buildings 15 03750 i394Buildings 15 03750 i395Buildings 15 03750 i396Buildings 15 03750 i397
SOPSummerBuildings 15 03750 i398Buildings 15 03750 i399Buildings 15 03750 i400Buildings 15 03750 i401Buildings 15 03750 i402
WinterBuildings 15 03750 i403Buildings 15 03750 i404Buildings 15 03750 i405Buildings 15 03750 i406Buildings 15 03750 i407
OPSummerBuildings 15 03750 i408Buildings 15 03750 i409Buildings 15 03750 i410Buildings 15 03750 i411Buildings 15 03750 i412
WinterBuildings 15 03750 i413Buildings 15 03750 i414Buildings 15 03750 i415Buildings 15 03750 i416Buildings 15 03750 i417
PGTSummerBuildings 15 03750 i418Buildings 15 03750 i419Buildings 15 03750 i420Buildings 15 03750 i421Buildings 15 03750 i422
WinterBuildings 15 03750 i423Buildings 15 03750 i424Buildings 15 03750 i425Buildings 15 03750 i426Buildings 15 03750 i427
Note: PT is Parallel Type; SC is Staggered Column; CP is Closed Perimeter; SOP is Semi-Open Perimeter; OP is Open Perimeter; PGT is Clustered.

References

  1. Mohurd, C. Statistical Yearbook of Urban and Rural Construction in China; Ministry of Housing and Urban-Rural Development: Beijing, China, 2020. [Google Scholar]
  2. Rimai, K.; Hickonicko, B.; Mudehwe, R. Use of High-Rise Apartments as an Urban Densification Policy: Lessons from China, Egypt and Ethiopian Condominiums. Lighthouse Zimb. Ezekiel Guti Univ. J. Law Econ. Public Policy 2025, 4, 103–122. [Google Scholar] [CrossRef]
  3. Wang, H.; Wang, Q.; Fu, Z.; Tang, J.; Chan, P.W.; Zheng, X. Wind Impacts on Buildings in Hong Kong during Super Typhoon Mangkhut. Build. Simul. 2025, 18, 385–401. [Google Scholar] [CrossRef]
  4. Du, Y.; Blocken, B.; Abbasi, S.; Pirker, S. Efficient and High-Resolution Simulation of Pollutant Dispersion in Complex Urban Environments by Island-Based Recurrence CFD. Environ. Model. Softw. 2021, 145, 105172. [Google Scholar] [CrossRef]
  5. van Druenen, T.; van Hooff, T.; Montazeri, H.; Blocken, B. CFD Evaluation of Building Geometry Modifications to Reduce Pedestrian-Level Wind Speed. Build. Environ. 2019, 163, 106293. [Google Scholar] [CrossRef]
  6. Zheng, X.; Montazeri, H.; Blocken, B. CFD Analysis of the Impact of Geometrical Characteristics of Building Balconies on Near-Façade Wind Flow and Surface Pressure. Build. Environ. 2021, 200, 107904. [Google Scholar] [CrossRef]
  7. Tanji, S.; Takemi, T.; Duan, G. Impacts of Building Modifications on the Turbulent Flow and Heat Transfer in Urban Surface Boundary Layers. J. Wind Eng. Ind. Aerodyn. 2024, 254, 105906. [Google Scholar] [CrossRef]
  8. Shen, P.; Wang, M.; Ma, H.; Ma, N. On the Two-Way Interactions of Urban Thermal Environment and Air Pollution: A Review of Synergies for Identifying Climate-Resilient Mitigation Strategies. Build. Simul. 2025, 18, 259–279. [Google Scholar] [CrossRef]
  9. Dai, Y.; Mak, C.M.; Hang, J.; Zhang, F.; Ling, H. Scaled Outdoor Experimental Analysis of Ventilation and Interunit Dispersion with Wind and Buoyancy Effects in Street Canyons. Energy Build. 2022, 255, 111688. [Google Scholar] [CrossRef]
  10. Dai, Y.; Tu, W.; Zhang, X.; Li, J.; Yue, X.; Wang, H. Dynamic Wind Patterns and Indoor/Outdoor Pollutant Dispersion in the Simplified Building Array: Statistical and Spectral Analyses from Scaled Outdoor Experiments. Build. Environ. 2025, 276, 112861. [Google Scholar] [CrossRef]
  11. Zheng, X.; Yang, J. Urban Road Network Design for Alleviating Residential Exposure to Traffic Pollutants: Super-Block or Mini-Block? Sustain. Cities Soc. 2023, 89, 104327. [Google Scholar] [CrossRef]
  12. Macintyre, H.L.; Heaviside, C.; Taylor, J.; Picetti, R.; Symonds, P.; Cai, X.-M.; Vardoulakis, S. Assessing Urban Population Vulnerability and Environmental Risks across an Urban Area during Heatwaves—Implications for Health Protection. Sci. Total Environ. 2018, 610–611, 678–690. [Google Scholar] [CrossRef] [PubMed]
  13. Deng, N.; Zheng, X.; Shi, S. Assessment of Health Risks of PAHs from Rural Cooking Emissions: Neighborhood Diffusion and the Impact of Village Settlement Characteristics. Build. Environ. 2023, 244, 110801. [Google Scholar] [CrossRef]
  14. Hang, J.; Xu, Y.; Hua, J.; Wang, W.; Zhao, B.; Zeng, L.; Du, Y. A Framework Combining Multi-Scale Model and Unmanned Aerial Vehicle for Investigating Urban Micro-Meteorology, Thermal Comfort, and Energy Balance. Sustain. Cities Soc. 2024, 115, 105847. [Google Scholar] [CrossRef]
  15. Zou, B.; Fan, C.; Li, J.; Wang, M.; Liao, Y.; Zhou, X. Assessing the Impact of Land Use Changes on Urban Heat Risk under Different Development Scenarios: A Case Study of Guangzhou in China. Sustain. Cities Soc. 2025, 130, 106532. [Google Scholar] [CrossRef]
  16. Shen, P. Spatiotemporal Mapping of Urban Air Temperature and UHI under TMY Condition: A Reference Station Based Machine Learning Approach. Energy Build. 2025, 343, 115923. [Google Scholar] [CrossRef]
  17. Vasaturo, R.; van Hooff, T.; Gillmeier, S.; Blocken, B.; van Wesemael, P.J.V. On the Effect of Pressure Coefficient Source on the Energy Demand of an Isolated Cross-Ventilated Building. Build. Environ. 2024, 255, 111436. [Google Scholar] [CrossRef]
  18. Fan, C.; Liu, R.; Liao, Y. Archetype Identification and Energy Consumption Prediction for Old Residential Buildings Based on Multi-Source Datasets. Buildings 2025, 15, 2573. [Google Scholar] [CrossRef]
  19. Vasaturo, R.; van Hooff, T.; Kalkman, I.; Blocken, B.; van Wesemael, P. Impact of Passive Climate Adaptation Measures and Building Orientation on the Energy Demand of a Detached Lightweight Semi-Portable Building. Build. Simul. 2018, 11, 1163–1177. [Google Scholar] [CrossRef]
  20. Zhong, S.; Hahm, Y.; Chen, X.; Wang, N.; Lee, C. Environmental Factors Influencing Intergenerational Interactions in Residential Communities: A US Nationwide Survey of Built Environment Experts. Habitat Int. 2025, 156, 103296. [Google Scholar] [CrossRef]
  21. Shen, P.; Ji, Y.; Li, Y.; Wang, M.; Cui, X.; Tong, H. Combined Impact of Climate Change and Urban Heat Island on Building Energy Use in Three Megacities in China. Energy Build. 2025, 331, 115386. [Google Scholar] [CrossRef]
  22. Du, Y.; Isaxon, C.; Roldin, P.; Mattisson, K.; Karttunen, S.; Li, X.; Malmqvist, E.; Järvi, L. Large-Eddy Simulation of Aerosol Concentrations in a Realistic Urban Environment: Model Validation and Transport Mechanism. Environ. Pollut. 2024, 358, 124475. [Google Scholar] [CrossRef] [PubMed]
  23. Duan, G.; Brimblecombe, P.; Chu, Y.L.; Ngan, K. Turbulent Flow and Dispersion inside and around Elevated Walkways. Build. Environ. 2020, 173, 106711. [Google Scholar] [CrossRef]
  24. Qin, P.; Ricci, A.; Blocken, B. Modeling Traffic Pollutants in a Street Canyon by CFD: Idealized Line Sources versus Multiple Realistic Car Sources. Sci. Total Environ. 2024, 955, 177099. [Google Scholar] [CrossRef]
  25. Zheng, X.; Yang, J. Impact of Moving Traffic on Pollutant Transport in Street Canyons under Perpendicular Winds: A CFD Analysis Using Large-Eddy Simulations. Sustain. Cities Soc. 2022, 82, 103911. [Google Scholar] [CrossRef]
  26. Zheng, X.; Li, L.; Cai, J.; Dong, J.; Li, Q. Impacts of Urban Viaducts and Noise Barriers on Traffic Pollutant Dispersion and Residential Exposure in the Neighborhood: An Analysis Using Large-Eddy Simulations. Build. Environ. 2025, 285, 113545. [Google Scholar] [CrossRef]
  27. Wang, H.; Brimblecombe, P.; Ngan, K. A Numerical Study of Local Traffic Volume and Air Quality within Urban Street Canyons. Sci. Total Environ. 2021, 791, 148138. [Google Scholar] [CrossRef]
  28. Wang, H.; Ngan, K. Turbulent Flow over Street Canyons with Balconies. Urban Clim. 2025, 59, 102331. [Google Scholar] [CrossRef]
  29. Shen, P.; Dai, M.; Xu, P.; Dong, W. Building Heating and Cooling Load under Different Neighbourhood Forms: Assessing the Effect of External Convective Heat Transfer. Energy 2019, 173, 75–91. [Google Scholar] [CrossRef]
  30. Zheng, X.; Montazeri, H.; Blocken, B. Impact of Building Façade Geometrical Details on Pollutant Dispersion in Street Canyons. Build. Environ. 2022, 212, 108746. [Google Scholar] [CrossRef]
  31. Shen, P.; Wang, Z. How Neighborhood Form Influences Building Energy Use in Winter Design Condition: Case Study of Chicago Using CFD Coupled Simulation. J. Clean. Prod. 2020, 261, 121094. [Google Scholar] [CrossRef]
  32. Yu, L.; Ye, Y.; Zhang, L. Influence of Waterside Buildings’ Layout on Wind Environment and the Relation with Design Based on a Case Study of the She Kou Residential District. J. Archit. Environ. Struct. Eng. Res. 2021, 4, 20–30. [Google Scholar] [CrossRef]
  33. Ma, T.; Chen, T. Classification and Pedestrian-Level Wind Environment Assessment among Tianjin’s Residential Area Based on Numerical Simulation. Urban Clim. 2020, 34, 100702. [Google Scholar] [CrossRef]
  34. Xian, X.; Li, X.; You, C.; Wei, S. Comprehensive Influence of Architectural Design Factors on the Outdoor Wind Environment of Residential Buildings. J. Build. Energy Effic. 2021, 49, 28–32+41. [Google Scholar]
  35. Shui, T.; Liu, J.; Yuan, Q.; Qu, Y.; Jin, H.; Cao, J.; Liu, L.; Chen, X. Assessment of Pedestrian-Level Wind Conditions in Severe Cold Regions of China. Build. Environ. 2018, 135, 53–67. [Google Scholar] [CrossRef]
  36. Penwarden, A.D. Acceptable Wind Speeds in Towns. Build. Sci. 1973, 8, 259–267. [Google Scholar] [CrossRef]
  37. Hunt, J.C.R.; Poulton, E.C.; Mumford, J.C. The Effects of Wind on People; New Criteria Based on Wind Tunnel Experiments. Build. Environ. 1976, 11, 15–28. [Google Scholar] [CrossRef]
  38. Murakami, S.; Uehara, K.; Deguchi, K. Wind Effects on Pedestrians: New Criteria Based on Outdoor Observation of Over 2000 Person. In Wind Engineering; Cermak, J.E., Ed.; Pergamon: Oxford, UK, 1980; pp. 277–288. ISBN 978-1-4832-8367-8. [Google Scholar]
  39. Lawson, T.V.; Penwarden, A.D. The Effects of Wind on People in the Vicinity of Buildings. In Proceedings of the International Conference on Wind Effects on Building and Structures 4th 750908, Heathrow, UK, 8 September 1975; Cambridge University Press: Cambridge, UK, 1977; pp. 605–666. [Google Scholar]
  40. Murakami, S.; Iwasa, Y.; Morikawa, Y. Study on Acceptable Criteria for Assessing Wind Environment at Ground Level Based on Residents’ Diaries. J. Wind Eng. Ind. Aerodyn. 1986, 24, 1–18. [Google Scholar] [CrossRef]
  41. Soligo, M.J.; Irwin, P.A.; Williams, C.J.; Schuyler, G.D. A Comprehensive Assessment of Pedestrian Comfort Including Thermal Effects. J. Wind. Eng. Ind. Aerodyn. 1998, 77–78, 753–766. [Google Scholar] [CrossRef]
  42. Nikolopoulou, M.; Lykoudis, S.; Kikira, M. Thermal Comfort in Outdoor Spaces: Field Studies in Greece. In Proceedings of the 5th International Conference on Urban Climate, IAUC-WMO, Lotz, Poland, 1–5 September 2003; pp. 91–94. [Google Scholar]
  43. Liu, W.; Zhang, Y.; Deng, Q. The Effects of Urban Microclimate on Outdoor Thermal Sensation and Neutral Temperature in Hot-Summer and Cold-Winter Climate. Energy Build. 2016, 128, 190–197. [Google Scholar] [CrossRef]
  44. Givoni, B.; Noguchi, M.; Saaroni, H.; Pochter, O.; Yaacov, Y.; Feller, N.; Becker, S. Outdoor Comfort Research Issues. Energy Build. 2003, 35, 77–86. [Google Scholar] [CrossRef]
  45. Cheng, V.; and Ng, E. Thermal Comfort in Urban Open Spaces for Hong Kong. Archit. Sci. Rev. 2006, 49, 236–242. [Google Scholar] [CrossRef]
  46. Shitzer, A.; Tikuisis, P. Advances, Shortcomings, and Recommendations for Wind Chill Estimation. Int. J. Biometeorol. 2012, 56, 495–503. [Google Scholar] [CrossRef]
  47. Ji, Y.; Song, J.; Shen, P. A Data-Driven Model on Human Thermophysiological and Psychological Responses under Dynamic Solar Radiation. Build. Environ. 2024, 248, 111098. [Google Scholar] [CrossRef]
  48. Dong, W.; Dai, D.; Liu, M.; Wang, Y.; Li, S.; Shen, P. Combined Effects of the Visual-Thermal Environment on Restorative Benefits in Hot Outdoor Public Spaces: A Case Study in Shenzhen, China. Build. Environ. 2025, 272, 112690. [Google Scholar] [CrossRef]
  49. Mittal, H.; Sharma, A.; Gairola, A. A Review on the Study of Urban Wind at the Pedestrian Level around Buildings. J. Build. Eng. 2018, 18, 154–163. [Google Scholar] [CrossRef] [PubMed]
  50. Yoshie, R.; Mochida, A.; Tominaga, Y.; Kataoka, H.; Yoshikawa, M. CFD Prediction of Wind Environment around a High-Rise Building Located in an Urban Area. In Proceedings of the Fourth International Symposium on Computational Wind Engineering (CWE2006), Yokohama, Japan, 16–19 July 2006. [Google Scholar]
  51. Tsang, C.W.; Kwok, K.C.S.; Hitchcock, P.A. Wind Tunnel Study of Pedestrian Level Wind Environment around Tall Buildings: Effects of Building Dimensions, Separation and Podium. Build. Environ. 2012, 49, 167–181. [Google Scholar] [CrossRef]
  52. Xu, X.; Yang, Q.; Yoshida, A.; Tamura, Y. Characteristics of Pedestrian-Level Wind around Super-Tall Buildings with Various Configurations. J. Wind Eng. Ind. Aerodyn. 2017, 166, 61–73. [Google Scholar] [CrossRef]
  53. Blocken, B.; Moonen, P.; Stathopoulos, T.; Carmeliet, J. Numerical Study on the Existence of the Venturi Effect in Passages between Perpendicular Buildings. J. Eng. Mech. 2008, 134, 1021–1028. [Google Scholar] [CrossRef]
  54. Li, B.; Luo, Z.; Sandberg, M.; Liu, J. Revisiting the ‘Venturi Effect’ in Passage Ventilation between Two Non-Parallel Buildings. Build. Environ. 2015, 94, 714–722. [Google Scholar] [CrossRef]
  55. Feng, W.; Ding, W.; Fei, M.; Yang, Y.; Zou, W.; Wang, L.; Zhen, M. Effects of Traditional Block Morphology on Wind Environment at the Pedestrian Level in Cold Regions of Xi’an, China. Environ. Dev. Sustain. 2021, 23, 3218–3235. [Google Scholar] [CrossRef]
  56. Ying, X.; Ding, G.; Hu, X.; Zhang, Y. Developing Planning Indicators for Outdoor Wind Environments of High-Rise Residential Buildings. J. Zhejiang Univ. Sci. A 2016, 17, 378–388. [Google Scholar] [CrossRef]
  57. Kubota, T.; Miura, M.; Tominaga, Y.; Mochida, A. Wind Tunnel Tests on the Relationship between Building Density and Pedestrian-Level Wind Velocity: Development of Guidelines for Realizing Acceptable Wind Environment in Residential Neighborhoods. Build. Environ. 2008, 43, 1699–1708. [Google Scholar] [CrossRef]
  58. Jin, H.; Liu, Z.; Jin, Y.; Kang, J.; Liu, J. The Effects of Residential Area Building Layout on Outdoor Wind Environment at the Pedestrian Level in Severe Cold Regions of China. Sustainability 2017, 9, 2310. [Google Scholar] [CrossRef]
  59. Wei, D.; Hu, X.; Chen, Y.; Li, B.; Chen, H. An Investigation of the Quantitative Correlation between Urban Spatial Morphology Indicators and Block Wind Environment. Atmosphere 2021, 12, 234. [Google Scholar] [CrossRef]
  60. Zahid Iqbal, Q.M.; Chan, A.L.S. Pedestrian Level Wind Environment Assessment around Group of High-Rise Cross-Shaped Buildings: Effect of Building Shape, Separation and Orientation. Build. Environ. 2016, 101, 45–63. [Google Scholar] [CrossRef]
  61. Gan, Y.; Chen, H. Discussion on the Applicability of Urban Morphology Index System for Block Natural Ventilation Research. Procedia Eng. 2016, 169, 240–247. [Google Scholar] [CrossRef]
  62. Zhu, Q. Residential Area Planning and Design; China Architecture and Building Press: Beijing, China, 2019. [Google Scholar]
  63. Yang, Z.; Yu, L.; Liu, J.; Song, X. Layout Study on Riverside Residential Building: Analysis of Thermal Environment Simulation. South Archit. 2015, 6, 74–79. [Google Scholar]
  64. You, W.; Shen, J.; Ding, W. Improving Wind Environment of Residential Neighborhoods by Understanding the Relationship between Building Layouts and Ventilation Efficiency. Energy Procedia 2017, 105, 4531–4536. [Google Scholar] [CrossRef]
  65. Zhang, A.; Gao, C.; Zhang, L. Numerical Simulation of the Wind Field around Different Building Arrangements. J. Wind Eng. Ind. Aerodyn. 2005, 93, 891–904. [Google Scholar] [CrossRef]
  66. Chang, H.; Xiang, C.; Duan, C.; Wan, Z.; Liu, Y.; Zheng, Y.; Shang, Y.; Liu, M.; Shu, S. Study on the Thermal Performance and Wind Environment in a Residential Community. Int. J. Hydrogen Energy 2016, 41, 15868–15878. [Google Scholar] [CrossRef]
  67. Peng, Y.; Gao, Z.; Ding, W. An Investigation on Outdoor Ventilation Performance in High-Rise Residential Districts Based on CFD Simulation and Field Measurement. Procedia Eng. 2017, 205, 3035–3041. [Google Scholar] [CrossRef]
  68. Ge, Q.; Kong, Q.; Xi, J.; Zheng, J. Application of UTCI in China from Tourism Perspective. Theor. Appl. Climatol. 2017, 128, 551–561. [Google Scholar] [CrossRef]
  69. DBJ/T15-154-2019; Testing and Assessment Standard for Building Wind Environment. China City Press: Beijing, China, 2019.
  70. GB 50180-2018; Standard for Urban Residential Area Planning and Design. China Architecture and Building Press: Beijing, China, 2018.
  71. Zheng, X.; Yang, J. CFD Simulations of Wind Flow and Pollutant Dispersion in a Street Canyon with Traffic Flow: Comparison between RANS and LES. Sustain. Cities Soc. 2021, 75, 103307. [Google Scholar] [CrossRef]
  72. Zheng, X.; Montazeri, H.; Blocken, B. CFD Simulations of Wind Flow and Mean Surface Pressure for Buildings with Balconies: Comparison of RANS and LES. Build. Environ. 2020, 173, 106747. [Google Scholar] [CrossRef]
  73. Yoshie, R.; Mochida, A.; Tominaga, Y.; Kataoka, H.; Harimoto, K.; Nozu, T.; Shirasawa, T. Cooperative Project for CFD Prediction of Pedestrian Wind Environment in the Architectural Institute of Japan. J. Wind Eng. Ind. Aerodyn. 2007, 95, 1551–1578. [Google Scholar] [CrossRef]
  74. Koutsourakis, N.; Bartzis, J.G.; Markatos, N.C. Evaluation of Reynolds Stress, k-ε and RNG k-ε Turbulence Models in Street Canyon Flows Using Various Experimental Datasets. Environ. Fluid. Mech. 2012, 12, 379–403. [Google Scholar] [CrossRef]
  75. Yu, H.; Thé, J. Validation and Optimization of SST k-ω Turbulence Model for Pollutant Dispersion within a Building Array. Atmos. Environ. 2016, 145, 225–238. [Google Scholar] [CrossRef]
  76. Tominaga, Y.; Stathopoulos, T. CFD Simulation of Near-Field Pollutant Dispersion in the Urban Environment: A Review of Current Modeling Techniques. Atmos. Environ. 2013, 79, 716–730. [Google Scholar] [CrossRef]
  77. Blocken, B. Computational Fluid Dynamics for Urban Physics: Importance, Scales, Possibilities, Limitations and Ten Tips and Tricks towards Accurate and Reliable Simulations. Build. Environ. 2015, 91, 219–245. [Google Scholar] [CrossRef]
  78. Blocken, B.; Stathopoulos, T.; Saathoff, P.; Wang, X. Numerical Evaluation of Pollutant Dispersion in the Built Environment: Comparisons between Models and Experiments. J. Wind Eng. Ind. Aerodyn. 2008, 96, 1817–1831. [Google Scholar] [CrossRef]
  79. Ramponi, R.; Blocken, B.; De Coo, L.B.; Janssen, W.D. CFD Simulation of Outdoor Ventilation of Generic Urban Configurations with Different Urban Densities and Equal and Unequal Street Widths. Build. Environ. 2015, 92, 152–166. [Google Scholar] [CrossRef]
  80. Hang, J.; Xian, Z.; Wang, D.; Mak, C.M.; Wang, B.; Fan, Y. The Impacts of Viaduct Settings and Street Aspect Ratios on Personal Intake Fraction in Three-Dimensional Urban-like Geometries. Build. Environ. 2018, 143, 138–162. [Google Scholar] [CrossRef]
  81. Franke, J.; Hellsten, A.; Schlünzen, H.; Carissimo, B. Best Practice Guideline for the CFD Simulation of Flows in the Urban Environment: COST Action 732 Quality Assurance and Improvement of Microscale Meteorological Models; University of Hamburg, Meteorological Institute, Centre for Marine and Atmospheric Sciences: Hamburg, Germany, 2007. [Google Scholar]
  82. DBJ/T 15-154-2019; Building Wind Environment Testing and Evaluation Standard. Guangdong Provincial Department of Housing and Urban-Rural Development: Guangzhou, China; China Industrial Press: Beijing, China, 2019.
  83. Gromke, C.; Ruck, B. Influence of Trees on the Dispersion of Pollutants in an Urban Street Canyon—Experimental Investigation of the Flow and Concentration Field. Atmos. Environ. 2007, 41, 3287–3302. [Google Scholar] [CrossRef]
  84. Gromke, C.; Ruck, B. On the Impact of Trees on Dispersion Processes of Traffic Emissions in Street Canyons. Bound.-Layer Meteorol. 2009, 131, 19–34. [Google Scholar] [CrossRef]
  85. Zheng, X.; Montazeri, H.; Blocken, B. Large-Eddy Simulation of Pollutant Dispersion in Generic Urban Street Canyons: Guidelines for Domain Size. J. Wind Eng. Ind. Aerodyn. 2021, 211, 104527. [Google Scholar] [CrossRef]
  86. Garcia Sanchez, D.; Lacarrière, B.; Musy, M.; Bourges, B. Application of Sensitivity Analysis in Building Energy Simulations: Combining First- and Second-Order Elementary Effects Methods. Energy Build. 2014, 68, 741–750. [Google Scholar] [CrossRef]
  87. Cui, X.; Li, Y.; Shen, P. Beyond CFD: Explainable Machine Learning for Efficient Assessment of Urban Morphology Impacts on Pedestrian Level Wind and Thermal Environment. J. Build. Perform. Simul. 2025, 1–16. [Google Scholar] [CrossRef]
Figure 1. Summary of neighborhood layout in different cities.
Buildings 15 03750 g001
Figure 2. Typical residential plan layouts in China.
Buildings 15 03750 g002
Figure 3. Diagram of wind directions.
Buildings 15 03750 g003
Figure 4. (a) Computational domain of CFD validation case and (b) Profiles of mean wind speed (U) of the CFD validation case and wind tunnel test.
Buildings 15 03750 g004
Figure 5. Model validation of the CFD simulation and wind tunnel test results.
Buildings 15 03750 g005
Figure 6. The proportion of pedestrian-level acceptable wind speed area for various typical plan layouts across all climate zones. Note: PT is Parallel Type; SC is Staggered Column; CP is Closed Perimeter; SOP is Semi-Open Perimeter; OP is Open Perimeter; PGT is Clustered.
Buildings 15 03750 g006aBuildings 15 03750 g006bBuildings 15 03750 g006c
Table 1. Summarization on the pedestrian-level acceptable wind speeds in various climate zones of China.
Climate ZonePedestrian-Level Acceptable Wind Speeds in Winter (m/s)Pedestrian-Level Acceptable Wind Speeds in Summer (m/s)
Severely Cold Regions0 to 1.81 to 5.4
Mild Regions0 to 1.81 to 5.4
Zone A of Cold Regions0 to 1.81 to 5.4
Zone B of Cold Regions0 to 1.81.5 to 5.4
Hot Summer and Cold Winter0 to 1.81.5 to 5.4
Hot Summer and Warm Winter0 to 3.61.5 to 5.4
Table 2. The design parameters and characteristics of each typical neighborhood layout features.
Design ParametersParallel LayoutStaggered LayoutClosed Perimeter DesignSemi-Open PerimeterOpen Perimeter StyleClustered
Enclosure ratio0.43 0.28 0.67 0.56 0.47 0.40
Average building aspect ratio2.25 2.25 3.602.91 1.33 1.00
Average windward area ratio−67.5°1.00 1.00 0.85 0.98 0.97 0.92
−45°0.93 0.93 0.87 0.91 0.99 1.00
−22.5°0.72 0.72 0.76 0.70 0.86 0.92
0.41 0.41 0.33 0.38 0.60 0.71
22.5°0.72 0.72 0.76 0.70 0.86 0.92
45°0.93 0.93 0.87 0.91 0.99 1.00
67.5°1.00 1.00 0.85 0.98 0.97 0.92
90°0.91 0.91 0.70 0.91 0.80 0.71
Table 3. Average wind direction and prevailing wind direction during winter and summer seasons for selected cities in different climatic zones.
Climate ZoneRepresentative CitiesWinterSummer
Prevailing Wind DirectionAverage Wind Speed (m/s)Prevailing Wind DirectionAverage Wind Speed (m/s)
Severe cold zonesShenyangNNE3.6SW3.5
Cold zone AYinchuanNNE2.2SSW2.9
Cold zone BBeijingN4.7SW3.0
Summer hot and winter cold zoneShanghaiNW3.0SE3.0
ChengduNE1.9NNE2.0
Warm winter and hot summer zoneShenzhenENE2.9ESE2.7
Mild climate zoneKunmingWSW3.7WSW2.6
Notes: N: north; NW: northwest; NE: northeast; NNE: north-northeast; ENE: east-northeast; SW: southwest; SE: southeast; SSW: south-southwest; WSW: west-southwest; ESE: east-southeast.
Table 4. Terrain category parameters for atmospheric boundary layer modeling.
Terrain CategoryTerrain DescriptionRoughness Index βD1 (m3−β/s4)D2 (m4/s4)
AOffshore waters and small islands, open water surfaces, coasts, lakeshores, desert areas0.12−1.3194.617
BFields, countryside, flat open areas, forests, sparsely built towns and suburban areas0.15−2.79.399
CAreas with dense trees and low-rise buildings, areas with sparse medium and high-rise buildings, gently rolling hills0.22−5.02350.12
DAreas with dense medium and high-rise buildings, hilly areas with increased undulation0.3−9.944298.7
Table 5. Pedestrian-level acceptable wind speed area ratios by climate zone and layout type.
Climate ZoneSeasonClosed PerimeterSemi-Open PerimeterOpen PerimeterParallelStaggeredClustered
Severely ColdWinter70–75%45–50%40–45%55–60%60–65%50–55%
(Shenyang)Summer75–80%80–85%75–80%70–75%70–75%65–70%
Cold Zone AWinter85–90%60–65%55–60%75–80%75–85%65–70%
(Yinchuan)Summer65–70%75–80%70–75%65–70%60–65%70–75%
Cold Zone BWinter40–45%30–35%25–30%40–45%45–50%35–40%
(Beijing)Summer50–55%65–70%60–65%55–60%50–55%55–60%
Hot Summer/Cold WinterWinter50–55% *30–35% *25–30% *45–50% *45–50% *50–55% *
(Shanghai)Summer20–25% *60–65% *55–60% *50–55% *45–50% *45–50% *
Hot Summer/Cold WinterWinter85–95% †75–85% †70–80% †80–90% †85–90% †75–80% †
(Chengdu)Summer10–15% †40–50% †30–40% †40–50% †25–35% †25–35% †
Hot Summer/Warm WinterWinter90–95%85–90%85–90%90–95%85–90%85–90%
(Shenzhen)Summer35–40%60–65%60–65%50–55%50–55%45–50%
Mild ClimateWinter55–60%35–40%35–40%50–55%50–55%40–45%
(Kunming)Summer50–55%75–80%70–75%65–70%65–70%50–55%
Note: Values represent the percentage of residential area with acceptable wind speeds for pedestrian comfort. Winter acceptable range: 0–1.8 m/s (severely cold, mild, cold zones), 0–3.6 m/s (hot summer/warm winter). Summer acceptable range: 1–5.4 m/s (severely cold, mild, cold zone A), 1.5–5.4 m/s (cold zone B, hot summer zones); * Shanghai data; † Chengdu data.
Table 6. The regression relationships between design parameters and pedestrian-level acceptable wind speed area ratios.
Design ParameterRelationship TypeWinter PerformanceSummer PerformanceOptimal RangeKey Findings
Building Enclosure RatioQuadraticR2 = 0.75R2 = 0.71 (combined)0.25–0.28 or 0.52–0.61Most influential parameter; initial deterioration then improvement
R2 = 0.56 (summer only) Corner flow superposition drives behavior
Average Building Aspect RatioQuadraticR2 = 0.75 (winter only)R2 = 0.79 (summer only)1.75–2.75Initial winter degradation, summer enhancement
R2 = 0.83 (combined)R2 = 0.69 (combined) Pattern inverts at higher ratios
Wind DirectionQuadraticR2 = 0.96 (non-uniform)R2 = 0.96 (non-uniform)0–22.5° (combined req.)Effect depends on enclosure uniformity
(Non-uniform enclosure) R2 = 0.89 (combined)R2 = 0.98 (combined)45° (optimal for uniform)Lower wind speeds at 0° and 22.5°
Wind DirectionQuadraticR2 = 0.99 (uniform)R2 = 0.93 (uniform) Winter worsens then improves
(Uniform enclosure) R2 = 0.85 (combined)R2 = 0.95 (combined) Summer follows reverse pattern
Average Windward Area RatioLinear/VariablePositive correlationNegative (non-uniform)Varies by boundary typeCorrelation range: 0.33–0.66
(winter only)Positive (uniform) Increases summer performance
Decreases winter performance
Incoming Wind SpeedLinear (Winter)R2 = 0.885 (0–1.8 m/s)R2 = 0.925 (1–5.4 m/s)Climate dependentStrong predictive relationships
Quadratic (Summer)R2 = 0.946 (0–3.6 m/s)R2 = 0.931 (1.5–5.4 m/s) Initial improvement then deterioration (summer)
Notes: R2 values indicate strength of predictive relationships. Combined = considering both winter wind proofing and summer heat dissipation. Optimal ranges vary by climate zone and seasonal priorities. All relationships significant at p < 0.05 level.
Table 7. Sensitivity of different plan neighborhood layout parameters to corresponding evaluation indicators of various pedestrian wind environments.
Pedestrian-Level Wind Environmental Assessment IndicatorsEnclosure RatioAverage Building Aspect RatioWind Direction
Non-Uniform EnclosureUniform Enclosure
Ratio of area having pedestrian-level wind speed between 0~1.8 m/s0.8440.2690.2700.135
Ratio of area having pedestrian-level wind speed between 0~3.6 m/s0.3570.1340.0830.042
Ratio of area having pedestrian-level wind speed between 1~5.4 m/s0.4680.5560.3430.172
Ratio of area having pedestrian-level wind speed between 1.5~5.4 m/s0.8170.4150.3450.173
Table 8. Correlation between building enclosure ratio, average building aspect ratio, wind direction, and the maximum and minimum values of different evaluation indicators in relation to incoming wind speeds.
IndicatorEnclosure RatioAverage Building Aspect RatioWind Direction
Non-Uniform Enclosure Uniform Enclosure
Ratio of area having a wind speed between 0~1.8 m/sBuildings 15 03750 i428Buildings 15 03750 i429Buildings 15 03750 i430Buildings 15 03750 i431
Ratio of area having a wind speed between 0~3.6 m/sBuildings 15 03750 i432Buildings 15 03750 i433Buildings 15 03750 i434Buildings 15 03750 i435
Ratio of area having a wind speed between 1~5.4 m/sBuildings 15 03750 i436Buildings 15 03750 i437Buildings 15 03750 i438Buildings 15 03750 i439
Ratio of area having a wind speed between 1.5~5.4 m/sBuildings 15 03750 i440Buildings 15 03750 i441Buildings 15 03750 i442Buildings 15 03750 i443
Table 9. Recommended design parameters for optimal pedestrian wind environments across climate zones.
Climate ZoneEnclosure RatioAverage Building Aspect RatioPrevailing Wind Direction
Severely cold zones, Mild climate zones, Cold zone A0.25–0.28 or 0.52–0.611.35–2.75Uniform enclosure: Winter: 54–90°; Summer: 0–36°
Non-uniform enclosure: Winter: 0–18° or 72–90°; Summer: 27–63°
Cold zone B and Hot summer/Cold winter zones0.25–0.28 or 0.52–0.611.75–2.75Uniform enclosure: Winter: 54–90°; Summer: 0–36°
Non-uniform enclosure: Winter: 0–18° or 72–90°; Summer: 27–63°
Hot summer/Warm winter zones0.25–0.40 or 0.54–0.611.75–4Uniform enclosure: Winter: 54–90°; Summer: 0–36°
Non-uniform enclosure: Winter: 0–18° or 72–90°; Summer: 27–63°
Disclaimer/Publisher’s Note: The statements, opinions and data contained in all publications are solely those of the individual author(s) and contributor(s) and not of MDPI and/or the editor(s). MDPI and/or the editor(s) disclaim responsibility for any injury to people or property resulting from any ideas, methods, instructions or products referred to in the content.