Article

A Study of a Noncontact Identification Method of Debonding Damage in External Thermal Insulation Composite Systems Based on Nonlinear Vibration

1
Road & Bridge International Co., Ltd., Beijing 100027, China
2
China Harbour Engineering Company Limited, Beijing 100027, China
*
Author to whom correspondence should be addressed.
Buildings 2025, 15(20), 3728; https://doi.org/10.3390/buildings15203728
Submission received: 31 July 2025 / Revised: 28 September 2025 / Accepted: 13 October 2025 / Published: 16 October 2025
(This article belongs to the Special Issue Advances in Composite Structures for Sustainable Building Solutions)

Abstract

Due to the influence of materials, construction quality, environmental conditions, and artificial factors, debonding damage in external thermal insulation composite systems (ETICS) has become a common issue in the construction field. A reliable and efficient method for identifying the debonding is still lacking. In this study, four groups of external insulation specimens with different degrees of debonding were fabricated. A non-contact detection method based on nonlinear vibration characteristics was employed, using a laser Doppler vibrometer to acquire the vibration response signals of the specimens. The results demonstrate that this technique can effectively distinguish specimens with different levels of debonding and accurately identify and locate the damage. Moreover, the relative position of the signal acquisition point with respect to the debonding area has no significant impact on the detection results.

1. Introduction

Against the background of sustainable development and the vigorous promotion of building energy-saving technologies by the government, external thermal insulation composite systems (ETICS) have played a crucial role in improving the thermal performance of buildings and reducing energy consumption. As a result, they have been widely applied across various types of buildings [1]. As a part of the building envelope, EITCS are subjected to environmental erosion and wind loads. Due to construction-related factors and material aging, they are prone to cracking, debonding, and even detachment, which can compromise the structural integrity of the building itself and potentially lead to significant economic losses and social hazards [2].
At present, traditional methods for detecting debonding damage in ETICS include visual inspection, pull-off testing, and hammer sounding. The visual inspection method relies heavily on subjective human experience; hammer sounding requires point-by-point manual tapping; and pull-off testing is destructive to the ETICS itself. Most of these traditional methods are time-consuming and inefficient. On this basis, alternative techniques such as infrared thermography, ground-penetrating radar, and X-ray inspection have been proposed [3,4,5]. Infrared thermography has greatly improved detection efficiency and operator safety [6,7]. However, it is significantly constrained by ambient temperature and weather conditions, and cannot reliably detect debonding damage in ETICS. Ground-penetrating radar performs nondestructive testing by emitting high-frequency electromagnetic waves, but due to the vertical structure of walls, its scanning time is lengthy, making it unsuitable for rapidly covering large areas. Although X-ray inspection can identify deep-seated defects, it requires specialized radiation sources and receiving equipment, which are expensive and poorly portable. Moreover, without adequate protective measures, it poses potential health and safety risks to personnel.
Vibration-based damage identification methods have long been employed in fields such as aerospace, energy, and civil engineering [8]. Debonding defects induce localized changes in stiffness and boundary conditions, thereby affecting dynamic responses such as natural frequencies, damping ratios, and mode shapes. The energy of vibration signals obtained from hammer excitation can be used to identify minor defects in the facing layer. On this basis Wang Z. employed accelerometers to detect defects in facade bonding layers by analyzing amplitude variations, demonstrating that the amplitude of vibration acceleration can reflect the state of bonding defects [9]. Abdulkareem M. [10] utilized numerical analysis to successfully identify damage locations based on mode shapes, and validated the method through damage detection experiments on steel plates. D. Pan [11] proposed a vibration-based detection method that relies on differences in acceleration responses at the excitation point. Using a single-point accelerometer and rubber hammer impacts, the debonding of silicone sealant layers in glass curtain walls was identified and validated via structural mode shapes. Although contact sensors have been widely used in various detection applications, these methods are overly sensitive to surface roughness [12]. In addition, contact sensors introduce mass loading on the contact surface, which may alter the surface’s resonance frequency, particularly in high-damping or nonlinear materials, thereby interfering with the identification of modal parameters [13]. With the advancement of nondestructive testing, non-contact detection technologies have been increasingly adopted due to their high precision and adaptability [14]. Owing to its inherent high accuracy, it has been widely applied to the measurement of sensitive parameters such as mode shapes [15].In the area of vibration signal detection, J. Zhou [16] utilized a non-contact laser vibrometer combined with two-dimensional wavelet transform and curvature analysis to identify damage in composite structures, verifying its feasibility. In addition, non-contact laser Doppler vibrometers have already been applied in the inspection of concrete structures. Through active excitation or passive excitation from ambient vibrations, they have been successfully used to detect defects in both concrete structures and composite plate-like structures [17,18,19,20].
Real-world engineering materials and structures often exhibit complex characteristics such as geometric nonlinearity, contact nonlinearity, and material nonlinearity. These nonlinear effects are particularly pronounced at defect or damage locations [21]. Linear vibration-based detection methods suffer from insufficient sensitivity in identifying early-stage or minor defects, making it difficult to detect weak interfaces, cracks, and local debonding. To address the limitations of traditional linear vibration detection in terms of sensitivity, researchers have increasingly focused on nonlinear vibration detection techniques in recent years. Such methods can fully exploit the intrinsic or defect-induced nonlinear dynamic characteristics of structures to achieve highly sensitive damage identification. B.Q. Wang [22], based on a nonlinear defect index derived from the relative nonlinear coefficient of Lamb waves combined with an adaptive weighted imaging algorithm, successfully detected small-scale defects in CFRP plates with an area detection error of only 7.8%, representing a substantial improvement over the 22.4% error of traditional algorithms. Ali proposed a self-referencing NDT method based on impulse response testing, introducing the nonlinear vibration index (NVI) as a novel damage-sensitive indicator, which can effectively detect defects such as shallow delaminations that are difficult to identify with conventional techniques [23]. In composite material inspection, a baseline-free damage localization method combining circular laser measurements with nonlinear ultrasonic guided waves has been proposed. By reconstructing wave source maps, its effectiveness in accurately identifying impact damage in composites has been demonstrated [24]. Non-contact detection technology based on nonlinear vibration characteristics integrates the advantages of both non-contact techniques and nonlinear vibration methods, offering benefits such as high efficiency, strong adaptability, high safety, and powerful detection capabilities. If applied to the detection of debonding damage in ETICS, it can effectively compensate for the shortcomings of traditional methods and infrared thermography in this field, showing promising prospects for ETICS debonding detection on building facades. Therefore, in this study, four sets of external thermal insulation specimens with varying degrees of debonding were fabricated. A non-contact damage identification technique based on nonlinear vibration characteristics was employed, using a laser Doppler vibrometer to collect the vibration response signals of the specimens. This study proposes a non-contact method for identifying ETICS debonding damage, offering a novel approach for defect detection.

2. Materials and Methods

2.1. Nonlinear Vibration Theory

The Duffing vibration system is one of the classical models used to describe nonlinear vibrations. In the development of structural dynamic systems, many nonlinear dynamic equations can be simplified into the form of the Duffing equation [25].
m x ¨ + c x ˙ + k 1 x + k 2 x 3 = 0
where m is the mass of the system, c is the damping coefficient, k 1 is the linear stiffness, k 2 is the nonlinear stiffness coefficient that determines the degree of nonlinearity, and x is the displacement of the system.
To analyze the vibration response of the Duffing system, the perturbation method can be employed to solve the free vibration problem. The perturbation method is a commonly used approximate technique for addressing nonlinear problems, allowing them to be transformed into a series of linear problems solved step by step. It is assumed that the system response can be expressed as a perturbation expansion in terms of a small parameter [26]:
x ( t ) = ε x 1 ( t ) + ε 2 x 2 ( t ) +
where ε is a small parameter representing the strength of the system’s nonlinearity. Substituting this assumption into the Duffing equation and expanding it order by order yields the following equations:
① At the first-order approximation, the system response satisfies a linear equation:
m x ¨ 1 + c x ˙ 1 + k 1 x 1 = 0
The first-order response is obtained as [27]:
x 1 ( t ) = A 1 c o s ( ω 1 t + φ 1 )
where A 1 is the first-order amplitude, and ω 1 = k 1 / m is the natural frequency of the linear system.
② At the second-order approximation, by incorporating the nonlinear correction term, the modified natural frequency is obtained as:
ω ( A ) = ω 0 ( 1 + α A 2 )  
where ω 0 is the linear natural frequency, α   =   k 2 / 4 m is the correction factor derived from the nonlinear stiffness coefficient, and A is the amplitude.
Equation (5) indicates that the system’s frequency varies with the amplitude, and the degree of this variation is proportional to the nonlinear stiffness coefficient k2. Specifically, when k2 > 0, the Duffing system exhibits hardening behavior, with frequency increasing as amplitude increases; when k2 < 0, the system exhibits softening behavior, with frequency decreasing as amplitude increases.

2.2. Variational Mode Decomposition

Variational Mode Decomposition (VMD) is an adaptive mode decomposition technique that decomposes complex signals into a set of Intrinsic Mode Functions (IMFs) with distinct frequency characteristics by optimizing a variational framework. Each IMF possesses a well-defined center frequency and can effectively capture the characteristic information of the signal within its corresponding frequency band. It is particularly well-suited for analyzing nonlinear and non-stationary time series data [28].

2.3. Hilbert Transform

The Hilbert transform is a fundamental time-domain transformation method that is widely used in the analysis of instantaneous frequency and time–frequency representation of non-stationary signals. Its core concept involves mapping a real-valued signal to its corresponding analytic signal, thereby revealing the signal’s instantaneous characteristics in both the time and frequency domains [29].

2.4. Defect Identification Procedure

Figure 1 illustrates the nonlinear vibration-based defect identification procedure for the external thermal insulation specimen.
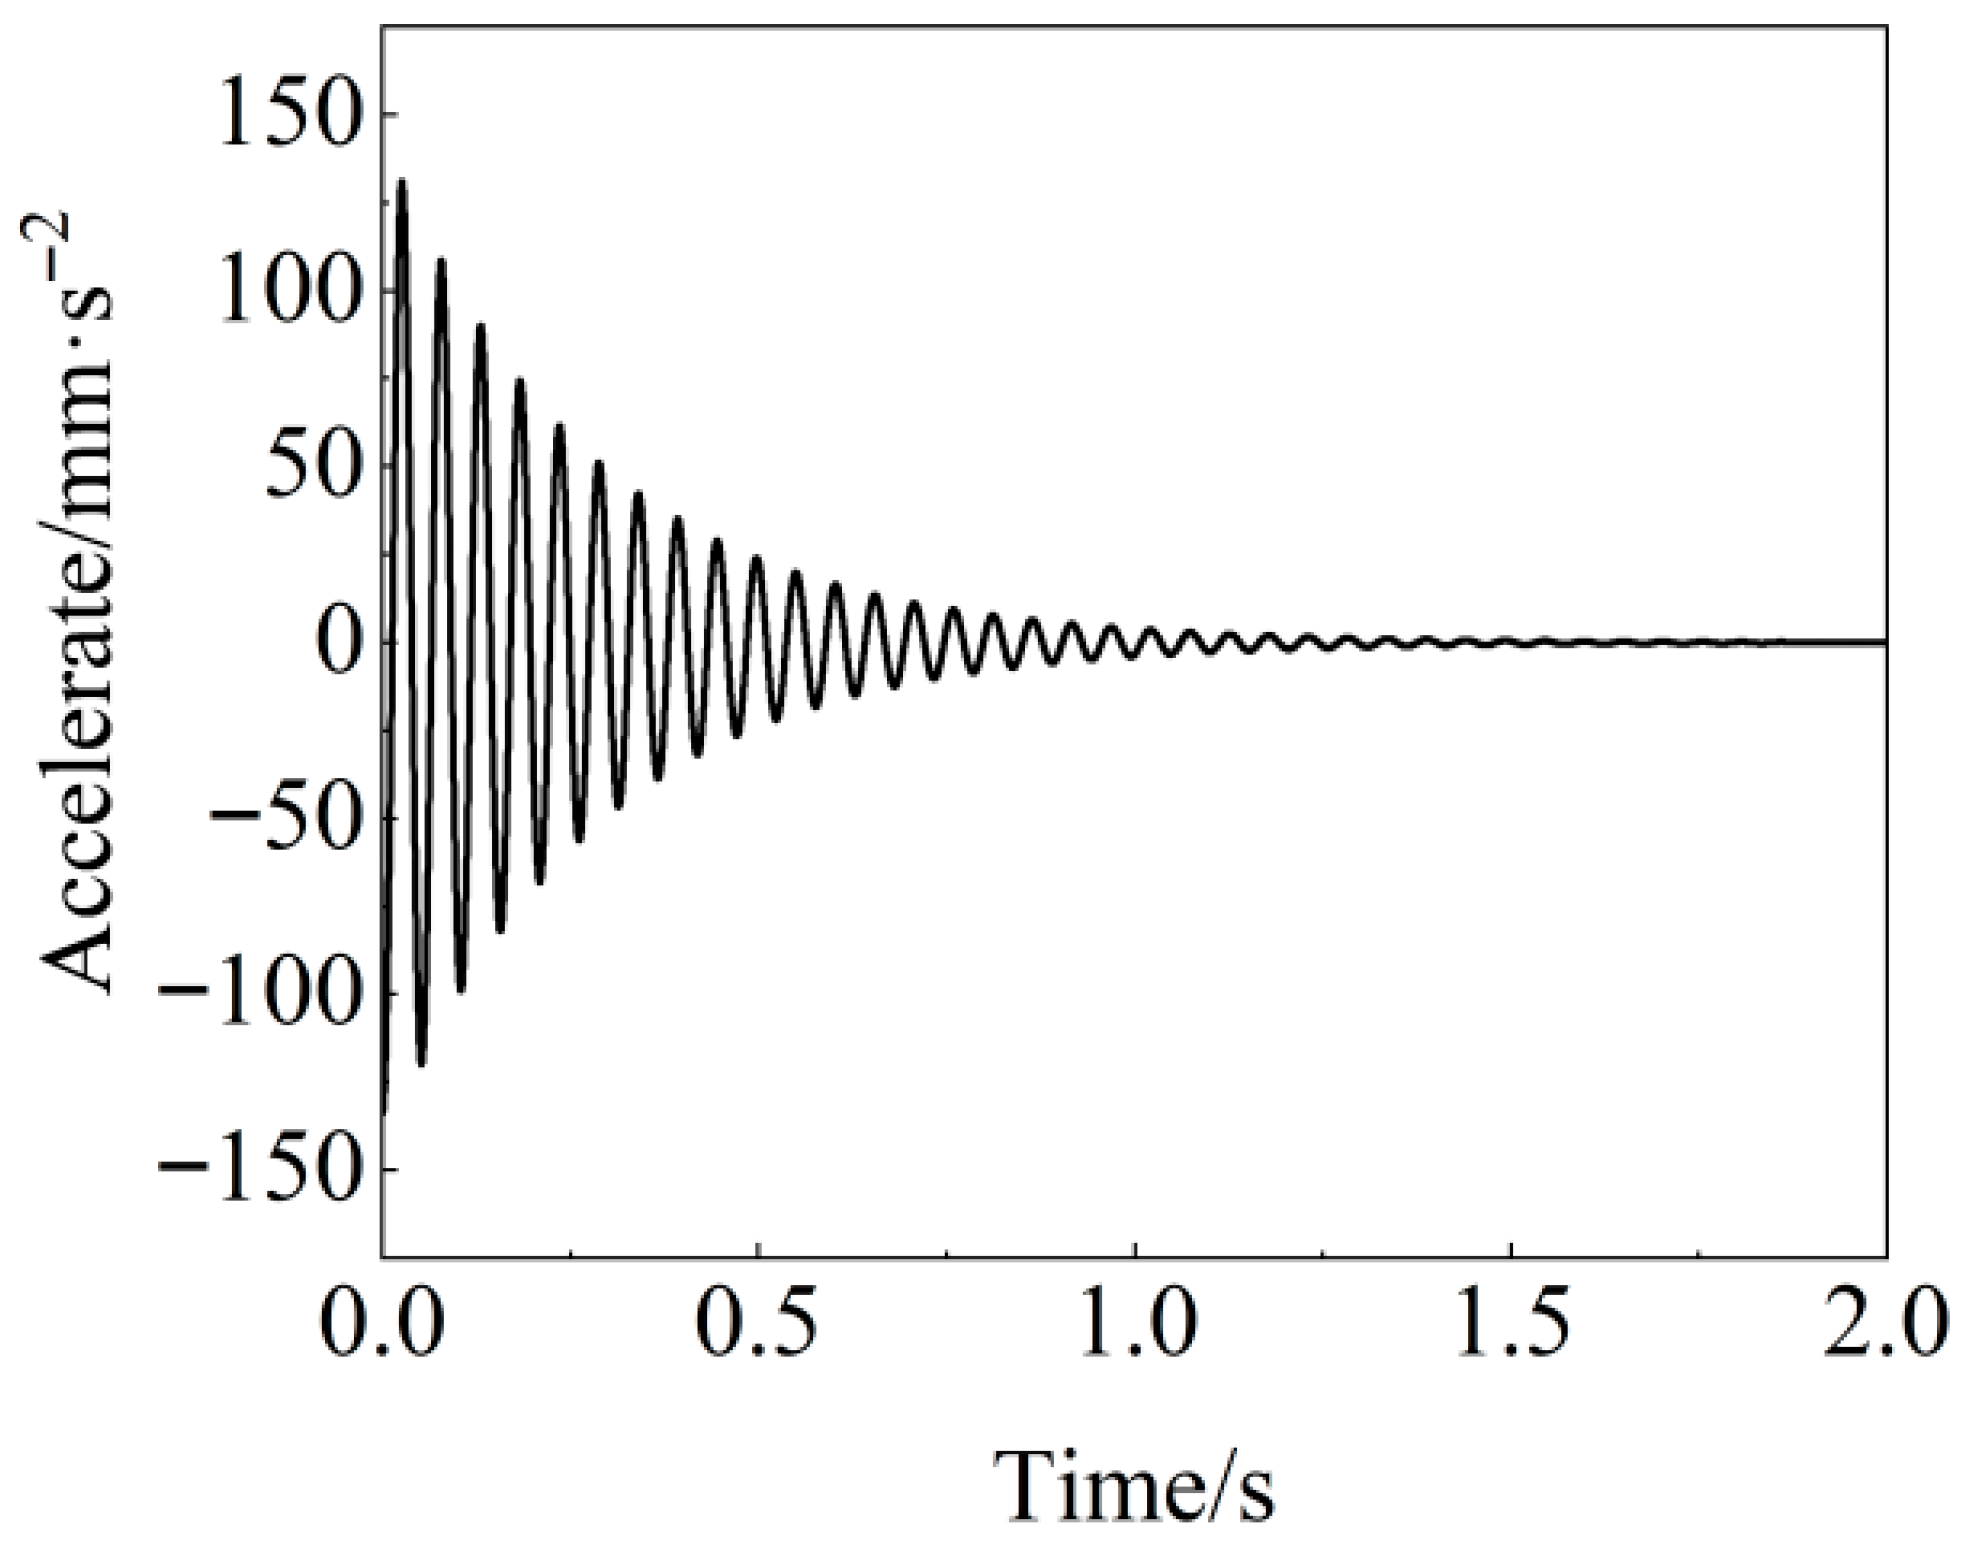
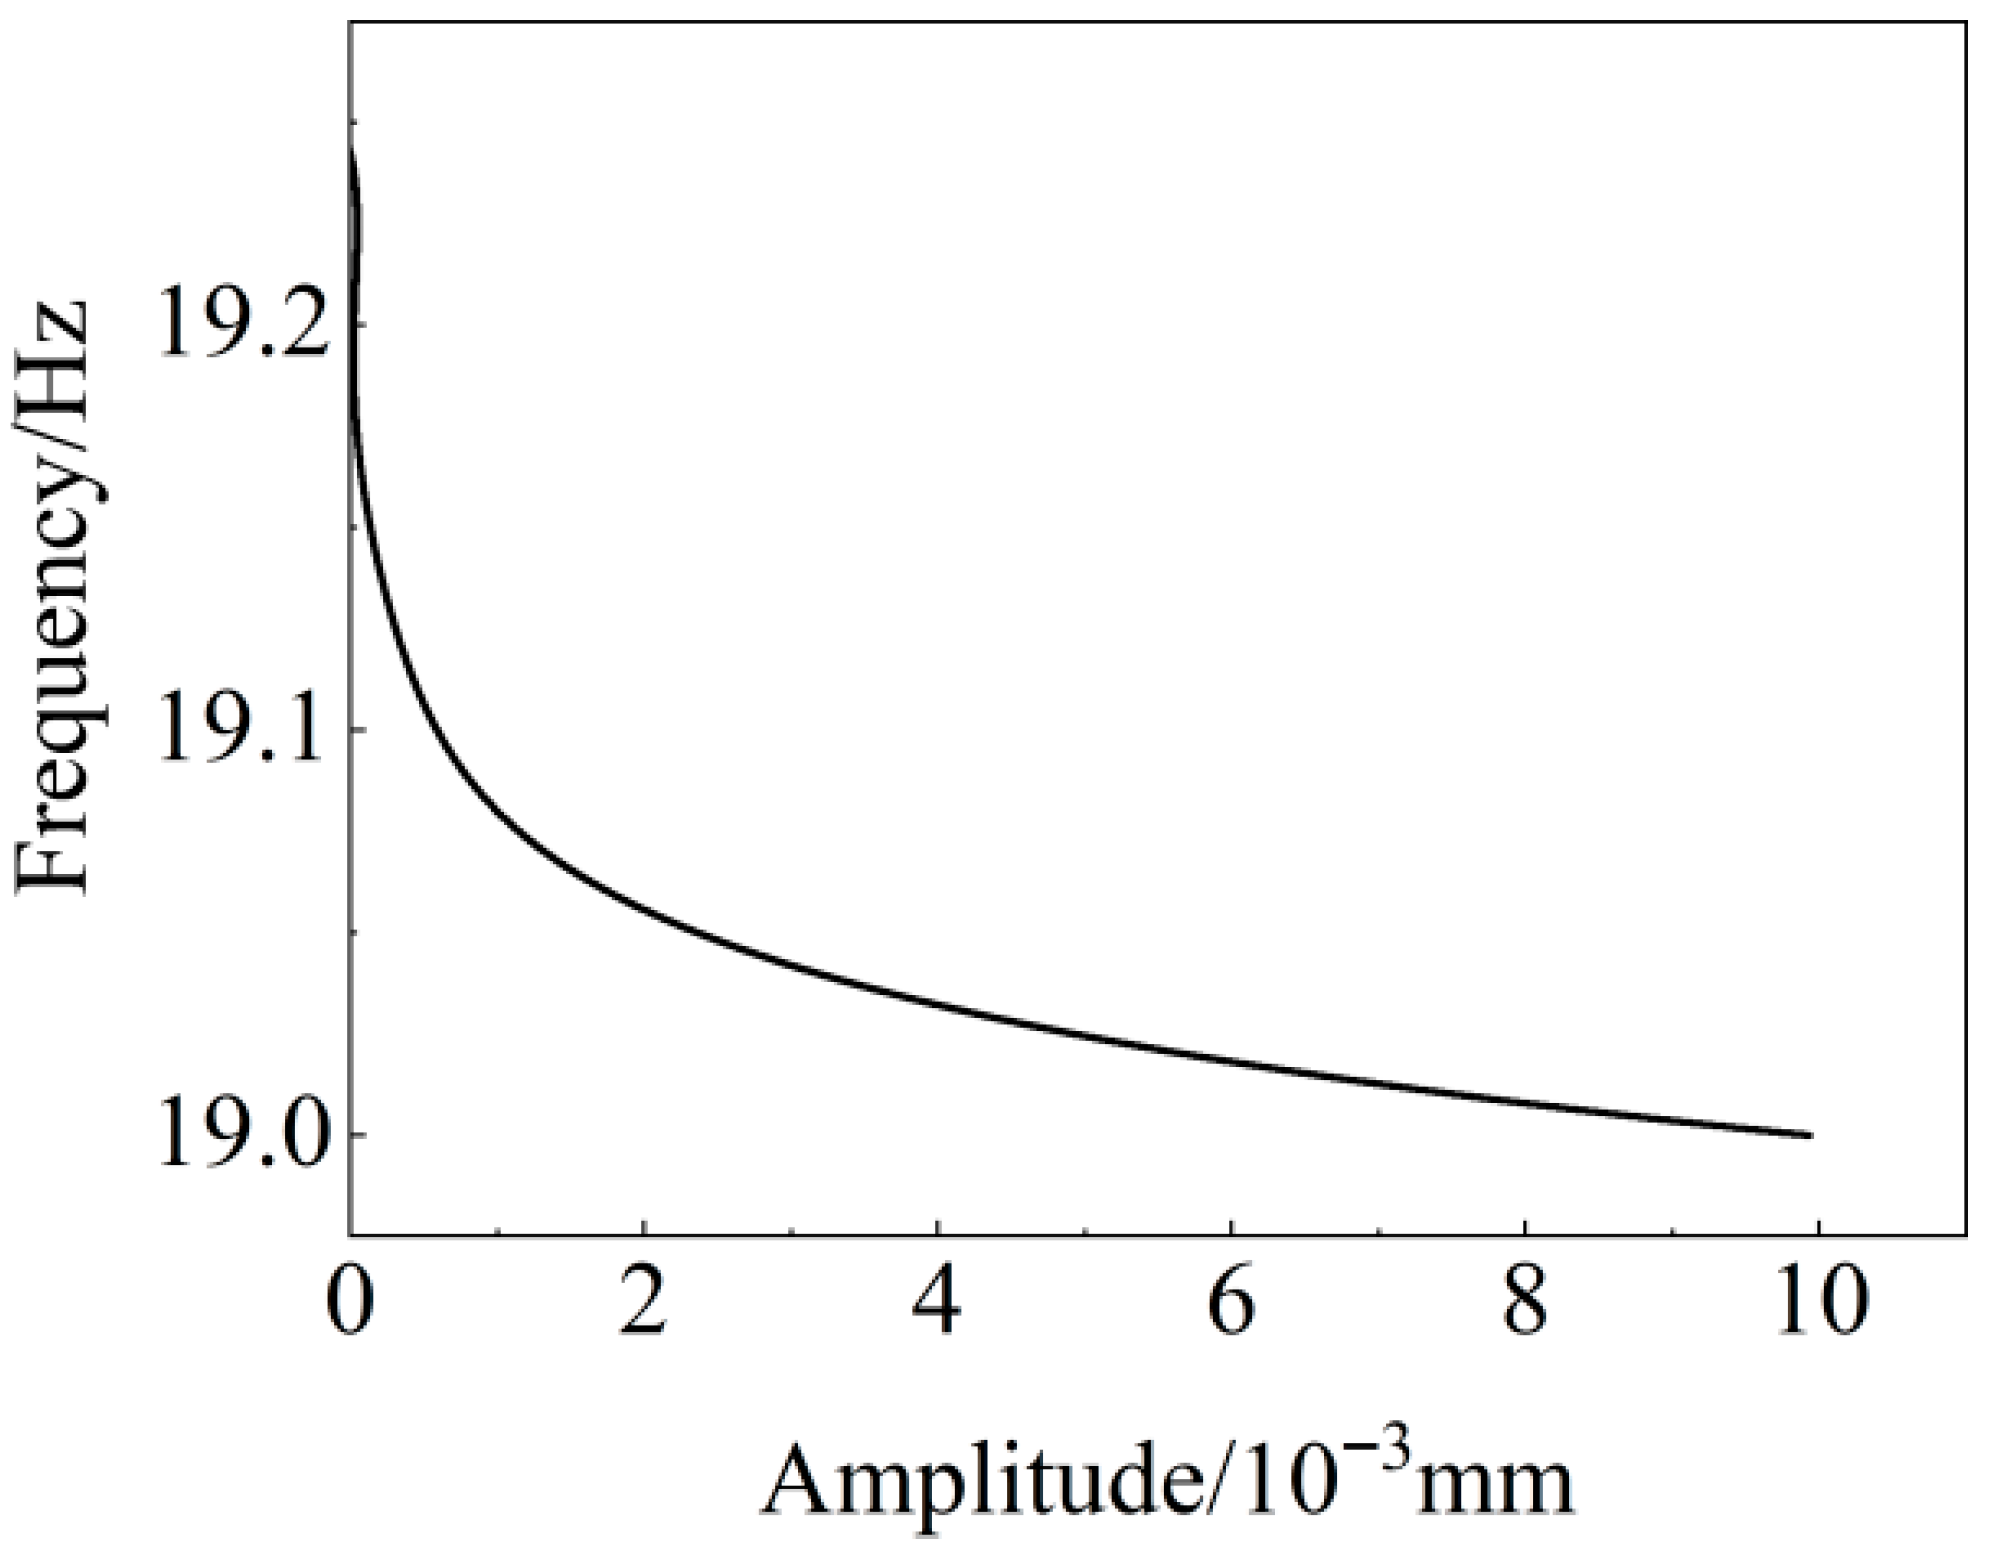
To demonstrate the signal processing method in detail, a weakly nonlinear damped vibration time-history signal containing three modal components is constructed. The first-order modal component of the signal is obtained by solving the dynamic equation of the weakly nonlinear damped Duffing free vibration system, Equation (1), using the fourth-order Runge–Kutta method in MATLAB 2022, with parameters specified as follows, sampling frequency of 5000 Hz; signal duration of 2 s; initial amplitude of 10 mm; damping ratio ξ   =   0.03 ; natural frequency ω 0   =   19   H z ; and ε   =   0.2 . The second and third-order modal signals are generated by the following Equation (6):
a i ( t ) = A i e 2 π ξ i f i t   c o s ( 2 π f i t + θ )  
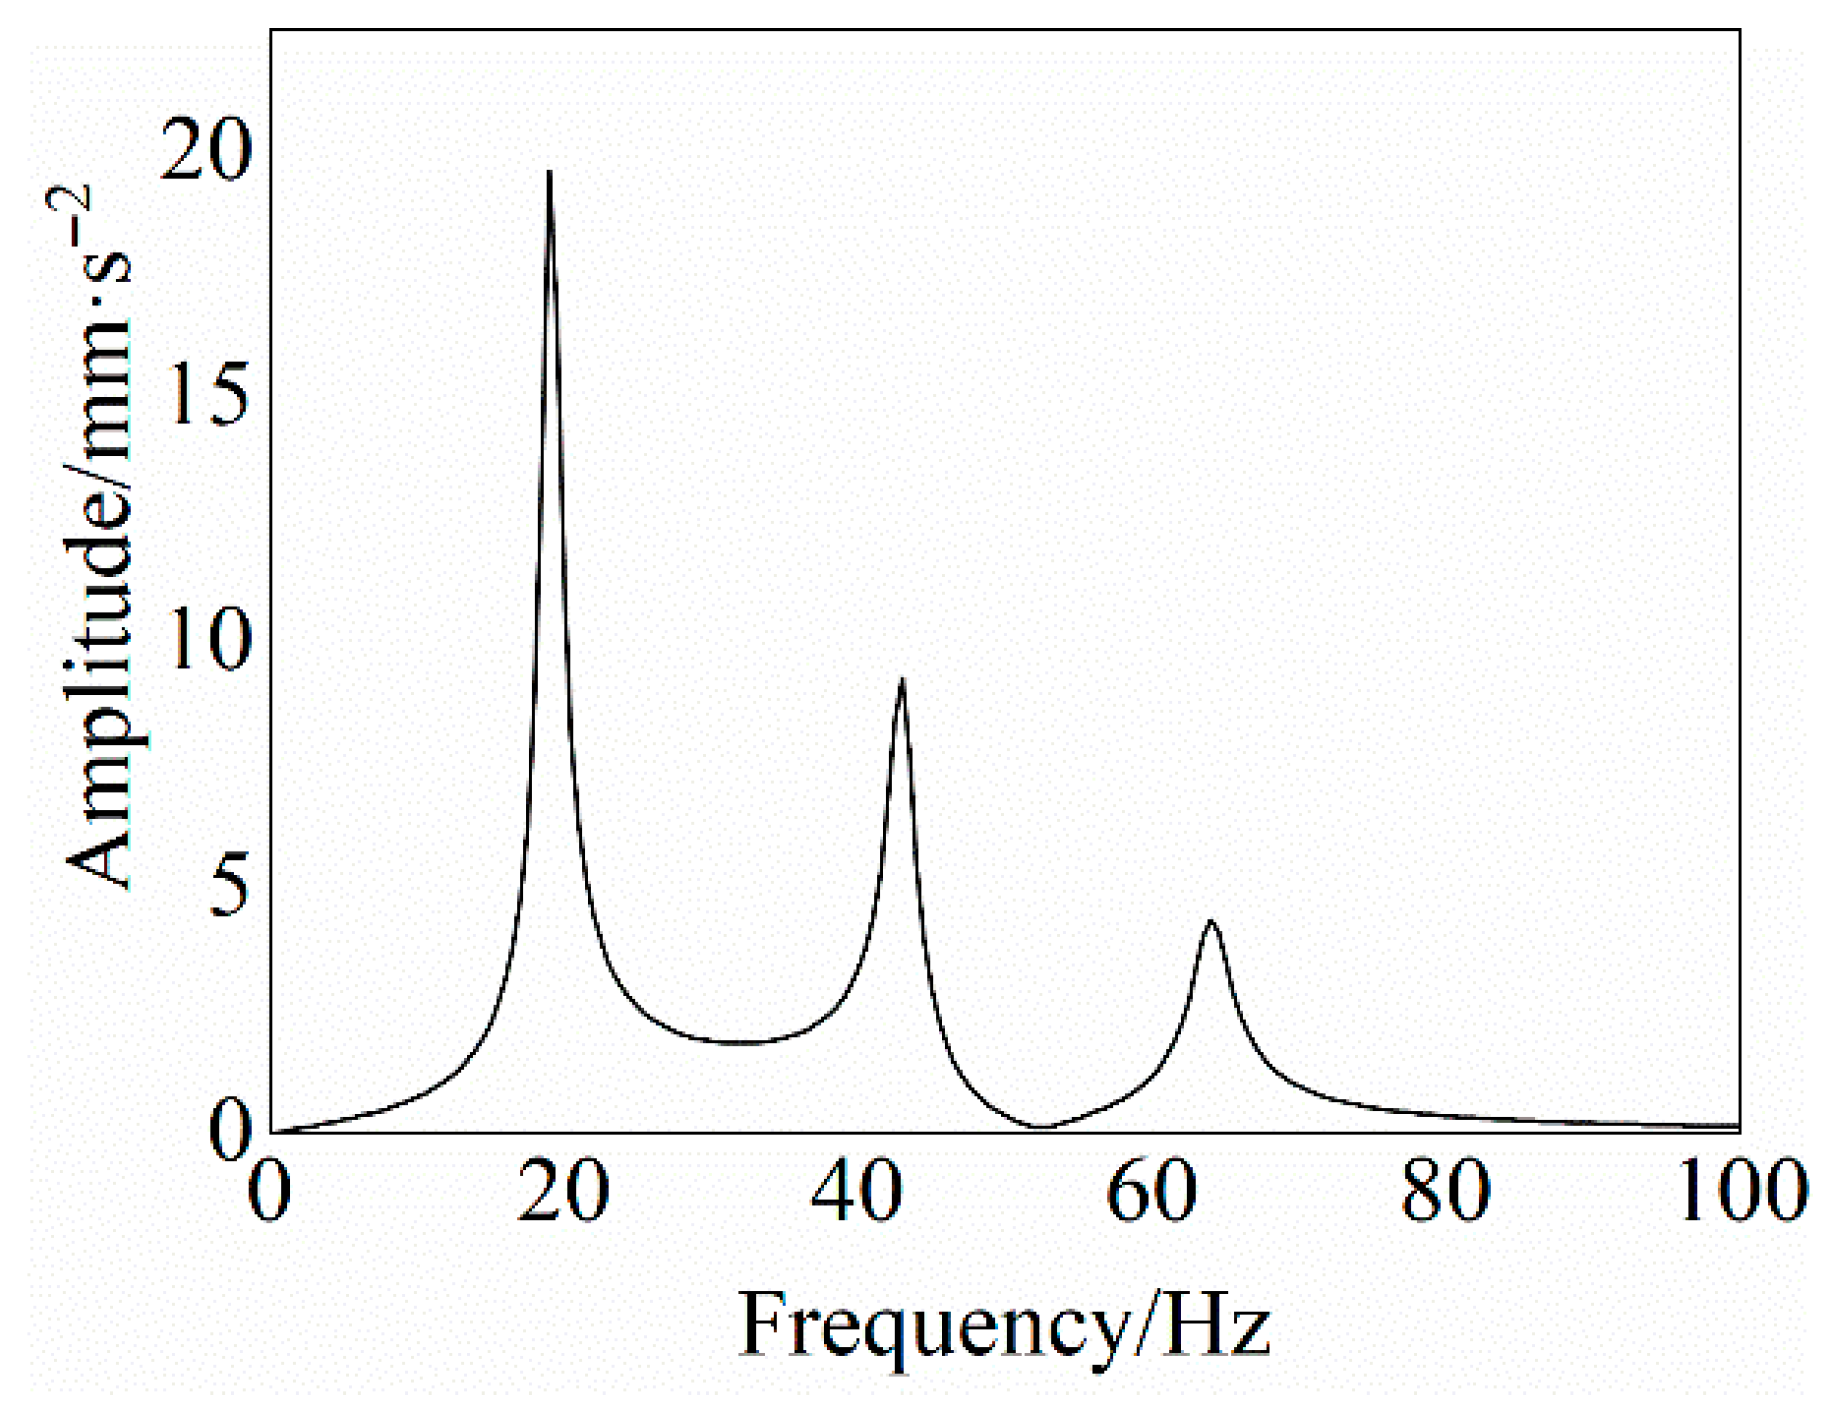
In Equation (6), the index i starts from 2. Here, A i denotes the amplitude, with A 2 = 100   m m · s 2 ,   A 3 = 70   m m · s 2 ; ξ i represents the damping ratio of each mode, with ξ 2   =   ξ 3   =   0.02 ; f i denotes the modal frequencies, with f 2 = 43   H z , f 3 = 64   H z ; θ i is the initial phase of each mode, θ 2 = θ 3 = 0 . The sampling frequency is 5000 Hz, and the sampling duration is 2 s. The final form of the signal and its spectrum are shown in Figure 2 and Figure 3.
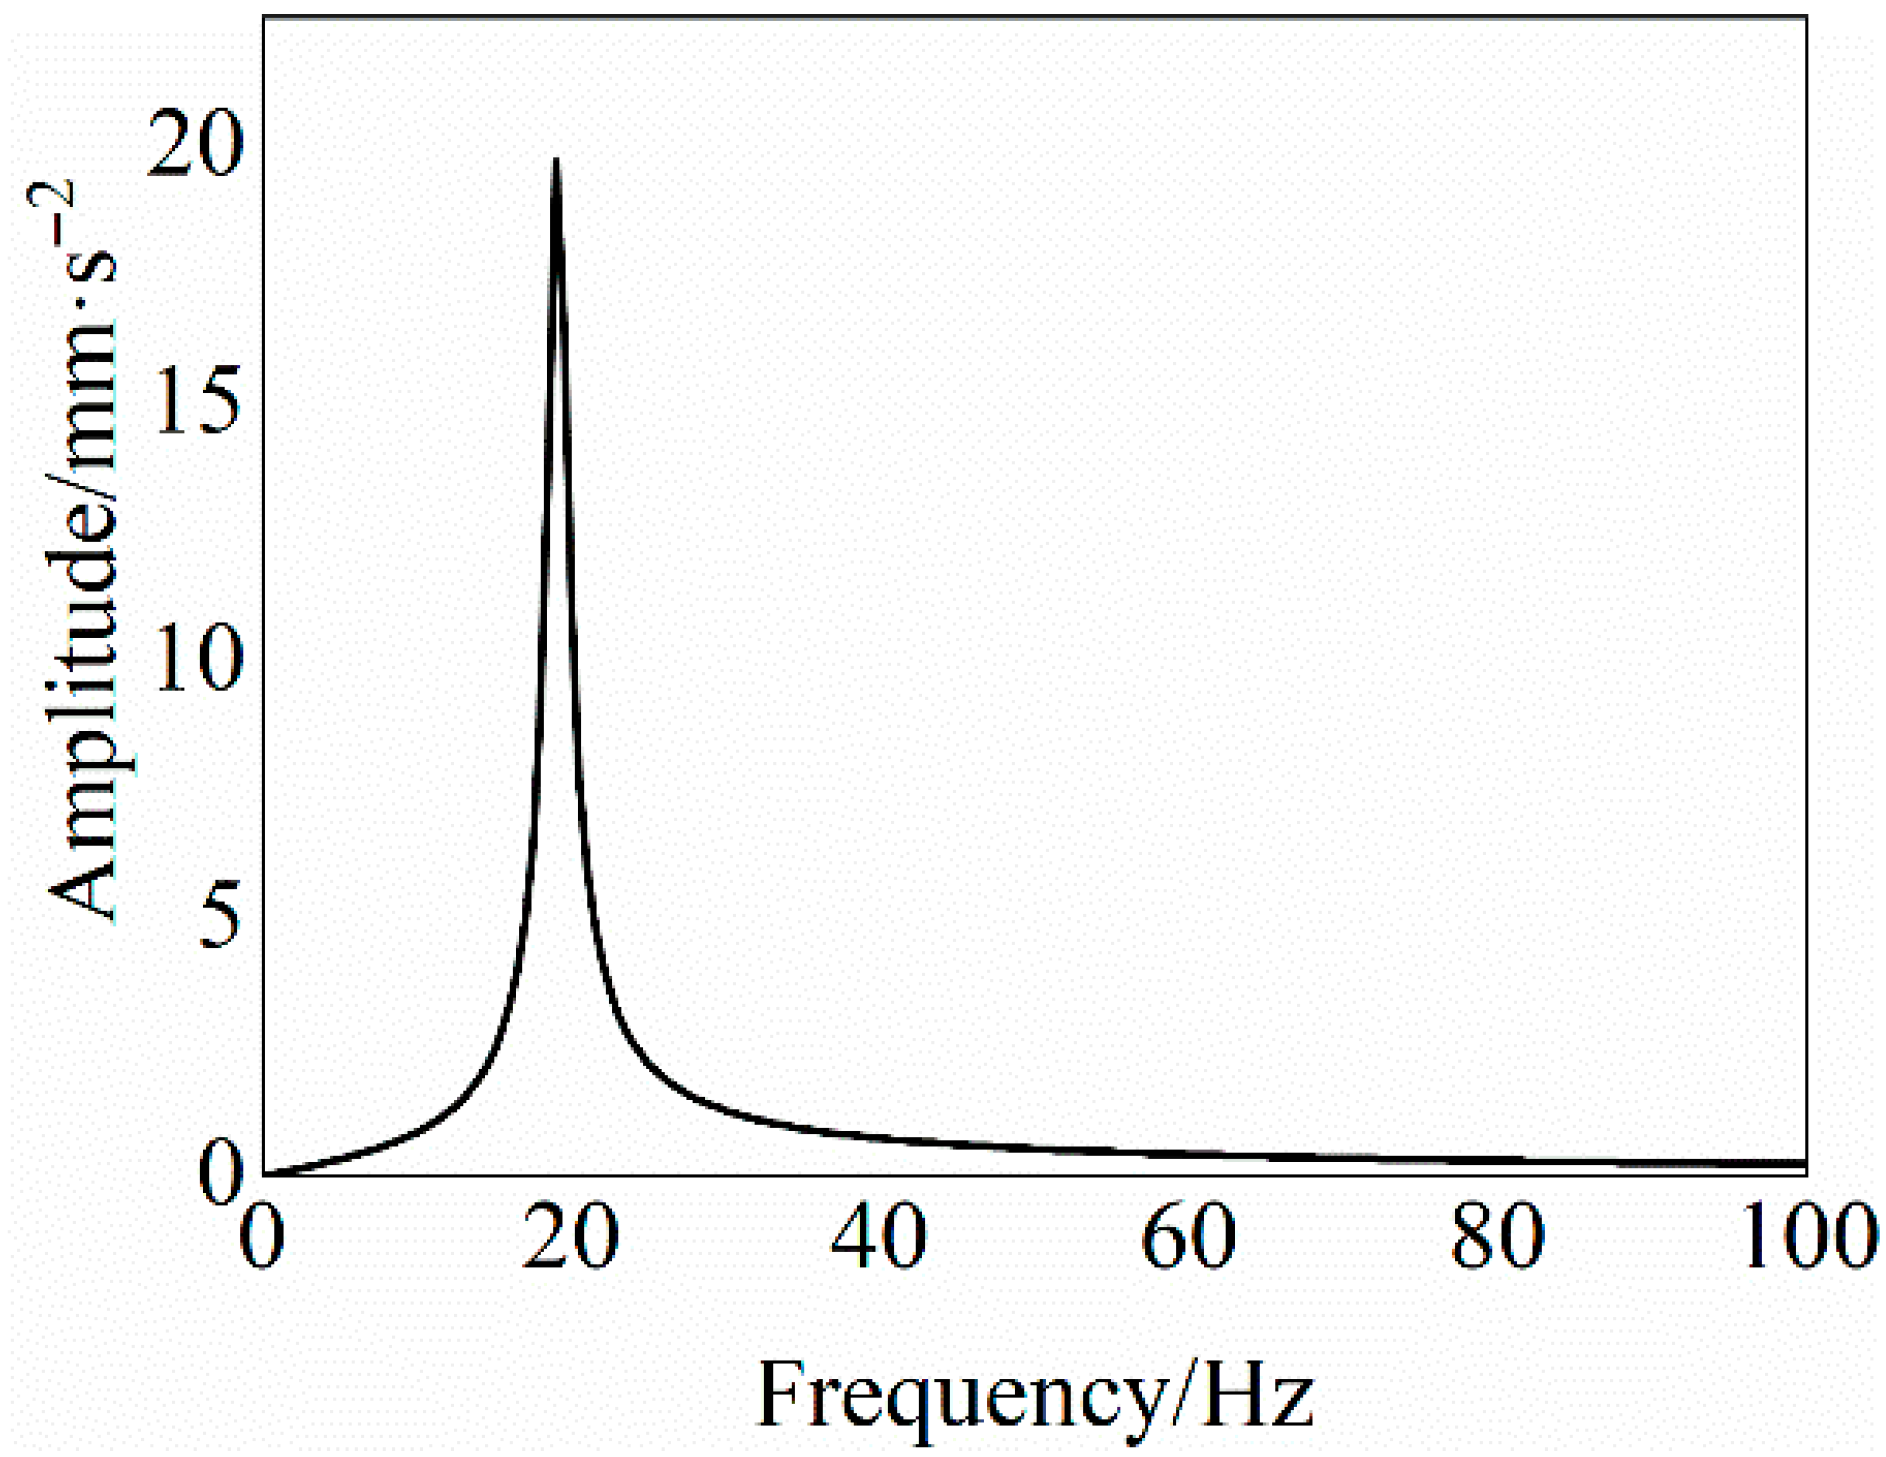
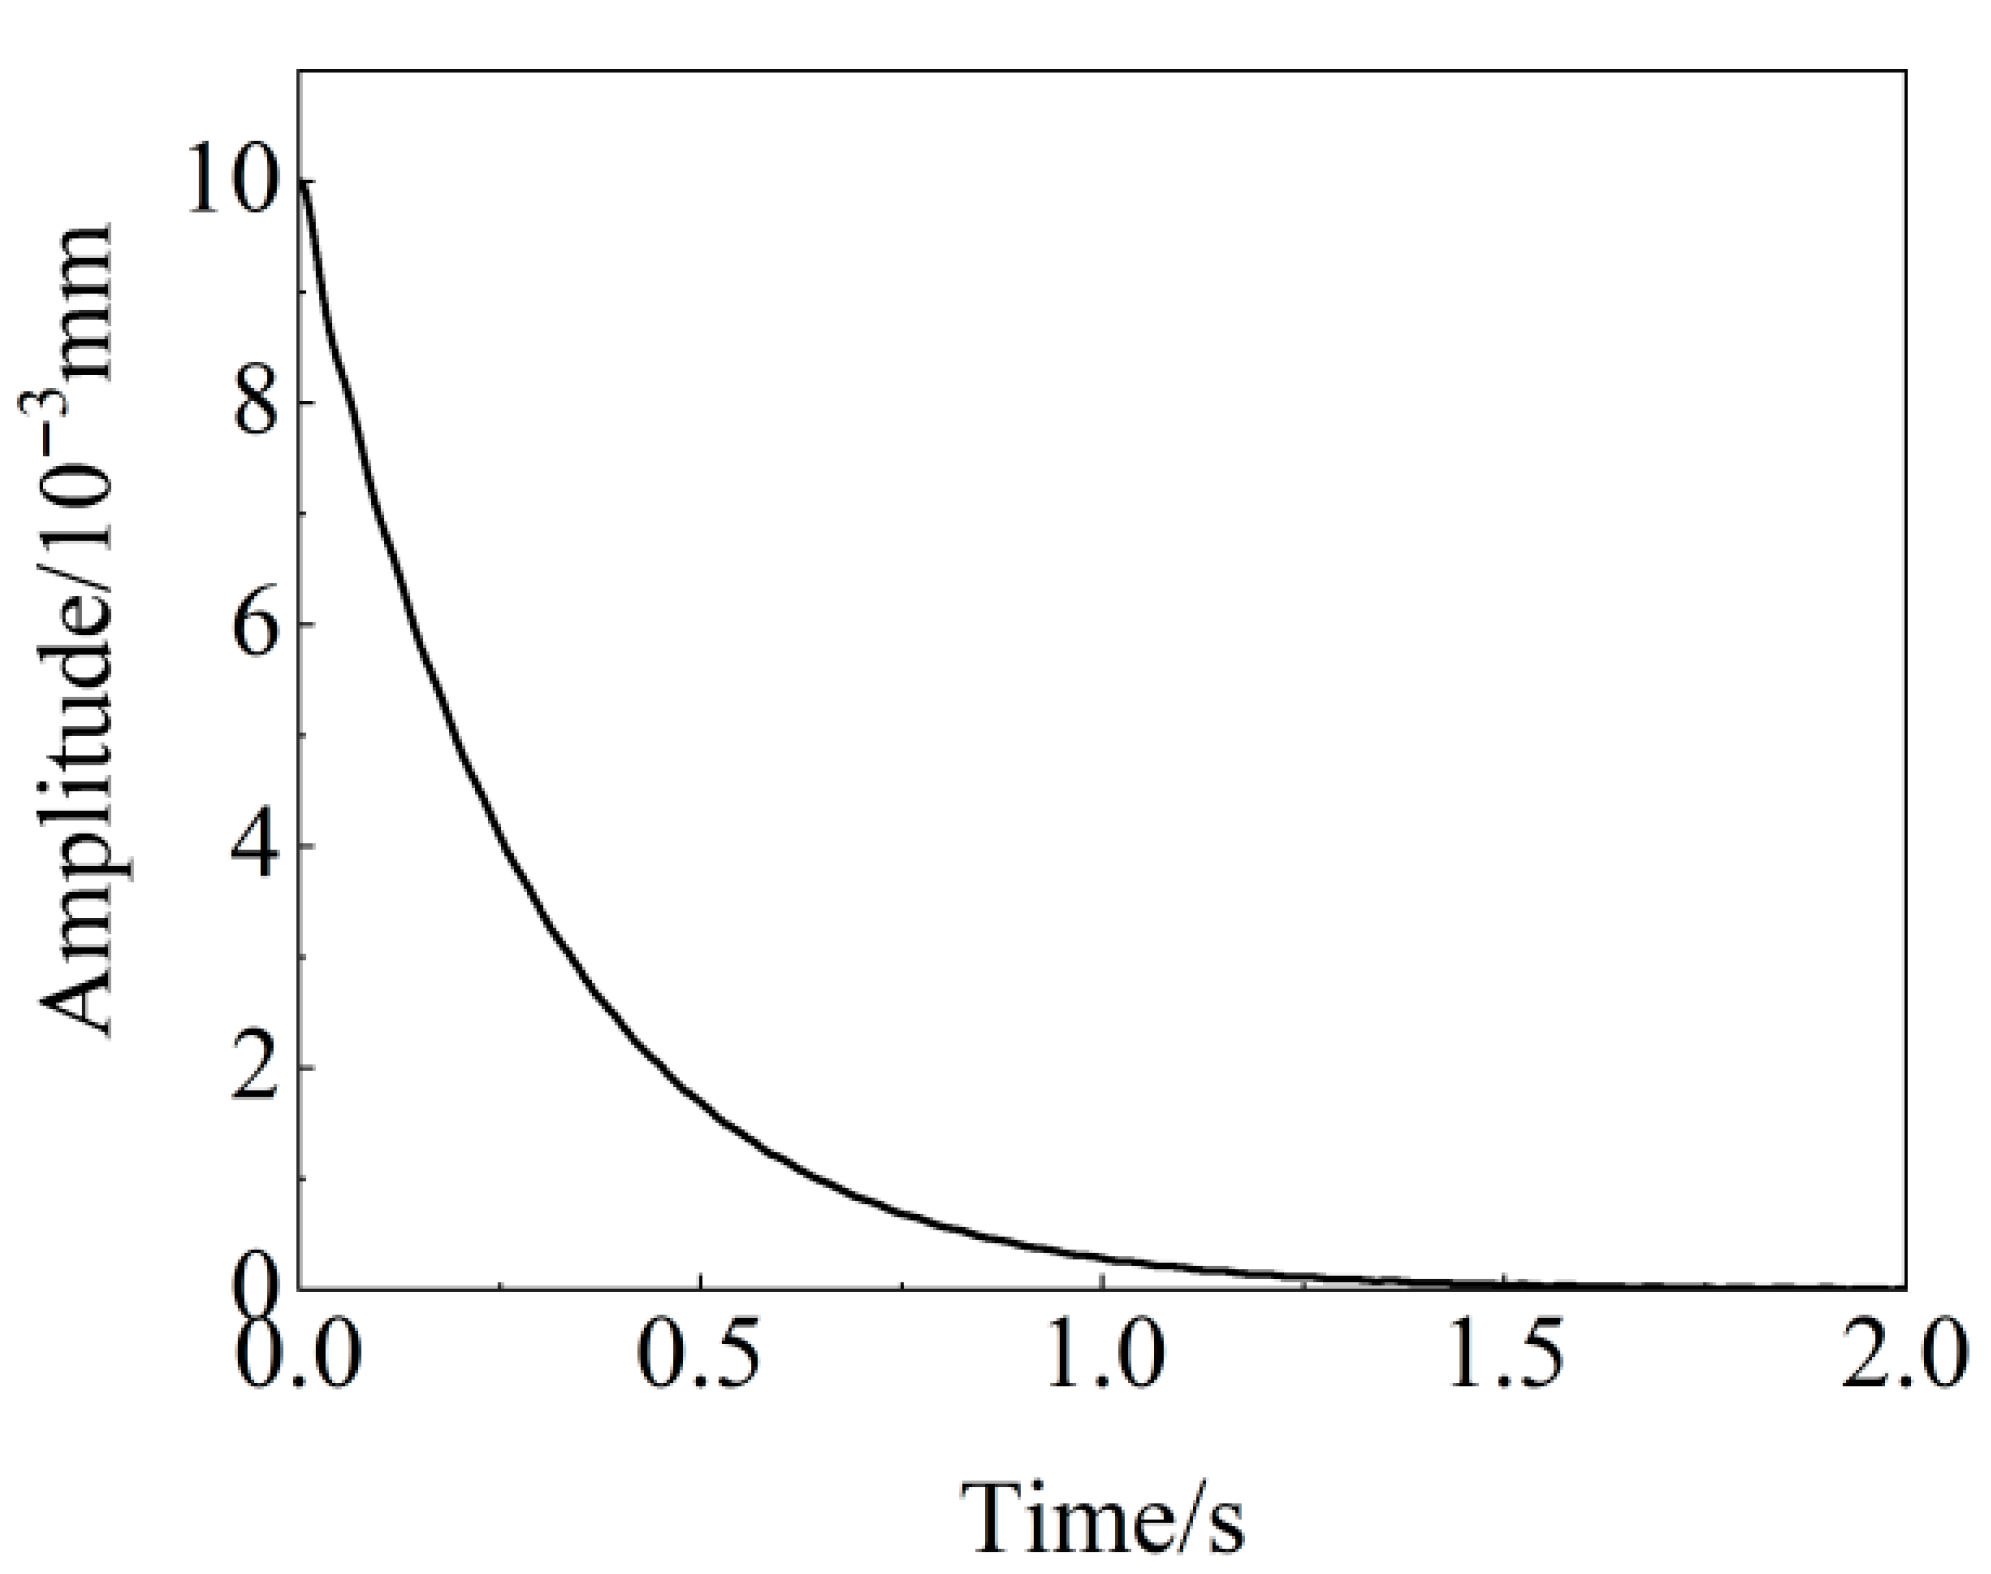
After obtaining the multi-modal weakly nonlinear damped vibration time-history signal, variational mode decomposition (VMD) is first applied to decompose the signal and extract its first-order modal component, as shown in Figure 4 The frequency-domain signal (Figure 5) shows that the modes decomposed by the VMD method contain no redundant components.
The time-history signal is subjected to the Hilbert transform to obtain the instantaneous frequency and amplitude, as shown in Figure 6 and Figure 7.
Finally, the instantaneous frequency and instantaneous amplitude are subjected to linearization and smoothing processes, respectively. Using the time correspondence between the instantaneous frequency and amplitude, the frequency–amplitude curve of the signal is obtained, as shown in Figure 8.
The frequency–amplitude relationship serves as an indicator of the system’s nonlinearity. In the frequency–amplitude curve, greater differences between the initial and final frequency values correspond to stronger structural nonlinearity, whereas smaller deviations indicate weaker nonlinearity.

3. Experimental Design for Debonding Defect Detection in ETICS

Specimen Fabrication

The experimental ETICS specimens were constructed according to the requirements of JGJ 144-2019 “Technical Standard for External Thermal Insulation of Buildings” [30]. Before constructing the specimen, the base wall was wetted by spraying water and coated with a primer. The adhesive layer was applied using polymer-modified cementitious adhesive mortar in strip bonding, ensuring a bonding rate of 50%. The insulation layer consisted of two Expanded Polystyrene boards sized 1200 mm × 600 mm × 100 mm bonded onto the substrate. The finish layer was a 7 mm plaster mortar coating embedded with alkali-resistant fiberglass mesh with 4 mm × 4 mm mesh openings. During the application of the adhesive layer, a plastic film was placed at the interface between the insulation and adhesive layers to create a debonded region. In this test, four debonding conditions were introduced, as summarized in Table 1.
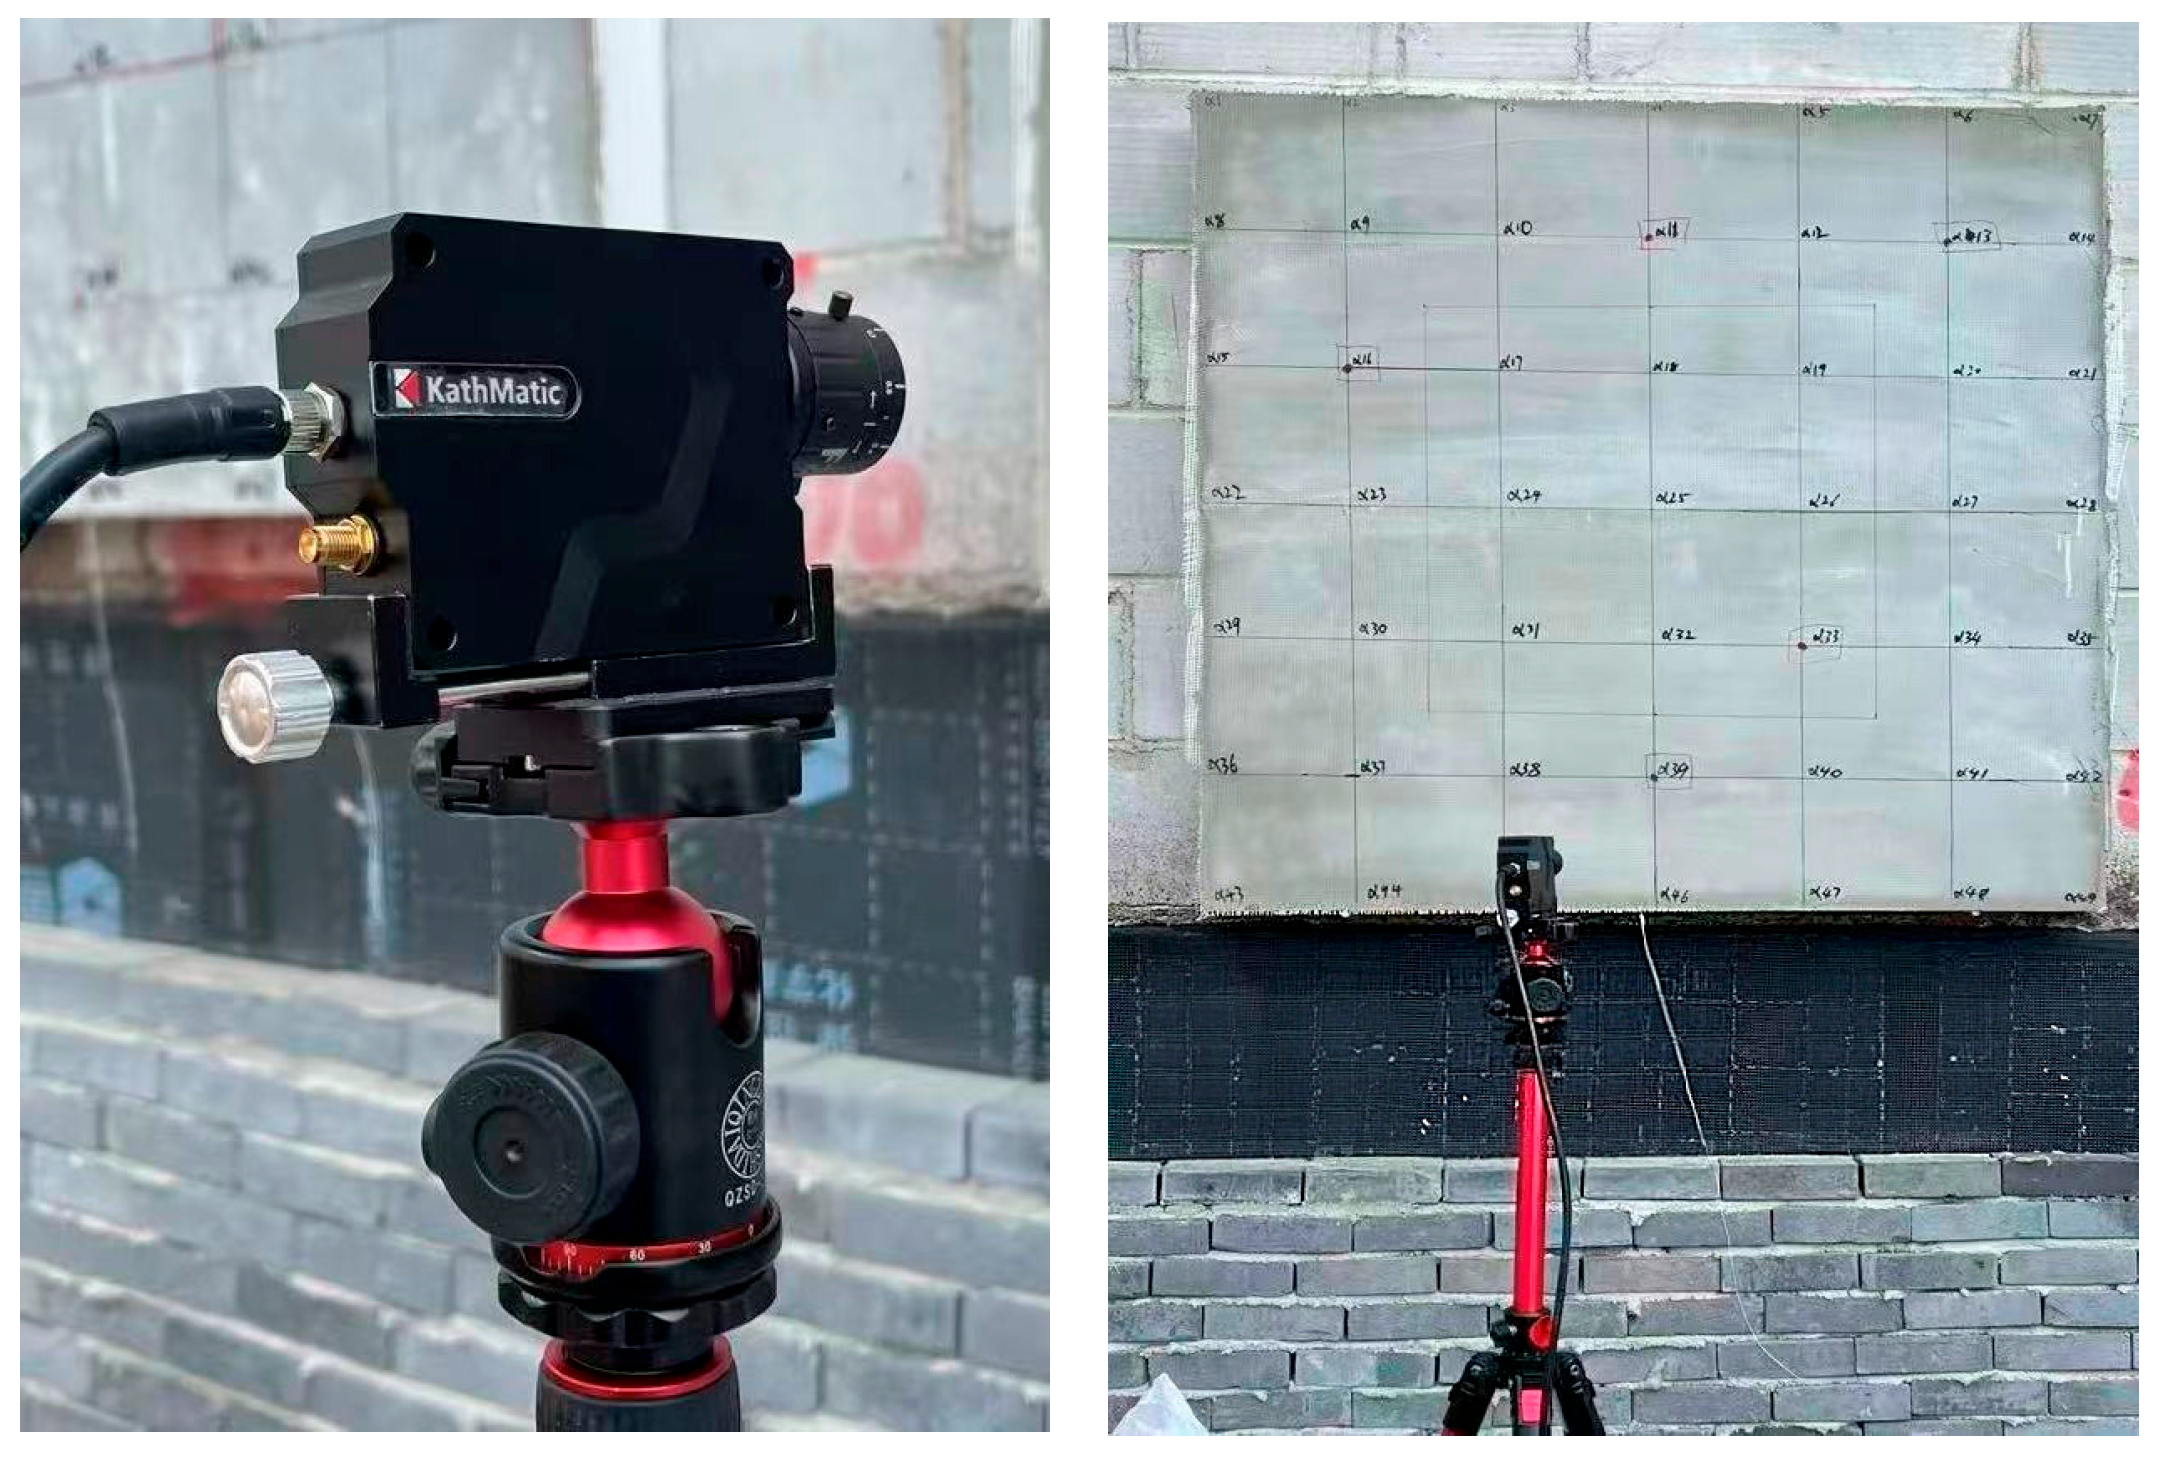
Figure 9 shows the experimental setup used for detecting debonding defects in the specimens. The vibration response signals were acquired in a non-contact manner using a Laser Doppler vibrometer (LDV) manufactured by Nanjing Kaysom Technology Co., Ltd. from Nanjing, China. The technical specifications of the LDV are summarized in Table 2. Due to its low sensitivity to external disturbances and distinct excitation characteristics, impact excitation is well suited for investigating structural vibration behavior and has been widely employed to simulate structural responses under natural excitation conditions. Therefore, a rubber hammer was used in this study to apply impact excitation to the rear side of the substrate wall of the insulation specimen. To identify debonding regions, 49 signal acquisition points were uniformly distributed on the surface of the specimen for each test condition, as shown in Figure 10.

4. Results

According to existing studies, the natural frequencies of external thermal insulation specimens are primarily distributed from 30 Hz to 1400 Hz. Therefore, a band-pass filter was applied to confine the acquired signals within this frequency range. The measured vibration acceleration signal is shown in Figure 11a. The acquired acceleration time-history signal comprises two main phases [31], (1) forced vibration caused by the impact between the hammer and the specimen surface, and (2) free decay vibration driven by the structure’s inherent dynamic response. Within the interval of 0.02–0.1 s, the signal exhibits sharp amplitude variations dominated by forced vibrations. Since forced responses reflect the characteristics of external excitation rather than those of the structure itself, they are not suitable for analyzing intrinsic structural properties. Therefore, in this study, a signal truncation method was employed to remove the initial forced vibration component. Only the subsequent free vibration segment, with gradually decaying amplitude, as shown in Figure 11b, was retained for further analysis of the structure’s nonlinear dynamic behavior.

4.1. Identification of the Degree of Debonding Between the Adhesive Layer and the Insulation Layer

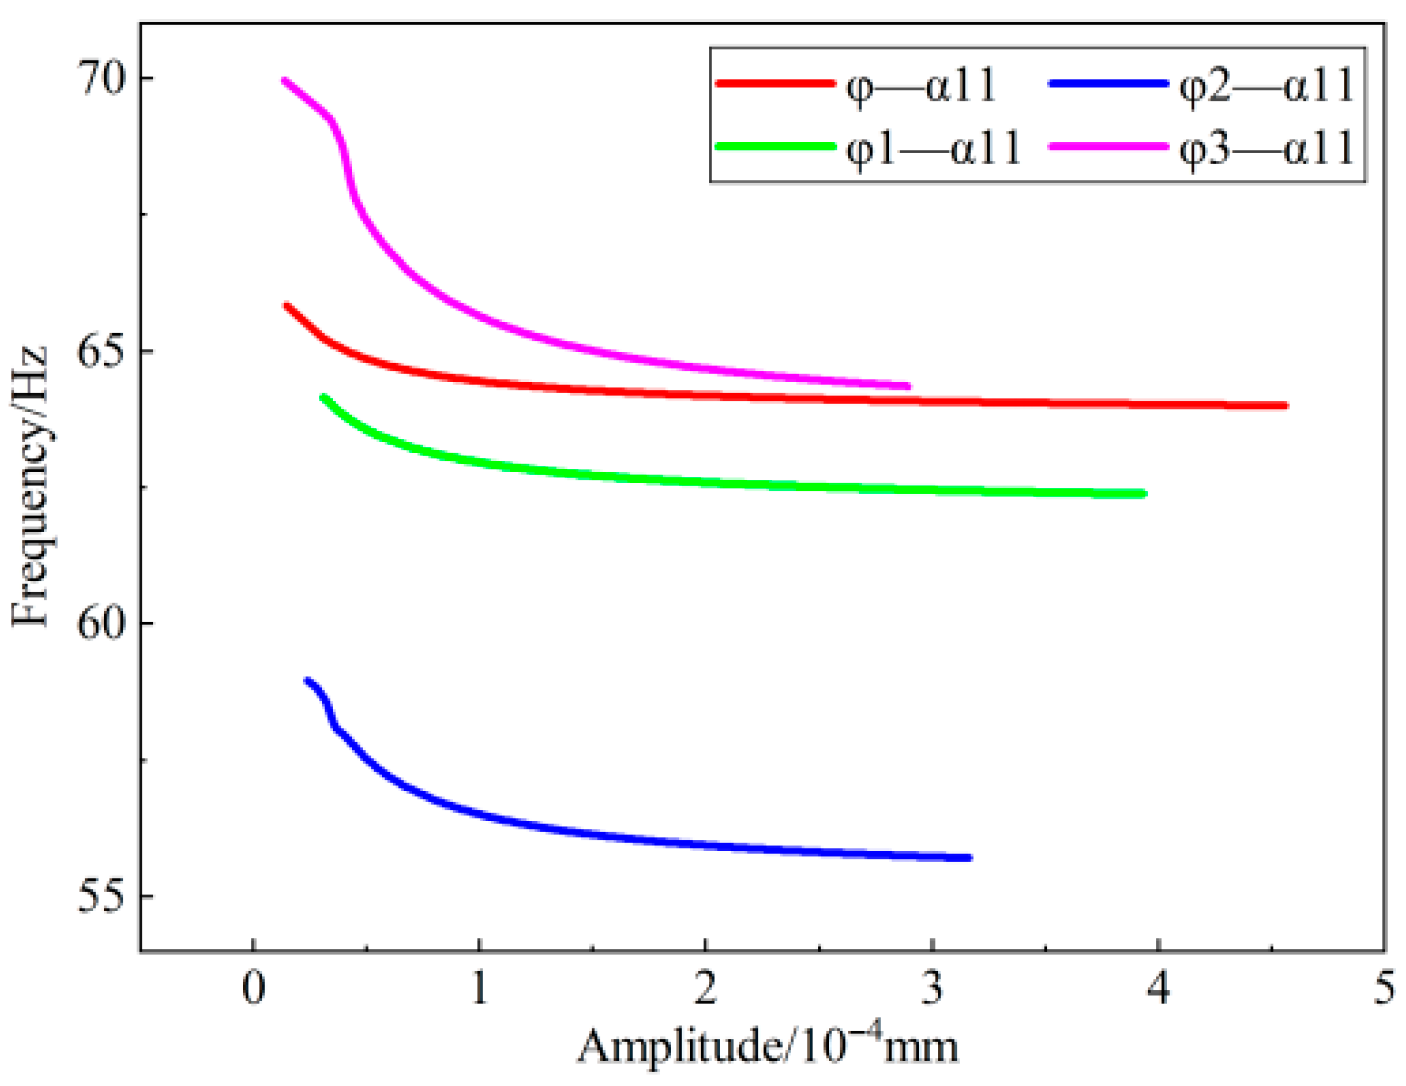
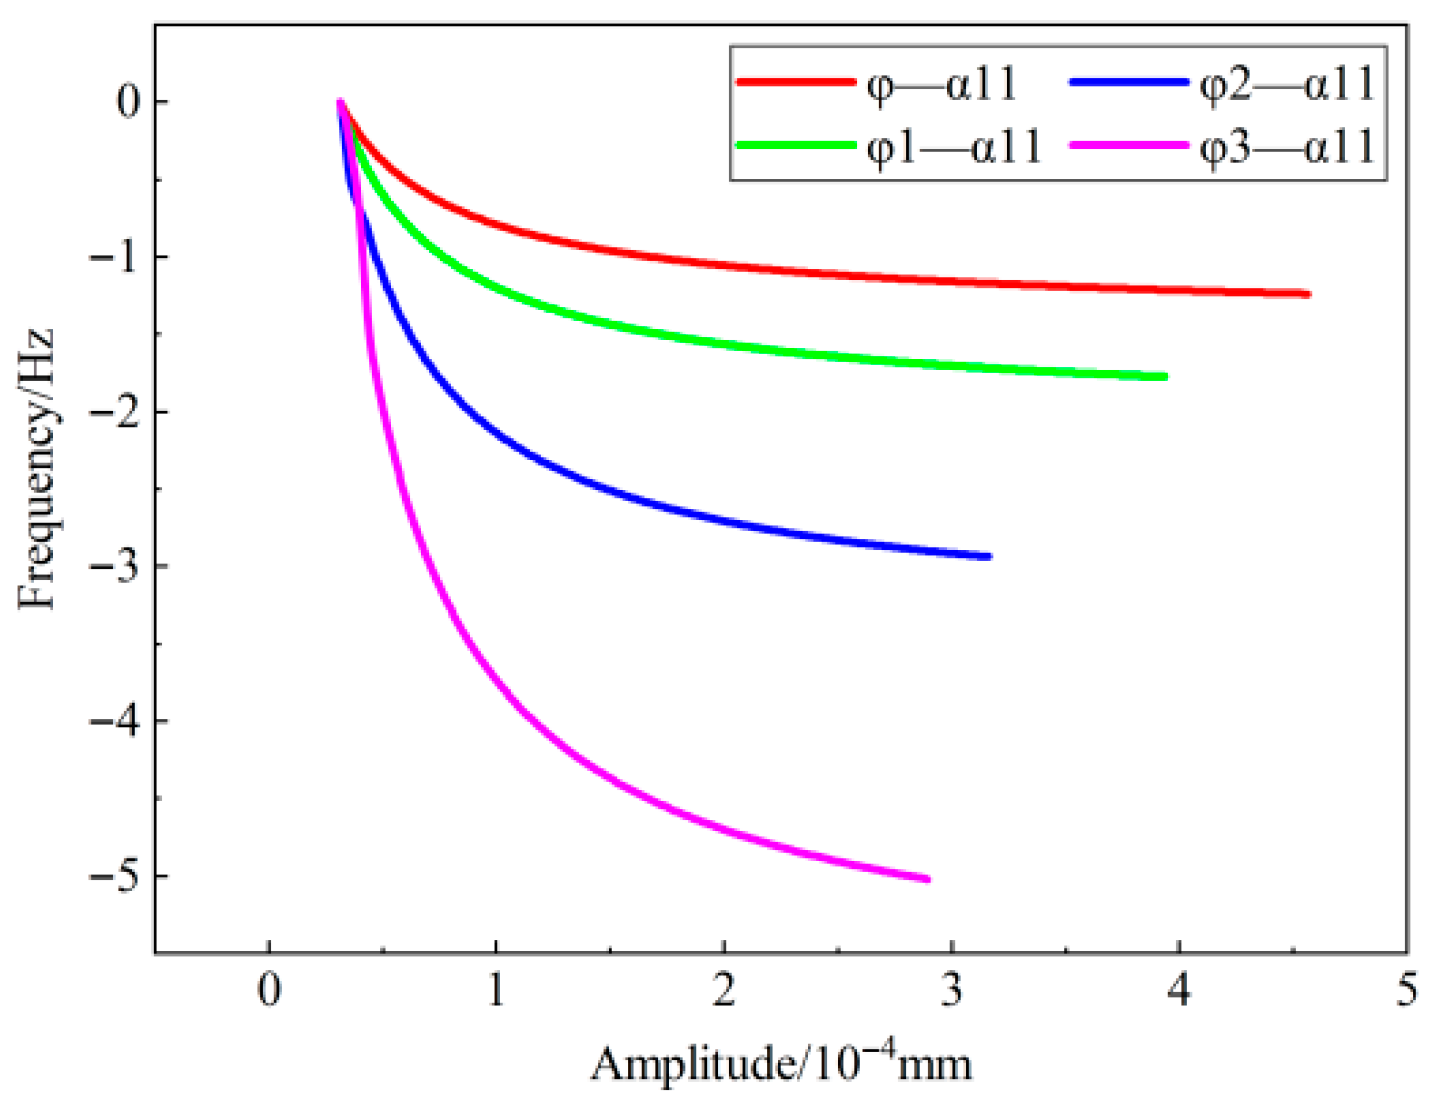
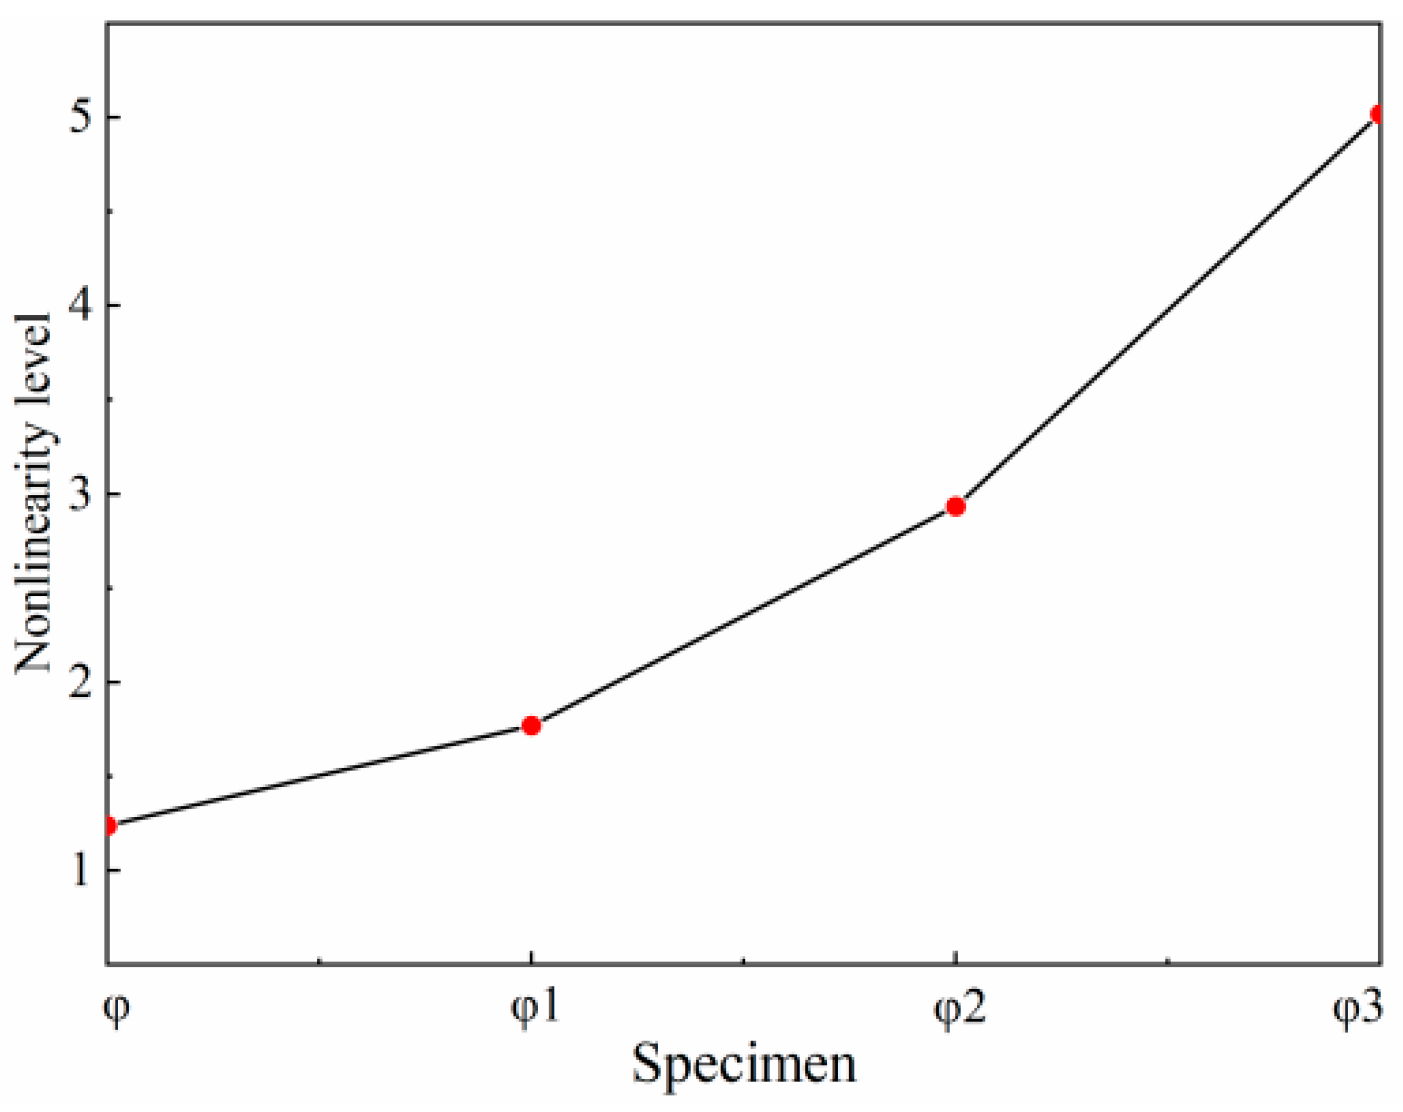
Following the identification procedure illustrated in Figure 1, the free decay vibration response signals at measuring point α11 for the four specimen conditions were decomposed using VMD. The first-order mode of each decomposition was then subjected to Hilbert transform to derive the corresponding frequency–amplitude curves, as shown in Figure 12, the fundamental frequencies of different specimens exhibit considerable discrepancies, these frequency differences arise from unavoidable factors during the construction process of the building, such as variations in wall construction techniques, curing conditions, and material properties. The results reveal significant differences in frequency response among the specimens. To further analyze the nonlinear characteristics induced by debonding defects, the frequency–amplitude curves were normalized, and the starting frequency was uniformly set to 0 Hz. As shown in Figure 13, the frequency of each specimen decreased with increasing vibration amplitude. The larger the debonded area, the more pronounced the frequency drop, indicating stronger nonlinear behavior. To quantify the degree of nonlinearity, the difference between the starting and ending frequencies of the frequency–amplitude curve was defined as the “nonlinearity index” [32]. This metric is intuitive and straightforward, facilitating comparative assessment of bonding defects. The nonlinearity indices for the four specimen conditions are presented in Figure 14, 1.23 for φ -α11, 1.77 for φ 1 -α11, 2.94 for φ 2 -α11, and 5.02 for φ 3 -α11. These results indicate that debonding damage has a substantial impact on the nonlinear vibrational characteristics of the EPS board thin-coat insulation system. Debonding alters the contact condition between the insulation layer and the adhesive layer, resulting in localized stiffness discontinuities and, consequently, enhanced nonlinear system responses. The greater the extent of debonding, the stronger the nonlinear response of the structure. The experimental results demonstrate that this method can effectively identify nonlinear vibrational features induced by structural defects.

4.2. Influence of Measurement Point Location

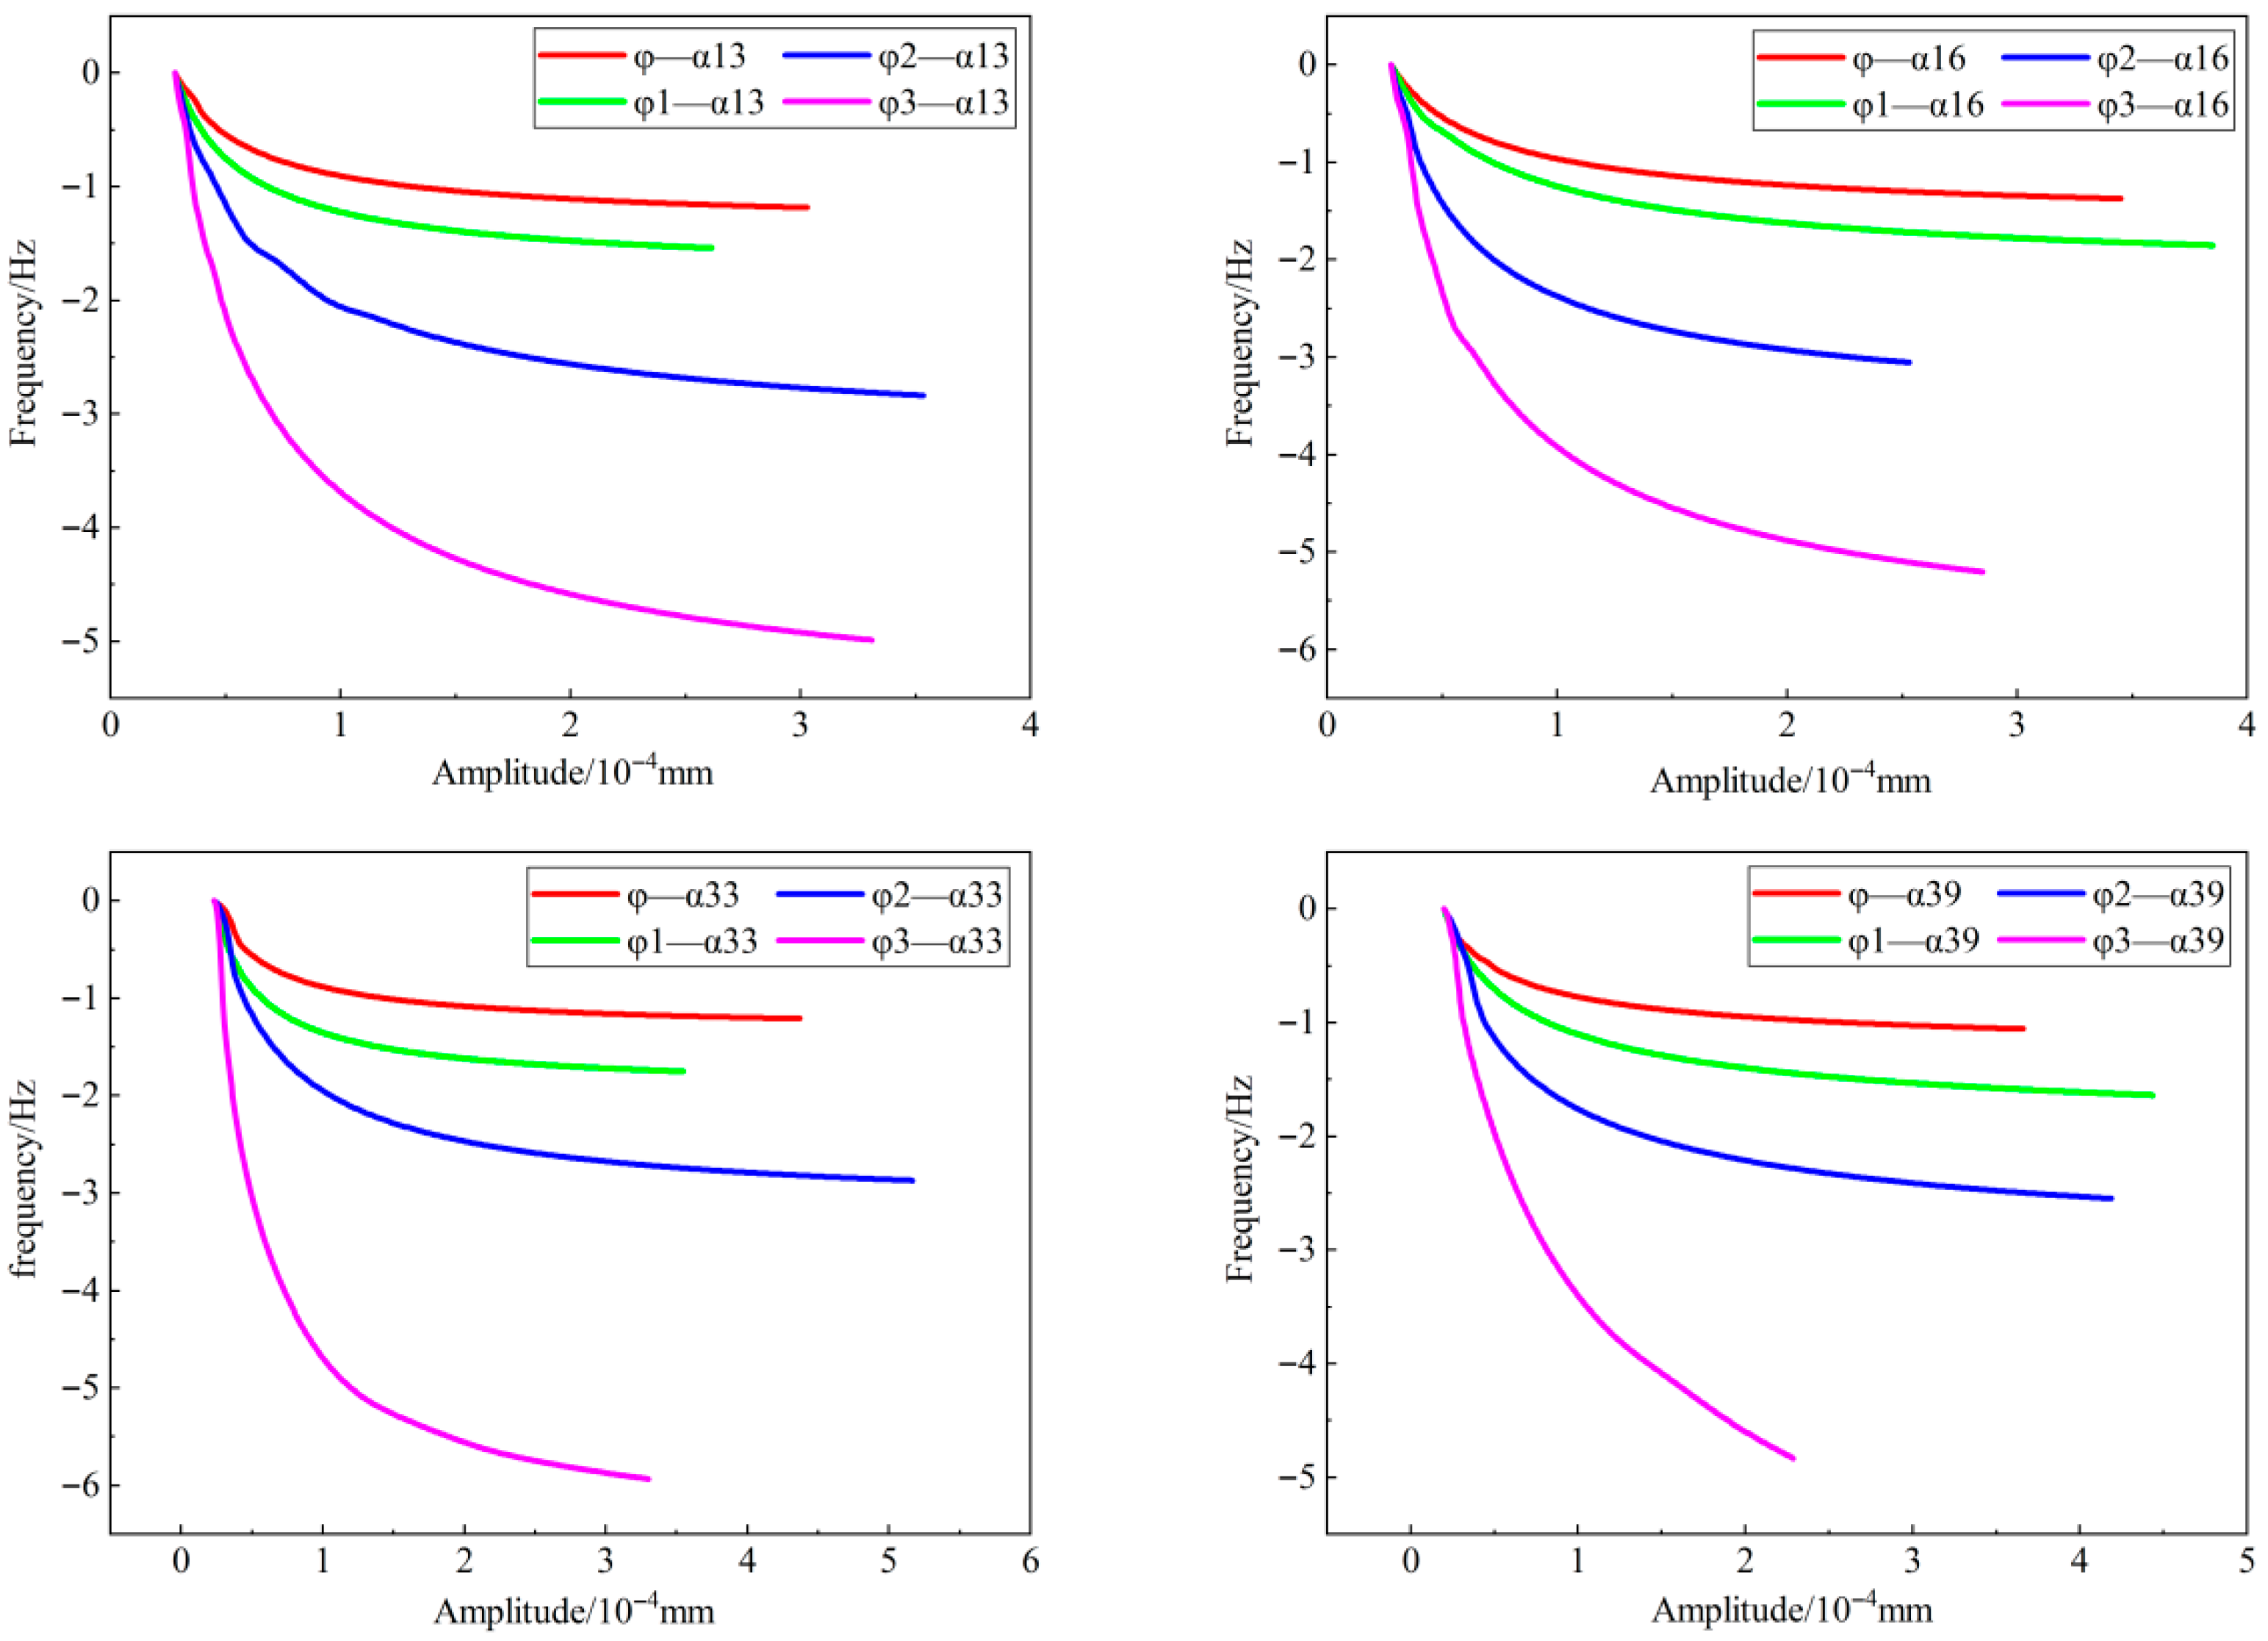
In structural vibration response measurements, the layout of measurement points is one of the key factors influencing detection results. Since debonding damage may occur at arbitrary locations on the structure, the relative position between the signal acquisition point and the damage is often unknown in practical testing. To investigate the effect of acquisition point location on nonlinear vibration-based detection, four measurement points (α13, α16, α33, and α39) were selected on the surface of the specimens. The nonlinear response characteristics at these locations were compared and analyzed to evaluate the influence of measurement layout on the effectiveness of debonding damage identification. Figure 15 presents the frequency–amplitude curves at the four measurement points for each specimen under the four test conditions. The results show that all curves exhibit a consistent downward trend, and as the debonded area increases, the rate of frequency drop also accelerates, indicating more pronounced nonlinear behavior. The nonlinearity indices calculated from the frequency–amplitude curves are shown in Figure 16. A clear positive correlation is observed between the degree of debonding and the nonlinearity index-specimens with more severe debonding exhibit more prominent nonlinear characteristics. This conclusion is consistent with the analysis in Section 4.1, further validating the effectiveness of nonlinear vibration characteristics in identifying debonding defects. Experimental results indicate that despite differences in measurement location, all points can effectively reflect changes in debonding severity. This suggests that when debonding damage exists between the adhesive and insulation layers, the system’s nonlinear response at any measurement point can serve as a reliable diagnostic indicator. Therefore, the relative position between the acquisition point and the debonding defect does not significantly affect the detection outcome. Additionally, under the φ 3 condition, the nonlinearity index at point α33 is significantly higher than at the other locations. This is attributed to the presence of a debonding defect, as α33 is located within the debonded region of the φ 3 specimen. The local stiffness variation facilitates the onset of nonlinear deformation, resulting in a significantly stronger nonlinear response at α33 compared to other points on the same specimen. This indicates that the nonlinearity index is highly sensitive to local defects and holds promise for further identifying the spatial location of debonding. To validate its feasibility in locating debonding defects, Section 4.3 further explores the use of this sensitivity to identify defect locations.

4.3. Debonding Location Identification

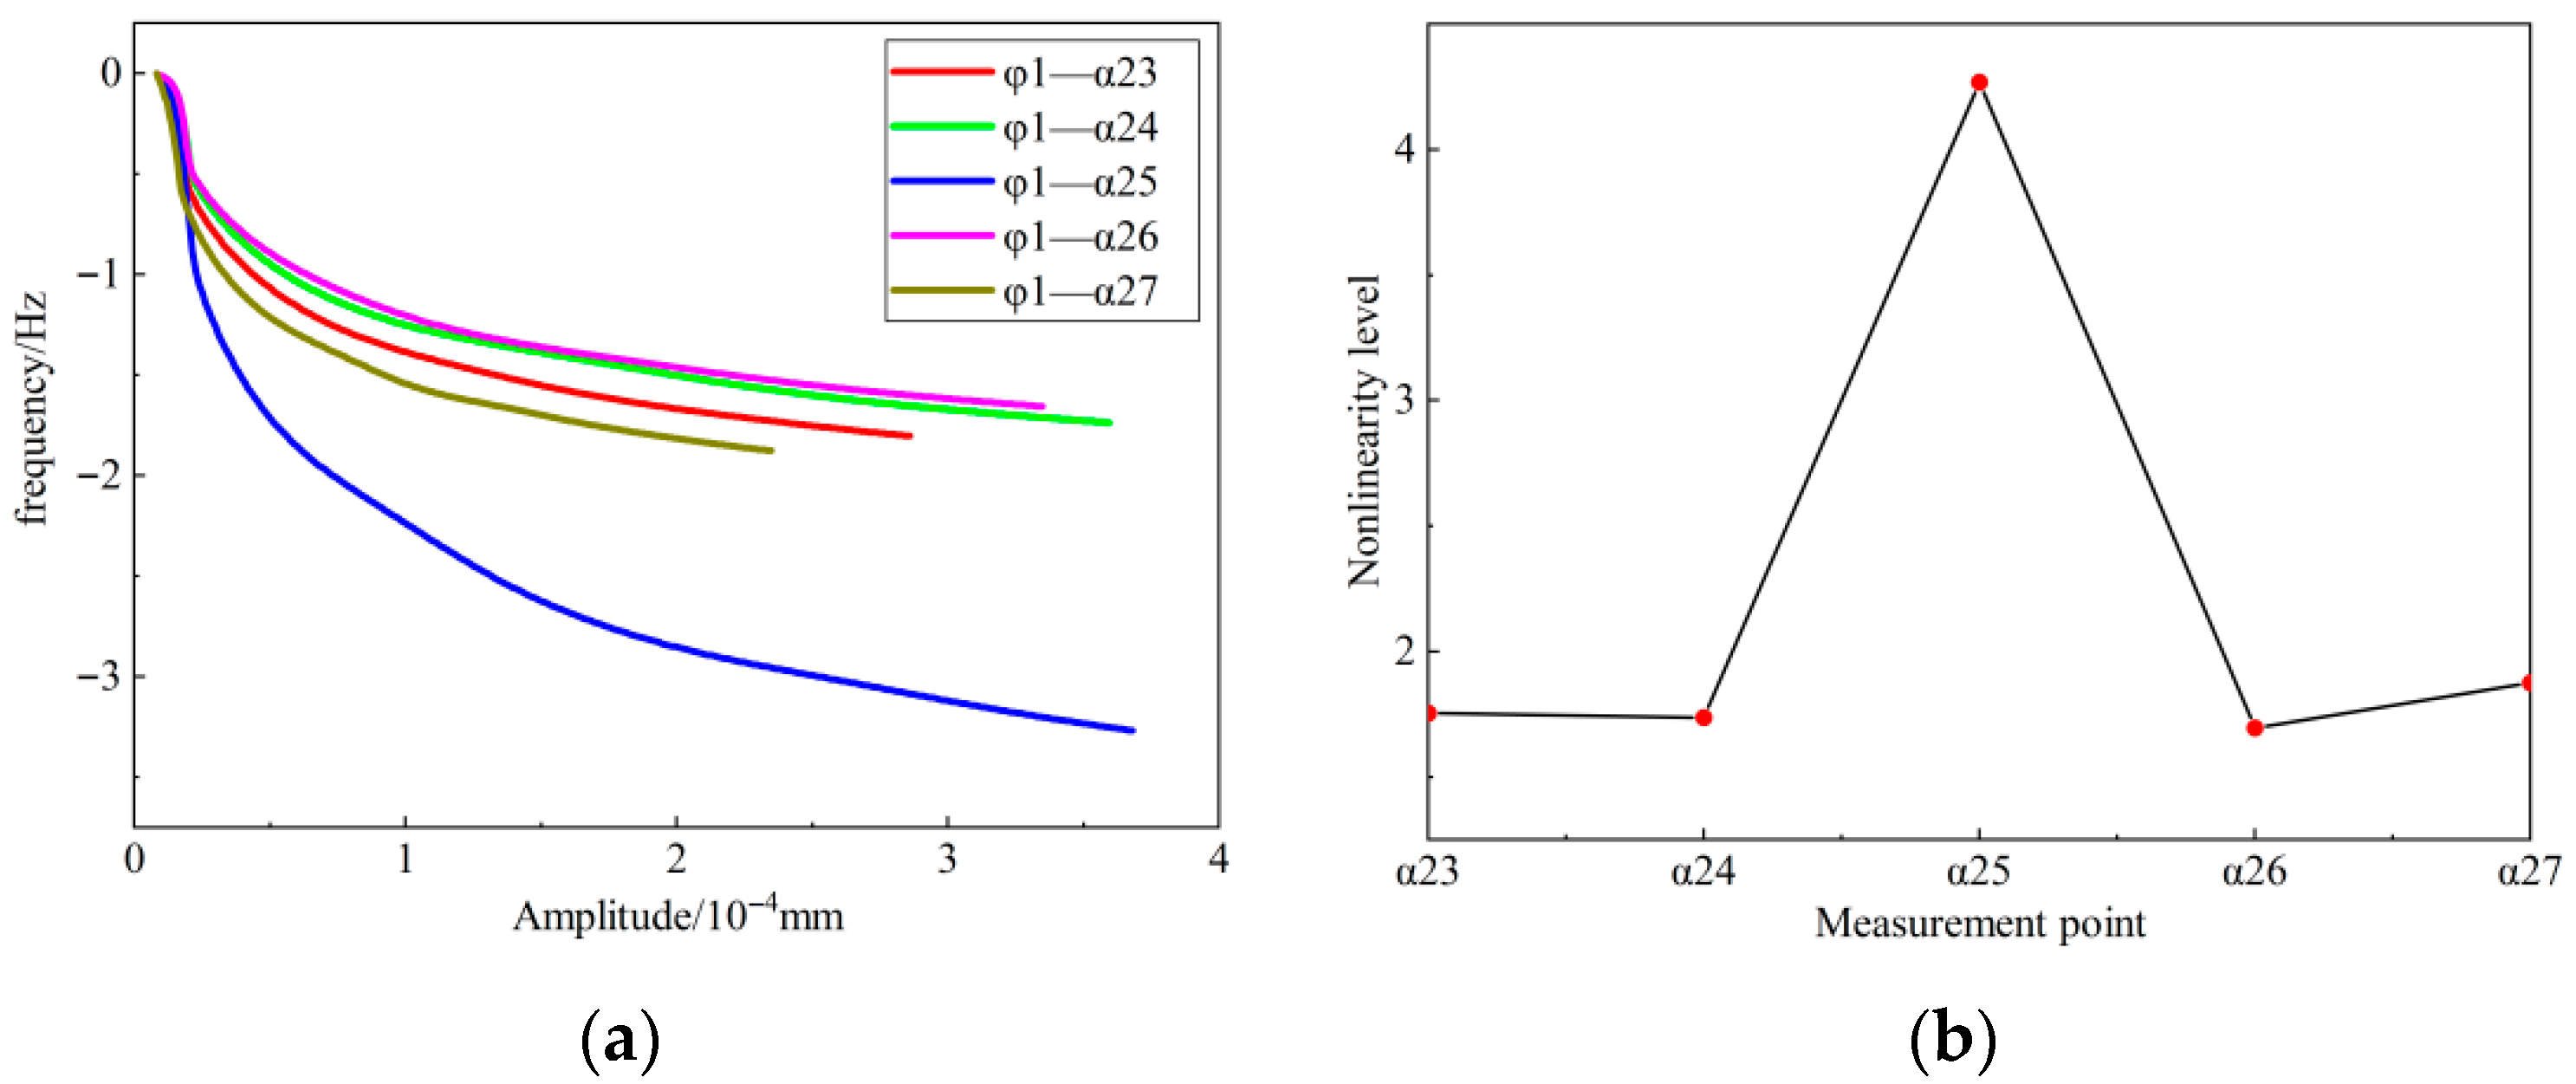
In this section, the defect-free specimen φ and the minimally debonded specimen φ 1 were selected for comparative analysis. The nonlinearity indices of five measurement points, α23 to α27, were analyzed. The frequency–amplitude curves of specimen φ at these points are shown in Figure 17a. The results indicate that the curves across all five points are essentially consistent, with no significant variations observed. Further analysis of the nonlinearity indices, as shown in Figure 17b, reveals slight fluctuations at points α23 through α27; however, the overall trend follows an approximately linear distribution with minimal variation. This indicates that under conditions of structural integrity and strong bonding, the specimen exhibits a relatively uniform stiffness distribution. Its dynamic response is close to linear, with no signs of local stiffness discontinuities or significant nonlinear behavior.
The frequency–amplitude curves of specimen φ1 at measurement points α23 to α27 are shown in Figure 18a. Among them, the curve at α25 exhibits a markedly larger variation compared to the others. The corresponding nonlinearity indices are presented in Figure 18b. The nonlinearity index at φ 1 -α25, which is located within the debonded region, is significantly higher than those at other points, indicating a clear local anomaly. This observation suggests that the enhanced nonlinear response at point φ 1 -α25 is primarily due to its location within the debonded area. The local stiffness variation in this region causes periodic contact and separation during vibration—commonly referred to as the “breathing effect” [33]. This nonlinear behavior markedly alters local vibrational responses, causing an increased nonlinearity index at the corresponding point. Comparison of the two specimens confirms the feasibility of identifying debonding locations using nonlinear vibrational characteristics.

5. Conclusions

This study conducted a comparative analysis of the frequency–amplitude curves at various signal acquisition points on specimens under different conditions. The results demonstrate that:
(1)
The nonlinear vibration method can effectively identify debonding defects in external thermal insulation specimens.
(2)
There is a clear correlation between the nonlinearity index and the severity of debonding damage: as the extent of debonding increases, the degree of nonlinearity also rises.
(3)
The spatial distribution of nonlinearity indices at different measurement points can be used to locate debonding defects within the external thermal insulation specimens.
(4)
The relative position between the signal acquisition point and the debonding area does not affect the accuracy of defect detection.
In summary, the non-contact identification technique based on nonlinear vibrational characteristics demonstrates high effectiveness in detecting debonding defects in ETICS, offering a feasible and practical method for such applications in the building sector. In the forthcoming studies, we will use excitations such as wind loads and the structure’s self-vibrations to investigate the nonlinear characteristics of ETICS specimens with defects, aiming to further improve detection efficiency and achieve rapid and automated ETICS inspection.

Author Contributions

Writing—original draft preparation, X.H.; writing—review and editing, X.H. and B.Y.; data curation, C.G. and H.Z.; conceptualization, X.H.; methodology, B.Y.; validation, Y.S. and H.Z. All authors have read and agreed to the published version of the manuscript.

Funding

This research did not receive any specific grant from funding agencies in the public, commercial, or not-for-profit sectors. The authors gratefully acknowledge the financial support provided by ROAD & BRIDGE INTERNATIONAL CO., LTD.

Data Availability Statement

The original contributions presented in this study are included in the article. Further inquiries can be directed to the corresponding author.

Conflicts of Interest

Author Xuejun Hou, Chao Gao, Hui Zhou were employed by the company Road & Bridge International Co., Ltd.; Bin Yao and Yanwen Shi were employed by the company China Harbour Engineering Company Limited. The remaining authors declare that the research was conducted in the absence of any commercial or financial relationships that could be construed as a potential conflict of interest.

References

  1. Huo, H.; Shao, J.; Huo, H. Contributions of energy-saving technologies to building energy saving in different climatic regions of China. Appl. Therm. Eng. 2017, 124, 1159–1168. [Google Scholar] [CrossRef]
  2. Yuan, K.; Xiong, H.; Wen, M.; Xu, J. Visualization of localized deformation of external thermal insulation composite systems during aging. Appl. Therm. Eng. 2022, 206, 118108. [Google Scholar] [CrossRef]
  3. Lourenço, T.; Matias, L.; Faria, P. Anomalies detection in adhesive wall tiling systems by infrared thermography. Constr. Build. Mater. 2017, 148, 419–428. [Google Scholar] [CrossRef]
  4. Li, Y.; Yang, X.; Gong, J.; Wang, J.; Jiang, Z.; Lan, T. Intelligent detection of bonding status in external building insulation layers using ground-penetrating radar. Autom. Constr. 2025, 173, 106100. [Google Scholar] [CrossRef]
  5. Zhang, D.; Zhan, C.; Chen, L.; Wang, Y.; Li, G. An in-situ detection method for assessing the thermal transmittance of building exterior walls using unmanned aerial vehicle–infrared thermography (UAV-IRT). J. Build. Eng. 2024, 91, 109724. [Google Scholar] [CrossRef]
  6. Fox, M.; Goodhew, S.; De Wilde, P. Building defect detection: External versus internal thermography. Build. Environ. 2016, 105, 317–331. [Google Scholar] [CrossRef]
  7. Lai, W.W.L.; Lee, K.K.; Poon, C.S. Validation of size estimation of debonds in external wall’s composite finishes via passive Infrared thermography and a gradient algorithm. Constr. Build. Mater. 2015, 87, 113–124. [Google Scholar] [CrossRef]
  8. Zar, A.; Hussain, Z.; Akbar, M.; Rabczuk, T.; Lin, Z.; Li, S.; Ahmed, B. Towards vibration-based damage detection of civil engineering structures: Overview, challenges, and future prospects. Int. J. Mech. Mater. Des. 2024, 20, 591–662. [Google Scholar] [CrossRef]
  9. Wang, Z.; Liu, X.; Cao, D.; Wan, D.; Wei, S. Detection and safety assessment of bonding defects in architectural decorative surface layer based on the variation of vibration acceleration amplitude. Case Stud. Constr. Mater. 2025, 22, e04278. [Google Scholar] [CrossRef]
  10. Abdulkareem, M.; Bakhary, N.; Vafaei, M.; Noor, N.M.; Mohamed, R.N. Application of two-dimensional wavelet transform to detect damage in steel plate structures. Measurement 2019, 146, 912–923. [Google Scholar] [CrossRef]
  11. Pan, D.; Jiang, K.; Zhang, X.; Huang, Y. Sealant Delamination Detection of Structural Sealant Glazing Systems Based on Driving-Point Accelerance. Shock. Vib. 2020, 2020, 7260438. [Google Scholar] [CrossRef]
  12. Zhang, X.; Xiong, Y.; Huang, X.; Wang, J.; Fan, B.; Zhao, Z.; Zhu, J. Dynamic modeling of rotary blade crack with regard to three-dimensional tip clearance. J. Sound Vib. 2023, 544, 117414. [Google Scholar] [CrossRef]
  13. Castellini, P.; Martarelli, M.; Tomasini, E.P. Laser Doppler Vibrometry: Development of advanced solutions answering to technology’s needs. Mech. Syst. Signal Process. 2006, 20, 1265–1285. [Google Scholar] [CrossRef]
  14. Vegas, S.T.; Lafdi, K. A literature review of non-contact tools and methods in structural health monitoring. Ultrasound 2021, 49, 9–50. [Google Scholar] [CrossRef]
  15. Avci, O.; Abdeljaber, O.; Kiranyaz, S.; Hussein, M.; Gabbouj, M.; Inman, D.J. A review of vibration-based damage detection in civil structures: From traditional methods to Machine Learning and Deep Learning applications. Mech. Syst. Signal Process. 2021, 147, 107077. [Google Scholar] [CrossRef]
  16. Zhou, J.; Li, Z.; Chen, J. Application of two dimensional Morlet wavelet transform in damage detection for composite laminates. Compos. Struct. 2023, 318, 117091. [Google Scholar] [CrossRef]
  17. Sugimoto, T.; Sugimoto, K.; Kosuge, N.; Utagawa, N.; Katakura, K. High-speed noncontact acoustic inspection method for civil engineering structure using multitone burst wave. Jpn. J. Appl. Phys. 2017, 56, 07JC10. [Google Scholar] [CrossRef]
  18. Zhao, Y.; Chen, Y.; Ye, L. A non-contact inspection method of tile debonding using tuned acoustic wave and laser doppler vibrometer. J. Sound Vib. 2023, 564, 117875. [Google Scholar] [CrossRef]
  19. Zhang, X.; Li, B.; Jiang, Y.; Wu, F.; Gao, Y. Ambient vibration-based quantitative assessment on tunnel lining defect using laser Doppler vibrometer. Measurement 2025, 239, 115481. [Google Scholar] [CrossRef]
  20. Chen, H.; Xue, J.; Gan, S.; Wang, J.; Li, Y.; Nie, X. Interfacial debonding detection for steel-concrete composite structures Part II: Scanning Doppler laser-based MASW and microphone combination-based impact-acoustic vibration. Structures 2024, 61, 106124. [Google Scholar] [CrossRef]
  21. Seresini, T.; Sunetchiieva, S.; Pfeiffer, H.; Wevers, M.; Glorieux, C. Defect Detection in Carbon Fiber-Reinforced Plate by Imaging of Mechanical Nonlinearity-Induced Sideband Vibrations. Vibration 2023, 6, 796–819. [Google Scholar] [CrossRef]
  22. Wang, B.; Shi, W.; Zhao, B.; Tian, X.; Tan, J. Detecting delamination defects in CFRP plates using nonlinear defect index of air-coupled Lamb waves and adaptively weighted imaging algorithm. Mech. Syst. Signal Process. 2024, 208, 111023. [Google Scholar] [CrossRef]
  23. Hafiz, A.; Schumacher, T.; Raad, A. A self-referencing non-destructive test method to detect damage in reinforced concrete bridge decks using nonlinear vibration response characteristics. Constr. Build. Mater. 2022, 318, 125924. [Google Scholar] [CrossRef]
  24. Lan, Z.; Saito, O.; Okabe, Y.; Deng, M.; Li, W. Baseline-free defects localization in CFRP laminates by acoustic nonlinear response of broadband guided waves. Appl. Acoust. 2025, 240, 110916. [Google Scholar] [CrossRef]
  25. Yang, Q.; Wang, X.; Dai, H.; Shi, Z.; Song, J.; Xu, Y.; Wan, H.; Huan, R.; Wei, X. Phase evolution and control in a synchronized Duffing-type nonlinear micro-oscillator. Mech. Syst. Signal Process. 2024, 219, 111598. [Google Scholar] [CrossRef]
  26. Alam, M.Z.; Hosen, M.A.; Alam, M.S. A new modified Lindstedt–Poincare method for nonlinear damped forced oscillations. Results Phys. 2023, 51, 106673. [Google Scholar] [CrossRef]
  27. von Wagner, U.; Lentz, L.; Dänschel, H.; Gräbner, N. On Large Amplitude Vibrations of the Softening Duffing Oscillator at Low Excitation Frequencies—Some Fundamental Considerations. Appl. Sci. 2024, 14, 11411. [Google Scholar] [CrossRef]
  28. Rao, D.; Huang, M.; Shi, X.; Yu, Z.; He, Z. A Microseismic Signal Denoising Algorithm Combining VMD and Wavelet Threshold Denoising Optimized by BWOA. Comput. Model. Eng. Sci. 2024, 141, 187–217. [Google Scholar] [CrossRef]
  29. Huang, N.E.; Shen, Z.; Long, S.R.; Wu, M.C.; Shih, H.H.; Zheng, Q.; Yen, N.-C.; Tung, C.C.; Liu, H.H. The empirical mode decomposition and the Hilbert spectrum for nonlinear and non-stationary time series analysis. Proceedings of the Royal Society of London. Ser. A Math. Phys. Eng. Sci. 1998, 454, 903–995. [Google Scholar] [CrossRef]
  30. JGJ 144–2019; Technical Standard for External Thermal Insulation on Walls. China Architecture & Building Press: Beijing, China, 2019. (In Chinese)
  31. Chen, H.; Ren, Y.; Gan, S.; Li, Y.; Wang, J.; Nie, X. Interfacial debonding detection for steel-concrete composite structures part I: Benchmark test and signal calibration of contact and non-contact measurement. Structures 2024, 62, 106123. [Google Scholar] [CrossRef]
  32. Aburakhia, S.; Hamieh, I.; Shami, A. Joint Instantaneous Amplitude-Frequency Analysis of Vibration Signals for Vibration-Based Condition Monitoring of Rolling Bearings. arXiv 2024, arXiv:2405.08919. [Google Scholar]
  33. Xiong, Q.; Guan, H.; Ma, H.; Wu, Z.; Guo, X.; Wang, W. Dynamic characteristic analysis of rotating blade with breathing crack. Mech. Syst. Signal Process. 2023, 196, 110325. [Google Scholar] [CrossRef]
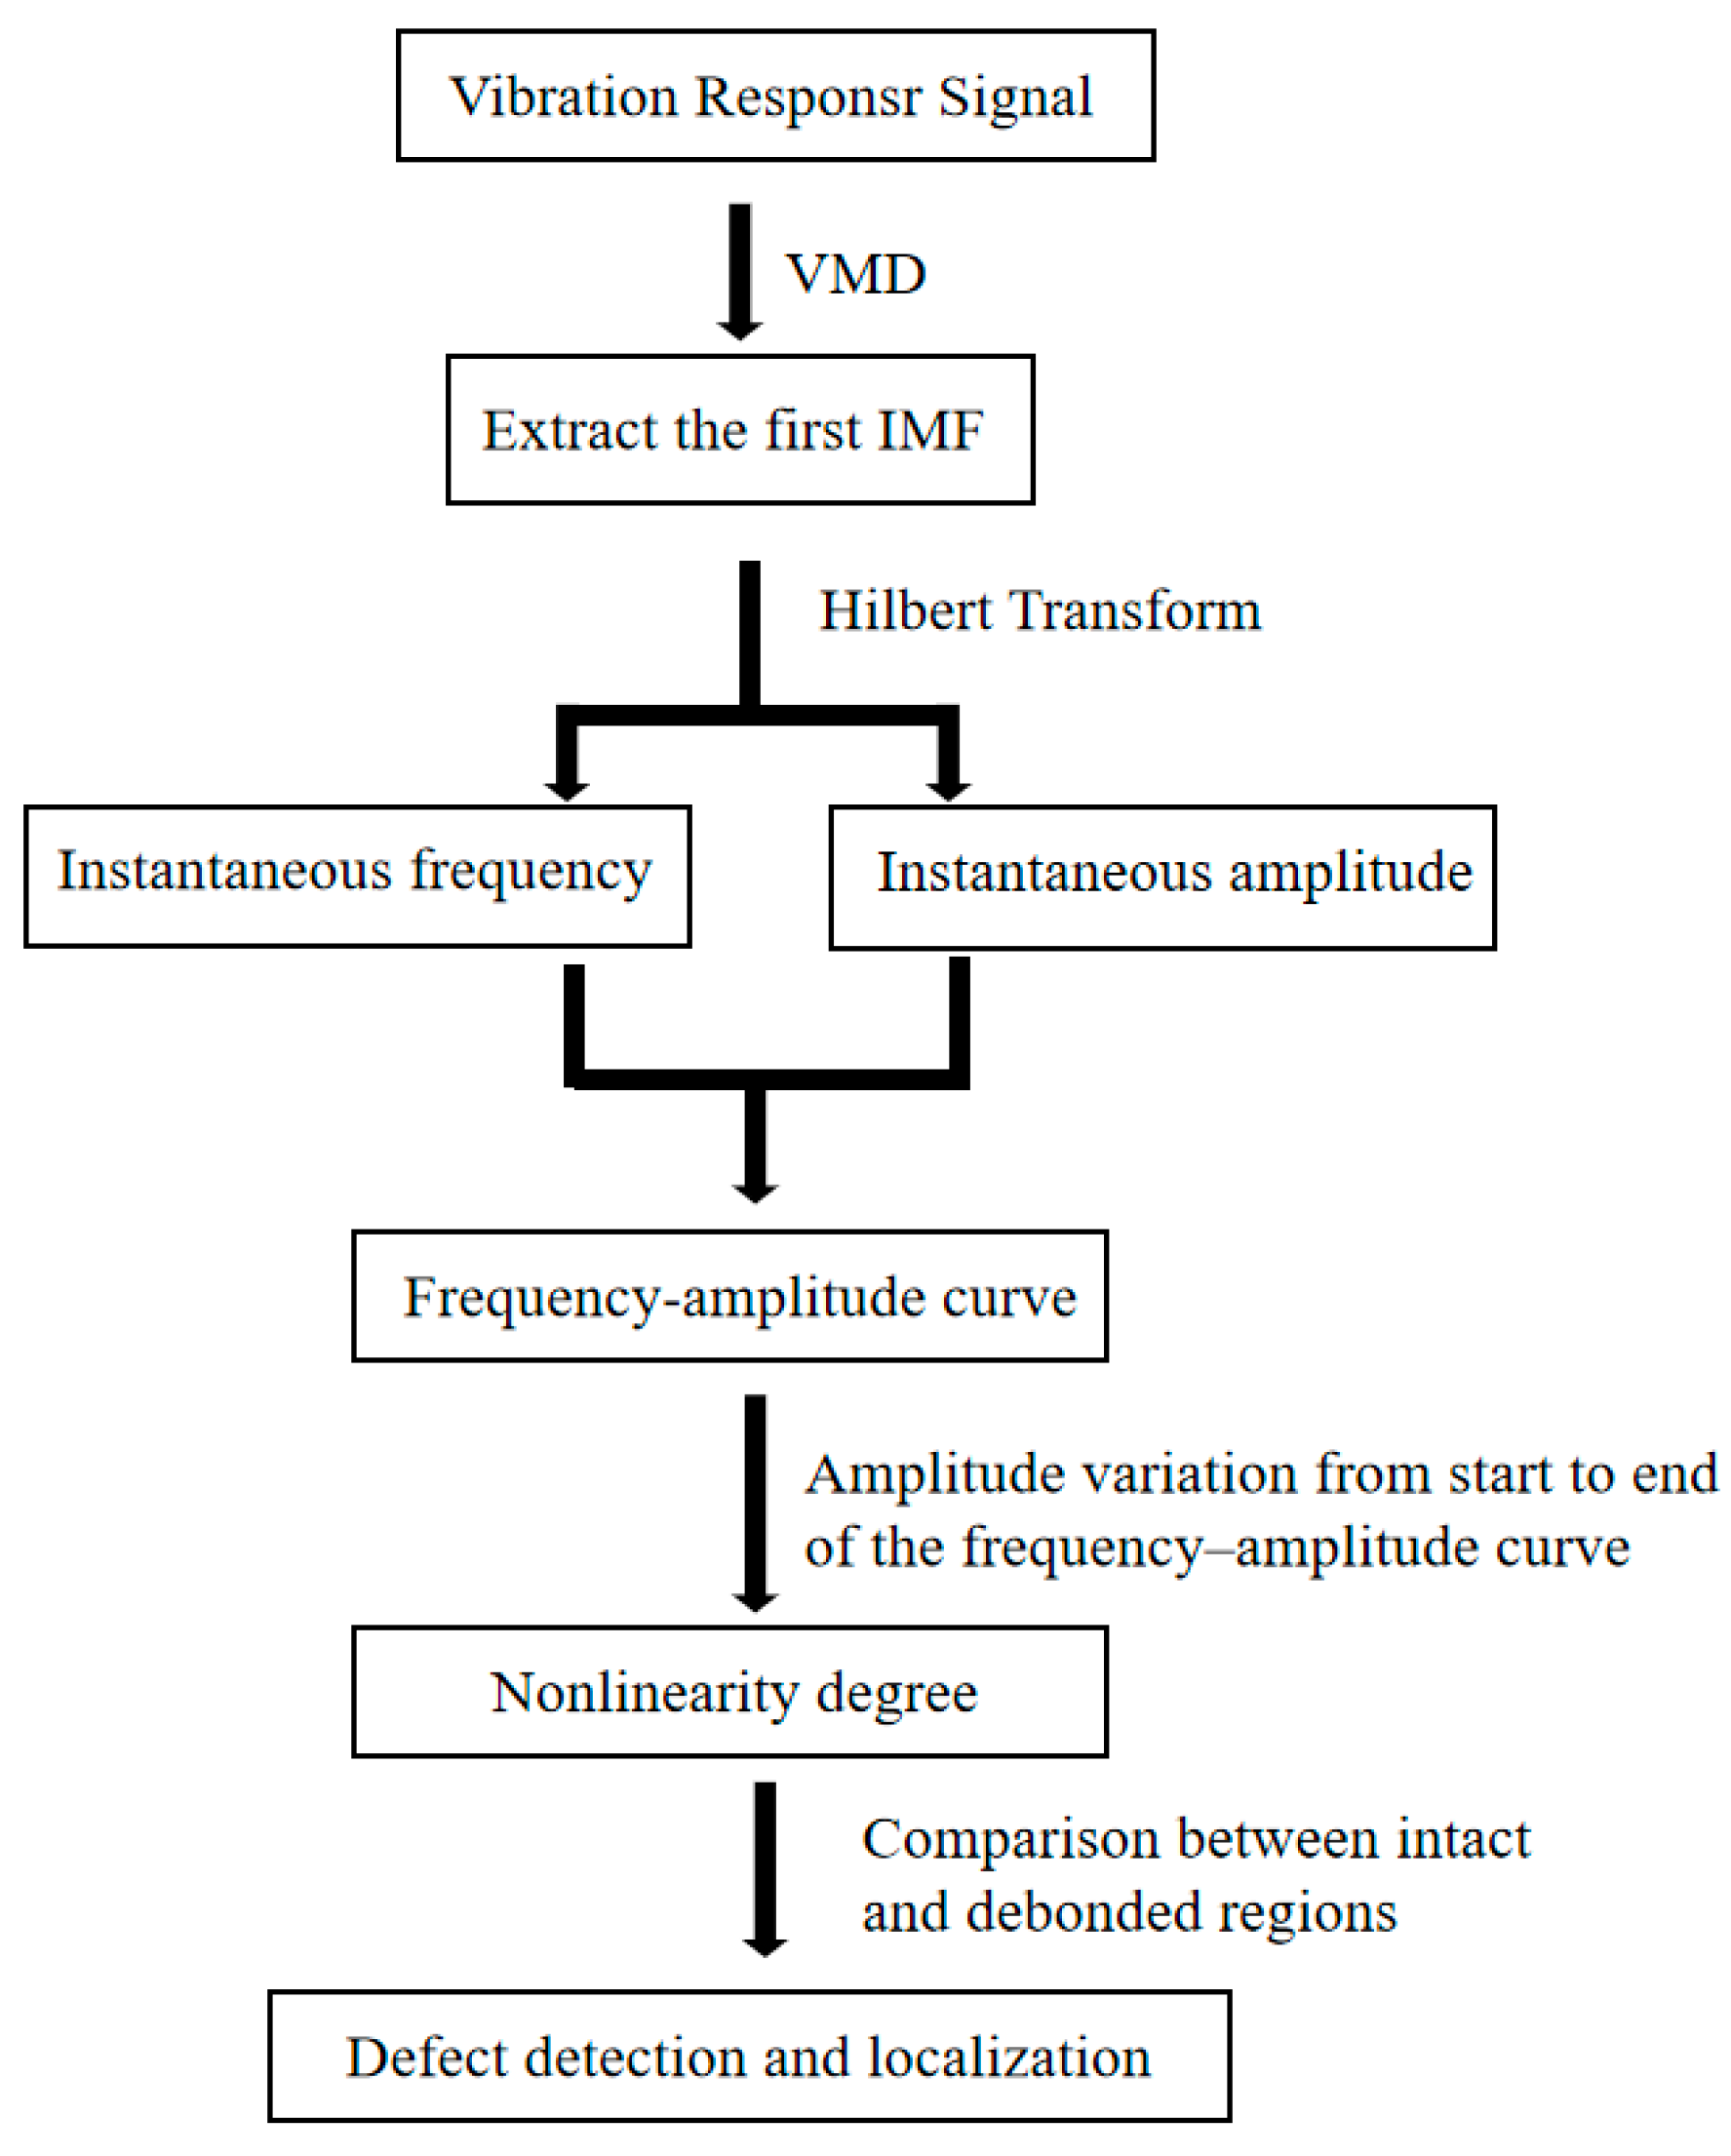
Figure 1. Nonlinear vibration-based defect identification procedure for the external thermal insulation specimen.
Buildings 15 03728 g001
Figure 2. Multimodal weakly nonlinear damped vibration time history signal.
Buildings 15 03728 g002
Figure 3. Multimodal weakly nonlinear damped vibration frequency domain signal.
Buildings 15 03728 g003
Figure 4. First-order modal component.
Buildings 15 03728 g004
Figure 5. First-order modal frequency domain component.
Buildings 15 03728 g005
Figure 6. Instantaneous frequency.
Buildings 15 03728 g006
Figure 7. Instantaneous amplitude.
Buildings 15 03728 g007
Figure 8. Frequency–amplitude curve.
Buildings 15 03728 g008
Figure 9. Laser Doppler vibrometer (KVD-4525R).
Buildings 15 03728 g009
Figure 10. Layout of signal acquisition points.
Buildings 15 03728 g010
Figure 11. Vibrational acceleration signal. (a) Acceleration time-history signal; (b) Free decaying vibration response.
Buildings 15 03728 g011
Figure 12. Original frequency–amplitude curves of each specimen at α11.
Buildings 15 03728 g012
Figure 13. Normalized frequency–amplitude curves of each specimen at α11.
Buildings 15 03728 g013
Figure 14. Nonlinearity degrees at measuring point α11 for each specimen.
Buildings 15 03728 g014
Figure 15. Normalized frequency–amplitude curves of each specimen at α13, α16, α33, and α39.
Buildings 15 03728 g015
Figure 16. Nonlinearity degrees of each specimen at four measurement points.
Buildings 15 03728 g016
Figure 17. Frequency–amplitude curves. (a) Specimen φ at α23 to α27; (b) Nonlinearity degree curves of specimen φ.
Buildings 15 03728 g017
Figure 18. Frequency–amplitude curves. (a) Specimen φ 1 from α23 to α27; (b) Nonlinearity degree curves of specimen φ 1 from α23 to α27.
Buildings 15 03728 g018
Table 1. Defect Configurations.
No.ScenariosSchemeNo.ScenariosScheme
φNo defectionBuildings 15 03728 i001 φ 1 200 mm rectangular defect at the center of the panelBuildings 15 03728 i002
φ 2 400 mm rectangular defect at the center of the panelBuildings 15 03728 i003 φ 3 600 mm rectangular defect at the center of the panelBuildings 15 03728 i004
Table 2. Performance Parameters of the Laser Doppler Vibrometer.
ParameterValue
Sampling Frequency78.125 kHz
Velocity Range4.5 m/s
Displacement Accuracy0.03 nm @ 20 kHz
Displacement Resolution0.1 nm
Velocity Resolution0.1 μm/s
Acceleration Resolution0.1 mg
Measurement Distance0.2~5 m
Displacement Range±10% of measurement distance
Frequency Range600 kHz
Laser Wavelength1550 nm
Disclaimer/Publisher’s Note: The statements, opinions and data contained in all publications are solely those of the individual author(s) and contributor(s) and not of MDPI and/or the editor(s). MDPI and/or the editor(s) disclaim responsibility for any injury to people or property resulting from any ideas, methods, instructions or products referred to in the content.