Article

Investigation on the Evolution Mechanism of the Mechanical Performance of Road Tunnel Linings Under Reinforcement Corrosion

1
School of Civil Engineering, Tongji University, Shanghai 200092, China
2
Shanghai Engineering Research Center of Underground Infrastructure Detection and Maintenance Equipment, Shanghai 200092, China
3
Zhejiang Shuzhi Jiaoyuan Technology Co., Ltd., Hangzhou 310030, China
4
Tongyan Civil Engineering Technology Co., Ltd., Shanghai 200082, China
*
Author to whom correspondence should be addressed.
Buildings 2025, 15(20), 3723; https://doi.org/10.3390/buildings15203723
Submission received: 15 August 2025 / Revised: 6 September 2025 / Accepted: 10 September 2025 / Published: 16 October 2025
(This article belongs to the Section Building Structures)

Abstract

To clarify the influence of reinforcement corrosion on the mechanical performance of road tunnel linings, localized tests on reinforcement-induced concrete expansion are conducted to identify cracking patterns and their effects on load-bearing behavior. Refined three-dimensional finite element models of localized concrete and the entire tunnel are developed using the concrete damaged plasticity model and the extended finite element method and validated against experimental results. The mechanical response and crack evolution of the lining under corrosion are analyzed. Results show that in single-reinforcement specimens, cracks propagate perpendicular to the reinforcement axis, whereas in multiple-reinforcement specimens, interacting cracks coalesce to form a π-shaped pattern. The cover-layer crack width exhibits a linear relationship with the corrosion rate. Corrosion leads to a reduction in the stiffness and load-bearing capacity of the local concrete. At the tunnel scale, however, its influence remains highly localized, and the additional deflection exhibits little correlation with the initial deflection. Local corrosion causes a decrease in bending moment and an increase in axial force in adjacent linings; when the corrosion rate exceeds about 15%, stiffness damage and internal force distribution tend to stabilize. Damage and cracks initiate around corroded reinforcement holes, extend toward the cover layer, and connect longitudinally, forming potential spalling zones.

1. Introduction

In recent years, the large-scale construction of highways and railways has placed the secondary lining of road tunnels at a key position in transportation infrastructure, where it bears most of the surrounding rock loads and construction loads [1,2]. However, tunnels are semi-enclosed structures that are often subject to water seepage, freeze–thaw cycles, and chloride ingress during service, significantly increasing the frequency of lining cracking [3]. Corrosion-induced reinforcement expansion under wet–dry cycles and chloride ion action serves as a primary factor triggering crack propagation, cover layer spalling, and stress redistribution [4]. The presence of cracks not only leads to local stress concentration [5,6], but also promotes further crack propagation, resulting in concrete spalling [7,8], water leakage, and local load-bearing capacity degradation, ultimately compromising the lining’s durability and overall structural capacity.
Existing studies often employ model tests to investigate the impact of reinforcement corrosion on the mechanical performance of concrete structures. The typical approach uses externally applied currents to accelerate corrosion [4,9,10], and evaluates the degradation of load-bearing capacity, ductility, and bond performance. At the component scale, most tests focus on reinforced concrete beams or slabs [11,12,13,14,15], showing that corrosion significantly reduces yield load and ultimate load-bearing capacity and alters initial cracking load. At the structural scale, Li et al. [16] investigated the hysteretic behavior of RC shear walls with different corrosion rates under cyclic loading and found that ductility and energy dissipation capacity decrease significantly with increasing corrosion rate. For underground structures, Mansoor et al. [4] designed accelerated-corrosion tunnel lining specimens with various cover thicknesses and reinforcement diameters, showing a clear linear negative correlation between corrosion rate and ultimate load-bearing capacity, as well as through-cover longitudinal cracks.
Numerical simulation offers advantages such as high repeatability and low cost, and validated numerical models uniquely facilitate observation of internal damage. Various methods have been developed to reveal the damage mechanisms of corroded concrete. Guzman et al. [17] adopted an embedded cohesive crack finite element model to convert corrosion-induced volumetric expansion into interface opening, accurately predicting cover cracking timing and crack morphology. German et al. [18] proposed a numerical model combining the CDP constitutive model and embedded cohesive elements, simulating corrosion expansion as interface thermal expansion to achieve a high-fidelity simulation of crack propagation and spalling under non-uniform corrosion of single and multiple reinforcements. The phase-field method [19] and XFEM [2,20,21], as non-geometry-based strategies, are widely used in concrete cracking simulations. The phase-field method captures multi-crack co-evolution without predefining crack paths; XFEM handles crack propagation without remeshing.
In summary, existing test studies mainly focus on the macroscopic mechanical performance changes and failure behavior of concrete components under reinforcement corrosion-induced expansion, while insufficient attention has been paid to the evolution of structural mechanical performance at the tunnel scale. Meanwhile, most existing numerical simulation studies [2,17,18,22] adopt two-dimensional plane models, which cannot adequately capture the non-uniform corrosion effects at the three-dimensional scale, thereby limiting their applicability in engineering practice. In view of this, the present study first conducts local tests on reinforcement corrosion-induced expansion and establishes a local concrete numerical model using the XFEM to reveal the influence of corrosion expansion on the mechanical properties and cracking behavior of concrete at the local scale. Building on this, the validated numerical model is further combined with the CDP constitutive model and extended to the tunnel scale, where a three-dimensional refined finite element analysis is conducted to systematically elucidate the evolution mechanism of the mechanical performance of tunnel linings under reinforcement corrosion.
This paper is structured as follows: Section 2 conducts localized concrete tests under corrosion-induced reinforcement expansion, yielding crack patterns and mechanical performance degradation of localized concrete; Section 3 establishes localized concrete and full-tunnel finite element models based on the CDP constitutive model and XFEM technique and validates them against test results; and Section 4 uses the validated FE models to analyze deformation, internal force response, damage evolution, and crack development of tunnel lining under localized reinforcement corrosion at the crown.

2. Local Concrete Test for Steel Reinforcement Corrosion

2.1. Test Design

2.1.1. Specimen Design

To investigate the effects of reinforcement corrosion on concrete cracking and spalling at the local scale, corrosion and loading tests are carried out on reinforced concrete specimens. As shown in Figure 1, the single-reinforcement specimens measure 200 mm × 200 mm × 150 mm, whereas the double-reinforcement specimens measure 400 mm × 200 mm × 150 mm. The specimen dimensions and cover thickness are designed with reference to previous studies and relevant codes [18,23,24]. The reinforcement consists of a 20 mm diameter HRB400 deformed reinforcement; the concrete is of grade C30; the reinforcement cover thickness is 50 mm; and, for the double-reinforcement specimens, the clear spacing between reinforcements is 200 mm. These design parameters are broadly representative of those commonly used in road tunnel projects.

2.1.2. Implementation of Reinforcement Corrosion

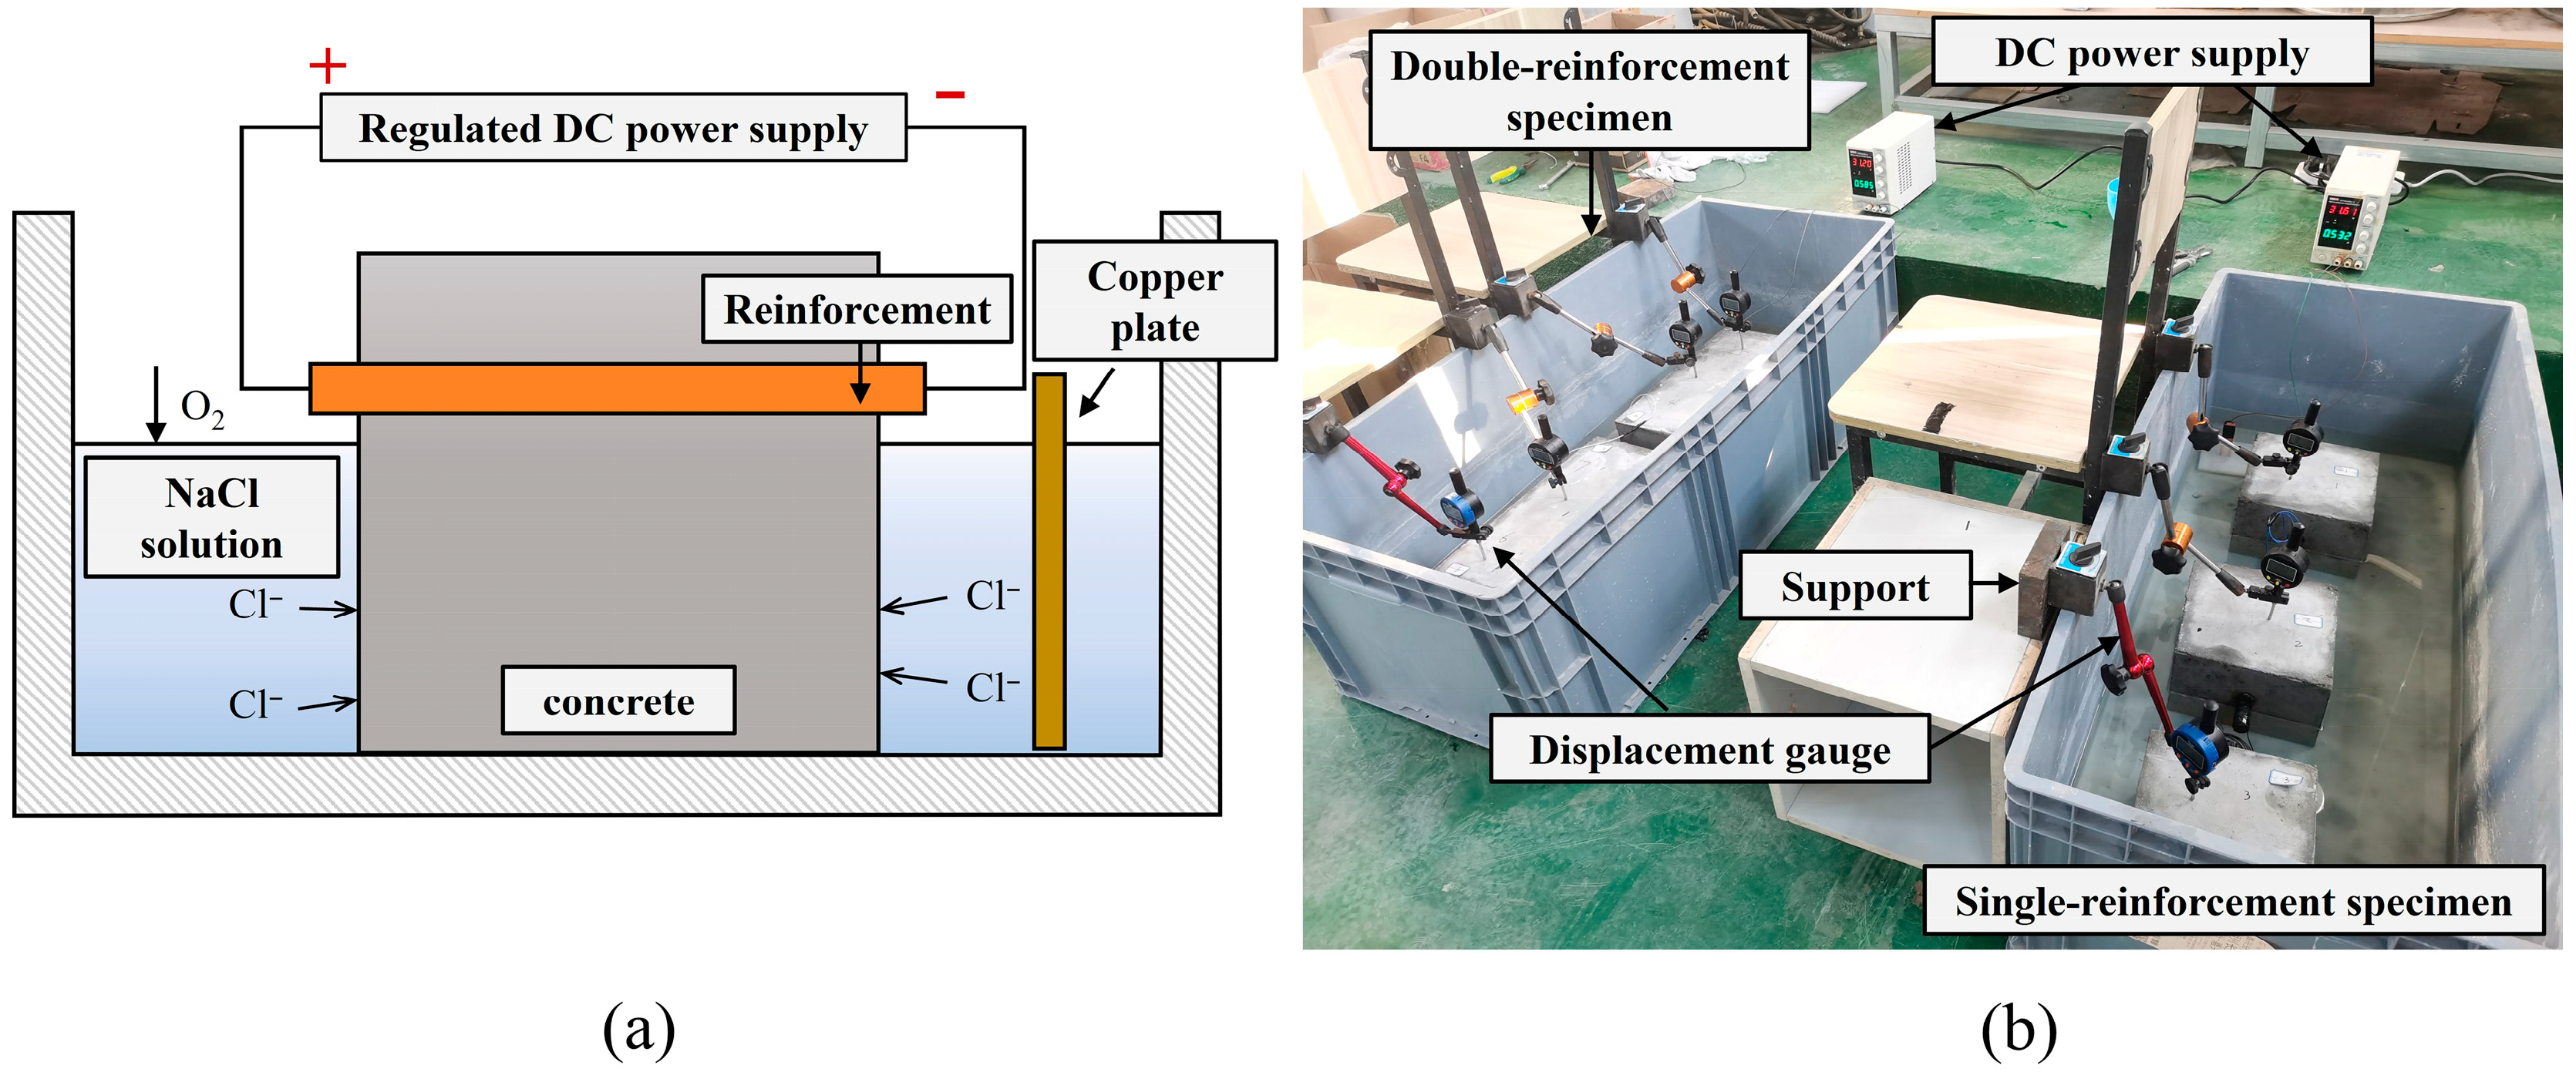
The electrochemical acceleration method is used to prepare reinforcements with different corrosion rates. Specimens are partially immersed in NaCl solution and electrified, where chloride ions destroy the passive film of the reinforcement, and anodic oxidation products react with hydroxyl ions at the cathode to generate rust, thereby accelerating corrosion. The electrochemical acceleration method is widely used to shorten the corrosion period; however, it cannot fully replicate the natural corrosion process of reinforcement. For instance, differences exist in the morphology and porosity characteristics of corrosion products, the spatial distribution of metal loss, and the corrosion environment. Numerous studies [4,9,10,23,25,26] have demonstrated that the electrochemical acceleration method remains applicable for investigating the cracking behavior of concrete under reinforcement corrosion. Therefore, in this study, the accelerated tests are primarily employed to achieve controllable levels of reinforcement cross-sectional loss and to explore the underlying structural mechanisms.
A total of seven reinforcement specimens are prepared, comprising three single-reinforcement specimens and two double-reinforcement specimens. Prior to casting, all reinforcement is derusted and weighed. During curing, the exposed ends of the reinforcement are tightly wrapped with insulating tape to prevent premature corrosion. In the electrochemical accelerated corrosion stage, the specimens are immersed in a NaCl solution for 24 h, with the liquid level is maintained at 1 cm below the lower surface of the reinforcement to facilitate chloride ingress into the concrete–reinforcement interface. The single- and double-reinforcement specimens are then connected in series to a DC power supply, and different durations of current application are adopted to achieve the target corrosion rates. Displacement transducers mounted on the specimen surfaces record the bulging deformation of the concrete at each corrosion rate, as illustrated in Figure 2. The electrochemical corrosion process is governed by the following equation:
δ r = M F ρ i = 1 n I i A p t i ,
where δ r is the average corrosion penetration depth of the reinforcement (cm); M is the relative atomic mass of metallic iron, taken as M = 56/2 = 28; F is the Faraday constant, F   = 96,485 C mol; ρ is the density of the reinforcement, ρ = 7.8 g/cm3; I i is the applied current through the reinforcement (A); A p is the surface area of the reinforcement in contact with the concrete subject to corrosion (cm2); and t i is the duration of current application (s).
The corrosion rate in the tests is calculated as follows:
ω = m 1 m 0 m 0 × 100 % ,
where ω is the corrosion rate, m 0 is the mass of uncorroded reinforcement, and m 1 is the mass of reinforcement after corrosion.
Assuming uniform corrosion along the reinforcement cross-section, the average corrosion product thickness is calculated by
δ c = d 0 1 1 m 2 ,
where δ c is the average corrosion product thickness and d 0 is the original reinforcement diameter.
By combining Equations (1)–(3), a theoretical relationship between the electrochemical parameters and the reinforcement corrosion rate is established, which is then used to control the corrosion of the specimens. In the present tests, the three single-reinforcement specimens exhibit corrosion rates are 13.03%, 14.71%, and 17.62%, whereas the four reinforcements in the two double-reinforcement specimens exhibit corrosion rates of 10.40%, 10.88%, 11.66%, and 25.59%.

2.1.3. Loading Procedure

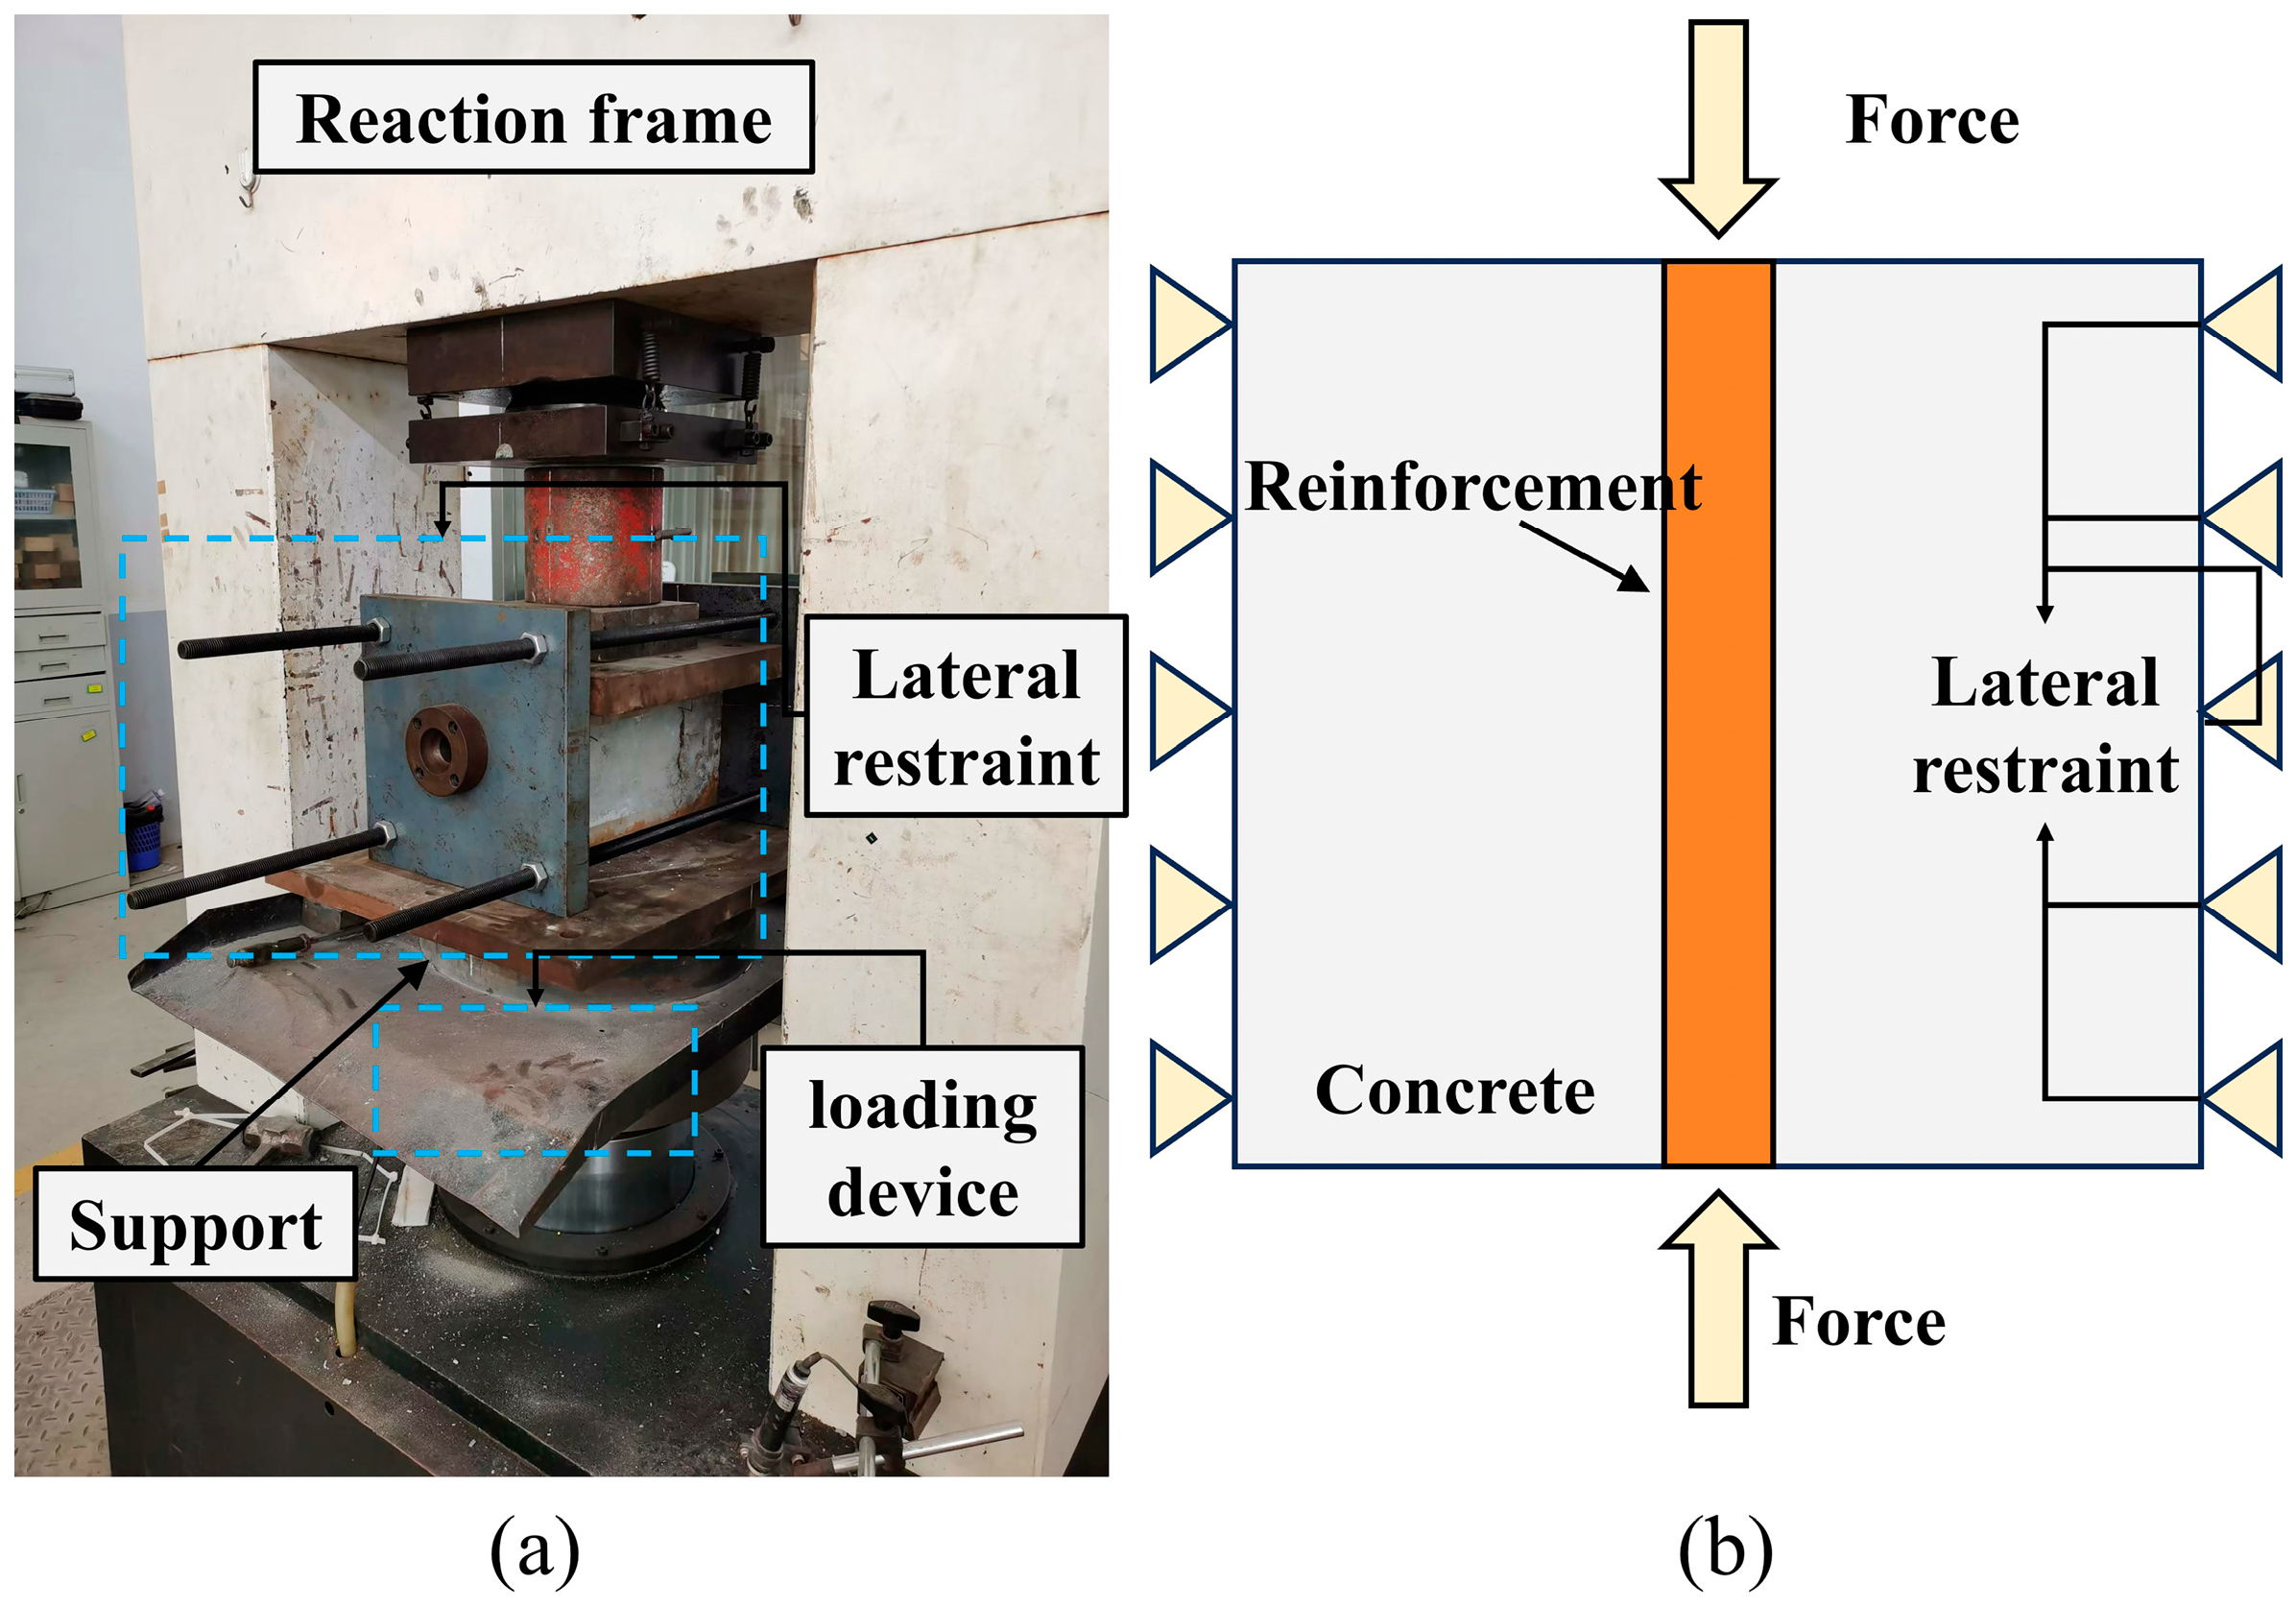
After the accelerated reinforcement corrosion stage, the specimens are placed in an indoor environment at 30 °C to dry for 72 h. The exposed ends of the reinforcement are then removed, and uniaxial loading is applied to examine the effects of corrosion on the strength and stiffness of the reinforced concrete. During loading, lateral restraints perpendicular to the reinforcement are provided, and an axial compressive force is applied along the reinforcement axis, as illustrated in Figure 3. Loading continues until extensive concrete spalling occurs or a sharp drop in the loading device pressure is observed. Crack propagation and spalling development are monitored throughout the loading process.

2.2. Test Results

2.2.1. Crack Patterns in Cover Concrete Under Corrosion

With an increasing current application time, corrosion products exude from the reinforcement ends and diffuse into the electrolyte, turning it reddish brown. On the concrete surface, cracks parallel to the reinforcement develop above the reinforcement location and propagate through the cover layer, as illustrated in Figure 4. Corrosion products fill these cracks and the adjacent concrete, appearing as reddish brown deposits. When the corrosion rate reaches 17.62%, through-cover longitudinal cracks also form on the side opposite the reinforcement cover, leading to concrete spalling. These observations indicate that, as the corrosion rate increases, cracks tend to develop symmetrically on both sides of the reinforcement, with their lengths progressively increasing.
Images of surface cracks on concrete, obtained from the reinforcement cover-layer side, are systematically collected for subsequent analysis. The cracking severity at different corrosion rates is illustrated in Figure 5, and the correlation between corrosion rate and average surface crack width is presented in Figure 6. For the specimen with a corrosion rate of 25.59%, the crack width cannot be measured because spalling occurs during the electrochemical corrosion stage. The surface cracking pattern is characterized by a primary crack parallel to the reinforcement axis. When the corrosion rate ranges from 10.40% to 17.62%, the average surface crack width increases from 1.07 mm to 8.67 mm, showing an approximately linear positive correlation. In double-reinforcement concrete specimens, cracks induced by different reinforcements interact with each other, which may result in larger crack widths than those in single-reinforcement specimens; for example, the crack width of specimen C is greater than that of specimen D.

2.2.2. Effect of Corrosion-Induced Cracks on Structural Stiffness

After corrosion-induced cracks develop in the concrete specimens, boundary restraints and uniaxial compression loading are applied to monitor concrete spalling during loading to failure. Specimens with corrosion rates exceeding 17.62% lose their load-bearing capacity due to extensive spalling and are excluded from further testing; only the remaining specimens are loaded to failure under uniaxial compression. When the applied load reaches 60–90% of the ultimate load-bearing capacity, multiple new cracks parallel to the existing corrosion-induced cracks appear on the surface. As loading progresses, both the width and number of cracks increase, and branching cracks perpendicular to the original cracks emerge. These cracks eventually interconnect, forming complete spalling zones.
With an increasing corrosion rate, both the load-bearing capacity and stiffness of the specimens decrease, as illustrated in Figure 6. For double-reinforcement specimens, the corrosion rate is taken as the average of the two reinforcements. Specifically, in single-reinforcement specimens, a 1.68% increase in corrosion rate corresponds to a 16.31% reduction in ultimate load-bearing capacity and a 27.18% reduction in stiffness; in double-reinforcement specimens, a 7.99% increase in corrosion rate corresponds to a 36.93% reduction in ultimate load-bearing capacity and a 27.60% reduction in stiffness.

3. Finite Element Model

To further elucidate the evolution of the overall tunnel’s mechanical performance under reinforcement corrosion and to ensure the accuracy of the finite element model, the simulation is conducted in two stages:
Step 1: Finite element models of localized concrete with single reinforcement and double reinforcement are established. XFEM is employed to simulate crack initiation and propagation, and the results are compared with experimental data to validate the suitability of the XFEM parameters.
Step 2: An overall tunnel lining finite element model is developed based on the CDP constitutive assumption. The validated XFEM parameters are incorporated to simulate crack evolution in the tunnel lining, and the model accuracy is further verified through scaled model tests.

3.1. Finite Element Model of Localized Concrete

3.1.1. Model Development

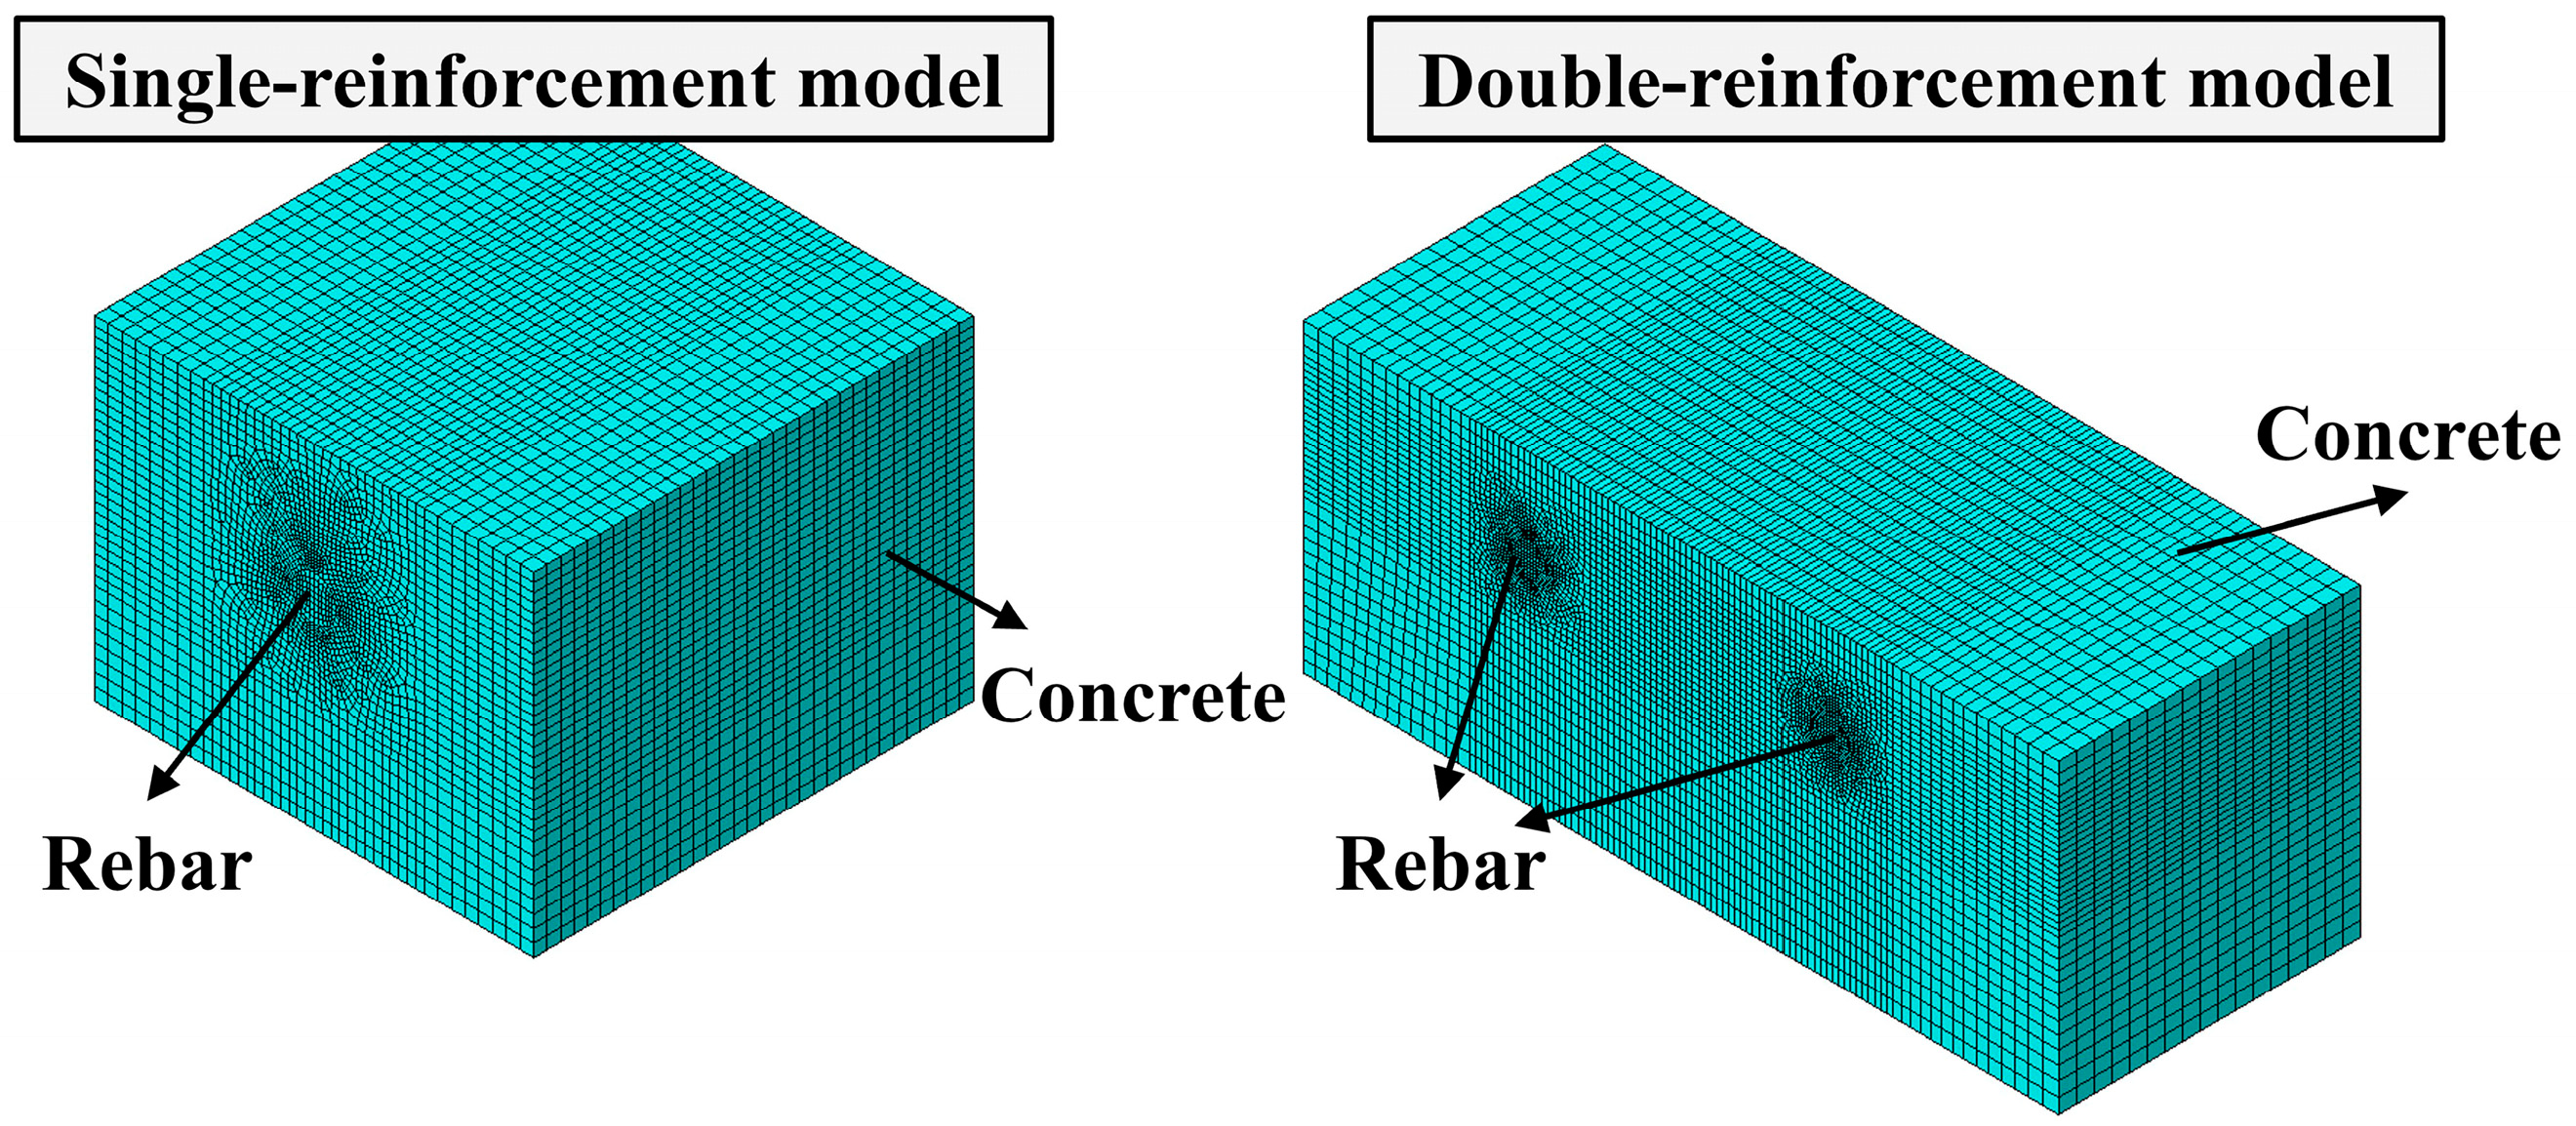
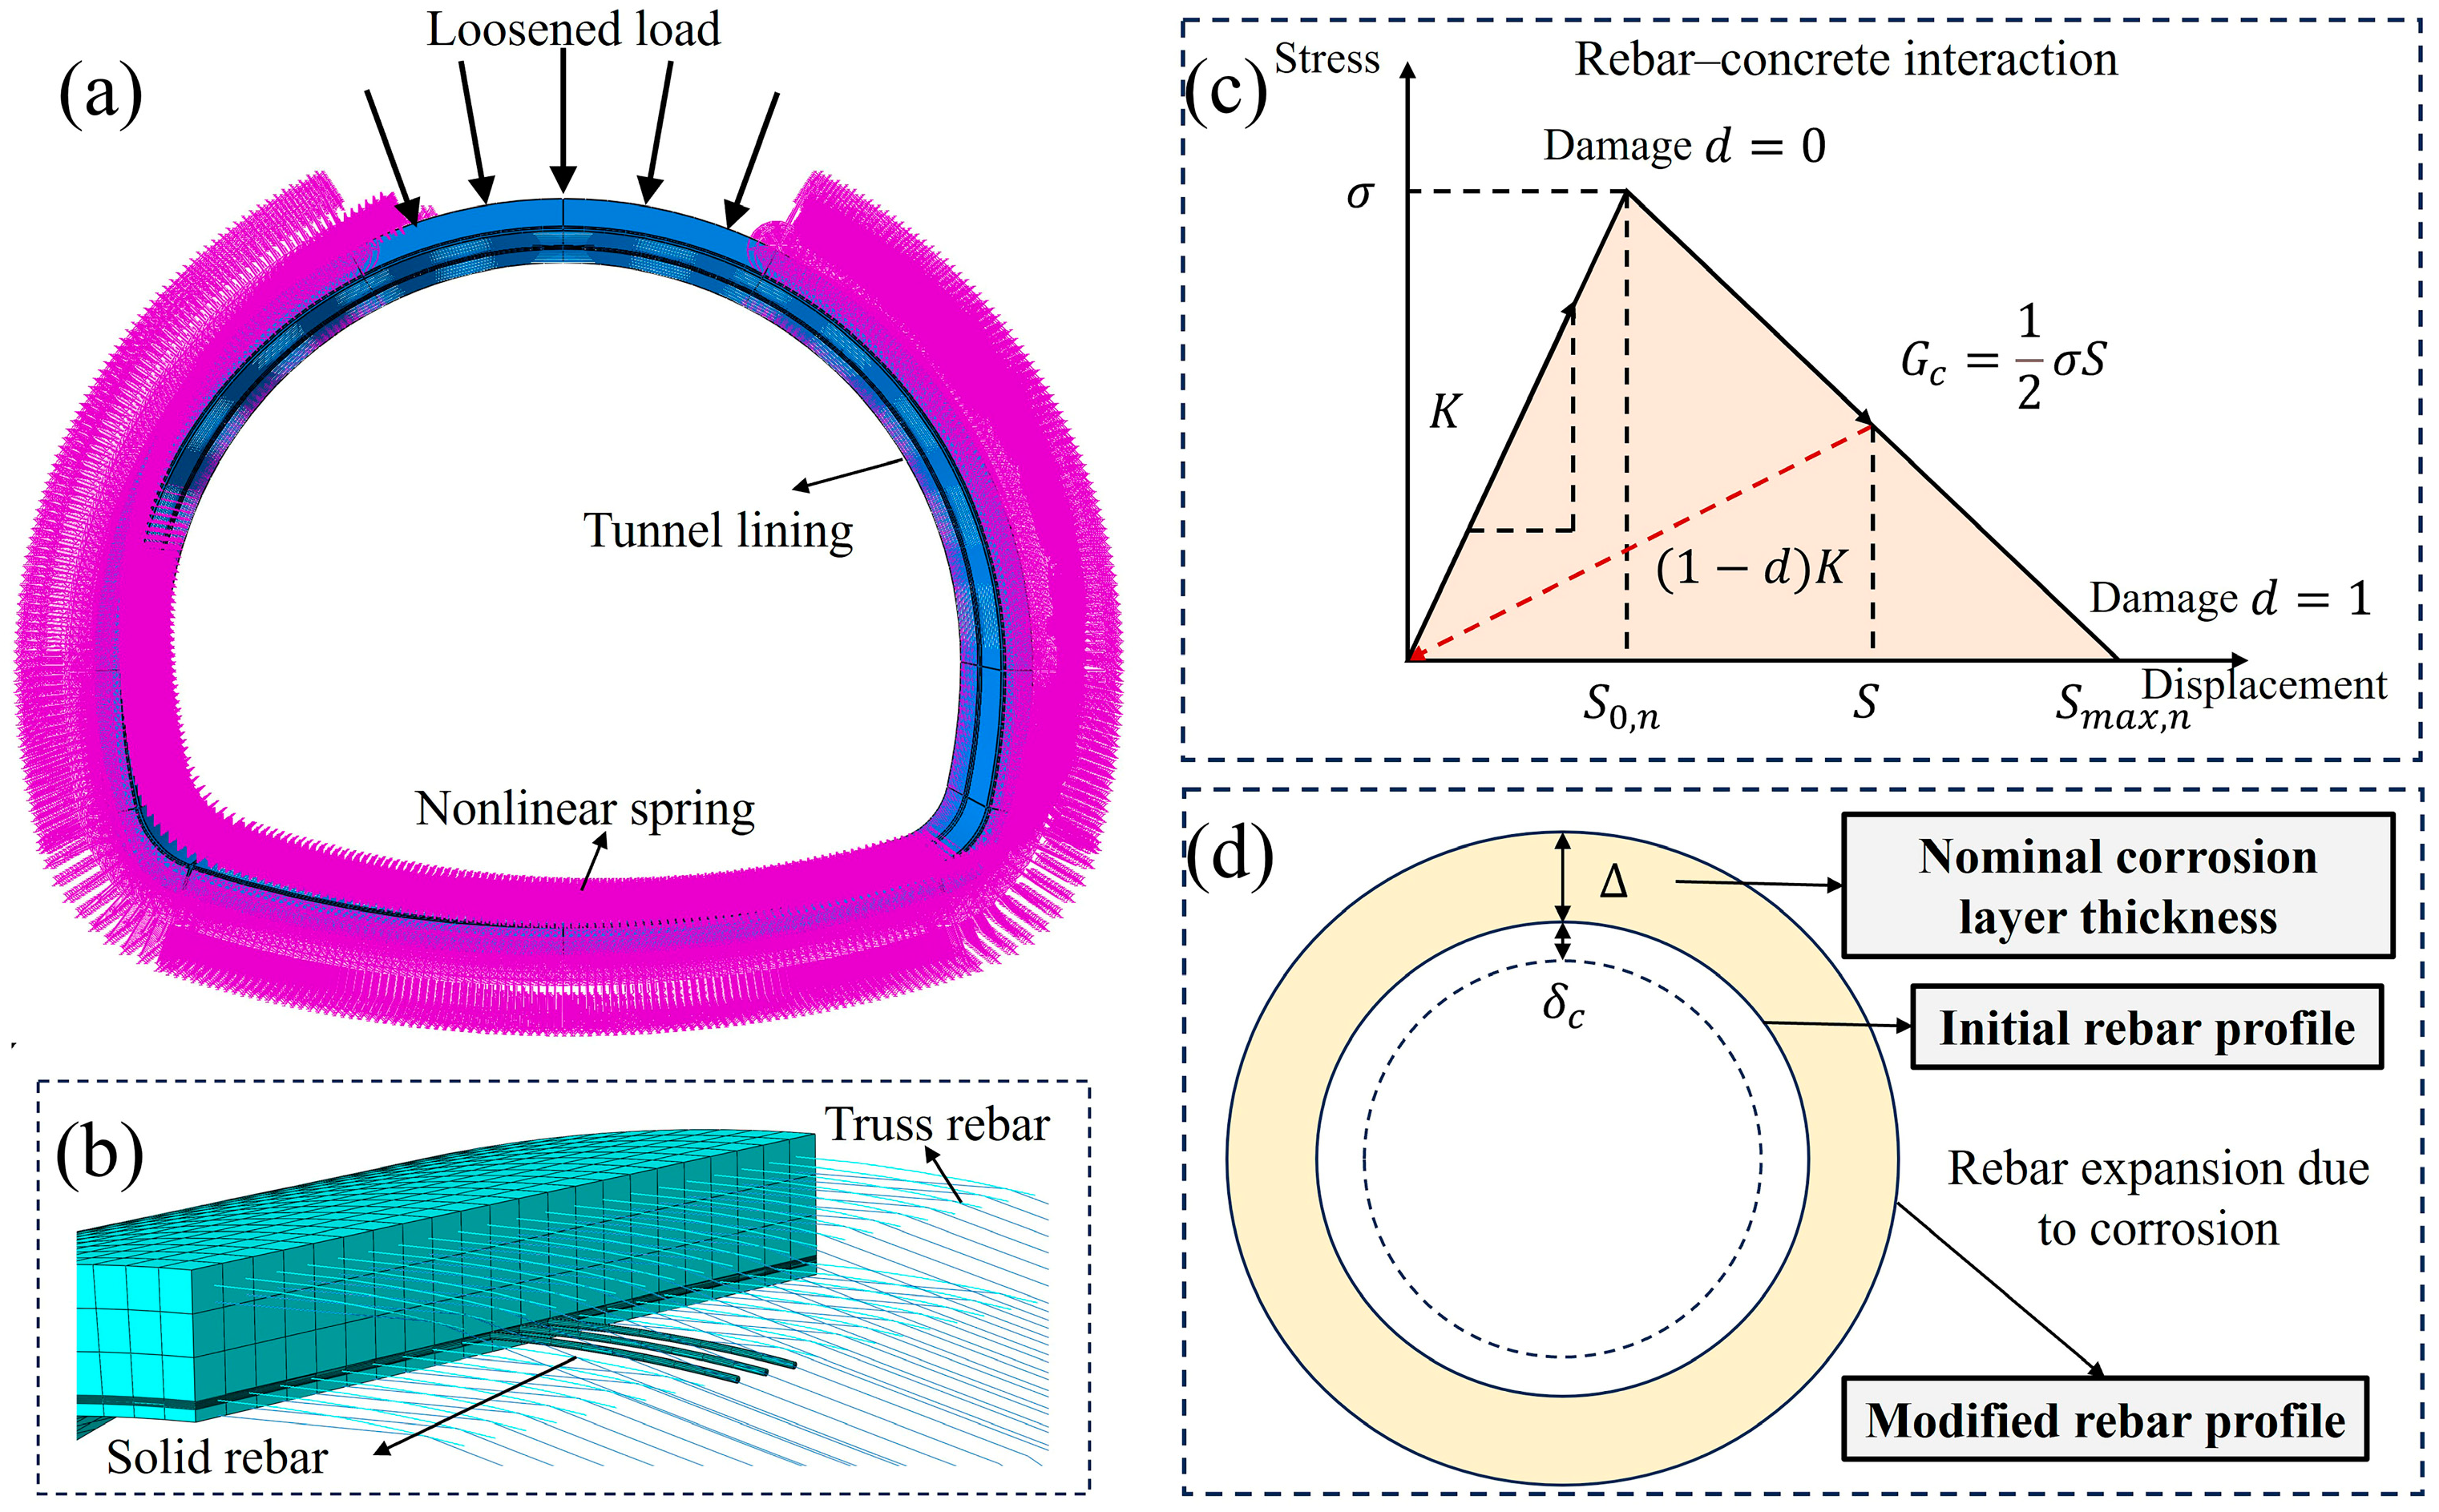
Single-reinforcement and double-reinforcement cubic models are established, as shown in Figure 7. The model dimensions are identical to those of the test specimens in Section 2, with both reinforcement and concrete modeled using C3D8R solid elements. Cohesive contact following the traction–separation law is employed to accurately simulate the interaction between reinforcement and concrete, with a bilinear damage evolution model adopted. The maximum nominal stress criterion is used to determine the onset of damage at the contact interface, i.e., damage initiates when the stress in any direction reaches its critical value. The extent of damage is governed by the cohesive energy G c , with the stress σ in each direction and cohesive energy G c calculated according to Equations (4) and (5):
σ = σ n σ s 1 σ s 2 = K n n K n s 1 K n s 2 K n s 1 K s 1 s 1 K s 1 s 2 K n s 2 K s 1 s 2 K s 2 s 2 S n S s 1 S s 2
G c = 1 2 σ S ,
In these equations, σ n denotes the normal stress; σ s 1 , σ s 2 represent tangential stresses in different directions; K n n , K n s 1 , K n s 2 , K s 1 s 1 , K s 1 s 2 , K s 2 s 2 denote components of the interfacial stiffness matrix; S represents the total interfacial displacement; S n is the normal interfacial displacement; and S s 1 , S s 2 are tangential interfacial displacements in different directions.
The parameters for the cohesive contact are listed in Table 1, with primary values referenced from relevant literature [27]. Here, σ n u represents the interfacial normal strength; σ s u represents the interfacial shear strength; K 0 , n represents the normal interfacial stiffness; K 0 , s represents the tangential interfacial stiffness; G C , n represents the normal cohesive energy; and G C , S represents the tangential cohesive energy. The interface strength primarily governs the initiation of interfacial damage, while the interface stiffness regulates the relative displacement across the interface and the initial stiffness of the system. In addition, the interfacial fracture energy controls the ultimate slip at failure and the post-peak softening behavior [27,28,29]. In the context of this study, reinforcement corrosion-induced expansion predominantly subjects the interface to compressive stress in the normal direction; therefore, the tensile parameters of the interface have only a minor influence on the cracking behavior of concrete. By contrast, the shear properties of the interface play a significant role by constraining interfacial slip and increasing crack energy dissipation, thereby affecting both the timing of crack initiation and the rate of crack propagation.
The equivalent thermal expansion coefficient method is adopted to simulate reinforcement expansion, i.e., a temperature field is applied to the corroded section to produce expansion deformation. The model assumes uniform corrosion of the reinforcement, with expansion occurring only in the transverse direction and the reinforcement mass uniformly distributed. The corrosion-induced expansion area of the reinforcement, S 1 , and the temperature-controlled expansion area of the reinforcement, S 2 , are calculated according to Equations (6) and (7), respectively:
S 1 = π r + 2 π r 2 ,
S 2 = π r 2 [ 1 + α T 2 1 ] ,
where is the nominal corrosion thickness,   = 2 δ c ; r is the reinforcement radius, α is the coefficient of linear thermal expansion, and T is the temperature change.

3.1.2. Constitutive Parameters

Since concrete subjected to corrosion-induced expansion primarily fails in tension, a simplified ideal elastic–plastic constitutive model is adopted to enhance computational efficiency. Crack initiation in the concrete is governed by the maximum principal stress criterion, with parameter values taken from the relevant literature [20]. The reinforcement is modeled using the same ideal elastic–plastic constitutive model. The main parameter values are summarized in Table 2.

3.1.3. Model Validation

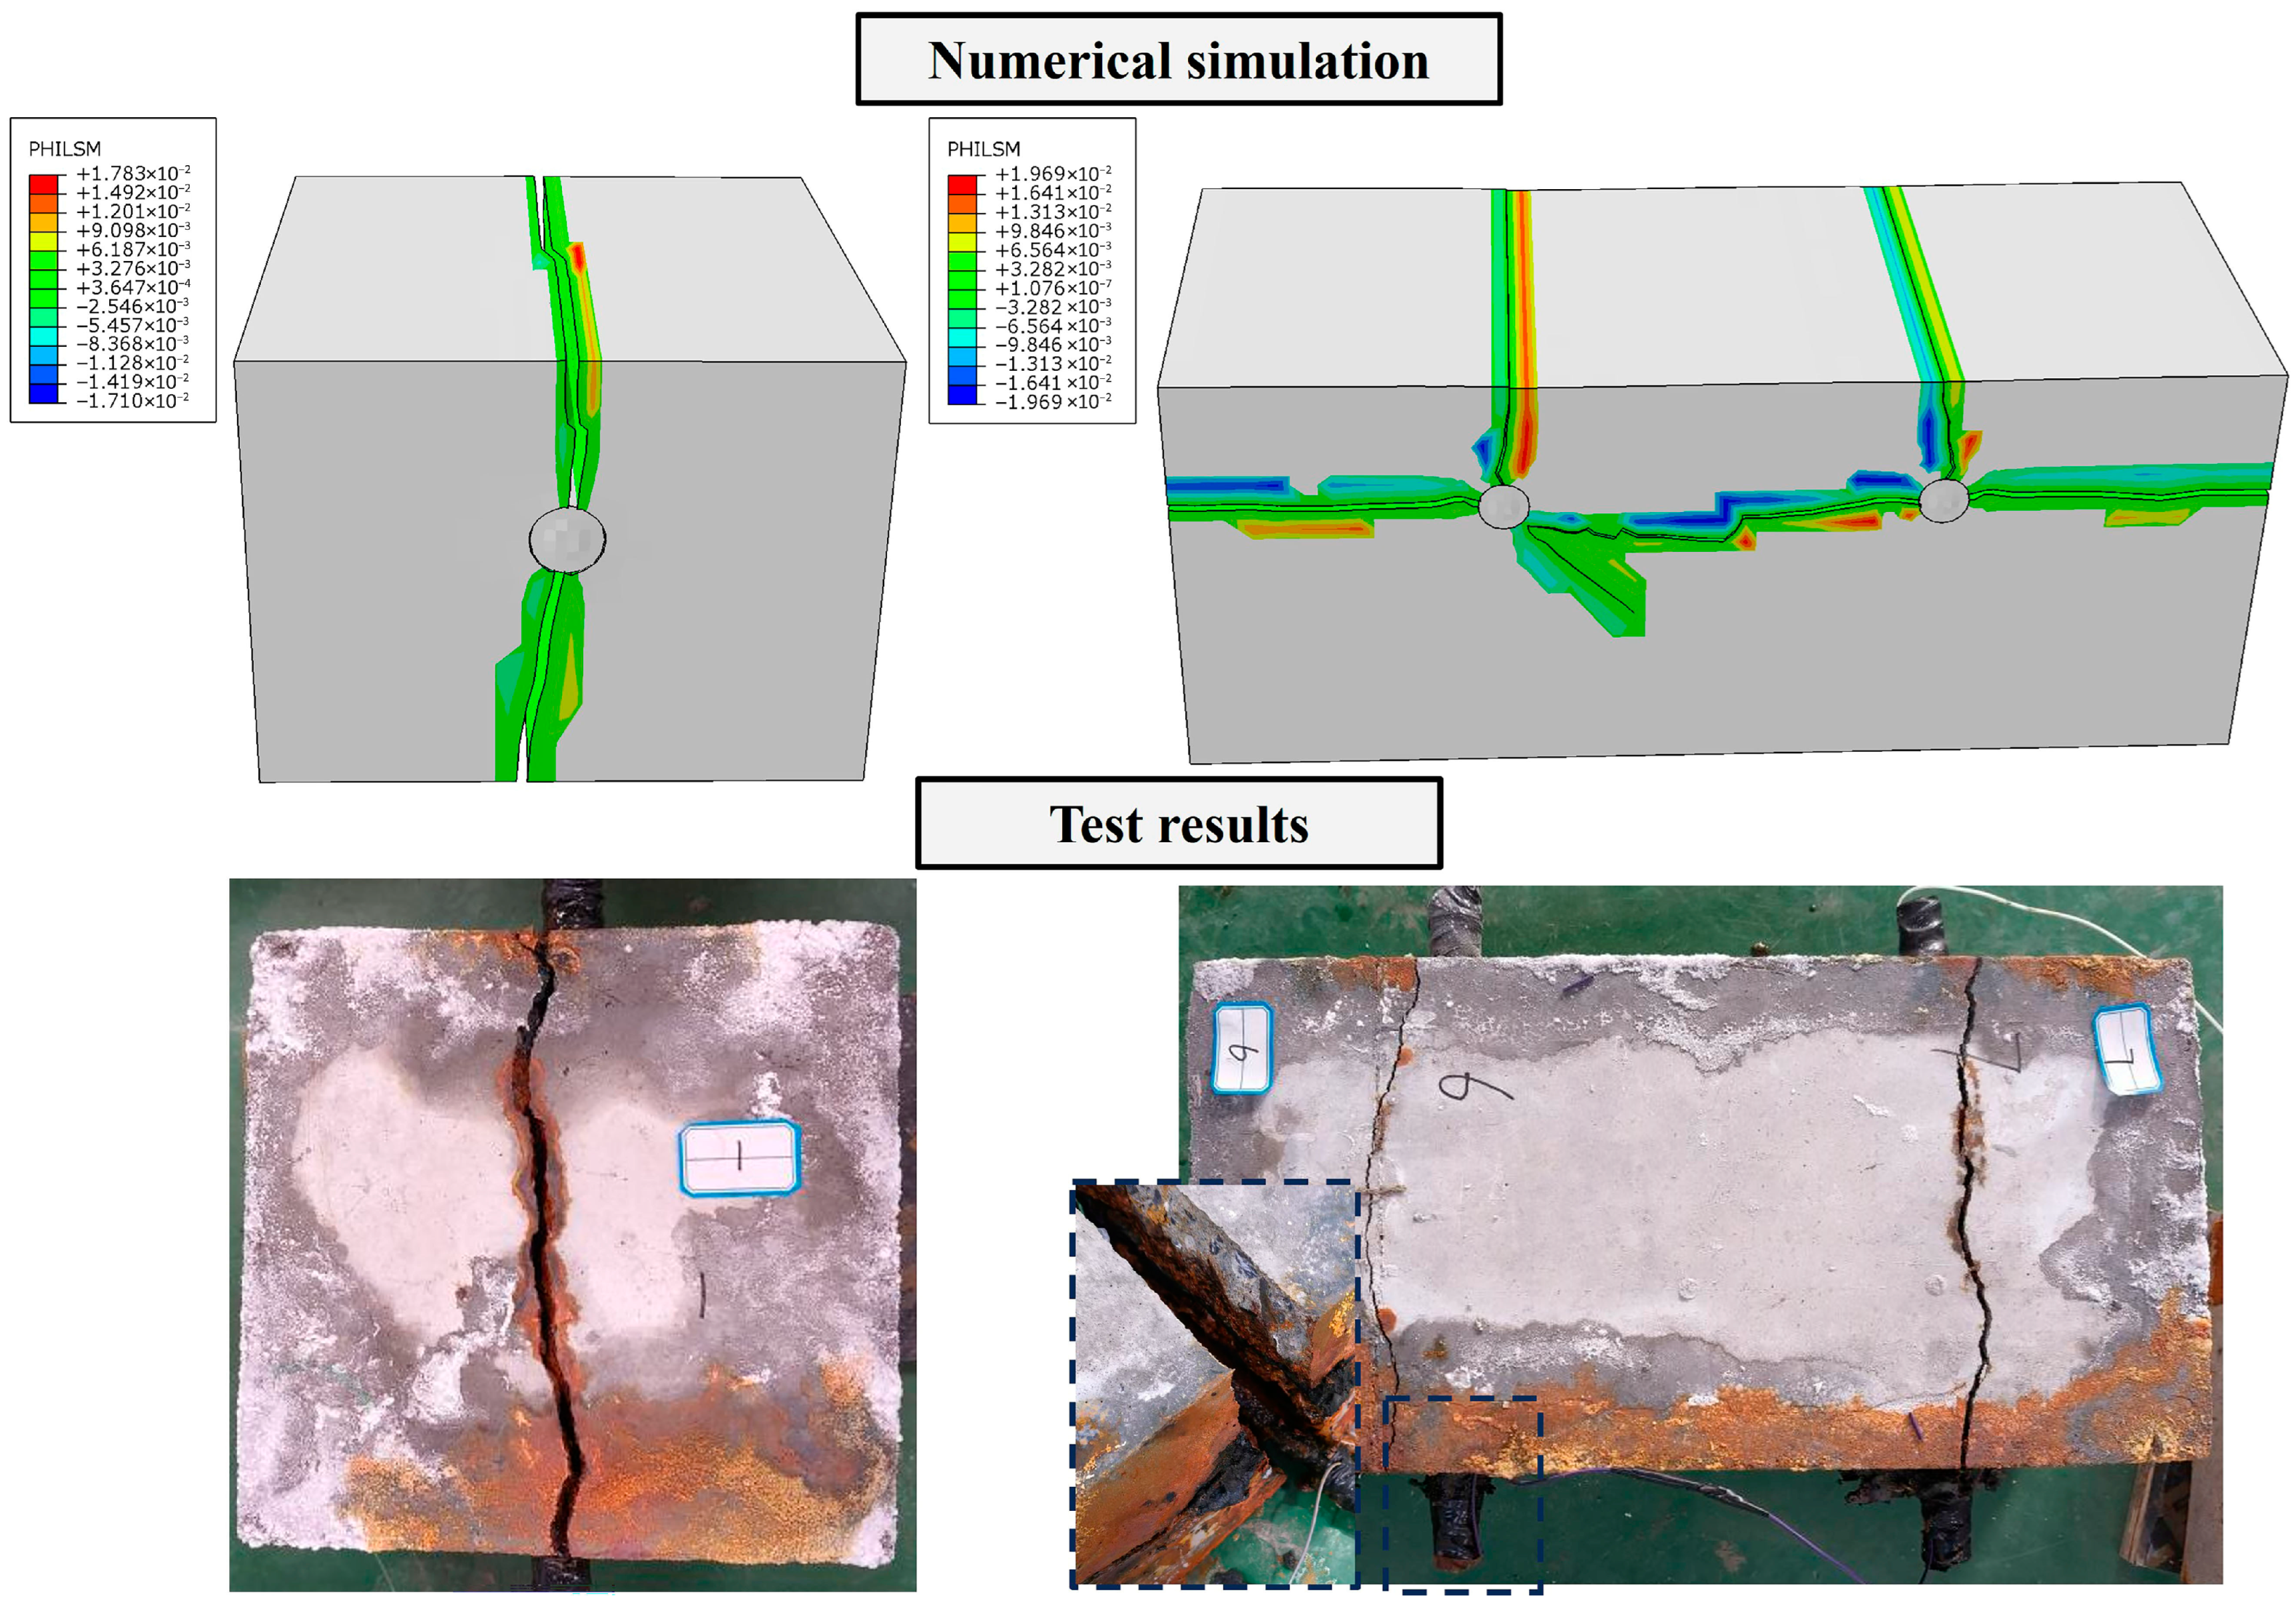
To verify the accuracy of the finite element model, the crack propagation observed in the simulations is compared with that in the tests. Figure 8 presents the cracking patterns of both the tested specimens and the numerical model. In the numerical contour plots, PHILSM denotes the level set function, whose contour line (PHILSM = 0) represents the crack location. The crack propagation modes in the simulations and tests are generally consistent, demonstrating the reliability of the finite element model.
A closer examination of the crack propagation process reveals that, for single-reinforcement specimens, two parallel cracks in opposite directions form in the concrete at the early stage of corrosion. The crack on the cover-layer side develops rapidly and first reaches the surface at a corrosion rate of approximately 1.16%. As the corrosion rate increases, the surface crack width continues to grow, while the crack on the opposite side extends downward and reaches the surface at a corrosion rate of approximately 14.52%. Beyond this point, further increases in corrosion rate do not change the crack length, indicating that a complete spalling zone has formed.
In the double-reinforcement concrete cubic model, cracks initially develop independently around each reinforcement, similar to the single-reinforcement case. At a corrosion rate of about 1.38%, the cracks associated with both reinforcements simultaneously extend to the cover-layer surface. With further increases in corrosion rate, cracks parallel to the surface gradually propagate, and at corrosion rates of 15.96–18.38%, they successively connect between the two reinforcements and between each reinforcement and the side surface. This process forms a symmetrical π-shaped crack pattern with a complete spalling zone in the concrete. Additional increases in corrosion rate do not alter the crack morphology. In practical engineering, cover cracks along reinforcement induced by corrosion have already been reported in several cases [30]. Moreover, existing experimental studies [31] have demonstrated that, under multi-reinforcement corrosion, cracks penetrating through multiple reinforcements can develop within the concrete, further confirming the rationality of the crack patterns obtained from the numerical simulations.

3.2. Finite Element Model of Road Tunnel Lining

3.2.1. Model Development

To further investigate the effect of reinforcement corrosion on the mechanical performance of road tunnel structures, a three-dimensional refined nonlinear finite element model of the road tunnel secondary lining is established, as shown in Figure 9. The lining thickness is 0.4 m, the height is 9.53 m, and the longitudinal length is 3 m. In the model, the concrete is modeled using C3D8R solid elements. The locally corroded reinforcement is modeled with solid elements, while the remaining reinforcement is modeled with truss elements. The interaction settings of the overall model are consistent with those of the localized model.
A loosened earth pressure is applied to a 54° range at the tunnel crown. Nonlinear ground springs are placed on the exterior side of the structure to simulate ground–structure interaction, which can bear compression but not tension. The spring stiffness K is calculated according to Equation (8):
K = k S n ,
where k is the ground resistance coefficient, taken as 10 MPa/m; S is the exterior surface area of the lining; and n is the number of nodes on the exterior surface of the lining in the finite element model.

3.2.2. Constitutive Parameters

The CDP model, combined with XFEM, is adopted to capture the damage and cracking of the concrete. The main parameters of the CDP constitutive model refer to the research of relevant scholars [29,32] and are as follows: a compressive strength of 20.1 MPa, tensile strength of 2.01 MPa, expansion angle (ψ) of 38°, eccentricity (ξ) of 0.1, ratio of initial equivalent biaxial compressive yield stress to initial uniaxial (σb0c0) of 1.16, ratio of constant stress in tension meridian to compression meridian (Kc) of 0.67, and viscosity coefficient (μ) of 0.0005. The XFEM parameters are identical to those used in the localized model in Section 2.1.2. The reinforcement is modeled with an ideal elastic–plastic constitutive model, with a yield strength of 400 MPa.

3.2.3. Model Validation

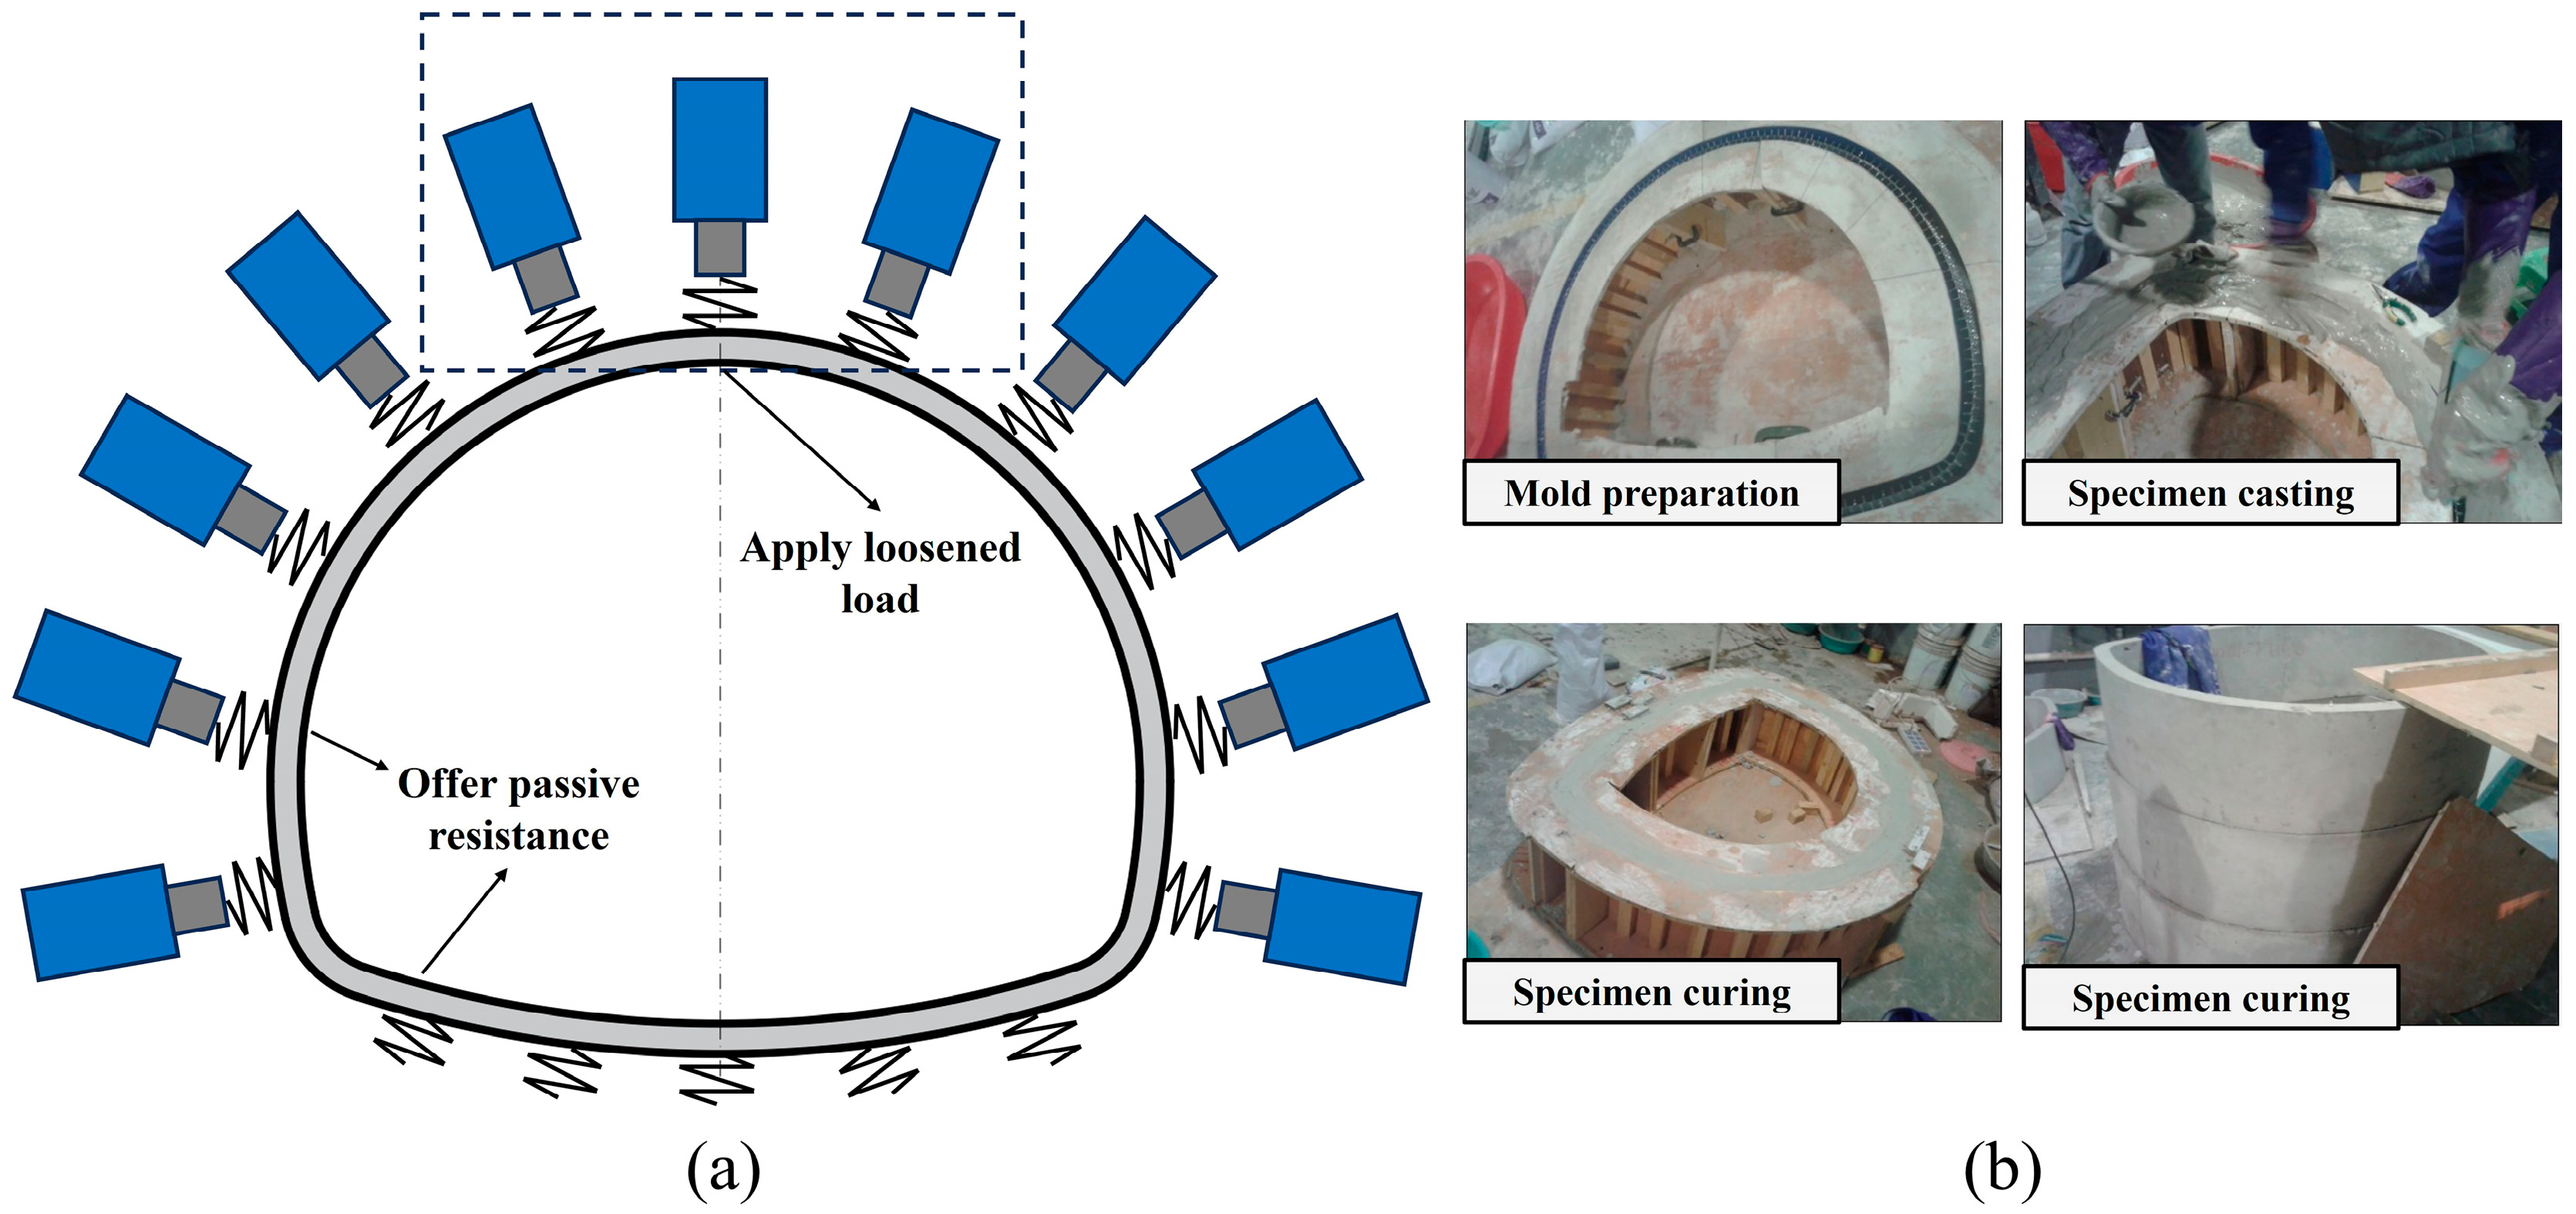
To verify the accuracy of the tunnel lining finite element model, a 1:10 scaled model test is conducted, as shown in Figure 10. The test similarity ratios are designed based on dimensional analysis, as shown in Table 3. The simulation methods for the concrete lining, reinforcement, and ground–structure interaction are as follows:
(1)
The concrete lining is cast using high-strength gypsum with a water-to-gypsum ratio of 0.55:1, an elastic modulus of 2.53 GPa, a compressive strength of 2.36 MPa, and a tensile strength of 0.24 MPa.
(2)
The reinforcement is made of steel, with a spacing of 1 cm.
(3)
The ground–structure interaction is simulated using a combination of jacks and springs, with curved bearing plates placed between the springs and the lining. First, the equivalent subgrade reaction coefficient k s for the model test is obtained based on the similarity ratio. Then, the stiffness of a single spring, k 0 , is calculated by multiplying k s   effective area of a single spring, S s . The calculated value of k 0 is taken as 100 N/m.
The test employs a full-perimeter loading system, as illustrated in Figure 10. Three jacks positioned at the crown actively apply loosened earth pressure, and high-precision load cells (accuracy: 0.2 kPa; maximum capacity: 80 kPa) are used to ensure precise load control. The entire setup is placed horizontally, with PTFE plates laid between the model base and the tray to reduce friction.
The test follows a “preloading + stepwise loading” scheme, in which preloading eliminates the effects of support displacement and imperfect contact between the specimen and the supports. The preloading load does not exceed 0.5 kPa, is applied in two steps, and is held constant for 0.5 h. Staged loading is then performed using small incremental loads, with the loading rate controlled between 0.3 and 0.5 kPa/min. Each load level is maintained for 5 min before proceeding to the next.
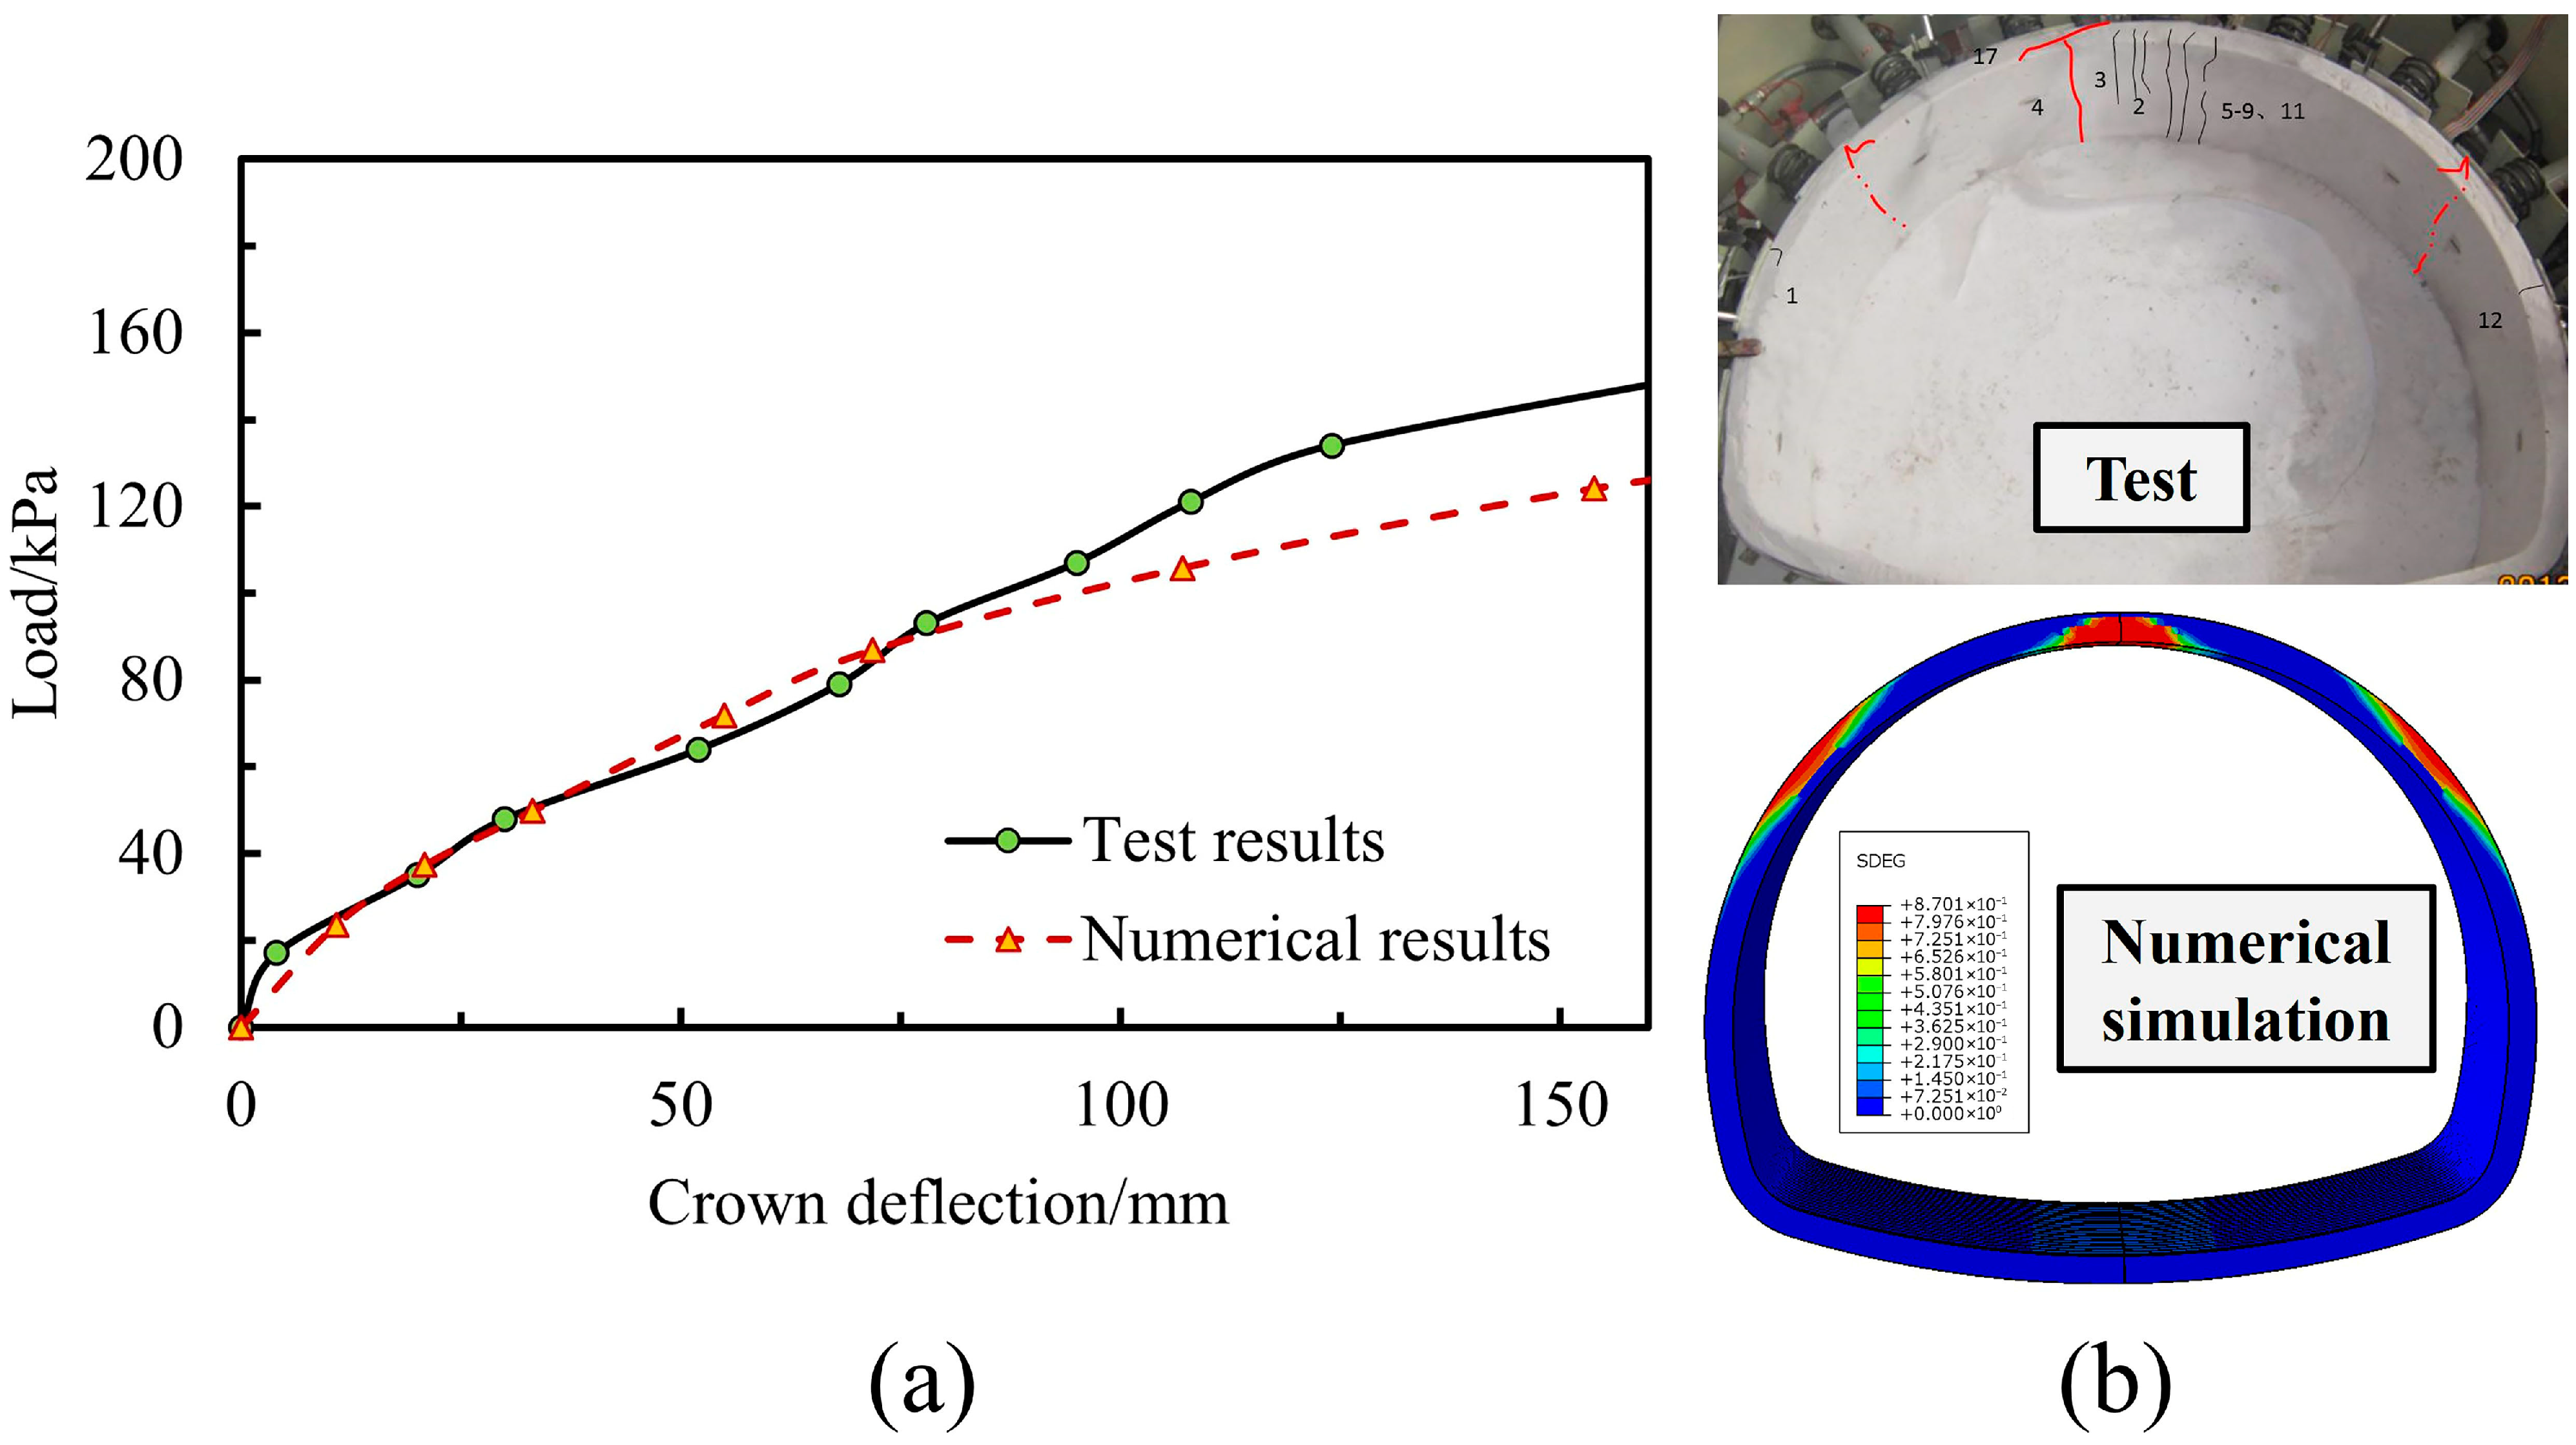
The numerical results are compared with the test results back-calculated according to similarity theory, using the crown deflection curve shown in Figure 11. The numerical and experimental results exhibit generally consistent trends, with an error of 15.92% in the ultimate load-bearing capacity. The failure locations and sequences are also comparable, further demonstrating the reliability of the numerical model. The structural load-bearing capacity obtained from the numerical simulations is slightly lower than that observed in the model tests, primarily due to the inevitable similarity ratio errors inherent in physical model testing. Constrained by material properties and processing conditions, the test materials cannot fully satisfy the theoretical similarity requirements, resulting in locally elevated material strengths and, consequently, a relatively higher load-bearing capacity in the experimental structures.

4. Results and Analysis

To further investigate the effect of reinforcement corrosion on the mechanical performance of the tunnel lining, a loosened earth pressure of 20 kPa is applied at the crown. This study discusses only the cracking behavior induced by reinforcement corrosion at the crown, as it is both common in engineering practice and represents the most unfavorable condition [2,7]. Corrosion of the reinforcement at the haunch and invert may exhibit different mechanical evolutions due to the distinct structural stress states in these regions. Corrosion-induced expansion is applied to the three longitudinally central reinforcements within the 54° crown sector, with a maximum corrosion rate of 25%.

4.1. Structural Deformation

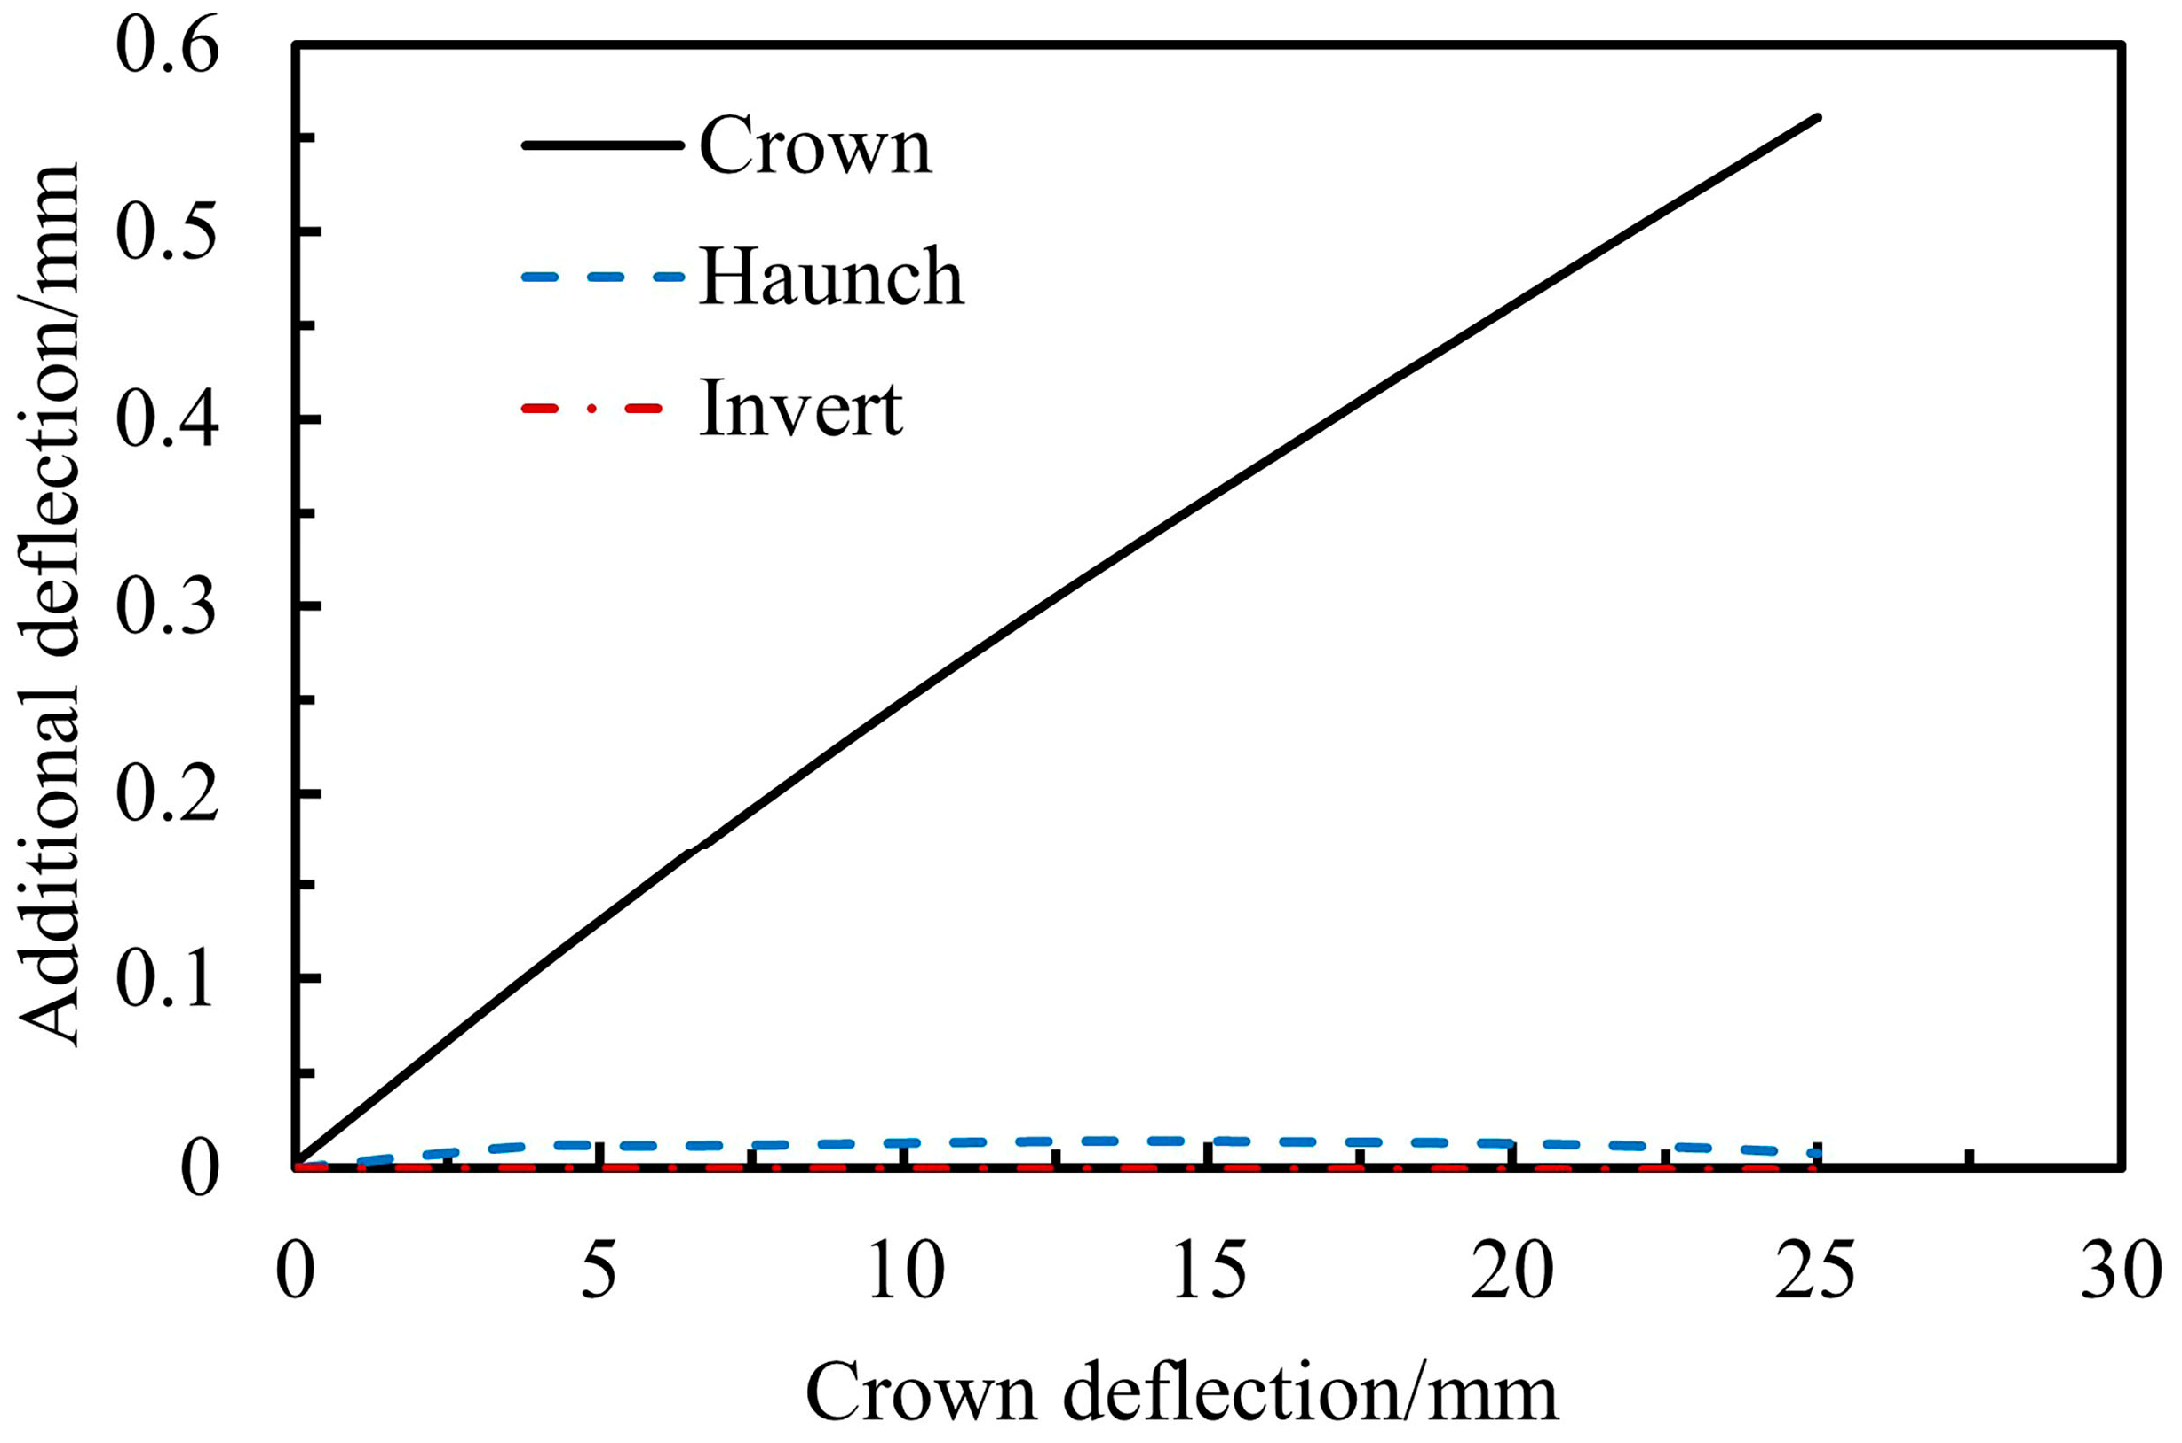
The deformation at different positions of the road tunnel secondary lining under reinforcement corrosion is extracted after the loosened earth pressure stabilizes, as illustrated in Figure 12. Under a local loosened earth pressure of 20 kPa, the tunnel lining crown exhibits a vertical deflection of 5.19 mm. As the reinforcement corrosion rate increases, the crown deflection also increases, with a maximum additional deflection of 0.56 mm, whereas the deflections at the haunch and invert remain almost unchanged. These results indicate that localized reinforcement corrosion affects the concrete deformation behavior only in the corresponding area, making it susceptible to local bulging that can subsequently lead to cracking and spalling, while exerting minimal influence on the overall tunnel lining.
A further analysis is performed to evaluate the influence of reinforcement corrosion under different local loosened earth pressures. When the pressure is increased to 40 kPa, the variation in crown deflection is examined, as presented in Table 4. The initial crown deflection increases from 5.19 mm to 23.26 mm, while the additional deflection induced by corrosion expansion rises by 12.5%, indicating a relatively minor influence.

4.2. Internal Force Redistribution

The road tunnel lining structure is a typical statically indeterminate system. Owing to the combined influence of complex boundary conditions and multiple structural interactions, its internal force distribution and evolution under localized reinforcement corrosion have not yet been systematically investigated. In studies of the internal force of road tunnel linings, emphasis is usually placed on bending moment and axial force.
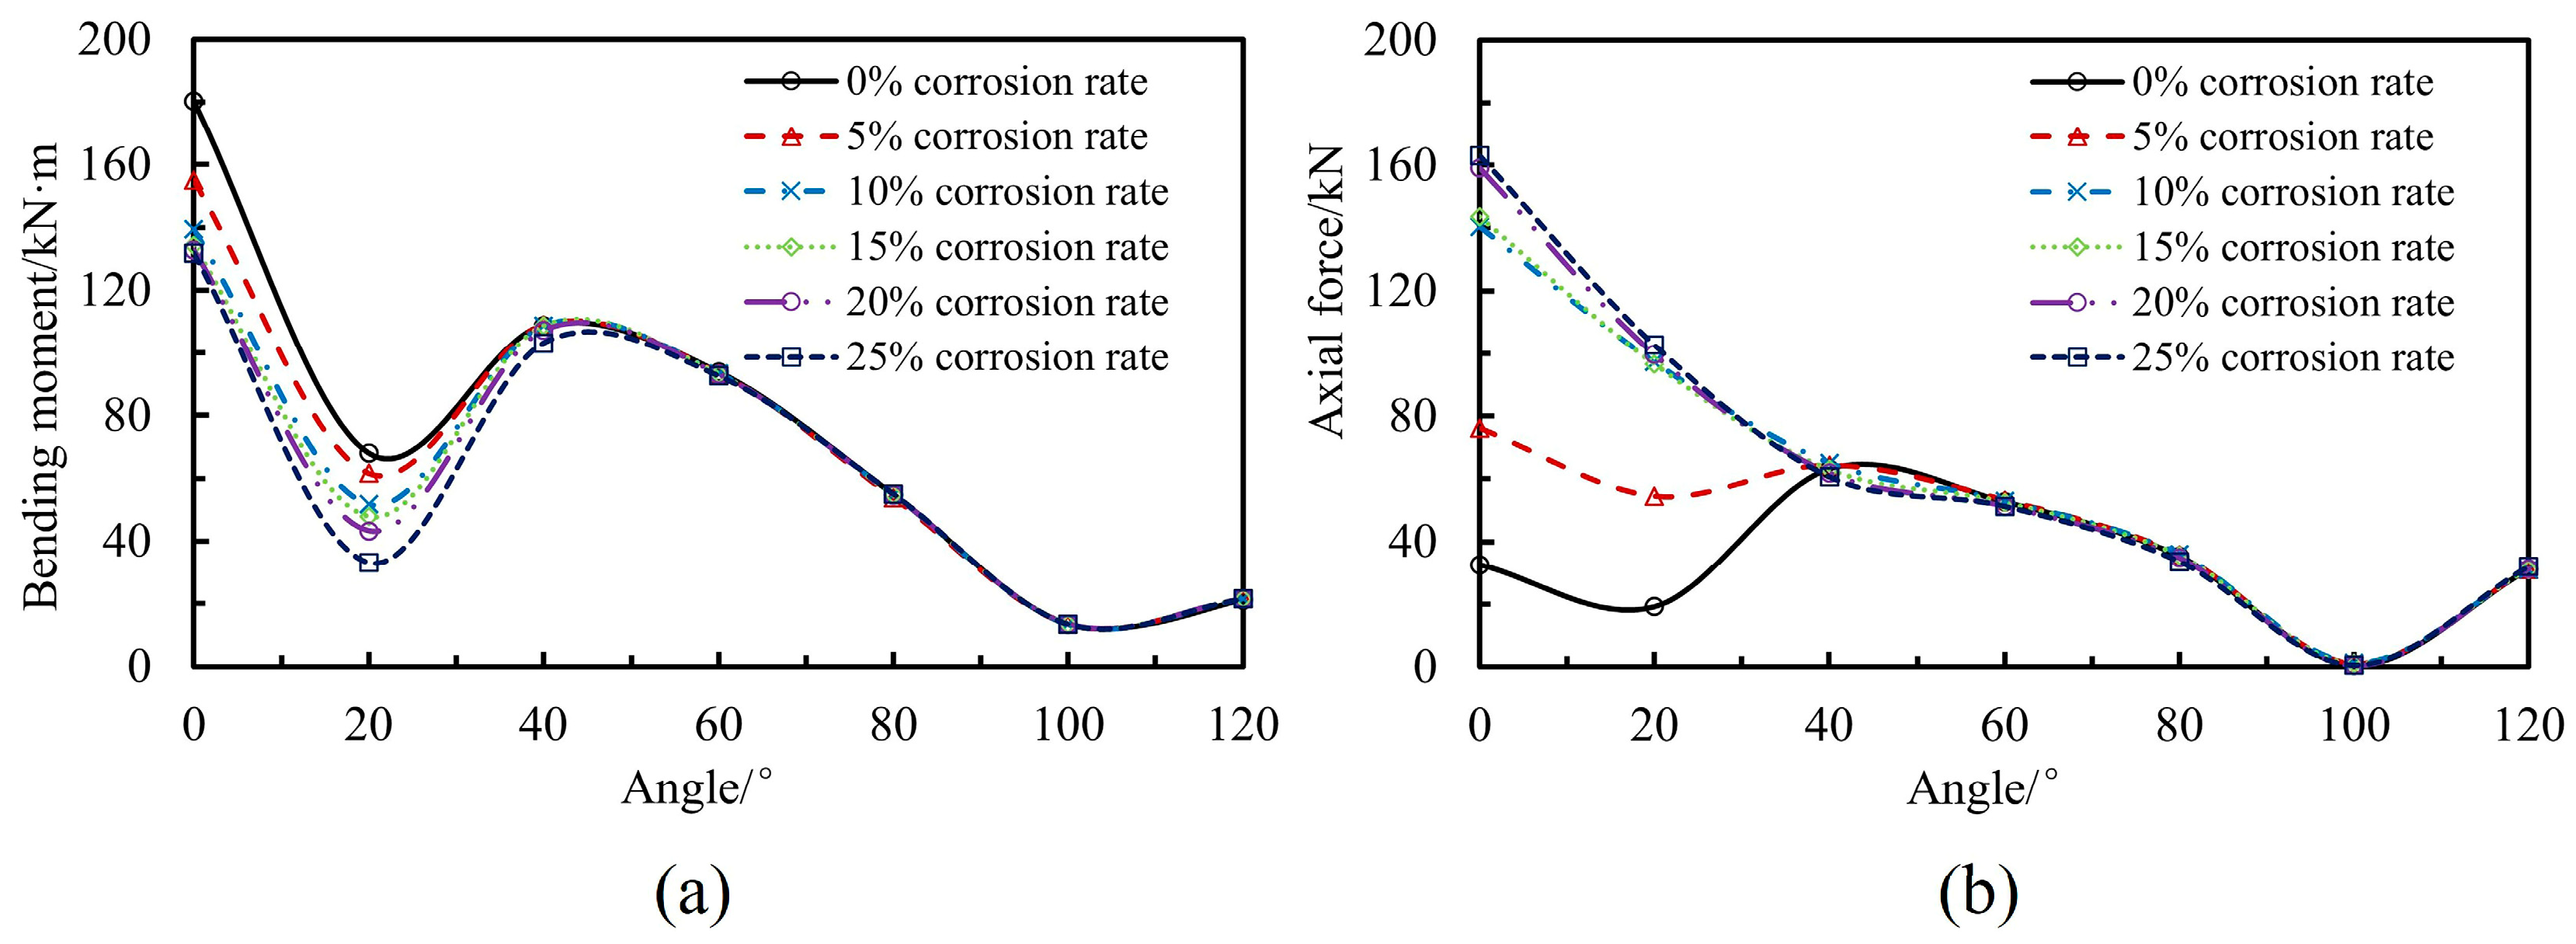
Based on the numerical model, the internal force distribution of the lining under crown reinforcement corrosion is extracted, as shown in Figure 13. The results show that, as the reinforcement corrosion rate increases, the bending moment within the crown range of approximately −60–60° decreases, whereas the axial force increases markedly. In contrast, internal force variations within the range of 60–300° are negligible, indicating that the influence of localized reinforcement corrosion is spatially confined.
Within the corrosion rate range of 0–15%, internal force changes are particularly sensitive: for every 5% increase in corrosion rate, the bending moment at the crown (0° position) decreases by an average of 8.47%, while the axial force increases by 114.54%. When the reinforcement corrosion rate exceeds approximately 15%, the variation rates of bending moment and axial force noticeably decelerate: for every additional 5% of corrosion, the bending moment at the crown (0° position) decreases by only about 0.96% on average, while the axial force increases by about 6.75%. The fundamental reason for this is that, once this critical level is reached, the stiffness of the local concrete section has already been significantly weakened by microcrack development and interfacial degradation induced by reinforcement expansion, resulting in nearly saturated losses of flexural and axial stiffness in that region. Beyond this point, although further corrosion continues to reduce the load-bearing capacity of the reinforcement cross-section, its impact on the overall redistribution of internal forces within the structure becomes considerably less pronounced. Therefore, in practical engineering, once inspection results indicate that the corrosion rate of reinforcement has exceeded this critical threshold, it signifies that the stiffness of the local concrete has already undergone severe degradation. At this stage, the focus of maintenance and strengthening should shift from delaying stiffness deterioration to enhancing local load-bearing capacity and crack resistance, while implementing measures to prevent cover spalling and concrete detachment.

4.3. Damage Evolution and Crack Propagation

With appropriate concrete strength parameters, the CDP model can capture the damage zones under reinforcement corrosion with acceptable computational efficiency. However, crack initiation and propagation cannot be accurately represented by damage modeling alone. XFEM can effectively characterize the crack evolution process; therefore, in this study, the CDP constitutive model is combined with XFEM to capture both damage evolution and crack propagation under reinforcement corrosion.
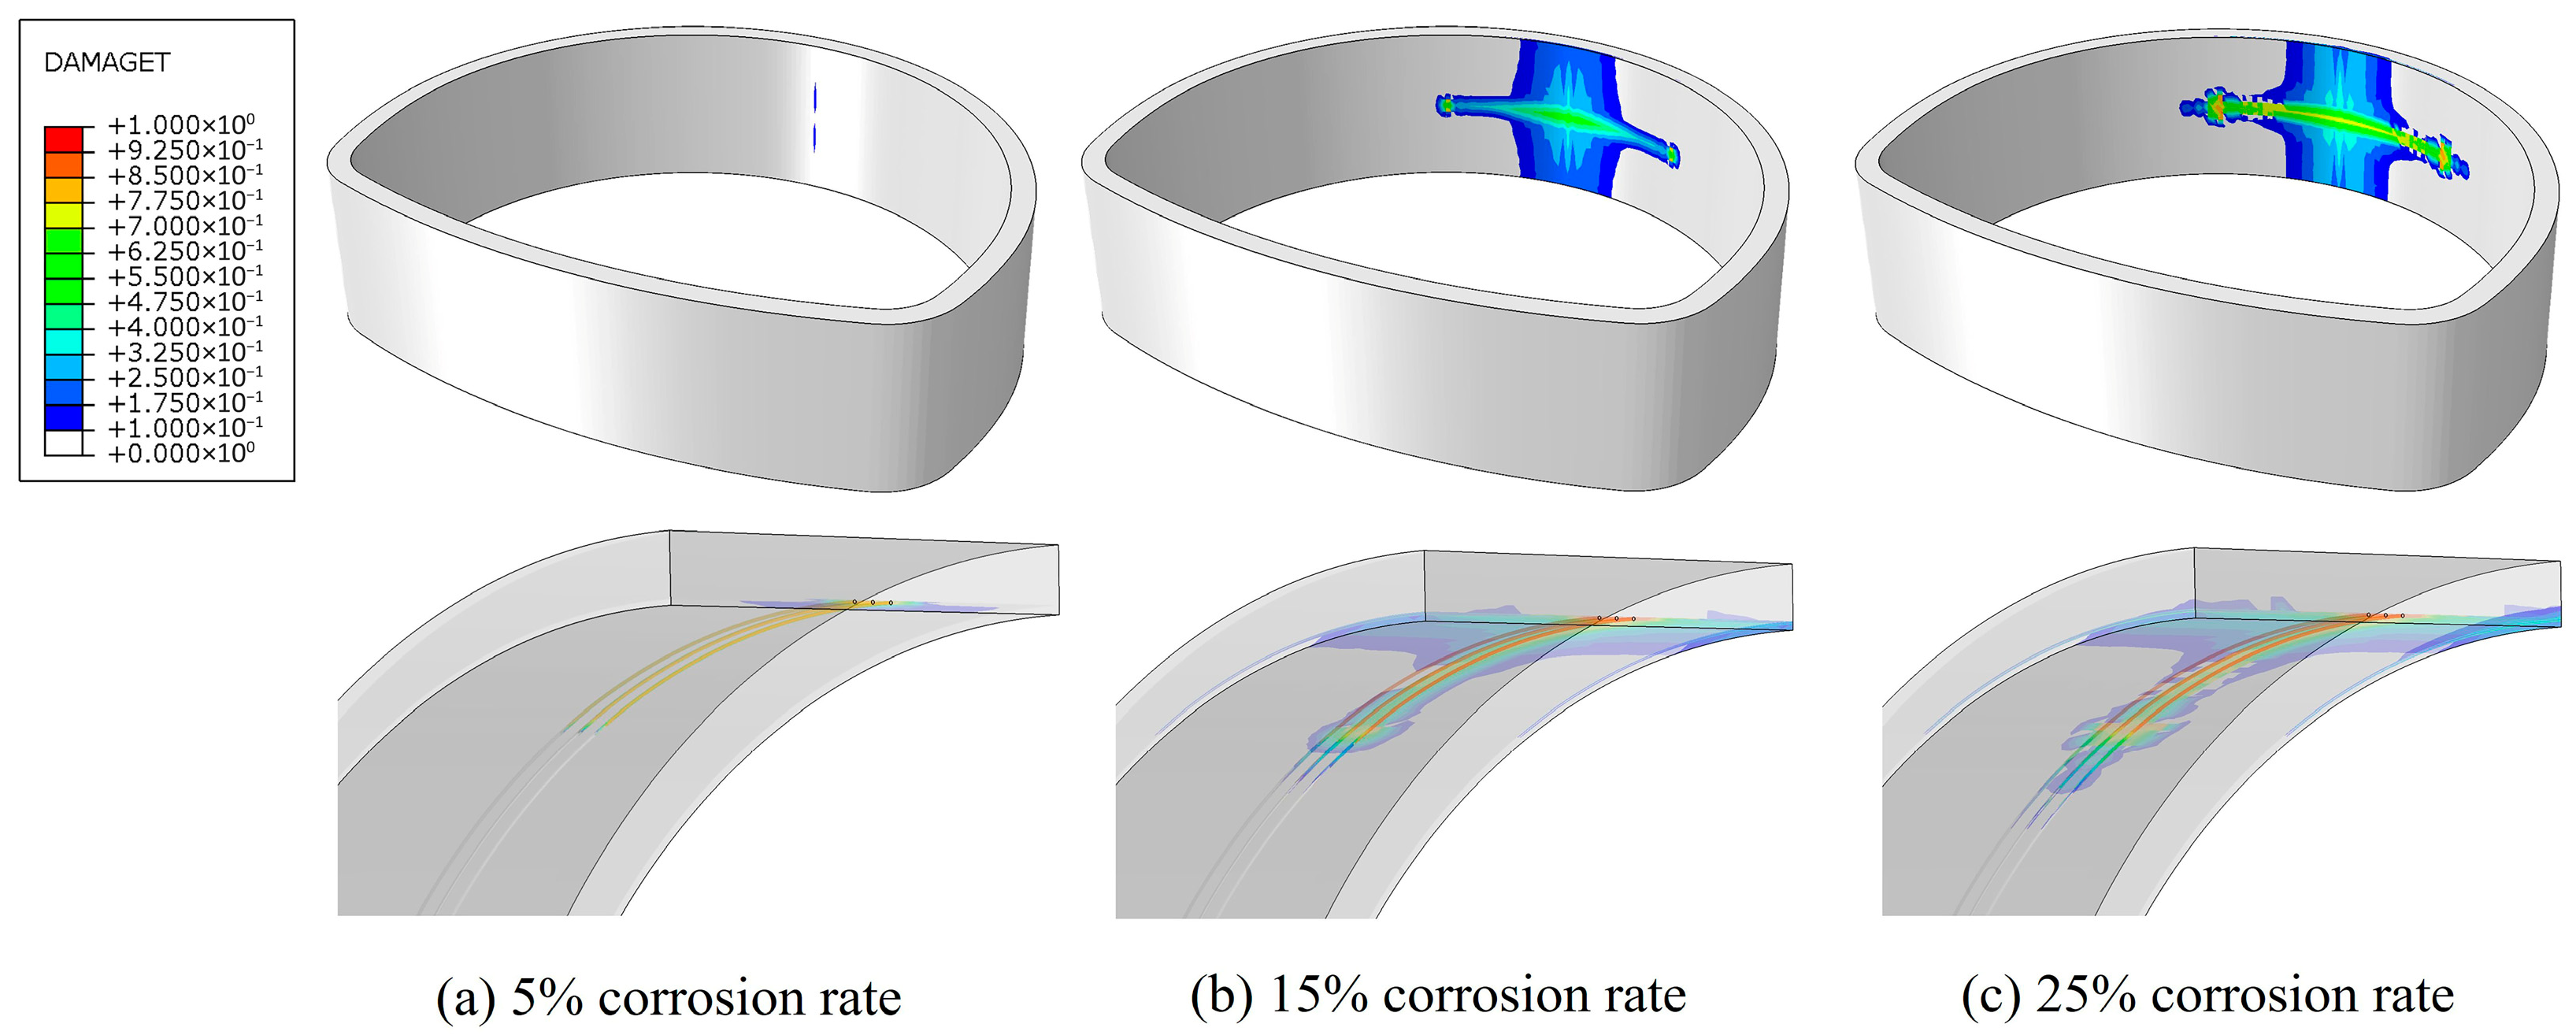
The concrete damage patterns at different reinforcement corrosion rates are shown in Figure 14. When the corrosion rate is 0%, no damage occurs because the loosened earth pressure is relatively small. At a corrosion rate of 5%, longitudinal damage first appears at the crown (0° position) on the lining surface, while internally, damage initiates near the corroded reinforcement holes and extends circumferentially from the 0° position toward both sides. As the corrosion rate increases, the surface damage becomes continuous along the longitudinal direction, and circumferential damage develops rapidly.
When the corrosion rate reaches 15%, further increases in corrosion rate cause little change in the damaged surface area, although the degree of damage in this region continues to intensify. Inside the lining, severe damage develops circumferentially in the concrete surrounding the reinforcement, with damage continuing to propagate longitudinally. At a corrosion rate of 25%, the concrete near the reinforcement within the crown range of −27–27° is almost completely damaged, with a maximum damage value of 0.9. Significant damage is also observed longitudinally and along the section height, with a maximum damage value of 0.7, indicating a high risk of cracking and spalling.
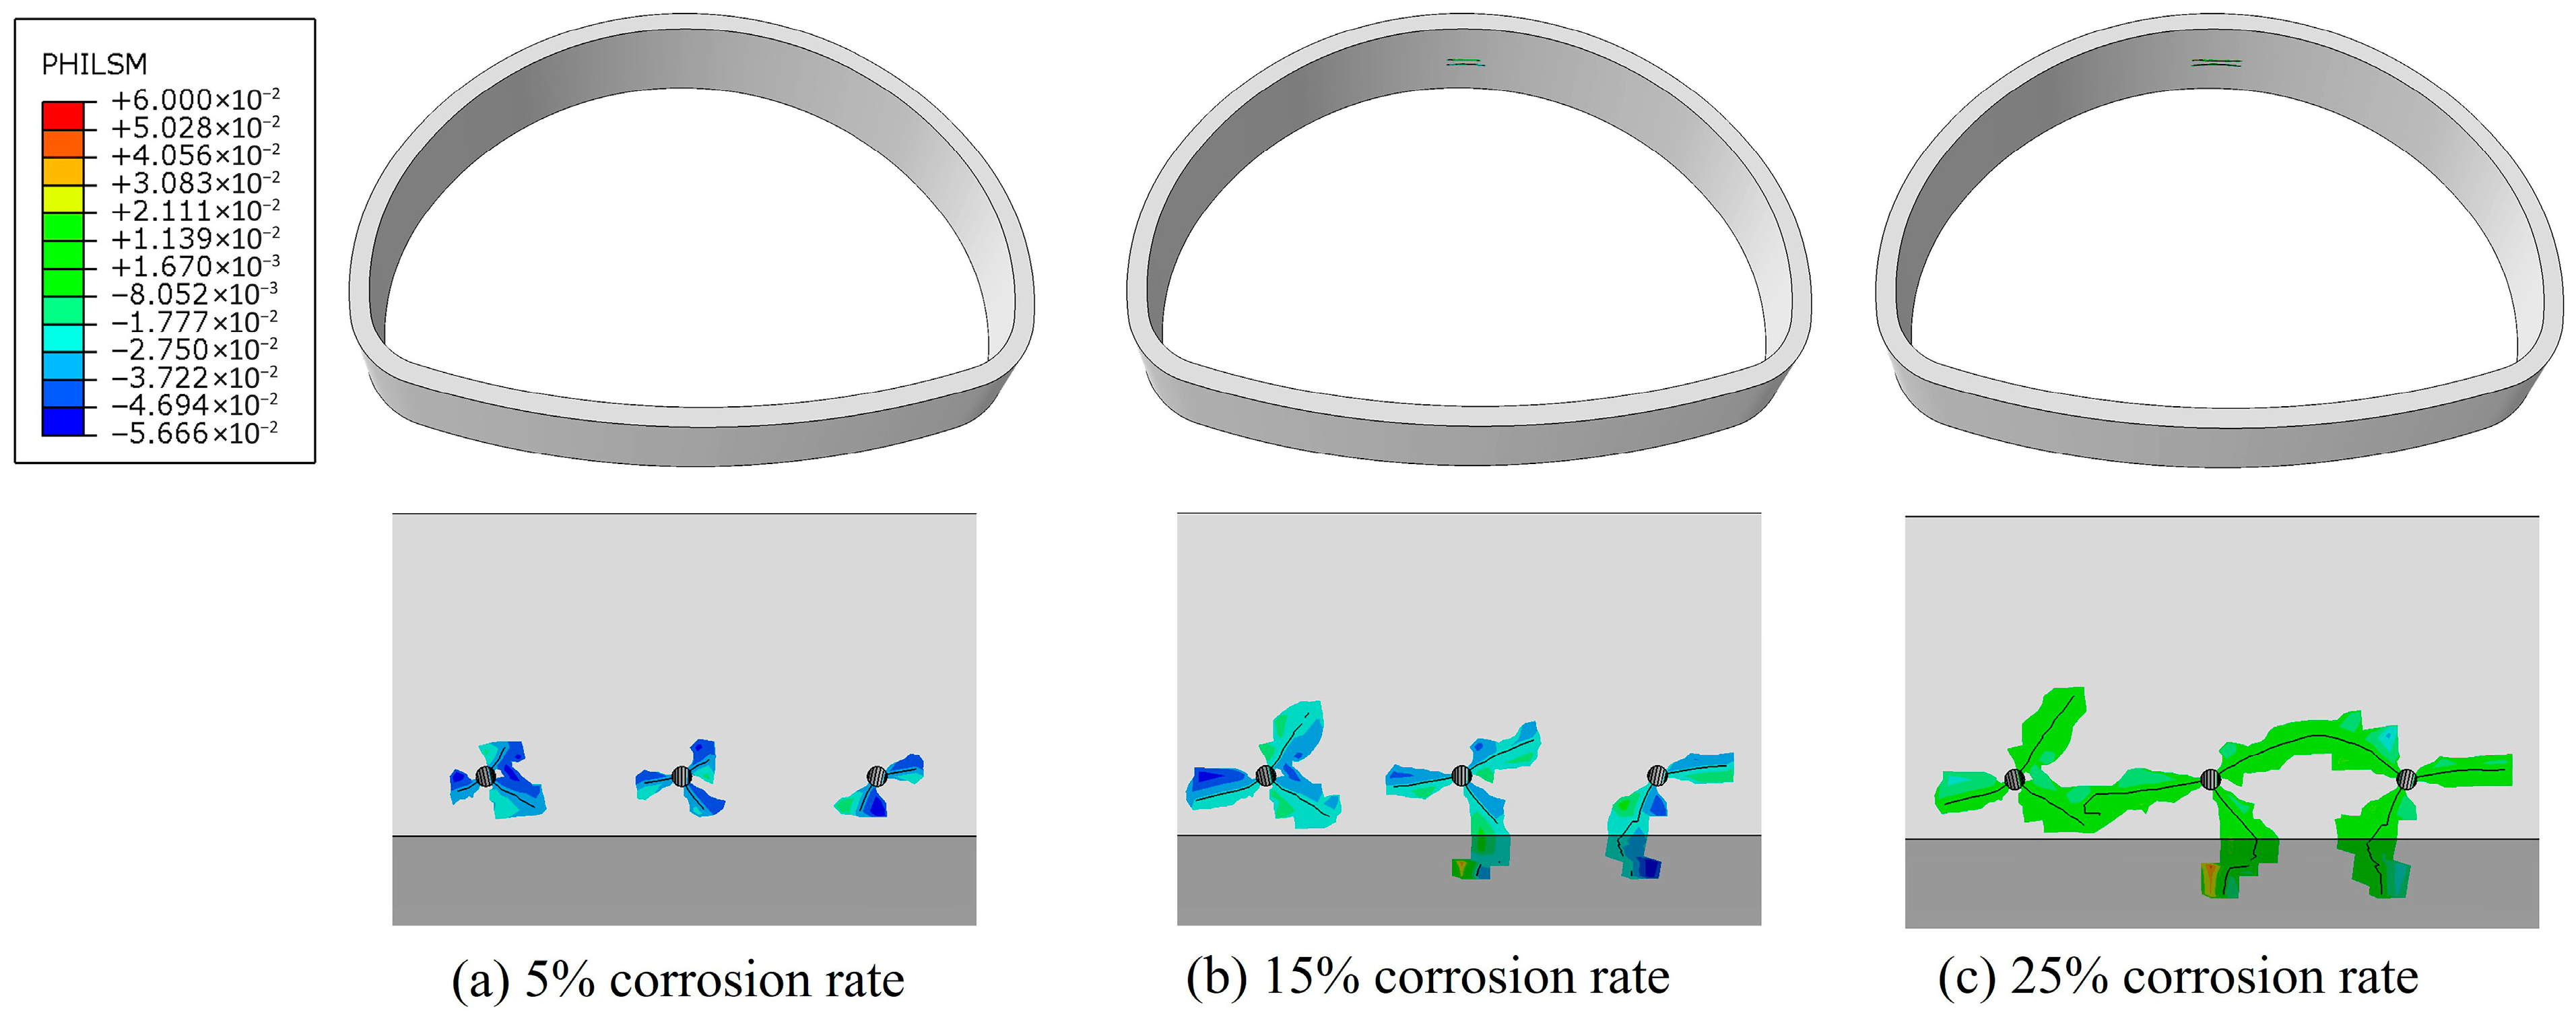
A further analysis of the XFEM results is presented in Figure 15. When the reinforcement corrosion rate is 0%, no cracks appear on either the surface or the interior of the lining. At a corrosion rate of 5%, no cracks are observed on the inner surface of the lining, but cracks begin to initiate near the reinforcement holes. According to their orientation, these cracks can be classified into two types:
(1)
Longitudinal cracks, parallel to the lining surface, which propagate over a larger range and are more likely to form a critical spalling zone along the cover-layer interface.
(2)
Circumferential cracks, perpendicular to the lining surface and concentrated around the corroded reinforcement, which generate a localized surface fragmentation zone.
When the corrosion rate increases to 15%, both the width and length of cracks near the reinforcement holes increase with the corrosion rate. At this stage, cracks near the reinforcement holes have already propagated to the cover layer, and two circumferential cracks are visible on the inner surface of the lining. As the corrosion rate further increases to 25%, longitudinal cracks parallel to the lining surface connect adjacent reinforcement holes, while radial cracks extend further along the inner surface. At this point, multiple crack planes divide the crown concrete into discrete blocks, forming a potential spalling zone.
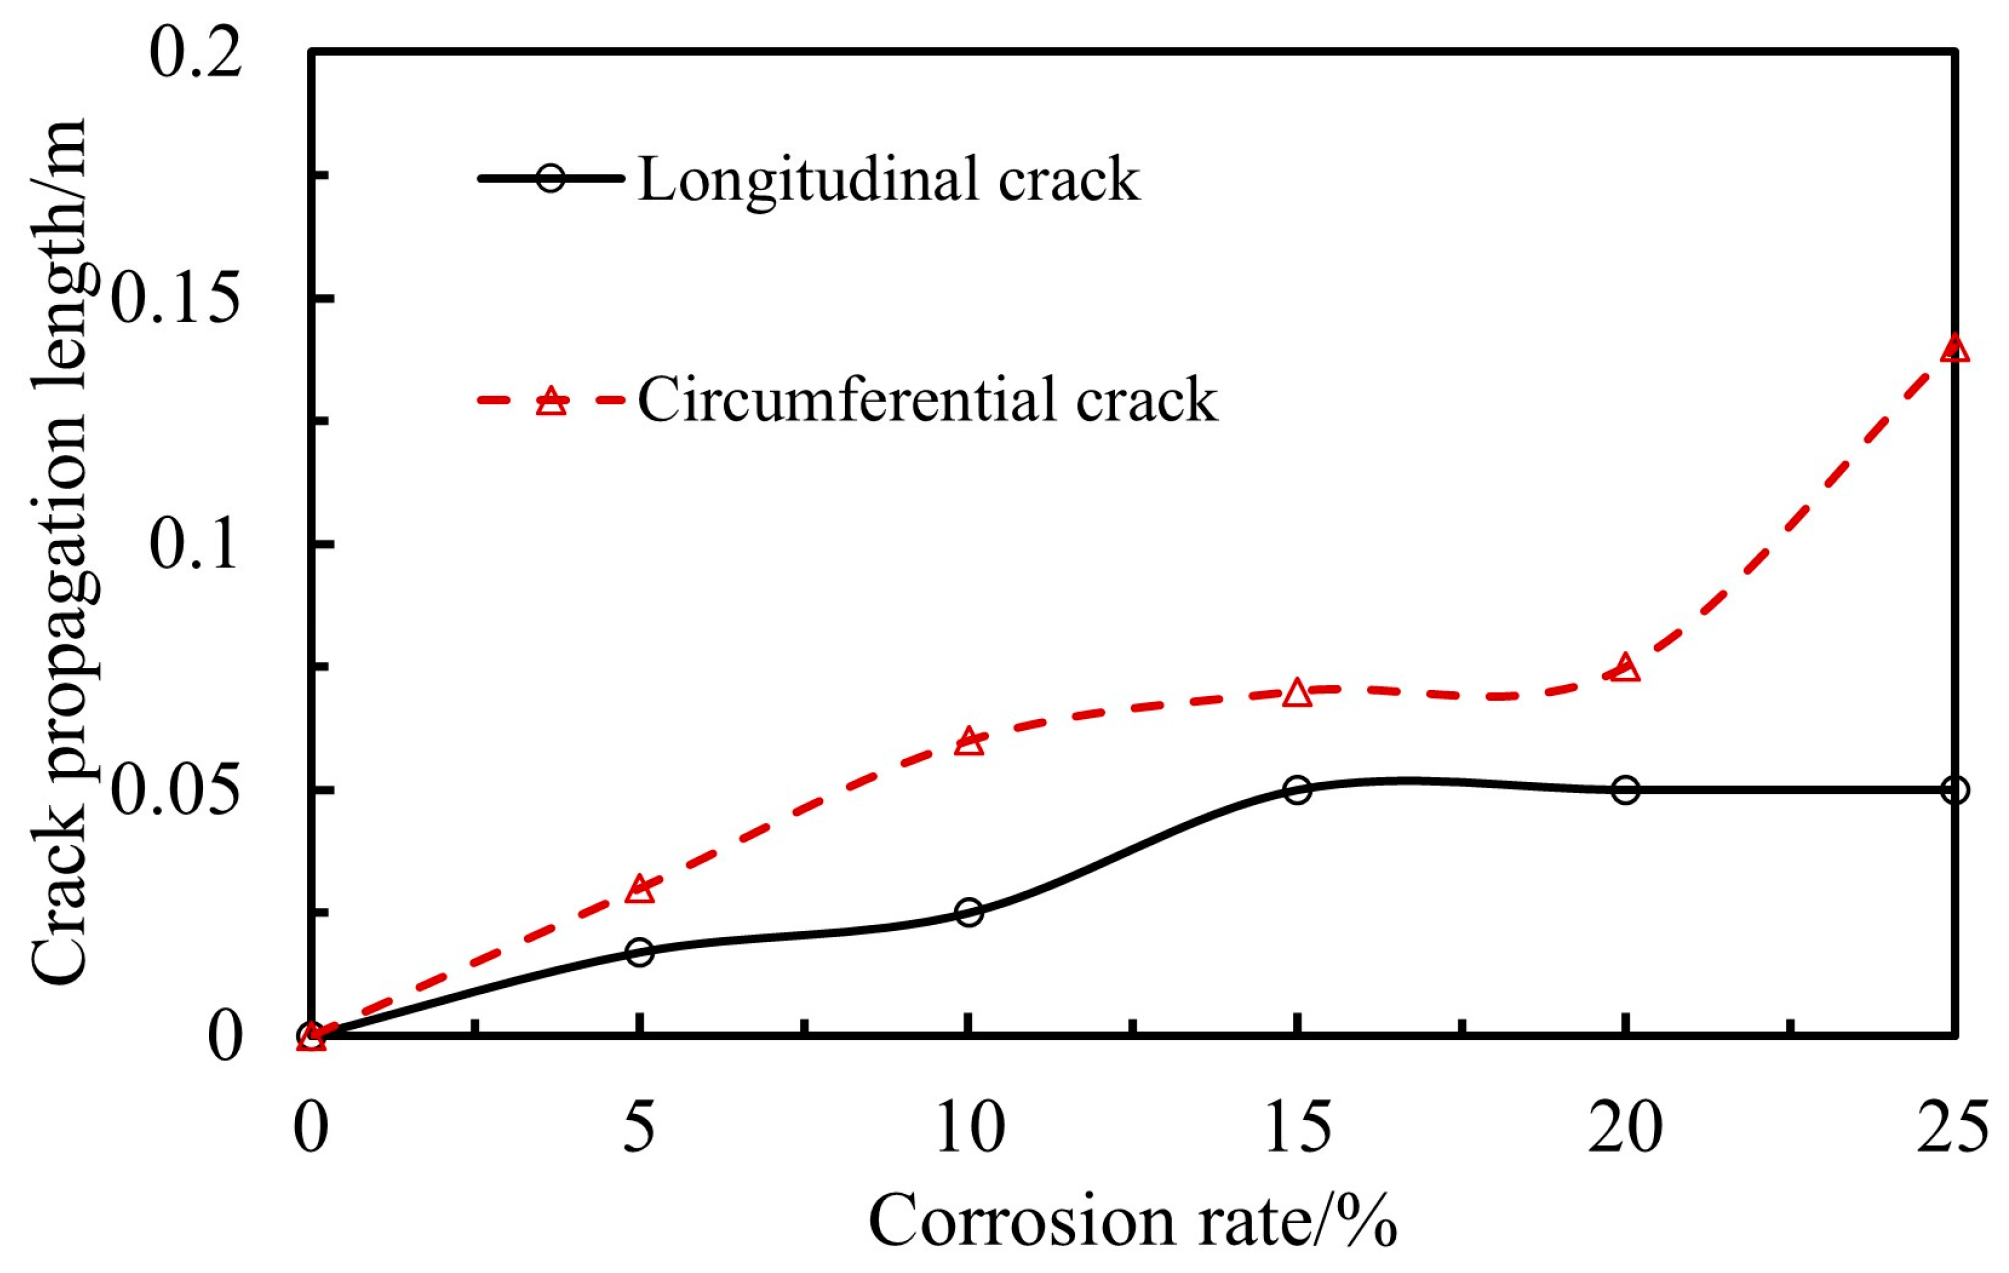
The relationships between crack propagation length in the two orientations and the reinforcement corrosion rate are shown in Figure 16. Both longitudinal and circumferential crack lengths exhibit nonlinear evolution with corrosion rate. For corrosion rates below 15%, crack propagation rates are high; when the corrosion rate exceeds 15%, the growth rate slows, as circumferential cracks have already reached the cover-layer surface and no longer develop. When the corrosion rate exceeds 20%, longitudinal cracks between adjacent reinforcement holes interconnect, causing a rapid increase in crack length until it equals the reinforcement spacing. Damage regions are mainly concentrated around the corroded reinforcement, and when adjacent reinforcements corrode simultaneously, their cracking effects superimpose.

5. Conclusions

This study investigates the multi-scale mechanical behavior of road tunnel linings under reinforcement corrosion. At the local scale, corrosion and loading tests on reinforced concrete are conducted to reveal the evolution of apparent cracking patterns and key mechanical parameters. At the tunnel scale, a validated three-dimensional refined finite element model is employed to elucidate the evolution of the structural macroscopic mechanical response under local reinforcement corrosion, and to summarize the associated crack and damage propagation patterns. The main conclusions are as follows:
(1)
Experimental results on localized concrete indicate that, for single-reinforcement corrosion, cracks propagate perpendicular to the reinforcement cross-section, with cracking on the cover-layer side occurring first. In the case of multiple-reinforcement corrosion, cracks interact, and through-cracks parallel to the cover-layer surface form simultaneously with cover-layer cracking.
(2)
The reinforcement corrosion rate and cover-layer crack width exhibit an approximately linear relationship. When the corrosion rate ranges from 10.40% to 17.62%, the crack width varies from 1.07 mm to 8.67 mm. When the corrosion rate exceeds 17.62%, concrete spalling occurs. Reinforcement corrosion reduces the load-bearing capacity and stiffness of localized concrete; for every 1% increase in corrosion rate, the load-bearing capacity decreases by approximately 4–11%, and stiffness decreases by approximately 3–17%.
(3)
When the corrosion rate of the three crown reinforcements reaches 25%, the crown deflection increases by 0.56 mm, while the deflections at the haunch and invert show no significant change, indicating that the effect of reinforcement corrosion is mainly confined to the local region. Further analysis under varying loosened earth pressures indicates that the influence of corrosion is weakly correlated with the initial deformation of the tunnel.
(4)
Localized reinforcement corrosion within the 54° crown range induces internal force redistribution in the 300–60° region of the lining, while internal forces in other regions remain largely unchanged, indicating that the influence of local reinforcement corrosion is confined to the adjacent concrete lining.
(5)
With the increase in the reinforcement corrosion rate, the flexural and axial stiffness of the structure gradually decrease and tend to stabilize when the corrosion rate reaches approximately 15%, primarily because the stiffness degradation of the concrete approaches saturation. In practical engineering, once inspection results indicate that the reinforcement corrosion rate has exceeded this critical threshold, local strengthening measures should be promptly implemented to enhance the load-bearing and crack-resistance capacity of the member, thereby preventing cover spalling or concrete detachment.
(6)
Finite element analysis shows that damage and cracks in the lining structure initiate near the reinforcement holes and then extend toward the concrete cover layer, with a pronounced longitudinal propagation trend. In the early stage, cracks mainly propagate circumferentially at a faster rate, leading to cover-layer cracking. As the reinforcement corrosion rate increases, longitudinal cracks further connect, exacerbating the risk of concrete spalling.

Author Contributions

Writing—original draft preparation, J.H. and J.F.; methodology, X.L.; formal analysis, J.H.; investigation, D.W. All authors have read and agreed to the published version of the manuscript.

Funding

This research was funded by the Zhejiang Provincial Department of Transportation (ZJXL-JTT-202222) and the National Natural Science Foundation of China (Grant No. 52278409).

Data Availability Statement

The data in figures and tables used to support the findings of this study are included herein.

Conflicts of Interest

Author Dexing Wu is employed by Zhejiang Shuzhi Jiaoyuan Technology Co., Ltd. Author Jiahui Fu is employed by Tongyan Civil Engineering Technology Co., Ltd. The remaining authors declare that the research was conducted in the absence of any commercial or financial relationships that could be construed as potential conflicts of interest.

References

  1. Tonon, F. Sequential Excavation, NATM and ADECO: What They Have in Common and How They Differ. Tunn. Undergr. Space Technol. 2010, 25, 245–265. [Google Scholar] [CrossRef]
  2. Lin, Z.; Feng, W.; Jin, K.; Chen, X.; Yang, H.; Hu, Y. Evolution of Cracking Damage and Load-Bearing Performance of in-Service Tunnel Linings with Cracks. Theor. Appl. Fract. Mech. 2025, 138, 104897. [Google Scholar] [CrossRef]
  3. Liu, C.; Zhang, D.; Zhang, S. Characteristics and Treatment Measures of Lining Damage: A Case Study on a Mountain Tunnel. Eng. Fail. Anal. 2021, 128, 105595. [Google Scholar] [CrossRef]
  4. Zhiqiang, Z.; Mansoor, Y.A. Evaluating the Strength of Corroded Tunnel Lining under Limiting Corrosion Conditions. Tunn. Undergr. Space Technol. 2013, 38, 464–475. [Google Scholar] [CrossRef]
  5. Zhang, X.; Li, M.; Tang, L.; Memon, S.A.; Ma, G.; Xing, F.; Sun, H. Corrosion Induced Stress Field and Cracking Time of Reinforced Concrete with Initial Defects: Analytical Modeling and Experimental Investigation. Corros. Sci. 2017, 120, 158–170. [Google Scholar] [CrossRef]
  6. Erarslan, N. Analysing Mixed Mode (I–II) Fracturing of Concrete Discs Including Chevron and Straight-through Notch Cracks. Int. J. Solids Struct. 2019, 167, 79–92. [Google Scholar] [CrossRef]
  7. Tsuno, K.; Kishida, K. Evaluation of Spalling of Concrete Pieces from Tunnel Lining Employing Joint Shear Model. Tunn. Undergr. Space Technol. 2020, 103, 103456. [Google Scholar] [CrossRef]
  8. Yang, H.; Wang, Z.; Chen, X.; Lin, Z.; Li, Q. A Test on Fire-Induced Damage of Concrete with Multiple Parameters Analysis—Based on Tunnel Linings of China. Structures 2024, 70, 107664. [Google Scholar] [CrossRef]
  9. Brindha, U.; Maheswaran, J.; Chellapandian, M.; Arunachelam, N. Quantitative Assessment of Strengthening Strategies and Design Recommendations for the Repair of Corrosion-Damaged Reinforced Concrete Members. Buildings 2023, 13, 1080. [Google Scholar] [CrossRef]
  10. Wang, Q.; Wang, Z.; Li, C.; Qiao, X.; Guan, H.; Zhou, Z.; Song, D. Research Progress in Corrosion Behavior and Anti-Corrosion Methods of Steel Rebar in Concrete. Metals 2024, 14, 862. [Google Scholar] [CrossRef]
  11. Ahmad, S.; Al-Huri, M.A.; Al-Osta, M.A.; Maslehuddin, M.; Al-Gadhib, A.H. An Experimental Approach to Evaluate the Effect of Reinforcement Corrosion on Flexural Performance of RC Beams. Buildings 2022, 12, 2222. [Google Scholar] [CrossRef]
  12. Van Nguyen, C.; Hieu Bui, Q.; Lambert, P. Experimental and Numerical Evaluation of the Structural Performance of Corroded Reinforced Concrete Beams under Different Corrosion Schemes. Structures 2022, 45, 2318–2331. [Google Scholar] [CrossRef]
  13. Yang, J.; Haghani, R.; Blanksvärd, T.; Lundgren, K. Experimental Study of FRP-Strengthened Concrete Beams with Corroded Reinforcement. Constr. Build. Mater. 2021, 301, 124076. [Google Scholar] [CrossRef]
  14. Do-Dai, T.; Chu-Van, T.; Tran, D.T.; Nassif, A.Y.; Nguyen-Minh, L. Efficacy of CFRP/BFRP Laminates in Flexurally Strengthening of Concrete Beams with Corroded Reinforcement. J. Build. Eng. 2022, 53, 104606. [Google Scholar] [CrossRef]
  15. Yang, Z.; Ma, J.; Li, B. Investigating the Impact of Corrosion on Behavior and Failure Modes of Reinforced Concrete Slabs: An Experimental and Analytical Study. Eng. Struct. 2024, 321, 118983. [Google Scholar] [CrossRef]
  16. Li, M.; Shen, D.; Yang, Q.; Cao, X.; Huang, C.; Cui, Z.; Qi, Y. Effect of Reinforcement Corrosion on the Seismic Performance of Reinforced Concrete Shear Walls. Constr. Build. Mater. 2023, 377, 130977. [Google Scholar] [CrossRef]
  17. Guzmán, S.; Gálvez, J.C.; Sancho, J.M. Modelling of Corrosion-Induced Cover Cracking in Reinforced Concrete by an Embedded Cohesive Crack Finite Element. Eng. Fract. Mech. 2012, 93, 92–107. [Google Scholar] [CrossRef]
  18. German, M.; Pamin, J. Cracking in Reinforced Concrete Cross-Sections Due to Non-Uniformly Distributed Corrosion. Materials 2023, 16, 6331. [Google Scholar] [CrossRef] [PubMed]
  19. Xu, W.; Zhang, C.; Li, Y. Simulation and Analysis of Rust Expansion Cracking of Reinforced Concrete. Constr. Build. Mater. 2024, 426, 136199. [Google Scholar] [CrossRef]
  20. Liu, C.; Peng, Z.; Cui, J.; Huang, X.; Li, Y.; Chen, W. Development of Crack and Damage in Shield Tunnel Lining under Seismic Loading: Refined 3D Finite Element Modeling and Analyses. Thin. Walled Struct. 2023, 185, 110647. [Google Scholar] [CrossRef]
  21. Lu, X.; Liu, Y.; Hou, X.; Chen, C.; Gao, R. Numerical Simulation of Mechanical Characteristics and Safety Performance for Pre-Cracked Tunnel Lining with the Extended Finite Element Method. Buildings 2024, 14, 123. [Google Scholar] [CrossRef]
  22. Liu, S.; Shi, Y.; Sun, R.; Yang, J. Damage Behavior and Maintenance Design of Tunnel Lining Based on Numerical Evaluation. Eng. Fail. Anal. 2020, 109, 104209. [Google Scholar] [CrossRef]
  23. Pan, T. Continuous Damage of Concrete Structures Due to Reinforcement Corrosion: A Micromechanical and Multi-Physics Based Analysis. J. Build. Eng. 2024, 95, 110139. [Google Scholar] [CrossRef]
  24. GB 50010-2010; Code for Design of Concrete Structures. China Architecture & Building Press: Beijing, China, 2010.
  25. Liu, X.; Liu, H.; Yang, L.; Li, Y.; Zhu, H.; Liu, G.; Gao, D. Corrosion Behavior of Steel Bars Embedded in Steel Fiber Reinforced Concrete (SFRC) under the Condition of Electro-Accelerated Chloride Attack. J. Build. Eng. 2025, 106, 112701. [Google Scholar] [CrossRef]
  26. Du, F.; Jin, Z.; Xiong, C.; Yu, Y.; Fan, J. Effects of Transverse Crack on Chloride Ions Diffusion and Steel Bars Corrosion Behavior in Concrete under Electric Acceleration. Materials 2019, 12, 2481. [Google Scholar] [CrossRef] [PubMed]
  27. Santana, P.F.M.; Evangelista Junior, F.; Oliveira, M.H. Assessment of Reinforcement Steel–Concrete Interface Contact in Pullout and Beam Bending Tests Using Test-Fitted Cohesive Zone Parameters. Buildings 2024, 14, 2981. [Google Scholar] [CrossRef]
  28. Li, Z.; Liu, X.; Lai, H.; Yang, Z.; Wang, B. Detailed Damage Mechanism of Deformed Shield Tunnel Linings Reinforced by Steel Plates. Eng. Fail. Anal. 2023, 143, 106850. [Google Scholar] [CrossRef]
  29. Li, Z.; Liu, X.; Wang, J. Elaborate Numerical Investigation on Surcharge-Induced Mechanical Responses and Strengthening Effects of Single-Line Shield Tunnels with Typical Cross-Sections. Tunn. Undergr. Space Technol. 2025, 156, 106237. [Google Scholar] [CrossRef]
  30. Yuan, Y.; Ji, Y. Modeling Corroded Section Configuration of Steel Bar in Concrete Structure. Constr. Build. Mater. 2009, 23, 2461–2466. [Google Scholar] [CrossRef]
  31. Zahid, H.F.; Jiradilok, P.; Singh Kuntal, V.; Nagai, K. Investigation of the Effects of Multiple and Multi-Directional Reinforcement on Corrosion-Induced Concrete Cracking Pattern. Constr. Build. Mater. 2021, 283, 122594. [Google Scholar] [CrossRef]
  32. Guo, W.; Feng, K.; Zhou, Y.; Lu, X.; Qi, M.; He, C.; Xiao, M. Experimental and Numerical Investigation on the Shear Behavior and Damage Mechanism of Segmental Joint under Compression-Shear Load. Tunn. Undergr. Space Technol. 2023, 139, 105238. [Google Scholar] [CrossRef]
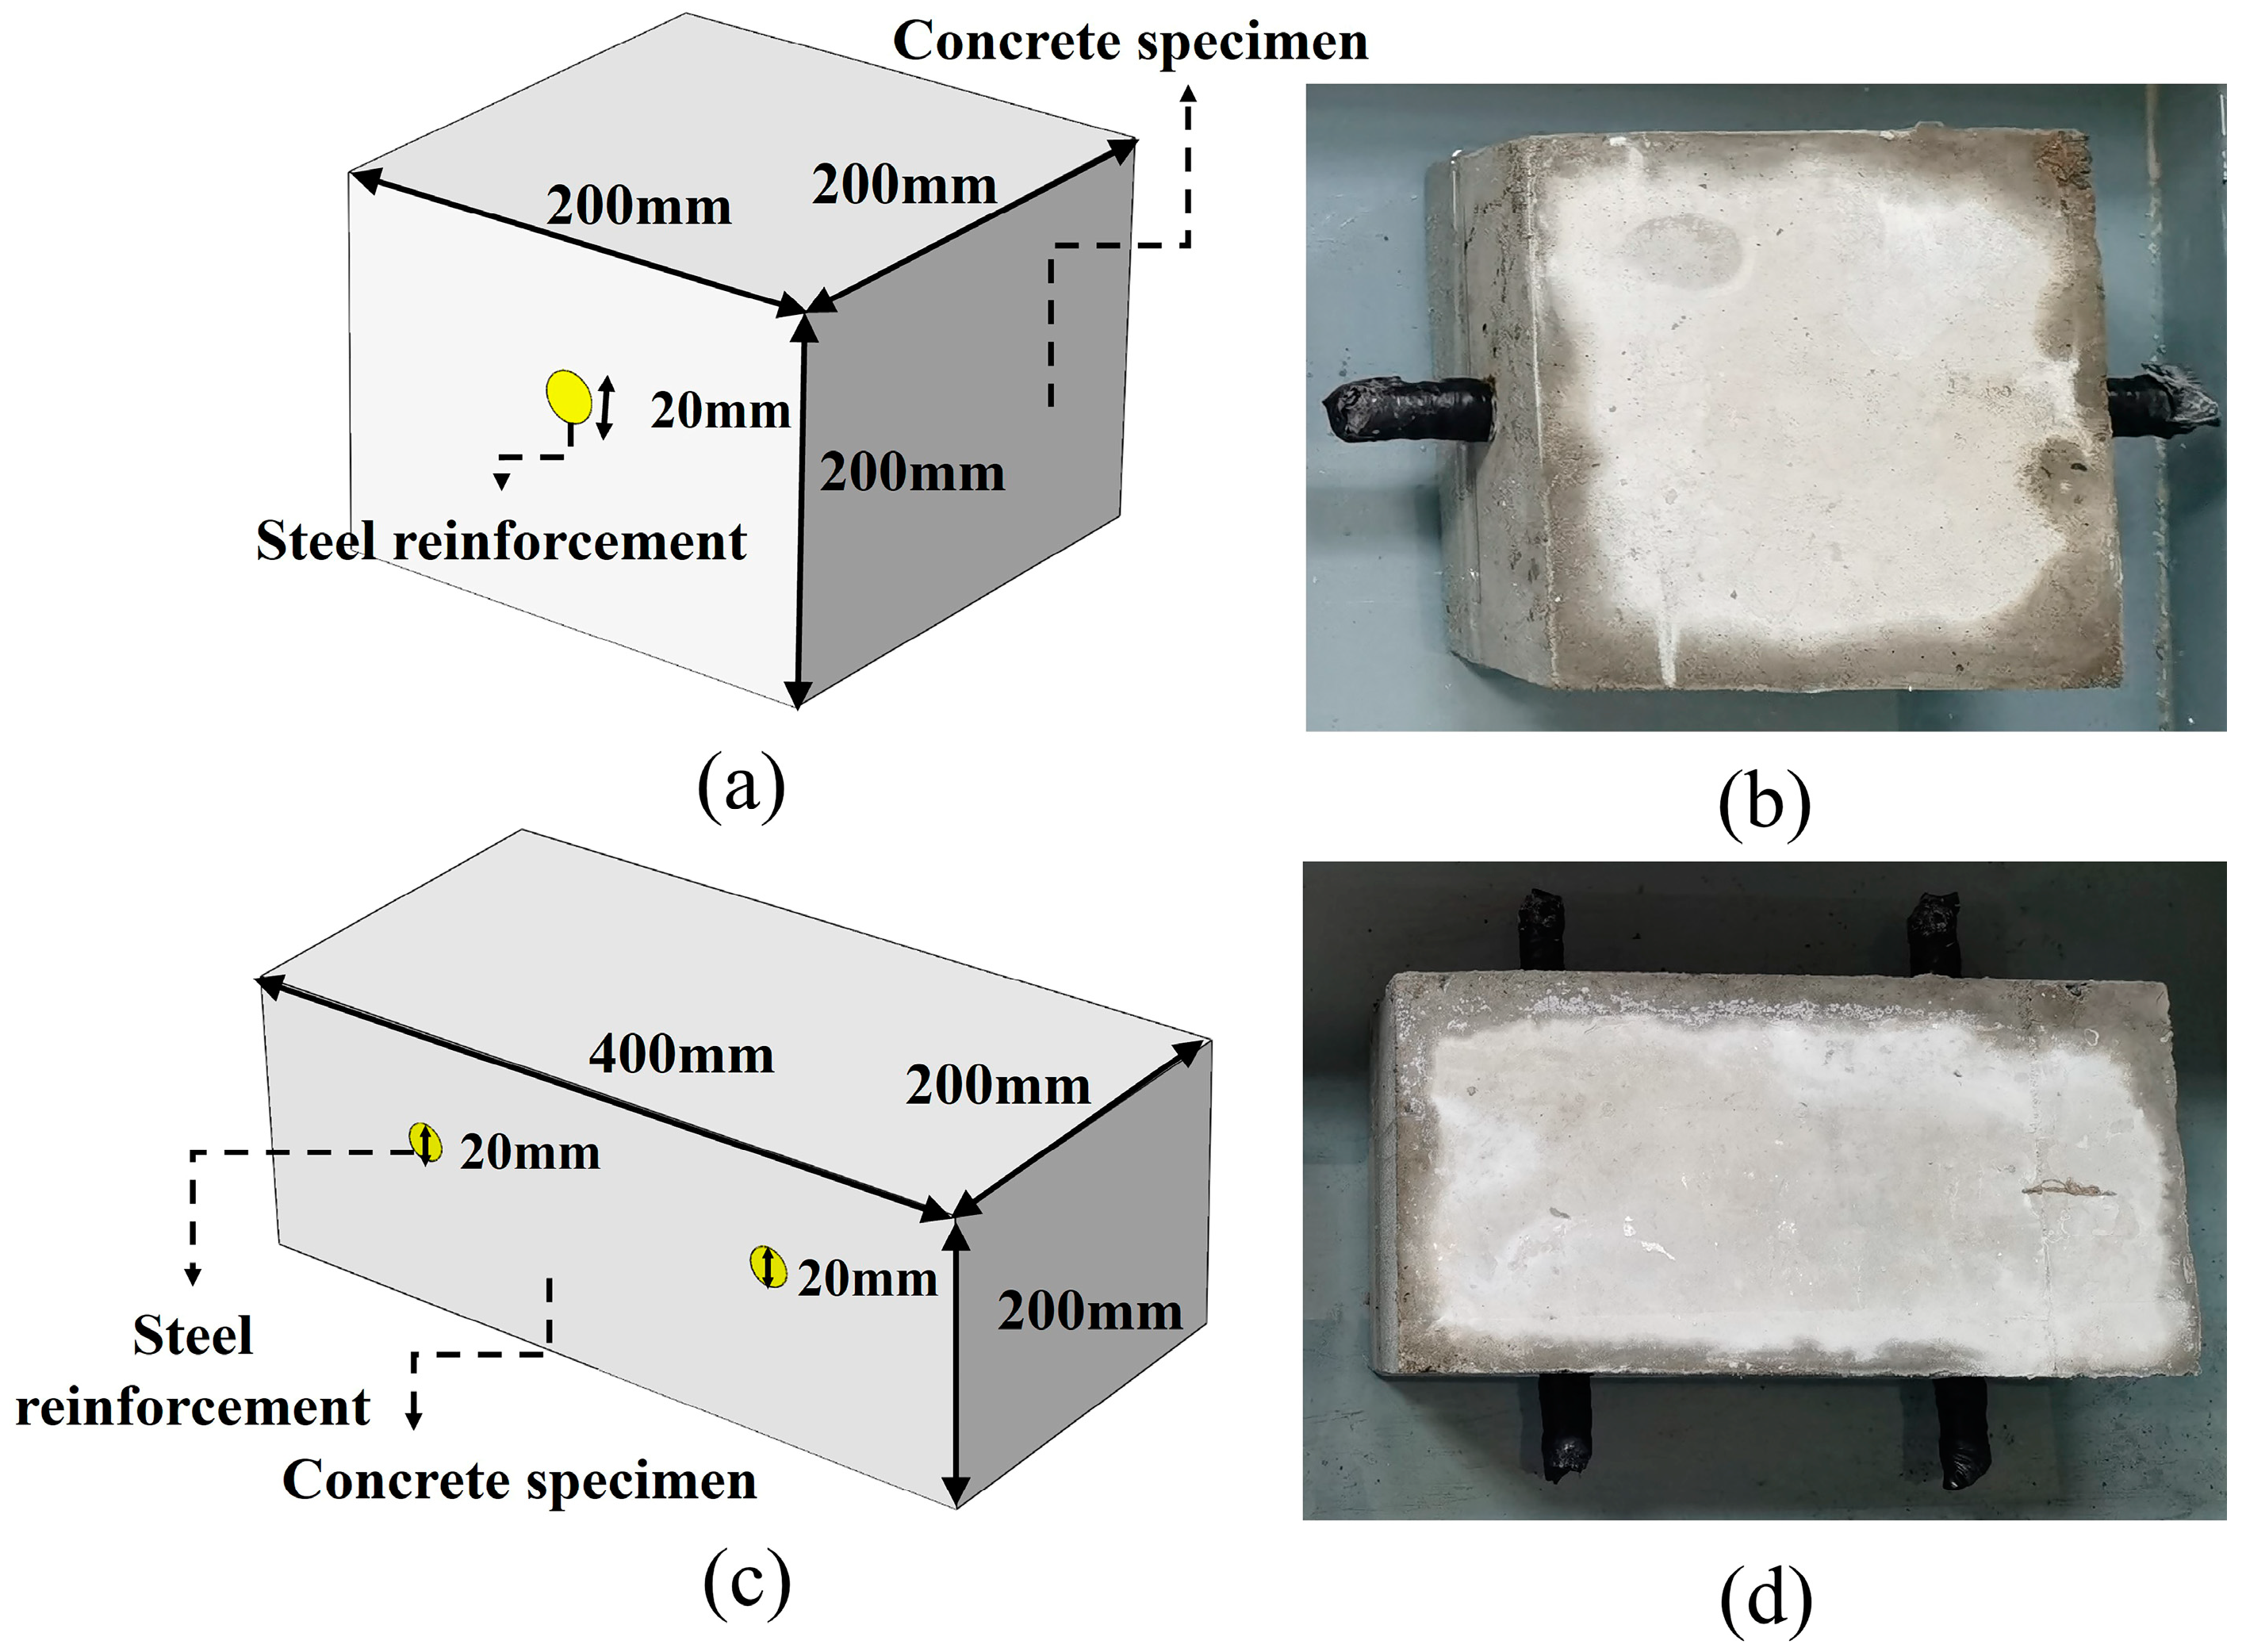
Figure 1. Test specimens: (a) single-reinforcement specimen dimensions; (b) actual photograph of single-reinforcement specimen; (c) double-reinforcement specimen dimensions; (d) actual photograph of double-reinforcement specimen.
Buildings 15 03723 g001
Figure 2. Test setup: (a) principle of electrochemical accelerated corrosion; (b) photograph of the apparatus.
Buildings 15 03723 g002
Figure 3. Test loading: (a) photograph of the loading device; (b) schematic of the loading principle.
Buildings 15 03723 g003
Figure 4. Test phenomena: (a) cover-layer side; (b) cross-section.
Buildings 15 03723 g004
Figure 5. Crack widths and specimen photographs under different corrosion rates.
Buildings 15 03723 g005
Figure 6. Relationship between reinforcement corrosion rate and load-bearing capacity and stiffness.
Buildings 15 03723 g006
Figure 7. Localized concrete finite element model.
Buildings 15 03723 g007
Figure 8. Comparison of crack propagation between local concrete tests and simulations.
Buildings 15 03723 g008
Figure 9. Finite element model of road tunnel lining: (a) overview of the whole model; (b) details of reinforcement modeling; (c) reinforcement–concrete cohesive contact model; (d) uniform expansion model of reinforcement.
Buildings 15 03723 g009
Figure 10. Overview of the model test: (a) boundary conditions and loading scheme; (b) fabrication process.
Buildings 15 03723 g010
Figure 11. Comparison between three-dimensional refined numerical simulation and test results: (a) crown deflection curve; (b) structural damage.
Buildings 15 03723 g011
Figure 12. Additional deflection of the lining induced by reinforcement corrosion.
Buildings 15 03723 g012
Figure 13. Structural internal force variations induced by reinforcement corrosion: (a) bending moment; (b) axial force.
Buildings 15 03723 g013
Figure 14. Tensile damage of concrete under different reinforcement corrosion rates: (a) 5%; (b) 15%; (c) 25%.
Buildings 15 03723 g014
Figure 15. Crack propagation of concrete under different reinforcement corrosion rates: (a) 5%; (b) 15%; (c) 25%.
Buildings 15 03723 g015
Figure 16. Relationship between corrosion rate and crack propagation length.
Buildings 15 03723 g016
Table 1. Cohesive contact parameters.
σ n u /MPa σ s u /MPa K 0 , n /MPa/mm K 0 , s /MPa/mm G C , n /N/m G C , S /N/m
1.9611.52117711.77589034,675
Table 2. Material parameters.
MaterialYoung’s Modulus E/GPaPoisson’s Ratio  ν Yield Strength  f y /MPaCompressive Strength  f c , u /MPaTensile Strength  f t , u /MPaFracture Energy  G /N/m
Concrete300.2-20.12.0180
Reinforcement2060.3400---
Table 3. Design of similarity ratios for the test.
Physical Quantity Geometric   Size   C L Elastic   Modulus   C L E Stress   C σ Strain   C ε Strength   C R Resistance   Coefficient C k Uniform   Load   C q
Similarity ratio1:101:111:7.21:5.11:7.211:7.2
Table 4. Additional crown deflection induced by reinforcement corrosion under different loosened earth pressures.
Loosened Earth Pressure/kPaAdditional Crown Deflection Induced by Reinforcement Corrosion/mm
200.56
400.63
Disclaimer/Publisher’s Note: The statements, opinions and data contained in all publications are solely those of the individual author(s) and contributor(s) and not of MDPI and/or the editor(s). MDPI and/or the editor(s) disclaim responsibility for any injury to people or property resulting from any ideas, methods, instructions or products referred to in the content.