Article

Probabilistic Model Optimization and Safety Assessment Methods for Existing Masonry Structures

1
School of Civil Engineering, Harbin Institute of Technology, Harbin 150090, China
2
China Academy of Building Research, Beijing 100013, China
3
C+E Center for Engineering Research Test and Appraisal Co., Ltd., Beijing 100142, China
4
School of Civil Engineering, Tianjin Chengjian University, Tianjin 300384, China
*
Authors to whom correspondence should be addressed.
Buildings 2025, 15(20), 3716; https://doi.org/10.3390/buildings15203716
Submission received: 17 September 2025 / Revised: 14 October 2025 / Accepted: 14 October 2025 / Published: 15 October 2025

Abstract

The practice of the assessment of the safety of existing masonry structures is related to the safety of people’s lives and property. However, the current assessment method, described in “GB50292-2015 Standard for appraisal of reliability of civil buildings”, fails to fully consider the uncertainty-related characteristics of the structures, which easily leads to unreasonable assessment results. This paper proposes a method of safety assessment for existing masonry structures that considers the updating of resistance and load probability models and different member weights. First, based on the resistance probability model measured in the field, the resistance model in the current code (GB50292-2015) is updated through Bayesian theory. Then, the variable load model is updated for different subsequent working years through the equal-exceeding-probability method. Finally, the safety grade of the existing masonry structure is obtained by the analytic hierarchy process, using the affiliation set as the assessment index. This method of analysis solves the problem relating to the “jump” in the middle of the break-point of the traditional safety grading standard. It also fully considers the uncertainty-related characteristics of the existing structure, and its evaluation results align with the existing structure’s actual situation, which is critical to the assessment of the safety of the existing masonry structure.

1. Introduction

Existing masonry structures are a considerable presence in the field of construction engineering. Due to the influences of time and environment, the material performance is degraded, resulting in lower levels of structural safety and reliability, which affects the safety of people’s lives and property. The structural safety assessment of existing masonry structures is important in urban renewal. At present, the assessment of the safety of existing masonry structures in China is mainly based on the “GB 50292-2015 Standard for appraisal of reliability of civil buildings” [1], which characterizes the safety level of the members through the coefficient R / ( γ 0 S ) , then describes the safety level of the subunit through the percentage of the safety level of the subunit’s different members, and finally qualifies the safety level of the identified unit through the subunit’s lowest assessment level. However, the current safety assessment method does not consider the weights of different types of members with respect to the structural safety, nor does it take into account the changes in the probabilistic models of the resistance and loading of the existing structure, which leads to assessment results that are on the conservative side [2]. For example, the load probability model in current codes does not account for the structure’s subsequent service life, nor does it specify investigations into the actual load distribution on the structure. The resistance model refers only to measured samples of in situ material strength, disregarding the effects of geometric characteristics and computational uncertainty, as well as the limitations of the sample size. Therefore, the current assessment method merely serves as a compliance check which determines whether existing building structures meet design specifications, and fails to adequately account for the actual conditions of existing buildings. There is an urgent need for the study of the safety assessment methods applicable to existing masonry structures.
The measurement of structural safety has gradually changed from member reliability to structural-system reliability. Currently, the primary research on structural-system safety includes three aspects: (i) finding and constructing the main failure modes of structural systems; (ii) calculating the mode failure probability based on the limit state equations of the failure modes; and (iii) calculating the failure probability of the system from the mode failure probability of the main failure modes [3]. Among the previous works on the topic, Freudenthal [4] has pioneered the analogy of structural systems to series systems. Based on this, Hong [5] proposed the probabilistic network assessment technique in 1975. With Ditlevesen’s establishment of a narrow-bound formula for the reliability of structural systems in 1979 [6], the paradigm of overall structural reliability analysis based on the series–parallel system model took shape. Subsequently, failure mode screening techniques and equivalent system modeling methods were developed to provide a theoretical basis for the overall structural reliability analysis [7,8,9,10,11,12].
At present, scholars within China and abroad have attempted to introduce fuzzy mathematical theory [13,14] and the analytic hierarchy process (AHP) into the reliability assessment of existing building structures [15,16,17,18,19,20,21,22,23,24,25]. On this basis, Zheng [26] combined the affiliation rating method and the AHP to propose a system reliability-assessment method for existing frame structures. However, the AHP depends on the weights of substructures and does not apply to high-rise and super-high-rise buildings due to the large numbers of members, which decreases the weight coefficients of the underlying members. At the same time, the above analysis methods cannot reflect the real physical development of the structure from linear to nonlinear; for this reason, Li Jie et al. [27,28,29,30,31,32,33,34,35], proposed the probability density evolution theory based on the principle of probability conservation, and at the same time, utilizing the principle of equivalent extreme value, solved the problem of the combined explosion of the traditional structural overall reliability analysis. The chief difficulty in the overall reliability analysis of complex structural systems is solved by synthesizing the theory of probability density evolution and the principle of equivalent extreme-value events. The reliability assessment described above provides a crucial basis for structural rehabilitation [36].
Although a wealth of research achievements have been made relating to the assessment of the safety of structural systems, in practical application, practical assessment methods, fuzzy assessment methods, and physical-synthesis assessment methods have their advantages and disadvantages. There is still a lack of simple, reasonable, and feasible reliability-assessment methods for existing structural systems. At the same time, the reliability-assessment method associated with existing masonry building systems under the current code is based on the reliability assessments of elements; ignores the influences of the weights of element types, locations, importance, and other factors; and does not take into account the characteristics of the existing structural loading and resistance uncertainty. Therefore, the assessment methodology of the current code needs to be updated to be congruent with the actual characteristics of existing building structures.
In this paper, firstly, with respect to the resistance probability model derived from small samples of field measurements of existing structures, the resistance model in the current code is updated through the Bayesian method, to make it conform to the actual characteristics of the existing structures and to overcome the disadvantage of the significant errors associated with the small-sample probability model. Then, the variable load model, which results in different determinations of subsequent working years, is updated through the equal-exceeding-probability method. Based on the updated model, the reliability and affiliations of the members are calculated, and the reliability of the members is characterized by the affiliation set. Finally, the overall reliability of the existing structure is evaluated using the AHP, taking into account the differences in the weights of the members of the existing structure. Therefore, the main innovations of this paper are as follows: (1) a method for modifying the resistance and load probability models of existing structures is proposed; (2) safety assessment criteria for existing structures based on reliability indices and affiliation sets are advanced; and (3) a methodological framework for the overall reliability assessments of existing structures is established. The findings provide significant guidance for the assessment of the safety of existing structures and offer a theoretical basis for revising subsequent relevant standards.

2. Update of the Member-Resistance Model for Existing Masonry Structures

2.1. On-Site Measured Material Strength Models

Currently, the inspection of existing masonry structures generally utilizes non-destructive testing. The rebound method is one of the most commonly used non-destructive testing methods, and is widely used in the engineering inspections of existing masonry structures. According to “GB/T 50315-2011 Technical Standard for On-site Inspection of Masonry Engineering” [37], when using the rebound method to determine the strength of masonry materials, it is necessary to use the rebound method to determine the brick strength (f1) and the mortar strength (f2), and then calculate the average value of the masonry material strength (fm) according to Equation (1):
f m = k 1 f 1 α ( 1 + 0.07 f 2 ) k 2
where f1 is the brick compressive strength, f2 is the bond mortar compressive strength, α = 0.5, k1 = 0.78, and when f2 < 1, k2 = 0.6 + 0.4f2.
If the mean and variance of the brick strength (f1) and the mean and variance of the mortar strength (f2) are obtained from the actual measurements, the mean and variance of the masonry material strength (f) can be obtained by the Taylor expansion method. If the function Z = g ( x 1 , x 2 , , x n ) is assumed, the mean and variance can be expressed by Equations (2) and (3), respectively:
μ Z g ( μ ) + 1 2 i = 1 n j = 1 n 2 g X i X i μ C o v ( X i , X j )
where μ is a vector of variable means.
σ Z 2 i = 1 n j = 1 n g X i μ g X i μ C o v ( X i , X j )
According to “GB 50003-2011 Code for the Design of Masonry Structures” [38], the masonry strength standard value(fk) should have a 95% guarantee rate, i.e., fk = fm − 1.645σ, so the mean coefficient of the measured material strength κ f = f m / f k . From Equations (1)–(3), the mean coefficient ( κ f ) and variation coefficient ( δ f ) of the measured masonry strength can be obtained. Thus, the uncertainty-related characteristics κ f * and δ f * of the measured material properties can be obtained.

2.2. Resistance Model Update

Due to the limited number of measured samples, measured probability distribution parameters generally do not accurately reflect the actual situation of the structure. However, the prior probability model and distribution parameters are known during the structural design process, so the prior probability model can be updated based on the measured probability model, and a posterior probability distribution that is congruent with the characteristics of the existing building can be obtained through the Bayesian equation, Equation (4).
π ( θ | x ) = π ( θ ) p ( x | θ ) + π ( θ ) p ( x | θ ) d θ
where π ( θ ) is the prior probability density function; p ( x | θ ) is the conditional density function (i.e., the likelihood function).
If the prior probability distribution of a random variable is normal N ( μ , σ 2 ) , the likelihood function L(θ) is normal N ( μ , σ 2 ) and the posterior distribution is also normal N ( μ , σ 2 ) ; the mean μ and variance σ are determined as follows:
μ = μ σ 2 + μ σ 2 σ 2 + σ 2
σ 2 = ( σ σ ) 2 σ 2 + σ 2
If the mean coefficient and coefficient of variation of the prior probability distribution of material performance uncertainty are κ f and δ f , respectively, then the mean coefficient and coefficient of variation of the posterior probability distribution of the masonry material performance uncertainty-related characteristics, as updated by the Bayesian method, are κ f and δ f , respectively. According to “GBJ 68-84 Unified Standard for Reliability Design of Building Structures” [39], the uncertainty-related characteristics of the resistance consist of computational model uncertainty, the uncertainty related to geometric characteristics, and material performance uncertainty. Assuming that the uncertainty of the computational model and the uncertainty associated with the geometric characteristics of the resistance of the existing masonry structure follow the a priori distribution characteristics, the updated mean coefficient of resistance and the coefficient of variation are as follows.
κ R = κ P κ a κ f "
where κR is the updated mean coefficient of resistance, κP is the mean coefficient of geometric characteristics uncertainty, κa is the mean coefficient of computational model uncertainty, and κ f is the mean coefficient of material performance uncertainty updated by the Bayesian method.
δ R = δ P 2 + δ a 2 + δ f 2
where δR is the updated variation coefficient of resistance, δP is the variation coefficient of geometric characteristics uncertainty, δa is the variation coefficient of computational model uncertainty, and δ f is the variation coefficient of material performance uncertainty updated by the Bayesian method.
The a priori distribution parameters of resistance uncertainty for brick masonry structures are shown in Table 1, and the a posteriori distribution parameters of resistance can be obtained through Equations (1)–(8).

2.3. Load Model Update

A variable load obeys the Gumbel distribution, and the distribution characteristics of the variable load under different subsequent working-life conditions can be obtained by the equal-exceeding-probability method [40], as shown in Equation (9).
F Q   T ( x ) = [ F Q i ( x ) ] T T m
where a is the probability distribution of loads for the subsequent working life T′; b is the probability distribution model of loads at any point in time, as shown in Equation (10); T is the design working life; and m is the number of times the maximum value of the load occurs during the design reference period.
F Q i ( x ) = exp exp x θ α
where α = 6 σ / π θ = µζα µ is the mean, σ is the standard deviation, and ζ is Euler’s constant ζ = 0.5772.
From Equations (9) and (10), the probability distribution parameters for variable loads with different subsequent working years can be obtained, as shown in Table 2. The permanent loads follow a normal distribution and do not consider the effects of subsequent working years.

3. Reliability Assessments of Existing Masonry Structural Systems

3.1. Affiliation Set

The standard “GB 50068-2018 Unified Standard for Reliability Design of Building Structures” [41] specifies the safety grading standards for existing masonry components with a safety grade of Grade II, as well as the corresponding target reliability indices, as shown in Table 3. Although using the member’s reliability index in order to rate existing masonry members is more accurate, there is the problem of sudden changes in the rating near the boundary region. For example, although β = 3.1999 and β = 3.2001 are very close, they span two safety levels. The problem of sudden rating changes in the boundary region can be solved by the affiliation rating method. The affiliation functions of the au level, bu level, cu level, and du level are shown in Equations (11)–(14), respectively, and their function images are as shown in Figure 1. The affiliation set μ x = { μ a ( x ) , μ b ( x ) , μ c ( x ) , μ d ( x ) } of the members can be obtained from the affiliation function.
The affiliation function for the au level is
μ a ( x ) = 1 x 1 < x 0.5 + 0.5 sin 2 π x 1 x 2 x 3 x 1 + x 2 4 x 1 + x 2 2 < x x 1 0 x x 1 + x 2 2
The affiliation function for the bu level is
μ b ( x ) = 0 x 1 < x 0.5 0.5 sin 2 π x 1 x 2 x 3 x 1 + x 2 4 x 1 + x 2 2 < x x 1 0.5 + 0.5 sin 2 π x 1 x 3 x x 1 + x 3 + 2 x 2 4 x 2 + x 3 2 < x x 1 + x 2 2 0 x x 2 + x 3 2
The affiliation function for the cu level is
μ c ( x ) = 0 x 1 + x 2 2 < x 0.5 0.5 sin 2 π x 1 x 2 x x 1 + x 3 + 2 x 2 4 x 2 + x 3 2 < x x 1 + x 2 2 0.5 + 0.5 sin 2 π x 2 x 3 x 3 x 3 + x 2 4 x 3 < x x 2 + x 3 2 0 x x 3
The affiliation function for the du level is
μ d ( x ) = 1 x x 3 0.5 0.5 sin 2 π x 2 x 3 x 3 x 3 + x 2 4 x 3 < x x 2 + x 3 2 0 x 2 + x 3 2 < x
When the member reliability index is used as the independent variable, x1, x2, and x3, when corresponding to masonry members with structural safety class II, can be considered to be 3.7, 3.45, and 3.2, respectively. In other words, if the member reliability indices are β1 = 3.3 and β2 = 3.4, the corresponding affiliation sets are [0, 0, 0.9045, 0.0955] and [0, 0.1744, 0.8256, 0], respectively. The first-order reliability method (FORM) can calculate the reliability indices for existing masonry elements. The member’s limit state function is shown in Equation (15).
Z = R S G S Q
where R is the resistance, SG is the permanent load, and SQ is the variable load.

3.2. Analytic Hierarchy Process (AHP)

3.2.1. Hierarchical Recursive

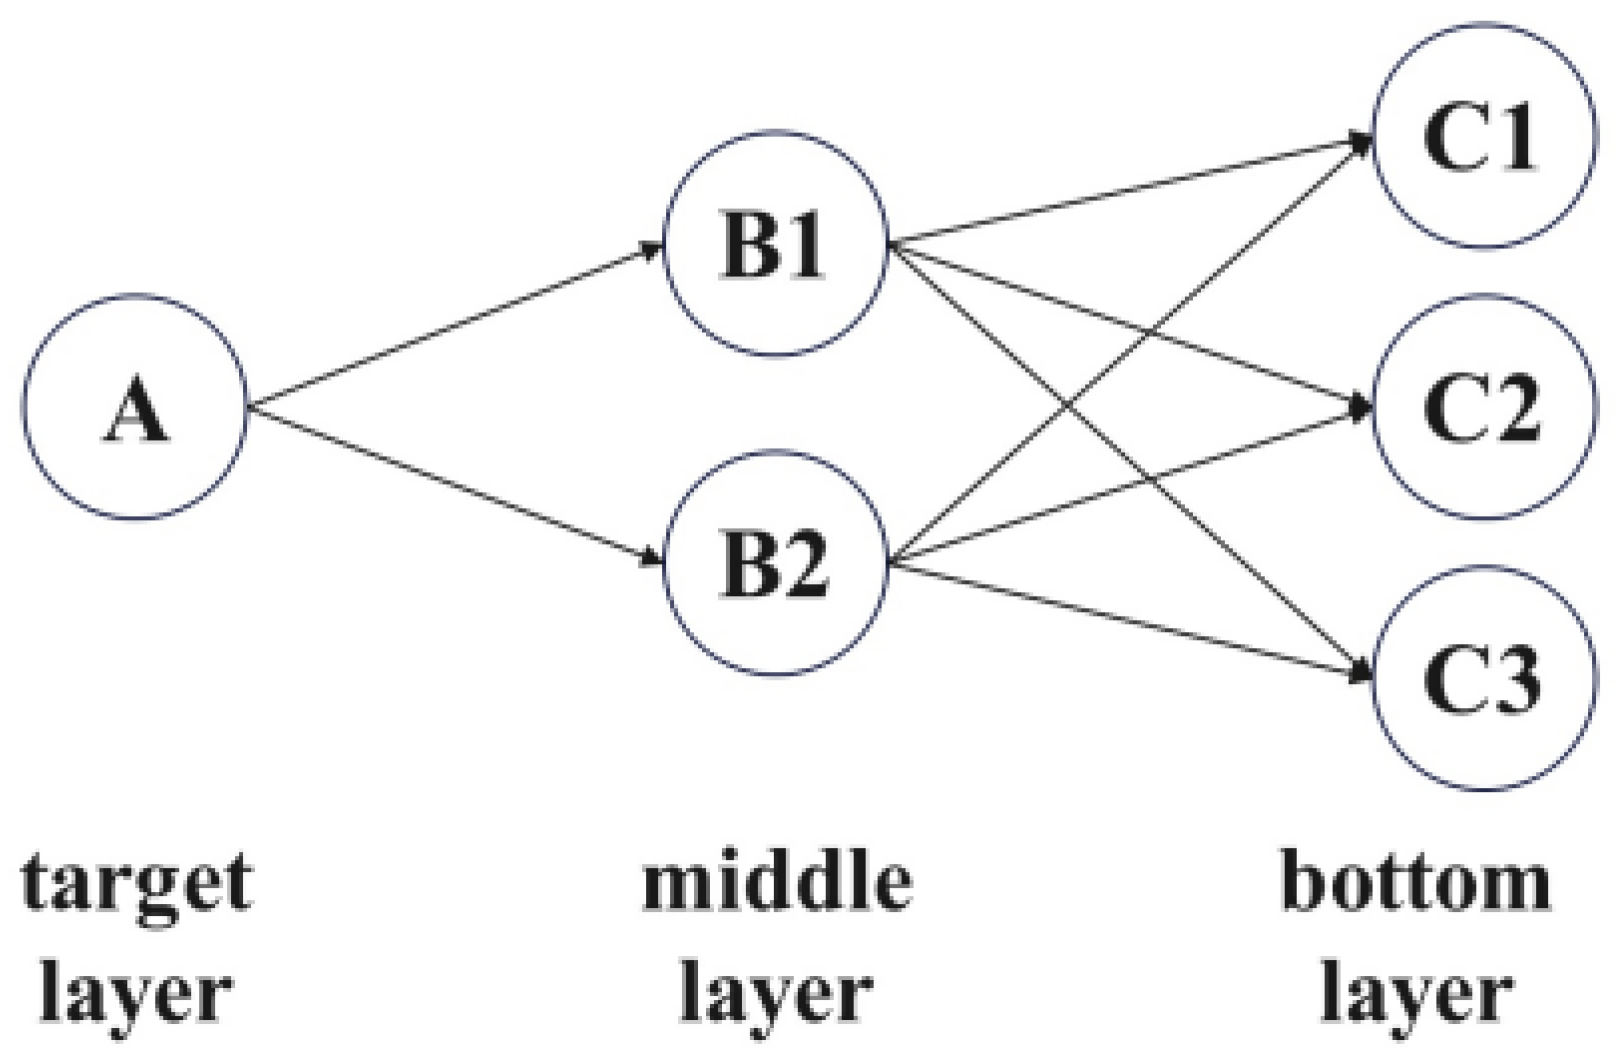
The recursive hierarchical model for a masonry structure is shown in Figure 2. The top layer (target layer) is the overall reliability index A; the middle layer (criterion layer) contains member damage hazard B1 and inter-component correlation coefficient B2, which affect the top layer (target layer); and the bottom layer (scheme layer) consists of basic independent elements such as element type (C1), location (C2), and number of floors (C3), which are independent and cross-influence the criterion layer (e.g., a single program-level factor can act on single/multiple criterion-layer factors). At the same time, criterion and scheme layers are sometimes interchangeable. For example, in masonry structures, where different floors have different effects on the overall structural safety, floors can also be used as the second layer, and element types and locations as the third layer.

3.2.2. Judgment Matrix

The judgment matrix is constructed based on the nine-level scale method, and the scale values are set based on psychological experiments and practical-application experience. The specific meanings and usage scenarios are shown in Table 4.
According to Figure 2, the recursive hierarchical structure, the judgment matrix E of a certain level consists of the square matrix of each element scale of the next level. For example, the safety of each layer of a five-story masonry structure has a different degree of importance relative to the safety of the entire structure; therefore, the safety of the entire structure is the target layer, each floor is a middle layer, and the judgment matrix for the target layer is a 5 × 5 square matrix. If it is assumed that the safety of the first floor has the most significant influence on the structure and the safety of the fifth floor has the least influence on the structure, the judgment matrix is as shown in Equation (16).
E 55 = e 11 e 12 e 13 e 14 e 15 e 21 e 22 e 23 e 24 e 25 e 31 e 32 e 33 e 34 e 35 e 41 e 42 e 43 e 44 e 45 e 51 e 52 e 53 e 54 e 55 = 1 3 5 7 9 1 / 3 1 3 5 7 1 / 5 1 / 3 1 3 5 1 / 7 1 / 5 1 / 3 1 3 1 / 9 1 / 7 1 / 5 1 / 3 1

3.2.3. Hierarchical Ordering

The weights of each element of this layer relative to the previous layer can be solved for by the judgment matrix. Generally, the maximum eigenvalue of the judgment matrix (λmax) and its corresponding eigenvector (wmax) can be solved first. The eigenvector corresponding to the maximum eigenvalue can be normalized to obtain the weight of each element of this layer relative to the previous layer, as shown in Equation (17).
E W = λ W
where E is the judgment matrix, W is the eigenvector matrix, W = { w 1 , w 2 , w 3 w n } , λ is the eigenvector, λ = { λ 1 , λ 2 , λ 3 λ n } , and λ max = max { λ 1 , λ 2 , λ 3 λ n } .
When calculating the weight of each element of the scheme layer relative to the target layer, each layer weight vector wmaxi should be calculated individually at first, and then divided equally according to the number of elements accounted for in the different types to determine the weight of each element accounted for in the overall reliability, as shown in Equation (18).
W ¯ = w max 1 T w max 2
where W ¯ is the weight matrix of the bottom elements relative to the target layer, wmax1 is the middle-layer weight vector, and w max 1 = { v 1 , v 2 , v 3 v n } , wmax2 is the bottom weight vector, w max 2 = { u 1 , u 2 , u 3 u n } .

3.2.4. Judgment Matrix Consistency Test

A consistency test should be performed on the judgment matrix when calculating weight. If the consistency test is not passed, the judgment matrix must be readjusted. A consistency test is generally characterized by the consistency ratio indicator CR, as shown in Equation (19). When CR < 0.1, the consistency test returns a passing value.
C R = C I R I
where CI is the index of deviation consistency of judgment matrix, as shown in Equation (20); RI is the average stochastic consistency index of judgment matrix, as shown in Table 5.
C I = λ max n n 1
where λmax is the maximum eigenvalue of the judgment matrix; n is the maximum order of the judgment matrix.
The total hierarchical ranking is calculated layer by layer from top to bottom. Taking the middle layer B as an example, if some influencing factors have a single sort consistency index of (CIj) for the target layer (Aj) and the corresponding average random consistency index (RIj), then the total sort random consistency ratio of the middle layer B can be expressed by Equation (21). When CRB < 0.1, the total ranking consistency of the hierarchy is considered to be adequate; otherwise, the judgment matrix needs to be further adjusted until the consistency is satisfied.
C R B = i = 1 n W j C I j i = 1 n W j R I j

3.2.5. Assessment of Structural Systems

The set associated with the affiliation evaluation of the overall structure can be expressed by Equation (22).
u ¯ = u 4 × n W 1 ¯ n × 1
where u 4 × n is the affiliation matrix of a single component of the scheme layer; W 1 ¯ n × 1 is the weight matrix of a single element of the scheme layer with respect to the target layer, which is obtained by transforming W ¯ .
The structural reliability grading criteria are shown in Table 6. A grade of Au means the overall load-bearing capacity of the building meets the requirements for safe use, and measures should be taken with respect to a very small number of general components. A grade of Bu means the overall load-bearing capacity of the building basically meets the requirements for safe use, while some general members or a few major members should be subject to measures, and the overall load-bearing capacity of the building is not yet affected. A grade of Cu means the safety of the building does not meet the requirements for safe use, and a few major components should be subject to immediate measures to significantly change the overall bearing capacity of the building. A grade of Du means the building has serious safety hazards, the overall load-bearing is seriously affected, and measures should be taken immediately.
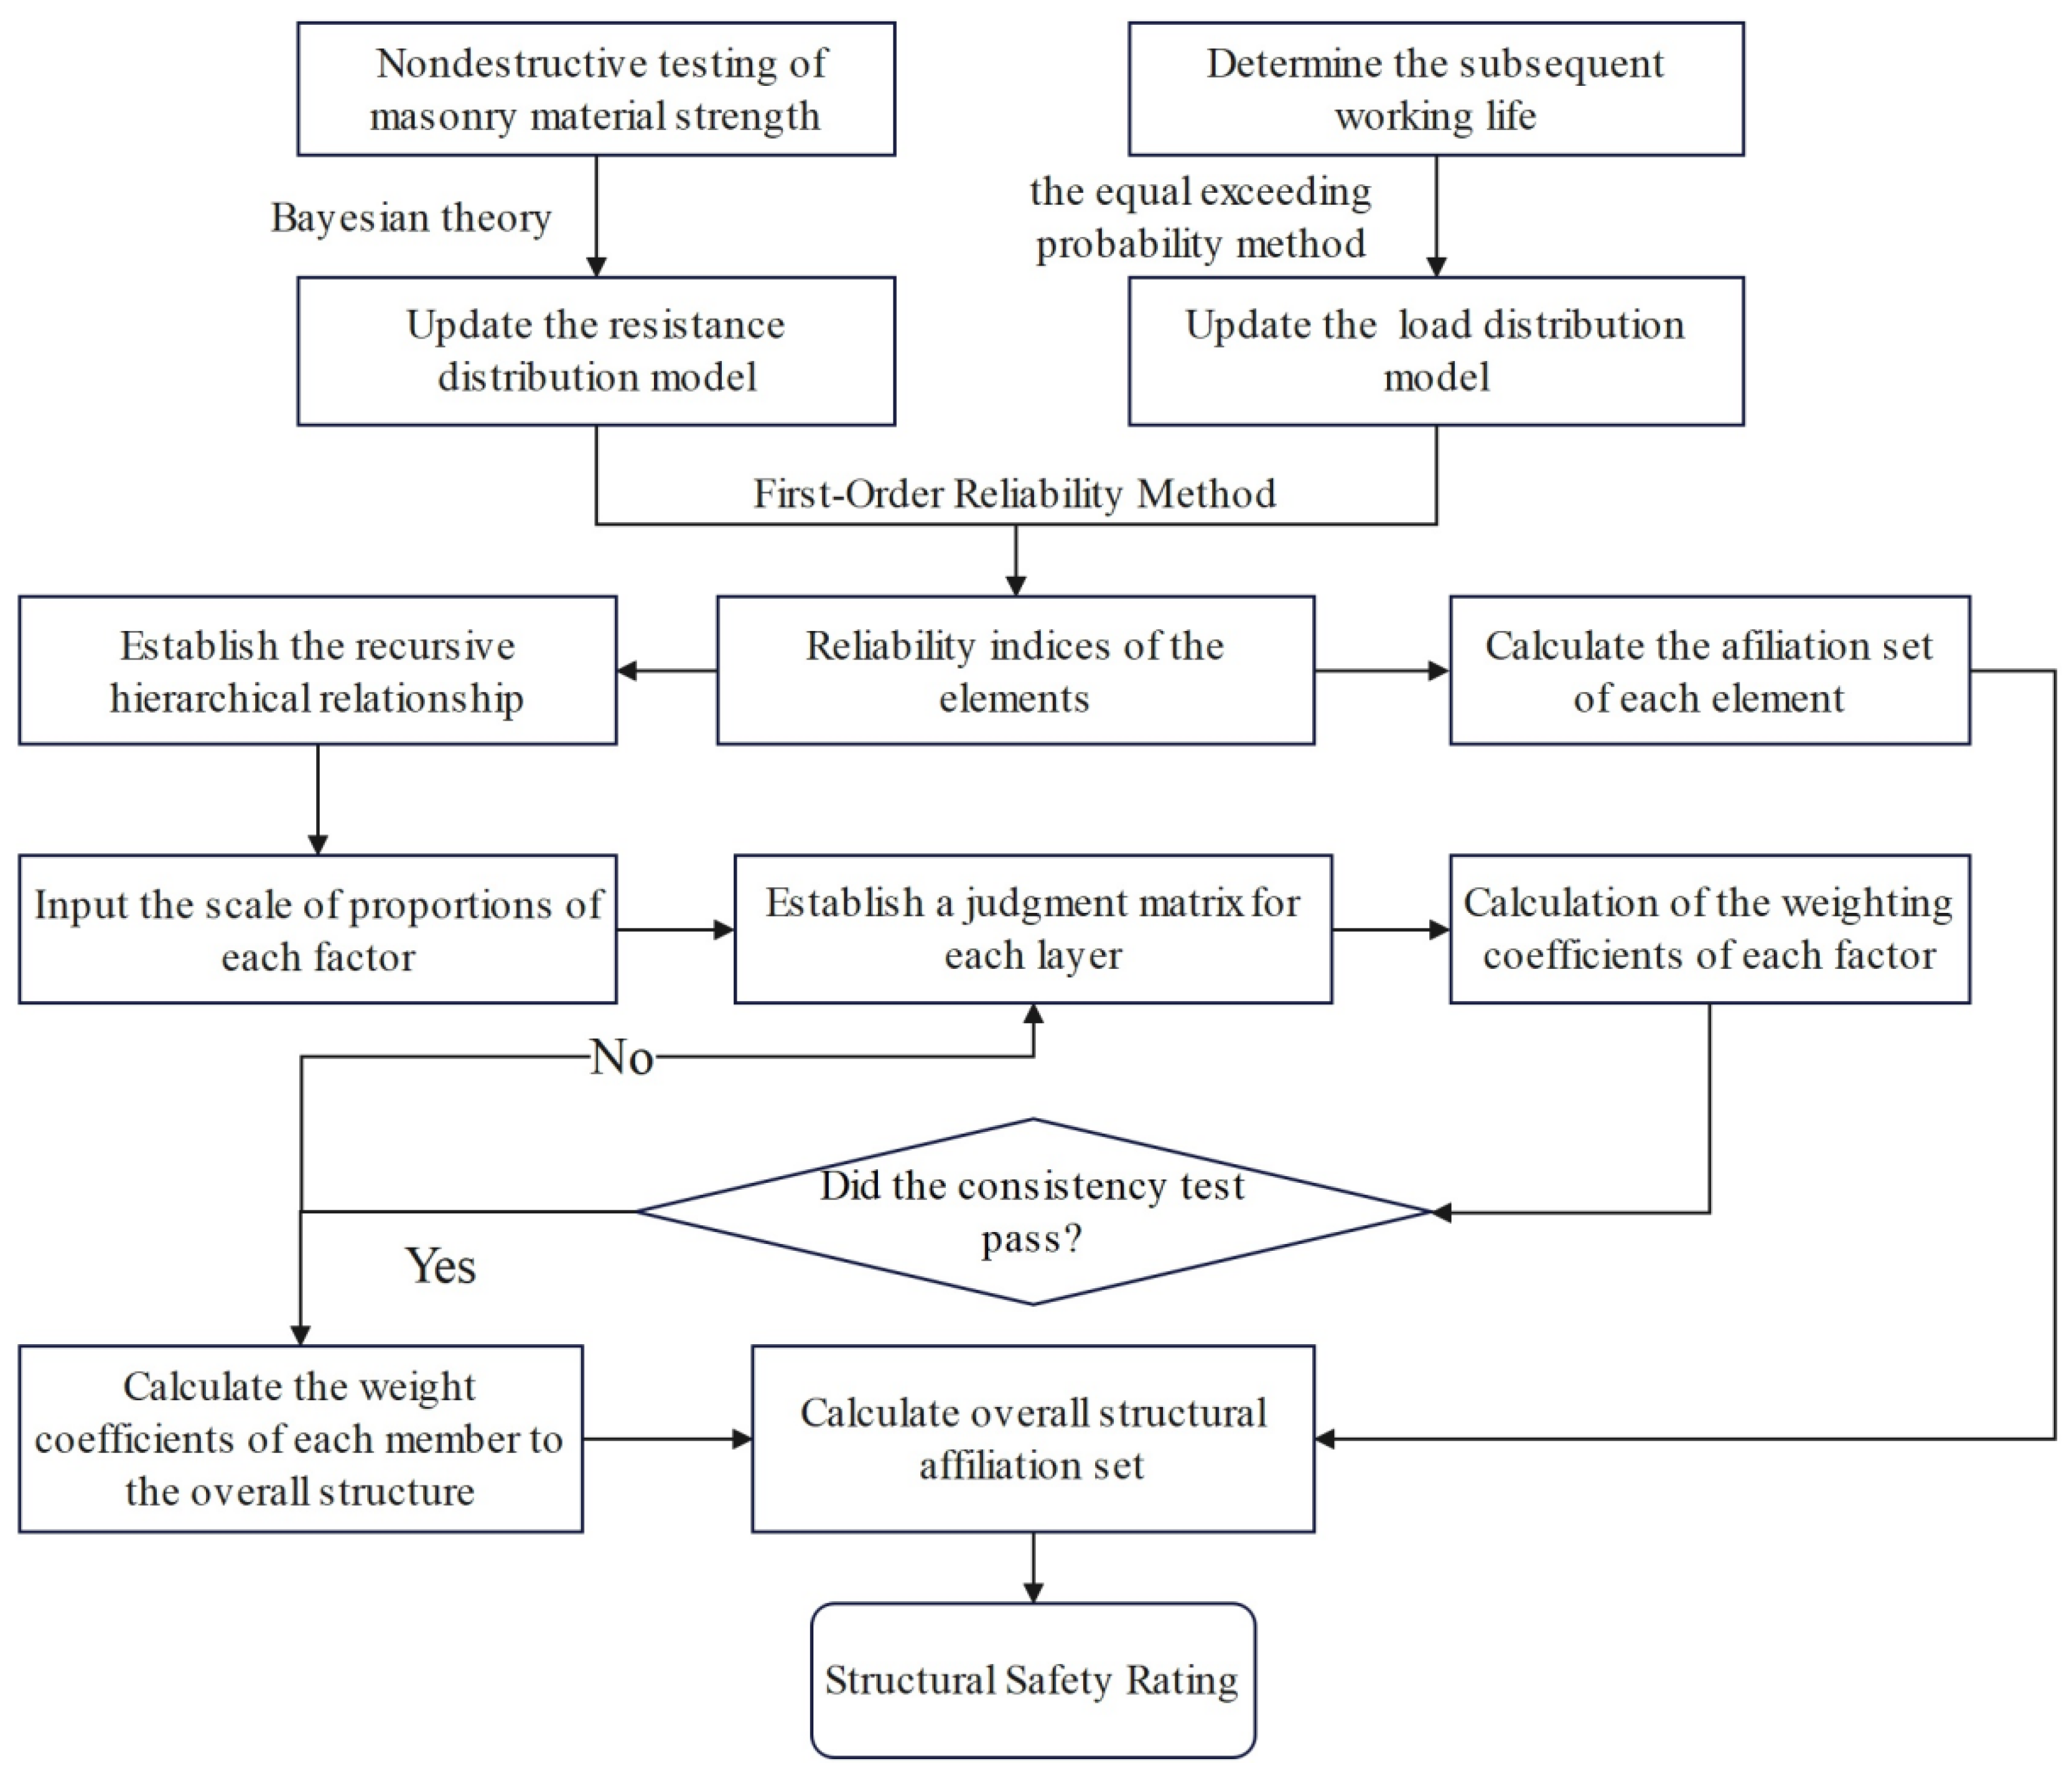
The steps for rating the overall safety of an existing masonry structure are set out in the following, and a related flow chart is shown in Figure 3.
(1) Conduct nondestructive testing of the strength of masonry materials and determine the subsequent working life.
(2) Update the resistance distribution model based on Bayesian theory and the load distribution model based on the equal-exceeding-probability method.
(3) Calculate the reliability index for each component using the first-order reliability method and calculate the affiliation set for each element.
(4) Establish the recursive hierarchical relationship, build the judgment matrix based on ratio scaling, and calculate the weight coefficients of each factor for each single level.
(5) Conduct a consistency test of the judgment matrix.
(6) Calculate the weight coefficients of each element relative to the overall structure.
(7) Synthesize (3) and (6) to calculate the overall structural affiliation set; this determines the overall safety rating for the existing masonry structure.

4. Assessment Case

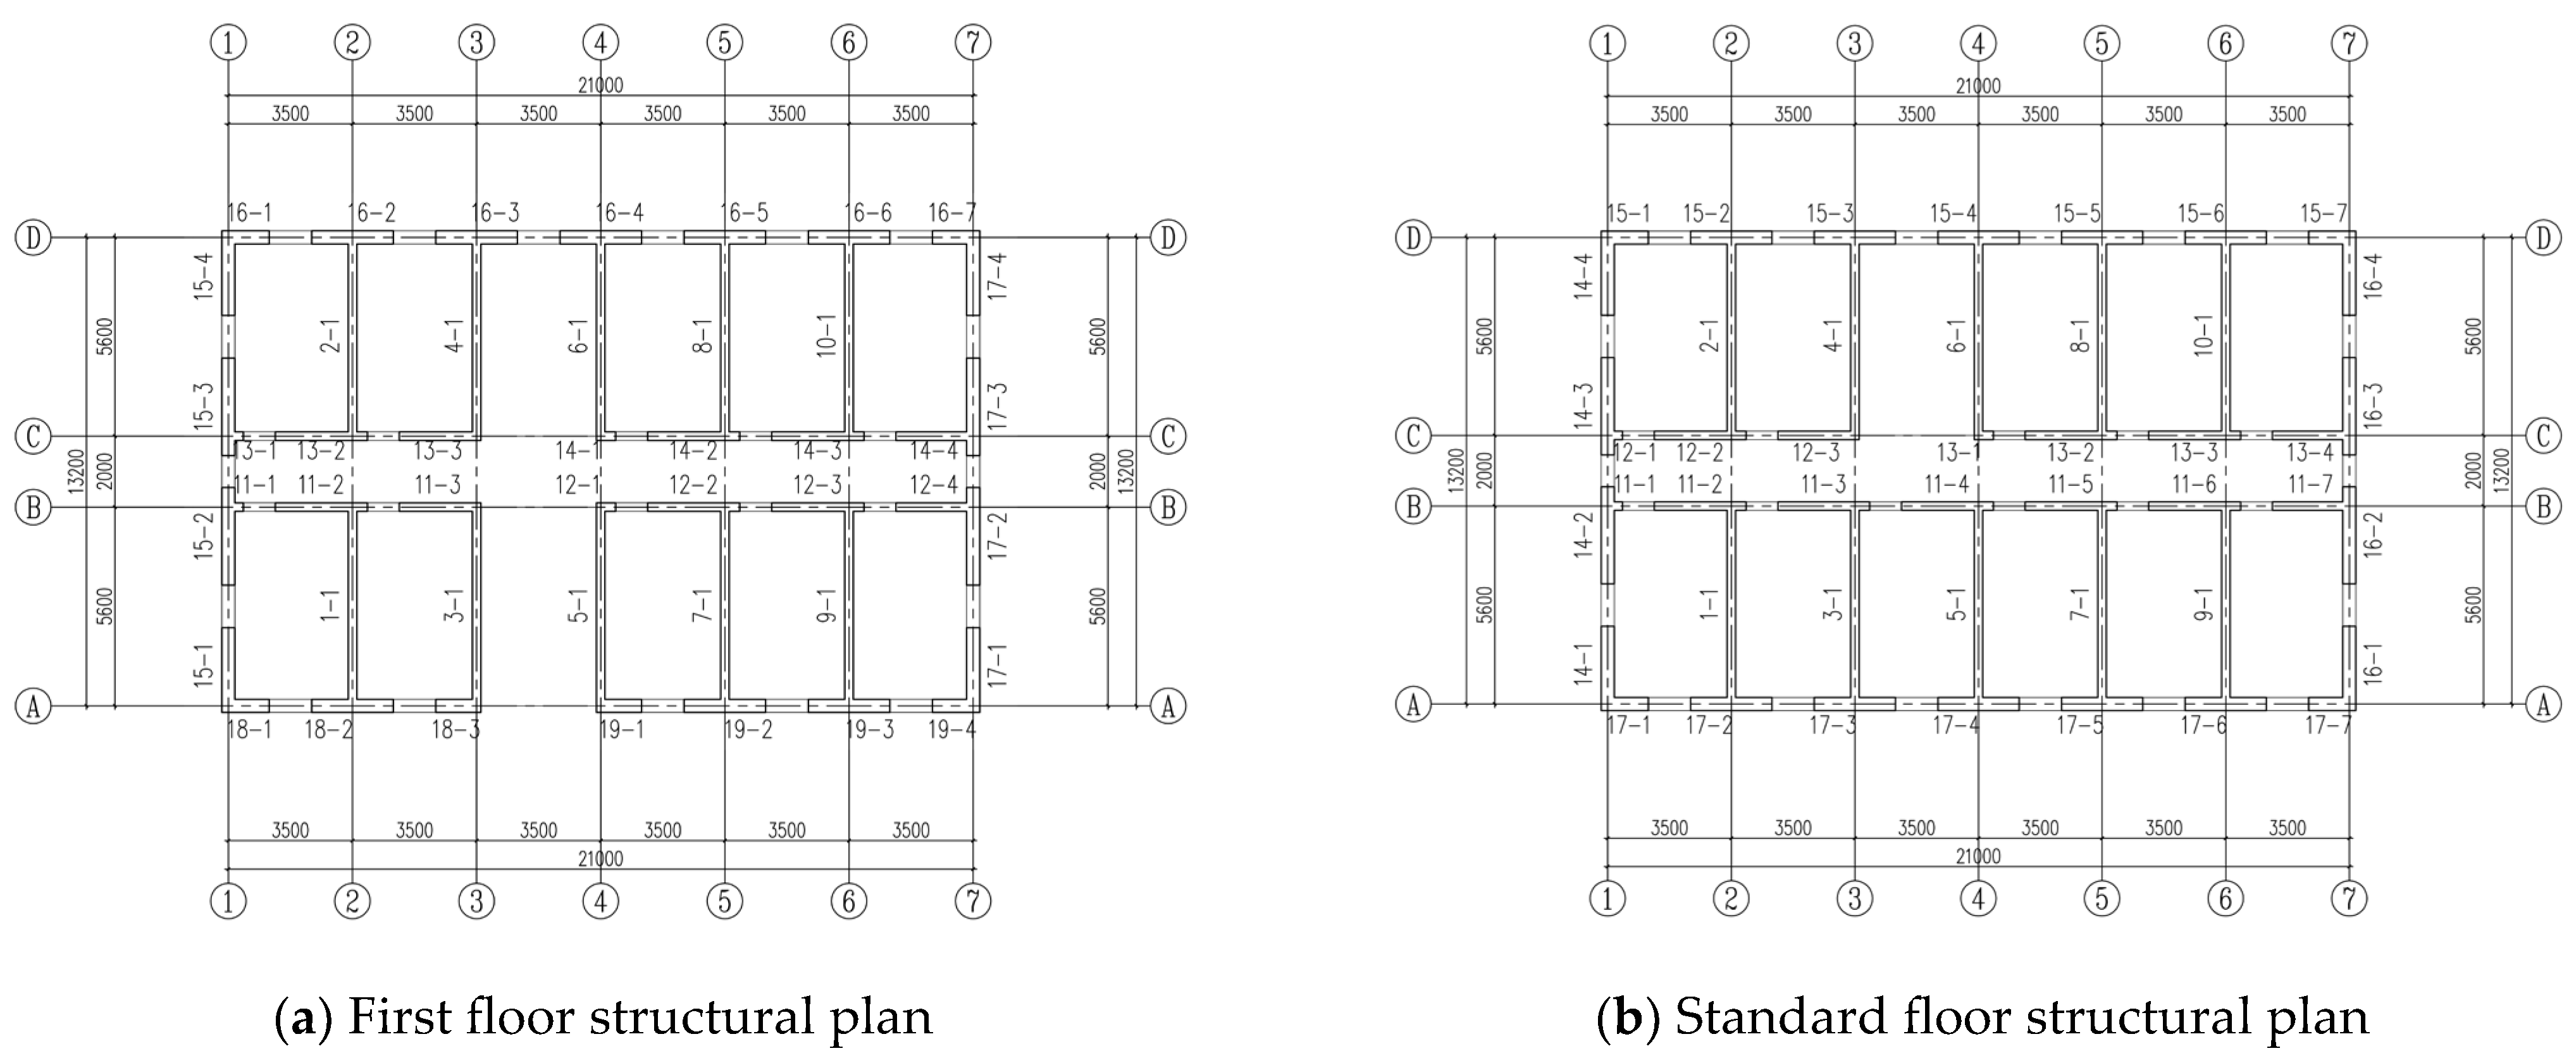
The structure is a five-story existing brick masonry house with a subsequent working life of 30 years; the height of the first floor is 3.500 m, and the height of the other floors is 2.700 m. The strength grade of the brick is MU10 (the average value of the on-site measurements is 11.0 MPa, and the coefficient of variation is 0.18), and the strength grade of the mortar is M1.0 (the average value of the on-site measurements is 1.1 MPa, and the coefficient of variation is 0.04). The thickness of both the internal and external brick walls is 240 mm. The masonry house is load-bearing by means of its transverse walls. The masonry weight is 18 kN/m3, the permanent floor load is 4.0 kN/m2, the floor live load is 2.0 kN/m2, the stairwell permanent load is 7.0 kN/m2, the stairwell live load is 3.5 kN/m2, the roof permanent load is 5.0 kN/m2, and the roof live load is 0.5 kN/m2, while the first floor and the standard floor plan are structurally planned as shown in Figure 4. Walls with numerical axis designations are transverse walls, while walls with alphabetic axis designations are longitudinal walls. Components are numbered in the format “number1–number2”, where the first digit represents the wall number and the second digit denotes the wall segment number. For example, component 15-1 in Figure 4a indicates the first wall segment of transverse wall 15.

4.1. Structural Safety Grade as Determined by GB 50292-2015

The resistance design values Rd, permanent-load standard values SGk, and live-load standard values SQk for the first- and second-floor compression members are shown in Table 7. The safety grades of each member according to the “GB 50292-2015 Standard for appraisal of reliability of civil buildings” are shown in Table 7. Since the safety grades of the members from the third to the fifth floor are the same as those of the second floor, this paper only shows the information for the first and second floors. According to the “GB 50292-2015 Standard for appraisal of reliability of civil buildings”, the proportion of du-grade members is 10.9%, which exceeds the 5% limit, and the superstructure is rated as Du-grade. This means the building has serious safety hazards, the overall load-bearing is seriously affected, and measures should be taken immediately.

4.2. Safety Assessment Based on Model Updating and Affiliations

The process for evaluating the safety of existing masonry structures according to Figure 1 is as follows:
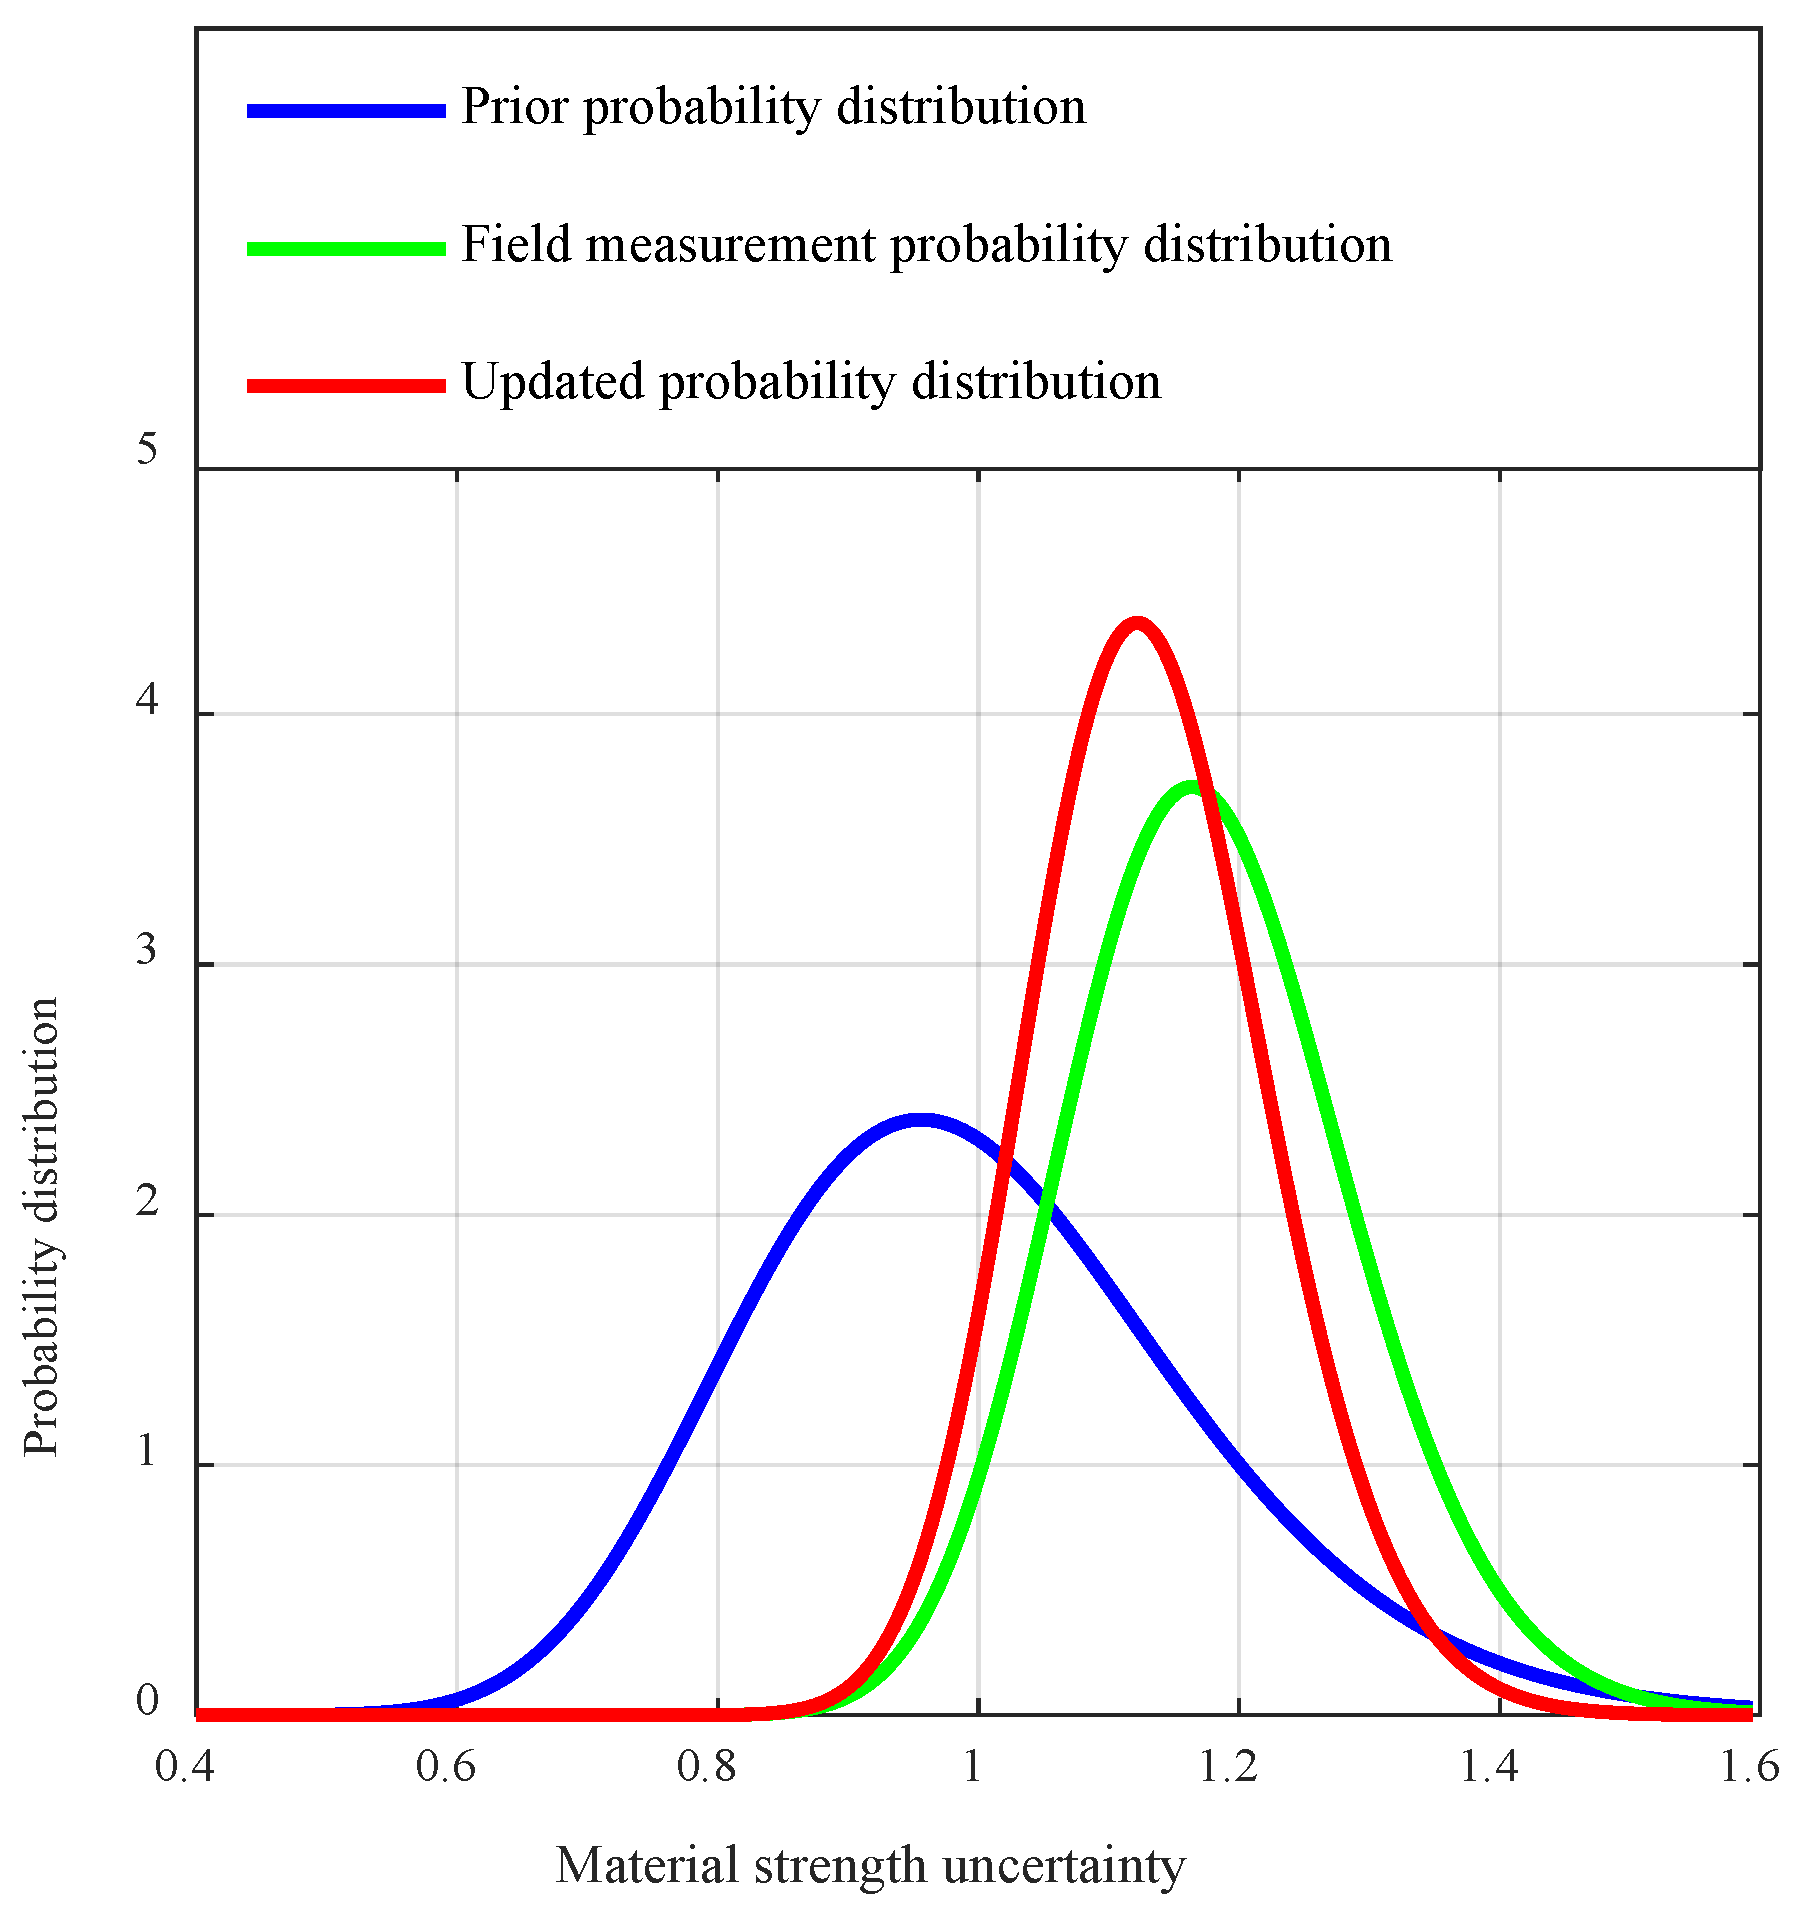
(1) The resistance model is updated based on the measured values. The probability distribution model for the material performance uncertainty before and after the update is shown in Figure 5, and it can be observed that after the update, the probability density function curve for the material strength uncertainty is changed from “short and fat” to “thin and high”; i.e., the mean coefficient of material strength uncertainty is increased, and the coefficient of variation is decreased. The resistance distribution parameters are updated according to Equations (1)–(7), with κ R   =   1.3385 ,   δ R   =   0.2325 , and obeying a log-normal distribution. According to Table 2, the parameters of variable load distribution are selected for a subsequent working life of 30 years, with κ SQ   =   0.594 ,   δ SQ   =   0.252 , and obeying the Gumbel distribution. The permanent-load distribution parameters are κ SG   =   1.06 ,   δ SG   =   0.07 , obeying a normal distribution.
(2) The safety class of this masonry structure is class II, and its standard value of resistance R k = 1.6 R d . The reliability index of each member can be obtained according to the first-order reliability method, and then the affiliation set for each member can be calculated according to Equations (11) and (14), as shown in Table 8.
(3) Definition of judgment matrices. The middle-layer judgment matrix B is defined according to the number of floors (five floors in total, defined as a 5 × 5 square matrix). The judgment matrix C of the scheme layer is defined according to the types of elements (differentiated as bearing wall, mountain wall, or window wall, and defined as a 3 × 3 square matrix). Combined with engineering experience, the judgment matrices B and C are constructed according to the scale in Table 4.
B = 1 3 5 7 9 1 / 3 1 3 5 7 1 / 5 1 / 3 1 3 5 1 / 7 1 / 5 1 / 3 1 3 1 / 9 1 / 7 1 / 5 1 / 3 1 ,   C = 1 3 5 1 / 3 1 3 1 / 5 1 / 3 1
And when the consistency test is conducted on the judgment matrix according to Equations (17)–(21), it can be determined that CRB = 0.053 < 0.1, CRC = 0.033 < 0.1, and the consistency test is passed.
(4) By solving for the maximum eigenvalue and the maximum vector, the weight coefficients WeightB and WeightC for a single level can be obtained. The weight coefficient matrix WeightA for each component with respect to the overall structure can be obtained by multiplying the judgment matrix weight coefficient vectors (WeightBT · WeightC).
WeightB = {0.5218, 0.2615, 01290, 0.0634, 0.0333},
WeightC = {0.6370, 0.2583, 0.1047},
W e i g h t A = W e i g h t B T · W e i g h t C = b e a r i n g   w a l l m o u n t a i n   w a l l w i n d o w   w a l l 1 st   floor 2 nd   floor 3 rd   floor 4 th   floor 5 th   floor 0.3267 0.1325 0.0537 0.1666 0.0675 0.0274 0.0822 0.0333 0.0135 0.0404 0.0164 0.0066 0.0212 0.0086 0.0035
The weight coefficients for each member for the structure are then obtained by dividing by the number of members of the same type in the weight coefficient matrix; the weight coefficients for each member associated with the first floor or the second floor are shown in Table 8.
(5) Based on the affiliation set and the weight coefficients of each member, the affiliation set of the structure can be obtained according to Equation (22). The μ ¯ = { 0.840 ,   0.090 ,   0.002 ,   0.068 } . By checking Table 6, it can be determined that the existing masonry structure is rated Du.
Table 9 presents a comparison of the assessment results for components and structures under the current method and the proposed method. The proportions of cu- and du-grade components are 15% and 11%, based on the current method, while the proportions of cu- and du-grade components are 17% and 19%. The rating results for the structure-safety rating according to the standard in the “GB 50292-2015 Standard for appraisal of reliability of civil buildings” and the method outlined in this paper reflect consistent assessment results (both Du-grade); that is, the masonry structure has serious safety hazards, and immediate measures should be taken.
However, when the floor live load was adjusted to 1.5 kN/m2, the assessment results for the current method and the new method showed significant differences, as shown in Table 9. The assessment results under the current method remained unchanged. However, when evaluated using the new method, the proportion of bu-grade components in the first floor is 17% and that of cu-grade components is 9%, and there are no du-grade components. The assessment results for the second-floor components remain unchanged. The affiliation set of the structure changes to μ ¯ = { 0.738 ,   0.262 ,   0.000 ,   0.000 } . According to Table 6, the structure is classified as Bu-grade, meaning that it meets requirements and only requires repairs to some components.
The above case demonstrates that the two assessment methods may present different results; since the method described in this paper takes into account the change characteristics of the resistance and load model of the existing structure, as well as the weights of different types of components relative to the overall reliability of the structure, the assessment results are more in line with the actual situation of the existing structure, and also have broad applicability.

5. Results and Discussion

The number of existing masonry buildings is plentiful, but the assessment methods for existing structures do not fully consider the changes of resistance and load probability models, and do not solve the problem of sudden changes of endpoints between safety assessment intervals; these factors lead to unreasonable safety assessments of existing masonry structures. Therefore, this paper proposes a safety assessment method that considers both the update of resistance and load probability models and the different weights of members, and its main conclusions are as follows:
(1) The resistance probability model for existing masonry structures is one-size-fits-all, and based on limited testing samples, a resistance probability model that conforms to the actual resistance probability model of the existing masonry structure can be obtained by updating the a priori probability model through Bayesian theory.
(2) The load probability model for existing masonry structures is related to the subsequent work years, and a load probability model matching the subsequent work years can be obtained through the equal-exceeding-probability method.
(3) Based on the modified resistance and load probability model, the contributions of different members to the overall reliability of the structure can be effectively considered by assigning weight coefficients and affiliation sets to different members through the affiliation analysis method and the hierarchical analysis method; based on the affiliation assessment indices, assessment results can be obtained in line with the actual assessment results appropriate to the existing masonry structure.
However, the method proposed in this paper still has certain limitations in its application.
(1) While it performs well on multi-level structures with established rules, its applicability to complex structures, high-level structures, and irregular structures may be insufficient and require further investigation.
(2) The construction of the judgment matrix is subjective and empirical, and it needs to be implemented reasonably in combination with the structure’s type, layout, and importance. Therefore, subsequent research may focus on developing various types of judgment matrices for use by engineers and researchers.

Author Contributions

Methodology, Supervision, F.W.; Writing—review and editing, Writing—original draft, Conceptualization, J.Z.; Supervision, Conceptualization, Methodology, S.H.; Methodology, Supervision, B.Y.; Writing—original draft, Investigation, Data curation, L.W. All authors have read and agreed to the published version of the manuscript.

Funding

This research received no external funding.

Data Availability Statement

The data that support the findings of this study are available from the corresponding author, upon reasonable request.

Conflicts of Interest

Authors Jing Zhang, Shimin Huang and Baojiang Yin were employed by the company China Academy of Building Research; Author Jing Zhang was employed by the company C+E Center for Engineering Research Test and Appraisal Co., Ltd. The remaining authors declare that the research was conducted in the absence of any commercial or financial relationships that could be construed as a potential conflict of interest.

References

  1. GB 50292-2015; Standard for Appraisal of Reliability of Civil Buildings. 2015 ed. China Building Industry Press: Beijing, China, 2015; pp. 34–35.
  2. Wu, L.L.; Tang, C.M.; Luo, K.H.; Huang, S.M.; Lu, D.G. Discussion on the determination method of target reliability index for existing building assessment and retrofitting. China Civ. Eng. J. 2022, 55, 196–202. [Google Scholar] [CrossRef]
  3. Gu, X.L.; Chen, S.J.; Zhang, W.P. A practical method for reliability assessment of existing building structural systems. Struct. Eng. 2007, 23, 12–17. [Google Scholar]
  4. Freudenthal, A.M.; Garrelts, J.M.; Shinozuka, M. The analysis of structural safety. J. Struct. Div. ASCE 1966, 92, 267–325. [Google Scholar] [CrossRef]
  5. Ang, A.H.S.; Ma, H.F. On the reliability of structural systems. In Proceedings of the 3rd International Conference on Structural Safety and Reliability, Trondheim, Norway, 23–25 June 1981. [Google Scholar]
  6. Ditlevsen, O. Narrow reliability bounds for structural systems. J. Struct. Mech. 1979, 7, 453–472. [Google Scholar] [CrossRef]
  7. Thoft-Christensen, P.; Sorensen, J.D. Reliability of structural systems with correlated elements. Appl. Math. Model. 1982, 6, 171–178. [Google Scholar] [CrossRef]
  8. Murotsu, Y.; Okada, H.; Taguchi, K.; Grimmelt, M.; Yonezawa, M. Automatic generation of stochastically dominant failure modes of frame structures. Struct. Saf. 1984, 2, 17–25. [Google Scholar] [CrossRef]
  9. Thoft-Christensen, P.; Murotsu, Y. Application of Structural Systems Reliability Theory, 1st ed.; Springer: Berlin, Germany, 1986; pp. 37–46. [Google Scholar]
  10. Dong, C. Modern Structural System Reliability Theory and Applications; Science Press: Beijing, China, 2001. [Google Scholar]
  11. Lee, Y.; Song, J. Risk analysis of fatigue-induced sequential failures by branch-and-bound method employing system reliability bounds. J. Eng. Mech. 2011, 137, 807–821. [Google Scholar] [CrossRef]
  12. Hu, Y.C.; Guo, Z.B. Structural System Reliability Analysis: Theory and Applications; Tianjin University Press: Tianjin, China, 1992. [Google Scholar]
  13. Brown, C.B. A fuzzy safety measure. J. Eng. Mech. Div. ASCE 1980, 105, 855–872. [Google Scholar] [CrossRef]
  14. Blockley, D.I. The role of fuzzy sets in civil engineering. Fuzzy Sets Syst. 1979, 2, 267–278. [Google Scholar] [CrossRef]
  15. Yao, J.T.P. Safety and Reliability of Existing Structures; Pitman Advanced Publishing Program: Vancouver, BC, Canada, 1985. [Google Scholar]
  16. Wang, X.M.; Li, G.Q. Analysis and Evaluation for Exesting Housing Reliability. J. Wuhan Univ. Technol. 1999, 21, 43–46. [Google Scholar]
  17. Xia, C.C.; Liu, X.L. Damage evaluation expert system for one-storey reinforced concrete building (RACODE-I). Comput. Struct. Mech. Appl. 1989, 6, 64–71. [Google Scholar]
  18. Chen, S.J.; Gu, X.L.; Zhang, W.P. Application of analytic hierarchy process in reliability assessment of existing building structural systems. Struct. Eng. 2005, 21, 31–35. [Google Scholar]
  19. DG/TJ08-804-2005; Standard for Inspection and Assessment of Existing Building Structures. 1st ed. Shanghai Construction Engineering Standards Management Station: Shanghai, China, 2005.
  20. Andreolli, F.; Bragolusi, P.; D’ALpaos, C.; Faleschini, F.; Zanini, M.A. An AHP model for multiple-criteria prioritization of seismic retrofit solutions in gravity-designed industrial buildings. J. Build. Eng. 2022, 45, 103493. [Google Scholar] [CrossRef]
  21. Alkubaisi, A.; Alnsour, M.A. Using AHP method for development of existing building green assessment system in Jordan. Asian J. Civ. Eng. 2022, 23, 1231–1250. [Google Scholar] [CrossRef]
  22. Shen, P.; Chen, Y.; Ma, S.; Yan, Y. Safety assessment method of concrete-filled steel tubular arch bridge by fuzzy analytic hierarchy process. Buildings 2023, 14, 67. [Google Scholar] [CrossRef]
  23. Moon, H.; Mirmotalebi, S.; Jang, Y.; Ahn, Y.; Kwon, N. Risk evaluation of radioactive concrete structure decommissioning in nuclear power plants using fuzzy-AHP. Buildings 2024, 14, 1536. [Google Scholar] [CrossRef]
  24. Gashaw, D.Y.; Suryabhagavan, K.V.; Nedaw, D.; Gummadi, S. Rainwater harvesting in Modjo watershed, upper Awash River Basin, Ethiopia through remote sensing and fuzzy AHP. Geocarto Int. 2022, 37, 14785–14810. [Google Scholar] [CrossRef]
  25. Wang, C.; Zhang, G.; Zhai, Y. Integrating AHP-Entropy and IPA Models for Strategic Rural Revitalization: A Case Study of Traditional Villages in Northeast China. Buildings 2025, 15, 2475. [Google Scholar] [CrossRef]
  26. Zheng, H.B. Appraisal and Reinforcement Research on Existing Reinforced Concrete Structure Based on Target Service Life and Overall Reliability. Ph.D. Thesis, South China University of Technology, Guangzhou, China, 2010. [Google Scholar]
  27. Li, J.; Chen, J.B. The number theoretical method in response analysis of nonlinear stochastic structures. Comput. Mech. 2007, 39, 693–708. [Google Scholar] [CrossRef]
  28. Chen, J.B.; Ghanem, R.; Li, J. Partition of the probability-assigned space in probability density evolution analysis of nonlinear stochastic structures. Probabilistic Eng. Mech. 2009, 24, 27–42. [Google Scholar] [CrossRef]
  29. Xu, J.; Chen, J.B.; Li, J. Probability density evolution analysis of engineering structures via cubature points. Comput. Mech. 2012, 50, 135–156. [Google Scholar] [CrossRef]
  30. Chen, J.B.; Yang, J.; Li, J. A GF-discrepancy for point selection in stochastic seismic response analysis of structures with uncertain parameters. Struct. Saf. 2016, 59, 20–31. [Google Scholar] [CrossRef]
  31. Chen, J.B.; Song, P.Y. A generalized L2-discrepancy for cubature and uncertainty quantification of nonlinear structures. Sci. China Technol. Sci. 2016, 59, 941–952. [Google Scholar] [CrossRef]
  32. Li, J.; Chen, J.B.; Fan, W.L. The equivalent extreme-value event and evaluation of the structural system reliability. Struct. Saf. 2007, 29, 112–131. [Google Scholar] [CrossRef]
  33. Chen, J.B.; Li, J. The extreme value distribution and dynamic reliability analysis of nonlinear structures with uncertain parameters. Struct. Saf. 2007, 29, 77–93. [Google Scholar] [CrossRef]
  34. Chen, J.B.; Li, J. Dynamic response and reliability analysis of nonlinear stochastic structures. Probabilistic Eng. Mech. 2005, 20, 33–44. [Google Scholar] [CrossRef]
  35. Li, J.; Chen, J.B. Stochastic Dynamics of Structures; John Wiley & Sons: Hoboken, NJ, USA, 2009. [Google Scholar]
  36. John, S.K.; Cascardi, A.; Verre, S.; Nadir, Y. RC-columns subjected to lateral cyclic force with different FRCM-strengthening schemes: Experimental and numerical investigation. Bull. Earthq. Eng. 2025, 23, 1561–1590. [Google Scholar] [CrossRef]
  37. GB/T 50315-2011; Technical Standard for On-Site Inspection of Masonry Engineering. 2001 ed. China Building Industry Press: Beijing, China, 2011.
  38. GB 50003-2011; Code for Design of Masonry Structures. 2011 ed. China Building Industry Press: Beijing, China, 2011.
  39. GBJ 68-84; Unified Standard for Reliability Design of Building Structures. China Building Industry Press: Beijing, China, 1984.
  40. Wu, L.; Yang, T.; Guan, H.; Tang, C.; Zhao, Y. Study on safety assessment method considering the deterministic characteristics of existing masonry structures. Struct. Monit. Maint. 2025, 12, 121–135. [Google Scholar]
  41. GB 50068-2018; Unified Standard for Reliability Design of Building Structures. 2018 ed. China Building Industry Press: Beijing, China, 2018.
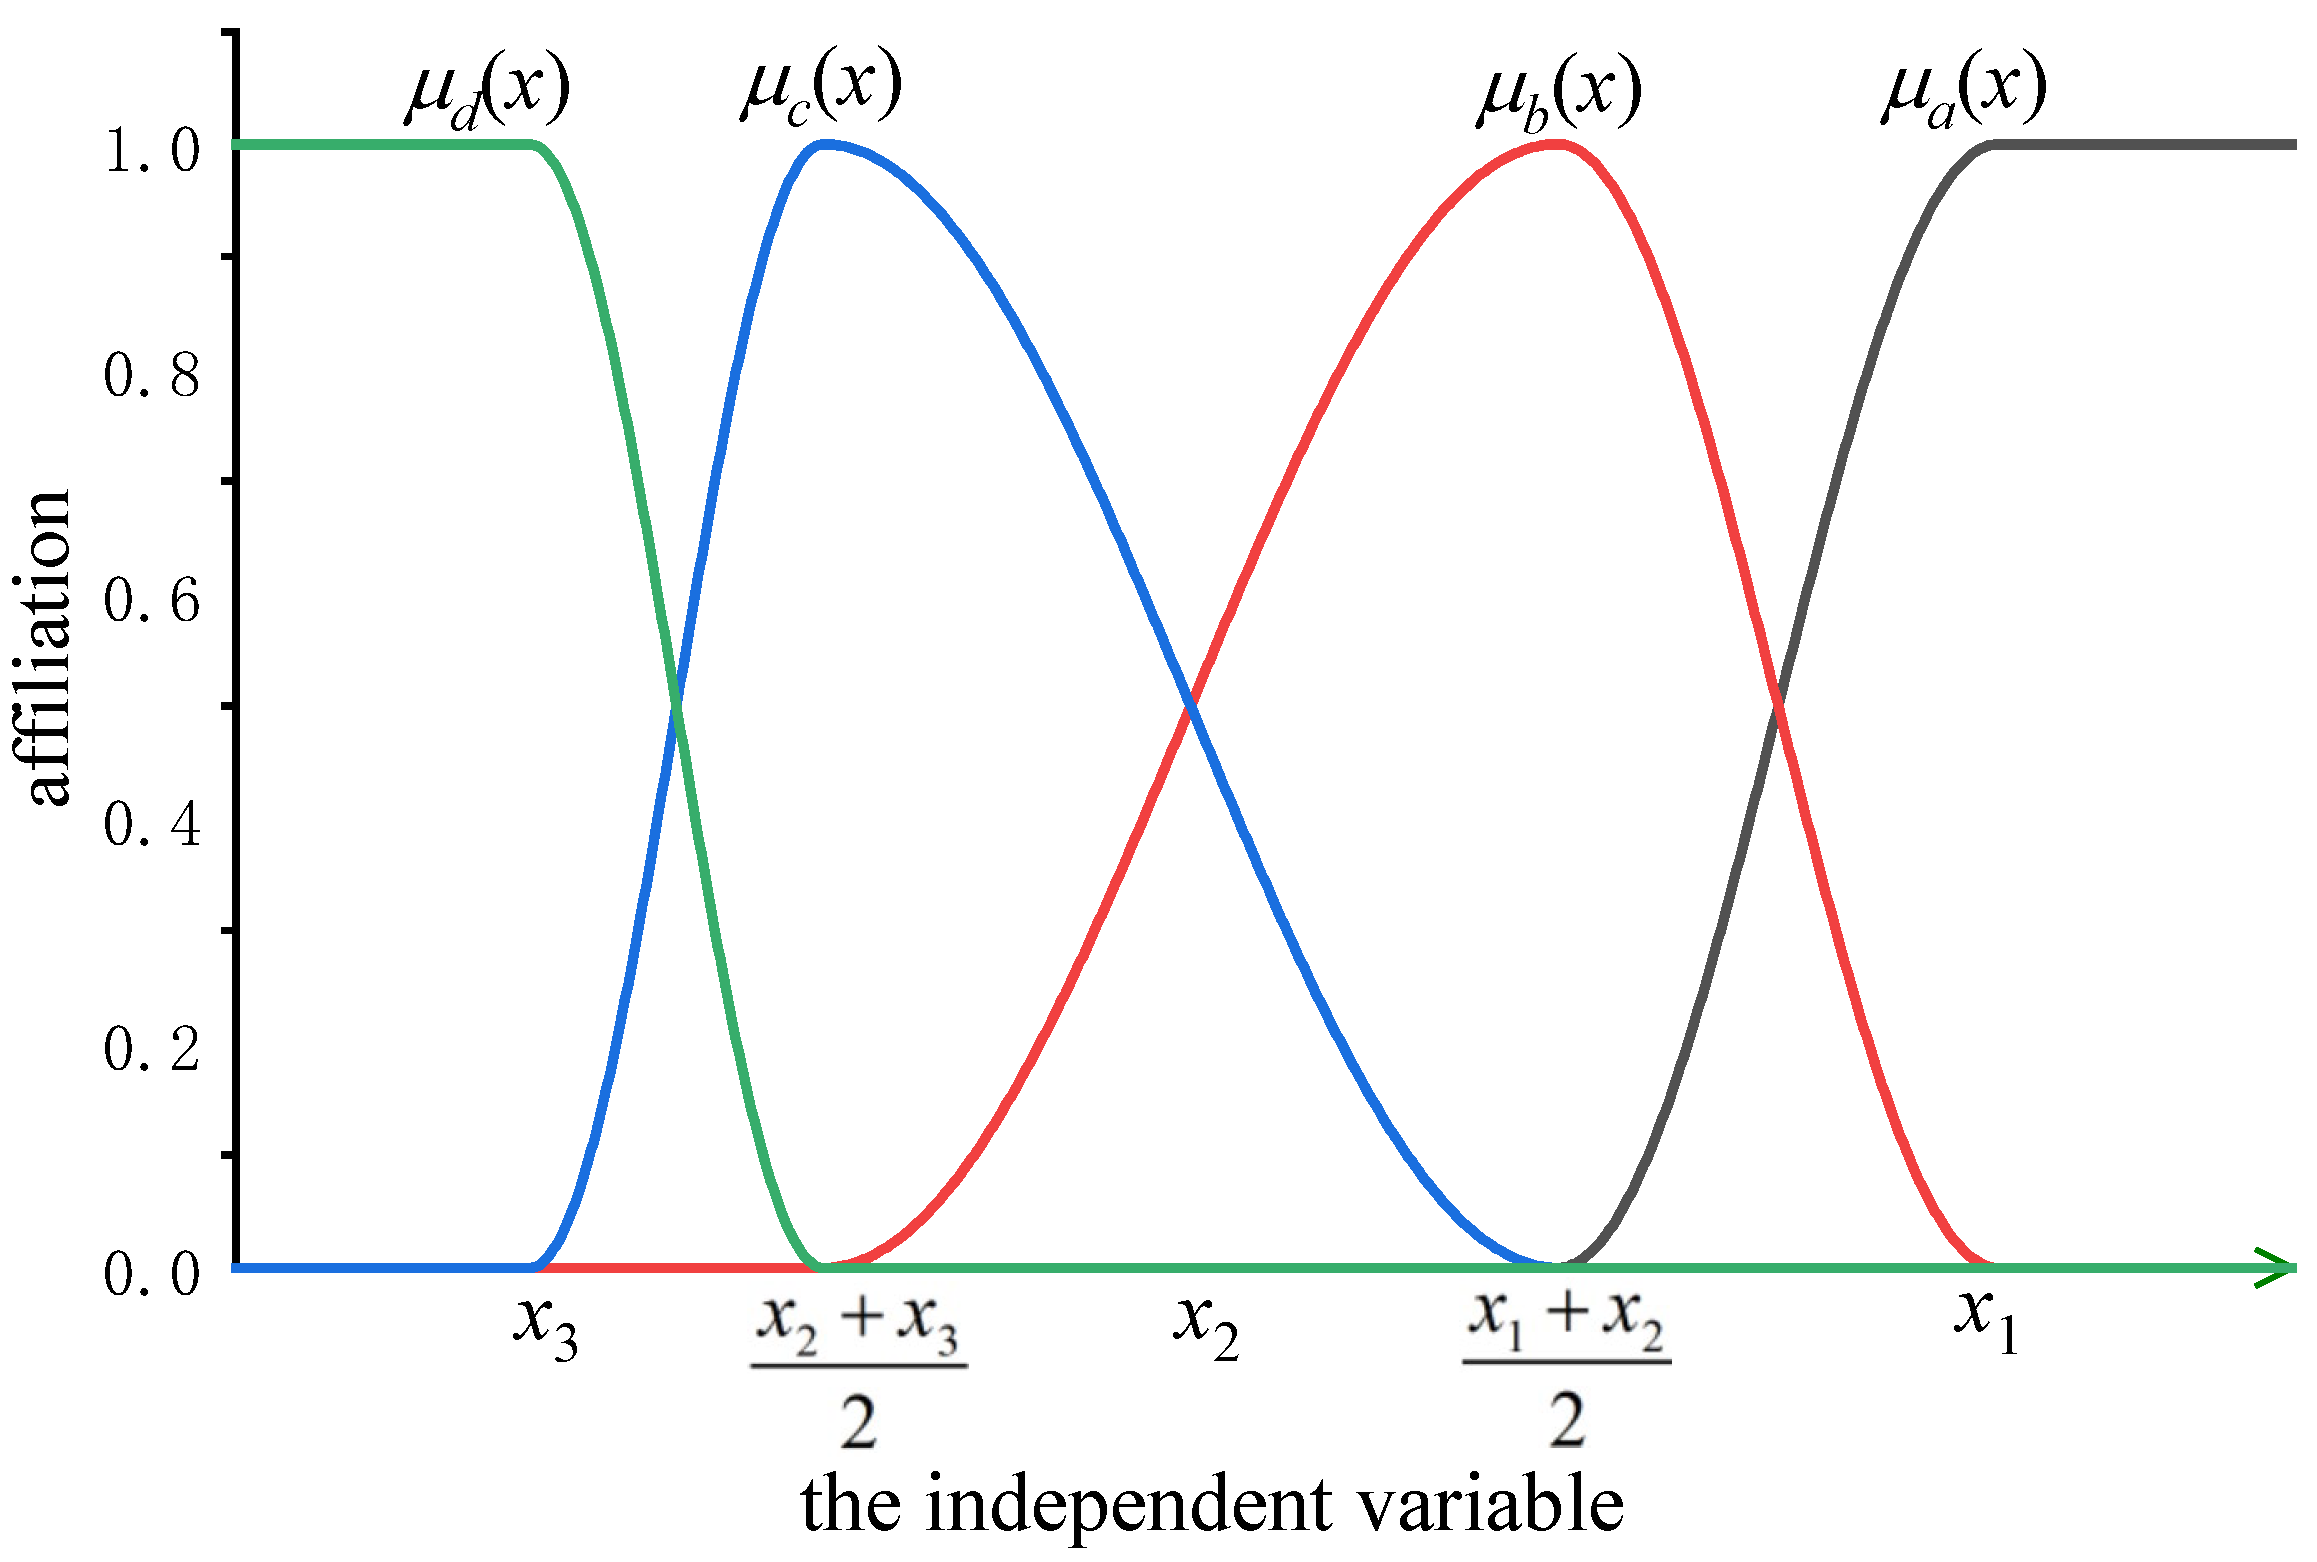
Figure 1. Affiliation function.
Buildings 15 03716 g001
Figure 2. The hierarchical recursive model.
Buildings 15 03716 g002
Figure 3. The overall safety evaluation process for existing masonry structures.
Buildings 15 03716 g003
Figure 4. Structural plan of the first floor and the standard floors of the structure.
Buildings 15 03716 g004
Figure 5. Probability density function, before and after material strength update.
Buildings 15 03716 g005
Table 1. Statistical parameters of resistance uncertainty for the design of brick masonry members.
Typesκδ Typesκδ
ΩfAxial compression1.000.174ΩPAxial compression1.09220.2059
Eccentric compression1.000.174Eccentric compression1.18140.2159
Shear1.000.240Shear1.0170.1260
ΩaAxial compression1.000.023RAxial compression1.09220.2705
Eccentric compression1.000.023Eccentric compression1.18140.2811
Shear1.000.036Shear1.01700.2734
Notes: κ = μ X / X k , μ X is the mean of the variable X; X k is the standard value of variable X; and δ x is the coefficient of variation of the variable X.
Table 2. Load statistical parameters for different numbers of subsequent working years.
Subsequent Working YearsSGSQ
Dead Loads Residential Live LoadsOffice Live LoadsWind
κδκδκδκδ
10a1.060.070.4860.3080.3710.4070.4550.256
20a0.5540.2700.4370.3460.6730.225
30a0.5940.2520.4750.3180.8220.210
40a0.6220.2410.5020.3000.9280.201
50a0.6440.2330.5240.2881.0000.194
Notes: κ = μ X / X k , μ X is the mean of the variable X; X k is the standard value of variable X; and δ x is the coefficient of variation of the variable X.
Table 3. Safety classification of existing masonry members of structural safety class II.
aubucudu
R / ( γ 0 S ) 1 1 > R / ( γ 0 S ) 0.95 0.95 > R / ( γ 0 S ) 0.9 R / ( γ 0 S ) < 0.9
β 3.7 3.7 > β 3.45 3.45 > β 3.2 β < 3.2
Table 4. The ratio scale and the meanings associated with the judgment matrix.
Scale eijMeaningExample
1Elements i and j are of equal importanceBeams and columns have a comparable impact on the overall reliability of the structure.
3Element i is slightly more important than element jMain beams are slightly more important than secondary beams.
5Element i is significantly more important than element jFraming columns have a significantly higher risk of failure than infill walls.
7To a strong degree, element i is more important than element jFoundation elements are much more important than decorative elements.
9Element i is extremely more important than element jBearing wall failures can lead to a direct collapse of the structure.
2,4,6,8Indicates the intermediate values for the adjacent judgments aboveIt is difficult to clearly distinguish between “slightly important” and “obviously important”.
1/(1~9)The degree of unimportance of element i over element j The importance of secondary beams is 1/3 of the importance of the main beams.
Table 5. The index of average random consistency.
n123456789
RI0.000.000.580.901.121.241.321.411.45
Table 6. Safety classification of existing masonry structures.
Overall Reliability RatingResidential BuildingIndustrial Building
Au μ c   =   μ d   =   0 and μ b     0.25 μ c =   μ d =   0 and μ b     0.3
Bu μ c   =   μ d   =   0 and μ b   >   0.25 μ c   =   μ d = 0 and μ b   >   0.3
Cu μ d   0.05   and 0   < μ c   0.5 μ d     0.05   and 0   < μ c     0.5
Du μ d   >   0.05 or μ c   >   0.5 μ d   >   0.05 and μ c   >   0.5
Table 7. Safety grades for the first- and second-floor compression members per GB 50292-2015.
First FloorSecond Floor
NumberRd/kNSGk/kNSQk/kNRd/(γ0S)GradeNumberRd/kNSGk/kNSQk/kNRd/(γ0S)Grade
1-11161.21795.98166.60.9cu1-11220.54623.5127.401.22au
2-11161.21795.98166.60.9cu2-11220.54623.5127.401.22au
3-11161.21946.34176.520.78du3-11220.54623.5127.401.22au
4-11161.21912.4235.320.75du4-11220.54709.71179.061.02au
5-11161.21976.46181.910.75du5-11220.54623.5127.401.22au
6-11161.21928.96240.710.74du6-11220.54724.6183.171.00au
7-11161.21795.98166.60.9cu7-11220.54623.5127.401.22au
8-11161.21795.98166.60.9cu8-11220.54623.5127.401.22au
9-11161.21795.98166.60.9cu9-11220.54623.5127.401.22au
10-11161.21795.98166.60.9cu10-11220.54623.5127.401.22au
11-1118.5966.719.131.18au11-1121.9250.876.961.59au
11-2602.96268.3836.751.49au11-2619.94204.6528.002.01au
11-3533.39247.10 36.071.43au11-3619.94204.6528.002.01au
12-1103.9882.4712.20.84du11-4619.94204.6528.002.01au
12-2602.96268.3836.751.49au11-5619.94204.6528.002.01au
12-3602.96268.3836.751.49au11-6619.94204.6528.002.01au
12-4548.47210.6727.611.81au11-7563.9153.7821.002.44au
13-1118.5966.719.131.18au12-1121.9250.876.961.59au
13-2602.96268.3836.751.49au12-2619.94204.6528.002.01au
13-3533.39226.65 36.751.54au12-3548.41177.1327.482.02au
14-1103.9875.1312.20.9cu13-1106.8259.339.291.17au
14-2602.96268.3836.751.49au13-2619.94204.6528.002.01au
14-3602.96268.3836.751.49au13-3619.94204.6528.002.01au
14-4548.47210.6727.611.81au13-4563.9153.7821.002.44au
15-1881.57372.4241.641.61au14-1904.12285.6631.842.16au
15-21057.09443.5441.661.65au14-21073.42337.8131.862.20au
15-31057.09443.5441.661.65au14-31073.42337.8131.862.21au
15-4881.57372.4241.641.61au14-4904.42285.6631.842.16au
16-1535.21158.540.00 2.6au15-1542.21118.550.003.52au
16-2922.08317.090.00 2.24au15-2934.14237.10.003.03au
16-3922.08317.090.00 2.24au15-3934.14237.10.003.03au
16-4922.08317.090.00 2.24au15-4934.14237.10.003.03au
16-5922.08317.090.00 2.24au15-5934.14237.10.003.03au
16-6922.08317.090.00 2.24au15-6934.14237.10.003.03au
16-7535.21158.540.00 2.6au15-7542.21118.550.003.52au
17-1881.57372.4241.641.61au16-1904.12285.6631.842.16au
17-21057.09443.5441.661.65au16-21073.42337.8131.862.21au
17-31057.09443.5441.661.66au16-31073.42337.8131.862.21au
17-4881.57372.4241.641.61au16-4904.42285.6631.842.16au
18-1535.21158.540.00 2.6au17-1542.21118.550.003.52au
18-2922.08317.090.00 2.24au17-2934.14237.10.003.03au
18-3509.15203.980.00 1.92au17-3934.14237.10.003.03au
19-1509.15203.980.00 1.92au17-4934.14237.10.003.03au
19-2922.08317.090.00 2.24au17-5934.14237.10.003.03au
19-3922.08317.090.00 2.24au17-6934.14237.10.003.03au
19-4535.21158.540.00 2.6au17-7542.21118.550.003.52au
Table 8. Affiliation information for elements associated with the first or second level.
First FloorSecond Floor
NumberΒElement TypeAffiliation SetWeightsNumberΒElement TypeAffiliation SetWeights
1-13.59Bearing wall[0.0402,0.9598,0,0]0.01361-14.82Bearing wall[1,0,0,0]0.0069
2-13.59Bearing wall[0.0402,0.9598,0,0]0.01362-14.82Bearing wall[1,0,0,0]0.0069
3-12.96Bearing wall[0,0,0,1]0.01363-14.82Bearing wall[1,0,0,0]0.0069
4-12.86Bearing wall[0,0,0,1]0.01364-14.11Bearing wall[1,0,0,0]0.0069
5-12.83Bearing wall[0,0,0,1]0.01365-14.82Bearing wall[1,0,0,0]0.0069
6-12.78Bearing wall[0,0,0,1]0.01366-14.02Bearing wall[1,0,0,0]0.0069
7-13.59Bearing wall[0.0402,0.9598,0,0]0.01367-14.82Bearing wall[1,0,0,0]0.0069
8-13.59Bearing wall[0.0402,0.9598,0,0]0.01368-14.82Bearing wall[1,0,0,0]0.0069
9-13.59Bearing wall[0.0402,0.9598,0,0]0.01369-14.82Bearing wall[1,0,0,0]0.0069
10-13.59Bearing wall[0.0402,0.9598,0,0]0.013610-14.82Bearing wall[1,0,0,0]0.0069
11-14.68Bearing wall[1,0,0,0]0.013611-15.92Bearing wall[1,0,0,0]0.0069
11-25.65Bearing wall[1,0,0,0]0.013611-26.89Bearing wall[1,0,0,0]0.0069
11-35.45Bearing wall[1,0,0,0]0.013611-36.89Bearing wall[1,0,0,0]0.0069
12-13.21Bearing wall[0,0,0.0186,0.9814]0.013611-46.89Bearing wall[1,0,0,0]0.0069
12-25.65Bearing wall[1,0,0,0]0.013611-56.89Bearing wall[1,0,0,0]0.0069
12-35.65Bearing wall[1,0,0,0]0.013611-66.89Bearing wall[1,0,0,0]0.0069
12-46.28Bearing wall[1,0,0,0]0.013611-77.68Bearing wall[1,0,0,0]0.0069
13-14.68Bearing wall[1,0,0,0]0.013612-15.92Bearing wall[1,0,0,0]0.0069
13-25.65Bearing wall[1,0,0,0]0.013612-26.89Bearing wall[1,0,0,0]0.0069
13-35.74Bearing wall[1,0,0,0]0.013612-36.90Bearing wall[1,0,0,0]0.0069
14-13.54Bearing wall[0,0.8644,0.1356,0]0.013613-14.65Bearing wall[1,0,0,0]0.0069
14-25.65Bearing wall[1,0,0,0]0.013613-26.89Bearing wall[1,0,0,0]0.0069
14-35.65Bearing wall[1,0,0,0]0.013613-36.89Bearing wall[1,0,0,0]0.0069
14-46.28Bearing wall[1,0,0,0]0.013613-47.68Bearing wall[1,0,0,0]0.0069
15-15.96Mountain wall[1,0,0,0]0.016614-17.17Mountain wall[1,0,0,0]0.0084
15-26.06Mountain wall[1,0,0,0]0.016614-27.25Mountain wall[1,0,0,0]0.0084
15-36.06Mountain wall[1,0,0,0]0.016614-37.25Mountain wall[1,0,0,0]0.0084
15-45.96Mountain wall[1,0,0,0]0.016614-47.17Mountain wall[1,0,0,0]0.0084
16-1≥10.00Window wall[1,0,0,0]0.003815-1≥10.00Window wall[1,0,0,0]0.0020
16-2≥10.00Window wall[1,0,0,0]0.003815-2≥10.00Window wall[1,0,0,0]0.0020
16-3≥10.00Window wall[1,0,0,0]0.003815-3≥10.00Window wall[1,0,0,0]0.0020
16-4≥10.00Window wall[1,0,0,0]0.003815-4≥10.00Window wall[1,0,0,0]0.0020
16-5≥10.00Window wall[1,0,0,0]0.003815-5≥10.00Window wall[1,0,0,0]0.0020
16-6≥10.00Window wall[1,0,0,0]0.003815-6≥10.00Window wall[1,0,0,0]0.0020
16-7≥10.00Window wall[1,0,0,0]0.003815-7≥10.00Window wall[1,0,0,0]0.0020
17-15.96Mountain wall[1,0,0,0]0.016616-17.17Mountain wall[1,0,0,0]0.0084
17-26.06Mountain wall[1,0,0,0]0.016616-27.25Mountain wall[1,0,0,0]0.0084
17-36.06Mountain wall[1,0,0,0]0.016616-37.25Mountain wall[1,0,0,0]0.0084
17-45.96Mountain wall[1,0,0,0]0.016616-47.17Mountain wall[1,0,0,0]0.0084
18-1≥10.00Window wall[1,0,0,0]0.003817-1≥10.00Window wall[1,0,0,0]0.0020
18-2≥10.00Window wall[1,0,0,0]0.003817-2≥10.00Window wall[1,0,0,0]0.0020
18-3≥10.00Window wall[1,0,0,0]0.003817-3≥10.00Window wall[1,0,0,0]0.0020
19-1≥10.00Window wall[1,0,0,0]0.003817-4≥10.00Window wall[1,0,0,0]0.0020
19-2≥10.00Window wall[1,0,0,0]0.003817-5≥10.00Window wall[1,0,0,0]0.0020
19-3≥10.00Window wall[1,0,0,0]0.003817-6≥10.00Window wall[1,0,0,0]0.0020
19-4≥10.00Window wall[1,0,0,0]0.003817-7≥10.00Window wall[1,0,0,0]0.0020
Table 9. Comparison of the two assessment methods.
First Floor Second Floor
NumberGrade1Grade2Grade3NumberGrade1Grade2NumberGrade1Grade2NumberGrade1Grade2
1-1cucubu14-4auau1-1auau13-4auau
2-1cucubu15-1auau2-1auau14-1auau
3-1duducu15-2auau3-1auau14-2auau
4-1duducu15-3auau4-1auau14-3auau
5-1duducu15-4auau5-1auau14-4auau
6-1duducu16-1auau6-1auau15-1auau
7-1cucubu16-2auau7-1auau15-2auau
8-1cucubu16-3auau8-1auau15-3auau
9-1cucubu16-4auau9-1auau15-4auau
10-1cucubu16-5auau10-1auau15-5auau
11-1auauau16-6auau11-1auau15-6auau
11-2auauau16-7auau11-2auau15-7auau
11-3auauau17-1auau11-3auau16-1auau
12-1ducubu17-2auau11-4auau16-2auau
12-2auauau17-3auau11-5auau16-3auau
12-3auauau17-4auau11-6auau16-4auau
12-4auauau18-1auau11-7auau17-1auau
13-1auauau18-2auau12-1auau17-2auau
13-2auauau18-3auau12-2auau17-3auau
13-3auauau19-1auau12-3auau17-4auau
14-1cucubu19-2auau13-1auau17-5auau
14-2auauau19-3auau13-2auau17-6auau
14-3auauau19-4auau13-3auau17-7auau
The proportions of the different grades of componentsStructural safety rating
Current methodcu-grade: 15%, du-grade: 11%The proportion of du-grade exceeds 5%, the structure is Du-grade.
New methodcu-grade: 17%, du-grade: 9% μ ¯ = { 0.840 ,     0.090 ,     0.002 ,   0.068 } , based on Table 6, the structure is Du-grade.
Live load is 1.5 kN/m2New methodbu-grade: 17%, cu-grade: 9% μ ¯ = { 0.738 ,   0.262 ,   0.000 ,   0.000 } , based on Table 6, the structure is Bu-grade.
Notes: Grade1 denotes component rating according to current standards; Grade2 denotes component rating using the method described herein; and Grade3 denotes component rating using the method described herein after adjustment for live loads.
Disclaimer/Publisher’s Note: The statements, opinions and data contained in all publications are solely those of the individual author(s) and contributor(s) and not of MDPI and/or the editor(s). MDPI and/or the editor(s) disclaim responsibility for any injury to people or property resulting from any ideas, methods, instructions or products referred to in the content.