Article

Multi-Level Loess Slope Displacement Calculation Based on Lumped Mass Method

1
Key Laboratory of Disaster Mitigation in Civil Engineering of Gansu Province, Lanzhou University of Technology, Lanzhou 730050, China
2
School of Civil and Hydraulic Engineering, Lanzhou University of Technology, Lanzhou 730050, China
3
School of Civil Engineering, Lanzhou Institute of Technology, Lanzhou 730050, China
*
Author to whom correspondence should be addressed.
Buildings 2025, 15(20), 3695; https://doi.org/10.3390/buildings15203695
Submission received: 8 September 2025 / Revised: 6 October 2025 / Accepted: 12 October 2025 / Published: 14 October 2025
(This article belongs to the Special Issue Soil–Structure Interactions for Civil Infrastructure)

Abstract

Earthquakes are highly unpredictable and often lead to secondary disasters such as slope collapses, landslides, and debris flows, posing serious threats to human life and property. To explore how multi-stage loess slopes respond to seismic loading, improve both the efficiency and precision of seismic analysis, and better capture the random characteristics of earthquakes in reliability assessment, this research proposes a new analytical framework. The approach adopts the pseudo-dynamic method, divides the slope soil into layers through the lumped mass scheme, and applies the Newmark-β integration method to construct a displacement response model that incorporates seismic variability. By comparing and analyzing results from Geo-Studio finite element simulations, the study reveals the dynamic response behavior of multi-level loess slopes subjected to seismic loads. The key findings are as follows: (1) The formation of unloading platforms introduces a graded energy dissipation effect that significantly reduces stress concentration along potential sliding surfaces; (2) The combined influence of the additional vertical load from the overlying soil and the presence of double free faces has a notable effect on the stability of secondary slopes; (3) The peak displacement response exhibits a nonlinear relationship with slope height, initially increasing and then decreasing. The proposed improved analysis method demonstrates clear advantages over traditional approaches in terms of computational efficiency and accuracy, and provides a valuable theoretical basis for the seismic design of high loess slopes.

1. Introduction

In recent years, slope instability disasters triggered by strong earthquakes have exhibited significant chain-reaction characteristics. For example, the 2008 Wenchuan earthquake (M_w 7.9) triggered between 30,000 and 50,000 landslides and slope collapses, directly resulting in over 2300 fatalities [1,2]. In 2023, the Jishishan earthquake triggered a series of landslide and debris flow disasters in Qinghai Province, causing 13 deaths and widespread house burial incidents [3,4]. Similarly, the 2025 Myanmar earthquake (M_w 7.9) led to 2719 deaths. Engineering experience has demonstrated that the damage caused by secondary geological disasters triggered by earthquakes often surpasses that of the direct seismic impact itself. This phenomenon is especially pronounced in regions with unique geological structures, such as loess areas [5]. Located in Northwest China, the Loess Plateau serves as a key region along the “Belt and Road Initiative.” It is distinguished by ridge–mound landforms and numerous tall, steep slopes (with heights exceeding 30 m). Geographically, it lies where the North–South Seismic Belt intersects with the northeastern edge of the Qinghai–Tibet Plateau Seismic Belt. This area is marked by intense neotectonic activity, and its baseline seismic intensity generally surpasses level VIII on the seismic scale. To improve slope seismic stability, one or more unloading platforms are often constructed at designated heights to achieve staged slope height reduction. This configuration effectively decreases lateral earth pressure and significantly enhances the overall stability of multi-level loess slopes [6,7]. The seismic stability of slopes has long been a focal and challenging topic in geotechnical and earthquake engineering. Key research areas include the calculation of seismic forces, the assessment of slope instability under seismic action, and the determination of potential sliding surface locations once instability occurs [8,9].
The pseudo-static method simplifies seismic forces into constant inertial forces, featuring a clear and straightforward calculation approach [10,11,12]. Nevertheless, this method assumes that seismic forces remain invariant over time and neglects the wave effect of earthquakes. Given the inherent conservatism of the pseudo-static method in evaluating the stability of slopes subjected to earthquakes, the pseudo-dynamic method, by introducing the wave equation, takes into account the propagation effect of seismic waves [13,14]. This method has now been proven effective in assessing the stability of slopes under dynamic conditions, especially in cases where seismic ground motion fluctuates significantly [15,16,17]. Hence, introducing the pseudo-dynamic method into the study of seismic landslide disasters can more comprehensively illuminate the vibration characteristics and failure mechanisms of seismic slopes [18]. During the research on the reinforcement of homogeneous single-level loess slopes, Yan et al. [19], Deng et al. [20], and Yan et al. [21] combined the pseudo-dynamic method with the limit analysis method to explore the relationship between slope stability and seismic motion parameters, and derived the calculation formulas for seismic forces and slope stability. In the study of multi-level homogeneous loess high slopes, Cui et al. [22], Zhang et al. [23], Ye et al. [24], Wang et al. [25] and Xue et al. [26], based on the Newmark landslide displacement analysis method and the principle of energy conservation, analyzed the energy changes in multi-level loess slopes under seismic loads and derived the analytical expressions for the critical acceleration and permanent displacement of each landslide mass. Additionally, Ye et al. [27,28] designed and accomplished a large-scale shaking table model test with a similarity ratio of 1:10 for a frame anchor-supported loess slope, exploring the dynamic response laws of the slope under seismic action and the dynamic characteristics of the sliding soil mass after seismic action, while conducting a sensitivity analysis of slope stability factors. At present, the displacement response of multi-level loess slopes under seismic loading still involves several critical scientific challenges that re-main unresolved. The unique physical and mechanical properties of loess—such as its high susceptibility to liquefaction due to large pore structures, strength degradation under water influence, and flow-slide behavior following structural collapse—contribute to a more complex deformation mechanism during seismic events [29]. Traditional analysis methods, such as Newmark’s sliding block analysis method, estimate the permanent displacement of slopes using static parameters at the critical state of instability [30]. However, these methods fail to capture the dynamic evolution of soil properties and the cumulative effects of seismic-induced damage through-out the shaking process. Furthermore, the geometric diversity among different slope levels—including variations in slope angles, step heights, and soil layer configurations—introduces complex internal phenomena such as nonlinear stress redistribution, coupled multi-level vibrations, and abrupt changes in wave impedance. These factors have yet to be fully investigated and quantified in current research.
Loess, as a typical structural soil, exhibits pronounced regional characteristics in its dynamic response. Traditional analytical approaches developed for single-level slopes are inadequate for accurately capturing the complex mechanical behavior of multilevel loess slopes under seismic loading conditions [31]. Building upon our earlier dynamic analyses [24,27,32], this study further integrates the lumped mass method with the Newmark-β numerical scheme, introducing nonlinear stiffness control parameters (α, β) to describe the platform contact interface. This approach enables a more realistic characterization of multi-level coupling effects and energy dissipation mechanisms, representing a substantive methodological advancement beyond our previous works.

2. Theoretical Framework

When an unsupported high loess slope is subjected to high-frequency, short-duration seismic waves, the soil layers may lose synchrony, leading to a significant increase in relative displacement [33]. To reduce computational complexity while accurately capturing slope behavior, the multi-level loess slope is modeled as a multi-degree-of-freedom (MDOF) system. This representation allows the dynamic characteristics of the slope to be discretized into interconnected masses, which can respond individually to seismic excitations, thereby providing a more realistic simulation of slope deformation compared with single-degree-of-freedom or simplified continuum models [34]. The lumped mass method is then employed to compute the dynamic response of each mass element, accounting for interactions between layers and the propagation of seismic forces throughout the slope. The corresponding dynamic response calculation framework is illustrated in Figure 1, offering a clear depiction of the modeling approach and its assumptions. This methodology not only simplifies the computational procedure but also enhances the precision of seismic response predictions for complex, multi-tiered loess slopes.
In the model, soil layers are connected by massless shear springs and dampers to simulate the interaction between adjacent layers. The slope is horizontally stratified based on its height, with each soil layer treated as a rigid body capable of moving as a unit. To simplify the calculations, the mass at each layer interface is concentrated at the midpoint between the upper and lower layers—specifically, half of the mass from each adjacent layer is assigned to the interface. For the topmost soil strip, half of its mass is concentrated at the slope’s top surface, while half of the bottommost strip’s mass is assumed to be rigidly connected to the slope base. As a result, after stratification, each slope level is divided into n soil layers, forming m = n + 1   lumped mass points after mass concentration. Therefore, for an s-level slope, the system contains a total of s m lumped mass points. When calculating the dynamic response, the system is treated as having s m degrees of freedom. To facilitate the theoretical derivation of the dynamic response for multi-level slopes, the following simplifying assumptions are adopted. The slope is composed of homogeneous loess and is modeled as a rigid-plastic material under the Mohr–Coulomb failure criterion [35,36]. Only horizontal seismic forces are considered (vertical components are neglected—justification is provided in Section 4.2). The sliding surface is assumed to follow a circular arc passing through the slope toe, and soil masses above and below the sliding surface are assumed to move approximately in the same direction, such that their mutual interaction force is small and neglectable for the present analysis.
The motion equation governing the response of multi-level loess slopes under horizontal seismic loading is established as follows:
M U ¨ t + C U ˙ t + K U t = M I u ¨ g t
In the governing equation, M, C, and K correspond to the mass, damping, and stiffness matrices of the slope system, respectively. The term u ¨ g ( t ) denotes the ground acceleration input at time t, while U ¨ ( t ) , U ˙ t and U ( t ) represent the acceleration, velocity, and displacement response matrices of the slope soil. The unit influence vector is indicated by {I}. Each diagonal element of the mass matrix reflects the mass associated with a discrete degree of freedom, capturing the inertia distribution across the slope. The damping matrix accounts for energy dissipation during dynamic motion, and the stiffness matrix characterizes the slope’s resistance to deformation. The combined effect of these matrices in the dynamic equilibrium equation governs how seismic forces propagate through the slope, determining the overall and local displacement, velocity, and acceleration responses. This formulation allows for a detailed representation of slope behavior under seismic loading, incorporating inertia, damping, and stiffness effects concurrently. Where in the mass matrix is:
M = M 1 0 0 0 0 M 2 0 0 0 0 0 0 0 0 M n
For ease of calculation, the equations of the line segments A 1 B 1 ,   A j B j , A n B n and the arc C A 1 are denoted as y 1 ,   y j ,   y n and y n + 1 , respectively. Given that the parameters of both the slope model and the sliding surface model are already defined, the following relationships can be derived:
y 1 = x tan β 1 y j = tan β j x s 2 j 1 + H j 1       y n = tan β n x s 2 n 1 + H n 1 y n + 1 = b r 2 x a 2
In the formula, j = 1,2 , , n 1 . The area of each soil layer on the nth-level slope is given as follows:
s n , 1 = h j , n H j h n , 1 a + r 2 y b 2 y n H n 1 tan β n + s 2 n 1 d y s n , n = h n , n 1 h n a + r 2 y b 2 y n H n 1 tan β n + s 2 n 1 d y
Among them: H n H j = h n , 1 + h n , 2 + + h n , n . To simplify the theoretical derivation, a unit length is assumed along the lateral width of the sliding soil mass. Consequently, the volume of each soil layer is equivalent to the area of the corresponding sub-layer, expressed as:
v n , i = s n , i
The formula for calculating the mass of each soil layer is given by:
m i = ρ i v i
In conclusion, the mass at the bottommost soil node of each slope level is equal to half of the mass of its corresponding soil layer, expressed as:
M 1 , 1 = m 1 , 1 = 1 2 ρ i v 1 , 1 M j , 1 = m j , 1 = 1 2 ρ i v j , 1       M n , 1 = m n , 1 = 1 2 ρ i v n , 1
The mass at the topmost soil node of each slope level is equal to half of the mass of the corresponding soil layer, expressed as:
M 1 , n = m 1 , n = 1 2 ρ i v 1 , n M j , n = m j , n = 1 2 ρ i v j , n       M n , n = m n , n = 1 2 ρ i v n , n
The mass of the soil nodes at each intermediate level of the slope is equal to half the sum of the masses of the soil nodes at the adjacent upper and lower levels, that is:
M 1 , i = m 1 , i = 1 2 ρ i v 1 , i + v 1 , i + 1 M j , i = m j , i = 1 2 ρ i v j , i + v j , i + 1       M n , i = m n , i = 1 2 ρ i v n , i + v n , i + 1
Accordingly, the mass matrix is expressed as follows:
M = M 1 , 1 0 0 0 0 0 M j , 1 0 0 0 0 0 M n , 1 0 0 0 0 0 0 0 0 0 0 M n , n
The stiffness matrix K represents the shear stiffness of the soil mass and is defined as follows:
K = k 11 k 12       k 21 k 22 k 23             k i , i 1 k i i k i , i + 1       k n , n 1 k n n
In the formula:
k i i = k i + k i + 1 k i , i + 1 = k i + 1 , i = k i + 1 k n n = k n
According to the definition of shear stiffness, when u = 1 , the stiffness is given by:
F i = k i = G A i h i
In this expression, Fi denotes the horizontal shear force acting on the i-th soil layer, Ai represents the equivalent horizontal shear area of that layer, and hi corresponds to the thickness of the i-th soil layer.
Substitute the shear stiffness of the soil strips, calculated by Equation (13), into Equation (12) to obtain the shear stiffness matrix of the soil mass. Assuming that the dynamic behavior of multi-level loess slopes under seismic loading follows the Rayleigh damping model, the damping matrix may be formulated, to simplify the computational process, as follows (14). The Rayleigh damping approach combines mass-proportional and stiffness-proportional components, allowing energy dissipation to be represented efficiently across all vibration modes. This formulation is widely adopted in seismic slope analysis because it provides a reasonable approximation of damping effects while maintaining computational tractability, particularly in multi-degree-of-freedom systems where explicit modeling of complex soil hysteresis would be computationally intensive.
C = α 1 M + α 2 K
In this expression, α1 denotes the mass-proportional damping coefficient, and α2 represents the stiffness-proportional damping coefficient. These parameters define the relative contributions of mass- and stiffness-dependent damping in the Rayleigh formulation, thereby controlling how energy is dissipated across different vibration modes of the slope system. Their values can be determined using the following relationship, which ensures that the damping matrix accurately captures the overall energy dissipation behavior of the multi-level loess slope under seismic loading.
α 1 = 2 ω i ω j ξ i ω i ξ j ω j ω j 2 ω i 2
α 2 = 2 ξ i ω i ξ j ω j ω j 2 ω i 2
In the formula, ωi and ωj indicate the natural frequencies of the i-th and j-th modes of the slope model, respectively, while ξi and ξj represent the corresponding damping ratios. These parameters are essential for characterizing the dynamic response of the slope, as the natural frequencies determine how the slope responds to seismic excitation at different modes, and the damping ratios describe the rate of energy dissipation in each mode. Accurately defining these values allows for the precise calibration of the Rayleigh damping coefficients, ensuring that the slope’s energy dissipation behavior is realistically captured.
Since the damping ratio ξ for loess is generally less than 0.2, the natural frequency of the damped system can be approximated as ω = ω 1 ξ 2 , ω denotes the natural frequency of the undamped system. Given the relatively small magnitude of ξ, the value of ω’ is very close to ω, allowing the natural frequency of the undamped system to serve as a practical substitute for that of the damped system. In the absence of external excitations, the system oscillates at this natural frequency, reflecting the intrinsic dynamic characteristics of the structural system. Based on these considerations, the equation of motion for the multi-degree-of-freedom slope system can be formulated as follows:
M U ¨ t + K U t = 0
Under the assumption that a multi-degree-of-freedom system undergoes free vibration in simple harmonic motion, the displacement may be represented by:
U t = ϕ sin ω t + θ
where {ϕ} is defined as the mode shape vector characterizing the deformation pattern of the system, and θ represents the phase angle. By taking the second derivative of the above equation and simplifying, the following expression is obtained:
K ω 2 M ϕ = 0
The necessary condition for Equation (19) to yield a non-zero solution is:
K ω 2 M = 0
Equation (20) corresponds to the frequency equation governing a multi-degree-of-freedom system. When the stiffness matrix and mass matrix of the system are known, the natural frequencies ω of the structure can be obtained by solving this equation. In general, selecting the first two natural frequencies is sufficient to meet the requirements of calculation accuracy.

3. Newmark-β Numerical Solution

The motion equations of multi-degree-of-freedom systems are solved using the Newmark-β method. This method discretizes the time domain and requires the motion equations to be satisfied only at discrete time steps. Parameters α and β were calibrated based on small-strain dynamic tests [37] and sensitivity analyses, ensuring they represent the stiffness degradation of loess interfaces under cyclic loading. The chosen range (α = 0.35–0.45; β = 0.25–0.30) corresponds to realistic damping characteristics observed in similar field experiments, the method achieves unconditional stability and second-order accuracy. The stability condition for the Newmark-β method is given by:
Δ t 1 2 π 2 α 2 β T n
That is, when ∆t ≪ ∞, the Newmark-β method becomes unconditionally stable under the condition that α = 0.35–0.45 and β = 0.25–0.30. Suppose that the acceleration between the discrete points of time [t, t + ∆t] is a certain constant, denoted as Uδ. Then, according to the basic assumption of the method, it is assumed that:
U ¨ δ = 1 α U ¨ t + α U ¨ t + Δ t                           0 α 1 U ¨ δ = 1 2 β U ¨ t + 2 β U ¨ t + Δ t               0 β 1 2
By integrating the acceleration Uδ over the time interval [t, t + ∆t], the velocity and displacement at time t + ∆t can be obtained as follows:
U ¨ t + Δ t = 1 β Δ t 2 U t + Δ t U t 1 Δ t β U ˙ t 1 2 β 1 U ¨ t U ˙ t + Δ t = α Δ t β U t + Δ t U t + 1 α β U ˙ t + 1 α 2 β Δ t U ¨ t
Equation (24) satisfies the motion control Equation (1) at time t + t . By substituting Equation (24) into this, the calculation formula for the displacement {U}t+∆t at time t + ∆t can be derived, as follows:
K ¯ U t + Δ t = P ¯ t + Δ t
The formulation of the equivalent stiffness matrix and the associated load vector is presented as:
K ¯ = K + a 0 M + a 1 C
p ¯ t + Δ t = p t + Δ t + M a 0 U t + a 2 U ˙ t + a 3 U ¨ t + C a 1 U t + a 4 U ˙ t + a 5 U ¨ t
Among them, a0, a1, a2, a3, a4, a5 and a6 are integration constants. The specific calculation formulas are provided in Appendix A.
The acceleration and velocity at time [t, t + ∆t] can be calculated based on the displacement at the same time, as follows:
U ¨ t + Δ t = a 0 U t + Δ t U t a 2 U ˙ t a 3 U ¨ t
U ˙ t + Δ t = U ˙ t + a 6 U ¨ t + a 7 U ¨ t + Δ t

4. Numerical Examples Verification and Comparative Analysis

4.1. Model Establishment

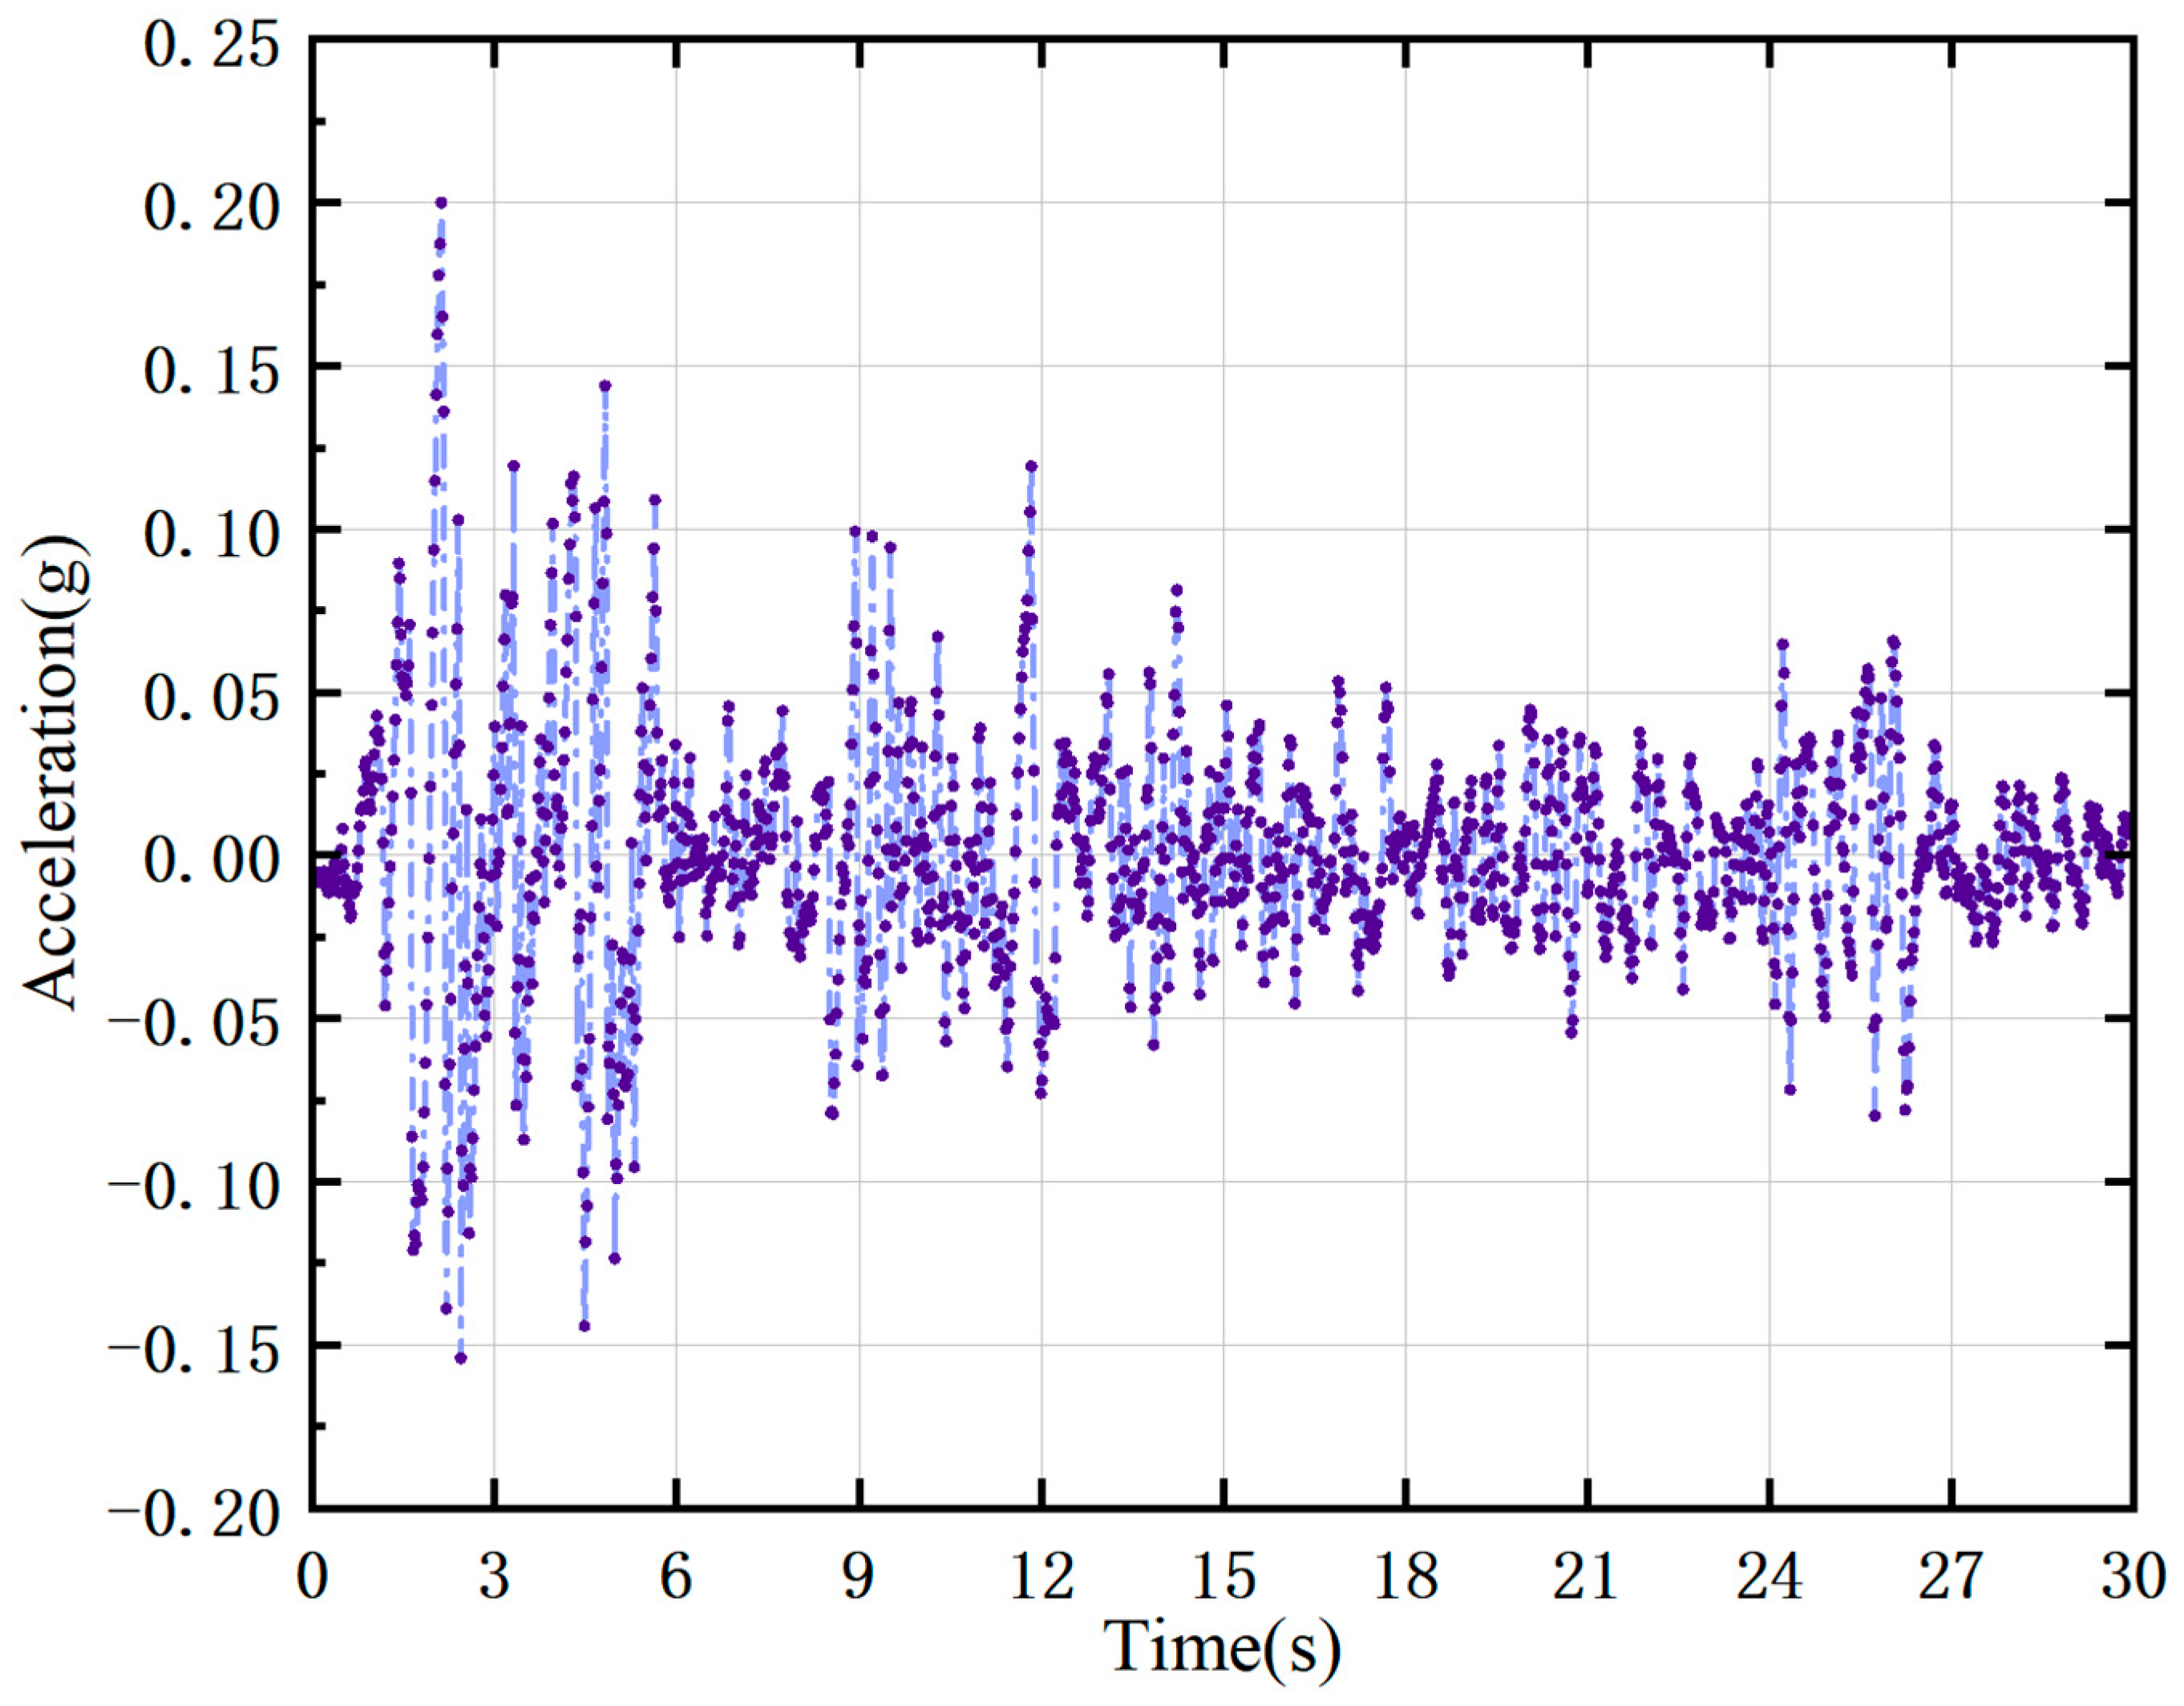
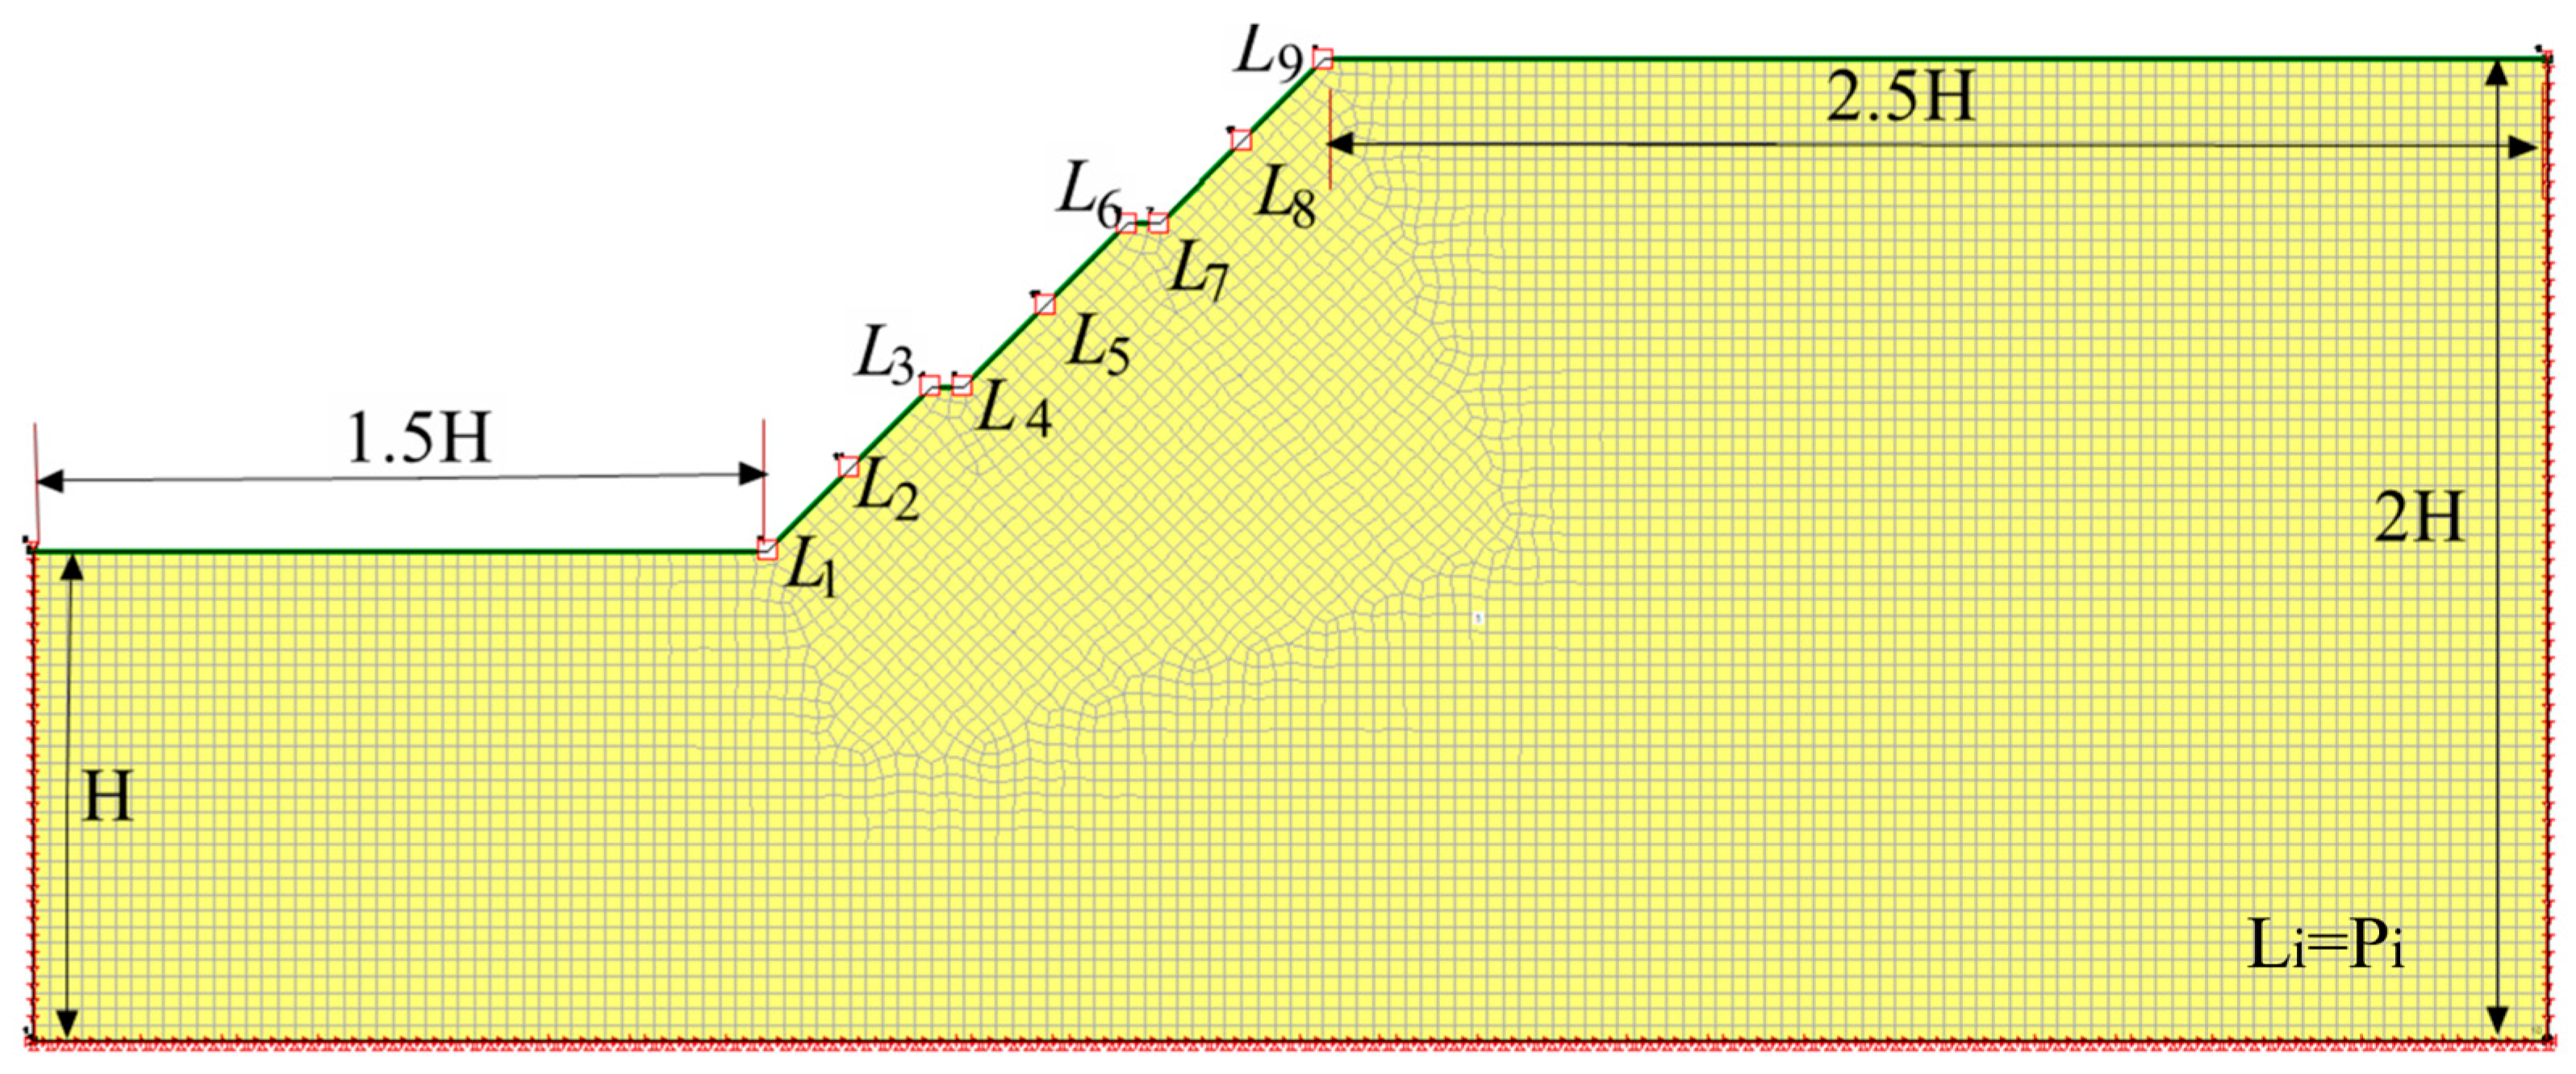
The parameters of a typical multi-level homogeneous loess slope are defined as follows: the height of each slope level is h1 = hi = hj = 10 m, and the width of each slope unloading platform is bi = 2 m. Each level has a slope angle of 45. In the model, the horizontal distance from the slope crest to the right boundary is set to 2.5 H, while the distance from the slope toe to the left boundary is 1.5 H. The total height of the model is taken as twice the slope height to provide sufficient vertical extent, reducing the influence of artificial boundary effects on the simulation results. The seismic fortification intensity is specified as Level VIII, reflecting strong earthquake conditions for the region, and the El-Centro horizontal seismic wave, with a peak ground acceleration of 0.2 g, is selected as the input motion to realistically represent potential seismic excitation for the slope (see Figure 2). The physical and mechanical properties of the loess soil employed in the multi-level slope, including density, cohesion, internal friction angle, and elastic modulus, are summarized in Table 1. These parameters are essential for accurately capturing the dynamic behavior of the slope under seismic loading, ensuring that the numerical analysis reflects realistic stress–strain responses and potential failure mechanisms.
A numerical model of a multi-level loess slope was established using the GeoStudio 2012 finite element analysis software, as shown in Figure 3. To capture the displacement response characteristics of the multi-degree-of-freedom system, monitoring points were strategically placed at the toe, crest, and center of each slope level.

4.2. Model Validation and Comparative Analysis

By inputting the EI-Centro wave, both theoretical and numerical simulation displacement response curves were obtained at various monitoring points on the multi-level loess slope. The peak displacement values were extracted for comparative analysis. To further test model robustness, we also applied two additional horizontal records (Taft 1952 [38] and Kobe 1995 [39,40]). Peak displacements varied within ±8% of the El-Centro case but the elevation trend (increase then decrease) remained unchanged. A parametric study of unloading platform width (b = 1, 2, 3, 4 m) indicates a monotonic decrease in crest displacement with width: relative reduction ~5%, ~9%, and ~15% for b increases of 1→2, 2→3, and 3→4 m, respectively. These results suggest platform geometry is an effective design variable for displacement mitigation.
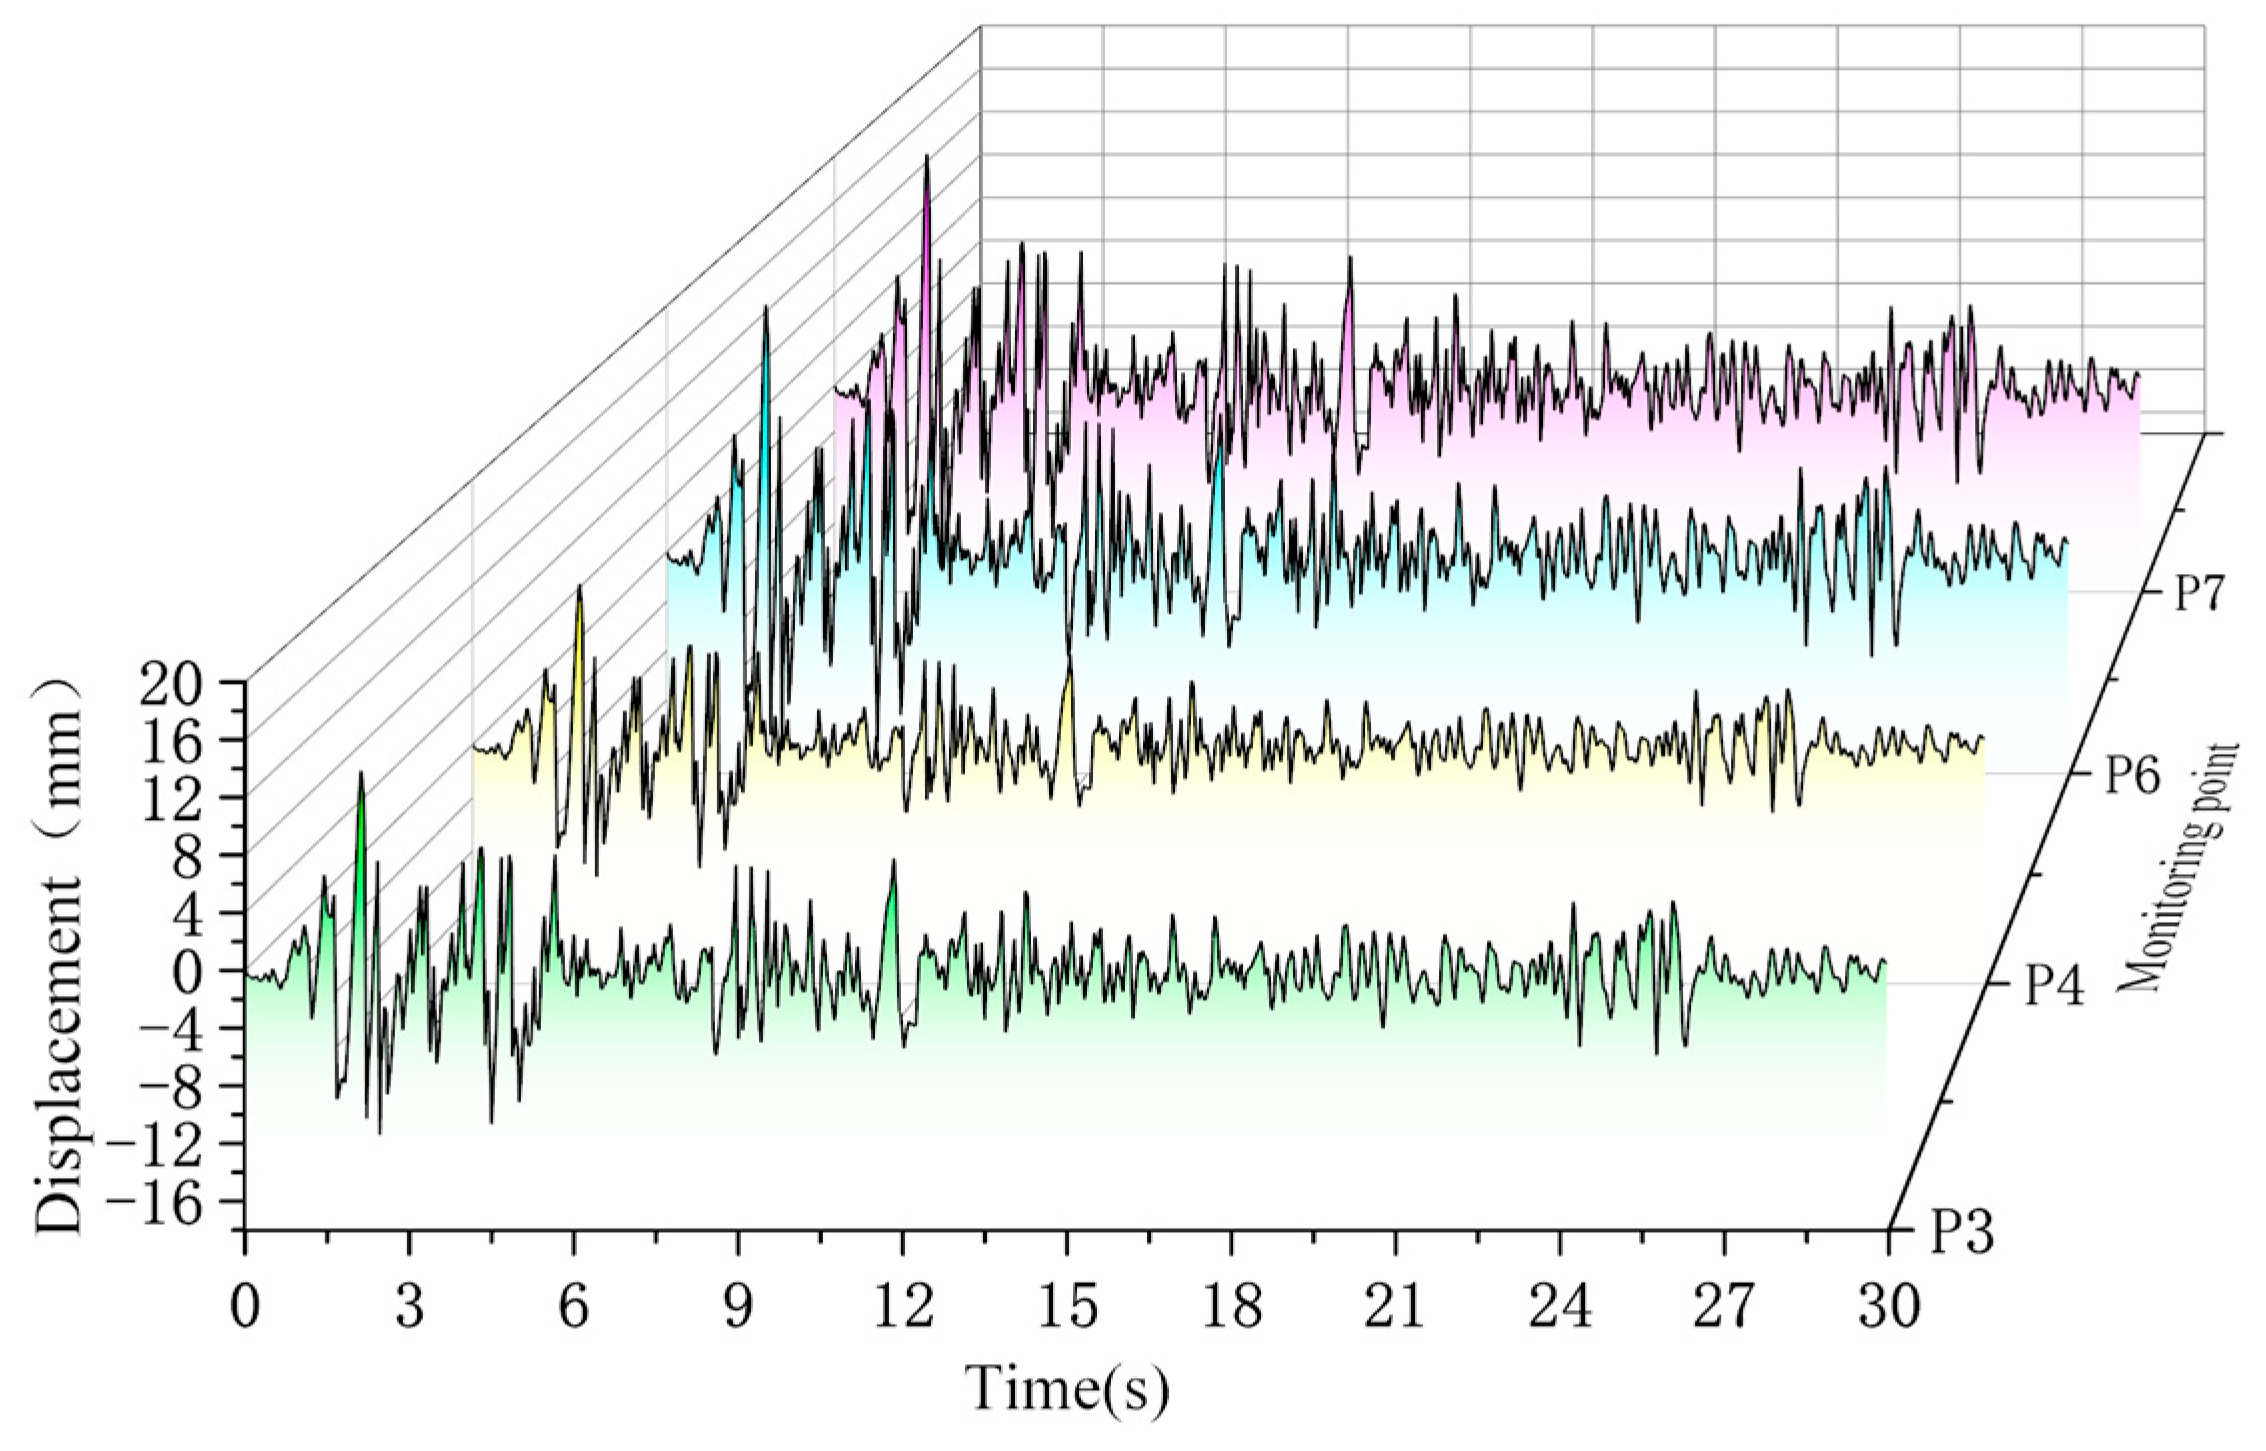
Analysis 1: Monitoring points were set at each unloading platform. Figure 4 illustrates the theoretical displacement response curves at monitoring points P3, P4, P6, and P7, while Figure 5 displays the corresponding displacement response curves from the GeoStudio numerical simulation at monitoring points L3, L4, L6, and L7.
According to the data in Table 2, at corresponding positions on the unloading platforms, the peak displacements of the lower slope top and the upper slope toe exhibit strong consistency, with a maximum deviation of only 0.56 mm. The maximum relative error between the theoretical calculations and the numerical simulation results is approximately 7.6%, indicating a high degree of agreement between the two methods. Comparative analysis reveals that the theoretical peak displacement at the second-level unloading platform increases by an average of 6.38 mm compared to the first level. Furthermore, in Analysis Two, the theoretical peak displacement difference between the midpoints of the second- and first-level slopes reaches 12.02 mm. These results indicate a significant attenuation trend in peak displacement with increasing elevation.
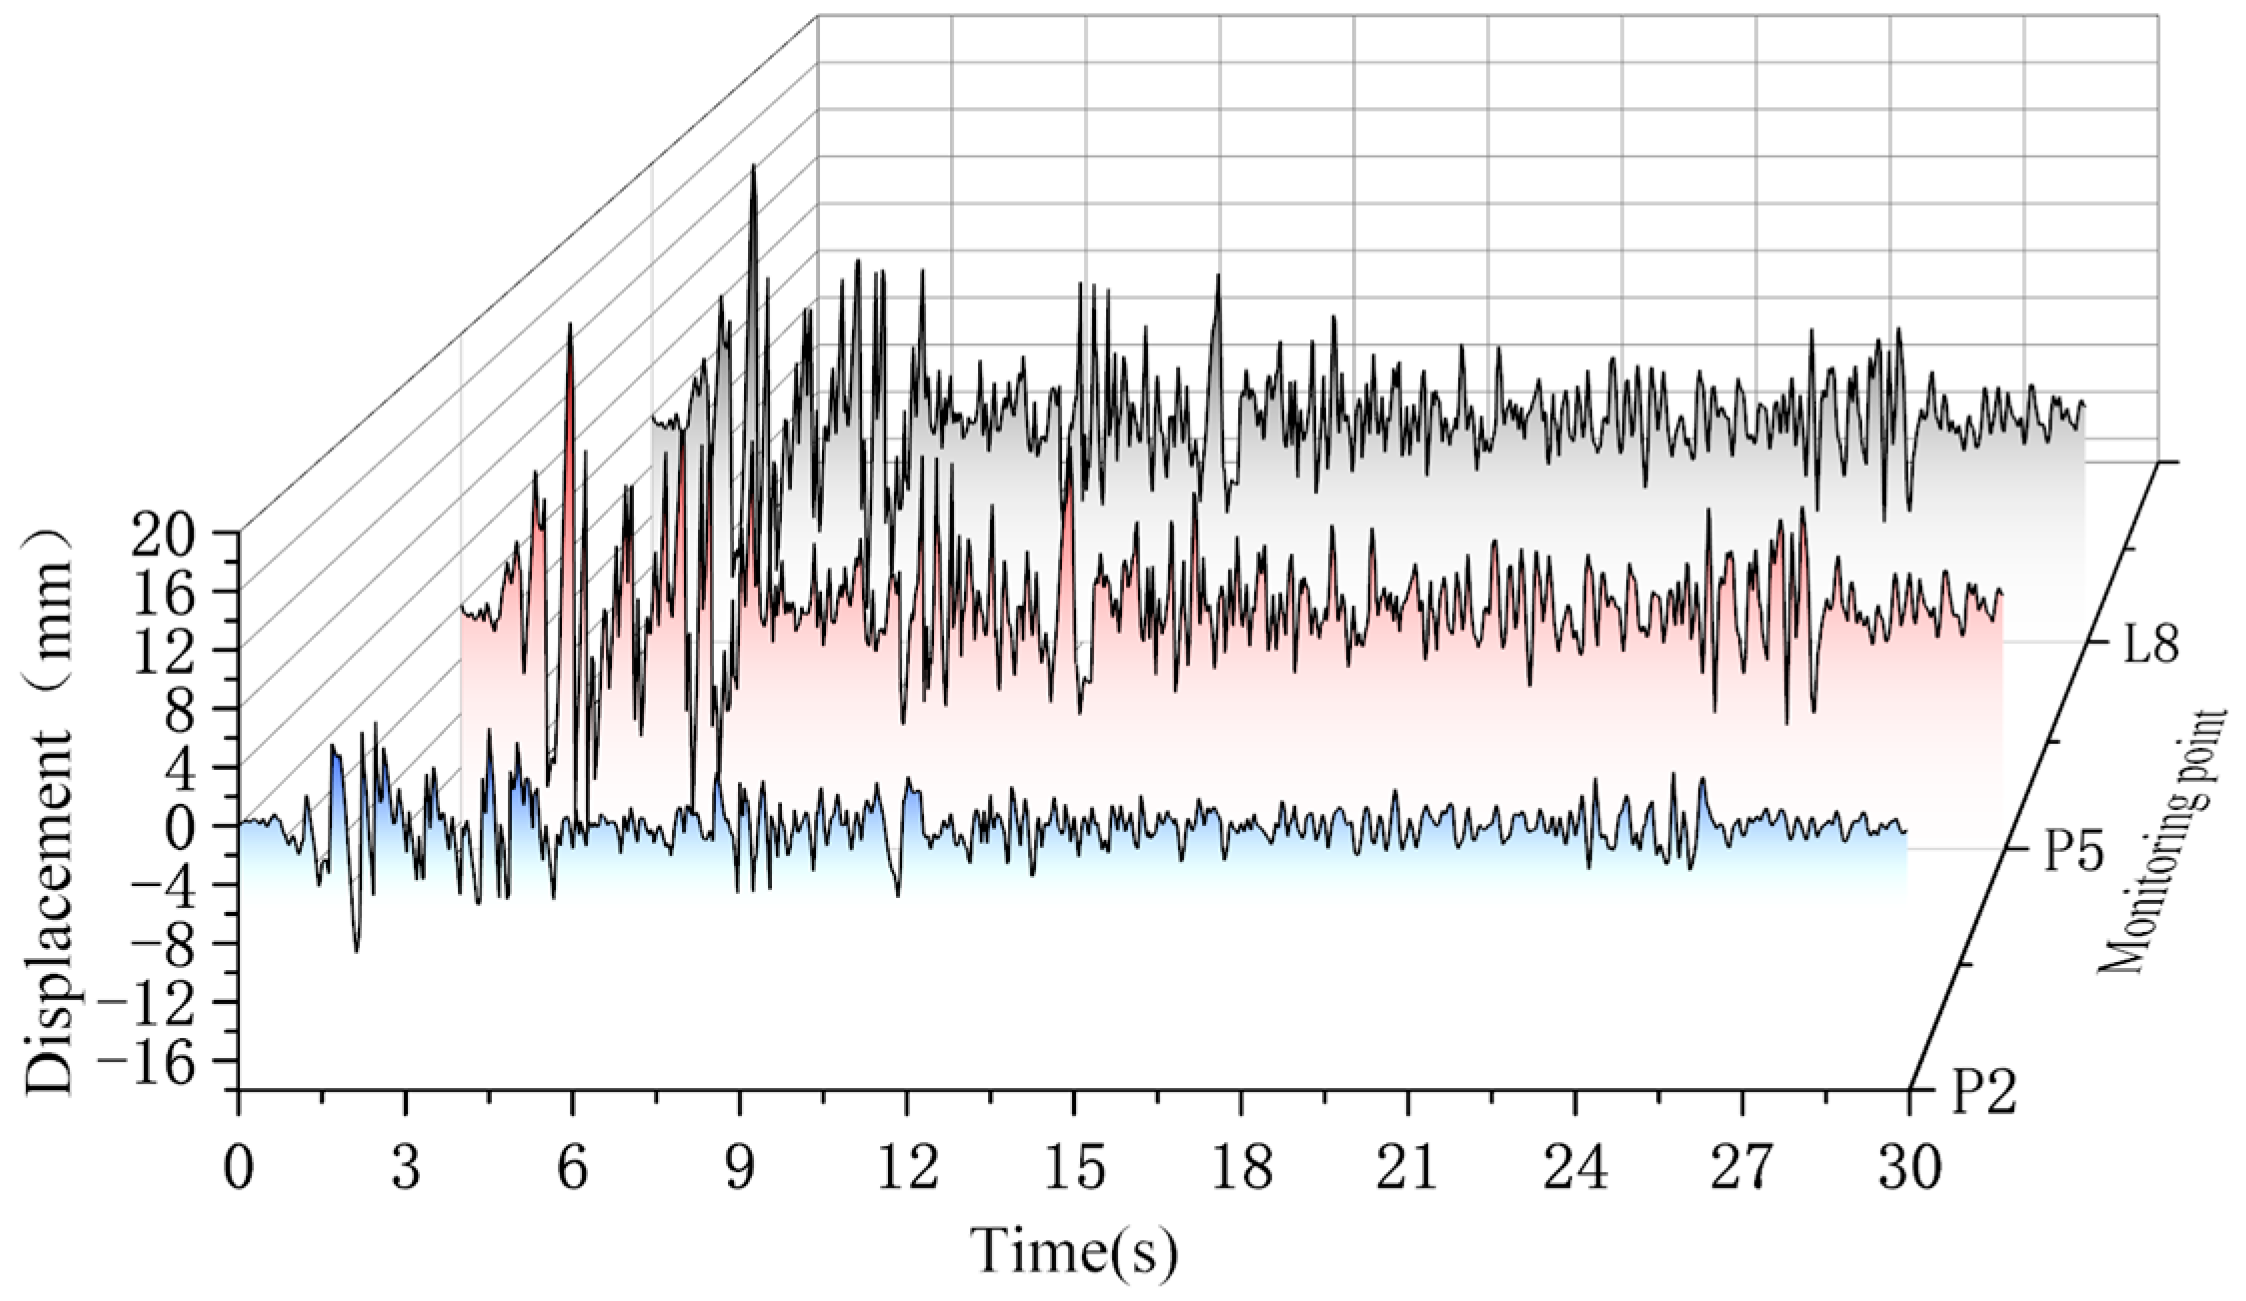
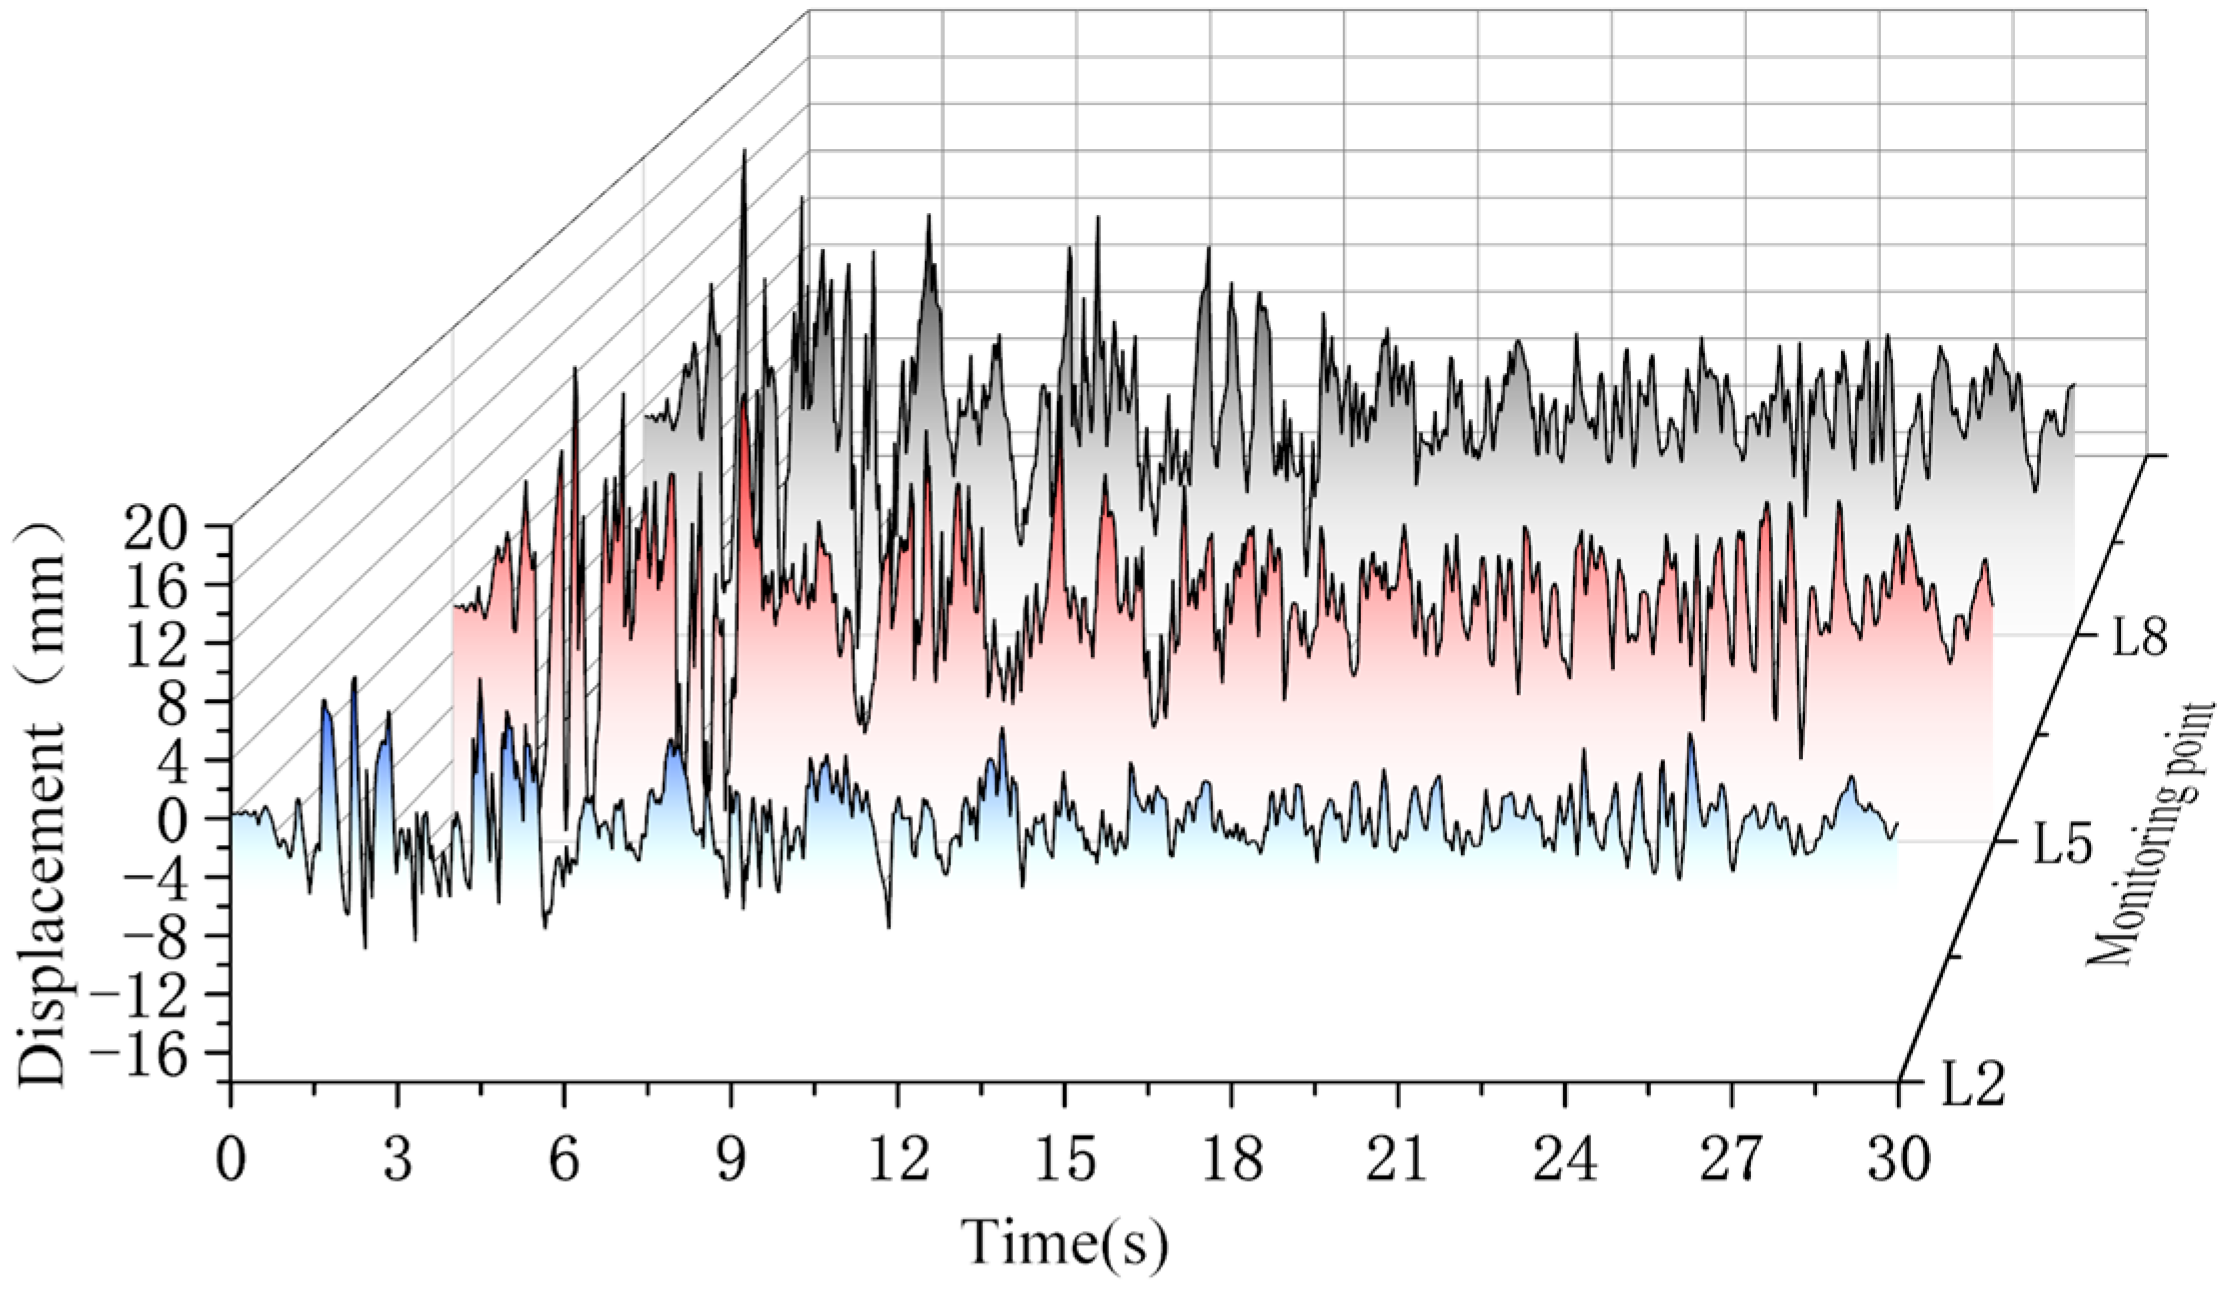
Analysis 2: The monitoring points are located at the midpoints of each slope surface. Figure 6 presents the displacement response curves for monitoring points P2, P5 and P8, while Figure 7 shows the corresponding displacement response curves for monitoring points L2, L5 and L8 obtained through Geo-Studio numerical simulation.
Based on the comparative analysis of the data presented in Table 3, the theoretically calculated peak displacements at the midpoints of each slope face exhibit strong agreement with the results obtained from numerical simulations. The maximum absolute deviation is 0.89 mm, and the maximum relative error is only 4.4%. Specifically, the theoretical peak displacement of the second-level slope increases significantly by 12.02 mm compared to the first-level slope, while the theoretical peak displacement of the third-level slope decreases by 0.92 mm compared to the second-level slope. This behavior can be attributed to the horizontal sliding and shear deformation of the soil in multi-level slopes under seismic action. During this process, a portion of the inertial force generated by the self-weight of the soil is transmitted as an additional vertical load to the lower-level slopes through internal stress redistribution within the soil mass. This mechanism arises because the dynamic response of the upper-level slopes induces variations in stress throughout the slope profile, which are then partially transferred to the underlying layers. Such stress redistribution not only increases the effective vertical stress on the lower slopes but also affects their displacement and stability characteristics. The repeated action of ground motion causes cumulative plastic deformation in the soil of the third-level slope, gradually transferring this deformation to the second-level slope. This results in a significant peak displacement at the mid-point of the second-level slope (at an elevation of 15 m). Furthermore, due to the height effect of the slope, the seismic wave experiences significant wave impedance changes as it propagates from the bottom to the top of the slope. The energy of the seismic wave is redistributed at the interface between each unloading platform, causing phase differences in the vibration between different levels of the slope. This redistribution suppresses the further increase in peak displacement at the third-level slope.
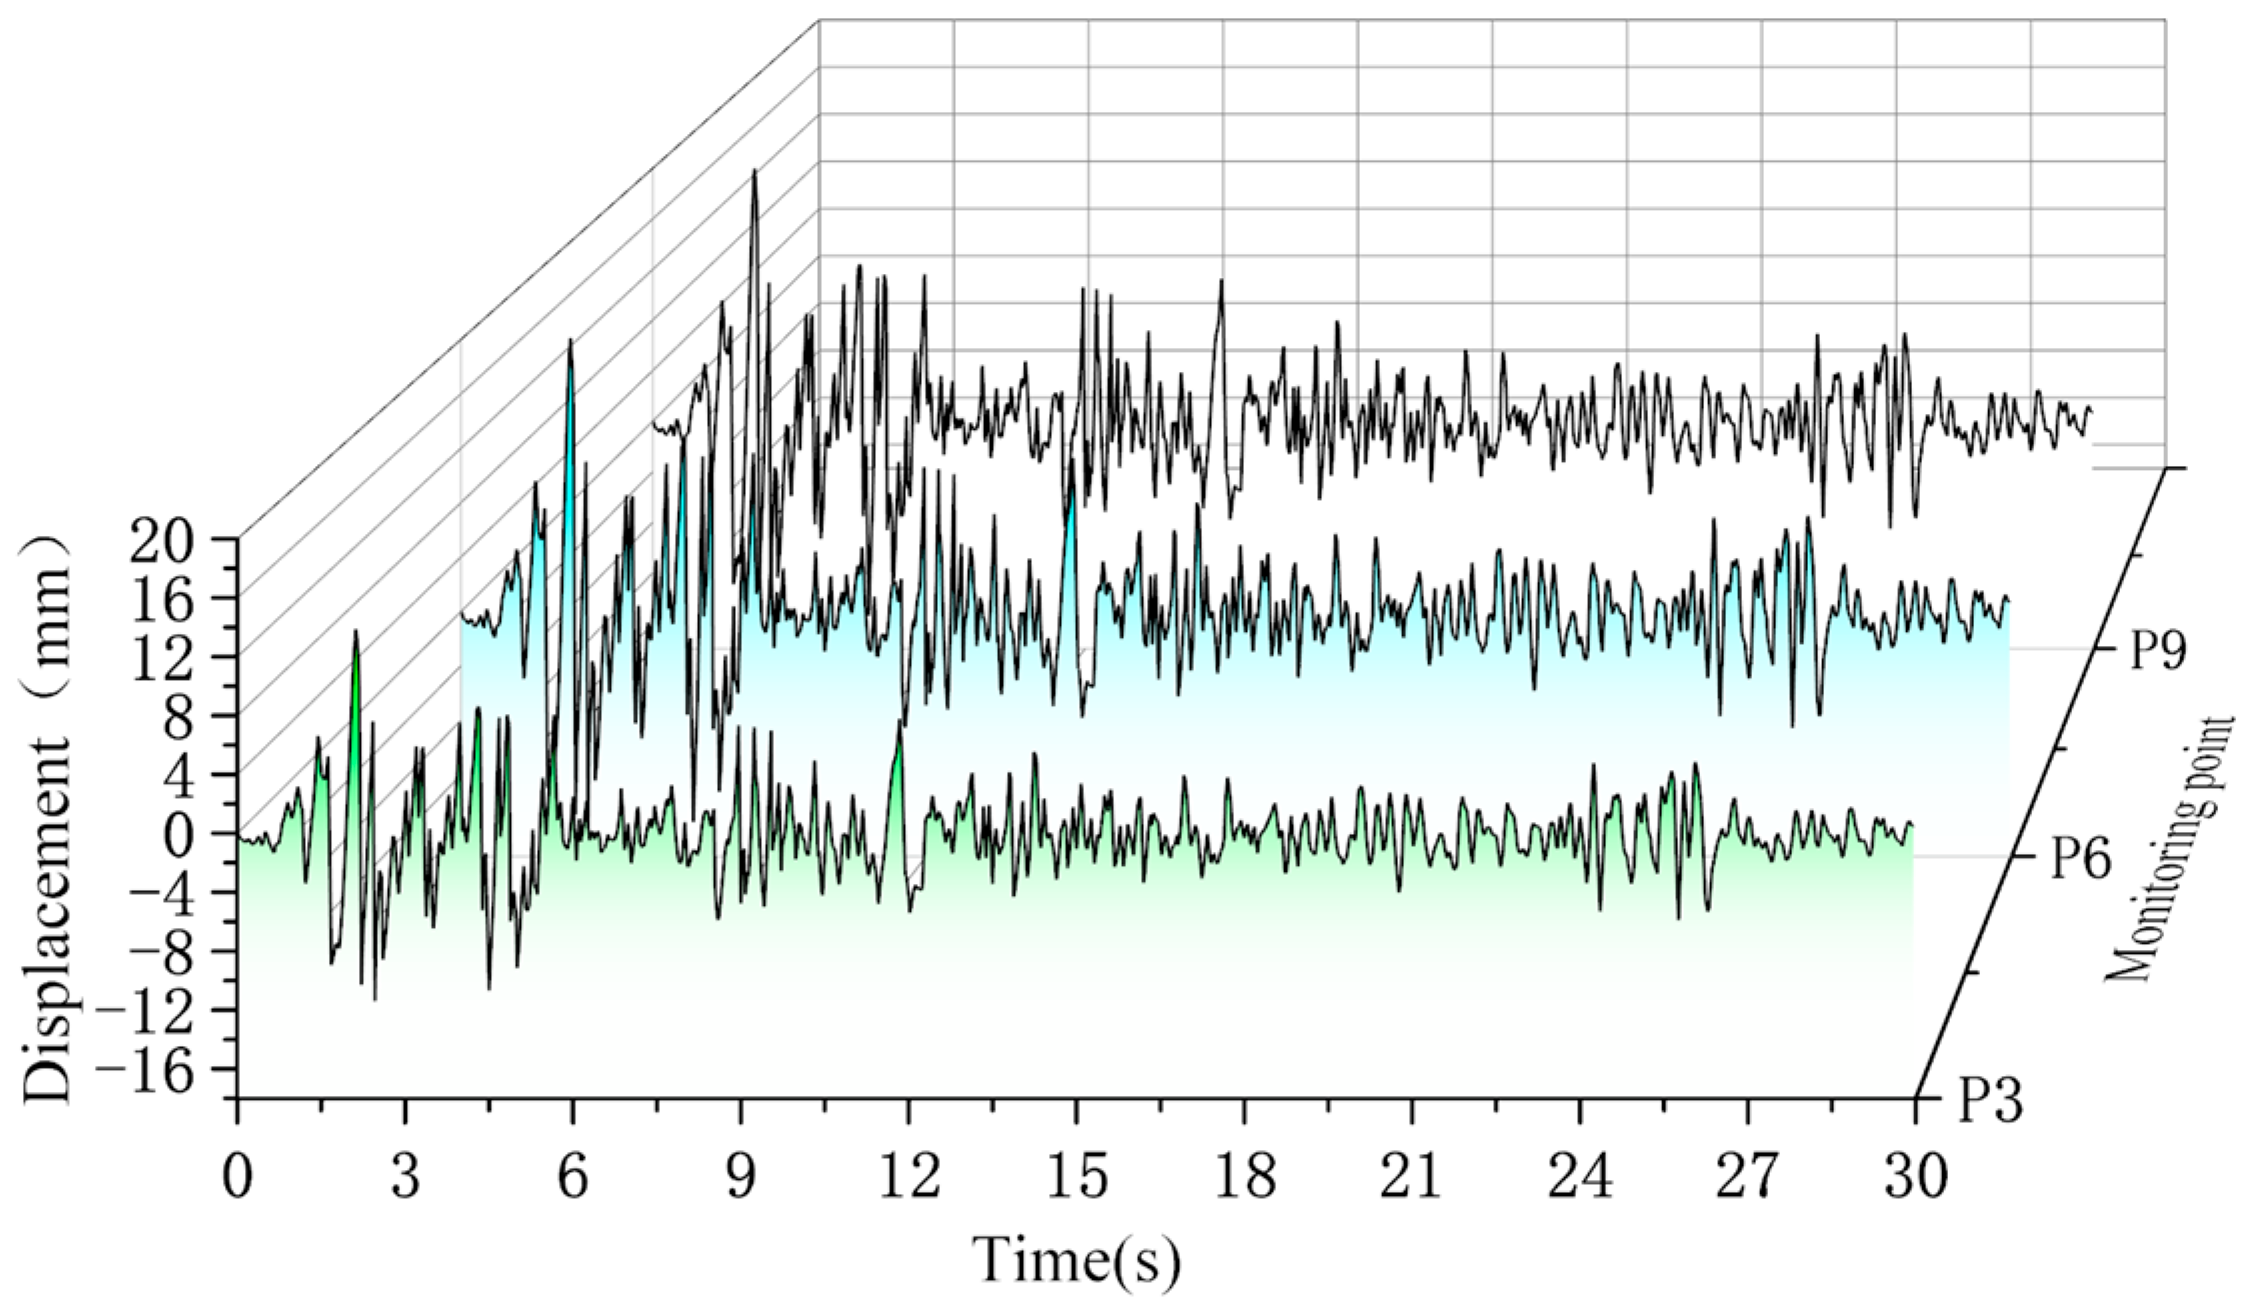
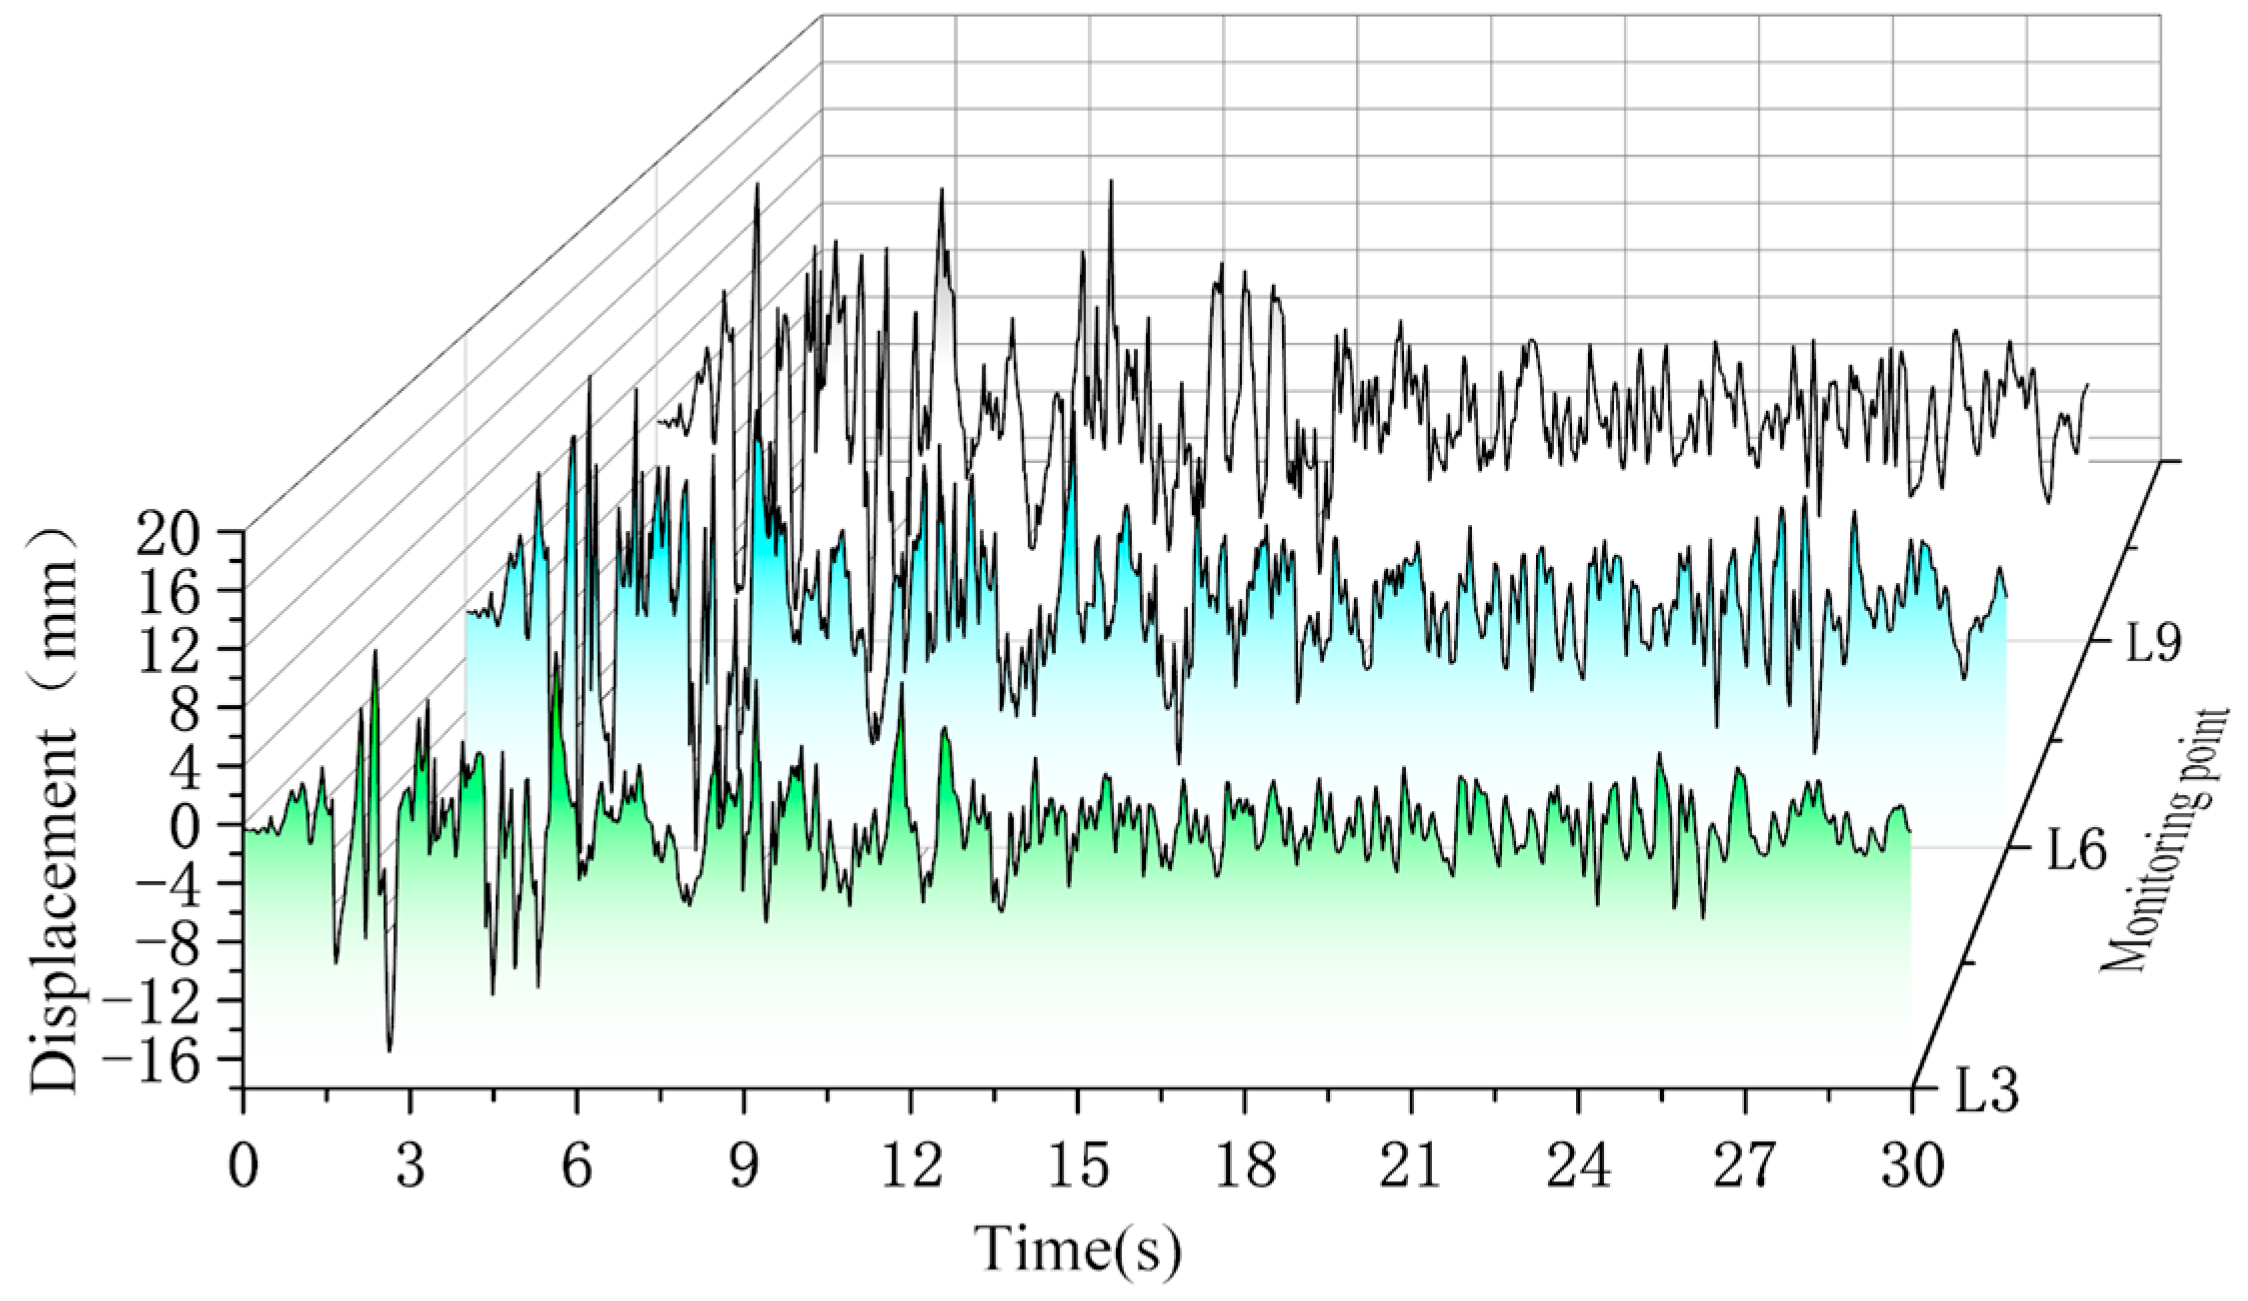
Analysis 3: The monitoring points are positioned at the crest of each slope level to capture the maximum displacement responses during seismic loading. Figure 8 illustrates the displacement response curves of monitoring points P3, P6, and P9, while Figure 9 presents the corresponding curves for monitoring points L3, L6, and L9, as obtained from GeoStudio simulations.
According to the comparison presented in Table 4, the theoretical peak displacement at the top of the slope exhibits strong agreement with the numerical simulation results, with a maximum absolute deviation of 1.46 mm and a relative error within 6.7%. The analysis indicates that the peak displacement at the slope crest under seismic excitation demonstrates a nonlinear variation with elevation, initially increasing and then gradually decreasing. This behavior is primarily attributed to the “double free face effect” caused by the presence of unloading platforms. During seismic loading, the soil above (at the toe of the third-level slope) and below (at the top of the second-level slope) the unloading platform moves in opposite directions, creating a boundary condition akin to a double free face. This condition results in significant stress concentration and localized instability. Therefore, in the design of multi-level excavated slopes, reinforcement measures such as anchor cable-frame beam systems are recommended. These flexible support structures help connect adjacent slope levels, enabling coordinated deformation and improving the overall seismic performance of the slope system.

4.3. Discussion

Comparison with recent studies: The observed nonlinear elevation pattern (peak at the mid-section of the second level) is consistent with the multi-stage energy redistribution described by Zhang et al. [23] and Xue et al. [26], who reported similar mid-level amplification in staged loess slopes. Our predicted peak displacement magnitudes (9–21 mm) are of the same order as the shaking-table results reported by Ye et al. [27] after scaling, where comparable peak displacements were observed (differences within ~10%). However, our parametric results indicate a stronger sensitivity to unloading-platform width than reported in some prior continuum FEM studies. The dynamic response of single-level slopes under seismic loading exhibits a pronounced elevation effect, with peak displacements typically occurring at the slope crest and increasing monotonically with elevation. To enhance validation credibility, supplementary analyses incorporating vertical acceleration components (up to 0.65 × horizontal PGA) were performed. The resulting displacement differences were <5%, confirming that vertical forces have limited influence on horizontal displacement and validating their omission for model simplicity. However, for multi-level high slopes with heights reaching up to 30 m, the dynamic response characteristics differ significantly. In these scenarios, the maximum displacement generally occurs in the upper section of the slope, typically near the midpoint of the slope face. Furthermore, the displacement distribution along elevation displays a nonlinear trend—initially increasing and then gradually decreasing, as illustrated in Figure 10. The observed pattern can be attributed to several key factors: 1. The unloading platforms within the multi-level slope structure play a critical role in stress regulation, effectively mitigating stress concentrations by progressively redistributing the pressure from the overlying soil; 2. The upper-middle section near the slope crest experiences a complex stress boundary condition, as it is simultaneously influenced by the downward force from the overlying soil and the bidirectional free-face effect; 3. As seismic waves propagate from the slope toe to the crest, energy dissipation and phase alterations occur due to wave impedance effects. These findings not only elucidate the unique dynamic response mechanism of multi-level loess slopes under seismic loading but also validate the accuracy and reliability of the proposed horizontal seismic displacement response analysis method for such slopes; 4. In addition to the El-Centro record, Taft (1952) and Kobe (1995) horizontal seismic waves were also applied. Comparative results confirmed that while peak displacements vary slightly (within ±8%), the nonlinear elevation trend remains consistent, validating the general applicability of the proposed method.

5. Conclusions

This paper presents a lumped-mass, Newmark-β-based framework to estimate seismic permanent displacement of multi-level loess slopes. (1) The model reproduces the non-monotonic elevation dependence of peak displacement observed in numerical simulations, with maximum discrepancy <8% versus GeoStudio. (2) Unloading platforms produce graded energy dissipation and can shift the peak displacement to mid-levels—a design implication for placing reinforcement. (3) It is found that the dynamic response mechanism of multi-level slopes significantly differs from that of traditional single-level slopes. A peak displacement zone forms in the middle of the second-level slope (at an elevation of 15 m), resulting from the combined influence of dual free-face boundary conditions, the additional load from the overlying soil, and seismic wave impedance effects. Limitations: the present model assumes homogeneous loess, horizontal forcing only, and circular sliding surfaces. Future work will extend the model to layered/anisotropic soils, include vertical seismic components, and validate against centrifuge and field monitoring data. These steps will improve applicability for practical slope design and resilient infrastructure planning.

Author Contributions

Conceptualization, B.L.; Methodology, B.L. and S.Y.; Resources, B.L., S.Y. and J.L.; Data curation, B.L. and W.Y.; Writing—review and editing, B.L. and S.Y.; Visualization, B.L. and J.L.; Supervision, J.L. and W.Y. All authors have read and agreed to the published version of the manuscript.

Funding

This research was supported by the National Natural Science Foundation of China (Grant No. 52168050), the Gansu Province Higher Education Teacher Innovation Fund Project (Grant No. 2025B-242), the Gansu Province Science and Technology Plan Project (Grant No. 24JRRA292) the Gansu Province Young Talents (Team Project) of CPC Gansu Provincial Committee Organisation Department (No. 2025QNTD09) and the Gansu Province Department of Education, Youth Doctor Support Program (Grant No. 2023QB-052).

Data Availability Statement

The data that support the findings of this study are available from the corresponding author upon reasonable request.

Acknowledgments

The authors acknowledge the support from Lanzhou University of Technology, Lanzhou Institute of Technology and Key Laboratory of Disaster Mitigation in Civil Engineering of Gansu Province.

Conflicts of Interest

The authors declare that there is no competing financial interest or personal relationship that could have appeared to influence the work reported in this paper.

Appendix A. Relevant Formulas

a 0 = 1 β Δ t 2
a 1 = α Δ t β
a 2 = 1 Δ t β
a 3 = 1 2 β 1
a 4 = α β 1
a 5 = Δ t 2 α β 2
a 6 = Δ t ( 1 α )

References

  1. Huang, R.; Li, W. Research on development and distribution rules of geohazards induced by wenchuan earthquake on 12th may. Chin. J. Rock Mech. Eng. 2008, 27, 2585–2592. [Google Scholar]
  2. Huang, R. Mechanism and geomechanical modes of landslide hazards triggered by wenchuan 8.0 earthquake. Chin. J. Rock Mech. Eng. 2009, 28, 1239–1249. [Google Scholar]
  3. Xu, Q.; Peng, D.; Fan, X.M.; Dong, X.; Zhang, X.; Wang, X. Preliminary study on the characteristics and initiation mechanism of zhongchuan town flow slide triggered by jishishan ms 6. 2 earthquake in gansu province. Geomat. Inf. Sci. Wuhan Univ. 2025, 50, 207–222. [Google Scholar]
  4. Zhong, X.; Wang, Q.; Wang, Y. Characteristics of Damage to Rural Houses in the High-Intensity Area of the Jishishan Mw 6.2 Earthquake. Buildings 2024, 14, 3762. [Google Scholar] [CrossRef]
  5. Li, Z. The state of the art of the research on seismic landslide hazard at home and abroad. J. Catastrophology 2003, 18, 65–71. [Google Scholar]
  6. Li, Z.; Zhu, Y. Search model of slip surface and stability analysis of multi-step slope. Chin. J. Rock Mech. Eng. 2006, 25, 2841–2847. [Google Scholar]
  7. Guo, Z.; Huang, Q.; Liu, Y.; Jiang, Z.; Xie, Q.; Yu, D. Stability analysis and design optimization of multi-stage slope in gully land consolidation projects on the loess plateau. Bull. Eng. Geol. Environ. 2023, 82, 431. [Google Scholar] [CrossRef]
  8. Zheng, Y.; Ye, H.; Huang, R. Analysis and discussion of failure mechanism and fracture surface of slope under earthquake. Chin. J. Rock Mech. Eng. 2009, 28, 1714–1723. [Google Scholar]
  9. Jiang, Q.; Deng, Y.; Yang, N. Pseudo-dynamic seismic slope stability analysis based on rigorous slice method. China Earthq. Eng. J. 2023, 45, 716–723. [Google Scholar]
  10. Mostafaei, H.; Gilani, M.; Ghaemian, M. A comparative study between pseudo-static and dynamic analyses on rock wedge stability of an arch dam. Civ. Eng. J. 2018, 4, 179–187. [Google Scholar] [CrossRef]
  11. Yang, C.-W.; Zhang, J.-J.; Fu, X.; Zhu, C.-B.; Bi, J.-W. Improvement of pseudo-static method for slope stability analysis. J. Mt. Sci. 2014, 11, 625–633. [Google Scholar] [CrossRef]
  12. Karray, M.; Hussien, M.; Delisle, M. Framework to assess pseudo-static approach for seismic stability of clayey slopes. Can. Geotech. J. 2018, 55, 1860–1876. [Google Scholar] [CrossRef]
  13. Steedman, R.; Zeng, X. The influence of phase on the calculation of pseudo-static earth pressure on a retaining wall. Geotechnique 1990, 40, 103–112. [Google Scholar] [CrossRef]
  14. Zeng, X.; Steedman, R. On the behaviour of quay walls in earthquakes. Geotechnique 1993, 43, 417–431. [Google Scholar] [CrossRef]
  15. Choudhury, D.; Nimbalkar, S. Seismic passive resistance by pseudo-dynamic method. Geotechnique 2005, 55, 699–702. [Google Scholar] [CrossRef]
  16. Choudhury, D.; Nimbalkar, S. Pseudo-dynamic approach of seismic active earth pressure behind retaining wall. Geotech. Geol. Eng. 2006, 24, 1103–1113. [Google Scholar] [CrossRef]
  17. Choudhury, D.; Nimbalkar, S. Seismic rotational displacement of gravity walls by pseudo-dynamic method: Passive case. Soil Dyn. Earthq. Eng. 2007, 27, 242–249. [Google Scholar] [CrossRef]
  18. Baziar, M.; Shahnazari, H.; Rabeti Moghadam, M. Sliding stability analysis of gravity retaining walls using the pseudo-dynamic method. Proc. Inst. Civ. Eng.-Geotech. Eng. 2013, 166, 389–398. [Google Scholar] [CrossRef]
  19. Yan, Z.; Deng, Y.; He, J.; Xuan, Y.; Wu, W. A pseudo-dynamic approach of seismic active pressure on retaining walls based on a curved rupture surface. Math. Probl. Eng. 2020, 2020, 6462034. [Google Scholar] [CrossRef]
  20. Deng, Y.; Xu, Z.; Sun, K. Pseudo dynamic seismic slope stability analysis method considering wave propagation effects. J. Earth Sci. Environ. 2019, 41, 623–630. [Google Scholar]
  21. Yan, M.; Xia, Y.; Liu, T. Limit analysis under seismic conditions of a slope reinforced with prestressed anchor cables. Comput. Geotech. 2019, 108, 226–233. [Google Scholar] [CrossRef]
  22. Cui, Y.; Liu, A.; Xu, C.; Zheng, J. A modified newmark method for calculating permanent displacement of seismic slope considering dynamic critical acceleration. Adv. Civ. Eng. 2019, 2019, 9782515. [Google Scholar] [CrossRef]
  23. Zhang, X.; Zhang, X.; Ye, S. Calculation for permanent displacement of single slip surface of multi-stage loess slope based on energy method. Appl. Sci. 2022, 12, 8426. [Google Scholar] [CrossRef]
  24. Ye, S.; Xue, T.; Zhang, W. Multi-stage slope displacement analysis based on real-time dynamic newmark slider method. Soil Dyn. Earthq. Eng. 2023, 174, 108209. [Google Scholar] [CrossRef]
  25. Wang, D.; Li, X.; Guo, P. Analysis of the influence of step-by-step construction and prestress loss on the reinforcement of multi-stage slope by frame prestressed anchor. J. Ground Improv. 2023, 5, 383–390. [Google Scholar]
  26. Xue, T.; Ye, S.; Cao, C. Permanent displacement analysis of multistage loess slopes with multiple slip surfaces based on energy methods. Int. J. Geomech. 2023, 23, 04023192. [Google Scholar] [CrossRef]
  27. Ye, S.; Zhao, Z.; Zhu, Y. Experimental study of the shaking table test and dynamic response of the loess slope reinforced by frame anchors. Soil Mech. Found. Eng. 2022, 59, 272–280. [Google Scholar] [CrossRef]
  28. Ye, S.; Huang, A. Sensitivity analysis of factors affecting stability of cut and fill multistage slope based on improved grey incidence model. Soil Mech. Found. Eng. 2020, 57, 8–17. [Google Scholar] [CrossRef]
  29. Wu, H.; Shao, S.; Shao, S. Variations in dynamic shear modulus of loess exposed to dry-wet cycles from xi’an area, China. Soil Dyn. Earthq. Eng. 2023, 173, 108126. [Google Scholar] [CrossRef]
  30. Li, J.; Ye, S.; Cui, X.; Liu, B.; Li, N. Displacement Calculation of a Multi-Stage Homogeneous Loess Slope Under Seismic Action. Buildings 2025, 15, 1484. [Google Scholar] [CrossRef]
  31. Ye, S.; Huang, A.; Fang, G. Dynamic response law and stability analysis of loess multi-stage high fill slope under horizontal seismic action. Technol. Earthq. Disaster Prev. 2020, 15, 1–10. [Google Scholar]
  32. Ye, S.; Fang, G.; Zhu, Y. Model establishment and response analysis of slope reinforced by frame with prestressed anchors under seismic considering the prestress. Soil Dyn. Earthq. Eng. 2019, 122, 228–234. [Google Scholar] [CrossRef]
  33. Bray, J.D.; Macedo, J. Performance-based seismic assessment of slope systems. Soil Dyn. Earthq. Eng. 2023, 168, 107–835. [Google Scholar] [CrossRef]
  34. Huang, B.; Ni, H.; Jin, Y.; Lu, Y. The integrated drill string dynamic model based on the lumped mass method and discrete element method. Mech. Syst. Signal Process. 2024, 221, 111723. [Google Scholar] [CrossRef]
  35. Makdisi, F.; Seed, H. Simplified procedure for estimating dam and embankment earthquake-induced deformations. J. Geotech. Eng. Div. 1978, 104, 849–867. [Google Scholar] [CrossRef]
  36. Kramer, S.; Smith, M. Modified newmark model for seismic displacements of compliant slopes. J. Geotech. Geoenvironmental Eng. 1997, 123, 635–644. [Google Scholar] [CrossRef]
  37. Acheampong, L.; Bryson, S. Estimation of unsaturated small-strain shear modulus in a laboratory test box and field site from a soil-water characteristic curve. Transp. Geotech. 2025, 52, 101599. [Google Scholar] [CrossRef]
  38. Zhang, W.; Han, L.; Feng, L.; Ding, X.; Wang, L.; Chen, Z.; Liu, H.; Aljarmouzi, A.; Sun, W. Study on seismic behaviors of a double box utility tunnel with joint connections using shaking table model tests. Soil Dyn. Earthq. Eng. 2020, 136, 106118. [Google Scholar] [CrossRef]
  39. Patil, M.; Choudhury, D.; Ranjith, P.; Zhao, J. Behavior of shallow tunnel in soft soil under seismic conditions. Tunn. Undergr. Space Technol. 2018, 82, 30–38. [Google Scholar] [CrossRef]
  40. Ma, C.; Lu, D.; Du, X.; Qi, C. Effect of buried depth on seismic response of rectangular underground structures considering the influence of ground loss. Soil Dyn. Earthq. Eng. 2018, 106, 278–297. [Google Scholar] [CrossRef]
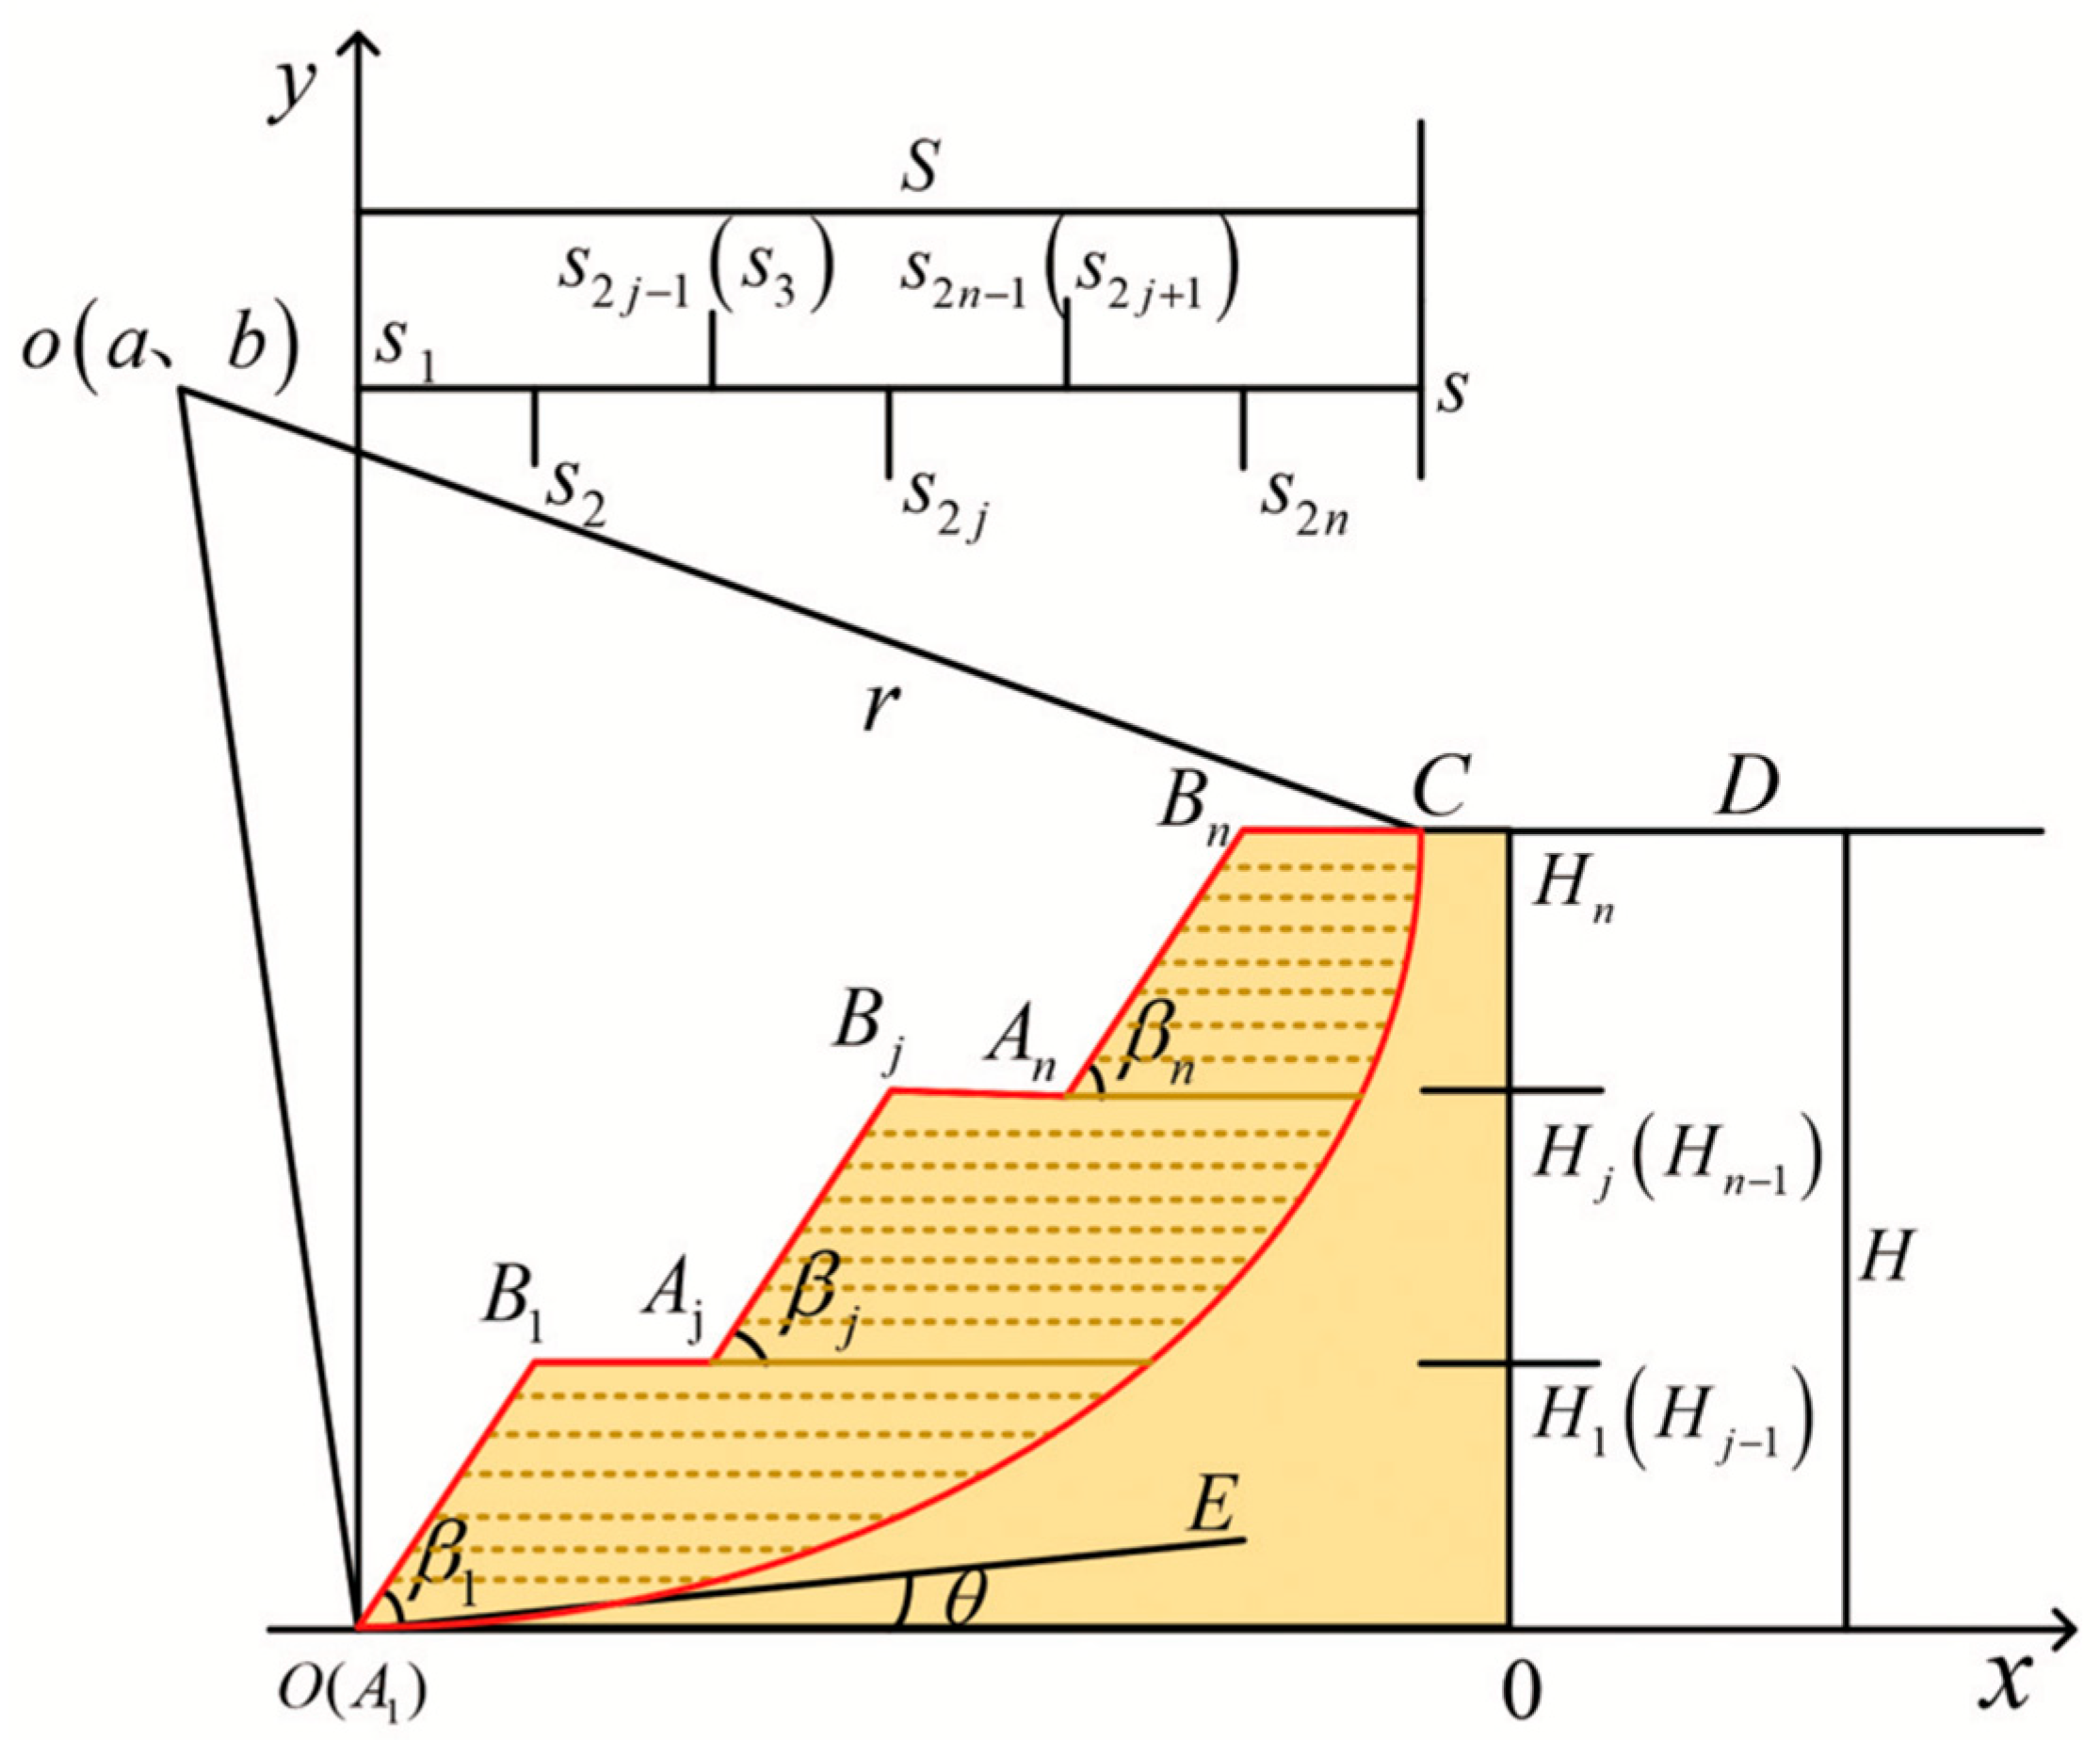
Figure 1. Calculation model of slope dynamic response by concentrated mass method.
Buildings 15 03695 g001
Figure 2. Time history curve of ground acceleration for the El-Centro earthquake.
Buildings 15 03695 g002
Figure 3. Numerical calculation model of the multi-level loess slope (Li = Pi).
Buildings 15 03695 g003
Figure 4. Theoretical displacement response curves of monitoring points P3, P4, P6, and P7 at each level of the unloading platform.
Buildings 15 03695 g004
Figure 5. Theoretical displacement response curves of monitoring points L3, L4, L6, and L7 at each level of the unloading platform.
Buildings 15 03695 g005
Figure 6. Theoretical displacement response curves of monitoring points P2, P5, and P8 at the midpoints of the slopes at various levels.
Buildings 15 03695 g006
Figure 7. The displacement response curves of the numerical simulation for the monitoring points L2, L5 and L8 at the midpoints of the slope surfaces at various levels.
Buildings 15 03695 g007
Figure 8. Theoretical displacement response curves of monitoring points P3, P6, and P9 at the midpoints of the slopes at various levels.
Buildings 15 03695 g008
Figure 9. Displacement response curves from the numerical simulation for monitoring points L3, L6, and L9 located at the top of each slope level.
Buildings 15 03695 g009
Figure 10. Peak Displacement Diagram of Monitoring Points on Slope under Earthquake Action.
Buildings 15 03695 g010
Table 1. Physical and Mechanical Properties of Soil in Multi-level Loess Slopes.
Soil ParametersNumerical Value
Weight density of soil, γ (kN/m3)16.8
Internal friction angle, φ (◦)24
Cohesion, c (kPa)16
Dynamic shear modulus, G (MPa)220
Poisson’s ratio0.3
Damping ratio0.1
Table 2. Comparison of Theoretical and Numerical Simulation Results for Unloading Platform Displacement at All Slope Levels.
-Monitoring PointP3/L3P4/L4P6/L6P7/L7
Peak Displacement
/mm
Theoretical results15.4314.8721.4821.59
Simulation results15.5415.3820.0220.07
Table 3. Theoretical and numerical simulation calculation results at the mid - points of slope surfaces at various levels.
-Monitoring PointP2/L2P5/L5P8/L8
Peak Displacement
/mm
Theoretical results9.2821.3020.38
Simulation results10.0420.4120.76
Table 4. Comparative Analysis of Theoretical and Numerical Simulation Results for Slope Crest Displacement at Different Levels.
-Monitoring PointP3/L3P6/L6P9/L9
Peak Displacement
/mm
Theoretical results15.4321.4820.47
Simulation results15.5420.0219.57
Disclaimer/Publisher’s Note: The statements, opinions and data contained in all publications are solely those of the individual author(s) and contributor(s) and not of MDPI and/or the editor(s). MDPI and/or the editor(s) disclaim responsibility for any injury to people or property resulting from any ideas, methods, instructions or products referred to in the content.