Article

Spatial Scale, Enclosure, and Material Impacts on Micro-Housing Perception: Multimodal Physiological Evidence

1
School of Architecture and Art Design, Hebei University of Technology, Tianjin 300130, China
2
Center for Urban and Rural Renewal and Architectural Heritage Protection, Hebei University of Technology, Tianjin 300130, China
3
China Railway Design Corporation, Tianjin 300308, China
4
School of Architecture, Tianjin University, Tianjin 300072, China
*
Author to whom correspondence should be addressed.
These authors contributed equally to this work.
Buildings 2025, 15(20), 3694; https://doi.org/10.3390/buildings15203694
Submission received: 25 August 2025 / Revised: 5 October 2025 / Accepted: 9 October 2025 / Published: 14 October 2025

Abstract

Micro-housing has gained prominence as a sustainable urban residential solution, yet the impact of its spatial design on occupants’ perceptual and physiological responses remains underexplored. This study employs a multimodal approach to investigate how three key spatial elements—spatial scale (SS), window-to-wall ratio (WWR), and interface material (IM)—influence human perception in micro-housing environments. A full-factorial experimental design with 12 distinct conditions was implemented in a controlled laboratory setting. We collected both subjective evaluations and multimodal physiological data—including electroencephalography (EEG), electromyography (EMG), skin conductance (SC), and blood volume pulse (BVP)—from 30 participants. Subjective results indicate that all three spatial elements significantly affect spatial perception and overall comfort, with the influence hierarchy being SS > WWR > IM. Notably, a compensatory effect was observed: increasing the WWR enhanced the perceived spatial area, particularly in mid-sized spaces. Physiologically, SS significantly influenced SC, WWR affected the EEG beta power ratio (BR), and IM impacted the EEG alpha/beta (A/B) ratio, corroborating the subjective findings. Interaction effects were also identified: SS interacted with WWR in area evaluation, and with IM in both area and window size evaluations. This study provides empirical evidence that spatial form elements directly and interactively shape human perception, offering practical insights for enhancing livability in micro-housing through design optimization. The integration of subjective and physiological metrics also establishes a robust methodological framework for future research on human-centered spatial design.

1. Introduction

From a temporal perspective, individuals spend approximately 66% of their time in indoor residential environments [1], underscoring the profound impact of these environments on occupant health, comfort, and productivity. Extensive research has established significant relationships between key indoor environmental factors—such as thermal, visual, and auditory comfort, as well as air quality—and critical human outcomes including health, efficiency, productivity, and mental well-being [2]. As the demand for higher-quality living spaces grows, the research focus has expanded beyond these traditional physical performance elements to encompass the role of spatial morphology itself. Specifically, the influence of spatial elements—including spatial scale (SS), the area ratio of window to wall (WWR), and interface material (IM)—on health has attracted increasing scholarly attention. For instance, living space size can impact psychological health by influencing resident activities and values [3]. IM also modulates resident perceptions and emotional responses; exposure to wood-based environments has been shown to enhance comfort, lower blood pressure, and improve blood oxygen saturation, indicating reduced stress and anxiety levels [4]. Furthermore, WWR affects emotions, as enclosed spaces can activate brain regions associated with fear [5], leading to elevated stress and more negative emotions [6].
Micro-housing spaces, characterized by their small size, bring residents physically closer to the spatial interfaces, making them more sensitive to the perception of spatial elements. Even minor changes in spatial form can significantly impact the health and well-being of the occupants. It is challenging to establish a direct link between spatial form elements and health because these elements interact with the human sensory organs and are transmitted to the brain, where they are integrated with existing cognitive processes and spatial needs, forming a perception of the space. The perception within the acceptable range guides individuals toward adaptive or corrective behavior. However, when the perception exceeds the comfort threshold, it may negatively impact health, such as discomfort triggered by narrow proportions of space, hence raising psychological health risks [7]. Thus, it is essential to explore how spatial form impacts the perceptions of residents to improve living health conditions.
Previous architectural studies on the impact of spatial form on the perceptions of residents primarily relied on subjective methods, such as questionnaires and interviews, which are easy to collect and cost-effective. However, these methods can introduce semantic bias during the process of interpreting and analyzing data. Furthermore, under subtle environmental changes, individuals may struggle to accurately describe these changes using language, whereas physiological indicators may reveal fluctuations. For example, in a short-term experiment, subjective questionnaires did not demonstrate changes in participants’ emotions, stress, or Sick Building Syndrome (SBS) symptoms, but physiological indicators such as SpO2, pNN50, and RMSSD exhibited significant differences [8]. The development of physiological measurement techniques provides a new perspective for objectively capturing the effects of micro-housing spatial forms on the perceptions of residents. Thus, this study aimed to collect both physiological data (Electroencephalography (EEG), Electromyography (EMG), Skin Conductance (SC), Blood Volume Pulse (BVP), Skin Temperature (ST)) and subjective perception evaluation data across different experimental conditions. The combined subjective and objective data corroborated with each other to strengthen the accuracy and objectivity of measuring the effects of spatial form on residents’ perceptions, as well as the generalizability and reliability of the research conclusions. The physiological indicators involved in this study include EEG, EMG, SC, ST, and BVP.
(1)
EEG
The brain, as a complex organ, is highly energy-consuming. While it comprises only 2% of the body’s mass, it requires up to 20% of the body’s energy for processing neural information and performing neural computations [9,10]. This process is accompanied by a substantial amount of EEG signals. The brain’s EEG energy, which varies across different environments, can be transformed into signals at various frequencies through the Fast Fourier Transform (FFT). EEG signals are typically divided into five frequency bands: δ (<3 Hz), θ (3–8 Hz), α (8–12 Hz), β (12–30 Hz), and γ (>30 Hz). The corresponding human states associated with these frequency bands are detailed in Table 1.
(2)
EMG
Muscle activity in different regions of the face is closely related to the emotions and perceptions of the subject. For example, activities in the zygomaticus major muscle and corrugator supercilii muscle are associated with positive emotions and negative emotions, respectively [12]. Therefore, EMG signals can be adopted to evaluate emotional responses in subjects across different spatial environments. In this study, the EMG data from the frontal muscles of the subjects were collected.
(3)
SC
The electrodermal response in the hands and feet is highly sensitive to environmental changes [13]. Skin Conductance (SC) reflects emotional changes in the subject. For example, some researchers established the method of Galvanic Skin Response (GSR) to evaluate the intensity of happiness and sadness and tested its feasibility in emotional computing applications [13,14]. Vijaya and Shivakumar [15] classified emotions by SC. Generally, sympathetic nervous activity increases during emotional tension, fear, or anxiety, inducing increased sweat gland activity, enhanced conductivity, and thus higher SC readings. Conversely, SC levels decrease when the subject is calm (Table 2).
(4)
ST
Compared to other peripheral physiological signals such as SC and EMG, Skin Temperature (ST) presents lower temporal resolution and smaller fluctuations. Nevertheless, it is still correlated with emotional changes [16] and can reflect variations in blood flow and different emotional states [17]. When the sympathetic nervous system is activated, the smooth muscles of subcutaneous blood vessels contract, bringing about a decrease in local blood flow and ST. Conversely, ST rises when sympathetic nervous activity decreases. Therefore, variations in ST can serve as an indicator of emotional changes.
(5)
BVP
BVP, typically occurring in sync with the heartbeat, indicates the blood flow within the blood vessels and the pressure changes in the cardiovascular system. Its amplitude and waveform are associated with the contraction and relaxation of the heart. Heart Rate (HR) and HR variability can be derived from BVP signals. HR, representing the number of heartbeats per unit of time, is determined by analyzing the periodic changes in the BVP signal [18]. It is a key indicator of the cardiovascular system’s operational state and activity load. BVP can be utilized to monitor heart health and assess physical endurance, fatigue levels, and emotional states. In this study, the HR variation in BVP was analyzed to assess the human perception results in different spatial environments.
In summary, multimodal objective physiological measurement techniques were combined with subjective perception questionnaire data in this study to enhance residential comfort and investigate the impact of spatial form in micro-housing environments on perceptions of residents.

2. Methods

2.1. Experimental Room

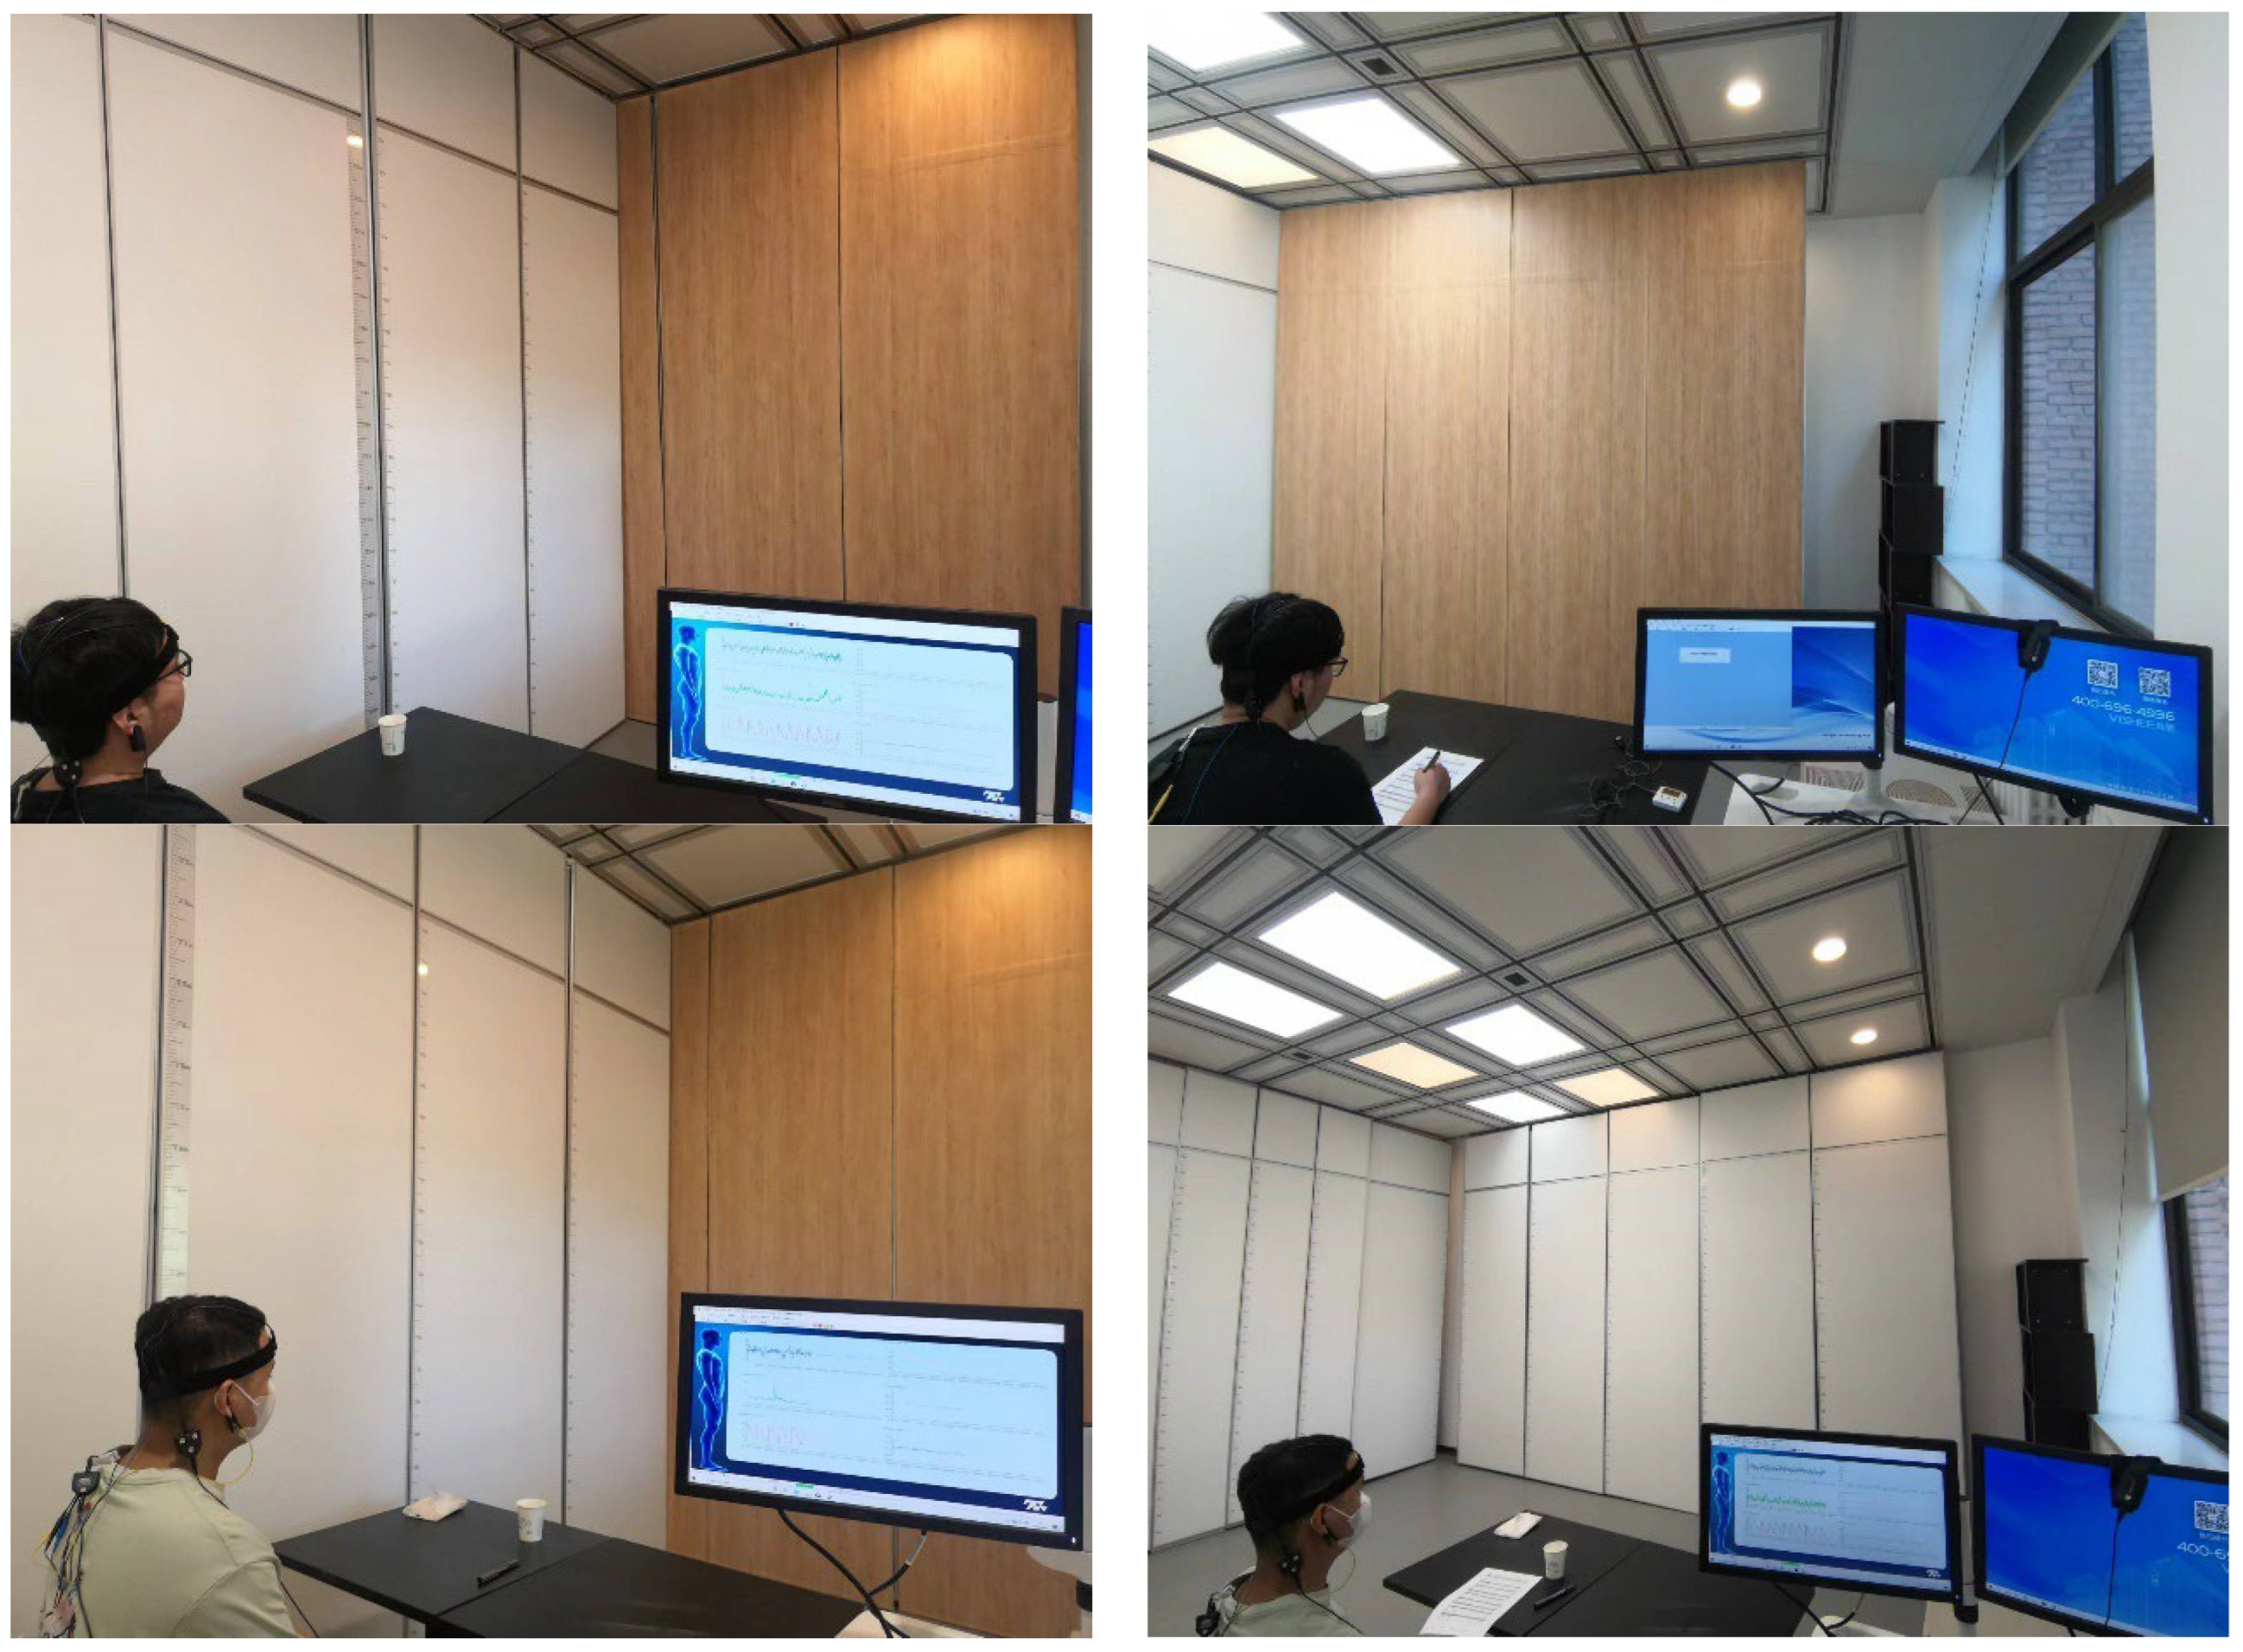
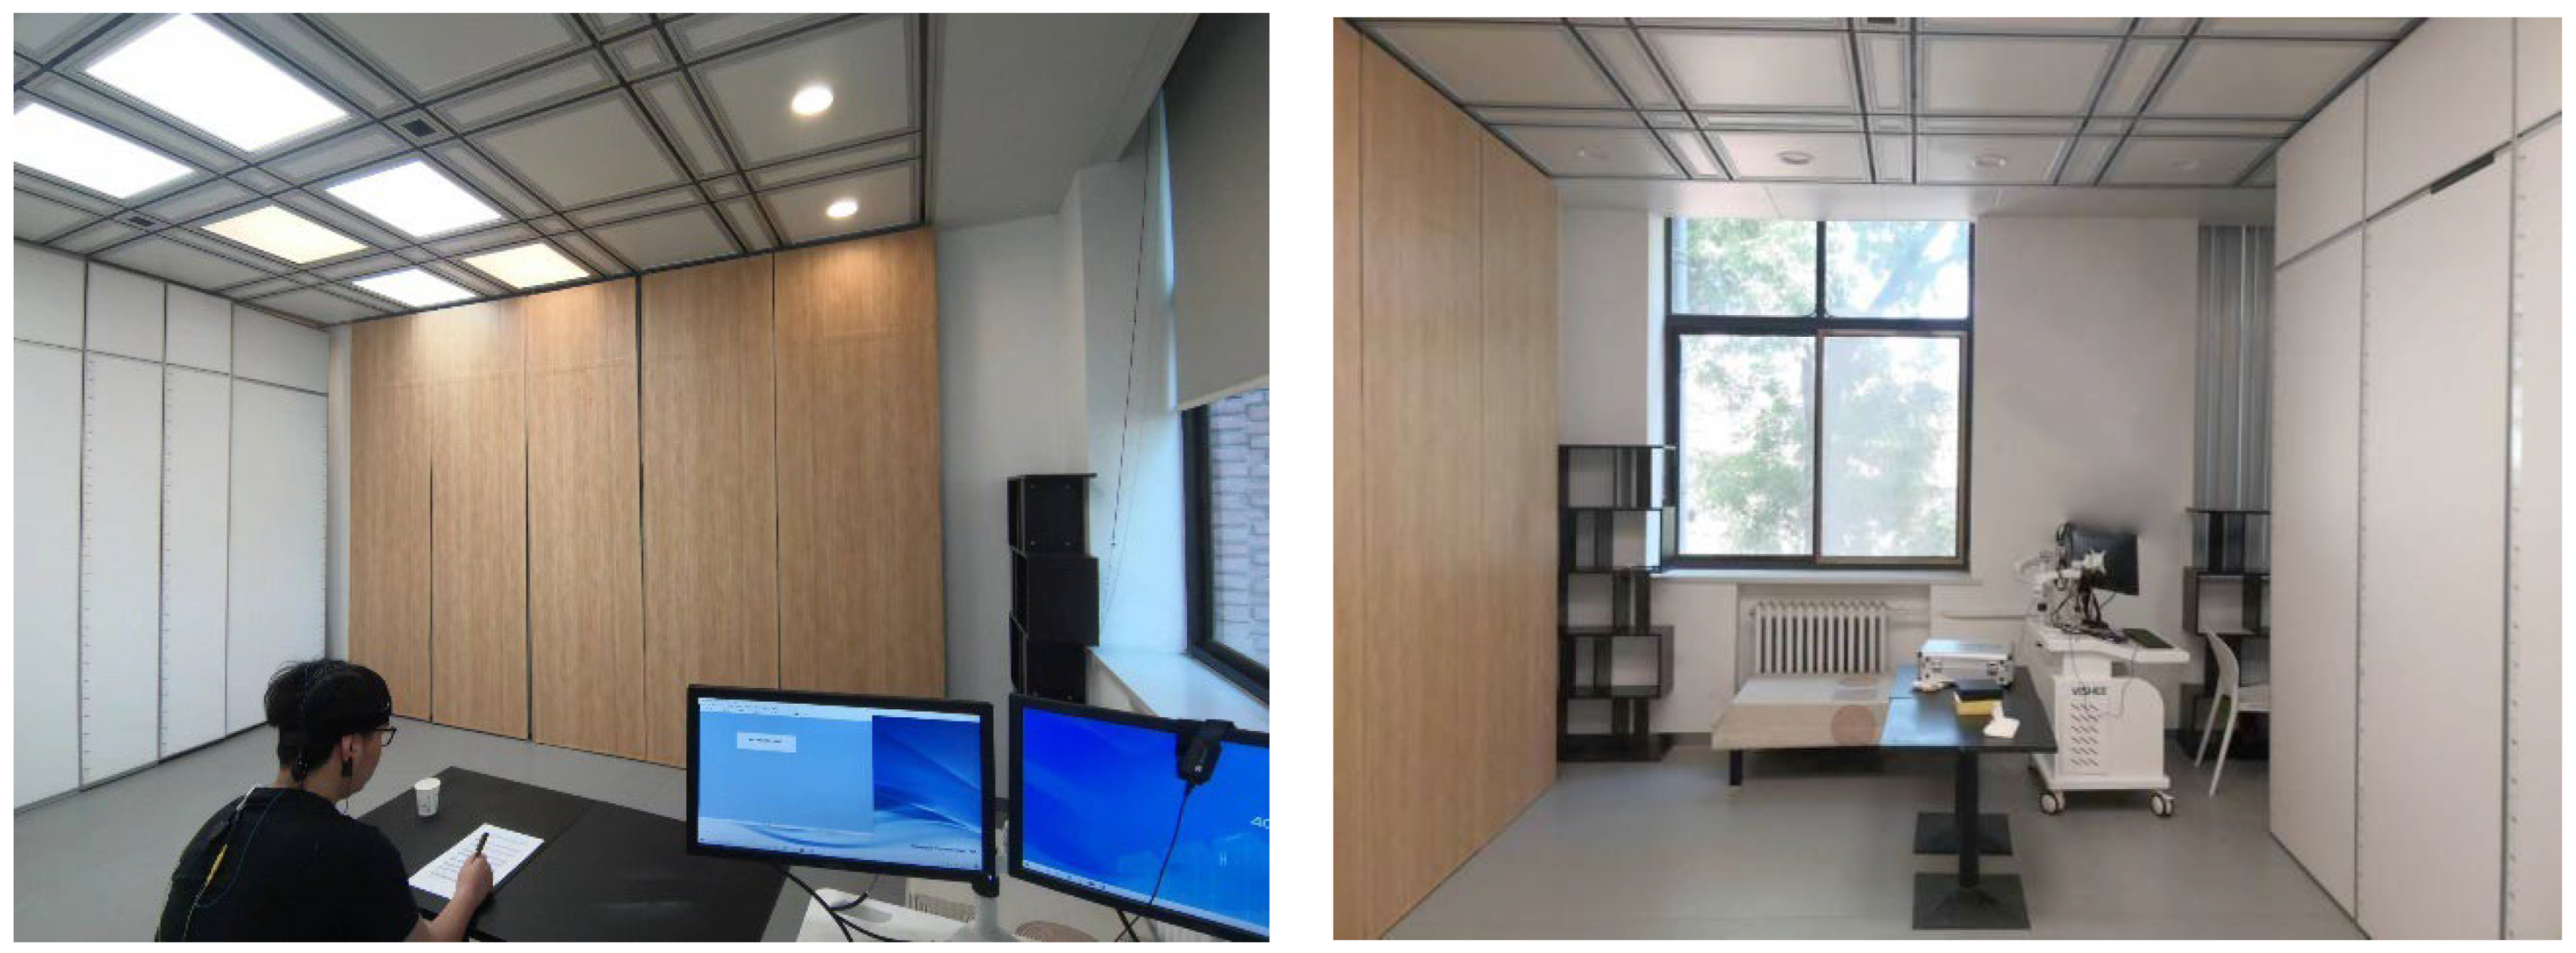
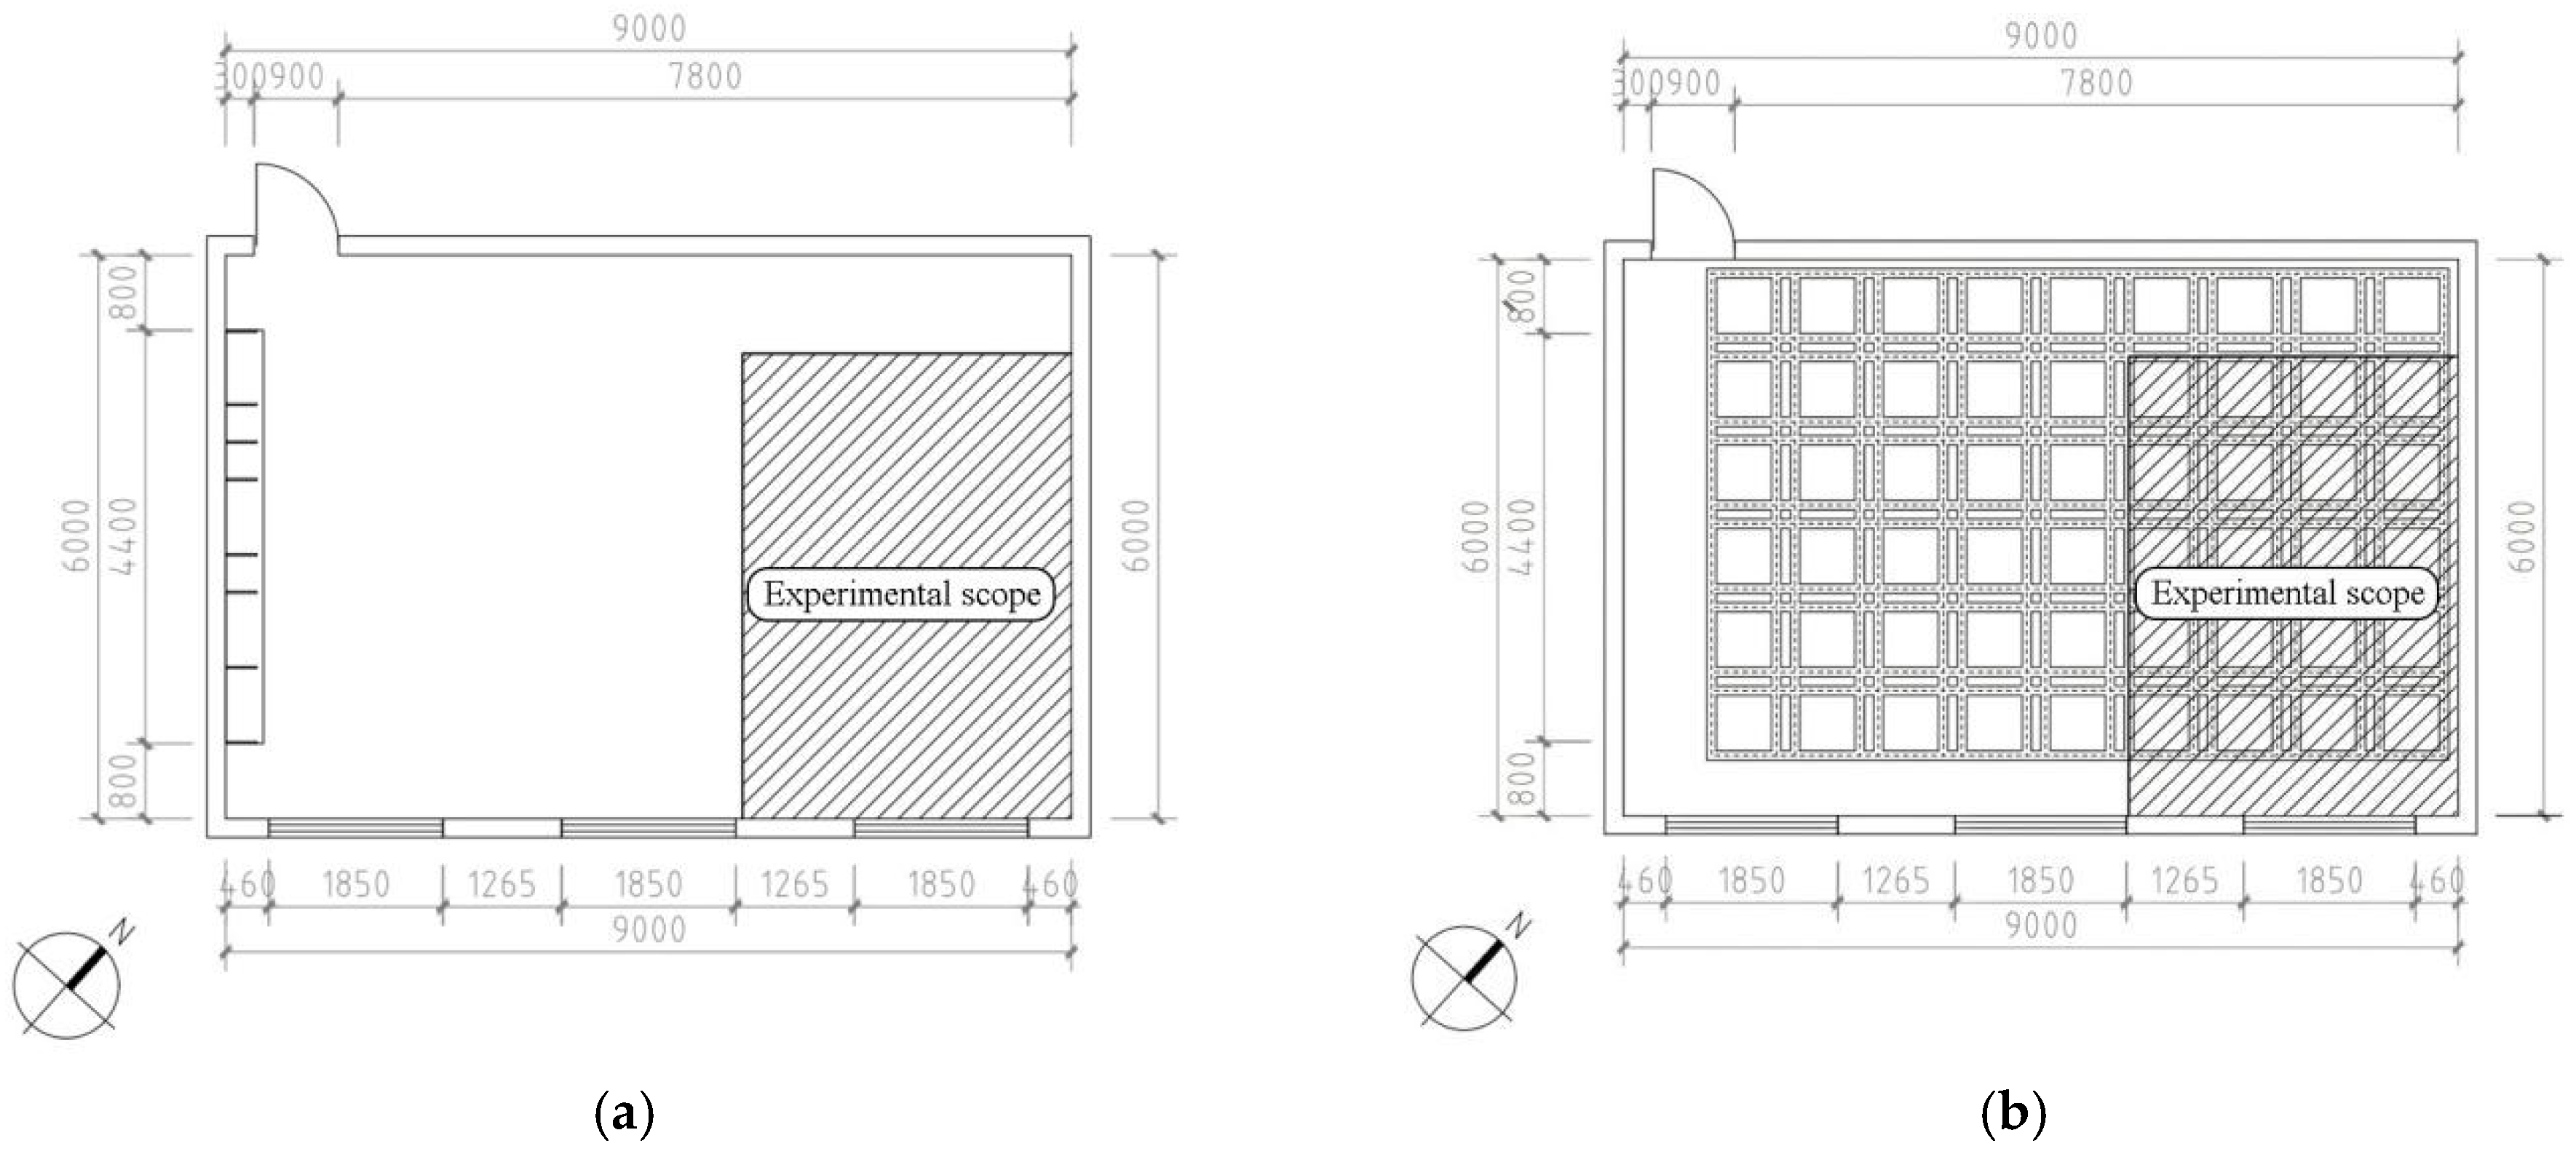
In this study, the experiment was conducted in a controlled laboratory setting to obtain physiological and subjective perception data from participants in a real spatial environment. It should be noted that this experiment focuses solely on the impact of spatial attributes (SS, WWR, IM) of individual spaces (bedroom or living room) within micro-housing spaces on human comfort, and does not account for influences such as furniture in real micro-housing environments. The internal layout of the laboratory is displayed in Figure 1. The floor plan and ceiling layout of the laboratory are depicted in Figure 2.

2.2. Participants

A method of within-subjects design was employed in the experiment. The participants were university students aged 20–26 from various disciplines. With the purpose of eliminating the potential impact of physical health on physiological data, the participants were required to have no physical or psychological conditions, to have had adequate sleep before the experiment, and to refrain from consuming alcohol, caffeine, or any substances that might impact mental states. Considering that extreme emotions can significantly impact EEG data, participants were asked to complete a questionnaire including basic personal information and a self-assessment of their emotional state. Participants who revealed extreme emotional states were excluded from the experiment. Furthermore, the thermal resistance of the participants’ clothing was standardized at 0.5 clo to weaken the impact of individual thermal comfort on physiological data and enhance the accuracy of the experiment. This is equivalent to wearing a short-sleeved shirt, long pants, and slip-on shoes, with the metabolic rate controlled at 1.0 met [19]. During the experiment, participants were instructed to sit in a relaxed position and avoid excessive movement of their hands, head, and other areas where the data were collected.
No standardized method is available for determining sample size in related studies, and the sample sizes used by different researchers vary considerably (Table 3), typically ranging from 7 to 26 participants per group [20]. Finally, a total of 33 participants were recruited in accordance with the analysis methods employed in this study and the sample sizes used in related research. The basic information of the participants is summarized in Table 4.

2.3. Experimental Design

2.3.1. Experimental Condition Settings

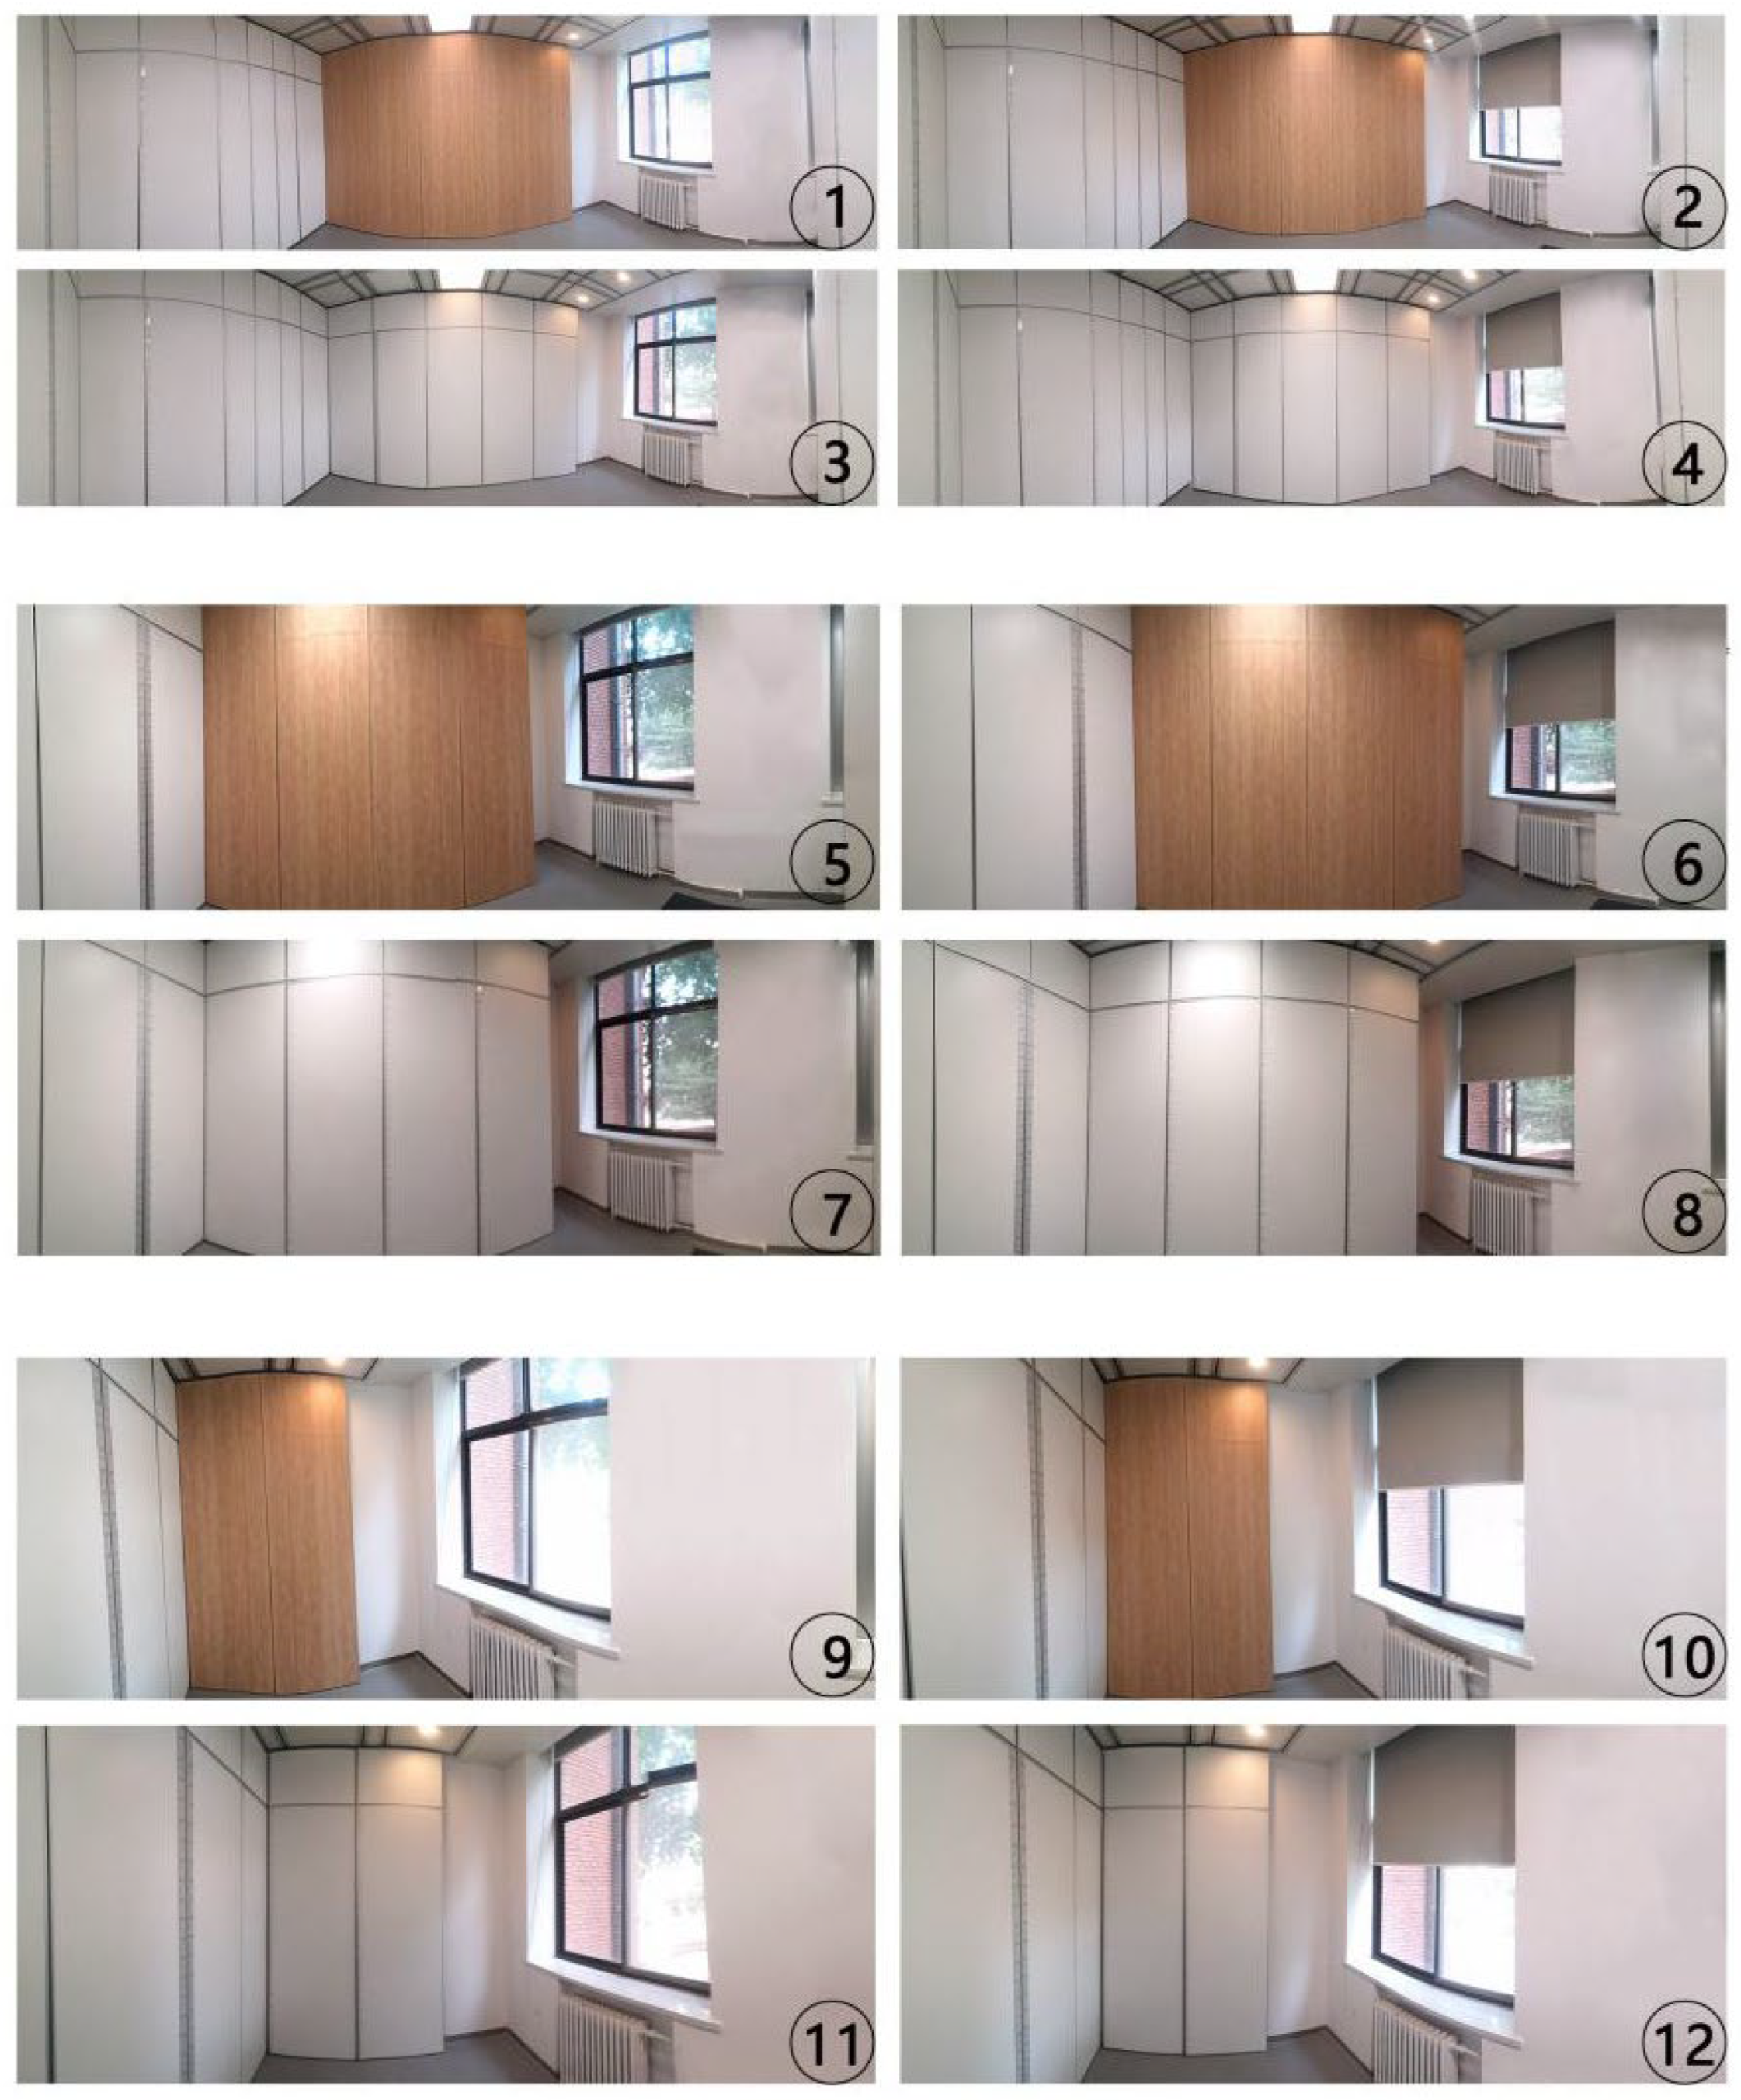
Three key spatial form elements (SS, WWR, and IM) were investigated in this study. Specific levels for these elements were established to ensure both typicality and variability in the experimental conditions. Three SSs were defined as XXL (3500 × 4900 mm, 17.15 m2), XL (2800 × 3900 mm, 10.92 m2), and L (3500 × 2500 mm, 8.75 m2). Two levels of WWR were considered, characterized by the WWR of 18% and 36%. Meanwhile, two IMs, wood and white paint, were selected for analysis. Additionally, the aspect ratio was fixed at 1.4, and the ceiling height was set at 3000 mm, so as to maintain consistency across conditions. Furthermore, a full-factorial design was implemented, where all levels of the three spatial elements were fully crossed, generating 12 unique experimental conditions. The specific spatial parameters corresponding to each condition are listed in Table 5. The experimental setup is illustrated in Figure 3.

2.3.2. Experimental Procedure

The experiment was conducted from 1 June to 30 June 2023. Particularly, all experiments were conducted between 14:00 and 17:00, with each session lasting no more than 60 min per participant, to minimize the impact of circadian rhythms and participant fatigue accumulation on physiological data. The experiment consisted of two phases: pre-experiment preparation and the formal experiment.
1.
Pre-experiment preparation, involving basic information collection and equipment setup:
(1)
Basic information collection: Before the experiment, participants were required to sit and rest in a waiting room for 10 min to guarantee that they were in a stable physiological state. Simultaneously, researchers read the informed consent form, which comprised details about the experiment’s objectives, procedures, and requirements. Participants who agreed to participate signed the consent form and completed a basic information questionnaire and a self-reported emotional state assessment. Only participants whose emotional state scores met the criteria proceeded to the laboratory for equipment setup, where they also received a briefing on experimental precautions.
(2)
Equipment setup: Before the EEG setup, the earlobes and the Cz electrode site on the parietal lobe were cleaned. Afterward, conductive paste was applied, and three electrodes were placed at their respective positions. Concerning EMG, SC, ST, and BVP sensors, similar skin-cleaning procedures were performed before attaching the sensors. The entire setup process took approximately 5 min.
2.
Experimental procedure, involving environmental adaptation, physiological data collection, and subjective questionnaire completion:
(1)
Environmental adaptation stage: After equipment calibration, participants were instructed to close their eyes and rest for approximately 30 s, so as to alleviate any discomfort induced by the sensors. Data collection commenced after the physiological signals had stabilized.
(2)
Physiological data collection stage: Participants engaged in a 2 min spatial perception task, during which physiological indicators were continuously recorded.
(3)
Subjective perception evaluation stage: After the physiological data collection was completed, participants filled out a spatial perception questionnaire, which took approximately 5 min.
Following these steps, researchers adjusted the SS, WWR, and IM before proceeding to the next experimental condition. Notably, the 12 experimental conditions were presented in a randomized sequence to eliminate order effects. The experimental workflow and the experimental process are depicted in Figure 4 and Figure 5, respectively.

2.4. Experimental Data

2.4.1. Physical Environment Monitoring

During the experiment, the physical environment of the laboratory was continuously monitored to eliminate the impact of extraneous variables. The monitored parameters included thermal environment (air temperature and relative humidity), lighting environment (color temperature and illuminance), and acoustic environment (A-weighted sound level). The reference values for these parameters were determined based on Chinese residential environment standards (Table 6). Air temperature, relative humidity, and illuminance were recorded by the TR-74Ui-H data logger (T&D Corporation, Nagano, Japan). Color temperature was controlled by a personal mobile terminal and was fixed at 3000 K throughout the experiment. The A-weighted sound level (A dB) was recorded by the AWA5688 multifunctional sound level meter (Hangzhou Aihua Instruments Co., Ltd., Hangzhou, China). Detailed specifications of the equipment adopted in the experiment are outlined in Table 6. The images of the devices are presented in Figure 6. With. Moreover, the measured parameters were continuously monitored, with values recorded every minute by the researchers, to ensure uniform distribution of environmental monitoring points around the participants.

2.4.2. Subjective Perception Data Collection

A subjective questionnaire was applied to collect participants’ perceptions of spatial form and overall perception under each experimental condition. The questionnaire covered three main perspectives: basic evaluation of spatial form, overall perceived comfort, and emotional evaluation within the space. All items in the questionnaire were measured via a seven-point semantic differential scale to ensure a detailed assessment of participants’ subjective experiences. The structure of the questionnaire is illustrated in Figure 7.

2.4.3. Physiological Data Collection

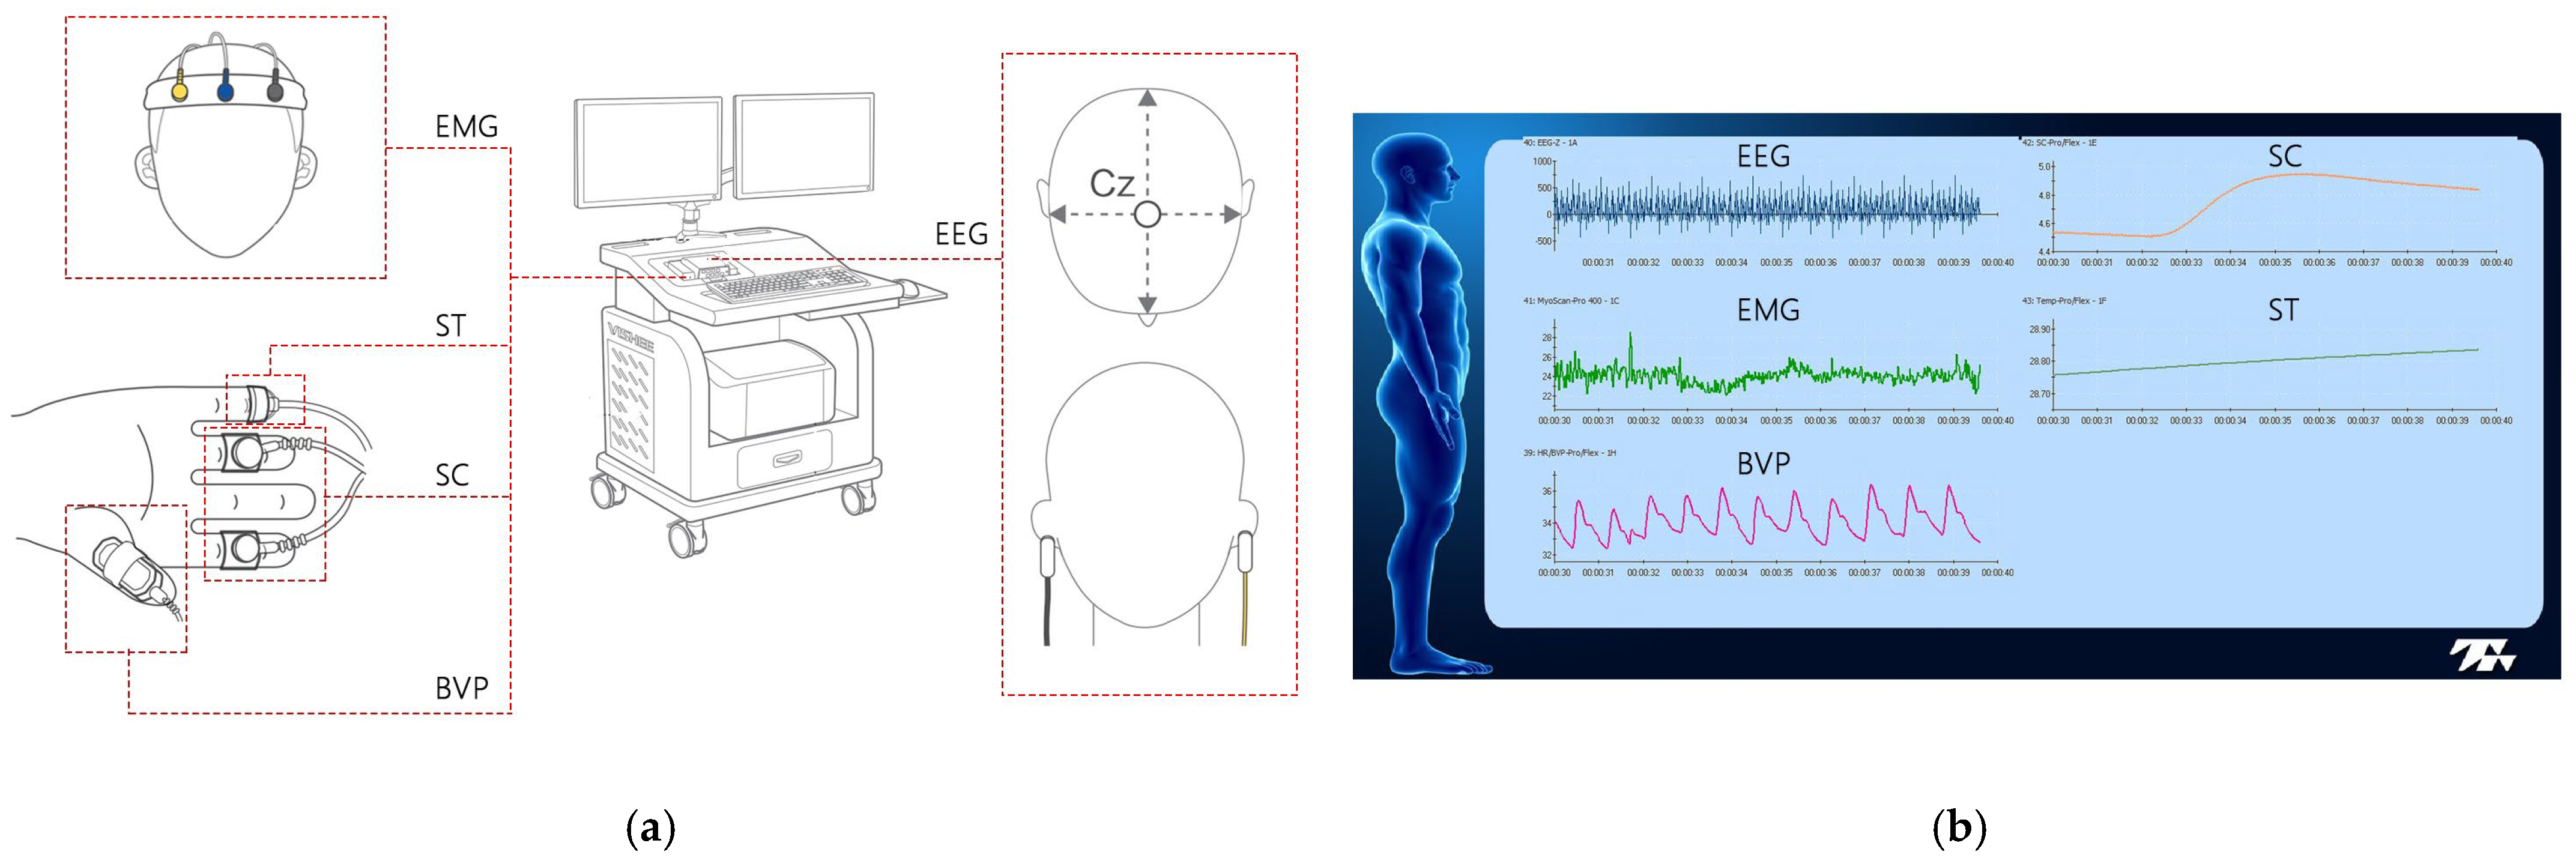
In this experiment, five physiological indicators were collected and analyzed, and their corresponding eigenvalues and characterization meanings are detailed in Table 7. Regarding EEG data processing, raw signals were preprocessed before computing power across different frequency bands. First, a notch filter was applied to remove 50 Hz powerline interference. Second, visual inspection techniques were employed to extract steady-state EEG data from the final 10 s of each experimental condition. Additionally, blink-related and EMG noise were initially removed through visual recognition to curtail artifacts. Subsequently, the Power Spectral Density (PSD) of each frequency band was calculated by FFT, allowing for the extraction of EEG power values and power ratios under different experimental conditions. Finally, statistical analysis of EEG power across conditions was performed by SPSS 25. The detailed data processing workflow is exhibited in Figure 8. The remaining four physiological indicators only extracted their average values as data for subsequent analysis. These averages were calculated using the built-in data processor within the physiological indicator collection software.
All physiological indicators were collected by the multi-parameter biofeedback device (Infiniti3000A, Thought Technology Ltd., Montreal, QC, Canada), which can simultaneously record EEG, EMG, SC, ST, and BVP. The EEG sensor system was composed of one recording electrode and two reference electrodes, with the recording electrode positioned at the parietal Cz site, which is associated with spatial perception [28,29]. The placement of physiological sensors is illustrated in Figure 9a. The specifications of the equipment and sensors are detailed in Table 8.

3. Results

3.1. Environmental Conditions

The physical environment monitoring results for each experimental condition are summarized in Table 9. The results unveil that environmental parameters were well controlled and satisfied the relevant regulatory standards. After three participants were excluded because of abnormal data, a total of 30 valid participant datasets were obtained. Each participant provided 12 questionnaire responses and 12 physiological measurements, providing a total of 720 documents for statistical analysis. Afterward, the collected data were analyzed and visualized by SPSS 25, MATLAB R2022a, and Origin 2022. The primary analyses emphasized the impact of spatial form on subjective perception and physiological indicators.

3.2. Subjective Questionnaires

Subjective perception consists of two main components: basic evaluation of the three spatial form elements and overall perception. The reliability analysis suggests that all sections of the questionnaire possessed good internal consistency (Table 10). The differences between experimental conditions were examined from the following perspectives. First, descriptive statistics were employed to calculate the mean values of each evaluation metric across the 12 experimental conditions. Next, paired-sample t-tests were conducted to determine whether significant differences existed between conditions. Subsequently, a multifactor Analysis of Variance (ANOVA) was performed to assess the impact weight of the three spatial elements on each evaluation metric and determine whether interaction effects existed between these elements.

3.2.1. Spatial Area Evaluation: Small (−3) to Large (3)

Figure 10a illustrates the mean values and standard deviations of spatial area evaluations under three SS conditions: XXL (3500 × 4900 mm), XL (2800 × 3900 mm), and L (2500 × 3500 mm). Specifically, a paired-sample t-test was conducted for each experimental condition within the same SS. The analysis implies that different IMs frequently presented significant differences. For instance, in the XXL space, participants rated the area as larger when the IM was white paint; in the L space, the wood material brought about higher area evaluations; in the XL space, a combination of white paint and a higher WWR contributed to a larger perceived area.
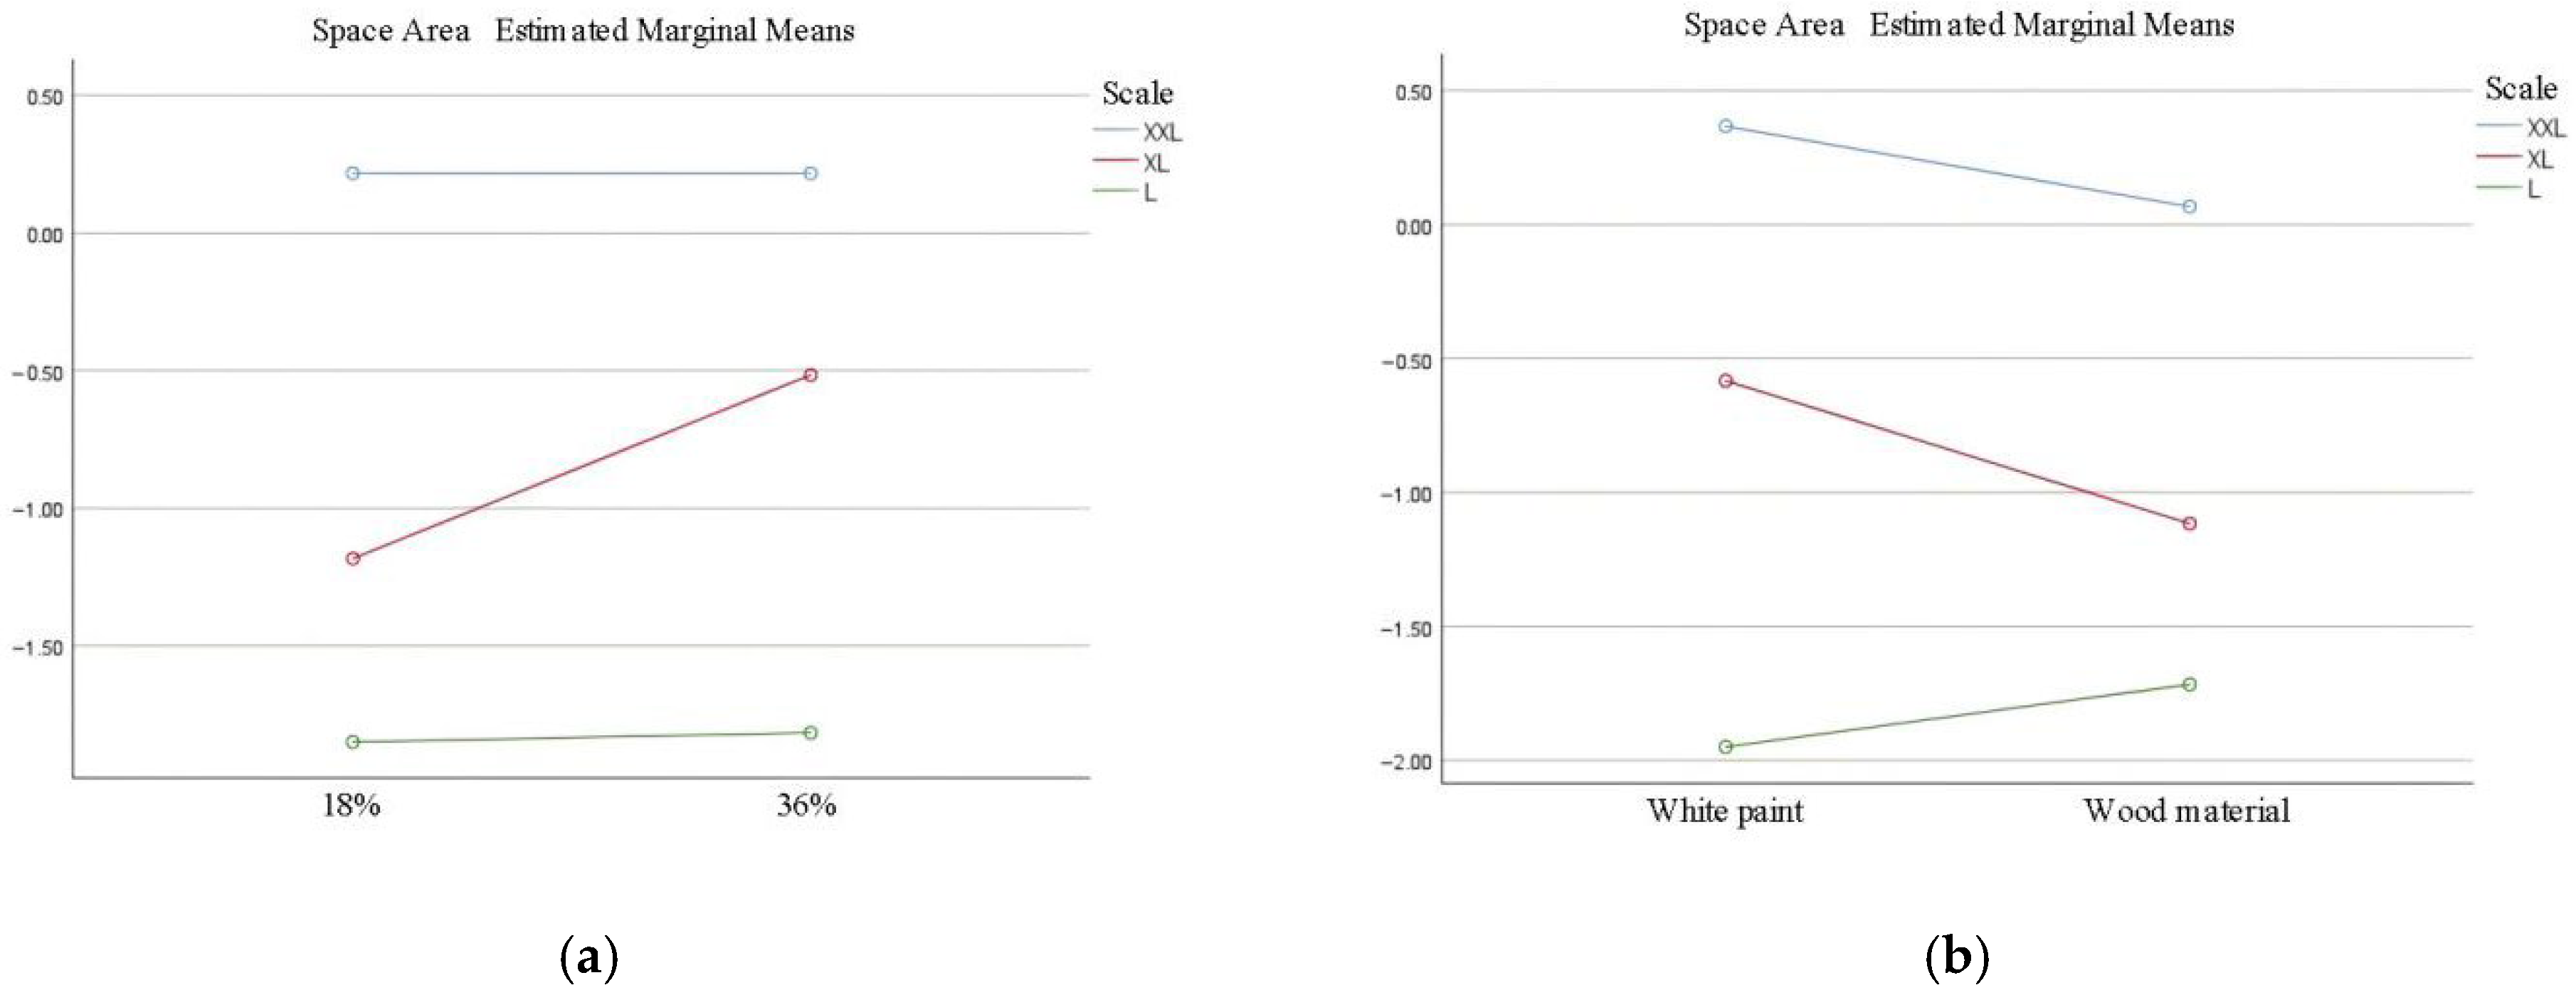
The results of the multifactor ANOVA are provided in Table 11. In addition to SS, the WWR considerably impacted the area evaluation. Furthermore, interaction effects were observed between SS and WWR, as well as between SS and IM (p < 0.05). In other words, the impact of the WWR and material varied across different SSs. In XXL and L spaces, the WWR exerted little effect on area evaluation as perceptions remained nearly identical across different enclosure conditions. Nonetheless, in XL spaces, a higher WWR corresponded to a significantly higher area evaluation (Figure 11a). In XXL and XL spaces, the white-painted IM was accompanied by higher area evaluations, whereas in the L space, wood material led to a higher perceived area (Figure 11b). However, both interactions (η2 < 0.06) indicate that the effects of spatial scale on window size and the interaction between spatial scale and material are relatively small.

3.2.2. Evaluation on the WWR: Small (−3) to Large (3)

Figure 10b demonstrates the mean values of window area evaluations under two area ratios of window to wall (18% and 36%). A paired-sample t-test was conducted for different experimental conditions within the same WWR. Specifically, significant differences were observed between the XXL and L spaces when the WWR was 18% and the IM was white paint. Significant differences in window area evaluation appeared between different IMs when the WWR was 36% and the SS was L, with wood material receiving higher ratings. For the same IM, window area evaluations varied across different SSs. Additionally, significant differences occurred between the L space and both XXL and XL spaces when the IM was wood, and the L spaces received the highest window area evaluations. Different SSs exhibited no significant differences when the IM was white paint.
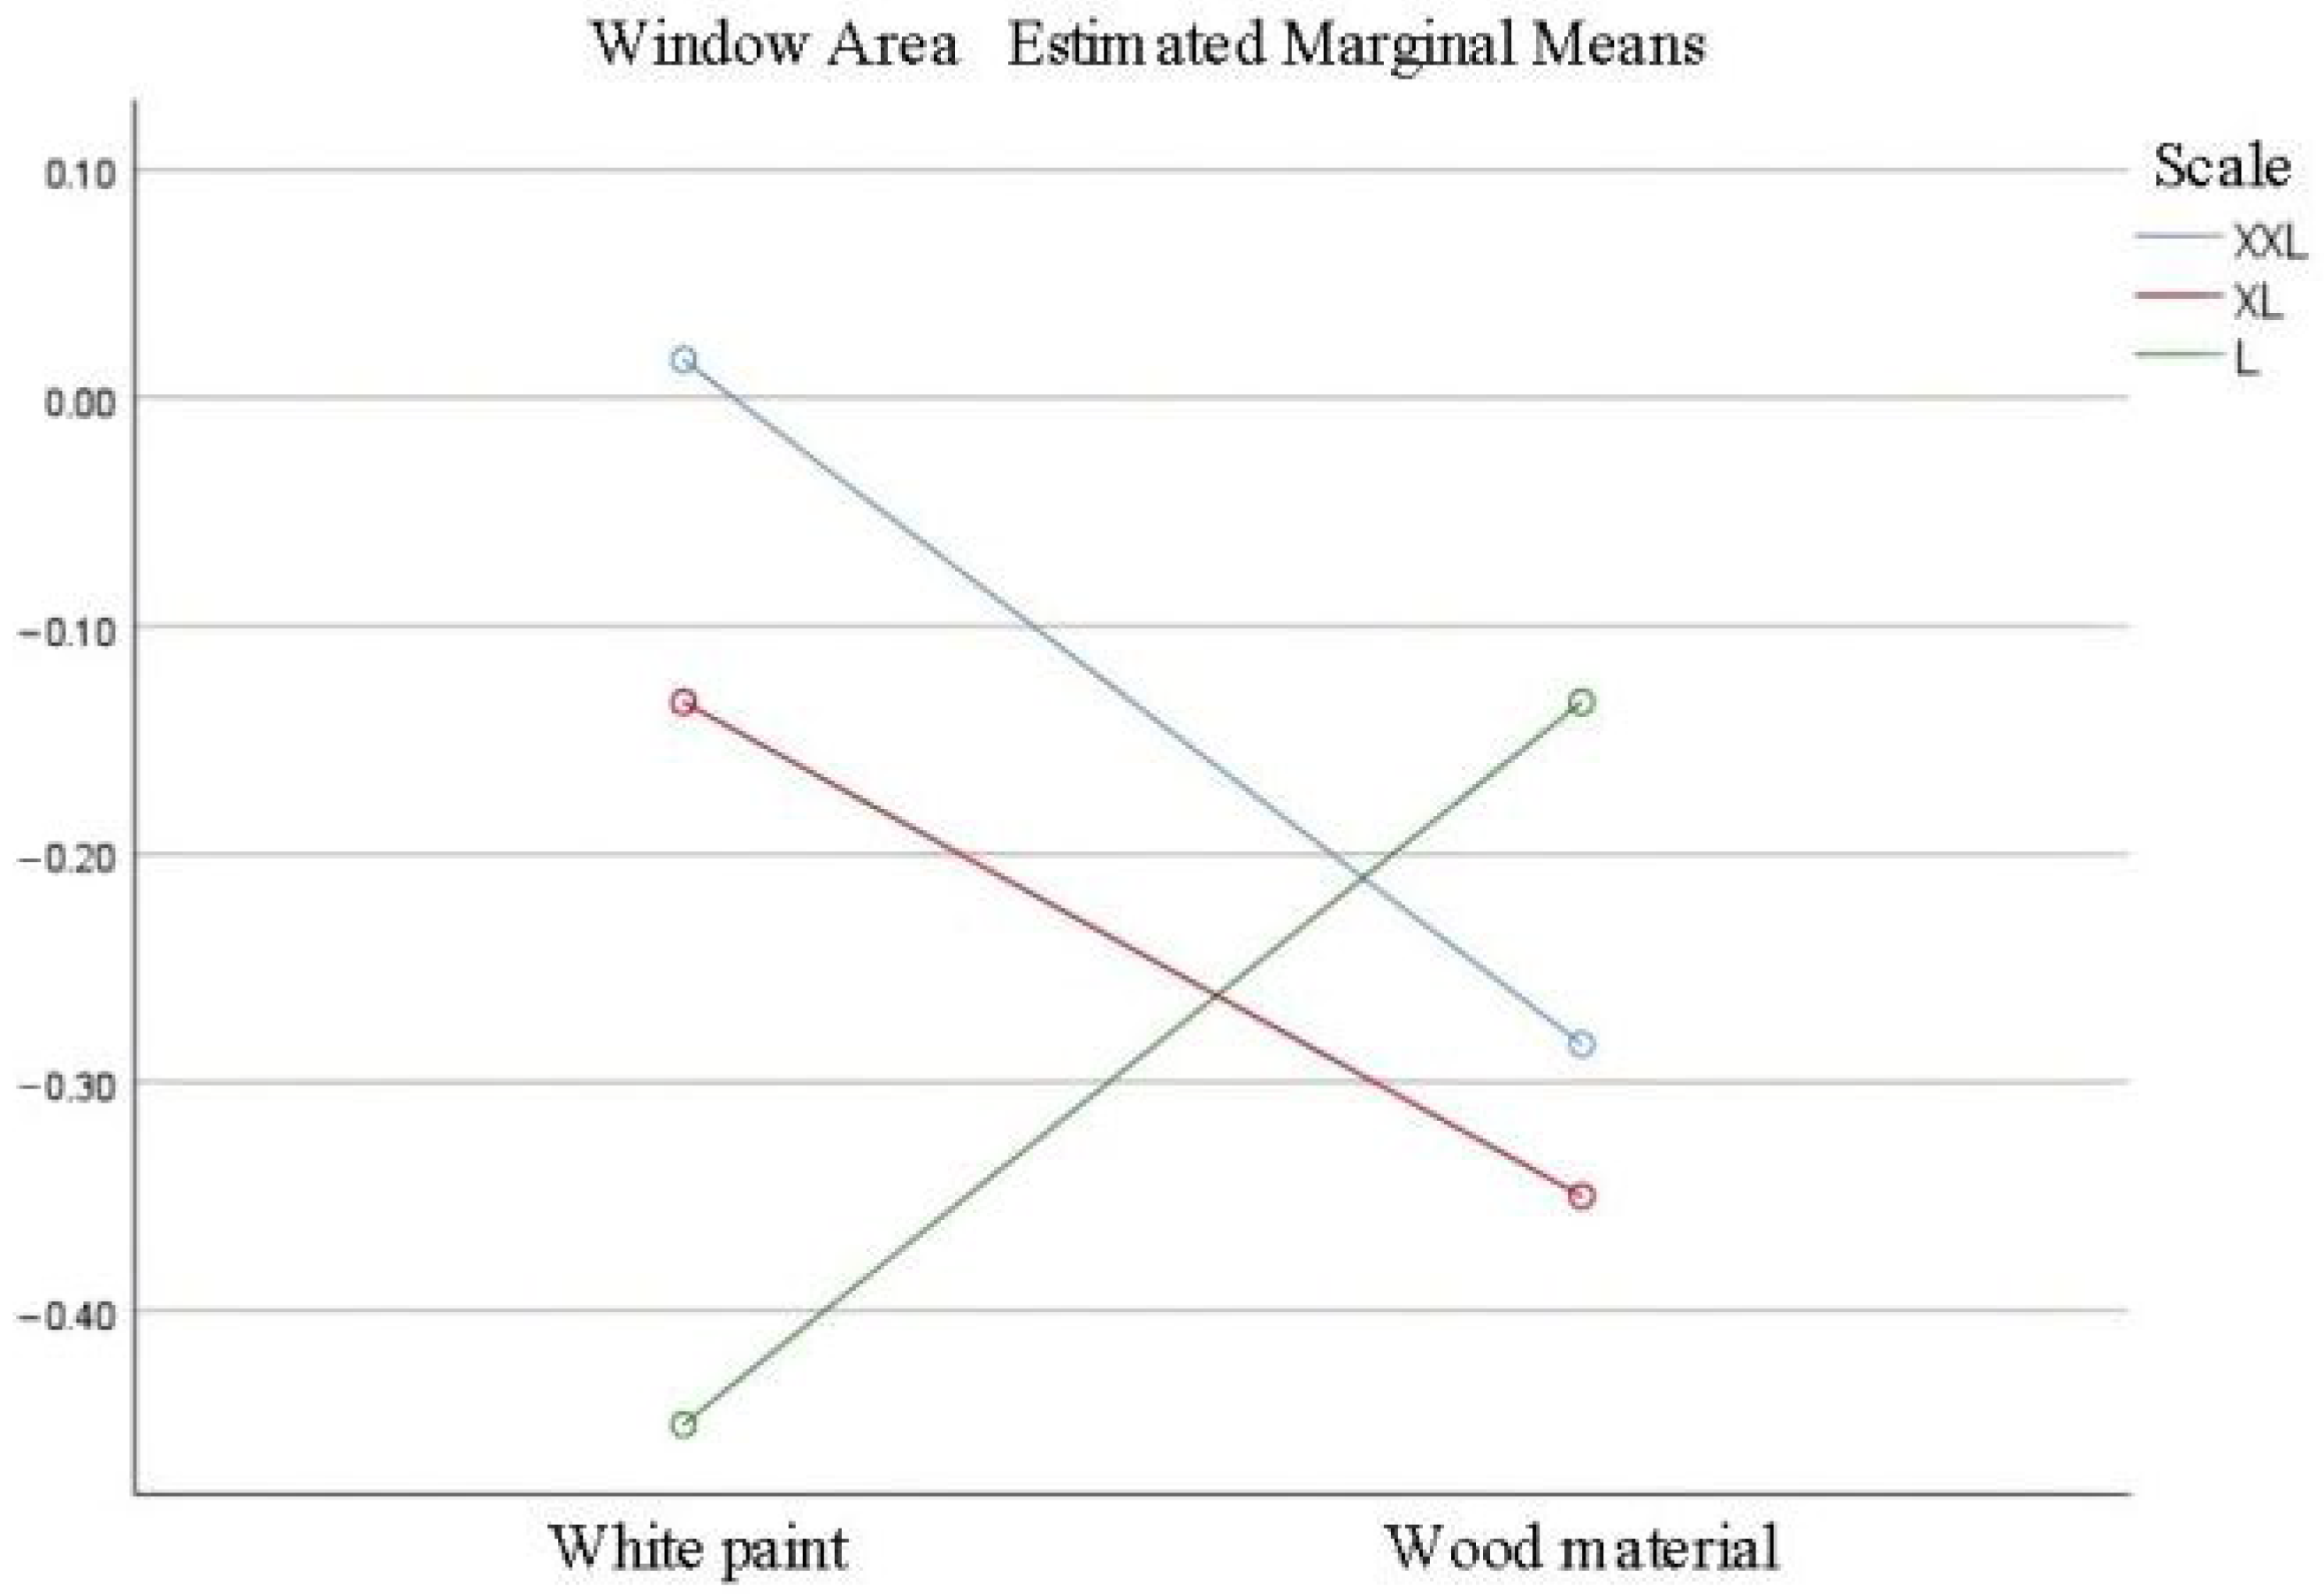
The results of the multifactor ANOVA unveil that, apart from the WWR itself, no other spatial element exerted a significant impact on window area evaluation. Nevertheless, there was a significant interaction effect between SS and IM (Table 12). The mean distribution plots suggest that wood material significantly increased window area evaluations in spaces, further confirming the interaction (Figure 12). In contrast, white paint led to higher evaluations in XXL and XL spaces, whereas wood material brought about the highest window area ratings in L spaces. However, the interaction effects between spatial scale and window size, as well as between spatial scale and material, were small, with η2 < 0.06.

3.2.3. IM Evaluation: Cold (−3) to Warm (3)

The evaluation of IM implies that spaces incorporating wood were perceived as warmer. The results under different experimental conditions are exhibited in Figure 10c to further examine the effects of SS and WWR on IM evaluation. A paired-sample t-test was conducted to compare different conditions under the same IM. In the XXL SS, the spaces with a higher WWR were significantly warmer. However, no significant differences were observed among the remaining experimental conditions. The results of the multifactor ANOVA suggest that neither SS nor WWR exerted a significant impact on IM evaluation. Additionally, no interaction effects appeared between these factors. The specific effect sizes are outlined in Table 13.

3.2.4. Overall Perceived Comfort: Uncomfort (−3) to Comfort (3)

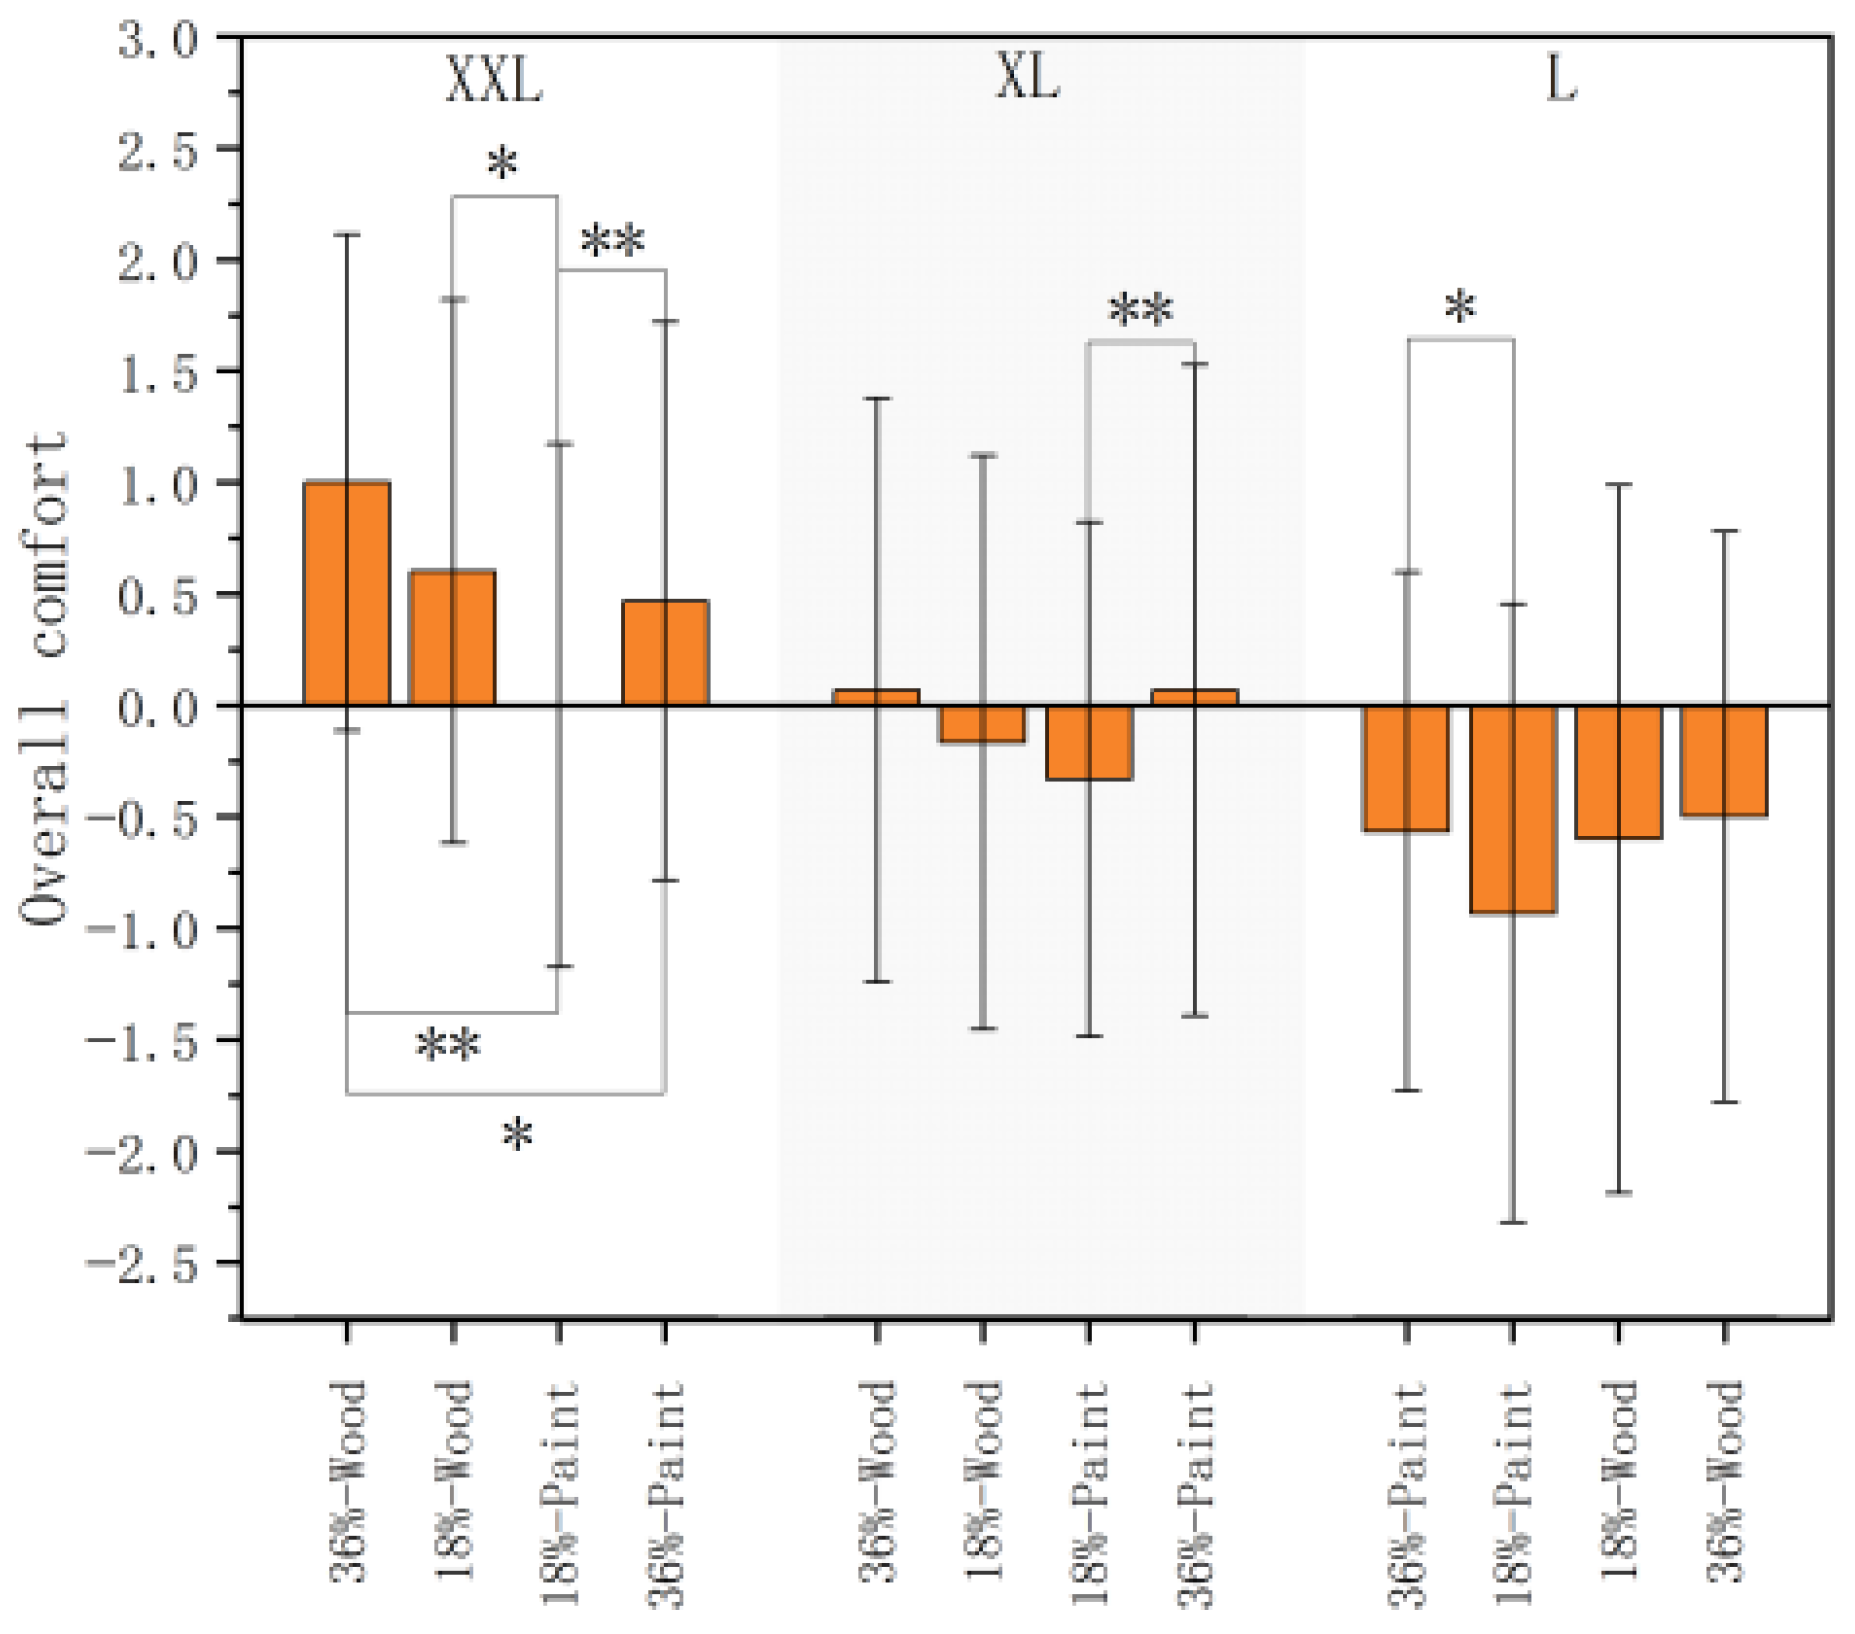
Overall perceived comfort indicates participants’ comprehensive evaluation of the space (Figure 13). Generally, larger SSs were associated with higher comfort levels. Within the same SS, wooden IM and a higher WWR contributed to greater comfort ratings. The results of the paired-sample t-test reveal that all IM conditions exhibited significant differences in XXL-scale spaces. When the IM was white paint, significant differences were observed between different area ratios of window to wall. A significant difference was also discovered when both the IM was wood and the WWR was set to 36%. In XL and L spaces, significant differences between different area ratios of window to wall occurred when the IM was white paint.
The results of the multifactor ANOVA demonstrate that perceived comfort was jointly impacted by SS, WWR, and IM. Nonetheless, there were no significant interaction effects between these elements. Among the three factors, SS had the greatest impact, followed by the WWR, and then IM (Table 14).

3.3. Physiological Parameters

3.3.1. EEG

(1)
Alpha power
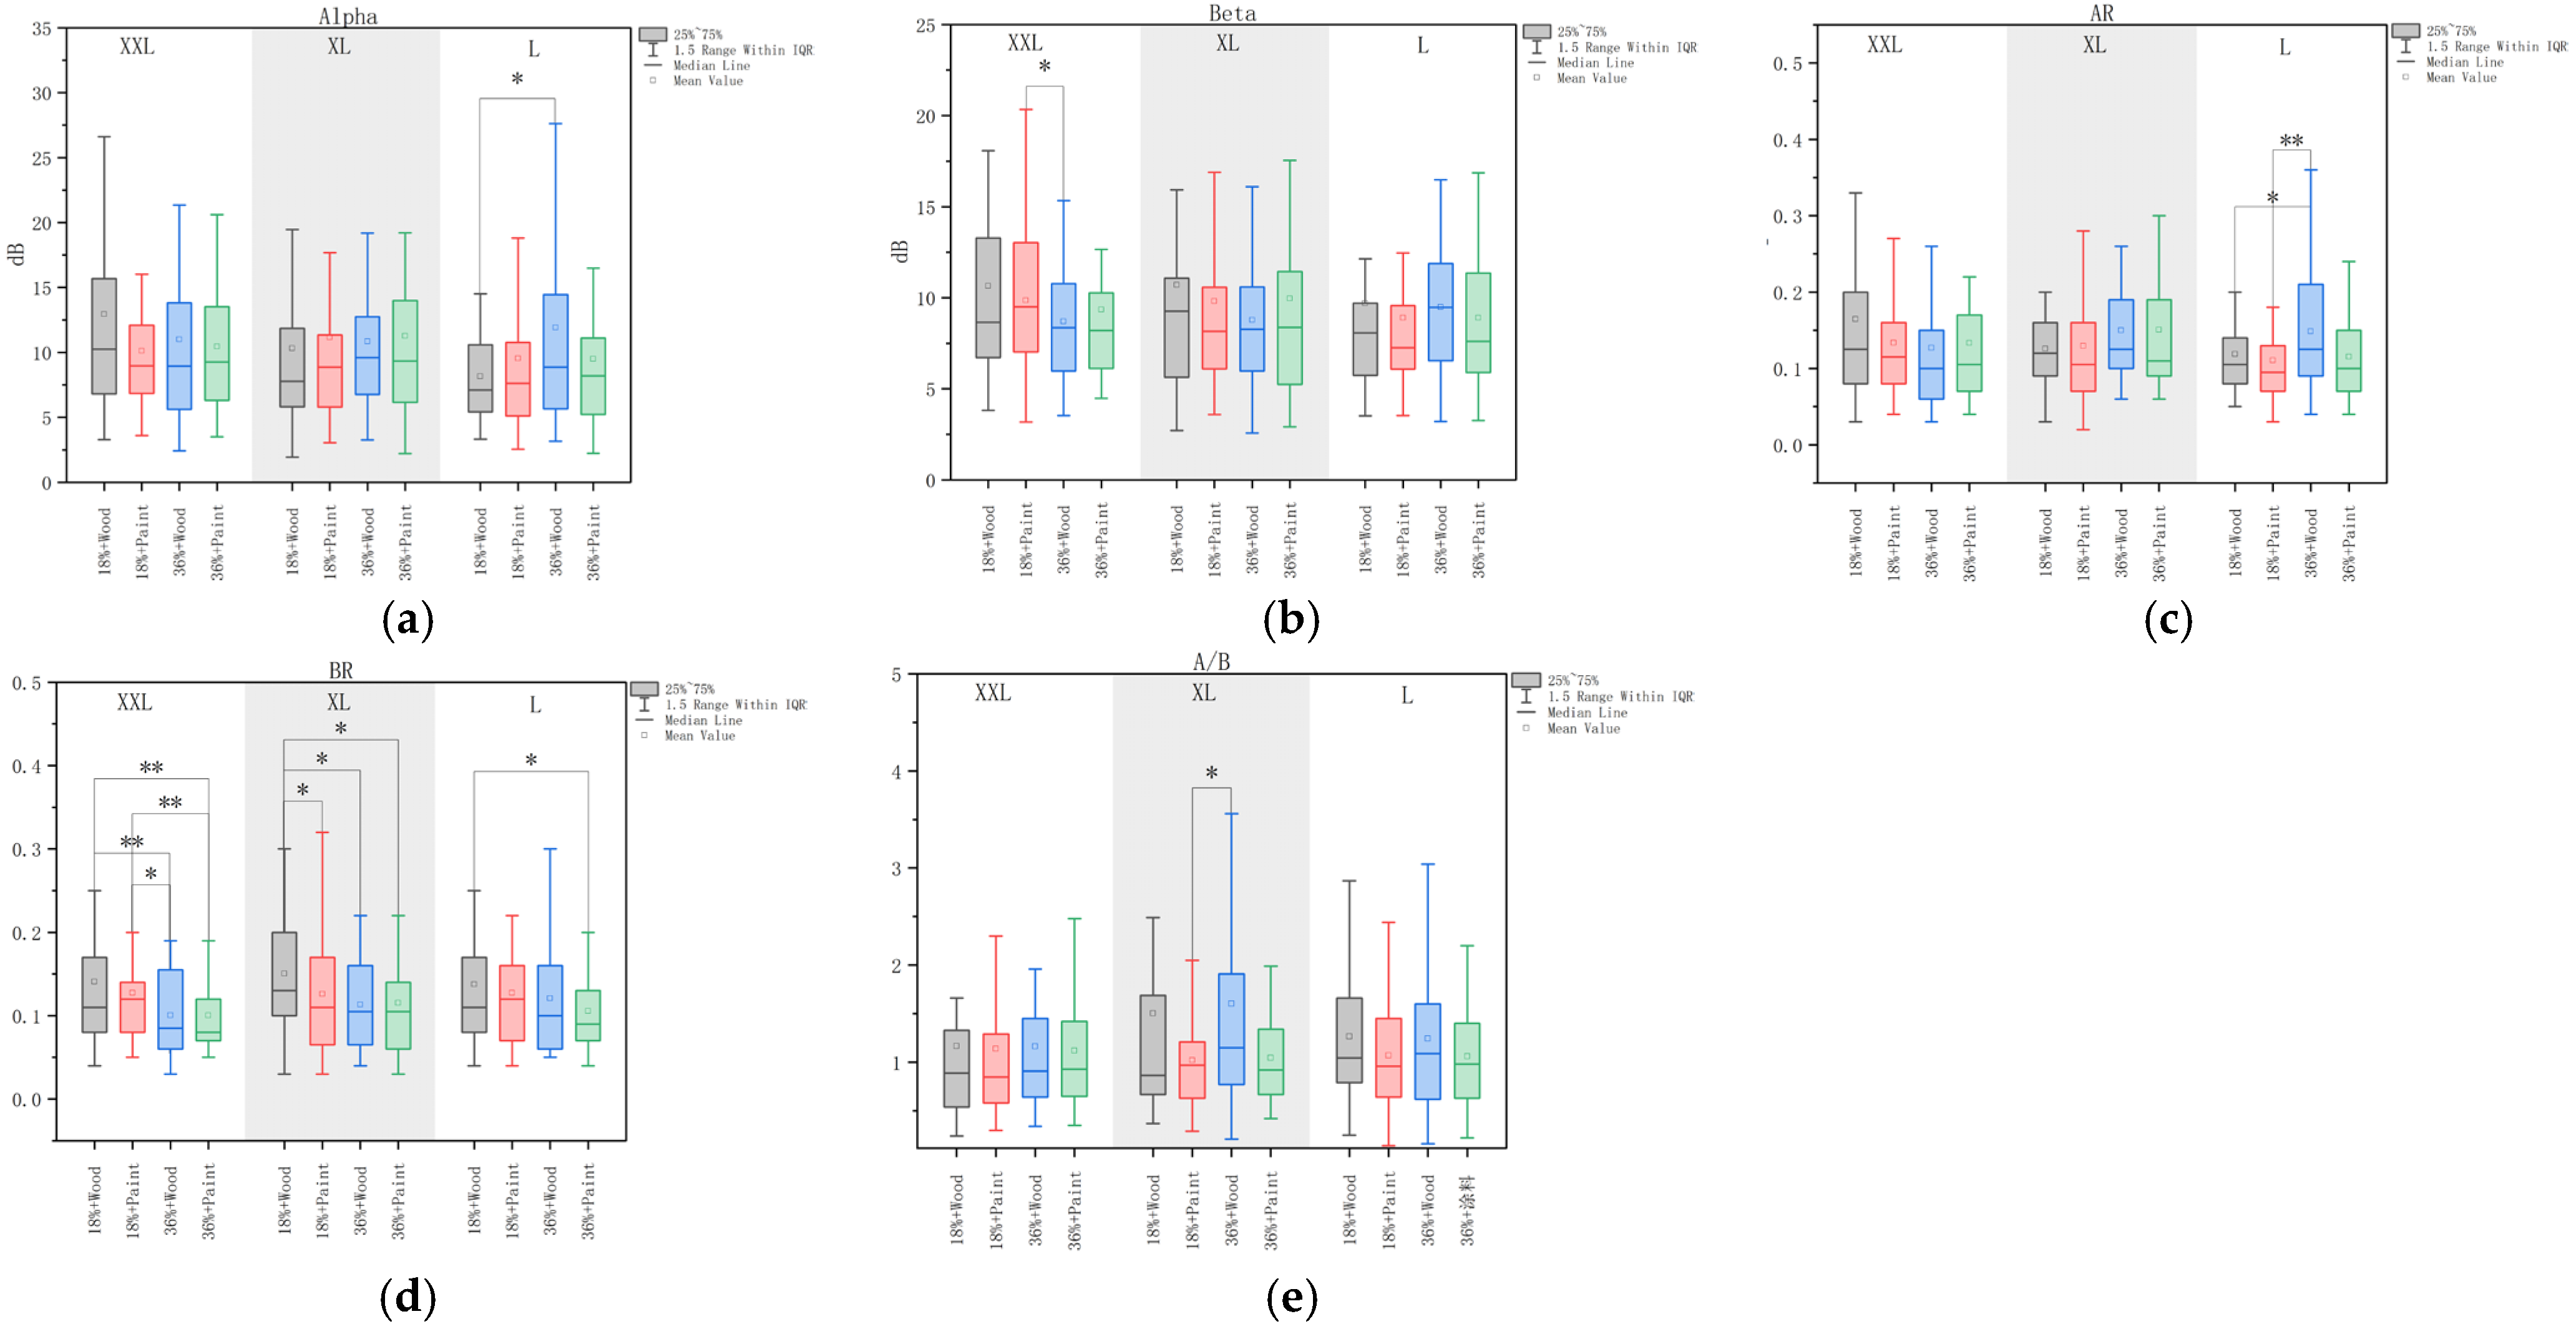
Figure 14a exhibits the mean, median, first and third quartiles, and 1.5 times the Interquartile Range (IQR) of Alpha power across 12 experimental conditions for 30 participants. Regarding the window size, in XL and L spaces, participants exhibited higher Alpha power in the spaces with a larger WWR. The difference in Alpha power between different area ratios of window to wall was more pronounced when the IM was wood. The results of the paired-sample t-test reflect that in L-scale spaces, significant differences were observed in Alpha power between different area ratios of window to wall when the IM was wood; in XXL-scale spaces, no significant relationship between the WWR and Alpha power appeared. Based on IM, Alpha power was higher in wooden spaces compared to those with white-painted surfaces in XXL-scale spaces, even though this difference was not statistically significant. No such differences were observed in XL and L-scale spaces.
The results of the multifactor ANOVA establish that none of the spatial elements exerted a significant effect on Alpha power, nor were any significant interaction effects observed.
(2)
Beta power
Figure 14b displays Beta power across different experimental conditions. Beta power values remained similar across different SSs. For window size, Beta power was lower in spaces with a larger WWR in all three SSs. With IM, the effects varied following the WWR. In XXL and XL spaces, Beta power was lower in white-painted spaces when the WWR was 18%, whereas Beta power was lower in wooden spaces when the WWR was 36%. In L spaces, Beta power was lower in wooden spaces when the WWR was 18%, and Beta power was lower in white-painted spaces when the WWR was 36%. A paired-sample t-test conducted within the same SS reveals a significant difference in XXL-scale spaces with both the WWR of 36% and an IM of wood.
The multifactor ANOVA suggests that none of the three spatial elements exerted a significant effect on Beta power, accompanied by no interaction effects.
(3)
AR
Alpha power Ratio (AR) across different experimental conditions is depicted in Figure 14c. Overall, AR was highest and lowest in XXL spaces and L spaces, respectively. Concerning the WWR, in XXL spaces, AR was higher in spaces with a WWR of 18% when the IM was wood, whereas AR was similar across different area ratios of window to wall when the IM was white paint. In XL and L spaces, AR was higher in spaces with a WWR of 36%, indicating that participants were more relaxed. With respect to IM, in XXL spaces, AR was higher in wooden spaces when the WWR was 18%, and AR was similar across different materials when the WWR was 36%. In L spaces, AR was consistently higher in wooden spaces across both area ratios of window to wall. A paired-sample t-test reflects significant differences in L spaces when the IM was wood, indicating AR varied significantly across different area ratios of window to wall. Additionally, a significant difference was observed when both area ratios of window to wall were 36% and the IM was wood.
The multifactor ANOVA unveils no significant effect of the three spatial elements on AR, nor any interaction effects.
(4)
BR
Figure 14d illustrates the Beta power Ratio (BR) across different experimental conditions. Regarding SS, XXL spaces had lower BR values compared to XL and L spaces, suggesting that participants were more relaxed in larger spaces. Concerning the WWR, BR was lower in spaces with a WWR of 36% compared to those with a WWR of 18%, implying that larger window sizes contributed to relaxation. However, different IMs demonstrated no consistent pattern. The paired-sample t-test presents the following significant differences. In XXL spaces, significant differences were observed between different area ratios of window to wall, with lower BR in spaces with a larger WWR, implying greater relaxation. This effect was more pronounced when the IM was wood. Additionally, significant differences appeared when both the WWR and IM were changed simultaneously. In XL spaces, significant differences occurred when the IM was wood, and different area ratios of window to wall resulted in varying BR values. Additionally, different IMs demonstrated significant differences when the WWR was 18%, with white-painted spaces exhibiting lower BR and indicating greater relaxation. A significant difference was also discovered when both area ratios of window to wall were 36% and the IM was white paint. In L spaces, significant differences were observed when both area ratios of window to wall were 36% and the IM was white paint, while a higher WWR and a white-painted surface contributed to the decreased BR, verifying increased relaxation.
The multifactor ANOVA reveals that the WWR had a significant impact on BR (Table 15), but not on SS and IM. Moreover, no interaction effects were detected between the spatial elements.
(5)
A/B ratio
The Alpha/Beta (A/B) ratio is a comprehensive indicator, with higher values demonstrating a more relaxed physiological state. Figure 14e depicts the A/B ratio across different experimental conditions. Concerning SS, differences across scales were minimal, followed by no consistent trend. A higher WWR brought about slightly higher A/B ratios in XXL and XL spaces, suggesting greater relaxation, whereas A/B ratios remained similar across different area ratios of window to wall in L spaces. In terms of IM, wooden environments exhibited higher A/B ratios compared to white-painted spaces, reflecting a more relaxed state in wooden surroundings. Additionally, a paired-sample t-test reveals that a significant difference appeared in XL spaces when both area ratios of window to wall were increased to 36% and the IM was wood. This combination significantly elevated the A/B ratio, implying enhanced relaxation. Meanwhile, no other significant differences were observed across conditions.
The multifactor ANOVA confirms that IM had a significant effect on A/B ratios and that no significant effects were observed for SS or WWR, nor were any interaction effects observed. The results are listed in Table 16.

3.3.2. EMG

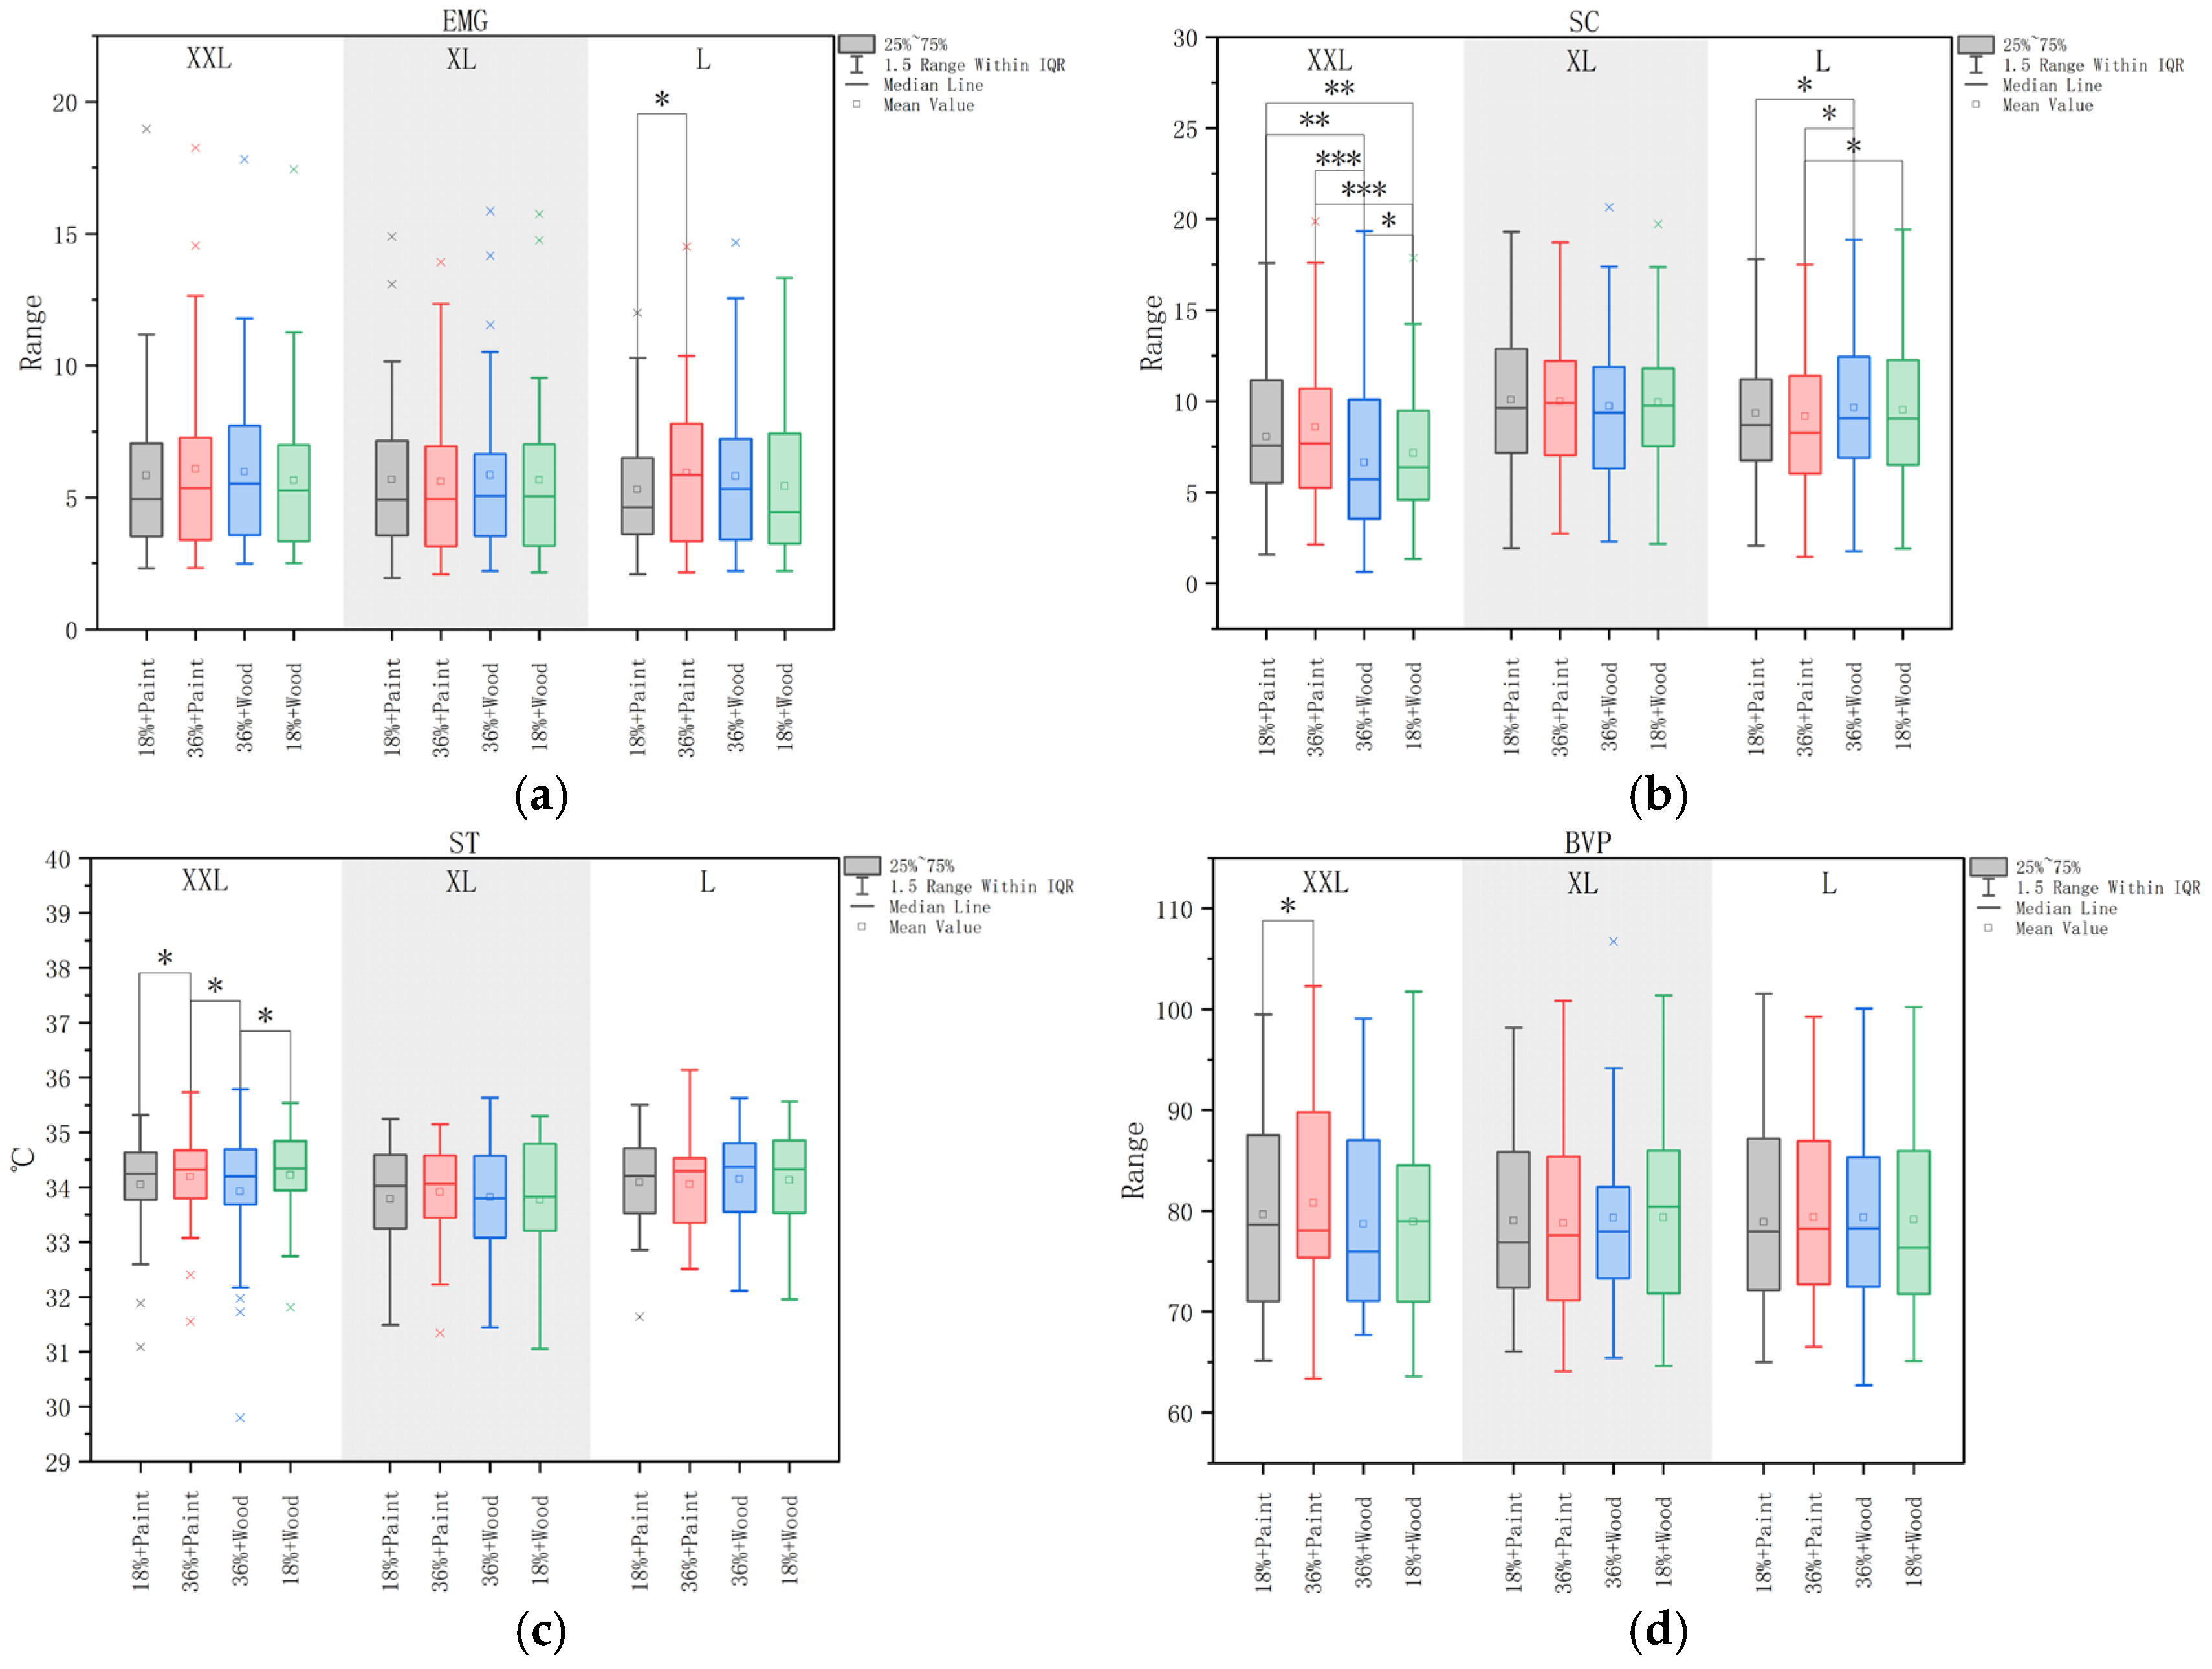
Figure 15a exhibits the mean EMG values across different experimental conditions. Concerning SS, in XXL and L spaces, a higher WWR (36%) contributed to higher EMG values, and wooden IMs also led to higher EMG values. However, no such differences were observed in XL spaces. A paired-sample t-test was conducted within each SS, revealing that a significant difference appeared when the IM was wood, with higher EMG values in spaces with a larger WWR (36%). In other words, participants demonstrated a higher level of emotional arousal in these conditions. As confirmed by further analysis combining EEG signals, participants experienced more positive emotions in L spaces with a WWR of 36%. The results of the multifactor ANOVA reflect that none of the three spatial elements exerted a significant impact on EMG values.

3.3.3. SC

Figure 15b depicts the mean SC values across different experimental conditions. Regarding SS, XXL spaces exhibited lower SC values compared to XL and L spaces, suggesting that participants were more relaxed. This result is consistent with EEG data, further confirming a greater state of relaxation in larger spaces. Concerning the WWR, in XXL spaces, SC values were lower in spaces with a WWR of 36% when the IM was wood. With respect to IM, in XXL spaces, wooden surfaces induced lower SC values compared to white-painted surfaces, while no significant differences were observed in other conditions. A paired-sample t-test reveals significant differences in the following conditions. In XXL spaces, SC values were significantly lower in wooden environments compared to white-painted ones, implying greater relaxation, as confirmed by EEG data. For the WWR, SC was significantly lower in spaces with a WWR of 36% in wooden environments. In L spaces, significant differences between different IMs occurred when the WWR was 36%, with lower SC values in white-painted spaces. Moreover, significant differences also appeared only when both IM and WWR were changed simultaneously.
The multifactor ANOVA specifies that SS had a significant effect on SC (p < 0.001, η2 = 0.05) and that spatial elements exhibited no significant interaction effects (Table 17). A post hoc comparison of SC values across different SSs reveals that SC values in XXL spaces were significantly lower than those in XL and L spaces by 2.33 and 1.82, respectively. In addition, no significant differences were discovered between XL and L spaces (Table 18). Within the range of experimental variables, larger SSs brought about lower SC values, implying a greater sense of relaxation in more spacious environments.

3.3.4. ST

Figure 15c illustrates the mean ST values across different experimental conditions. Overall, ST fluctuations were minimal across conditions, with average values oscillating approximately 34 °C. In XXL spaces, significant differences were observed between different area ratios of window to wall, but the direction of the effect varied depending on the IM. Specifically, ST was lower in spaces with a larger WWR (36%) when the IM was wood, revealing higher emotional arousal. ST was lower in spaces with a smaller WWR (18%) when the IM was white paint, indicating a reversed trend. Additionally, ST was significantly lower in wooden spaces compared to white-painted ones when the WWR was 36%. Meanwhile, no significant differences were observed across other conditions. The results of the multifactor ANOVA verify that none of the three spatial elements had a significant impact on ST.

3.3.5. BVP

Figure 15d demonstrates the mean HR values across different experimental conditions. In XXL spaces, participants exhibited a lower HR in spaces with a larger WWR (36%)when the IM was wood, and this difference was statistically significant. Wooden spaces had significantly lower HR values compared to white-painted spaces when the WWR was 36%, reflecting a greater state of relaxation. No consistent trends or significant differences were observed across other SSs. The results of the multifactor ANOVA suggest that none of the three spatial elements exerted a significant effect on HR and that the effect size for each factor was extremely small. Thus, HR was minimally impacted by spatial form elements.

4. Discussion

4.1. Effects of Individual Spatial Elements on Perception

4.1.1. Effects of Spatial Scale on Perception

(1)
Effects of SS on subjective perception
In terms of spatial form perception, SS significantly impacted area evaluation. Since significant differences were observed among the three SSs, participants could accurately distinguish between them. Regarding overall perception, the SS significantly impacted overall comfort. Larger spaces were associated with greater comfort within the experimental range of SSs.
(2)
Effects of spatial scale on physiological indicators
The SS exerted a significant effect on SC. Participants in larger spaces exhibited lower SC values, attributed to reduced emotional arousal. With respect to subjective evaluation results, it can be concluded that participants felt more comfortable in larger spaces. This conclusion aligns with findings from Vartanian et al. [5], who examined emotional changes under different SSs using functional magnetic resonance imaging (fMRI) and reported that individuals in spacious environments exhibited more positive emotions than those in confined spaces.

4.1.2. Effects of Area Ratio of Window to Wall on Perception

(1)
Effects of WWR on subjective perception
Concerning spatial form perception, the WWR was the primary factor impacting window size evaluation; the WWR significantly impacted area perception, and a larger WWR received higher area evaluations. Similarly, Balconi and Lucchiari [14] established that windows impact the perceived spatial area in smaller spaces. Regarding overall perception, an increase in the WWR led to greater relaxation and higher overall comfort ratings.
(2)
Effects of the WWR on physiological indicators
The WWR had a significant effect on BR in EEG signals. Larger WWR spaces had lower BR values, specifying that participants were more relaxed, consistent with the results from the subjective perception questionnaire. Vartanian et al. [5] also verified that the WWR impacts emotional states. In enclosed spaces, brain activity in the cingulate cortex, a region associated with fear, is more pronounced, provoking higher stress and more negative emotions [6]. Compared to windowless environments, spaces with windows have been associated with higher blood oxygen saturation and greater HR variability, reflecting diminished SBS symptoms, lower stress, and less fatigue [8]. Naiman further confirmed this relationship by monitoring cortisol secretion [30]. However, the WWR did not significantly impact SC, HR, or ST in this study since extreme conditions (e.g., windowless spaces (0%) or fully glazed walls (100%)) were not included in the experimental design, preventing significant physiological changes from being detected.

4.1.3. Effects of Interface Material on Perception

(1)
Effects of IM on subjective perception
Regarding spatial form perception, IM significantly impacted material perception, and wooden surfaces were rated as more favorable than white-painted surfaces. Concerning overall perception, IM significantly impacted participants’ comfort. Particularly, participants reported higher overall comfort levels in wooden environments.
(2)
Effects of IM on physiological indicators
IM had a significant effect on the A/B ratio in EEG signals. Participants in wooden spaces exhibited higher A/B ratios, implying greater relaxation. Chang et al. suggested that IM can impact emotional responses and thus lessen mental tension and fatigue [31]. Exposure to wooden environments has been linked to lower blood pressure and blood oxygen saturation levels, contributing to reduced stress and anxiety [4]. Wang et al. reported that warm-colored environments were associated with slightly higher HR [32]. Nevertheless, IM did not significantly impact physiological indicators other than the A/B ratio in our study. This discrepancy may be induced by the differences in experimental settings and exposure durations.
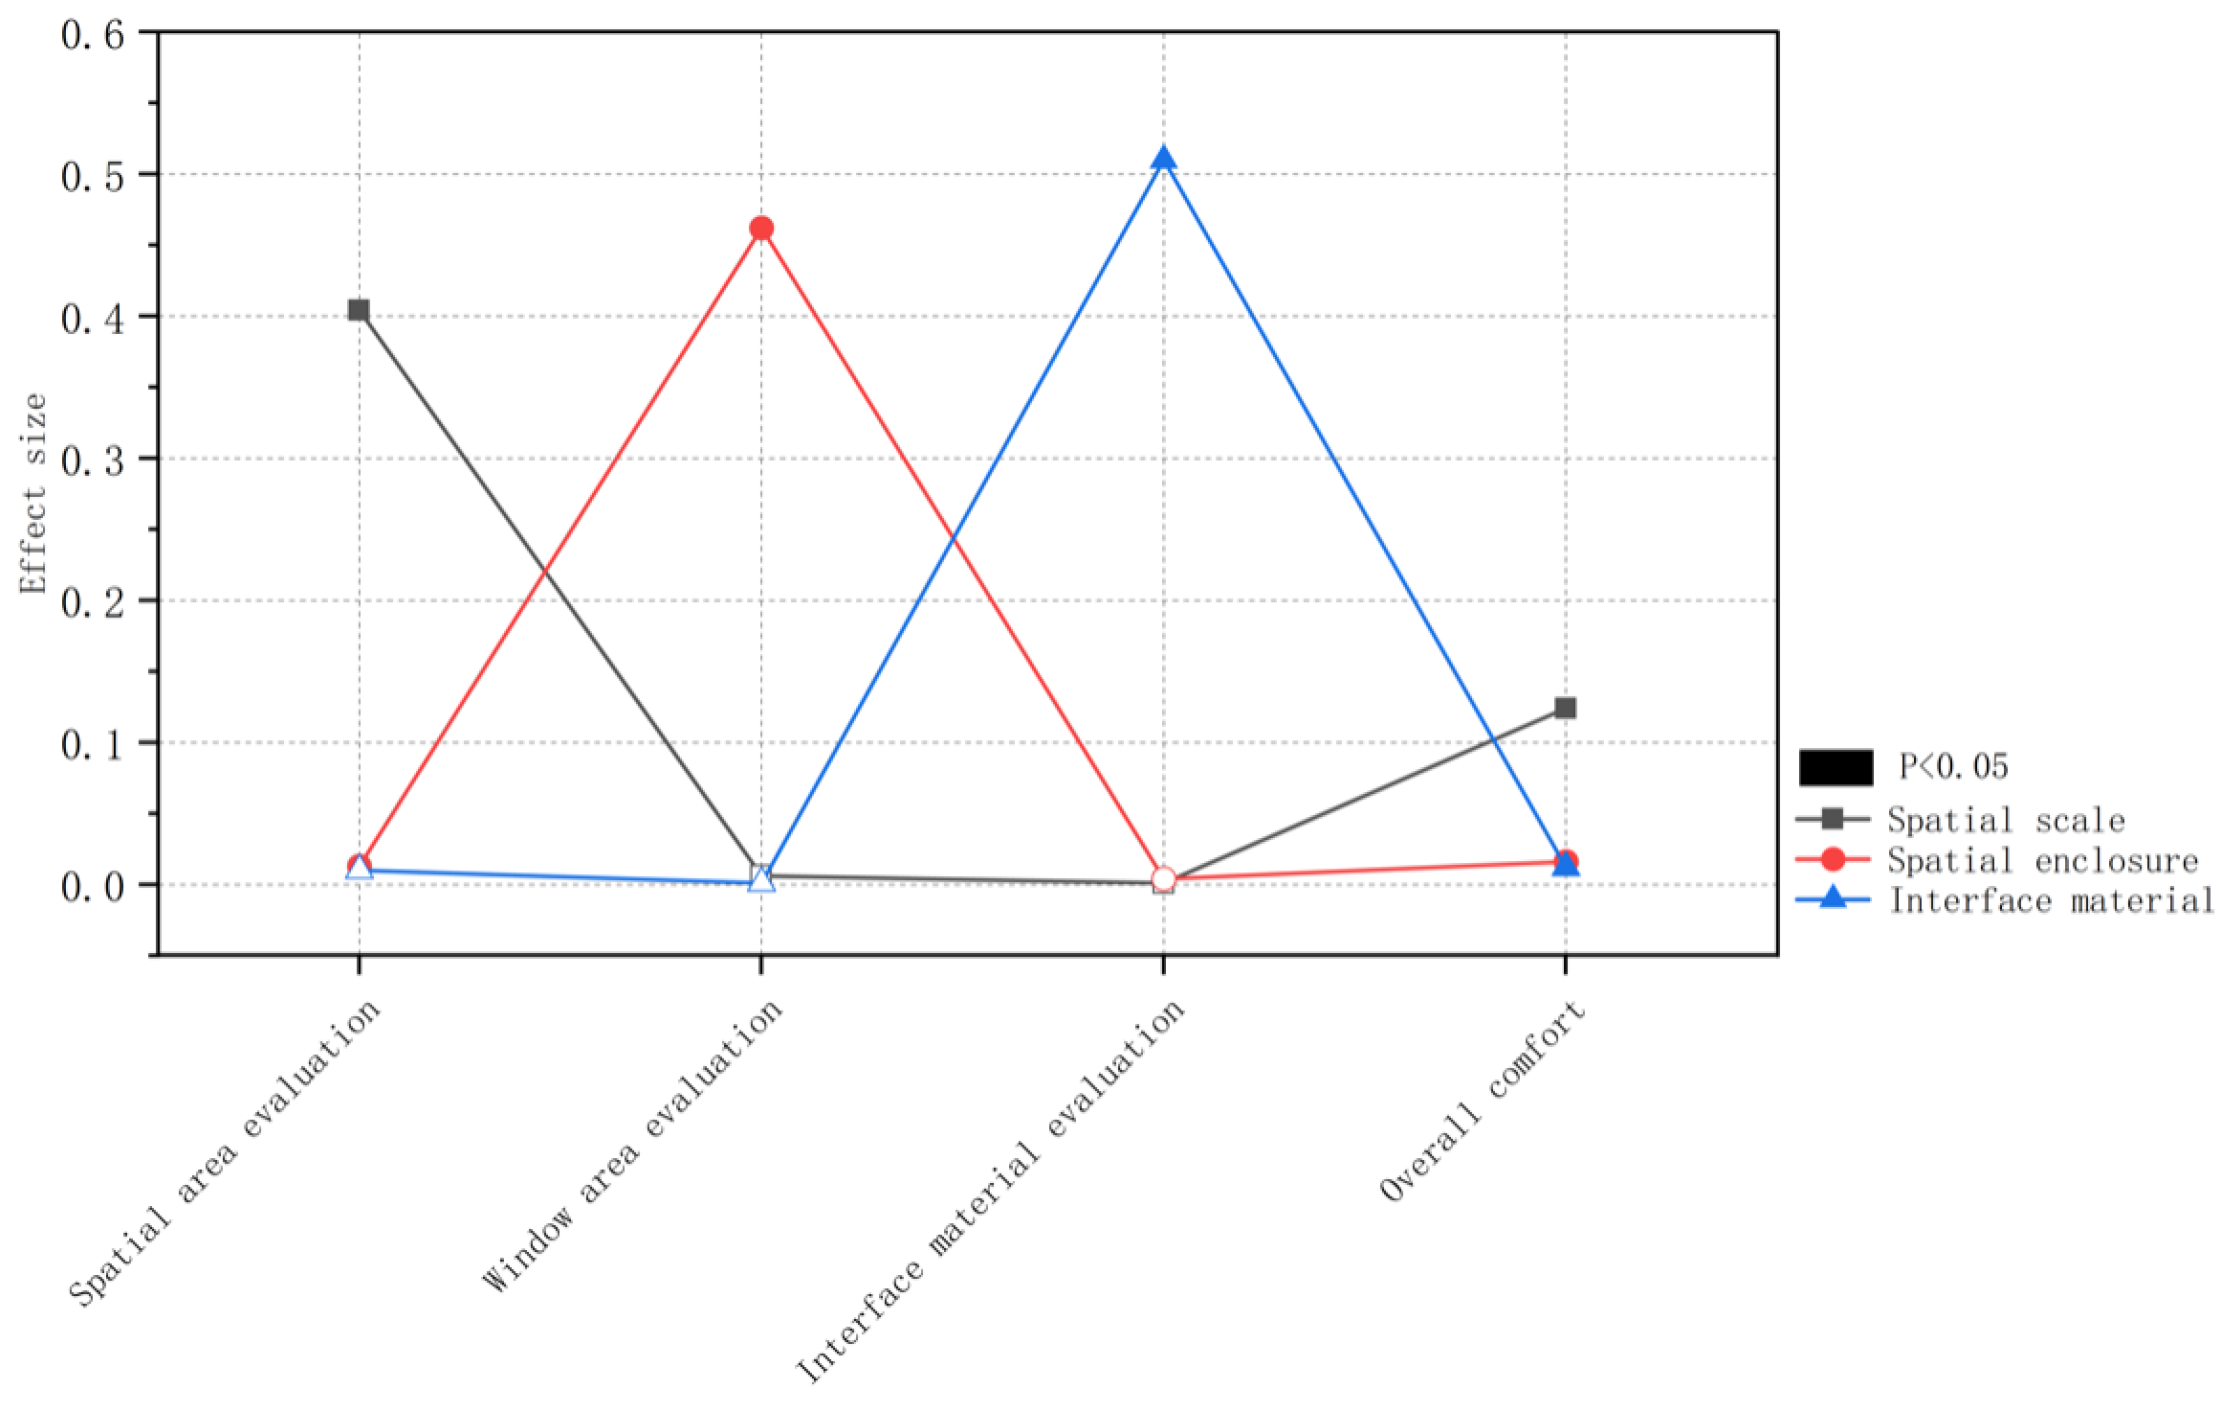
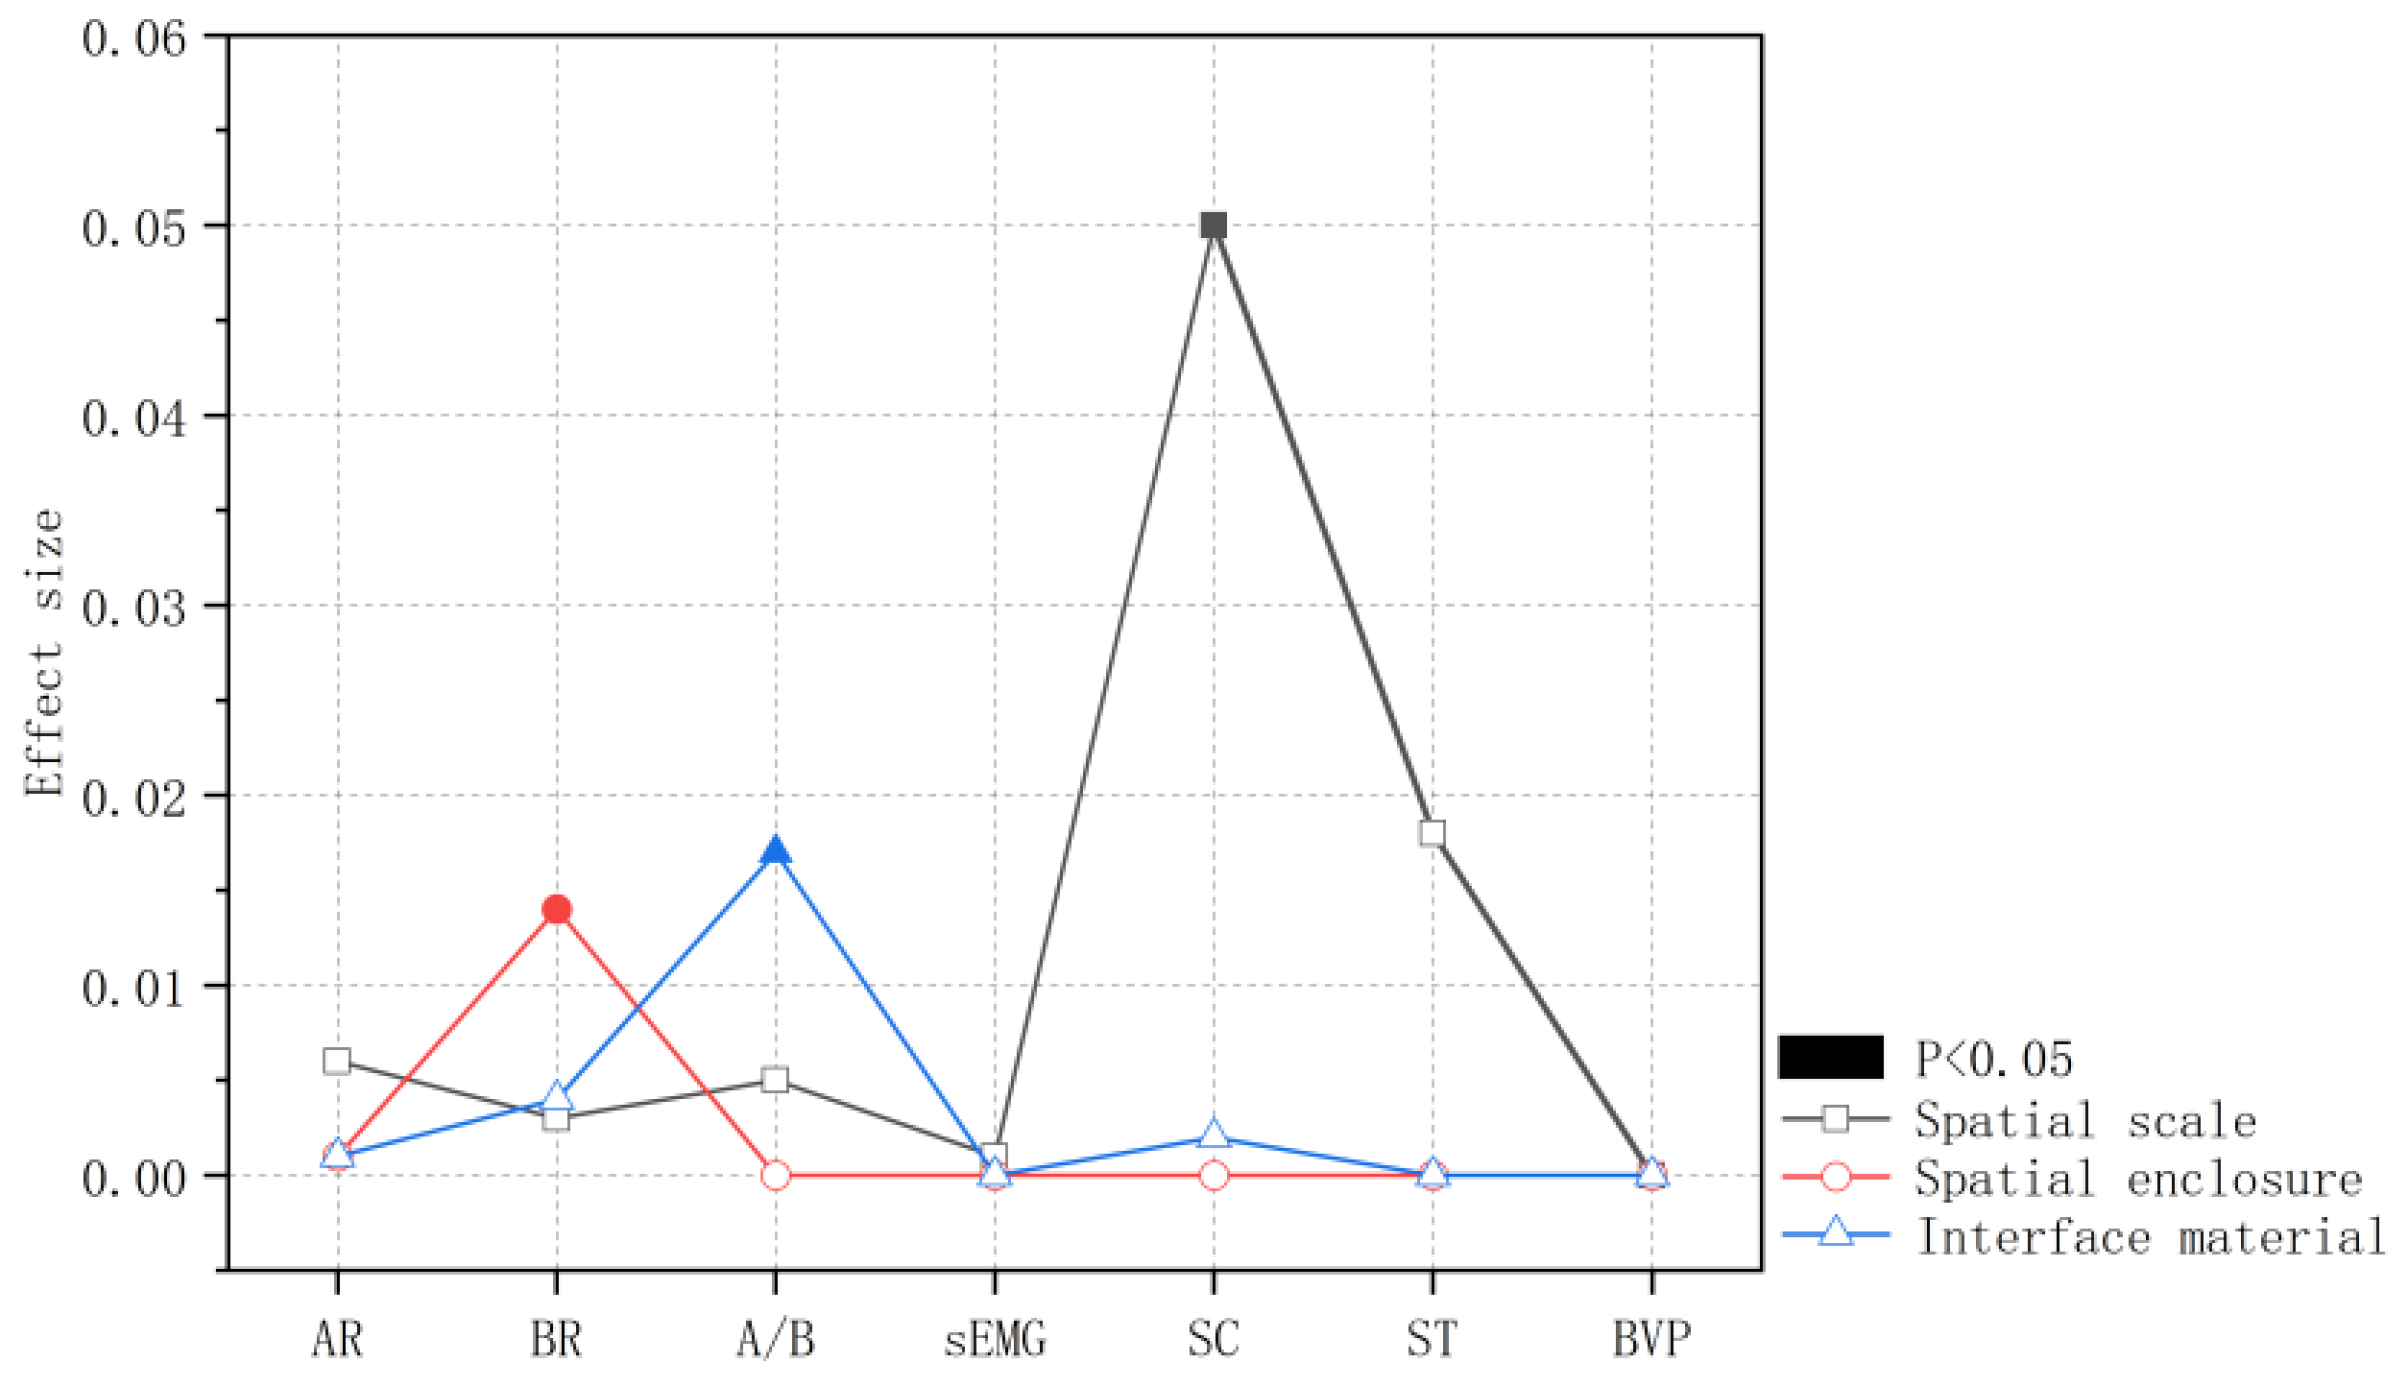
Individual spatial elements significantly impacted both subjective perception and physiological indicators. (1) Direction of impact: Larger SSs, higher WWR, and wooden IM brought about greater spatial comfort. Physiologically, BR and SC were lower, and A/B was higher, confirming the relaxation effect of these spatial elements. (2) Combined effect of multiple elements: Spatial perception is a multidimensional experience, in which individual spatial elements interact to shape perception. Specifically, both area size and WWR jointly impacted area evaluation. All three spatial elements significantly impacted overall comfort. Different physiological indicators responded to different spatial elements. For instance, SS significantly impacted SC; WWR and IM impacted EEG, BR, and A/B ratio, respectively. (3) Effect size of spatial elements: The effect size of spatial elements on overall comfort (subjective perception) followed an order of SS > WWR > IM (Figure 16). This is in favorable agreement with the findings obtained by Hecht (2011), who confirmed that SS is the dominant factor impacting spatial perception [33]. The effect size of spatial elements on physiological indicators followed an order of SS > IM > WWR (Figure 17).

4.2. Interaction Effects of Different Spatial Elements on Perception

4.2.1. Interaction Between Spatial Scale and Area Ratio of Window to Wall

A significant interaction effect was observed between SS and WWR in area evaluation. Although an increase in the WWR reinforced the perceived spatial area, the magnitude of this effect varied across different SSs. In XL spaces, an increase in the WWR significantly enhanced the perception of the spatial area, allowing for a more spacious sense of the environment. However, the WWR had a minimal impact on area evaluation in XXL and L spaces, as perceived areas remained similar across different enclosure conditions. The single-factor analysis of individual spatial elements specifies that the WWR significantly impacted area evaluation. The interaction analysis further reveals that the effect of the WWR was more pronounced at specific SSs. Notably, adjusting the WWR had limited effectiveness in enhancing perceived area when the SS was too large or too small. At extreme SSs (too large or too small), adjusting the WWR did not effectively alter area perception since people feel more relaxed in spaces that incorporate natural elements (e.g., daylight), leading to higher area evaluations.

4.2.2. Interaction Between Spatial Scale and Interface Material

The impact of IM (white paint vs. wood) and the WWR evaluations varied across different SSs. In XXL and XL spaces, white-painted surfaces enhanced both area and window size evaluations. In L spaces, wooden surfaces brought about higher area and window size evaluations. Following biophilic design theory, people feel more relaxed in environments incorporating natural materials. In smaller spaces, where participants are physically closer to IM, visual stimuli from wood surfaces may trigger responses in other sensory modalities (e.g., touch and smell), intensifying the psychological effect of the material. This increased relaxation further reinforced area perception. In micro-living spaces, increasing the use of wood may enhance perceived area and window size, contributing to the improvement of spatial comfort. Material selection should be tailored to SS. In other words, larger spaces may benefit from white-painted surfaces, while smaller spaces may require more natural materials such as wood to optimize perception and comfort.
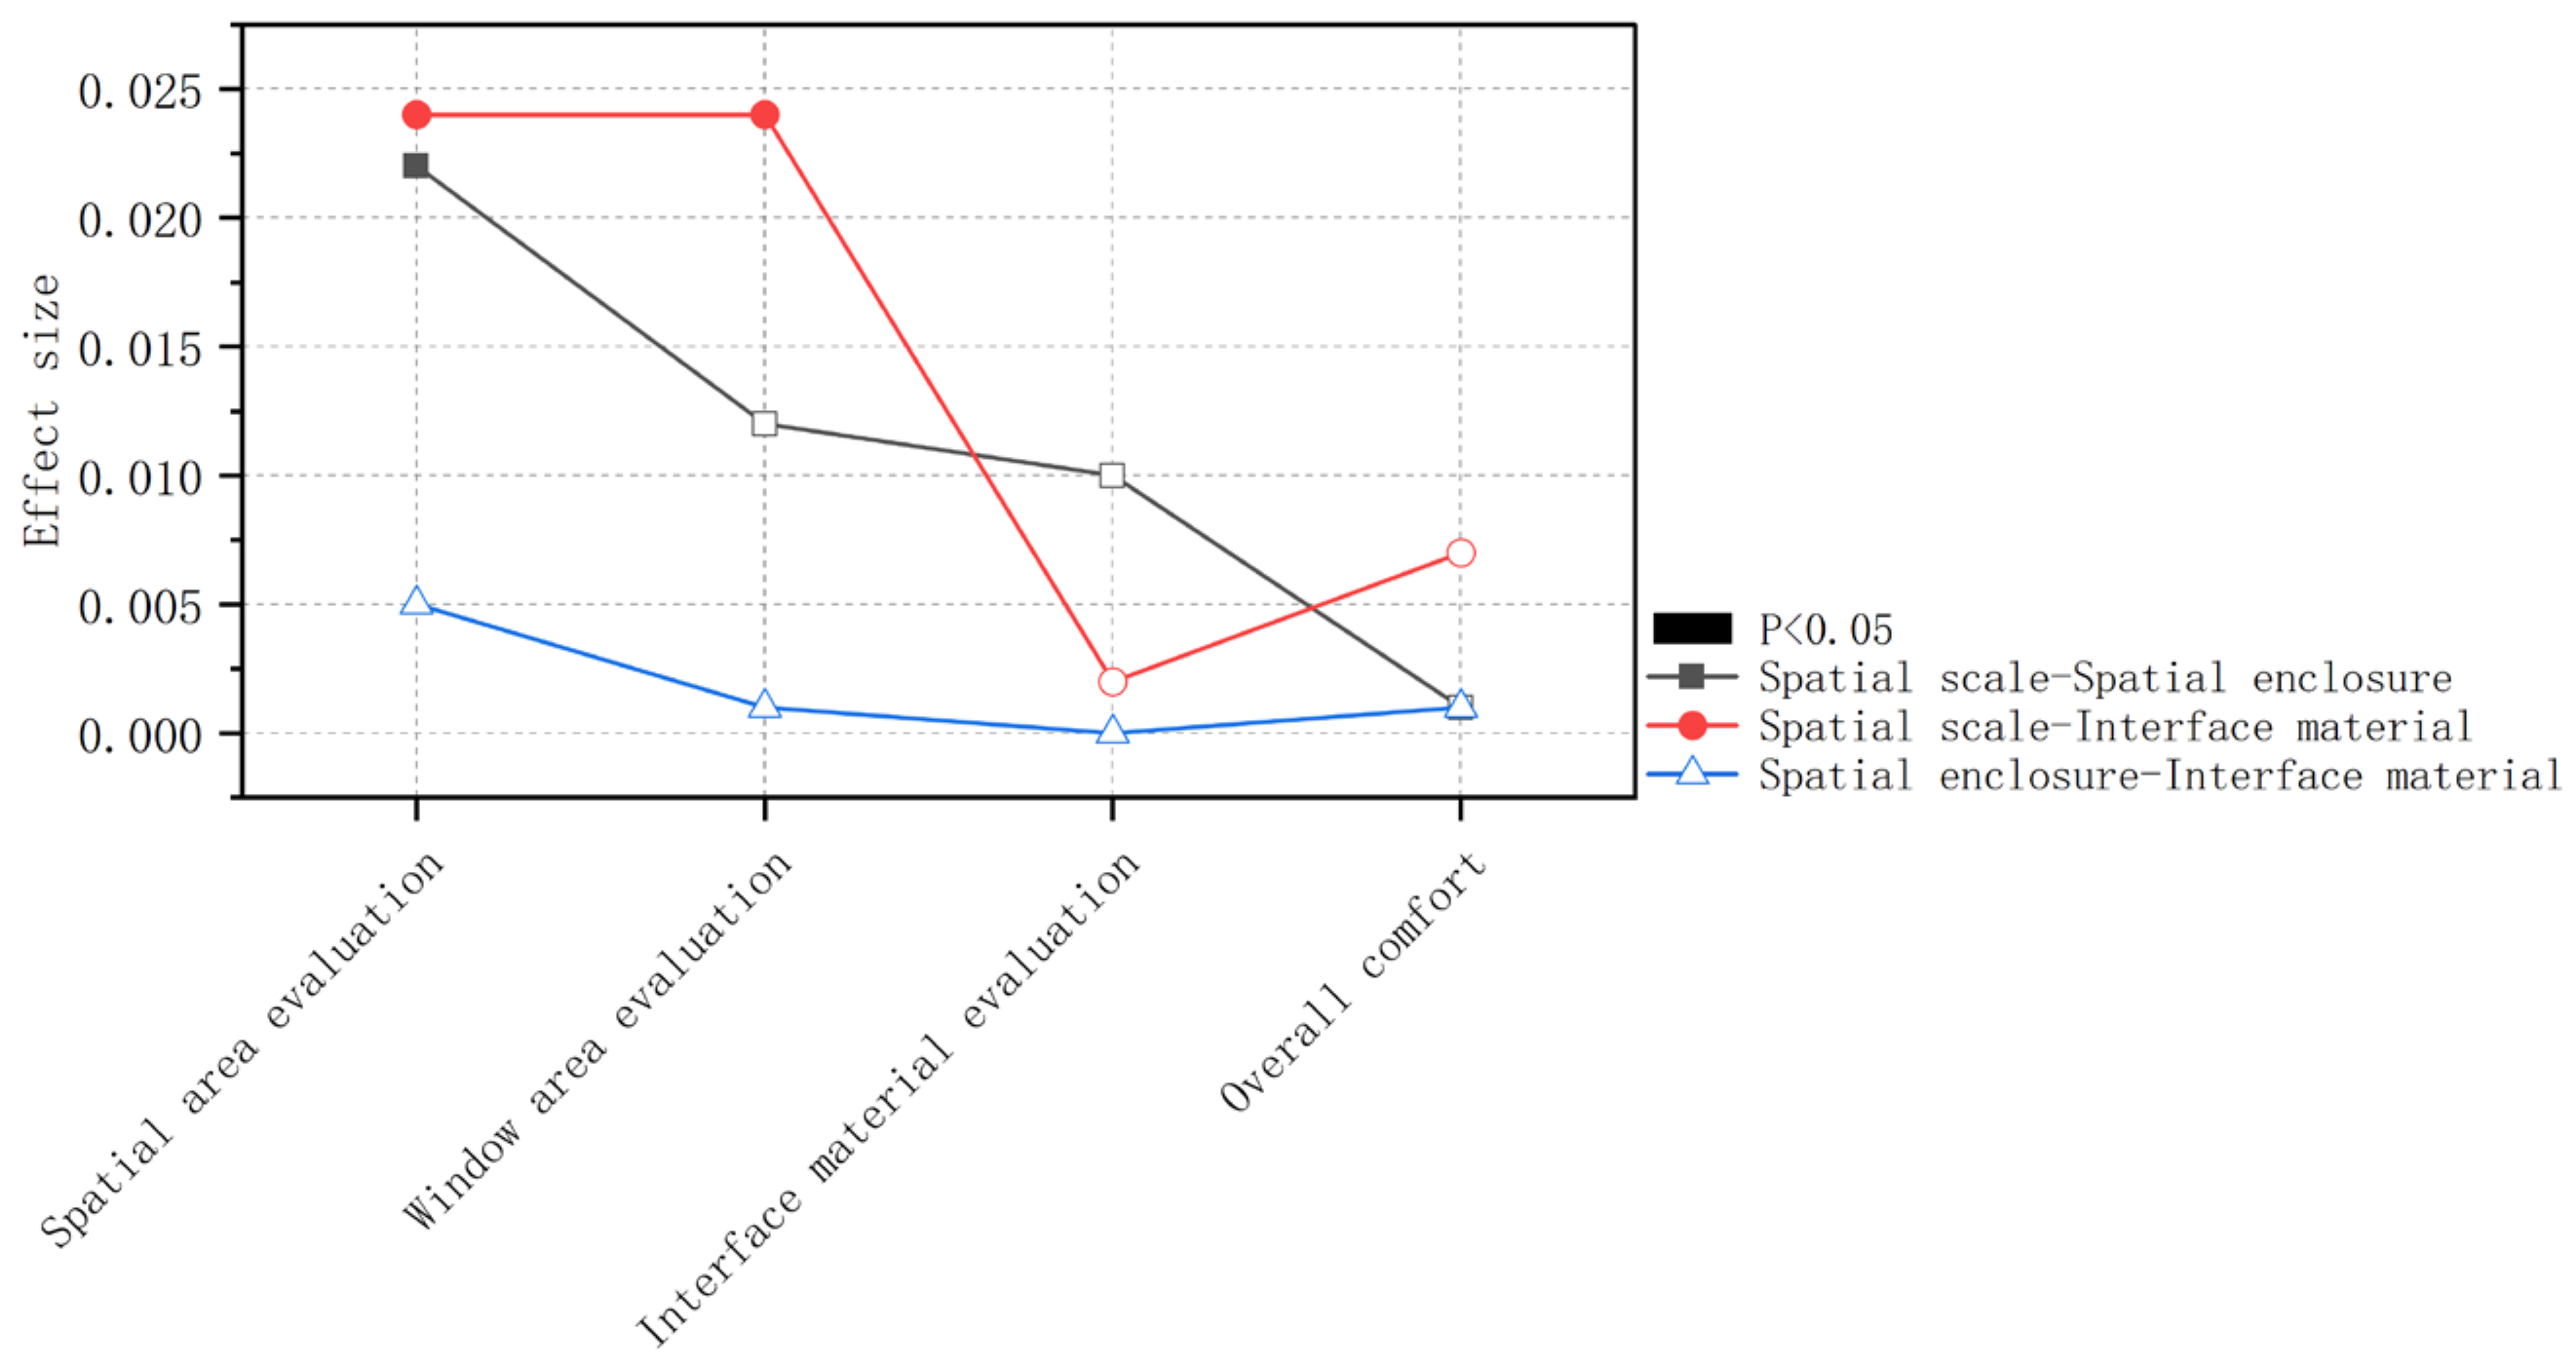
The observed interactions between SS and other spatial elements further confirmed the multidimensional, integrated, and complex properties of spatial perception. Significant interaction effects were observed between SS and both WWR and IM, but not between WWR and IM. The magnitude of interaction effects is depicted in Figure 18, which demonstrates the strongest interaction effect between SS and IM. This result further supports the conclusion that SS plays the most dominant role in perception among the three spatial elements. Additionally, no significant interaction effects appeared in physiological indicators across different spatial elements, specifying that human physiological responses remain relatively stable and are less impacted by interactions between spatial elements.
Overall, the impact of spatial form elements on subjective perception and physiological indicators exhibits a complex and multifaceted property, as illustrated in Figure 19. Each spatial form element exerted a direct impact on spatial perception and overall comfort. In limited spatial conditions, increasing SS, the WWR, and incorporating more wooden materials enhanced comfort levels and promoted positive emotional responses. This was further validated by physiological indicators. Additionally, individual spatial elements interacted and compensated for one another. By strategically utilizing these compensatory effects, overall comfort in space-constrained environments could be optimized through adjustments in the WWR and IM. Furthermore, the impact of the WWR and IM varied across different SSs. When leveraging compensatory effects, interactions between SS and other elements should be considered to maximize design effectiveness. Understanding the complex and integrated properties of spatial perception allows designers to strategically manipulate SS, enclosure, and materials so as to strengthen comfort, well-being, and spatial quality, even within limited living spaces. The study also found that EEG and SC were more sensitive to spatial changes, while ST, BVP, and EMG changes were weaker or insignificant. This likely relates to the sensitivity of the measurement tools, the relatively short exposure time (2 min), and the inherent responsiveness of these indicators to subtle environmental stimuli. For instance, ST changes typically occur slowly; a brief sitting task may be insufficient to induce significant HR or EMG alterations. These “non-significant results” suggest that during short microenvironment exposures, certain physiological systems may be less sensitive than the EEG and SC. This provides crucial guidance for future studies in selecting measurement tools and determining experimental duration, avoiding the assumption that all physiological indicators should be treated equally. Furthermore, as the participants in this study comprised 30 college students, future research could include subjects of varying ages, cultural backgrounds, and socioeconomic statuses to enhance the generalizability of the findings.

5. Conclusions

Micro-housing has emerged as a compact, economically viable, and space-efficient residential solution under the framework of high-quality urban development. It assists in effectively addressing the intensification of land use and serves as a critical housing type for new urban residents. In this study, objective physiological measurements were integrated with subjective perception assessments to quantify the impacts of spatial form elements on human perception. The results reveal the impact of SS, WWR, and IM on both subjective perception ratings and objective physiological indicators. The crucial conclusions are drawn below.

5.1. Direct Impacts and Compensation Mechanisms of Individual Spatial Elements

Concerning the impacts on subjective perception, (1) all three spatial elements (SS, WWR, and IM) significantly impacted spatial perception and overall comfort. The relative importance of these elements followed an order of SS > WWR > IM. Larger spatial areas, higher WWR, and wooden materials brought about greater perceived spaciousness and higher comfort ratings. (2) The WWR exerted a compensatory effect on area perception. Specifically, an increase in the WWR contributed to the improved perceived spatial area, particularly in mid-sized spaces.
Regarding the impacts on physiological indicators, (1) SS significantly impacted SC. Larger spaces led to lower SC values in the three SSs tested, reflecting a more relaxed physiological state. (2) The WWR significantly impacted EEG BR. A larger WWR had lower BR, signifying greater relaxation. (3) IM significantly impacted EEG A/B ratios. Wooden spaces exhibited higher A/B ratios attributed to greater positive emotional responses. These physiological results are consistent with subjective perception results, confirming the relationship between spatial form elements and human perception from a physiological perspective.

5.2. Interaction Effects Among Different Spatial Elements

(1) Interaction between SS and WWR in area evaluation: Increasing the WWR significantly enhanced perceived spaciousness in XL spaces. However, the WWR had little impact on area evaluation in XXL and L spaces. (2) Interaction between SS and IM in area and window size evaluation: In L spaces, wooden surfaces reinforced both area and window size evaluations compared to white-painted surfaces. In contrast, white-painted surfaces brought about higher area and window size evaluations in XXL and XL spaces. Moreover, no significant interaction effects were observed in physiological indicators.
In summary, the impact of spatial elements on perception in micro-housing is characterized by multidimensionality, complexity, and integrative effects. In spatial design, both the direct and compensatory effects of form elements should be maximized to achieve better residential comfort. This approach can optimize overall spatial perception, thereby improving housing quality for new urban residents. In practical applications, constraints such as affordability, sustainability, and cultural context of micro-living spaces should be comprehensively considered to seek optimized combinations rather than simplistic application of single solutions. It is recommended to prioritize more cost-effective strategies (e.g., using wood finishes on key surfaces instead of everywhere, optimizing WWR through design techniques rather than unlimited expansion). While the research team possesses the capability to complete the current analysis, deeper neuroscientific interpretations may require closer collaboration with specialists in the field—an area for future refinement. Additionally, the 30 s resting period in this study primarily served to allow participants to adapt to the sensors and stabilize signals. It was not recorded as a formal baseline for subsequent data normalization, meaning it may not fully account for differences in physiological foundations between individuals.
Additionally, physiological measurements were integrated with subjective perception analysis in this study, providing a quantitative and objective approach for evaluating spatial perception. This methodology enlightens the measurement of human spatial perception results. Given the ongoing trend in multidisciplinary research integration, future studies should consider the aspects below.

5.2.1. Expanding Research Scope: Investigating the Holistic Impact of Space on Perception

This study primarily focused on spatial form elements (SS, WWR, and IM). In the future, a comprehensive framework that includes both spatial form factors and physical performance elements, such as acoustic conditions, lighting conditions, thermal environment, and air quality, should be established. This holistic approach will deepen the understanding of how the built environment impacts human perception and well-being.

5.2.2. Integrating Multidisciplinary Research: Establishing a New Paradigm for Space-Perception Studies

In future research, a more integrative research model should be developed by leveraging advancements in human factors, computer science, and cognitive neuroscience. Incorporating simulation experiments and artificial intelligence-driven analytical methods can facilitate more precise modeling and prediction of human responses to different spatial environments. Furthermore, a multidisciplinary paradigm should be established for spatial perception research to acquire a multi-perspective, multi-dimensional, and multi-layered understanding of human–space interactions.
Author Contributions

Conceptualization, P.S., J.W., L.W. and D.R.; Methodology, P.S., J.W. and L.W.; Software, J.W.; Investigation, J.W. and Z.J.; Writing—original draft, P.S. and J.W.; Writing—review and editing, P.S., L.W. and D.R.; Visualization, J.W. and Z.J.; Supervision, P.S., L.W. and D.R.; Project administration, P.S.; Funding acquisition, P.S. All authors have read and agreed to the published version of the manuscript.

Funding

This research was funded by the National Natural Science Foundation of China, grant numbers 52578015 and 52078178.

Data Availability Statement

The data presented in this study are available on request from the corresponding author.

Acknowledgments

The authors sincerely thank all participants for their time and contribution to the experiments.

Conflicts of Interest

Author Jiawei Wang was employed by the company China Railway Design Corporation. The remaining authors declare that the research was conducted in the absence of any commercial or financial relationships that could be construed as a potential conflict of interest.

References

  1. Leech, J.A.; Nelson, W.C.; Burnett, R.T.; Aaron, S.; Raizenne, M.E. It’s about time: A comparison of Canadian and American time–activity patterns. J. Expo. Sci. Environ. Epidemiol. 2002, 12, 427–432. [Google Scholar] [CrossRef]
  2. Tsang, T.W.; Mui, K.W.; Wong, L.T. Investigation of thermal comfort in sleeping environment and its association with sleep quality. Build. Environ. 2021, 187, 107406. [Google Scholar] [CrossRef]
  3. Foye, C. The Relationship Between Size of Living Space and Subjective Well-Being. J. Happiness Stud. 2017, 18, 427–461. [Google Scholar]
  4. Zhang, X.; Lian, Z.; Wu, Y. Human physiological responses to wooden indoor environment. Physiol. Behav. 2017, 174, 27–34. [Google Scholar] [CrossRef] [PubMed]
  5. Vartanian, O.; Navarrete, G.; Chatterjee, A.; Fich, L.B.; Gonzalez-Mora, J.L.; Leder, H.; Modroño, C.; Nadal, M.; Rostrup, N.; Skov, M. Architectural design and the brain: Effects of ceiling height and perceived enclosure on beauty judgments and approach-avoidance decisions. J. Environ. Psychol. 2015, 41, 10–18. [Google Scholar] [CrossRef]
  6. Fich, L.B.; Jnsson, P.; Kirkegaard, P.H.; Wallergrd, M.; Garde, A.H.; Hansen, S. Can architectural design alter the physiological reaction to psychosocial stress? A virtual TSST experiment. Physiol. Behav. 2014, 135, 91–97. [Google Scholar] [CrossRef]
  7. Shemesh, A.; Leisman, G.; Bar, M.; Grobman, Y.J. The emotional influence of different geometries in virtual spaces: A neurocognitive examination. J. Environ. Psychol. 2022, 81, 101802. [Google Scholar] [CrossRef]
  8. Jiang, Y.; Li, N.; Yongga, A.; Yan, W. Short-term effects of natural view and daylight from windows on thermal perception, health, and energy-saving potential. Build. Environ. 2022, 208, 108575. [Google Scholar]
  9. Aiello, L.C.; Wheeler, P. The Expensive-Tissue Hypothesis: The Brain and the Digestive System in Human and Primate Evolution. Curr. Anthropol. 1995, 36, 199–221. [Google Scholar]
  10. Fox, M.D.; Raichle, M.E. Spontaneous fluctuations in brain activity observed with functional magnetic resonance imaging. Nat. Rev. Neurosci. 2007, 8, 700–711. [Google Scholar] [CrossRef]
  11. Zhang, Y.; Yan, G.; Chang, W.; Huang, W.; Yuan, Y. EEG-based multi-frequency band functional connectivity analysis and the application of spatio-temporal features in emotion recognition. Biomed. Signal Process. Control 2023, 79, 104157. [Google Scholar] [CrossRef]
  12. Rutkowska, J.M.; Ghilardi, T.; Vacaru, S.V.; van Schaik, J.E.; Meyer, M.; Hunnius, S.; Oostenveld, R. Optimal processing of surface facial EMG to identify emotional expressions: A data-driven approach. Behav. Res. Methods 2024, 56, 7331–7344. [Google Scholar] [CrossRef] [PubMed]
  13. Liu, F.; Liu, G.; Lai, X. Emotional Intensity Evaluation Method Based on Galvanic Skin Response Signal. In Proceedings of the 2014 Seventh International Symposium on Computational Intelligence and Design, Hangzhou, China, 13–14 December 2014; pp. 257–261. [Google Scholar]
  14. Balconi, M.; Lucchiari, C. Consciousness and arousal effects on emotional face processing as revealed by brain oscillations. A gamma band analysis. Int. J. Psychophysiol. 2008, 67, 41–46. [Google Scholar] [CrossRef] [PubMed]
  15. Vijaya, P.A.; Shivakumar, G. Galvanic Skin Response: A Physiological Sensor System for Affective Computing. Int. J. Mach. Learn. Comput. 2013, 3, 31–34. [Google Scholar] [CrossRef]
  16. Kreibig, S.D. Autonomic nervous system activity in emotion: A review. Biol. Psychol. 2010, 84, 394–421. [Google Scholar] [CrossRef]
  17. McFarland, R.A. Relationship of skin temperature changes to the emotions accompanying music. Biofeedback Self-Regul. 1985, 10, 255–267. [Google Scholar] [CrossRef]
  18. Soleymani, M.; Villaro-Dixon, F.; Pun, T.; Chanel, G. Toolbox for Emotional feature extraction from Physiological signals (TEAP). Front. ICT 2017, 4, 2017. [Google Scholar] [CrossRef]
  19. Kim, S.; Yun, B.Y.; Choi, J.Y.; Kim, Y.U.; Kim, S. Quantification of visual thermal perception changes in a wooden interior environment using physiological responses and immersive virtual environment. Build. Environ. 2023, 240, 110420. [Google Scholar] [CrossRef]
  20. Larson, M.J.; Carbine, K.A. Sample size calculations in human electrophysiology (EEG and ERP) studies: A systematic review and recommendations for increased rigor. Int. J. Psychophysiol. 2017, 111, 33–41. [Google Scholar] [CrossRef]
  21. Guan, H.; Hu, S.; Lu, M.; He, M.; Zhang, X.; Liu, G. Analysis of human electroencephalogram features in different indoor environments. Build. Environ. 2020, 186, 107328. [Google Scholar] [CrossRef]
  22. Pigliautile, I.; Casaccia, S.; Morresi, N.; Arnesano, M.; Pisello, A.L.; Revel, G.M. Assessing occupants’ personal attributes in relation to human perception of environmental comfort: Measurement procedure and data analysis. Build. Environ. 2020, 177, 106901. [Google Scholar] [CrossRef]
  23. Chen, J.; Taylor, J.E.; Comu, S. Assessing Task Mental Workload in Construction Projects: A Novel Electroencephalography Approach. J. Constr. Eng. Manag. 2017, 143, 04017053.1–04017053.13. [Google Scholar] [CrossRef]
  24. Hu, M.; Roberts, J. Built Environment Evaluation in Virtual Reality Environments—A Cognitive Neuroscience Approach. Urban Sci. 2020, 4, 48. [Google Scholar] [CrossRef]
  25. Frescura, A.; Lee, P.-J.; Jeong, J.-H.; Soeta, Y. EEG alpha wave responses to sounds from neighbours in high-rise wood residential buildings. Build. Environ. 2023, 242, 110560. [Google Scholar] [CrossRef]
  26. Cruz-Garza, J.G.; Darfler, M.; Rounds, J.D.; Gao, E.; Kalantari, S. EEG-based investigation of the impact of room size and window placement on cognitive performance. J. Build. Eng. 2022, 53, 104540. [Google Scholar] [CrossRef]
  27. Kim, S.; Park, H.; Choo, S. Effects of Changes to Architectural Elements on Human Relaxation-Arousal Responses: Based on VR and EEG. Int. J. Environ. Res. Public Health 2021, 18, 4305. [Google Scholar] [CrossRef] [PubMed]
  28. Nehmad, O.D.L. The end in sight: A look at the occipital lobe. Clin. Eye Vis. Care 1998, 10, 125–133. [Google Scholar] [CrossRef]
  29. Rizzolatti, G.; Fogassi, L.; Gallese, V. Parietal cortex: From sight to action. Curr. Opin. Neurobiol. 1997, 7, 562–567. [Google Scholar] [CrossRef]
  30. Naiman, R. Dreamless: The silent epidemic of REM sleep loss. Ann. N. Y. Acad. Sci. 2017, 1406, 77–85. [Google Scholar] [CrossRef]
  31. Chang, C.-C.; Oh, R.R.Y.; Nghiem, T.P.L.; Zhang, Y.; Tan, C.L.Y.; Lin, B.B.; Gaston, K.J.; Fuller, R.A.; Carrasco, L.R. Life satisfaction linked to the diversity of nature experiences and nature views from the window. Landsc. Urban Plan. 2020, 202, 103874. [Google Scholar] [CrossRef]
  32. Wang, H.; Liu, G.; Hu, S.; Liu, C. Experimental investigation about thermal effect of colour on thermal sensation and comfort. Energy Build. 2018, 173, 710–718. [Google Scholar] [CrossRef]
  33. Daniel, O.; Hecht, H. Fashion Versus Perception: The Impact of Surface Lightness on the Perceived Dimensions of Interior Space. Hum. Factors J. Hum. Factors Ergon. Soc. 2011, 53, 284–298. [Google Scholar]
Figure 1. Actual view of the laboratory.
Buildings 15 03694 g001
Figure 2. (a) Laboratory floor plan; (b) ceiling view of laboratory.
Buildings 15 03694 g002
Figure 3. Actual scenes of different experimental conditions.
Buildings 15 03694 g003
Figure 4. Experimental flowchart.
Buildings 15 03694 g004
Figure 5. Experimental procedure.
Buildings 15 03694 g005
Figure 6. (a) Temperature, humidity, and illuminance recorder; (b) multi-function sound level meter; (c) illuminance and color temperature control terminals.
Buildings 15 03694 g006
Figure 7. Questionnaire structure.
Buildings 15 03694 g007
Figure 8. EEG data processing flowchart.
Buildings 15 03694 g008
Figure 9. (a) Acquisition point location; (b) acquisition interface screenshot.
Buildings 15 03694 g009
Figure 10. Evaluations of (a) space area; (b) window area; and (c) IM. Note: * denotes p < 0.05 and ** denotes p < 0.01.
Buildings 15 03694 g010
Figure 11. Mean distribution of the space area under. (a) Different area ratios of window to wall. (b) Different IMs.
Buildings 15 03694 g011
Figure 12. Mean distribution of window area evaluation under different IMs.
Buildings 15 03694 g012
Figure 13. Overall comfort. Note: * denotes p < 0.05 and ** denotes p < 0.01.
Buildings 15 03694 g013
Figure 14. (a) Alpha power; (b) Beta power; (c) AR; (d) BR; (e) A/B ratio. Note: * denotes p < 0.05 and ** denotes p < 0.01.
Buildings 15 03694 g014
Figure 15. (a) EMG; (b) SC; (c) ST; (d) BVP. Note: * denotes p < 0.05, ** denotes p < 0.01, and *** denotes p < 0.001.
Buildings 15 03694 g015
Figure 16. Effect size of single spatial element on subjective perception.
Buildings 15 03694 g016
Figure 17. Effect size of single spatial element on physiological indicators.
Buildings 15 03694 g017
Figure 18. Interaction effects of different spatial elements on subjective perception.
Buildings 15 03694 g018
Figure 19. Impact of spatial form on human perception.
Buildings 15 03694 g019
Table 1. EEG and human status in different frequency bands [11].
BrainwaveFrequencyHuman State
Delta<3 HzDeep sleep, unconsciousness, or fatigue
Theta3–8 HzEncountering setbacks or stress
Alpha8–12 HzAwake, calm, and relaxed state
Beta12–30 HzExcited state
Gamma30–100 HzFocused thinking
Table 2. Relationship between SC and human emotional state.
Human Emotional StateSC
Relaxed<5 mho
Slight emotional arousal5–10 mho
Emotional excitement10–20 mho
Anxiety/high vigilance>20 mho
Table 3. Physiological indicators, analysis methods, and sample size in related studies.
ReferencePhysiological IndicatorAnalysis MethodSample Size
Guan et al. [21]EEGOne-sample t-test, one-sample Wilcoxon signed-rank test, Pearson correlation analysis8
Pigliautile et al. [22]ECGPearson correlation analysis, machine learning28
Chen et al. [23]EEGMultifactor ANOVA30
Hu and Roberts [24]EEGWilcoxon signed-rank test, t-test8
Frescura et al. [25]EEGIndependent sample t-test, non-parametric test (Kruskal–Wallis test)30
Cruz-Garza et al. [26]EEGKruskal–Wallis test, machine learning (SVM)23
Kim et al. [27]EEGWilcoxon signed-rank test33
Table 4. Basic information for subjects.
Gender (Number of Participants)Age (Mean ± SD)Height (Mean ± SD)Weight (kg) (Mean ± SD)
Male (14)23.3 ± 1.3176.5 ± 6.370.5 ± 10.1
Female (16)22.5 ± 0.9163.2 ± 5.850.3 ± 8.6
Table 5. Specific parameters for different working conditions.
No.SSWWRIMAxonometric View
1XXL: 3500 × 4900 mm36%WoodBuildings 15 03694 i001
2XXL: 3500 × 4900 mm18%WoodBuildings 15 03694 i002
3XXL: 3500 × 4900 mm36%White paintBuildings 15 03694 i003
4XXL: 3500 × 4900 mm18%White paintBuildings 15 03694 i004
5XL: 2800 × 3900 mm36%WoodBuildings 15 03694 i005
6XL: 2800 × 3900 mm18%WoodBuildings 15 03694 i006
7XL: 2800 × 3900 mm36%White paintBuildings 15 03694 i007
8XL: 2800 × 3900 mm18%White paintBuildings 15 03694 i008
9L: 3500 × 2500 mm36%WoodBuildings 15 03694 i009
10L: 3500 × 2500 mm18%WoodBuildings 15 03694 i010
11L: 3500 × 2500 mm36%White paintBuildings 15 03694 i011
12L: 3500 × 2500 mm18%White paintBuildings 15 03694 i012
Table 6. Specifications of measurement devices.
Measurement ParameterDeviceModelMeasurement RangeAccuracy
Air temperatureTemperature, humidity, and illuminance recorderTR-74Ui-H0–55 °C±0.5 °C
Relative humidity10–95%±5%
Illuminance0–130 klx±5%
A-weighted Sound levelMultifunction sound level meterAWA568828–138 dB0.1 dB
Table 7. Eigenvalues of physiological indicators and characterisation meanings.
SystemPhysiological IndicatorEigenvalueCharacterization Meaning
Brain systemEEGAlpha powerAlpha power and AR are usually positively correlated with relaxation and comfort.
Alpha power ratio
Beta powerBeta power and BR are usually negatively correlated with relaxation and comfort.
Beta power ratio
A/B ratioThe A/B ratio is a comprehensive indicator. A higher ratio indicates a more relaxed state.
Autonomic nervous systemEMGMean valueRelated to emotional arousal level but does not indicate emotional valence.
SCMean value
STMean value
BVPMean value
Table 8. Physiological signal acquisition device information.
Device NameMeasured IndicatorMeasurement RangeAccuracySampling FrequencyInput ImpedanceCommon-Mode Rejection Ratio
Multiparameter biofeedback device
(Infiniti3000A)
EEG2–500 μv≤±10%2048 Hz≥50 MΩ≥110 dB
EMG5–5000 μv≤±10%256 Hz≥5 MΩ≥100 dB
SC0.1–30 μS≤±10%256 Hz--
ST10–45 °C±0.1 °C256 Hz--
BVP0–100%±0.1%256 Hz--
Table 9. Physical environment monitoring results.
Experimental ConditionAir Temperature (°C)Air Humidity (%)Illuminance (lx)Noise Level (dB)
126.1 ± 0.642.5 ± 5338.8 ± 4845.8 ± 5
226.3 ± 0.543.8 ± 8330.8 ± 5046.6 ± 4
325.8 ± 0.744.1 ± 4335.8 ± 4545.5 ± 6
426.2 ± 0.641.3 ± 9332.8 ± 4344.7 ± 6
526.1 ± 0.842.5 ± 5339.8 ± 4244.7 ± 8
626.5 ± 0.743.5 ± 6330.8 ± 4045.9 ± 7
726.5 ± 0.641.5 ± 6337.8 ± 4540.9 ± 8
826.1 ± 0.545.5 ± 8336.8 ± 4846.8 ± 6
926.3 ± 0.745.5 ± 7335.8 ± 5043.8 ± 5
1026.5 ± 0.740.5 ± 6338.8 ± 4843.4 ± 7
1126.4 ± 0.542.5 ± 9335.8 ± 4545.3 ± 6
1226.5 ± 0.746.5 ± 5337.8 ± 4445.1 ± 6
Table 10. Cronbach’s Alpha.
Questionnaire ContentCronbach’s AlphaNumber of Items
Basic evaluation and Overall perception evaluation0.9174
Table 11. Significance analysis of spatial elements and interaction effects on area evaluation.
ScaleWindowMaterialScale–WindowScale-MaterialWindow–Material
η20.404 ***0.013 *0.0100.022 *0.024 *0.005
Sig.0.000 ***0.033 *0.0670.020 *0.014 *0.186
Note: The values represent the p-values and partial ƞ2 obtained from a multi-factor ANOVA significance analysis. * denotes p < 0.05 and *** denotes p < 0.001. Partial η2 = 0.01 indicates that the independent variable has a small effect on the dependent variable; partial η2 = 0.06 reflects that the independent variable has a medium effect on the dependent variable; and partial η2 = 0.14 specifies that the independent variable has a large effect on the dependent variable. This interpretation applies similarly in the following cases.
Table 12. Significance analysis of spatial elements and interaction effects on window area evaluation.
ScaleWindowMaterialScale–WindowScale-MaterialWindow–Material
η20.0060.462 ***0.0010.0120.024 *0.001
Sig.0.3670.000 ***0.4750.1180.014 *0.552
Note: * denotes p < 0.05 and *** denotes p < 0.001.
Table 13. Significance analysis of spatial elements and interaction effects on IM evaluation.
ScaleWindowMaterialScale–WindowScale–MaterialWindow–Material
η20.0010.0040.510 ***0.0100.0020.000
Sig.0.8810.2130.000 ***0.1690.7090.871
Note: *** denotes p < 0.001.
Table 14. Significance analysis of spatial elements and interaction effects on overall comfort.
ScaleWindowMaterialScale–WindowScale–MaterialWindow–Material
η20.124 ***0.016 *0.012 *0.0010.0070.001
Sig.0.000 ***0.016 *0.038 *0.8340.3190.540
Note: * denotes p < 0.05 and *** denotes p < 0.001.
Table 15. Significance analysis of spatial elements and interaction effects on BR.
ScaleWindowMaterialScale–WindowScale–MaterialWindow–Material
η20.0030.014 *0.0040.0030.0020.002
Sig.0.5670.025 *0.2470.6190.6960.468
Note: * denotes p < 0.05.
Table 16. Significance analysis of spatial elements and interaction effects on A/B power ratio.
ScaleWindowMaterialScale–WindowScale–MaterialWindow–Material
η20.0050.0000.017 *0.0000.0110.000
Sig.0.4420.9060.017 *0.9430.1530.897
Note: * denotes p < 0.05.
Table 17. Significance analysis of spatial elements and interaction effects on SC.
ScaleWindowMaterialScale–WindowScale–MaterialWindow–Material
η20.050 ***0.0000.0020.0000.0070.000
Sig.0.000 ***0.9100.3560.9870.2890.748
Note: *** denotes p < 0.001.
Table 18. Post hoc comparison of the SS effect on SC.
ScaleIJMean Difference (I-J)Standard ErrorSignificanceConfidence Interval
Lower LimitUpper Limit
Tukey HSDXXLXL−2.33 ***0.570.000 ***−3.67−0.99
L−1.82 **0.570.004 **−3.16−0.47
XLXXL2.33 ***0.570.000 ***0.993.67
L0.520.570.636−0.821.86
LXXL1.82 **0.570.004 **0.473.16
XL−0.520.570.636−1.860.82
Note: ** denotes p < 0.01 and *** denotes p < 0.001.
Disclaimer/Publisher’s Note: The statements, opinions and data contained in all publications are solely those of the individual author(s) and contributor(s) and not of MDPI and/or the editor(s). MDPI and/or the editor(s) disclaim responsibility for any injury to people or property resulting from any ideas, methods, instructions or products referred to in the content.