Article

Sustainability Assessment of Demountable and Reconfigurable Steel Structures

by
Adrián Ouro Miguélez
1,
Félix Fernández Abalde
1,*,
Manuel Cabaleiro Núñez
2 and
Fernando Nunes Cavalheiro
2
1
Universidade de Vigo, 36310 Vigo, Spain
2
CINTECX, Universidade de Vigo (University of Vigo), GeoTECH, 36310 Vigo, Spain
*
Author to whom correspondence should be addressed.
Buildings 2025, 15(20), 3651; https://doi.org/10.3390/buildings15203651
Submission received: 1 August 2025 / Revised: 23 September 2025 / Accepted: 25 September 2025 / Published: 10 October 2025

Abstract

Steel structures that support machines and industrial process installations should ideally be flexible, adaptable, and easily reconfigurable. However, in current practice, new profiles are frequently used and discarded whenever layout modifications are required, leading to considerable material waste, increased costs, and environmental burdens. Such practices conflict with the principles of the circular economy, in which reusability is preferable to recycling. This paper presents a life cycle sustainability assessment (life cycle cost, LCC, and life cycle assessment, LCA) applied to six structural typologies: (a) welded IPE profiles, (b) bolted IPE profiles, (c) welded tubular profiles, (d) bolted tubular profiles, (e) clamped IPE profiles with demountable joints, and (f) flanged tubular profiles with demountable joints. The assessment integrates structural calculations with an updatable database of costs, operation times, and service lives, providing a systematic framework for evaluating both economic and environmental performance in medium-load industrial structures (0.5–9.8 kN/m2). Application to nine representative case studies demonstrated that demountable clamped and flanged joints become economically competitive after three life cycles, and after only two life cycles under high-load conditions (9.8 kN/m2). The findings indicate relative cost savings of up to 75% in optimized configurations and carbon-footprint reductions of approximately 50% after three cycles. These results provide quantitative evidence of the long-term advantages of demountable and reconfigurable steel structures. Their capacity for repeated reuse without loss of performance supports sustainable design strategies, reduces environmental impacts, and advances circular economy principles, making them an attractive option for modern industrial facilities subject to frequent modifications.

1. Introduction

Achieving a sustainable economic model that meets present and future human needs is a guiding principle that permeates all areas of society. In the construction sector, the demolition of structures, especially those with a service life shorter than 50 years, generates significant inefficiencies and environmental burdens. Within the European Union, construction and demolition activities account for one-third of total annual waste [1]. Although steel is one of the most recyclable construction materials, with recycling rates close to 90%, only about 5% is currently reused [2]. This discrepancy highlights a major limitation: while recycling allows the recovery of material, it requires significant energy for remelting, resulting in high CO2 emissions [3]. In contrast, direct reuse retains the embodied energy and reduces environmental impact, but it remains marginal in practice [4,5]. Several studies reinforce that reuse is more beneficial than recycling in reducing the environmental footprint of steel construction [6,7].
One promising approach to enhancing reuse is the adoption of connecting systems that allow complete construction, disassembly, and reconfiguration of structures, thus fitting into the circular economy model. To increase adoption, it is essential to quantify their economic and environmental benefits while ensuring structural performance. The concept of Design for Deconstruction (DfD) has gained relevance as a design philosophy that promotes adaptability and reusability in construction [7,8,9,10]. Tingley and Davison (2012) [11] demonstrated, through life cycle assessment (LCA), that deconstruction-oriented design reduces environmental impacts. Atta et al. (2021) [12] introduced the concept of material passports to improve the traceability and recovery of structural elements. Santos R. et al. (2020) [13] integrated life cycle sustainability assessment into BIM-based workflows, highlighting that sustainability benefits can be maximized if considered from the design stage. Despite these advances, most applications remain concentrated in buildings, with industrial structures receiving comparatively less attention.
Industrial plants are particularly relevant in this context due to their high rate of transformation. These facilities, including automotive, pharmaceutical, and textile sectors, frequently modify their layouts in cycles often shorter than ten years [14]. These changes directly affect supporting steel structures, requiring frequent adaptation. Figure 1 illustrates typical load-bearing structures of machines and installations built with standard profiles. Although reuse can extend the lifespan of steel beams up to 100 years [11], in practice, the lack of systematic evaluation tools leads to the continued predominance of constructing new structures and scrapping existing ones. Previous research has shown that reuse-oriented strategies reduce material demand, but their implementation depends on both innovative connection technologies and robust evaluation frameworks [14,15,16].
Traditionally, load-bearing steel structures are built using standard profiles joined by welding or classic bolted joints [17,18]. Welded joints are permanent and require torch cutting for dismantling, which is often more expensive than purchasing new members, resulting in systematic scrapping. Classic bolted joints permit partial disassembly but require preparatory work such as welding end plates, stiffening, or drilling, making the components specific to their initial use and difficult to reuse in other contexts. Consequently, neither welded nor bolted joints are effectively reused. To overcome these limitations, innovative clamp-based and flanged joints have been developed as alternatives that enable fully demountable and reconfigurable steel structures [14]. Figure 2 shows examples of these alternatives. Unlike traditional methods, these systems avoid drilling and welding, requiring only cutting to length, which allows almost indefinite reuse.
Recent studies have analyzed the mechanical performance of these solutions. Cabaleiro et al. [14,19,20] studied the behavior of clamp-based joints, and Pongiglione et al. (2021) [21] proposed reversible joints for seismic applications. More recently, Cavalheiro et al. (2025) [22,23] provided experimental and finite element results showing that clamp-based joints can reproduce the performance of welded and bolted systems under service loads while enabling disassembly and reuse. These studies confirm the mechanical viability of demountable connections but also highlight their higher initial costs compared to conventional joints, which has limited their adoption. Therefore, it is essential to complement structural assessments with integrated economic and environmental evaluations.
The lifespan of a structure is a complex concept. For buildings, it is typically estimated at 50 years [24], whereas reusable materials such as steel beams can reach 100 years [11]. In the case of industrial support structures, where layout changes occur approximately every ten years, this translates to five reconfiguration cycles before full replacement. Several studies have developed tools to evaluate economic and environmental impacts in this context. Basta et al. (2020) [8] proposed a BIM-based framework for assessing deconstructability, while Romano et al. (2020) [9] employed a multi-performance approach for steel structures. Usefi et al. (2021) [25] evaluated hybrid modular frames, Brütting et al. (2019, 2020) [26,27] investigated optimization strategies for reusing beams and lattice structures, and Atta et al. (2021) [12] presented material passports. Liu et al. (2022) [16] examined modular demountable light-gauge systems, and Pongiglione et al. (2014) [15] demonstrated reuse in a real case study. However, most of these works focus on building systems rather than medium-load industrial support structures. In particular, few contributions combine both economic and environmental dimensions within a unified framework, which limits their applicability to industrial facilities. This lack of integrated approaches highlights the need for comprehensive assessments that consider structural, economic, and environmental aspects simultaneously.
The objective of this work is to develop and apply a methodology that integrates structural calculation, life cycle cost (LCC), and life cycle assessment (LCA) to evaluate and compare six typologies of steel structures, including welded, bolted, clamped, and flanged alternatives. The methodology, implemented through an algorithm described in Section 2, allows systematic comparison by means of cost and sustainability ratios. This approach addresses the current research gap by providing quantitative evidence of the long-term economic and environmental performance of demountable and reconfigurable joints in industrial applications.

2. Proposed Methodology

Previous studies have addressed the sustainability of steel structures using different approaches. Some focused mainly on environmental aspects through life cycle assessment (LCA) [8,9,10,25], while others emphasized cost-based evaluations or design-for-deconstruction metrics [11,12,15]. However, when applied in isolation, these methods do not capture the full complexity of sustainability, as LCA disregards the economic trade-offs while LCC neglects environmental impacts. To overcome these limitations, the present study integrates life cycle cost (LCC) and life cycle assessment (LCA) within a single framework, implemented through an algorithm that also incorporates structural calculations and an updatable cost-time database. This integration provides a balanced and comprehensive evaluation of welded, bolted, clamped, and flanged solutions under comparable conditions. The adopted approach allows not only quantifies economic and environmental performance consistently, but also to identify the optimal typology for each case study, offering a more robust decision-support tool than partial methods.
The methodology considers six structural typologies: (a) Structure with IPE steel profiles joined by welding. (b) Structure with tubular steel profiles with welded joints. (c) Structure with IPE steel profiles with classic bolted joints. (d) Structure with tubular steel profiles with classic bolted joints. (e) Structure with IPE steel profiles with clamped joints. (f) Structure with tubular steel profiles with flanged clamp joints.
The developed algorithm will analyze the six proposed typologies for each case study that is proposed and will determine the optimal one in each case.
The proposed methodology is divided into four main blocks (see Figure 3):
  • Structural calculation;
  • Database;
  • Economic/sustainability analysis algorithm;
  • Proposal of the optimal solution for the proposed case.

2.1. Structural Calculation

The process starts with the 3D design of the structure. To do this, they enter the bars that compose it, as well as the point and/or distributed loads that it must support. The program also offers the possibility of grouping bars. In this way, the result of the structural calculation will provide the common minimum inertias for those profiles that have been grouped.
The nodes between the bars are considered fixed, as this represents the most common practice in medium-load industrial support structures, where beam-to-column and base connections are generally designed as rigid. This assumption follows Eurocode 3 [28], which allows joints to be modeled as fully restrained in global analysis unless semi-rigid behavior is explicitly required. Previous studies on demountable clamp-based joints [14,19], as well as recent experimental and finite element research [22,23], have shown that these systems reproduce fixed-end behavior under service loading, supporting the validity of this modeling assumption.
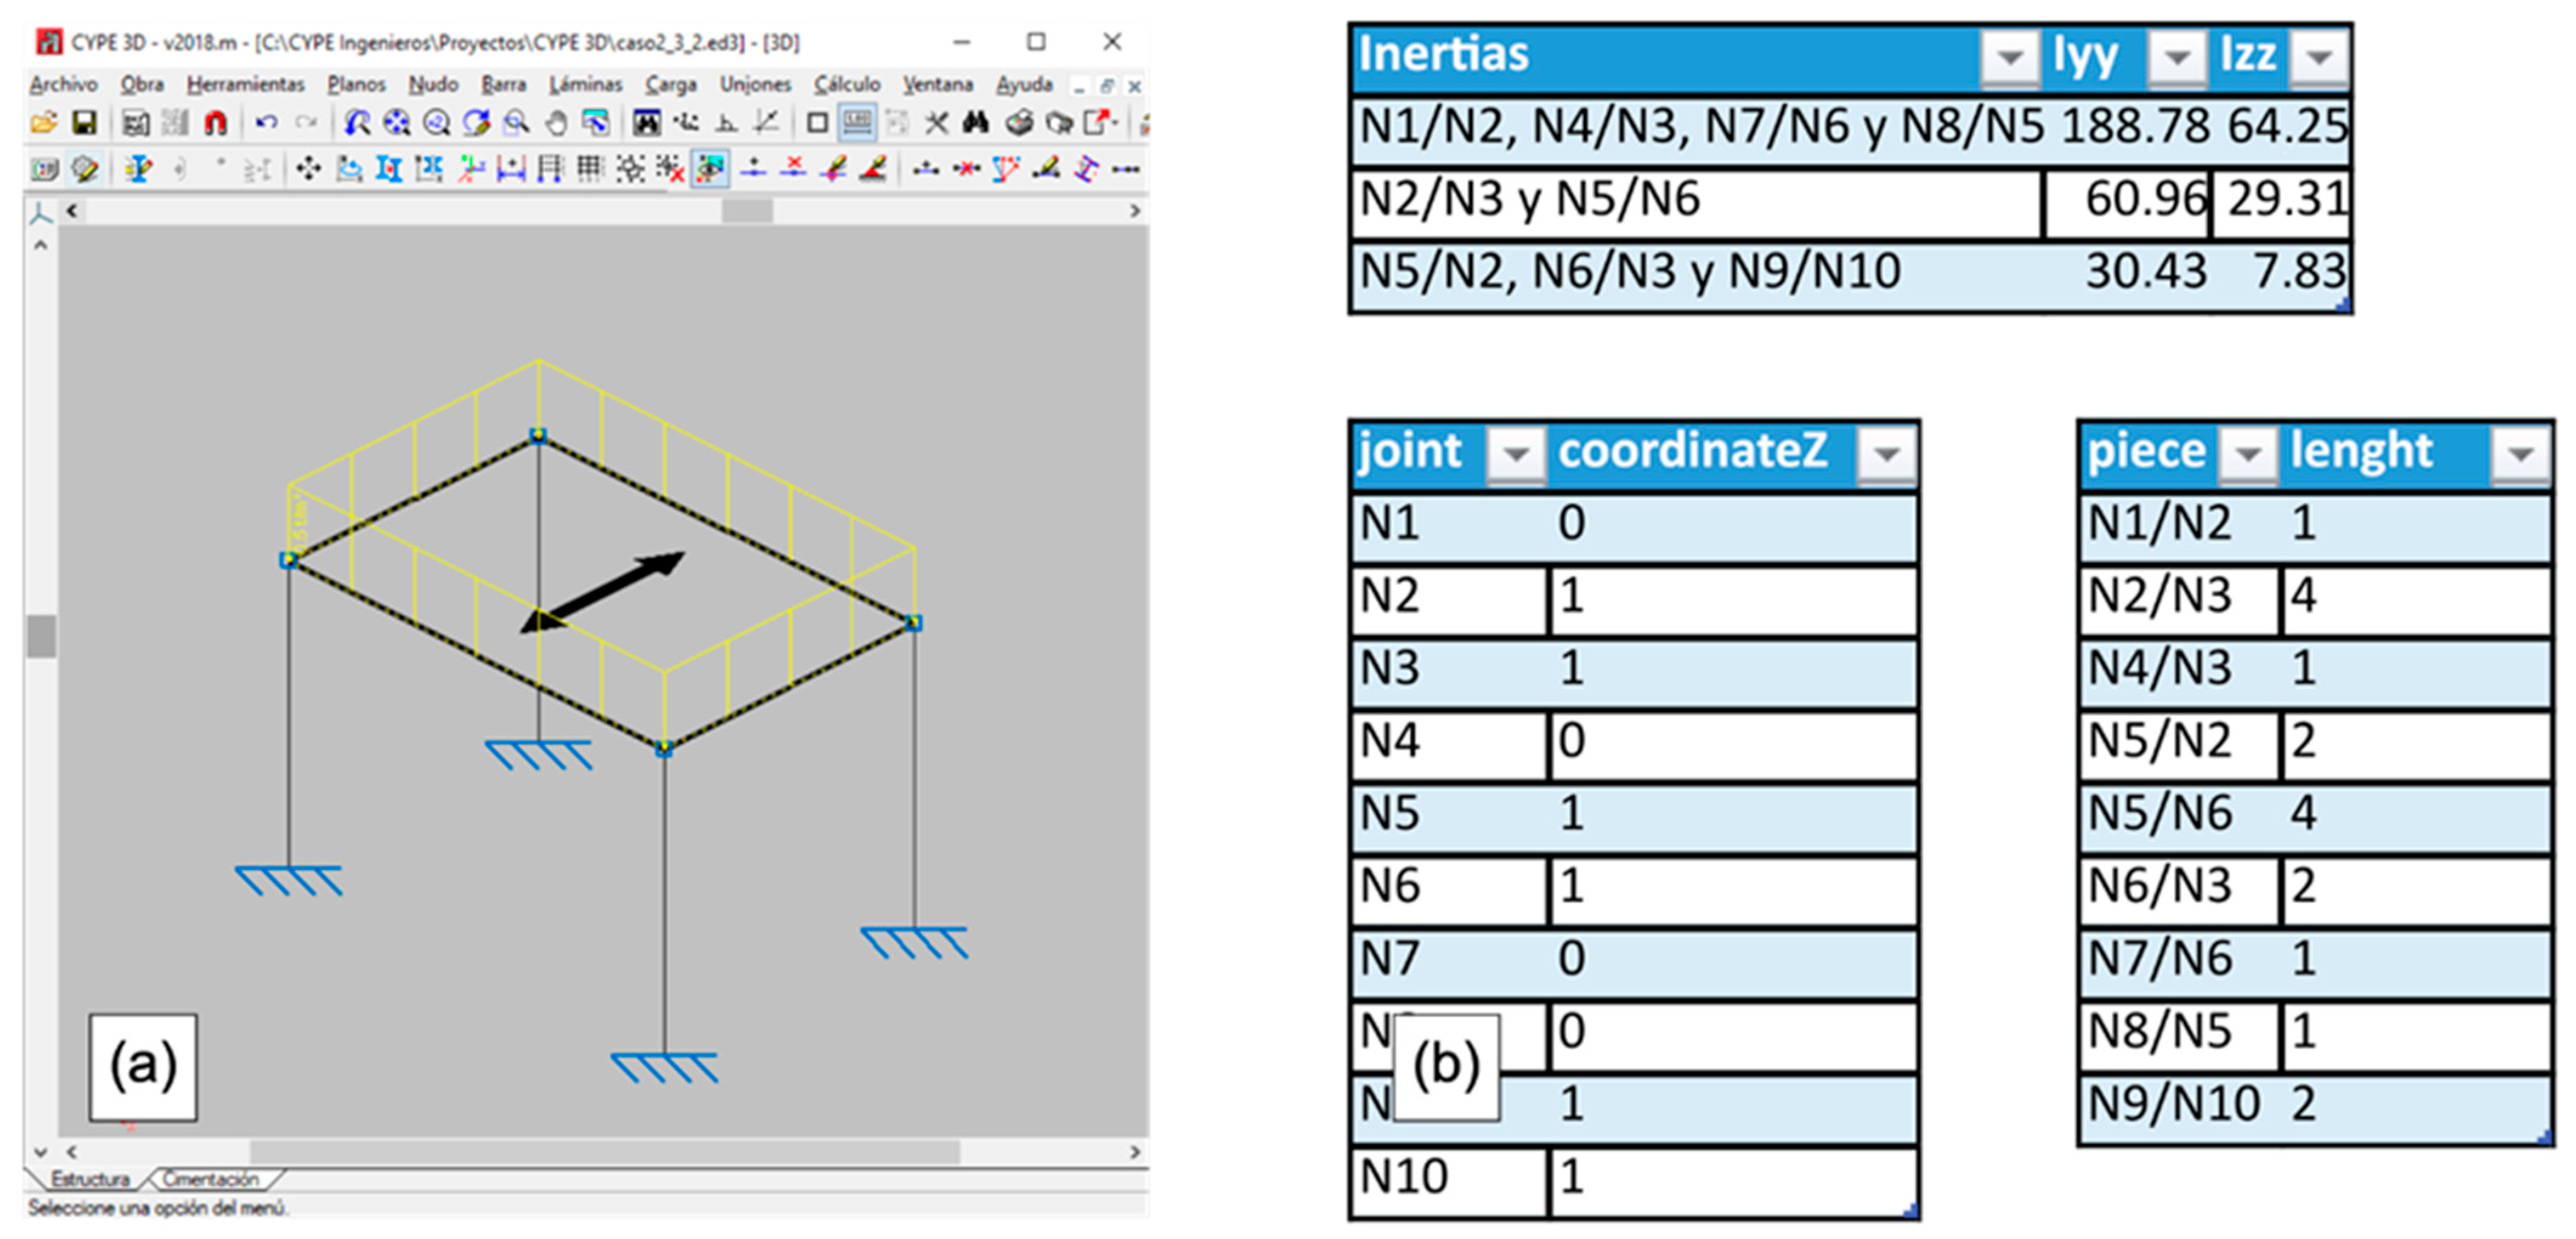
Based on this data, the structural calculation is performed using the matrix method. In this work, CYPE 3D was used (Figure 4). The calculation results are exported in XML format to an Excel spreadsheet.
The spreadsheet imports the following data:
  • Minimum section inertias around the local “Y” and “Z” axis for steel profiles;
  • Z coordinate of the structure nodes;
  • Length of the structure bars.
Additionally, a *.dxf file is created with the 3D wireframe geometry of the calculated structure.
The steel structure calculation is performed following the Eurocode 3 standard.

2.2. Database

The algorithm uses a database that contains information about the profiles and joints used in the study typologies. The database prices can be updated at any time. The user can add or hide profiles or joints according to their needs. The database is in an Excel spreadsheet and is transferred to the algorithm program in XML format.
The database is composed of four data blocks:
(a)
Component Features Database;
Profiles:
(a1)
Dimensional and mechanical properties (Mass per meter, area, perimeter, moments of inertia, etc.);
(a2)
Physical and mechanical properties of the materials (yield strength, Young’s modulus, etc.);
Joints:
(a3)
Physical and mechanical characteristics of screws, nuts, washers, clamps, staples and flanges (dimensions, strength, mass, etc.).
(b)
Database of operation times;
Profile-related times:
(b1)
Profile section cutting time ( t p c )
Calculation parameters:
  • Average handling time for cutting ( t p h ) The time it takes to load the bar into the cutting machine, measure it, and unload the cut profile after cutting. It was obtained experimentally and considers the need for a crane for masses greater than 20 kg;
  • Profile cutting time: It is directly proportional to the profile cross-sectional area ( A p ) and inversely proportional to the cutting speed ( V c ), which in turn is a function of the profile material. According to the equation;
The total time required to cut a profile is expressed by Formula (1):
t p c = ( t p h + A p V c ) 60
where t p c is the profile section cutting time (h/section); t p h is the average handling time for cutting (min); A p is the cross-sectional area (cm2); V c is the cutting speed (cm2/min).
  • (b2)
    Positioning time for profile assembly/disassembly ( t p a / t p d );
This is the time required to move the profiles to their location and position them correctly for joining, including the placement of fastening accessories (screw clamps), measurements, squaring, and leveling. To calculate this positioning time, different structures are assembled and disassembled experimentally, the process is timed, and the coefficients m and n of the following equation are established:
t p a t p d = ( m · l + n ) 60
where t p a is the profile positioning time for assembly (h/profile); t p d is the profile positioning time for disassembly (h/profile); l is the profile length (m); m , n are the assembly/disassembly coefficients (depending of the use of a crane and the use of a ladder) (min/m; min).
The same handling time is considered regardless of the type of joint to be made. Since the assemblies are carried out by two people, the times are doubled (time/person) to facilitate the calculation of the labor cost. If the weight of the profile is greater than 30 kg, the use of a crane is considered necessary. If the height at which the profile is placed is greater than 2 m, the use of a ladder is considered necessary. The length of the profile will be between 1 and 6 m.
  • (b3)
    Profile painting time ( t p p );
Anti-rust primer will be applied to the surface of each steel profile. The labor time per unit area is obtained from the CYPE ingenieros [29] database.
The following formula is used to calculate the time required for the surface finishing process of the profile:
t p p = t p · u · l
where t p p is the profile painting time (h/profile); t p is the painting time per unit area (h/m2); u is the profile perimeter (m); l is the profile length (m).
Joint-related times:
  • (b4)
    Welded joint completion time ( t j w );
Since it is necessary to determine the weld bead mass prior to calculating this time, the following considerations must be taken into account.
  • Welded joints are made using a GMAW welder (MIG/MAG welding);
  • Convex weld with equal sides;
  • 90° T-joint weld;
  • Length of the side/s of the weld bead section equal to the minimum thickness of the pieces to be joined (according to the book Modern welding technology, pag. 544 [30]). The thickness of the profile will be taken as a reference.
Equation (4) allows for the calculation of the amount of material deposited in the welded joint of the head of the profile, according to [30].
M j w = π · ( e 1000 ) 2 4 · ρ · u 1000
where M j w is the mass of weld bead (kg/head); e is the profile thickness (mm); ρ is the density of the filler metal (kg/m3); u is the profile perimeter (mm).
Equation (5), which is presented below, allows for the determination of the process time for welding one end (head) of a profile.
t j w = t p + ( e 1000 ) 2 ( w 1000 ) 2 · E d · R f · F o · 60 · u
where t j w is the welding process time per end of a profile (h/head); t p is the tacking time (h/head); e is the profile thickness (mm); w is the wire diameter of the filler metal (mm); E d is the deposition efficiency (90% [30]); R f is the feed rate (m/min); F o is the operation factor (20% [30]); u is the profile perimeter (m).
The tack time ( t p ) was determined experimentally.
A determining parameter for calculating the welding time is the amount of filler metal consumed per unit length ( M c ). Its calculation is implicit in Equation (4).
The diameter of the wire used ( w ) is determined based on the thickness of the pieces to be joined. The welding current and voltage are determined based on the wire diameter, the thickness of the pieces, the penetration to be achieved, and the welding position. The wire feed rate ( R f ) is determined using a graph based on the wire diameter and the welding current I [30] (p. 289).
  • (b5)
    Disassembly time of the welding joint ( t j w d );
One of the most widely used processes for steel scrapping is oxyacetylene cutting, easily applicable to cases of carbon steels and low alloy steels. In this procedure, the torch is fed with oxygen and a combustible gas that, for the case study, is commonly considered acetylene.
The formula used to determine the cutting time of a plate profile section is as follows:
t j w d = 1 S c · F o · u
where t j w d is the disassembly time of the welding joint (min/section); S c is the cutting speed (m/min); F o is the operation factor (30% [30]); u is the profile perimeter (m).
  • (b6)
    Drilling process time ( t d p );
Experimental data is used to calculate drilling times. Three sub-times are included in the calculation of the total drilling process time.
  • Marking time ( t m ): Time for measurement and marking of holes (grit blasting);
  • Handling time ( t m p ): Time for handling the profile to be drilled, placement and subsequent removal;
  • Drilling time ( t d ): Time to drill the hole. Times have been taken for different metrics and thicknesses ( e ) of sheet metal to be drilled. With this, the coefficients m and n were determined as a function of the drilling metric.
The formula to determining the drilling process time for a hole is as follows:
t d p = t m + t m p + k · e + g 60
where t d p is the drilling process time (min/hole); t m is the marking time (s); t m p is the piece/part handling time (s); k , g are coefficients of the linear equation for drilling time (s/mm; s); e is the thickness of the part/profile where the hole will be drilled (mm).
  • (b7)
    Screwing/unscrewing process time ( t s / t u s ) .
Experimental data is used to determine the screw fastening time for a profile end joint. The main influencing factor is the size of the joint, or in other words, the size of the screw. Therefore, an assembly and disassembly time is associated with each screw metric.
(c)
Cost database;
The cost database includes the following costs:
  • (c1)
    Cost per kilogram of profile ( C p );
    (c2)
    Labor cost ( C l );
    (c3)
    Cost of the painting material ( C p m );
The painting material cost includes both the primer and the auxiliary materials necessary for its application. These values are obtained from those offered by CYPE Ingenieros. It is calculated with the following expression:
C p m = C m s f · s · l
where C p m is the cost of the painting material (€/profile); C m s f is the cost of the material for surface finishing (€/m2); s is the area of the external surface of the profile per unit length of profile (m2/m); l is the length of the profile (m).
  • (c4)
    Welded joint process cost ( C j w );
On the one hand, the costs of the welding process are considered, which include labor, gas consumption, and energy consumption of the welding machine. On the other hand, the cost of the welding filler material is considered.
C j w = π · ( e m i n 1000 ) 2 4 · ρ E d · C m a + e m i n 1000 2 w 1000 2 · E d · R f C l 60 · F o + w · C g 100 + V · I 60000 + C e e E w · u + t p · C l
where C j w is the welded joint process cost (€/head); e m i n is the minimum thickness of the pieces to be welded (mm); ρ is the filler metal density (steel: 7850 kg/m3); E d is the deposition efficiency (90% [30]); C m a is the filler material cost (€/kg); w is the wire diameter of the filler metal (mm); R f is the feed rate (m/min); C l is the labor cost (€/h); F o is the operation factor (30% [30]); C g is the cost of shielding gas per unit volume at 1 atm (€/m3); V is the welding voltage (V); I is the welding intensity (A); C e e is the cost of electrical energy (€/kWh); E w is the efficiency of the GMAX welder (80%); u is the profile perimeter (m); t p is the tacking time (h/profile)
  • (c5)
    Welded joint disassembly process cost ( C j w d ) ;
The cost of labor and gas consumption will be considered for oxyacetylene cutting. The cost associated with the use of machinery or auxiliary materials will not be considered.
The Equation to determine the set of all costs for dismantling a welded joint is as follows:
C j w d = 1 V w · C l 60 · F o + F o x g · C o x g 1000 + F a c g · C a c g 1000 · u
where C j w d is the welded joint disassembly process cost (€/head); V w is the welding speed (m/min); C l is the labor cost (€/h); F o is the operation factor (30% [22]); F o x g is the oxygen gas flow (l/min); C o x g is the oxygen gas cost per unit volume at 1 atm (€/m3); F a c g is the acetylene gas flow (l/min); C a c g is the acetylene gas cost per unit volume at 1 atm (€/m3); u is the profile perimeter (m).
  • (c6)
    Traditional bolted joint costs;
The bolting process costs include:
  • Welded joint process cost ( C j w ).
  • Drilling cost for IPE beams. Only labor cost is considered.
  • Bolting/unbolting process labor cost. Only labor cost is considered.
  • The cost of the bolted joint material is also considered ( C j b ).
  • Head plate cost; 3D modeling of the different head plates has been carried out, considering their specific dimensions. Subsequently, an exhaustive cost assessment has been carried out, obtaining an average price per kilogram.
  • Cost of screws, nuts, and washers.
  • (c7)
    Cost of innovative stapled/flanged joints.
This cost includes labor, calculated from assembly/disassembly time, and the cost of staples, clamps, screws, nuts and washers.
(d)
Life database.
This cost includes the labor cost, calculated based on the assembly/disassembly time, and the cost of staples, clamps, screws, nuts, and washers.
  • (d1)
    Service life of the structure ( L s );
    (d2)
    Service life of the components ( L c ).
To evaluate reconfigurable structures, within the reuse philosophy of the circular economy, it is necessary to previously define two time parameters: the operational life of the structure ( L s ), that is, the time during which a structure is useful before it needs to be reconfigured, and the service life of the components ( L c ), that is, the life of each of the elements before the cannot be reused due to deterioration or damage. These two times will be fundamental for the algorithm in the calculation and analysis of the ratios.

2.3. Algorithm for Analyzing the Proposed Typologies

The algorithm developed for economic, and sustainability analysis is fed by the data obtained from the database in point 2.2 (updatable and modifiable at any time). The necessary calculation equations are applied to analyze the costs and times of each type of structure to be evaluated.
The steps to follow would be:

2.3.1. Profile Selection

The algorithm starts by selecting, for each type of profile, the most suitable profile for each bar according to the minimum inertias Iy and Iz obtained in the structural calculation.

2.3.2. Pre-Dimensioning of Bolted Joints

A preliminary design of the joint is first carried out to obtain both an economic value and a preliminary processing time. For this purpose, the size of the bolts must be selected according to the maximum moment that the profile must withstand. In all cases, 4-bolt joints (two upper and two lower) of grade 8.8 are assumed. According to Eurocode 3 [28] and the calculation manual of Argüelles et al. (2005) [31], a simplified calculation is then performed using Equation (11) to obtain a preliminary assessment of the joint. The equation determines the diameter of the core of the bolts necessary for the bolted joint.
s = 4 π · σ p · I p σ s · h p · L
where s is the screw diameter (mm); σ p is the elastic limit of the profile (MPa); I p is the highest moment of inertia of the profile section (mm4); σ s is the elastic limit of the screws (MPa); h p is the height of the profile (mm); L is the distance between top and bottom screws (mm).
In the case of the preliminary design of the end plates, it will be considered, on the one hand, that the plate thickness is twice the maximum profile thickness and, on the other hand, that the plate will protrude from the profile Section 100 mm on each side.
The size of the holes in the end plates will be defined by the diameter of the bolt required for the joint. In addition, it will be considered that the length of the bolt must be greater than three times the thickness of the end plate.

2.3.3. Cost and Time Calculation by Type of Structure

The life cycle cost (LCC) methodology will be applied to calculate the total economic costs of a structure from its construction to its disposal (“cradle to grave”) [13,32,33]. This encompasses design, material procurement, construction, maintenance, inspection, repair, disassembly, and final scrapping. In addition, life cycle assessment (LCA) procedures will be applied [34] to investigate and evaluate the environmental impacts of the different stages of the structure, from raw material extraction and manufacturing of the required elements to their transportation and storage, construction, maintenance, repair, disassembly, and final scrapping at the end of the life cycle.
According to 2020 data from the World Steel Association [3], steel production generates a carbon footprint of 1.29 kg CO2 eq/kg and an energy consumption of 16.6 MJ/kg. The environmental impact of welded or bolted joints, in terms of cutting, profile painting, material transport, and workers traveling to the workplace, is comparable to that of innovative solutions. These types of industrial structures do not require significant maintenance.
With this data, you can calculate the total times of a life cycle.
  • Life cycle time of a welded structure ( t s w );
t s w = 1 b t p c + t p a + t p p + t p d + 1 j ( t j w + t j w d )
where t s w is the life cycle time of welded structure (h); t p c is the profile section cutting time (h); t p a is the positioning time for profile assembly (h); t p p is the profile painting time (h); t p d is the positioning time for profile disassembly (h); b is the number of profiles; t j w is the welded joint completion time (h); t j w d is the disassembly time of the welding joint (h); j is the number of joints
b.
Life cycle cost of a welded structure ( C s w ) ;
t s w = 1 b t p c + t p a + t p p + t p d + 1 j ( t j w + t j w d )
where C s w is the life cycle cost of a welded structure (€); W p is the profile weight (kg); C p is the cost per kilogram of profile (€/kg); C p m is the cost of profile painting material (€/kg); b is the number of profiles; C j w is the welded joint process cost (€/joint); C j w d is the welded joint disassembly process cost (€); j is the number of joints; t s w is the life cycle time of welded structure (h); C l is the labor cost (€/h)
c.
Life cycle time of a structure with classic screwed joints ( t s s ) ;
For IPE columns, the connection is made by welding a head plate to the beam. Then, holes are drilled in both column and the head plate to pass the bolts that will join both elements.
In the case of square or rectangular hollow section columns, an additional plate is welded to the beam’s head plate. This additional plate is used to create threaded holes for bolts. As a result, the associated times and costs are twice those considered for beams with IPE profiles.
The execution time of the joint will be considered as the sum of three times: Plate-to-beam welding time, drilling time, and bolting/unbolting time.
The total time invested in the construction of a structure with classic bolted joints for a life cycle will be calculated using the following Equation;
t s w = 1 b t p c + t p a + t p p + t p d + 1 j ( t j w + t j w d )
where t s s is the life cycle time of a structure with classic screwed joints (h); t p c is the profile section cutting time (h); t p a is the positioning time for profile assembly (h); t p p is the profile painting time (h); t d p is the positioning time for profile disassembly (h); b is the number of profiles; t j w is the welding process time per end of a profile (h/head); n s is the number of screws per joint (4 units per joint in the cases considered); t d is the drilling time per screw (only for IPE profiles) (h); t s is the screwing time per screw (h); t u s is the unscrewing time per screw (h); j is the number of joints
d.
Life cycle cost of a classic bolted structure ( C s s ) ;
C s s = 1 b W p · C p + C p m + 1 j ( C j w + C j b ) + t s s · C l
where C s s is the life cycle cost of a classic bolted structure (€); W p is the profile weight (kg); C p is the profile cost per kilogram (€/kg); C p m is the cost of painting material (€/kg); b is the number of profiles; C j w is the welded joint process cost (double for tube) (€/joint); C j b is the cost of the bolted joint material (€); t s s is the construction time of a structure with classic screwed joints (h); C l is the labor cost (€/h); j is the number of joints
e.
Life cycle time of an innovative reconfigurable structure (made with staples and flanges) ( t s s / t i f s ) ;
For the sake of simplicity, it will be considered that these joints always require eight screws (for upper and four lower) to resist the maximum moment resulting from the supported loads. The lever effect generated in a type of staple with a front lever equal to the rear lever reduces the screw resistance by half [20], although this depends on the dimension of the staple and its position in the joint. This factor can be modified in the algorithm according to the dimensions of the levers of the staples used.
The same rule applies to flanged joints.
t i s s / t i f s = 1 b t p c + t p a + t p p + t p d + 1 j ( n s · ( t s + t u s ) )
where t i s s / t i f s is the life cycle time of an innovative stapled/flanged structure (h); t p c is the profile section cutting time (h); t p a is the positioning time for profile assembly (h); t p p is the profile painting time (h); t p d is the positioning time for profile disassembly (h); b is the number of profiles; n s is the number of screws per joint (16 per stapled joint/18 per flanged joint); t s is the screwing time per screw (h); t u s is the unscrewing time per screw (h); j is the number of joints
f.
Life cycle cost of an innovative stapled/flanged structure ( C i s s / C i f s ) .
C i s s / C i f s = 1 b W p · C p + C p m + 1 j C j s / C j f + t i s s / t i f s · C l
where C i s s / C i f s is the life cycle cost of an innovative stapled/flanged structure (€); W p is the profile weight (kg); C p is the profile cost per kilogram (€/kg); C p m is the cost of painting material (€/kg); b is the number of profiles; C j s / C f s is the material cost of a stapled/flanged joint (€/joint); j is the number of joints; t i s s / t i f s is the construction time of innovative stapled/flanged structure in a life cycle (h); C l is the labor cost (€/h)

2.3.4. Data Provided by the Algorithm

The algorithm will provide the following absolute values for each construction solution/typology:
  • Manufacturing-assembly time/cost (€)
  • Total material cost (€)
  • Total structure cost (€)
  • Dismantling time/cost (€)
  • Structure weight (kg)
  • Weight of reusable materials (kg)
  • Value of reusable materials (€)
Using this data and the data on the service life of the structure ( L s ) and the service life of the components ( L c ), the algorithm will provide the following ratios and values for each construction solution/typology:
  • Cost ratio (n)
  • Sustainability ratio (n)
  • Absolute and relative economic savings (n)
  • Absolute and relative material savings (n)
  • Absolute and relative CO2 eq savings (n)
  • Absolute and relative energy savings (n)
  • Cumulative cost (n)
  • Cumulative material (n)
  • Cumulative CO2 eq carbon footprint (n)
* (n): as a function of the number of life cycles (n =   L s / L c )
From the ratios that have been proposed in this study, the following can be considered the most important.
Cost ratio ( R c s ): Relationship between the cost of the demountable structure and the cost of the same welded solution, as a function of the expected number of reconfigurations of the structure.
R c s = C s w L s L c C r m + ( C l + C n r m ) L s L c
where R c s is the cost ratio; C s w is the cost of welded structure (€); L s is the service life of the structure (year); L c is the service life of the components (year); C r m is the cost of reusable material (€); C l is the aggregated labor cost (€); C n r m is the cost of non-reusable material (€)
Sustainability ratio ( R s s ) (in carbon footprint or energy expended).
R s s = W s w L s L c W r m + W n r m L s L c
where R s s is the sustainability ratio; W s w is the weight of welded structure (kg); L s is the service life of the structure (year); L c is the service life of the components (year); W r m is the weight of reusable material (kg); W n r m is the weight of non-reusable material (kg). As the carbon and energy footprints of steel are directly proportional to its mass, R s s is a dimensionless indicator that directly expresses the relative environmental impact of demountable compared with welded solutions.

2.3.5. Comparison of Different Structural Typologies

The calculated values and ratios serve as a comparison tool for the different structural typologies analyzed. This allows the algorithm to perform a numerical comparison and establish an order of prevalence.

2.4. Proposal for an Optimal Solution

Based on the service life of the structure ( L s ) and the service life of the components ( L c ), the algorithm will indicate the optimal construction solution from a structural, economic, and environmental standpoint. Additionally, a *.dxf file is generated that allows for the consultation of the geometry, type, and size of each profile in a 3D design software.

3. Case Studies

According to the type of profile and connection, the following typologies will be studied:
(a)
Steel IPE profile (80 to 200) [35,36]. Welded connections.
(b)
Steel square (30 × 30 to 100 × 100) [37] or rectangular (30 × 60 to 100 × 200) tube profiles. Welded connections.
(c)
Steel IPE profiles. Classic bolted connections.
(d)
Steel square/rectangular tube profiles. Classic bolted connections.
(e)
Steel IPE profiles. Connections with stapled clamps.
(f)
Steel square/rectangular tube profiles. Connections with flanged clamps.
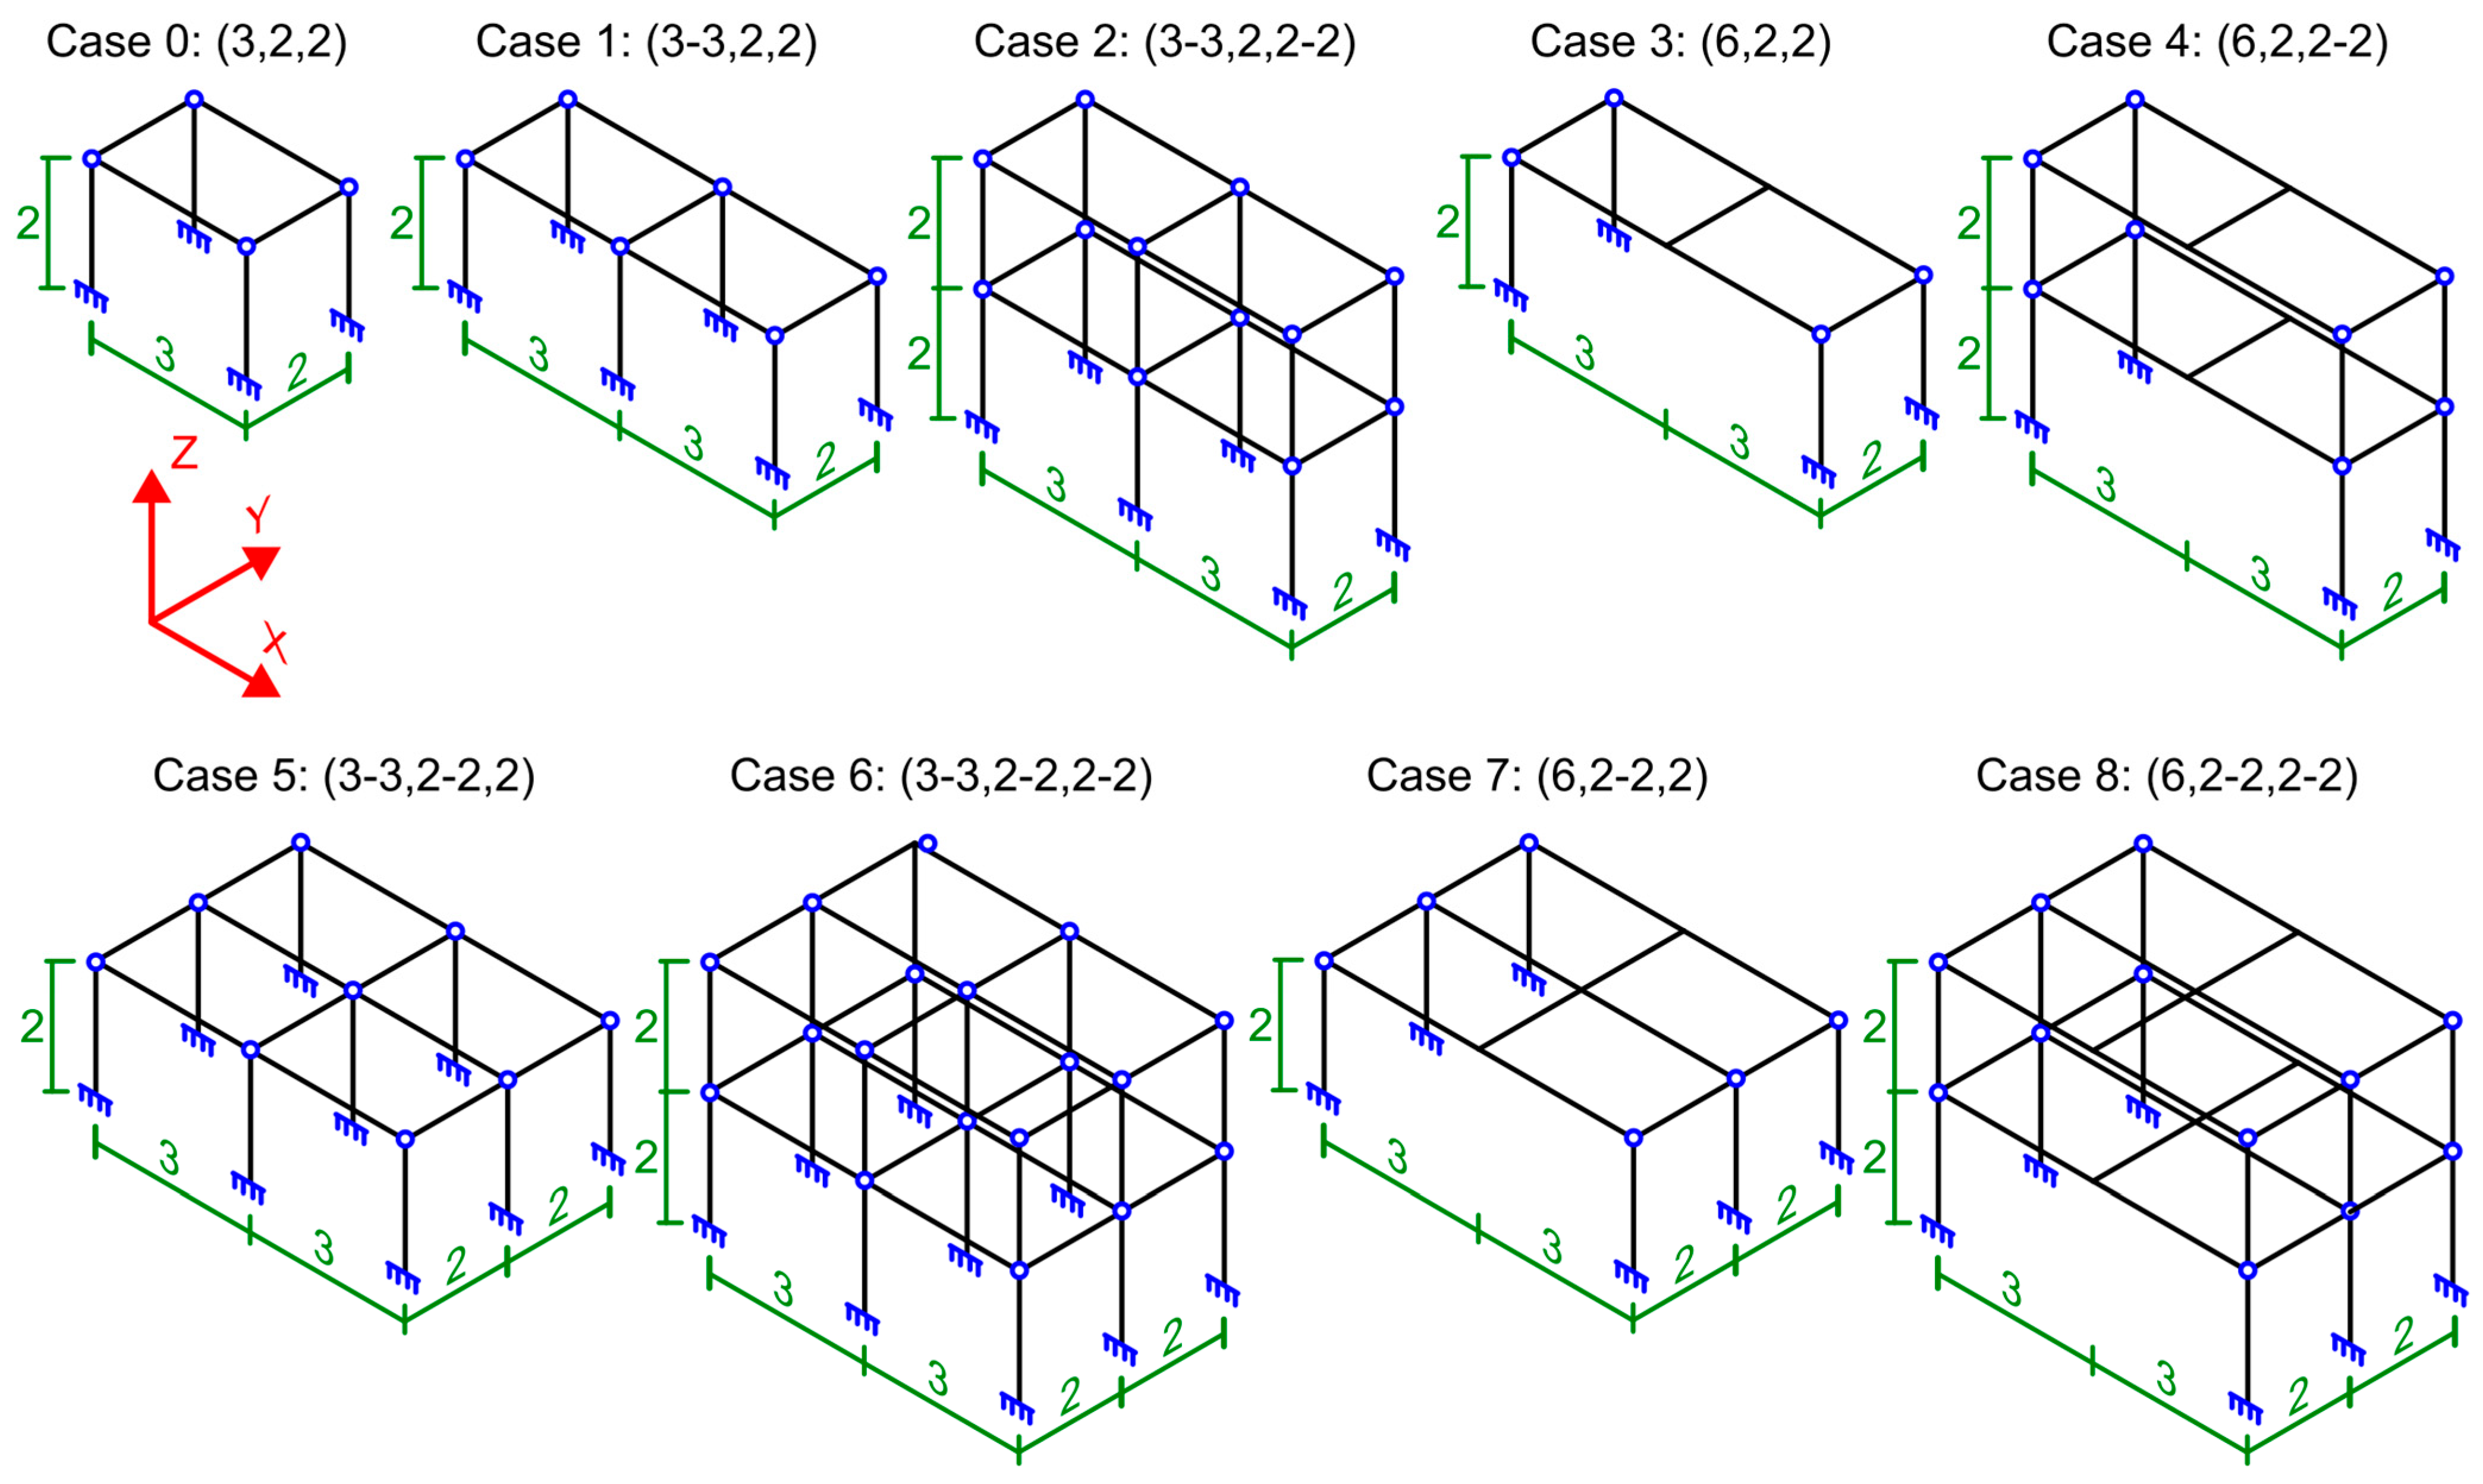
Nine different structures will be studied (Figure 5). The structures vary in the length of the profile, the number of floors, and the number of lateral and frontal bays. Each case will be named with three numerical combinations separated by commas. The first number will indicate the length of the span in the X axis in meters. For example, “3” if it is a single span and “3-3” if there are two spans. A similar criterion is used for the Y and Z axes.
The nine geometries will be subsequently tested with two different types of loads, and their influence on profitability and sustainability ratios will be assessed.
In a third step, the structures will be analyzed under three possibilities: (a) Profiles optimized according to the structural calculation for each applied load. (b) Same IPE profile in all bars. (c) Same tubular profile in all bars.

4. Results and Discussion

4.1. Cost Ratios According to the Configuration of the Structure Made

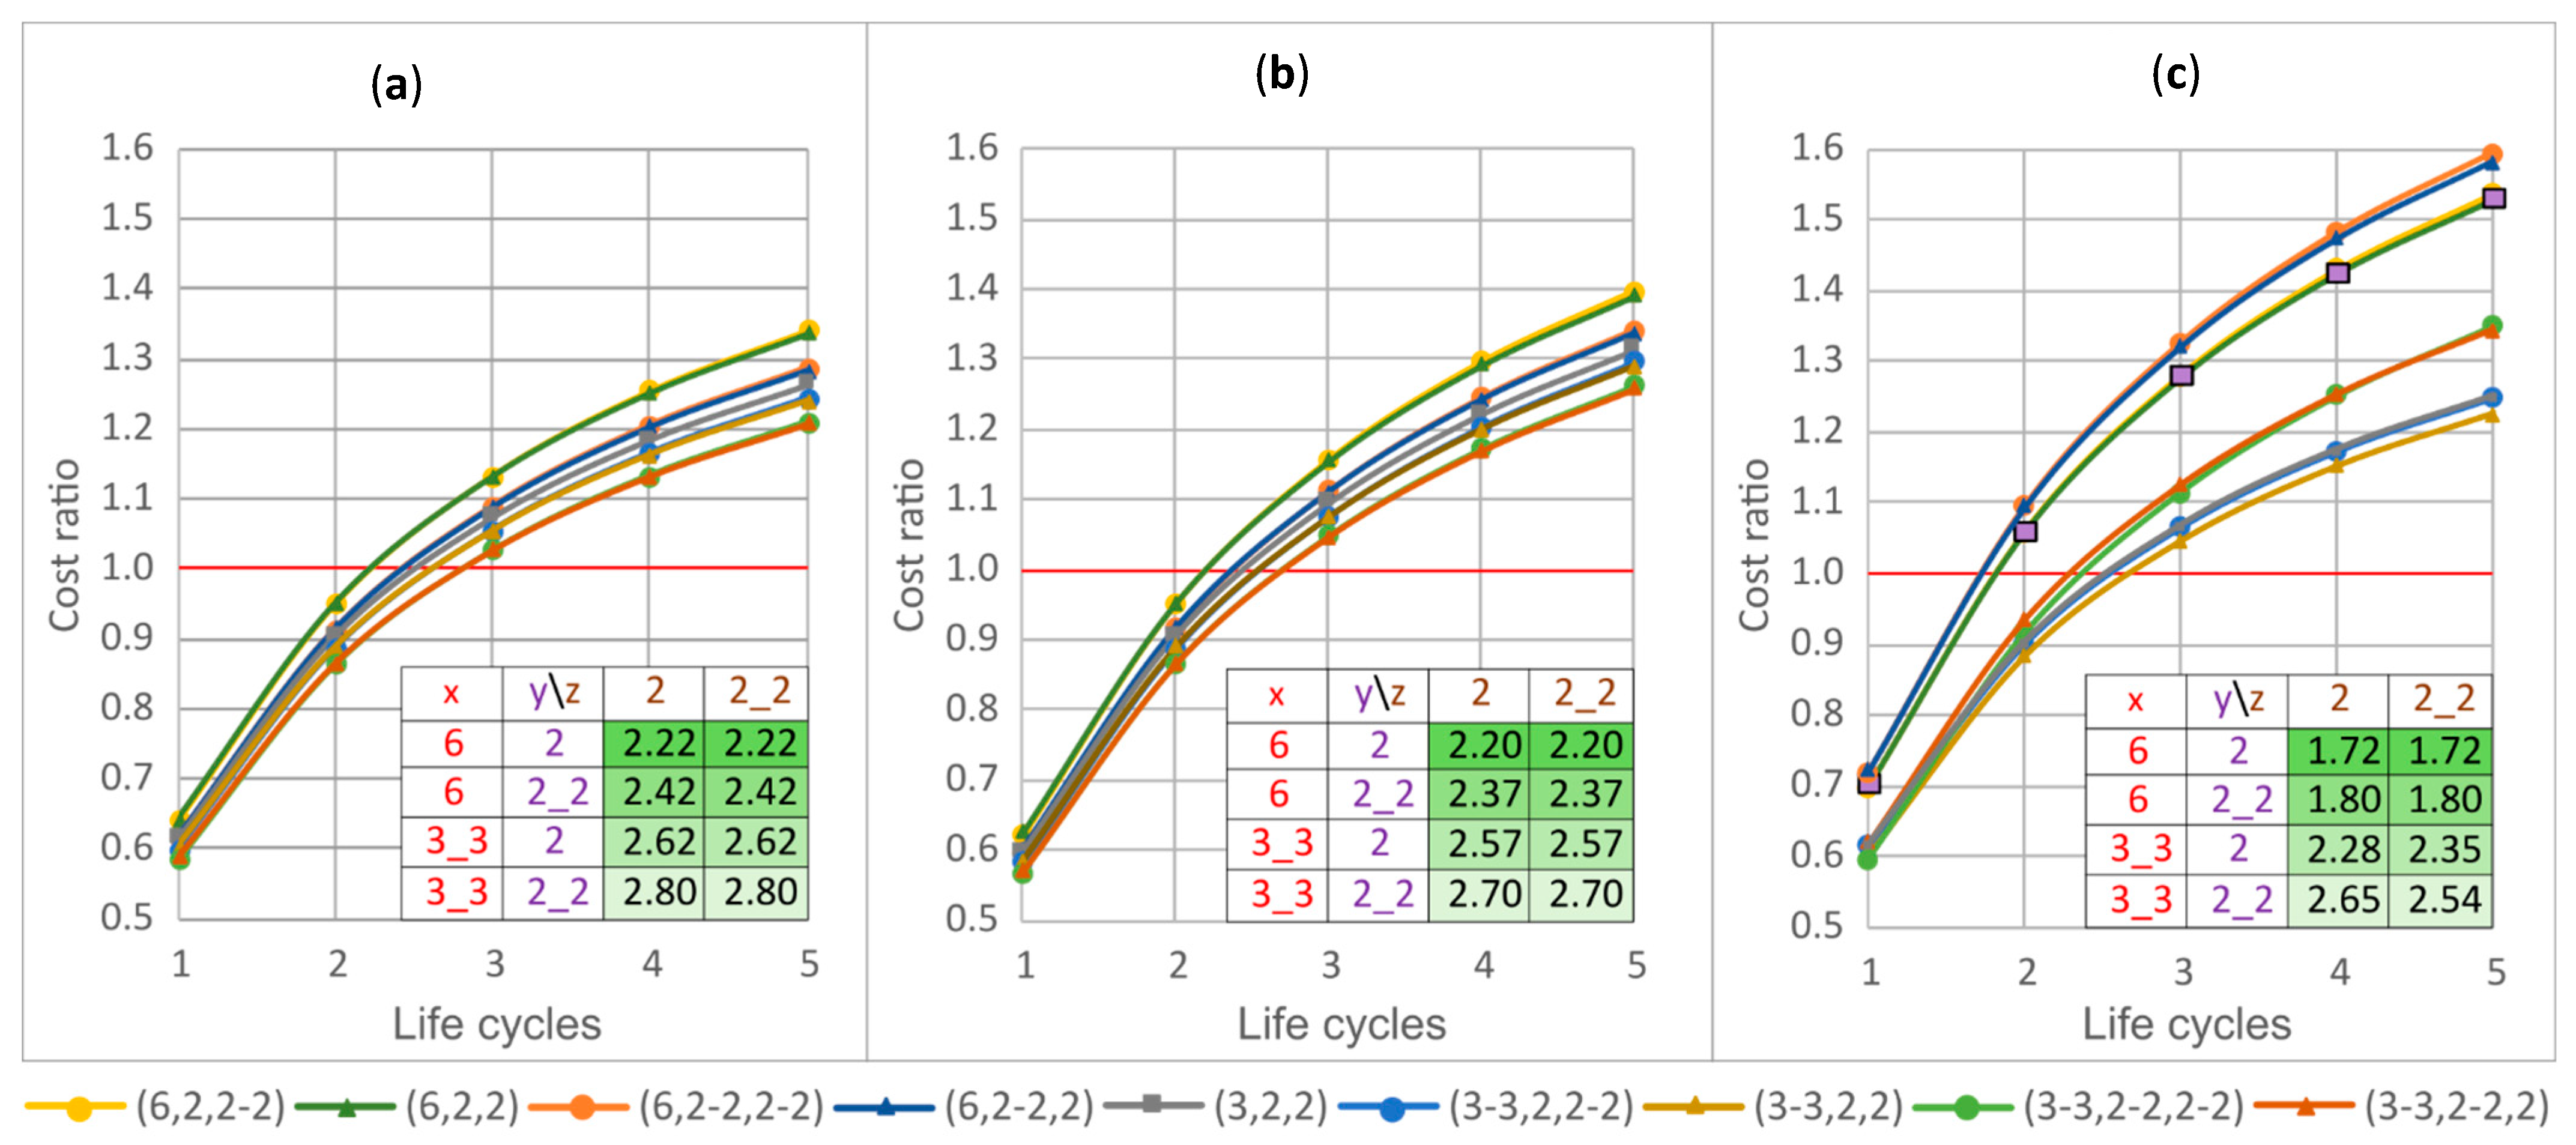
Using IPE profiles and clamped joints, the cases where all the profiles of the structure are IPE100 or IPE160 and have a single span in the X axis (6,2,2-2 and 6,2,2) present the best cost ratio (Figure 6a,b). It has been verified that increasing the span in the X axis produces a decrease in this ratio (the same happens if the length of each span is reduced to 3 m).
All case studies start to be economically profitable from the third life cycle because demountable joints require a higher initial investment than welded or bolted connections. The savings generated during the first two cycles are not sufficient to compensate for this difference. However, from the third cycle onwards, the cumulative reuse of intact members without additional cutting, drilling, or welding produces a net economic advantage. Under high load conditions (9.8 kN/m2), profitability is achieved already in the second cycle. Structurally, this occurs because heavier profiles are required to carry higher loads, which greatly increases the initial cost of welded solutions, while demountable alternatives preserve and reuse this additional mass without further processing, accelerating cost recovery.
These results reinforce previous findings in the literature that emphasize the cumulative benefits of structural reuse [6,7], highlighting that the economic and environmental advantages of reuse increase significantly over multiple life cycles, which is consistent with our observation that demountable clamped and flanged joints become competitive from the second or third cycle. Similarly, Pongiglione et al. (2014) [15] demonstrated in a real case study that reusing steel components can substantially reduce material demand, supporting the idea that multi-cycle scenarios are decisive for the feasibility of reconfigurable systems.
These results also align with the broader conclusions of Sotorrío Ortega et al. (2023) [38], who emphasized that many industrialized construction practices still lack comprehensive integration of life cycle approaches, reinforcing the need for combined LCC and LCA methodologies such as the one adopted in this work. Furthermore, these findings are supported by recent case-based research, such as Cervantes Puma et al. (2024) [39], who demonstrated the circular economy benefits of reused steel and slag in real construction contexts.

4.2. Absolute and Relative Economic Savings Depending on the Configuration of the Structure

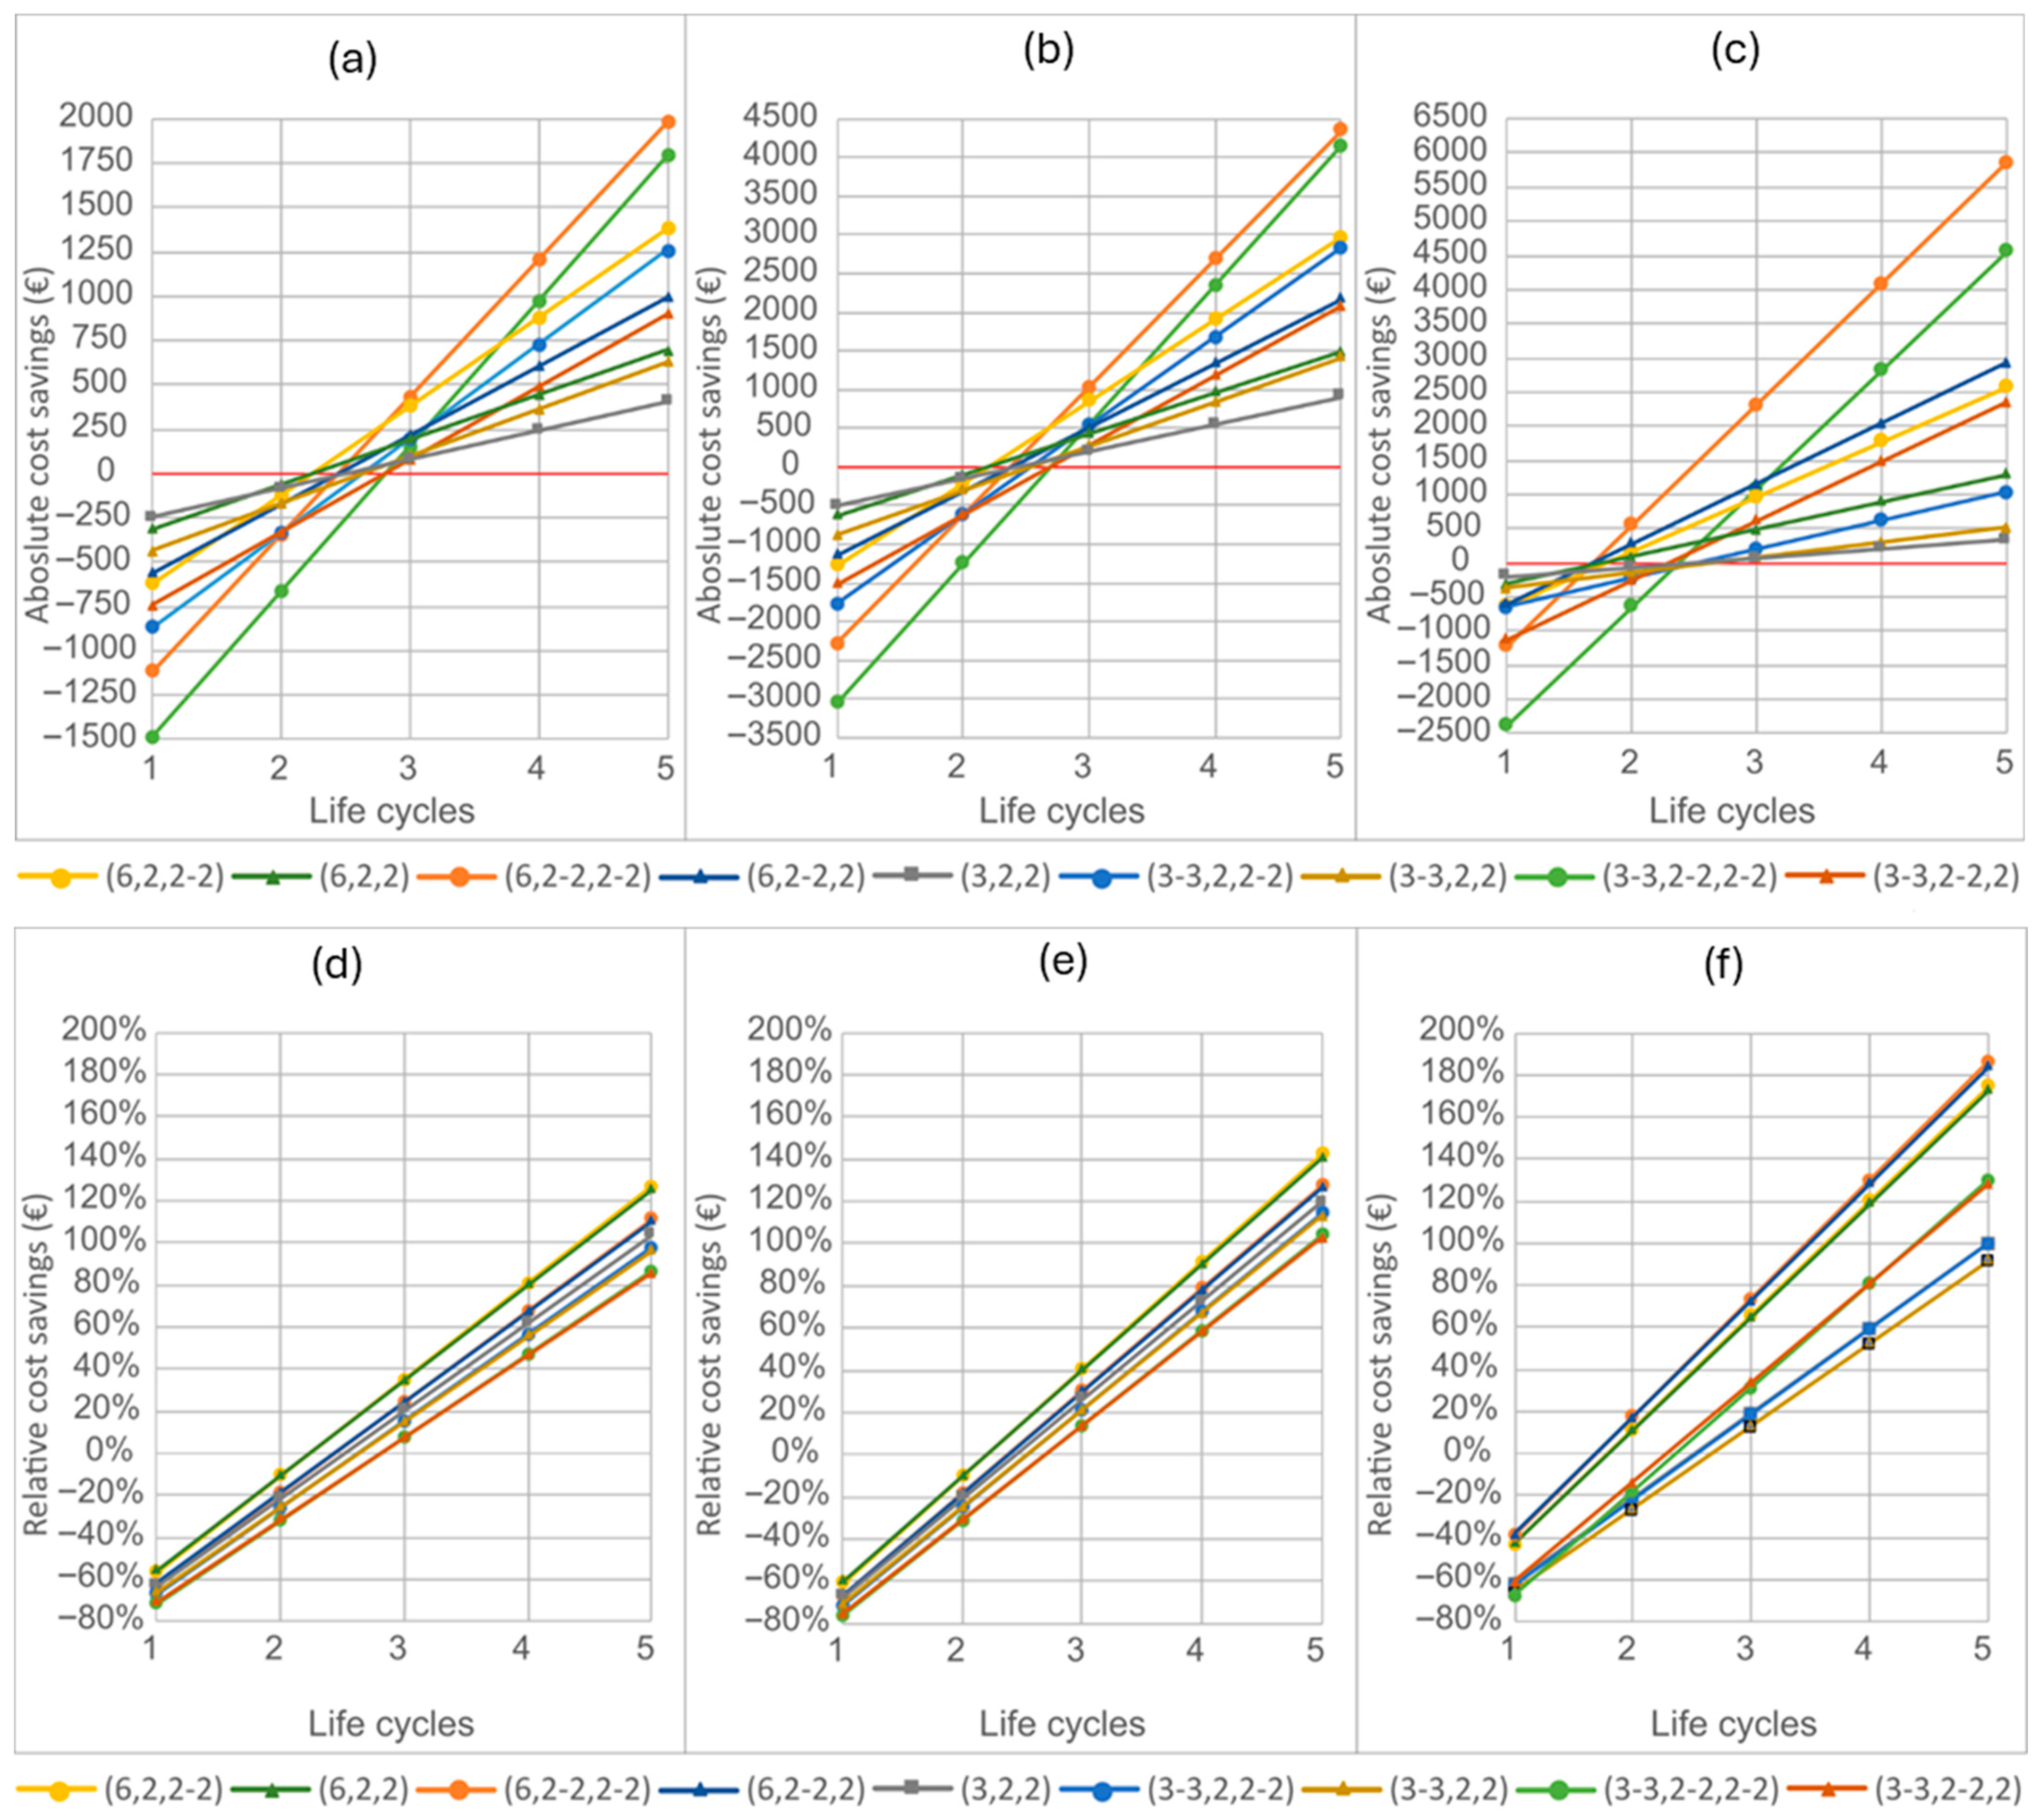
The graphs in Figure 7a–c show the absolute economic savings. Cases with longer profiles or heavier structures have a steeper slope, which means they require higher initial investment, but also that their gains are greater from the third life cycle onwards.
Figure 7d–f show the relative economic savings. It can be observed that, for the best of the nine proposed structural typologies, the relative savings reach 35–40% in the third life cycle if the same profile is used throughout the structure and increases up to 75% for the optimized structure with a load of 4.9 kN/m2.

4.3. Sustainability Ratio According to the Structure Configuration

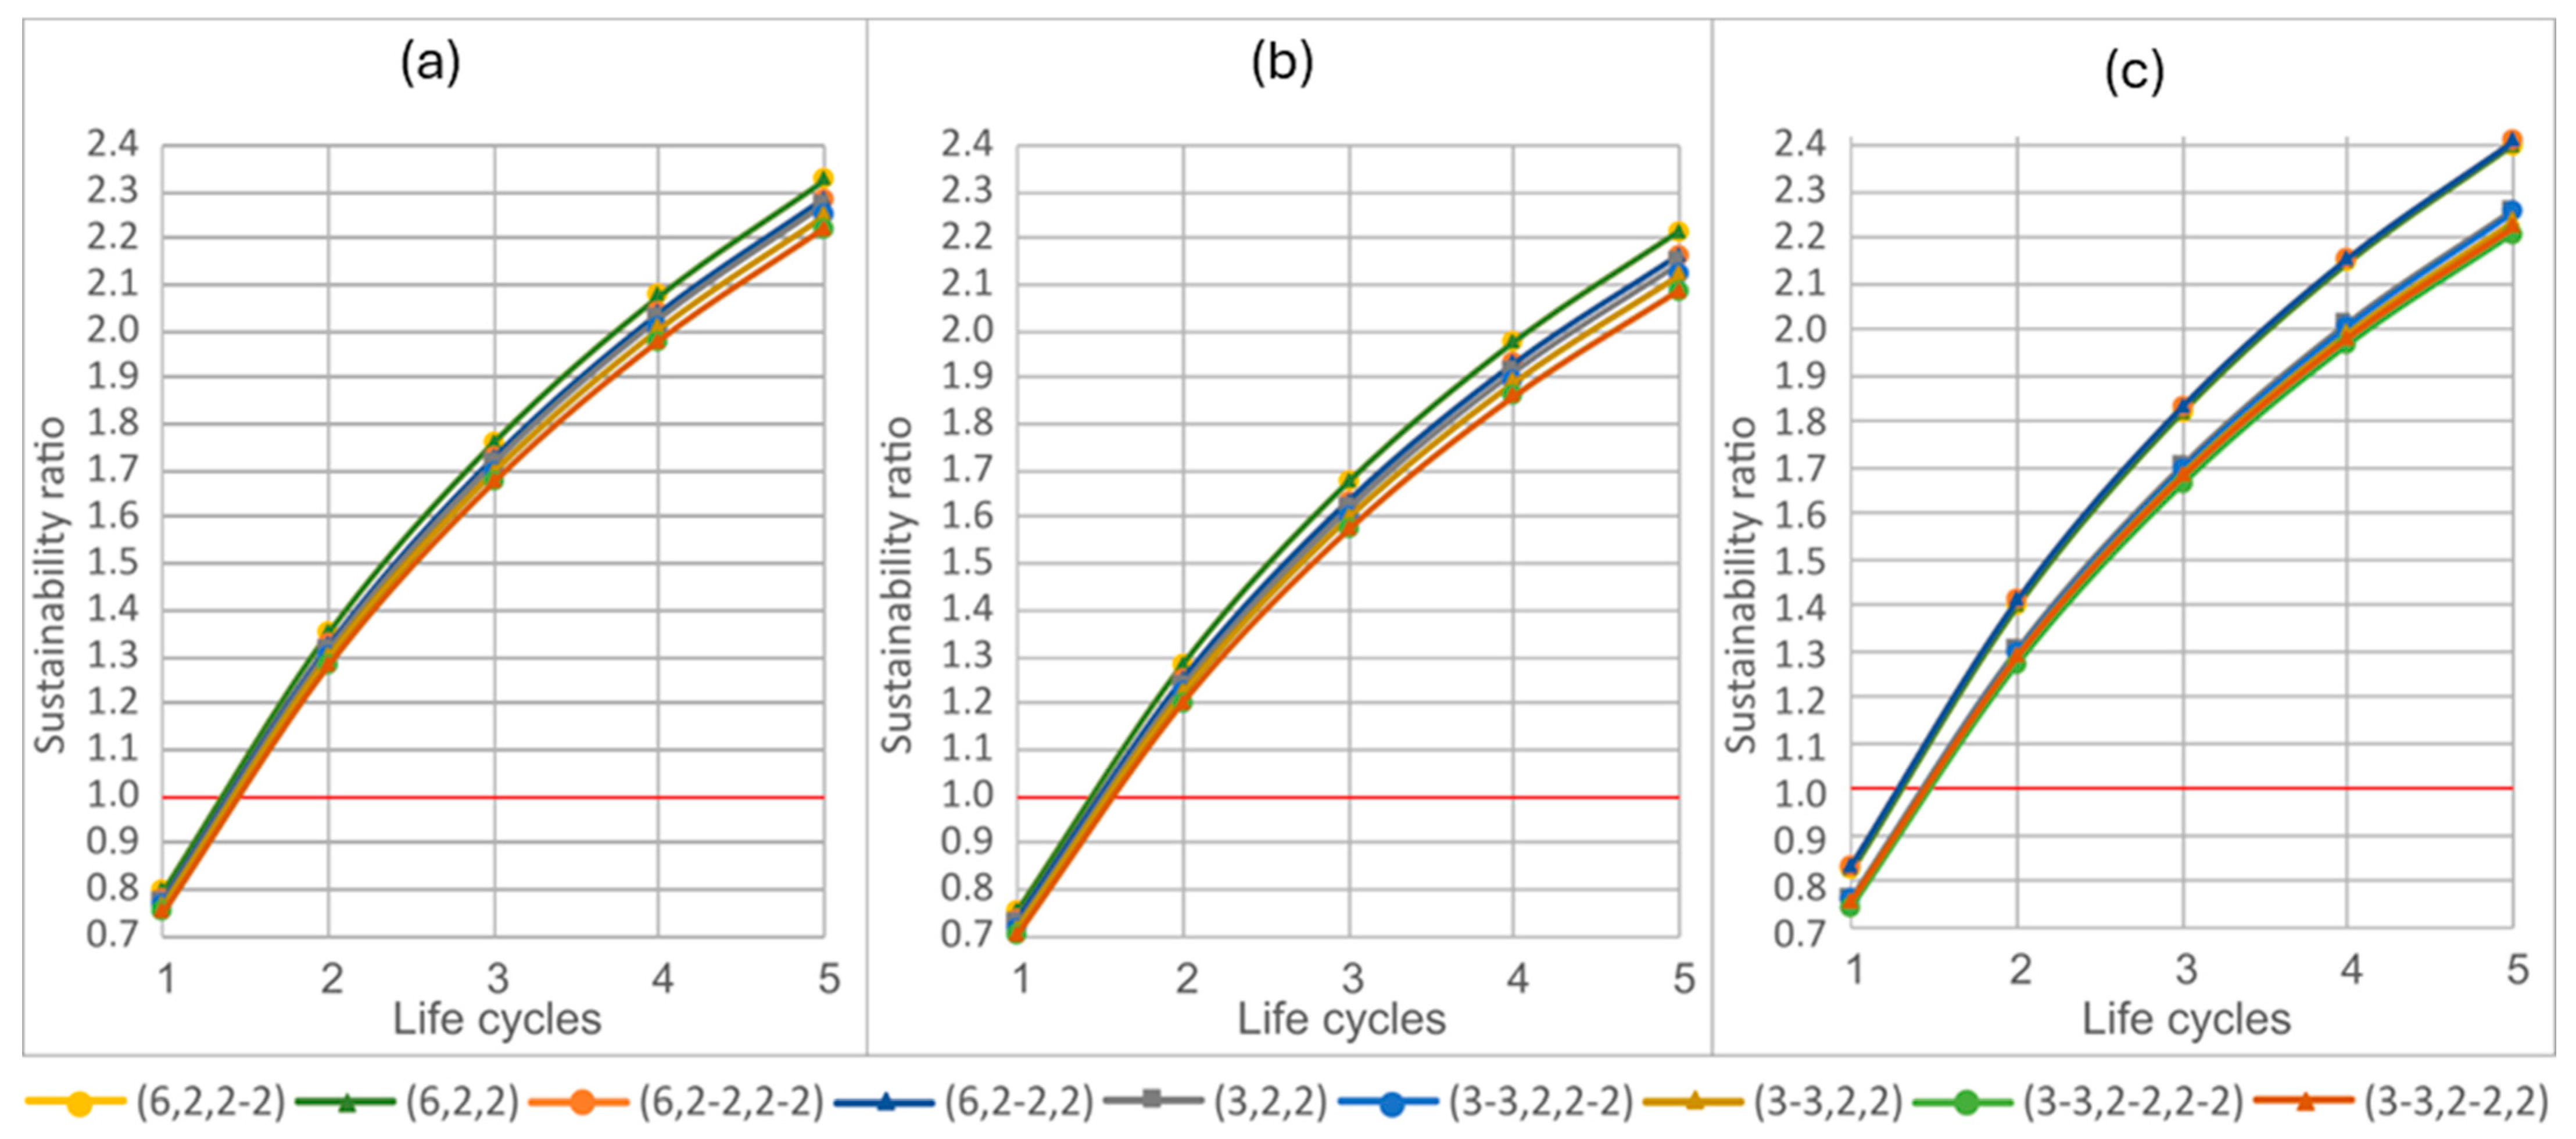
The curves in Figure 8 present the sustainability ratio, which represents the relationship between the carbon footprint of a structure built with welded joints and the carbon footprint of a structure built with flanged or clamped joints. It can be observed that Figure 8a,b are very similar for all nice cases. However, Figure 8c shows four configurations with a span distance on the X-axis of six meters, which have a better sustainability ratio than the rest.
The fact that the sustainability ratio starts at 0.75 means that the CO2 produced by the construction of the structure with welded joints is 75% of the CO2 that would be produced with the stapled structure. The value of the ratio increases constantly, passing through 1.5 for two life cycles and 2 for three.
The reduction of nearly 50% in carbon footprint observed after three cycles aligns with the results of [8,9], who both demonstrated that design-for-deconstruction strategies can significantly decrease embodied energy and greenhouse gas emissions. While those studies focused primarily on building structures, our findings extend these conclusions to medium-load industrial applications. This distinction is relevant because it shows that the environmental advantages of demountable connections are not limited to buildings but also apply to industrial plants subject to frequent layout changes, where the potential for reuse is even greater.
These trends are further supported by recent numerical studies. Recent parametric finite element analyses [40] have demonstrated that demountable shear connections not only maintain structural efficiency but also provide measurable sustainability gains over multiple cycles. Moreover, investigations on the seismic behavior of demountable joints [41] confirmed that such connections remain robust under repeated loading scenarios. Together, these findings reinforce the long-term viability of demountable systems and complement the environmental advantages demonstrated in the present study.

4.4. Absolute CO2 and Energy Savings Depending on the Structure Configuration

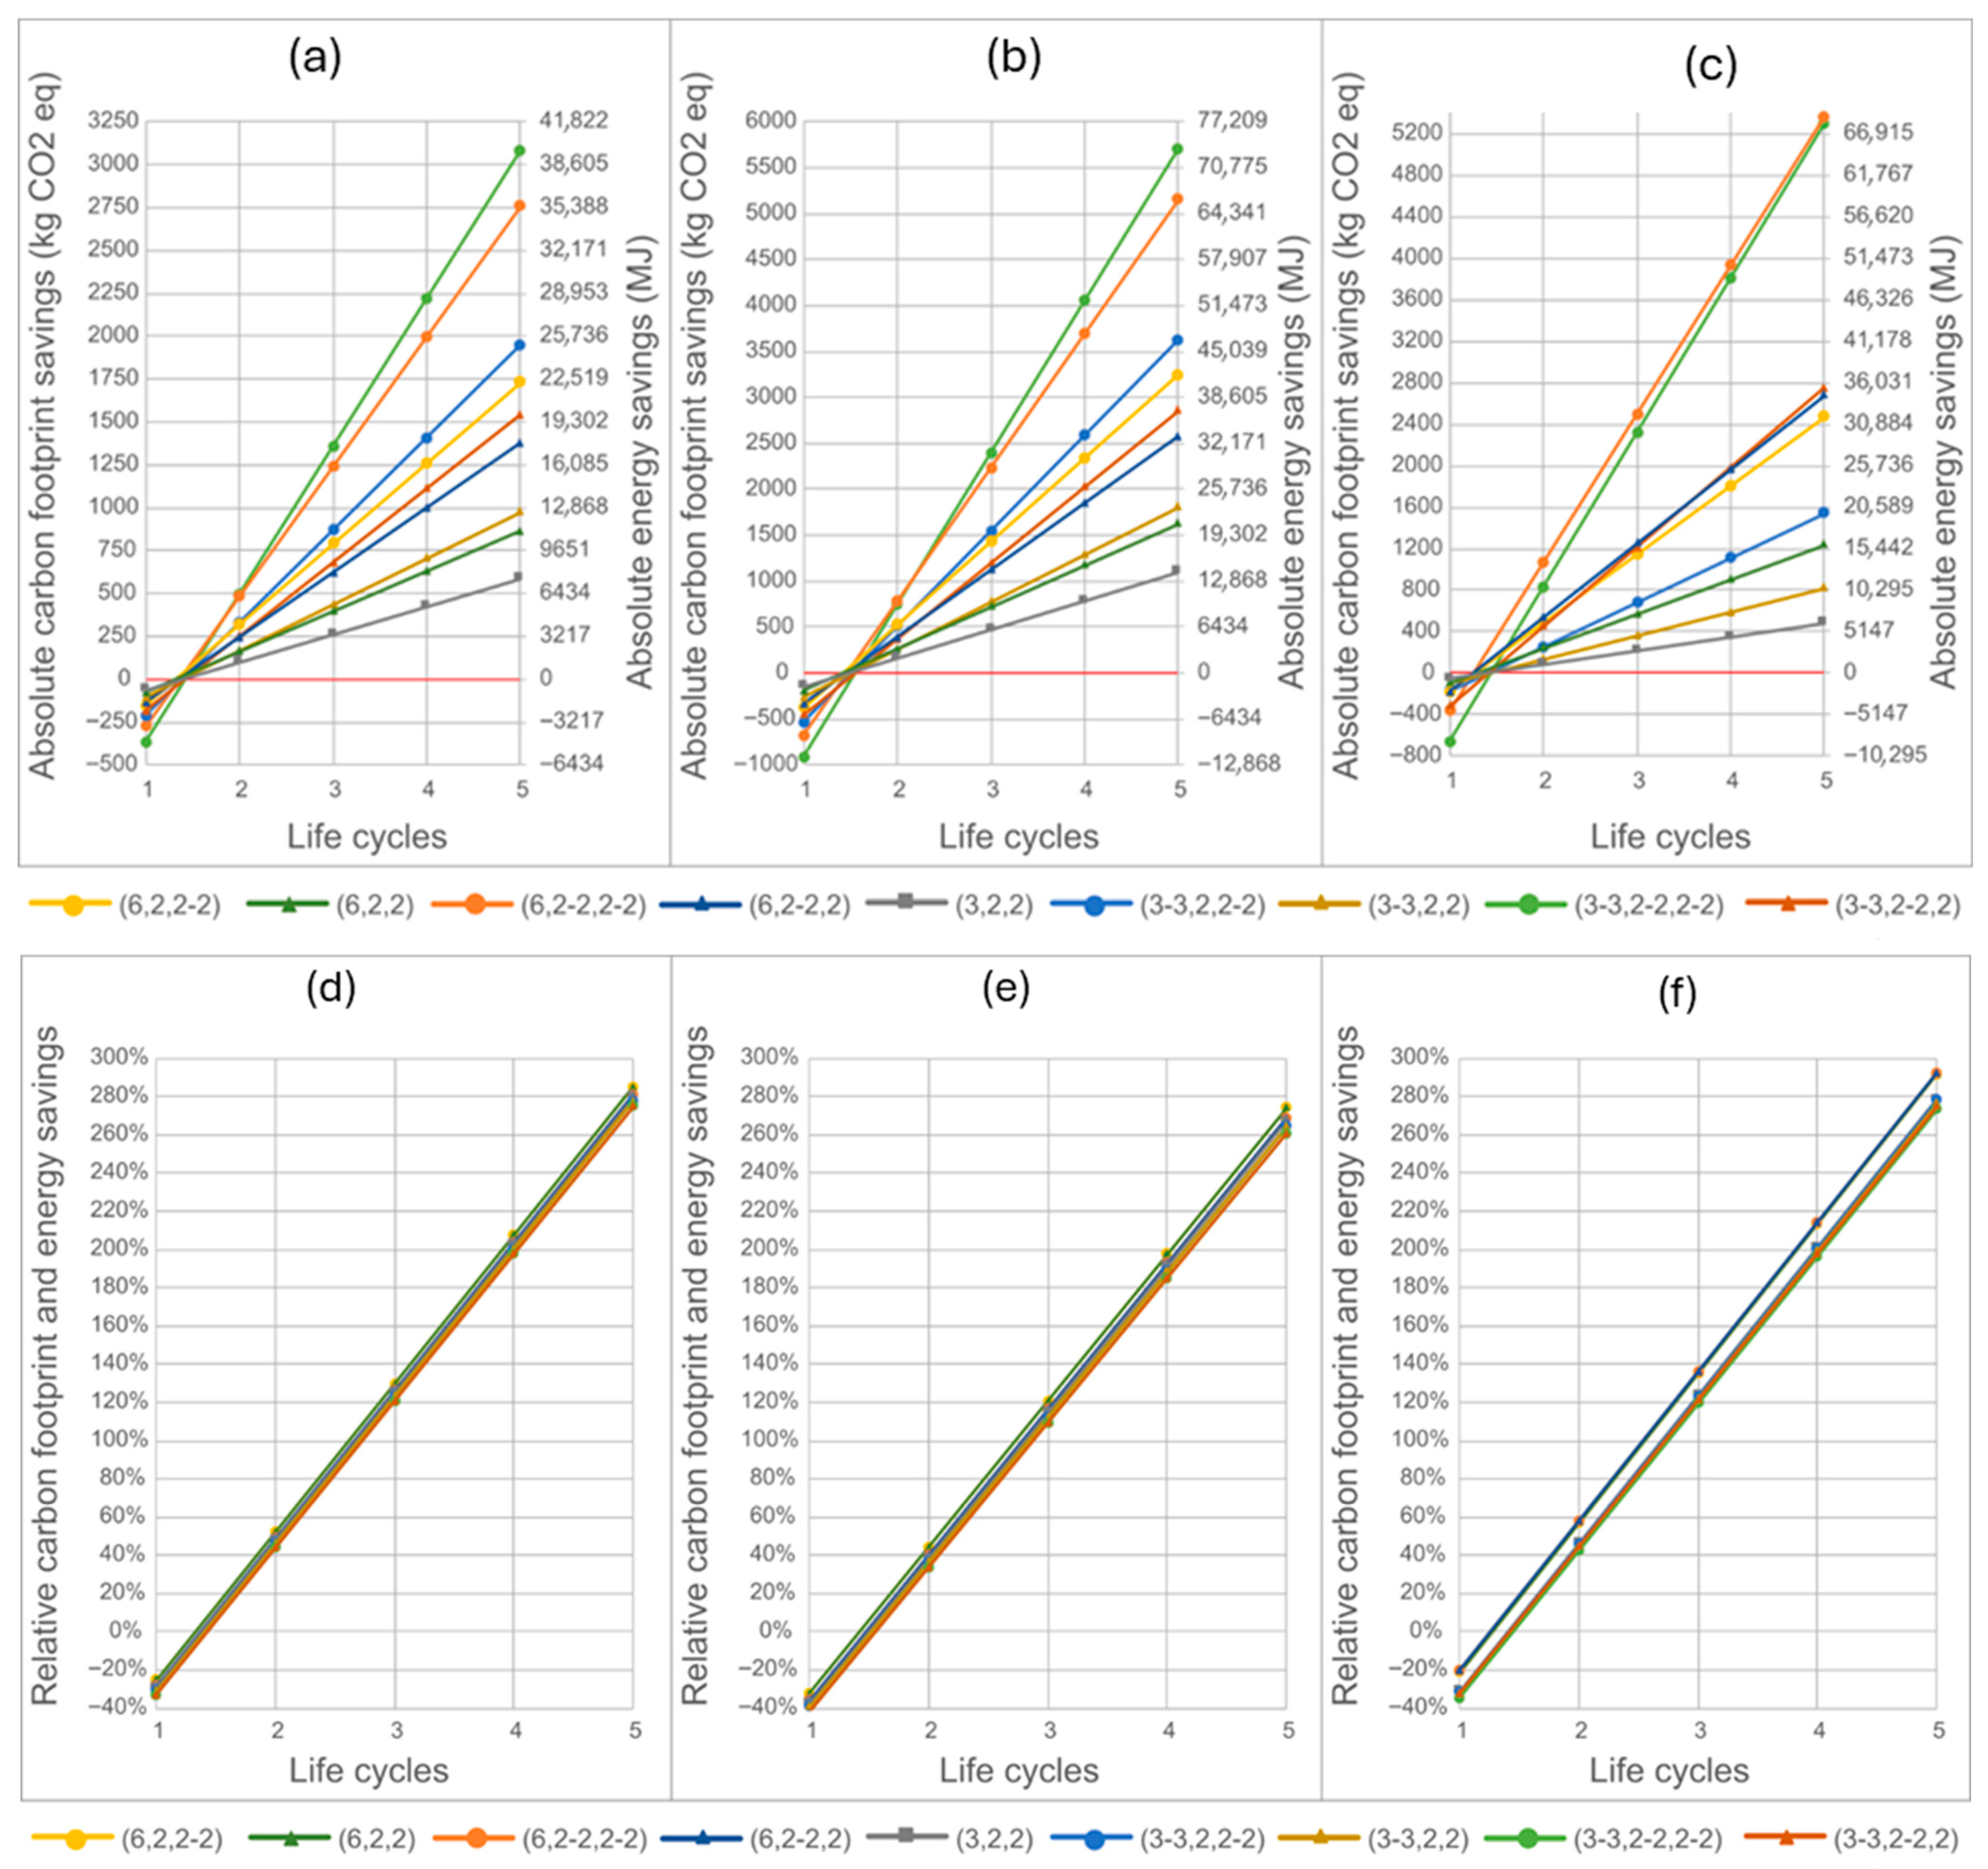
The graph in Figure 9 shows the absolute savings in CO2 emitted and energy consumed when using clamped joints instead of welded joints in structures made of IPE profiles. The curves corresponding to cases with longer profiles, more lateral spans, or more heights have a steeper slope. This means that structures with more material have a greater initial environmental impact, but also greater potential savings over their lifetime.

4.5. Total and Relative Cumulative Cost Depending on the Joining Solution Used for a Given Load and Composition

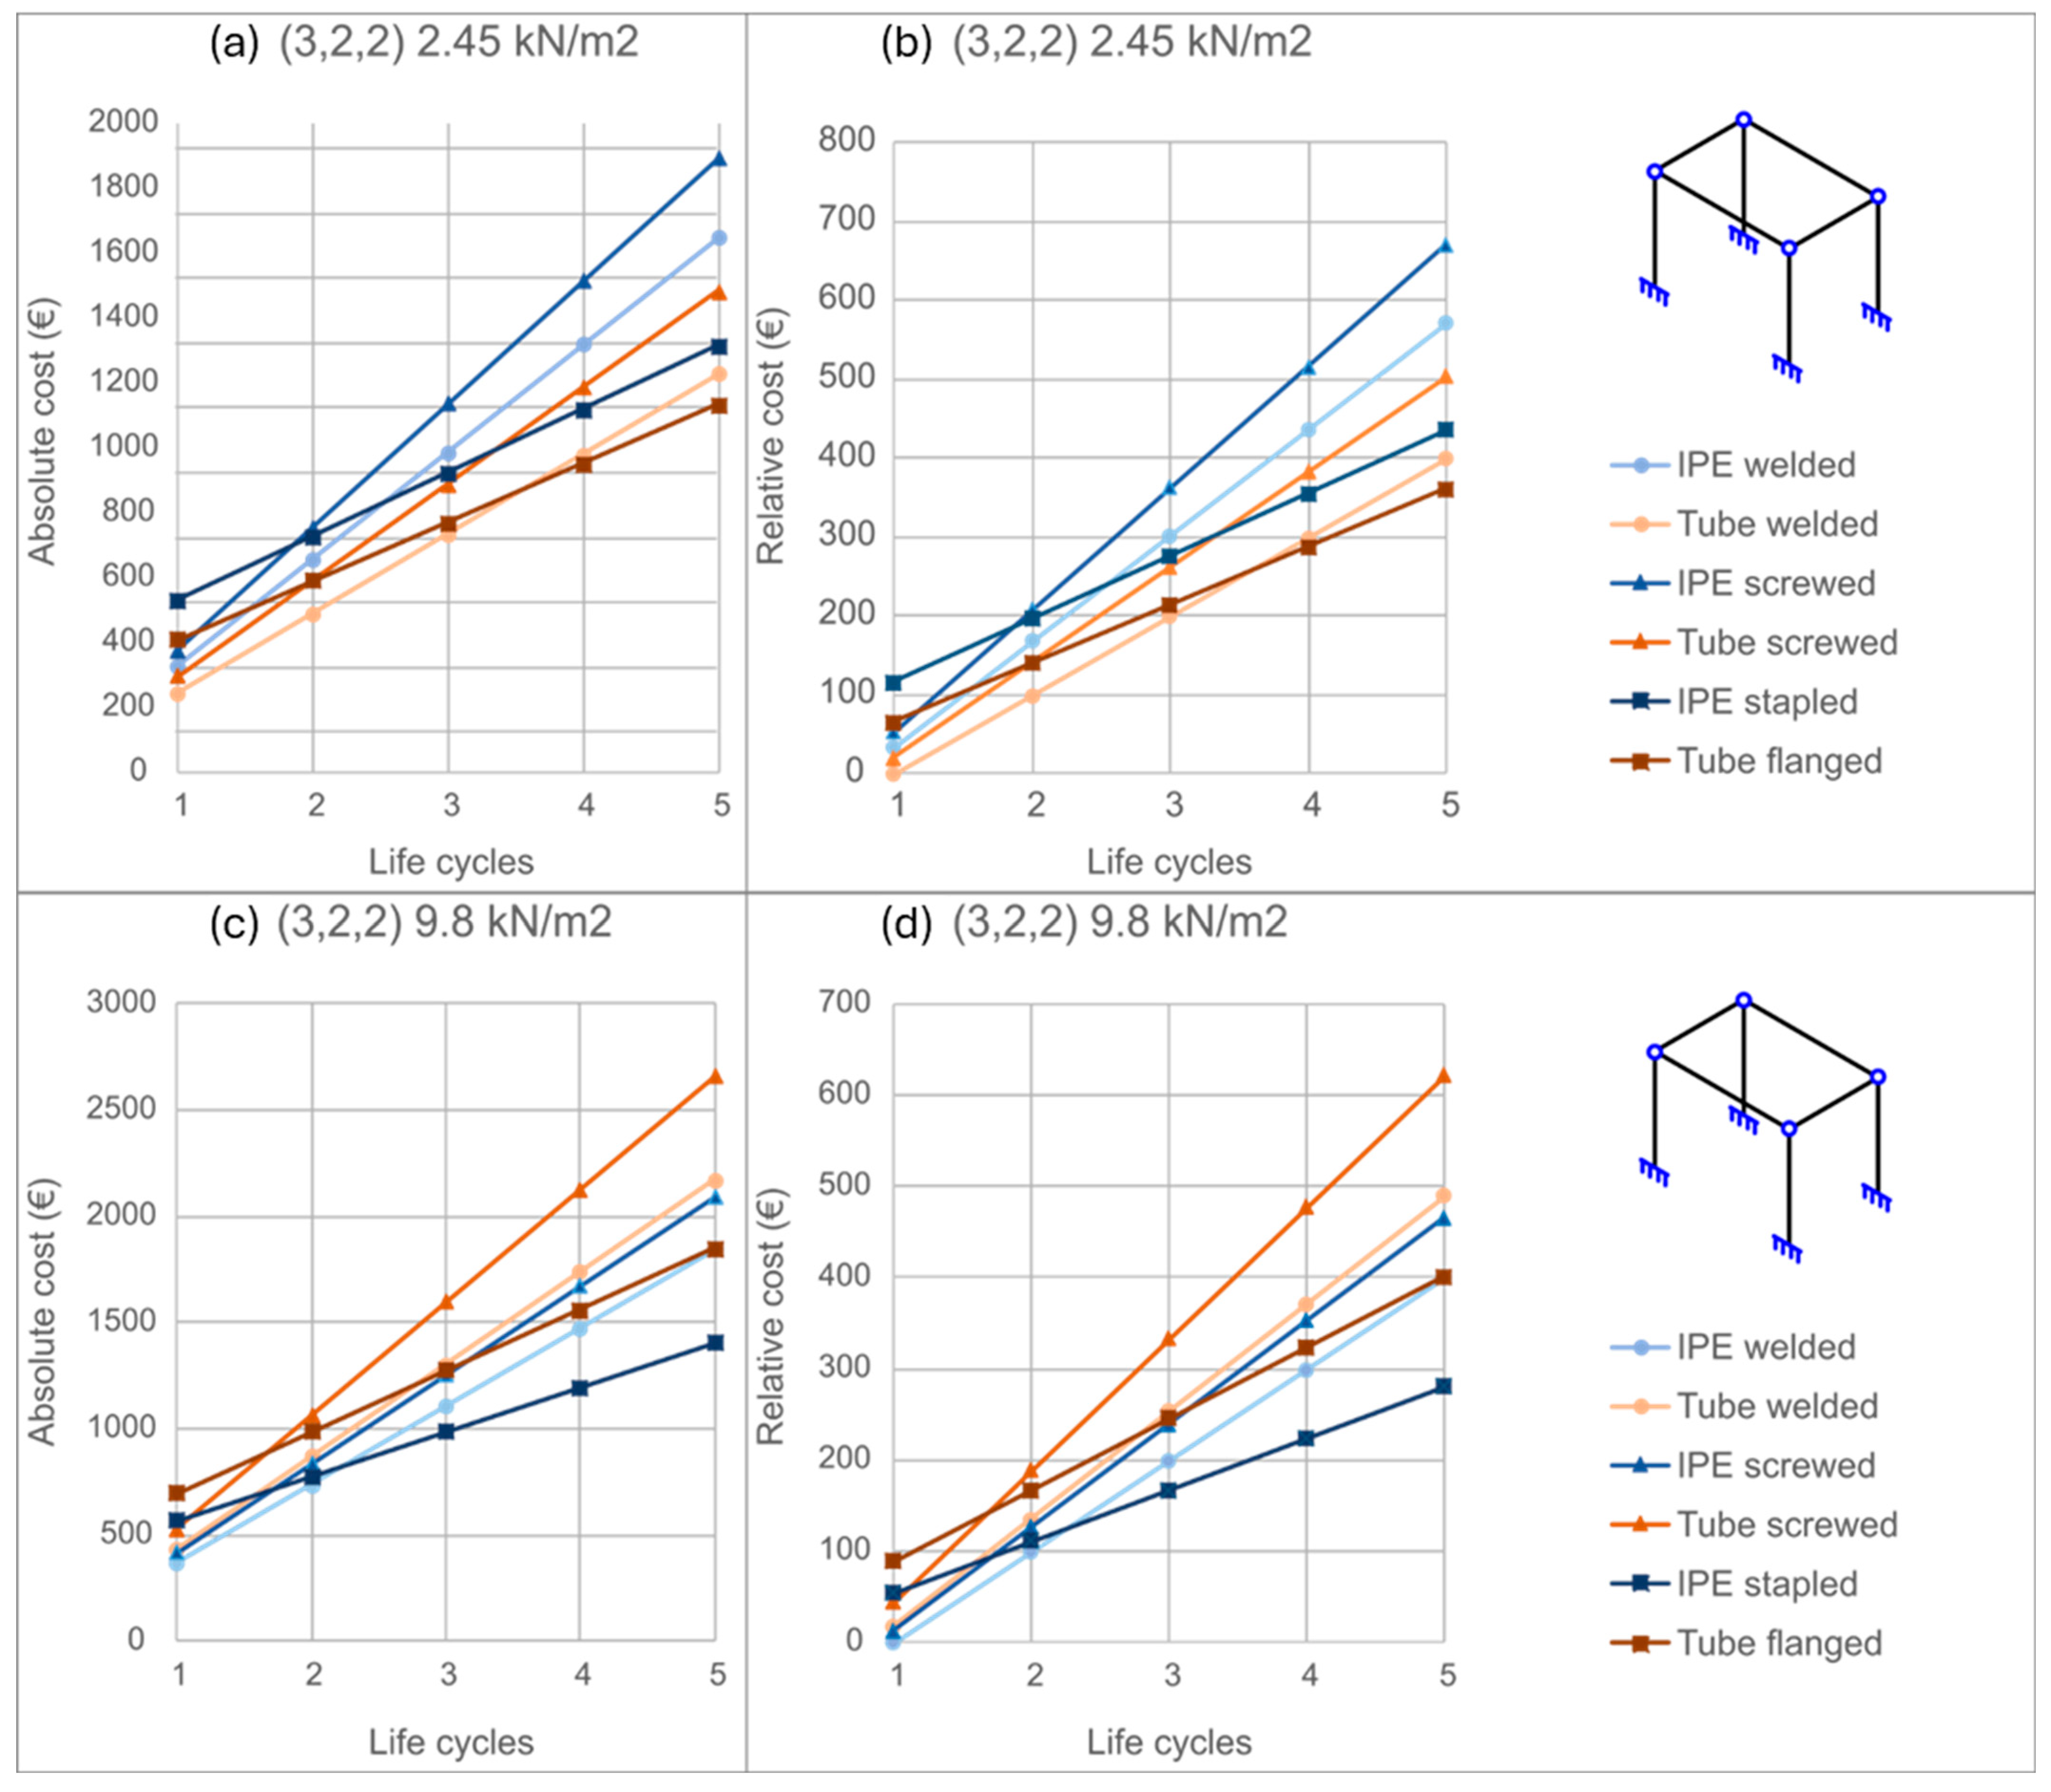
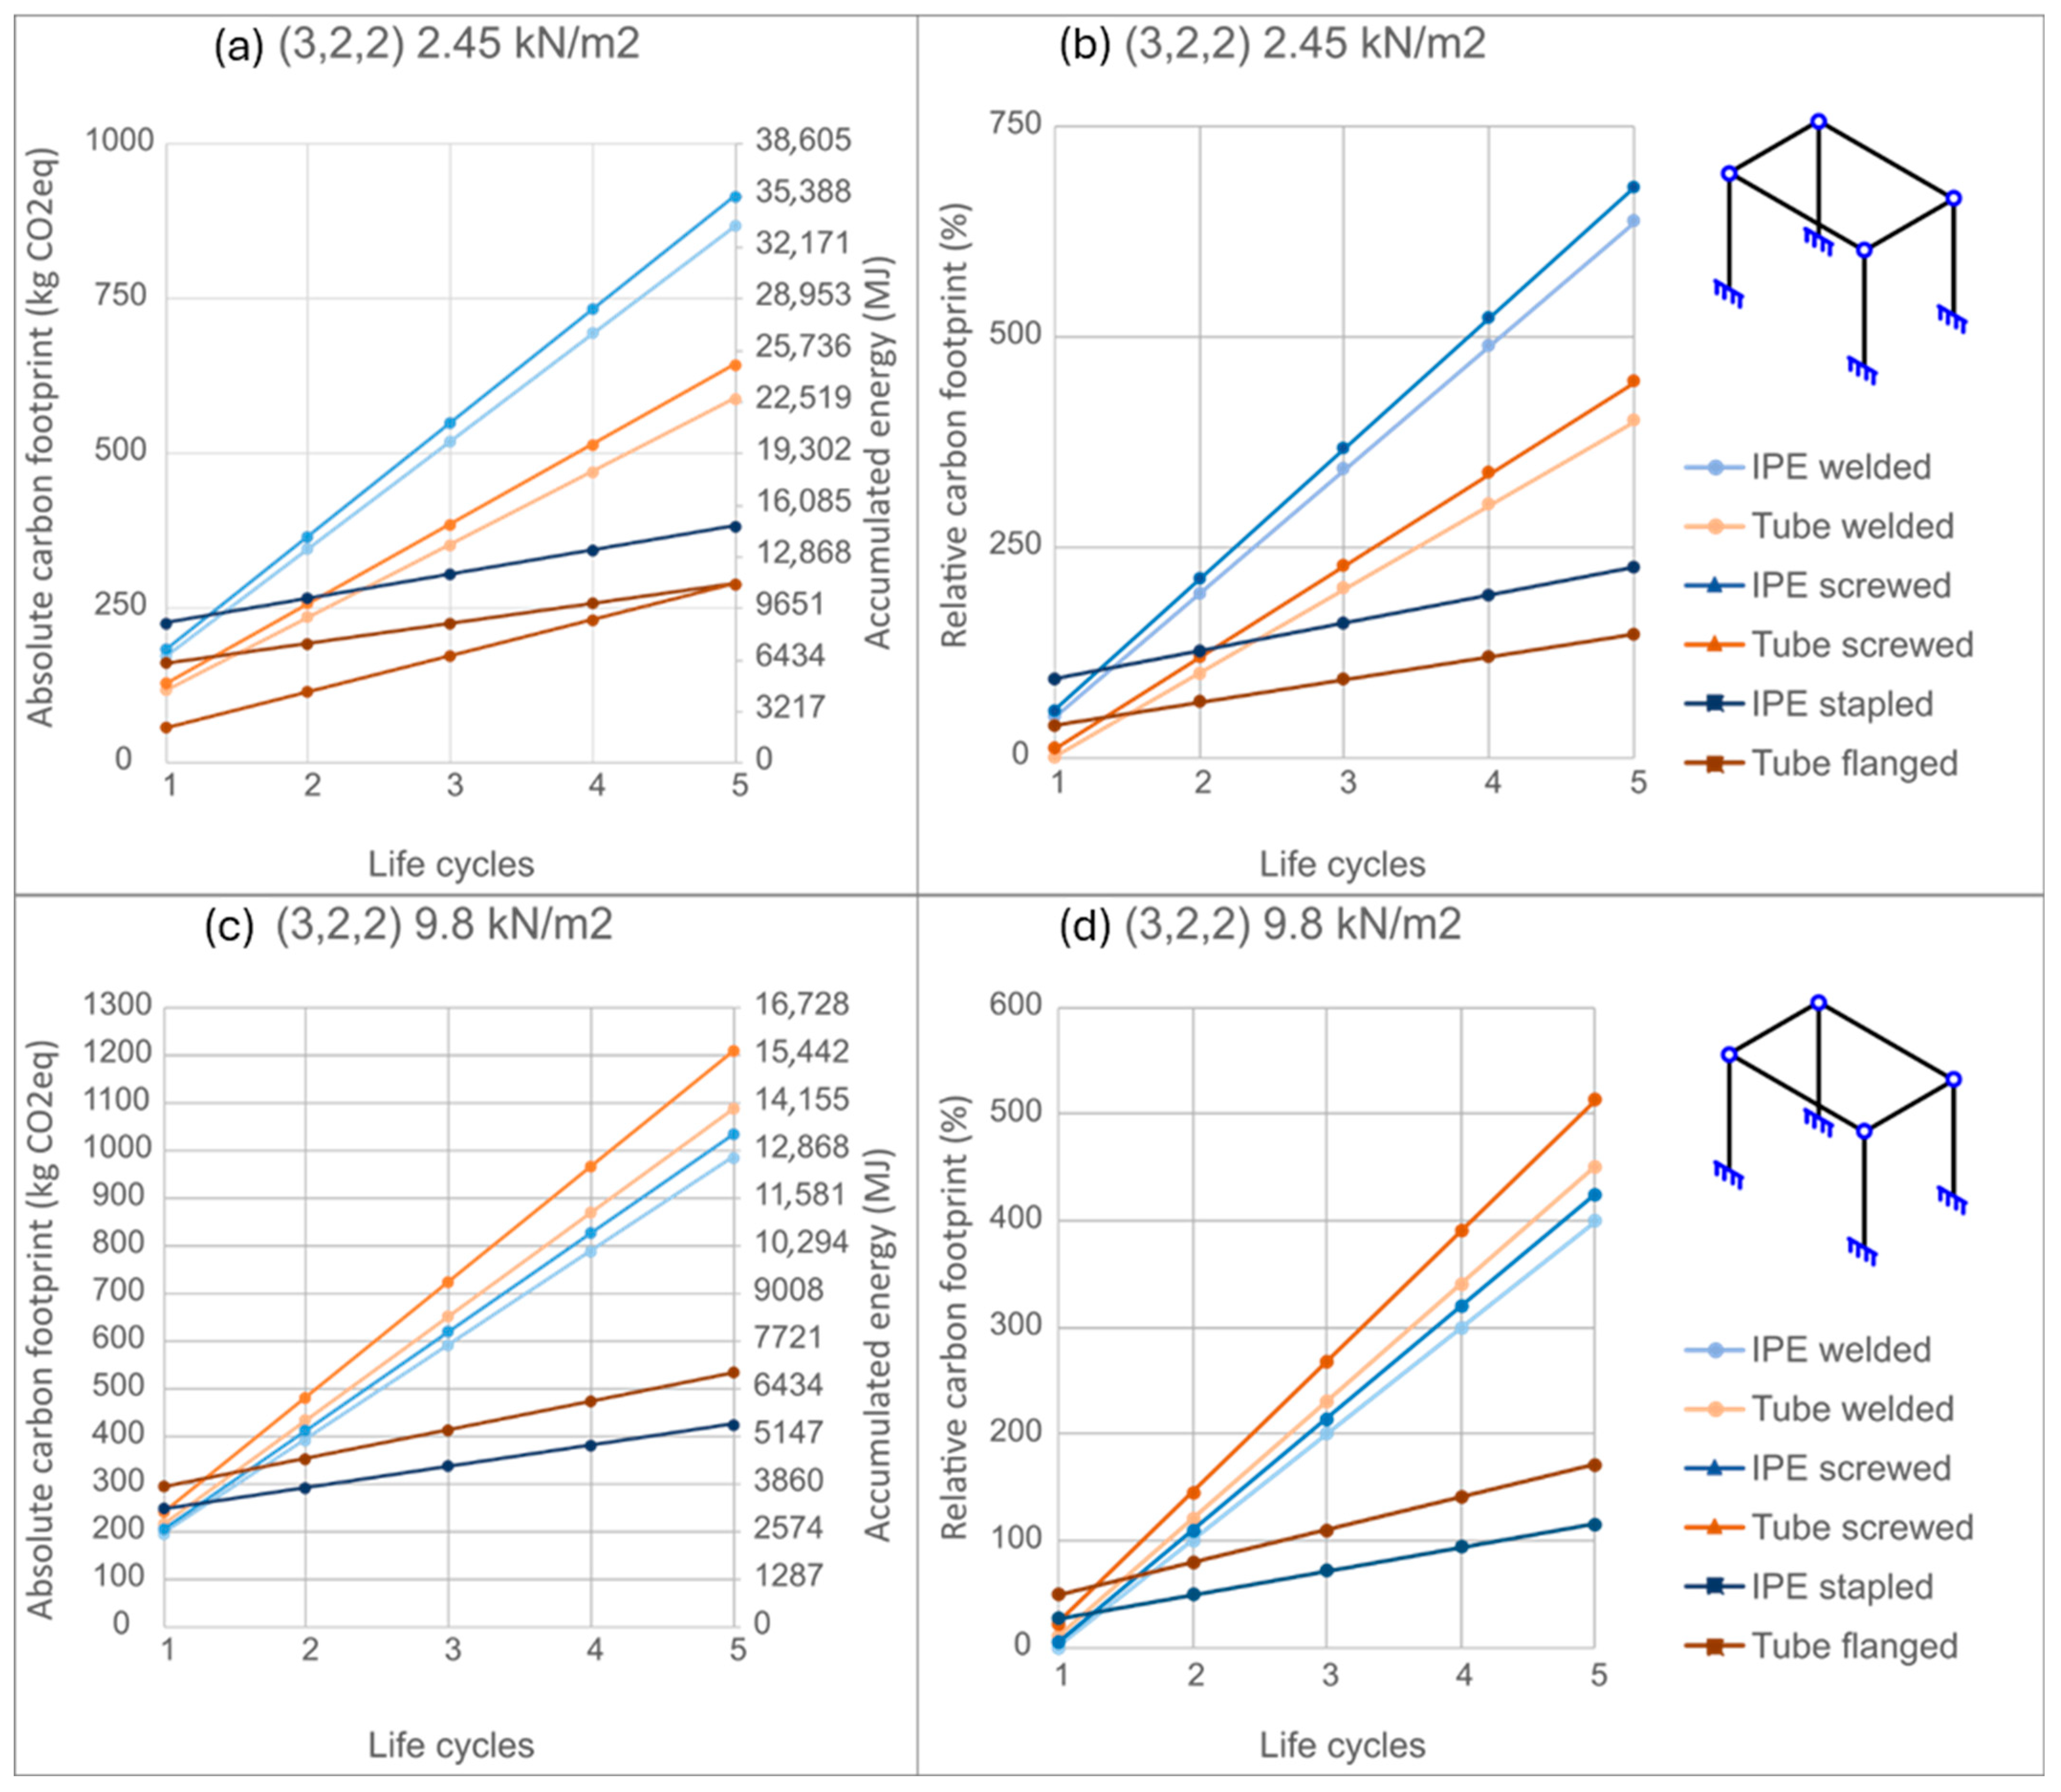
Figure 10 presents the total and relative accumulated cost according to the joint solution used for a given load and composition (3,2,2): (a) absolute cost for 2.45 kN/m2; (b) relative cost for 2.45 kN/m2; (c) absolute cost for 9.8 kN/m2; and (d) relative cost for 9.8 kN/m2. Figure 10a,b show that, after three cycles, a structure with flanged joints has a lower cost than one with welded joints, in the case of a composition (3,2,2) loaded with 2.45 kN/m2. Conversely, Figure 10c,d demonstrate that only two life cycles are necessary for a structure with clamped joints to become more economical than one with welded joints, when subjected to 9.8 kN/m2. These results highlight that the initial cost disadvantage of demountable connections is rapidly offset when structures are subjected to higher loads and multiple reconfigurations.
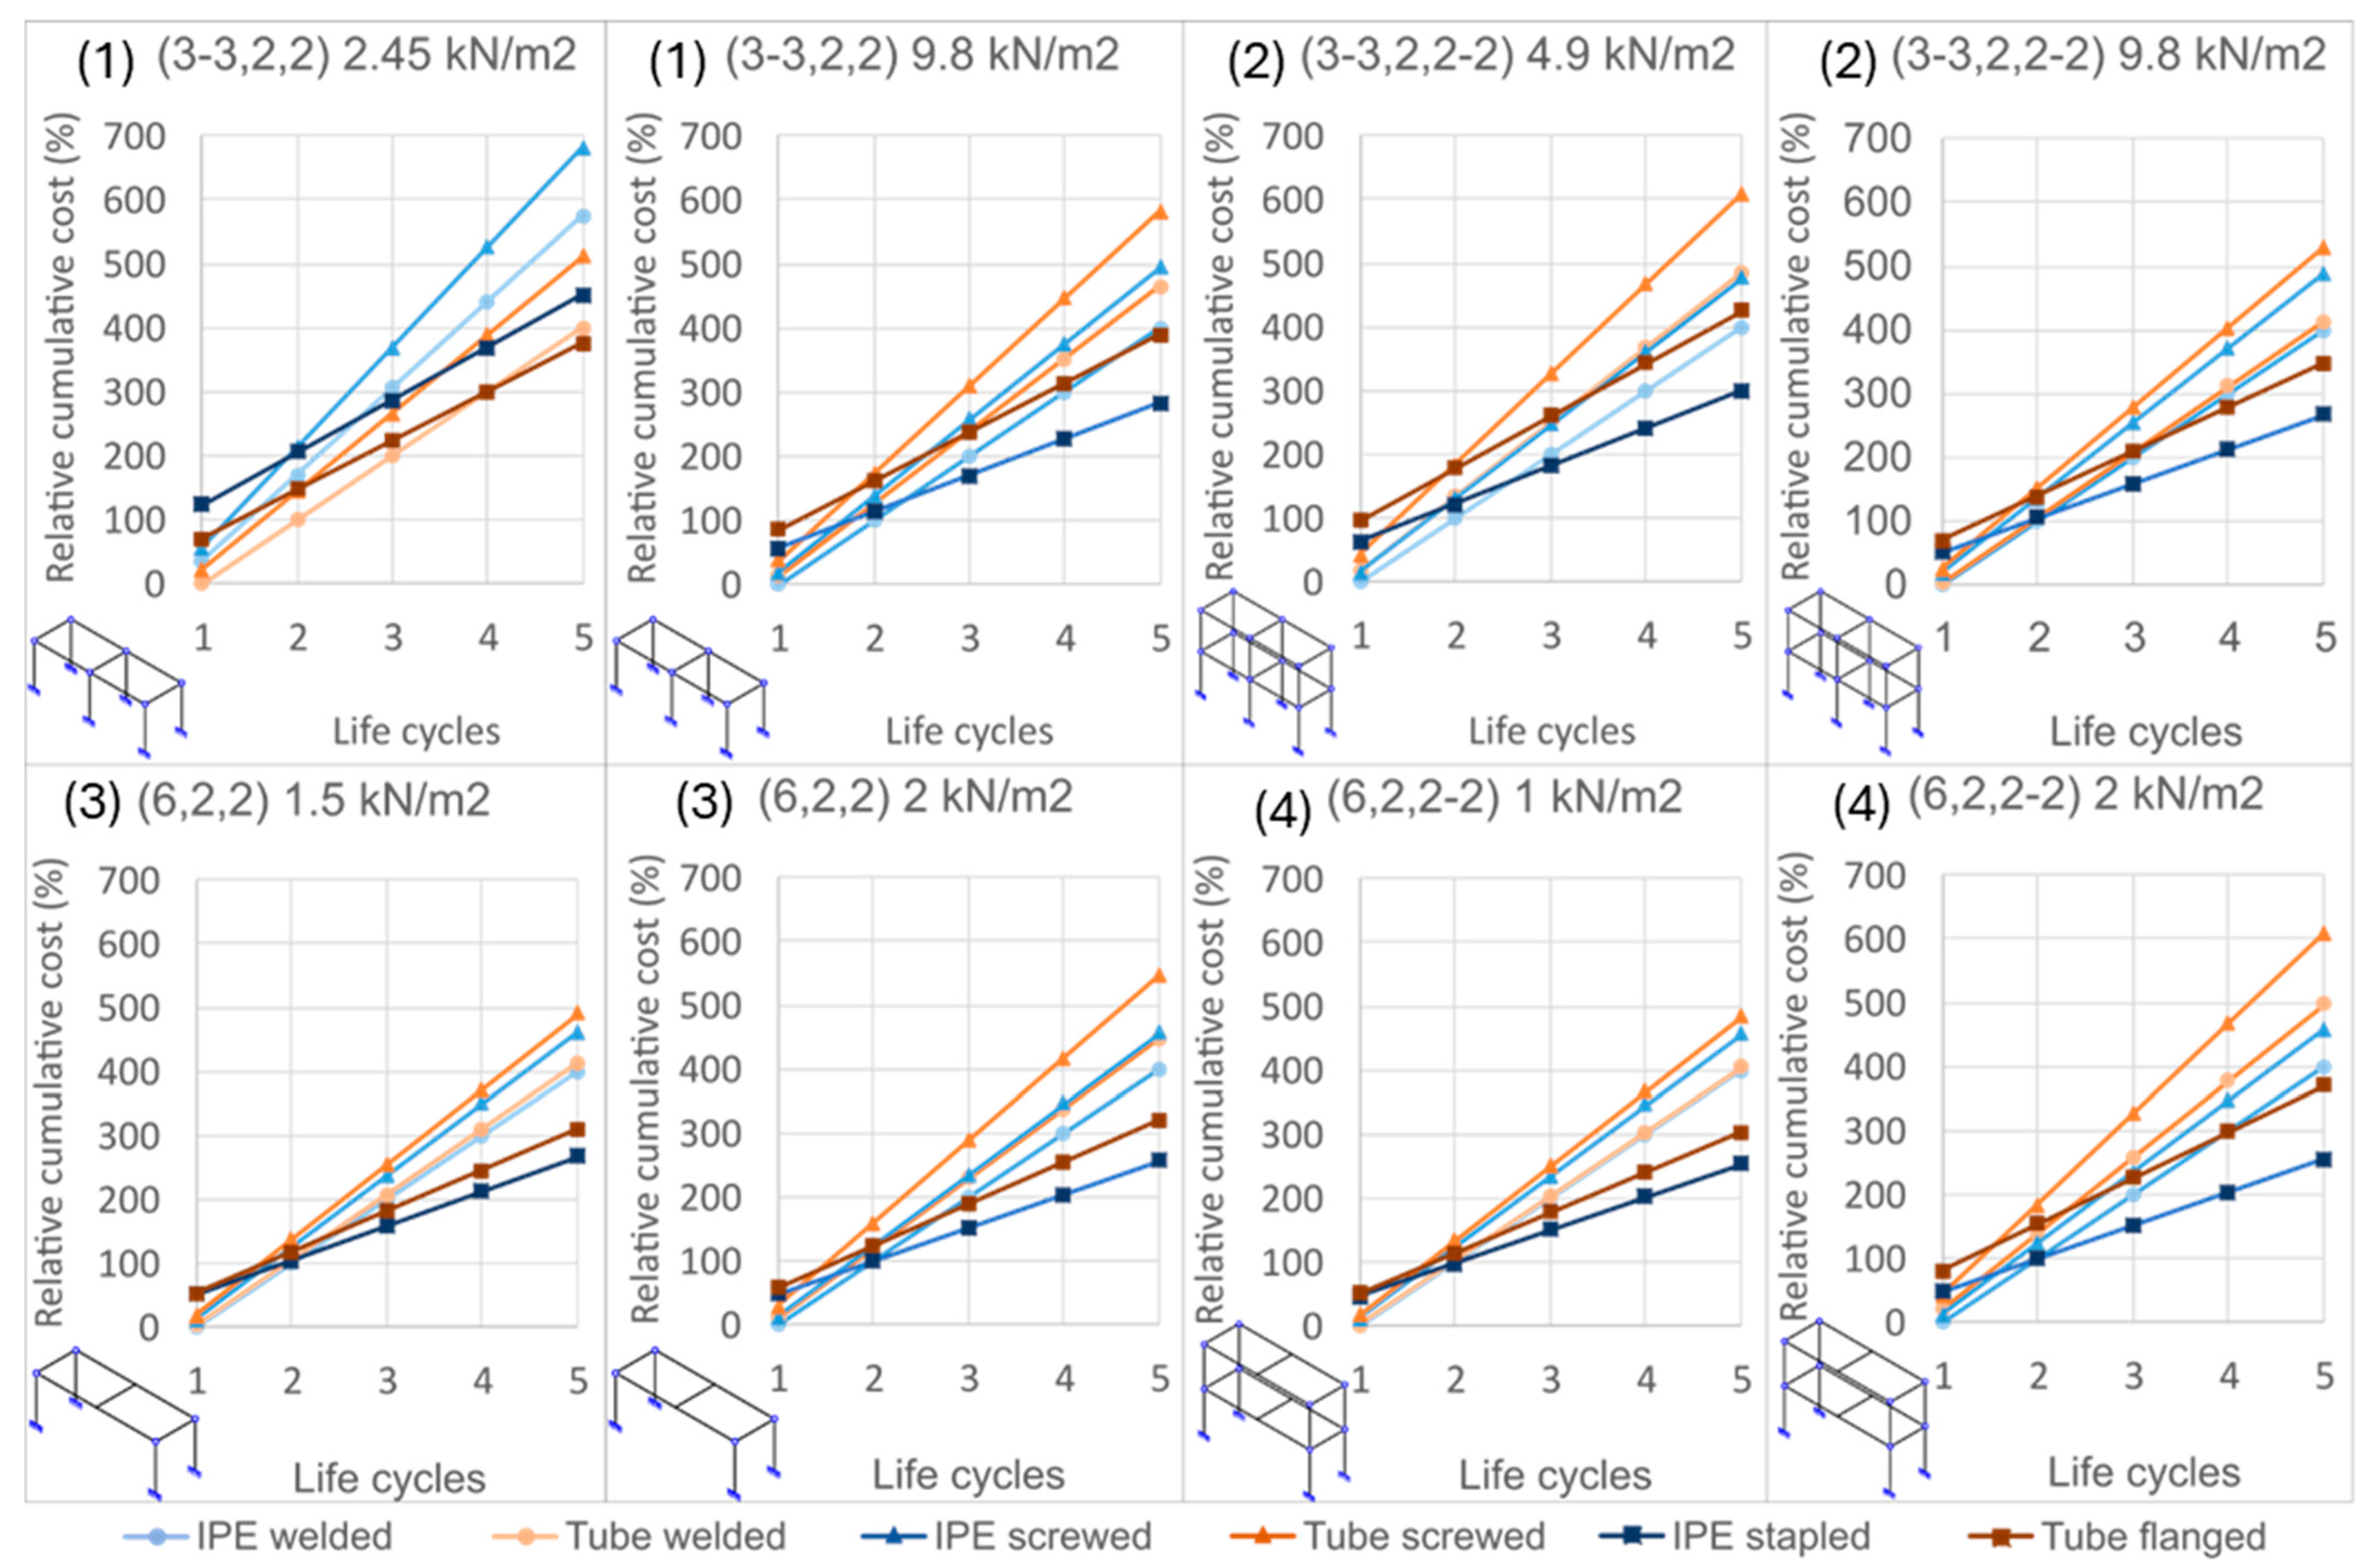
In general, there are no significant differences between the absolute and relative cost graphs. Figure 11 and Figure 12 further illustrate the relative accumulated cost of assumptions with a single span in the Y direction that support a given load. It is verified that, for three life cycles, all assumptions with stapled IPE profiles have a lower cost than their welded counterparts. Similarly, from four life cycles onwards, it is always cheaper to join tubular profiles with flanges than to weld them. These observations reinforce the cumulative economic benefits of reusability in a wide range of structural scenarios.
Compared with conventional welded and bolted joints, demountable solutions provide not only structural reliability [19,20], but also notable sustainability advantages when evaluated over multiple cycles. The present results confirm the mechanical evidence from those studies and extend the analysis to include both economic and environmental dimensions. Cavalheiro et al. (2025) [22,23] also demonstrated experimentally and numerically that clamp-based joints can replicate the performance of welded and bolted connections in the elastic range, supporting our conclusion that these systems are technically viable while enabling reuse. By combining these structural findings with life cycle assessment, the present study provides a more comprehensive evaluation of their long-term benefits.
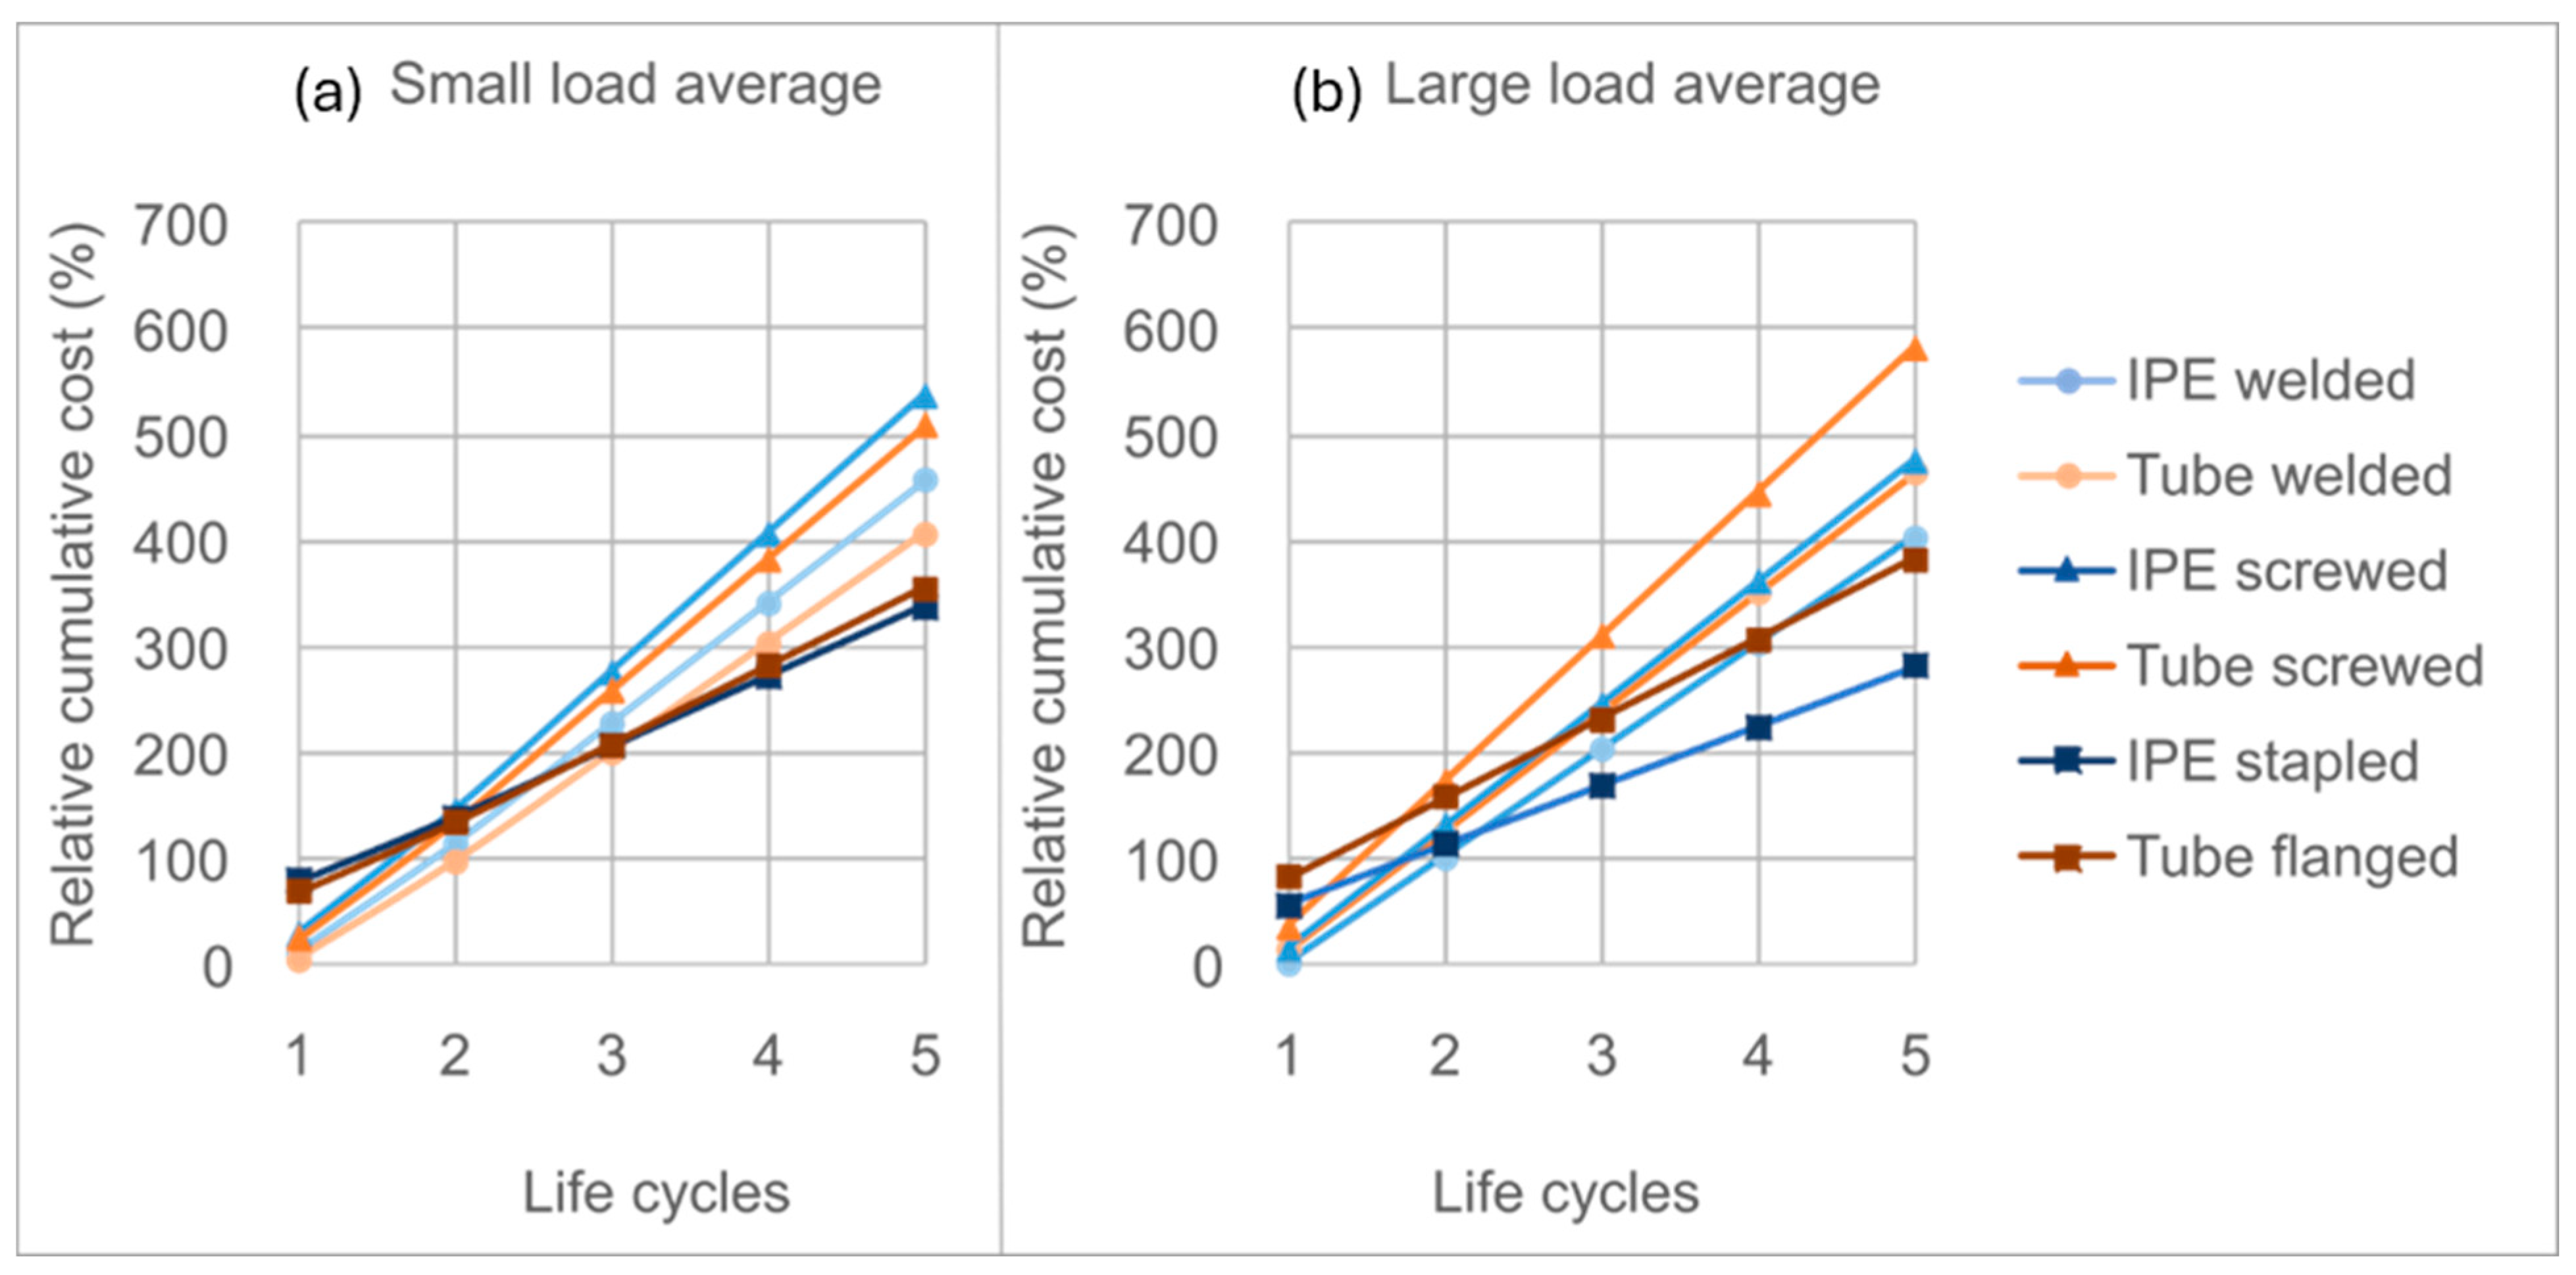
The graphs in Figure 13 show how the relative accumulated cost (regarding the best solution) of each of the assumed structures varies as the load increases. For example, for three life cycles and small loads, it is more favorable to use welded tubes. However, for three life cycles and large loads, IPE profiles with clamped joints are better.
The following section will show that reconfigurable solutions are always more sustainable from the second life cycle onwards.

4.6. Absolute and Relative Accumulated Carbon Footprint and Energy Consumed Depending on the Bonding Solution Used for a Given Load and Composition

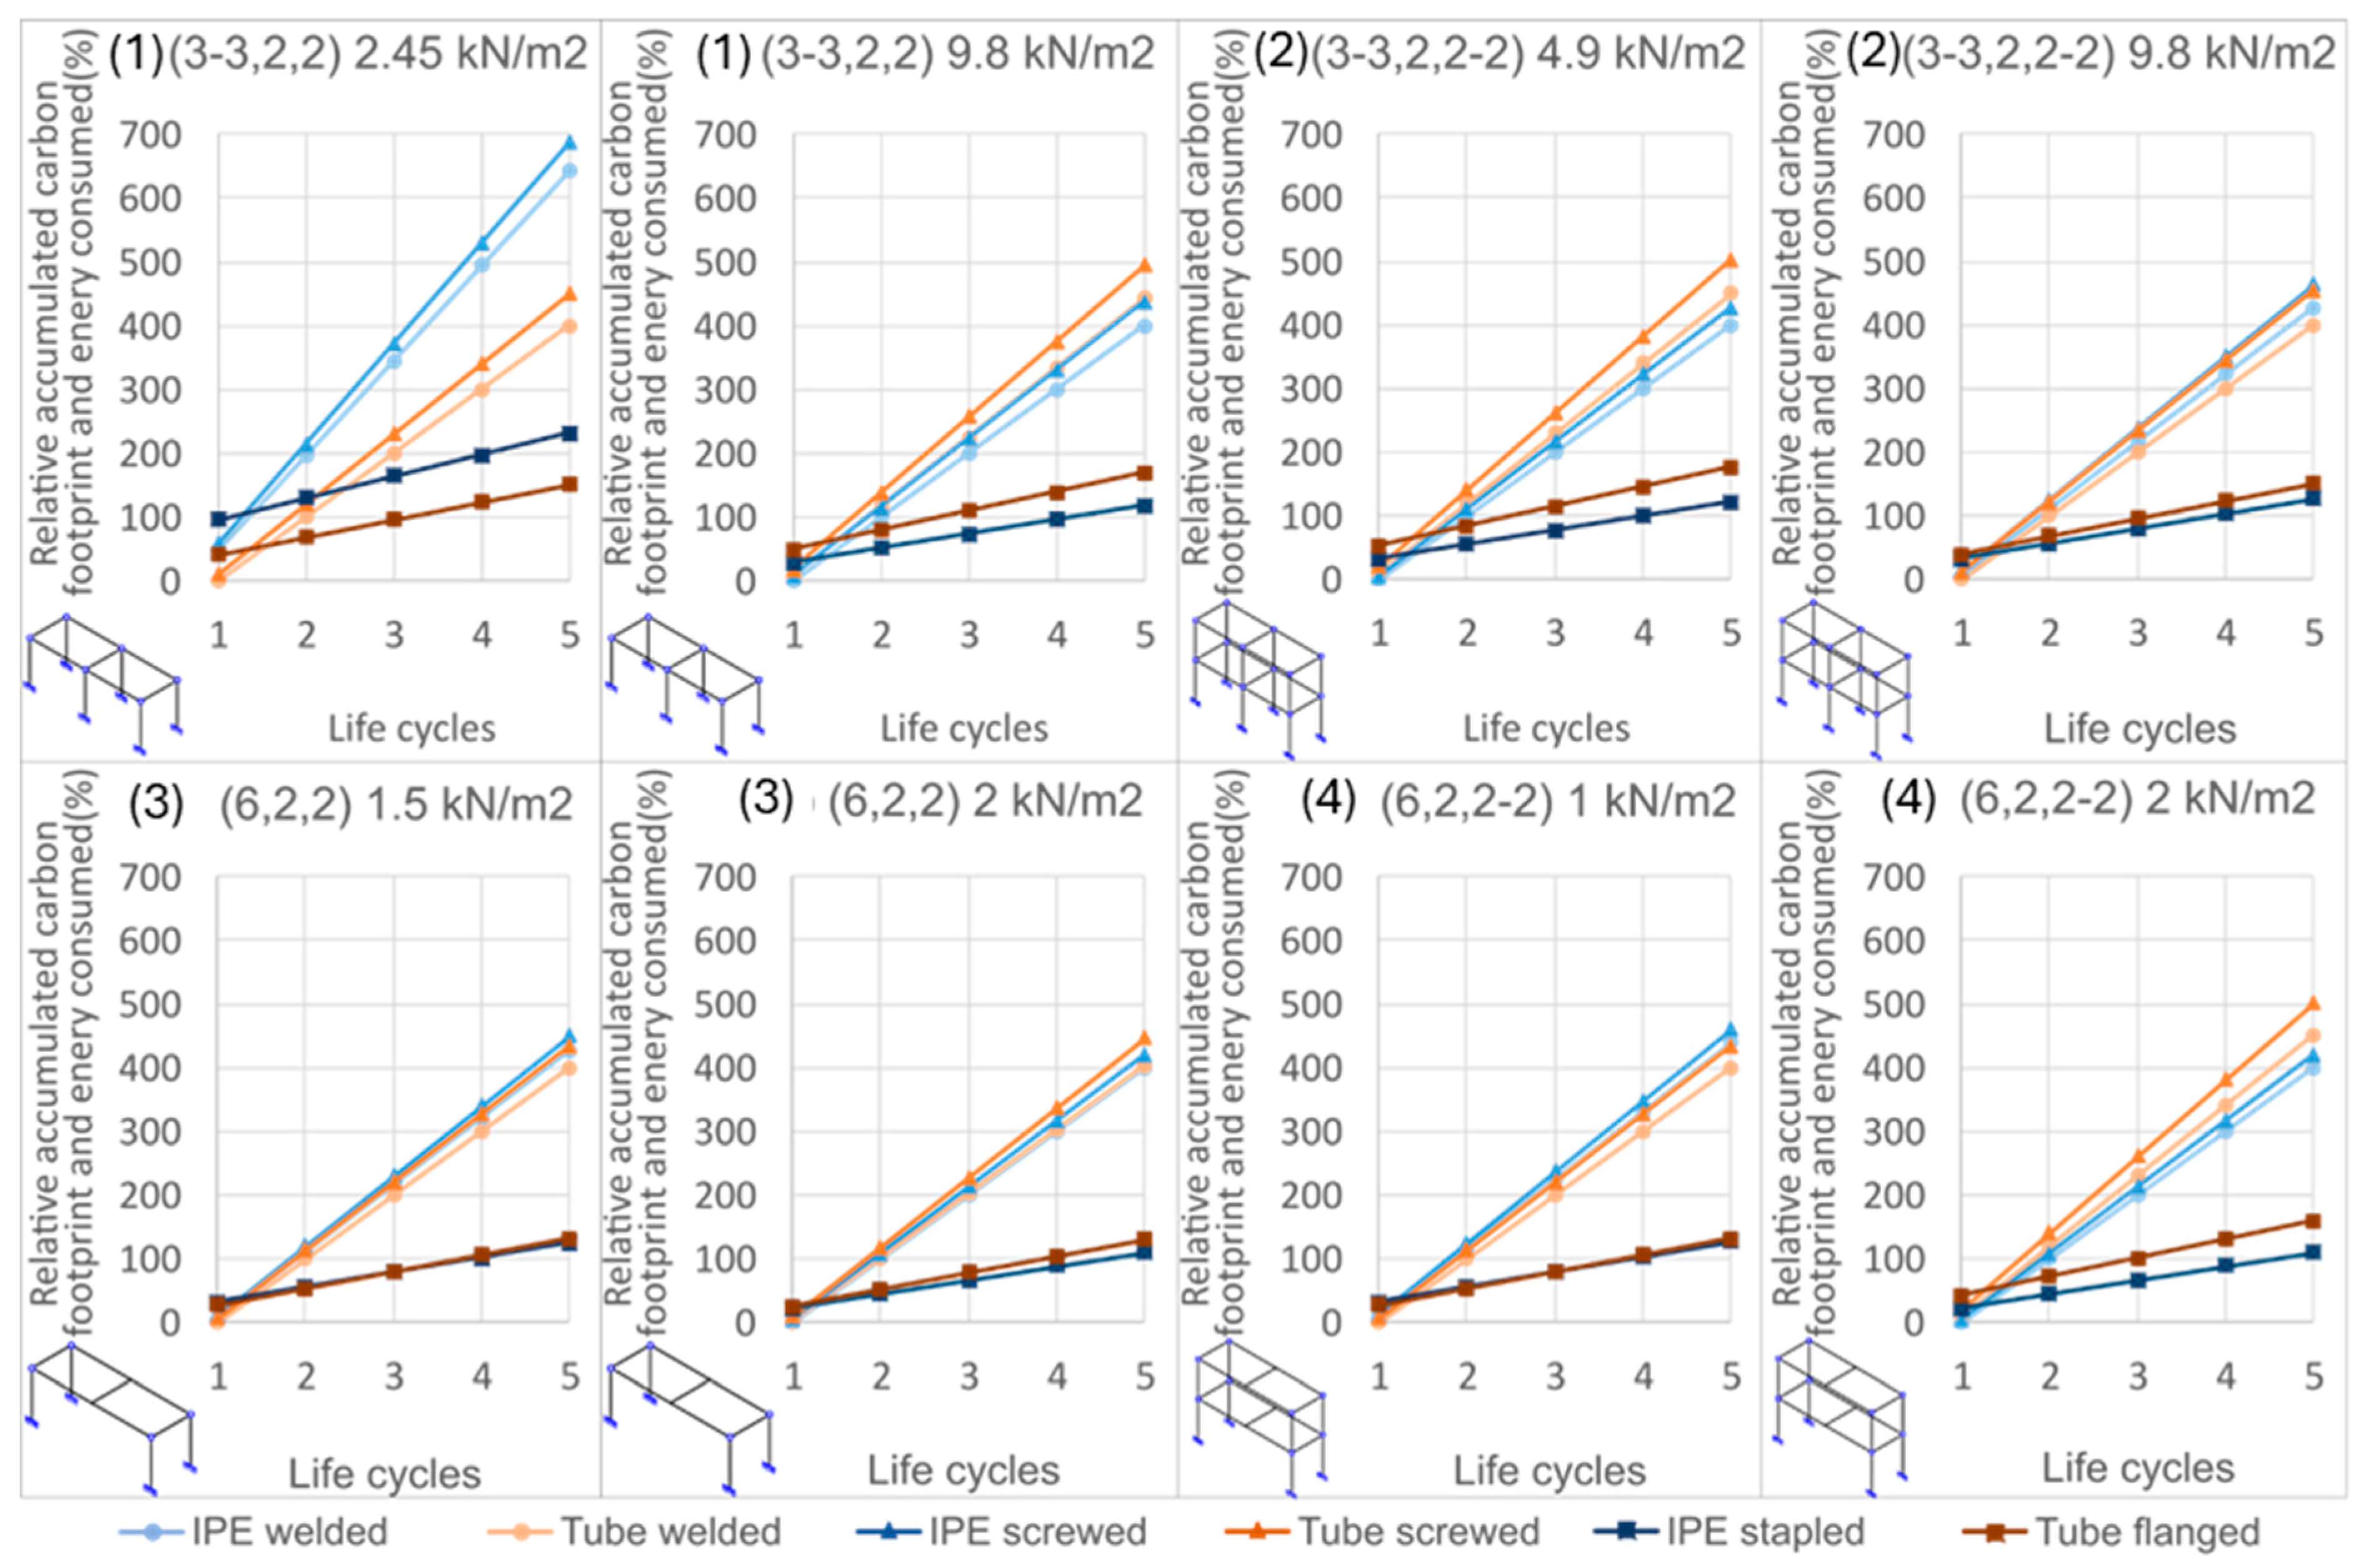
Figure 14 shows that, while the most favorable solution for a single life cycle is the use of IPE profiles with welded joints, from the second life cycle onwards, it depends on the type of load: for small loads, the use of flanged tubes is better, while, for large loads, the best option is IPE profiles with clamped joints. It is worth noting that the graphs of absolute and relative values show similar behavior. Figure 15 shows the relative accumulated carbon footprint and energy consumption for single-span compositions along the Y axis under different load conditions and joining solutions. Figure 16 extends this analysis to two-span compositions along the Y axis, also comparing different joining solutions under various load levels.
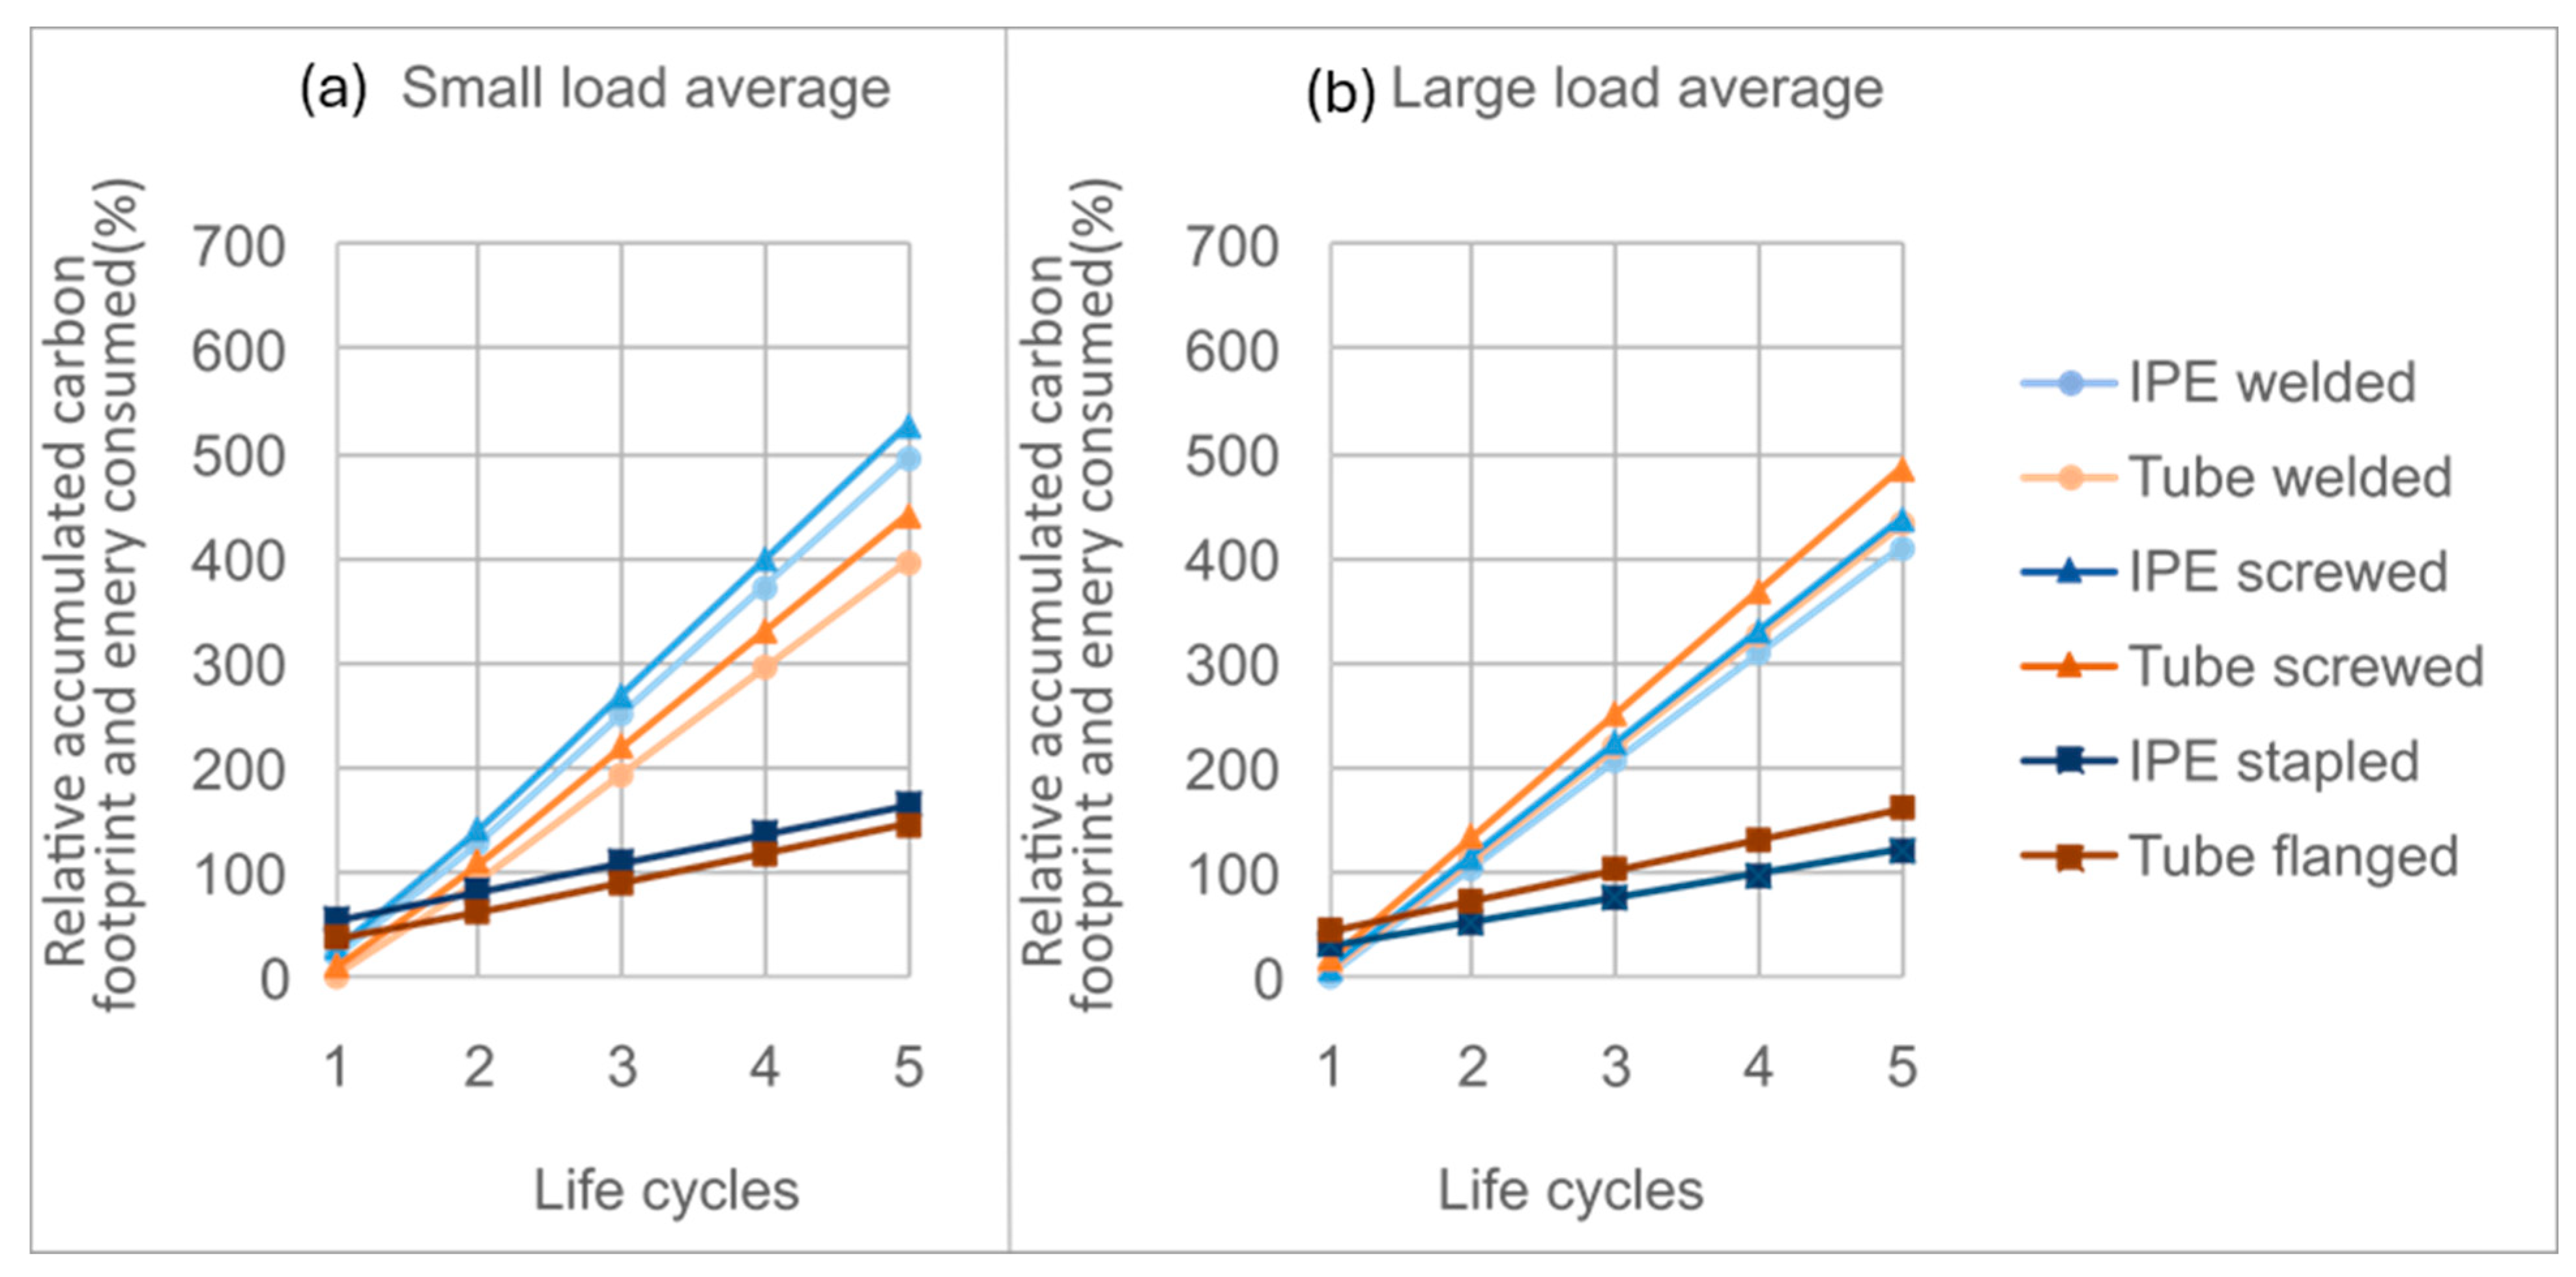
Figure 17 shows the average of the cases studied. It is observed that the use of classic joints, whether welded or bolted, is only better for one life cycle. Removable joints are more sustainable after two or more life cycles, as also confirmed by recent case-based studies on reused steel that demonstrated significant reductions in embodied impacts through multiple reconfigurations [39].
It can also be noted that tubular profiles with clamped joints perform better for small loads and IPE profiles with clamped joints for large loads. An important aspect highlighted by the results is the trade-off between the higher initial costs of demountable joints and their cumulative benefits over multiple cycles. This challenge has also been recognized in previous works, where the main barrier to adopting reusable systems is often the perception of increased upfront investment [2,7], a barrier also highlighted in recent parametric studies on demountable composite connections [40].
The present findings quantify this trade-off for medium-load industrial structures, showing that although conventional welded or bolted systems appear cheaper in the first cycle, demountable solutions deliver superior economic and environmental performance from the second or third cycle onwards. This reinforces the importance of adopting life cycle–based decision-making, as also emphasized by Pongiglione et al. (2014) [15], to capture the long-term sustainability advantages of reusable structures.
The diversity of typologies, geometric configurations, and load levels examined in this study also provides insight into the sensitivity of the results to variations in input parameters. Comparisons between optimized and uniform designs, as well as between low (2.45 kN/m2) and high (9.8 kN/m2) load scenarios, demonstrate that although absolute values of cost and environmental indicators vary, the relative advantage of demountable joints after multiple cycles remains consistent. This embedded sensitivity analysis reinforces the robustness of the proposed methodology and the reliability of the conclusions drawn.
Overall, the results demonstrate that demountable and reconfigurable joints reconcile structural performance with sustainability objectives, particularly in industrial environments characterized by frequent modifications. This directly addresses the gap highlighted in the literature [12,32], which emphasizes the need for integrated life cycle approaches to support circular economy practices in construction. By quantifying both economic (LCC) and environmental (LCA) benefits, the present study provides evidence-based guidance for industry stakeholders, showing that the higher initial costs of demountable joints are outweighed by significant long-term advantages under reuse scenarios, which is consistent with recent circular economy strategies proposed to minimize construction and demolition waste [41].

5. Conclusions

This work proposed a methodology for optimizing the load-bearing structures of machines and industrial installations by selecting the optimal combination of profile type and connection, ensuring the best structural, economic, and environmental performance. Cost, savings, and sustainability ratios were defined to enable a consistent comparison among solutions as a function of the number of life cycles considered.
  • Economic advantages: Although demountable connections involve a higher initial investment than welded or bolted solutions, they become profitable from the third life cycle, and already from the second under high load conditions (9.8 kN/m2). Relative cost savings reach 35–40% by the third cycle for uniform-profile configurations and up to 75% for optimized designs. For small loads (2.45 kN/m2) and up to three cycles, welded tubular profiles are the most favorable; beyond that point, IPE profiles with bolted or clamped joints offer superior cost efficiency.
  • Environmental advantages: The sustainability analysis demonstrates that innovative demountable connections reduce the carbon and energy footprint from the second life cycle onwards. Average reductions are approximately 33% after two cycles and 50% after three cycles compared with welded counterparts. The influence of structural height is minor, but increasing profile length significantly improves the sustainability ratio, reinforcing the cumulative environmental benefits of reusability.
  • Applicable scenarios: Demountable and reconfigurable joints are particularly advantageous in industrial facilities subject to frequent layout modifications, such as automotive, pharmaceutical, and textile plants. Their ability to be dismantled, reassembled, and reused without loss of performance aligns with circular economy principles and makes them an attractive alternative for projects that require versatility, rapid assembly and disassembly, and long-term sustainability.
In summary, the proposed methodology provides quantitative evidence that innovative demountable connections deliver measurable economic and environmental benefits and offers a decision-support framework for engineers and stakeholders involved in the design of reconfigurable steel structures.
While the study achieved its aim of integrating structural, economic, and environmental assessments of demountable steel structures, its scope was intentionally focused on medium-load industrial applications (0.5–9.8 kN/m2) and on the economic (LCC) and environmental (LCA) dimensions of sustainability. Cost and time data were obtained from a structured database, which may vary across industrial contexts. These choices were appropriate for the objectives of this work but also open opportunities for further research, such as experimental validation of the proposed methodology, its extension to other structural typologies or load conditions, and its integration into BIM workflows for practical implementation. From a practical perspective, the findings provide actionable insights for engineers and designers, who can adopt life cycle indicators in design-for-deconstruction; for industrial managers, who can anticipate long-term cost savings and sustainability benefits; and for policymakers, who may promote incentives and regulations to foster the adoption of reusable steel systems in line with circular economy strategies.

Author Contributions

Conceptualization, A.O.M., M.C.N. and F.N.C.; Methodology, A.O.M. and M.C.N.; Software, A.O.M.; Validation, A.O.M., F.F.A. and F.N.C.; Formal analysis, A.O.M. and F.F.A.; Investigation, A.O.M.; Resources, A.O.M. and M.C.N.; Writing—original draft, A.O.M.; Writing—review & editing, A.O.M., F.F.A. and F.N.C.; Visualization, A.O.M., F.F.A. and F.N.C.; Supervision, M.C.N.; Project administration, M.C.N.; Funding acquisition, M.C.N. All authors have read and agreed to the published version of the manuscript.

Funding

This research was funded by TED2021–130497A-I00, MCIN/AEI/10.13039/501100011033, and by the European Union ‘NextGenerationEU’/PRTR. La publicación es parte del proyecto TED2021–130497A-I00, financiado por MCIN/AEI/10.13039/501100011033 y por la Unión Europea “NextGenerationEU”/PRTR.

Data Availability Statement

The original contributions presented in the study are included in the article, further inquiries can be directed to the corresponding author.

Acknowledgments

We want to acknowledge Esypro Company for their collaboration in providing the photos used in this work.

Conflicts of Interest

The authors declare no conflict of interest.

References

  1. European Commission. Waste Statistics 2018. EUROSTAT Statistics Explained. Available online: https://ec.europa.eu/eurostat/statistics-explained/index.php/Waste_statistics#Total_waste_generation (accessed on 21 February 2020).
  2. Sansom, M.; Avery, N. Briefing: Reuse and Recycling Rates of UK Steel Demolition Arisings. Proc. Inst. Civ. Eng. Eng. Sustain. 2014, 167, 89–94. [Google Scholar] [CrossRef]
  3. World Steel Association. Life Cycle Inventory Study Report, 2020 Data Release; Beijing Lufthansa Centre: Beijing, China, 2020; Available online: https://worldsteel.org/publications/bookshop/life-cycle-inventory-study-report-2020-datarelease/ (accessed on 10 July 2024).
  4. United Nations General Assembly. Transforming Our World: The 2030 Agenda for Sustainable Development; United Nations: New York, NY, USA, 2015. [Google Scholar]
  5. European Commission. Communication from the Commission to the European Parliament, the European Council, the Council, the European Economic and Social Committee and the Committee of the Regions: The European Green Deal; COM(2019) 640 Final; European Commission: Brussels, Belgium, 2019; Available online: https://www.eea.europa.eu/policy-documents/com-2019-640-final (accessed on 10 July 2024).
  6. Eckelman, M.J.; Brown, C.; Troup, L.N.; Wang, L.; Webster, M.D.; Hajjar, J.F. Life Cycle Energy and Environmental Benefits of Novel Design-for-Deconstruction Structural Systems in Steel Buildings. Build. Environ. 2018, 143, 421–430. [Google Scholar] [CrossRef]
  7. Kuzmenko, K.; Roux, C.; Feraille, A.; Baverel, O. Assessing Environmental Impact of Digital Fabrications and Reuse of Constructive Systems. Structures 2021, 31, 1300–1310. [Google Scholar] [CrossRef]
  8. Basta, A.; Serror, M.H.; Marzouk, M. A BIM-Based Framework for Quantitative Assessment of Steel Structure Deconstructability. Autom. Constr. 2020, 111, 103064. [Google Scholar] [CrossRef]
  9. Romano, E.; Cascini, L.; D’Aniello, M.; Portioli, F.; Landolfo, R. A Simplified Multi-Performance Approach to Life-Cycle Assessment of Steel Structures. Structures 2020, 27, 371–382. [Google Scholar] [CrossRef]
  10. Akbarnezhad, A.; Ong, K.C.G.; Chandra, L.R. Economic and Environmental Assessment of Deconstruction Strategies Using Building Information Modelling. Autom. Constr. 2014, 27, 131–144. [Google Scholar] [CrossRef]
  11. Tingley, D.D.; Davison, B. Developing an LCA Methodology to Account for the Environmental Benefits of Design for Deconstruction. Build. Environ. 2012, 57, 387–395. [Google Scholar] [CrossRef]
  12. Atta, I.; Bakhoum, E.S.; Marzouk, M.M. Digitizing Material Passport for Sustainable Construction Projects Using BIM. J. Build. Eng. 2021, 43, 103233. [Google Scholar] [CrossRef]
  13. Santos, R.; Costa, A.A.; Silvestre, J.D.; Vandenbergh, T.; Pyl, L. BIM-Based Life Cycle Assessment and Life Cycle Costing of an Office Building in Western Europe. Build. Environ. 2020, 169, 106568. [Google Scholar] [CrossRef]
  14. Cabaleiro, M.; Riveiro, B.; Conde, B.; Caamaño, J.C. Analytical T-Stub Model for the Analysis of Clamps in Structural Metal Joints. J. Constr. Steel Res. 2017, 130, 138–147. [Google Scholar] [CrossRef]
  15. Pongiglione, C.M. Material Savings through Structural Steel Reuse: A Case Study in Genoa. Resour. Conserv. Recycl. 2014, 86, 87–92. [Google Scholar] [CrossRef]
  16. Liu, C.; Mao, X.; He, L.; Chen, X.; Yang, Y.; Yuan, J. A New Demountable Light-Gauge Steel Framed Wall: Flexural Behaviour, Thermal Performance and Life Cycle Assessment. J. Build. Eng. 2022, 47, 103856. [Google Scholar] [CrossRef]
  17. Groover, M.P. Fundamentals of Modern Manufacturing, 4th ed.; John Wiley & Sons: Hoboken, NJ, USA, 2010. [Google Scholar]
  18. Kalpakjian, S.; Schmid, S.R. Manufacturing Engineering and Technology, 6th ed.; Prentice Hall: Upper Saddle River, NJ, USA, 2006. [Google Scholar]
  19. Cabaleiro, M.; Conde, B.; Riveiro, B.; Caamaño, J.C. Analysis of Steel Connections with Girder Clamps According to the Bolt Preload. J. Constr. Steel Res. 2020, 168, 105866. [Google Scholar] [CrossRef]
  20. Cabaleiro, M.; Comesaña, R.; González-Gaya, C.; Caamaño, J.C. Analytical Model for the Fatigue Analysis of Steel Joints by Clamps According to the Lever Length. Materials 2021, 14, 7726. [Google Scholar] [CrossRef]
  21. Pongiglione, M.; Calderini, C.; D’Aniello, M.; Landolfo, R. Novel Reversible Seismic-Resistant Joint for Sustainable and Deconstructable Steel Structures. J. Build. Eng. 2021, 35, 101989. [Google Scholar] [CrossRef]
  22. Cavalheiro, F.N.; Cabaleiro, M.; Conde, B.; Cruz, Y. Elastic Structural Assessment of Clamp-Based Steel Beam-to-Column Connections for Reusable Steel Systems. Appl. Sci. 2025, 15, 5398. [Google Scholar] [CrossRef]
  23. Cavalheiro, F.N.; Cabaleiro, M.; Conde, B.; Bouzas, Ó. Clamp-Based Steel Connections for Structural Reusability: Experimental and Finite Element Analysis in the Elastic Range. Structures 2025, 75, 108767. [Google Scholar] [CrossRef]
  24. UNE-EN 1990:2019; Eurocode—Basis of Structural Design. Spanish Association for Standardization (UNE): Madrid, Spain, 2019.
  25. Usefi, N.; Sharafi, P.; Mortazavi, M.; Ronagh, H.; Samali, B. Structural Performance and Sustainability Assessment of Hybrid Cold-Formed Modular Steel Frame. J. Build. Eng. 2021, 34, 101895. [Google Scholar] [CrossRef]
  26. Brütting, J.; Desruelle, J.; Senatore, G.; Fivet, C. Design of Truss Structures through Reuse. Structures 2019, 18, 128–137. [Google Scholar] [CrossRef]
  27. Brütting, J.; Vandervaeren, C.; Senatore, G.; De Temmerman, N.; Fivet, C. Environmental Impact Minimization of Reticular Structures Made of Reused and New Elements through Life Cycle Assessment and Mixed-Integer Linear Programming. Energy Build. 2020, 215, 109827. [Google Scholar] [CrossRef]
  28. EN 1993-1-8:2024; Eurocode 3: Design of Steel Structures—Part 1–8: Joints. European Committee for Standardization (CEN): Brussels, Belgium, 2024.
  29. CYPE Ingenieros. Generador de Precios de la Construcción. Spain. Available online: http://www.generadordeprecios.info/#gsc.tab=0 (accessed on 2 February 2021).
  30. Cary, H.B.; Helzer, S.C. Modern Welding Technology; Pearson Prentice Hall: Upper Saddle River, NJ, USA, 2005. [Google Scholar]
  31. Argüelles Álvarez, R.; Argüelles Bustillo, R.; Arriaga Martitegui, F.; Argüelles Bustillo, J.M.; Atienza Reales, J.R. Steel Structures. Calculation 2; Bellido: Madrid, Spain, 2005. [Google Scholar]
  32. Llatas, C.; Soust-Verdaguer, B.; Passer, A. Implementing Life Cycle Sustainability Assessment during Design Stages in Building Information Modelling: From Systematic Literature Review to a Methodology Approach. Build. Environ. 2020, 182, 107164. [Google Scholar] [CrossRef]
  33. Johnston, R.P.; McGrath, T.; Nanukuttan, S.; Lim, J.B.; Soutsos, M.; Chiang, M.C.; Rahman, M.A. Sustainability of Cold-Formed Steel Portal Frames in Developing Countries in the Context of Life Cycle Assessment and Life Cycle Costs. Structures 2018, 13, 79–87. [Google Scholar] [CrossRef]
  34. Rezaei, F.; Bulle, C.; Lesage, P. Integrating Building Information Modelling and Life Cycle Assessment in the Early and Detailed Design Stages. Build. Environ. 2019, 153, 158–167. [Google Scholar] [CrossRef]
  35. UNE-EN 36526:2018; Structural Eurocodes. Basis of Structural Design. Spanish Association for Standardization (UNE): Madrid, Spain, 2018.
  36. UNE-EN 10034:1994; Hot-Rolled Structural Steel I and H Sections. Tolerances on Shape and Dimensions. Spanish Association for Standardization (UNE): Madrid, Spain, 1994.
  37. UNE-EN 10219-2:2019; Cold Formed Welded Structural Hollow Sections of Non-Alloy and Fine Grain Steels. Part 2: Tolerances, Dimensions and Sectional Properties. Spanish Association for Standardization (UNE): Madrid, Spain, 2019.
  38. Sotorrío Ortega, L.; García-Alvarado, R.; Rincón, L.; López-Mesa, B. Industrialized Construction and Sustainability: A Comprehensive Literature Review. Buildings 2023, 13, 2861. [Google Scholar] [CrossRef]
  39. Cervantes Puma, G.C.; Salles, A.; Turk, J.; Ungureanu, V.; Bragança, L. Utilisation of Reused Steel and Slag: Analysing the Circular Economy Benefits through Three Case Studies. Buildings 2024, 14, 979. [Google Scholar] [CrossRef]
  40. Žuvelek, V. Parametric Finite Element Analyses of Demountable Shear Connections in Steel–Concrete Composite Systems. Buildings 2024, 14, 324. [Google Scholar] [CrossRef]
  41. Cai, J.; Deng, Z.; Li, W. Numerical Study on Seismic Behavior of Demountable Joints Consisting of Reinforced Concrete Columns and Steel Beams. Buildings 2023, 13, 2558. [Google Scholar] [CrossRef]
Figure 1. Load-bearing structures of machines and facilities built with standard steel profiles.
Buildings 15 03651 g001
Figure 2. (a) Classic bolted joint. (b) Beam-to-column connection of IPE sections using clamps. (c) Beam-to-column connection of square hollow sections using flanges.
Buildings 15 03651 g002
Figure 3. Outline of the proposed methodology.
Buildings 15 03651 g003
Figure 4. (a) Structural calculation diagram. (b) Calculation data export.
Buildings 15 03651 g004
Figure 5. The nine different structures that are studied.
Buildings 15 03651 g005
Figure 6. Cost ratios of structures with IPE profiles and clamped joints depending on the structural configuration and the number of reuse cycles. The table in each graph shows the number of reconfigurations required to reach a cost ratio of 1. (a) All profiles with IPE 100. (b) All profiles with IPE 160. (c) All profiles with a load of 4.95 kN/m2.
Buildings 15 03651 g006
Figure 7. Absolute and relative economic savings for IPE profile and clamped joints depending on the structural configuration and the number of reused cycles. (a) Absolute savings for IPE100 in all profiles. (b) Absolute savings for IPE160 in all profiles. (c) Absolute savings for the same load of 4.9 kN/m2 in all profiles. (d) Relative savings for IPE100 in all profiles. (e) Relative savings for IPE160 in all profiles. (f) Relative savings for the same load of 4.9 kN/m2 in all profiles.
Buildings 15 03651 g007
Figure 8. Sustainability ratio for IPE profiles and clamped joints depending on the configuration of the structure and the number of reuse cycles. (a) For IPE100 in all profiles. (b) For IPE160 in all profiles. (c) For the same load of 4.9 kN/m2 in all profiles.
Buildings 15 03651 g008
Figure 9. Absolute and relative carbon and energy footprint savings for IPE profiles with clamped joints depending on the configuration of the structure made and the number of reused cycles. (a) Absolute savings for IPE100 in all profiles. (b) Absolute savings for IPE160 in all profiles. (c) Absolute savings for the same load of 4.9 kN/m2 in all profiles. (d) Relative savings for IPE100 in all profiles. (e) Relative savings for IPE 160 in all profiles. (f) Relative savings for the same load of 4.9 kN/m2 in all profiles.
Buildings 15 03651 g009
Figure 10. Total and relative accumulated cost according to the joint solution used for a given load and composition (3,2,2) (a) Absolute cost for 2.45 kN/m2. (b) Relative cost for 2.45 kN/m2. (c) Absolute cost for 9.8 kN/m2. (d) Relative cost for 9.8 kN/m2.
Buildings 15 03651 g010
Figure 11. Relative cumulative cost of single-span compositions in the Y direction according to the joining solution used and the determined load.
Buildings 15 03651 g011
Figure 12. Relative cumulative cost of two-span compositions in the Y direction according to the joining solution used and the determined load.
Buildings 15 03651 g012
Figure 13. Average relative cost of compositions of two spans in the Y direction according to the type of profile, joining solution used and determined load. (a) For small loads. (b) For large loads.
Buildings 15 03651 g013
Figure 14. Absolute and relative accumulated carbon footprint and energy consumed for a composition structure (3,2,2) and different charges depending on the joining solution used. (a) Absolute for 2.45 kN/m2. (b) Relative for 2.45 kN/m2. (c) Absolute for 9.8 kN/m2. (d) Relative for 9.8 kN/m2.
Buildings 15 03651 g014
Figure 15. Relative accumulated carbon footprint and energy consumed for different loads in single-span compositions in the direction of the Y axis depending on the joining solution used.
Buildings 15 03651 g015
Figure 16. Relative accumulated carbon footprint and energy consumed for different loads in two-span compositions in the direction of the Y axis depending on the joining solution used.
Buildings 15 03651 g016
Figure 17. Average accumulated carbon footprint and relative energy consumed according to the joining solution and profile used. (a) For small loads. (b) For large loads.
Buildings 15 03651 g017
Disclaimer/Publisher’s Note: The statements, opinions and data contained in all publications are solely those of the individual author(s) and contributor(s) and not of MDPI and/or the editor(s). MDPI and/or the editor(s) disclaim responsibility for any injury to people or property resulting from any ideas, methods, instructions or products referred to in the content.