Article

Intelligent Defect Recognition of Glazed Components in Ancient Buildings Based on Binocular Vision

1
China Academy of Building Research, Beijing 100013, China
2
CABR Testing Center Co., Ltd., Beijing 100013, China
3
School of Geomatics and Urban Spatial Informatics, Beijing University of Civil Engineering and Architecture, Beijing 102616, China
4
Beijing Key Laboratory for Architectural Heritage Fine Reconstruction & Health Monitoring, Beijing 100044, China
5
Engineering Research Center for Representative and Ancient Building Database of the Ministry of Education, Beijing 102616, China
6
International Joint Laboratory of Safety and Energy Conservation for Ancient Buildings, Ministry of Education, Beijing 100044, China
*
Author to whom correspondence should be addressed.
Buildings 2025, 15(20), 3641; https://doi.org/10.3390/buildings15203641
Submission received: 20 August 2025 / Revised: 11 September 2025 / Accepted: 30 September 2025 / Published: 10 October 2025
(This article belongs to the Section Building Materials, and Repair & Renovation)

Abstract

Glazed components in ancient Chinese architecture hold profound historical and cultural value. However, over time, environmental erosion, physical impacts, and human disturbances gradually lead to various forms of damage, severely impacting the durability and stability of the buildings. Therefore, preventive protection of glazed components is crucial. The key to preventive protection lies in the early detection and repair of damage, thereby extending the component’s service life and preventing significant structural damage. To address this challenge, this study proposes a Restoration-Scale Identification (RSI) method that integrates depth information. By combining RGB-D images acquired from a depth camera with intrinsic camera parameters, and embedding a Convolutional Block Attention Module (CBAM) into the backbone network, the method dynamically enhances critical feature regions. It then employs a scale restoration strategy to accurately identify damage areas and recover the physical dimensions of glazed components from a global perspective. In addition, we constructed a dedicated semantic segmentation dataset for glazed tile damage, focusing on cracks and spalling. Both qualitative and quantitative evaluation results demonstrate that, compared with various high-performance semantic segmentation methods, our approach significantly improves the accuracy and robustness of damage detection in glazed components. The achieved accuracy deviates by only ±10 mm from high-precision laser scanning, a level of precision that is essential for reliably identifying and assessing subtle damages in complex glazed architectural elements. By integrating depth information, real scale information can be effectively obtained during the intelligent recognition process, thereby efficiently and accurately identifying the type of damage and size information of glazed components, and realizing the conversion from two-dimensional (2D) pixel coordinates to local three-dimensional (3D) coordinates, providing a scientific basis for the protection and restoration of ancient buildings, and ensuring the long-term stability of cultural heritage and the inheritance of historical value.

1. Introduction

Glazed components have been utilized in ancient Chinese architecture for millennia, embodying significant historical and cultural value [1]. However, over time, glazed components progressively exhibit various forms of damage due to environmental erosion, physical impacts, and human interference [2]. The combined effects of factors such as temperature fluctuations [3], thermal expansion [4], and structural vibrations [5] can induce thermal expansion cracks or stress fractures in glazed components [6]. These cracks not only substantially weaken the structural integrity of the glazed components [7], but also ultimately lead to their rupture, severely compromising the durability and stability of the building [8]. Simultaneously, prolonged exposure to climate change and environmental factors [9] often results in the spalling of the surface of glazed components [10]. The spalling of the surface not only strips the glazed components of their original luster and decorative effect [11] but also diminishes the artistic expression and historical significance of the building, hindering the presentation of its original historical characteristics. Furthermore, as brittle materials, glazed components are susceptible to stress concentration under external forces, resulting in localized damage [12,13,14,15]. Particularly in areas subjected to heavy loads, glazed components may experience localized fractures or shattering due to uneven external forces or improper repair techniques [16], further compromising the overall structural stability of the building. This degradation of mechanical properties not only jeopardizes the physical safety of the building, but also threatens its historical authenticity and cultural significance [17,18]. In recent years, the field of international cultural heritage conservation has increasingly embraced digital technologies for refined monitoring and analysis. A series of studies, particularly in Europe, have widely adopted approaches such as Historic Building Information Modeling (HBIM) [19], multi-source photogrammetry [20], and multimodal imaging techniques—including infrared thermography and hyperspectral scanning [21] for the detection and long-term monitoring of surface damage in historic structures. By integrating information across different scales and physical properties, these methods have substantially improved the precision of damage identification and spatial localization, thereby enabling more systematic and sustained preservation strategies for historical heritage.
Despite the significant progress made in recent years in image-based computer vision approaches for damage identification and detection [22,23,24,25], particularly in achieving high-precision classification and localization through semantic segmentation and object detection techniques [26,27,28,29,30], most existing methods rely heavily on two-dimensional RGB images for feature extraction and pattern recognition [31,32,33]. This reliance introduces several critical limitations. Traditional RGB images only contain color and texture information, lacking true depth and spatial positioning attributes [34,35,36,37], which prevents the mapping of identified damages into real-world physical space. As a result, it becomes difficult to accurately quantify the actual width, length, and depth of damage features [38,39,40], thereby compromising the scientific validity and comparability of structural damage assessments [41]. Moreover, factors such as camera viewing angle, focal length, and imaging distance during image acquisition directly influence the pixel dimensions of targets in images, leading to scale inconsistencies across varying conditions [42]. This can result in false positives and missed detections in severe cases. Damage recognition models based solely on 2D imagery are inherently incapable of perceiving the geometric relationships between damages and structural surfaces. Consequently, they struggle to distinguish between superficial and structural penetrating damages and cannot support spatial tracking or modeling of damage paths. In real-world engineering contexts, the physical dimensions of damage are essential indicators for determining the degree of structural performance degradation, evaluating repair strategies, estimating restoration efforts, and formulating preventive conservation measures [43,44,45,46,47,48]. Image-only models lack the quantitative capabilities required for such tasks [49], which severely limits their practical value in high-precision damage detection scenarios [50,51,52]. Therefore, there is an urgent need to establish a methodological framework that integrates visual recognition with spatial reconstruction capabilities—one that combines image-based damage identification with depth maps, camera parameters, or point cloud data to recover the true three-dimensional scale of defects within physical space.
The contributions of this study are as follows:
  • Development of a Multi-Type Damage Dataset for Glazed Architectural Components. To address the diverse morphological characteristics and significant scale variations of surface damages, cracks and spalling on glazed architectural components, this study establishes a specialized dataset focusing on ancient glazed structures. In particular, it incorporates a full processing pipeline for detecting and analyzing the prevalent crack and spalling damages found on the Nine-Dragon Wall. This dataset provides a foundational resource for the digital monitoring and quantitative scale assessment of cultural heritage components.
  • Proposal of a Deep Learning-Based Detection Algorithm for Glazed Surface Damage with Complex Textures. This study designs a deep neural network architecture tailored for detecting damages in the intricate textures of glazed surfaces. The CBAM is integrated into the backbone network and applied to the output of each feature processing stage, enabling the model to learn highly discriminative and semantically rich features at early stages of extraction. This attention-enhanced architecture significantly improves feature representation capabilities and provides more accurate and robust semantic support for downstream damage detection tasks, ultimately achieving higher precision in image-based defect recognition.
  • Construction of a Depth Estimation and Scale Restoration Fusion Algorithm for Accurate 2D to 3D Mapping. Based on the depth information obtained from the detected damage regions, this study introduces a 3D coordinate back-projection method using pre-calibrated intrinsic camera parameters to transform the 2D pixel-based segmentation results into real-world physical space. This approach enhances the geometric accuracy of damage quantification and improves the spatial interpretability of the detection outcomes. It provides reliable and quantifiable 3D data support for subsequent tasks such as structural health analysis, restoration planning, and long-term monitoring of architectural heritage components.

2. Related Work

2.1. Traditional Methods

In the detection of structural deterioration in glazed components and similar heritage elements, traditional methods predominantly rely on manual inspection and contact-based measurements [53,54]. Such inspections are typically conducted by experienced conservation professionals using visual observation, manual measurement, and percussion-based auditory techniques to identify surface damages such as cracks and spalling. These methods are characterized by their simplicity and intuitive operation; however, the reliability of the results is highly contingent upon the inspector’s expertise and is often influenced by subjective judgment and environmental variability. This undermines the consistency and comparability required for long-term monitoring. Internationally, certain cultural heritage institutions have integrated auxiliary instruments—such as high-precision vernier calipers, crack width gauges, and optical microscopes [55,56,57]—into traditional inspection workflows to enhance measurement accuracy. Contact displacement sensors and handheld microscopic probes have also been employed. Nevertheless, these approaches face substantial limitations when applied to large-scale surfaces, structurally intricate components, or elevated positions. Challenges include low efficiency, high labor intensity, and the risk of inflicting secondary damage to delicate heritage materials. In China, architectural heritage conservation practices [58,59,60] similarly emphasize manual inspection supplemented by localized measurement. However, in the face of increasing demands for high-precision, rapid, and non-contact diagnostic techniques, the limitations of conventional methods are becoming increasingly pronounced.

2.2. Deep Learning Methods

With the rapid advancement of computer vision and artificial intelligence, deep learning–based image recognition techniques have been increasingly adopted in the detection of damage in cultural heritage components. Both domestic and international studies have employed convolutional neural networks (CNNs) [61], object detection models such as Faster R-CNN and the YOLO series [62,63], and semantic segmentation frameworks including U-Net, DeepLab, and the Mask R-CNN family [64,65,66], to enable automated identification and localization of defects such as cracks and spalling.
In the international context, earlier research primarily focused on structural damage in civil infrastructure, such as concrete and steel structures. For instance, some scholars combined Faster R-CNN with image enhancement strategies to improve crack detection performance under varying illumination conditions [67]. Others utilized multi-scale convolutional features and attention mechanisms to enhance the extraction of subtle damage patterns [68]. In China, research efforts have increasingly integrated practical needs from both civil engineering and cultural heritage conservation [69,70], leading to the development of lightweight and high-robustness detection models. Examples include the integration of YOLOv8 with feature pyramid networks (FPN) to improve the detection of small-scale damage features [71], as well as the incorporation of Transformer architectures or multi-modal data fusion approaches [72] to enable more comprehensive, data-driven damage recognition and condition assessment. However, existing deep learning approaches still face two major challenges when applied to heritage components. First, most models are based on monocular RGB imagery, lacking the ability to recover the true spatial dimensions of detected defects. Second, their adaptability remains limited when confronted with complex surface textures, lighting variations, and the coexistence of multiple types of damage.

3. Method

3.1. Technical Route for Automatic Damage Identification Method and Scale Restoration of Glazed Components

An automated processing flow integrating image recognition, depth perception, and scale restoration is developed for various types of damage features on the surface of glazed components, such as cracks, spalling, and missing parts. The process mainly involves the following steps: (1) binocular vision RGB-D image acquisition based on frame sequences; (2) semantic segmentation and instance recognition of damaged areas; (3) a fusion algorithm for depth estimation and scale restoration; and (4) 3D coordinate recovery based on internal and external camera parameters. By designing an end-to-end neural network structure, a precise mapping from 2D images to real-scale 3D space is achieved, ensuring geometric accuracy and spatial interpretability in damage detection. The technical roadmap is presented in Figure 1.

3.2. Binocular Vision System Data Acquisition and Enhancement

In this study, a calibrated binocular stereo vision system was employed to capture surface image data of glazed components from historic architecture. The stereo camera setup was calibrated by configuring a fixed baseline distance B and known focal length f, with parallel optical axes between the two cameras to minimize baseline error. An Intel RealSense D455f depth camera was utilized, the manufacturer of the Intel RealSense D455f is Intel. The company’s headquarters are located in Santa Clara, California, in the United States. The image synchronization was achieved through the RealSense SDK to ensure temporal alignment between RGB and depth images. The image acquisition was performed at a resolution of 1280 × 720 pixels and a frame rate of 30 fps. During data acquisition, intrinsic camera parameters were simultaneously extracted. These parameters, which include focal lengths, principal point coordinates, and distortion coefficients, describe the imaging model of the camera and are essential for establishing geometric correspondences between image coordinates and 3D spatial coordinates. These intrinsic parameters provided the foundational input for subsequent image registration and scale recovery processes.
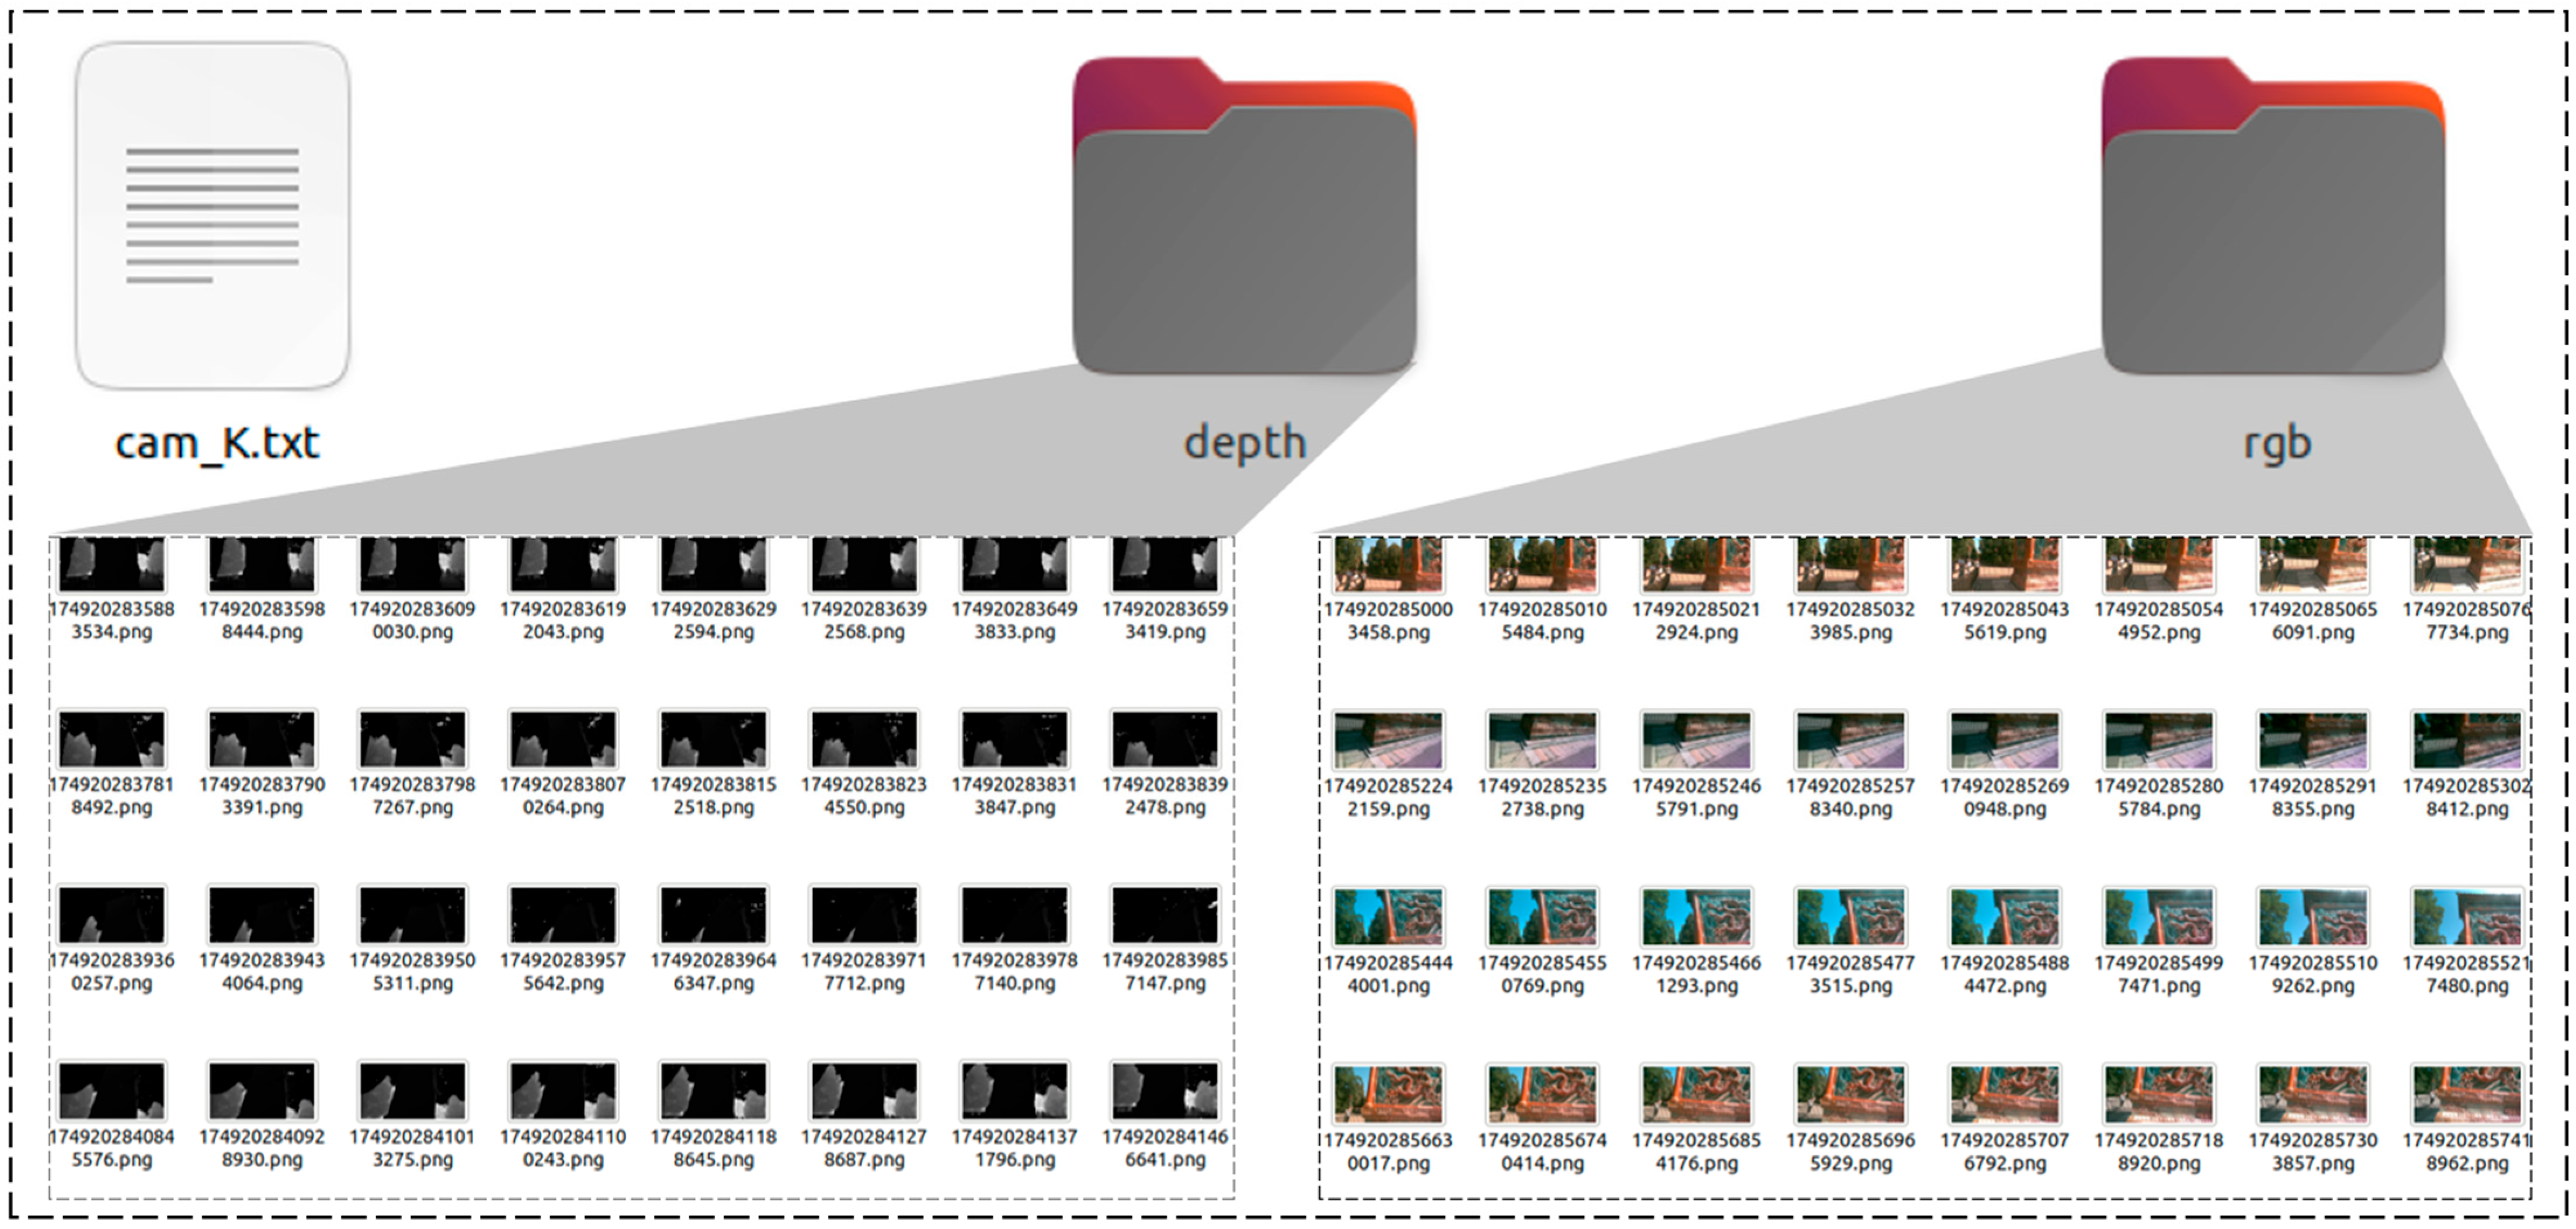
The image acquisition was conducted at the glazed Nine-Dragon Wall in Beihai Park, Beijing, a representative example of traditional glazed architectural components. This structure, characterized by outdoor glazed decorative surfaces, is particularly prone to damage such as cracking and spalling at the lower sections due to stress concentration. Image pairs were captured from multiple reasonable viewpoints and distances within the visible range of the glazed wall to ensure spatial diversity and enhance the generalization capability of the model in real-world scenarios. The collected dataset consists of time-stamped synchronized RGB-D image pairs and the corresponding intrinsic calibration matrices, serving as the data foundation for image registration, scale restoration, and 3D damage recognition tasks. Furthermore, to improve recognition robustness in low-texture regions, structured light projection was incorporated during acquisition to enhance the visibility of surface texture features. A schematic diagram of the acquired data is shown in Figure 2.
Figure 3 presents a point cloud model of the entire Nine Dragon Wall, scanned and reconstructed using a FARO Premium scanner. This point cloud accurately represents the surface geometry and detailed information of the component, with its density and distribution effectively illustrating the component’s complex structure. Using image registration and point cloud fusion technologies, image data from different perspectives were successfully converted into a high-precision 3D point cloud model, laying the groundwork for subsequent analysis and processing.

3.3. Scale Uncertainty Analysis

Because image processing is inherently pixel-based, missing scale information is a key issue affecting geometric reconstruction accuracy. This paper solves the scale uncertainty problem by restoring the scale method. Baseline error in a binocular system significantly impacts depth estimation. The depth estimation and coordinate transformation formula for a binocular system is based on parallax d = xlxr, where xl and xr are the pixel values of the left and right images at the same timestamp. The depth value is calculated as follows:
Z = f B d
Subsequently, each pixel coordinate (u, v) in the depth image was back-projected into real-world three-dimensional coordinates (X, Y, Z) by integrating the depth image with the intrinsic parameters of the calibrated camera. This inverse projection follows the pinhole camera model, enabling accurate mapping from the 2D image plane to the 3D physical space. The transformation is described by the following equations:
X = ( u c x ) Z f x Y = ( v c y ) Z f y
where (cx, cy) are the coordinates of the principal point in the image, and fx, fy are the focal lengths.
The core principle for calculating the real-world size and distance of a lesion is to convert the pixel size in the 2D image into physical dimensions in 3D space using the camera’s intrinsic parameters and the object’s depth information. The dynamically scaled focal length (fx, fy) is dynamically adjusted based on the ratio of the current image resolution to the native resolution. Calculating the pixel-to-meter conversion factor. With the average depth and the adjusted focal length, a crucial conversion factor can be calculated: the real-world size per pixel. This factor represents the physical distance represented by a pixel at the lesion’s depth. The formula for this conversion factor is as follows:
meters _ p e r _ p i x e l = Z a v g f a v g
where Zavg is the average depth of the damage, and favg is the average focal length after dynamic scaling. To calculate the true size, with the meters_per_pixel conversion factor, simply multiply the pixel measurement by this factor to obtain the true size in meters. Pixel-level size measurement first extracts the exact pixel outline of the damage, then uses the minimum bounding rectangle to obtain the length pixels and width pixels of the damage, which are then converted to true size using the following formula:
l e n g t h _ m e t e r = l e n g t h _ p i x e l s × m e t e r s _ p e r _ p i x e l width _ m e t e r = width _ p i x e l s × m e t e r s _ p e r _ p i x e l
In addition to the size, the coordinates of the center point of the damage in 3D space (X, Y, Z) are also calculated. The pixel center point of the damage on the image (center_x_px, center_y_px) is calculated using the image moment. Then, the real-world three-dimensional coordinates were computed using geometrically derived back-projection formulas, by integrating the pixel centroid, average depth, and the intrinsic parameters of the camera.
X = ( c e n t e r _ x _ p x c x ) Z a v g f x Y = ( c e n t e r _ y _ p x c y ) Z a v g f y Z = Z a v g
By obtaining a pixel-level segmentation mask, using the depth map to obtain the average depth, and combining it with camera intrinsic parameters, the pixel size and position are accurately converted to real-world physical dimensions and 3D coordinates.

3.4. Design of Scale Restoration Algorithm

Existing object recognition algorithms treat all feature channels and spatial locations equally during feature extraction, without prioritizing important information and regions. To effectively enhance the representational capacity of critical regions while maintaining computational efficiency, the CBAM was adopted. CBAM applies attention mechanisms sequentially along the channel and spatial dimensions of feature maps, enabling dynamic weighting of salient features across multiple levels. Compared with other attention mechanisms, CBAM offers a lightweight structure with low computational overhead and demonstrates superior performance in improving model accuracy, making it particularly suitable for fine-grained damage recognition tasks. In this study, CBAM are integrated into the backbone network and applied to the output of each C2f module. This integration allows the network to learn more discriminative features at the early stages of feature extraction, thereby providing more accurate and semantically meaningful representations for subsequent detection and segmentation tasks.
To achieve damage recognition from images to real-world spatial scales, this study designed a deep neural network architecture incorporating a scale restoration module. The overall framework consists of the following modules: We propose the Restore Scale Identification (RSI) object detection method, which can be divided into three parts: a backbone feature extraction module, a neck feature fusion module, and a head detection output module. First, the input image undergoes multiple layers of convolution (Conv) followed by a feature extraction module (C2f) to gradually extract multi-scale semantic features. An attention mechanism is introduced at the end to enhance the recognition of fine-grained features, such as damage. The neck layer employs a multi-layer upsampling and feature concatenation strategy to fuse feature information from different levels, thereby enhancing small object detection capabilities. Finally, a multi-scale detection branch, Detect, is placed in the Head part to output the bounding box (Bbox), category (Cls), and loss function supporting multi-target, high-precision damage identification tasks.
Figure 4 shows the internal structure of the CBAM, which enables neural networks to dynamically focus on important features. CBAM consists of two serially connected submodules: a Channel Attention Module (CAM) and a Spatial Attention Module (SAM). The CAM inputs a feature map F of size H × W × C. After processing by the CBAM, an enhanced feature map F’’ of size H × W × C is generated. The CAM then performs global max pooling and global average pooling on the feature map F, generating two feature vectors of size 1 × 1 × C. These two feature vectors share a multi-layer perceptron (MLP). The MLP consists of a dimensionality reduction layer, a ReLU activation function, and a dimensionality increase layer. The outputs of the MLP are element-wise summed and then passed through a sigmoid activation function to generate a channel attention weight vector Mc of size 1 × 1 × C. The output is a channel-weighted feature map F’, calculated as follows:
F = M c F
The spatial attention module (SAM) inputs the channel-weighted feature map F′, performs maximum pooling and average pooling on F′ in the channel dimension, and obtains two feature maps of size H × W × 1. These two feature maps are concatenated to obtain a feature map of size H × W × 2. A standard convolution layer is applied to this concatenated feature map. Finally, after passing the Sigmoid activation function, a spatial attention weight map Ms of size H × W × 1 is obtained. The final enhanced feature map F″ is output. The calculation method is:
F = M s F

4. Result and Discussion

4.1. Dataset Creation

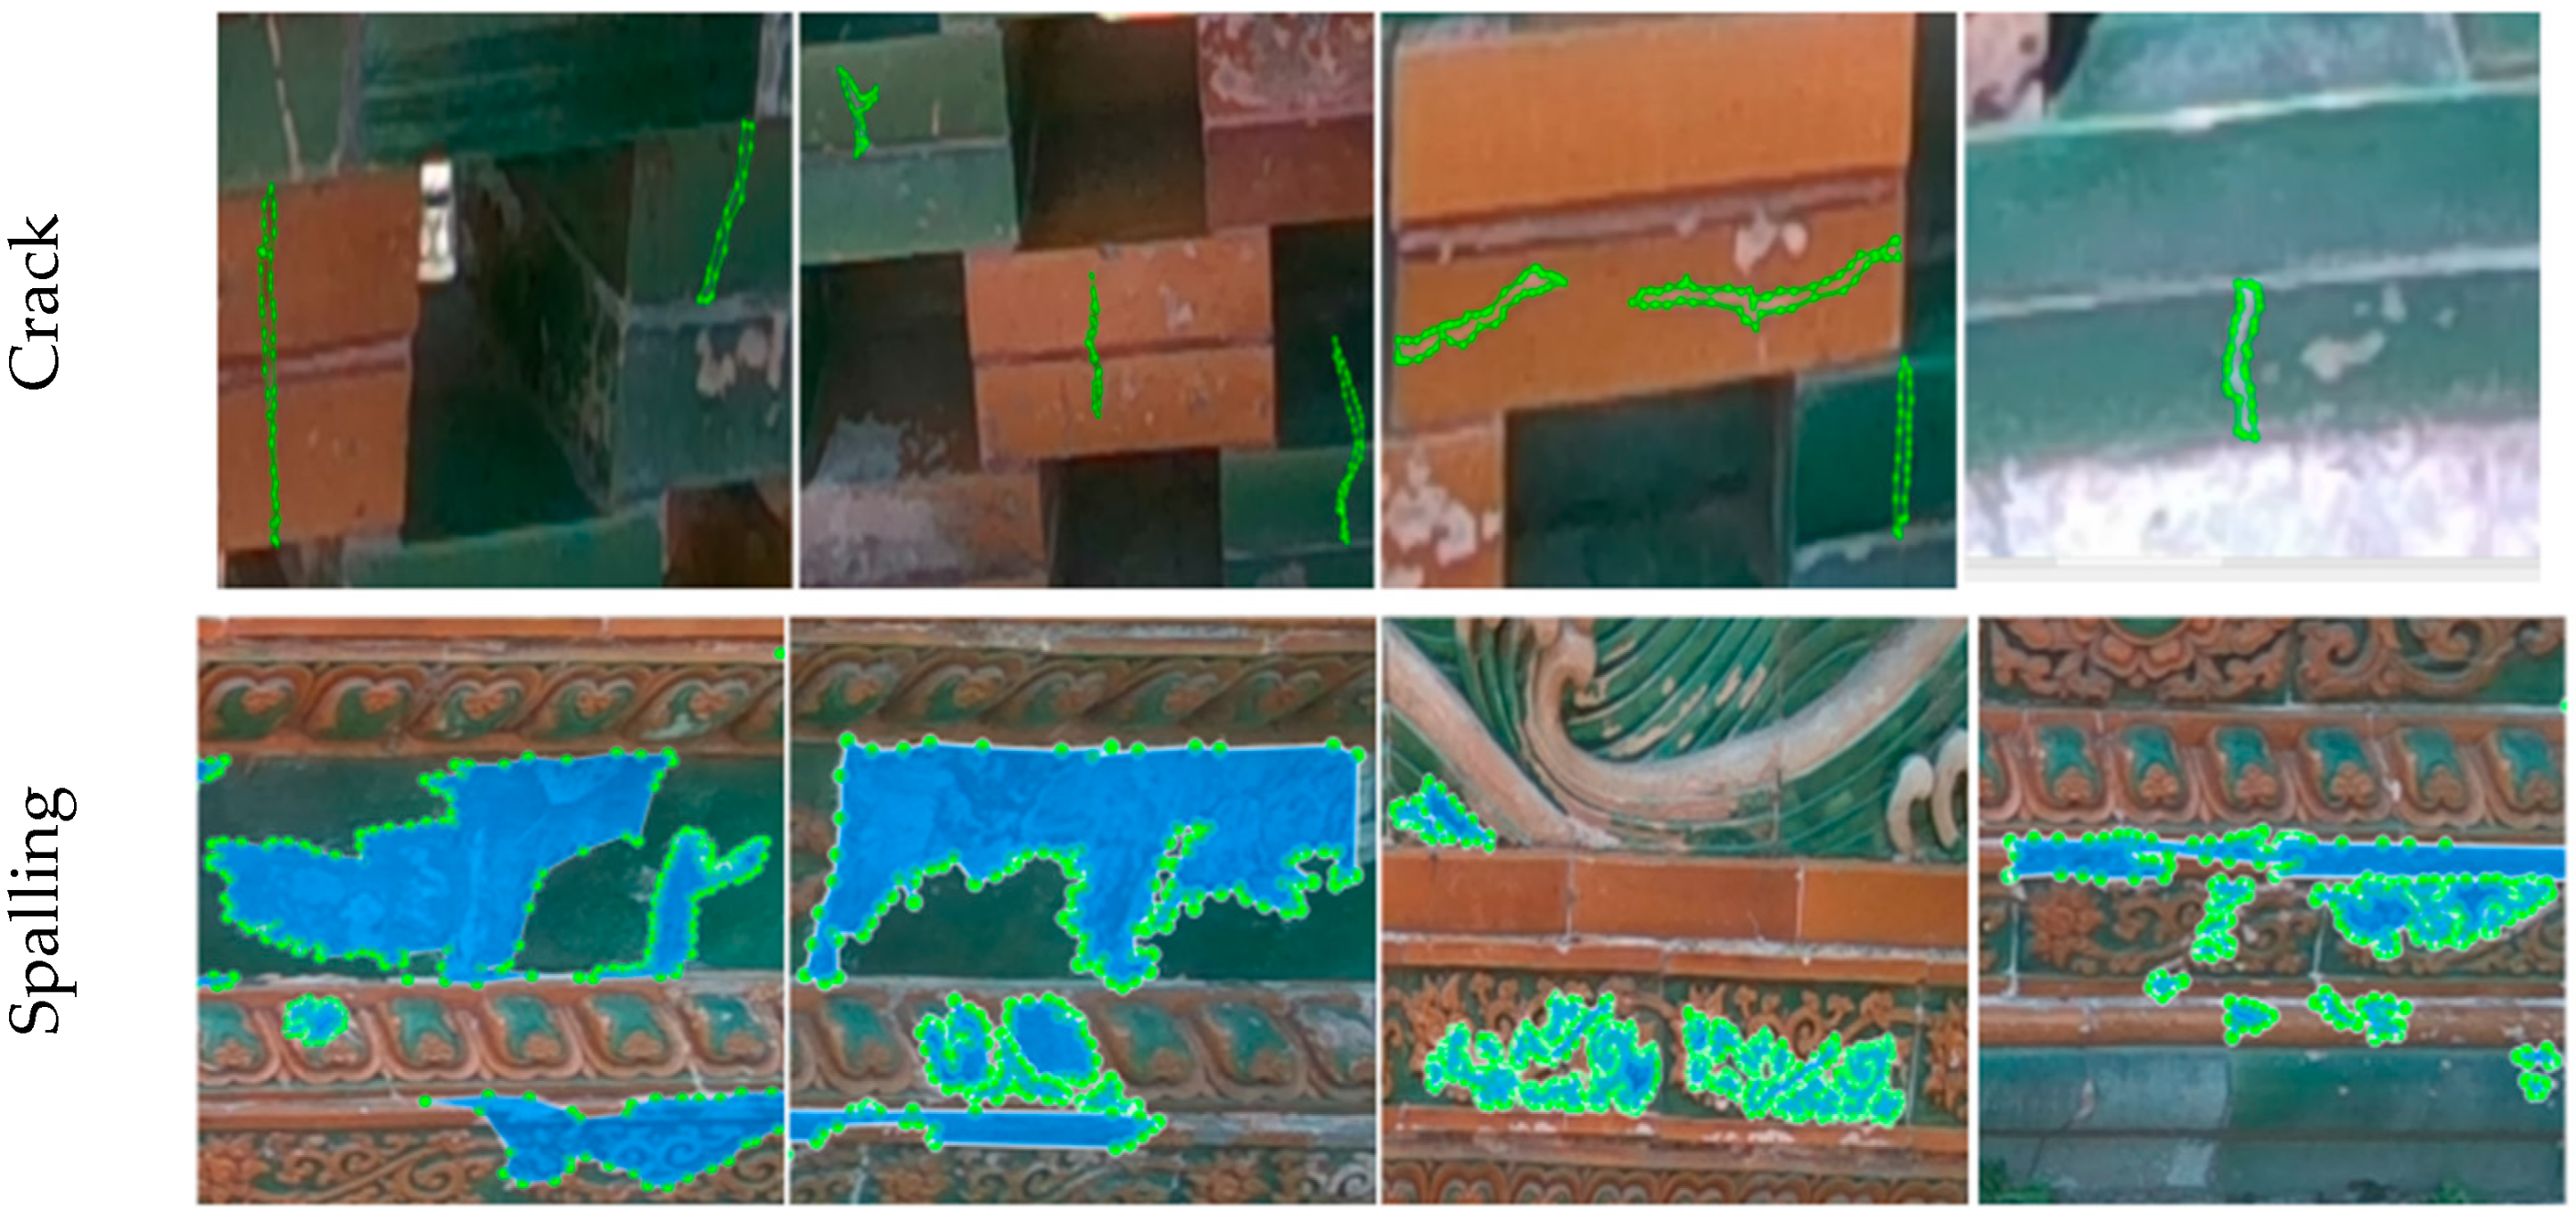
The depth camera system is employed to acquire RGB images from the left camera as the primary input for damage detection, with depth images temporally synchronized via timestamp alignment. Both intrinsic and extrinsic camera parameters are recorded to facilitate subsequent 3D coordinate reconstruction. A custom dataset, named the Semantic Segmentation Dataset of Glazed Tile Damage Images (sS-DGDID), was constructed by manually annotating regions of cracks, spalling, and material loss using the Labelme v5.1.0, with semantic polygon labels assigned as liefeng (crack) and tuoluo (spalling). Background regions were also labeled to assist the model in distinguishing between damaged and undamaged areas. In total, 3472 usable RGB images were collected, covering the main structure of the Nine-Dragon Wall and surrounding glazed architectural elements. These images were captured from diverse and strategically chosen viewpoints and distances to ensure comprehensive spatial coverage of component distribution and damage states, thereby enhancing the spatial generalization ability of the model. The dataset was partitioned into 70% for training, 20% for validation, and 10% for testing, as illustrated in Figure 5.

4.2. Dataset Train

The RSI architecture was designed by incorporating both attention mechanisms and a scale restoration branch. The training experiments were conducted on a platform equipped with an Intel Core i9-13900KF CPU, NVIDIA RTX 4090 desktop GPU (24 GB VRAM), running Ubuntu 22.04 LTS with Python 3.10, PyTorch 2.0, and CUDA 11.8. Taking into account both model accuracy and GPU memory constraints, the optimal configuration was determined through iterative training and hyperparameter tuning. The input image size was set to 640 × 640 pixels, and the batch size was fixed at 16. To mitigate overfitting and improve convergence stability, the Adam optimizer was employed with an initial learning rate of 0.001 and a learning rate decay factor of 0.75. The total number of training epochs was set to 300. Loss functions were defined as a weighted combination of classification loss (BCE Loss) evaluated using Precision and Recall, bounding box regression loss (CIoU Loss) assessed by IoU, and segmentation loss (Dice Loss) evaluated using F1 score, IoU, and Recall. The training process required approximately 12 h, and the average inference time per image was around 40 ms. The detailed hyperparameter settings are summarized in Table 1.
The intersection over union (IOU) is used to measure the degree of overlap between the predicted area and the true area:
I O U = T P T P + F P + F N
TP: The number of pixels predicted to be positive and actually positive (True Positive); FP: The number of pixels predicted to be positive but actually negative (False Positive); FN: The number of pixels predicted to be negative but actually positive (False Negative).
Precision is used to measure how many of the samples predicted to be positive are actually positive samples:
Precision = T P T P + F P
Recall is used to measure how many of the truly positive samples are correctly predicted as positive:
Recall = T P T P + F N
The comprehensive evaluation F1-score combines Precision and Recall, and the formula is as follows:
F 1 = 2 × Precision × Recall Precision + Recall
It is the harmonic mean of Precision and Recall. The closer F1 is to 1, the better the model finds the majority of positive examples and ensures that the majority of predicted positive examples are correct. If Precision is high but Recall is low, or if Recall is high but Precision is low, the F1-score will be significantly lower. In tasks with an imbalanced sample class, the F1-score better reflects the model’s true performance than Precision or Recall alone.

4.3. Damage Identification Results and Discussion

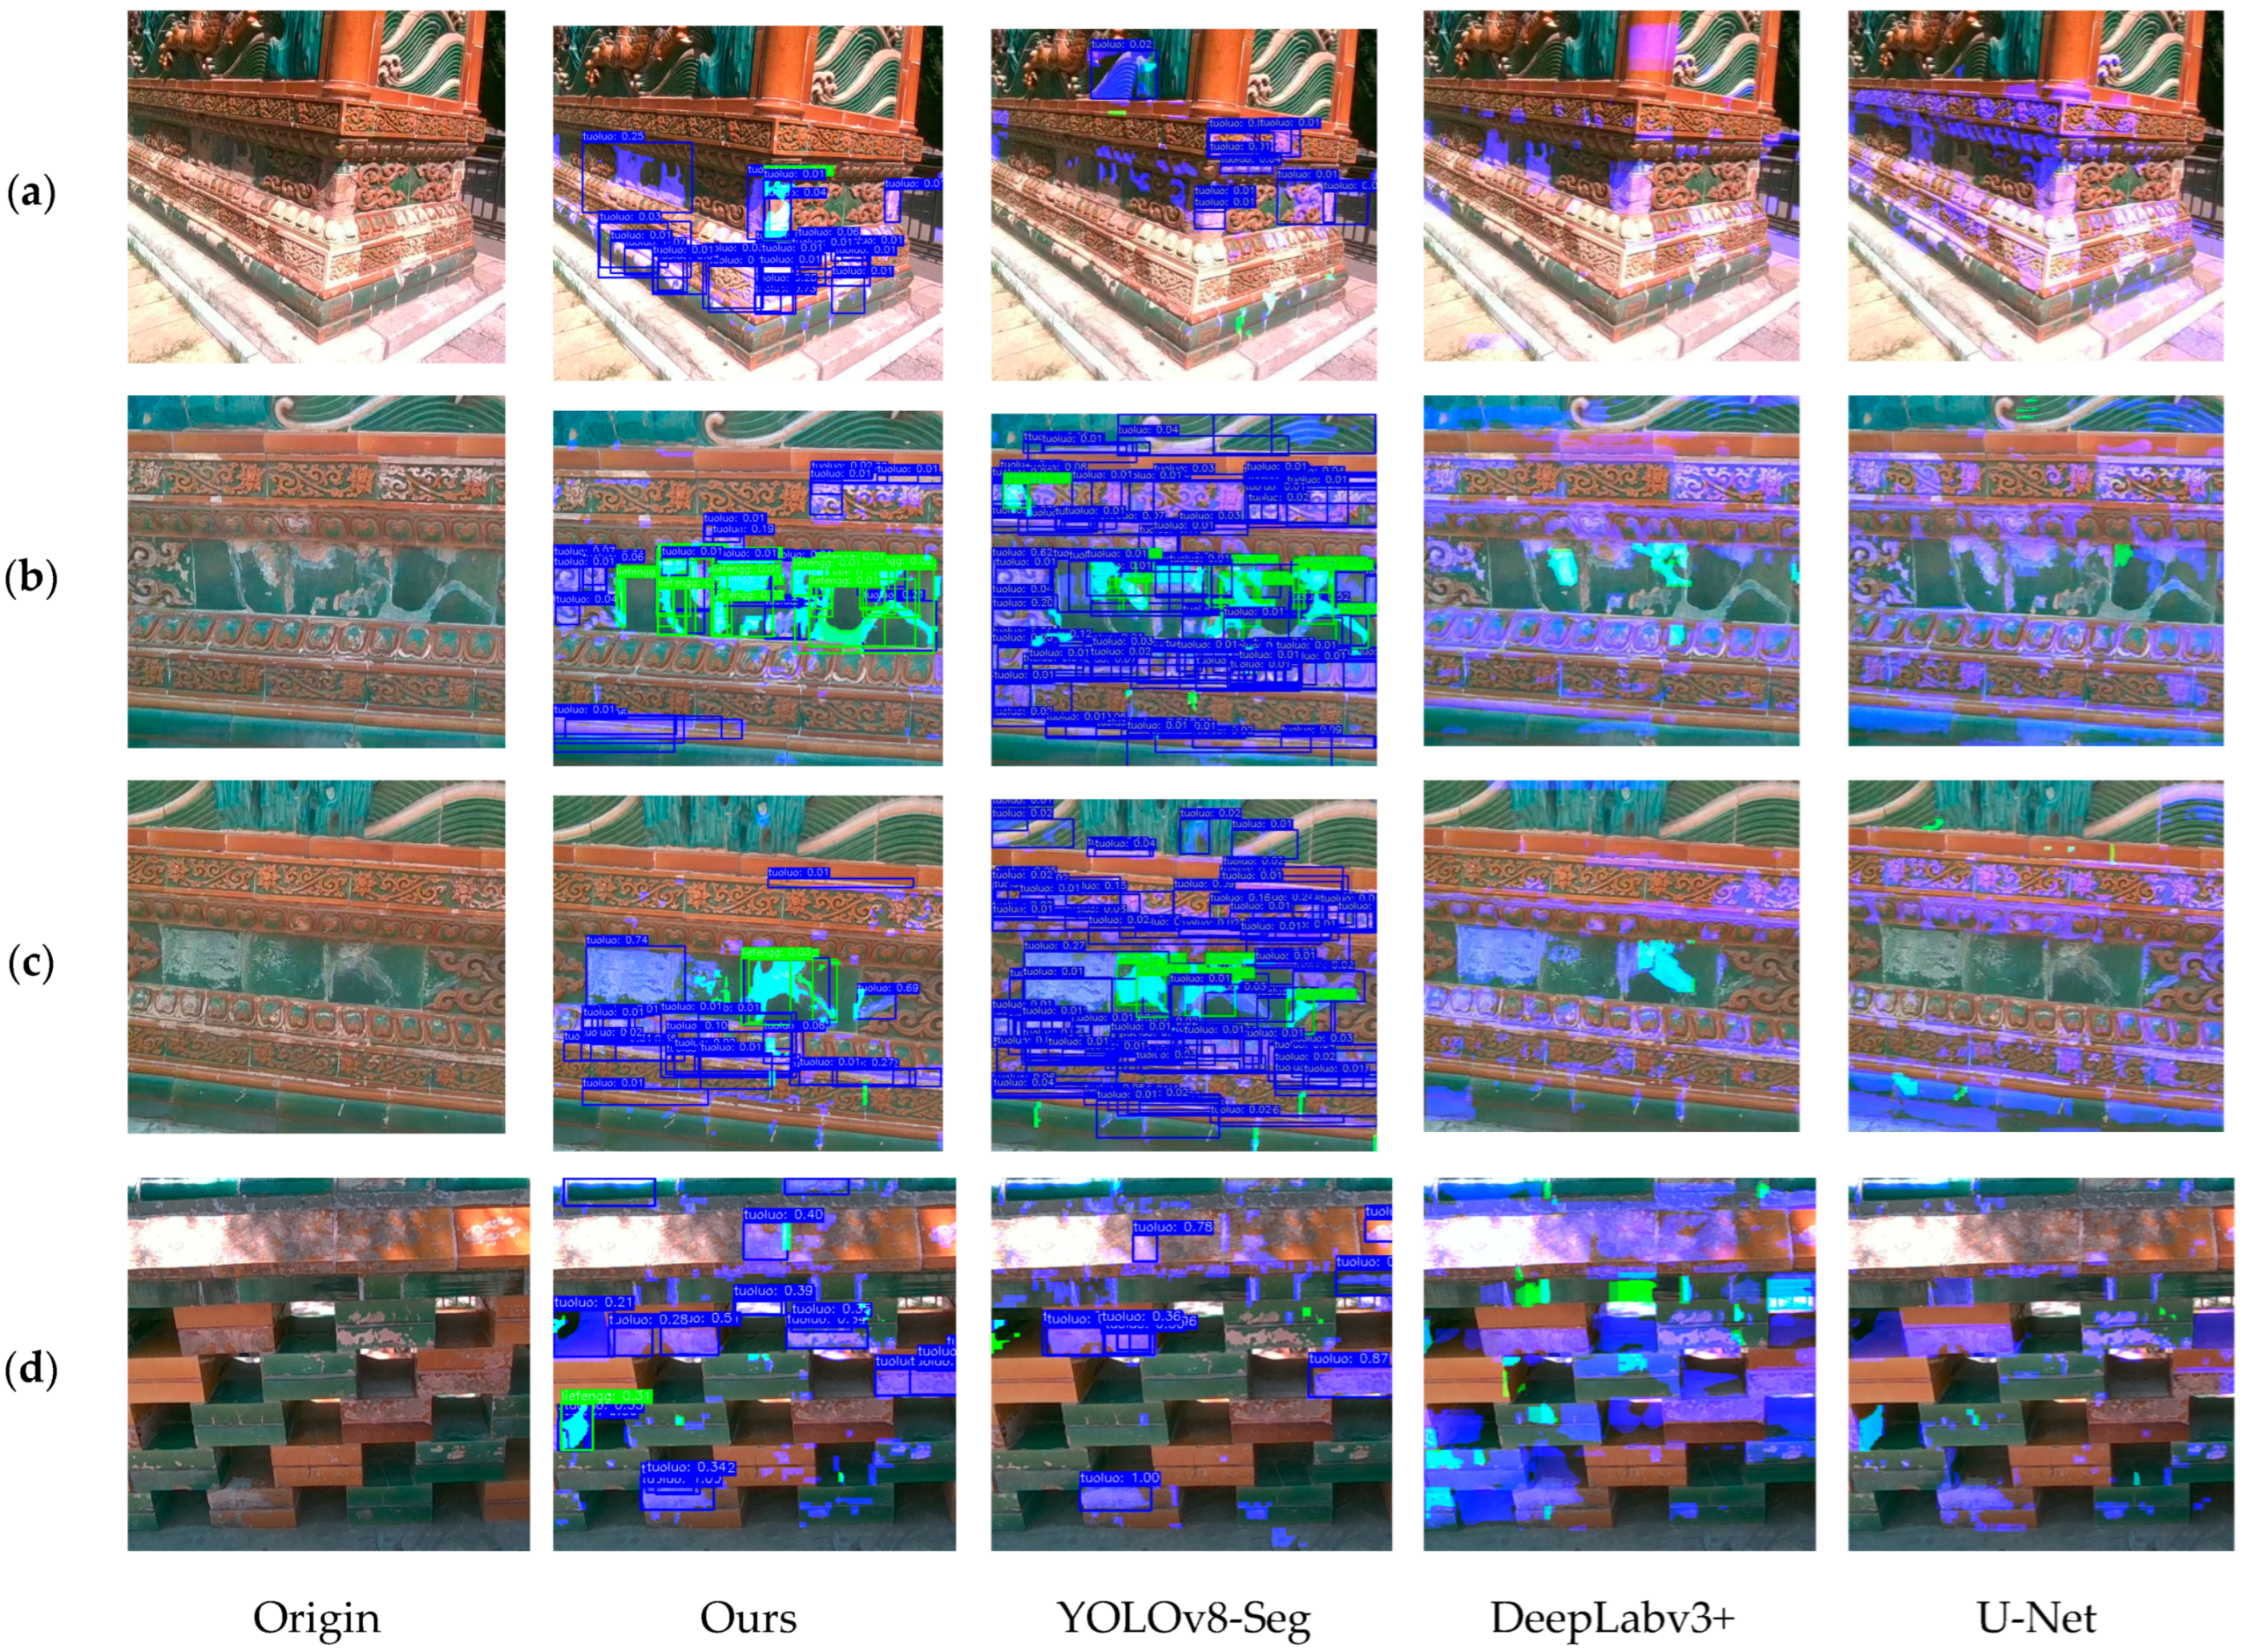
To verify the effectiveness of the proposed method for damage identification and scale restoration of glazed components, this section conducts experimental analysis based on the collected binocular RGB-D data. The detection results for multiple types of damage, including cracks and spalling, are visualized and evaluated. First, semantic segmentation results from different test samples are compared to analyze the network’s performance under complex texture backgrounds and its ability to preserve contour integrity. Subsequently, using the 3D size calculated from depth information, the scale restoration accuracy of the detection results is quantitatively validated. As shown in Table 2, the accuracy of the proposed method improves by 19.1%, 16%, and 8.7% respectively, compared with the other three methods. As can be seen from the figure, compared with YOLOv8-Seg in Figure 6a, the upper area is incorrectly identified as blue-colored spalling. In the middle area, the green-colored cracks are misclassified as blue-colored spalling, and in the lower part, multiple damage areas are not detected at all. In Figure 6b, the green cracks in the middle region are not fully recognized by YOLOv8-Seg; some parts are missed, and the upper part of the image shows misclassification of undamaged areas as cracks. In Figure 6c, both the upper and middle regions exhibit misclassifications, such as spalling areas being mistaken for green cracks in the middle area. In Figure 6d, misclassifications and missed detections are also observed. Compared with the proposed method, DeepLabv3+ also shows incorrect and missed detections: In Figure 6a, there are both misclassified regions and completely undetected damage areas. In Figure 6b, the number of correctly recognized areas is significantly fewer than that achieved by the proposed method. In Figure 6c, there is misclassification in the middle area. In Figure 6d, the results exhibit false positives. Compared with the proposed method, U-Net demonstrates even more areas with incorrect classification and failure to detect damage.
Although these three methods show relatively good recognition performance in some areas, they still suffer from false and missed detections. These errors are mainly due to the inadequate handling of local features under complex textures by YOLOv8-Seg, the atrous convolution module DeepLabv3+, and the traditional encoder-decoder-based U-Net. This is particularly evident in locating tiny damages with complex morphology and blurry edges, which are difficult to identify. In contrast, the proposed method incorporates CBAM, which enhances attention to damage areas under complex textures and backgrounds by dynamically weighting important regions. This significantly mitigates issues of false detection and missed detection, thus validating the advantage of the proposed method in fine-grained damage recognition. The experimental validation demonstrates that, after the introduction of the attention mechanism, the proposed method achieves more accurate identification of the two damage categories and reduces the probability of misclassification. Results are shown in Table 2, and the visualized outcomes are presented in Figure 6.

4.4. Scale Restoration Accuracy Evaluation

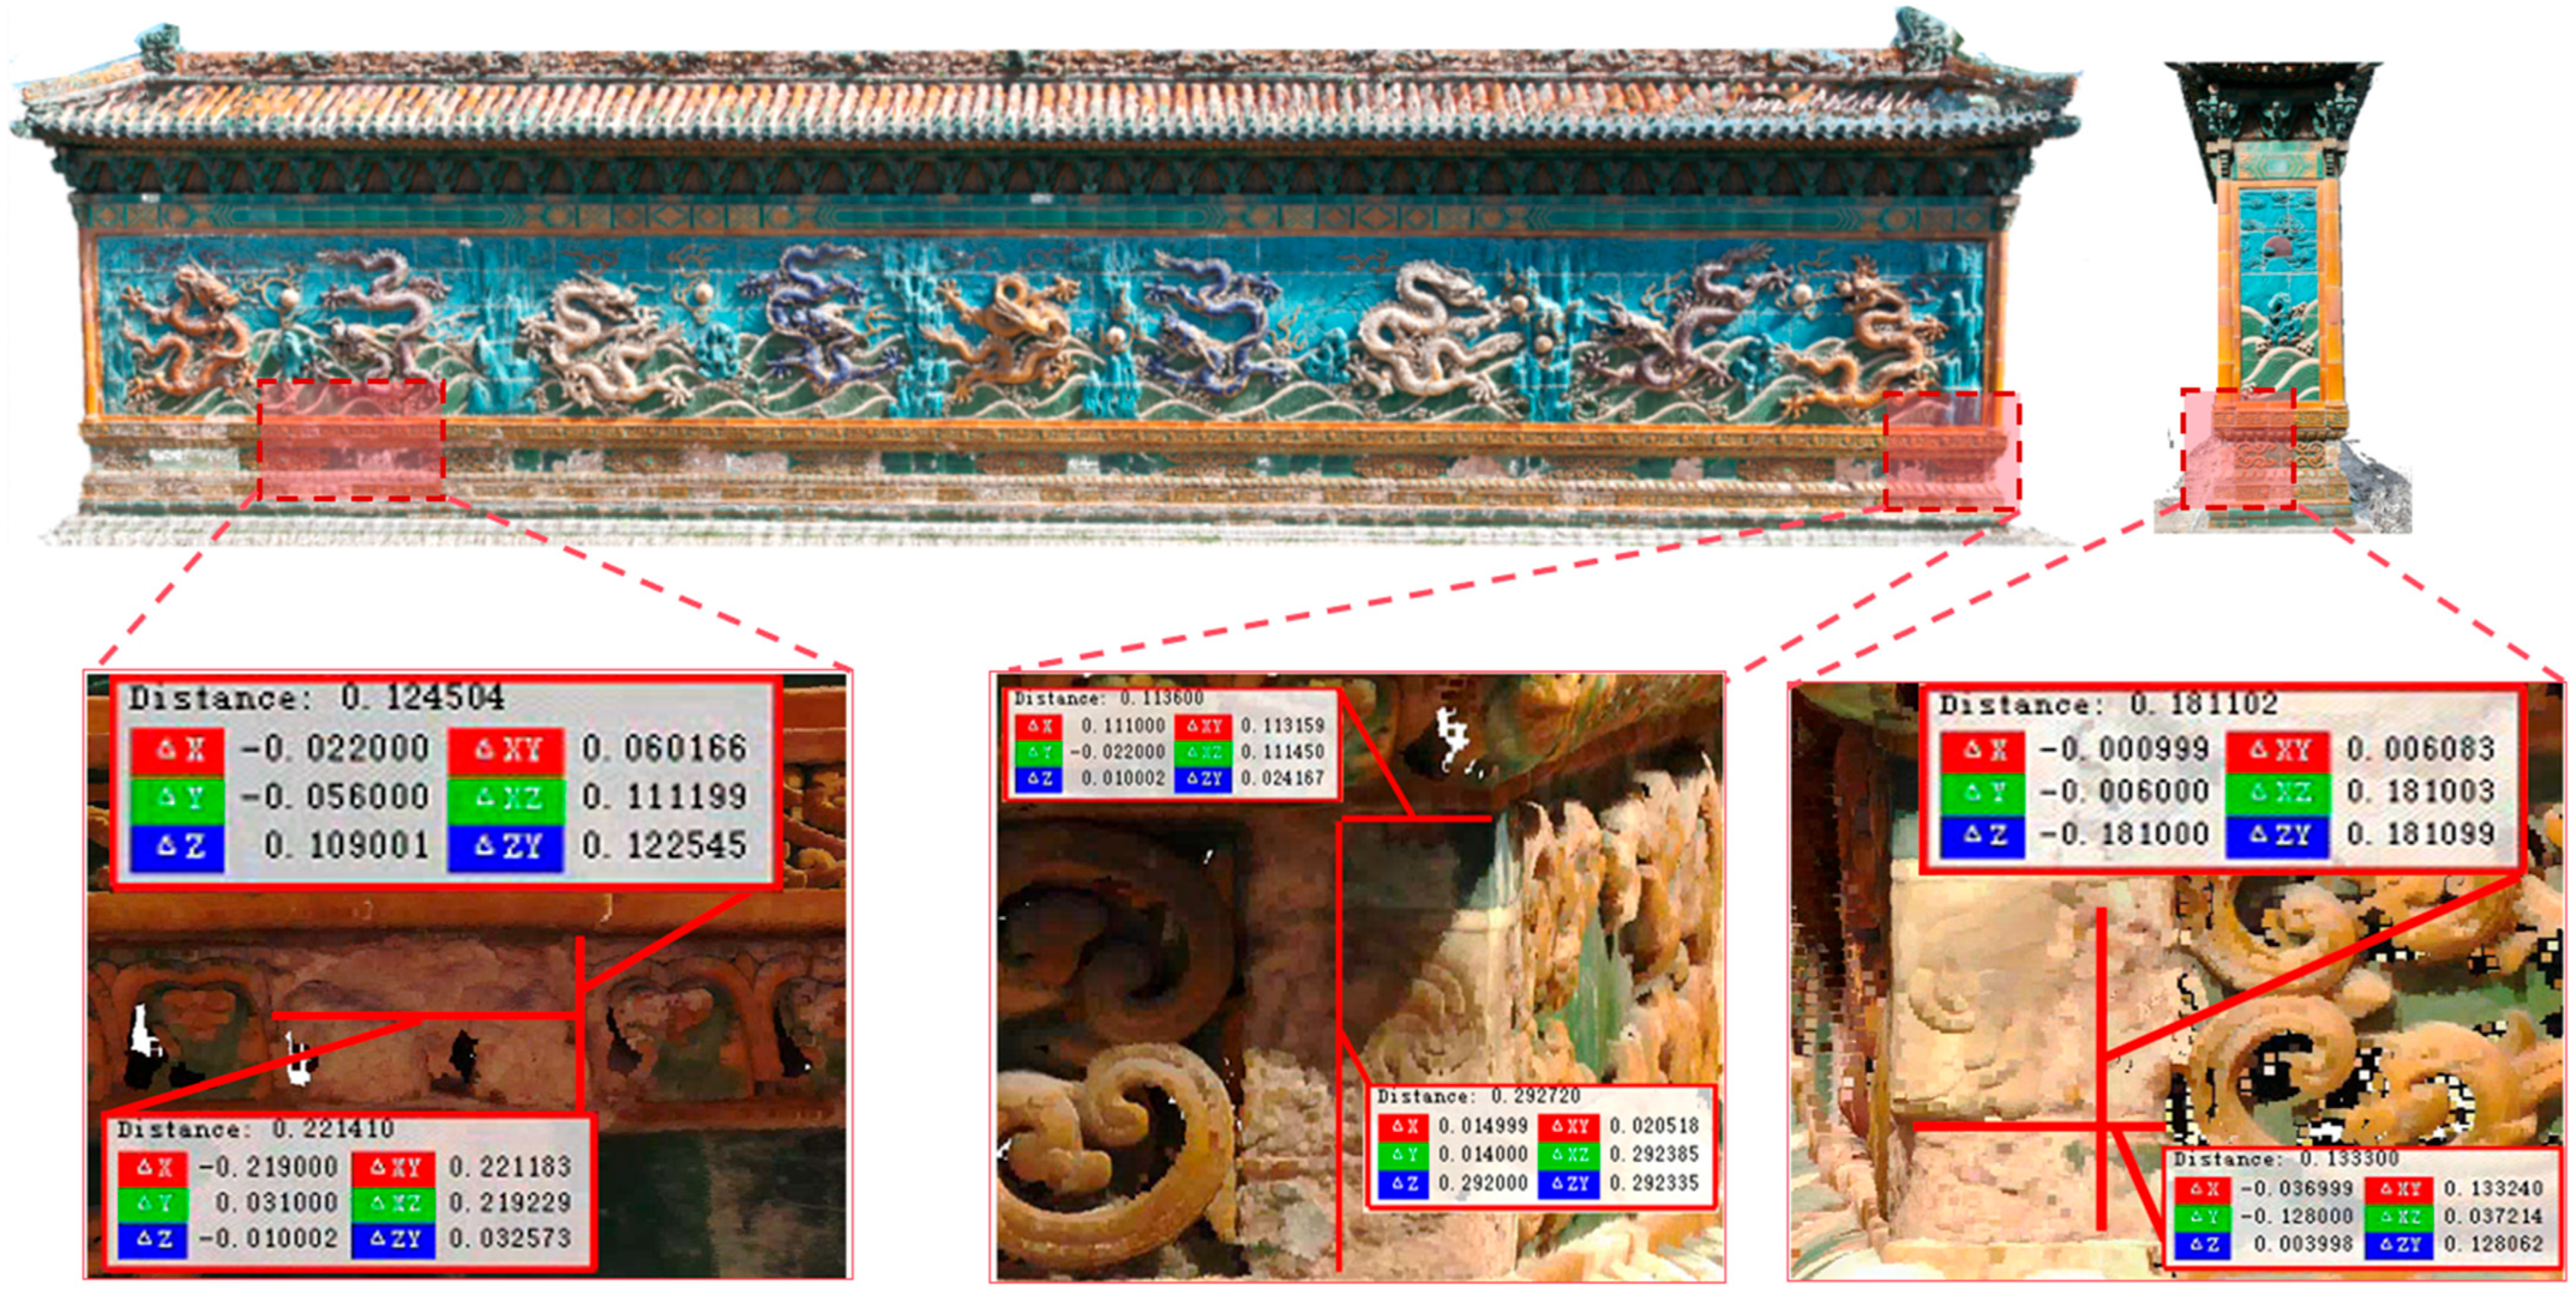
For data collection on the Nine Dragon Wall, a ground-based 3D LiDAR. The FARO Premium is manufactured by FARO Technologies, Inc., which is headquartered in Lake Mary, Florida, USA. FARO Premium was used for high-precision data collection. The scanner settings were: color scanning, 10 min per station, and a total of 16 stations. After the scanning stations were stitched together, the maximum error of the 3D laser point cloud was within 4 mm, the overall stitching accuracy was 1.4 mm, and the point cloud density was 800,000 points/m2. The damage to each part was measured and visualized as shown in Figure 7.
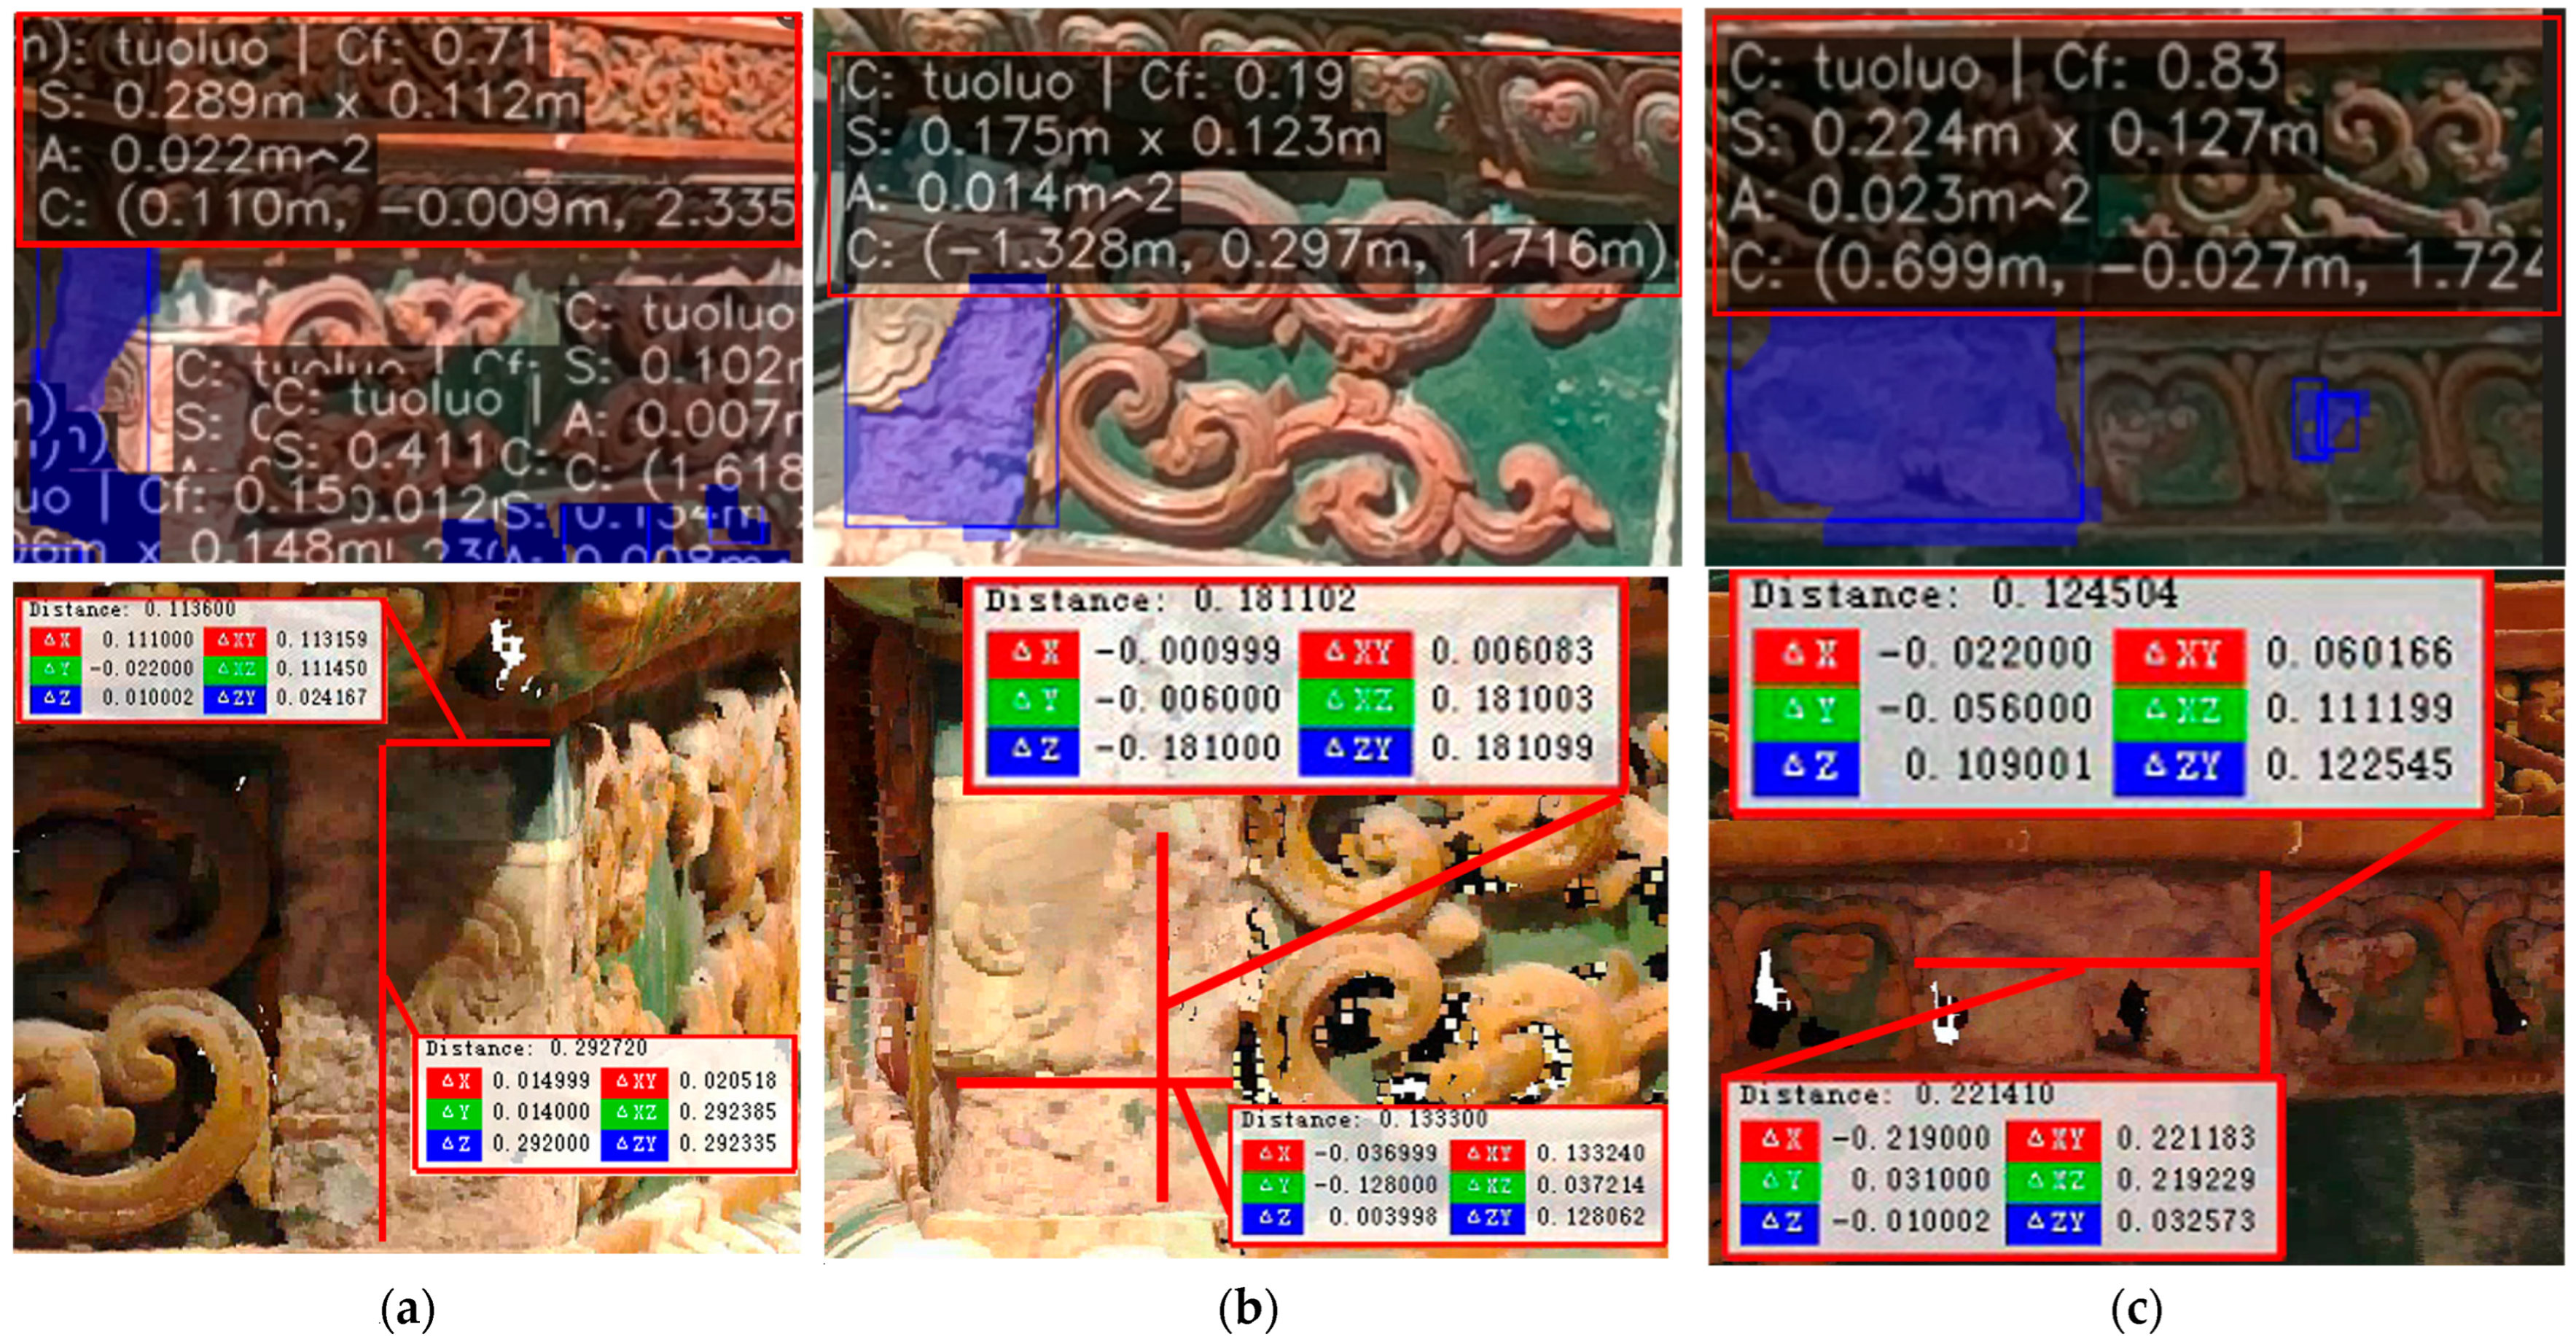
The actual size results identified by the depth camera are compared with the measured FARO 3D LiDAR point cloud, which is used as the true value of the scale for comparison. Several damages are compared, as shown in Figure 8.
After analyzing the predicted results against the ground truth acquired from 3D LiDAR point cloud measurements, it was found that the discrepancy between the two remained within ±10 mm. A deeper analysis revealed that the residual error primarily originated from the following sources: First, the inherent accuracy limitations of the depth camera may introduce slight deviations in local regions. Second, during the image segmentation process, edge effects and the smoothing of damage boundaries could lead to inaccuracies in delineating the extent of damage. Third, variations in material reflectance may affect the precision of depth acquisition, thereby introducing additional measurement errors. Despite these factors, the proposed method is still capable of effectively predicting the 3D information of surface damages. The trained model successfully generates high-quality, pixel-level damage masks, providing accurate inputs for subsequent geometric computations. Through the implementation of preprocessing techniques such as median filtering and smoothing, noise and outliers in the depth images were effectively suppressed, ensuring the reliability of average depth estimation. Additionally, the scale restoration algorithm dynamically adjusts the intrinsic parameters of the camera based on image resolution, mitigating measurement errors caused by image resizing and enhancing the robustness of the calculations.
An error level within ±10 mm is considered relatively high accuracy in conventional visual scale estimation methods, and it holds practical significance for the restoration and conservation of glazed components in architectural heritage. Damage in glazed tiles typically manifests as fine cracks or micro-spalling localized to small regions. Within this ±10 mm margin, the method can effectively support preliminary repair planning, component size estimation, and reconstruction of missing areas, particularly in scenarios where high-precision laser scanning is not feasible. The computational results are summarized in Table 3.
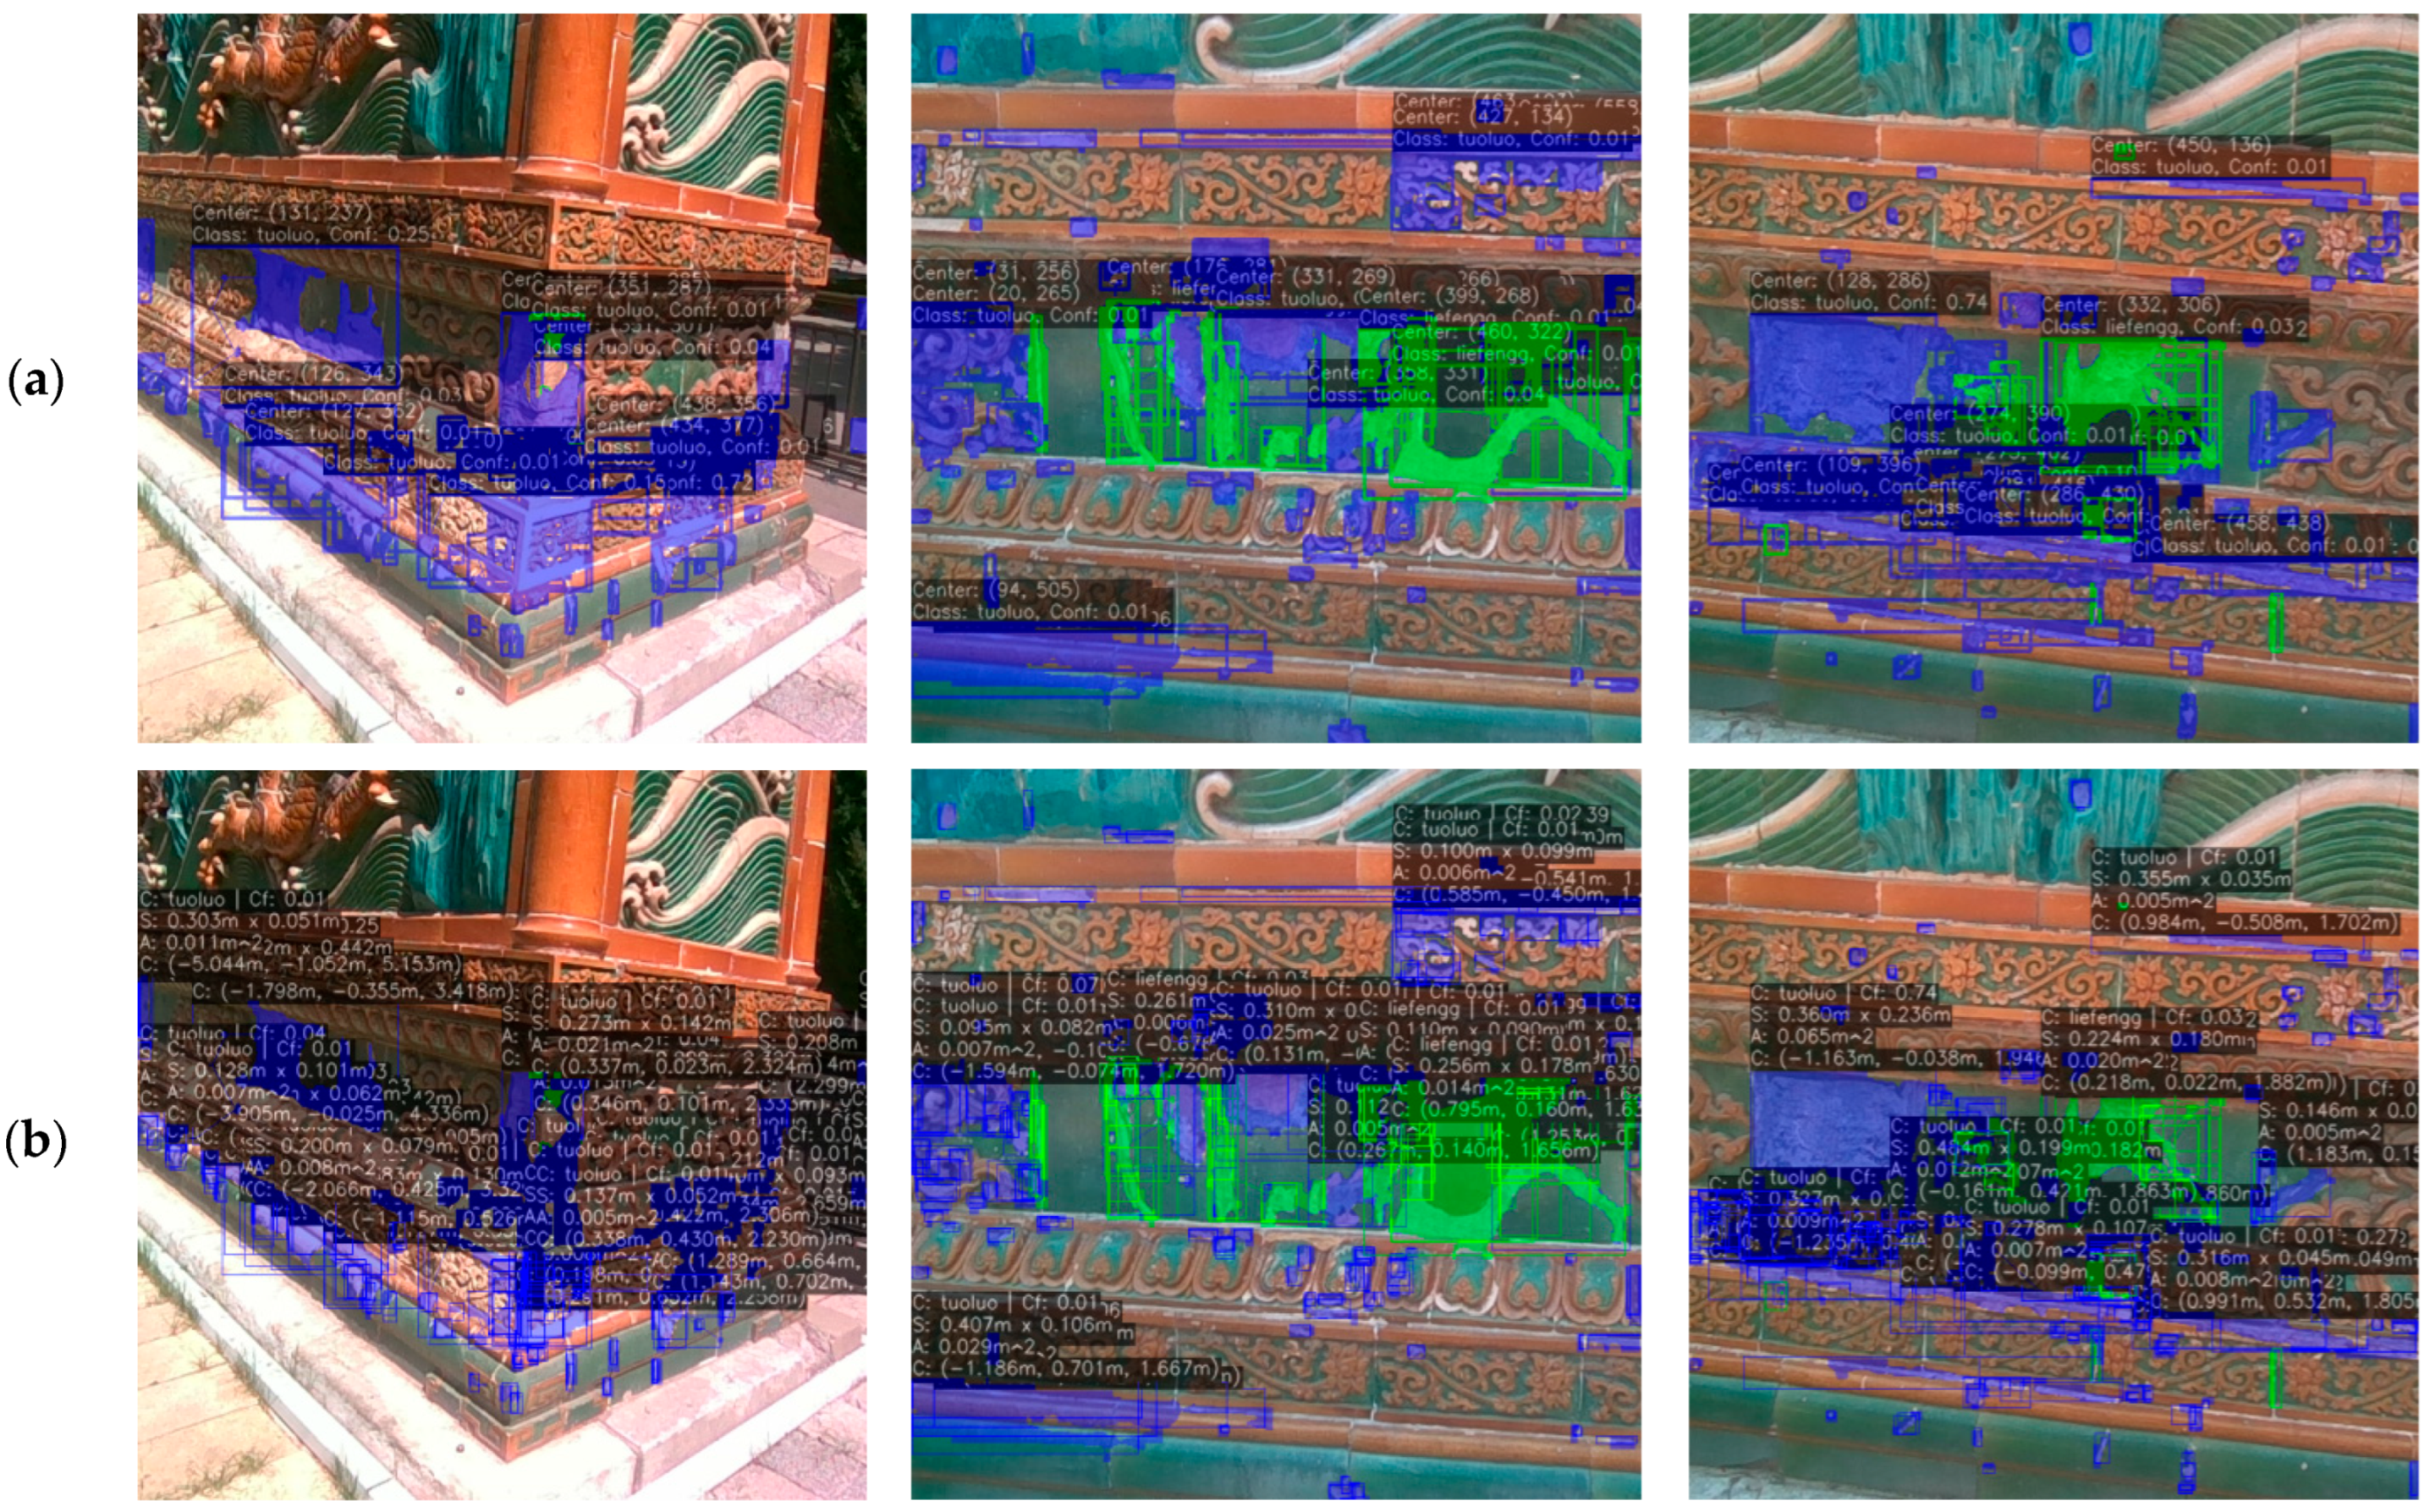
By adding camera intrinsics between the depth image and the RGB image, Figure 4 shows the transformation from pixel coordinates to local 3D coordinates. This process, which transforms 2D pixel coordinates into 3D local coordinates, is achieved by fusing the depth image with the RGB image and utilizing camera intrinsics. This process is a core step in computer vision and 3D reconstruction and is the foundation for damage size measurement. Pixel coordinates: These are the 2D coordinates of the damage on the image obtained from the RGB image using the segmentation model. Depth information: The grayscale value in the depth image represents the distance of the pixel along the Z axis in the camera coordinate system. By combining pixel coordinates and depth information with camera intrinsics, we can back-project the 2D coordinates back into 3D space. This transformation enables us to extract the true geometric information of an object from a 2D image that originally lacks depth information, as shown in Figure 9.

5. Conclusions

This study effectively integrates the perception capability of deep learning with the camera model-based back-projection mechanism in computer vision. By incorporating depth information, the proposed method extends traditional 2D image-level damage detection to the recognition of real-world dimensions and 3D spatial locations. Utilizing RGB-D data and a scale recovery algorithm, our approach enables accurate identification and measurement of damages in glazed architectural components without relying on high-precision laser scanners, demonstrating strong practicality and applicability in real-world heritage conservation tasks. The dataset employed in this study primarily consists of glazed components, which, while representative, still have limitations in terms of material diversity, environmental conditions, and structural forms. To generalize the applicability of the method to other types of cultural heritage materials—such as brick masonry, timber structures, and stone carvings—further validation of its robustness and adaptability is necessary. Future work will focus on expanding the range of heritage scenarios and component types to build a more diversified and representative damage identification dataset, enhancing the method’s generalizability and effectiveness in fine-grained damage detection and structural conservation. This research is primarily based on RGB-D imagery and point clouds. Future developments may incorporate multimodal data such as thermal infrared or hyperspectral imagery, which can reveal hidden cracks or differentiate between restoration materials. Integrating these modalities would enable more comprehensive and accurate damage diagnostics.
Additionally, by merging RGB-D data captured from multiple viewpoints, a more complete point cloud model could be constructed, thereby improving the accuracy of 3D coordinate and dimension measurements. Advancements in depth image inpainting techniques will also be explored to address issues of missing depth data caused by occlusion or reflective surfaces. Furthermore, building an error compensation model that dynamically adjusts based on the spatial location and depth of the damage within the image may enhance measurement precision. In future research, damage localization and analysis could be extended to multi-component coordination, where known damage information from a single component is integrated into finite element analysis for a comprehensive structural health assessment. Moreover, the proposed techniques may be applied in long-term HBIM-based monitoring systems for historic buildings. By periodically scanning and analyzing key components, a damage evolution database can be established, providing a scientific basis for preventive conservation strategies and valuable data to assess the response of historical architecture to environmental stressors such as climate change.

Author Contributions

Y.Z.: Directed the research and revised the manuscript critically. X.Z.: Conceived the methodology, wrote the manuscript, and performed experimental validation. M.G.: Directed the research and revised the manuscript critically. H.H. and J.W.: Prepared the datasets. Y.W.: Acquired the data. X.L.: data processing, analysis and chart creation. All authors have read and approved the published version of the manuscript. M.H.: Provided technical guidance. All authors have read and agreed to the published version of the manuscript.

Funding

This research was funded by the Key Special Project of the National Key Research and Development Program of China (grant number 2022YFF0904300) and was supported by M.G. This research was supported by two grants: Grant No. 2022YFF0904400, “Research and Development of Key Technologies and Equipment for Rapid and Efficient Collection of Digital Resources of Cultural Relics,” which was funded by M.G., and Grant No. 42171416, “The 3D Fine Modeling Considering Internal and External Topological Consistency of Components of Architectural Heritage based on Ground LiDAR Point Cloud Assisted by Non-metric Images,” which was funded by M.H.

Data Availability Statement

The data presented in this study are available on request from the corresponding author. The data are not publicly available due to [The data were collected under a confidentiality agreement with a third party, which restricts their public sharing].

Acknowledgments

The authors have reviewed and edited the final manuscript and take full responsibility for the content of this publication.

Conflicts of Interest

Authors Youshan Zhao and Xiaoxu Li were employed by the company CABR Testing Center Co., Ltd. The remaining authors declare that the research was conducted in the absence of any commercial or financial relationships that could be construed as a potential conflict of interest.

References

  1. Adili, D.; Zhao, J.; Yang, L.; Zhao, P.; Wang, C.; Luo, H. Protection of glazed tiles in ancient buildings of China. Herit. Sci. 2020, 8, 37. [Google Scholar] [CrossRef]
  2. Duan, H.; Miao, J.; Li, Y.; Kang, B.; Li, H. Analysis and research on the diseases of green glazed components in ancient Chinese buildings. J. Palace Mus. 2013, 166, 114–124+161. [Google Scholar]
  3. Xu, C.; Zhang, Y.; Qiu, D. The Regulation of Temperature Fluctuations and Energy Consumption in Buildings Using Phase Change Material-Gypsum Boards in Summer. Buildings 2024, 14, 3387. [Google Scholar] [CrossRef]
  4. Chen, D.; Gong, Q.; Dai, Y.; Bian, F.; Shang, D. Application of thermal expansion series fireproof sealing products in building passive fireproofing projects. Fire Technol. Prod. Inf. 2004, 62–64. [Google Scholar]
  5. Zhou, X.; Yan, W.; Yang, R. Seismic isolation, vibration reduction and vibration control of building structures. J. Build. Struct. 2002, 2–12+26. [Google Scholar]
  6. Sun, F.; Wang, R.; Xu, H.; Liu, C.; Huang, F. Analysis and study of green glazed tile fragments from Liao Dynasty. Spectrosc. Spectr. Anal. 2019, 39, 3839–3843. [Google Scholar]
  7. Chen, B.; Gao, F.; Sun, C.; Wu, Y.; Wang, J. Study on the correlation between oxide composition of glazed tile matrix and matrix color, water absorption, apparent porosity and mechanical strength. J. Beijing Univ. Chem. Technol. (Nat. Sci. Ed.) 2021, 48, 33–39. [Google Scholar]
  8. Wang, J.; Zhu, J.; Huang, Y. Modern restoration and reconstruction of classical architecture and supervision. Build. Tech. 2009, 120–123. [Google Scholar]
  9. Wang, C.; Tang, H. Evolution and development of the composition and formula of Chinese glazed tiles. Glass Enamel 2014, 42, 37–41. [Google Scholar]
  10. Hui, R.; Wang, L.; Liang, J.; Wei, C.; Li, H. Preliminary study on the “powdery rust” disease of glazed tiles in ancient Chinese buildings. Cult. Herit. Archaeol. Sci. 2007, 19, 14–19. [Google Scholar]
  11. Zhong, N. Analysis of the decorative art and pattern significance of glazed bricks in Xinjiang. Design 2023, 8, 1612. [Google Scholar] [CrossRef]
  12. Li, H.; Ding, Y.; Duan, H.; Liang, G.; Miao, J. Non-destructive determination of the main and trace elements in glazed tile components by EDXRF. Cult. Herit. Archaeol. Sci. 2008, 20, 36–40. [Google Scholar]
  13. Li, Y. Difficult issues and solutions in the roof maintenance of the Qin’an Hall. Anc. Archit. Gard. Technol. 2014, 38–41. [Google Scholar]
  14. Sun, M.; Huang, L. Brief analysis of key points in the production process of traditional architectural glazed components. Chin. Foreign Archit. 2016, 177–179. [Google Scholar]
  15. Han, X.; Huang, X.; Luo, H. Preparation and performance study of bridge-type siloxane for the protection of glazed tiles in Qing Dynasty buildings in the Forbidden City. J. Inorg. Mater. 2014, 29, 657–660. [Google Scholar]
  16. Zhao, L.; Miao, J.; Ding, Y. Study on the weather resistance evaluation of glazed tile replicas of Qing Dynasty official buildings. Bricks Tiles 2014, 7–10. [Google Scholar]
  17. Shan, G. Protection of Urban Cultural Heritage and the Construction of Cultural Cities. Ph.D. Thesis, Hong Kong Baptist University, Hong Kong, China, 2007. [Google Scholar]
  18. Zhao, H. Exploration of the cultural nature of ancient Chinese architecture. Ind. Technol. Forum 2015, 105–106. [Google Scholar]
  19. López, F.J.; Lerones, P.M.; Llamas, J.; Gomez-Garcia-Bermejo, J.; Zalama, E. A review of heritage building information modeling (H-BIM). Multimodal Technol. Interact. 2018, 2, 21. [Google Scholar] [CrossRef]
  20. Arias, P.; Herraez, J.; Lorenzo, H.; Ordoñez, C. Control of structural problems in cultural heritage monuments using close-range photogrammetry and computer methods. Comput. Struct. 2005, 83, 1754–1766. [Google Scholar] [CrossRef]
  21. Adriano, B.; Yokoya, N.; Xia, J.; Miura, H.; Liu, W.; Matsuoka, M.; Koshimura, S. Learning from multimodal and multitemporal earth observation data for building damage mapping. ISPRS J. Photogramm. Remote Sens. 2021, 175, 132–143. [Google Scholar] [CrossRef]
  22. Zhou, Y.; Zhang, L.; Liu, T.; Gong, S. Structural system recognition based on computer vision. J. Civ. Eng. 2018, 51, 17–23. [Google Scholar]
  23. Huang, X.; Liu, Z.; Zhang, X.; Kang, J.; Zhang, M.; Guo, Y. Surface damage detection for steel wire ropes using deep learning and computer vision techniques. Measurement 2020, 161, 107843. [Google Scholar] [CrossRef]
  24. Feng, D.; Feng, M.Q. Computer vision for SHM of civil infrastructure: From dynamic response measurement to damage detection—A review. Eng. Struct. 2018, 156, 105–117. [Google Scholar] [CrossRef]
  25. Obiechefu, C.B.; Kromanis, R. Damage detection techniques for structural health monitoring of bridges from computer vision derived parameters. Struct. Monit. Maint. 2021, 8, 91–110. [Google Scholar]
  26. Khuc, T.; Catbas, F.N. Structural identification using computer vision-based bridge health monitoring. J. Struct. Eng. 2018, 144, 04017202. [Google Scholar] [CrossRef]
  27. Dong, C.Z.; Catbas, F.N. A review of computer vision-based structural health monitoring at local and global levels. Struct. Health Monit. 2021, 20, 692–743. [Google Scholar] [CrossRef]
  28. Cui, B.; Wang, C.; Li, Y.; Li, H.; Li, C. Application of computer vision techniques to damage detection in underwater concrete structures. Alex. Eng. J. 2024, 104, 745–752. [Google Scholar] [CrossRef]
  29. Crognale, M.; De Iuliis, M.; Rinaldi, C.; Gattulli, V. Damage detection with image processing: A comparative study. Earthq. Eng. Eng. Vib. 2023, 22, 333–345. [Google Scholar] [CrossRef]
  30. Zhao, J.; Yin, L.; Chen, X.; Yang, J.; Guo, M. A graph convolution-based method for vehicle-mounted video object semantic segmentation. Surv. Mapp. Sci. 2023, 48, 157–167. [Google Scholar]
  31. Guo, M.; Zhu, L.; Zhao, Y.; Tang, X.; Guo, K.; Shi, Y.; Han, L. Intelligent Extraction of Surface Cracks on LNG Outer Tanks Based on Close-Range Image Point Clouds and Infrared Imagery. J. Nondestruct. Eval. 2024, 43, 84. [Google Scholar] [CrossRef]
  32. Li, J.; Najmi, A.; Gray, R.M. Image classification by a two-dimensional hidden Markov model. IEEE Trans. Signal Process. 2000, 48, 517–533. [Google Scholar] [CrossRef]
  33. Guo, M.; Zhu, L.; Huang, M.; Ji, J.; Ren, X.; Wei, Y.; Gao, C. Intelligent extraction of road cracks based on vehicle laser point cloud and panoramic sequence images. J. Road Eng. 2024, 4, 69–79. [Google Scholar] [CrossRef]
  34. Barron, J.T.; Malik, J. Intrinsic scene properties from a single rgb-d image. In Proceedings of the IEEE Conference on Computer Vision and Pattern Recognition, Portland, OR, USA, 23–28 June 2013; pp. 17–24. [Google Scholar]
  35. Janani, M.; Jebakumar, R. Detection and classification of groundnut leaf nutrient level extraction in RGB images. Adv. Eng. Softw. 2023, 175, 103320. [Google Scholar] [CrossRef]
  36. Akhtar, N.; Mian, A. Hyperspectral recovery from RGB images using Gaussian processes. IEEE Trans. Pattern Anal. Mach. Intell. 2018, 42, 100–113. [Google Scholar] [CrossRef] [PubMed]
  37. Hossain, M.D.; Chen, D. A hybrid image segmentation method for building extraction from high-resolution RGB images. ISPRS J. Photogramm. Remote Sens. 2022, 192, 299–314. [Google Scholar] [CrossRef]
  38. Xin, P.; Liu, Y.; Wang, P.; Xu, J. A deep learning and stereo vision-based method for quantitative assessment of bridge surface damage severity. J. Civ. Eng. Inf. Technol. 2025, 17, 19–26. [Google Scholar]
  39. Wang, Q.; Xu, Y.; Qian, S. Research on concrete damage evolution based on machine vision and digital image correlation technology. J. Hunan Univ. (Nat. Sci. Ed.) 2023, 50. [Google Scholar] [CrossRef]
  40. Zhou, Y.; Zhang, W.; Chen, Y.; Zhang, Y.; Luo, X. Road crack localization and quantification method based on UAV monocular video. Eng. Mech. 2024. [Google Scholar] [CrossRef]
  41. Harika, A.; Sivanpillai, R.; Sajith Variyar, V.V.; Sowmya, V. Extracting water bodies in rgb images using deeplabv3+ algorithm. Int. Arch. Photogramm. Remote Sens. Spat. Inf. Sci. 2022, 46, 97–101. [Google Scholar] [CrossRef]
  42. Yang, G.; Li, R.; Zhang, S.; Wen, Y.; Xu, X.; Song, H. Extracting cow point clouds from multi-view RGB images with an improved YOLACT++ instance segmentation. Expert Syst. Appl. 2023, 230, 120730. [Google Scholar] [CrossRef]
  43. Shi, Y.; Guo, M.; Zhao, J.; Liang, X.; Shang, X.; Huang, M.; Guo, S.; Zhao, Y. Optimization of structural reinforcement assessment for architectural heritage digital twins based on LiDAR and multi-source remote sensing. Herit. Sci. 2024, 12, 310. [Google Scholar] [CrossRef]
  44. Shi, Y.; Guo, M.; Zhou, J.; Liang, X. Analysis of static stiffness properties of column-architrave structures of ancient buildings under long term load-natural aging coupling. Structures 2024, 59, 105688. [Google Scholar] [CrossRef]
  45. Guo, M.; Shang, X.; Zhao, J.; Huang, M.; Zhang, Y.; Lv, S. Synergy of LIDAR and hyperspectral remote sensing: Health status assessment of architectural heritage based on normal cloud theory and variable weight theory. Herit. Sci. 2024, 12, 217. [Google Scholar] [CrossRef]
  46. Gao, C.; Guo, M.; Wang, G.; Guo, K.; Zhao, Y. 3D Change Detection Method for Exterior Wall of LNG Storage Tank Supported by Multi-Source Spatial Data. Adv. Theory Simul. 2024, 7, 2300941. [Google Scholar] [CrossRef]
  47. Guo, M.; Zhao, J.; Pan, D.; Sun, M.; Zhou, Y.; Yan, B. Normal cloud model theory-based comprehensive fuzzy assessment of wooden pagoda safety. J. Cult. Herit. 2022, 55, 1–10. [Google Scholar] [CrossRef]
  48. Shang, X.; Guo, M.; Wang, G.; Zhao, J.; Pan, D. Behavioral model construction of architectural heritage for digital twin. NPJ Herit. Sci. 2025, 13, 129. [Google Scholar] [CrossRef]
  49. Traore, B.B.; Kamsu-Foguem, B.; Tangara, F. Deep convolution neural network for image recognition. Ecol. Inform. 2018, 48, 257–268. [Google Scholar] [CrossRef]
  50. Guo, M.; Fu, Z.; Pan, D.; Zhou, Y.; Huang, M.; Guo, K. 3D Digital protection and representation of burial ruins based on LiDAR and UAV survey. Meas. Control 2022, 55, 555–566. [Google Scholar] [CrossRef]
  51. Gao, Z.; Wang, G.; Guo, M.; Zhou, T. Application of TLS in feature acquisition of complex steel structures. Surv. Bull. 2020, 151–154+159. [Google Scholar]
  52. Guo, M.; Sun, M.; Pan, D.; Huang, M.; Yan, B.; Zhou, Y.; Nie, P.; Zhou, T.; Zhao, Y. High-precision detection method for large and complex steel structures based on global registration algorithm and automatic point cloud generation. Measurement 2021, 172, 108765. [Google Scholar] [CrossRef]
  53. Serre, T.; Kreiman, G.; Kouh, M.; Cadieu, C.; Knoblich, U.; Poggio, T. A quantitative theory of immediate visual recognition. Prog. Brain Res. 2007, 165, 33–56. [Google Scholar]
  54. Cheng, Y.; Huang, J.; Zhang, Y.; Peng, N. Application of artificial intelligence in cultural heritage conservation. Nat. J. 2024, 46, 261–270. [Google Scholar]
  55. Hao, T.; Shen, T.; Yang, T. Research on high-precision crack width variation measurement technology. J. Xi’an Univ. Technol. 2020, 36. [Google Scholar] [CrossRef]
  56. Janc, B.; Vižintin, G.; Pal, A. Investigation of disc cutter wear in tunnel-boring machines (tbms): Integration of photogrammetry, measurement with a caliper, weighing, and macroscopic visual inspection. Appl. Sci. 2024, 14, 2443. [Google Scholar] [CrossRef]
  57. Cai, R.; Luo, X.; Xie, G.; Wang, K.; Peng, Y.; Rao, Y. Effects of the printing parameters on geometric accuracy and mechanical properties of digital light processing printed polymer. J. Mater. Sci. 2024, 59, 14807–14819. [Google Scholar] [CrossRef]
  58. Guo, M.; Wei, Y.; Chen, Z.; Zhao, Y.; Tang, X.; Guo, K.; Tang, K. Integration of Time-Series Interferometric Synthetic Aperture Radar Imagery and LiDAR Point Cloud for Monitoring and Analysis of Liquefied Natural Gas Storage Tank Exteriors. Sens. Mater. 2024, 36, 3713–3730. [Google Scholar] [CrossRef]
  59. Wang, J.; Jiang, N. Protective reuse of industrial heritage buildings in post-industrial era in China. J. Archit. 2006, 8, 12. [Google Scholar]
  60. Guo, M.; Tang, X.; Zhao, Y.; Liu, Y.; Chen, Z.; Zhu, L.; Guo, K. Monitoring Scheme of Liquified Natural Gas External Tank Using Air—Space—Land Integration Multisource Remote Sensing. Sens. Mater. 2024, 36, 373–392. [Google Scholar] [CrossRef]
  61. Alzubaidi, L.; Zhang, J.; Humaidi, A.J.; Al-Dujaili, A.; Duan, Y.; Al-Shamma, O.; Santamaria, J.A.; Fadhel, M.; Al-Amidie, M.; Farhan, L. Review of deep learning: Concepts, CNN architectures, challenges, applications, future directions. J. Big Data 2021, 8, 53. [Google Scholar] [CrossRef] [PubMed]
  62. Ren, S.; He, K.; Girshick, R.; Sun, J. Faster R-CNN: Towards real-time object detection with region proposal networks. IEEE Trans. Pattern Anal. Mach. Intell. 2016, 39, 1137–1149. [Google Scholar] [CrossRef] [PubMed]
  63. Jiang, P.; Ergu, D.; Liu, F.; Cai, Y.; Ma, B. A Review of Yolo algorithm developments. Procedia Comput. Sci. 2022, 199, 1066–1073. [Google Scholar] [CrossRef]
  64. Ronneberger, O.; Fischer, P.; Brox, T. U-net: Convolutional networks for biomedical image segmentation. In Proceedings of the International Conference on Medical Image Computing and Computer-Assisted Intervention, Munich, Germany, 5–9 October 2015; Springer International Publishing: Cham, Switzerland, 2015; pp. 234–241. [Google Scholar]
  65. Chen, L.C.; Papandreou, G.; Kokkinos, I.; Murphy, K.; Yuille, A.L. Deeplab: Semantic image segmentation with deep convolutional nets, atrous convolution, and fully connected crfs. IEEE Trans. Pattern Anal. Mach. Intell. 2017, 40, 834–848. [Google Scholar] [CrossRef] [PubMed]
  66. He, K.; Gkioxari, G.; Dollár, P.; Girshick, R. Mask r-cnn. In Proceedings of the IEEE International Conference on Computer Vision, Venice, Italy, 22–29 October 2017; pp. 2961–2969. [Google Scholar]
  67. Xu, X.; Zhao, M.; Shi, P.; Ren, R.; He, X.; Wei, X.; Yang, H. Crack detection and comparison study based on faster R-CNN and mask R-CNN. Sensors 2022, 22, 1215. [Google Scholar] [CrossRef] [PubMed]
  68. Xu, Z.; Bashir, M.; Yang, Y.; Wang, X.; Wang, J.; Ekere, N.; Li, C. Multisensory collaborative damage diagnosis of a 10 MW floating offshore wind turbine tendons using multi-scale convolutional neural network with attention mechanism. Renew. Energy 2022, 199, 21–34. [Google Scholar] [CrossRef]
  69. Lv, Y.; Wu, N.; Jiang, H. Reconstruction of environmental elements in cultural heritage protection using 3D surveying and mapping data. Sustain. Dev. 2024, 14, 3028. [Google Scholar]
  70. Wang, N.; Zhao, X.; Wang, L.; Zou, Z. Novel system for rapid investigation and damage detection in cultural heritage conservation based on deep learning. J. Infrastruct. Syst. 2019, 25, 04019020. [Google Scholar] [CrossRef]
  71. Sohan, M.; Sai Ram, T.; Rami Reddy, C.V. A review on yolov8 and its advancements. In Proceedings of the International Conference on Data Intelligence and Cognitive Informatics, Tirunelveli, India, 27–28 June 2023; Springer: Singapore, 2024; pp. 529–545. [Google Scholar]
  72. Wan, H.; Gao, L.; Yuan, Z.; Qu, H.; Sun, Q.; Cheng, H.; Wang, R. A novel transformer model for surface damage detection and cognition of concrete bridges. Expert Syst. Appl. 2023, 213, 119019. [Google Scholar] [CrossRef]
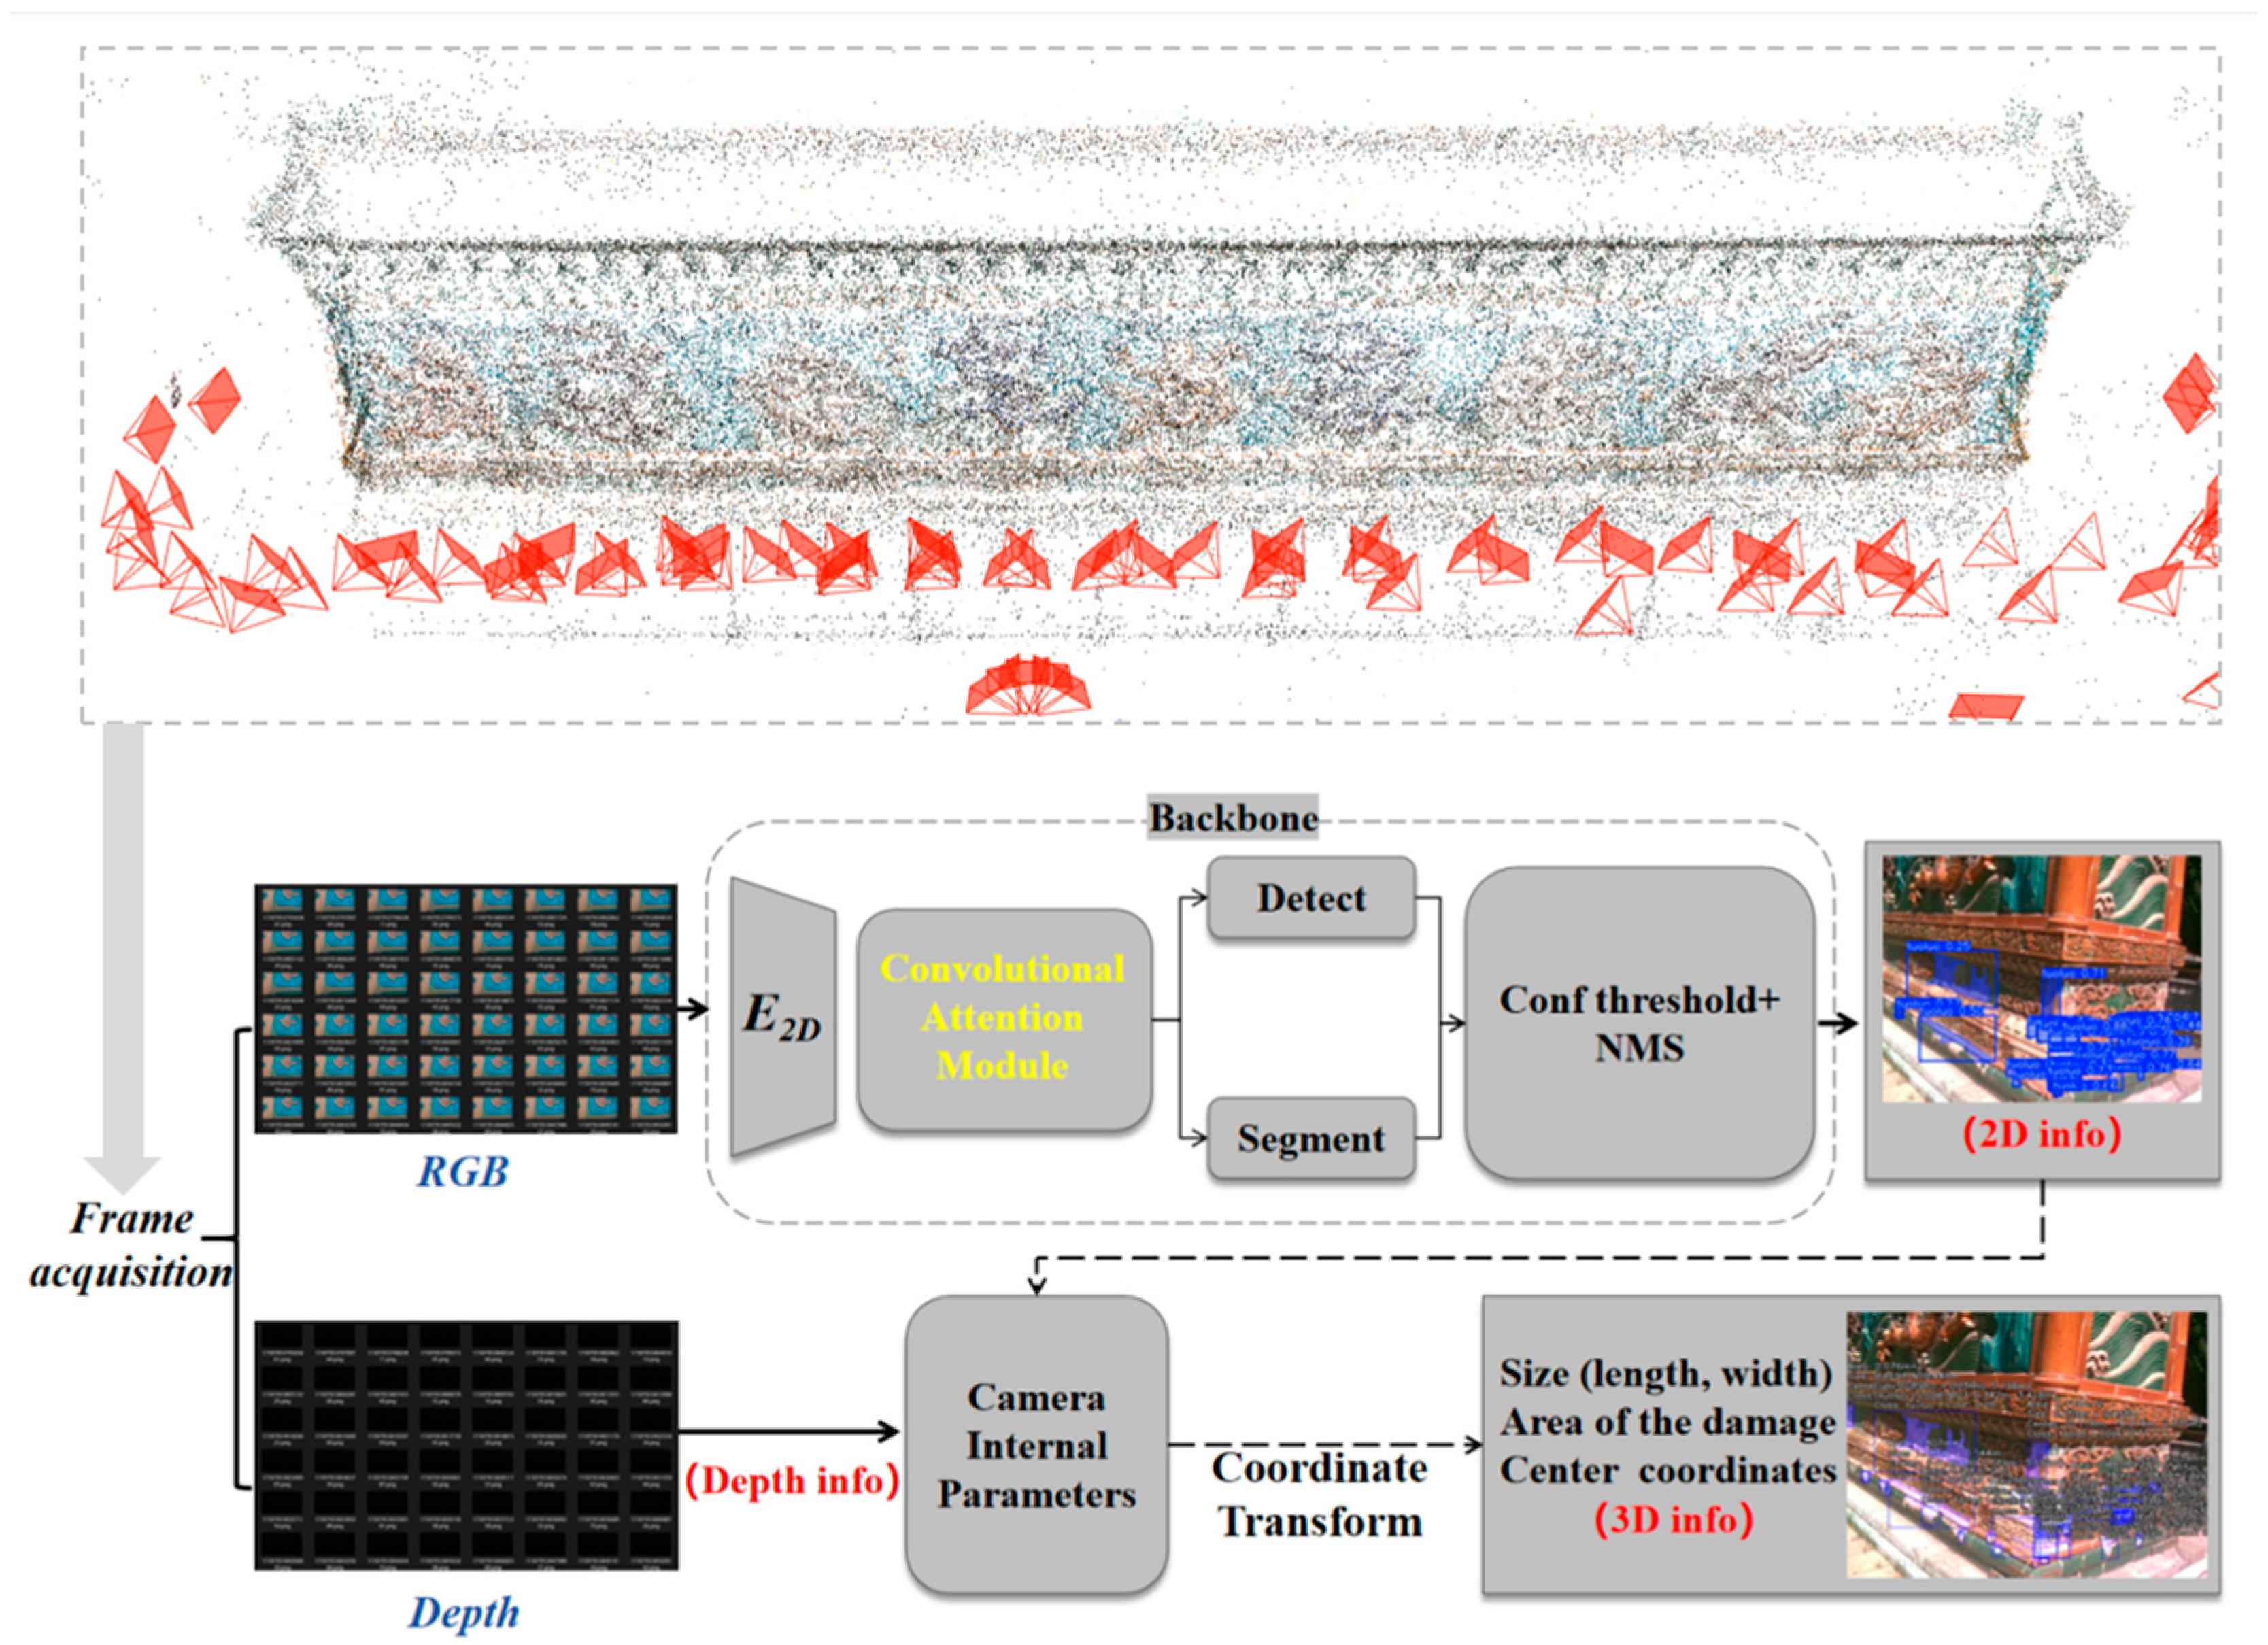
Figure 1. Damage intelligent identification method and restoration scale technology route.The depth information (Depth info) provided by the Depth map and the mask information (2D info) provided by the 2D image are converted into the required 3D information (3D info) through coordinate transform.
Buildings 15 03641 g001
Figure 2. Schematic diagram of data collection results.
Buildings 15 03641 g002
Figure 3. Overall diagram of the Nine Dragon Wall.
Buildings 15 03641 g003
Figure 4. Schematic diagram of the improved Restore Scale Identification (RSI) network structure. The input image is progressively processed through the backbone and neck networks enhanced with CBAM, and ultimately passed to the detection head. The final output is generated through a detection head integrated with a scale restoration module. The lower-right portion illustrates the internal structure of the CBAM, which consists of two submodules: channel attention and spatial attention.
Buildings 15 03641 g004
Figure 5. Examples of annotated image samples in sS-DGDID. The colors in the image are used to highlight specific damage types on the glazed component. Green: Represents cracks. Blue: Represents spalling.
Buildings 15 03641 g005
Figure 6. Schematic diagram of damage recognition results using various methods. The blue recognition result is spalling, and the green one is cracking. (ad) show the original image of the part from left to right and the corresponding segmentation masks generated by our proposed method and three other state-of-the-art methods. The comparison results intuitively demonstrate the superior performance of our method in accurately identifying and segmenting target features.
Buildings 15 03641 g006
Figure 7. Measurement area of the Nine Dragon Wall and its specific measurement values and range. The notations in the figure represent the measured dimensions of the damage on the lower part of the Nine-Dragon Wall. These measurements, including length and width, were obtained by analyzing the LiDAR point cloud using the CloudCompare software.
Buildings 15 03641 g007
Figure 8. Comparison of 3D LiDAR point cloud and RSI algorithm recognition results. Subfigures (ac), respectively, show the selected detection results and measured dimensions on the Nine-Dragon Wall. In the recognition results: C denotes the damage type; Cf indicates the confidence score; S represents the size (length × width); A is the damaged area; and C: (X, Y, Z) corresponds to the 3D coordinates of the damage centroid relative to the camera coordinate system. By comparing the value in the red box, the first line is the value of the recognition result, where the length and width correspond to the value of S, and the second line is the measurement value of the LiDAR point cloud. The measured result is compared with the recognition result. By statistically comparing the numerical differences between the recognition results and the measured values, the accuracy of the proposed method is verified.
Buildings 15 03641 g008
Figure 9. (a) shows the pixel coordinate inference result, where Center is the coordinate of the damaged pixel center, Class is the category, and Conf is the confidence level. In (b), C is the category, Cf is the confidence level, A is the actual damage area, S is Size, indicating the actual length and width of the damage, and C:(X, Y, Z) is the actual 3D coordinate (X, Y, Z) in the camera coordinate system.
Buildings 15 03641 g009
Table 1. Model training parameters.
SizeBatch SizeOptimizerNumber of EpochInitial Learning RateLearning Rate Decay
64016Adam3000.0010.75
Table 2. Comparison results of various methods in terms of accuracy, recall rate, and F1-score. The bold ones are the ones with the highest recognition accuracy for each method in each category.
ClassIoUPRF1
U-Nettuoluo74.188.284.185.5
liefengg70.582.480.481.4
DeepLabv3+tuoluo77.287.083.885.4
liefengg72.785.378.882.2
YOLOv8-Segtuoluo80.693.590.492.4
liefengg74.994.189.693.9
Ourstuoluo92.297.194.196.5
liefengg86.495.795.995.5
Table 3. Damage prediction value, 3D laser point cloud measurement value and their difference.
(a) (Length × Width)/m(b)(c)
Predicted value0.2890.1120.1750.1230.2240.127
Measured value0.2920.1130.1810.1330.2210.124
Difference0.0030.0010.0060.010−0.003−0.003
Disclaimer/Publisher’s Note: The statements, opinions and data contained in all publications are solely those of the individual author(s) and contributor(s) and not of MDPI and/or the editor(s). MDPI and/or the editor(s) disclaim responsibility for any injury to people or property resulting from any ideas, methods, instructions or products referred to in the content.