Article

The Effect of Steel Reinforcement Diameter on the Behavior of Concrete Beams with Corrosion

by
Joel Moreno-Herrera
1,*,
Néstor Vega-Juarez
1,
Jorge Varela-Rivera
1,
Luis Fernandez-Baqueiro
1 and
Pedro Castro-Borges
2
1
College of Engineering, Autonomous University of Yucatan, Av. Industrias no Contaminantes, Merida 97302, Yucatan, Mexico
2
Department of Applied Physics, Center for Research and Advanced Studies, Campus Mérida, Cordemex, Merida 97310, Yucatan, Mexico
*
Author to whom correspondence should be addressed.
Buildings 2025, 15(2), 266; https://doi.org/10.3390/buildings15020266
Submission received: 27 November 2024 / Revised: 12 January 2025 / Accepted: 13 January 2025 / Published: 17 January 2025
(This article belongs to the Section Building Structures)

Abstract

Corrosion is one of the main problems affecting reinforced concrete (RC) structures, yet there remains a lack of studies in which the electrochemical and structural behavior of corroded RC elements are studied together. In this work, four RC beams with and without corrosion were studied to evaluate their electrochemical and structural behavior via the variable of the diameter of the longitudinal tension steel reinforcement (LTR). The beams were initially tested to determine their initial structural behavior and then subjected to sustained loads and wetting and drying cycles by applying a NaCl solution. The beams were tested a second time to determine their final structural behavior. The variations in the corrosion potential and corrosion rate of the LTR with time, together with concrete resistivity, cracking patterns, and load–displacement curves of the RC beam, are presented. It was found that the electrochemical parameters of the beams with corrosion were similar regardless of the steel reinforcement diameter; these parameters indicated a high level of corrosion. The maximum flexural strength loss was observed for beams with an LTR of 10 mm compared to those with a 13 mm diameter. The maximum cross-sectional area loss associated with pitting corrosion was greater for the beam with an LTR of 10 mm.

1. Introduction

Corrosion is one of the main problems that affect the safety and durability of reinforced concrete structures [1]. In the United States of America and the United Kingdom, the cost associated with the maintenance and repair of structures damaged by corrosion is estimated to be around USD 276 billion and GBP 755 million, respectively [2,3]. Corrosion is caused by aggressive agents such as chlorides, sulfates, and carbon dioxide that penetrate the concrete [4]. In the case of marine environments, concrete structures are mainly affected by chlorides [5]. Corrosion affects the behavior of reinforced concrete structures, for example, their strength and deformation capacity [1,6,7]. Changes in the behavior of structures are mainly related to changes in the geometric and mechanical properties of the steel reinforcement. In the first case, the change is associated with a reduction in the transverse cross-sectional area, and in the second, it is associated with a change in the stress–strain relationship of the steel reinforcement. Concrete cracking associated with corrosion also affects the behavior of concrete structures [8,9,10,11]. Cracking is associated with an increment in the radial tensile stress in concrete and the presence of steel oxide in the steel reinforcements.
On the other hand, the durability requirements of current design codes are related to the prevention and assessment of corrosion in concrete structures. In the first case, the compressive strength of concrete and the cover of steel reinforcement are typically specified depending on exposure to aggressive environments [12,13,14]. In the second case, the levels of corrosion are specified as a function of different electrochemical parameters. The most commonly used electrochemical parameters are the corrosion rate [15,16], the potential of corrosion [17,18], and the electrical resistivity of concrete [19,20]. The requirements for the assessment of durability are associated with the initial stages of corrosion; this means that specified levels of corrosion are not based on changes in the behavior of the structures, for example, changes in their strength or deformation capacity [21].
Most studies related to corrosion in reinforced concrete elements focus on two independent aspects: variations in the electrochemical parameters and changes in the behavior of the structures. In the first case, the main variables studied are the concrete cover, the compressive strength of concrete, and the water/cement ratio [22,23,24]. Accelerated corrosion is induced by using an electrical current and wetting and drying cycles. It has been observed that as the concrete cover and compressive strength of concrete decrease, the electrochemical parameters increase. On the other hand, as the water/cement ratio increases, the electrochemical parameters also increase their deterioration rates. The concrete cover is related to the physical barrier, while the compressive strength of concrete and the water/cement ratio are related to the porosity of concrete. In the second case, the main variables studied are the level of corrosion, the cross-sectional dimension of concrete elements, the amount of steel reinforcement, and the application of sustained loads [25,26,27,28,29]. Corrosion is induced by using an impressed electrical current and wetting and drying cycles. It has been observed that as the level of corrosion increases, the strength of reinforced concrete elements decreases. It has also been observed that the cracking associated with sustained loads facilitates the penetration of aggressive agents into the concrete.
A single study was founded where the electrochemical parameters are compared with the structural behavior of reinforced concrete beams [21]. The variable studied was the level of sustained loads. Corrosion was induced by chloride contamination in fresh concrete, together with wetting and drying cycles. The values of the electrochemical parameters measured were associated with a high level of corrosion. However, no significant changes were observed in the behavior of the studied beams. This indicates that the corrosion levels defined in the current design codes are related to the initial stages of corrosion and these levels can be used for prevention strategies. However, it is also important to evaluate and assess existing RC structures to consider modified reliability levels [9,27]. For the assessment of reinforced concrete elements affected by corrosion, new levels of corrosion associated with significant changes in the behavior of the structures are needed. A reliable non-destructive procedure to estimate the residual life of a reinforced concrete structure subjected to corrosion is not yet well defined [1]. Therefore, more studies with a comprehensive evaluation of the electrochemical parameters and their relationship with the structural behavior of reinforced concrete beams with corrosion are still required. In this study, the electrochemical and structural behavior of reinforced concrete beams was evaluated. Two control beams without corrosion and two beams with electrochemical parameters associated with a high level of corrosion were considered. Beams with flexural behavior were considered. The variable studied was the diameter of the longitudinal tension steel bar. The variation in the electrochemical parameters over time is presented, as well as the cracking patterns and load–displacement curves of the reinforced concrete beams.

2. Materials and Methods

2.1. Beam Properties

Four full-scale reinforced concrete beams with dimensions of 150 mm × 300 mm × 3500 mm (width × height × length) were considered. The longitudinal compression steel reinforcement consisted of two bars with a 10 mm diameter. The longitudinal tension steel reinforcement consisted of two bars with a 10 mm diameter for two beams and two bars with a 13 mm diameter for another two. The longitudinal tension steel reinforcement ratio ( ρ ) was 0.0036 and 0.0064 for the 10 mm and 13 mm beams, respectively. The yielding strength (fy) of the bars with 10 mm and 13 mm diameters was 445.22 MPa and 424.62 MPa, respectively, and was determined in accordance with ASTM A370 [30]. The clear cover of the longitudinal steel reinforcement was 35 mm. The transverse steel reinforcement consisted of hoops spaced every 100 mm; hoops were made with bars with a 6.4 mm diameter. The nominal yielding strength of the transverse steel reinforcement was 227.51 MPa. The longitudinal compression reinforcement and transverse reinforcement were painted with anticorrosive alkyd enamel. This paint was used to avoid corrosion in this steel and induce it only in the longitudinal tension reinforcement. The mix proportion for a cubic meter of fresh concrete and the average compressive strength of concrete (fc) is presented in Table 1. A water/cement ratio of 0.46 was considered. The compressive strength of the concrete of the beams was determined in accordance with ASTM C39/C39M [31].

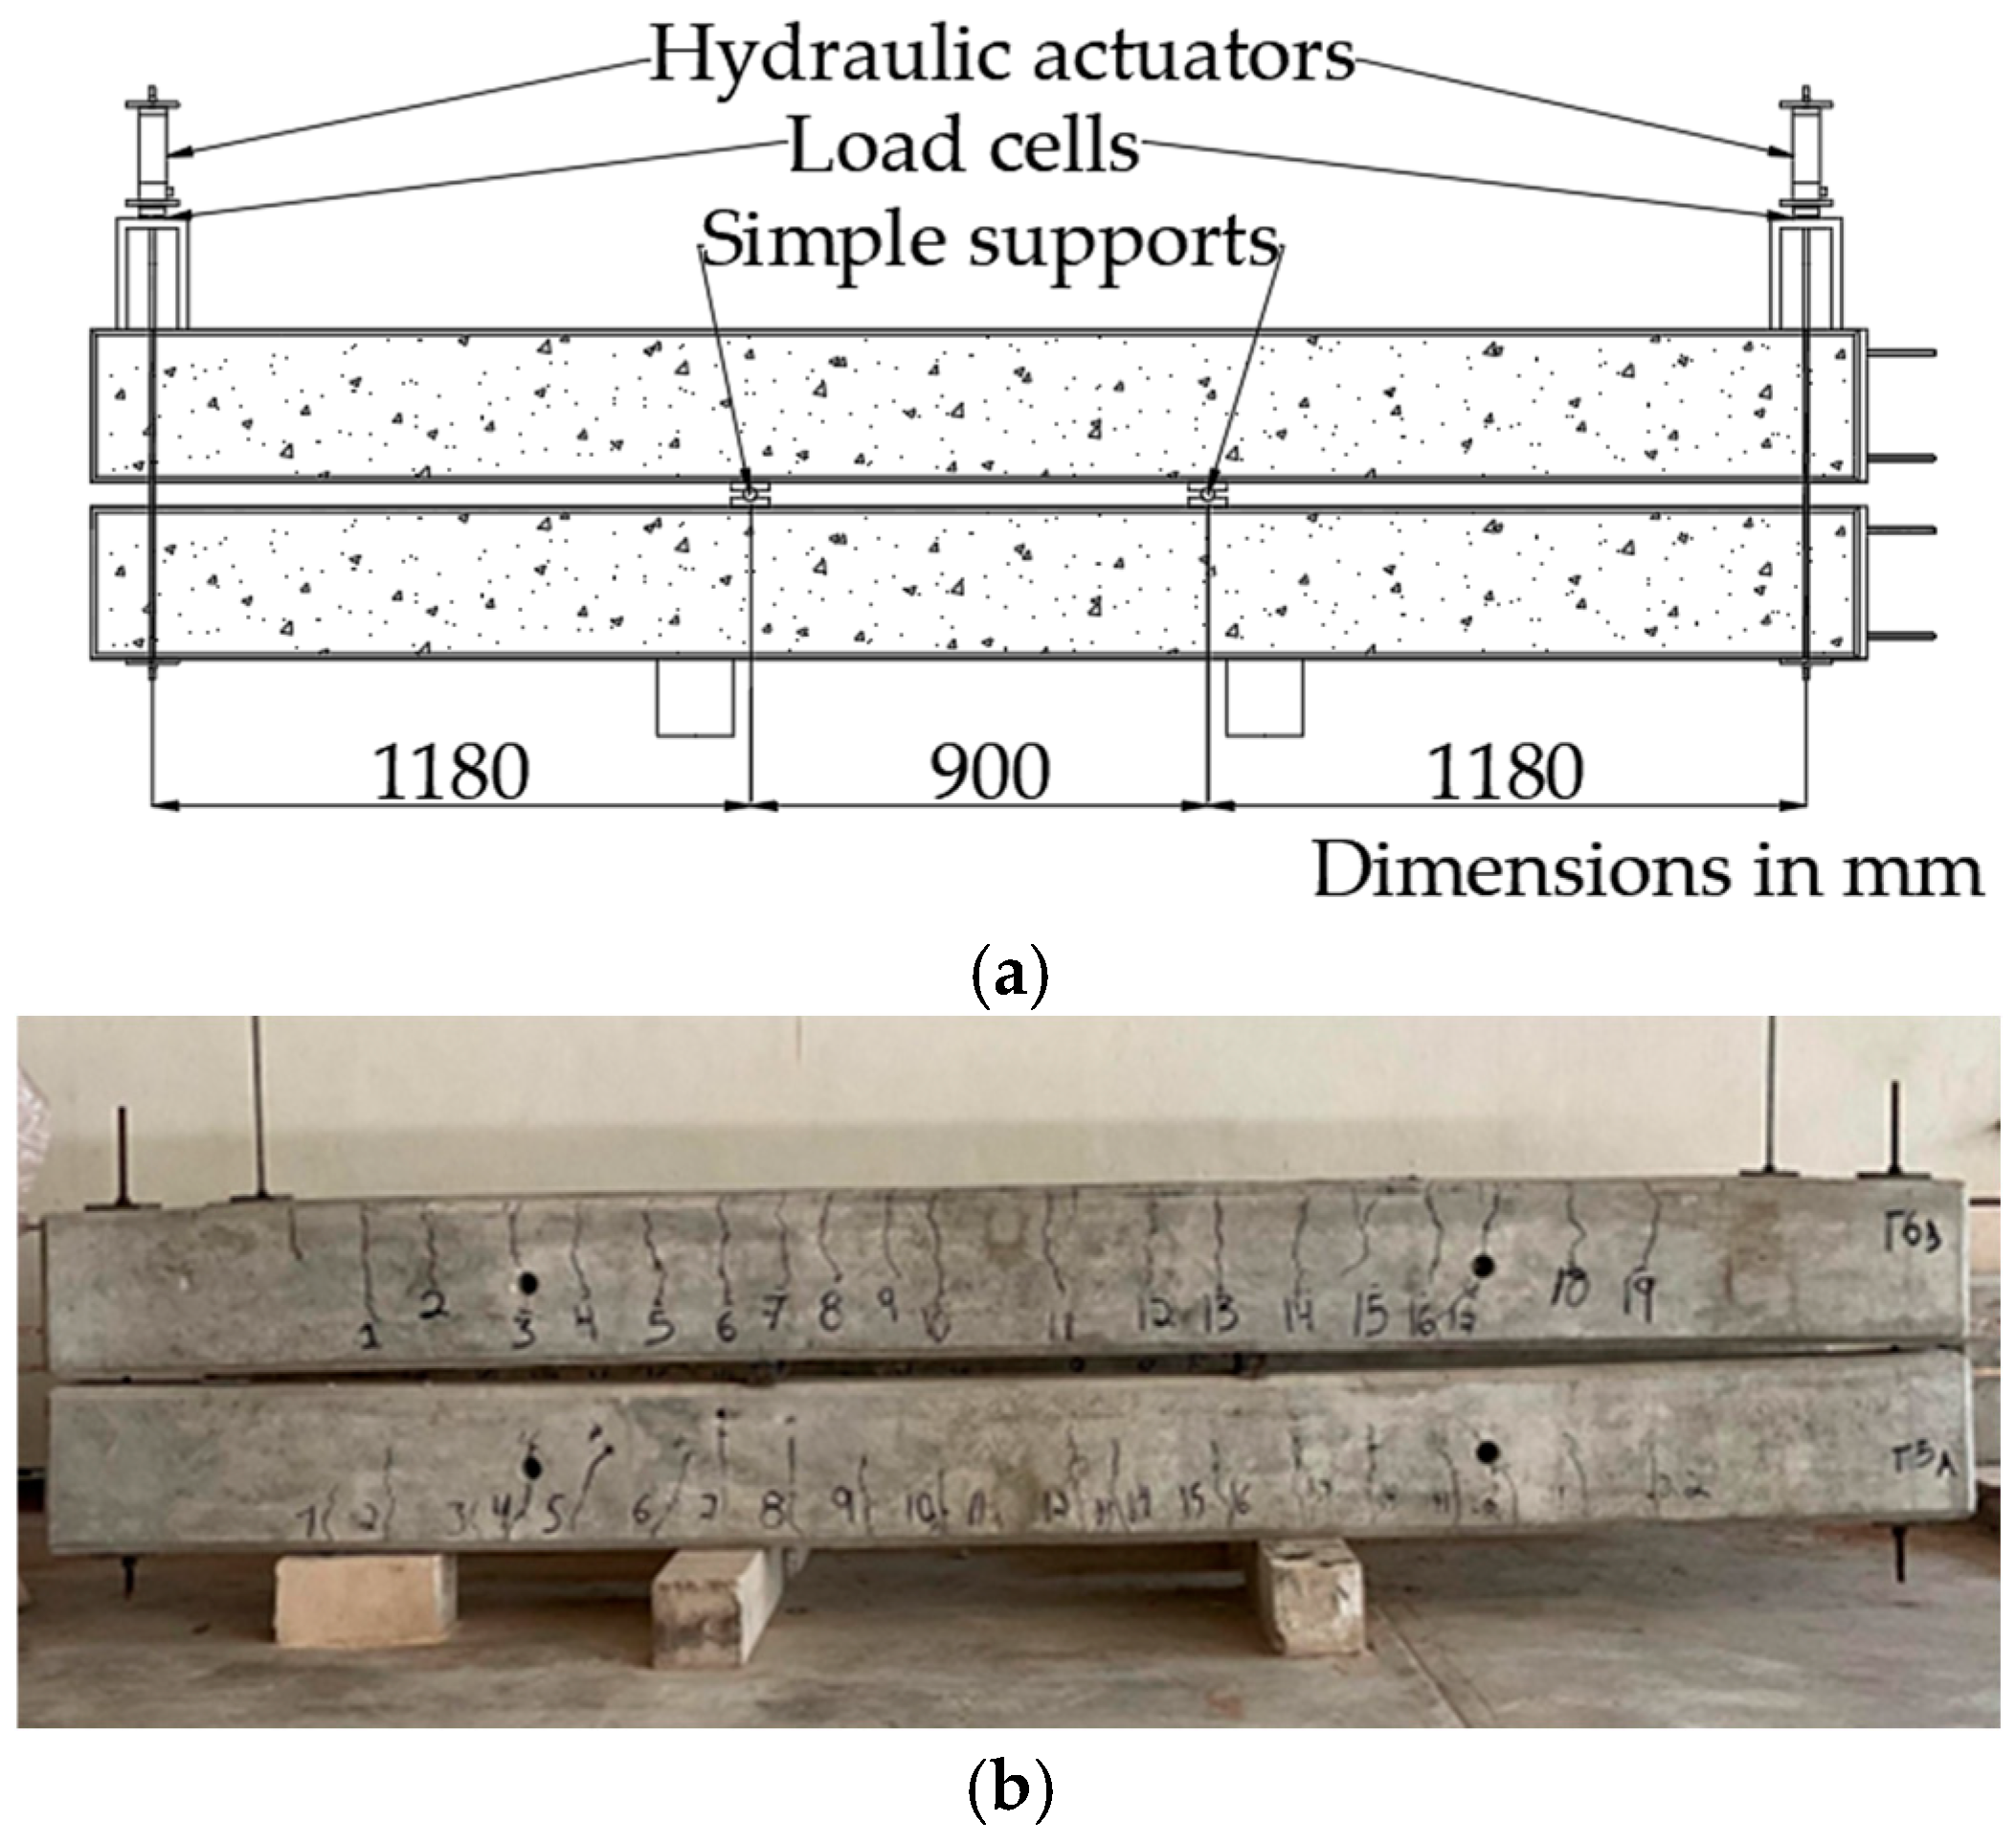
2.2. Initial Beam Testing

Beams were first tested to determine their initial structural behavior under incremental monotonic loads using a four-point load system (Figure 1). The loads were applied using a hydraulic actuator and measured using a donut-type load cell. Displacements were measured at the mid-span of the beams using two linear potentiometers. The maximum loads applied were associated with a target stress value in the longitudinal tension reinforcement: stress equal to 60% of the yield strength of the steel (0.6 fy) was selected. The initial structural behavior was defined in terms of the cracking pattern, the flexural cracking load (cracking load), and the initial secant stiffness of the beams (initial stiffness).

2.3. Sustained Load System

After the first tests, the beams were subjected to sustained loads associated with a target stress value of 0.6 fy. The loads were applied using a four-point sustained load system (Figure 2). Beams were placed in pairs, and the longitudinal tension reinforcement of the upper and lower beams was located at the top and bottom, respectively (Figure 2). Loads were applied using two hydraulic actuators and were measured using two donut-type load cells. Sustained loads were measured every two months to verify that they remained constant during the induction of accelerated corrosion, as described later.

2.4. Accelerated Corrosion Technique

Corrosion was induced via wetting and drying cycles in two beams, one with the longitudinal tension reinforcement (LTR) of 10 mm and the other with an LTR of 13 mm. The beams were moistened using a saline solution of 3.5% sodium chloride (NaCl) by weight. The solution was applied using a pressurized pump to maintain a constant pressure and velocity. Beams were covered with cotton cloth to maintain their humidity (Figure 3). Cycles consisted of 4 h of wetting and 20 h of drying for 320 days and began at 1100 days of age; they were interrupted for 180 days due to the SARS-CoV-2 emergency. After that, cycles of 4 h of wetting and 68 h of drying were considered. The drying period was increased because this favored the corrosion process [28]. The nomenclature used to identify the beams was as follows: diameter of the longitudinal tension steel reinforcement in millimeters (10, 13)-corrosion technique (N, WD). N refers to no-corrosion and WD to the wetting and drying cycles.

2.5. Measurement of Electrochemical Parameters, Concrete Resistivity, and Cracking Patterns

The electrochemical parameters (corrosion potential and corrosion rate of steel reinforcement) and concrete resistivity were measured in the beams. These parameters were measured every seven days using a commercial corrosimeter (Gecor6). The electrochemical parameters and concrete resistivity were measured by placing the Gecor6 confining ring at the mid-span of beams. The cracking patterns of beams were also obtained: crack lengths were measured using a tape measure and crack widths using a microscope with precision of 0.01 mm. The widths of vertical cracks were measured at a height of 10 mm from the face in tension of beams, and corrosion crack widths were measured along the length of cracks.

2.6. Testing of Beams Until Failure

Beams were tested a second time to determine post-cracking behavior, being subjected to incremental monotonical loads until failure. The loads were applied using a four-point load system as described before (Figure 1). Post-cracking behavior was defined in terms of the load associated with the yielding of the LTR (yielding load) and the maximum load, deformation capacity, and failure type.

2.7. Characterization of Longitudinal Steel Reinforcement

After the second test, the longitudinal steel reinforcement bars were extracted. Bars were cleaned in accordance with ASTM G1-90 [32] and divided into 50 cm long segments. The cross-sectional area loss of the segments via pitting corrosion was determined. Two types of pits were considered: triangular and flat. The triangular pit was characterized by pit depth under the segment ( τ i ) and pit width ( h τ ) (Figure 3). In the case of a flat pit, τ i is equal to zero. For triangular pits, the cross-sectional area loss ( A TP ) was determined using Equation (1). For flat pits, the cross-sectional area loss ( A FP ) was determined using Equation (2). In Equations (1) and (2), R is the bar radius, α is the central angle for a triangular pit, and β is the central angle for a flat pit. In Figure 4, τ is the total pit depth. The dimensions of pits were measured using a digital vernier caliper with precision of 0.01 mm.
A TP = h τ · τ i 2 + R 2 2 α · π 180 sin α
A FP = R 2 2 β · π 180 sin β

3. Results and Discussions

3.1. Initial Structural Parameters

The cracking patterns of the beams after the first test are presented in Figure 5; vertical dashed lines indicate the loading point locations. The cracking pattern of beams was characterized by the formation of vertical cracks and slightly diagonal cracks, with vertical cracks being observed between the loading points. This was because in this zone, only flexural moments developed. Diagonal cracks were observed along the length of the beam between the loading points and supports, as both flexural moments and shear forces developed in this zone.
Figure 5a,b show that the crack widths and lengths of the beams with a longitudinal tension reinforcement (LTR) of 10 mm (10-N and 10-WD) were between 0.05 and 0.3 mm and 49 and 228 mm, respectively. Similarly, Figure 5c,d show that the crack widths and lengths of the beams with an LTR of 13 mm (13-N and 13-WD) were between 0.05 and 0.18 mm and 42 and 214 mm, respectively. In general, the maximum crack widths and lengths were greater nearer to the loading points. This was because in this zone, axial stresses related to both flexural and shear stresses developed together. Therefore, tension stresses, due to the combination of axial and shear stresses, were larger than those that developed along the center of beams.
On the other hand, it was observed that the maximum crack widths and lengths were greater for the beams with an LTR of 10 mm. This was because the depth of the neutral axis of the beams with an LTR of 10 mm was smaller compared to that of the beams with an LTR of 13 mm; the depth of the neutral axis was 48.6 mm and 63.0 mm for the 10 mm and 13 mm beams, respectively, determined using flexural theory (kinematic, constitutive, and equilibrium hypotheses). This effect has also been reported in other works [33,34]. It was also observed that the number of cracks in the beams with an LTR of 10 mm was smaller than that observed in the beams with an LTR of 13 mm. This was because the acting flexural moment associated with 0.6 fy was greater for beams with an LTR of 13 mm. Therefore, the cracking moment of beams with an LTR of 13 mm was reached in a larger segment compared to the beams with an LTR of 10 mm. The cracking moment strength, however, was similar for all the beams.
The load–displacement curves corresponding to the first test of the beams are presented in Figure 6. Table 2 shows the cracking load ( P cr ), together with its corresponding displacement ( cr ), and the initial stiffness of beams ( K o ). This stiffness was determined using P cr and cr . Table 2 shows that the cracking load and initial stiffness of all the beams were similar. This was because the transformed uncracked moment of inertia of the cross-sections of all the beams was also similar.

3.2. Electrochemical Parameters and Concrete Resistivity

The history of the corrosion potential, corrosion rate, and concrete resistivity of the beams is presented in Figure 7, Figure 8 and Figure 9; the threshold values for the corrosion potential, corrosion rate, and electrical resistivity of concrete specified in corresponding Mexican standards [16,18,20] are also presented. The first vertical dotted line from left to right indicates the beginning of the application of sustained loads, the second line indicates the beginning of the corrosion induction (WD), and the third and fourth lines indicate the period of no corrosion induction due to SARS-CoV-2.
Figure 7, Figure 8 and Figure 9 show that before the application of the wetting and drying cycles (day 1100), the electrochemical parameters and concrete resistivity of the beams were similar regardless of the amount of the tension steel reinforcement. These parameters indicated a low probability of corrosion, a low level of corrosion, and the considerable interconnected porosity of the concrete. After the application of the wetting and drying cycles, it was observed that the electrochemical parameters of the beams without corrosion (10-N and 13-N) remained constant. On the contrary, a change in the slope of the corrosion potential of the beams with accelerated corrosion (10-WD and 13-WD) was observed (Figure 7). A similar change was also observed in the slope of the corrosion rate and electrical resistivity of the concrete of beams with accelerated corrosion. Those changes were observed 120 days after the beginning of the wetting and drying cycles (day 1220). Prior to the no-corrosion period (day 1420), the electrochemical parameters indicated a 95% probability of corrosion, a moderate-to-high level of corrosion, and excessive interconnected porosity. It was observed that 610 days after the beginning of the wetting and drying cycles (day 1710), the corrosion potential of beams 10-WD and 13-WD was −517.9 mV and −501.4 mV, respectively, the corrosion rate was 2.28 µA/cm2 and 1.95 µA/cm2, respectively, and the electrical resistivity of the concrete was 7.45 kΩ × cm and 9.24 kΩ × cm, respectively. These parameters indicated a probability of severe corrosion, a high level of corrosion, and the excessive interconnected porosity of the concrete.
The cracking patterns of beams 10-WD and 13-WD associated with the presence of the first corrosion cracks are presented in Figure 10; corrosion cracks were observed in both beams (Figure 11). In this figure, the corrosion cracks are represented by red lines and the corresponding crack widths are shown in red. In general, horizontal corrosion cracks were parallel to the length of the LTR of the beams, and the first corrosion cracks were observed between the loading points and supports (Figure 2 and Figure 10). Corrosion cracks matched with the maximum crack widths associated with sustained loads. In addition, some crack widths associated with sustained loads increased. These cracks, together with the corrosion cracks, facilitated the access of chlorides into the concrete.
Figure 10 shows that the corrosion crack widths of beam 10-WD were between 0.1 mm and 0.3 mm. These cracks were observed 250 days after the application of the wetting and drying cycles. On the other hand, the corrosion crack widths of beam 13-WD were 0.1 mm. In this case, the first corrosion cracks were observed after 297 days of the wetting and drying cycles. It was noted that corrosion cracking occurred first in beam 10-WD compared to beam 13-WD. This was because the flexural crack widths of beam 10-WD were greater than those of beam 13-WD. As described before, wider cracks allow the access of a greater amount of chlorides into the concrete. For beam 10-WD, the corrosion potential, corrosion rate, and electrical resistivity of concrete were −429.7 mV, 2.17 µA/cm2, and 9.87 kΩ × cm, respectively. For beam 13-WD, the corrosion potential, corrosion rate, and electrical resistivity of concrete were −434.5 mV, 0.78 µA/cm2, and 7.98 kΩ × cm, respectively. In general, the electrochemical parameters indicated a 95% probability of corrosion, a moderate-to-high level of corrosion, and the excessive interconnected porosity of the concrete.
The cracking patterns of beams 10-WD and 13-WD before the second test are presented in Figure 12. It was observed that, in general, the corrosion cracks in beams increased in number, width, and length. The largest corrosion cracks were observed near to the loading points (Figure 10). The number of cracks was greater in beam 10-WD compared to beam 13-WD. The corrosion crack widths of beam 10-WD were between 0.05 mm and 1.1 mm, and the corresponding widths of beam 13-WD were between 0.05 mm and 0.80 mm. The electrochemical parameters for these beams indicated a probability of severe corrosion, a high level of corrosion, and the excessive interconnected porosity of the concrete. Additionally, the corrosion crack widths indicated a significant increment in the radial tensile stresses in the concrete due to the increment in the volume of corrosion in the LTR. These crack widths were similar to those reported in other works [28,35]. Crack widths between 0.30 mm and 5.38 mm were associated with a cross-sectional loss of the LTR of 2% and 34% [28,35]. Therefore, for a crack width of 1.1 mm (10-WD), a cross-sectional area loss of 7% in the LTR was expected, while for a crack width of 0.8 mm (13-WD), it was approximately 5%.

3.3. Structural Behavior of Beams with Corrosion

The load–displacement curves corresponding to the second test of the beams are presented in Figure 13. The failure of beams 10-N, 13-N, and 13-WD was associated with the crushing of concrete (Figure 14); the failure of beam 10-WD was associated with the fracture of the LTR (Figure 15). This fracture was located between the loading points and supports. The yielding ( P y ) and maximum load ( P m ), together with their corresponding displacements ( y and m ), are presented in Table 3, along with the secant yielding stiffness ( K y ) and secant post-yielding stiffness ( K m ). Yielding stiffness was determined using P y and y ; post-yielding stiffness was determined using P m and m .
Table 3 shows that the yielding load of beam 10-WD was 6% lower than that of beam 10-N. In addition, the maximum load of beam 10-WD was 12% lower than that of beam 10-N. In the first case, the reduction in the yielding load was associated with the cross-sectional area loss of the LTR due to corrosion. In the second case, the reduction in the maximum load was associated with the cross-sectional area loss and change in the type of failure (fracture of the LTR) observed during testing. The displacement ductility ( m / y ) of beam 10-WD was 40% greater than that of beam 10-N. This was associated with the cross-sectional area loss of the LTR. As the amount of LTR decreases, the ductility increases [36]. On the other hand, the yielding load of beam 13-WD was similar compared to that of beam 13-N. Additionally, the maximum load of beam 13-WD was 2.5% lower than that of beam 13-N. No significant reduction in the yielding and maximum loads was observed. This was because the cross-sectional area loss was small, and the failure of beams was controlled by the crushing of concrete. No significant trends were observed for yielding and post-yielding stiffness.

3.4. Cross-Sectional Area Loss of Longitudinal Steel Reinforcement

The distribution of the bar segments of the LTR of beams 10-WD and 13-WD is presented in Figure 16; the locations of the critical pits in the LTR of beams and fracture of steel are also presented. A critical pit was defined as the greatest cross-sectional area loss observed in each bar segment. Triangular and flat pits were observed in the bar segments of beams with corrosion. A triangular pit, flat pit, and fracture of steel are represented with a triangle, square, and “×” marker, respectively. Table 4 shows the number of pits, the type of critical pits, the cross-sectional area loss (SL) associated with a critical pit, and the corrosion crack width nearest to a critical pit (CW). Bar segments were identified using the nomenclature presented in Figure 16. The pitting corrosion observed in the LTR of beams 10-WD and 13-WD is presented in Figure 17.
Figure 16 and Table 4 show that a greater number of pits were developed in beam 10-WD compared to beam 13-WD. It was observed that the pits of bar segments were located between the loading points and supports of the beams. Table 4 shows that the percentage of cross-sectional area loss due to the pitting (%SL) of beam 10-WD was between 0.54% and 18.47%. In the case of beam 13-WD, the cross-sectional area loss was 6.52%. It was observed that, in general, as crack width increases, the cross-sectional area loss increases. This was associated with an increment in tensile stress in the concrete related to loading and corrosion. The fracture of the LTR of beam 10-WD was associated with the maximum cross-sectional area loss observed. Additionally, the largest corrosion crack widths (1.1 mm) were also observed in this zone (Figure 12). This indicates that the location of maximum crack widths can be associated with the location of the maximum cross-sectional area loss of steel reinforcement.

3.5. Relationship Between Electrochemical, Physical, and Structural Parameters

A summary of the electrochemical, physical, and structural parameters of the beams is presented in Table 5. It was found that before the second test of the beams under the wetting and drying cycles, the electrochemical parameters indicated a probability of severe corrosion, a high level of corrosion, and the excessive interconnected porosity of the concrete (Figure 7, Figure 8 and Figure 9). In general, the crack width (WS) and crack length (LS) associated with the sustained loads of beams 10-N and 10-WD were greater than those of beams 13-N and 13-WD. This was because the depth of the neutral axis was smaller for beams 10-N and 10-WD. The number of pits in beam 10-WD was greater than that for beam 13-WD. This was related to the maximum crack widths and lengths observed in beam 10-WD; cracks facilitated the access of chlorides into the concrete. Additionally, the lateral unit surface of a 10 mm diameter bar was smaller than that of a 13 mm diameter bar; therefore, the amount of chlorides per area was greater for the 10 mm diameter bars. The maximum crack widths associated with corrosion were observed nearest to the maximum critical pitting. The maximum cross-sectional area loss of beam 10-WD was greater than that of beam 13-WD. This was associated with the cracking related to sustained loads and the perimetral area of reinforcing bars.
The maximum load of beam 10-WD was 12% lower than that of beam 10-N. On the other hand, the maximum load of beam 13-WD was 2.5% lower than that of beam 13-N. For beam 10-WD, the ratio between the maximum load capacity loss (12%) and maximum cross-sectional area loss (18.47%) of the LTR was 0.65. For beam 13-WD, the ratio between the maximum load capacity loss (2.5%) and maximum cross-sectional area loss (6.25%) of the LTR was 0.38. A greater influence in the load capacity of beams with cross-sectional loss was observed for beam 10-WD. This was because in this case, the failure mechanism changed from the crushing of concrete to the fracture of the LTR. In the case of beam 10-WD, the behavior was mainly controlled by the steel reinforcement. In the case of beam 13-WD, the behavior was mainly controlled by the concrete.
The fracture of the LTR was observed between the loading points and supports of the beams. The widest corrosion cracks were also observed in this zone. This was because in zones with the largest cross-sectional area loss of steel reinforcement, a greater corrosion product was generated. The increment in the volume of corrosion increases the radial stress in the concrete and induces cracking. As the volume of corrosion increases, the crack widths also increase [37].
The flexural strength of reinforced concrete beams can be determined using flexural theory. For this, it is necessary to know the cross-sectional area losses due to pitting, together with the possible changes in the constitutive models of steel reinforcement with corrosion, for example, the changes in the stress–strain curve under tensile loads. The electrochemical parameters provided relevant information in the first stages of the activation of the corrosion process. However, no clear correlation was found between these parameters and cross-sectional area losses of the LTR and the strength losses of beams. In order to develop a correlation between the electrochemical parameters and cross-sectional area losses of the LTR, more studies are still needed [38,39]. This study shows that additional threshold values for the electrochemical parameters must be established based on the structural parameters.
On the other hand, it was observed that as the corrosion crack width increased, the cross-sectional area loss of the LTR increased. Therefore, there is a correlation between corrosion crack width and cross-sectional loss due to pitting in the LTR. However, it should be considered that these crack widths are a function of the diameter of the bars, the concrete cover of the LTR, and the mechanical properties of the concrete, among other factors [34,35]. It is concluded then that the correlation model between the cracking and cross-sectional area losses in the LTR must consider these factors. More studies where the electrochemical parameters, corrosion cracking, cross-sectional area losses of the LTR, and strength losses in the beams with corrosion are evaluated together are therefore needed.

4. Conclusions and Recommendations

In this work, the electrochemical, physical, and structural behaviors of reinforced concrete beams were evaluated. Two control beams without corrosion and two beams with electrochemical parameters associated with a high level of corrosion were considered. Based on the results obtained in this work, the following conclusions and recommendations are presented:
  • The initial structural behavior of beams without corrosion and with corrosion was similar. The cracking pattern of all the beams was characterized by the formation of vertical cracks in the central length and slightly diagonal cracks between the loading points and supports. The initial stiffness and cracking load were similar for beams with longitudinal tension steel reinforcement (LTR) of 10 mm and 13 mm. This was because the uncracked moment of inertia of the beams was similar.
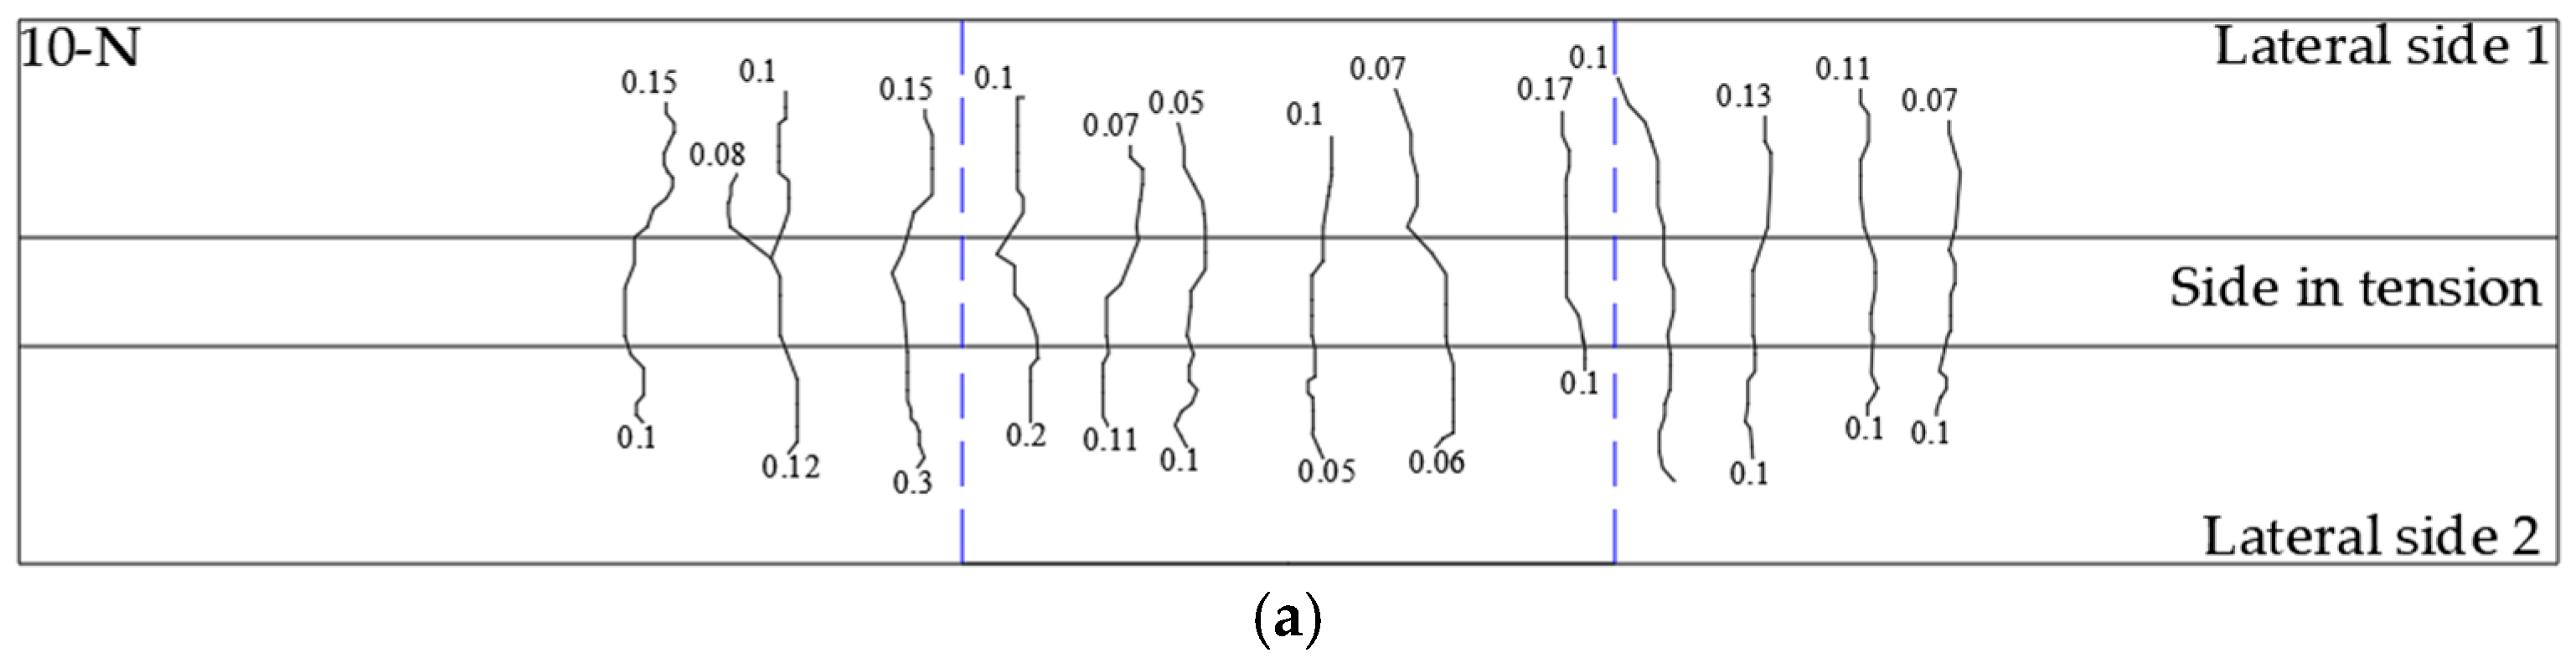
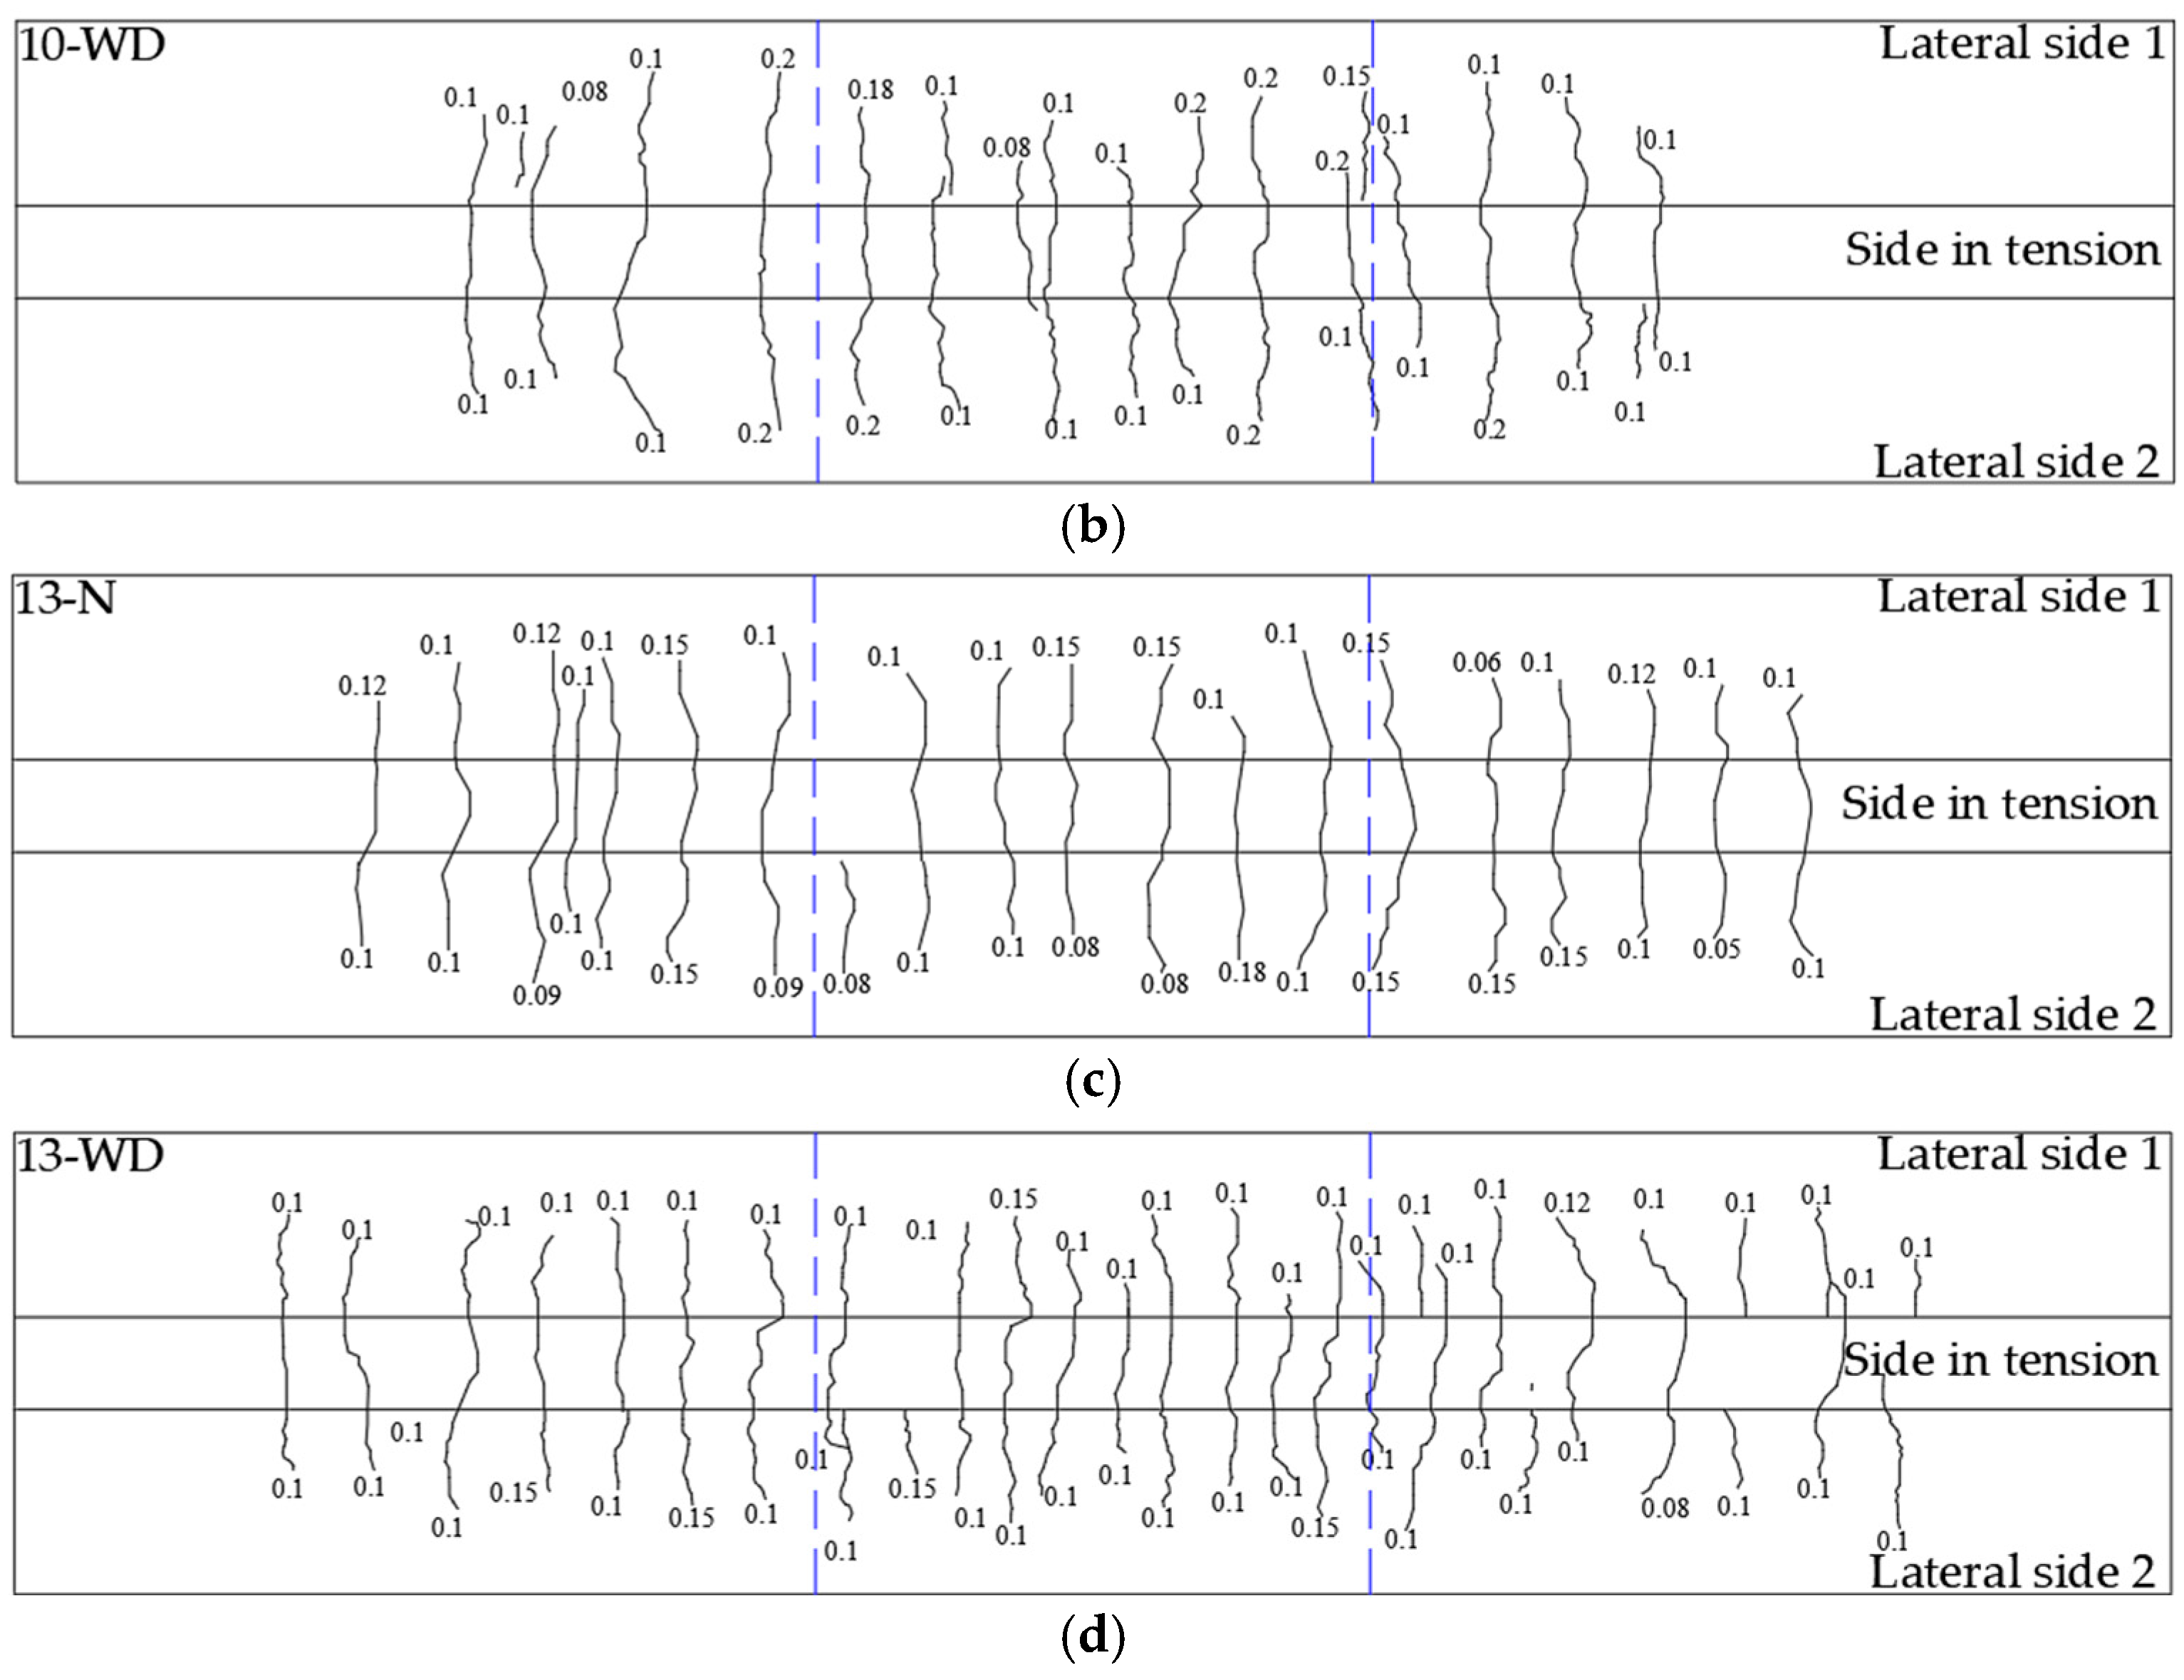
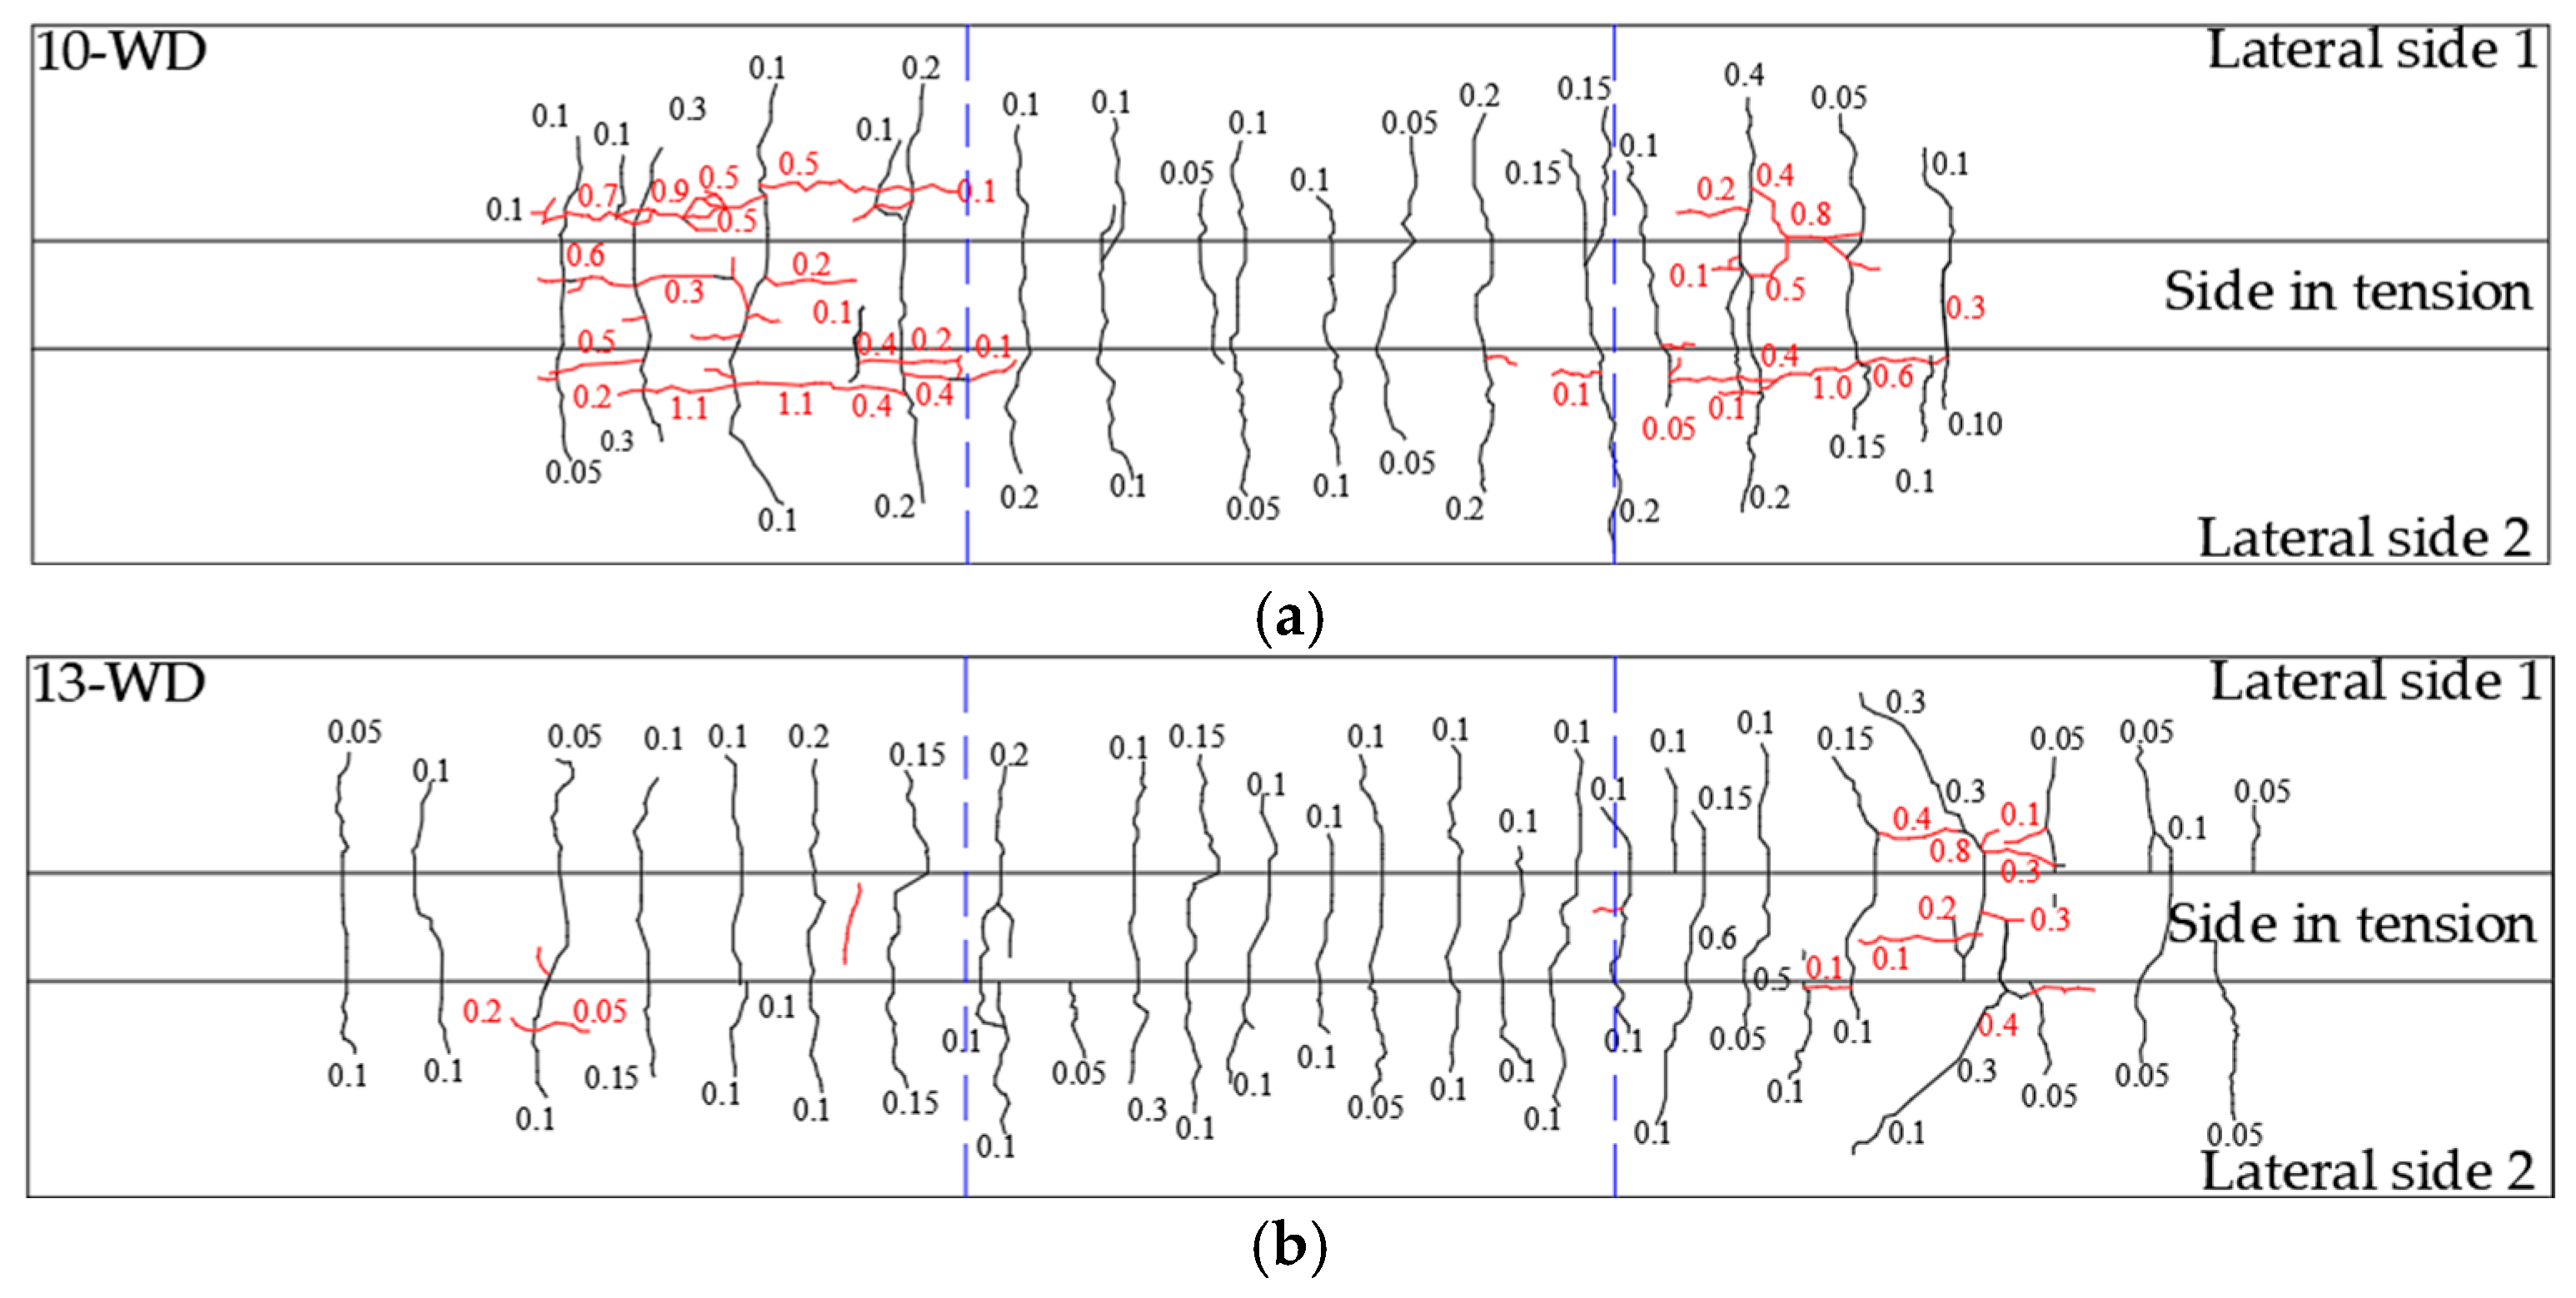
  • For a load associated with 60% of the yielding stress (0.6 fy) in the LTR, the maximum flexural crack widths and lengths were greater for beams with an LTR of 10 mm compared to beams with an LTR of 13 mm. This was because the depth of the neutral axis of the beams with an LTR of 10 mm was smaller compared to that of beams with an LTR of 13 mm. The maximum crack widths and lengths were greater nearer to the loading points. This was because in this zone, axial stresses related to flexural and shear forces developed together. Therefore, the tension stresses, due to the combination of axial and shear stresses, were larger than those developed along the center of beams.
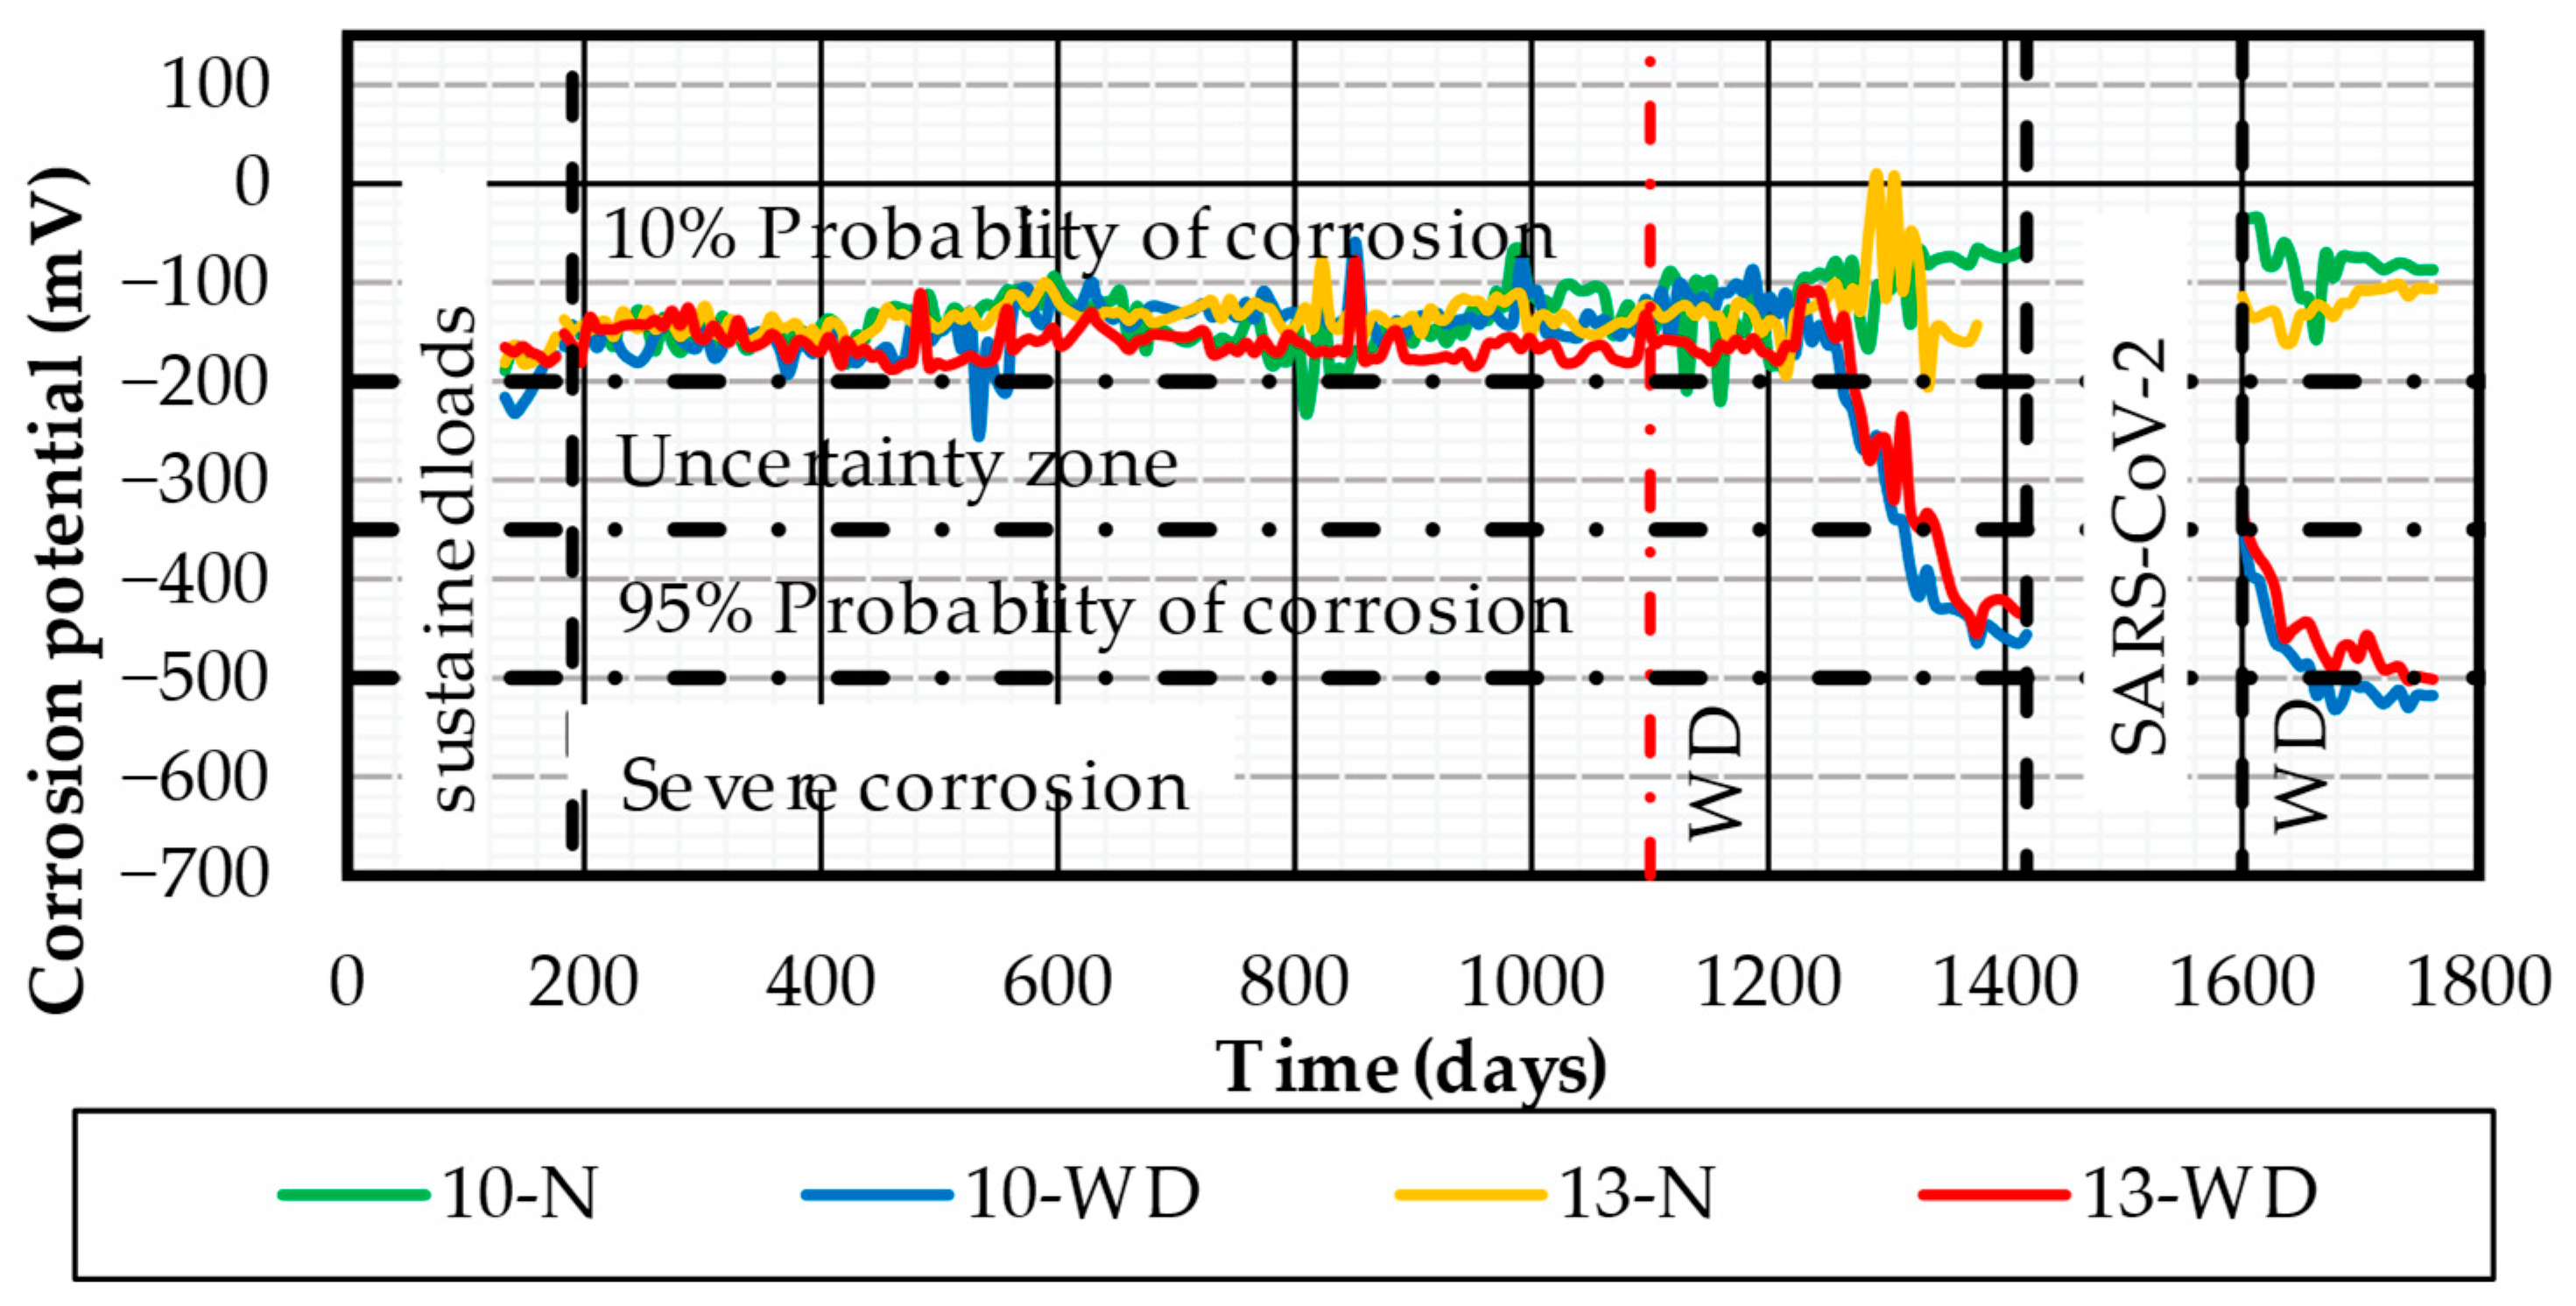
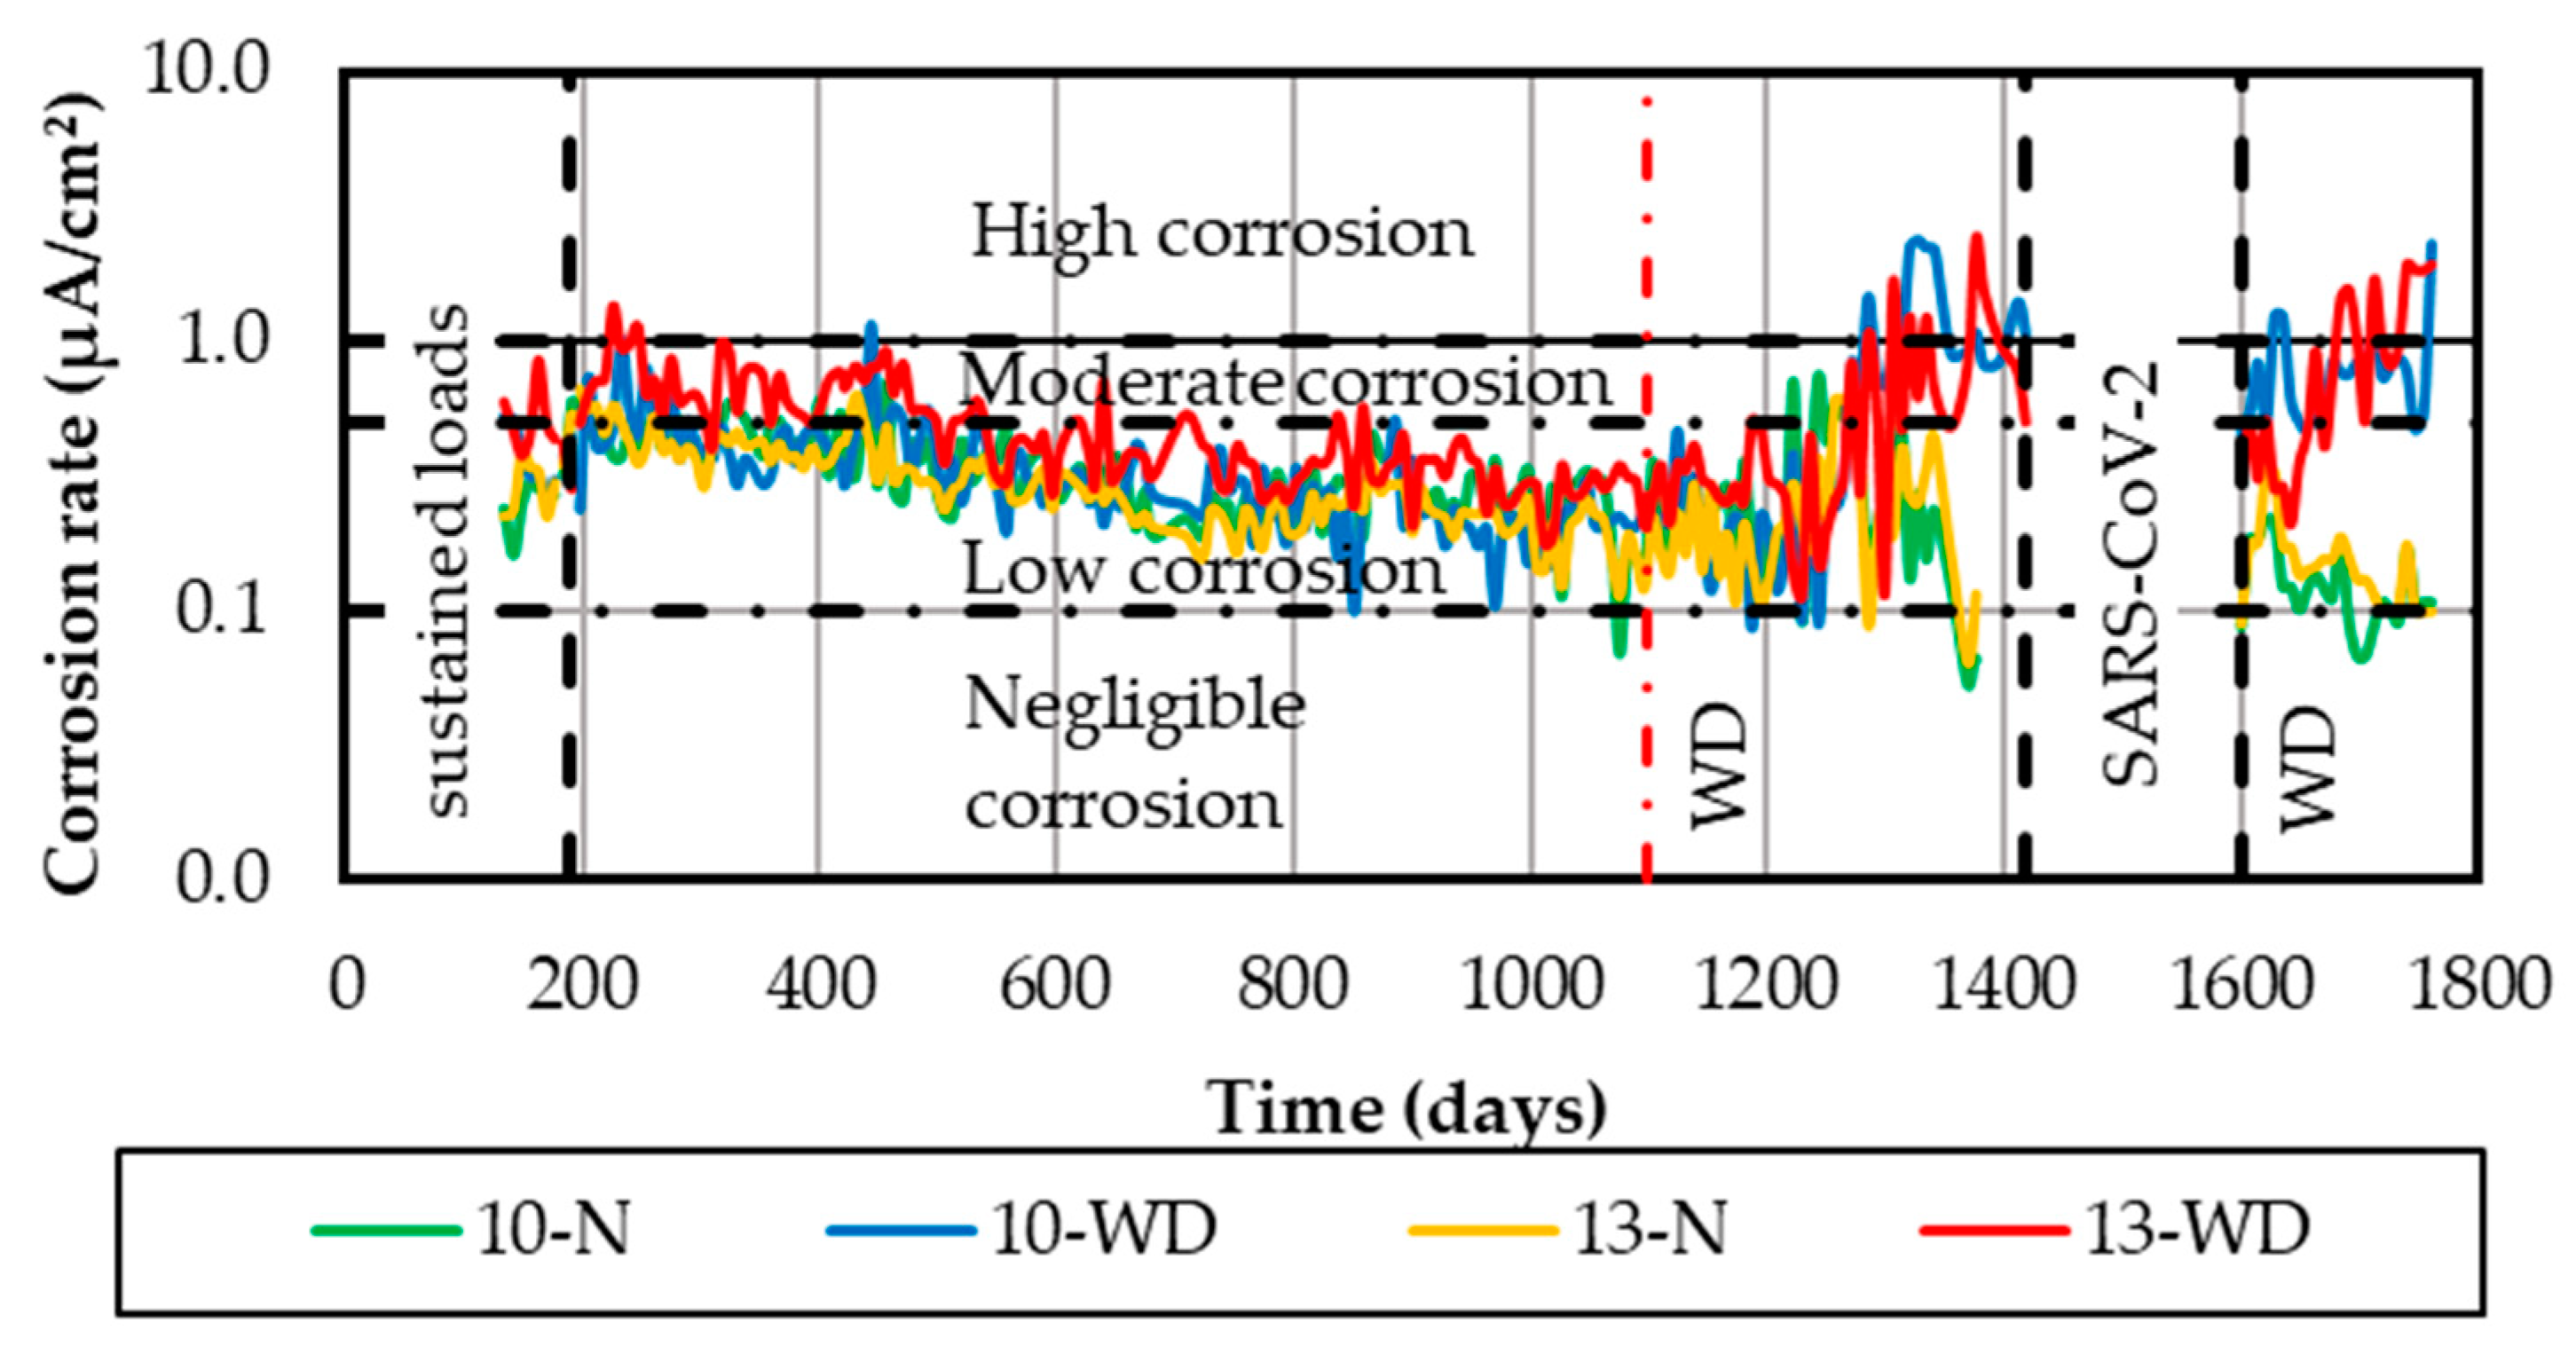
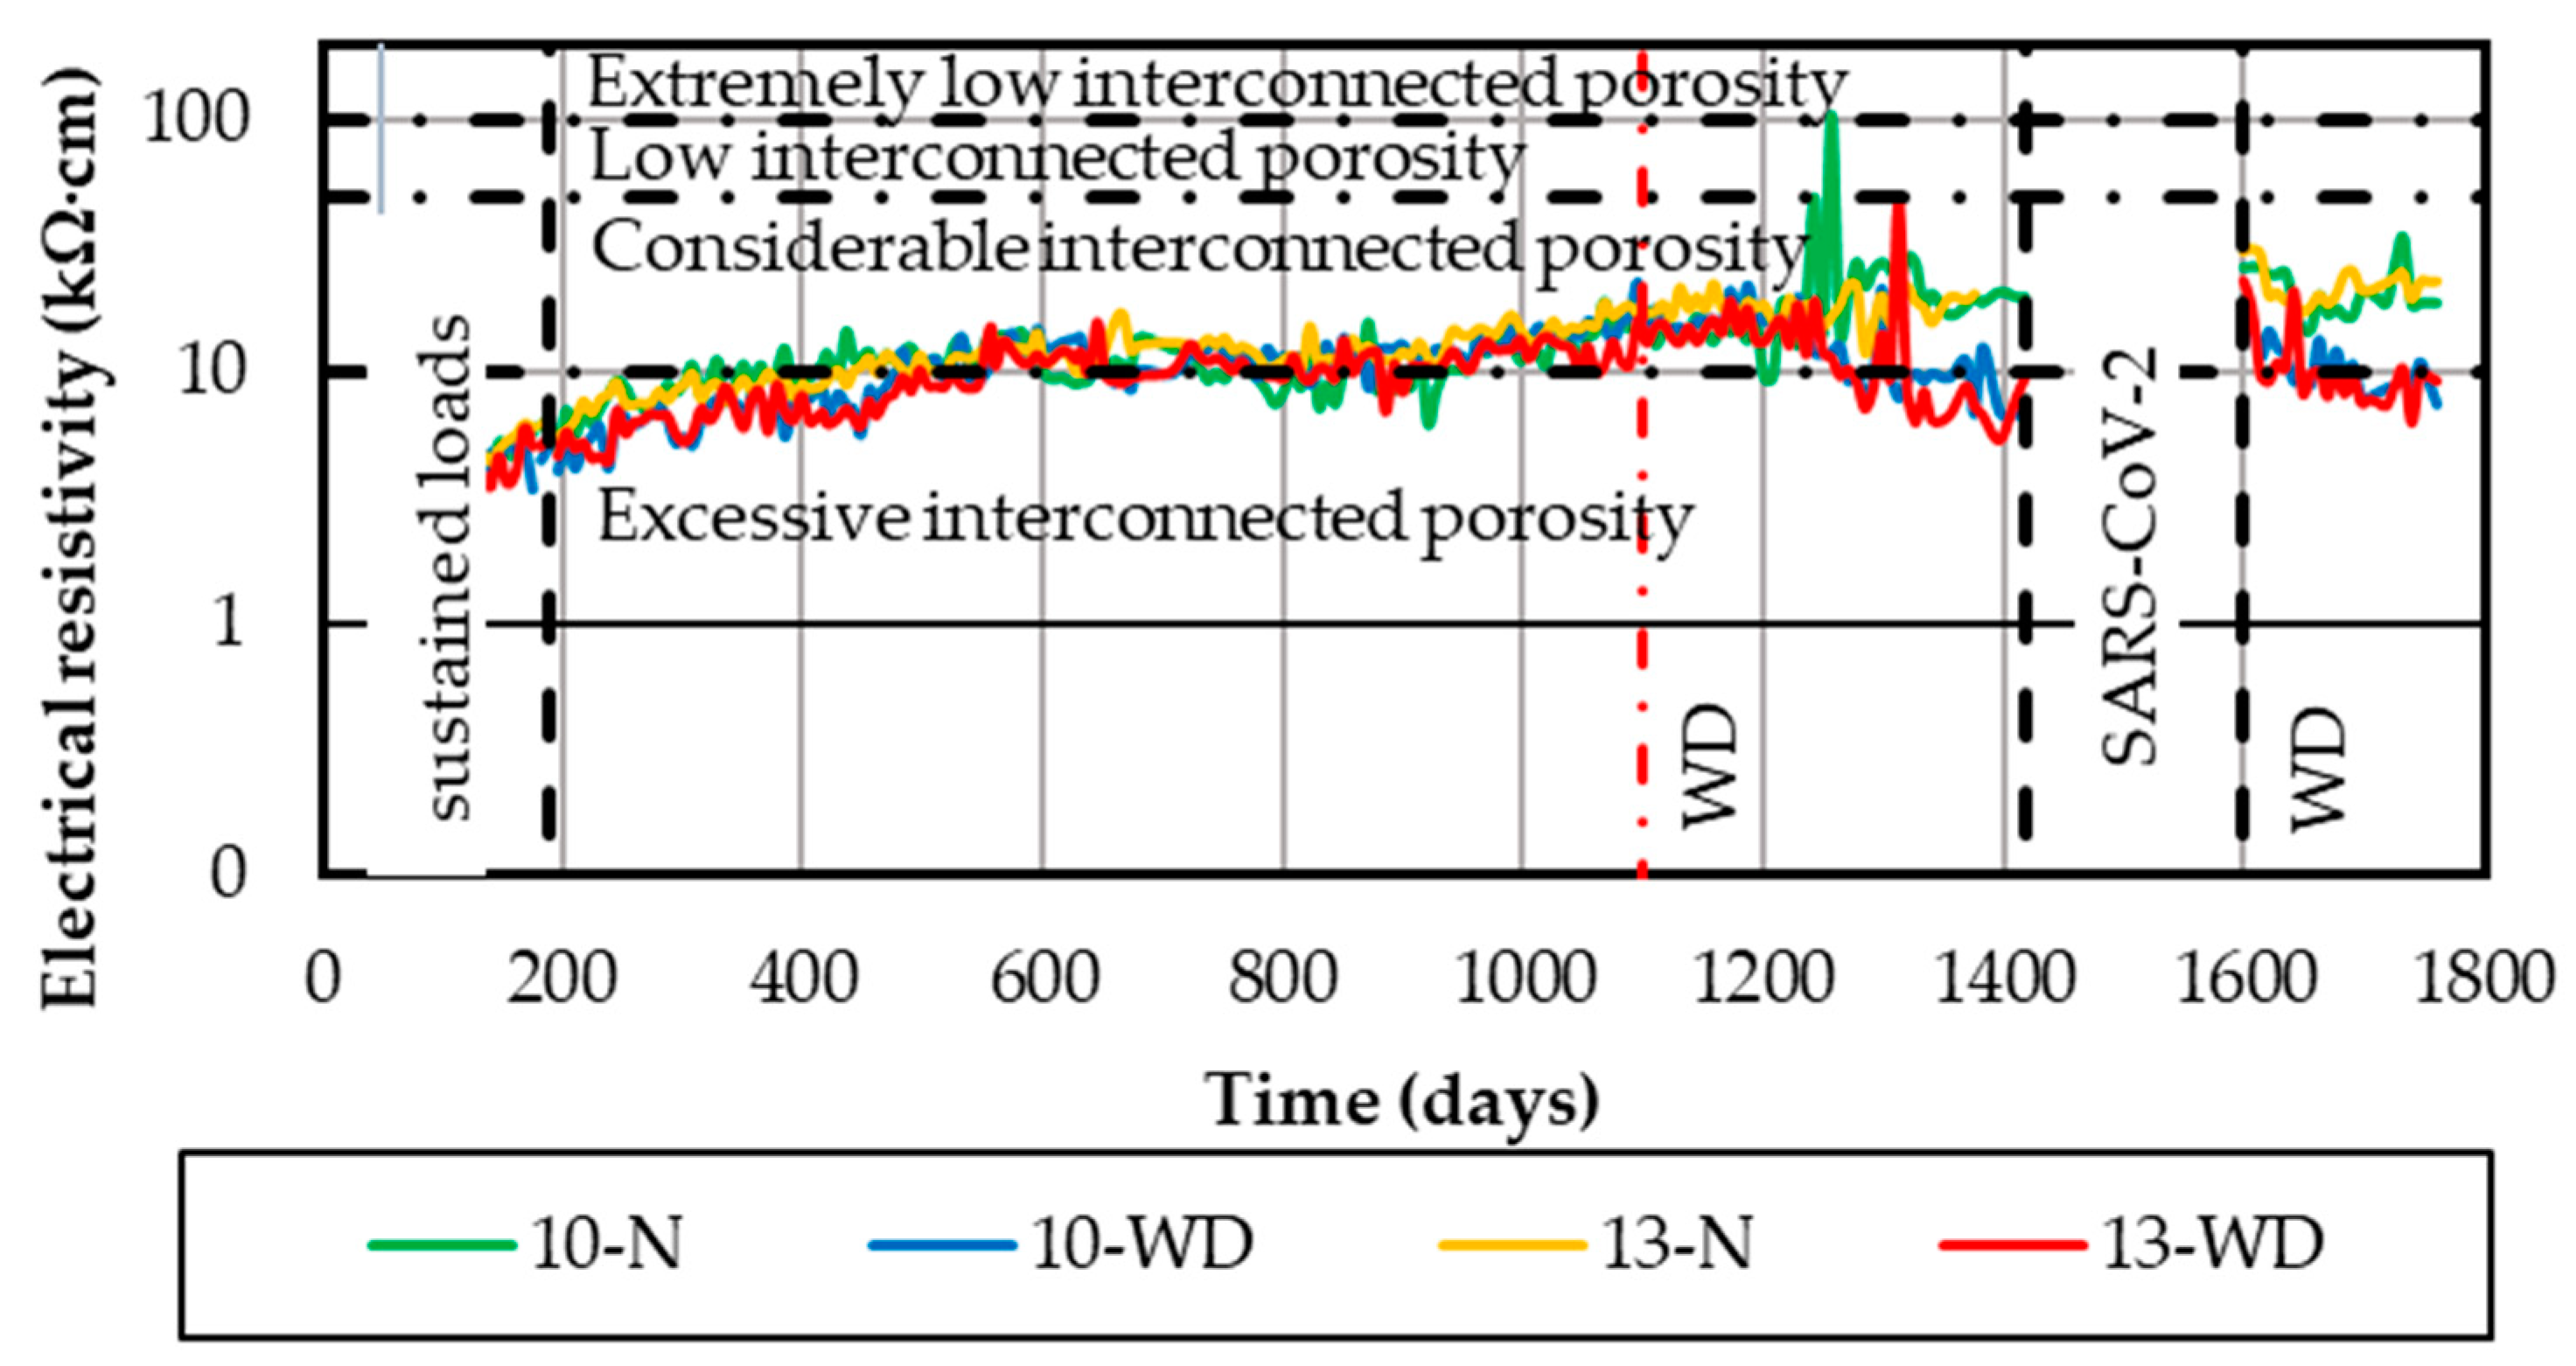
  • Before the application of the wetting and drying cycles, the electrochemical parameters were similar regardless of the amount of the LTR of beams. These parameters indicated a low probability of corrosion, a low level of corrosion, and the considerable interconnected porosity of the concrete. After the application of the wetting and drying cycles and before the testing until failure of the beams, the electrochemical parameters of the beams with an LTR of 10 mm and 13 mm indicated similar levels of corrosion. These parameters suggested a probability of severe corrosion, a high level of corrosion, and the excessive interconnected porosity of the concrete.
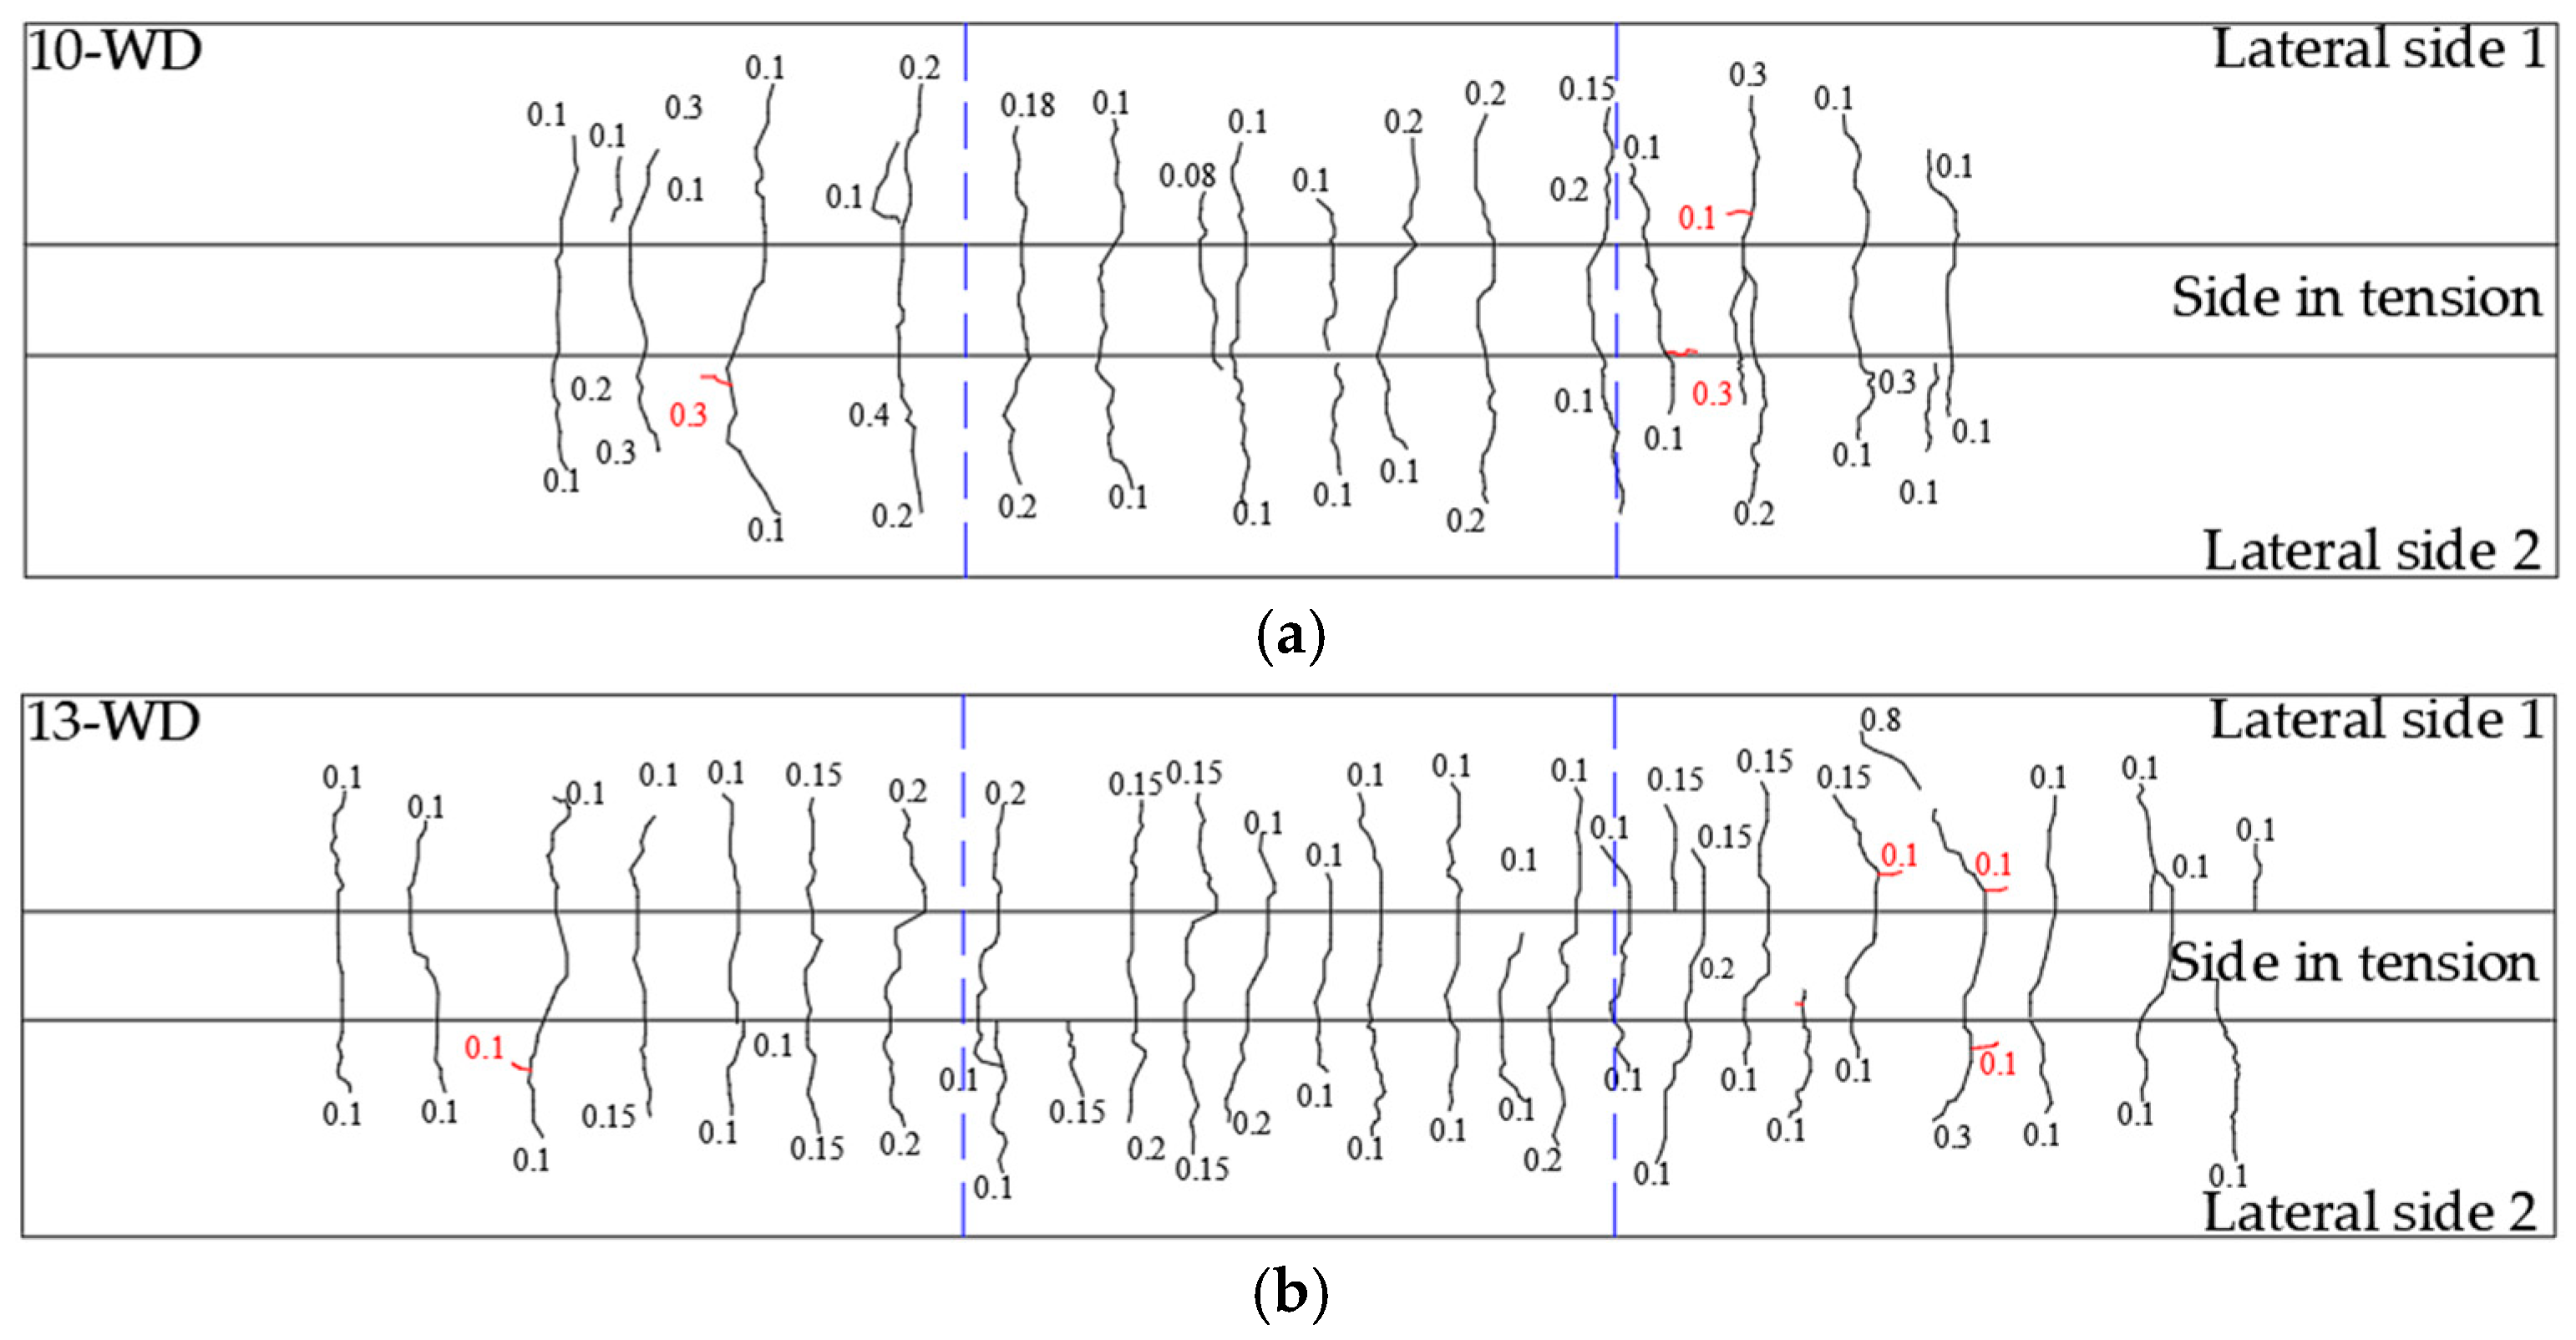
  • Cracks associated with corrosion were observed parallel to the length of the LTR of beams. The largest corrosion cracks were observed nearer to the loading points. The number of cracks was greater in beam 10-WD compared to beam 13-WD. This was associated with the increment in radial tensile stress associated with the increment in the volume of the corrosion product. This increment was greater for the LTR of beam 10-WD. Corrosion cracks matched with maximum crack widths associated with sustained loads. Corrosion crack widths indicated a significant increment in the radial tensile stresses in concrete due to the increment in the volume of the corrosion product in the LTR.
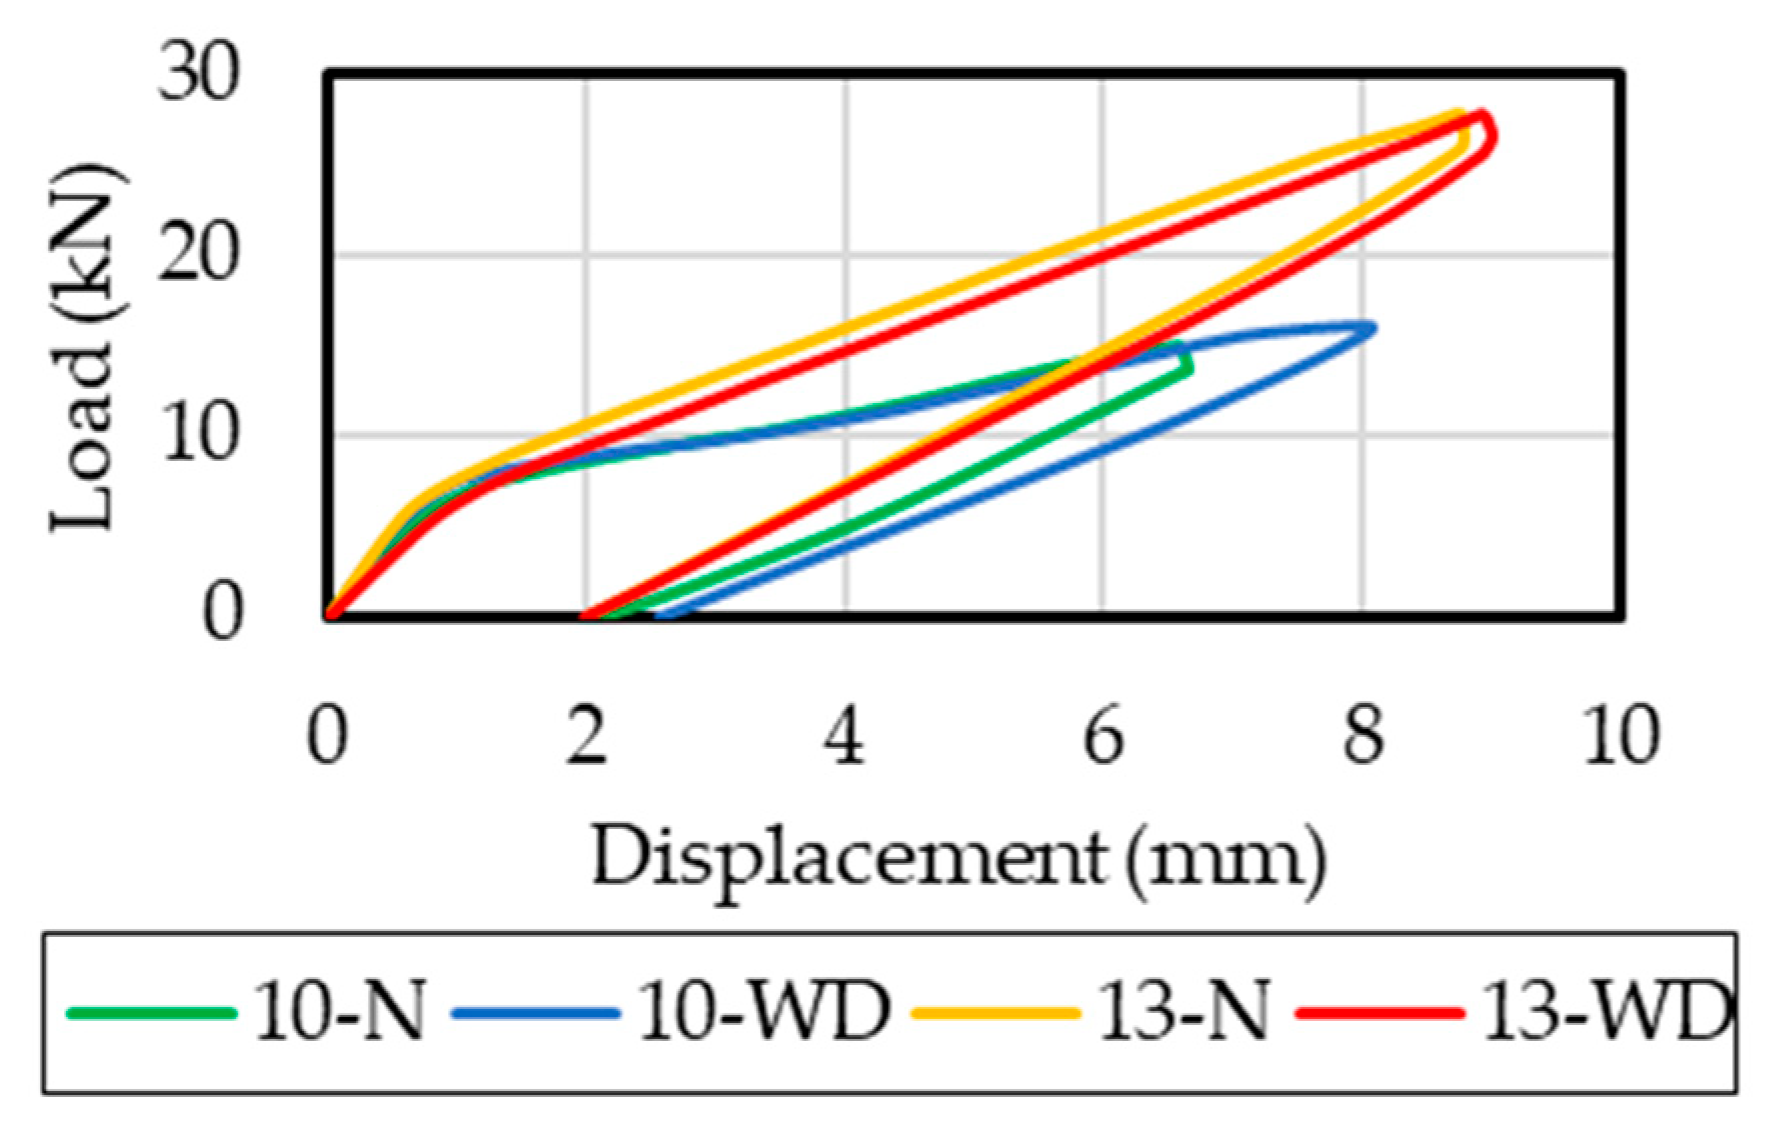
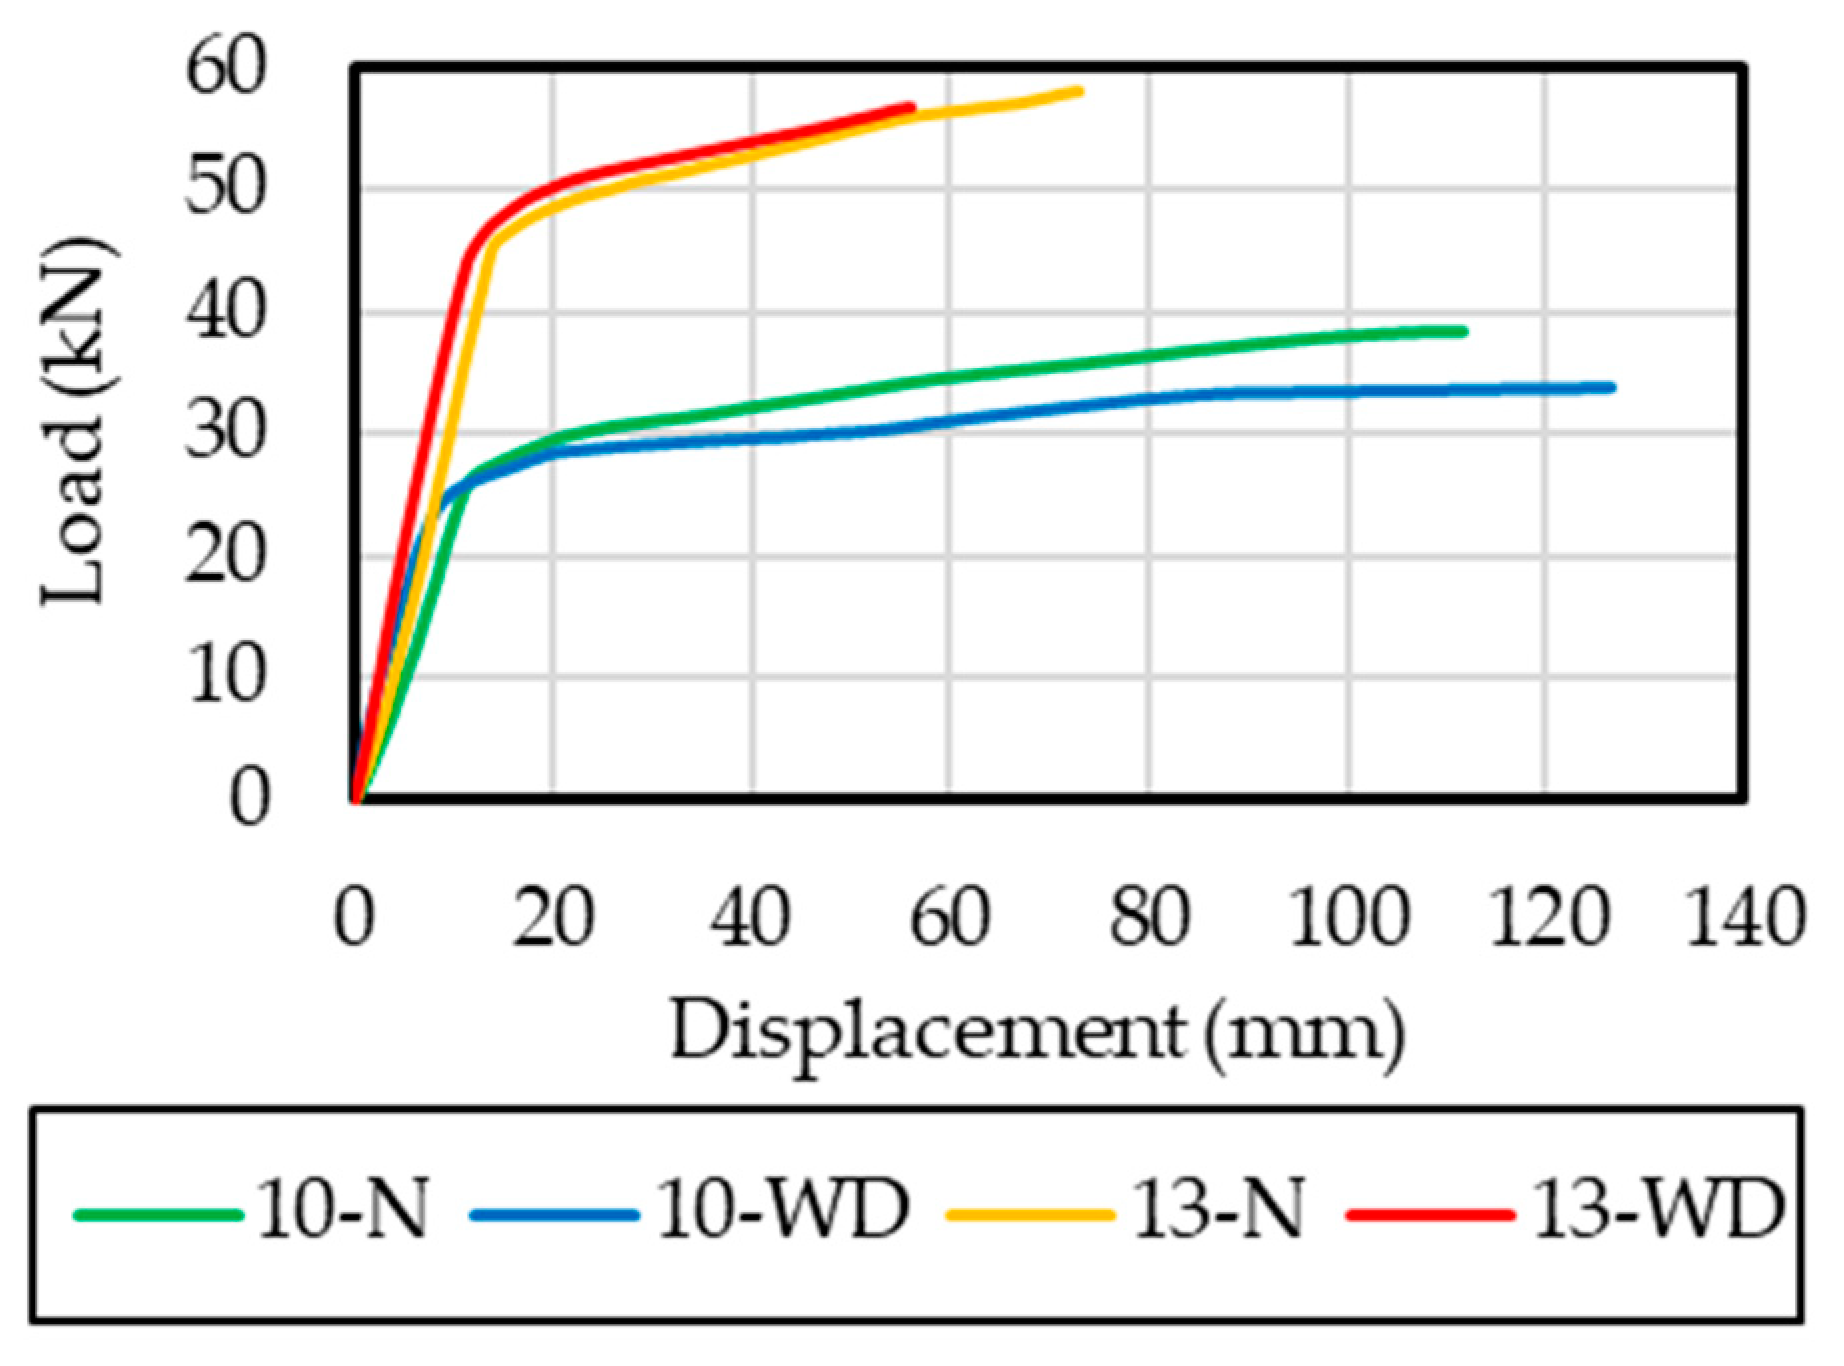
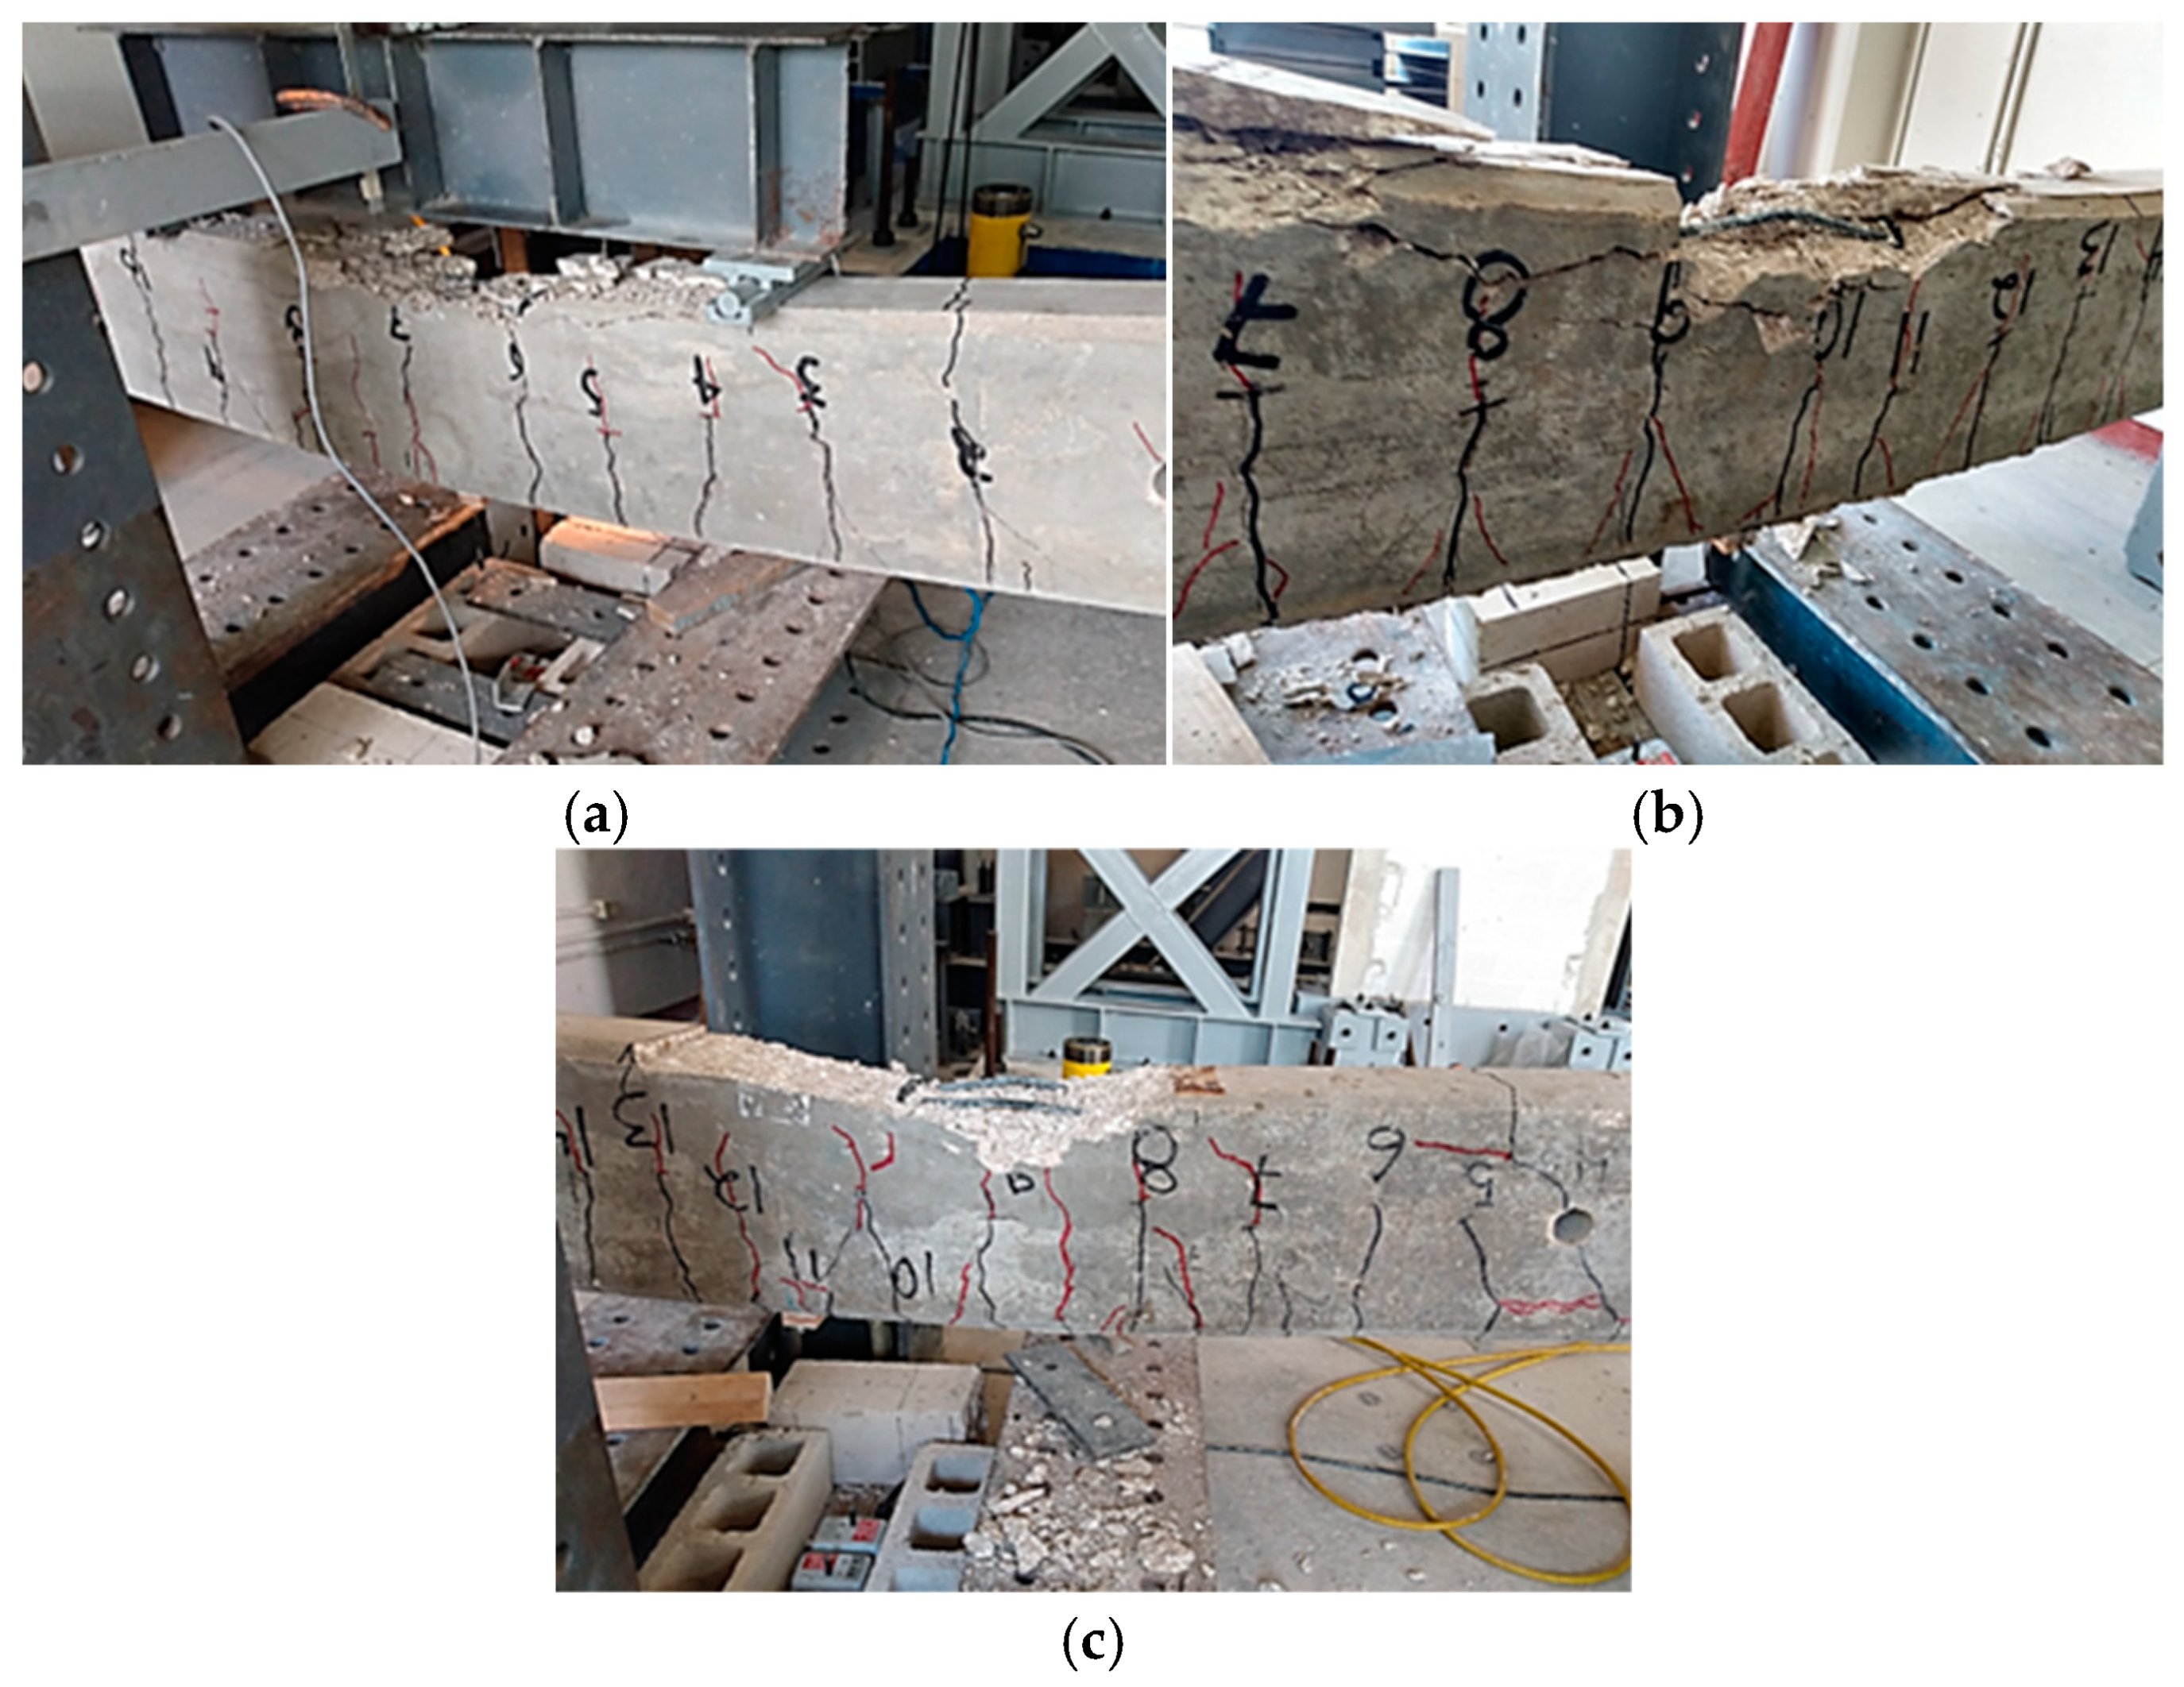
  • The yielding load of beam 10-WD was 6% lower than that of beam 10-N. Meanwhile, the yielding load of beam 13-WD was similar compared to that of beam 13-N. The maximum load of beam 10-WD was 12% lower than that of beam 10-N. On the other hand, the maximum load of beam 13-WD was 2.5% lower than that of beam 13-N. The failure of beam 10-WD was associated with the fracture of the LTR. This was because beam 10-WD had a greater cross-sectional area loss of the LTR compared to that of beam 13-WD. A greater influence in the load capacity of beams with a cross-sectional loss was observed for beam 10-WD. This was because in this case, the failure mechanism changed from the crushing of concrete to the fracture of the LTR.
  • A greater number of pits were observed in the LTR of beam 10-WD compared to that of beam 13-WD. The critical pitting of bar segments was located between the loading points and supports of beams. The percentage of cross-sectional area loss due to the pitting of beam 10-WD was between 0.54% and 18.47%. In the case of beam 13-WD, the cross-sectional area loss was 6.52%.
  • The fracture of the LTR of beam 10-WD was associated with the maximum cross-sectional area loss observed. The largest corrosion crack widths were also observed in this zone. This was because the greatest cross-sectional area loss of steel reinforcement was associated with a greater amount of corrosion product. The increment in the volume of corrosion product increased the radial stress in concrete and induced cracking. As the volume of the corrosion product increased, the crack widths also increased. This indicates that the location of maximum crack widths can be associated with the location of the maximum cross-sectional area loss of steel reinforcement.
  • The electrochemical parameters provided relevant information in the first stages of the activation of the corrosion process. However, no clear correlation was found between these parameters and the cross-sectional losses of the LTR and the strength losses of beams.
  • More studies where the electrochemical parameters, corrosion cracking, cross-sectional area losses of the LTR, and strength losses of beams with corrosion are evaluated together are required. Variables such as the bar diameter, free cover concrete of the LTR, and properties of concrete, among others, must be considered.

Author Contributions

Conceptualization, J.M.-H., J.V.-R., L.F.-B. and P.C.-B.; methodology, J.M.-H., N.V.-J., J.V.-R., L.F.-B. and P.C.-B.; validation, J.M.-H. and N.V.-J.; formal analysis, J.M.-H., N.V.-J., J.V.-R. and P.C.-B.; investigation, J.M.-H., N.V.-J., J.V.-R., L.F.-B. and P.C.-B.; resources, J.M.-H., J.V.-R. and L.F.-B.; data curation, J.M.-H. and N.V.-J.; writing—original draft preparation, J.M.-H., N.V.-J. and J.V.-R.; writing—review and editing, J.M.-H., N.V.-J., J.V.-R., L.F.-B. and P.C.-B.; visualization, J.M.-H., N.V.-J., J.V.-R. and L.F.-B.; supervision, J.M.-H., J.V.-R. and P.C.-B.; project administration, J.M.-H., J.V.-R. and L.F.-B. All authors have read and agreed to the published version of the manuscript.

Funding

The authors acknowledge the support of the Universidad Autonoma de Yucatan, as well as the scholarships that the Consejo Nacional de Humanidades, Ciencias y Tecnologias (CONAHCYT), provided to the second author.

Data Availability Statement

The raw data supporting the conclusions of this article will be made available by the authors on request.

Conflicts of Interest

The authors declare no conflicts of interest.

References

  1. Bossio, A.; Imperatore, S.; Kioumarsi, M. Ultimate Flexural Capacity of Reinforced Concrete Elements Damaged by Corrosion. Buildings 2019, 9, 160. [Google Scholar] [CrossRef]
  2. Castañeda, A.; Rodríguez, M. Las pérdidas económicas causadas por el fenómeno de la corrosión atmosférica del acero de refuerzo embebido en el hormigón armado. CENIC Cienc. Químicas 2014, 45, 52–59. (In Spanish) [Google Scholar]
  3. Koch, G.; Varney, J.; Thompson, N.; Moguissi, O.; Gould, M.; Payer, J. International Measures of Prevention, Application and Economics of Corrosion Technologies Study; NACE International: Houston, TX, USA, 2016. [Google Scholar]
  4. Figueira, R.B. Electrochemical Sensors for Monitoring the Corrosion Conditions of Reinforced Concrete Structures: A Review. Appl. Sci. 2017, 7, 1157. [Google Scholar] [CrossRef]
  5. Villagrán Zaccardi, Y.A.; Bértora, A.; Di Mario, A.A. Temperature and humidity influences on the on-site active marine corrosion of reinforced concrete elements. Mater. Struct. 2013, 46, 1527–1535. [Google Scholar] [CrossRef]
  6. Xu, S.A.; Zhang, R.; Li, R.; Qiu, B. Experimental study on the shear behavior of RC with corroded stirrups. J. Adv. Concr. Technol. 2017, 15, 7–23. [Google Scholar] [CrossRef]
  7. Elmezayen, Y.; Khattak, N.; El-Maaddawy, T. Prediction of Nonlinear Flexural Behavior of Continuous RC Beams Pre-Damaged by Corrosion. Buildings 2023, 13, 1398. [Google Scholar] [CrossRef]
  8. Zeng, B.; Wang, Y.; Gong, F.; Maekawa, K. Corrosion-Induced Cracking Pattern Analysis of RC Beam under Sustained Load Considering the Poromechanical Characteristics of Corrosion Products. Buildings 2022, 12, 2256. [Google Scholar] [CrossRef]
  9. Bahleda, F.; Prokop, J.; Koteš, P.; Wdowiak-Postulak, A. Mechanial Properties of Corroded Reinforcement. Buildings 2023, 13, 855. [Google Scholar] [CrossRef]
  10. Oyado, M.; Kanakubo, T.; Sato, T.; Yamamoto, Y. Bending performance of reinforced concrete member deteriorated by corrosion. Struct. Infrastruct. Eng. 2011, 7, 121–130. [Google Scholar] [CrossRef]
  11. Andisheh, K.; Scott, A.; Palermo, A.; Clusas, D. Influence of chloride corrosion on the effective mechanical properties of steel reinforcement. Struct. Infrastruct. Eng. 2019, 15, 1036–1048. [Google Scholar] [CrossRef]
  12. NTCC-2023; Normas Técnicas Complementarias para Diseño y Construcción de Estructuras de Concreto. Administración Pública del Distrito Federal: México City, Mexico, 2017. (In Spanish)
  13. ACI 318-19; Building Code Requirements for Structural Concrete—Commentary on Building Code Requirements for Structural Concrete (ACI 318R-19). American Concrete Institute (ACI): Farmington Hills, MI, USA, 2019.
  14. EN 1992-1-1; Eurocode 2: Design of Concrete Structures—Part I: General Rules and Rules for Buildings. European Committee for Standardization: Brussels, Belgium, 2002.
  15. NMX-C-501-ONNCCE; Industria de la Construcción—Durabilidad de Estructuras de Concreto Reforzado—Medición de Velocidad de Corrosión en Campo—Especificaciones y Método de Ensayo. Organismo Nacional de Normalización y Certificación de la Construcción y Edificación (ONNCCE): Ciudad de México, México, 2015. (In Spanish)
  16. ASTM G-59-97; Standard Test Method for Conducting Potentiodynamic Polarization Resistance Measurements. ASTM International: West Conshohocken, PA, USA, 2020.
  17. NMX-C-495-ONNCCE; Industria de la Construcción—Durabilidad de Estructuras de Concreto Reforzado—Medición de Potenciales de Corrosión del Acero de Refuerzo sin Revestir—Especificaciones y Método de Ensayo. Organismo Nacional de Normalización y Certificación de la Construcción y Edificación (ONNCCE): Ciudad de México, México, 2015. (In Spanish)
  18. ASTM C876-15; Standard Test Method for Corrosion Potentials of Uncoated Reinforced Steel in Concrete. ASTM International: West Conshohocken, PA, USA, 2015.
  19. NMX-C-514-ONNCCE; Industria de la Construcción—Resistividad Eléctrica del Concreto Hidráulico—Especificaciones y Método de Ensayo. Organismo Nacional de Normalización y Certificación de la Construcción y Edificación (ONNCCE): Ciudad de México, México, 2019. (In Spanish)
  20. ASTM C1876-24; Standard Test Method for Bulk Electrical Resistivity or Bulk Conductivity of Concrete. ASTM International: West Conshohocken, PA, USA, 2024.
  21. Moreno-Herrera, J.A.; Varela-Rivera, J.L.; Visairo-Méndez, R.; Castro-Borges, P. Flexural Behavior of Reinforced Concrete Beams with Electrochemical Parameters Associated with High Level of Corrosion. ALCONPAT 2022, 12, 422–432. (In Spanish) [Google Scholar]
  22. Wei, J.; Fu, X.X.; Dong, J.H. Corrosion Evolution of Reinforcing Steel in Concrete under Dry/Wet Cyclic Conditions Contaminated with Chloride. J. Mater. Sci. Technol. 2012, 10, 905–912. [Google Scholar] [CrossRef]
  23. Otieno, M.; Beushausen, H.; Alexander, M. Chloride-induced corrosion of steel in cracked concrete—Part I: Experimental studies under accelerated and natural marine environments. Cem. Concr. Res. 2016, 79, 373–385. [Google Scholar] [CrossRef]
  24. Ibrahim, M.; Ahmad, A.; Barry, M.S. Durability of Structural Lightweight Concrete Containing Expanded Perlite Aggregate. Int. J. Concr. Struct. M. 2020, 14, 50. [Google Scholar] [CrossRef]
  25. Rodriguez, J.; Ortega, L.M.; Casal, J. Load Carrying Capacity of Concrete Structures with Corroded Reinforcement. Constr. Build. Mater. 1997, 11, 239–248. [Google Scholar] [CrossRef]
  26. Yingshu, Y.; Yongsheng, J.; Shah, S.P. Comparison of Two Accelerated Corrosion Techniques for Concrete Structures. ACI Struct. J. 2007, 104, 344–347. [Google Scholar]
  27. Koteš, P.; Vičan, J. Reliability-based evaluation of existing concrete bridges in Slovakia according to Eurocodes. In Proceedings of the Fourth International Fib Congress 2014, Mumbai, “Improving Performance of Concrete Structures”, Mumbai, India, 10–14 February 2014; pp. 227–229. [Google Scholar]
  28. Zhu, W.; François, R.; Coronelli, D.; Cleland, D. Effect of Corrosion of Reinforcement on the Mechanical Behaviour of Highly Corroded RC Beams. Eng. Struct. 2013, 56, 544–554. [Google Scholar] [CrossRef]
  29. Zhanzhan, T.; Zhixiang, H.; Zheng, C.; Lingkun, C.; Hanyang, X.; Hanqing, Z. Experimental and Numerical Study on Ultimate Shear Load Carrying Capacity of Corroded RC Beams. Adv. Civ. Eng. 2021, 2021, 4848483. [Google Scholar]
  30. ASTM A370-24; Standard Test Methods and Definitions for Mechanical Testing of Steel Products. ASTM International: West Conshohocken, PA, USA, 2024.
  31. ASTM C39/C39M-24; Standard Test Method for Compressive Strength of Cylindrical Concrete Specimens. ASTM International: West Conshohocken, PA, USA, 2024.
  32. Otieno, M.; Golden, G.; Alexander, M.; Beushausen, H. Acceleration of steel corrosion in concrete by cyclic wetting and drying effect of drying duration and concrete quality. Mater. Struct. 2019, 52, 50. [Google Scholar] [CrossRef]
  33. ASTM G1-90; Standard Practice for Preparing, Cleaning, and Evaluating Corrosion Test Specimens. ASTM International: West Conshohocken, PA, USA, 1999.
  34. Gergely, P.; Lutz, L.A. Maximum Crack Width in Reinforced Concrete Flexural Members. Am. Concr. Inst. 1968, 10, 87–117. [Google Scholar]
  35. Goszczyńska, B.; Trąmpczyński, W.; Tworzewska, J. Analysis of Crack Width Development in Reinforced Concrete Beams. Materials 2021, 14, 3043. [Google Scholar] [CrossRef] [PubMed]
  36. Wight, J.K. Reinforced Concrete Mechanics and Design, 7th ed.; Pearson Education Limited: Edinburgh Gate, Harlow, UK, 2016. [Google Scholar]
  37. Ye, H.; Fu, C.; Jin, N.; Jin, X. Performance of reinforced concrete beams corroded under sustained service loads: A comparative study of two accelerated corrosion techniques. Constr. Build. Mater. 2018, 162, 286–297. [Google Scholar] [CrossRef]
  38. Shaikh, F.U.A. Effect of Cracking on Corrosion of Steel in Concrete. Int. J. Concr. Struct. Mater. 2018, 12, 3. [Google Scholar] [CrossRef]
  39. Yu, B.; Yang, L.; Wu, M.; Li, B. Practical model for predicting corrosion rate of steel reinforcement in concrete structures. Constr. Build. Mater. 2014, 54, 385–401. [Google Scholar] [CrossRef]
Figure 1. Four-point load system: (a) schematic view; (b) actual view.
Buildings 15 00266 g001aBuildings 15 00266 g001b
Figure 2. Sustained load system: (a) schematic view; (b) actual view.
Buildings 15 00266 g002
Figure 3. Beams under the corrosion technique.
Buildings 15 00266 g003
Figure 4. Types of pits: (a) bar with pits; (b) pit dimensions.
Buildings 15 00266 g004
Figure 5. Cracking pattern after the first test (crack widths in mm): (a) beam 10-N; (b) beam 10-WD; (c) beam 13-N; (d) beam 13-WD. The blue dashed lines indicate the location of the loading points.
Buildings 15 00266 g005aBuildings 15 00266 g005b
Figure 6. Load–displacement curves of the first test of the beams.
Buildings 15 00266 g006
Figure 7. History of corrosion potential.
Buildings 15 00266 g007
Figure 8. History of corrosion rate.
Buildings 15 00266 g008
Figure 9. History of concrete resistivity.
Buildings 15 00266 g009
Figure 10. Cracking patterns associated with the first corrosion cracks: (a) beam 10-WD; (b) beam 13-WD. The blue dashed lines indicate the location of the loading points.
Buildings 15 00266 g010
Figure 11. Corrosion cracks: beam 10-WD (a) center and (b) loading point; beam 13-WD (c) center and (d) loading point.
Buildings 15 00266 g011
Figure 12. Cracking patterns before the second test: (a) beam 10-WD; (b) beam 13-WD. The blue dashed lines indicate the location of the loading points.
Buildings 15 00266 g012
Figure 13. Load–displacement curves of the second test of the beams.
Buildings 15 00266 g013
Figure 14. Crushing of concrete in the beams: (a) beam 10-N; (b) beam 13-N; and (c) beam 13-WD.
Buildings 15 00266 g014
Figure 15. Failure of beam 10-WD: (a) general view after the second test; (b) fracture of the longitudinal tension reinforcement, the red circle indicates the location of the fracture; (c) close-up of the fracture of the bar.
Buildings 15 00266 g015
Figure 16. Location of critical pits for the beams with corrosion: (a) bars of beam 10-WD; (b) bars of beam 13-WD.
Buildings 15 00266 g016
Figure 17. Pitting corrosion LTR of beams: (a) bar segments of beam 10-WD; (b) bar segment of beam 13-WD.
Buildings 15 00266 g017
Table 1. Mix proportion for a cubic meter of fresh concrete.
Portland
Cement (kg)
Water (kg)Coarse
Aggregate (kg)
Fine
Aggregate (kg)
fc (MPa)
391.30231.90758.91671.9926.96
Table 2. Initial structural parameters of beams.
Beam P cr
(kN)
cr
(mm)
K o
(kN/mm)
10-N7.011.106.40
10-WD7.491.007.47
Average7.251.056.93
13-N7.400.937.95
13-WD7.781.395.60
Average7.591.166.78
Table 3. Structural parameters of the beams.
Beam P y
(kN)
y
(mm)
P m
(kN)
m
(mm)
K y
(kN/mm)
K m
(kN/mm)
10-N28.1716.0738.40115.181.750.33
10-WD26.4112.8533.86129.182.060.26
13-N45.6213.9258.6674.273.280.79
13-WD46.0712.6857.2556.243.631.02
Table 4. Cross-sectional area loss of critical pits and the nearest corrosion crack widths.
BeamBarNumber of PitsType of Critical PitSL
(mm2)
%SLCW
10-WDLS1-10-26Flat6.018.580.9
LS1-10-52Triangular2.143.060.8
LS2-10-13Triangular1.131.61---
LS2-10-28Triangular1.902.710.5
LS2-10-57Triangular0.370.540.4
F-104Flat12.9518.471.1
13-WDLS2-13-21Triangular6.886.520.2
Table 5. Summary of the parameters of the beams.
Parameters10-N10-WD13-N13-WD
Ecorr (mV)−87.10−517.80−106.23−501.40
icorr (µA/cm2)0.112.280.091.95
Res (kΩ × cm)18.907.4522.709.24
WS (mm)0.05–0.300.08–0.200.05–0.180.08–0.15
LS (mm)75–22149–22892–20642–214
NP-30-1
CW (mm)-1.10-0.80
%SL-18.47-6.52
TP-Flat-Triangular
P y (kN)28.1726.4145.6246.07
P m (kN)16.0712.8513.9212.68
TFCrushing
of concrete
Fracture
of LTR
Crushing
of concrete
Crushing
of concrete
Disclaimer/Publisher’s Note: The statements, opinions and data contained in all publications are solely those of the individual author(s) and contributor(s) and not of MDPI and/or the editor(s). MDPI and/or the editor(s) disclaim responsibility for any injury to people or property resulting from any ideas, methods, instructions or products referred to in the content.

