Article

Optimizing University Campus Functional Zones Using Landscape Feature Recognition and Enhanced Decision Tree Algorithms: A Study on Spatial Response Differences Between Students and Visitors

1
College of Landscape Architecture and Art, Fujian Agriculture and Forestry University, Fuzhou 350002, China
2
College of Economics and Management, Fujian Agriculture and Forestry University, Fuzhou 350002, China
3
Department of Financial and Business Systems, Faculty of Agribusiness and Commerce, Lincoln University, Christchurch 7647, New Zealand
*
Author to whom correspondence should be addressed.
These authors contributed equally to this work.
Buildings 2025, 15(19), 3622; https://doi.org/10.3390/buildings15193622
Submission received: 4 September 2025 / Revised: 18 September 2025 / Accepted: 4 October 2025 / Published: 9 October 2025

Abstract

As universities become increasingly open, campuses are no longer only places for study and daily life for students and faculty, but also essential spaces for public visits and cultural identity. Traditional perception evaluation methods that rely on manual surveys are limited by sample size and subjective bias, making it challenging to reveal differences in experiences between groups (students/visitors) and the complex relationships between spatial elements and perceptions. This study uses a comprehensive open university in China as a case study to address this. It proposes a research framework that combines street-view image semantic segmentation, perception survey scores, and interpretable machine learning with sample augmentation. First, full-sample modeling is used to identify key image semantic features influencing perception indicators (nature, culture, aesthetics), and then to compare how students and visitors differ in their perceptions and preferences across campus spaces. To overcome the imbalance in survey data caused by group–space interactions, the study applies the CTGAN method, which expands minority samples through conditional generation while preserving distribution authenticity, thereby improving the robustness and interpretability of the model. Based on this, attribution analysis with an interpretable decision tree algorithm further quantifies semantic features’ contribution, direction, and thresholds to perceptions, uncovering heterogeneity in perception mechanisms across groups. The results provide methodological support for perception evaluation of campus functional zones and offer data-driven, human-centered references for campus planning and design optimization.

1. Introduction

University campuses are central places for knowledge transmission, talent development, and symbolic spaces that reflect cultural traditions and social interaction [1]. Within them, campus functional zones serve not just to connect buildings, but also to support diverse activities such as learning, leisure, and communication [2]. Studies have shown that green infrastructure and multifunctional nodes can help promote mental health and social interaction [3,4]. At the same time, with their cultural atmosphere and landscape appeal, universities are increasingly becoming “semi-public” landscape resources within cities. In the context of cultural and tourism integration, they attract visitors and serve as essential carriers of urban image and cultural communication [5,6,7,8,9].
Existing research has focused chiefly on students, showing that the visibility, layout, accessibility, and landscape design of campus functional zones significantly affect their frequency of use and comfort [10,11,12]. Shade, quietness, and scenic views are also key factors for staying in these spaces [11,13]. Even under unfavorable weather conditions, students still prefer outdoor areas of campus functional zones [10]. Green spaces and natural elements have improved mental health and satisfaction, while short-term exposure can enhance resilience and creativity [14]. At the same time, students generally regard campus functional zones as essential for rest and social interaction, positively influencing their well-being and sense of belonging [15,16]. With increasing campus openness, research has gradually expanded to include tourism perspectives. Connell (1996) highlighted the need to balance the interests of universities, students, and visitors in using campus spaces [17]. Cheng et al. (2020) noted that landmark buildings are the core attractions for visitors [18]. McManus et al. (2021) showed how visitors reconstruct spaces’ physical and symbolic meaning through social media [19]. Almeida and Silveira (2022) further pointed out that different types of visitors show varied preferences for campus spaces, including prospective students, residents, and highly educated family groups with children [20].
Although previous studies have shown that campus spaces play an essential role in environmental experience and tourism, there are still three main limitations. First, most research has focused on a single group, lacking systematic comparisons between students, faculty, and visitors. Second, while traditional surveys and interviews can capture subjective experiences, they struggle to reveal the complex and non-linear relationships between spatial features and perception. They are also often affected by data imbalance (such as too few visitor samples or extreme ratings), which weakens the detection of differences and thresholds and may lead to biased results. Third, existing studies have paid insufficient attention to the discrepancies between campus functional zones. Evaluations often stay at the overall or green-space level, without detailed comparisons across other types of spaces.
The research questions addressed in this paper are: How can suggestions for campus space optimization be made from the perspective of multi-group perception? How can the issue of imbalanced high and low score samples in traditional questionnaire surveys be resolved? How can the functional areas of the campus be effectively divided based on the results of explainable machine learning?
To address these limitations, this study developed an integrated framework combining landscape feature recognition, interpretable machine learning, and spatial clustering, using a Chinese comprehensive open university as a case study. First, perception surveys were conducted among students and tourists to collect subjective ratings across three dimensions: natural, cultural, and aesthetic aspects. Second, the study employed the Mask2Former model to extract campus landscape features and used the CTGAN algorithm to augment data for samples with extremely high and low scores. An “enhanced decision tree–SHAP” model was then developed to identify key landscape features influencing student and tourist perceptions, while analyzing the threshold effects of these features. Finally, based on the spatial distribution of these influential features, the campus was divided into different functional zones. By integrating driving mechanisms with spatial effects, the study proposes a “group–context” interaction model, from which optimization strategies for functional zones are derived, providing evidence-based guidance for inclusive design in open campuses. The innovation of this research lies in:
First, this study employs the Mask2Former model to conduct semantic segmentation on campus street view images, obtaining objective measurements of natural elements, architectural forms, and facility layouts. These segmentation results are then combined with questionnaire survey scores from both students and visitors. Previous campus landscape research typically focused solely on students, overlooking visitor perceptions at open universities. However, studying visitor perceptions helps optimize campus spaces from an external perspective and enhances institutional reputation. By integrating image semantic segmentation with multi-group perceptions, this study compares how students and visitors differ in their sensitivity, preferences, and thresholds regarding campus spatial characteristics. This analysis identifies synergies between “teaching-daily use” and “visiting-short-term experience” functions. The research provides a valuable complement to existing studies by optimizing campus landscapes through a multi-group perception approach.
Second, this study introduces methodological innovations compared to previous research. Earlier studies overlooked a critical issue: sample imbalance in participants’ perceptual ratings. For instance, on a 1–7 scale, participants rarely assign extreme scores of 1 or 7, resulting in limited samples at these endpoints. However, the underlying factors driving these extreme ratings contain valuable insights and warrant increased representation in the dataset. This research innovatively employs Conditional Tabular Generative Adversarial Networks (CTGAN) to augment extreme high and low scoring samples, combined with SHAP-enabled interpretable decision trees and ensemble tree models to analyze the importance and thresholds of semantic features. This approach offers two key advantages: First, it enables the model to better capture the critical factors driving very high or very low perceptual scores, providing more precise guidance for subsequent landscape optimization. Second, regarding model performance, integrating CTGAN with SHAP-based interpretable tree models achieves lower error rates than single interpretable models while maintaining explainability of perceptual differences between students and visitors.
Finally, this study offers a novel perspective on research content by projecting key landscape elements that influence student and visitor groups onto spatial maps and comparing them with street view images to identify governance units, including green-blue ecological corridors, academic and cultural axes with structural nodes, aesthetic enhancement zones along interfaces, gateway and landmark display areas, and open activity or hard-surfaced plazas. These findings directly translate group perceptual differences into functional zone planning strategies. Compared to existing studies that typically rely on overall evaluations or focus on single groups without connecting features.
Based on the above analysis, this study achieved fine-grained recognition of visual elements and multidimensional analysis of perception differences in its methods. In content, it expanded the pathways for campus landscape optimization from both student and visitor perspectives. Together, these contributions provide a practical technical framework and reference for refined design and functional zone optimization in open university spaces.
This paper is organized into six chapters: Chapter 2 reviews the theoretical foundations; Chapter 3 develops the integrated methodological framework; Chapter 4 presents the empirical impact analysis; Chapter 5 discusses the research findings; and Chapter 6 concludes with a summary and future directions.

2. Literature Review and Theory

2.1. Literature Review

2.1.1. Analysis of Spatial Perception Differences Among Multiple Campus User Groups

As a composite public space, the campus must meet the diverse needs of university members and the wider public [21]. Environmental psychology shows that group perception differences stem from functional needs, cultural background, and psychological expectations [22]. In this context, place attachment has become essential for understanding such differences. Lewicka (2011) noted that it includes three dimensions: cognitive, emotional, and behavioral [23]. Scannell and Gifford (2010) proposed a tripartite framework that emphasizes the interaction of “person–psychological process–place,” showing that students tend to form functional attachment through daily use, while visitors more often build emotional connections through cultural symbols [24]. Williams and Vaske (2003) further divided place attachment into “place identity” and “place dependence,” offering valuable tools for analyzing group perception differences [25].
From the student perspective, as frequent campus users, their spatial perceptions are strongly utility-oriented, mainly focusing on academic support, social interaction, and restorative experiences [26,27]. Studies show that students prefer areas with seating, shade, and opportunities for socializing, and they often use informal spaces when formal ones are lacking [21]. At the same time, campus green spaces have been proven to reduce stress and restore attention, with students favoring natural, quiet, and socially supportive environments [28]. These preferences highlight students’ core needs for stress relief and social support within the campus.
In contrast, visitors’ perceptions are more oriented toward cultural experience, focusing mainly on cultural identity, aesthetic appreciation, and symbolic meaning [29]. Their evaluations place greater emphasis on architectural style, historical and cultural significance, and landscape aesthetics [30,31,32]. In addition, visitors’ place attachment often depends on the length of stay, the diversity of activities, and the depth of exploration. Their spatial perceptions rely more on short-term sensory and cultural impressions than long-term functional needs.
The familiarity effect and social identity are key explanatory paths for group differences. Through long-term study and life on campus, students are more familiar with the environment and thus more likely to develop positive emotions and attachment. At the same time, visitors rely mainly on sensory impressions to make judgments [33,34]. At the same time, social identity strongly shapes spatial perception: students, as insiders, experience a sense of belonging and identification, whereas visitors, viewing from an “outsider” perspective, place greater emphasis on aesthetics and cultural experience [35].
In summary, the spatial perception differences between students and visitors reflect a division between functional and cultural needs, highlighting the key roles of place attachment and identity in the perception process [33,34,35]. This differentiated analysis provides empirical support for campus landscape design and offers theoretical reference for universities in balancing the needs of multiple groups and optimizing campus spaces.

2.1.2. Advances in Intelligent Recognition of Landscape Features in Campus Space Research

Intelligent recognition of landscape features has developed rapidly with advances in deep learning and computer vision [36,37]. As an essential approach in landscape research, urban green space (UGS) analysis shows that accurate measurement is central to assessing landscape quality and provides methodological insights for campus studies [38]. Breakthroughs in semantic segmentation have enabled image recognition to be widely applied in green space identification and spatial pattern measurement [39,40], overcoming the limitations of traditional methods in calculating greening rates and recognizing patterns [41]. Applying these techniques to campus research makes it possible to precisely quantify landscape elements and provide technical support for the optimization of open spaces.
Studies have combined semantic segmentation with various analytical methods at the application level. He et al. (2024) used semantic segmentation to quantify campus landscape elements and applied variance analysis to identify key factors and combinations that help relieve short-term stress [42]. Gao et al. (2025) employed Segmenter with PLS-SEM and Bootstrapping to verify the moderating role of landscape elements, providing support for healing-oriented campus design [43]. Qin et al. (2025) used DeepLabV3+ to extract semantic features from street-view images and developed a modeling framework for walking space perception [44]. Chen et al. (2025) applied HRNet to extract indicators such as vegetation, water bodies, paving, building enclosure, and openness, revealing the non-linear mechanisms linking audiovisual perception and attention restoration [45].
In summary, intelligent recognition of landscape features has already shown its applicability and potential in campus space research. Combining semantic segmentation with multiple analytical methods makes it possible to quantify and analyze complex campus landscape elements and uncover their effects on students’ psychological and behavioral responses. This provides technical and theoretical support for campus landscape optimization and health-oriented design.

2.1.3. Applications of Interpretable Machine Learning in Spatial Evaluation

With the growing use of machine learning in urban space analysis, the “black box” problem has increasingly become a barrier to planning and design practice. Interpretable machine learning addresses this by improving model transparency and directly revealing the complex relationships between space and human behavior, offering new approaches for spatial evaluation and optimization [46,47]. Current research mainly relies on two frameworks: SHAP (Shapley Additive exPlanations) and LIME (Local Interpretable Model-agnostic Explanations) [48].
Interpretable machine learning has shown strong potential in spatial perception evaluation to reshape our understanding of human–environment relationships. Xiao et al. (2024) combined population data from Shenzhen with a Random Forest–SHAP model, revealing the non-linear interaction effects between community park visitation and built environment factors [49]. Chen et al. (2024) integrated hotspot analysis with SHAP to uncover how informal green space features influence residents’ complaint emotions [50]. Yang et al. (2024) explained how the built environment affects residents’ health [51]. In transport and urban form research, Wagner et al. (2022) analyzed 3.5 million commuting records to show that the development of Berlin’s sub-centers reduced commuting distances, confirming the “15 min city” hypothesis and identifying a carbon emission density threshold effect [52]. In spatial prediction and optimization, Ruan et al. (2025) combined street-view imagery with a deep vision model–SHAP Random Forest, finding that non-linear building and facility density interactions significantly affect non-motorized travel vitality [53]. Eshraghi et al. (2025) proposed an AI-based optimization framework that integrates SHAP and CFX to evaluate and improve skyline openness in open spaces, balancing design flexibility with computational efficiency [54].
Overall, interpretable machine learning has become an essential tool for spatial evaluation. It can reveal the non-linear and interaction effects of environmental features on perception and behavior while providing optimization strategies for planning and design [46,48]. In campus studies, this approach is equally applicable, as it can uncover perception differences and underlying mechanisms between students and visitors, offering scientific support for optimizing open spaces and fostering cultural identity [45,53].

2.2. Indicator Construction and Theoretical Framework

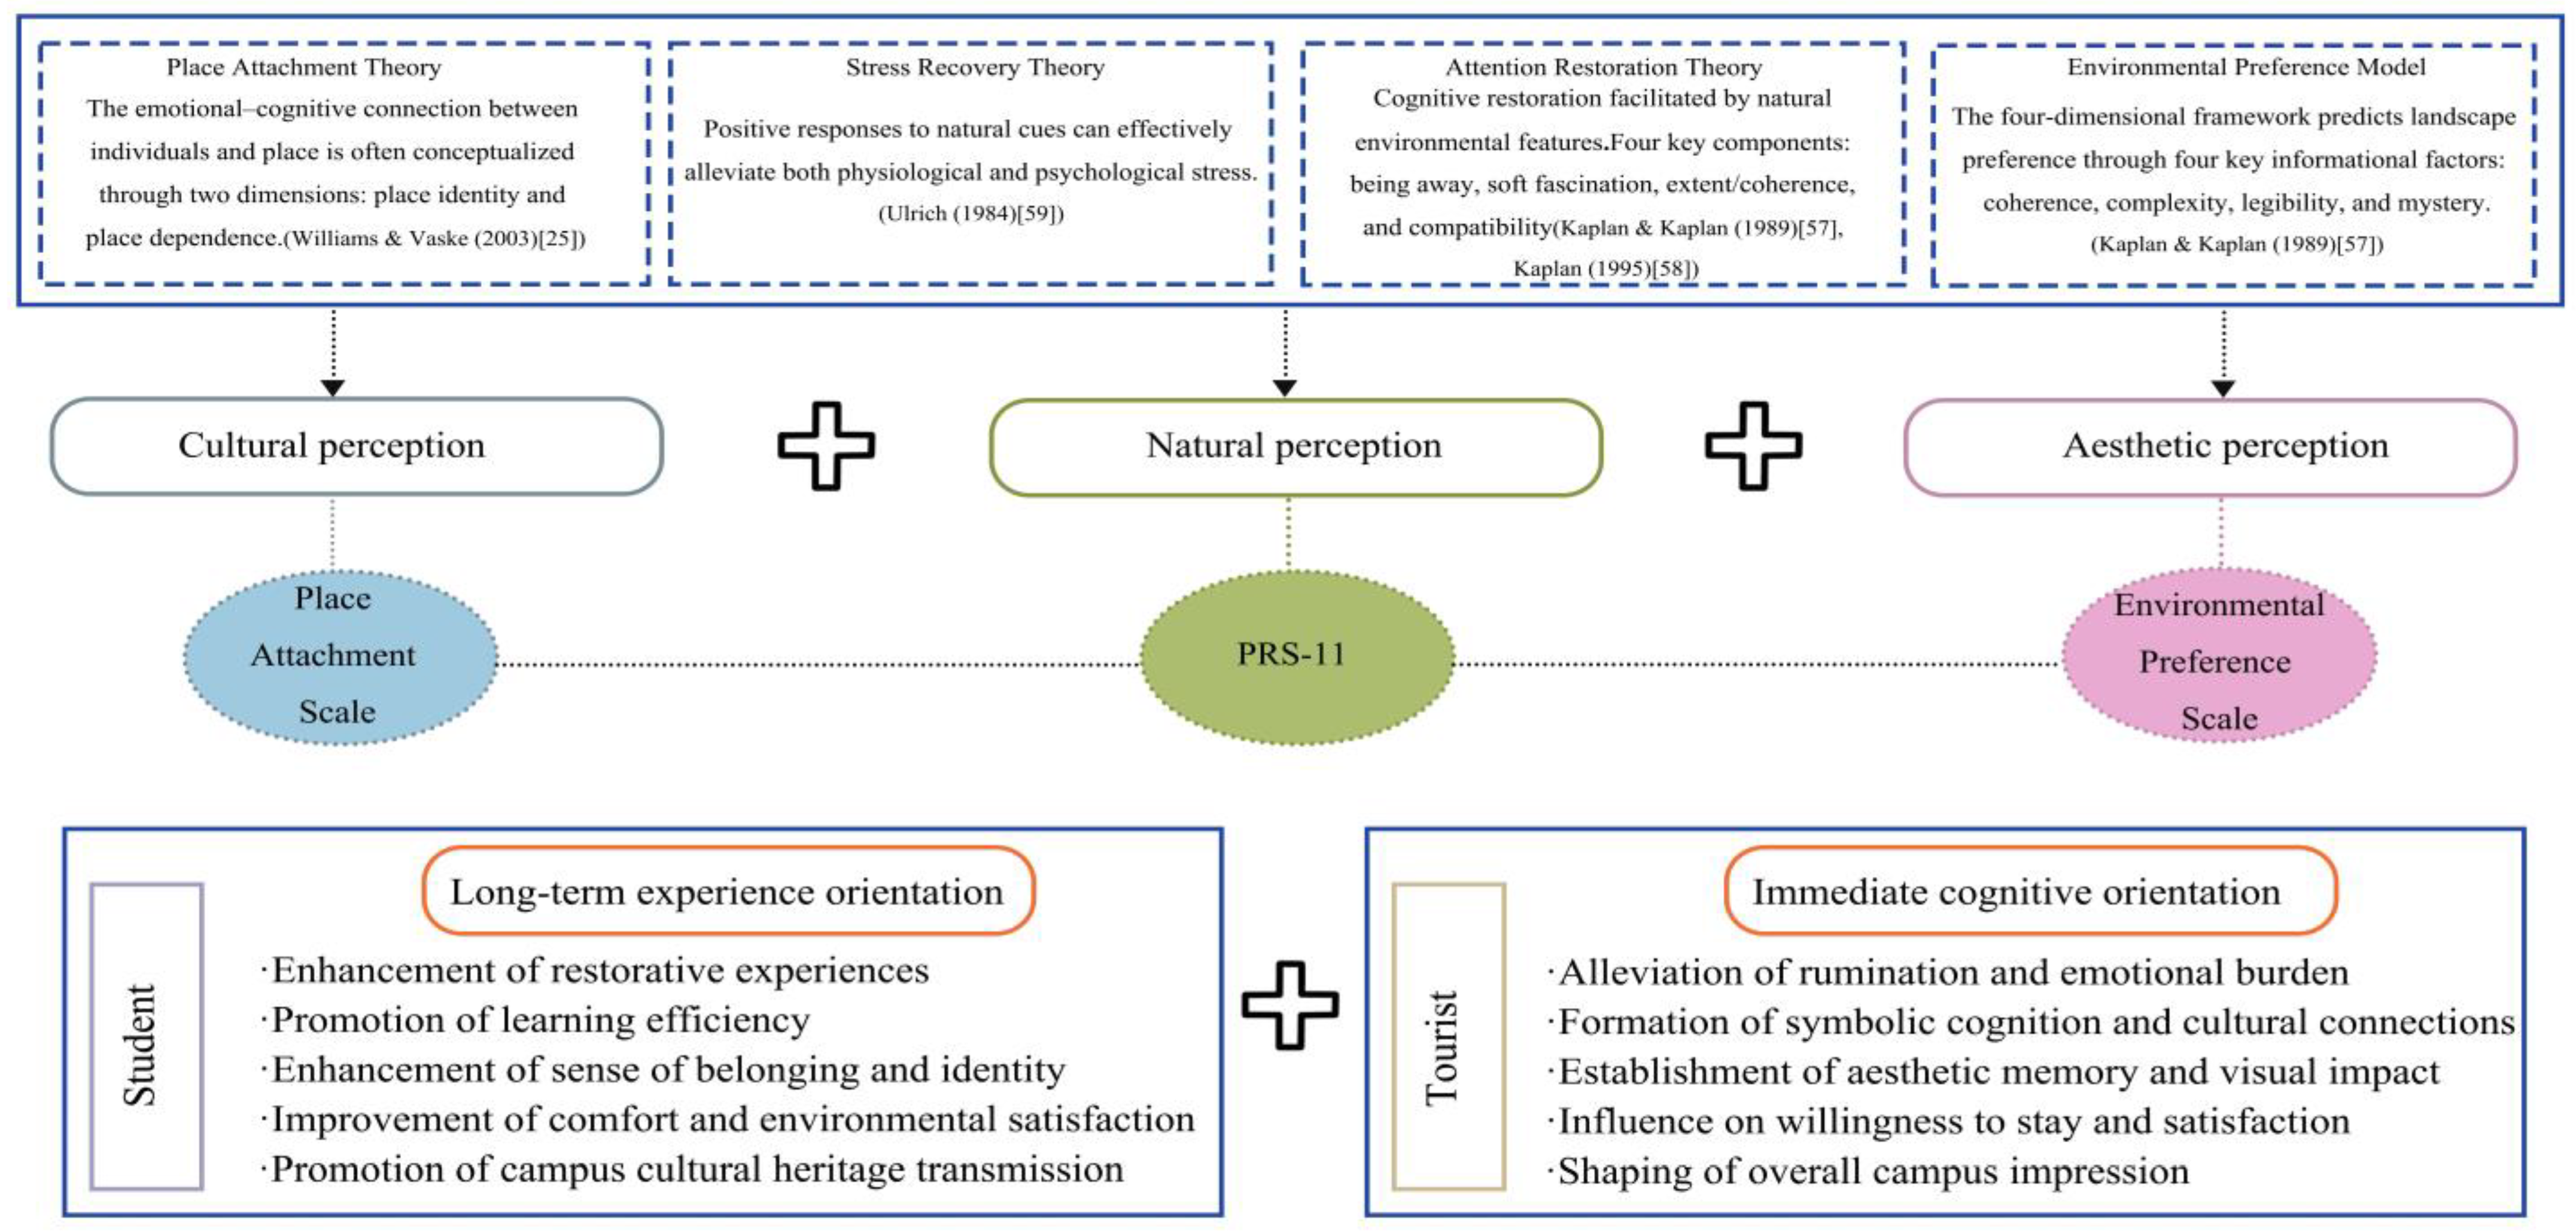
Integrating architectural and environmental design theories has provided a new analytical framework for campus space research, encouraging interdisciplinary exploration of how spatial configuration and environmental quality influence user experience and behavior [55,56]. Within this context, campus open spaces serve as meaningful learning, communication, and rest venues. Their ecological attributes and spatial organization affect environmental comfort and functional efficiency, and shape social interaction and cultural atmosphere. Based on this, the present study builds a comprehensive evaluation model from three dimensions—natural perception, artistic perception, and aesthetic perception—to reveal the environmental benefits and optimization mechanisms of campus functional zones, while offering references for planning renewal and sustainable governance. Figure 1 illustrates the connections between the three indicators and the different user groups in this study. These indicators have cross-group applicability: students, as long-term users, focus more on support for learning, communication, and belonging, whereas visitors form perceptions mainly through natural settings, cultural imagery, and aesthetic impressions. Thus, this framework can explain students’ everyday experiences and uncover visitors’ immediate perceptions, providing theoretical support for optimizing campus spaces to meet the needs of multiple groups.
Natural perception is mainly grounded in Attention Restoration Theory (ART) and Stress Recovery Theory (SRT). ART highlights how natural environments support attention recovery through features such as “being away,” “soft fascination,” “extent/coherence,” and “compatibility,” while SRT emphasizes that positive responses to natural cues can help reduce both physiological and psychological stress [57,58,59]. The Perceived Restorativeness Scale (PRS) has been widely used to assess environmental restorative capacity [60]. Research has shown that green spaces and exposure to nature significantly improve health and well-being [61]. For students, nature-rich spaces enhance feelings of restoration and improve learning efficiency [62]. Higher landscape quality improves visitors’ experience and satisfaction; even short-term exposure can ease rumination and emotional stress [63,64].
Cultural perception is rooted in place attachment theory, which emphasizes the emotional–cognitive bonds between people and places, including “place identity” and “place dependence” [24,25]. Within the cultural landscape framework, landscapes are seen as products of social–natural interaction, carrying collective memory and supporting the reproduction of identity [65]. For students, cultural perception relates to their sense of belonging in study and daily life and recognition and inheritance of campus historical symbols [23]. For visitors, it relies more on cultural imagery and narrative experiences to build symbolic understanding and cultural connections [66]. Aesthetic perception is mainly derived from Kaplan’s environmental preference model, whose four core dimensions—coherence, complexity, legibility, and mystery—have been shown to predict landscape preference and visual evaluation [57,67] reliably. At the level of buildings and streetscapes, factors such as façade composition, material colors, and the degree of spatial enclosure significantly influence aesthetic judgments [30,68]. At the urban scale, aesthetic perception has been widely applied in studies of public spaces such as squares and parks [69]. For students, the aesthetic quality of learning and activity spaces directly affects their comfort and satisfaction with the environment [70]. For visitors, novelty in architectural form and substantial visual impact play a greater role, shaping their overall impression of the campus and their aesthetic memories [71].
As shown in Figure 2, the three dimensions—natural perception, cultural perception, and aesthetic perception—together form the core framework of this study. They capture both students’ long-term experiences and visitors’ immediate perceptions, thus providing theoretical support for campus space optimization and sustainable governance from a multi-group perspective.

3. Materials and Methods

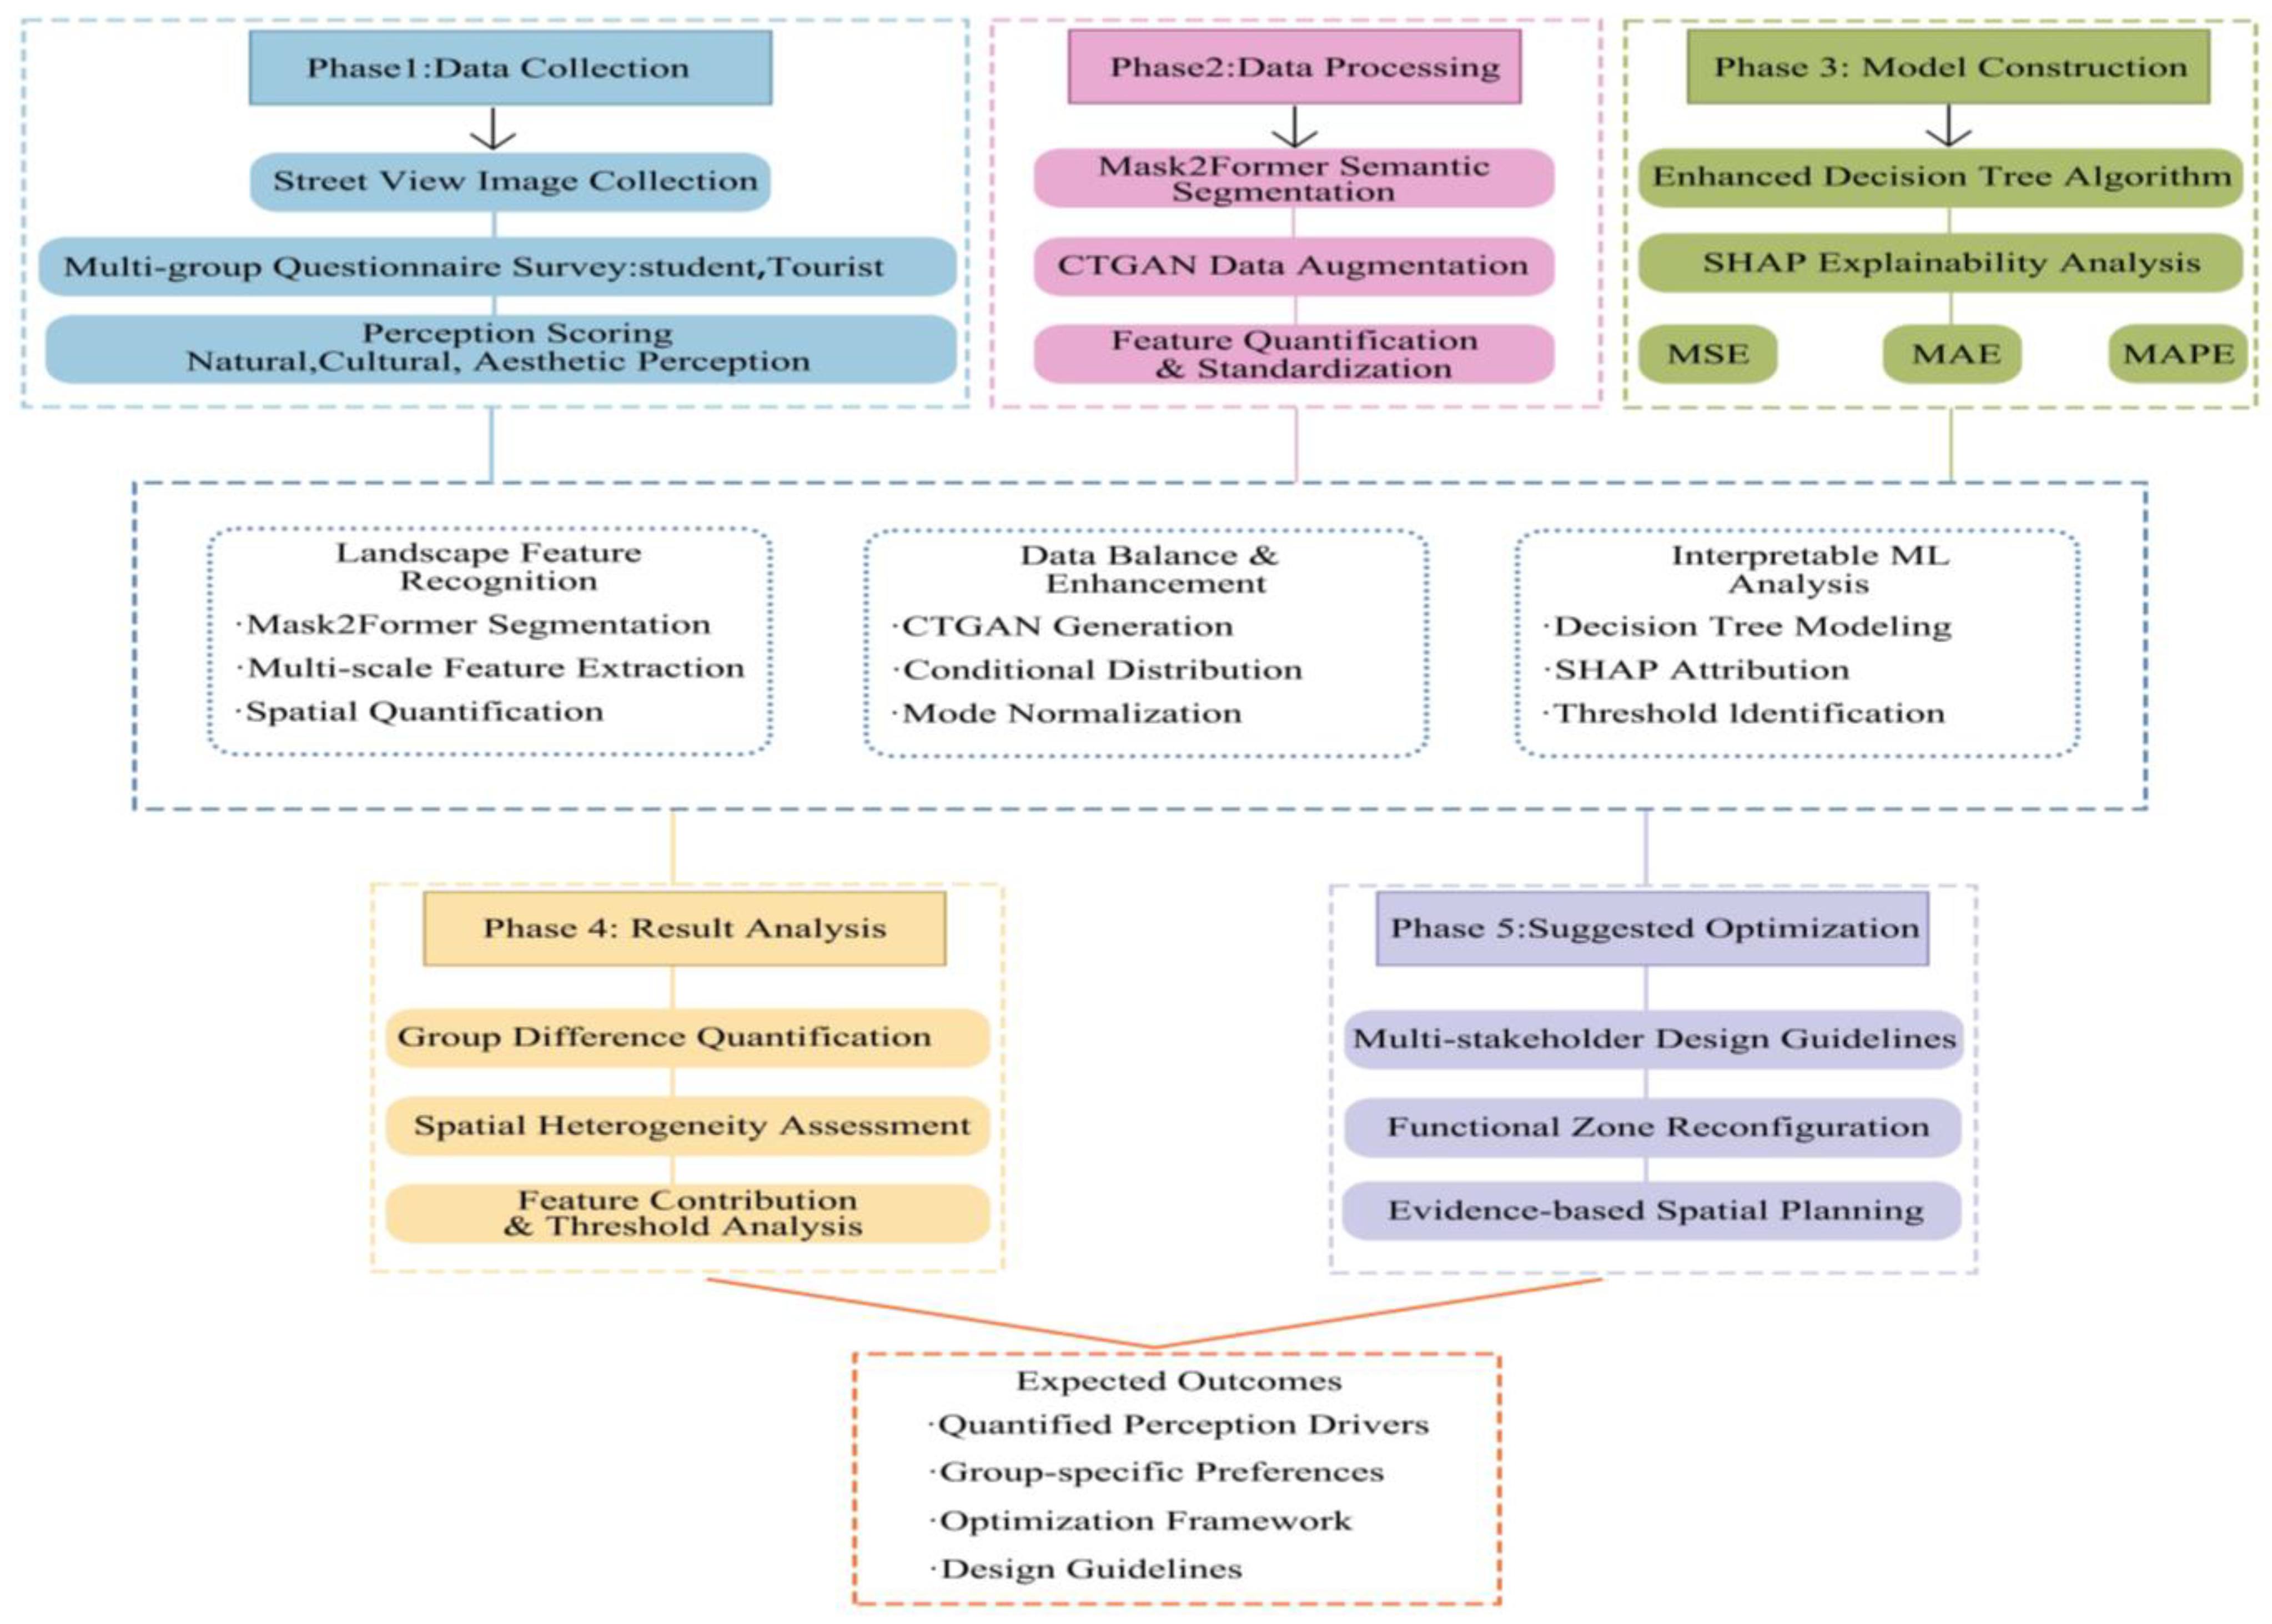
This study used campus street-view images retrieved from Baidu Maps and applied a Mask2Former-based semantic segmentation method to extract landscape features. At the same time, a questionnaire survey was conducted to collect student and visitor scores on the three indicators of natural perception, cultural perception, and aesthetic perception. Next, a CTGAN–interpretable decision tree model was employed to identify the key landscape features that significantly affect each type of perception, and to analyze their influence patterns and threshold effects. Based on the actual distribution of the critical landscape features identified earlier, the campus was divided into functional zones for heterogeneity analysis. Figure 3 illustrates the technical framework of this study.

3.1. Data Collection and Feature Quantification

  • Campus Street-View Acquisition
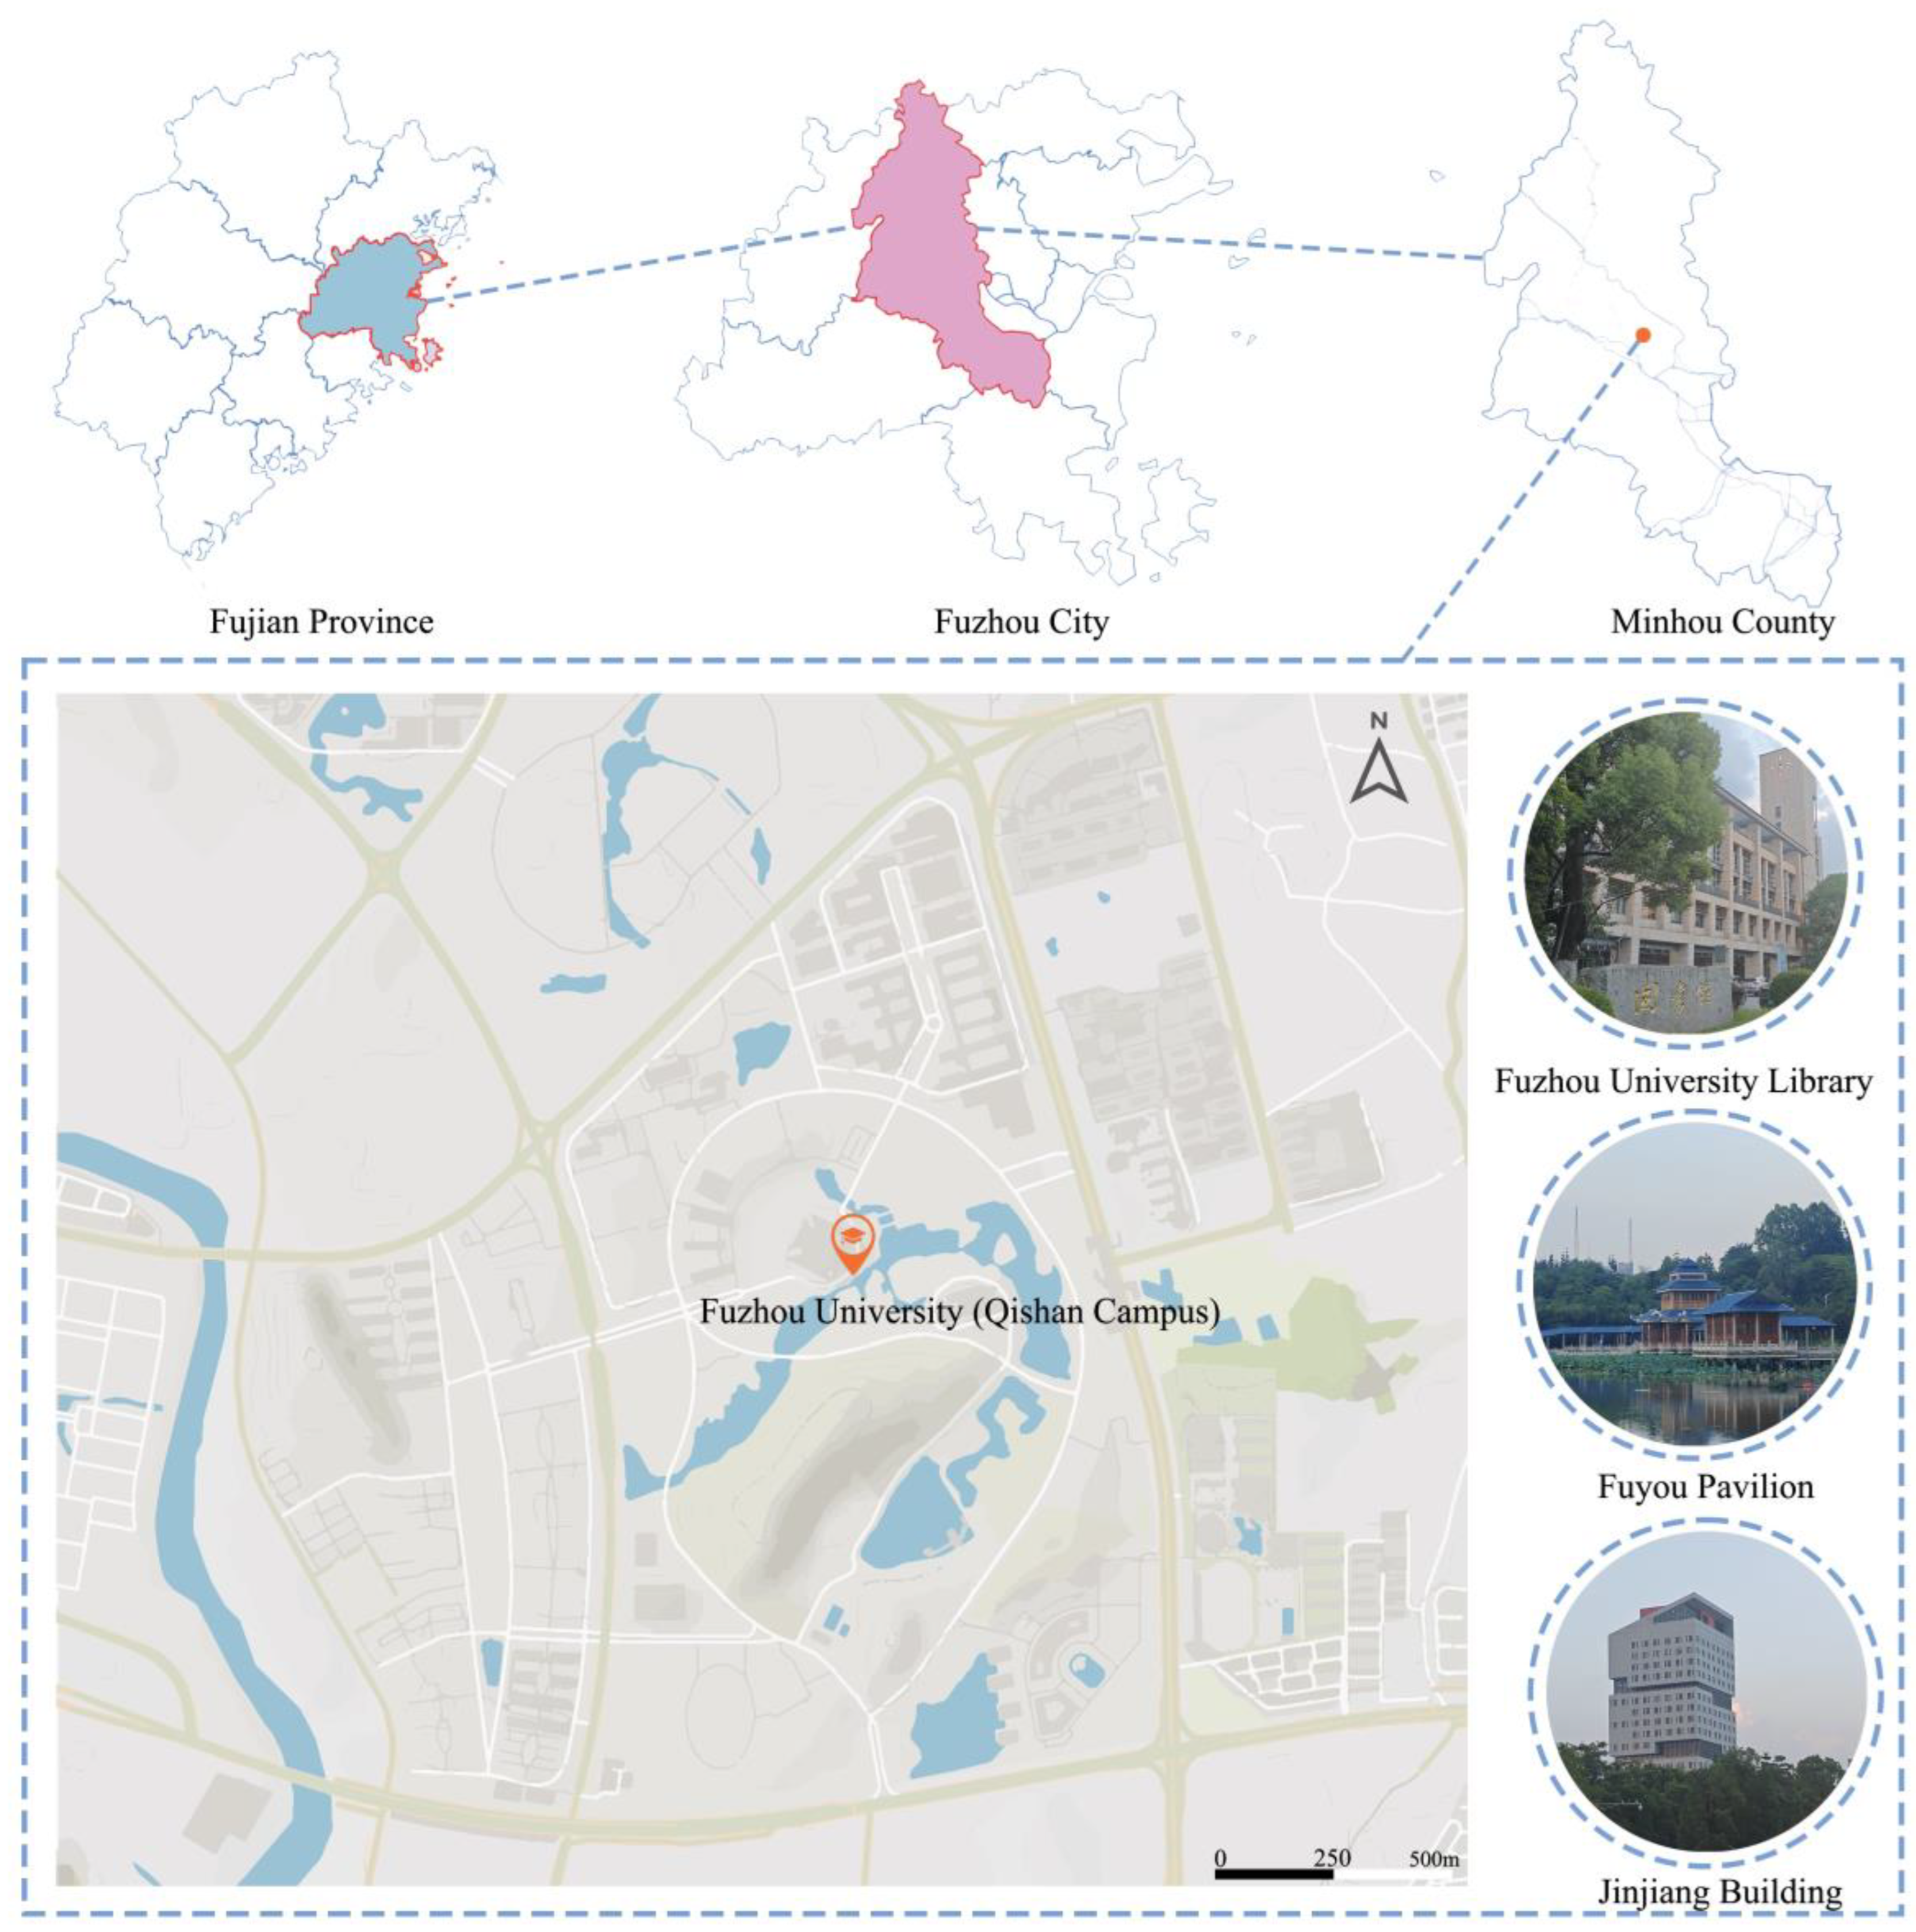
Fuzhou University, founded in 1958, is a national “Double First-Class” university and a key institution under the “211 Project.” The study site is the Qishan Campus, which is located in the University Town of Fuzhou, and it can be seen at https://www.openstreetmap.org/search?lat=26.06143&lon=119.19346&zoom=16#map=16/26.06143/119.19345 (accessed on 20 September 2025). The campus has a planned total floor area of 174,000 square meters and is surrounded by mountains and water, with a favorable natural environment. Figure 4 shows the geographical location of the study site. Representative campus buildings include Fuyou Pavilion, Jinjiang Building, and the library.
In this study, the road network was first extracted from OpenStreetMap (OSM), and 378 sampling points were generated in QGIS at 50 m intervals, with their latitude and longitude recorded. At each point, the pitch angle was set to 0°, and images were captured in four directions: 0°, 90°, 180°, and 270°. This produced four images per point and a total of 1516 street-view photos. The dataset provided near 360° panoramic coverage of the sampling locations, offering a systematic data foundation for semantic segmentation and perception modeling.
  • Quantification of perception indicators
This study aimed to assess street-view images in terms of three dimensions: natural perception, cultural perception, and aesthetic perception. To do so, we adapted three classic scales: the Perceived Restorativeness Scale (PRS-11) [60], the Place Attachment Scale [25], and the Environmental Preference Scale [57,67]. The questionnaire design selected 3–4 representative items from each scale and semantically rephrased to fit the evaluation context based on street-view images. All items were rated on a 7-point Likert scale, where 1 indicated “strongly disagree” and 7 indicated “strongly agree,” quantifying participants’ subjective perceptions of the images. Using a stratified random sampling approach, 200 representative images were selected from the street-view image database of Fuzhou University’s Qishan Campus. 235 participants completed the evaluation task, including 123 university students (recruited through on-campus channels to ensure reliable identity) and 112 tourists (recruited via online platforms, with screening questions at the beginning of the survey to exclude current students). Since tourists’ perceptions of the campus are primarily shaped by short-term visits and immediate impressions, online image-based ratings were an effective way to simulate their perception patterns. Each image received approximately 50 independent evaluations, and Table 1 presents the complete questionnaire for street-view image perception evaluation. Perception indicators were quantified through an online rating experiment involving university students and the general public. Student participants were recruited through campus channels to ensure reliable identity verification, while visitor participants were recruited via public platforms. Screening questions at the start of the survey (e.g., whether the participant was a current student, or had visited or planned to visit the campus) were used to distinguish the groups. It should be emphasized that this study focuses on visual perception differences under street-view image conditions, rather than actual usage behavior. Since visitors’ understanding of campuses is often based on short visits and immediate impressions, image-based online ratings can effectively simulate their real perception process. It should be emphasized that this study focuses on visual perception differences under street-view image conditions, rather than actual usage behavior. Since visitors’ understanding of campuses is often based on short visits and immediate impressions, image-based online ratings can effectively simulate their real perception process.

3.2. Data Processing Procedure

  • Semantic feature extraction process of street-view images
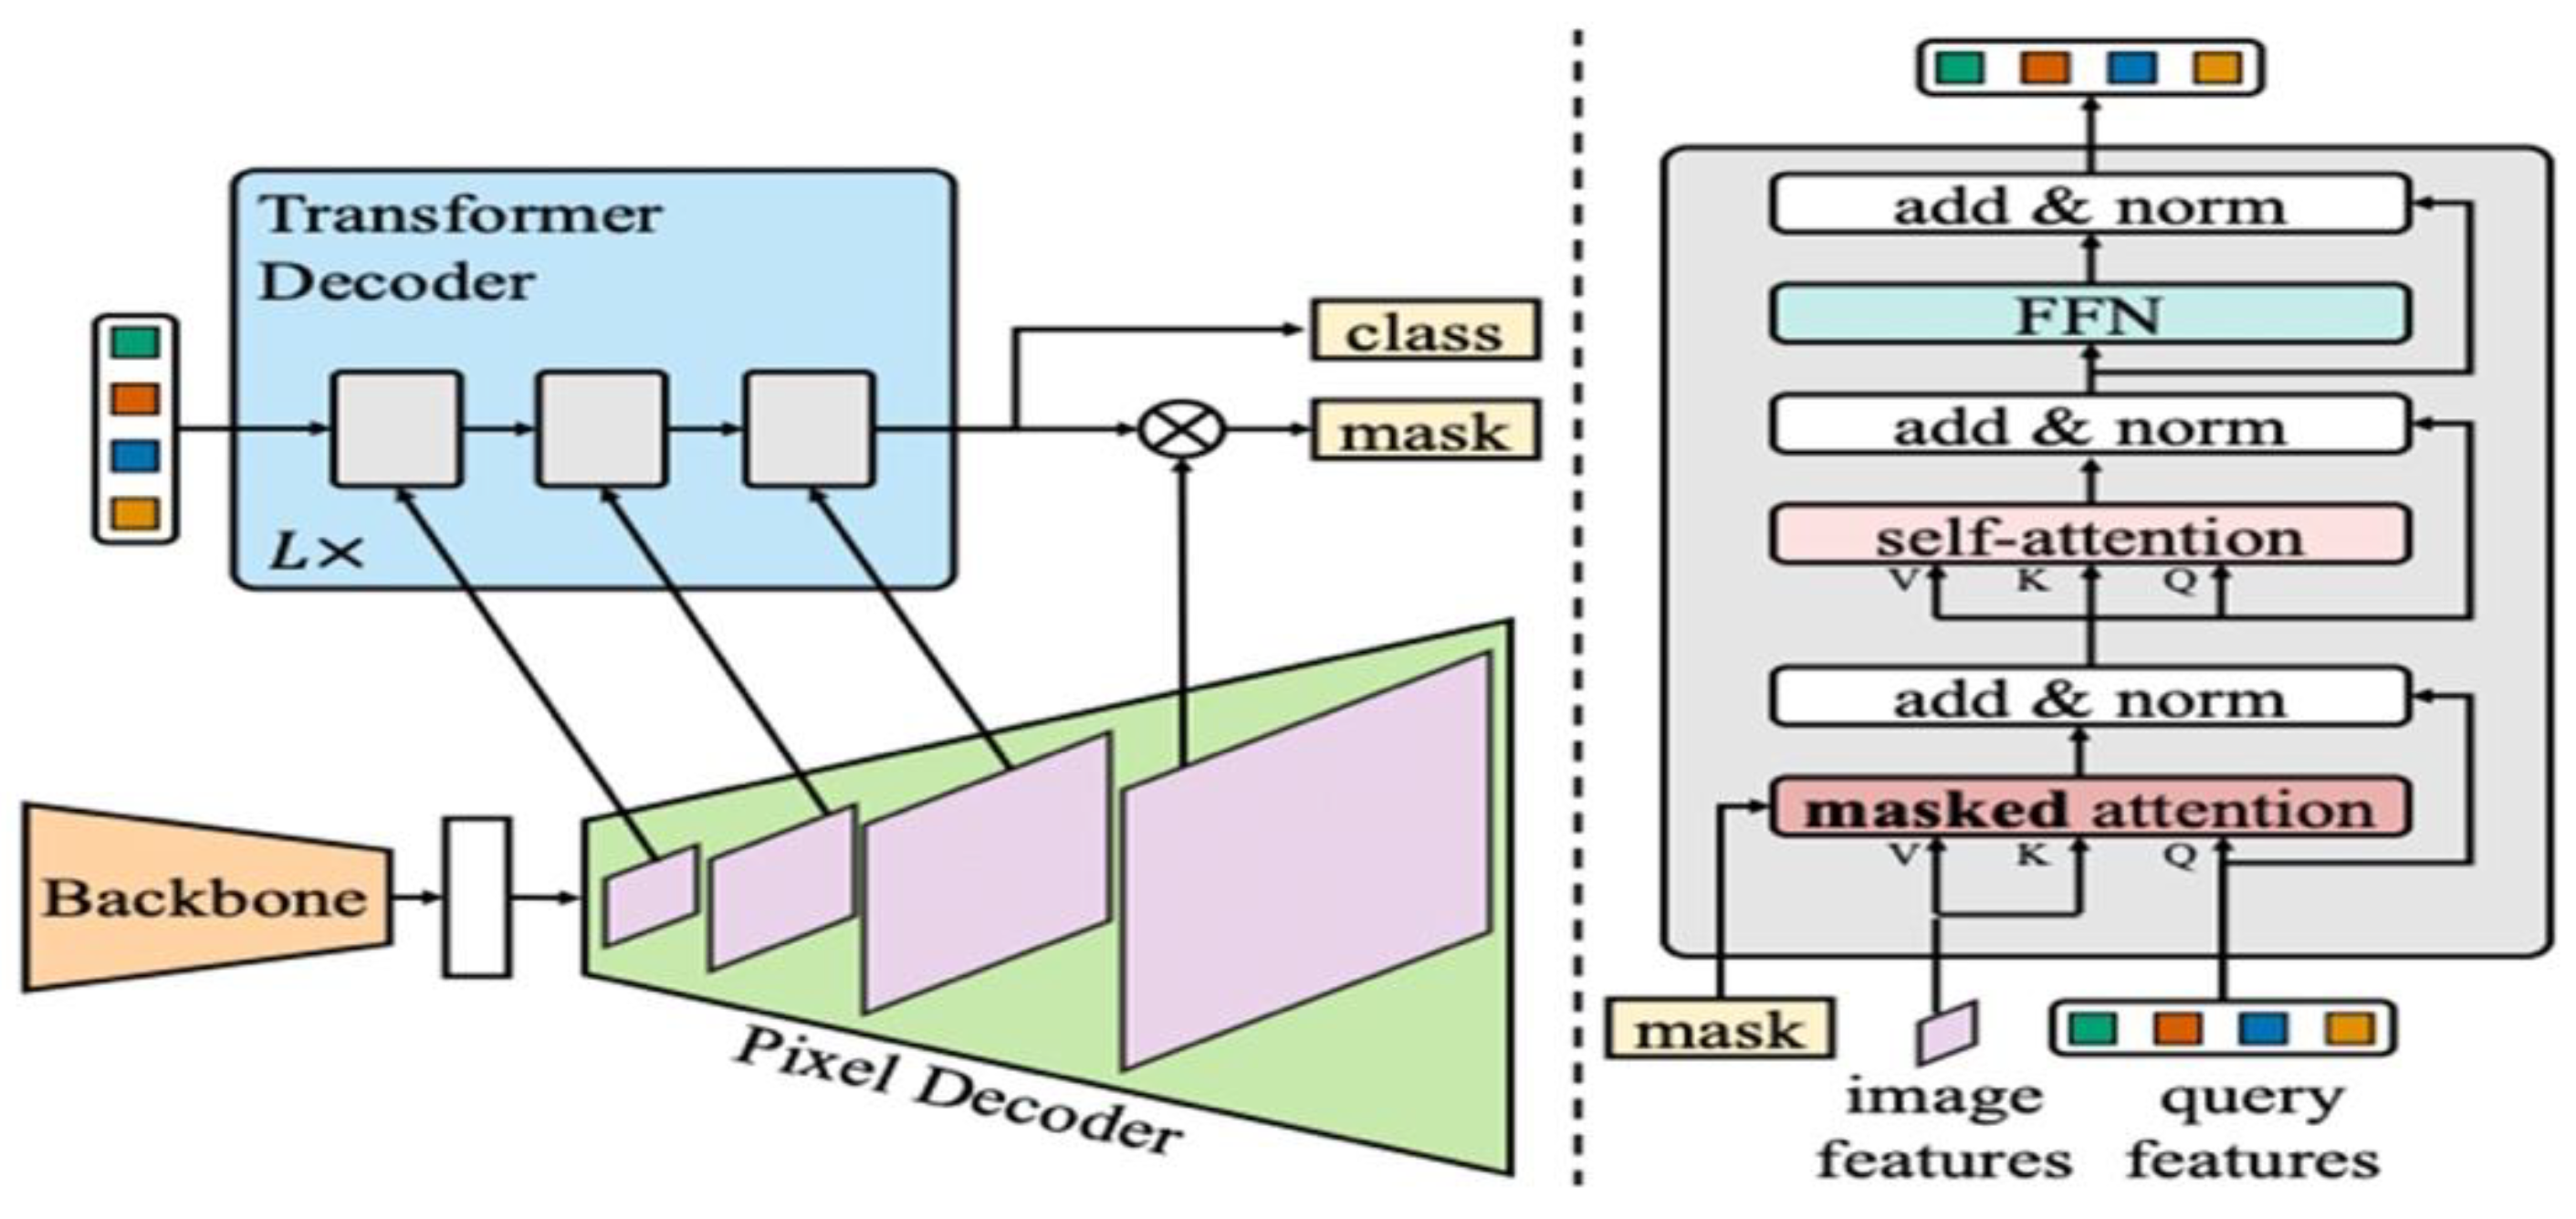
Street view images are widely used in environmental perception and spatial analysis research because they provide comprehensive spatial coverage and detailed visual information. This study uses the Mask2Former model to extract semantic features [72]. Figure 5 shows how this model works. The model is built on a Transformer structure and combines convolutional backbone networks with set prediction methods to achieve unified optimization for panoptic segmentation. This approach can accurately identify typical elements in campus scenes—such as vegetation, roads and walkways, open sky areas, and building outlines—at the pixel level. The model also uses the ADE20K dataset to extract semantic features from street view images. Figure 6 illustrates the process of collecting street view images and semantic segmentation, while Table 2 presents all feature names identified through semantic segmentation.
For Mask2Former training on the ADE20K dataset [72], semantic and panoptic segmentation are trained separately with identical settings, using an ImageNet-22K pre-trained backbone. Data augmentation includes random scale jittering (0.5–2.0), horizontal flip, 512 × 512 cropping, and color perturbation to match the dataset’s resolution and scene variety. A polynomial learning rate schedule ensures stable convergence (batch size 16, 160k–180k iterations), with AdamW optimizer, linear warm-up, and weight decay set to 0.05. In inference, images are resized so the long side is 1024 px, with optional multi-scale testing for semantic segmentation. The number of queries depends on task complexity and backbone (200 for Swin-L panoptic, otherwise 100) to balance accuracy and stability.
  • Application of CTGAN in imbalanced date
In recent years, Generative Adversarial Networks (GANs) have gained increasing attention for their use in tabular data modeling and imbalanced learning. Xu et al. (2019) first introduced CTGAN, which uses conditional generation mechanisms and mode normalization to solve problems like mixed-type variables (continuous and discrete), multimodal distributions, and class imbalance. This approach achieves high-quality and diverse tabular data synthesis [73]. Building on this work, Engelmann & Lessmann (2021) [74] introduced a conditional Wasserstein GAN for more stable oversampling of imbalanced tabular data. Later, Zhao et al. (2021) [75] proposed CTAB-GAN, which further improved the statistical similarity of synthetic data and model performance by adding classification loss, information loss, and an improved conditional vector structure. The latest research, CTAB-GAN+, extends the training mechanism to handle complex imbalanced distributions better. These methods together show that CTGAN-based generative modeling has significant advantages in reducing class imbalance and improving data quality. This provides strong methodological support for modeling and interpreting campus perception data in this study.

3.3. SHAP-Based Interpretable Decision Tree Modeling

To evaluate how landscape features affect student and visitor perception scores, this study uses three ensemble methods based on decision trees: Random Forest (RF), Gradient Boosting Decision Trees (GBDT), and AdaBoost [76,77,78]. The data uses semantic features from street view images and perception scores as output variables. The data is divided into training, validation, and test sets. CTGAN is used for conditional data augmentation during the training phase and is based only on the training set to address uneven distribution and minor sample problems. Model performance is evaluated using MSE, MAE, and validation set EVS, and the best model is selected for prediction and interpretation. To improve interpretability, SHAP (Python “shap” v0.47.2, TreeExplainer) calculates sample-level SHAP values on the test set to show local contributions. Global importance rankings are formed by averaging SHAP values across samples. To enhance robustness, 50 random resampling iterations are performed, and the average importance is reported.

4. Empirical Results

4.1. Building Optimal Decision Tree Models for Campus Functional Areas

To model and predict the restorative effects of campus outdoor spaces, this study uses three ensemble algorithms based on decision trees: Random Forest (RF), Gradient Boosting Decision Trees (GBDT), and AdaBoost. The approach uses semantic features from street view images as input variables and perception indicator scores as output variables. The data is divided into training, validation, and test sets. Before modeling, CTGAN is introduced for conditional data augmentation based only on the training set to address uneven distribution and minor sample problems and improve generalization ability. Model performance is evaluated using Mean Squared Error (MSE), Mean Absolute Error (MAE), and Mean Absolute Percentage Error (MAPE). The best-performing model on the validation set is selected as the final solution. The overfitting prevention strategies for the three algorithms are: RF limits maximum tree depth, sets minimum samples per leaf node, and uses random feature subsets for node splitting; GBDT controls model complexity through small learning rates, limited tree depth and number, and subsampling; AdaBoost achieves regularization by constraining the depth of base learners (such as shallow trees) and setting learning rates and the number of weak learners. Combining results from six tasks, the CTGAN + tree model achieves better error performance compared to the baseline in most cases. Table 3 and Table 4 show the final optimal models for each task in the two groups of students and visitors, along with their primary hyperparameters and indicators.

4.2. Analysis of the Working Mechanism of Semantic Features in Campus Spaces

4.2.1. Visual Analysis of Key Semantic Features Within the Study Area

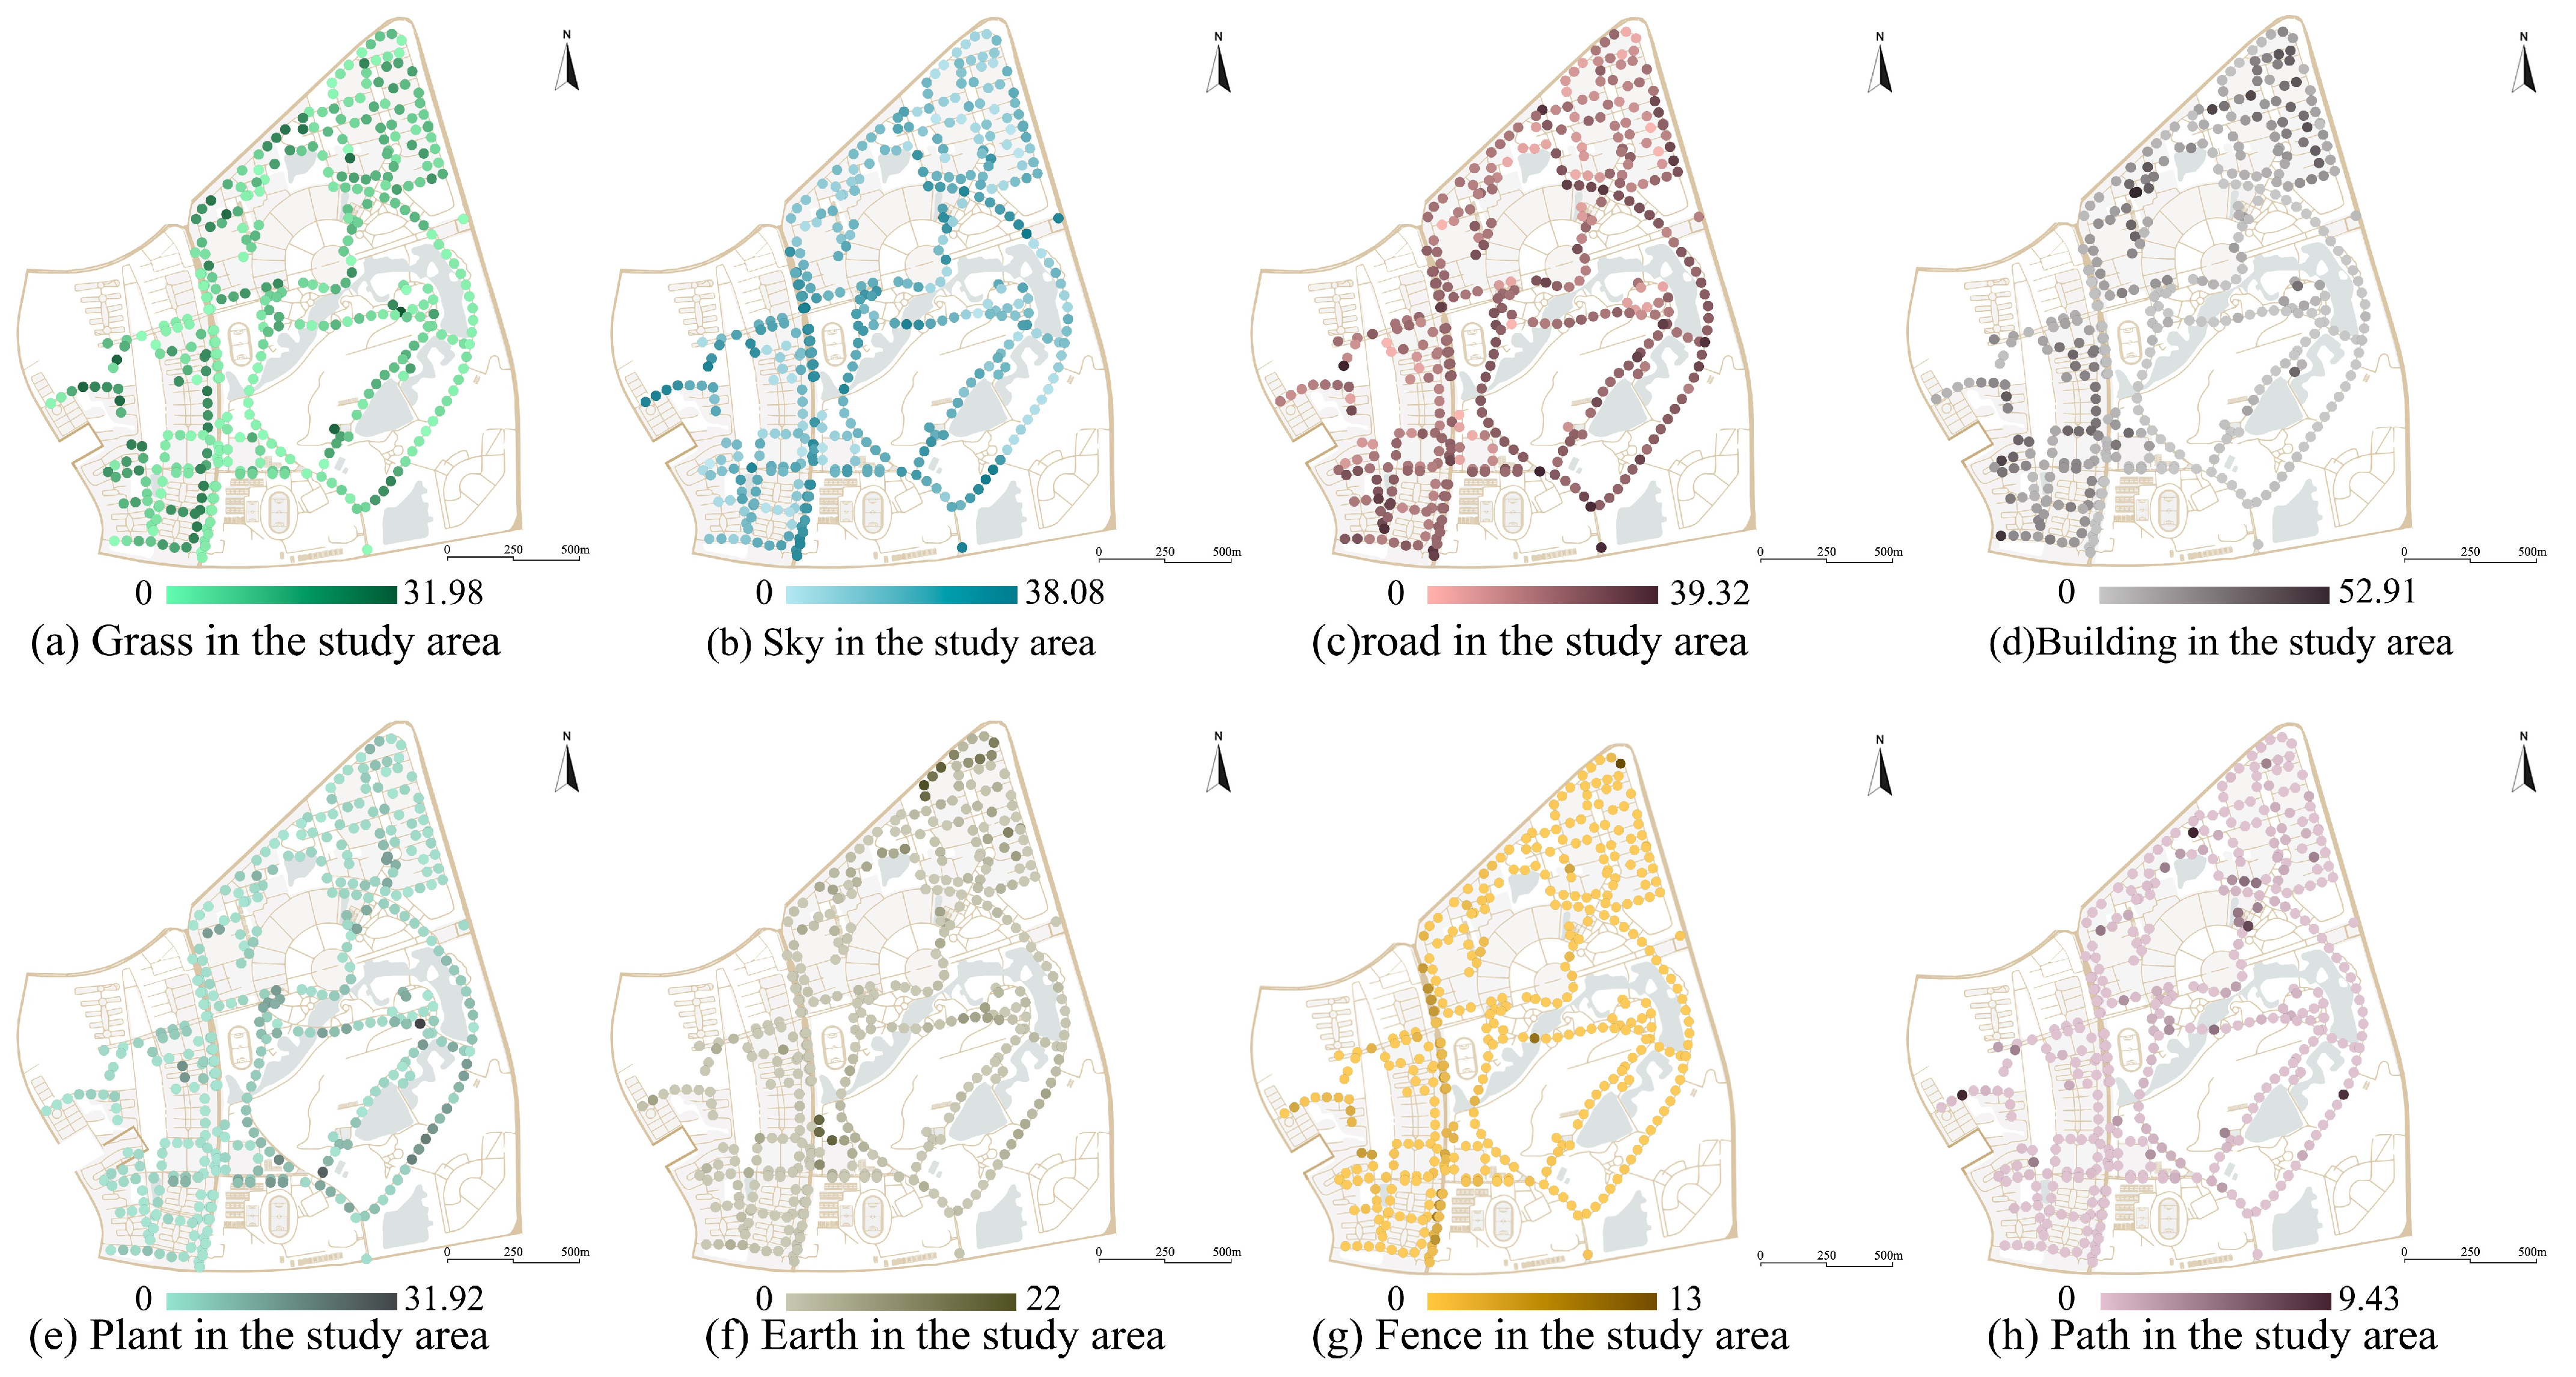
Figure 7 shows the spatial distribution of semantic features that significantly affect perception indicators across the entire study area. Combining student and visitor perception evaluations, 8 core image semantic features were selected after removing duplicates, highlighting representative landscape space distribution. Among these, the building has the highest density in core teaching and functional areas, with an impact weight of 52.91. Road (weight 39.32) shows a network-like distribution that strengthens spatial connectivity. Sky (weight 38.08) is found in open spaces and gaps between buildings, enhancing the sense of visual openness. Grass features rank fourth with a weight value of 31.98, serving as an important component of natural landscapes. Plant (weight 31.92) is widely distributed in green areas and building transition spaces, adding natural qualities. Earth (weight 22) is concentrated in open ground areas. Fence (weight 13) has a relatively small influence but is key in defining spatial boundaries. Path (weight 9.43) is distributed throughout the walking network, creating intimate experiences. These diverse semantic features’ distribution density and combination patterns directly affect users’ perception experiences, providing data support for campus optimization design. These diverse semantic features’ distribution density and combination patterns directly affect users’ perception experiences, providing data support for campus optimization design.

4.2.2. Analysis of Semantic Features Affecting Students’ and Visitors’ Natural Perception Indicators

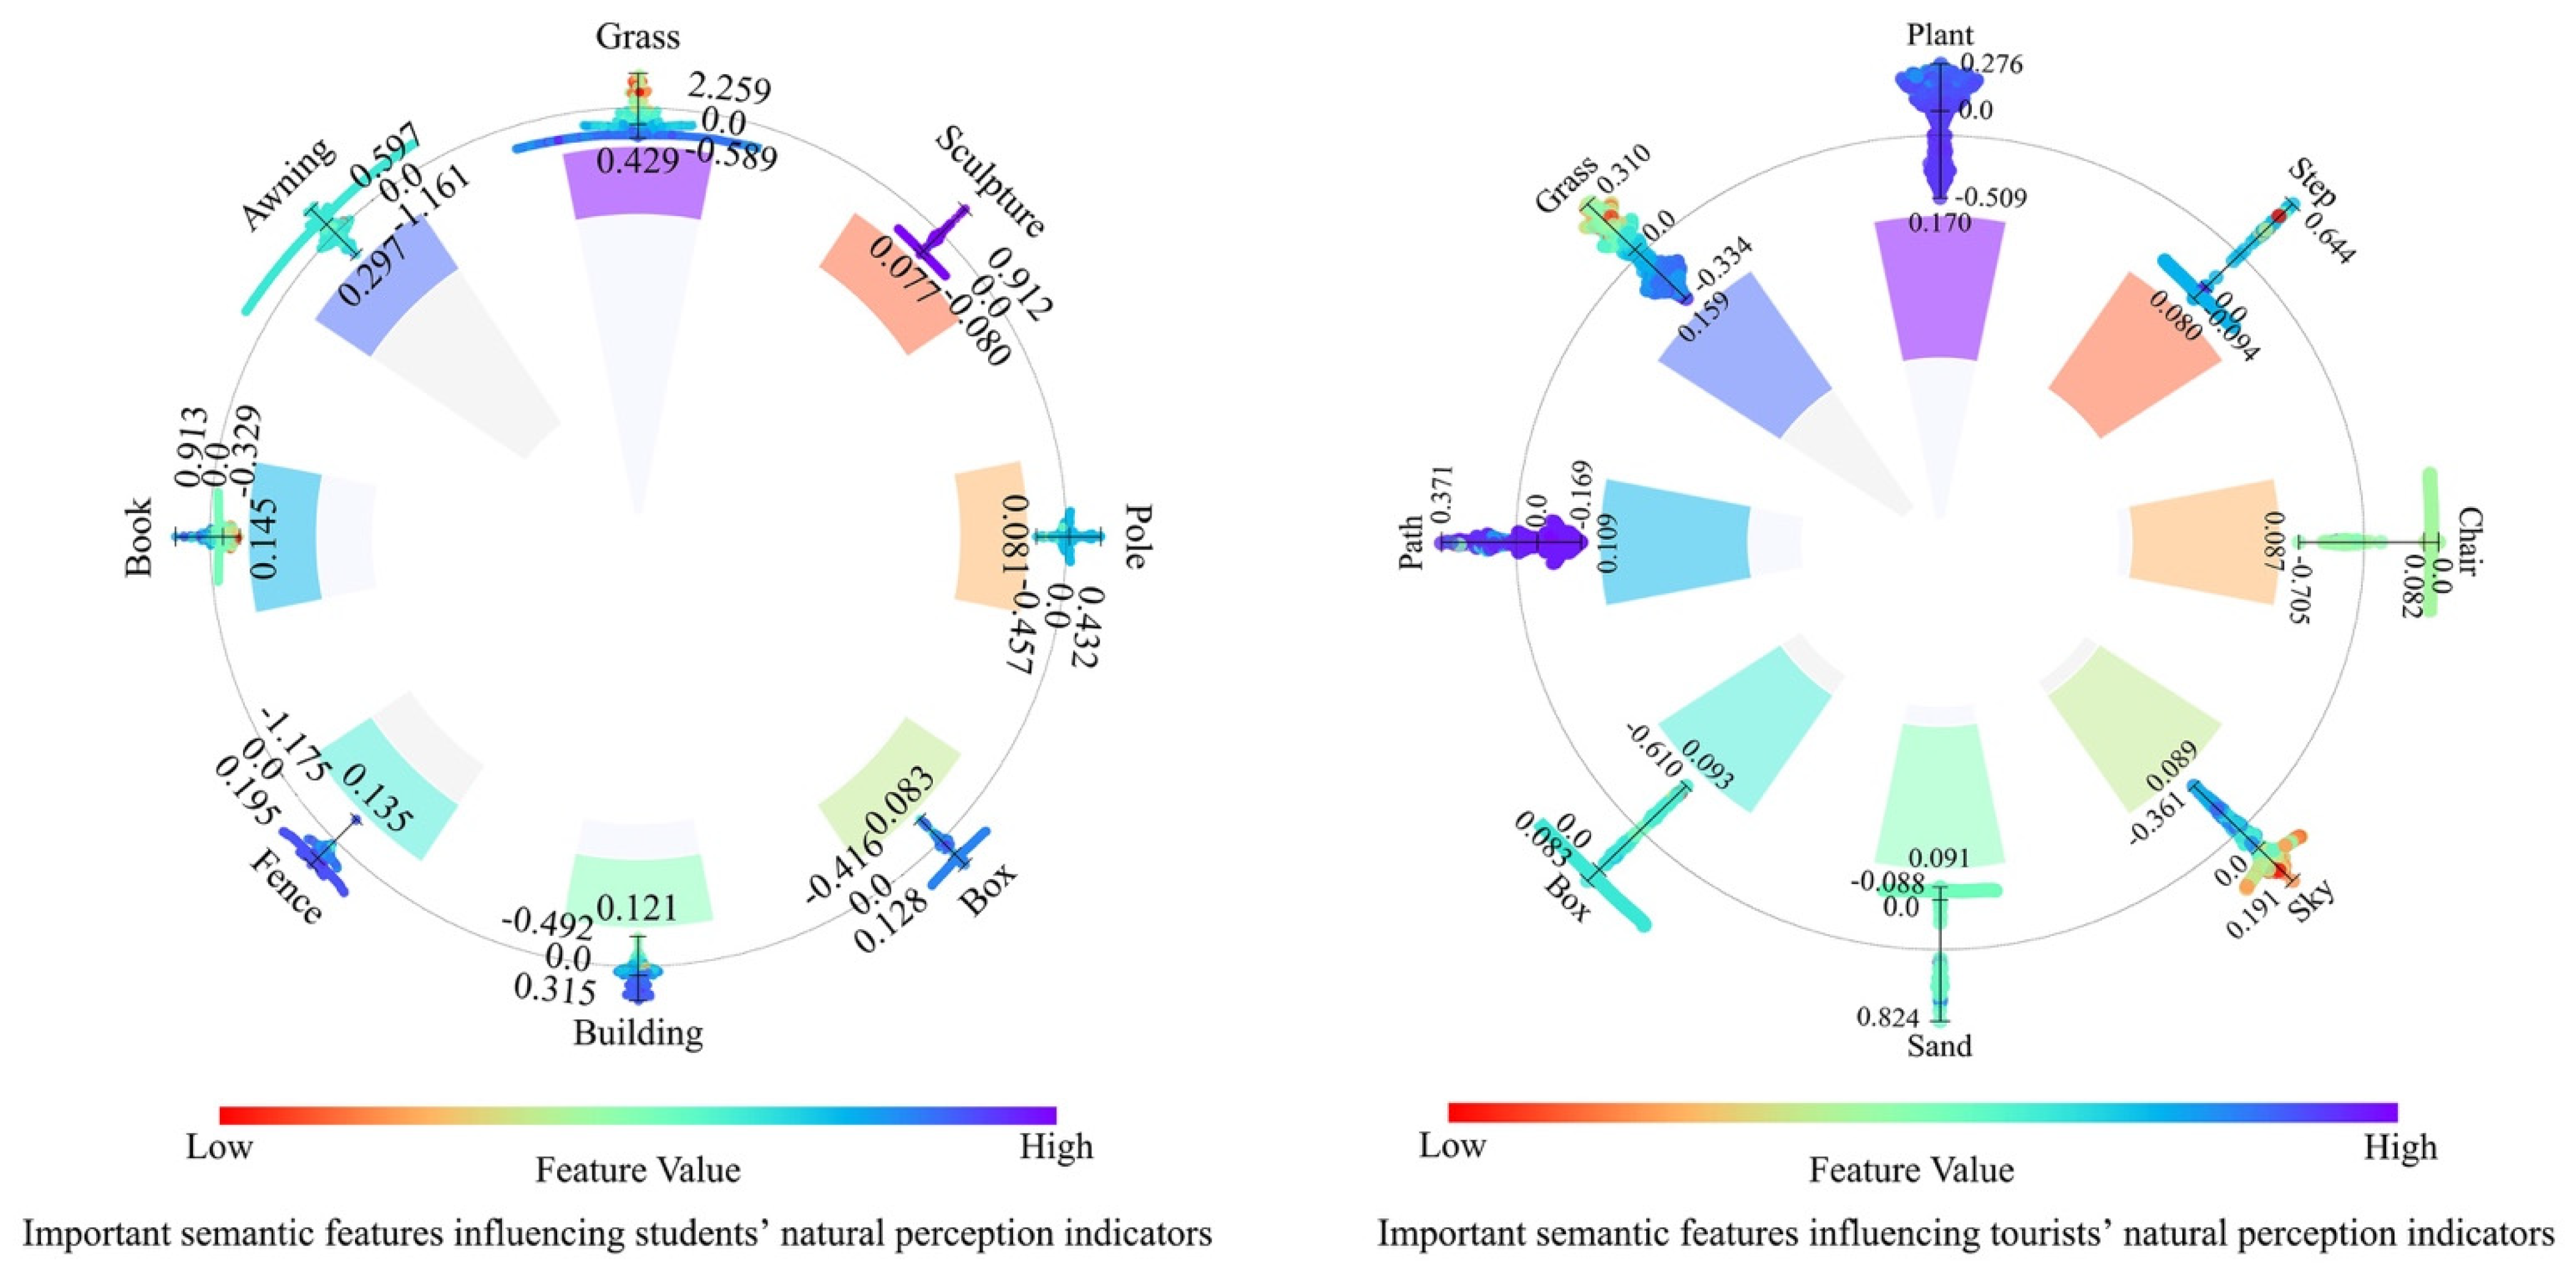
Figure 8 shows the SHAP analysis results of the critical semantic features that influence natural perception for students and visitors. The different sectors in the figure reflect the contribution and distribution of each feature. Features with higher importance have more polarized SHAP value distributions, while less important features are concentrated around zero, suggesting limited influence. On the left are the important features affecting students’ natural perception, and on the right are those affecting visitors. Overall, both students and visitors rely strongly on natural elements such as grass and sky, which generally have a positive effect. For students, besides grass, features like buildings, fences, and awnings also play a role, and in many cases high values of these reduce natural perception. Visitors, on the other hand, depend more on straightforward natural elements such as grass, sky, paths, and sand, but they are also more sensitive to facilities like chairs and steps, which can lead to negative experiences if they appear too frequently. In general, visitors’ natural perception relies more on direct natural elements, but their sensitivity to man-made facilities is higher, and excessive presence of such features can easily turn into a negative experience.
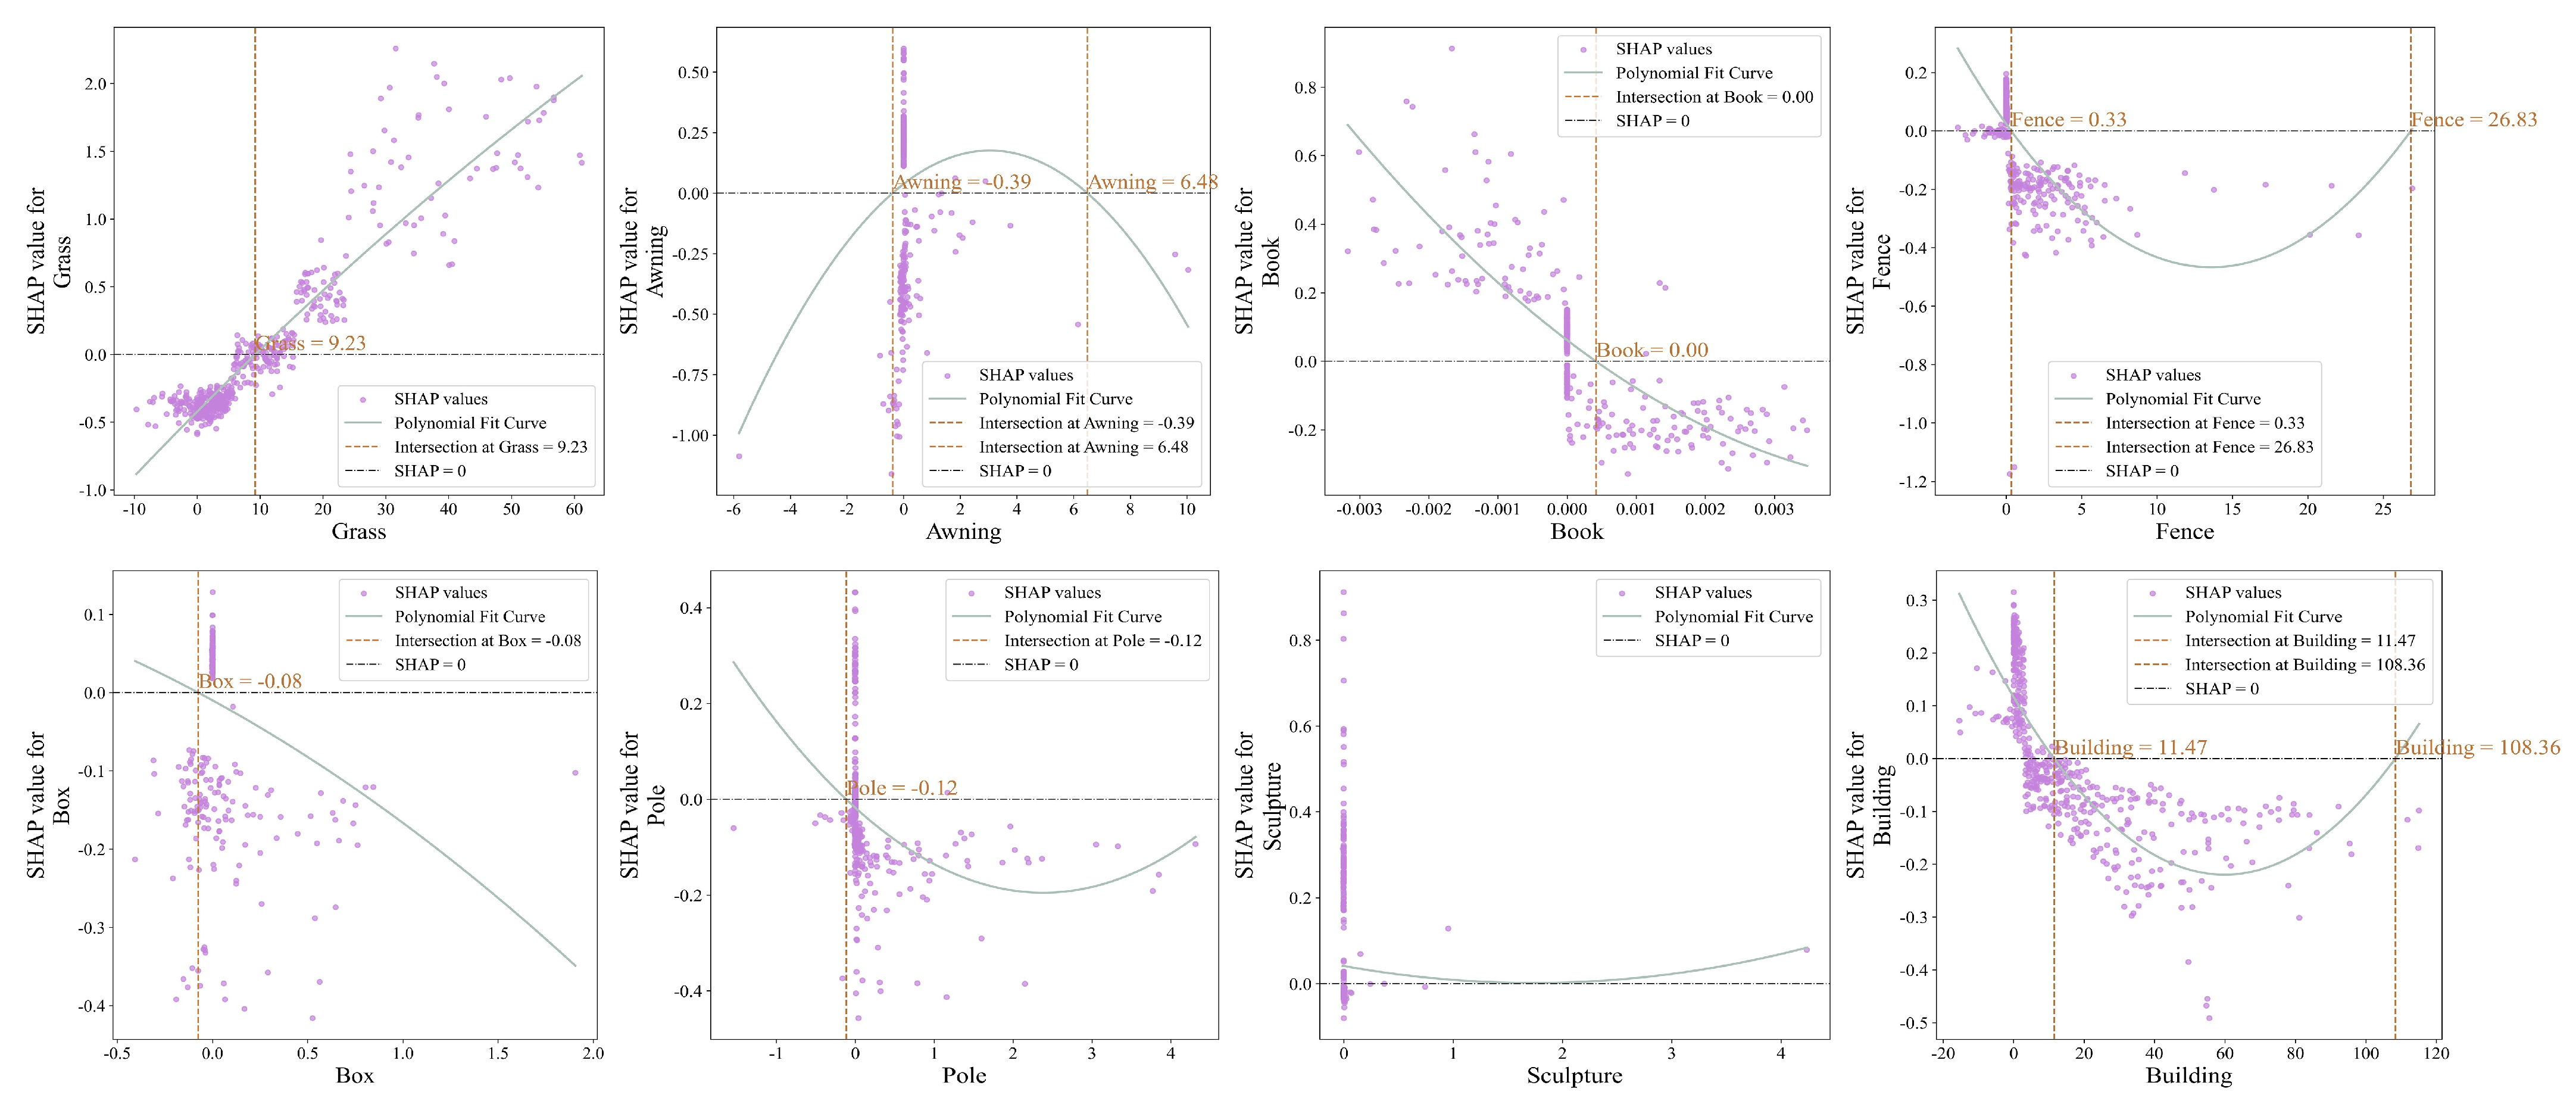
Figure 9 shows the influence patterns of the top eight important semantic features affecting students’ natural perception. The results indicate that grass significantly enhances natural perception once it exceeds about 9.23, making it the most important positive factor. Buildings have a slight positive effect when below 11.47 but become negative when this threshold is exceeded. Fences are unfavorable below 0.33 but turn positive after 26.83. Awnings and poles show fluctuating effects, shifting from positive to negative within certain ranges, though their overall influence is limited. Books, boxes, and sculptures have weaker effects, showing only minor influence in specific situations.
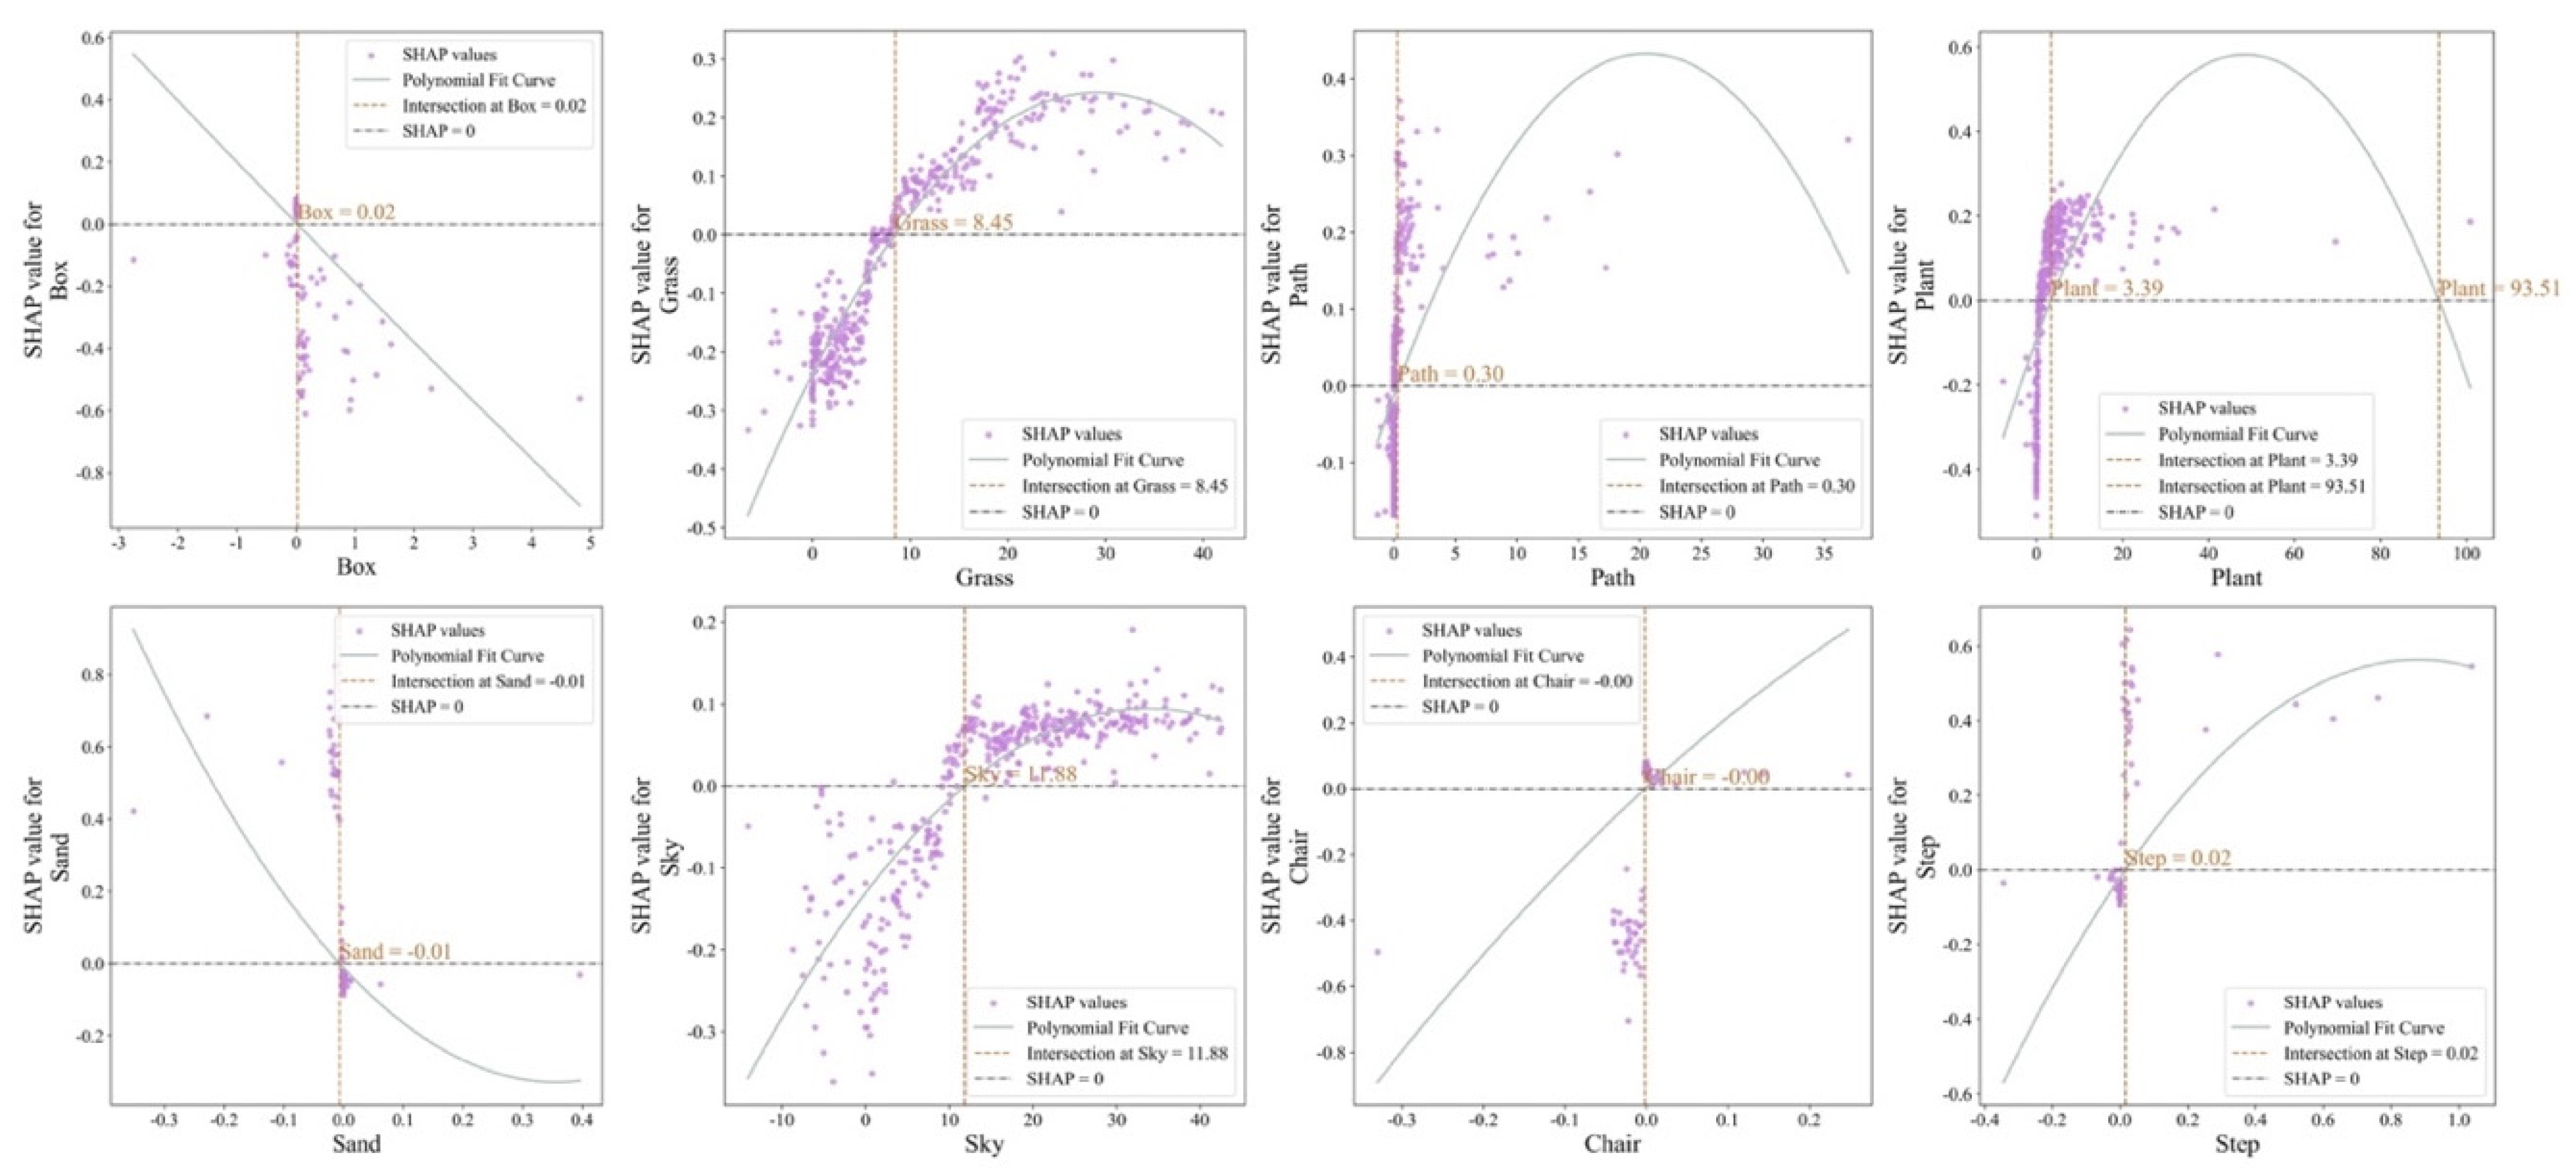
Figure 10 shows the top eight key semantic features influencing visitors’ natural perception and threshold effects. The results indicate that grass improves natural perception above 8.45, making it the strongest positive factor. Sky also continues to have a positive impact once it exceeds 11.88. Paths contribute positively when above about 0.30, while plants enhance perception significantly within the range of 3.39 to 93.51, but their impact weakens when values are too low or too high. In contrast, boxes become negative once they exceed 0.02. Sand is positive when below −0.01, but its effect weakens as the value increases. Chairs shift from negative to positive around zero, despite limited influence. Steps contribute positively when above 0.02.

4.2.3. Analysis of Semantic Features Influencing Cultural Perception of Students and Visitors

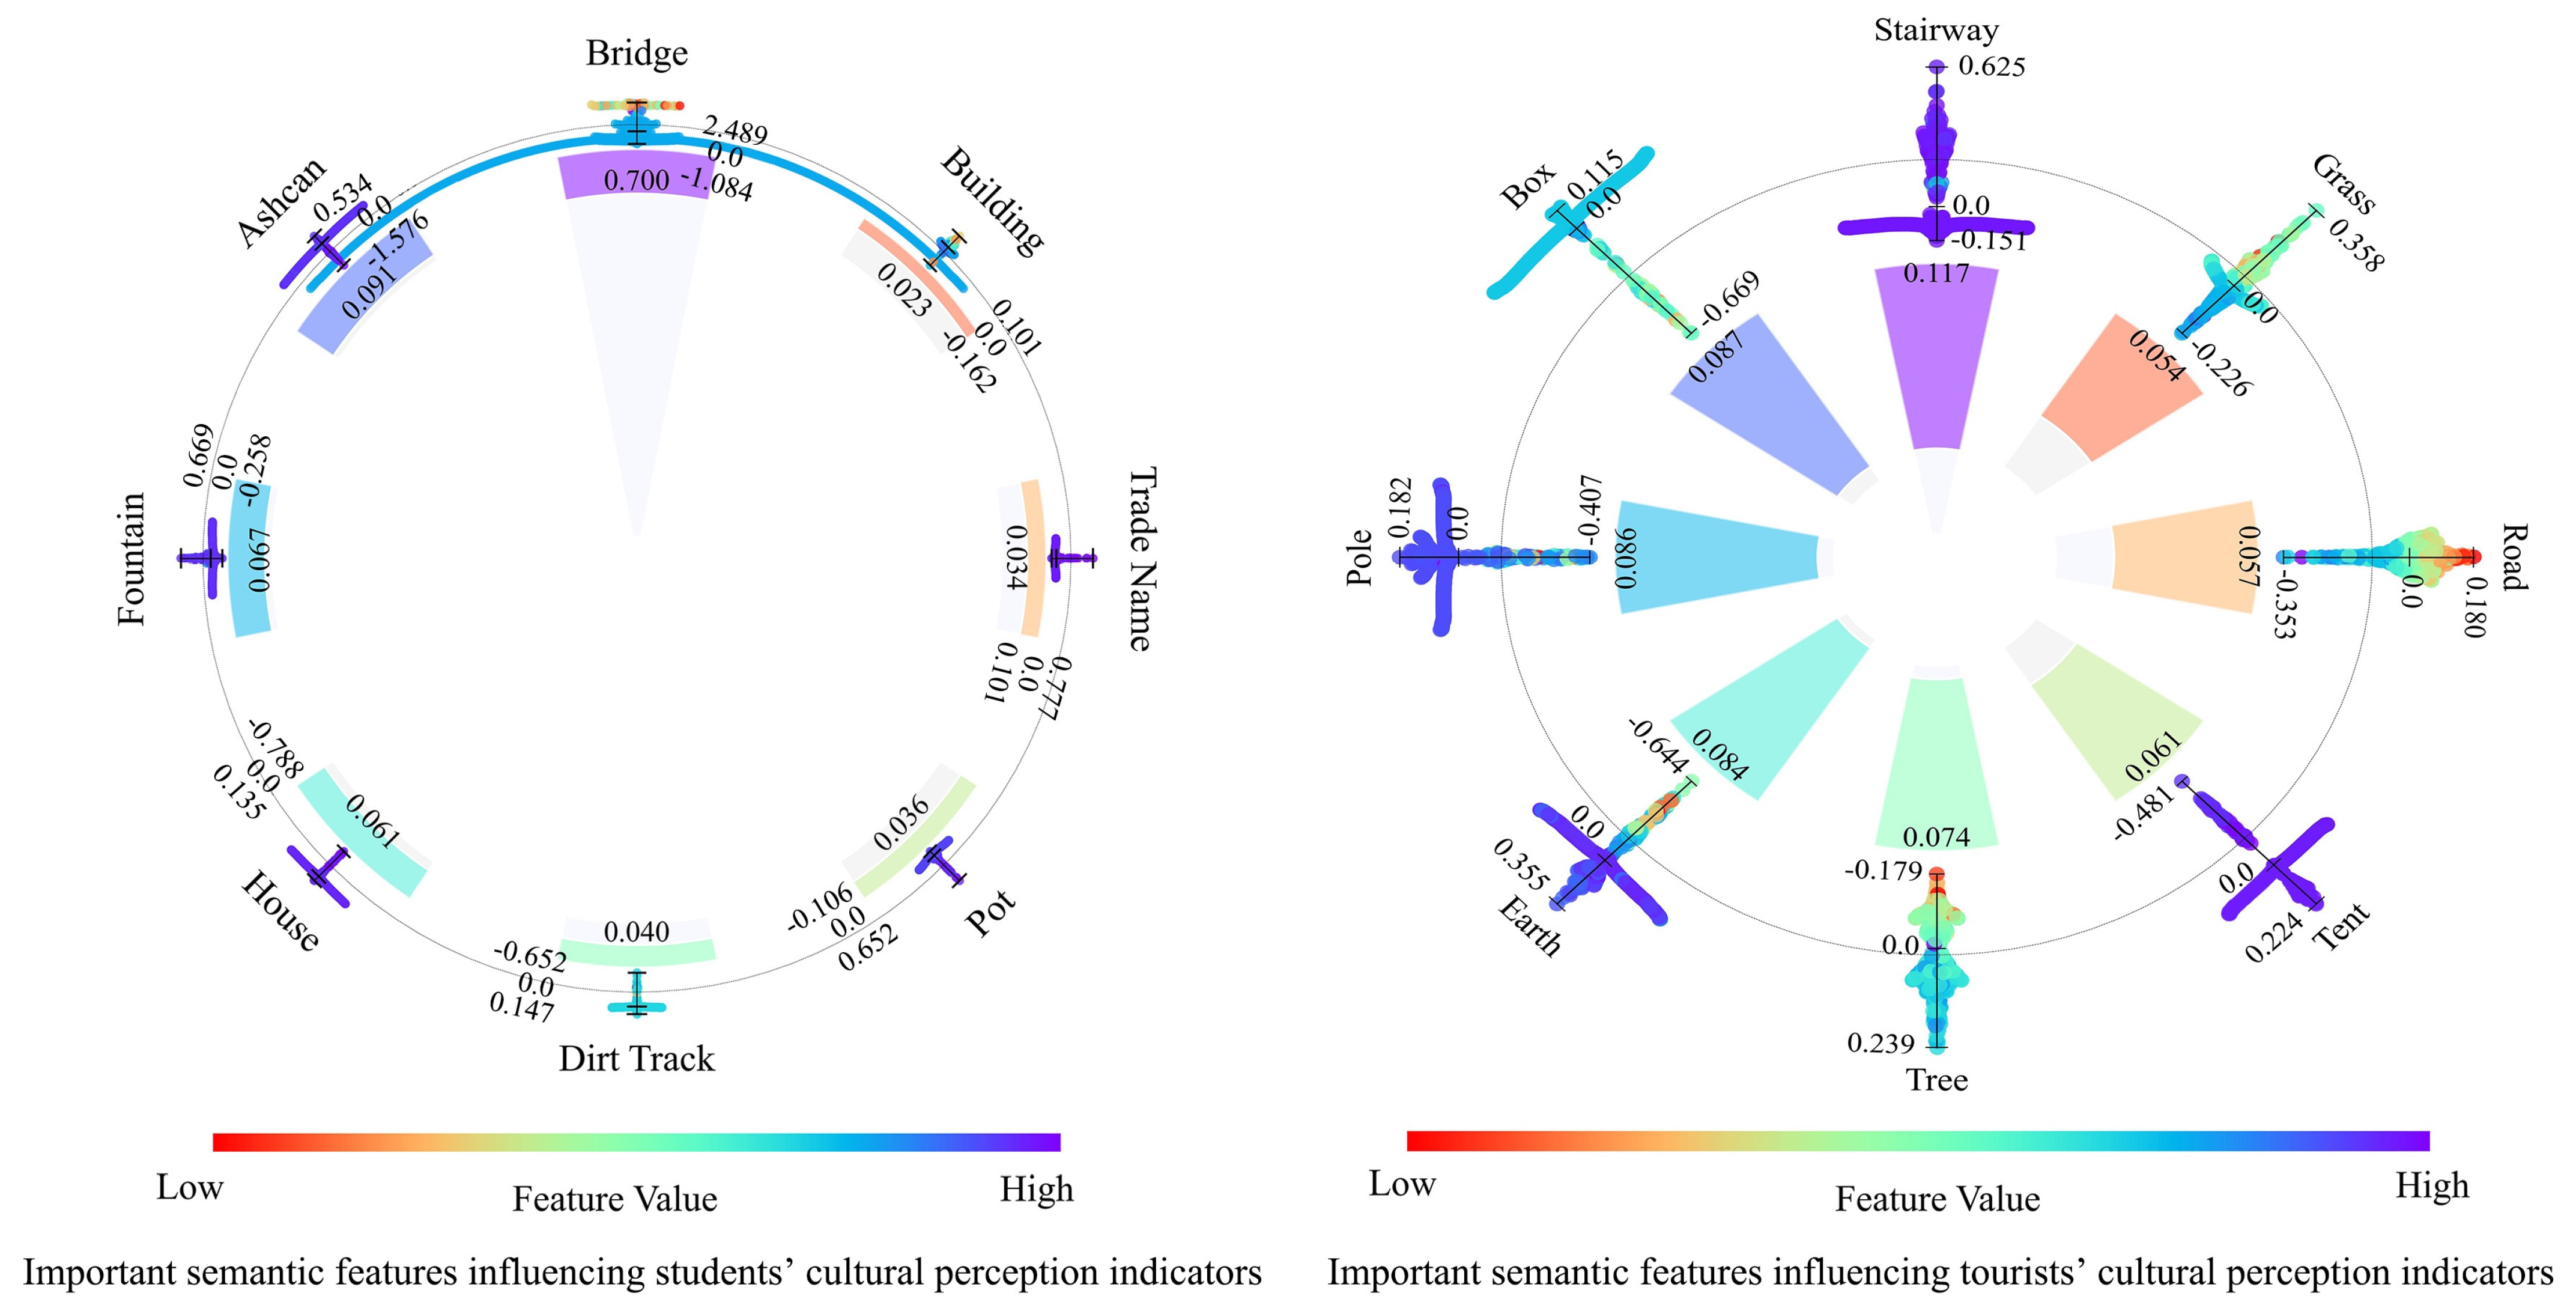
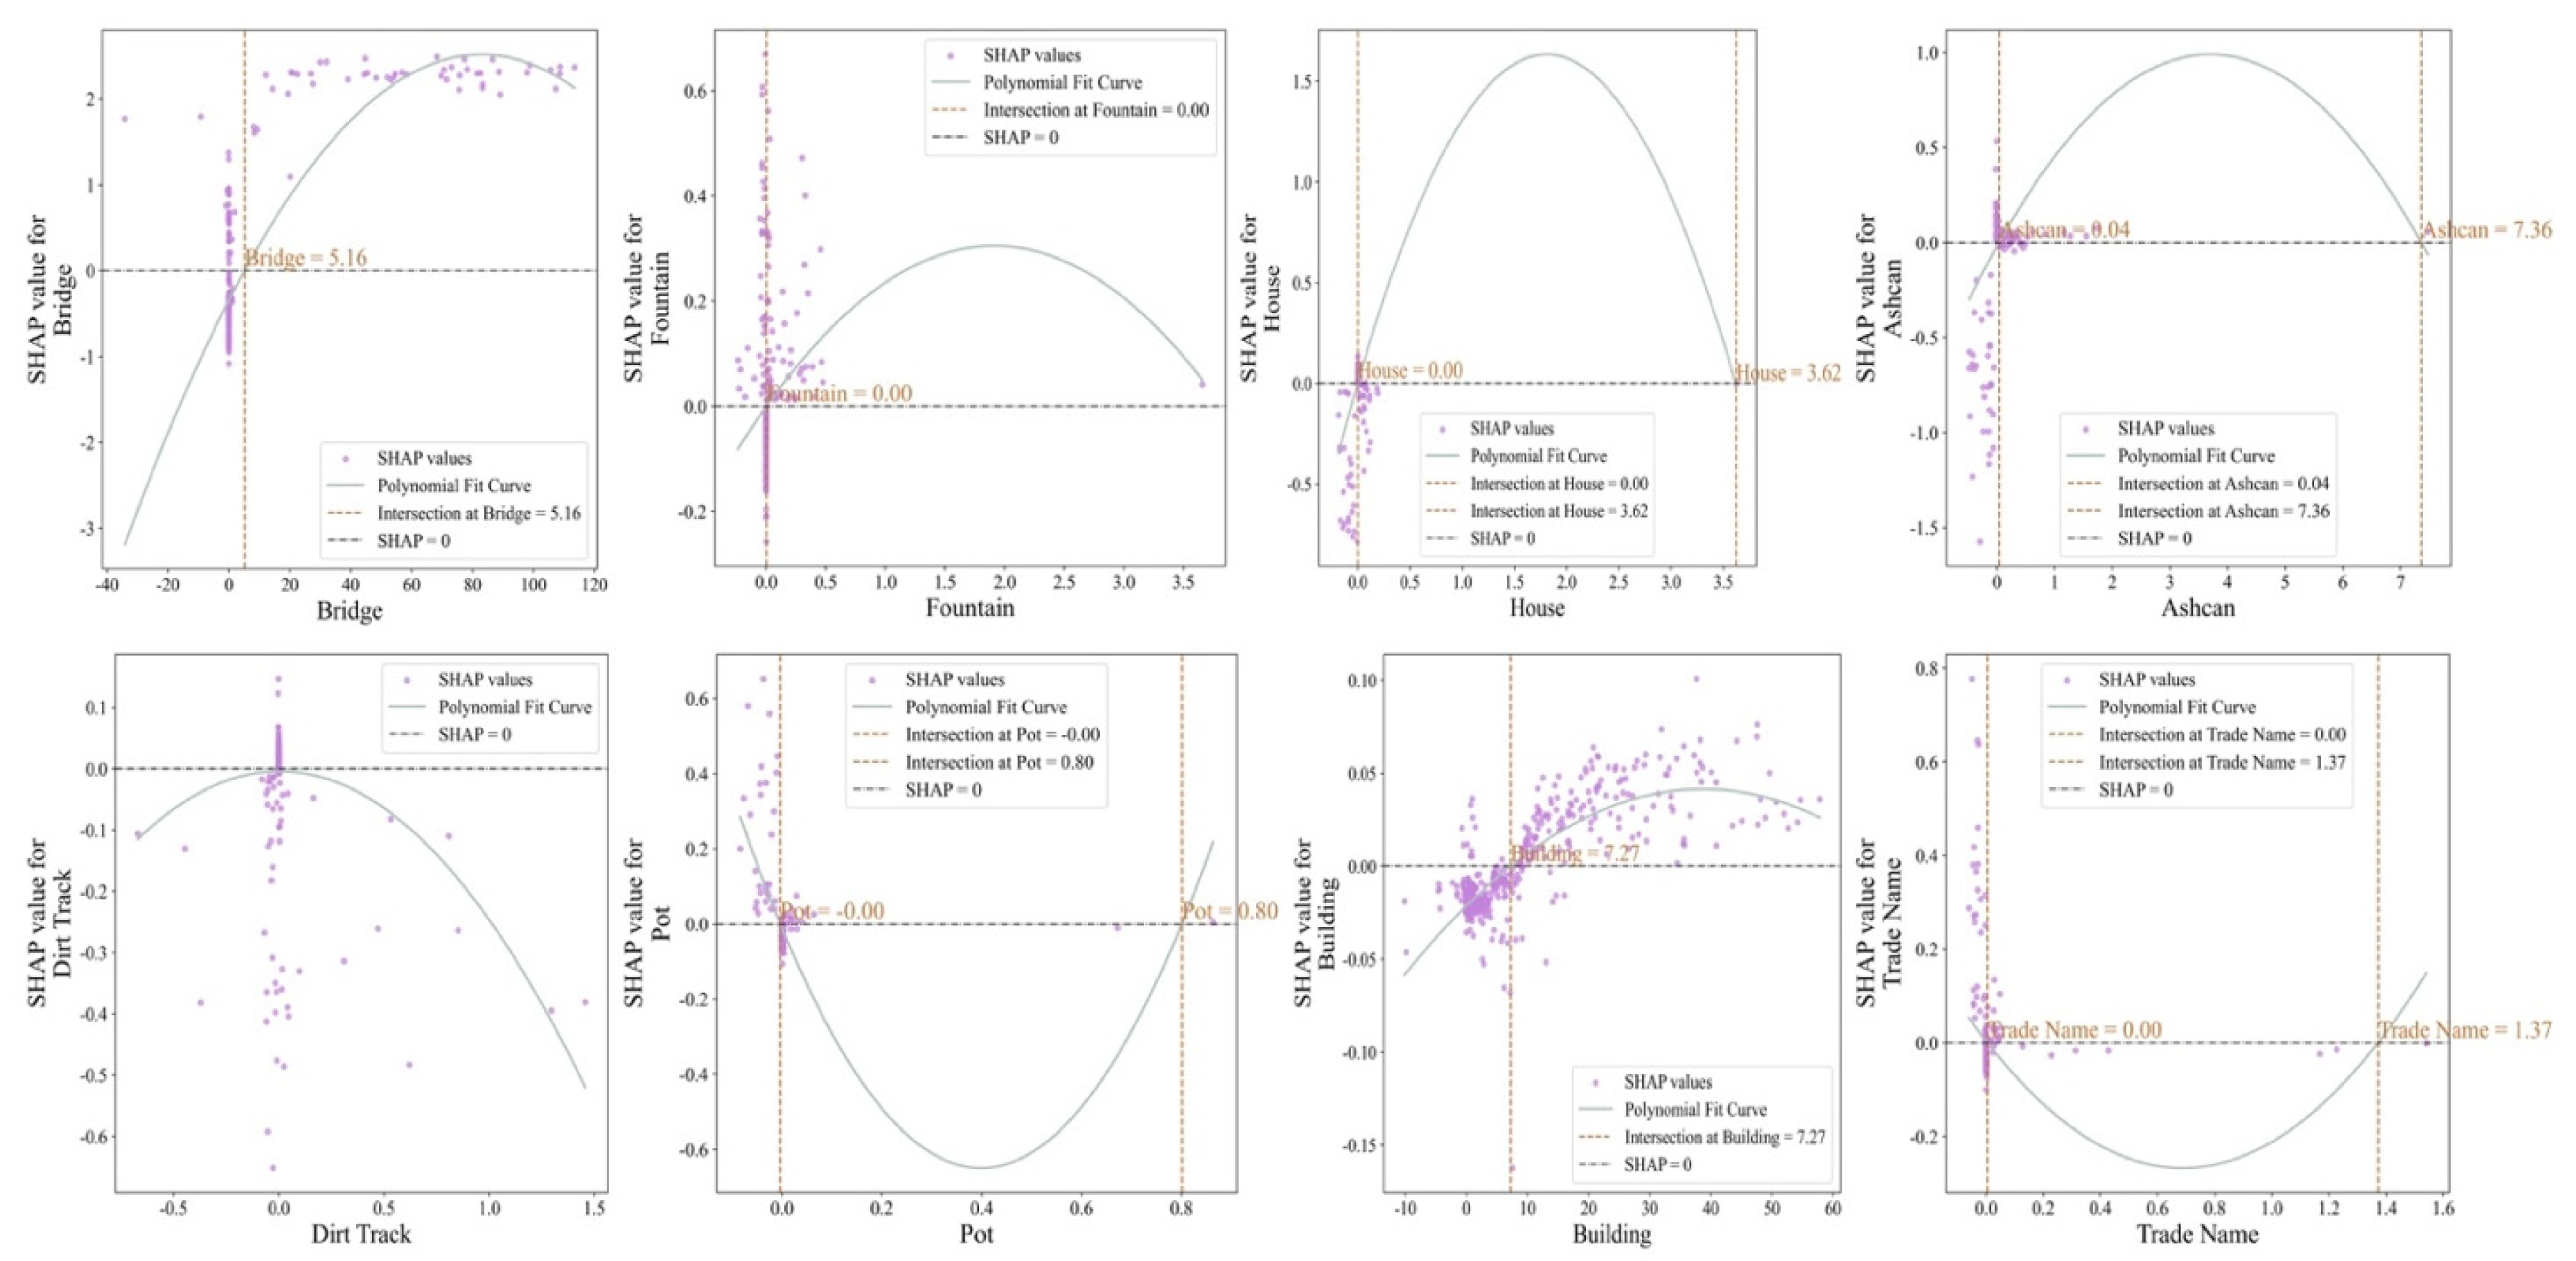
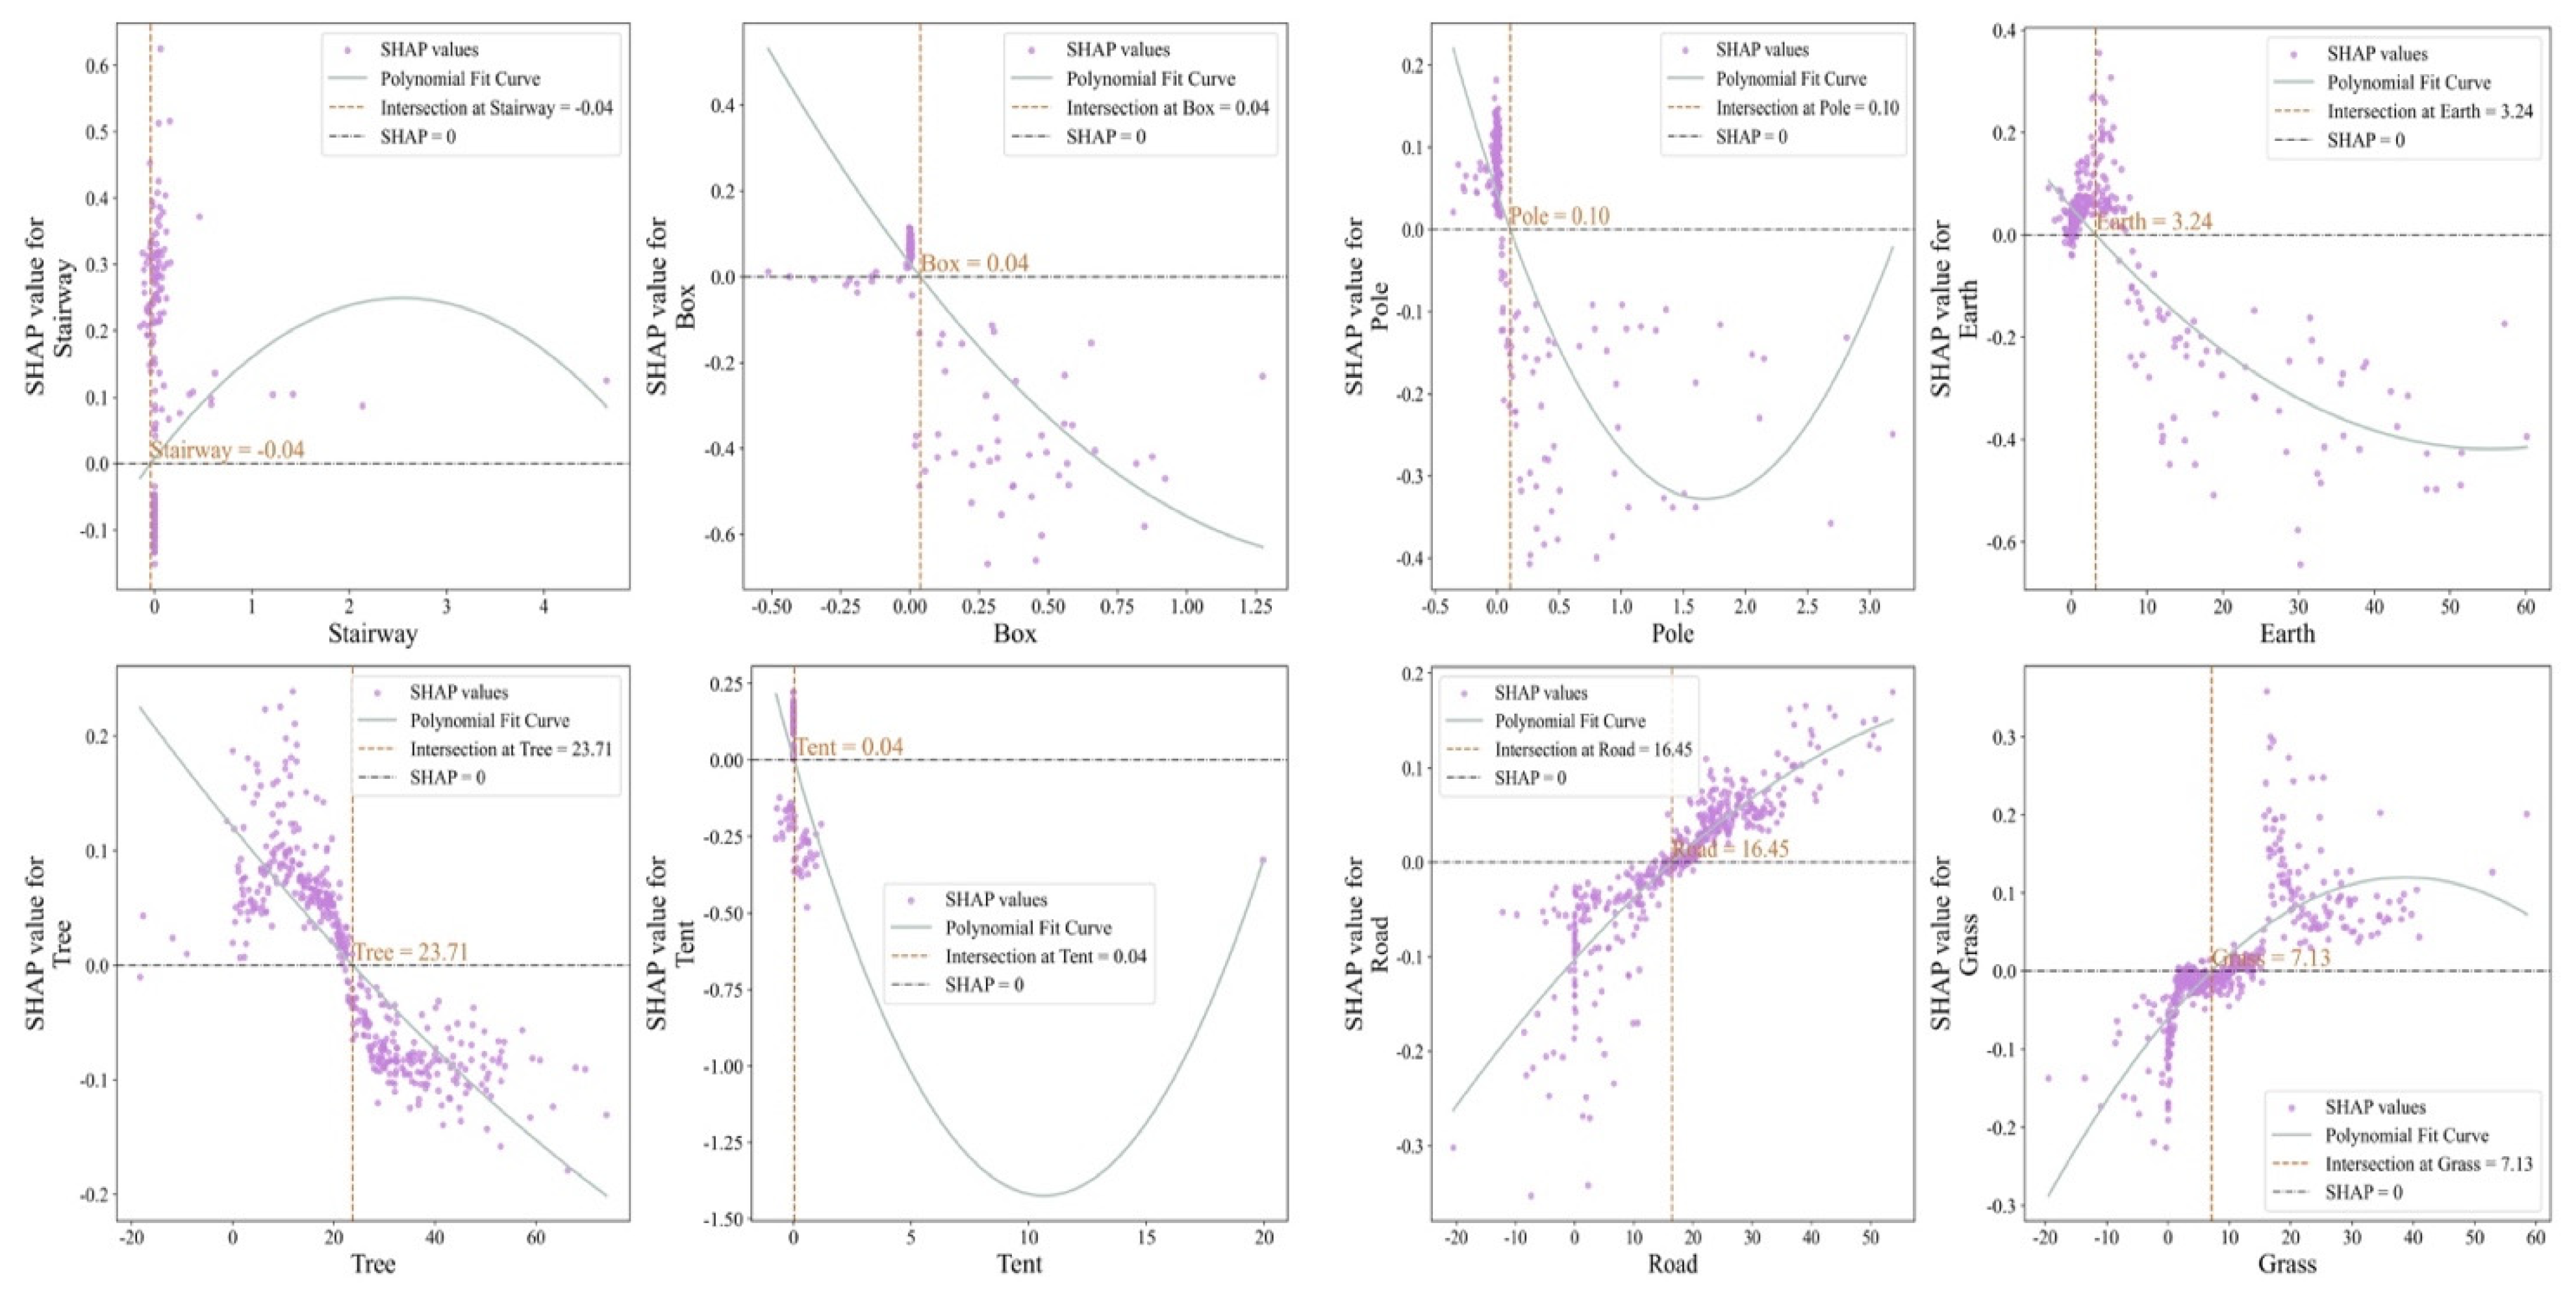
Figure 11 shows the SHAP analysis results of important semantic features influencing cultural perception for students and visitors. Both groups are commonly influenced by symbolic spatial elements such as buildings, which form the foundation of the cultural atmosphere. For students, elements like bridges, fountains, houses, and trade names are the main drivers, with symbolic or memory-related landscapes playing a stronger role in enhancing cultural perception. For visitors, cultural perception relies more on directly recognizable site elements such as stairways, roads, trees, and tents, which shape the cultural atmosphere through spatial use and visual symbols. At the same time, visitors are more sensitive to features like poles, boxes, and earth, which tend to weaken cultural perception when their values are high. Students’ cultural perception is generally rooted in landscape symbols connected to campus history and daily life, while direct environmental elements and experiential facilities influence visitors’ cultural perception.
Figure 12 shows the influence patterns of the top eight important semantic features affecting students’ cultural perception. The results indicate that bridges significantly enhance cultural perception once they exceed about 5.16, making them the most representative positive factor. Houses contribute clearly within the range of 0–3.62, but their effect weakens when values are too low or too high. Fountains generally have a positive impact, especially when values are greater than 0, where the effect remains steady. Ashcans show a positive impact within the range of 0.04–7.36, suggesting that their moderate presence helps the cultural atmosphere. Buildings gradually enhance perception when above 7.27, though their influence is limited. Trade names have a positive contribution within the range of 0–1.37. In contrast, dirt tracks and pots show weaker effects; in some ranges, they even have negative impacts.
Figure 13 shows the top eight important semantic features influencing visitors’ cultural perception and threshold effects. The results indicate that stairways have an overall positive impact once they exceed about -0.04, making them an essential factor in strengthening cultural perception. Roads continue to influence positively when above 16.45, and grass also shows positive contributions when greater than 7.13. In contrast, boxes, poles, and earth gradually become negative factors at higher values, weakening the cultural experience. Trees have little effect below 23.71 but show a clear negative impact when exceeding this threshold. Similarly, tents shift to an adverse effect once they are above 0.04.

4.2.4. Analysis of Semantic Features Influencing Aesthetic Perception of Students and Visitors

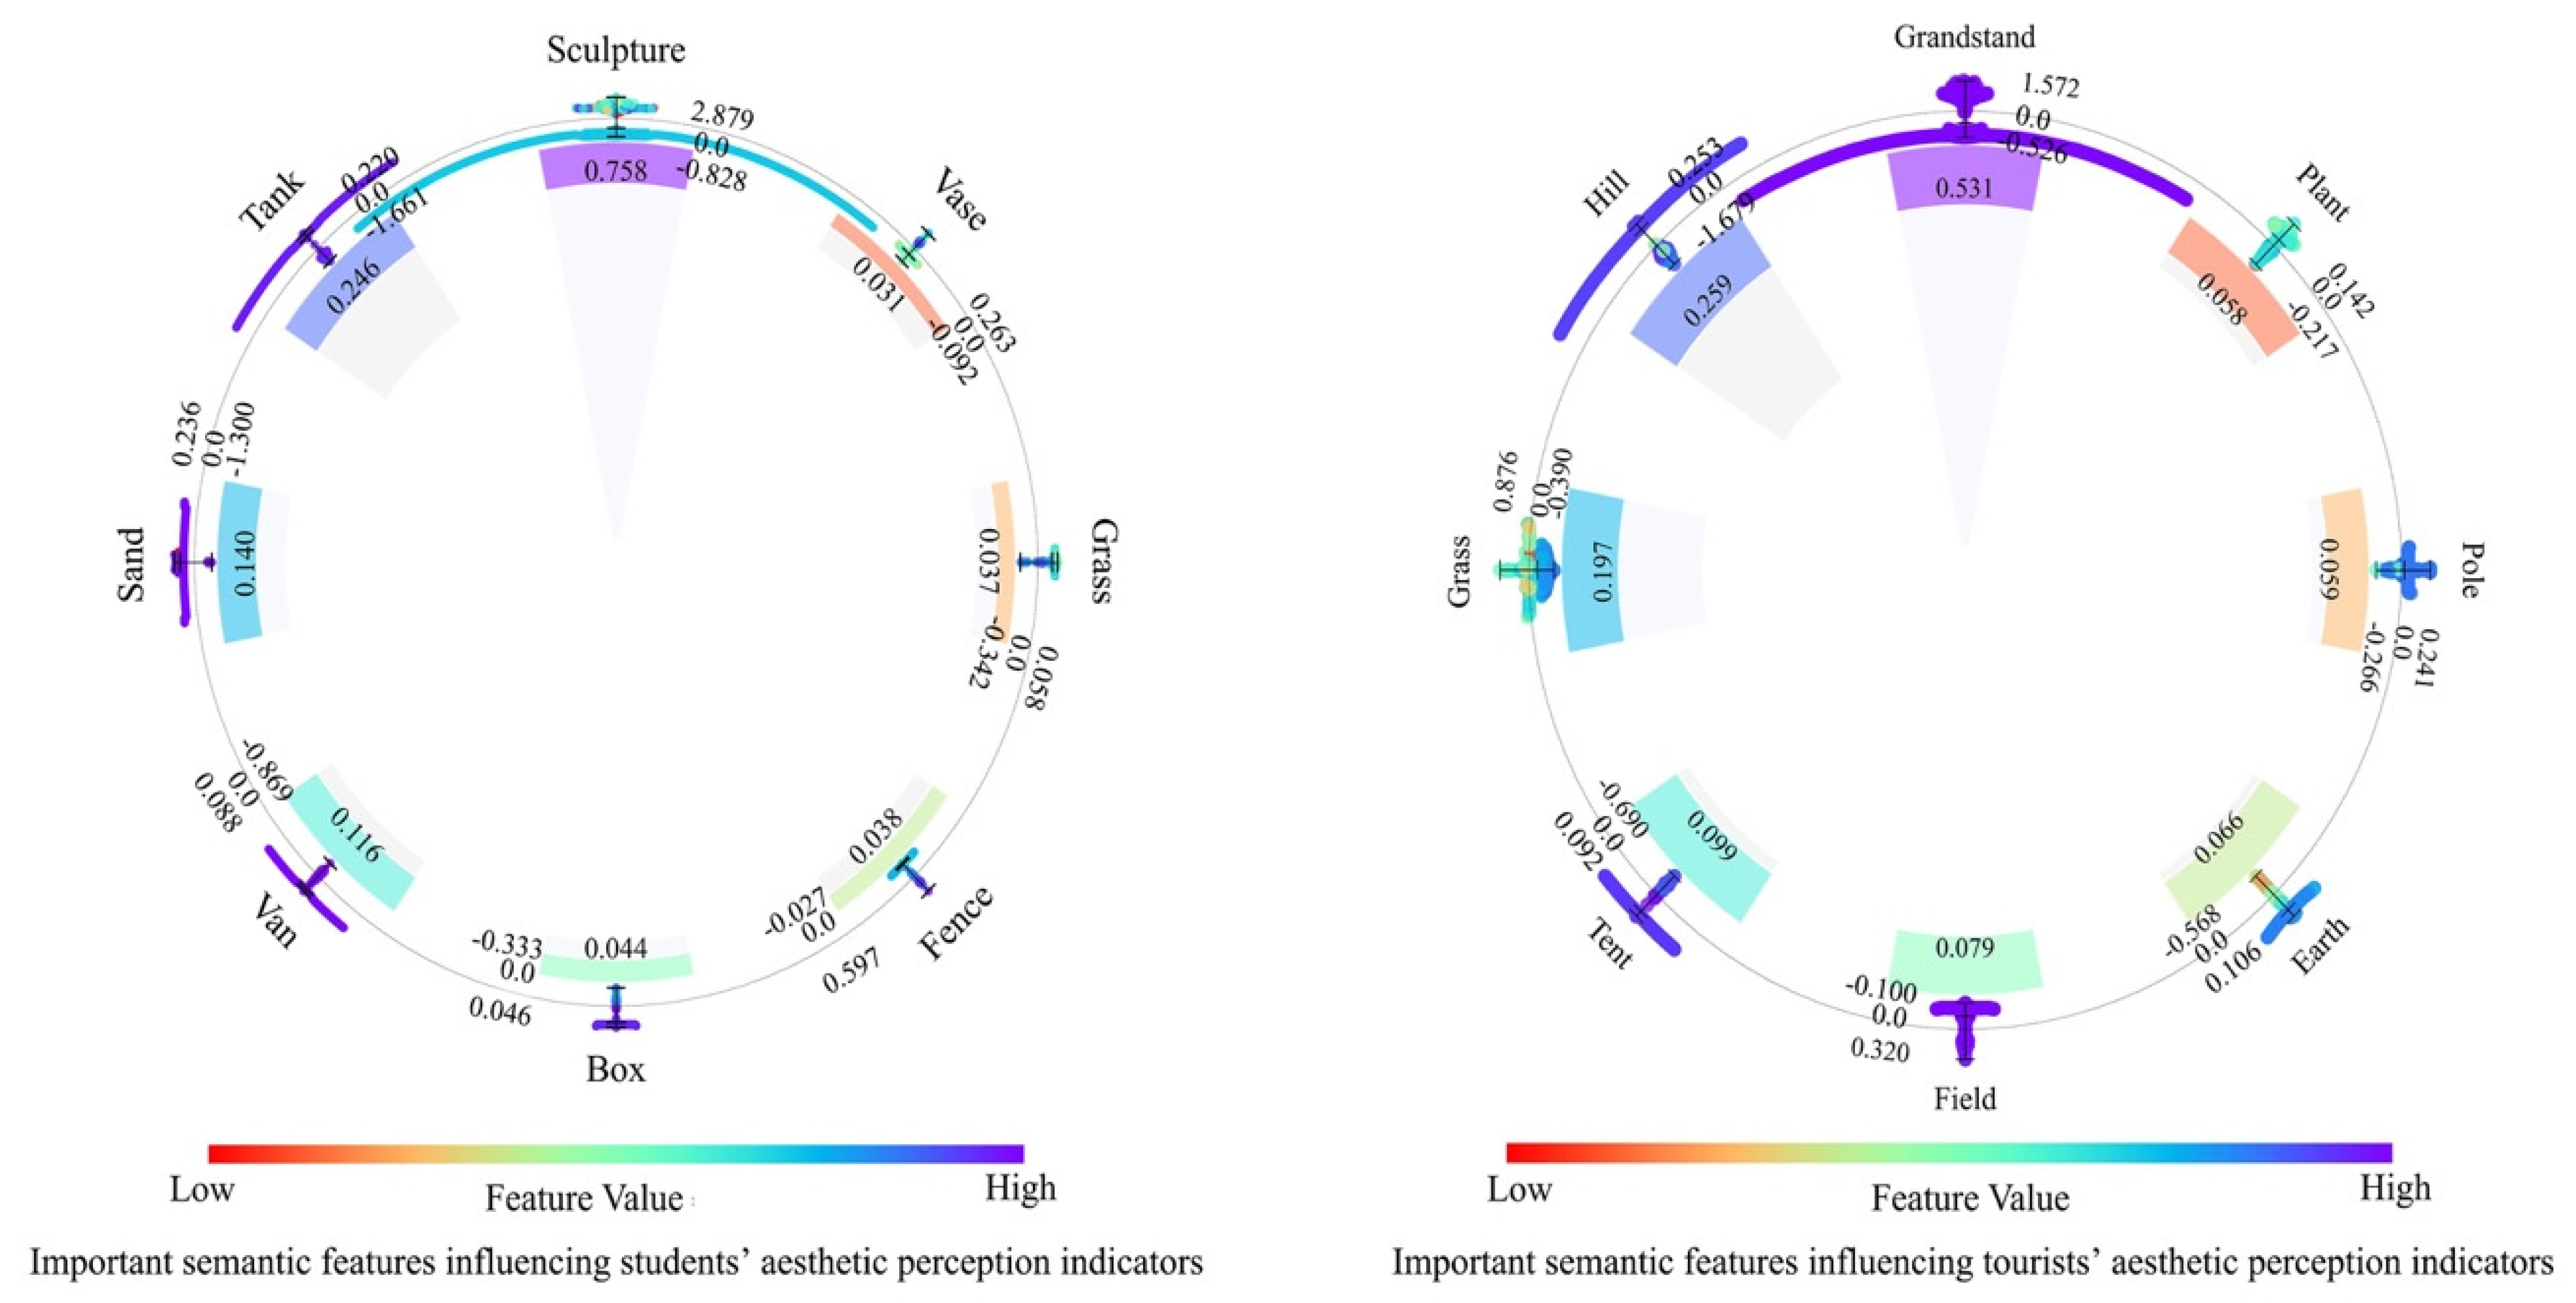
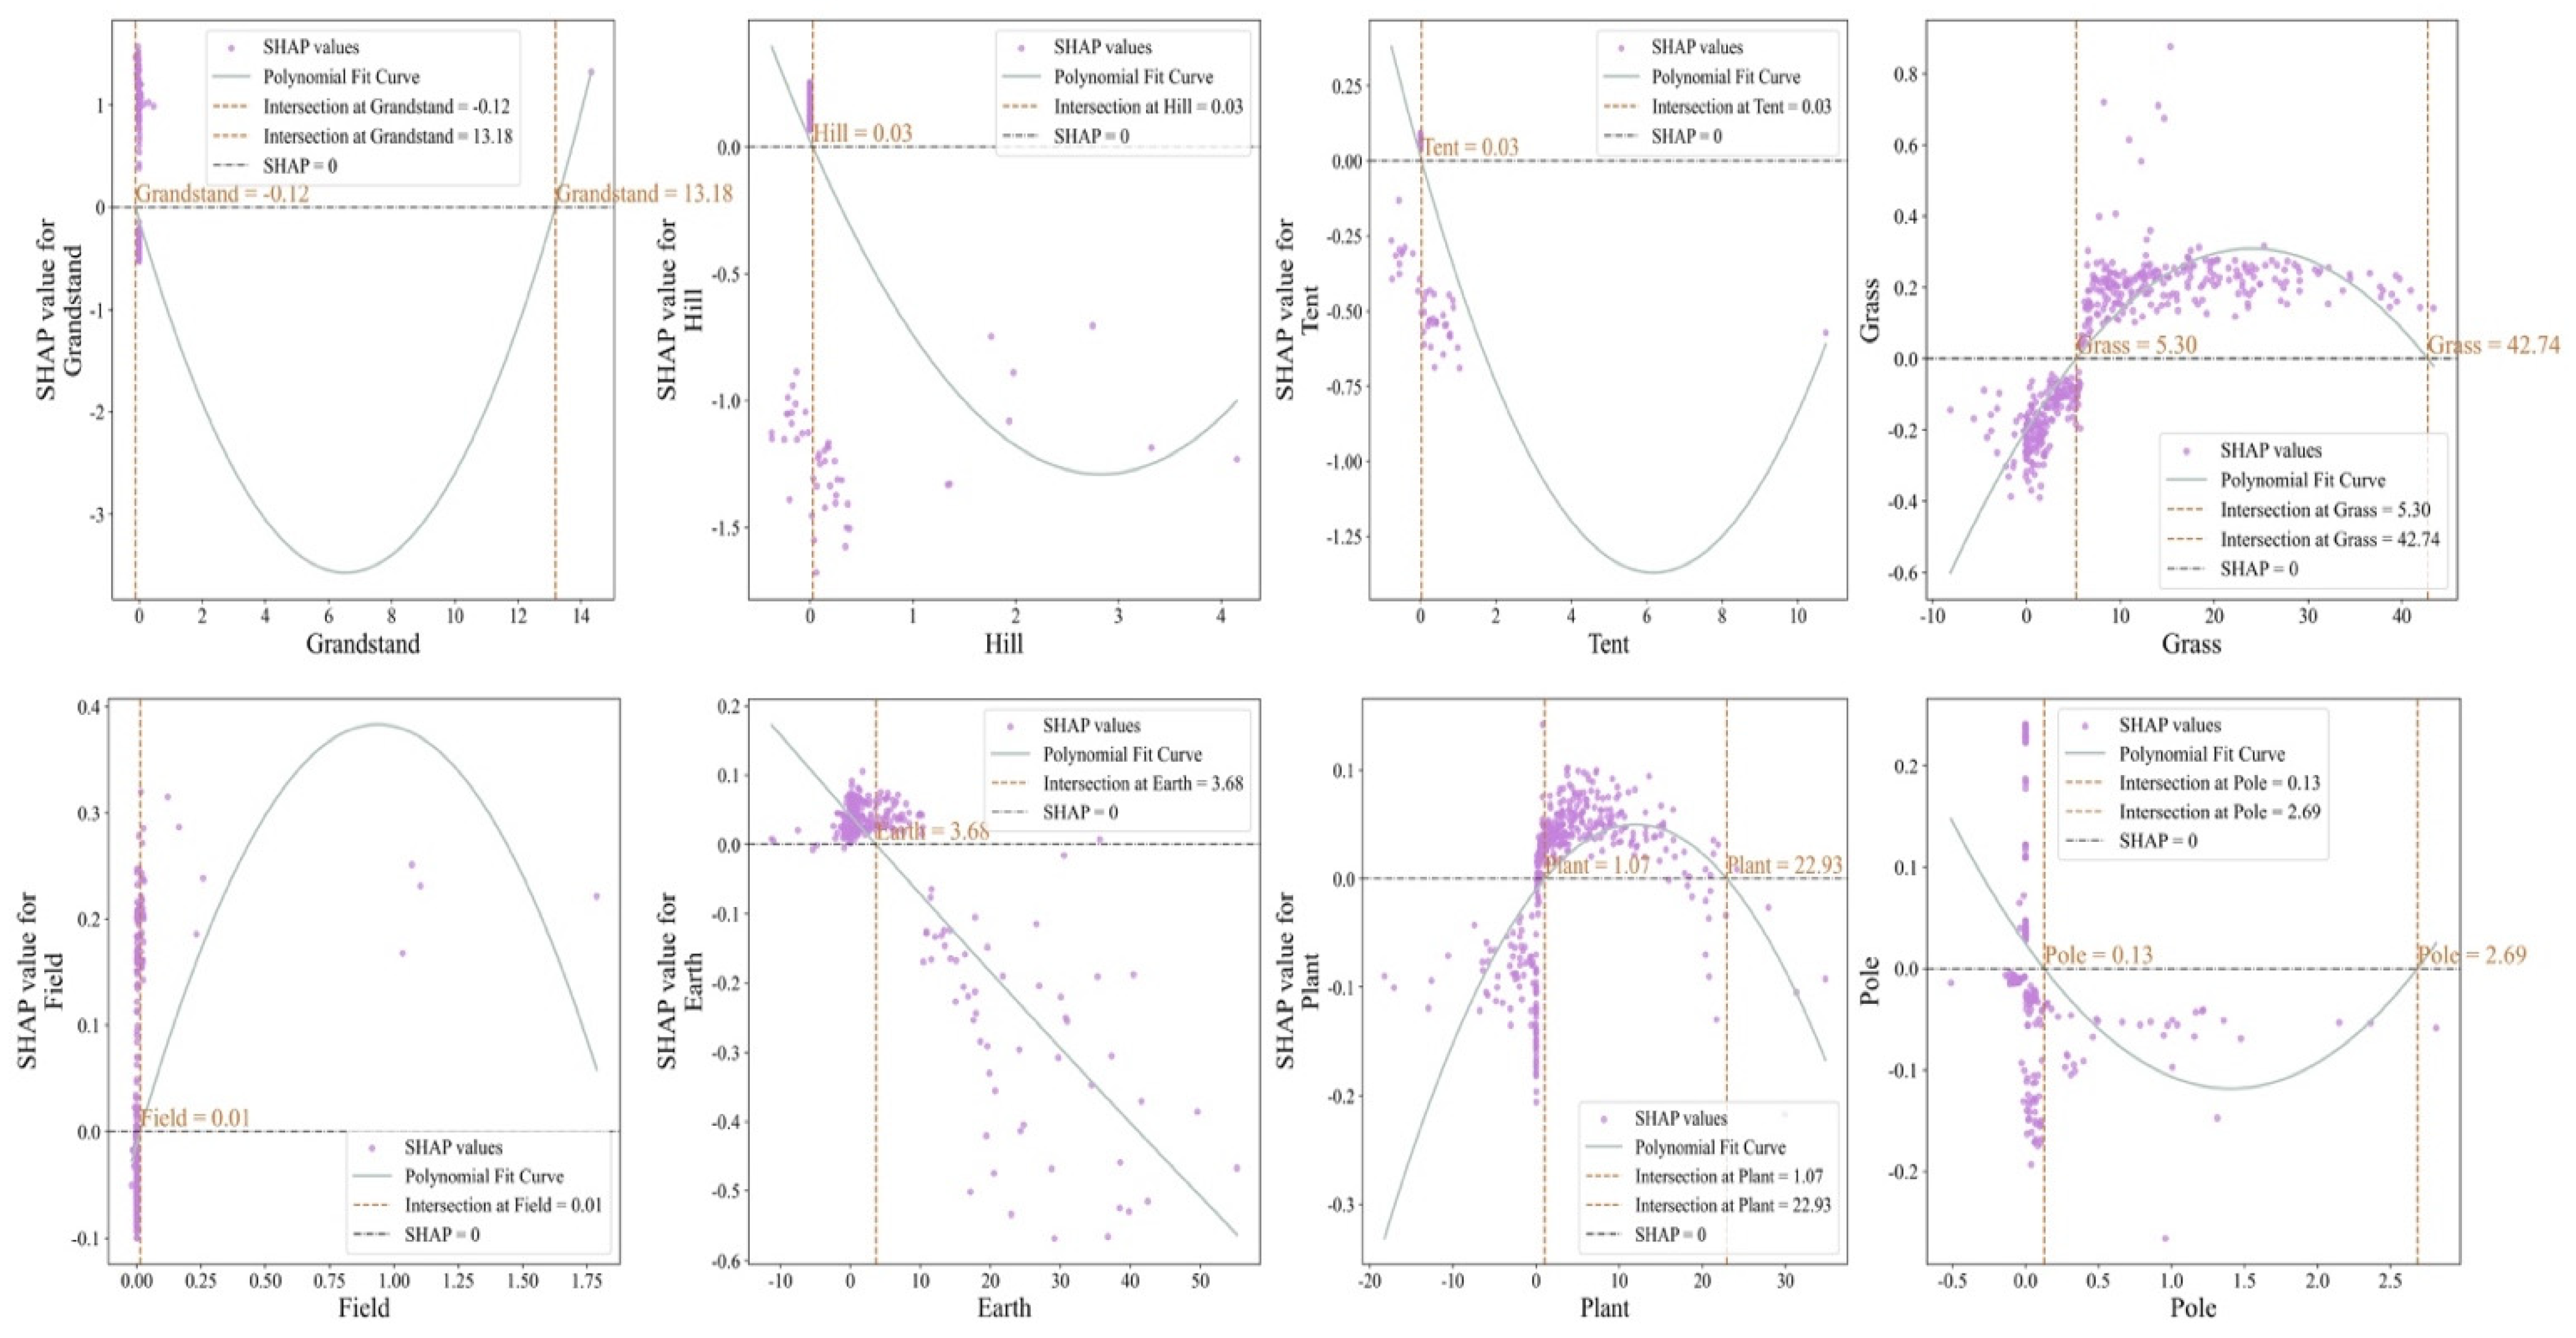
Figure 14 shows the SHAP analysis results of important semantic features influencing the aesthetic perception of students and visitors. For both groups, grass plays a shared role, as natural greenery generally enhances the beauty of the environment. Students rely more on sculptures, sand, and fences, which carry symbolic meaning or help create atmosphere. On the other hand, visitors place greater emphasis on features like grandstands, fields, and hills, while being more sensitive to facilities such as tents, poles, and earth, which can reduce aesthetic experience when overly present. Overall, visitors’ aesthetic perception depends more on spatial settings and scene elements, while students are more likely to be influenced by cultural symbols and landscape details.
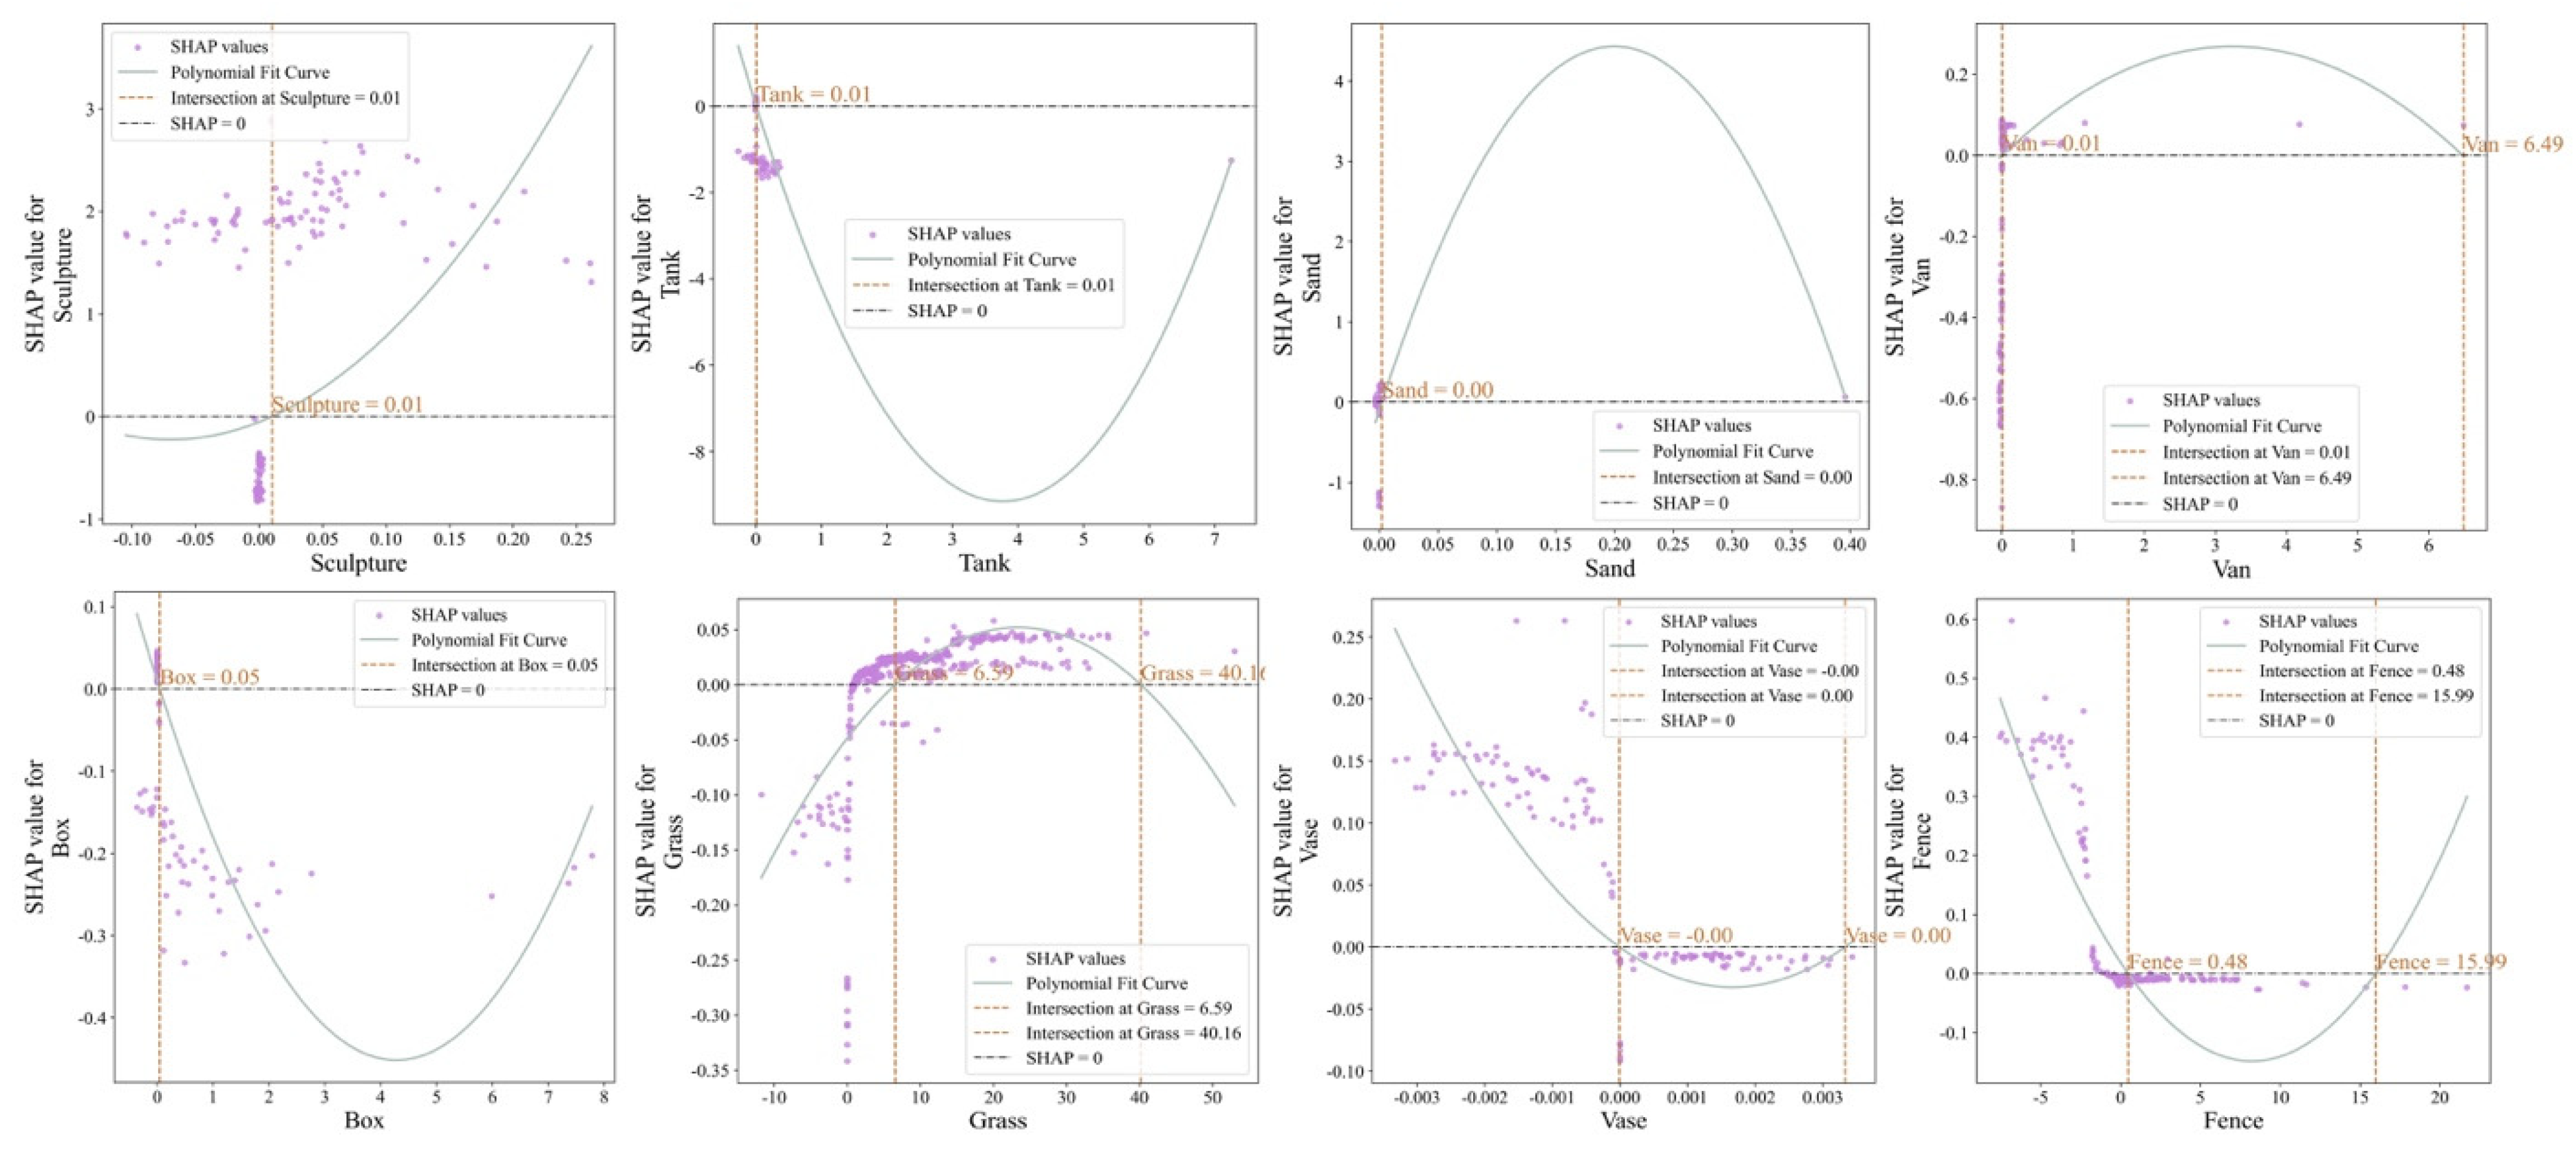
Figure 15 shows the top eight semantic features influencing students’ aesthetic perception and threshold effects. The results indicate that sculptures make a steady positive contribution once they exceed 0.01, making them the core factor for aesthetic perception. Sand significantly enhances perception when its value is greater than 0, while tanks have a positive effect in the range of 0–0.01. Vans have a positive impact between 0.01 and 6.49, but their effect weakens when the value is too high. Boxes contribute positively within the range of 0–0.05. Grass shows a positive impact within 6.59–40.16. In contrast, vases and fences have limited overall influence and show weak adverse effects in specific ranges.
Figure 16 shows the top eight semantic features influencing visitors’ aesthetic perception and threshold effects. The results indicate that grandstands significantly enhance aesthetic perception once they exceed 13.18. Grass provides a steady positive impact within the range of 5.30–42.74, while plants contribute positively between 1.07 and 22.93. Fields also bring a positive influence when above 0.01. In contrast, hills and tents generally show adverse effects. Earth turns negative when below 3.68, and poles display a weaker adverse impact within the range of 0.13–2.69.

4.3. Spatial Distribution of Key Semantic Features Influencing Students and Visitors, with Street View Comparison

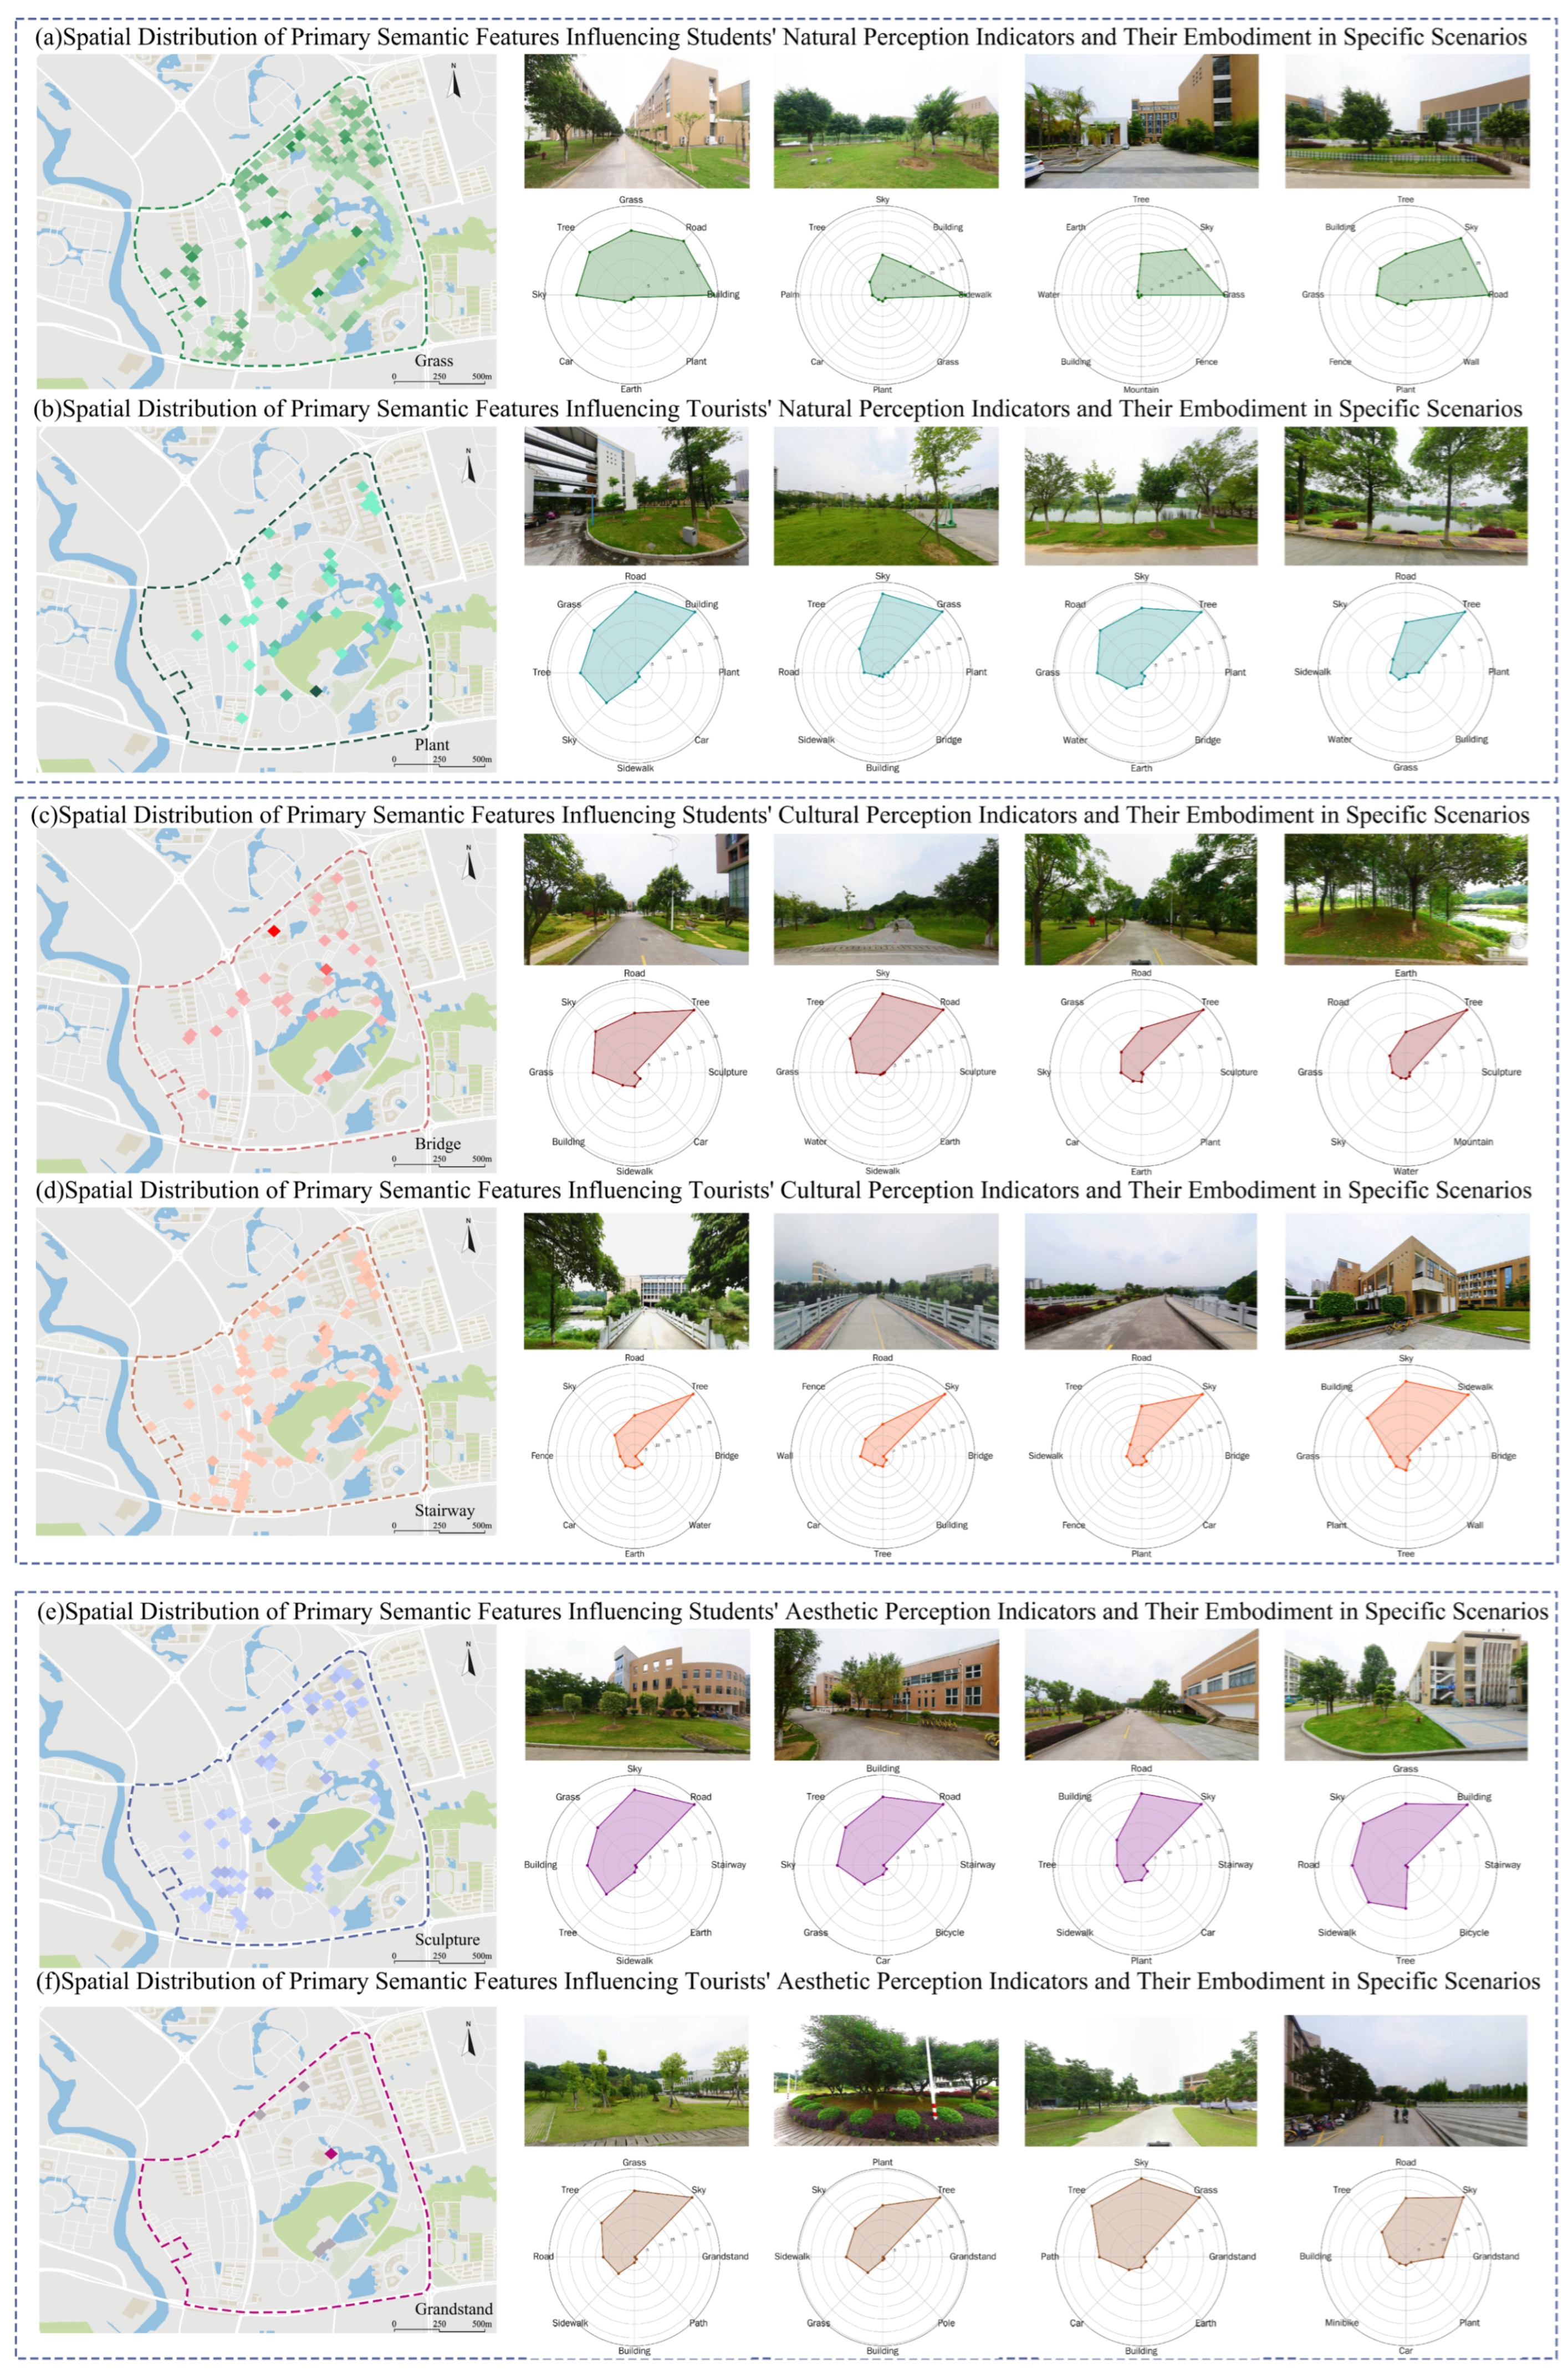
Figure 17 shows the spatial distribution of the key semantic features influencing students and visitors and the corresponding real-world street views. The six semantic features presented here come directly from the earlier SHAP results. We divided the task into six sub-items (“student/visitor × natural/cultural/aesthetic”). Based on the final model determined from the training set (with CTGAN augmentation), we calculated sample-level SHAP values on the test set, using the mean of their absolute values as the measure of global contribution, and applied 50 rounds of random resampling for robustness. For each sub-item, only the top-ranked semantic feature was kept for spatial projection and real-world examples. This sampling method ensures a clear one-to-one comparison between the two groups and the three perception dimensions while guaranteeing that the visualized features are the key factors with the most substantial marginal impact on perception. In this way, the results can directly support later spatial interventions and management decisions.
This figure presents, in six panels (a–f), the spatial patterns of the key semantic features influencing students’ and visitors’ perception and their corresponding forms in typical street views. On the left are the distributions of high-impact locations, the top right shows the related street views, and the bottom right presents the semantic radar charts. The key semantic features for each of the six sub-items are: Students—Natural perception: Grass; Visitors—Natural perception: Plant; Students—Cultural perception: Bridge; Visitors—Cultural perception: Stairway; Students—Aesthetic perception: Sculpture; Visitors—Aesthetic perception: Grounds.
Regarding overall patterns, for natural perception, grass for students forms hotspots along green areas and waterfront strips, closely linked with commuting corridors and the edges of teaching complexes. In the radar chart, grass carries the highest weight, followed by trees and sky, while buildings and roads are lower, showing that continuous greenery and open views shape the core image. For visitors, plants cluster at gateways, forest edges, and openings near water, with street views often featuring single tall trees, groups of shrubs, or ornamental flowerbeds. The radar chart shows plants rise clearly, followed by trees and sky, reflecting a “visually recognizable” scenic attribute.
For cultural perception, bridges for students connect key walking routes along rivers or corridors, with the radar chart showing bridges together with roads, sidewalks, and buildings as dominant, representing a linear cultural clue of “structure–access–order.” For visitors, stairways appear more often in entrance forecourts and at elevation changes. In the radar chart, stairways rise together with buildings and roads, highlighting ceremony and guidance in the visiting experience. For aesthetic perception, sculptures for students mainly appear in front of buildings and in transition zones between buildings and greenery. The street views show a balance of “sculpture–greenery–facade” as the core of the aesthetic setting, with the radar chart giving higher weights to sculptures and buildings, while grass and trees provide a backdrop. For visitors, grounds and points should be opened, and hard squares and forecourts should be cleaned along principal axes. In the radar chart, grounds are dominant, with buildings and roads framing the space and supporting composition, creating areas suitable for viewing, photography, and activities with strong carrying capacity.
In summary, high-value areas for students tend to extend along continuous corridors and linear interfaces, while visitors depend more on symbolic nodes.

4.4. Campus Open Space Functional Zoning Based on Key Semantic Features of Students and Visitors

In this section, the study identifies the top-ranking landscape features that influence students’ and visitors’ sense of nature, culture, and aesthetics: Grass, Bridge, Sculpture, Plant, Stairway, and Grandstand. Furthermore, coordinate points containing these landscape features are filtered out and, combined with the actual campus conditions, the study area can be categorized into five types of spatial units:
  • Green–blue ecological corridor zone
This zone, formed by continuous grass, trees, sky, and waterfront background, creates the green–blue base of the campus. It stretches in strips along commuting axes and riverbanks, with small resting spots appearing at corners and openings. In its semantic composition, grass and trees are the largest share, while sky and water provide an open backdrop, and buildings and roads remain at lower levels. This area supports students’ daily walking and commuting, offering visitors stable scenic frames at key nodes.
  • Academic and cultural axis with structural nodes
Bridges, together with roads and sidewalks, link building complexes and plazas to form an organizational pattern of “linear framework with rhythmic nodes.” Typical nodes appear at river crossings, corridor turns, and building entrances, serving the functions of stopping, recognition, and guidance. Regarding semantics, bridges work with roads, sidewalks, and buildings as dominant features, making them the leading carriers through which the campus structure is perceived and understood.
  • Interface aesthetic enhancement zone
Located between building forecourts and greenery, this zone centers on the combination of sculpture, building, and landscaping. The forecourt remains open with clear sightlines, while the sculptures’ scale matches the building facades, and grass and trees provide the underlying layers. Regarding semantic composition, sculptures and buildings are relatively high, with grass and trees at medium levels. This area directly shapes students’ daily aesthetic and resting experiences and determines the completeness of visitors’ viewing and photo-taking.
  • Gateway and landmark display zone
Centered on the main gate, landmark buildings, and distinctive sculptures, this zone is characterized by ceremonial sightlines and a broad hardscape foreground (grounds). A vast open space is kept at the front, with plants and trimmed hedges framing the sides, while buildings and roads in the background organize the entry and exit flow. In terms of semantics, grounds and dominates, buildings and roads define boundaries and rhythm, and plants enhance recognition. This area provides the first impression for visitors and represents the image of the campus.
  • Open activity and hardscape plaza zone.
This zone is centered on open forecourts and sports or gathering spaces dominated by grounds. Its geometric boundaries and entrance rhythms are clear, allowing for circulation, gathering, and activity use. Regarding semantic composition, grounds are the main element, while buildings and roads define the boundaries and access framework. Plants and trees locally soften the scale and provide shade. This area is highly adaptable to different contexts and serves as a primary setting for various activities and photo opportunities.

5. Discussion

For the top eight features identified by the enhanced explainable decision tree algorithm, the Section 5 first analyzes the impact coefficients using a multiple regression model. Table 5 shows that for the natural perception of the student group, the influences of Grass (0.03), Box (−0.24), Building (−0.02), Fence (−0.06), and Awning (−0.04) are notable. For the natural perception of the tourist group, the effects of Plant (0.02), Step (2.20), Chair (−1.81), Sky (0.03), Sand (6.53), Box (−0.33), Path (0.03), and Grass (0.03) are all significant. Regarding the cultural perception of the student group, the impacts of Bridge (0.04), Building (0.004), Pot (1.01), House (−0.13), and Ashcan (−0.26) are evident. In the case of the tourist group’s cultural perception, the effects of Stairway (0.46), Grass (0.01), Road (0.008), Tree (−0.01), Earth (−0.009), Pole (−0.13), and Box (−0.16) are prominent. For the student group’s aesthetic perception, the influences of Grass (0.009), Fence (−0.02), Box (−0.28), Van (−0.09), and Tank (−0.38) stand out. In terms of the tourist group’s aesthetic perception, the effects of Grandstand (0.02), Earth (−0.04), Tent (−0.12), Grass (0.01), and Hill (−0.12) are notable. The R 2 and F−statistic values for the six equations in Table 5 demonstrate a satisfactory fit, highlighting the key features’ influence on the psychological perceptions of both groups.
Regarding research methods, many international studies on campus outdoor spaces have used post-occupancy evaluation (POE) and questionnaires to describe place quality and user experience, or applied space syntax to identify social and accessibility hotspots [12,79]. These studies provide a solid framework for campus environment evaluation, but they are relatively limited in revealing the non-linear effects and threshold influences of specific spatial elements on perception. This study develops an integrated approach of “street view semantic segmentation—interpretable learning—spatial classification.” First, Mask2Former is used for pixel-level segmentation of street views to quantify semantic elements in a unified way. Then, random forest, gradient boosting trees, and AdaBoost are applied as model backbones, with SHAP introduced to explain feature contributions, directions, and potential thresholds. To address the problem of sample imbalance caused by “population × space” interactions, CTGAN is used for conditional data augmentation during training. Finally, the key semantic features the model identifies are projected onto space and matched with street views, translating statistical evidence directly into governable units such as “corridors, nodes, interfaces, and forecourts.” This approach has three main advantages: (1) it compares both students and visitors within the same segmentation framework for cross-space analysis; (2) it uses SHAP to clearly identify the positive and negative effects of features and their possible thresholds, avoiding the “black box” problem; and (3) it connects statistical findings with functional zoning and figure–scene interpretation, turning results into practical governance tools. In addition, international evidence on campus green spaces and college students’ mental health provides interdisciplinary support for focusing on green–blue elements in natural and aesthetic perception dimensions, strengthening the rationality and broader relevance of the proposed strategies.
Regarding research findings, existing campus studies mainly focus on overall quality evaluation and often consider a single group, usually students [80,81]. Supported by pixel-level semantics and interpretable modeling, this study identifies a stable correspondence among “semantics, space, and groups.” Natural perception is mainly shaped by continuous green–blue corridors (grass/plant plus sky/water); cultural perception is tied to structural frameworks such as bridges and roads (bridge/stairway plus road/sidewalk/building); and aesthetic perception centers on transitions between buildings and greenery as well as open forecourts (sculpture/grounds and building). More importantly, the study reveals apparent group differences: students favor linear continuity along commuting corridors and the edges of teaching areas, while visitors are drawn to symbolic nodes such as gateways, bridges, and forecourts. Based on SHAP evidence, we identified six key semantic features (grass, plant, bridge, stairway, sculpture, grounds) and mapped them onto the spatial distribution of “key elements—typical locations—scene forms.” From this, we propose layered interventions and five categories of functional zones: green–blue ecological corridors, academic and cultural axes with structural nodes, interface aesthetic enhancement zones, gateway and landmark display zones, and open activity and hardscape plazas. Thus, this study addresses students and visitors, explains nonlinear and threshold-driven mechanisms, and directly translates statistical results into actionable strategies for path optimization, node design, and interface improvement.

6. Conclusions

Using the Qishan Campus of Fuzhou University as a case study, this research builds an integrated framework of “street view image semantic segmentation (Mask2Former)—enhanced interpretable machine learning (combining CTGAN and decision tree algorithms with SHAP)—functional zoning.” The study systematically describes the chain of “elements—perception—space types” in campus open spaces by linking questionnaire-based measures of natural, cultural, and aesthetic perception. On the data side, the approach combines multi-view street view collection with semantic feature quantification. On the modeling side, it introduces enhanced interpretable decision trees, using SHAP to reveal directions and thresholds of influence. This provides a practical path for translating from element-level analysis to spatial governance. The main findings and corresponding directions for landscape improvement are as follows:
  • At the full-sample level, the three types of perception show stable and interpretable semantic differences between students and visitors, which can form a set of improvement suggestions. For natural perception, both groups benefit from the grass and the sky. However, when the proportions of buildings, fences, and awnings become too high, the natural experience is weakened for students. Visitors rely more on the direct combination of grass, sky, paths, and sand, and they are more sensitive to facilities such as chairs and steps, which become negative when overused. Therefore, along commuting and waterfront axes, continuous green–blue corridors should be strengthened, visual obstructions cleared, and hard edges softened with hedges, open railings, and rain shelters of controlled scale. At visitor nodes, planting design should focus on “small but refined” compositions, keeping facilities to a minimum. For cultural perception, the most potent positive effect for students comes from the linear structure guided by bridges (with an apparent threshold effect), and this can be further reinforced by adding fountains, houses, or trade names to enhance recognition. For visitors, entrances and elevation-change nodes are enhanced by stairways, higher levels of roads, and medium-to-high grass, while high proportions of boxes, poles, and bare earth, as well as poorly placed trees or tents, reduce the experience. The corresponding design direction is to strengthen accessibility and recognition at bridges and corridor nodes, create a “stairway–road” ceremonial sequence at gateways, unify signage and lighting, and reduce visual clutter by merging or burying boxes and poles, and minimizing exposed earth and temporary structures. For aesthetic perception, both groups generally benefit from grass. For students, even small amounts of sculpture can significantly improve the visual experience, and this can be complemented with limited sand elements. Visitors, in contrast, see clear improvement from grandstands, fields, and moderate levels of plants, while hills, tents, low-threshold earth, and specific ranges of poles tend to disrupt the scene and movement. The recommended approach is to implement coordinated “sculpture–building–greenery–paving” compositions in front of teaching buildings and at building–landscape transition zones, keep grounds clean and continuous along principal axes, use plants as a secondary compositional layer, and strictly control the number and placement of hills, tents, earth, and poles.
  • In the functional zoning of campus open spaces, the green–blue ecological corridor zone is structured by continuous grass, trees, sky, and waterfront backgrounds. It supports students’ commuting and walking, while providing visitors with stable green–blue scenic frames. Overall, it shows a pattern of “linear continuity with point stops.” The design recommendations are strengthening the continuity of street trees and lawns, adding small-scale resting spots under trees, softening the edges of buildings and fences, limiting motor vehicle disturbance, and improving basic nighttime lighting and anti-slip measures. The academic and cultural axis with structural nodes links building clusters and plazas through bridges, roads, and sidewalks, forming “stop, view, and guide” points at bridge locations, corridor turns, and building forecourts. The recommendations are to enhance bridge recognition and accessibility, unify paving and railing systems, improve signage and barrier-free connections, and regulate stalls, shared bicycles, and temporary parking. The interface aesthetic enhancement zone lies between building forecourts and green transition areas, with coordinated compositions of “sculpture–building–greenery” as the core, ensuring openness and clear sightlines. Suggested improvements include integrating micro-renovation of facades, greenery, and paving, removing foreground obstructions and illegal parking, keeping edges tidy, and using even, glare-controlled lighting. The gateway and landmark display zone centers on campus entrances, landmark forecourts, and distinctive sculptures. It keeps safe space in front for photos and gathering, framed on both sides by plants and decorative hedges, while buildings and roads in the background organize circulation and order. Recommendations are strengthening ceremonial sightlines, providing designated photo stops and separate pedestrian and vehicle flows, improving barrier-free access and layered signage, and refining nighttime lighting and event-related traffic control. The open activity and hardscape plaza zone is based on open forecourts and sports or gathering spaces dominated by grounds. Buildings and roads define precise geometry and entrance rhythms, supporting quick transitions between daily use and events. Recommended strategies include using durable, non-slip, and well-drained paving, reserving points for power, internet, and shading structures, providing movable seating and temporary performance interfaces, and softening boundaries with plants and tree rows while establishing a “quick in, quick out” recovery mechanism after events.
In summary, the optimization of campus open spaces should follow the principles of “enhancing nature, guiding structure, adapting to perception, and coordinating management.” Along commuting routes, the continuity of green–blue spaces should be strengthened, while bridges and corridors should be used to build cultural guidance sequences. Layered interventions should be applied for different groups—for example, softening hard edges along student pathways and simplifying facility layouts at visitor nodes. Ultimately, this forms an integrated path of “quantifying ecological base—responding to group perceptions—targeted spatial governance,” providing a data-driven model for open space optimization in similar universities.
This study still has several limitations. First, its generalizability is limited. The research is based on a single campus sample, which makes it challenging to represent different climates and built environments. Second, relying on static street view images has significant limitations in terms of the time dimension. This “snapshot” approach fails to capture seasonal changes in the campus scenery, daily time variations, and the dynamic perception patterns of students and visitors. Third, the image recognition method has semantic biases, as the general segmentation model can easily confuse or miss similar categories such as plant, grass, and tree and small-scale facilities. Fourth, the measurement and modeling assumptions are relatively strong. The perception data are cross-sectional self-reports, and the RF/GBDT/AdaBoost + SHAP + CTGAN approach mainly reveals correlations and thresholds, without explicitly controlling for spatial autocorrelation or causal direction. Fifth, the functional zoning is simplified. The zoning is primarily based on the top SHAP features and the “semantic–group” logic, which does not fully capture the coordination of multiple elements or the uncertainty of boundaries.
Future research improvements: First, future research should conduct multi-campus comparative studies across diverse geographical locations and institutional settings to enhance the generalizability of findings. Second, future research should integrate multi-temporal street view collection, behavioral trajectory tracking, and environmental sensor monitoring to develop a dynamic perception assessment framework that captures how temporal changes influence spatial perception. Third, improve recognition accuracy through detailed scene labeling and model fine-tuning, refine the semantic ontology, and introduce uncertainty quantification. Fourth, the methodological framework can be strengthened by incorporating spatial econometrics, causal/non-linear models, robustness, and sensitivity analyses. Fifth, empirical validation is carried out by combining field observations and intervention assessments to test the effectiveness and transferability of zoning and thresholds, and external cross-validation is conducted.

Author Contributions

Conceptualization, X.Z.; Methodology, X.Z., Y.C. and Z.T.; Software, Z.D. and C.G.; Writing—original draft preparation, X.Z.; Writing—review and editing, Y.C. and Z.D.; Supervision, Visualization, Z.D. and C.G.; Funding acquisition, Z.T. and Z.D. All authors have read and agreed to the published version of the manuscript.

Funding

This research work was supported by the National Natural Science Foundation of China under Grant No. 72341030, and the Special Funding Project of the China Agricultural and Forestry University Design Art Alliance under Grant No. 111900050.

Institutional Review Board Statement

The study was conducted according to the guidelines of the Declaration of Helsinki, and approved by the Ethics Committee of Fujian Agriculture and Forestry University (protocol code FAFUIRB-2025-04023 on 2 April 2025).

Informed Consent Statement

Informed consent was obtained from all participants involved in the study.

Data Availability Statement

The raw data supporting the conclusions of this article will be made available by the authors on request.

Conflicts of Interest

The authors declare no conflicts of interest.

References

  1. Hajrasouliha, A. Campus score: Measuring university campus qualities. Landsc. Urban Plan. 2017, 158, 166–176. [Google Scholar] [CrossRef]
  2. Söderström, O.; Paasche, T.; Klauser, F. Smart cities as corporate storytelling. In The Routledge Companion to Smart Cities; Willis, K.S., Aurigi, A., Eds.; Routledge: London, UK, 2020; pp. 283–300. [Google Scholar]
  3. Van den Berg, A.E.; Jorgensen, A.; Wilson, E.R. Evaluating restoration in urban green spaces: Does setting type make a difference? Landsc. Urban Plan. 2014, 127, 173–181. [Google Scholar] [CrossRef]
  4. Turk, Y.A.; Sen, B.; Ozyavuz, A. Students exploration on campus legibility. Procedia Soc. Behav. Sci. 2015, 197, 339–347. [Google Scholar] [CrossRef]
  5. Madanipour, A. Public and Private Spaces of the City; Routledge: London, UK, 2003. [Google Scholar]
  6. Peschardt, K.K.; Stigsdotter, U.K. Associations between park characteristics and perceived restorativeness of small public urban green spaces. Landsc. Urban Plan. 2013, 112, 26–39. [Google Scholar] [CrossRef]
  7. Chapman, M.P. American Places. In Search of the Twenty-First Century Campus; Greenwood Publishing Group: Westport, CT, USA, 2006. [Google Scholar]
  8. Ujang, N.; Zakariya, K. The notion of place, place meaning and identity in urban regeneration. Procedia Soc. Behav. Sci. 2015, 170, 709–717. [Google Scholar] [CrossRef]
  9. Toth, E. Teaching contested university histories through campus tours. Transformations 2017, 27, 104–112. [Google Scholar]
  10. Alnusairat, S.; Ayyad, Y.; Al-Shatnawi, Z. Towards meaningful university space: Perceptions of the quality of open spaces for students. Buildings 2021, 11, 556. [Google Scholar] [CrossRef]
  11. Abid, N.; Haque, M. Exploring and assessing user perception and preferences for open spaces in a university campus: A case study of IIT Roorkee, India. New Des. Ideas 2024, 8, 412–432. [Google Scholar] [CrossRef]
  12. El-Darwish, I.I. Enhancing outdoor campus design by utilizing space syntax theory for social interaction locations. Ain Shams Eng. J. 2022, 13, 101524. [Google Scholar] [CrossRef]
  13. Tao, Y.; Zhao, F.; Xue, M.; Jiang, B.; Lau, S.S.; Zhang, L. Factors influencing seating preferences in semi-outdoor learning spaces at tropical universities. Buildings 2023, 13, 982. [Google Scholar] [CrossRef]
  14. Xu, Z.; Zhong, Y.; Han, L.; Shang, Z.; Xu, F. Catalyzing college students’ well-being and creativity with campus outdoor spaces: A field study in China. Think. Skills Creat. 2025, 56, 101744. [Google Scholar] [CrossRef]
  15. Tudorie, C.A.M.; Vallés-Planells, M.; Gielen, E.; Arroyo, R.; Galiana, F. Towards a greener university: Perceptions of landscape services in campus open space. Sustainability 2020, 12, 6047. [Google Scholar] [CrossRef]
  16. Tourinho, A.C.C.; Barbosa, S.A.; Göçer, Ö.; Alberto, K.C. Post-occupancy evaluation of outdoor spaces on the Federal University of Juiz de Fora, Brazil campus. Archnet-IJAR Int. J. Archit. Res. 2021, 15, 617–633. [Google Scholar] [CrossRef]
  17. Connell, J. A study of tourism on university campus sites. Tour. Manag. 1996, 17, 541–544. [Google Scholar] [CrossRef]
  18. Cheng, D.; Gao, C.; Shao, T.; Iqbal, J. A landscape study of Sichuan University (Wangjiang Campus) from the perspective of campus tourism. Land 2020, 9, 499. [Google Scholar] [CrossRef]
  19. McManus, P.; Connell, J.; Ding, X. Chinese tourists at the University of Sydney: Constraints to co-creating campus tourism? Curr. Issues Tour. 2021, 24, 3508–3518. [Google Scholar] [CrossRef]
  20. Almeida, I.; Silveira, L. Who is visiting universities? General considerations on the demand characteristics of campus-based tourism. J. Tour. Herit. Res. 2022, 5, 179–198. [Google Scholar]
  21. Agheyisi, J.E.; Ebinum, G.O. Students’ perception and use of open spaces in a university campus. IFE Res. Publ. Geogr. 2019, 17, 1–13. [Google Scholar]
  22. Stedman, R.C. Is It Really Just a Social Construction? The Contribution of the Physical Environment to Sense of Place. Soc. Nat. Resour. 2003, 16, 671–685. [Google Scholar] [CrossRef]
  23. Lewicka, M. Place attachment: How far have we come in the last 40 years? J. Environ. Psychol. 2011, 31, 207–230. [Google Scholar] [CrossRef]
  24. Scannell, L.; Gifford, R. Defining place attachment: A tripartite organizing framework. J. Environ. Psychol. 2010, 30, 1–10. [Google Scholar] [CrossRef]
  25. Williams, D.R.; Vaske, J.J. The measurement of place attachment: Validity and generalizability of a psychometric approach. For. Sci. 2003, 49, 830–840. [Google Scholar] [CrossRef]
  26. Wang, S.; Han, C. The influence of learning styles on perception and preference of learning spaces in the university campus. Buildings 2021, 11, 572. [Google Scholar] [CrossRef]
  27. Zhang, J.; Li, Y. The impact of campus outdoor space features on students’ emotions based on the emotion map. Int. J. Environ. Res. Public Health 2023, 20, 4277. [Google Scholar] [CrossRef]
  28. Xu, Y.; Wang, T.; Wang, J.; Tian, H.; Zhang, R.; Chen, Y.; Chen, H. Campus landscape types and pro-social behavioral mediators in the psychological recovery of college students. Front. Psychol. 2024, 15, 1341990. [Google Scholar] [CrossRef]
  29. Poria, Y.; Reichel, A.; Biran, A. Heritage site management: Motivations and expectations. Ann. Tour. Res. 2006, 33, 162–178. [Google Scholar] [CrossRef]
  30. Nasar, J.L. Urban design aesthetics: The evaluative qualities of building exteriors. Environ. Behav. 1994, 26, 377–401. [Google Scholar] [CrossRef]
  31. Poria, Y. Clarifying Heritage Tourism: Distinguishing Heritage Tourists from Tourists in Heritage Places. Ph.D. Thesis, University of Surrey, Guildford, UK, 2001. [Google Scholar]
  32. Daniel, T.C. Whither scenic beauty? Visual landscape quality assessment in the 21st century. Landsc. Urban Plan. 2001, 54, 267–281. [Google Scholar] [CrossRef]
  33. Meneghetti, C.; Muffato, V.; Toffalini, E.; Altoè, G. The contribution of visuo-spatial factors in representing a familiar environment: The case of undergraduate students at a university campus. J. Environ. Psychol. 2017, 54, 160–168. [Google Scholar] [CrossRef]
  34. Peng, J.; Strijker, D.; Wu, Q. Place identity: How far have we come in exploring its meanings? Front. Psychol. 2020, 11, 294. [Google Scholar] [CrossRef] [PubMed]
  35. Lewicka, M. Place attachment, place identity, and place memory: Restoring the forgotten city past. J. Environ. Psychol. 2008, 28, 209–231. [Google Scholar] [CrossRef]
  36. Limei, N.; Dongfan, W.; Bo, Z. Landscape image recognition and analysis based on a deep learning algorithm. J. Intell. Fuzzy Syst. 2024, JIFS-239654. [Google Scholar] [CrossRef]
  37. Malik, K.; Robertson, C. Landscape similarity analysis using texture encoded deep-learning features on unclassified remote sensing imagery. Remote Sens. 2021, 13, 492. [Google Scholar] [CrossRef]
  38. Kabisch, N.; Qureshi, S.; Haase, D. Human–environment interactions in urban green spaces—A systematic review of contemporary issues and prospects for future research. Environ. Impact Assess. Rev. 2015, 50, 25–34. [Google Scholar] [CrossRef]
  39. Li, X.; Zhang, C.; Li, W.; Ricard, R.; Meng, Q.; Zhang, W. Assessing street-level urban greenery using Google Street View and a modified green view index. Urban For. Urban Green. 2015, 14, 675–685. [Google Scholar] [CrossRef]
  40. Zhu, X.X.; Tuia, D.; Mou, L.; Xia, G.S.; Zhang, L.; Xu, F.; Fraundorfer, F. Deep learning in remote sensing: A comprehensive review and list of resources. IEEE Geosci. Remote Sens. Mag. 2017, 5, 8–36. [Google Scholar] [CrossRef]
  41. Helbich, M.; Yao, Y.; Liu, Y.; Zhang, J.; Liu, P.; Wang, R. Using deep learning to examine street view green and blue spaces and their associations with geriatric depression in Beijing, China. Environ. Int. 2019, 126, 107–117. [Google Scholar] [CrossRef] [PubMed]
  42. He, H.; Zhang, T.; Zhang, Q.; Rong, S.; Jia, Y.; Dong, F. Exploring the impact of campus landscape visual elements combination on short-term stress relief among college students: A case from China. Buildings 2024, 14, 1340. [Google Scholar] [CrossRef]
  43. Gao, W.; Tang, B.M.; Liu, B. Effects of landscape characteristic perception of campus on college students’ mental restoration. Behav. Sci. 2025, 15, 470. [Google Scholar] [CrossRef] [PubMed]
  44. Qin, Y.; Wu, X.; Yu, T.; Jiang, S. Enhancing student-centered walking environments on university campuses through street view imagery and machine learning. PLoS ONE 2025, 20, e0321028. [Google Scholar] [CrossRef]
  45. Chen, S.; Chen, Z.; Hong, J.; Zhuang, X.; Su, C.; Ding, Z. Exploring the relationship between audio-visual perception in Fuzhou universities and college students’ attention restoration quality using machine learning. Front. Psychol. 2025, 16, 1572426. [Google Scholar] [CrossRef]
  46. Ribeiro, M.T.; Singh, S.; Guestrin, C. “Why should I trust you?”: Explaining the predictions of any classifier. In Proceedings of the 22nd ACM SIGKDD International Conference on Knowledge Discovery and Data Mining (KDD ’16), San Francisco, CA, USA, 13–17 August 2016; ACM: New York, NY, USA, 2016; pp. 1135–1144. [Google Scholar]
  47. Gebru, T.; Krause, J.; Wang, Y.; Chen, D.; Deng, J.; Aiden, E.L.; Fei-Fei, L. Using deep learning and Google Street View to estimate the demographic makeup of neighborhoods across the United States. Proc. Natl. Acad. Sci. USA 2017, 114, 13108–13113. [Google Scholar] [CrossRef]
  48. Lundberg, S.M.; Lee, S.-I. A unified approach to interpreting model predictions. In Advances in Neural Information Processing Systems; Curran Associates, Inc.: Red Hook, NY, USA, 2017; Volume 30, pp. 4765–4774. [Google Scholar]
  49. Xiao, Z.; Zhang, C.; Li, Y.; Chen, Y. Community park visits determined by the interactions between built environment attributes: An explainable machine learning method. Appl. Geogr. 2024, 172, 103423. [Google Scholar] [CrossRef]
  50. Chen, Z.; Yang, H.; Ye, P.; Zhuang, X.; Zhang, R.; Xie, Y.; Ding, Z. How does the perception of informal green spaces in urban villages influence residents’ complaint sentiments? A machine learning analysis of Fuzhou City, China. Ecol. Indic. 2024, 166, 112376. [Google Scholar] [CrossRef]
  51. Yang, W.; Fei, J.; Li, Y.; Chen, H.; Liu, Y. Unraveling nonlinear and interaction effects of multilevel built environment features on outdoor jogging with explainable machine learning. Cities 2024, 147, 104813. [Google Scholar] [CrossRef]
  52. Wagner, F.; Milojevic-Dupont, N.; Franken, L.; Zekar, A.; Thies, B.; Koch, N.; Creutzig, F. Using explainable machine learning to understand how urban form shapes sustainable mobility. Transp. Res. Part D Transp. Environ. 2022, 111, 103442. [Google Scholar] [CrossRef]
  53. Ruan, Y.; Zhang, X.; Wang, S.; Chen, X.; Chen, Q. Street view-enabled explainable machine learning for spatial optimization of non-motorized transportation-oriented urban design. Land 2025, 14, 1347. [Google Scholar] [CrossRef]
  54. Eshraghi, P.; Dehnavi, A.N.; Mirdamadi, M.; Talami, R.; Zomorodian, Z.S. An AI-driven framework for rapid and localized optimizations of urban open spaces. arXiv 2025, arXiv:2501.08019. [Google Scholar] [CrossRef]
  55. Rafiei, S.; Gifford, R. The meaning of the built environment: A comprehensive model based on users traversing their university campus. J. Environ. Psychol. 2023, 87, 101975. [Google Scholar] [CrossRef]
  56. Higuera-Trujillo, J.L.; Llinares, C.; Macagno, E. The cognitive-emotional design and study of architectural space: A scoping review of neuroarchitecture and its precursor approaches. Sensors 2021, 21, 2193. [Google Scholar] [CrossRef]
  57. Kaplan, R.; Kaplan, S. The Experience of Nature: A Psychological Perspective; Cambridge University Press: Cambridge, UK, 1989. [Google Scholar]
  58. Kaplan, S. The restorative benefits of nature: Toward an integrative framework. J. Environ. Psychol. 1995, 15, 169–182. [Google Scholar] [CrossRef]
  59. Ulrich, R.S. View through a window may influence recovery from surgery. Science 1984, 224, 420–421. [Google Scholar] [CrossRef]
  60. Hartig, T.; Korpela, K.; Evans, G.W.; Gärling, T. A measure of restorative quality in environments. Scand. Hous. Plan. Res. 1997, 14, 175–194. [Google Scholar] [CrossRef]
  61. Twohig-Bennett, C.; Jones, A. The health benefits of the great outdoors: A systematic review and meta-analysis of greenspace exposure and health outcomes. Environ. Res. 2018, 166, 628–637. [Google Scholar] [CrossRef]
  62. Felsten, G. Where to take a study break on the college campus: An attention restoration theory perspective. J. Environ. Psychol. 2009, 29, 160–167. [Google Scholar] [CrossRef]
  63. Kyle, G.; Graefe, A.; Manning, R.; Bacon, J. Effects of place attachment on users’ perceptions of social and environmental conditions in a natural setting. J. Environ. Psychol. 2004, 24, 213–225. [Google Scholar] [CrossRef]
  64. Bratman, G.N.; Hamilton, J.P.; Hahn, K.S.; Daily, G.C.; Gross, J.J. Nature experience reduces rumination and subgenual prefrontal cortex activation. Proc. Natl. Acad. Sci. USA 2015, 112, 8567–8572. [Google Scholar] [CrossRef] [PubMed]
  65. Ashworth, G.J.; Tunbridge, J.E. A Geography of Heritage: Power, Culture, and Economy; Arnold: London, UK, 2000. [Google Scholar]
  66. Poria, Y.; Butler, R.; Airey, D. The core of heritage tourism. Ann. Tour. Res. 2003, 30, 238–254. [Google Scholar] [CrossRef]
  67. Stamps, A.E., III. Mystery, complexity, legibility and coherence: A meta-analysis. J. Environ. Psychol. 2004, 24, 1–16. [Google Scholar] [CrossRef]
  68. Malewczyk, M.; Taraszkiewicz, A.; Czyż, P. Preferences of the facade composition in the context of its regularity and irregularity. Buildings 2022, 12, 169. [Google Scholar] [CrossRef]
  69. Nasar, J.L. The evaluative image of the city. J. Am. Plan. Assoc. 1990, 56, 41–53. [Google Scholar] [CrossRef]
  70. Hipp, J.A.; Gulwadi, G.B.; Alves, S.; Sequeira, S. The relationship between perceived greenness and perceived restorativeness of university campuses and student-reported quality of life. Environ. Behav. 2016, 48, 1292–1308. [Google Scholar] [CrossRef]
  71. Baloglu, S.; McCleary, K.W. A model of destination image formation. Ann. Tour. Res. 1999, 26, 868–897. [Google Scholar] [CrossRef]
  72. Cheng, B.; Misra, I.; Schwing, A.G.; Kirillov, A.; Girdhar, R. Masked-attention mask transformer for universal image segmentation. In Proceedings of the IEEE/CVF Conference on Computer Vision and Pattern Recognition (CVPR), New Orleans, LA, USA, 19–24 June 2022; pp. 1290–1299. [Google Scholar]
  73. Xu, L.; Skoularidou, M.; Cuesta-Infante, A.; Veeramachaneni, K. Modeling tabular data using conditional GAN. In Advances in Neural Information Processing Systems 32 (NeurIPS 2019); Curran Associates, Inc.: Red Hook, NY, USA, 2019; pp. 7333–7343. [Google Scholar]
  74. Engelmann, J.; Lessmann, S. Conditional Wasserstein GAN-based oversampling of tabular data for imbalanced learning. Expert Syst. Appl. 2021, 174, 114582. [Google Scholar] [CrossRef]
  75. Zhao, Z.; Kunar, A.; Birke, R.; Chen, L.Y. CTAB-GAN: Effective table data synthesizing. In Proceedings of the 13th Asian Conference on Machine Learning (ACML 2021), Virtual, 17–19 November 2021; PMLR: Lawrence, KS, USA, 2021; Volume 157, pp. 97–112. Available online: https://proceedings.mlr.press/v157/zhao21a (accessed on 3 October 2025).
  76. Breiman, L. Random forests. Mach. Learn. 2001, 45, 5–32. [Google Scholar] [CrossRef]
  77. Friedman, J.H. Greedy function approximation: A gradient boosting machine. Ann. Stat. 2001, 29, 1189–1232. [Google Scholar] [CrossRef]
  78. Freund, Y.; Schapire, R.E. A decision-theoretic generalization of on-line learning and an application to boosting. J. Comput. Syst. Sci. 1997, 55, 119–139. [Google Scholar] [CrossRef]
  79. Aydin, D.; Ter, U. Outdoor space quality: Case study of a university campus plaza. Archnet-IJAR Int. J. Archit. Res. 2008, 2, 189–203. [Google Scholar]
  80. Liu, W.; Sun, N.; Guo, J.; Zheng, Z. Campus green spaces, academic achievement and mental health of college students. Int. J. Environ. Res. Public Health 2022, 19, 8618. [Google Scholar] [CrossRef] [PubMed]
  81. Działek, J.; Homiński, B.; Miśkowiec, M.; Świgost-Kapocsi, A.; Gwosdz, K. The assessment of the quality of campus public spaces as key parts of the learning landscape: Experience from a crowdsensing study on the Third Campus of Jagiellonian University, Krakow, Poland. Urban Des. Int. 2024, 29, 77–92. [Google Scholar] [CrossRef]
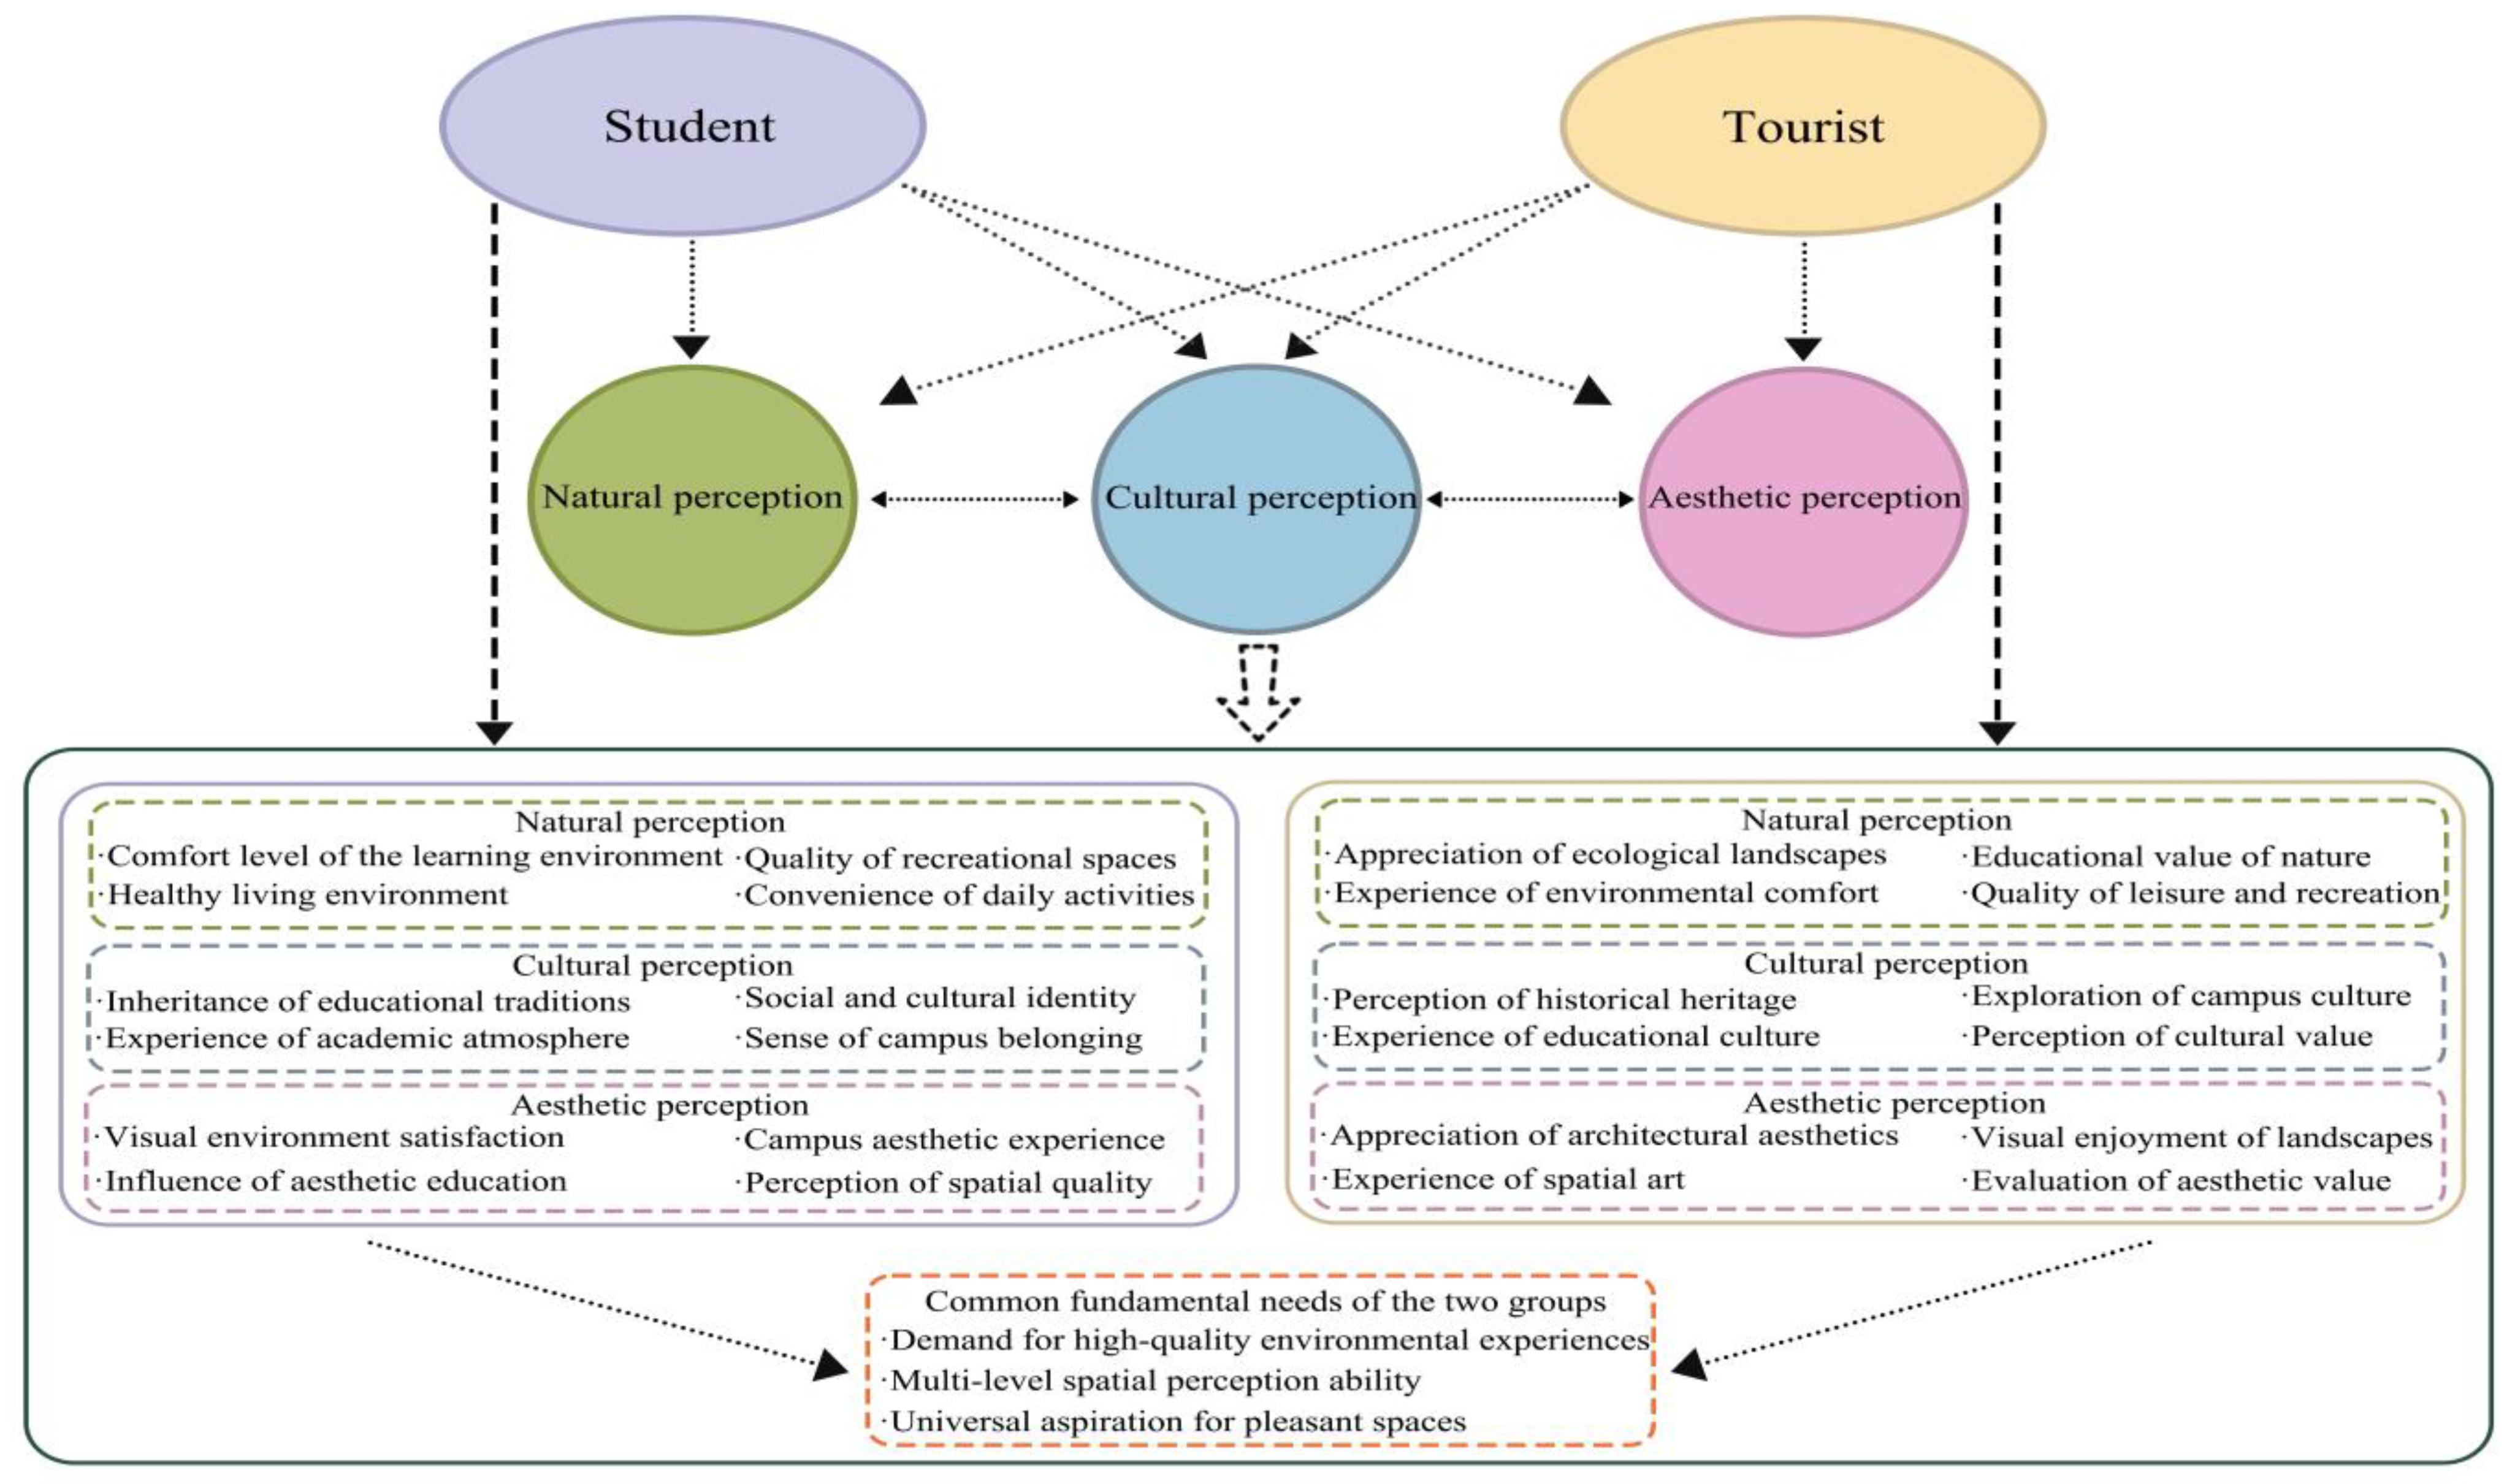
Figure 1. Relationships among the three indicators and between different groups in this study.
Buildings 15 03622 g001
Figure 2. The theoretical framework of the three indicators [25,57,58,59].
Buildings 15 03622 g002
Figure 3. Technical framework diagram.
Buildings 15 03622 g003
Figure 4. Geographical location of the study area.
Buildings 15 03622 g004
Figure 5. Mask2Former model workflow. Note: This figure is adapted from reference [72].
Buildings 15 03622 g005
Figure 6. The process of collecting street view images and semantic segmentation.
Buildings 15 03622 g006
Figure 7. Spatial distribution and selection results of semantic features significantly affect the study area’s perception indicators across all samples.
Buildings 15 03622 g007
Figure 8. SHAP analysis results of important semantic features influencing natural perception of students and visitors.
Buildings 15 03622 g008
Figure 9. Influence patterns of the top eight important semantic features affecting students’ natural perception.
Buildings 15 03622 g009
Figure 10. The top eight key semantic features influencing visitors’ natural perception and their threshold effects.
Buildings 15 03622 g010
Figure 11. SHAP analysis results of important semantic features influencing the cultural perception of students and visitors.
Buildings 15 03622 g011
Figure 12. Influence patterns of the top eight important semantic features affecting students’ cultural perception.
Buildings 15 03622 g012
Figure 13. The top eight important semantic features influencing visitors’ cultural perception and their threshold effects.
Buildings 15 03622 g013
Figure 14. SHAP analysis results of important semantic features influencing the aesthetic perception of students and visitors.
Buildings 15 03622 g014
Figure 15. The top eight semantic features influence students’ aesthetic perception and threshold effects.
Buildings 15 03622 g015
Figure 16. The top eight semantic features influence visitors’ aesthetic perception and threshold effects.
Buildings 15 03622 g016
Figure 17. Spatial distribution of key semantic features influencing students and visitors, with corresponding real-world street views.
Buildings 15 03622 g017
Table 1. Questionnaire for street-view image perception evaluation.
SectionScales UsedItem CodeQuestionScale
Background Information Q1What is your identity?Student/Visitor
Q2What is your gender?Male/Female/Other
Q3What is your age?≤18/19–25/26–35/36–45/≥46
Q4Have you ever visited Fuzhou University’s Qishan Campus?Never/Once/2–3 times/Frequently
Q5What is your current residence?Fuzhou/Other cities in Fujian/Other provinces/Abroad
Natural PerceptionPRS-11N1Viewing this scene makes me feel relaxed, both physically and mentally.1 (Strongly Disagree)–7 (Strongly Agree)
N2This environment seems helpful for relieving stress.1 (Strongly Disagree)–7 (Strongly Agree)
N3The landscape in the image appears to help me restore my attention and energy.1 (Strongly Disagree)–7 (Strongly Agree)
N4This scene conveys a sense of natural comfort.1 (Strongly Disagree)–7 (Strongly Agree)
Cultural perceptionPlace Attachment
Scale
C1This scene helps me feel the campus’s unique cultural atmosphere.1 (Strongly Disagree)–7 (Strongly Agree)
C2I think this environment represents the school’s history and cultural features well.1 (Strongly Disagree)–7 (Strongly Agree)
C3When I look at this image, I feel an emotional connection to the campus.1 (Strongly Disagree)–7 (Strongly Agree)
C4This scene seems to help visitors feel more connected to the school.1 (Strongly Disagree)–7 (Strongly Agree)
Aesthetic PerceptionEnvironmental Preference
Scale
A1I think this scene is visually appealing.1 (Strongly Disagree)–7 (Strongly Agree)
A2The environmental elements in the image work well together and look harmonious.1 (Strongly Disagree)–7 (Strongly Agree)
A3This landscape has some complexity that makes me want to explore it further.1 (Strongly Disagree)–7 (Strongly Agree)
A4This scene looks neat, clear, and easy to understand.1 (Strongly Disagree)–7 (Strongly Agree)
Table 2. Complete image semantic segmentation features name.
TreeRoadEarthSkyGrassCarPlantPolePalmPath
BuildingSignboardRockDirt TrackBridgeWaterColumnBicycleWallPerson
MinibikeVanMountainSidewalkFenceStreetlightRailingStairsAshcanCanopy
BenchTruckTableAwningBusBoothHouseBaseTowerBox
ChairBagStairwayBanisterPotFlagSculpturePosterClockGrandstand
FountainFieldHillVaseLightTraffic LightTankSandBookTrade Name
FlowerStepFloorMirrorDoorAirplaneBoatRiverBallSeat
BlanketTentSeaLandBasketBulletin BoardEscalatorCurtainFoodSconce
HovelPlaythingCeilingApparelTrayBottle
Table 3. The performance of decision tree algorithms was trained on complete student samples on the validation set.
Student Full-Sample Perceived Naturalness IndexStudent Full-Sample Cultural Perception IndexStudent Full-Sample Aesthetic Perception Index
RFGBDTAdaBoostCTGAN-GBDT RFGB
DT
AdaBoostCTGAN-AdaBoost RFGB
DT
AdaBoostCTGAN-RF
MSE0.930.930.910.75MSE0.980.990.970.62MSE1.291.321.310.95
MAE0.780.770.770.63MAE0.810.820.810.50MAE0.920.940.930.72
MAPE25.4125.03625.2922.87MAPE32.0432.0232.0120.40MAPE31.6631.9532.0128.03
Table 4. Performance of decision tree algorithms trained on complete visitor samples on the validation set.
Tourist Full-Sample Perceived Naturalness IndexTourist Full-Sample Cultural Perception IndexTourist Full-Sample Aesthetic Perception Index
RFGBDTAdaBoostCTGAN-GBDT RFGB
DT
AdaBoostCTGAN-AdaBoost RFGB
DT
AdaBoostCTGAN-RF
MSE2.002.001.991.65MSE0.920.930.920.60MSE1.321.301.290.87
MAE1.181.191.171.06MAE0.820.820.810.58MAE0.970.950.950.69
MAPE45.1345.3845.4040.15MAPE31.3031.3930.7223.23MAPE31.8431.1931.2623.14
Table 5. Empirical results of multivariable regression.
GrassSculpturePoleBoxBuildingFenceBookAwning R 2 F
Natural perception
(Students)
0.03 ***
(0.00)
0.12
(0.58)
−0.09
(0.23)
−0.24 ***
(0.01)
−0.02 ***
(0.00)
−0.06 ***
(0.00)
−183.67
(0.34)
−0.04 ***
(0.00)
0.1432.07
PlantStepChairSkySandBoxPathGrass R 2 F
Natural perception
(Vistors)
0.02 ***
(0.00)
2.20 *
(0.08)
−1.81 *
(0.08)
0.03 ***
(0.00)
6.53 **
(0.05)
−0.33 ***
(0.01)
0.03 **
(0.05)
0.03 ***
(0.00)
0.0816.98
BridgeBuildingTrade NamePotDirt TrackHouseFountainAshcan R 2 F
Cultural perception (Students)0.04 ***
(0.01)
0.004 **
(0.03)
−0.12
(0.33)
1.01 **
(0.04)
−0.21
(0.29)
−0.13 ***
(0.01)
0.07
(0.40)
−0.26 ***
(0.01)
0.013.44
StairwayGrassRoadTentTreeEarthPoleBox R 2 F
Cultural perception (Vistors)0.46 ***
(0.00)
0.01 ***
(0.00)
0.008 ***
(0.01)
−0.01
(0.87)
−0.01 ***
(0.00)
−0.009 **
(0.05)
−0.13 **
(0.05)
−0.16 **
(0.05)
0.0613.12
SculptureVaseGrassFenceBoxVanSandTank R 2 F
Aestheticperception (Students)−0.08
(0.72)
−86.25
(0.20)
0.009 ***
(0.01)
−0.02 **
(0.05)
−0.28 ***
(0.000)
−0.09 ***
(0.00)
−0.18
(0.95)
−0.38 **
(0.04)
0.013.66
GrandstandPlantPoleEarthFieldTentGrassHill R 2 F
Aestheticperception (Vistors)0.02 ***
(0.003)
−0.0042
(0.43)
−0.11
(0.20)
−0.04 ***
(0.00)
0.08
(0.60)
−0.12 ***
(0.00)
0.01 ***
(0.00)
−0.12 ***
(0.00)
0.0612.52
Note: ***, **, and * denote statistical significance at the 1%, 5%, and 10% levels, respectively.
Disclaimer/Publisher’s Note: The statements, opinions and data contained in all publications are solely those of the individual author(s) and contributor(s) and not of MDPI and/or the editor(s). MDPI and/or the editor(s) disclaim responsibility for any injury to people or property resulting from any ideas, methods, instructions or products referred to in the content.