Article

Building an Analytical Human-Centered Conceptual Framework Model for Integrating Smart Technology to Retrofit Traditional Cities into Smart Cities

by
Alhan F. Ibrahim
* and
Husein A. Husein
*
Department of Architectural Engineering, College of Engineering, Salahaddin University, Erbil 44001, Iraq
*
Authors to whom correspondence should be addressed.
Buildings 2025, 15(19), 3597; https://doi.org/10.3390/buildings15193597
Submission received: 13 August 2025 / Revised: 23 September 2025 / Accepted: 26 September 2025 / Published: 7 October 2025
(This article belongs to the Section Architectural Design, Urban Science, and Real Estate)

Abstract

The retrofitting of traditional cities into smart cities is crucial for addressing rapid urban development by integrating smart technology while respecting the human dimension to fulfill human needs. The primary objective of this paper is to establish practical guidelines and develop a strategic, human-centered, comprehensive, and conceptual framework model that integrates smart technology through a set of smart city performance indicators. This framework aims to inform human-centered technological strategies for adapting Erbil City, retrofitting the old city into a smart one. Therefore, the paper aims to develop a roadmap scenario and build a conceptual framework model for retrofitting the traditional city of Erbil into a smart city. It outlines the methods that can be used, taking into account contemporary technology and citizens’ needs. In this context, the traditional city of Erbil in the Kurdistan Region of Iraq has been selected as a case study, represented explicitly by the Buffer Zone area. The research employed a combination of qualitative and quantitative methods, including a literature review, questionnaires, space syntax analysis, and statistical analysis. The results and conclusions demonstrate that the human-centered approach plays a significant role in achieving smart cities. In collaboration with smart technology strategies, old and traditional cities can be retrofitted to become smart cities.

1. Introduction

In the twenty-first century, smart cities have emerged as a rapidly developing concept revolutionizing urban development. To enhance the standard of living for their residents, boost the effectiveness of infrastructure and services, and promote sustainable economic growth, smart cities utilize cutting-edge technologies and data analytics [1]. The rapid economic development in cities has increased the challenges that cities face. According to the United Nations census, in 2008, more than 50% of the world’s population, 3.3 billion people, lived in cities. This number is predicted to rise to 5 billion by 2030 and is expected to reach 70% of the population by 2050 [2,3]. This shift is occurring due to population growth and migration, which are motivated by the search for better opportunities and a higher standard of living [4].
Over the past few decades, traditional urban cities have experienced rapid growth, which has had a significant impact on countries’ economic development. Regarding this rapid development, the traditional city of Erbil faces numerous challenges in satisfying the needs and improving the quality of life of its inhabitants. This is due to the increasing population rate, congestion, and a set of regulations established by the Kurdistan Region Governorate (KRG) regarding the city’s heritage condition, which UNESCO has emphasized on the World Heritage List, limiting reconstruction procedures. Currently, the strategies in Erbil City are insufficient to meet the requirements of a high-quality life and achieve the goals of a human-centered smart city. Therefore, the research problem can be formulated as follows: Erbil City lacks a sufficient strategic human-centered conceptual framework that is integrated with smart technology. Thus, a comprehensive human-centered conceptual framework is required that visualizes the integration of smart technology, considering strategic actions to achieve a “Humane Smart City” that enhances the quality of life of the city’s residents. The human dimension must be addressed as the foundation and basis on which a beneficial urban future might be visualized. New technologies will not be able to tackle all, or even most, of the difficulties that a modern metropolis faces.
Therefore, this paper proposes a roadmap methodology for enhancing the retrofitting of Erbil City into a “smart city” through the implementation of “Information and Communication Technologies (ICTs).” This involves analyzing the city’s current condition and formulating a strategic roadmap that integrates technological components to enhance the quality of life of the city’s inhabitants.
  • The research questions have been formulated as follows:
    -
    What challenges does smart technology face in the application of humane smart cities in Erbil City, Kurdistan Region, Iraq?
    -
    How can smart technology be integrated to achieve a human-centered smart Erbil City?
  • The research aims and objectives are as follows:
    -
    Study and analyze smart technology strategies to meet human needs and improve the quality of life in Erbil City.
    -
    Specify some smart guidelines and develop a strategic, human-centered, comprehensive, and conceptual framework model integrated with smart technology using a set of smart city performance indicators as human-centered technological strategies to be applied in Erbil City to retrofit the old city into a smart one.
    -
    Conceptualize a theoretical framework by establishing a set of smart city performance indicators as human-centered strategies to be implemented in Erbil City.
In this paper, the key dimensions of smartness, represented by smart technology and smart people, were identified through a review of the previous literature and then linked to human needs using a conceptual framework model.
  • Smart technology strategies were studied and analyzed to address human needs in the city and improve the quality of life.
  • Smart guidelines were specified to provide a comprehensive framework that can be adapted to changing conditions in the future and support optimal systems for operation and management in the future.
  • A conceptual framework model was developed through a set of smart city performance indicators as human-centered strategies to be implemented in Erbil City.
The findings show that smart technology strategies and smart people are significantly correlated with the smartness of a city, and traditional cities can be enhanced smartly through the implementation of “Information and Communication Technology (ICT).” Additionally, the results demonstrate that the human-centered approach plays a significant role in achieving smart cities. By collaborating with smart technology strategies, traditional and older cities can be retrofitted to become smart cities, as human-centered smart technology is a crucial component of a city’s retrofitting and future development. The following figure illustrates the research structure (Figure 1).

2. Literature Review

2.1. Smart City Concept and Historical Background

The origin of the smart city concept can be traced back to the 1960s, with the emergence of “cybernetically planned cities.” Then, in urban planning development, it was linked to “networked or wired cities” in the 1980s. In the 1990s, the concept evolved into several terms, including “networked cities, cyber cities, digital cities, wired cities, knowledge cities, virtual cities, intelligent cities, and cyber-physical cities” [5]. Later, the “Smart Growth Movement” emerged in the late 1990s due to migration phenomena in cities, and it gained more mainstream attention around 2010, sparked by the increasing use of technology in urban environments [6].
In combination with sustainability and technology, the term “Smart Sustainable Cities” has emerged, which has been defined by Hara et al., 2016 as an innovative city that integrates technological solutions and “Information and Communication Technology (ICT)” to enhance residents’ quality of life and efficiency of services and tackle issues, such as security, property vacancy, infrastructure protection, and traffic jams and accidents [7]. The following table summarizes multidimensional definitions and explanations of “Smart Cities,” adapted from the literature chronologically (Table 1).

2.2. Smart Technology Dimension: The Information and Communication Technologies (ICTs) and the Internet of Things (IoTs)

The literature has shown the significant impact of “Information and Communication Technologies (ICTs)” in the formation of smart cities. From a “Techno-Centric Approach,” Bull and Azennoud (2016) define “Smart Cities” as utilizing advanced information technologies to integrate the city’s infrastructure and service delivery processes (public safety, energy and electricity distribution, buildings, transit, communication, mobility, and so on) to create smart cities that are livable, sustainable, and efficient [25]. A smart city enhances public information and service accessibility using sensors, kiosks, meters, personal devices, the Web, appliances, cameras, cellphones, implanted medical devices, social networks, and ICTs. To enhance the city’s intelligence, it integrates its physical, social, commercial, and IT infrastructure [12].
Moreover, Kaneti et al. (2025) define the Internet of Things (IoT) as a network of connected devices operating within an urban context to monitor, manage, and control resources, such as energy, water, mobility, and people. The Internet of Things (IoT) is utilized to enhance sustainability levels, smart traffic systems, surveillance, smart health, education, and public services, as well as public safety and security. These two studies show the implications of the “Internet of Things” (IoT), “IoT-oriented” devices, and “Information Communication Technologies” (ICTs) for sustainability levels as well as the use of smart devices to create effective smart health, surveillance, traffic and urban mobility, education, public service systems, waste management, digital transformation, water and air quality, energy, cultural aspects and tourism, and public safety and security. In addition, the emphasis will be on applying an “IoT-oriented solution” in these situations, as well as addressing problems related to citizens, mobility, governance, and the environment. Such solutions include traffic control cameras and sensors, as well as the linking and sharing of information through GIS and GPS, for managing emergencies, centralized control of traffic lights, smart parking sensors, bike flow management, smart public lighting, waste bin filling sensors, people passage sensors, vehicle passage sensors, and environmental sensors [9,26].
The study by Ansari, M.S. et al. (2025) examines the role of the Internet of Things (IoT) in enhancing urban governance and infrastructure, specifically exploring how IoT applications can improve waste disposal, traffic management, public services, and citizen engagement. It highlights the ability of IoT to generate more responsive, efficient, and data-driven smart cities [27]. The study by Bellini et al. (2022) reviews the concepts, frameworks, and technologies for smart cities that utilize the Internet of Things (IoT) to facilitate urban development. It discusses how IoT enhances transportation and smart mobility, public safety, smart living services, smart infrastructure, smart buildings, and energy management to highlight challenges, such as security issues, and how to improve quality of life and sustainability [28].
According to the study by Drepaul (2020), it is shown that IoT technology has the potential to alleviate and address human problems, enhance cities’ infrastructure, improve building practices, lessen the strain caused by population growth and overcrowding, contribute to healthier urban lives, and improve human futures and sustainability. It can also lead to improved designs for housing and transportation. The IoT can improve cities’ efficiency, creating “smarter cities” through technological applications, including lighting, temperature-sensitive sensors, smart parking, audio and video equipment, weather tracking, pollution monitoring, security systems, digital camera systems, and water shortage detection, all of which can be achieved through device integration. Drepaul (2020) defines “IoT” technology as a world in which physical things are connected to information networks, enabling physical objects to participate in business processes actively. It is a physical or virtual item that can interact or integrate with humans and other things through the internet or a communication system [29].
The study by McKenna (2020) explores the dimension of technology, encompassing systems, infrastructure, and services. It identifies several key drivers of “smart cities drivers,” including technology, community, sustainability, policy, innovation, productivity, livability, accessibility, and well-being [30]. While Sánchez-Corcuera et al. (2019) demonstrate that the core of smart cities is the integration of ICTs with basic human needs and services, through the implementation tactics of “smart cities” and the four categories of technology, people, system integration, and technical infrastructure, the study focuses on leveraging ICT, IoT, smart computing technologies (hardware, software, and network), and sensors and actuators to improve city administration, public safety, emergency response, healthcare, education, mobility, and real estate, enhance heritage places, and enhance IT-networked communities through cloud computing, transportation, utilities, and city monitoring [4].
The study by Myeong et al. (2018) examines smart city policies focusing on technological factors that influence smart cities and their implications for urban infrastructure, citizen engagement, and policy ecosystems. According to the study, a “Smart City” is a city built on highly intelligent Information and Communication Technology (ICT) that connects people and city components to improve competitiveness, sustainability, and quality of life. In a smart society, people, mobility, the government, the environment, and the economy are all integrated into a smart infrastructure. It is said that productivity, accessibility, sustainability, livability, well-being, and governance are the outcomes of smart cities [31].
In the study by Hunter et al. (2018), “smart energy” is associated with intelligent technologies, including smart city designs that integrate energy management systems, waste and water management, smart district heating and cooling, smart meters, and other advanced smart power grid technologies. Smart grids, electric mobility, hybrid cars and electric vehicle charging stations, smart parking, smart solid waste systems, energy-efficient and LEED-certified green buildings, smart sanitation systems, LED lighting and smart street lighting systems (solar sensors and light-emitting diodes), intelligent traffic management, energy storage, integrated multi-modal transportation systems, solar photovoltaic and solar thermal energy, wind turbines, thermal and renewable energy storage, smart points and hubs, and micro-grid data centers are just a few of the initiatives that integrate ICT in a digital and sustainable environment. Furthermore, ICT includes platforms for visualizing data, open energy, and open data; controlling, monitoring, and reporting integrated data; smart grids, traffic sensors, air quality sensors, and streetlights (smart lamp posts) that offer public Wi-Fi connectivity; and smartly optimizing waste collection, as well as digital education and proficiency and a plan for municipal digitization [32].
The study by Papa et al. (2013) focuses on networks and smart infrastructure to improve the livability of smart cities, comfort, and efficiency. Smart energy, smart mobility management, and enhancement of the transportation system are also included, along with the use of ICT, IoT, and smart technology to make these improvements, such as smart grids and smart transport networks, communications, electricity, lessening traffic and improving travel safety and efficiency, water management, intelligent energy, smart heating and cooling, solar and renewable resources, wind power and bioenergy, electric vehicles, enhancing transit networks, increasing travel options and multimodal connectivity, providing users with timely, accurate, and connected information about the transit system, enhancing payment options and prices, cutting down on trips and traffic, and fusing technology and transportation to enhance accessibility, affordability, and effectiveness. The study also focuses on smart infrastructures, which utilize ICT-based technologies, such as sensors, for real-time data collection, meters, digital controls, smart software for analytics and visualizations, analytical tools, and dynamic control systems. These technologies can be crucial in addressing efficiency and environmental issues, thereby reducing overall operating costs [33].
The study by Schaffers et al. (2012) examines how smart applications function in urban environments, how to link them to urban development, and how to investigate the process of developing smart apps. The study focuses on how “Information and Communication Technology” might improve citizens’ lives and address issues facing smart cities, in addition to utilizing smart network applications and e-services to face some smart cities’ development challenges, such as employment, public safety and security, inclusion, quality of life, economic decline, energy, infrastructure, healthcare, education, transportation and mobility, environmental management, and internet-based services. The paper explores several applications of spatial intelligence in smart cities, encompassing programming technologies, hardware, software, information, and communication [22].
Another study that discusses ICT is the study by Nam and Pardo (2011), which concentrates on three primary components of smart cities; people (infrastructures of hardware and software), technology (infrastructures of hardware and software), institutions (policy and governance), broadband connectivity, a skilled workforce, innovation, digital inclusion, and marketing are the elements that make up a prosperous smart city. The study defines a “smart city” as a city that emphasizes the use of smart computing technologies and highlights the smart city’s performance in terms of economy, governance, people, transportation, environment, and living, focusing on the integration of intelligent, interconnected, and instrumented technologies. The study mentions that technology includes the digital city, the intelligent city, the ubiquitous city, the wired city, the hybrid city, and the information city. In terms of community, there is the smart community. With regard to people, there is the creative city, the learning city, the human city, and the knowledge city [23]. The following table summarizes terms related to the “Techno-Centric Approach” of “Smart Cities” (Table 2).

2.3. Smart People Dimension

The literature has shown a significant impact of the “Human Dimension” in the formation of smart cities. Smart inhabitants produce and utilize information through effective and sustainable systems to build smart cities [25]. Smart people are also open-minded, possessing the ability to adapt to environmental changes and the ingenuity to contribute to the education of others. They are democratic in their participation and engagement in public life [37].
The systematic review of the literature by Landa-Oregi et al. (2024) examines how human-centered design can facilitate citizens’ engagement in the regeneration of urban spaces. The human-centered design can provide a structured framework for incorporating residents throughout the urban regeneration process. Key findings show that this strategy is based on three pillars: collaboration, empathy, and iteration. The review concluded that human-centered design enhances the effectiveness of urban projects by aligning them with the community’s needs and desires, leading to more successful and sustainable outcomes [38].
The study by Wang et al. (2024) proposes a human-centered framework for measuring street quality, encompassing three dimensions: network accessibility, people’s visual perception, and functional diversity. It applies artificial neural network technologies to analyze spatial design networks, street view images, and points of interest. The study examines public perception, street characteristics, and social activity to evaluate the quality of the streets [39].
The study by Chang, S., and Smith, M. (2023) reviews a set of studies from literature to examine the relationship between residents’ quality of life and smart cities. It discusses smart living, sustainability, smart urban governance, social inclusion, and citizen participation, aiming to create a holistic understanding of how technology impacts people’s lives and how citizens are involved in problem-solving and decision-making to achieve citizen-centric smart cities [40].
The study by Calzada et al. (2021) concentrates on the issue of technology affecting human digital rights, privacy and surveillance issues, and technology’s role in improving citizen engagement, as well as the aspects of public participation, education, public health, data governance, and digital inclusion, aspects that are at the core of inclusive urban and digital affairs of smart cities. The digital rights are expression, openness, access, privacy, and innovation [41].
The agenda of UN-HABITAT discussed how to accomplish sustainability, inclusivity, prosperity, and human rights by combining innovation and technology to boost their digital transformation. The agenda places people at the center, focusing on “people-centered digitalization,” which encompasses the preservation of privacy, tracking human rights, enhancing digital capacity, and reducing digital inequity. Technology can help to secure and improve sustainable urban development by reducing carbon emissions, streamlining the ecological transition, increasing the availability of affordable housing, encouraging public involvement in policymaking, and guaranteeing community access to inclusive services, alongside other topics included in the new urban agenda, such as artificial intelligence, digital innovation, sustainable energy, investment, and governance [3].
The study by McKenna (2020) discussed the people or human dimension (creativity and innovation, social infrastructure, education) and institutions (governance, planning, policy) [30]. Regarding smart and intelligent services, the study by Xu and Geng (2019) links people’s prosperity to the use of technology in relation to city infrastructure and services, termed “people-centric service intelligence,” which supports people’s needs. It discusses the concepts of “Artificial Intelligence (AI),” “Data Intelligence,” “Business Intelligence (BI),” and “Machine Learning (ML).” According to the study, communities meet the mental needs of people through social contact, culture, and ethics, whereas cities meet the demands of the environment and infrastructure [42]. The study by Alverti et al. (2018) suggests that prioritizing human needs should be at the forefront of future city planning. According to the study, future city design and thought processes should prioritize meeting human needs [43].
According to Allam and Newman (2018), the concept of “Smart People” is also well-received among critics who argue that smart technology can help integrate the social and human capital of a city. Such elements support a strong desire for lifelong learning and a cooperative social role within a flexible and creative environment. By including residents in an informed yet open decision-making process in the urban environment, the smart people idea and the government are combined [44].
The study by Lara et al. (2016) discusses human-centered cities, innovation, innovative urban technology, smart cities, smart communities, and urban planning and development. Additionally, the following concerns have been raised: urban mobility, biosphere degradation, Information and Communication Technologies, security, food and energy shortages, poverty, and the pursuit of economic and social progress [16]. Moreover, the “smart people” component in the study by Albino et al. (2015) encompasses several characteristics, including an interest in lifelong learning, social and ethnic diversity, adaptability, inventiveness, cosmopolitanism, open-mindedness, and involvement in civic affairs. Smart people have high Human Development Indexes; they are residents with advanced degrees and professional experience, original ideas and solutions to complex problems, and they use e-learning techniques. Intelligent individuals actively contribute to sustainable growth, maintenance, and management, are adaptable to changing conditions, and lead healthy lives, thereby improving their city [45]. In Greco and Bencardino’s (2014) study, smart people are those who are responsible for their decisions in life, capable of peaceful cohabitation, and aware of the value of participating in public life [21].

2.4. Human Smart Cities and the “Human-Centered Approach”

“Human Smart Cities” are the future generation of smart cities. How they are impacted by smart people’s engagement, collaboration, and invention, balancing technical infrastructure with soft elements, such as social engagement, citizen empowerment, and people’s interaction in real and virtual spaces, is a key aspect of interrelating physical and digital infrastructure [14].
The “Human-Centered Approach” is an approach that prioritizes human requirements, capabilities, and behavior before designing solutions to meet those needs, capabilities, and behaviors, which could promote the design of smart housing for people. Human-centered design places the human at the center of the problem-solving space [46,47]. “Human-Centered Approaches” in society can balance economic advancements by providing solutions to social problems by creating a system that integrates cyberspace with the physical one, linking the gaps between people, enhancing human activities, and providing more comfortable living conditions [30].
According to Bull and Azennoud (2016), policymakers’ vision is a “human-centric approach,” and the “Smart City” is a system that utilizes flows of services, energy, and financing, as well as materials, to interact with people and stimulate sustainable economic development, resilience, and a high quality of life. The strategic application of information and communication infrastructure and services in a transparent and unambiguous urban planning and management process that satisfies social and economic demands within society makes these linkages. It operates more efficiently, as it focuses on sustainable urban mobility, integrated infrastructure, and energy efficiency. A smart city should be livable and resilient, enable citizen engagement in all services, and provide attractive environments for all [25]. The following table summarizes terms related to the “Human-Centric Approach” of “Smart Cities” (Table 3).

2.5. Procedural Definitions of the “Smart City (SC)” and “Humane Smart City (HSC)”

A procedural definition of the “Smart City (SC)” is an intelligent, creative, and innovative city that supports sustainable economic growth and development, sustainable urban development, resource management and efficiency, and the creative economy through the collaboration of individuals and smart city key domains, technology, mobility, people, living, the environment, the economy, infrastructure, and governance.
As a procedural definition of the “Humane Smart City (HSC),” it is a citizen-driven city as a system of people, promoting sustainability, livability, and social equality through the effective integration of physical, digital, and human systems in the built environment to fulfill citizens’ needs, raise the levels of effective services and the standards of living, and support a high quality of life. This city promotes job creation, high productivity, and highly knowledgeable individuals who interact with and utilize flows of energy, materials, services, and financing to foster sustainable economic development through the strategic use of information and communication infrastructure, thereby responding to the social and economic needs of its citizens. The “Human Smart City” encourages the interrelation between technology and users.

2.6. Research Gap

From previous literature, the research gaps related to retrofitting Erbil City into a smart city have been indicated as follows:
  • Although ICT difficulties like security threats, privacy violations, and digital skill deficits are identified in the general literature, as are IoT challenges about security, scalability, and interoperability, there is a notable shortage of specialized studies on these topics in the context of Erbil City.
  • There is limited practical research on ICT and a human-centered approach in Erbil City, and there is a gap between theoretical discussions and empirical research on the application of these technologies in Erbil City and how it can be retrofitted into a smart city. Therefore, a significant research gap emerged in presenting a holistic, comprehensive perspective study that covers the integration of smart technology with human needs.
  • Although the idea of a “human-centered approach” is frequently emphasized in the literature on smart cities, little is known about how the people of Erbil view, anticipate, perceive, and worry about these technologies and the retrofitting process in their city. Thus, a research gap exists in the study of the “human-centered design framework” that will impact the development of Erbil City.

3. Materials and Methods

3.1. Research Hypotheses

The paper proposes a roadmap as a human-centered conceptual framework model. It develops a strategic planning scheme to be implemented in Erbil City, aiming to enhance its transformation and development into a smart city. The selected case study includes the “Buffer Zone of the Erbil Citadel.” The criteria for the chosen study area will be discussed and explained. The research has put forward the following hypotheses to be considered:
Hypothesis 1 (H1).
The human-centered approach plays a significant role in achieving smart cities.
Hypothesis 2 (H2).
By implementing smart technology strategies, traditional cities can be retrofitted to become smart cities.

3.2. Research Methodology

The methodology of the research includes multiple integrative methods of qualitative and quantitative approaches, which are as follows:
  • An interview and discussions with the “Buffer Zone Committee” and the “High Commission for Erbil Citadel Revitalization (HCECR)” in the “Municipality of Erbil.”
  • A field survey and a visit to the “Buffer Zone districts” as an observation method to evaluate the current condition of the area.
  • Space syntax analysis of the “Buffer Zone.”
  • Questionnaires distributed among experts, engineers, and specialists.
  • Statistical analysis using IBM SPSS Statistics 27 software and Microsoft Excel.

3.3. Smart Cities Performance Indicators (SCPIs) and Smart Cities Assessment Tools (SCATs)

The cornerstones of any assessment scheme are the indicators. Indicators are quantifiable, measurable variables that provide additional information on themes and/or aspects and can be used to measure the intelligence of cities. Therefore, this entails establishing a conceptual theoretical framework by finding Smart Cities Performance Indicators (SCPIs) that can be studied and implemented in the case study. Thus, the “Smart City’s Components” (smart technology, smart people, and smart living) have been identified with their corresponding indicators and possible values, conceptualized within the framework model.
A “Key Performance Indicator (KPI)” is a quantitative measurement method that an organization can use to assess the performance of specific objectives or activities by using a set of metrics and measurements that are based on a standardized approach [48]. Key Performance Indicators (KPIs) are tangible quantities used to assess, compare, and monitor an organization’s overall performance. They can include quantity, finance, cost, flexibility, time, safety, people’s satisfaction, social performance, learning, and environmental issues, etc. [49]. Moreover, the “Smart City Assessment (SCA)” refers to a tool or assessment procedure that measures the performance of a particular indicator within the context of smart city concept implementation [8].
Therefore, to test and measure the performance quality of the smart city, an integrated set of “Key Performance Indicators (KPIs)” with their possible values, extracted from previous literature, will be used to establish a framework for measuring smart city performance. The assessment framework’s indicators are chosen based on the needs of cities and their inhabitants, as “Smart” implies efficiency, sustainability, societal engagement, and a higher quality of life.

3.3.1. Smart Technology Key Performance Indicators for Smart Cities

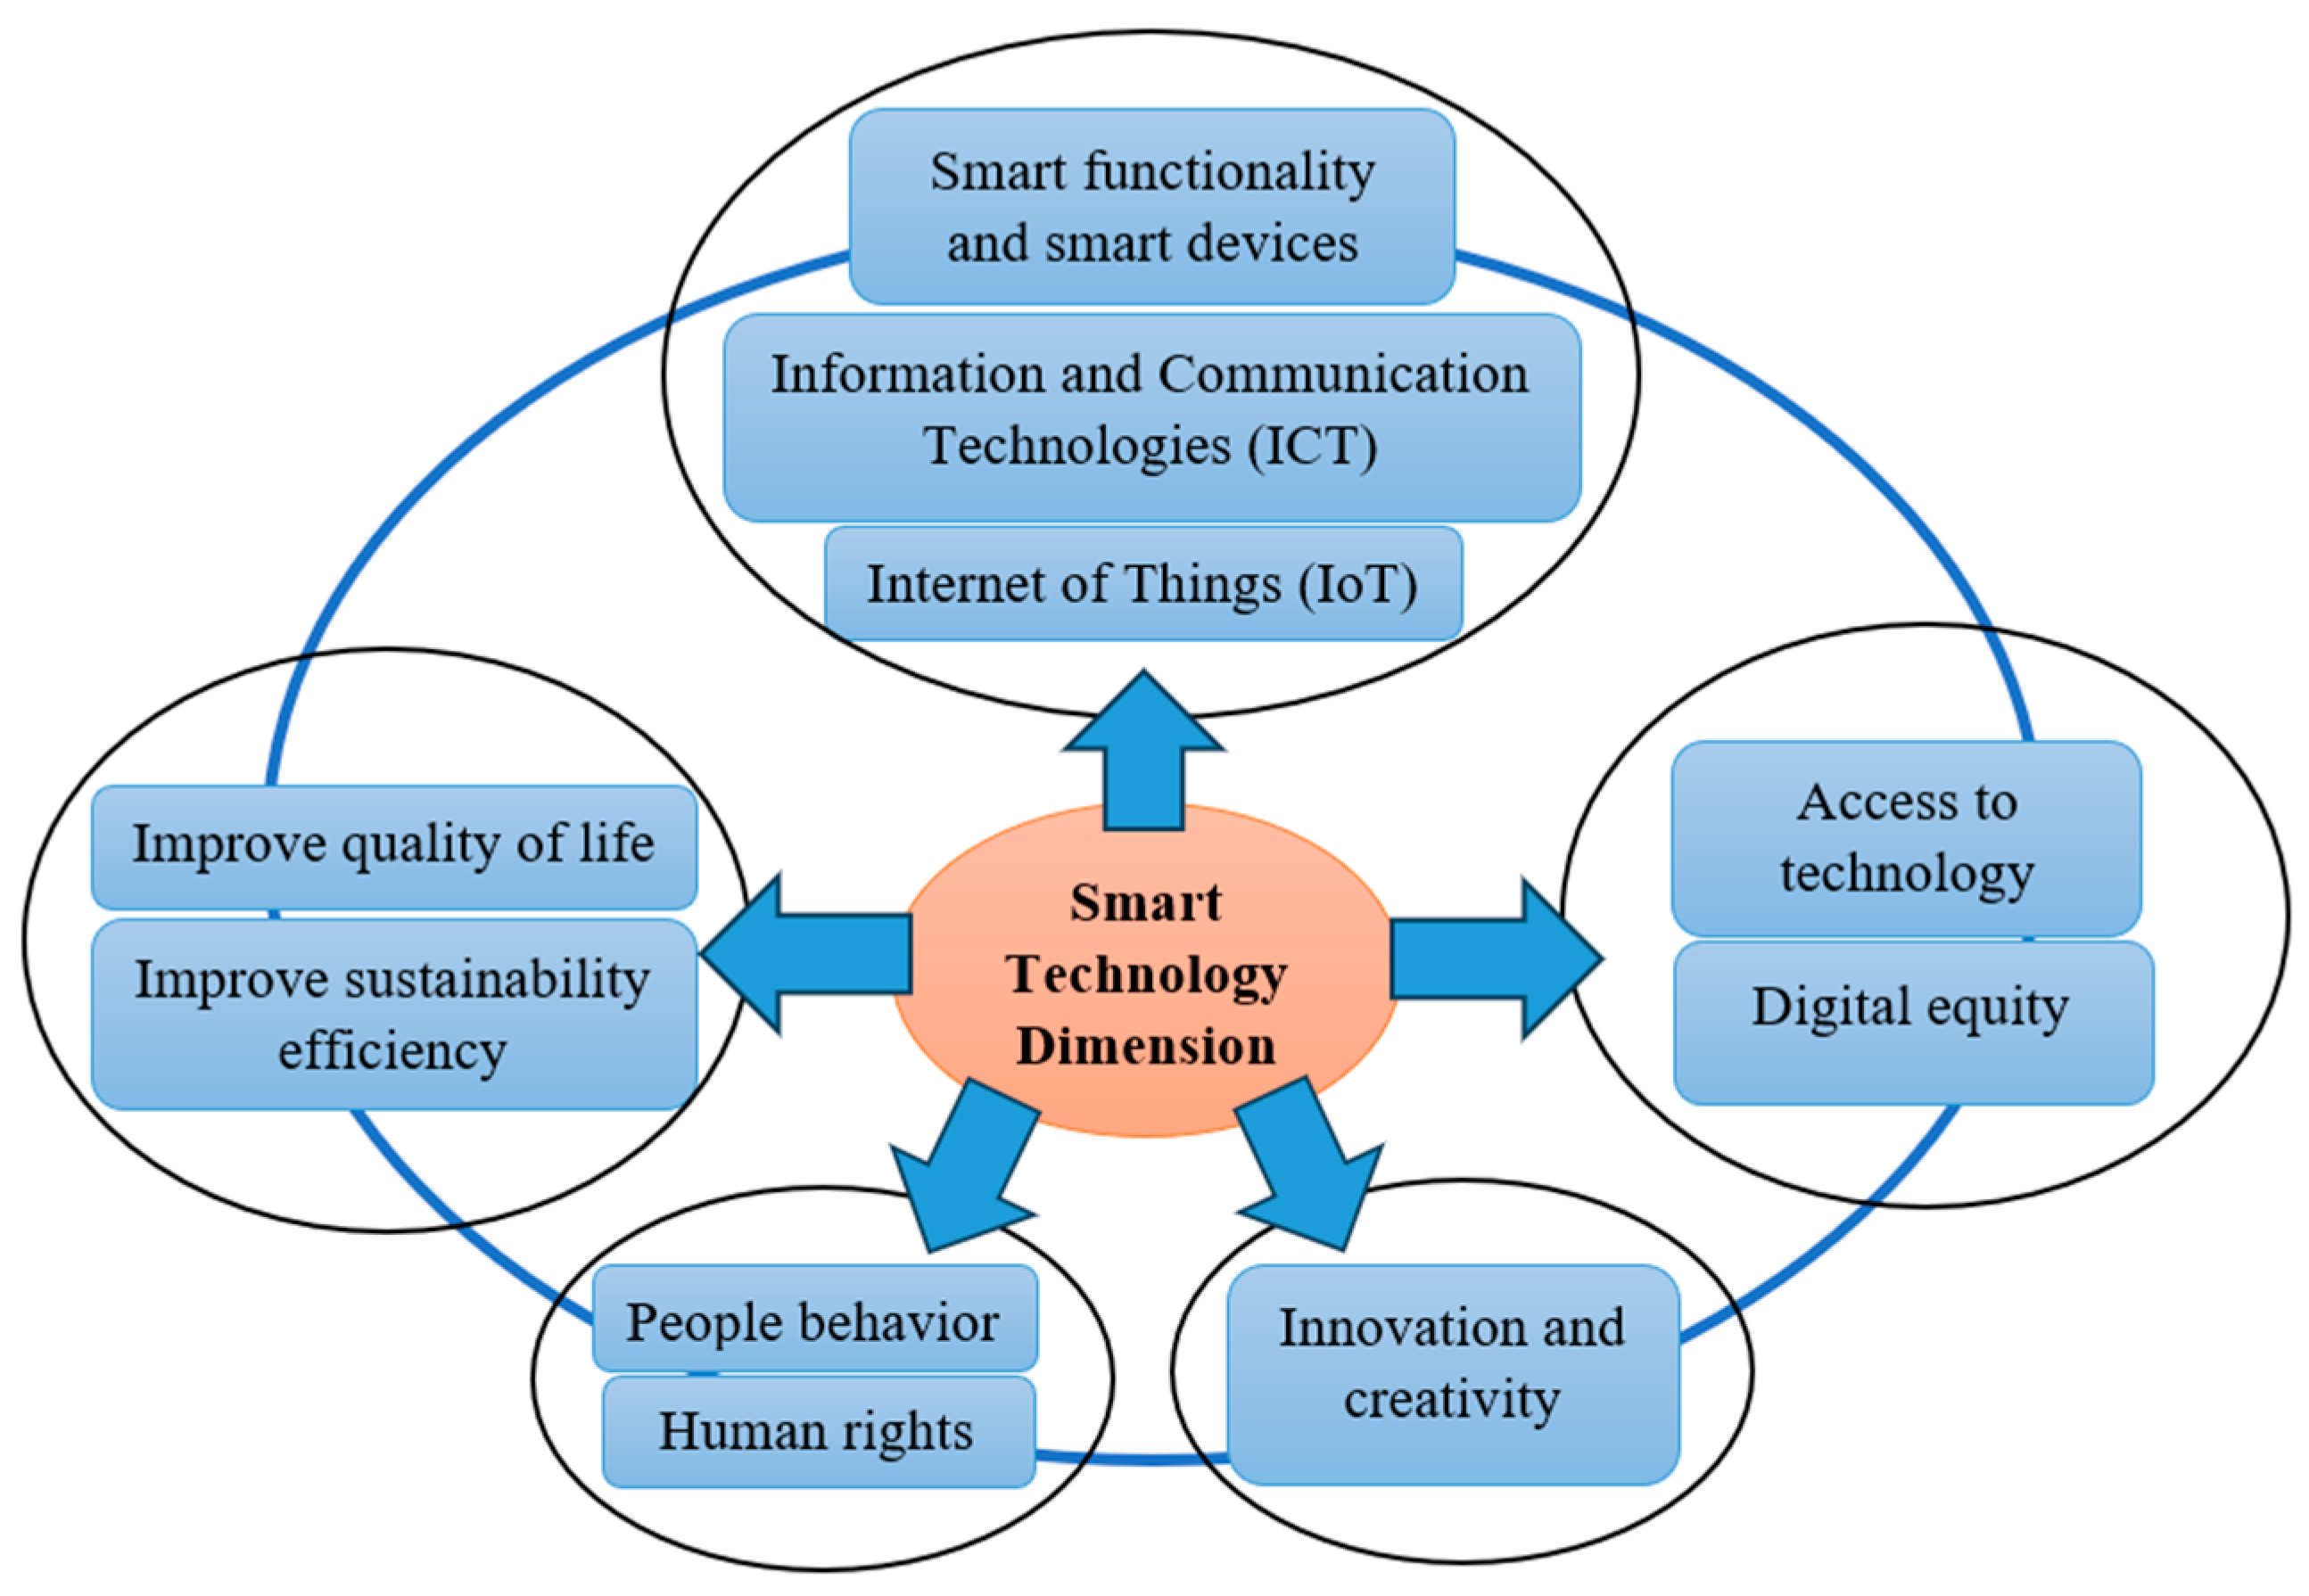
The smart technology component can enhance the quality of life of the citizens and control multiple functions and activities in the city by embedding Information and Communication Technologies (ICTs) and the Internet of Things (IoT). Moreover, it plays a key role in establishing the paradigm of the human-centered approach. The researcher concludes that the smart technology indicators are smart functionality and smart devices—Information and Communication Technologies (ICTs) and the Internet of Things (IoT); improved quality of life—improved sustainability efficiency; people’s behavior and human rights; digital equity and access to technology; and innovation and creativity regarding artificial intelligence (Table 4 and Figure 2).

3.3.2. Smart People’s Key Performance Indicators for Smart Cities

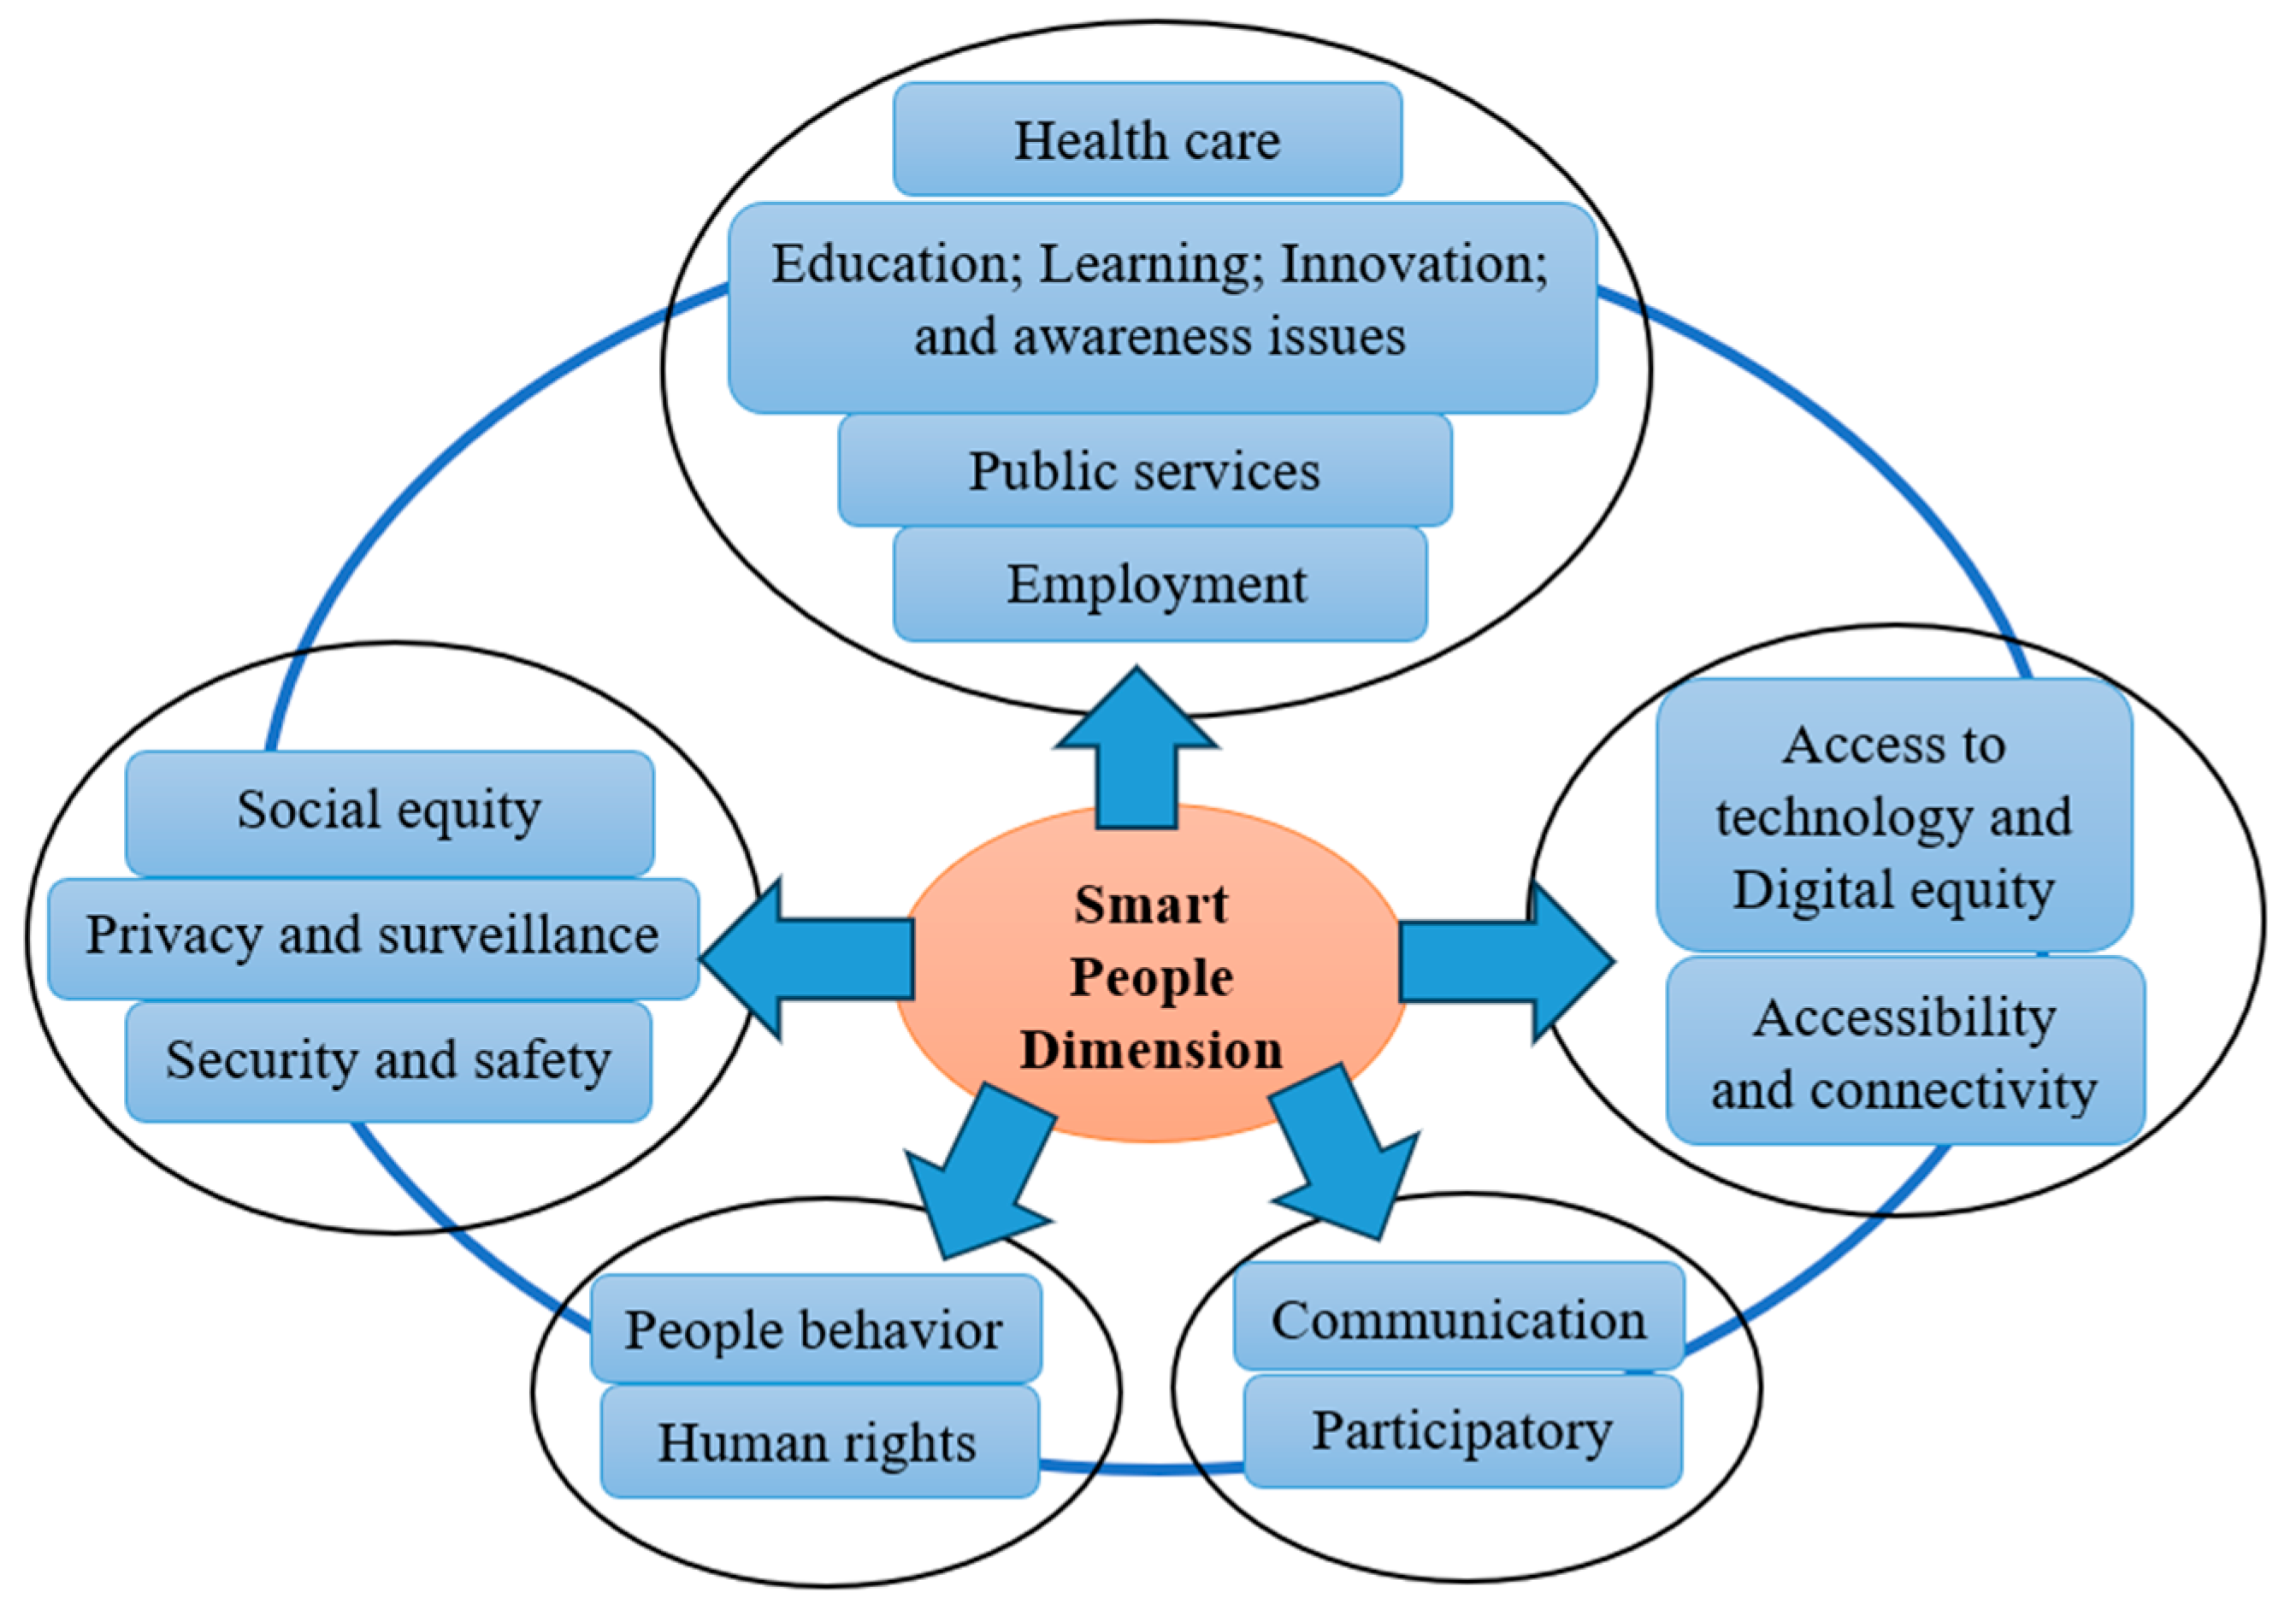
The smart people component is one of the most critical dimensions of the smart city to build a “Human-Centered Design Paradigm” to be implemented in Erbil City. The researcher concludes that smart people’s indicators are education, learning; innovation; awareness issues; the unemployment rate; healthcare; participation; people’s inequity, social inequity; poverty; human rights; people’s behavior; urban violence; insecurity; data safety; privacy; surveillance; communication; and digital equity and access to technological services (Table 5 and Figure 3).

3.3.3. Smart Living’s Key Performance Indicators for Smart Cities

The smart living component is the second important dimension related to human needs to build a “Human-Centered Design Paradigm.” The researcher concludes thatsmart living indicators are quality of life (livability); affordable housing; cultural issues; safety and security, accidents, crimes, and violence; healthcare support; access to public services; intelligent, real-time sensing; online services; diversification and social cohesion; working issues; urban sustainability; city attractiveness; and prosperity—poverty (see Table 6).

3.4. Erbil City as a Case Study—The Erbil Citadel and Its Relationship with the City

3.4.1. Erbil City Development and Challenges

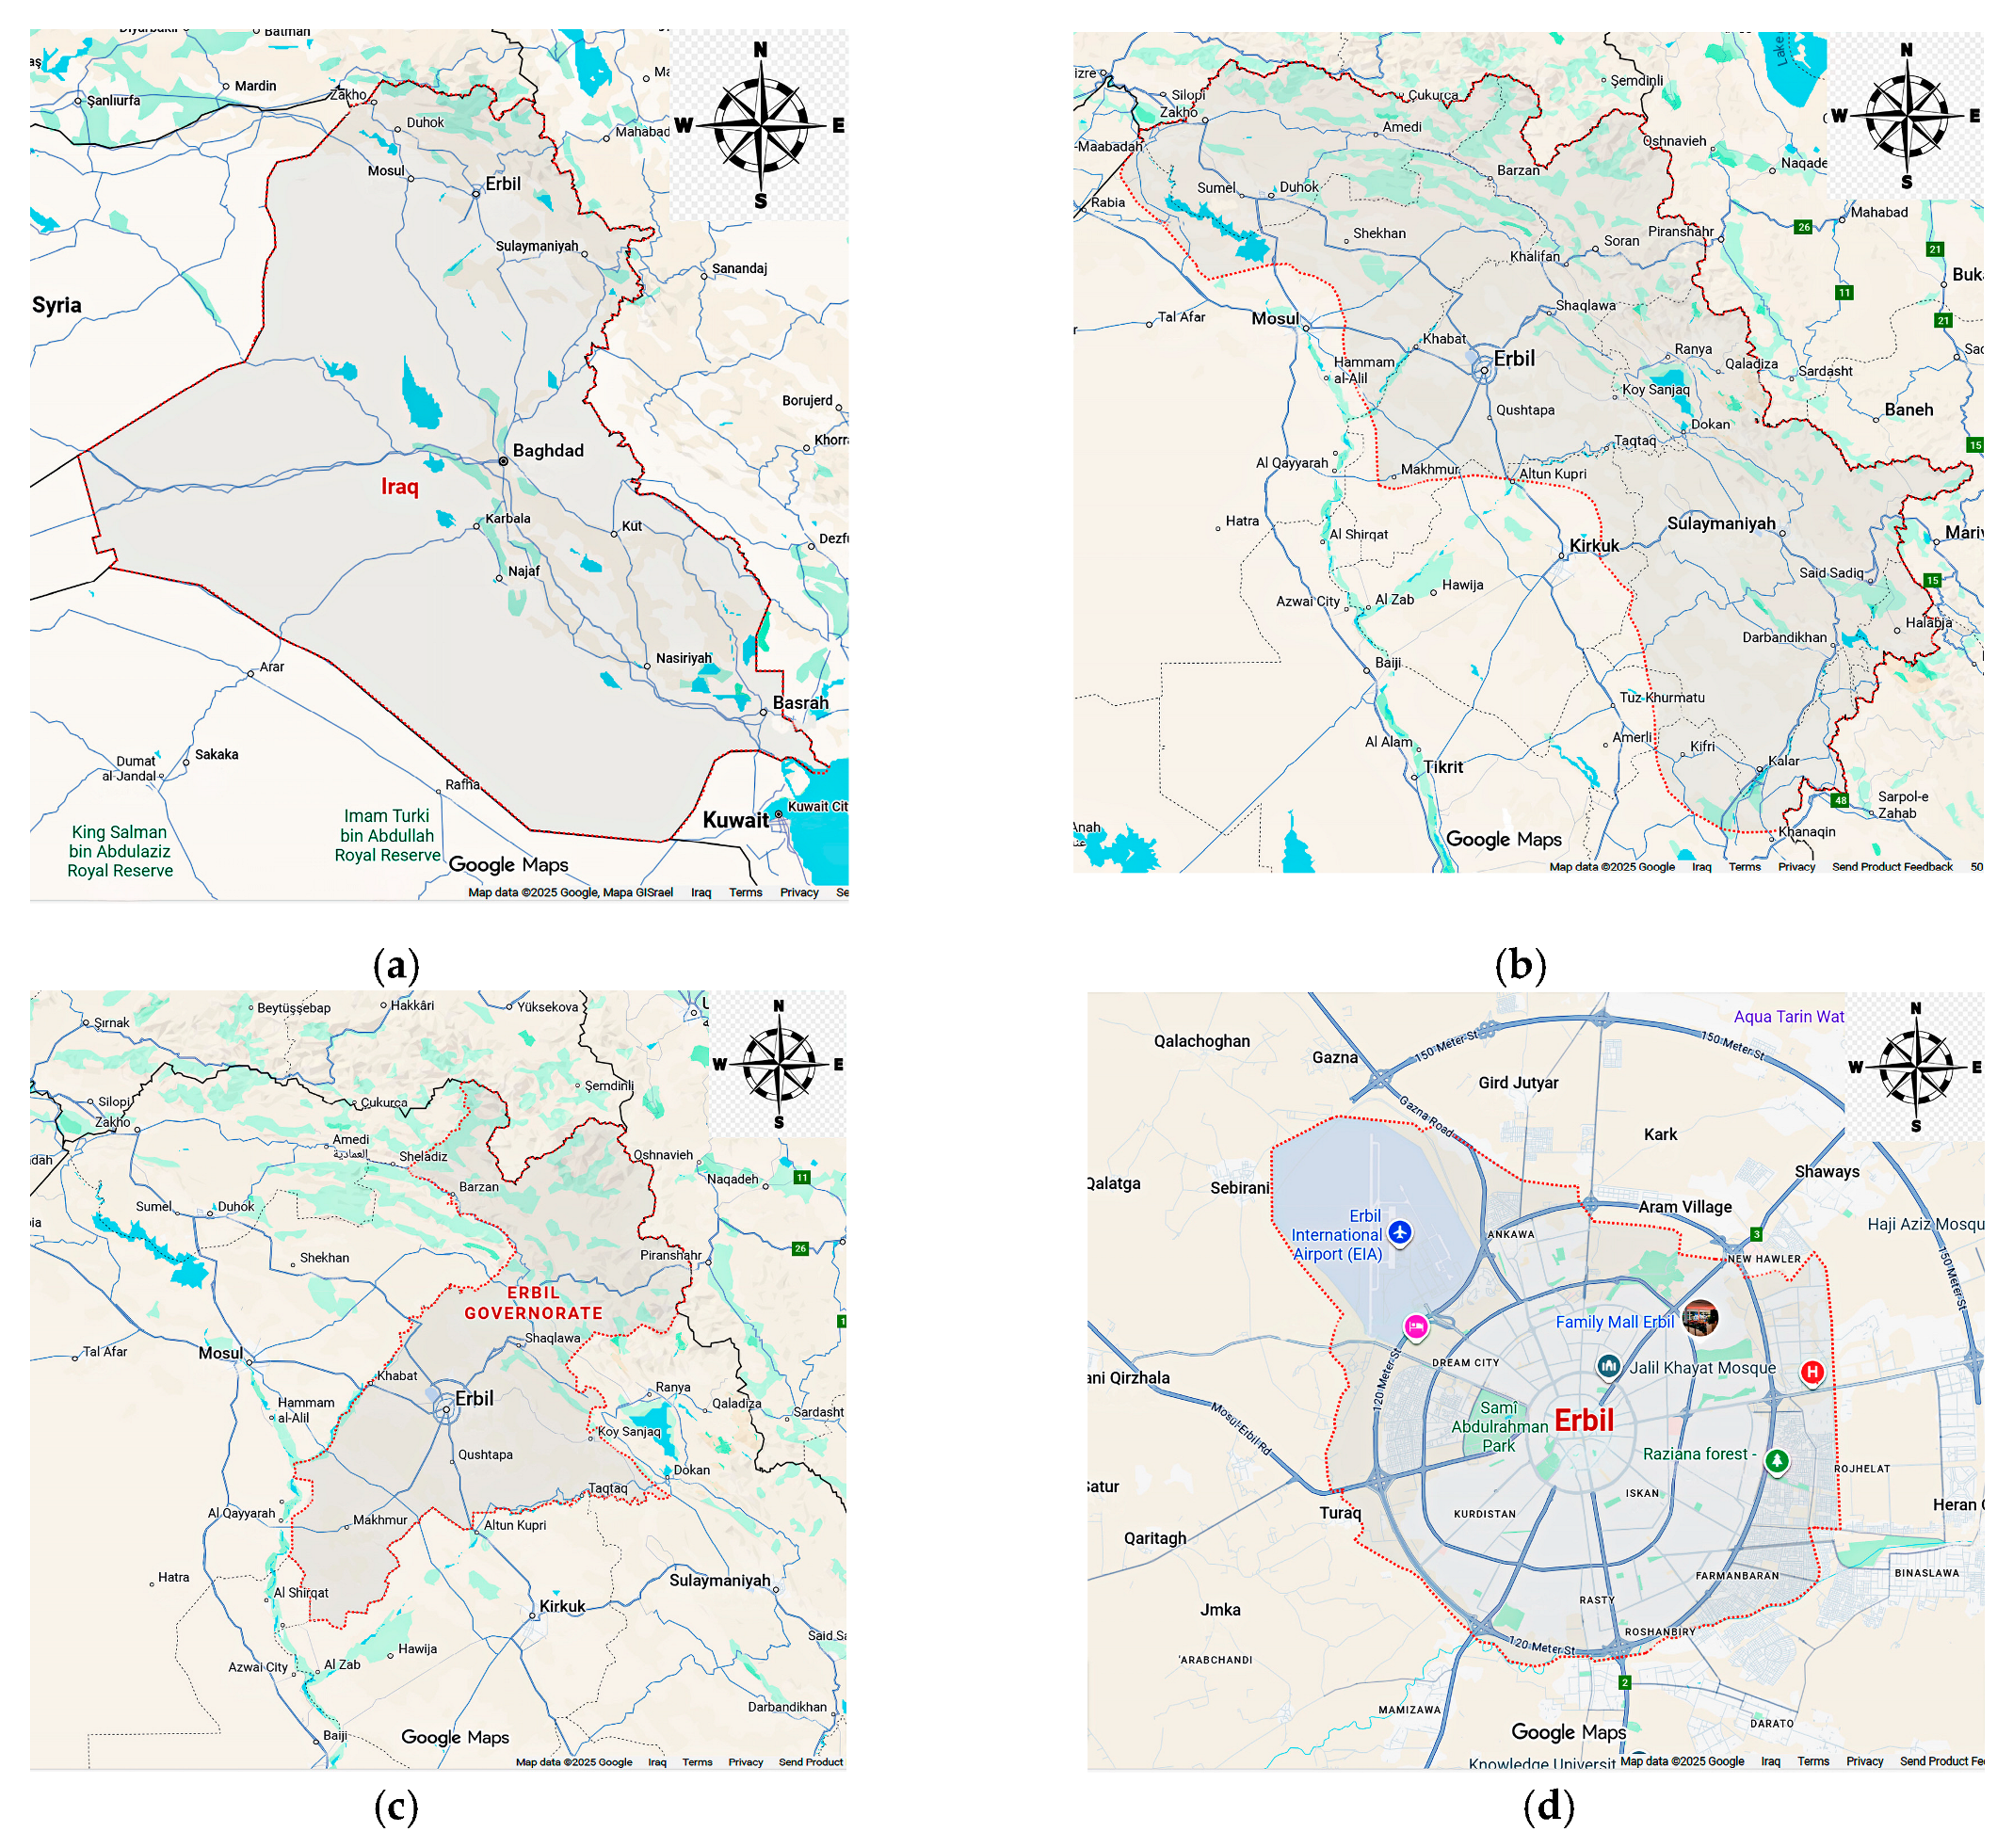
Erbil City is the capital of the Kurdistan Region of Iraq (see Appendix A). It has witnessed rapid urban development, which has led to urbanization challenges over time due to the expansion of urban areas to meet the population’s needs. These challenges include waste management, air pollution, environmental issues, health concerns, deteriorating infrastructure, congestion, etc.
The Citadel of Erbil has been one of the world’s oldest continuously inhabited places for over 6000 years. It is an outstanding historic urban landscape and part of Kurdish history and identity. Together with UNESCO (which listed the Citadel on the World Heritage List), the Governorate of Erbil and the Kurdistan Regional Government have been working throughout the past few years to preserve and develop this significant Kurdish legacy. The Erbil Citadel’s Buffer Zone Committee makes sure that the heritage of the surrounding historic districts and the Citadel’s unique character are maintained for both current and future generations [50].

3.4.2. The Buffer Zone of the Erbil Citadel

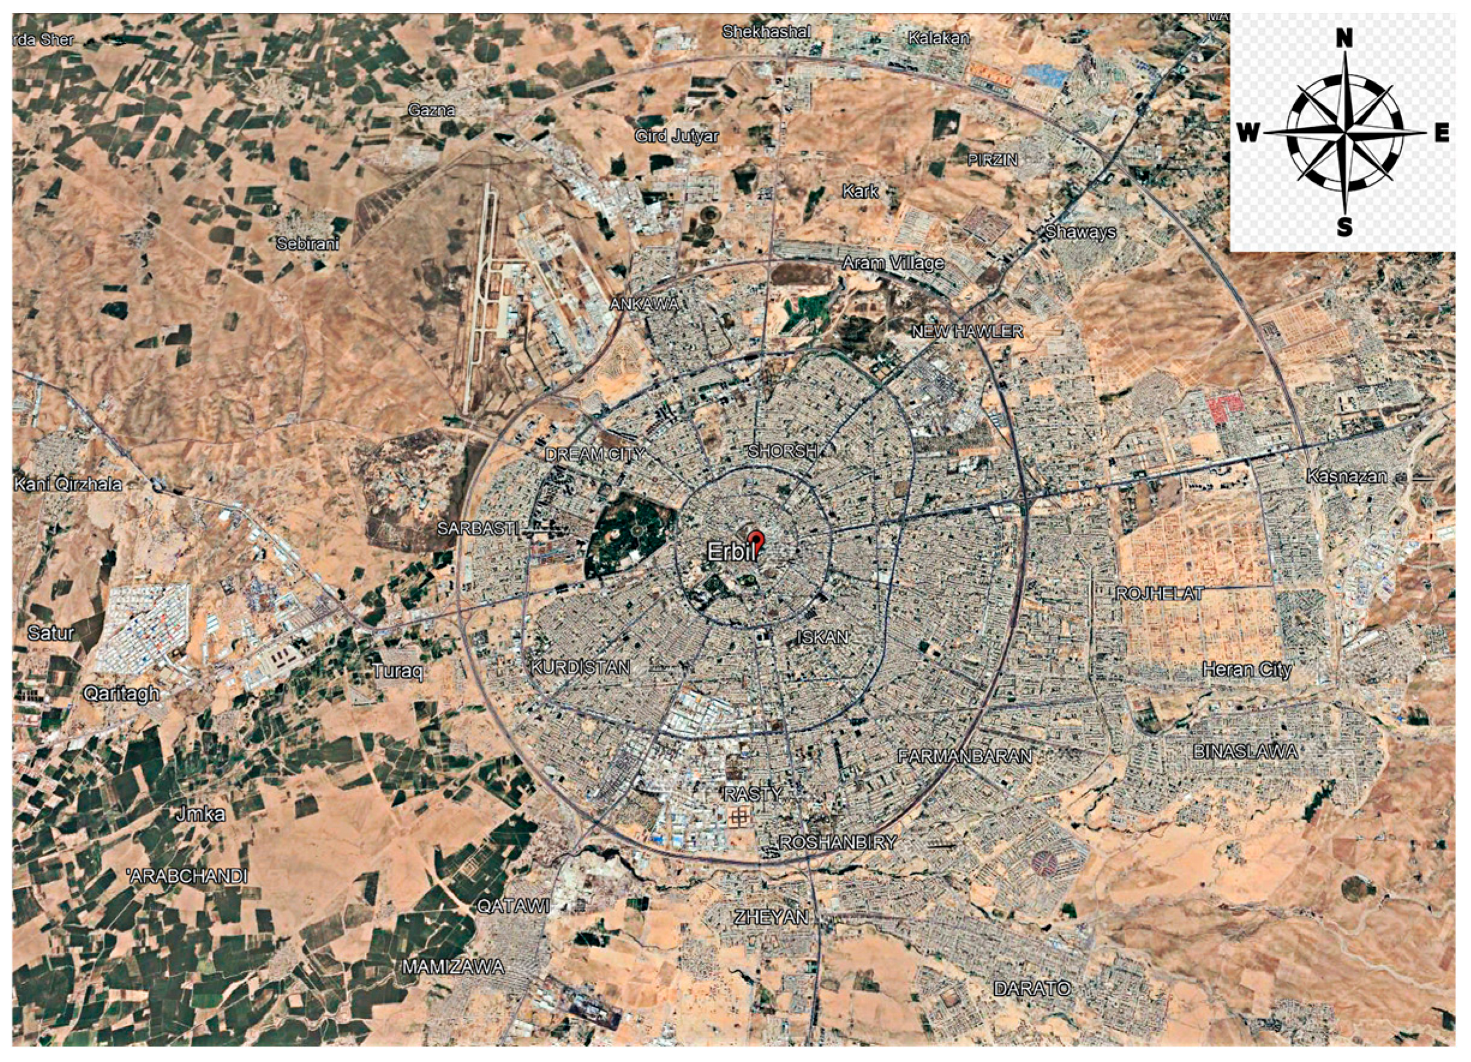
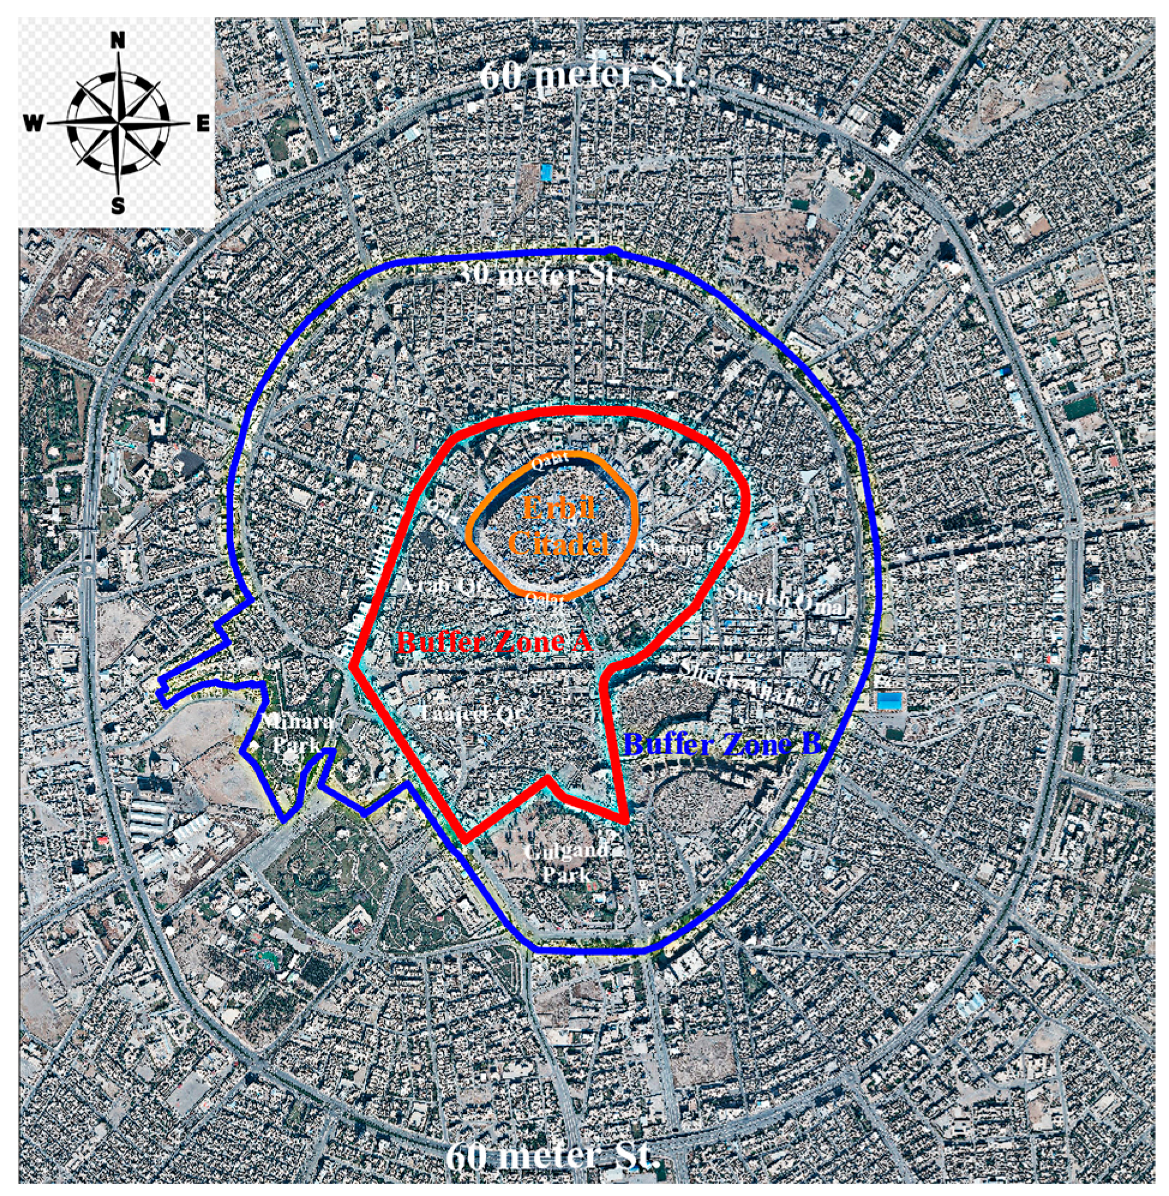
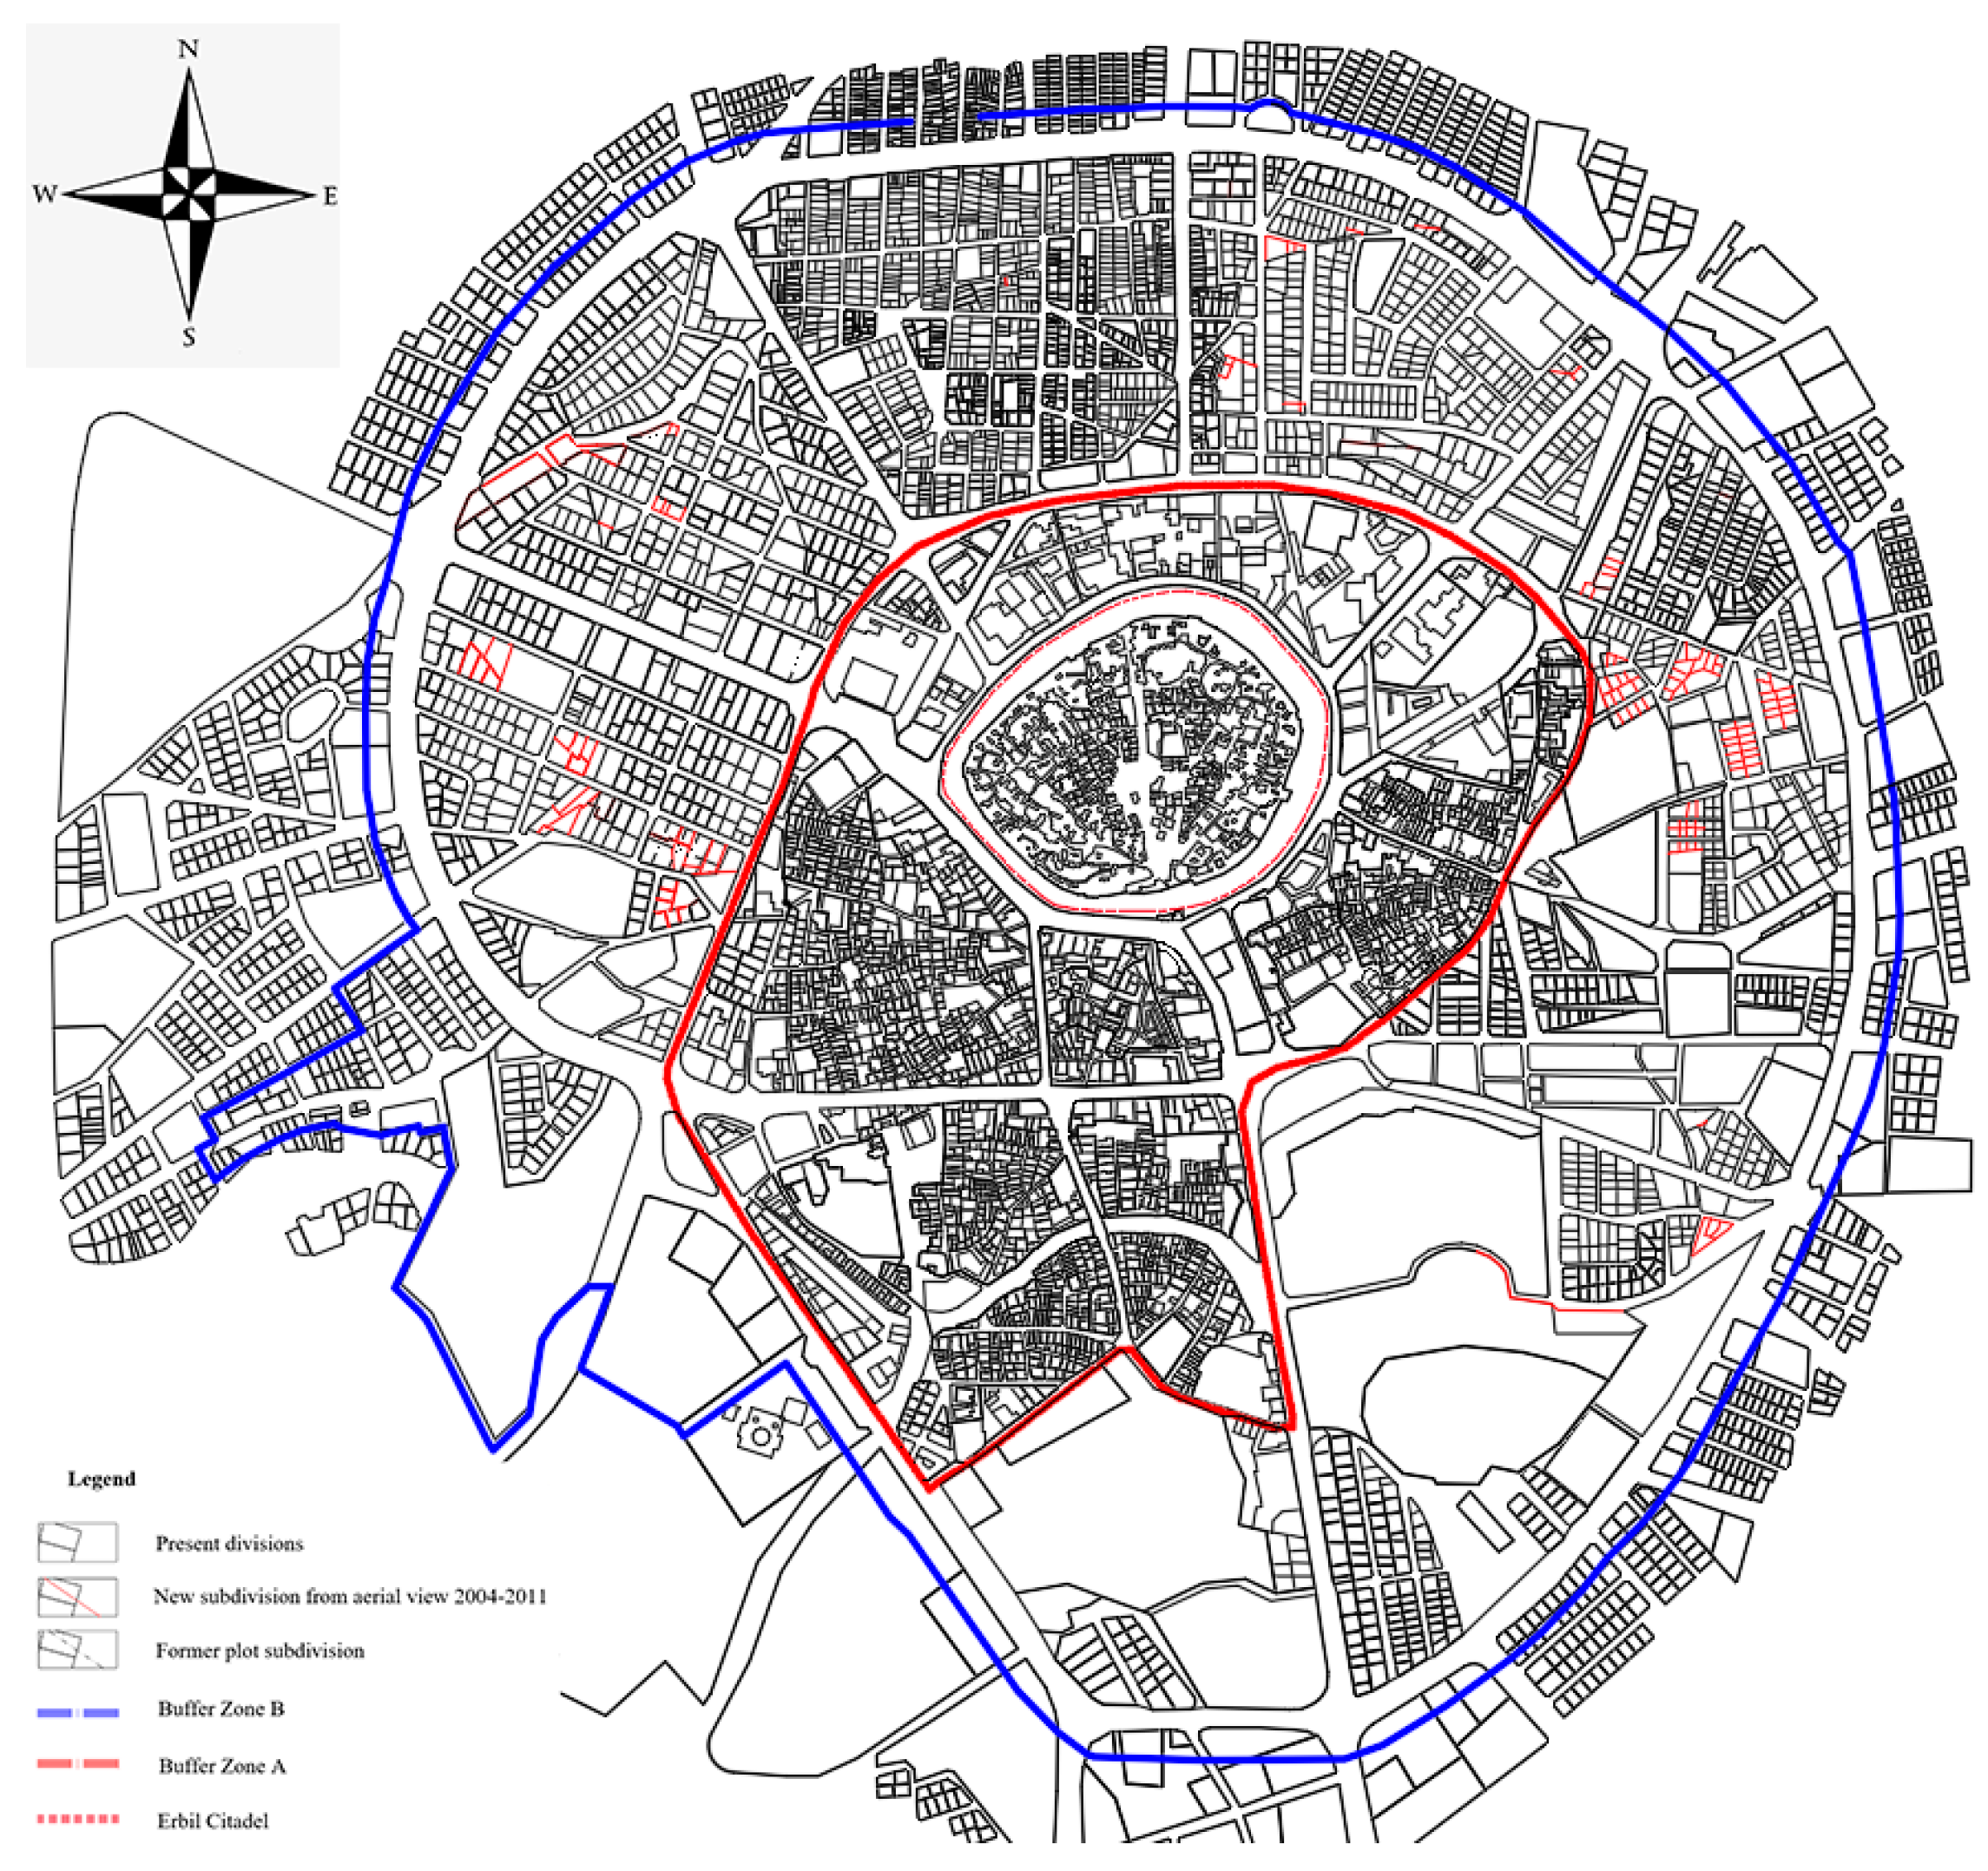
The Buffer Zone is a unique illustration of the development of Kurdish Cultural Heritage and a visible depiction of the cultural characteristics and diversity of previous generations who have inhabited this area. Traditionally constructed fabric may be seen in this area. The Buffer Zone includes the districts of Arab, Khanaqa, and Mustawfi, which have comparable urban layouts and building types that range from traditional courtyard houses to villas. Due to its historical significance, ability to regulate changes, importance to the Citadel’s heritage, and relationship with the city, the Buffer Zone demands special care and protection [50] (Figure 4, Figure 5 and Figure 6).

3.4.3. Planning and Building Regulations for the Buffer Zone of Erbil Citadel

The Buffer Zone of Erbil Citadel comprises the area between the Citadel and the thirty-meter ring (Barzani Namer Street) and the area surrounding Minaret Park. (Buffer Zone A with an approximate area of 900,000 sqm and Buffer Zone B (2,800,000 sqm). The Buffer Zone is divided into two parts [51] (Figure 5 and Figure 6):
  • Buffer Zone A: The area directly surrounding the Citadel (between the castle road and the first ring road) and the historic area of Taajil are subject to a high level of protection due to their historical value.
  • Buffer Zone B: The area between the first ring road (Al Muzaffariyah Road) and the thirtieth ring road (30 m), and the area surrounding Al Manara Park. This area is subject to a lower degree of protection.
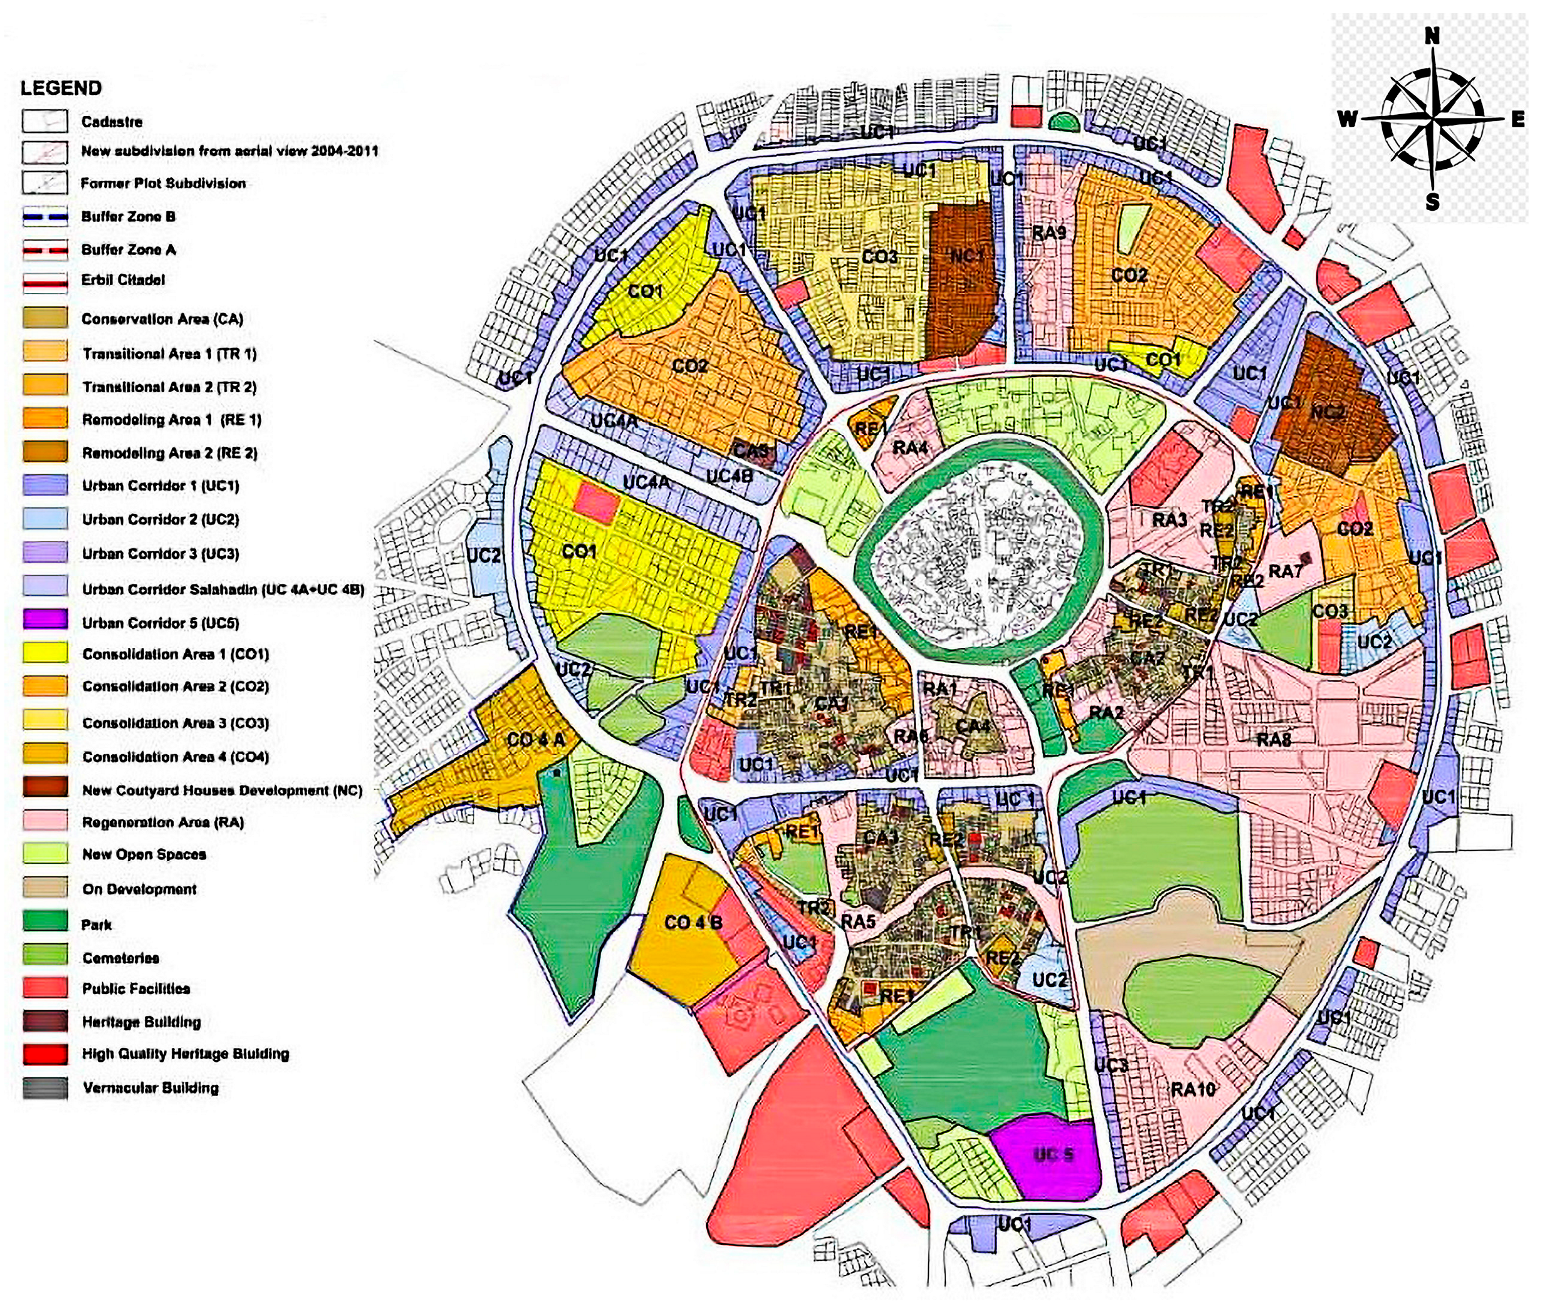
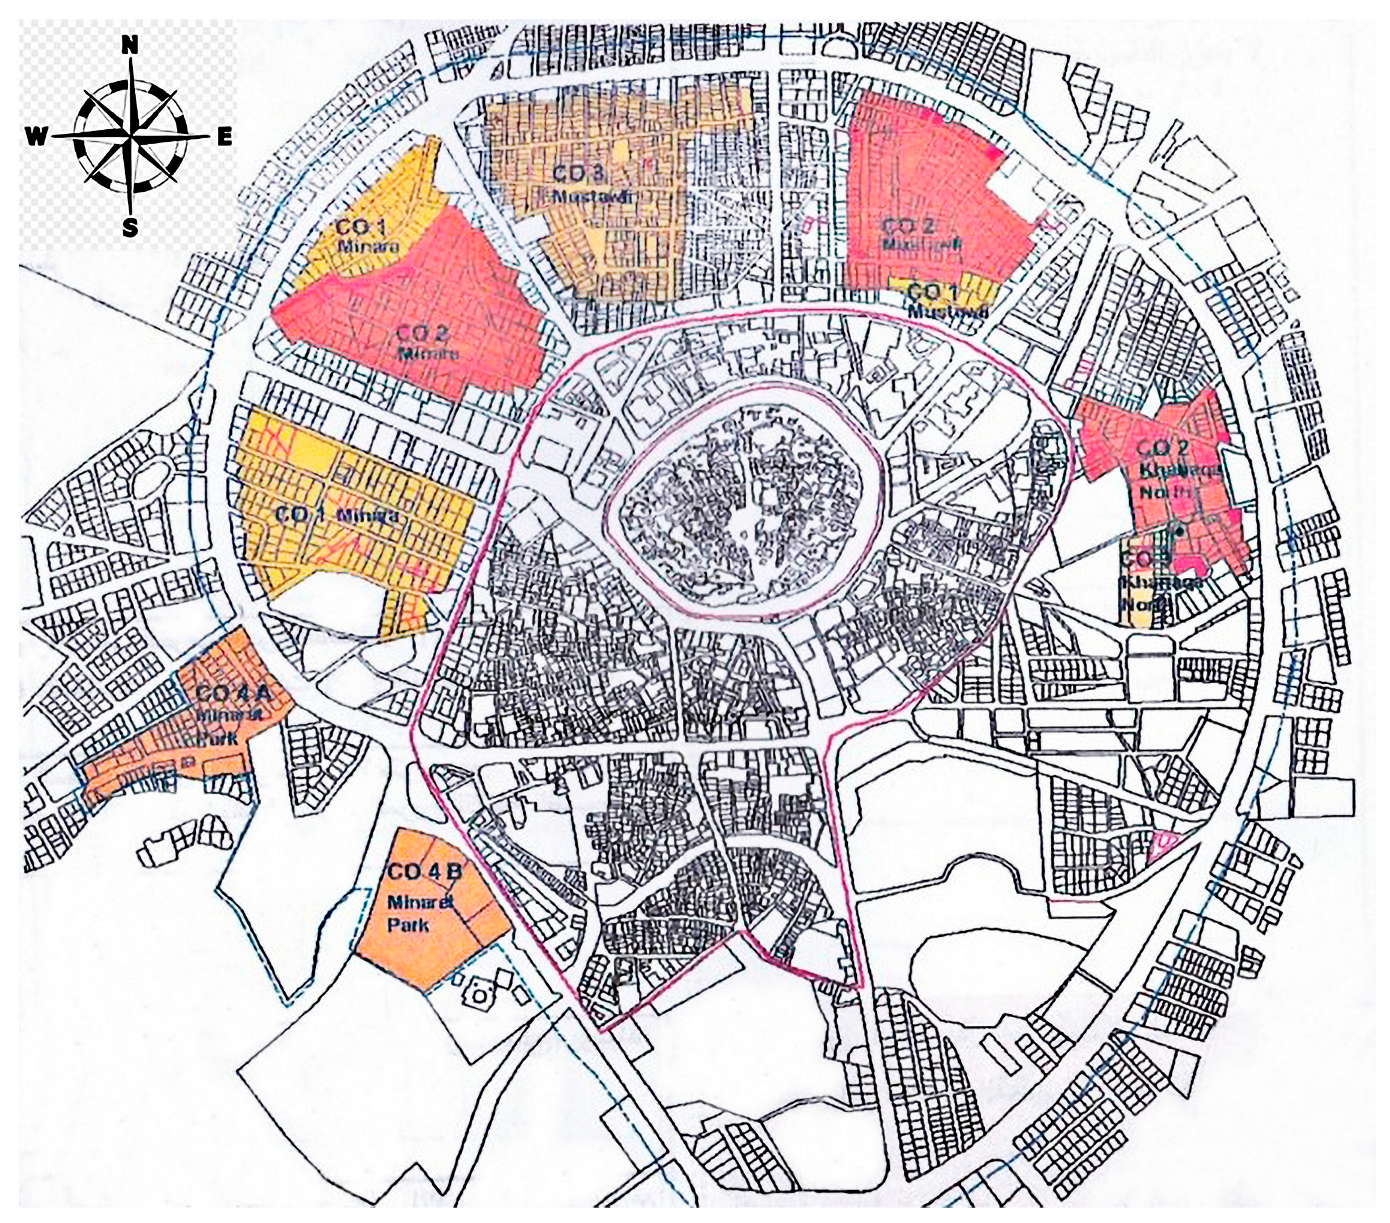
The Buffer Zone was divided into seven categories of planning areas, each subject to a set of conditions and regulations (Figure 7). These categories are Conservation Areas (CA), Transitional Areas (TR), Reconfiguration Areas (RE), Urban Corridors (UC), Consolidation Areas (CO), New Courtyard Home Development Areas (NC), and Renewal Areas (RA) (Table 7). Moreover, there are 5 Building System Types in the Buffer Zone: high-quality heritage buildings; heritage buildings; colloquial buildings; abandoned buildings; modern buildings; and contradictory buildings [51].

3.4.4. Criteria for Choosing the Study Area in the Buffer Zone of Erbil Citadel

The “License Committee of the Buffer Zone” is the organization responsible for regulating development and issuing building permits in the Buffer Zone [50].
According to many field survey visits to the “Buffer Zone districts” and discussions with the “Buffer Zone Committee” and the “High Commission for Erbil Citadel Revitalization (HCECR)” in “Municipality of Erbil,” the Buffer Zone is divided into sectors, each of which has unique characteristics, with some houses populated. In contrast, others have changed their functions to warehouses or stores. The Buffer Zone typically features a mix of uses, including residential, commercial, cultural, office, tourism accommodations, retail stores, entertainment venues, public facilities, parking, and open spaces.
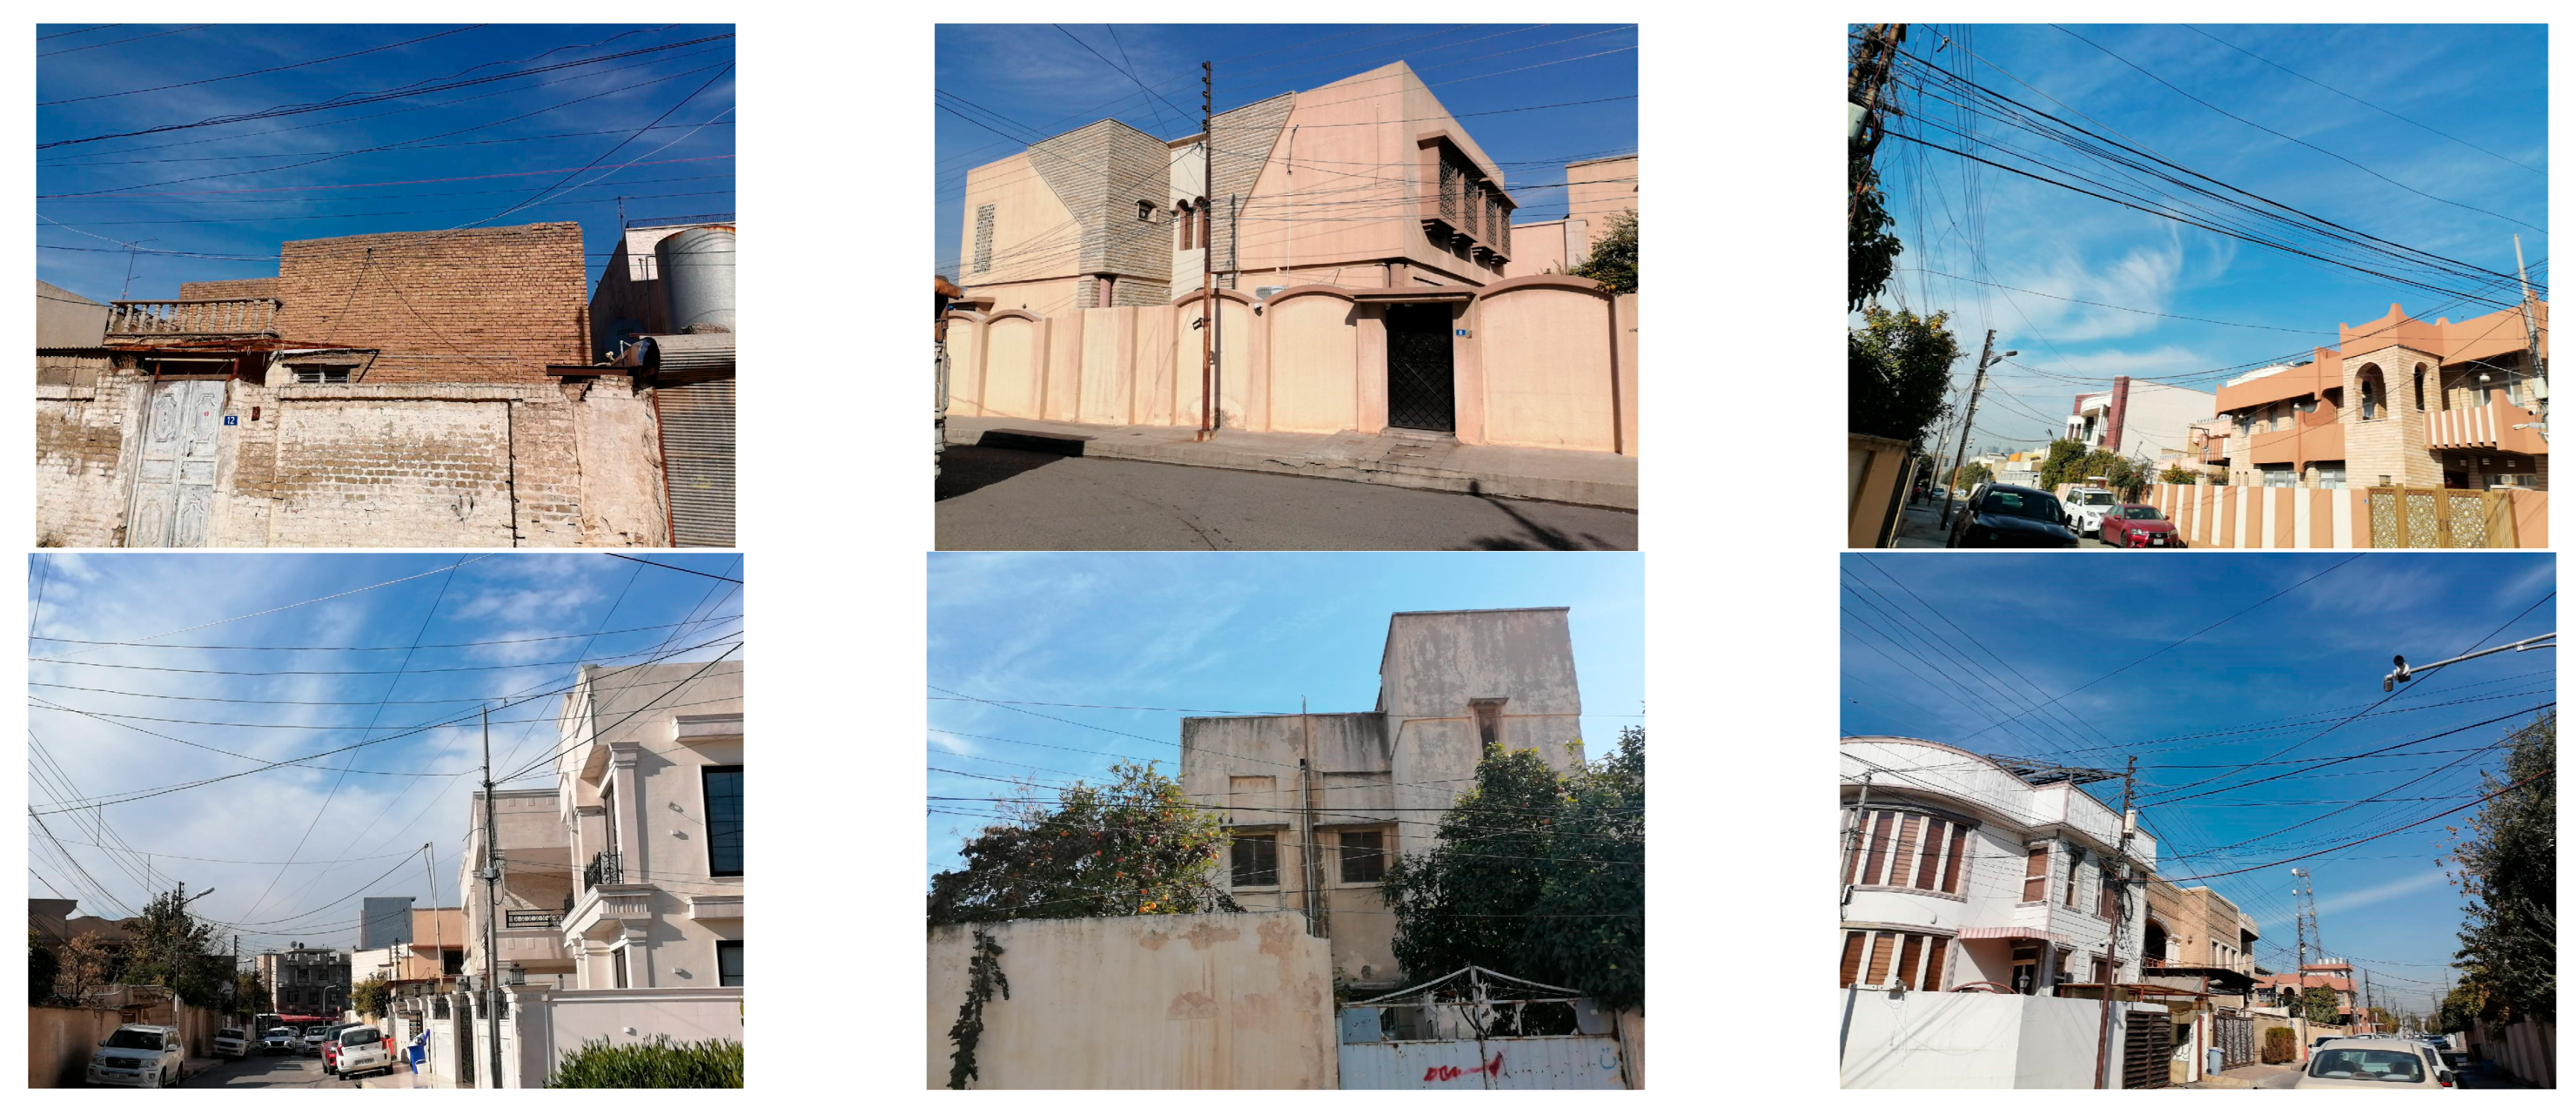
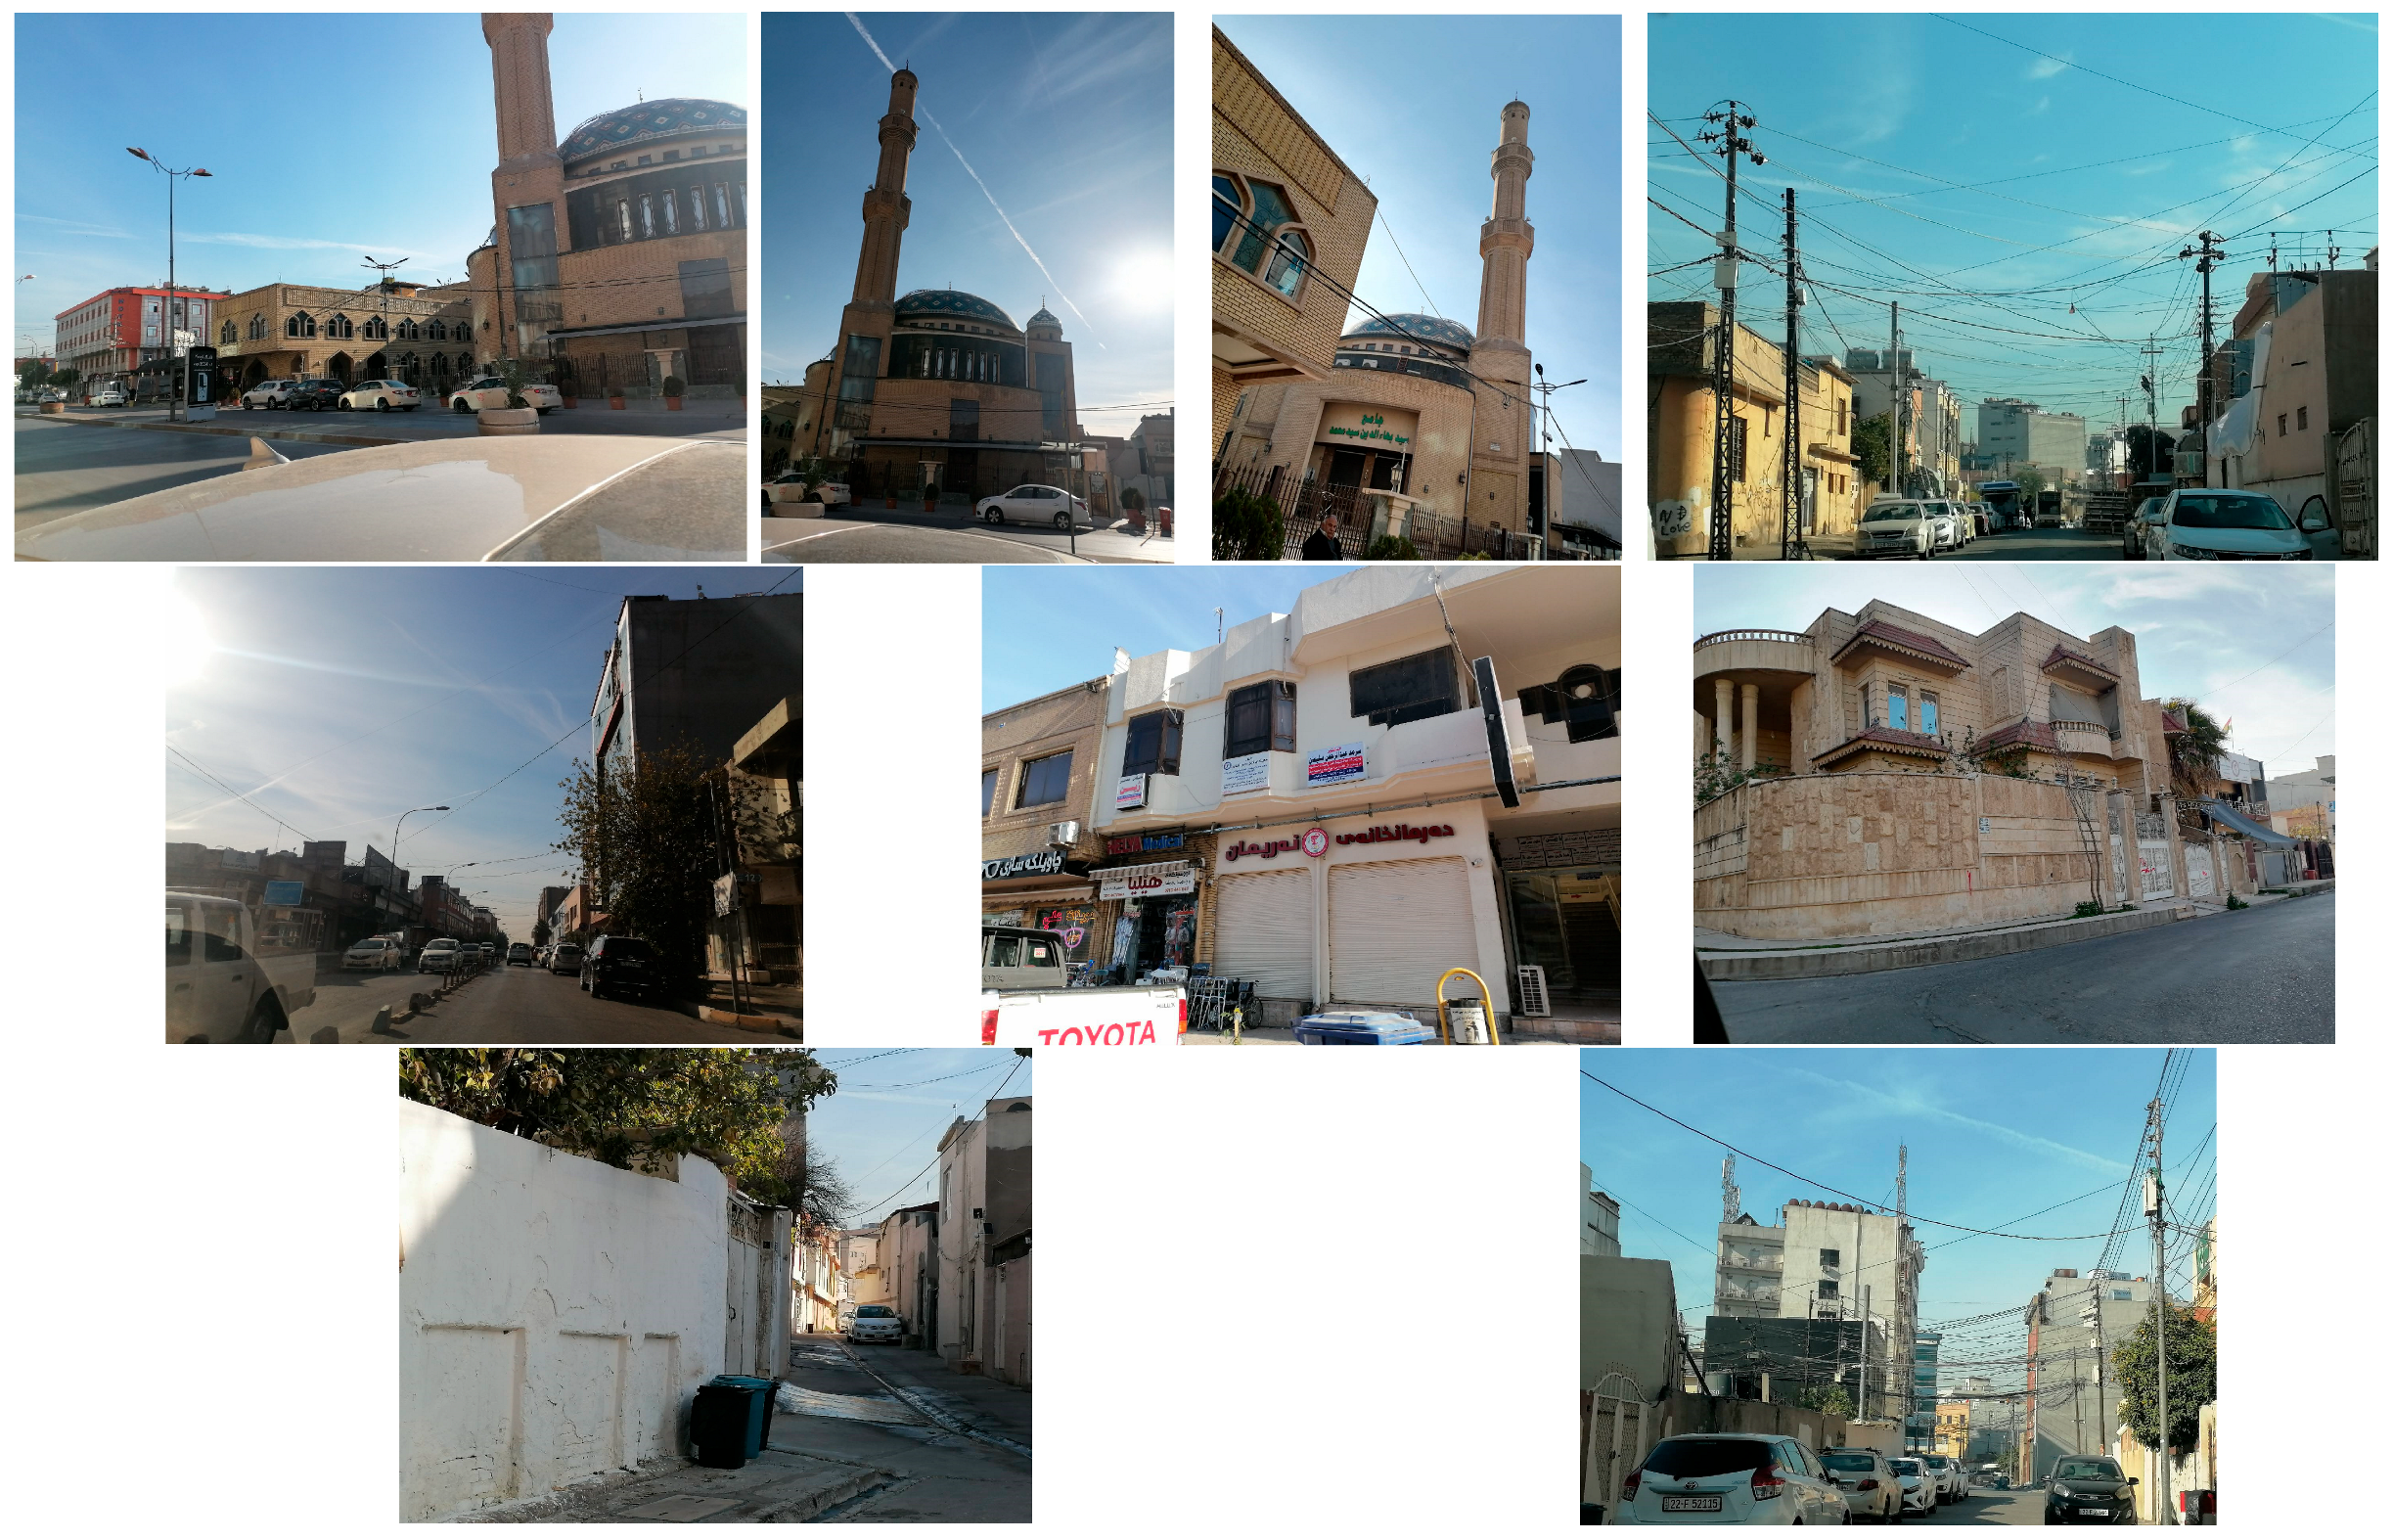
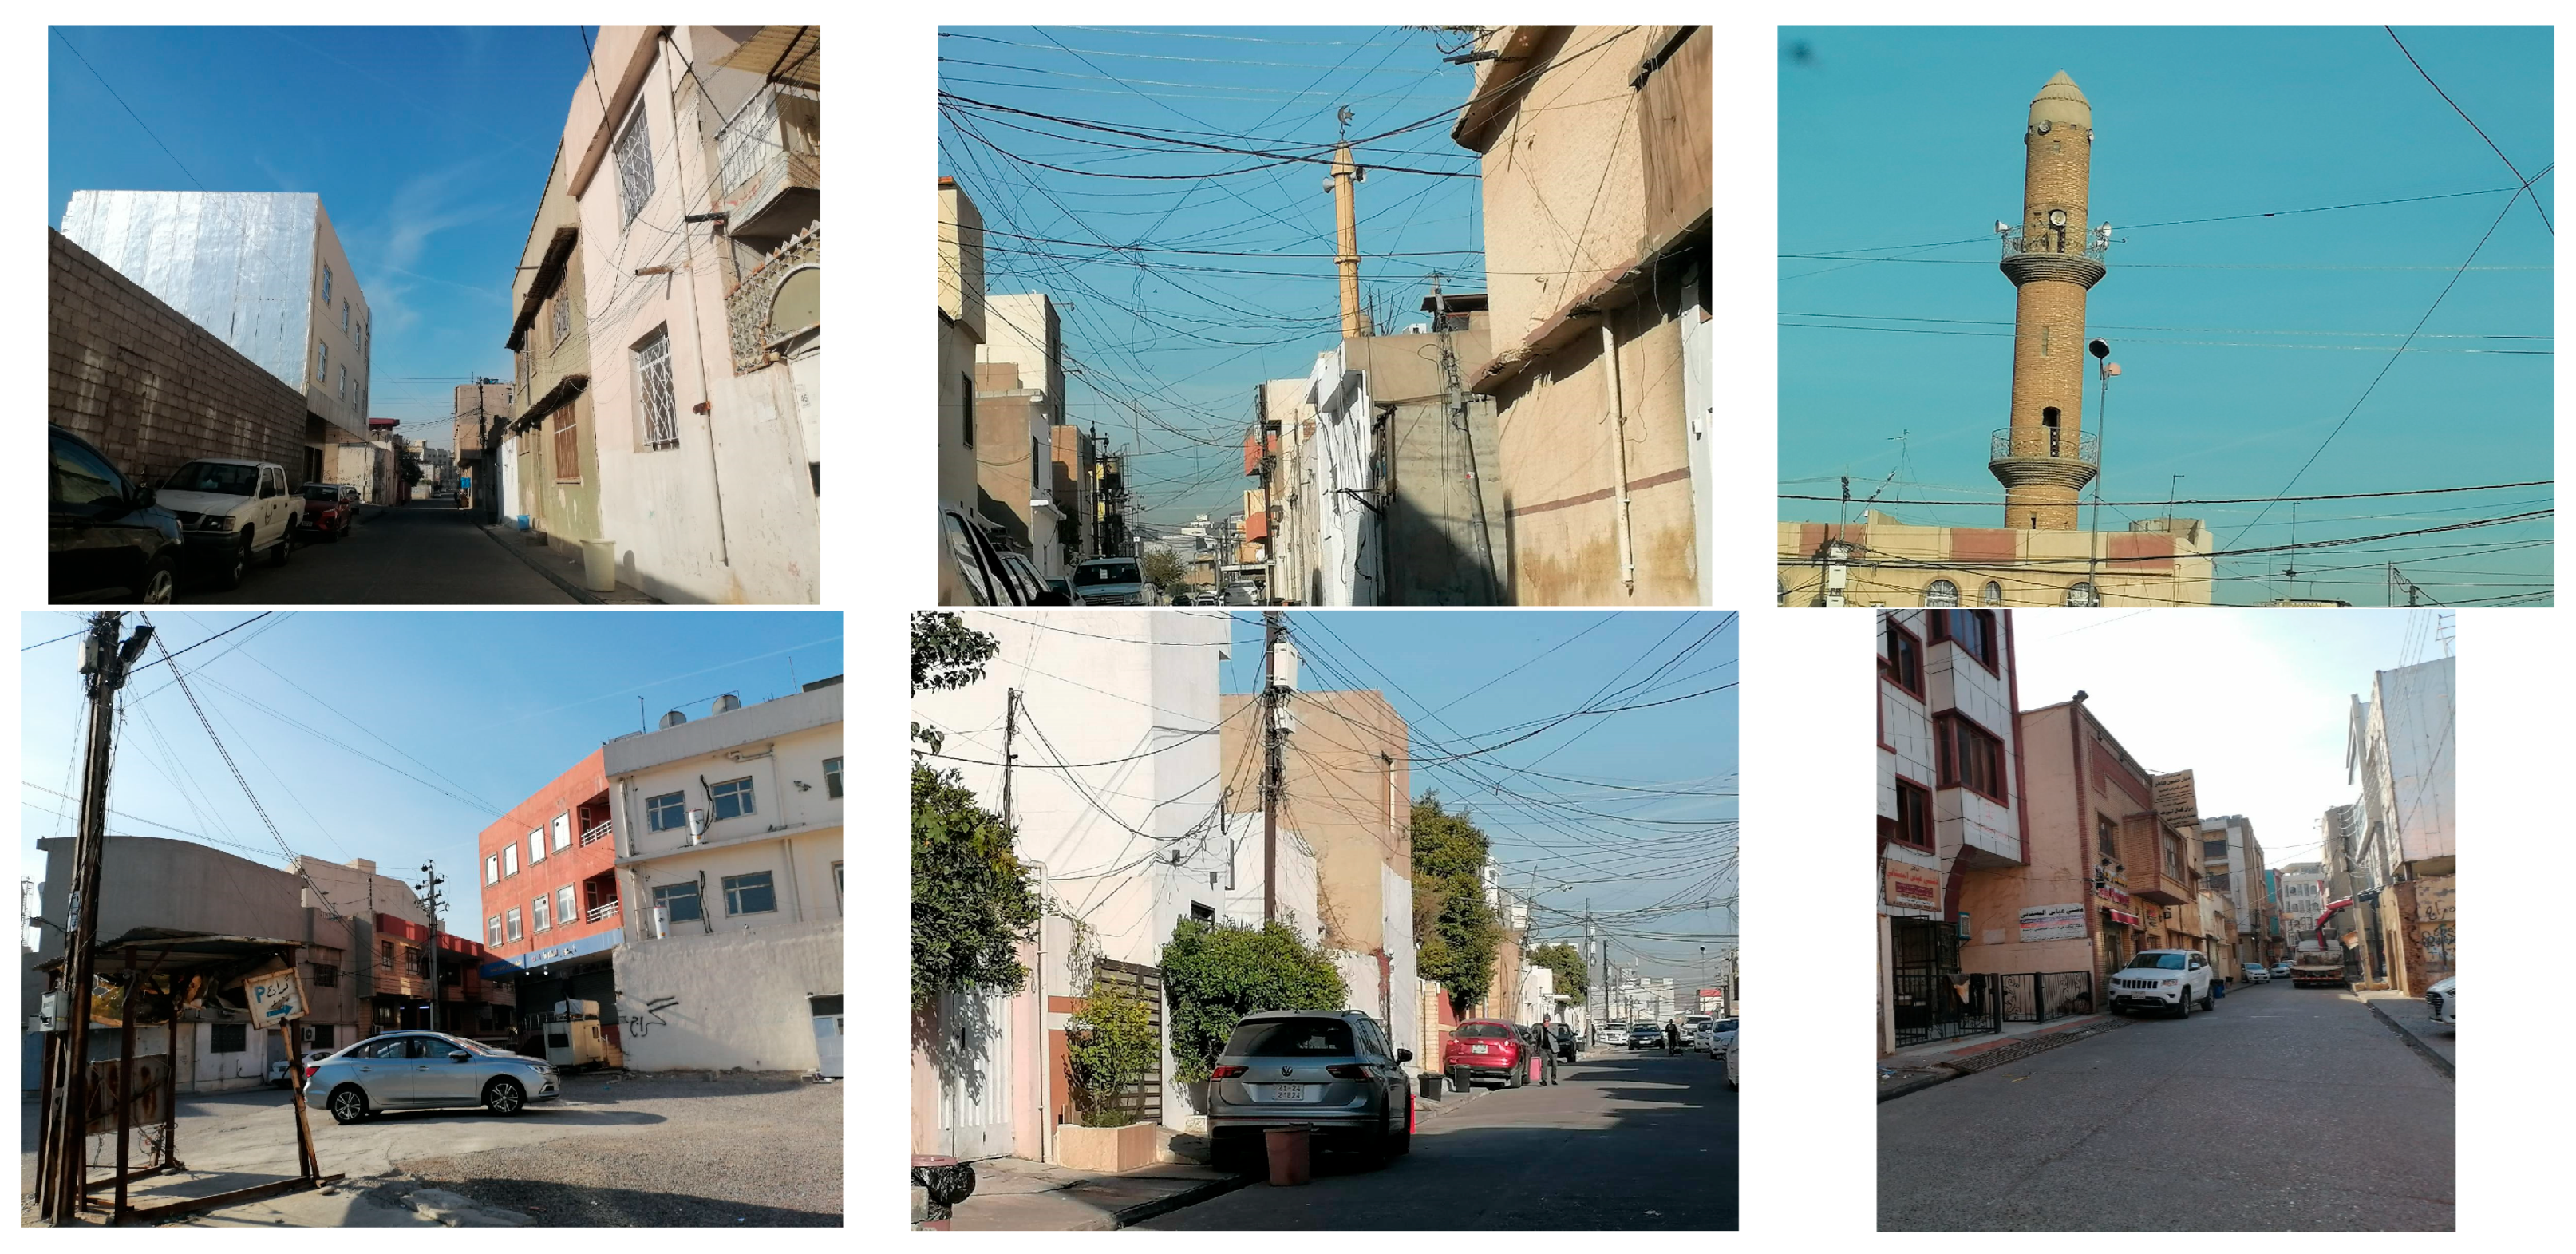
The selected zones recommended by the “Buffer Zone Committee” and the HCECR are as shown in the Erbil City Plan, represented by “Consolidation Area—CO1, CO2, CO3, and CO4” (Figure 8, Figure 9, Figure 10 and Figure 11), due to the following reasons:
-
The areas surrounding Erbil Citadel are conservation areas, and some have been appropriately reused as pre-existing buildings with very minor additions to very narrow streets, most of which are for pedestrians only and cannot withstand demolition, removal, significant additions, or changes.
-
There was a suggestion for plans for electric trams around the Citadel only.
-
The suggested case study (Consolidation Area (CO)) has a capacity for possible future development, retrofitting, and implementing new technologies in building and planning.
-
Noise and visual pollution are prohibited in the Buffer Zone area. The entry of large, heavy-duty machinery, large warehouses, and industrial activities that generate increased traffic, resulting in air, environmental, and visual pollution, are prohibited.
-
The maximum permitted height in the Buffer Zone is only three stories, except for the principal axes, where four stories are allowed in a way that does not affect the level of visibility or obstruct the view of the Citadel.

3.4.5. Consolidation Areas (CO) in the Buffer Zone

The Consolidation Areas are characterized by low population density. They include a group of residential regions located in Al Minara, Al Mustawfi, and Khanqa. The consolidation of the area is achieved by completing the urban structure and maintaining a forward setback for all new investments, while preserving the existing plot size and introducing new high-density uses [51].
A field survey was conducted for the “Consolidation Area (CO)” in the “Buffer Zone” in collaboration with the Higher Committee for Erbil Citadel Revival (HCECR), including an assessment of the condition of the buildings. The results are presented in the following table (Figure 9, Figure 10 and Figure 11 and Table 8).

3.5. Space Syntax Analysis for the Buffer Zone

3.5.1. Space Syntax—DepthmapX

Space syntax is an analytical tool that can be used as a methodology to inform urban planning and design decisions by analyzing a city’s spatial layout. Understanding the relationships between spaces or physical environments and the people who use them can be helpful. This includes an analysis of the connectivity and accessibility of spaces, as well as their influence on movements and social interactions [52,53]. DepthmapX 0.8.0 is multi-platform software designed to facilitate the understanding of social dynamics in the built environment through various spatial network analyses. It can operate on a range of scales, from buildings to entire cities. The analysis’s goal is to identify variables that might be societally or experientially significant [52,54]. Alasdair Turner of the University of London developed the software system. It is used to perform a set of spatial analyses of urban areas and link them to specific relationships, such as interference. This aims to understand social processes within the built environment and compare them with indicators of social behavior [55,56]. The program’s most essential uses can be summarized as follows [55,56]:
  • Basic topological measurements (such as integration), which are significantly correlated with pedestrian and vehicle movement patterns.
  • Spatial behavior that is associated with the area.
  • Graphic representation (axial, convex, and visibility graphs).
  • Visibility analysis and visibility systems analysis for architectural and urban plans, i.e., visual integration, optical step depth, and step depth analysis for axial maps.

3.5.2. The Case Study Analysis Using Space Syntax

City planners can create surroundings that are more livable, ecological, and efficient by utilizing space syntax as a strategy to transform old cities into smart cities, thereby enhancing community engagement, transit, and public spaces. This methodology guides better urban planning and design choices for smart city projects by providing a framework to analyze and comprehend a city’s spatial structure, rather than simply transferring it. Space syntax can analyze the following [57,58].
  • Analyzing Existing Spatial Structure.
    • Connectivity and Accessibility: Space syntax determines the high- and low-accessibility streets by analyzing their connectivity. This optimizes traffic flow, helps determine the positions of public transport hubs, and supports the placement of electric vehicle charging stations. Low-accessibility areas may be a sign that public transportation connections or pedestrian infrastructure require upgrades.
    • Integration: Space syntax evaluates the integration between public spaces and the urban fabric, promoting social interaction. The analysis can direct upgrades to make these areas more aesthetically pleasing and accessible.
    • Determining Important Sites: Space syntax analyzes the key nodes and locations within the city. These might be possible locations for smart streetlights, sensor networks, or community centers.
  • Improving Urban Design and Resilient Infrastructure:
    • The spatial analysis helps to maximize the impact of smart city technologies, such as the placement of smart sensors in areas of high traffic to optimize traffic management and the location of smart infrastructure.
    • Space syntax helps in redesigning public spaces and streets to enhance connectivity and accessibility, creating places that are more bike-friendly and walkable. This promotes the sustainability goals of smart cities.
    • The analysis facilitates the planning of effective, sustainable public transportation routes and encourages the use of non-motorized transportation. This promotes the environmental goals of smart cities.

4. Results and Discussion

4.1. Space Syntax Analysis and Results

Data collection includes the Buffer Zone’s spatial data of street networks, layouts, and public spaces. A set of analytical tools was applied to the Buffer Zone to understand its spatial structure and the relationships between urban spaces. This will help determine how to implement smart technology strategies in the study area, taking into account both human and societal aspects. Network graph models have been established by analyzing the spatial data as follows.

4.1.1. Analyses of Local Integration Core and Global Integration Core

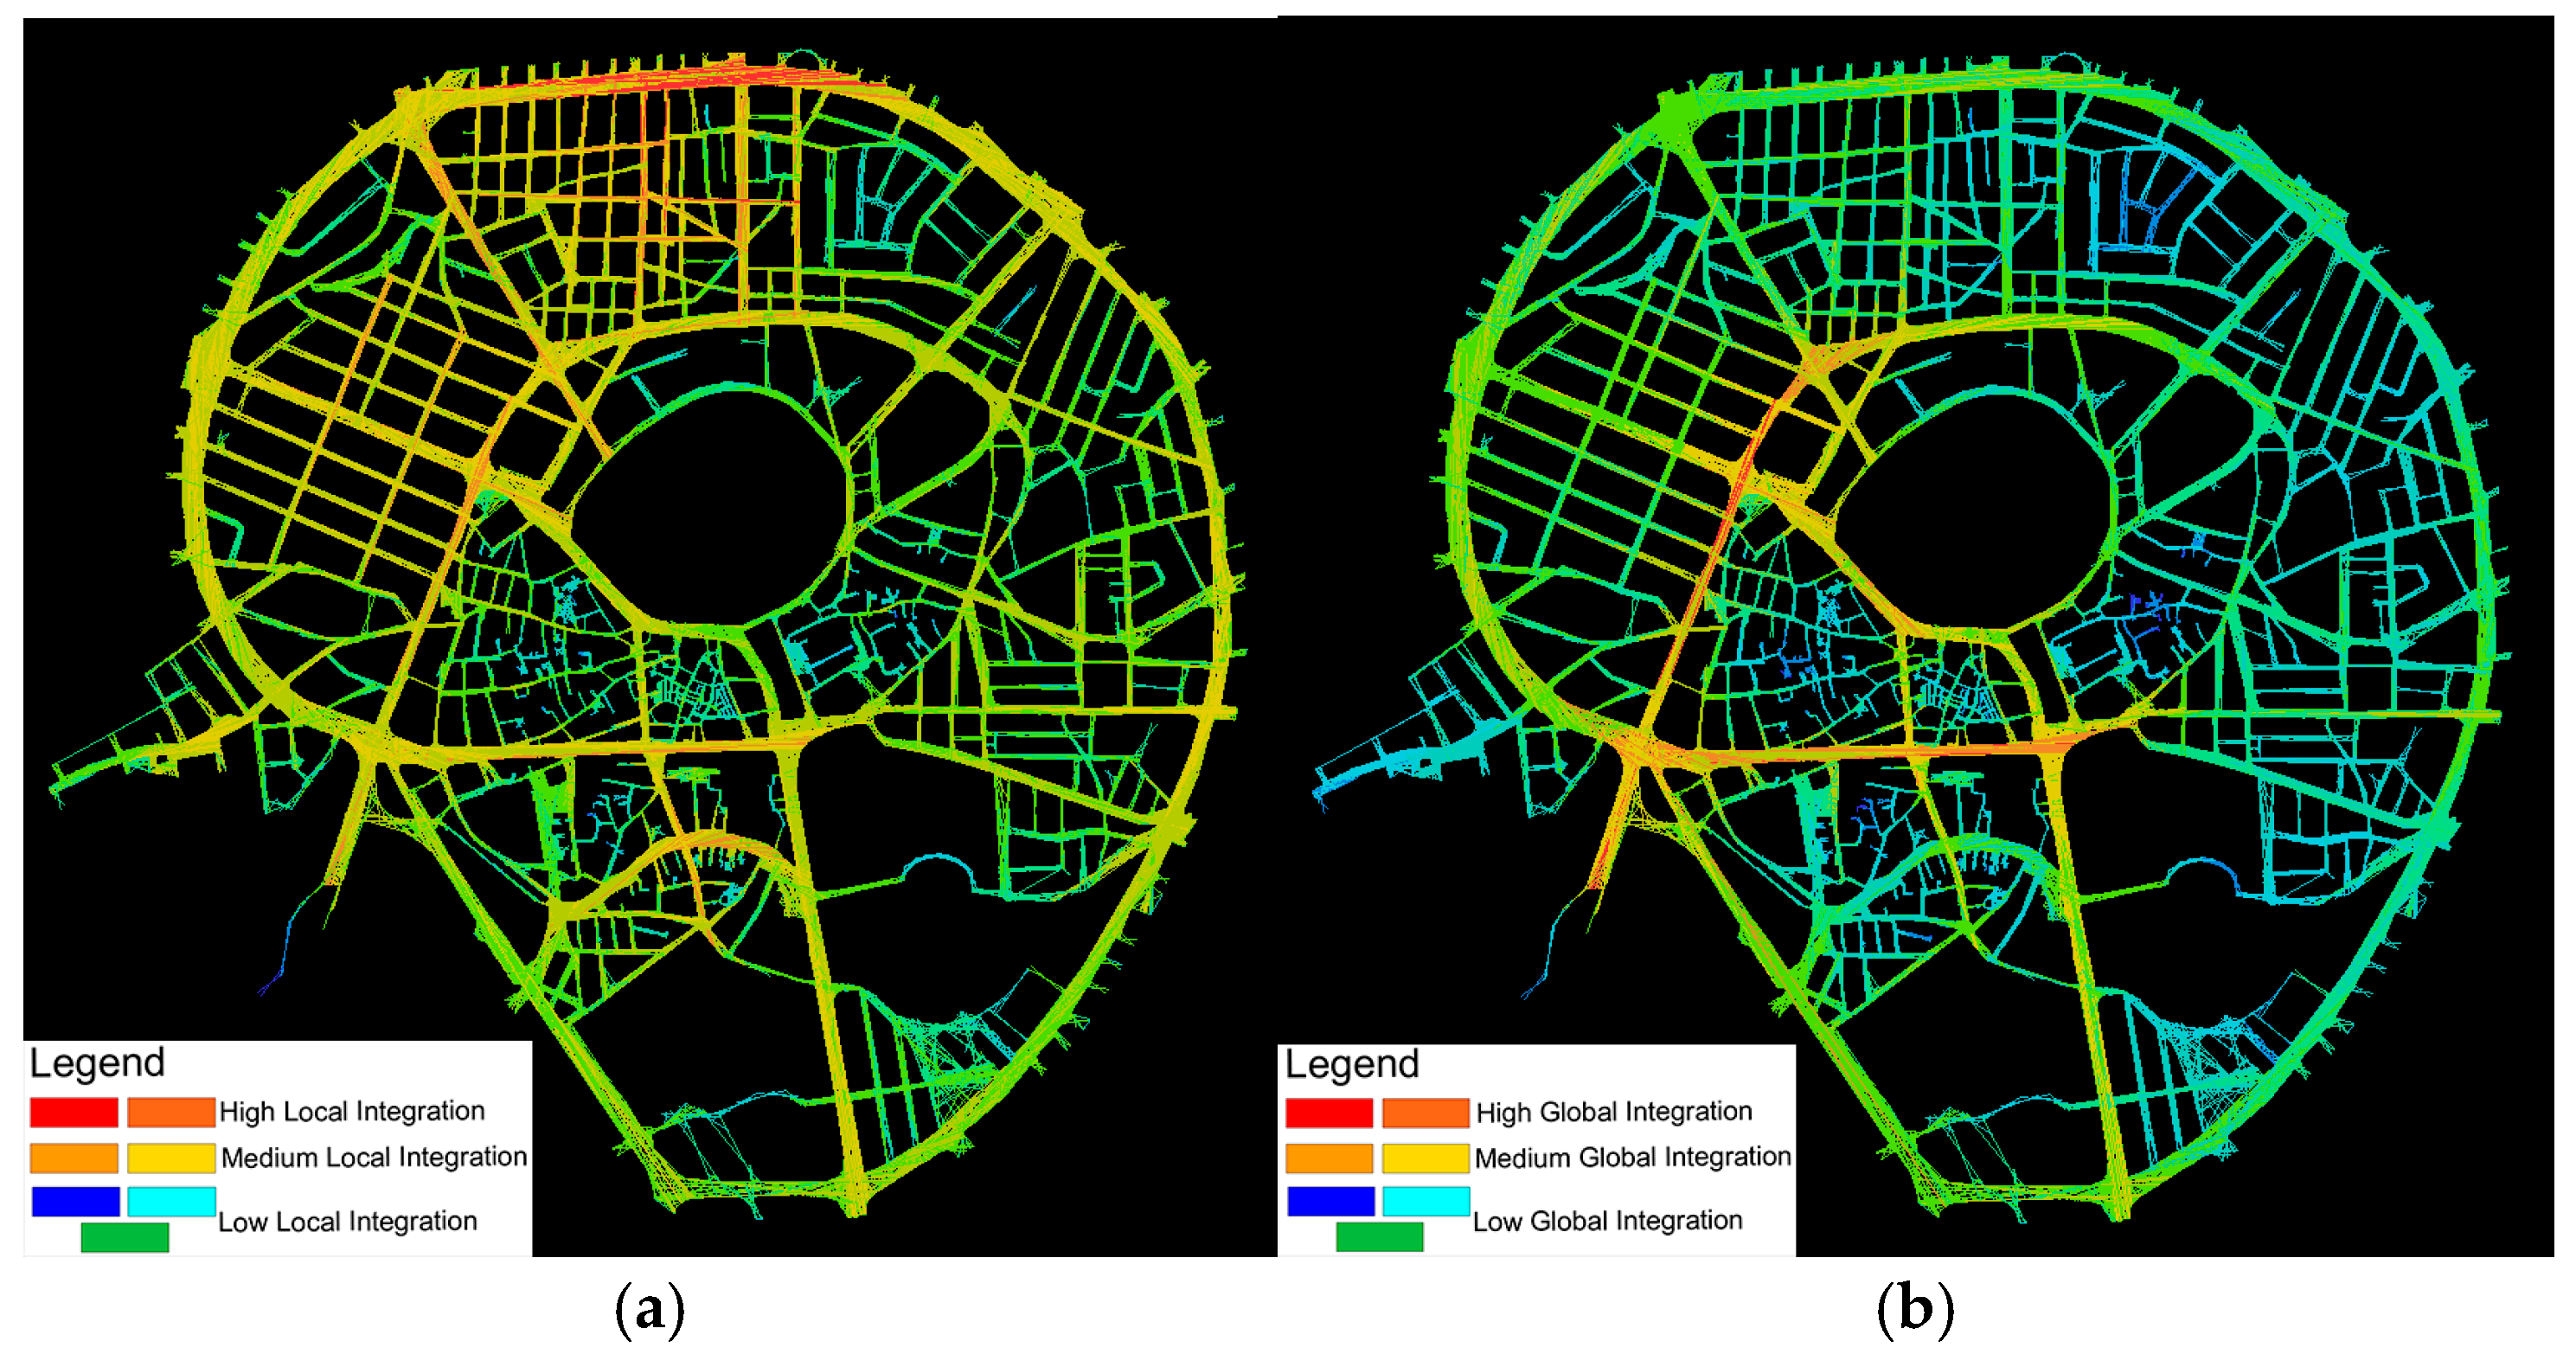
According to Hillier and Hanson (1984), integration is the normalized distance between any original space and every other space in a system. As a broad measure of relative asymmetry (or relative depth), it determines how close the original space is to every other space [59]. In other words, the Local Integration Core measures how easily accessible or interconnected space is within a network or the direct surroundings of each space, emphasizing places and streets that promote mobility or social interaction (the radius is three steps, R = 3). The Global Integration Core analysis measures the whole spatial network, as it assesses how each space connects to all other spaces and the degree of accessibility a route has to all other routes in the spatial system (the radius includes a longer distance, R = n). It may consist of transportation data, environmental factors, and knowledge technology (such as IoT sensors) [57], which is a sophisticated strategy designed to consider these interrelated factors, promoting a smarter, more sustainable urban environment, optimizing accessibility and mobility, and increasing the adaptability and resilience of the city.
The construction analysis of the integrated spatial networks reveals that the red and orange routes indicate a high value of integration, which suggests high accessibility, greater congestion, and more environmental hotspots (pollution hotspots correlate with higher spatial integration and noise level increases), as well as a strong relationship with the surrounding streets. On the contrary, lower integration indicates a low value of integration among segregated spaces, represented by the blue and green routes. This refers to reduced accessibility, lower congestion, and a weaker connection with other streets. The highly integrated spaces can serve as social public hubs, which may help determine the placement of smart public services, promote efficient smart mobility, enhance accessibility to services, encourage walkability and cycling to reduce emissions, optimize public transit, reduce traffic, and improve transit routes. In contrast, the less integrated spaces require connectivity enhancements, in addition to determining the most critical places for smart technological interventions (smart air pollution sensors, smart emergency systems, smart power grid, etc.) (Figure 12 and Table 9). Some suggested smart technological and human-centered solutions to enhance the Integration Core are as follows.
  • Involving user experience, perception, and cultural and historical context in space syntax analysis through social network analysis to analyze social behavior and interaction.
  • Using sensors and IoT devices to collect real-time data on pedestrian and mobility movements and patterns and environmental conditions to improve user experience and functionality.
  • Incorporating building information and social and spatial data and applying them in Geographic Information System (GIS) applications.
  • Using integrated digital tools to provide dynamic visualizations of mobility and pedestrian movement patterns.
  • Developing smart digital platforms and mobile applications to interact with users, designers, and urban planners to enhance public engagement for more human-centric solutions to meet users’ needs and preferences.
  • Integrating smart technology devices to measure accessibility, assess energy efficiency, analyze movement patterns, etc. to improve access to public services, reduce travel distances, and create more walkable environments.
  • Integrating wayfinding and navigation, using augmented virtual reality applications to provide space simulations, clarifying streets’ layouts, and creating legible spatial configurations.
  • Implementing smart infrastructure, such as adaptive smart traffic systems and dynamic signage, to improve traffic flow.

4.1.2. Analysis of Local Connectivity Core and Global Connectivity Core

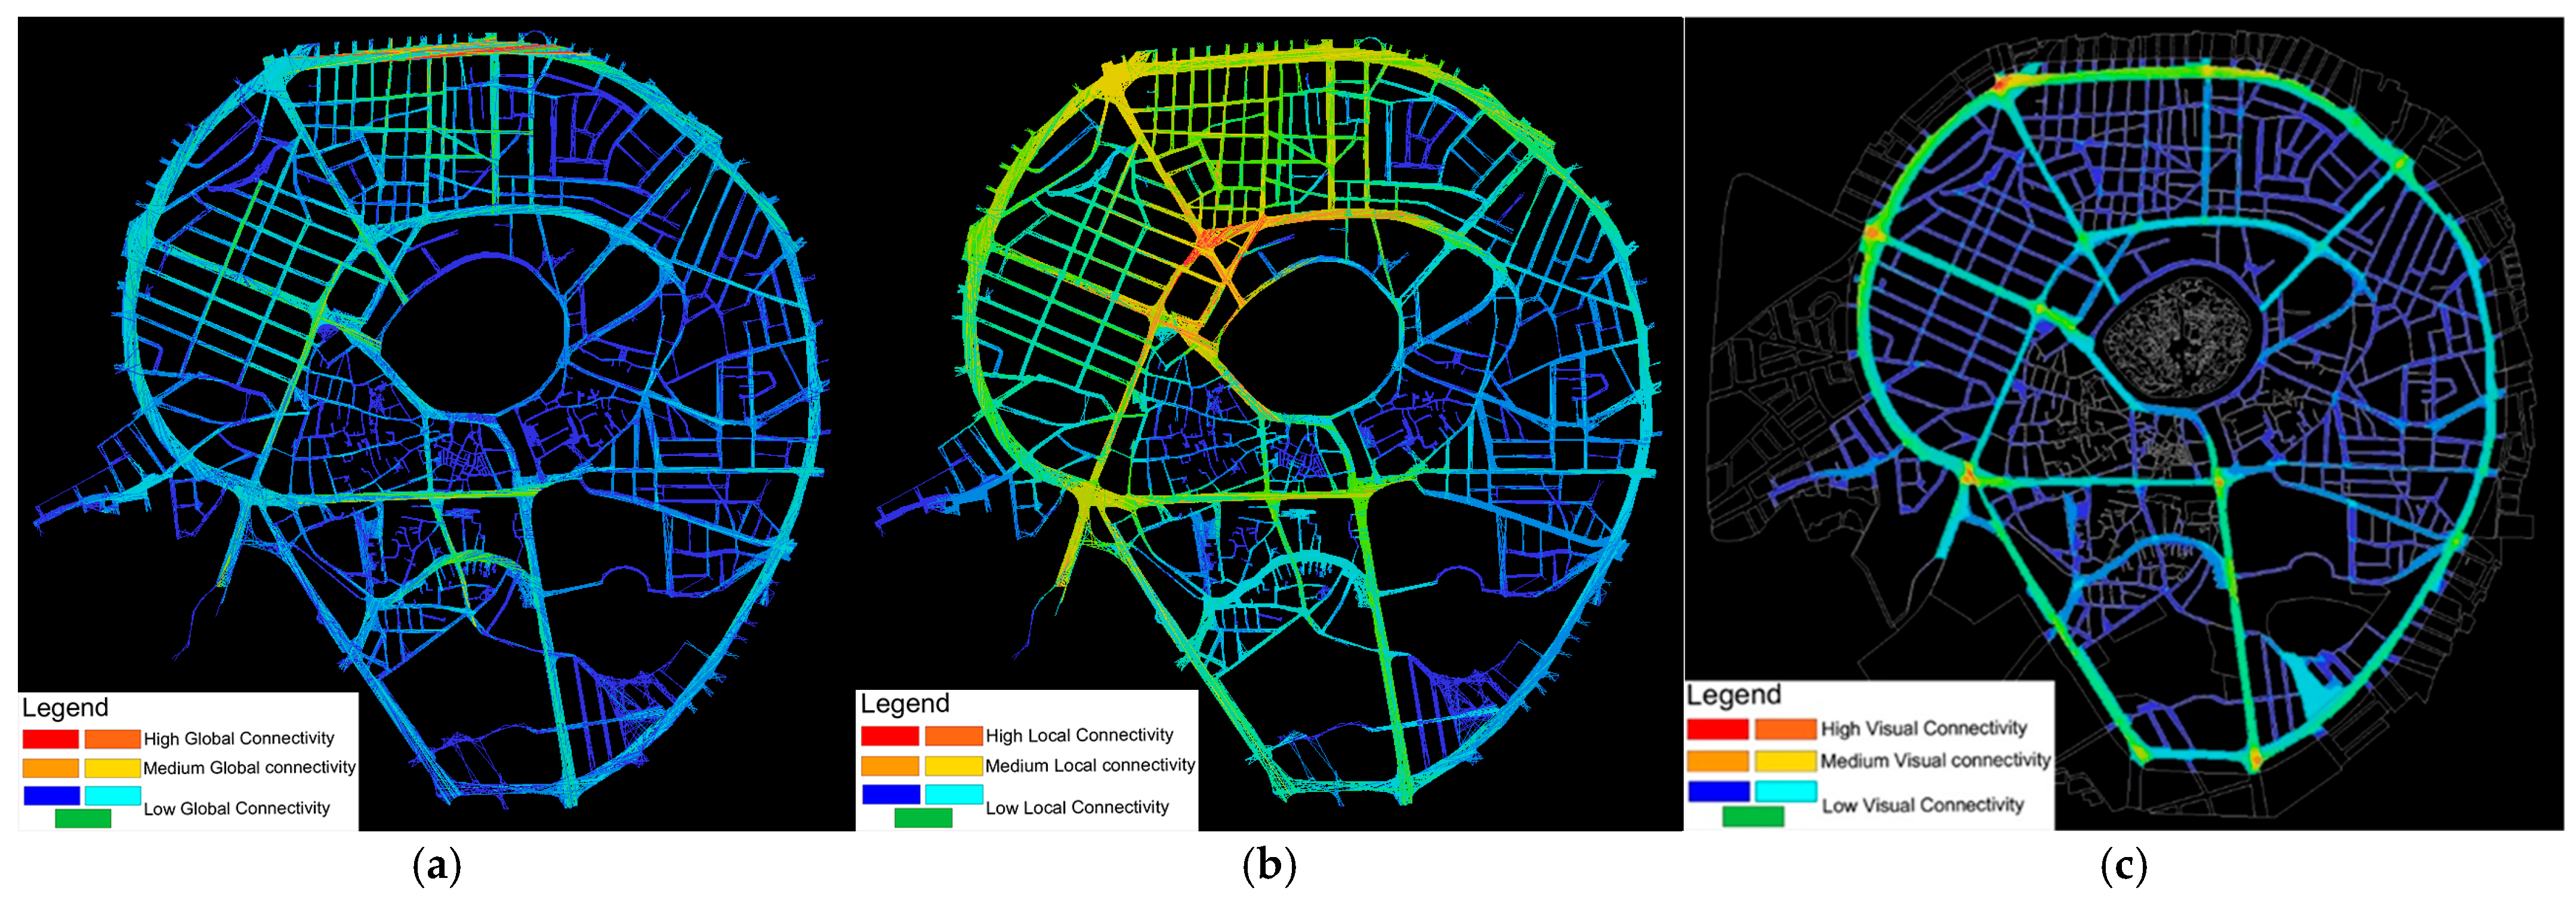
Connectivity measures the number of spaces that can be reached directly from a starting point. Connectivity analysis is beneficial in understanding and enhancing pedestrian flows and transit networks. This analysis can improve and optimize mobility by analyzing vehicle and pedestrian movement, making roads more efficient. As a result, the improved connections can decrease travel distances and energy consumption, while increasing social public spaces, human safety, and surveillance. Comprehending spatial connectivity facilitates the layout of public areas and commercial activity locations, thereby improving accessibility and social cohesion. The visual connectivity analysis evaluates the visibility of every point in the study area, which can affect pedestrians’ behavior [57,59,60].
As the street connects with a high number of other streets and has direct connections with them, this indicates that it has a high connectivity value. In contrast, fewer connections with other axes refer to a low connectivity value. The analysis reveals that the red and orange points indicate high connectivity, which is evident in the upper part of 30 m Street that surrounds the Buffer Zone, and visual connectivity is also apparent at intersection nodes of main streets. The blue and green streets refer to the low connectivity of the Buffer Zone and significant isolation from the surrounding spaces. The high-connectivity routes and nodes should be prioritized for smart technology implementation (Figure 13 and Table 9). Some suggested smart technological and human-centered solutions to enhance the Connectivity Core are as follows.
-
Implementing smart technology and data-driven analysis, such as IoT devices, smart monitoring, data analytics, and smart sensors, to monitor movement patterns, improve accessibility, and improve urban management and connectivity.
-
Using smart Wayfinding Systems, such as augmented reality, smartphone apps, and digital signs, to offer real-time navigation guidance based on users’ behavior and preferences.
-
Integrating physical smart digital devices to collect movement information and measure users’ interactions for connectivity improvements and to navigate people’s flows.
-
Integrating smart lighting and adaptable environmental control devices.
-
Using augmented reality and virtual reality to facilitate route connectivity.
-
Engaging people in the design process to fulfill their needs and encourage interactions by designing spaces that foster easy movement.
-
Encouraging human interactions by developing open spaces and public nodes.
-
Developing collaborative platforms to facilitate meetings to share insights and suggestions to enhance connectivity.

4.1.3. Analysis of Axial Control and Controllability Core

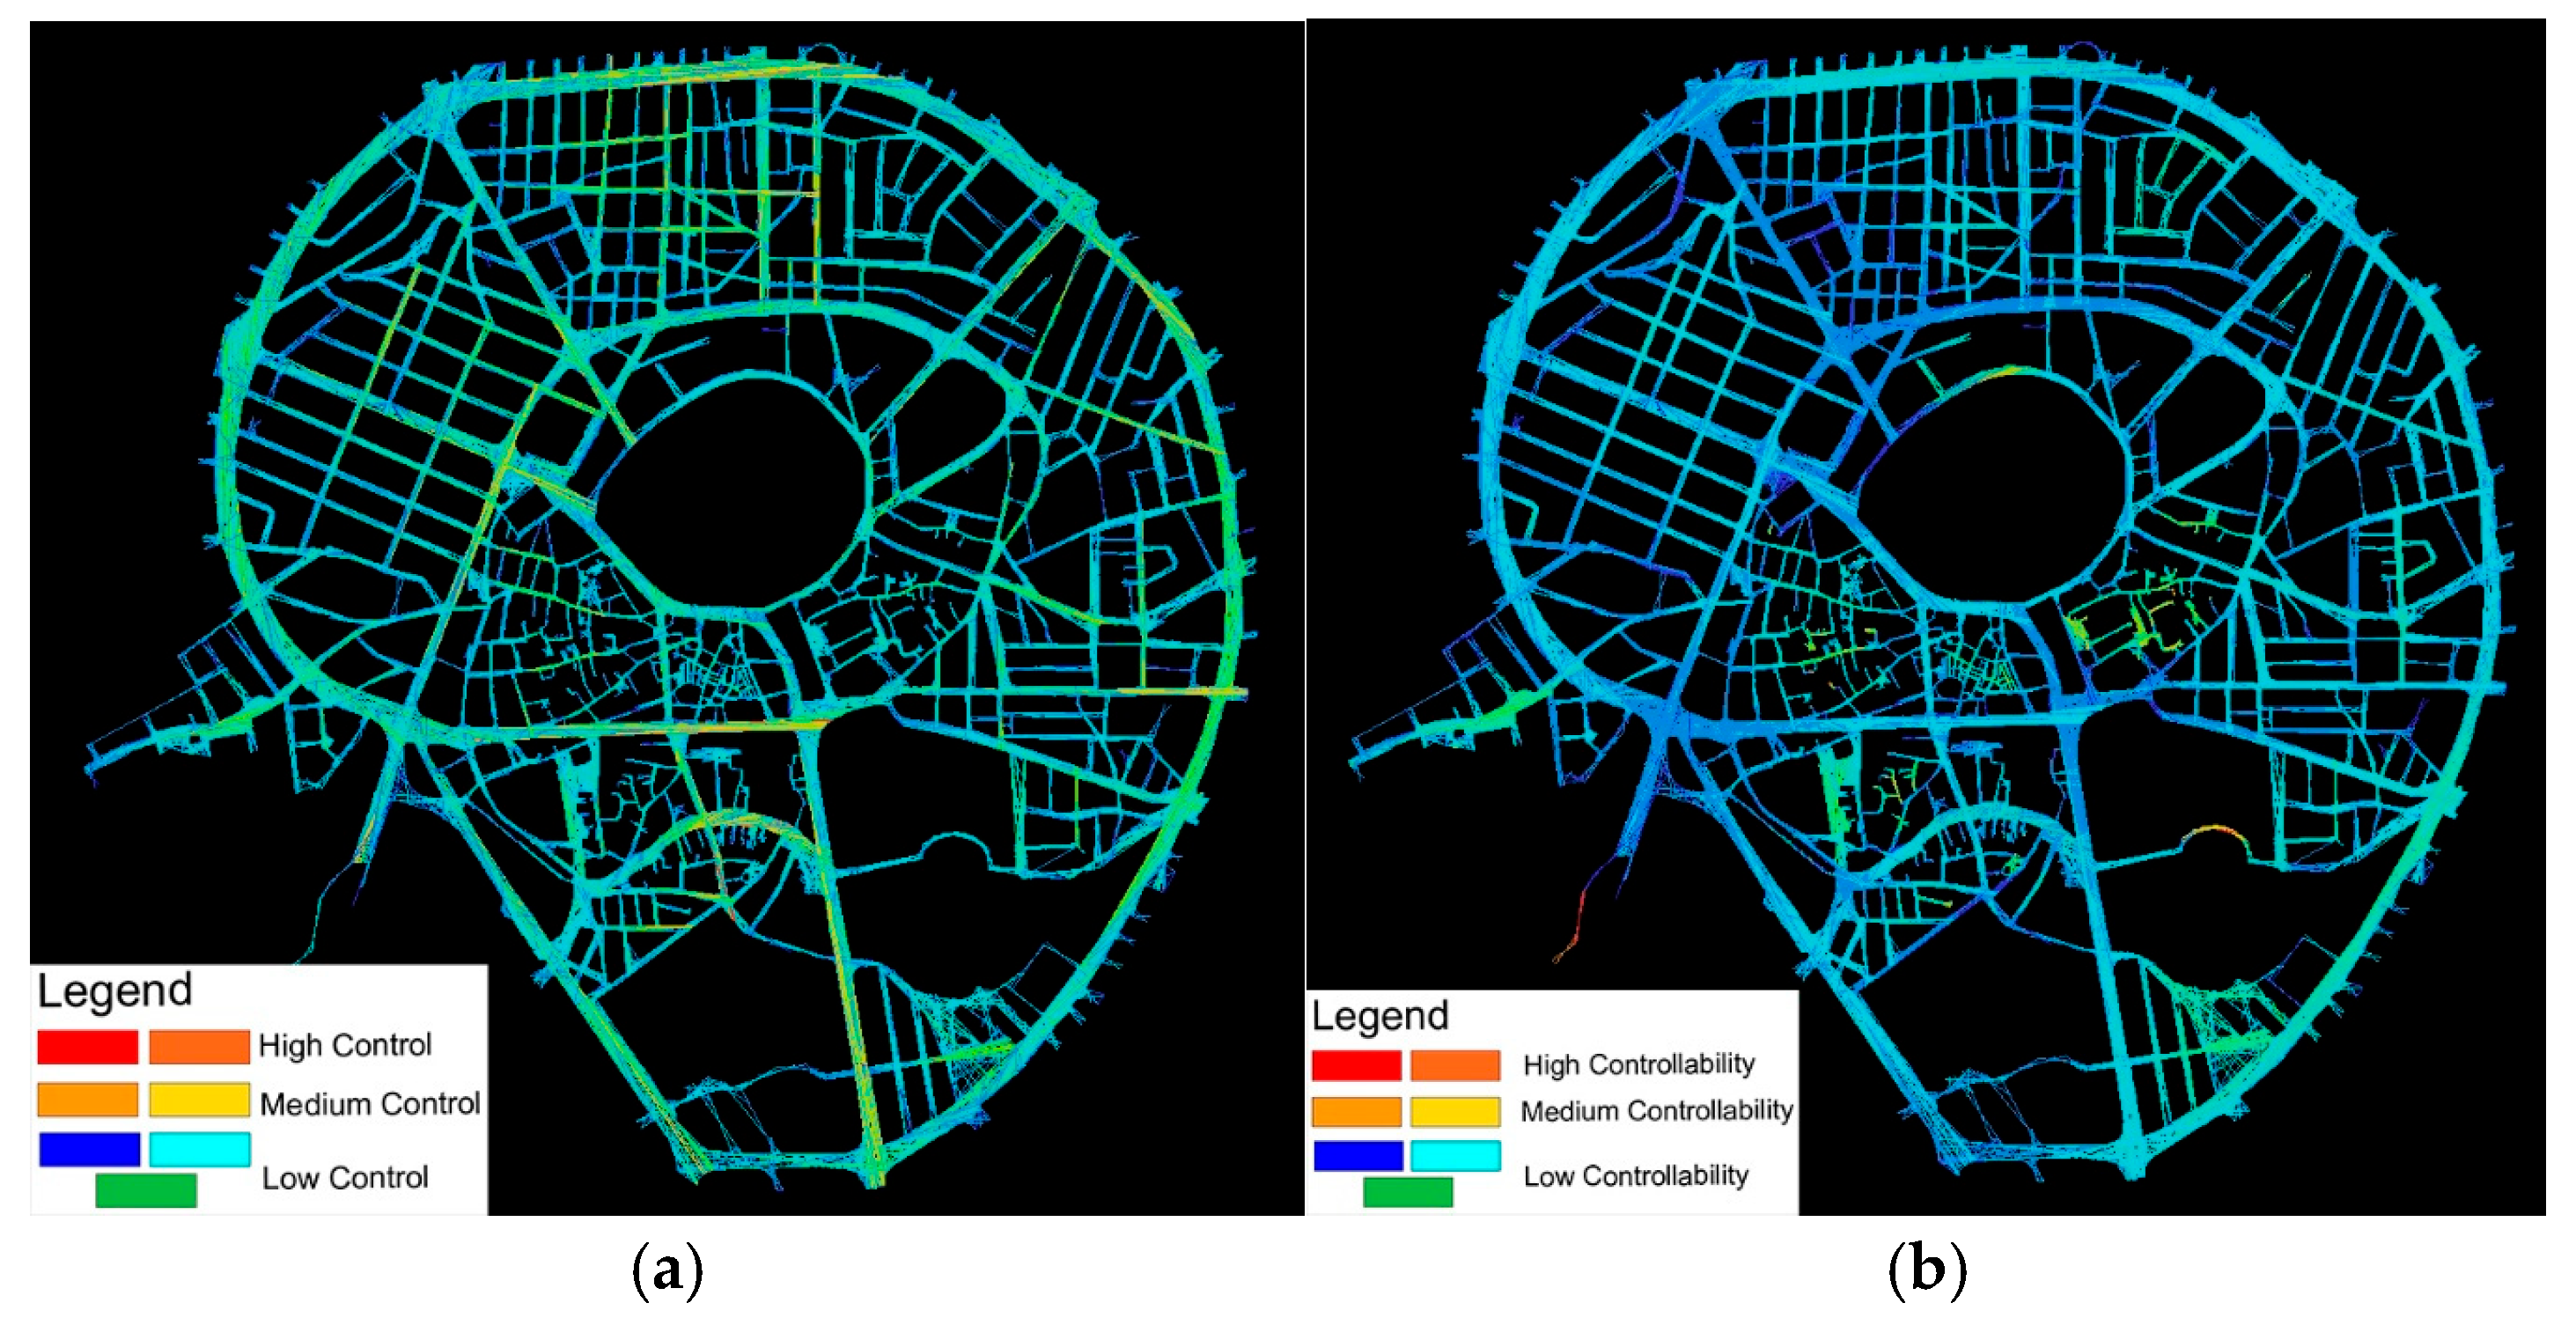
Control refers to the ability of a space to influence neighboring spaces, i.e., how easily a person can transition from one space to a neighboring space. The higher the axial control, the more dominant the space is over the adjacent spaces [59]. Thus, the control and controllability analyses evaluate how a space is affected by or influences other spaces nearby and controls the accessibility and movement through the urban fabric. This is essential to comprehending how spaces interact and are accessible in urban spaces. Spaces with high control facilitate movement more easily for people, while spaces with low control may make movement more challenging. The analysis can manage the traffic flow by contributing to more efficient transportation systems, path optimization, and accessibility enhancement, and assisting in the identification of possible congestion and the efficient management of both pedestrian and vehicular traffic [57,59]. Based on space control results, urban planners can decide where to implement technological and infrastructural development. Furthermore, combining this analysis with technology improves citizen experience and urban management. High-control areas can be monitored, and urban layouts can be modified to ensure accessibility and safety for people.
The results of this analysis indicate that blue or green colors identify areas of low control value (of which there are the most). These spaces have less influence on people’s movement or access to other areas of the space. Meanwhile, red, orange, or yellow may indicate a higher level of control, which is low in the Buffer zone of Erbil Citadel due to the multi-accessed routes (Figure 14 and Table 9). Some suggested smart technological and human-centered solutions to enhance the control core are as follows.
  • Urban flow in the Buffer Zone can be optimized by increasing controllability spaces, such as embedding smart technology and infrastructure, smart transit hubs, reducing congestion by developing smart transportation systems, fostering social interaction through central public spaces, and enhancing control nodes that can access resources and services equitably.
  • Integration with IoT devices that can provide data updates on movement flows and patterns, predict them, and enable real-time monitoring to adjust public traffic.
  • Using smart cameras to track and analyze spatial movement.
  • Using smart digital signage, smart lighting, and climate control devices.
  • Using smart automated systems for space security.
  • Smart predictive analytics for quick emergency response.
  • User feedback is continuously collected to improve spatial control features.

4.1.4. Analysis of Local Choice Core and Global Choice Core

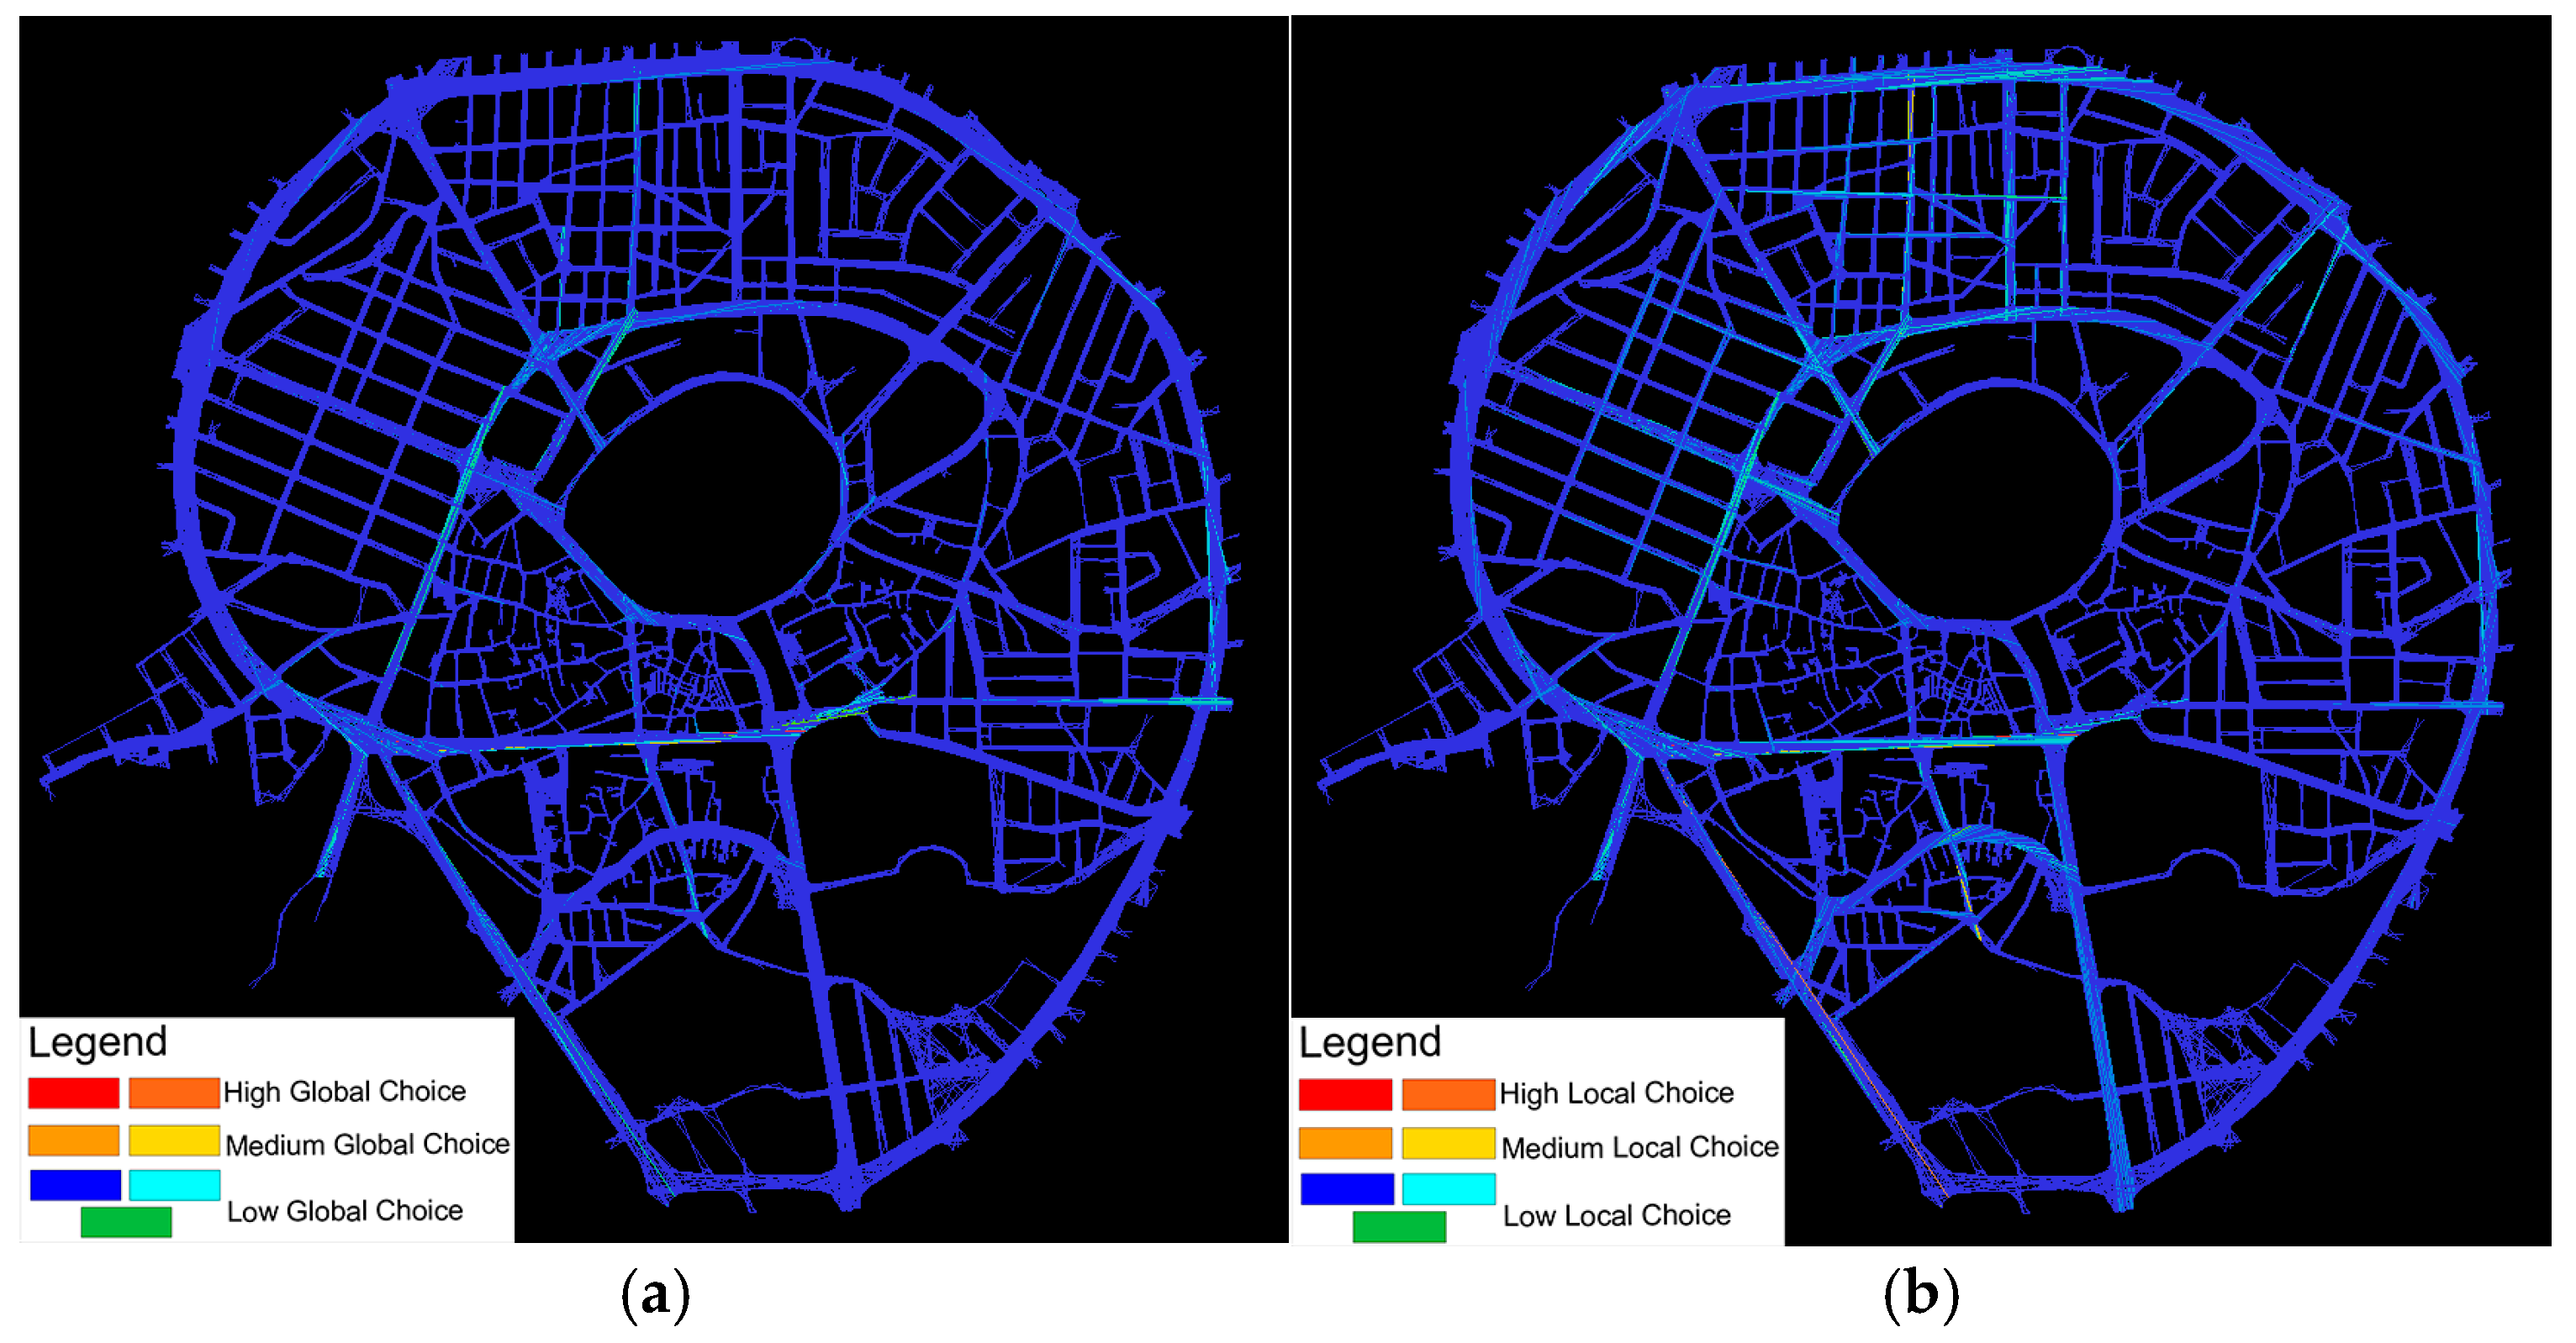
The choice metric calculates the probability that a street segment or axial line will be traversed on all of the shortest paths between any two locations in the system or with a specified radius from them. The choice analysis measures the likelihood of a space being traversed in optimal paths across the network. It identifies the preferred highly accessible routes for vehicles and pedestrians [57,60,61]. The most important areas can be identified using red or orange colors. Red indicates a high value for spaces or roads and significant importance and effectiveness in population movement or connectivity. Orange and yellow indicate average values, while blue and green indicate low values.
The results of the choice analysis in the Buffer Zone indicate low choice values due to the presence of multiple organic routes. Thus, to increase value, focus should be placed on facilitating access to various spaces within the system, which will expand the choices available based on user preferences (Figure 15 and Table 9). Space syntax can predict how these changes may affect accessibility and movement patterns by increasing the variety of spatial choices. Some suggested smart technological and human-centered solutions are as follows:
-
Implementing smart technology (IoT) devices and sensors into the study area to direct users to the preferred route and to provide real-time data-driven technology to suggest multiple access routes and alternative routes in case of congestion.
-
Using digital signage and wayfinding applications to guide pedestrians to less congested routes.
-
Improving connectivity using clear routes and digital directions.
-
Improving digital traffic signals to make the chosen options more attractive.
-
Providing clear digital information about roads, such as road names, distances, and directions.
-
Promoting mixed-use facilities around highly accessible nodes and making spaces more functional and attractive by integrating IoT environmental controls (noise, temperature, and smart lighting).
-
Virtual reality (VR) can be used to enhance pedestrian engagement.

4.1.5. Analysis of Total Depth and Mean Depth

The Total Depth and Mean Depth analyses are methods for evaluating the connectedness, integration, and accessibility of spaces. Total Depth is the sum of depths from any node or route line to all other routes; it calculates the smallest number of connections or steps required to travel from one space to every other space. Mean Depth measures the average depth from one space to all others, calculating the average number of steps from a particular space to different spaces and indicating how integrated or isolated a space is from the rest of the city [57,59]. Total depth analysis in space syntax provides valuable insights for designing urban environments that are more intelligent, effective, and equitable.
Through an understanding of the patterns of connectedness, urban and city planners can create interventions that promote sustainable development and enhance the standard of living. They may create more cohesive, effective, and resilient urban landscapes that improve mobility, accessibility, and overall quality of life by evaluating the accessibility of each area in relation to the network. These analyses help urban planners and experts identify spaces with higher accessibility and those that are segregated, guiding them to improve connectivity and accessibility, promote efficient transportation and walkability, increase connectivity to foster social interaction in public areas, and optimize service and infrastructure placement to ensure accessibility and equitable access.
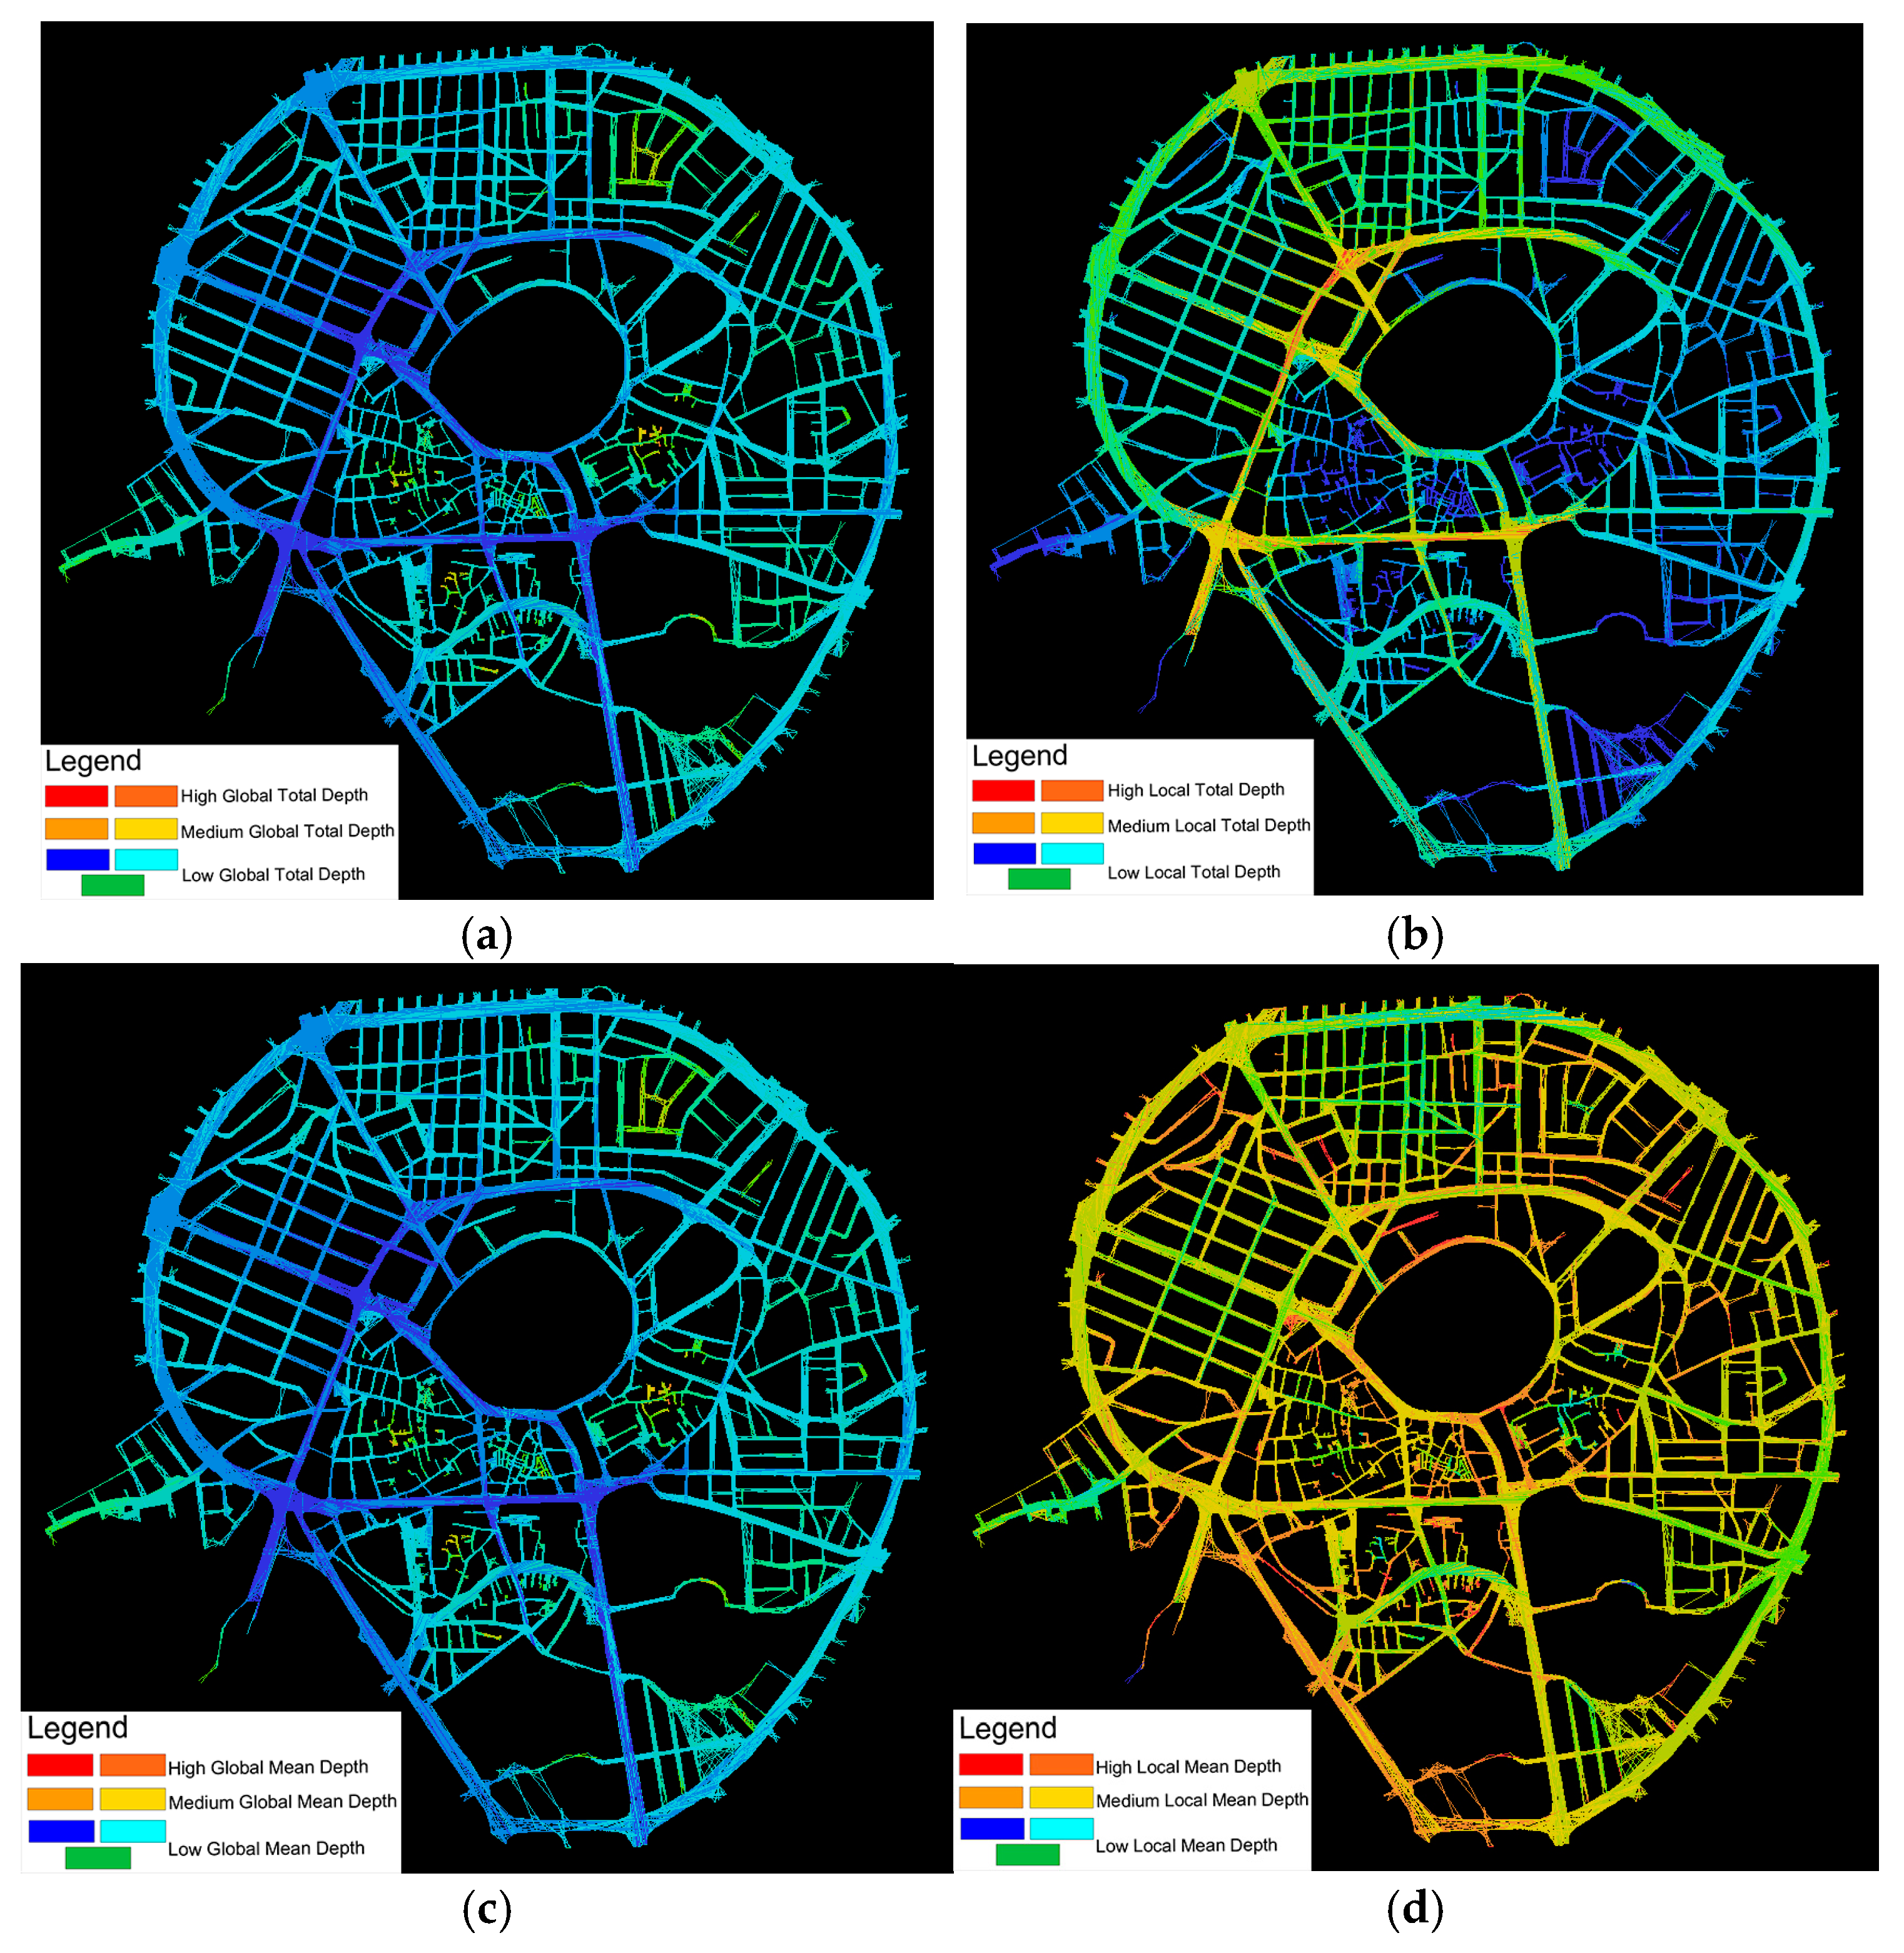
The results show that the red and orange colors refer to high Total Depth/Mean Depth (less integrated and deep isolated spaces). In contrast, the blue and green colors refer to low Total Depth/Mean Depth (shallow spaces, which are highly integrated and easily accessible, such as high traffic). The Buffer Zone’s Total Depth and Mean Depth analyses indicate low Total Depth/Mean Depth, which suggests high accessibility and strong integration with the surrounding spaces (Figure 16 and Table 9). Some suggested smart technological and human-centered solutions to enhance the Total Depth and Mean Depth are as follows.
  • Supporting smart mobility by indicating routes that support sustainable options, like walking and cycling, to decrease emissions.
  • Creating routes that promote shorter travel durations and quick emergency response time by lowering average depths.
  • Integrating smart (IoT) devices, traffic sensors, smart monitors, and smart real-time data into the spatial system to measure space performance and track movement patterns.
  • Promoting social cohesion by adapting pedestrian-friendly zones.
  • Incorporate environmental controls, smart lighting, and signage that changes according to user activity.
  • Creating interactive spaces that react to humans’ movements and presence to direct movement effectively.
  • Involving smart human solutions and modifications to meet their needs through participation, feedback collection, and public platforms, and encouraging collaboration between people and urban planners.
  • Promoting smart navigation to enhance ease of accessibility.
  • Using intelligent simulation through augmented and virtual reality to measure space usage and movement flows and detect areas that need improvement.

4.2. The Questionnaire Form—Analysis and Results

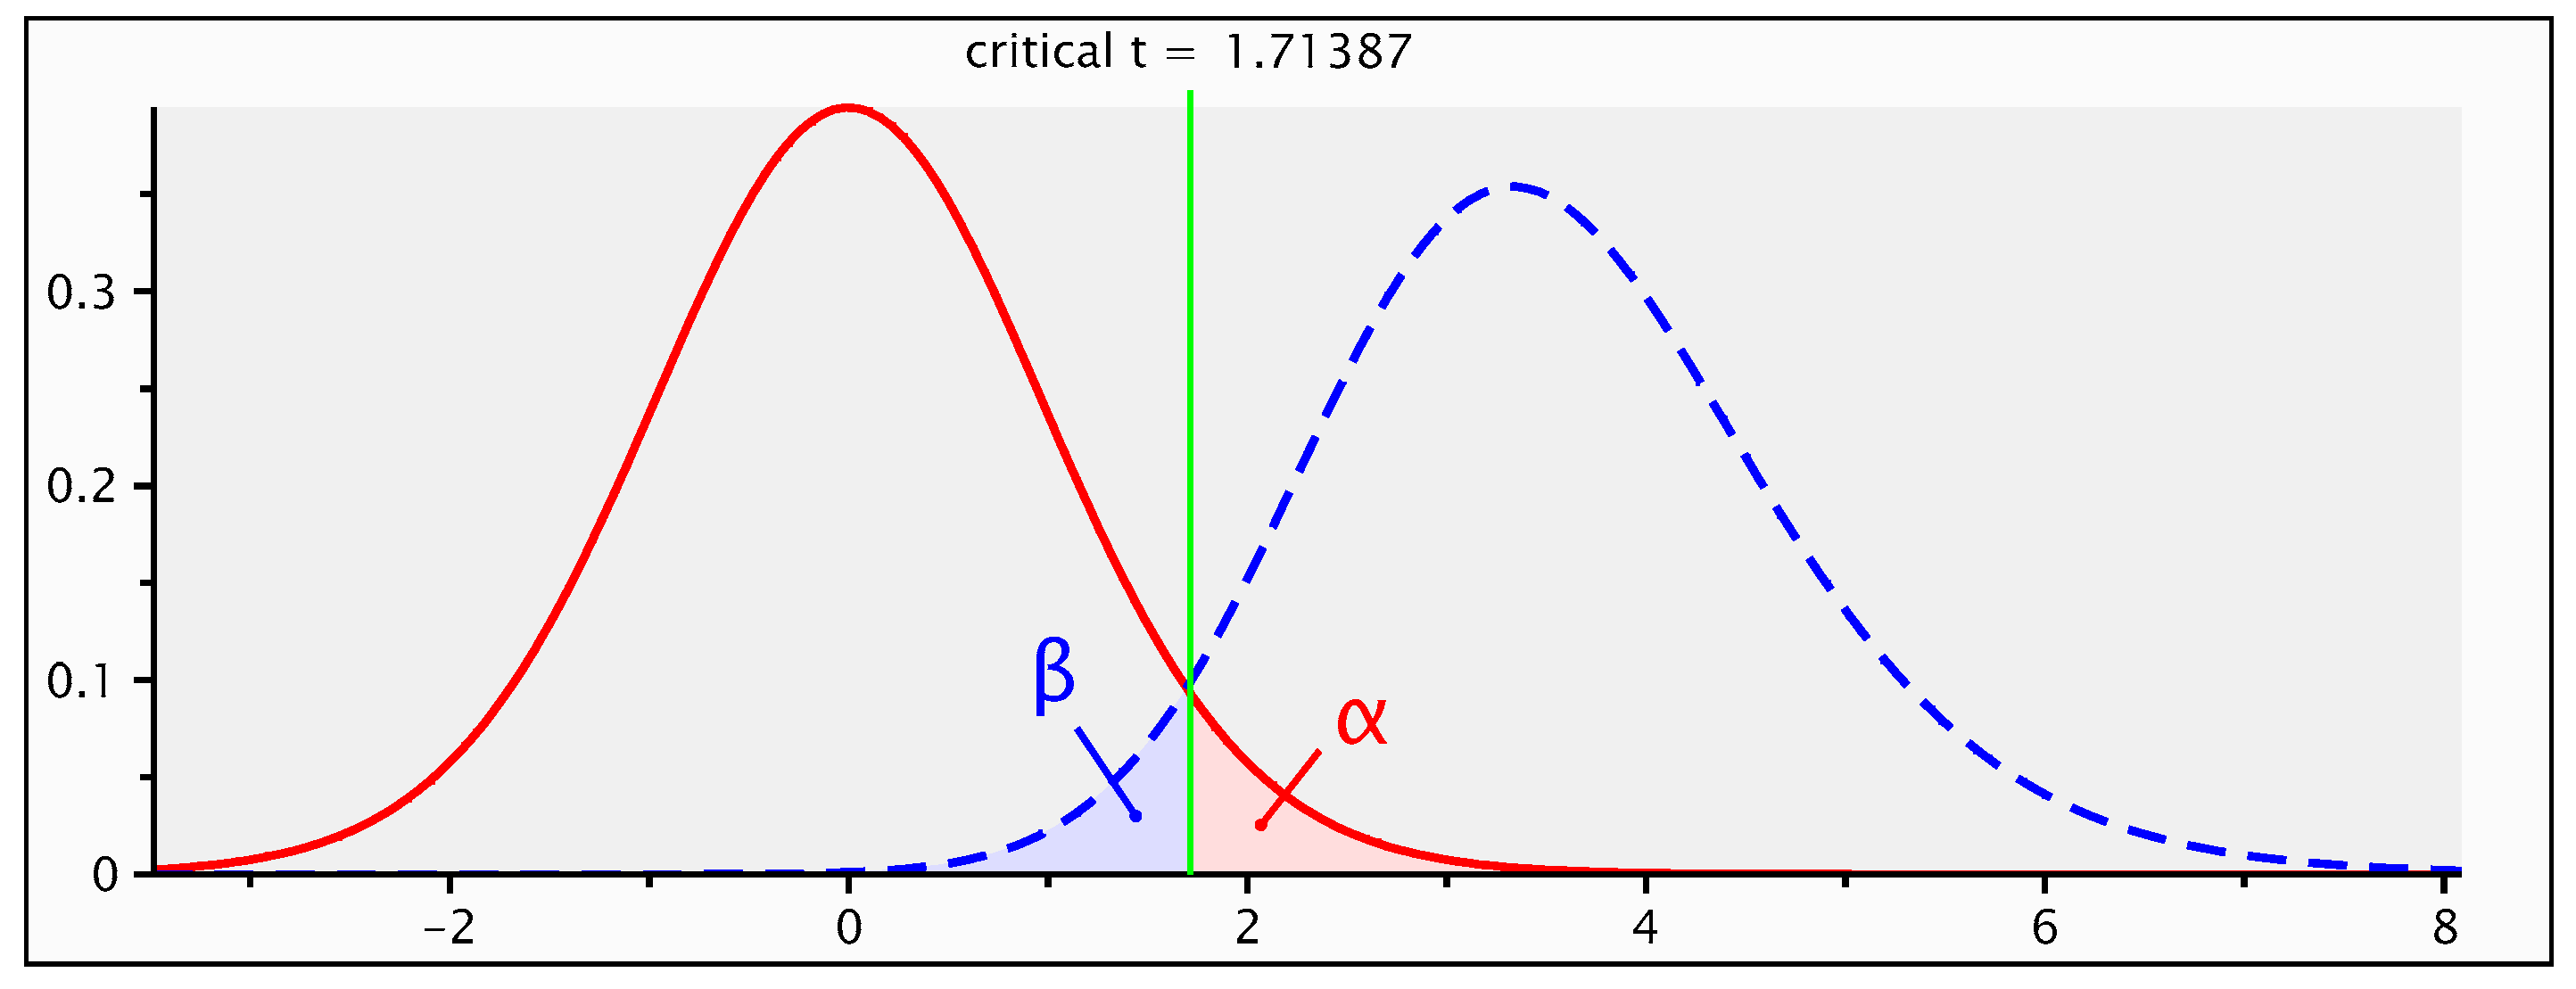
A questionnaire form was distributed among experts, engineers, university lecturers, and professors residing in Erbil City to assess their perceptions of smart cities, the opportunities and challenges of implementing smart technology strategies in old cities, their insights into the human-centered approach, and the role of people and community engagement. The required sample size was computed using the G.power Test, which concluded a number between 23 and 24 [see Appendix B]. In total, 25 questionnaire forms were distributed, and 20 were returned with answers.
Microsoft Office Excel was used in the typesetting of answer tables with results charts. At the same time, SPSS software and Microsoft Excel were used to analyze questionnaire results, as the questions included in the form varied between nominal, multi-response, and scale.

4.2.1. Nominal Analysis

  • Perceptions and Opportunities for Smart Technology Implementation
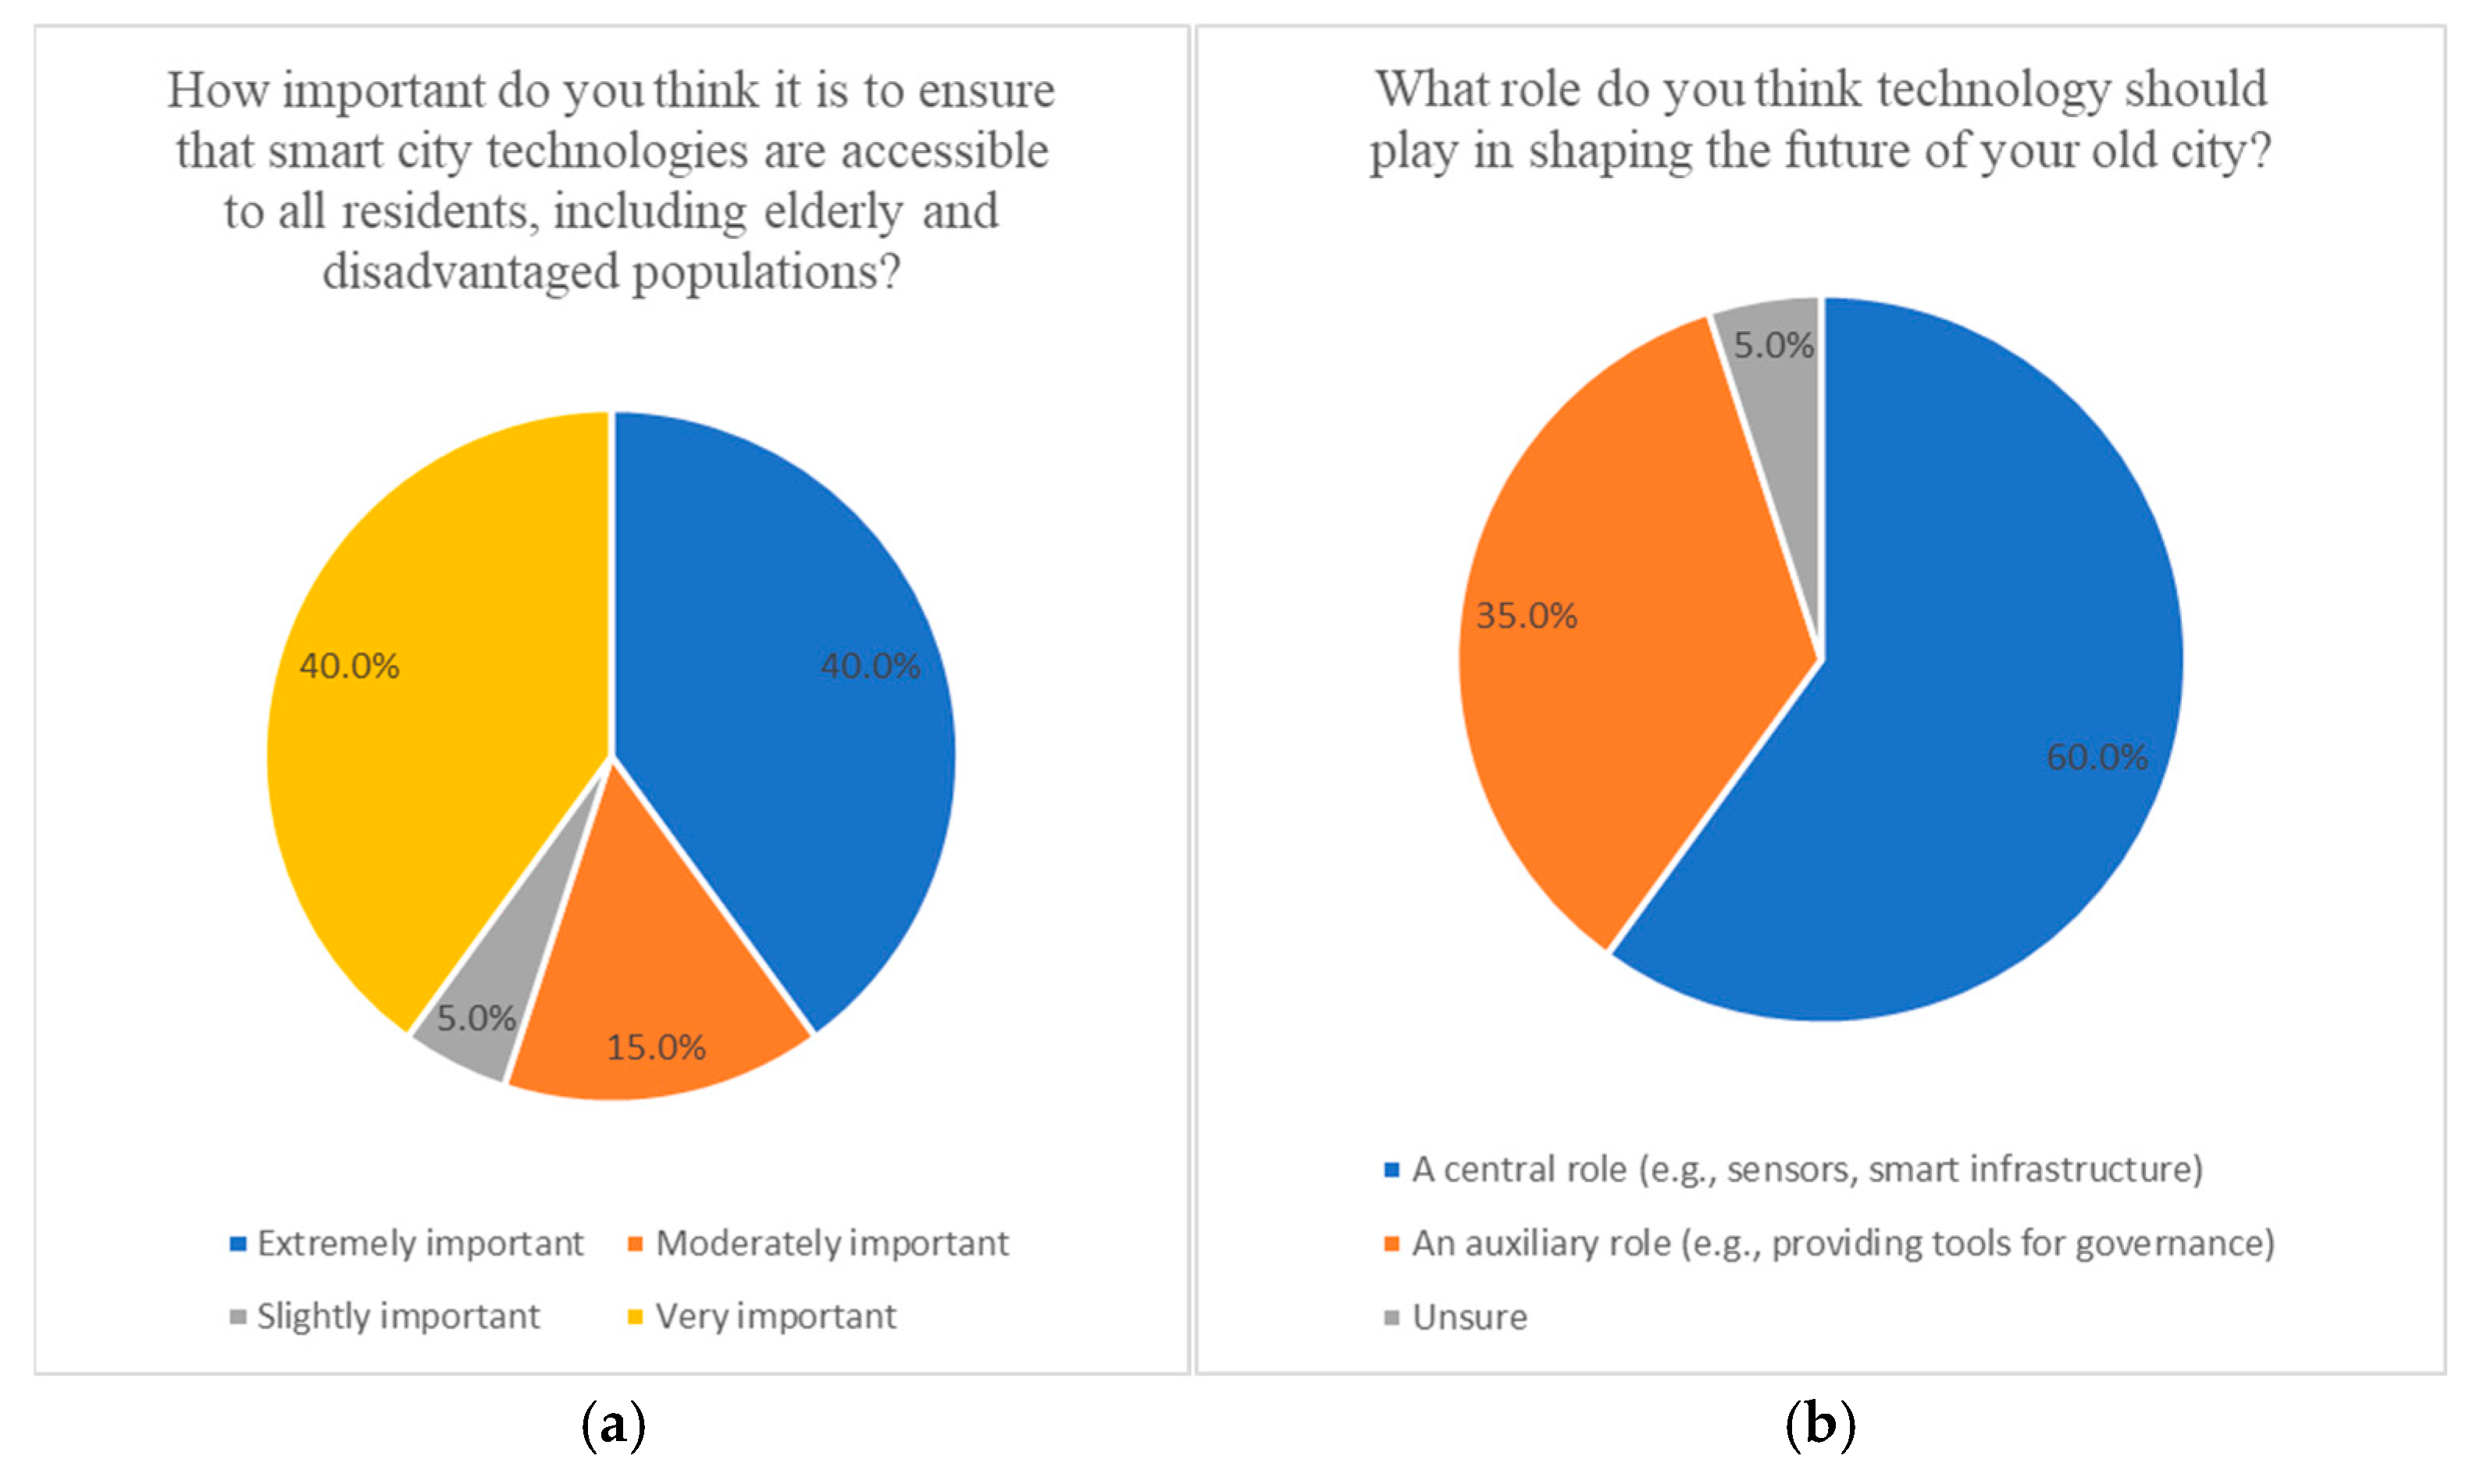
The following results indicate that 80% of the answers suggest that smart city technologies should be accessible to all residents (40% each for extremely important and very important) (Figure 17a), and 60% of answers show that technology plays a central role in shaping the future of the old city, while 35% support an auxiliary role (Figure 17b).
2.
Challenges in Implementing Smart Technology Strategies in Old Cities
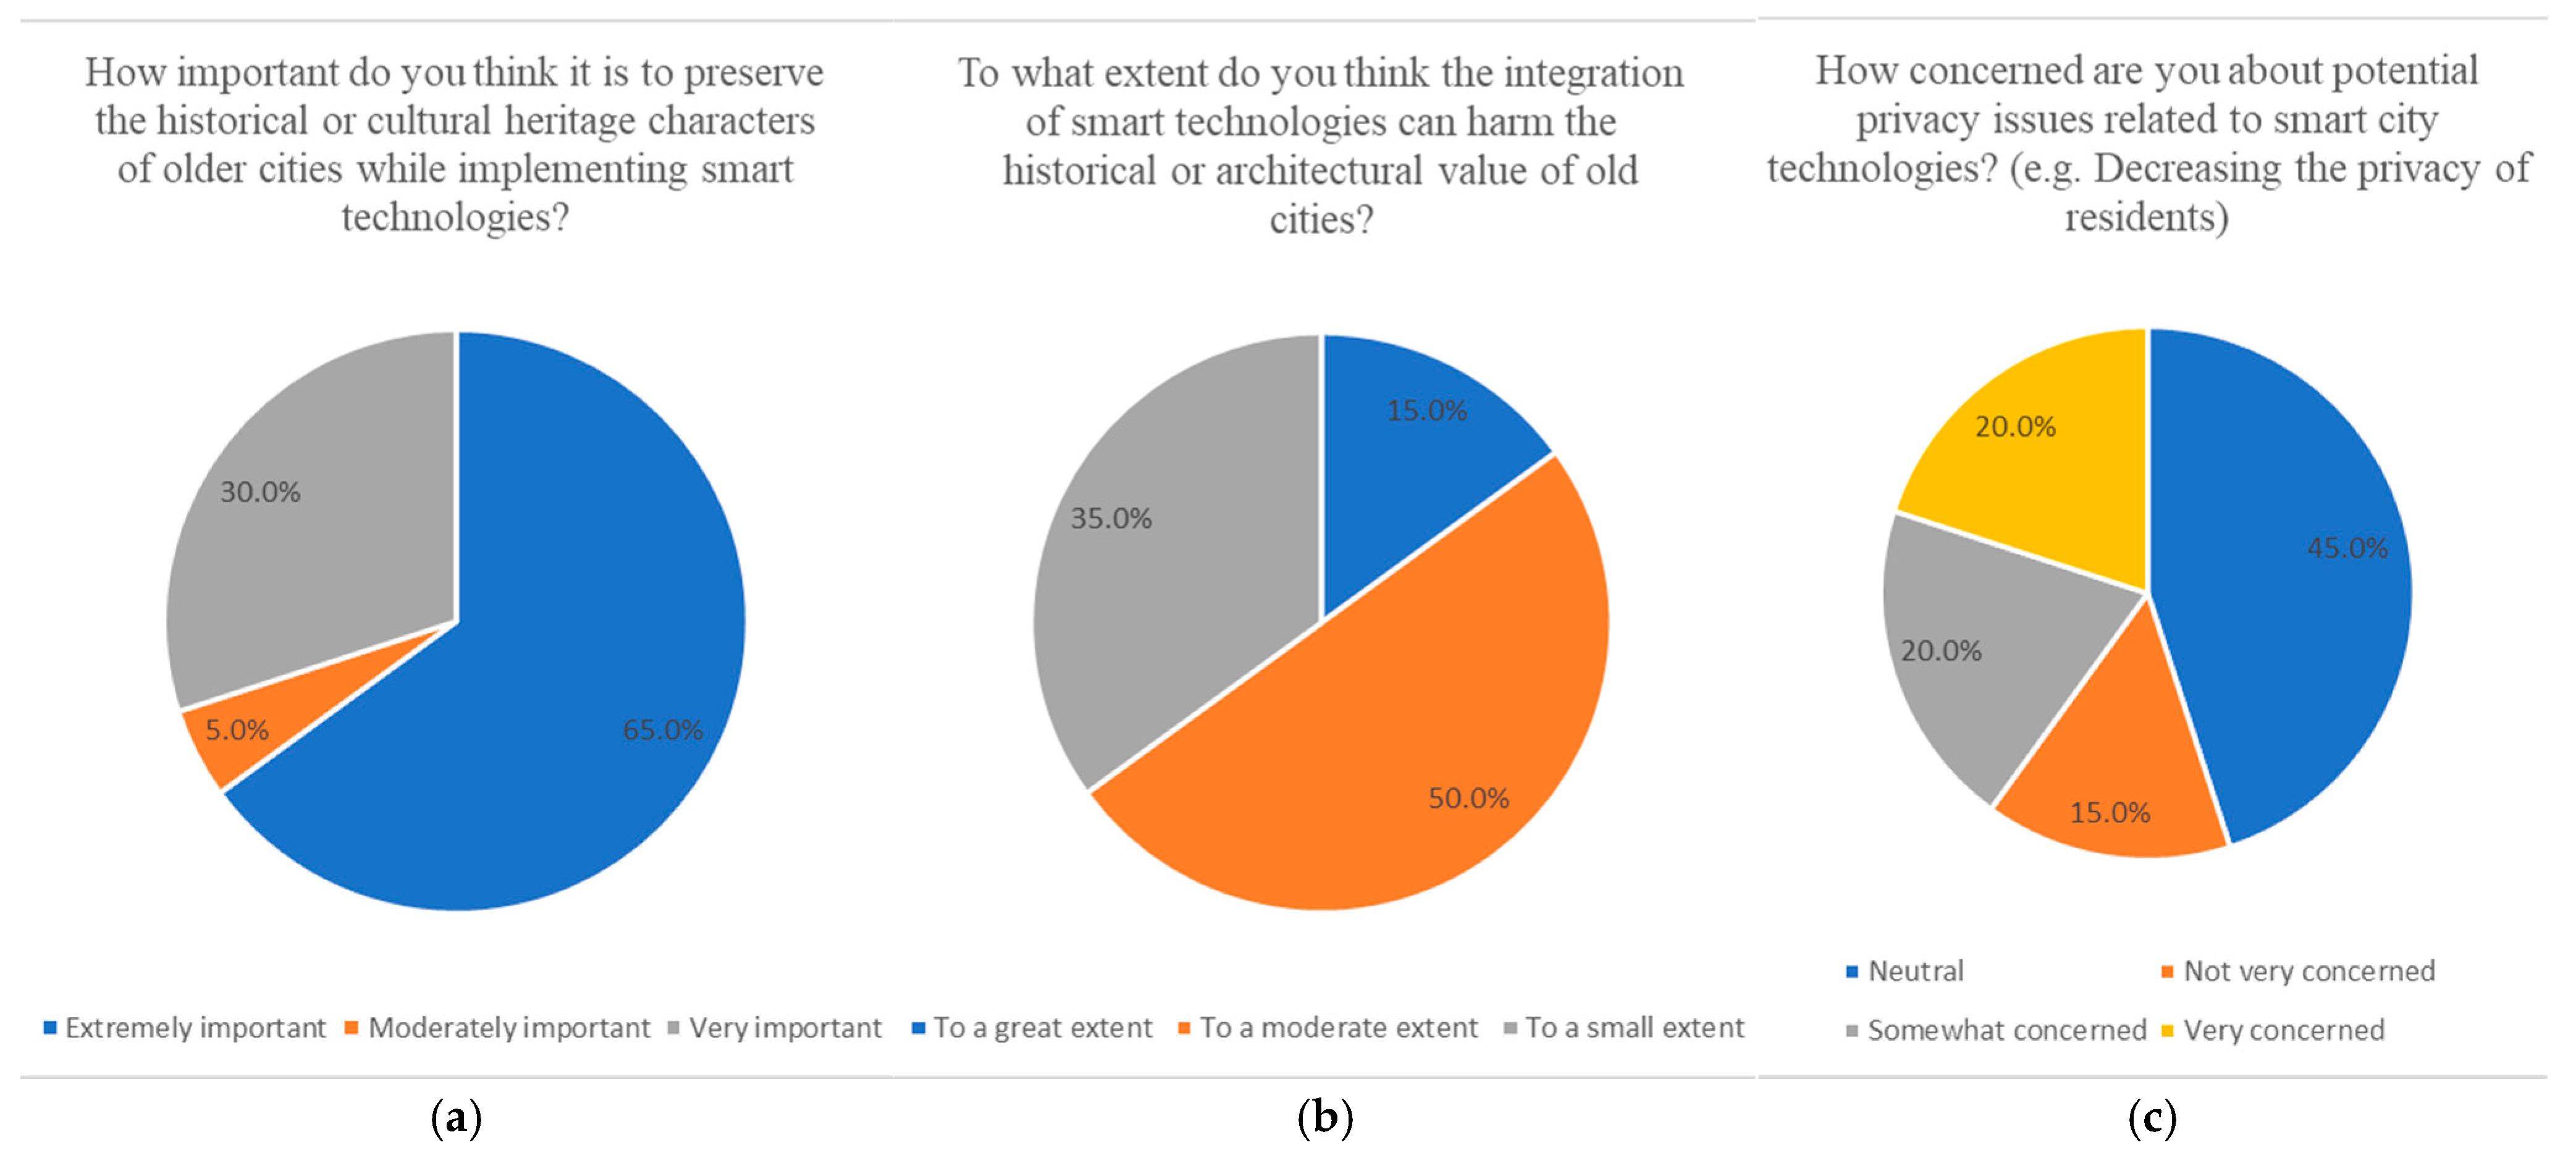
The following results show that 65% of the answers indicate that when implementing smart city technologies, historical or cultural heritage characteristics should be preserved (65% extremely important, 30% very important) (Figure 18a). At the same time, the use of smart technology can harm the historical value of the city by 15%, to a moderate extent by 50%, and to a small extent by 35% (Figure 18b). Therefore, the implementation of smart technology must be done carefully to enhance cultural and historical value, rather than diminish it. Lastly, regarding privacy concerns of residents when using smart technology, 20% of respondents were very concerned, 20% were somewhat concerned, 45% were neutral, and 15% were not very concerned (Figure 18c).
3.
Human-Centered Approach Integration
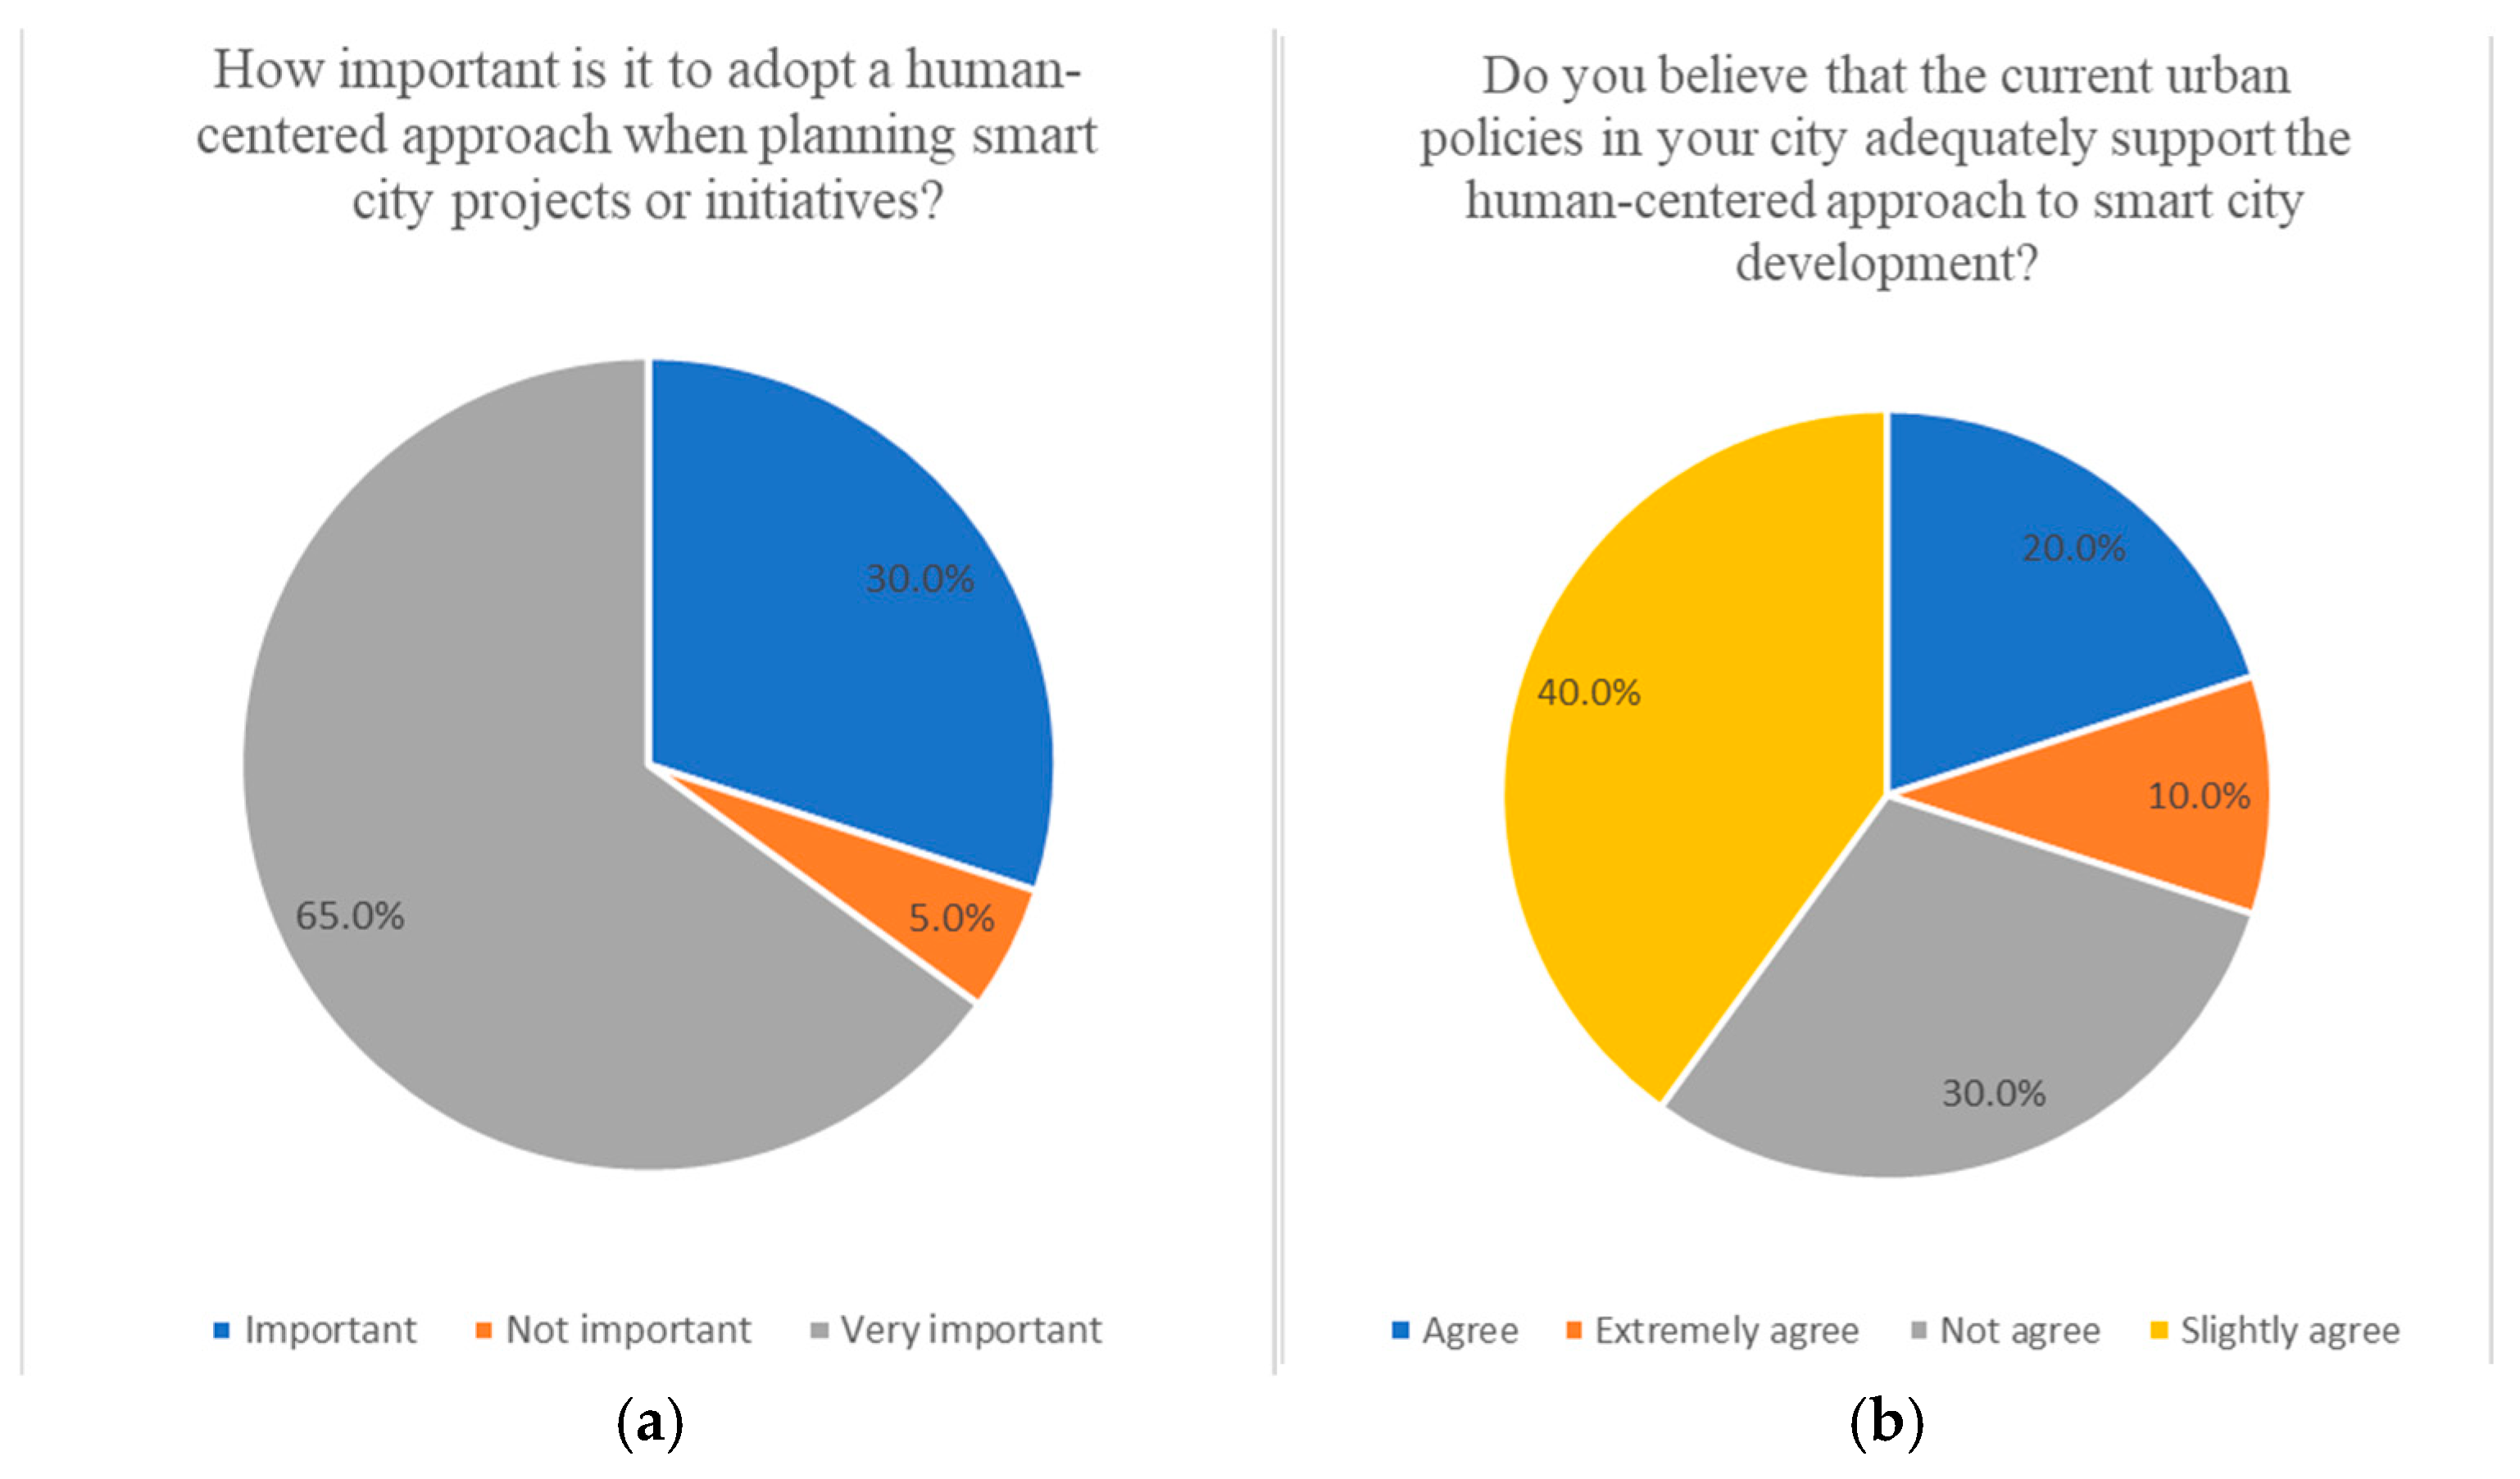
The following results indicate that 65% of the answers suggest that adopting a human-centered approach in smart cities is very important, while 30% of the answers consider it essential (Figure 19a). According to 30% of the answers, the current urban policies in Erbil City do not support a human-centered approach to developing a smart city, while 40% slightly agreed, 20% agreed, and only 10% strongly agreed (Figure 19b).
4.
People and Community Engagement.
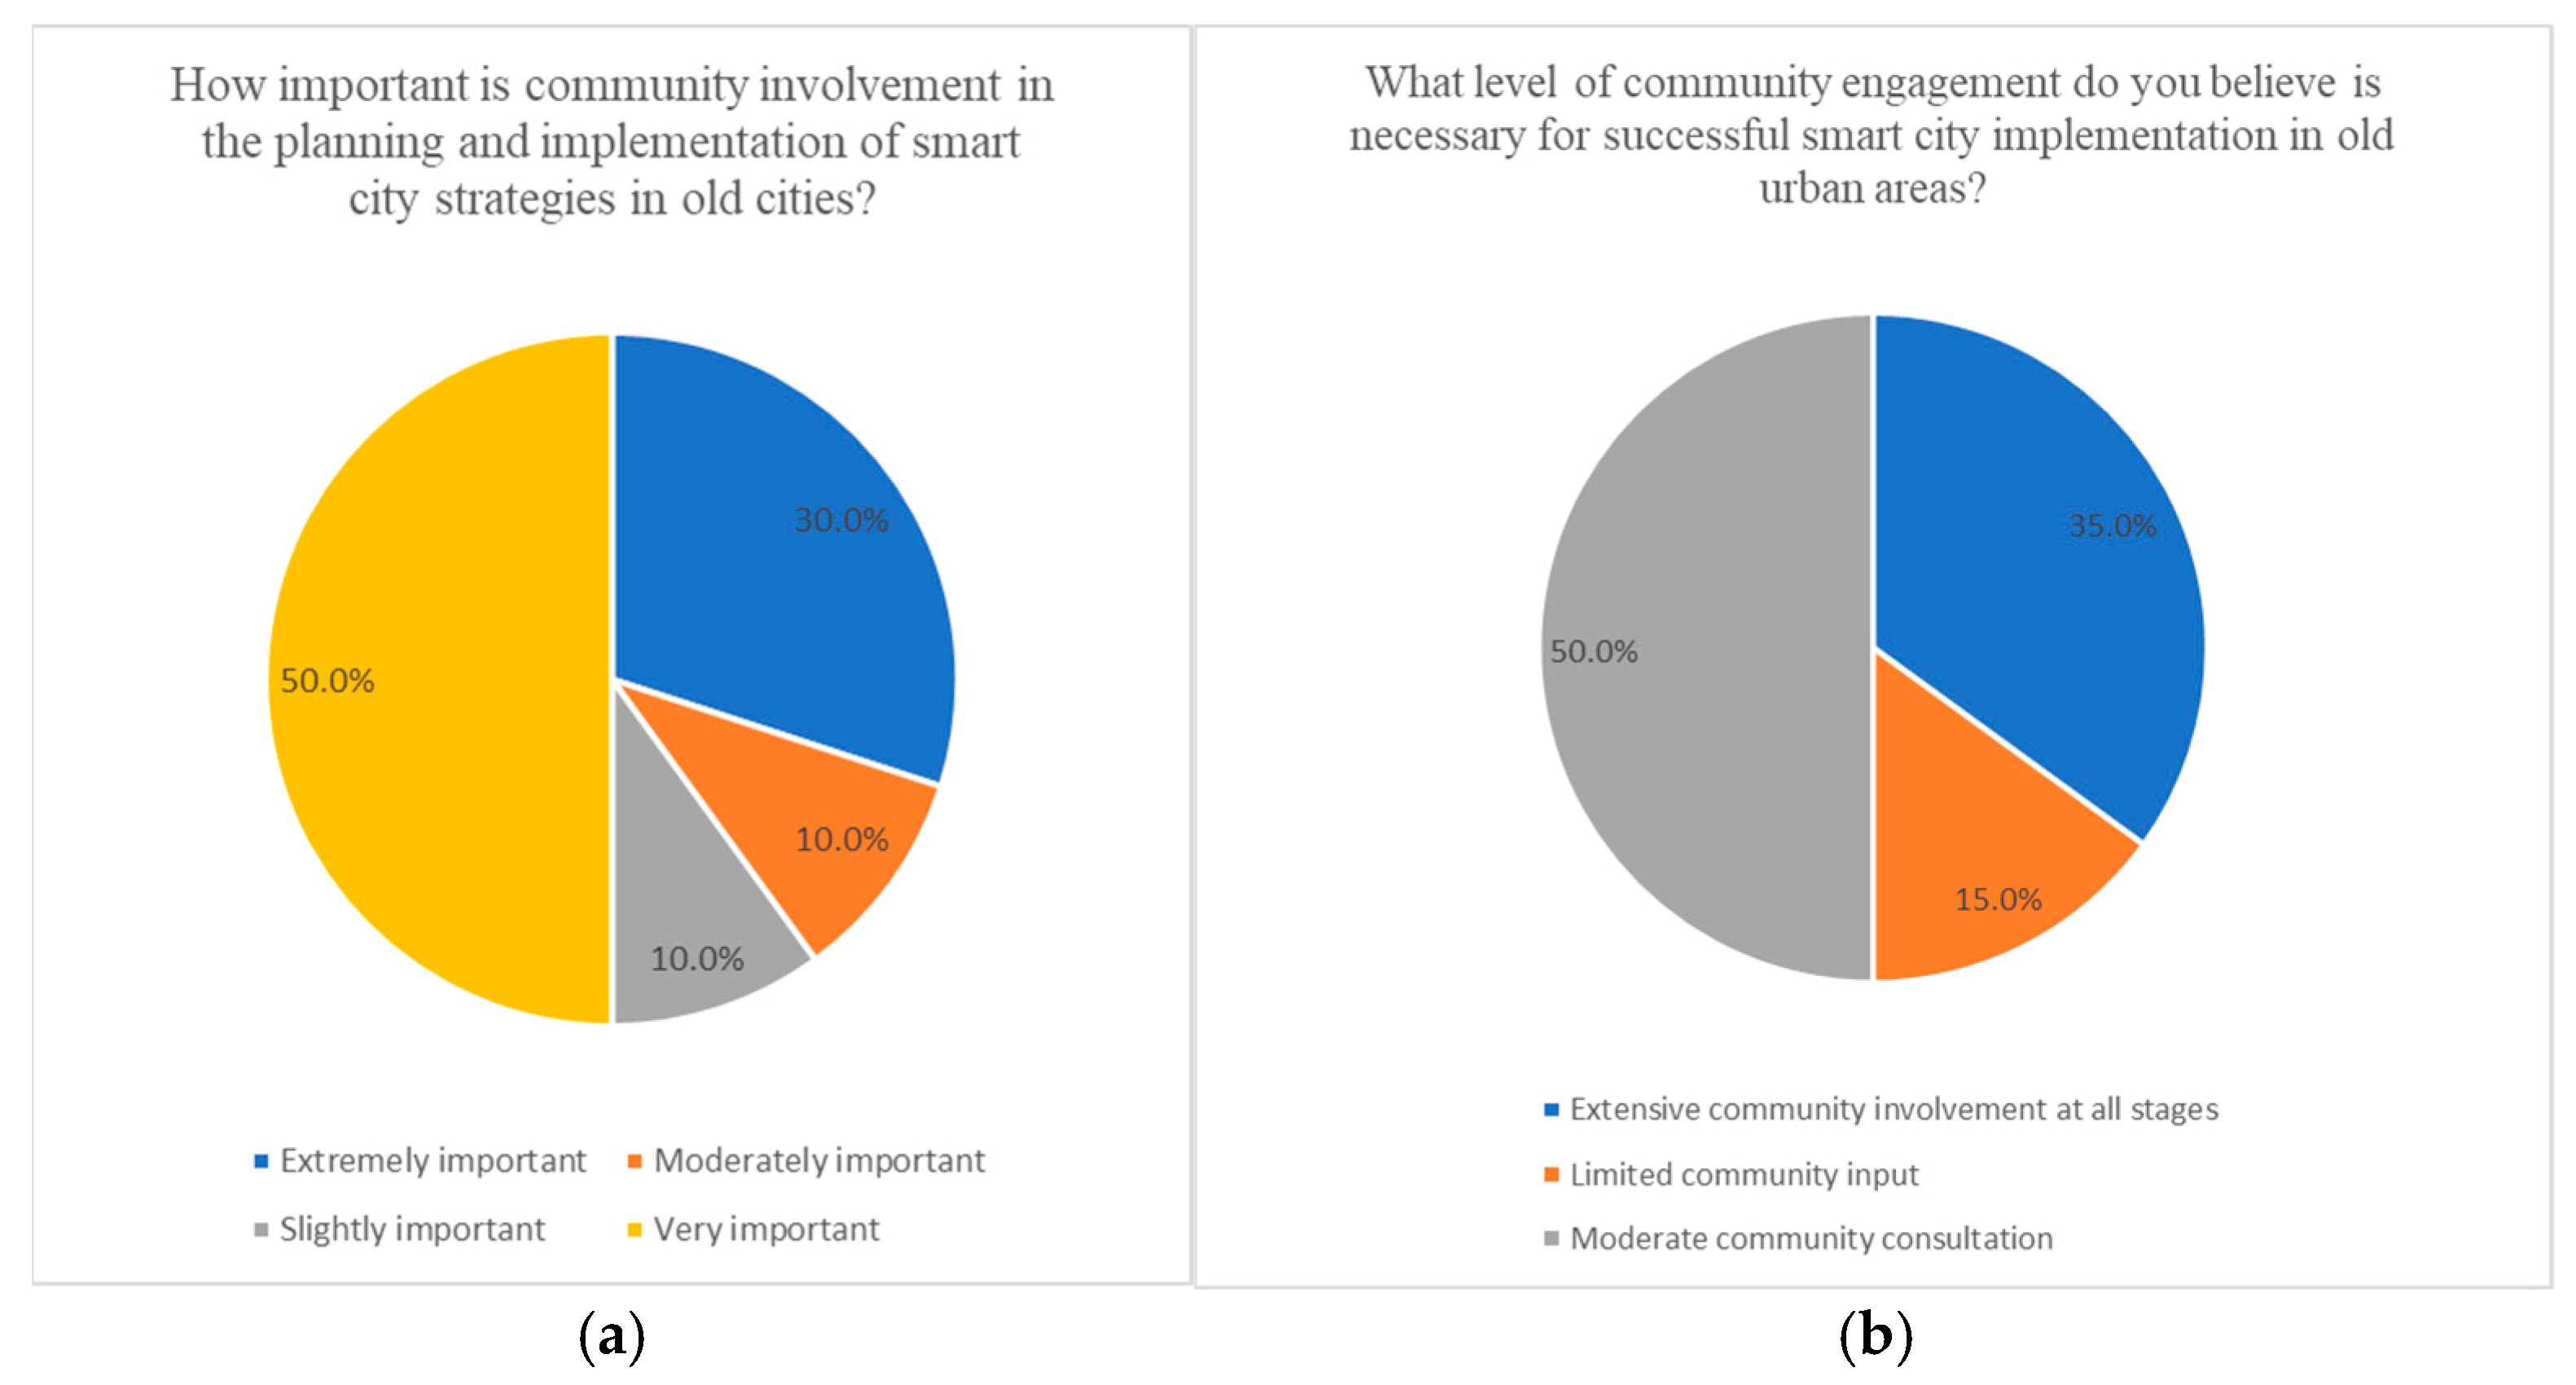
The following results indicate that 80% of the answers suggest that community involvement is crucial in implementing smart city strategies in old cities, with 50% of the answers being very important, 30% extremely important, and 10% for both moderately and slightly important (Figure 20a). For successful smart city implementation in old areas, 35% of answers were for extreme community involvement, 50% were for moderate community consultation, and 15% were for limited community involvement (Figure 20b).

4.2.2. Frequencies/Multiple Response Analysis

1.
Perceptions and opportunities of Smart City Implementation
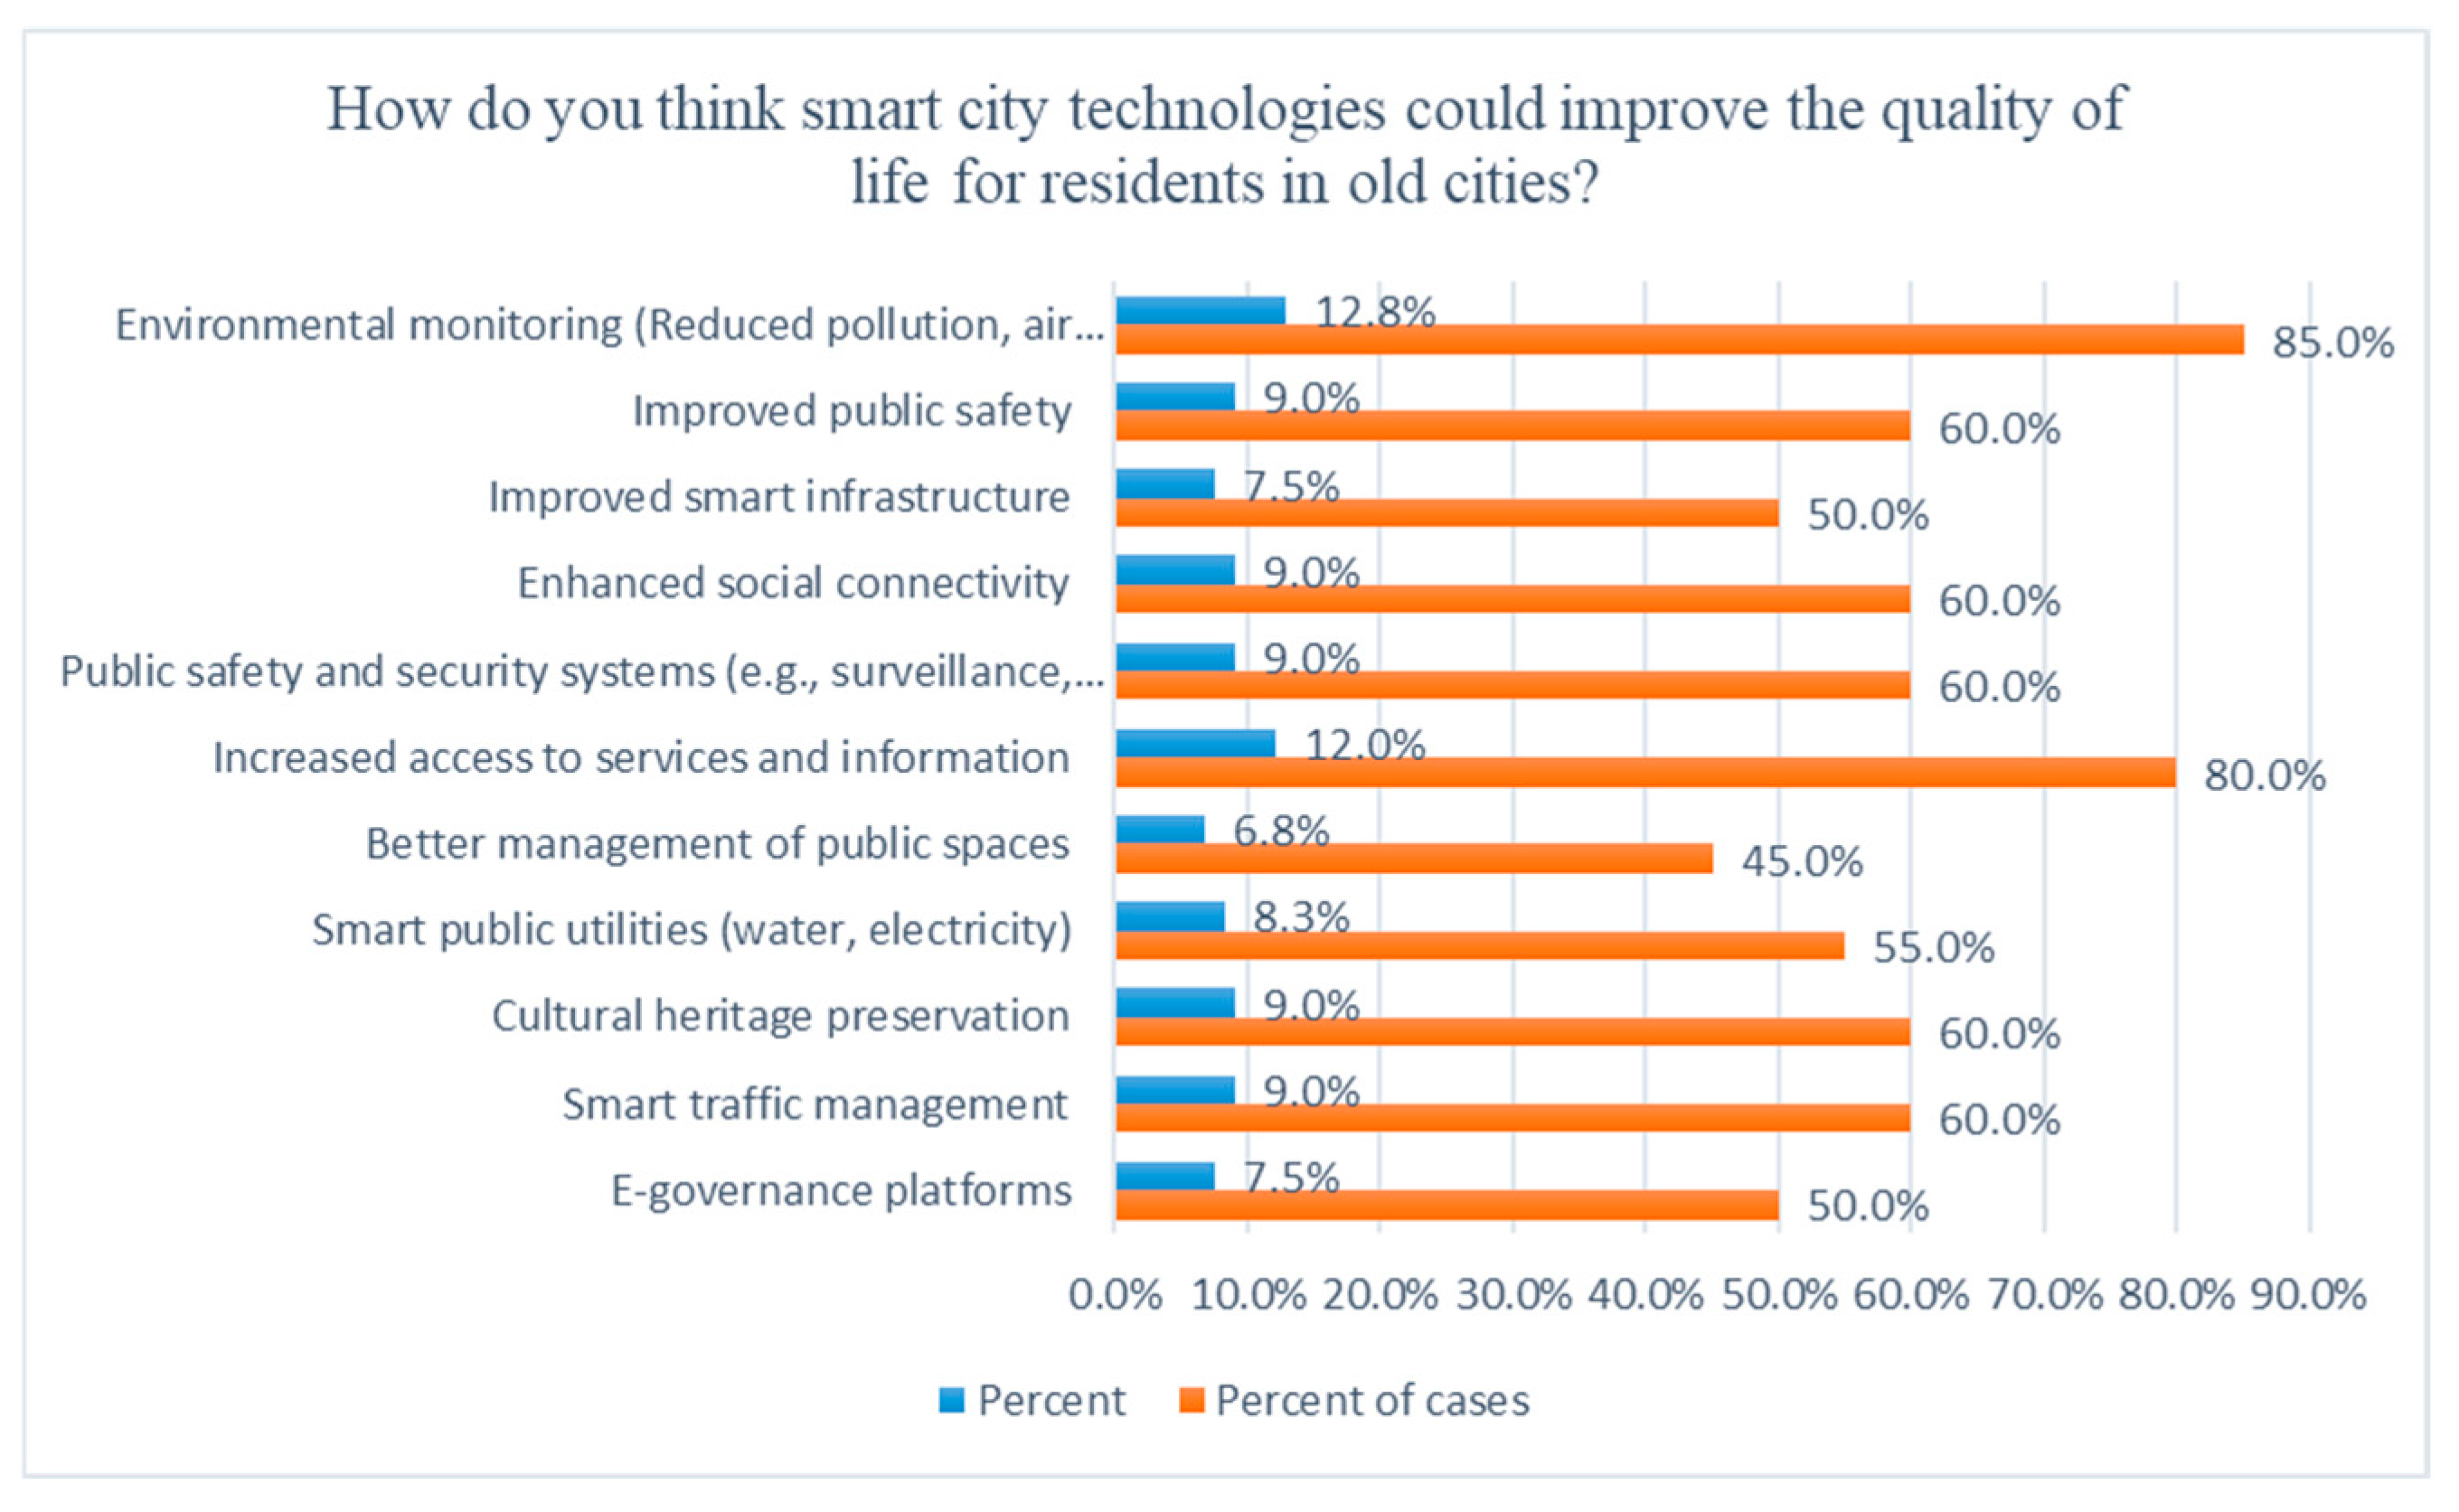
The following results show that 85% and 80% of the answers indicate that smart technologies can improve the quality of life of residents through environmental monitoring and increased access to services and information, 60% each for improving public safety, enhancing social connectivity, security systems, cultural heritage preservation, and smart traffic management, 55% for smart public utilities, 50% for improving smart infrastructure and E-governance platforms, and 45% for better management of public spaces (Figure 21).
2.
Human-Centered Approach Integration
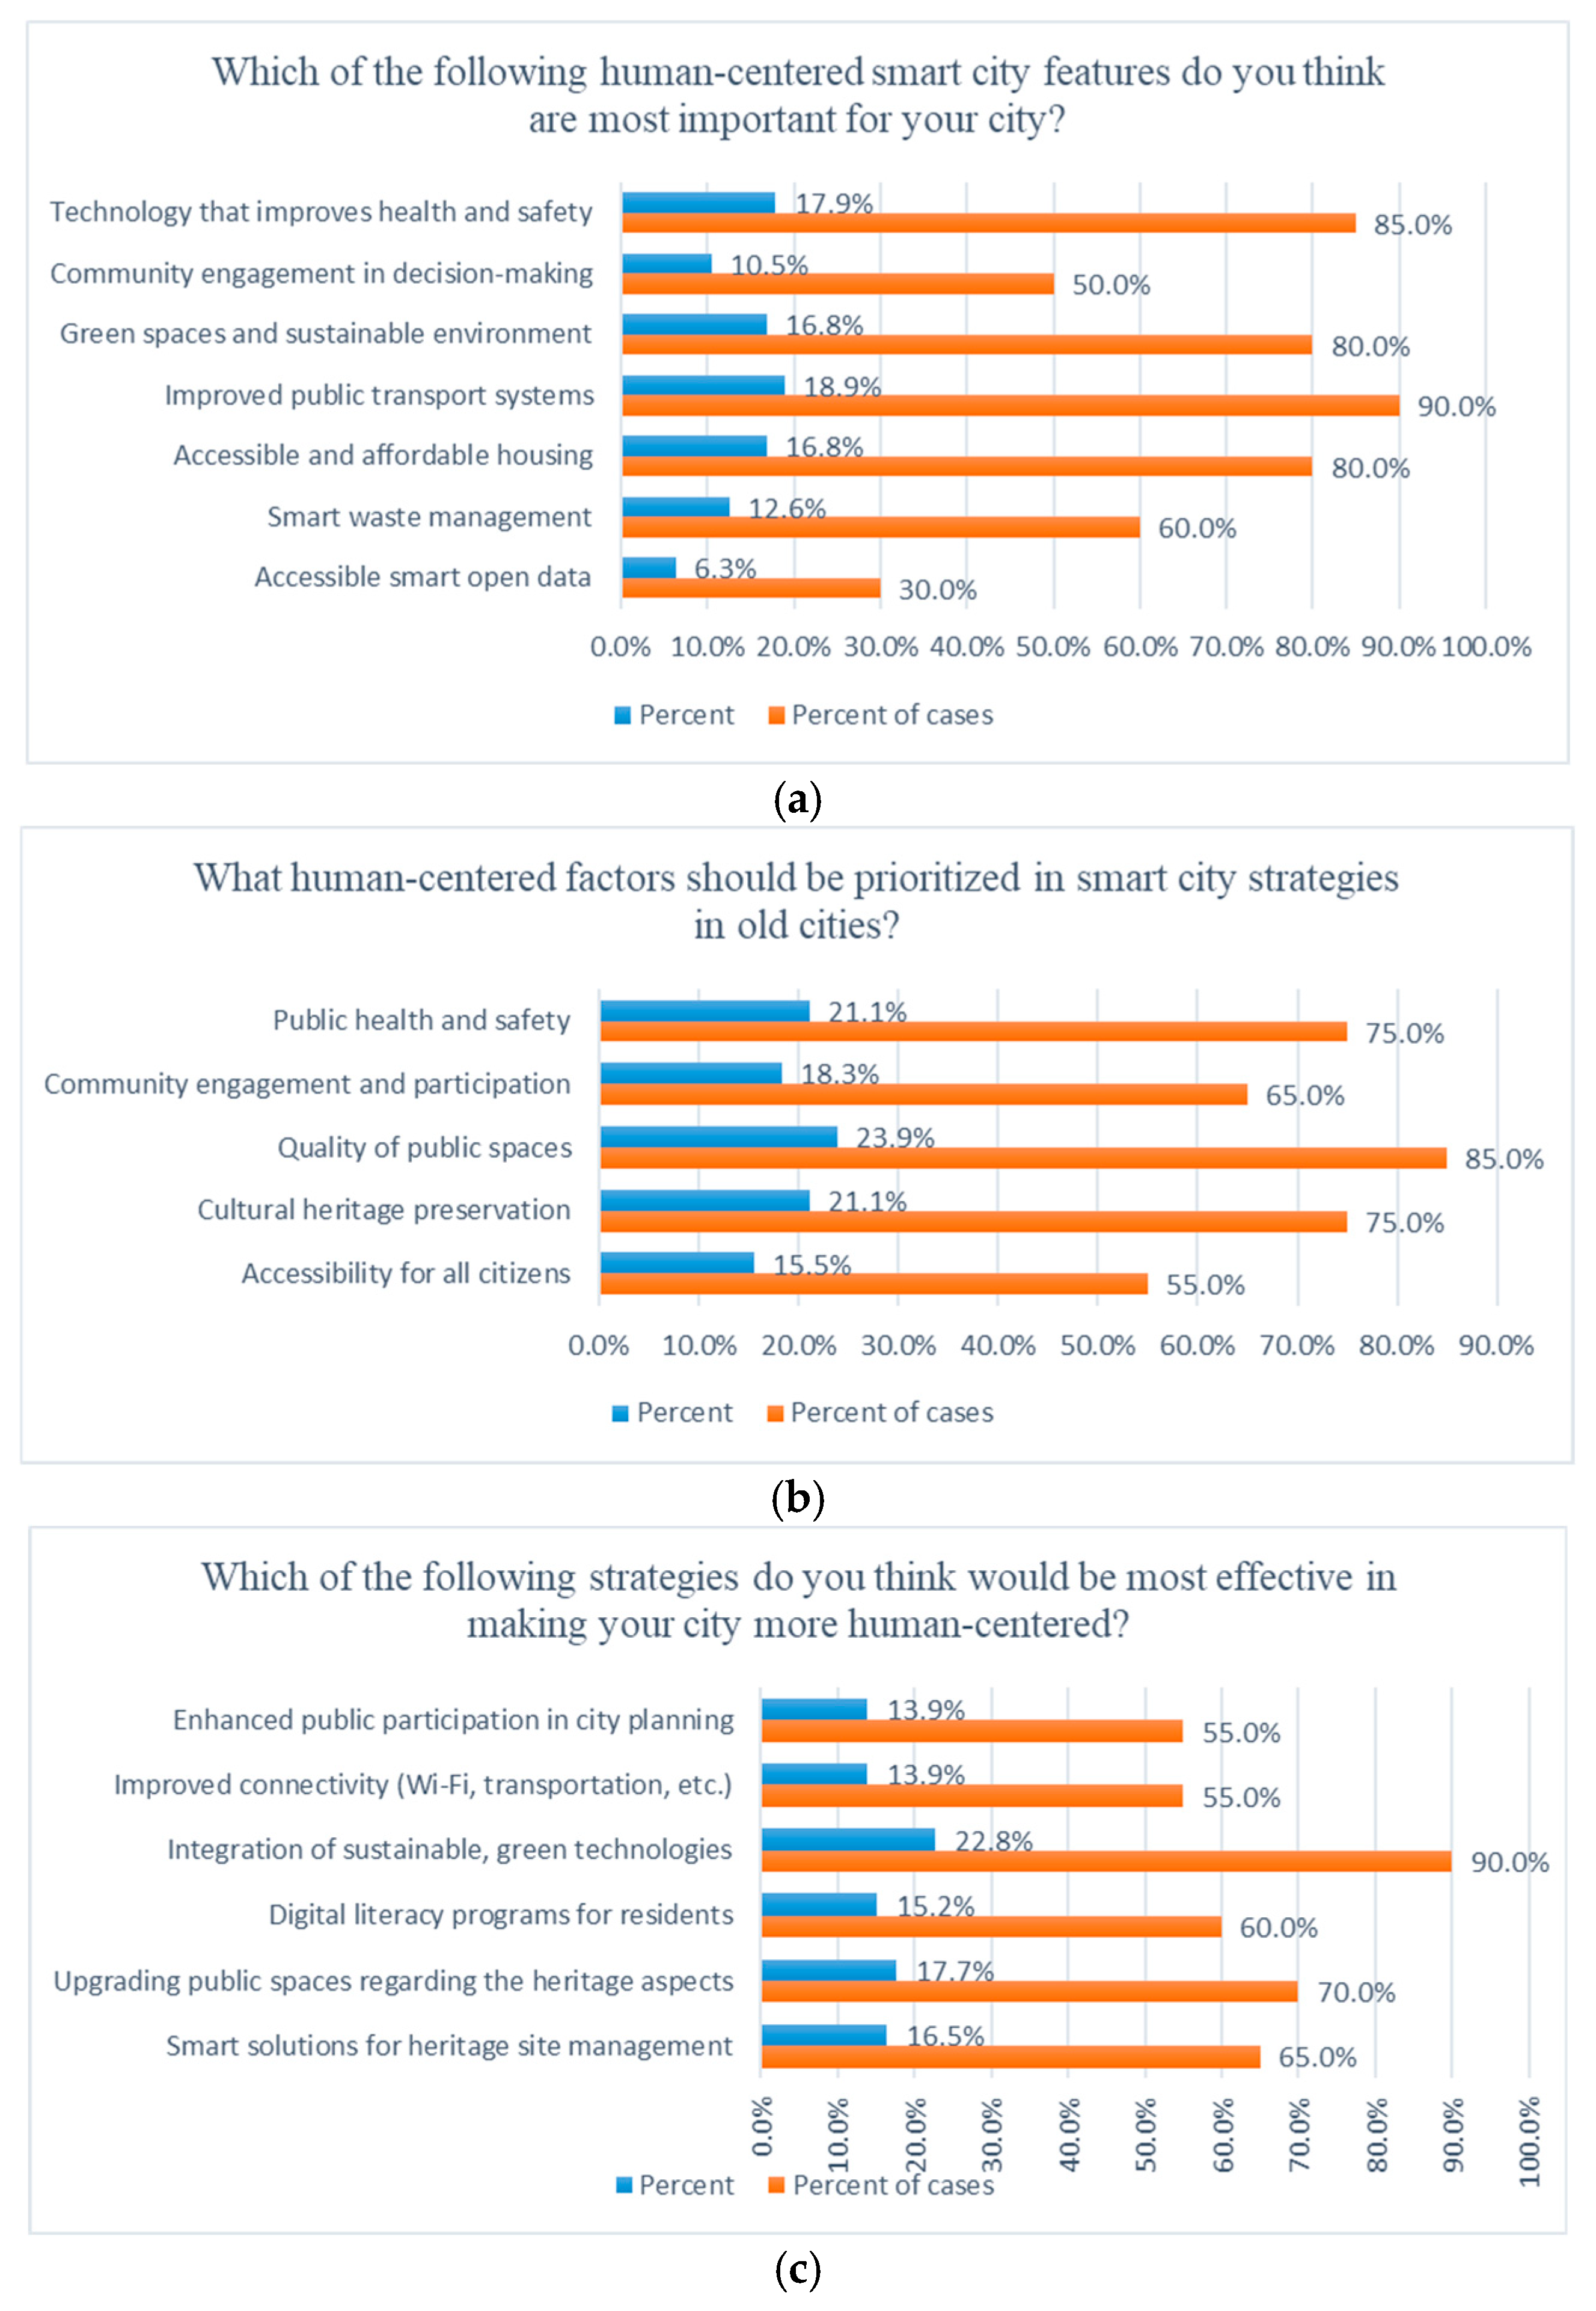
The following results show that 90% of the answers indicate that the most essential human-centered smart city feature is improving public transport systems, with 85% of answers for technology that improves health and safety, 80% for green spaces and a sustainable environment and accessible and affordable housing, 60% for smart waste management, 50% for community engagement in decision making, and 30% for accessible smart open data (Figure 22a). Moreover, the human-centered factors that should be prioritized are 85% for quality of public spaces, 75% for both public health and safety and cultural heritage preservation, 65% for community engagement and participation, and 55% for accessibility for all citizens (Figure 22b). Lastly, the most effective strategies that can make the smart city more human-centered are 90% for integration of sustainable and green technology, 70% for upgrading public spaces regarding heritage aspects, 65% for smart solutions for heritage site management, 60% for digital literacy programs for residents, and 55% for enhancing public participation in city planning and improving connectivity (Figure 22c).
3.
People and Community Engagement
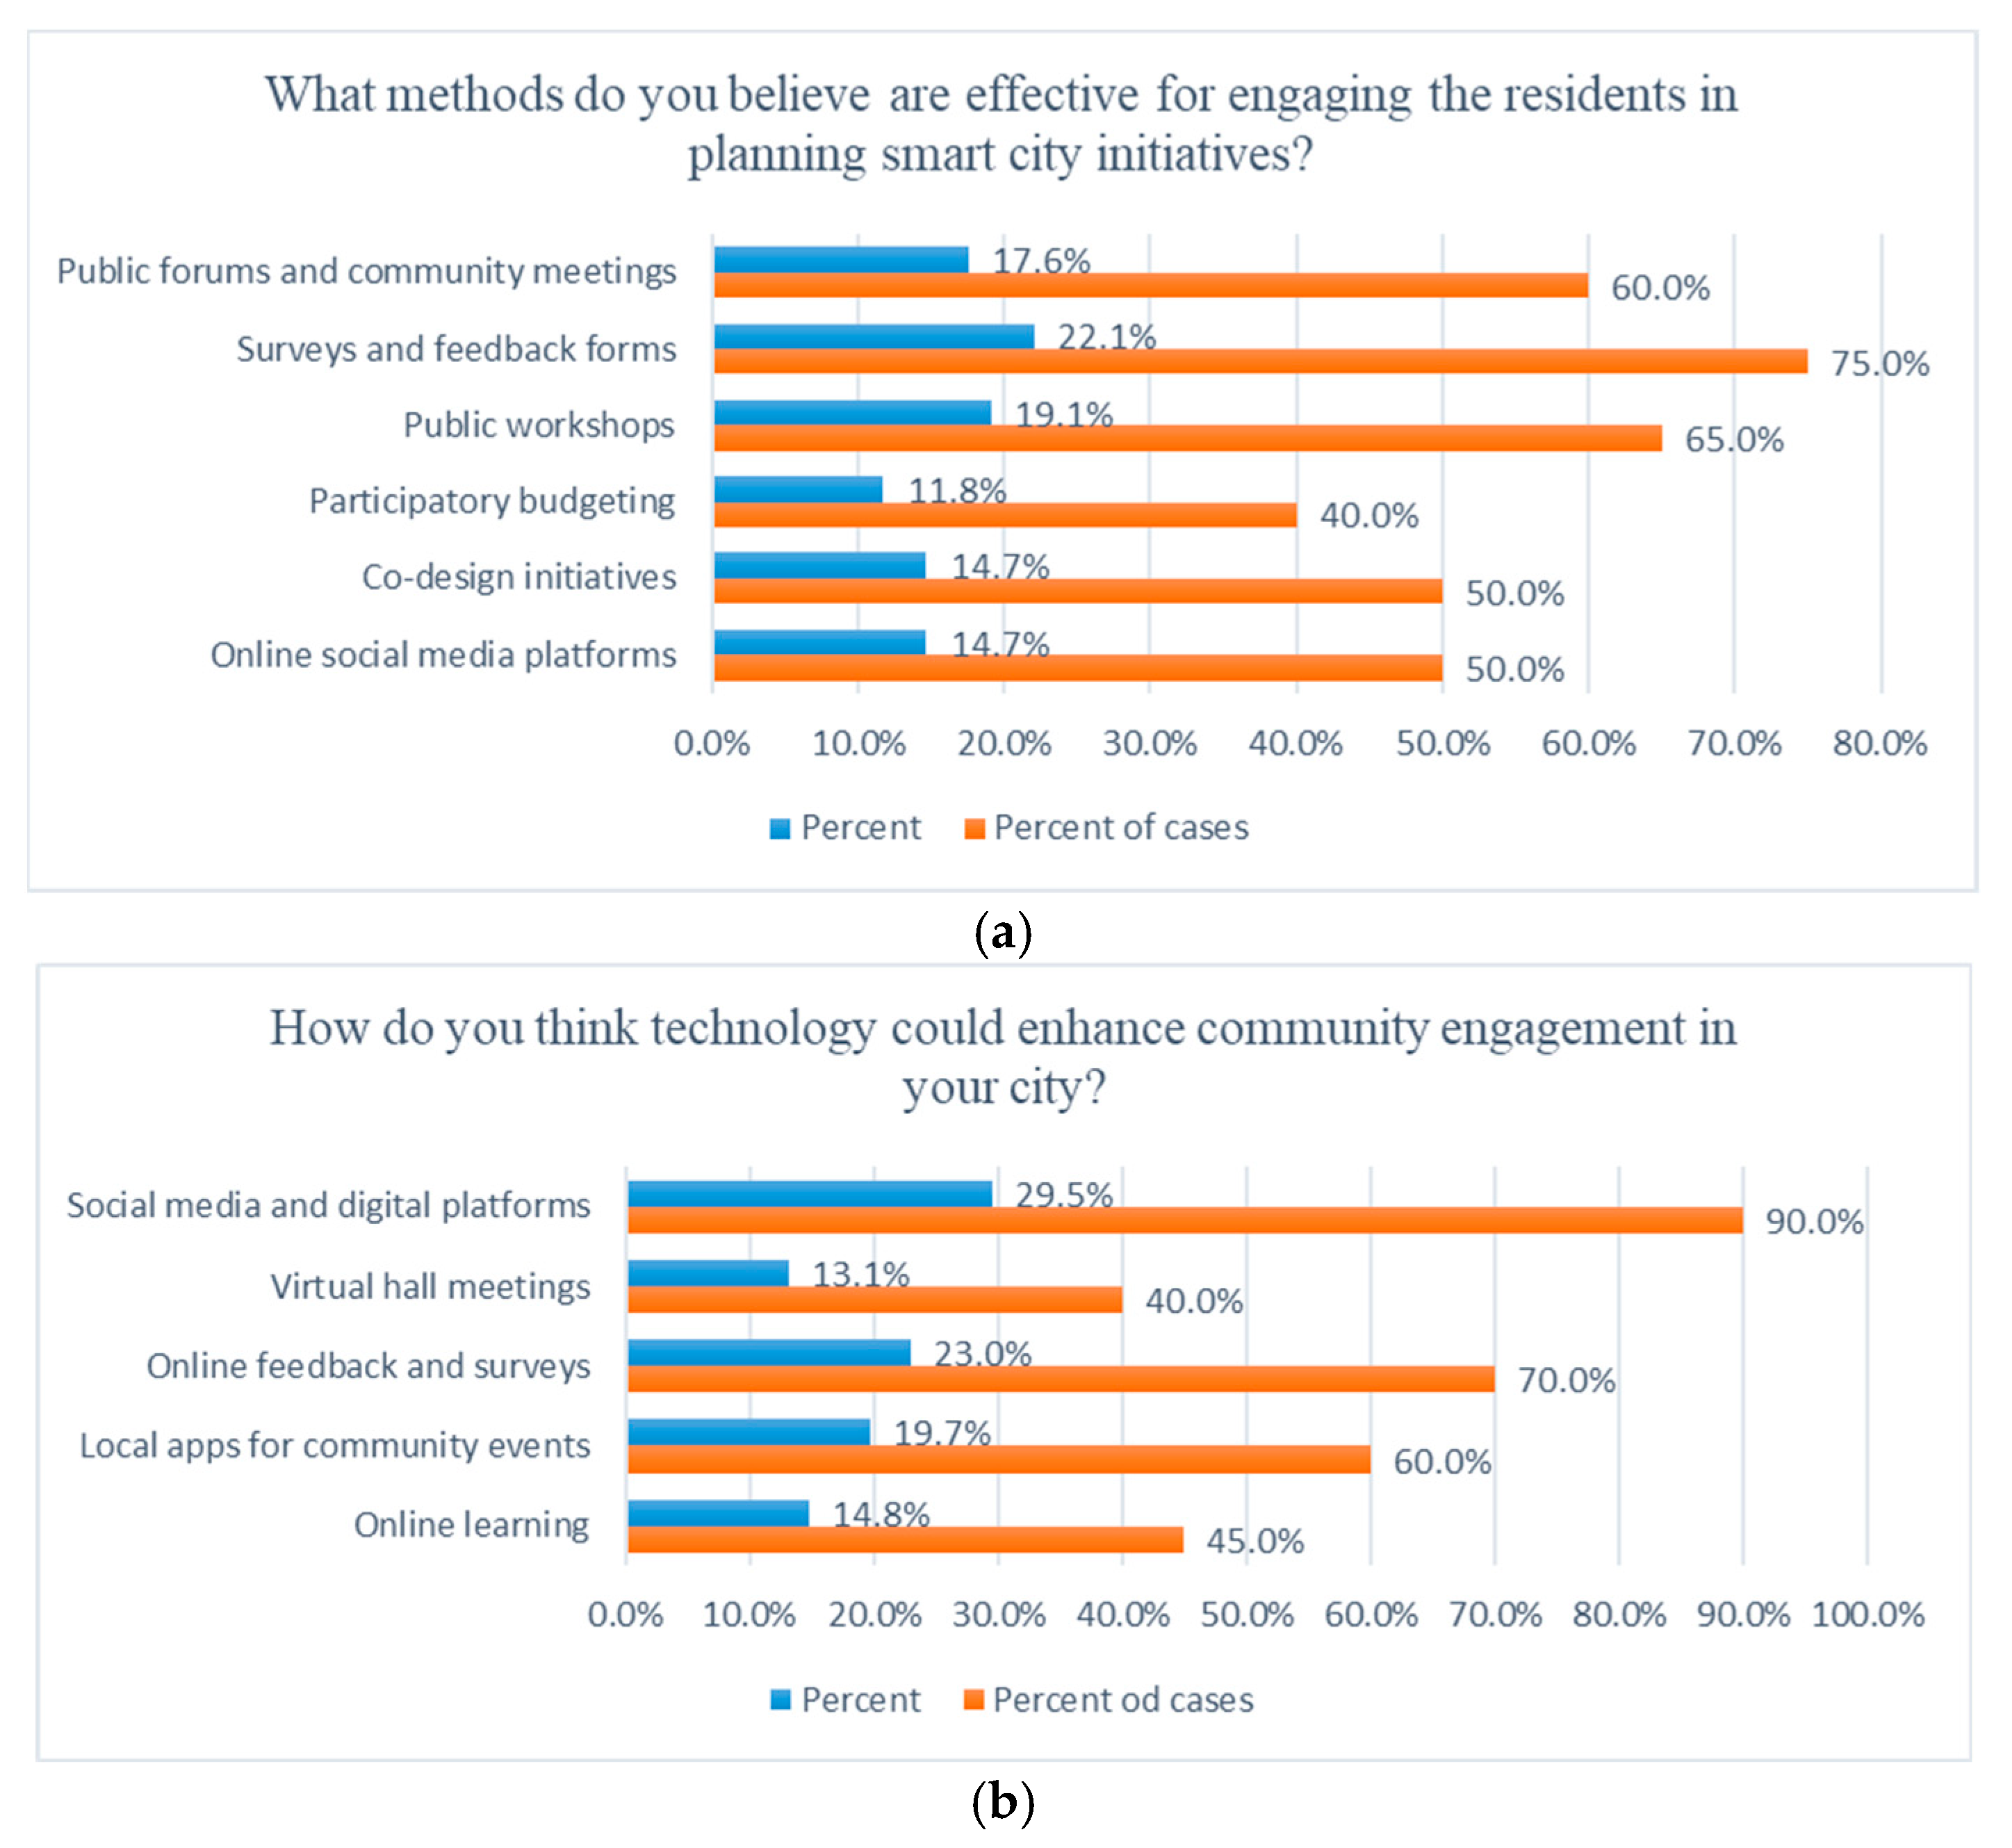
The following results show that 75% of the answers indicate that the most effective methods for engaging the residents in planning smart city initiatives are surveys and feedback forms, while 65% were for public workshops, 60% for public forums and community meetings, 50% for both co-design initiatives and online social media platforms, and 40% for participatory budgeting (Figure 23a). Technology can enhance community engagement in the city through social media and digital platforms (90%), online feedback and surveys (70%), local apps for community events (60%), online learning (45%), and virtual hall meetings (40%) (Figure 23b).

4.2.3. Scale Response Analysis

Using SPSS software, a one-sample t-test was implemented for the scale answers (five-to-one choices and four-to-one choices). The p-value is used to test if it has a significant impact or affects the hypotheses through its significance, as the hypotheses could be tested to measure their importance. The explanation of the functions is as follows (Table 10 and Table 11).
If p-value < 0.05 = significant.
If p-value < 0.01 = significant.
If p-value < 0.001 = highly significant.
The hypotheses could also be tested through comparison with the mean (M) results, where the mean is calculated as follows.
For the scale between 5 and 1, 1 + 2 + 3 + 4 + 5/5 = 15/5 = 3. Thus, the hypothesis will compare to three, as follows:
H0: M = 3
H1: M ≠ 3
For the scale between 4 and 1, 1 + 2 + 3 + 4/4 = 10/4 = 2.5. Thus, the hypothesis will compare to 2.5, as follows:
H0: M = 2.5
H1: M ≠ 2.5
The analysis shown in Table 10 indicates that the one-sample t-test shows that the hypotheses (H1, H2) are highly significant, with a p-value < 0.00, which means a firm rejection of the null hypothesis (H0:M = 3). The items in the tables concerning the importance of human-centered approaches (M = 4.55) and the accessibility of smart city technologies (M = 4.00) both have Means above the test value of 3, with very low p-values (<0.000), demonstrating a notably favorable opinion among participants. For the question of whether smart technology can be harmful to the historical value of old cities, M = 3.80, while for the question related to the optimism of implementing human-centered smart city strategies in the old city, M = 3.60, which is both close to the test value of 3 and indicates that the participants’ opinions were split into two opinions. The p-value < 0.000 and p-value < 0.001, respectively. Conversely, the item on current urban policies, also an H1 hypothesis, has a mean value of M = 3.10, which is close to the test value of 3 and a non-significant p-value (0.649). This fails to reject the null hypothesis, indicating that participants do not strongly agree that current policies support a human-centered approach. The results show that although participants appreciate human-centered smart city concepts, they have doubts about the efforts being made to implement them.
In Table 11, the community engagement Mean value M = 3.20 is close to the test value of 3. It has a significant p-value (0.001), indicating the importance of community involvement in the successful smart city implementation in old cities.

4.3. The Results of the Research Questions and Hypotheses

The research’s two hypotheses have been proven and confirmed by the research analysis, as the experts’ answers yield highly significant results (sig. at <0.01), as follows.
Hypothesis 1 (H1).
The human-centered approach plays a significant role in achieving smart cities.
Hypothesis 2 (H2).
By implementing smart technology strategies, traditional cities can be retrofitted to become smart cities.
Except for the question of “Do you believe that the current urban policies in your city adequately support the human-centered approach to smart city development,” the current urban policies in Erbil City do not support a human-centered approach to developing a smart city.
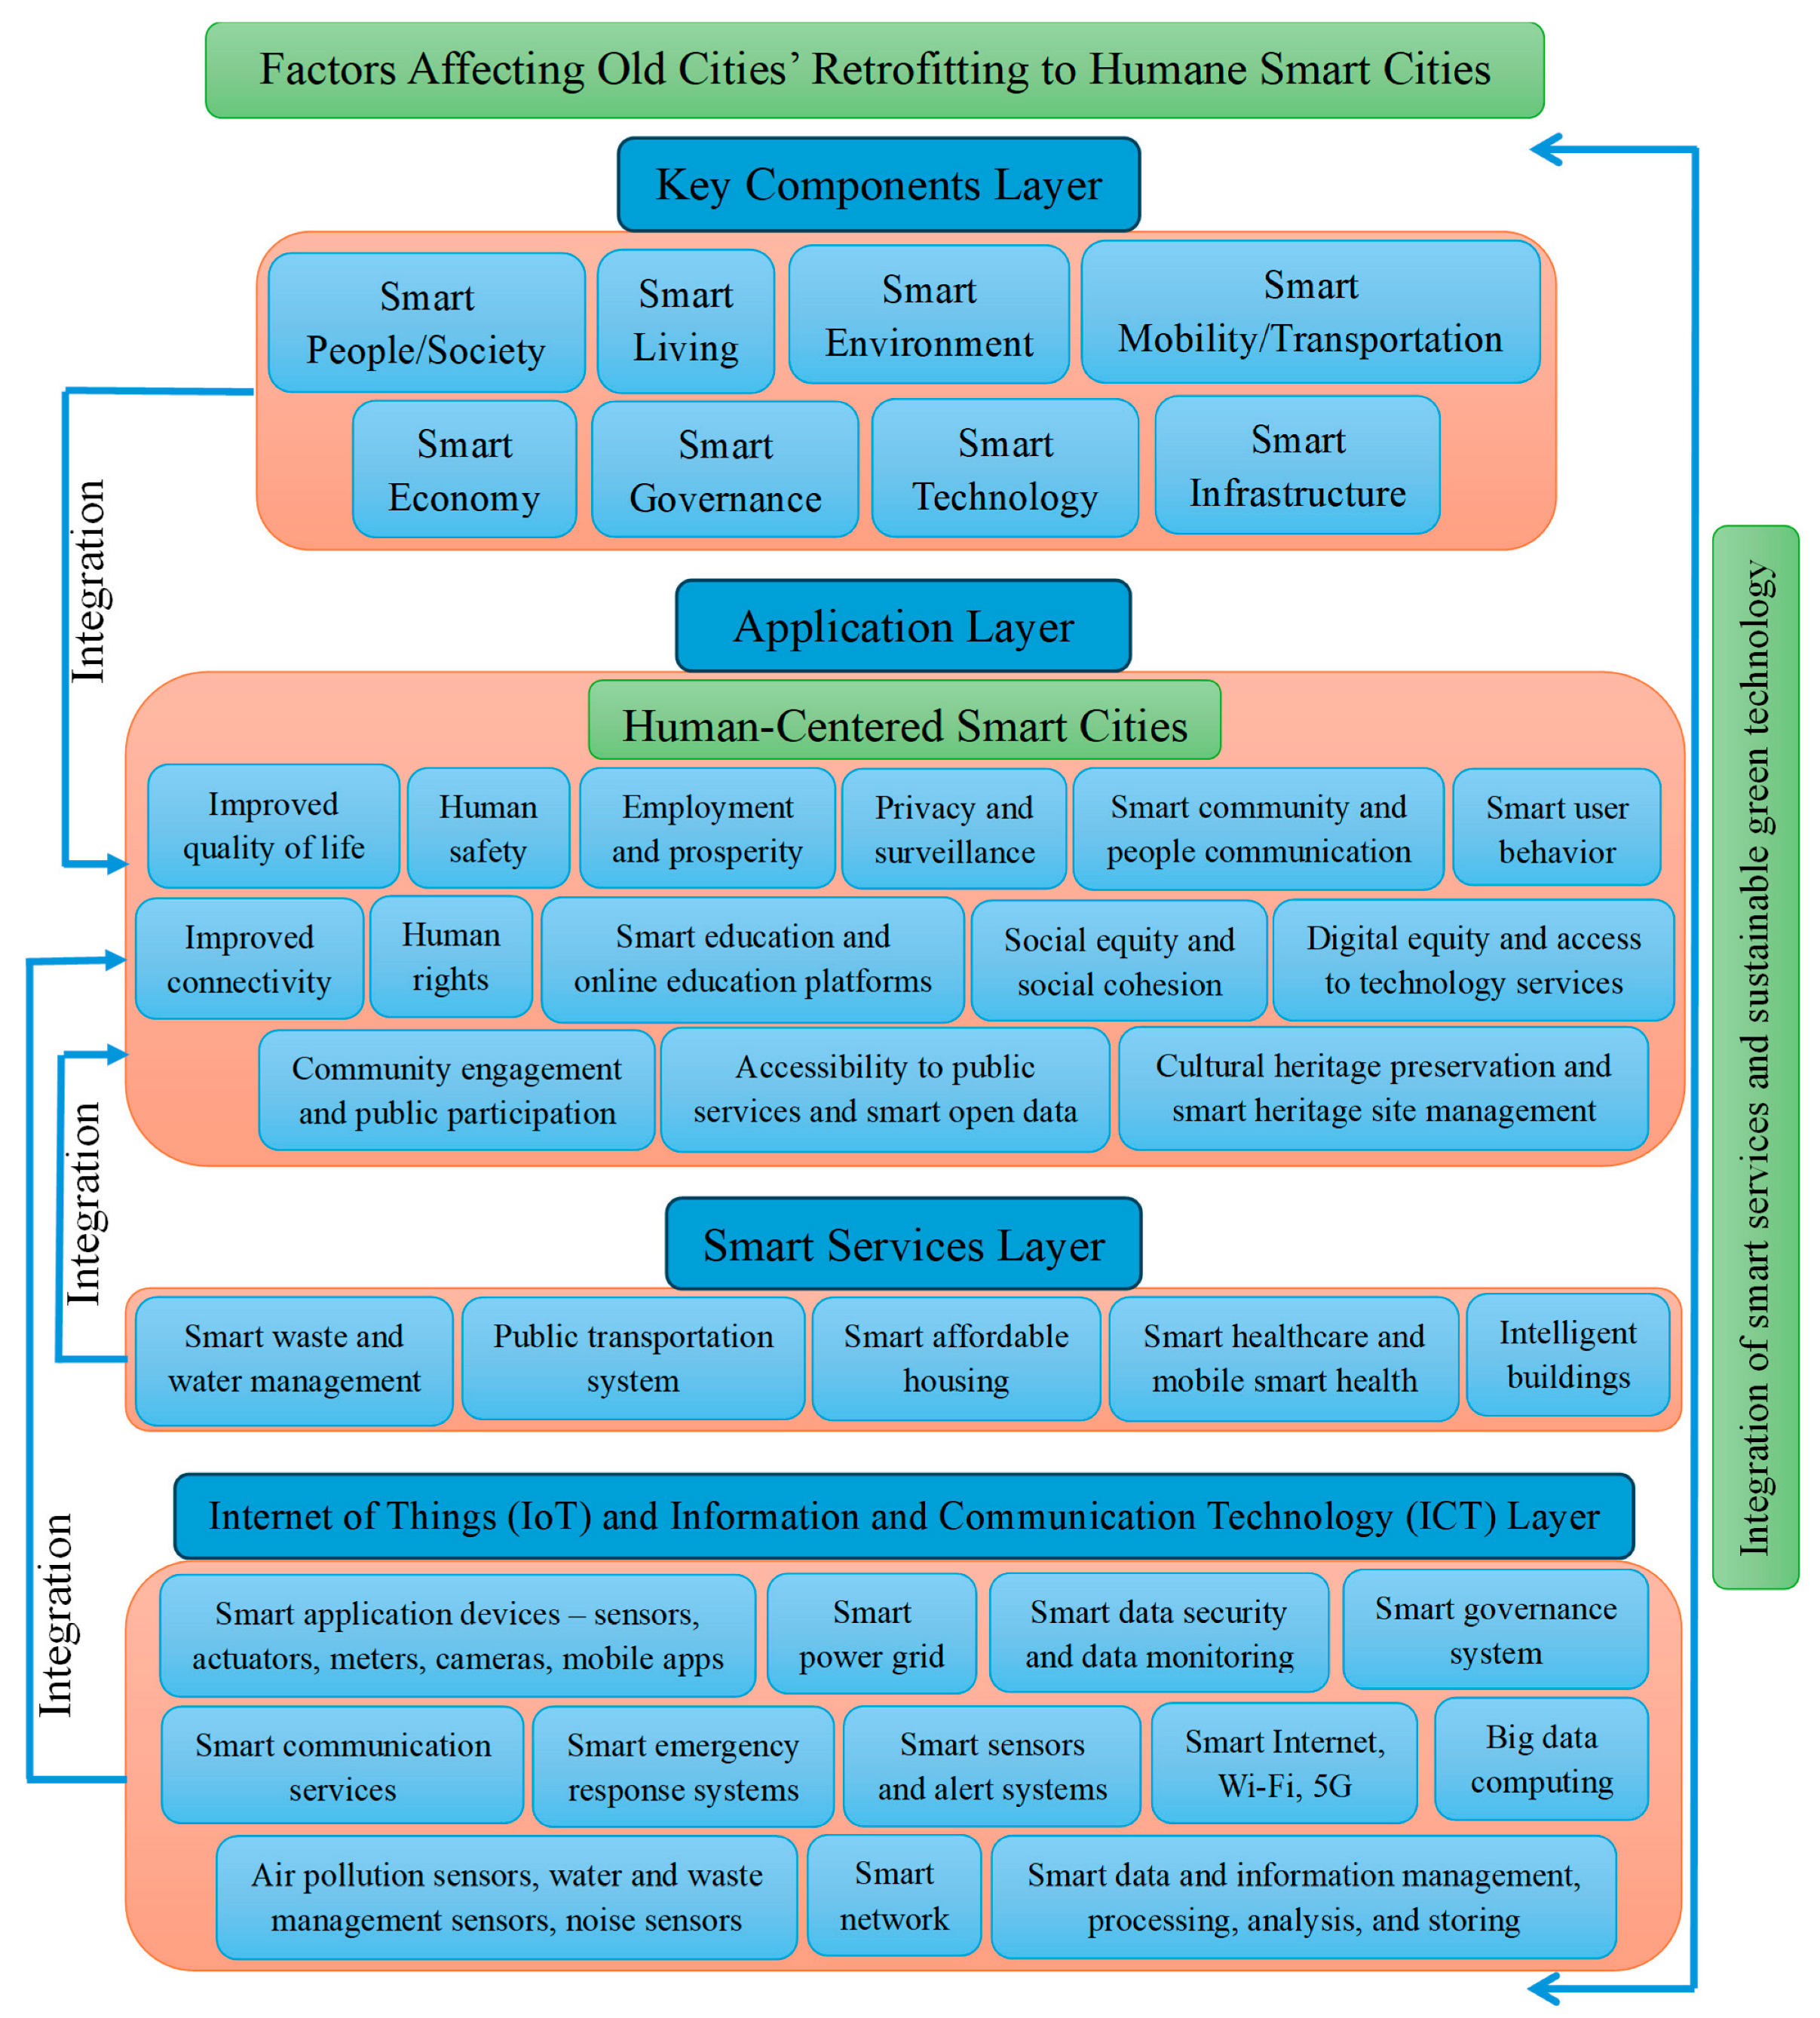
The study has analyzed smart technology strategies that contribute to meeting human needs and improving the quality of life, suggesting some smart guidelines and providing a comprehensive framework that can be adapted in Erbi City. Thus, the research has addressed the questions regarding the challenges of smart technology that hinder the implementation of human-centered smart cities in Erbil City, Kurdistan Region, Iraq, and the integration of smart technology to achieve a human-centered Smart Erbil City.
A methodological proposal for an operational framework model to retrofit old cities into humane smart cities (a human-centered design paradigm) is presented in the following figure (Figure 24).

4.4. The Contribution of the Research

Through a review of the existing literature, it became clear that a comprehensive study of the integration of smart technologies in Erbil City was necessary, particularly from a human-centered perspective. The essential contribution of this research is to bridge the gap between theoretical frameworks and the practical application of Information and Communication Technologies (ICTs) in the context of Erbil City. It could contribute to solutions to the challenges that the city faces, such as scalability, security, and privacy. Furthermore, the research sought to develop an operational framework based on the perceptions, concerns, and expectations of Erbil residents (which the questionnaires helped determine) regarding the retrofitting process of Erbil City into a smart city that prioritizes human needs. The findings could provide a comprehensive perspective that guides Erbil’s urban development by aligning human needs with technology through the development of a “human-centered design framework.” This research emphasizes that Erbil City’s smart retrofitting is not only a technological transformation but also a social, cultural, and human-oriented one. Thus, this could fill the gap between theory and application, establishing a sustainable urban development model.

5. Conclusions

Due to the challenges that Erbil City faces, there is a need to establish smart strategies to tackle them when developing the city in respecting the traditional city heritage and Kurdistan Region Governorate (KRG) regulations while satisfying human needs to improve the quality of their lives in collaboration with smart technology implementation, as there are not enough sufficient, strategic, comprehensive, human-centered, conceptual frameworks integrated with smart technology in Erbil City. This action is required to achieve a “Humane-Smart City” that fulfills the requirements of the city’s residents. The human dimension has been explored in this paper, as it is a crucial component of a beneficial urban future for retrofitting the traditional city of Erbil into a smart city. New technologies must be used to enhance the quality of life, rather than controlling human beings in a way that negatively impacts social life and people’s interactions. Therefore, the current condition of the old city of Erbil has been analyzed and studied, and a strategic road map methodology has been formulated to enhance Erbil City’s retrofitting to become a “smart city” through the implementation of “Information and Communication Technologies (ICTs)” with regard to the human dimension. Thus, the key dimensions and components of smart technology and smart people were studied through a review of the previous literature and then linked to human needs using a conceptual framework model. Moreover, some smart guidelines have been provided to adapt to human needs through a set of smart city performance indicators as human-centered technological strategies to be implemented in Erbil City.
The findings showed that smart technology strategies and smart people are significantly correlated with a city’s overall smartness, and the human-centered approach plays a significant role in the formation of smart cities. With the implementation of smart technology strategies, the traditional city of Erbil (represented with the Buffer Zone generally and Consolidation Areas specifically) can be retrofitted into a smart city. Additionally, the findings demonstrated that the human-centered smart city is a crucial component of the city’s retrofitting and future development.
This study can help urban planners and city initiatives develop traditional cities technologically in a humane manner by implementing the suggested strategic roadmap components within the traditional urban context.
However, the comprehensive proposed framework has some limitations, as follows:
  • The paper assumes that there would be reliable connectivity and sophisticated smart technological infrastructure, which may not be possible in every city location due to some technological and technical challenges.
  • There are some challenges and constraints mentioned in the article, such as the weakness of the current urban policies in Erbil City, some privacy issues among residents, the accessibility of smart technology for all, and the historical value of the city.
  • A specific country’s budget must be allocated to such smart projects.
  • Additional optimization might be necessary to maintain data privacy, urban policies, and energy economy when scaling to very large populations. These elements can be thoroughly examined in future research.
Our suggested roadmap for this research can pave the way for local authorities and urban planners in Erbil City to establish policies and regulations that facilitate the implementation of smart technologies in a human-centered city. Future research can employ different methodologies to validate our findings by empirically testing the proposed framework in smart city projects. Case studies of cities that have implemented a human-centered approach, along with smart technology strategies, to assess their efficacy, may be included. Researchers could, for instance, gather both qualitative and quantitative data from a smart city project to assess how it affects citizens’ civic involvement, social equity, public services, privacy, and well-being. Additionally, researchers could compare and examine how human-centered smart city frameworks are implemented in diverse cultural contexts.

Author Contributions

Conceptualization, A.F.I. and H.A.H.; methodology, A.F.I.; software, A.F.I.; validation, A.F.I. and H.A.H.; formal analysis, A.F.I.; investigation, A.F.I.; resources, A.F.I.; data curation, A.F.I.; writing—original draft preparation. A.F.I.; writing review and editing, A.F.I. and H.A.H.; visualization, A.F.I.; supervision, H.A.H.; project administration, H.A.H.; funding acquisition, A.F.I. All authors have read and agreed to the published version of the manuscript.

Funding

This research received no external funding.

Institutional Review Board Statement

Ethical review and approval were waived for this study as it did not involve personal or sensitive data, interventions, or vulnerable populations. Participation was voluntary and anonymous, in accordance with the ethical standards and academic research guidelines of Salahaddin University—Erbil/Iraq.

Informed Consent Statement

Informed consent for participation was obtained from all subjects involved in the study.

Data Availability Statement

The data presented in this study are available in the article.

Conflicts of Interest

The authors declare no conflicts of interest.

Abbreviations

The following abbreviations are used in this manuscript:
SCsSmart Cities
HSCHumane Smart City
HCHuman-Centered
ITCsInformation and Communication Technologies
IoTsInternet of Things
KRGKurdistan Region Governorate
IEEEInstitute of Electrical and Electronics Engineers
ITUInternational Telecommunication Union
ITInformation Technology
IBMInternational Business Machines Corporation
LEEDLeadership in Energy and Environmental Design
GISGeographic Information System
GPSGlobal Positioning System
AIArtificial Intelligence
BIBusiness Intelligence
MLMachine Learning
HCECRHigh Commission for Erbil Citadel Revitalization
KPIsKey Performance Indicators
SCPIsSmart Cities Performance Indicators
SCATsSmart Cities Assessment Tools
SPSSStatistical Package for the Social Sciences

Appendix A

Figure A1. (a) Republic of Iraq. (b) Kurdistan Region in Northern Iraq. (c) Erbil Governorate in Kurdistan. (d) Erbil City [researcher using Google Maps].
Buildings 15 03597 g0a1

Appendix B

t-tests—means: difference from constant (one-sample case)
Analysis: a priori: compute required sample size
Input: Tail(s) = One
Effect size d = 0.7
α err prob = 0.05
Power (1-β err prob) = 0.95
Output: No centrality parameter δ = 3.4292856
Critical t = 1.7138715
Df = 23
Total sample size = 24
Actual power = 0.9536172
Figure A2. G.power Test for selecting sample size [researcher].
Buildings 15 03597 g0a2

References

  1. Gracias, J.S.; Parnell, G.S.; Specking, E.; Pohl, E.A.; Buchanan, R. Smart Cities—A Structured Literature Review. Smart Cities 2023, 6, 1719–1743. [Google Scholar] [CrossRef]
  2. People Centred-Smart Cities | UN-Habitat. Available online: https://unhabitat.org/programme/people-centred-smart-cities (accessed on 10 August 2025).
  3. People-Centered Smart Cities—UN HABITAT-Flagship Programme.
  4. Sánchez-Corcuera, R.; Nuñez-Marcos, A.; Sesma-Solance, J.; Bilbao-Jayo, A.; Mulero, R.; Zulaika, U.; Azkune, G.; Almeida, A. Smart Cities Survey: Technologies, Application Domains and Challenges for the Cities of the Future. Int. J. Distrib. Sens. Netw. 2019, 15, 155014771985398. [Google Scholar] [CrossRef]
  5. Bibri, S.E.; Krogstie, J. A Scholarly Backcasting Approach to a Novel Model for Smart Sustainable Cities of the Future: Strategic Problem Orientation. City Territ. Archit. 2019, 6, 3. [Google Scholar] [CrossRef]
  6. Schipper, R.; Silvius, A. Characteristics of Smart Sustainable City Development: Implications for Project Management. Smart Cities 2018, 1, 75–97. [Google Scholar] [CrossRef]
  7. Hara, M.; Nagao, T.; Hannoe, S.; Nakamura, J. New Key Performance Indicators for a Smart Sustainable City. Sustainability 2016, 8, 206. [Google Scholar] [CrossRef]
  8. Patrão, C.; Moura, P.; Almeida, A.T.D. Review of Smart City Assessment Tools. Smart Cities 2020, 3, 1117–1132. [Google Scholar] [CrossRef]
  9. Belli, L.; Cilfone, A.; Davoli, L.; Ferrari, G.; Adorni, P.; Di Nocera, F.; Dall’Olio, A.; Pellegrini, C.; Mordacci, M.; Bertolotti, E. IoT-Enabled Smart Sustainable Cities: Challenges and Approaches. Smart Cities 2020, 3, 1039–1071. [Google Scholar] [CrossRef]
  10. González-Reverté, F. Building Sustainable Smart Destinations: An Approach Based on the Development of Spanish Smart Tourism Plans. Sustainability 2019, 11, 6874. [Google Scholar] [CrossRef]
  11. Yigitcanlar, T.; Kamruzzaman, M.D.; Buys, L.; Ioppolo, G.; Sabatini-Marques, J.; Da Costa, E.M.; Yun, J.J. Understanding ‘Smart Cities’: Intertwining Development Drivers with Desired Outcomes in a Multidimensional Framework. Cities 2018, 81, 145–160. [Google Scholar] [CrossRef]
  12. Vinod Kumar, T.M.; Dahiya, B. Smart Economy in Smart Cities. In Smart Economy in Smart Cities; Vinod Kumar, T.M., Ed.; Advances in 21st Century Human Settlements; Springer: Singapore, 2017; pp. 3–76. ISBN 978-981-10-1608-0. [Google Scholar]
  13. Tekin Bilbil, E. The Operationalizing Aspects of Smart Cities: The Case of Turkey’s Smart Strategies. J. Knowl. Econ. 2017, 8, 1032–1048. [Google Scholar] [CrossRef]
  14. Depiné, A.; Eleutheriou, V.; Macedo, M. Human Dimension and the Future of Smart Cities. In V International Congress Creative Cities: Proceedings Book. Icon 14 Scientific Association; 2017; pp. 948–957. [Google Scholar]
  15. Niaros, V. Introducing a Taxonomy of the “Smart City”: Towards a Commons-Oriented Approach? tripleC 2016, 14, 51–61. [Google Scholar] [CrossRef]
  16. Lara, A.P.; Da Costa, E.M.; Furlani, T.Z.; Yigitcanlar, T. Smartness That Matters: Towards a Comprehensive and Human-Centred Characterisation of Smart Cities. J. Open Innov. Technol. Mark. Complex. 2016, 2, 1–13. [Google Scholar] [CrossRef]
  17. Al-Nasrawi, S.; Adams, C.; El-Zaart, A. A Conceptual Multidimensional Model for Assessing Smart Sustainable Cities. JISTEM USP 2015, 12, 541–558. [Google Scholar] [CrossRef]
  18. Mora, L.; Bolici, R. The Development Process of Smart City Strategies: The Case of Barcelona; Juvenes print: Tampere, Finland, 2015. [Google Scholar]
  19. Piro, G.; Cianci, I.; Grieco, L.A.; Boggia, G.; Camarda, P. Information Centric Services in Smart Cities. J. Syst. Softw. 2014, 88, 169–188. [Google Scholar] [CrossRef]
  20. Cavada, M.; Rogers, C.; Hunt, D. Smart Cities: Contradicting Definitions and Unclear Measures. In Proceedings of the 4th World Sustainability Forum, Virtual, 1 November 2014; p. f004. [Google Scholar]
  21. Greco, I.; Bencardino, M. The Paradigm of the Modern City: SMART and SENSEable Cities for Smart, Inclusive and Sustainable Growth. In Proceedings of the Computational Science and Its Applications—ICCSA 2014, Guimaraes, Portugal, 30 June–3 July 2014; Murgante, B., Misra, S., Rocha, A.M.A.C., Torre, C., Rocha, J.G., Falcão, M.I., Taniar, D., Apduhan, B.O., Gervasi, O., Eds.; Lecture Notes in Computer Science. Springer International Publishing: Cham, Germany, 2014; Volume 8580, pp. 579–597, ISBN 978-3-319-09128-0. [Google Scholar]
  22. Schaffers, H.; Ratti, C.; Komninos, N. Special Issue on Smart Applications for Smart Cities—New Approaches to Innovation: Guest Editors’ Introduction. J. Theor. Appl. Electron. Commer. Res. 2012, 7, 9–10. [Google Scholar] [CrossRef]
  23. Nam, T.; Pardo, T.A. Conceptualizing Smart City with Dimensions of Technology, People, and Institutions. In Proceedings of the 12th Annual International Digital Government Research Conference: Digital Government Innovation in Challenging Times, College Park, MD, USA, 12–15 June 2011; ACM: College Park, MD, USA, 2011; pp. 282–291. [Google Scholar]
  24. Zhao, J. Towards Sustainable Cities in China: Analysis and Assessment of Some Chinese Cities in 2008; Springer Science & Business Media: Berlin/Heidelberg, Germany, 2011. [Google Scholar]
  25. Bull, R.; Azennoud, M. Smart Citizens for Smart Cities: Participating in the Future. Proc. Inst. Civ. Eng.-Energy 2016, 169, 93–101. [Google Scholar] [CrossRef]
  26. Kaneti, V.R.; Yamini, B.; Nagarajan, S.; Adaikkammai, A.; Anto Gracious, L.A.; Siva Subramanian, R.; Girija, P. Smart Transportation Systems and Sustainable Urban Mobility. In Revolutionizing Urban Development and Governance with Emerging Technologies; Al Maqousi, A., Almomani, A., Aldweesh, A., Alauthman, M., Eds.; IGI Global: Hershey, PA, USA, 2025; pp. 261–288. ISBN 979-8-3373-1375-7. [Google Scholar]
  27. Ansari, M.S.H.; Farooqui, N.A.; Ishrat, M.; Khan, W. IoT Applications in Urban Infrastructure and Governance. In Revolutionizing Urban Development and Governance with Emerging Technologies; Al Maqousi, A., Almomani, A., Aldweesh, A., Alauthman, M., Eds.; IGI Global: Hershey, PA, USA, 2025; pp. 343–386. ISBN 979-8-3373-1375-7. [Google Scholar]
  28. Bellini, P.; Nesi, P.; Pantaleo, G. IoT-Enabled Smart Cities: A Review of Concepts, Frameworks and Key Technologies. Appl. Sci. 2022, 12, 1607. [Google Scholar] [CrossRef]
  29. Drepaul, N. Sustainable Cities and the Internet of Things (IOT) Technology. Consilience 2020, 22, 39–47. [Google Scholar] [CrossRef]
  30. McKenna, H. Human-Smart Environment Interactions in Smart Cities: Exploring Dimensionalities of Smartness. Future Internet 2020, 12, 79. [Google Scholar] [CrossRef]
  31. Myeong, S.; Jung, Y.; Lee, E. A Study on Determinant Factors in Smart City Development: An Analytic Hierarchy Process Analysis. Sustainability 2018, 10, 2606. [Google Scholar] [CrossRef]
  32. Hunter, G.W.; Vettorato, D.; Sagoe, G. Creating Smart Energy Cities for Sustainability through Project Implementation: A Case Study of Bolzano, Italy. Sustainability 2018, 10, 2167. [Google Scholar] [CrossRef]
  33. Papa, R.; Gargiulo, C.; Galderisi, A. Towards an Urban Planners’ Perspective on Smart City. TeMA 2013, 6, 5–17. [Google Scholar]
  34. Komninos, N. The Architecture of Intelligent Cities: Integrating Human, Collective and Artificial Intelligence to Enhance Knowledge and Innovation. In Proceedings of the 2006 2nd IET International Conference on Intelligent Environments-IE 06, Athens, Greece, 5–6 July 2006; Volume 1, pp. 13–20. [Google Scholar]
  35. Lindskog, H. Smart Communities Initiatives. In Proceedings of the 3rd ISOneWorld Conference, Las Vegas, NV, USA, 14–16 April 2004; Volume 16, pp. 14–16. [Google Scholar]
  36. De Jong, M.; Joss, S.; Schraven, D.; Zhan, C.; Weijnen, M. Sustainable–Smart–Resilient–Low Carbon–Eco–Knowledge Cities; Making Sense of a Multitude of Concepts Promoting Sustainable Urbanization. J. Clean. Prod. 2015, 109, 25–38. [Google Scholar] [CrossRef]
  37. Gupta, S.; Ziaul Mustafa, S.; Kumar, H. Smart People for Smart Cities: A Behavioral Framework for Personality and Roles. In Advances in Smart Cities; Kar, A.K., Gupta, M.P., Vigneswara Ilavarasan, P., Dwivedi, Y.K., Eds.; Chapman and Hall/CRC: Boca Raton, FL, USA, 2017; pp. 23–30. ISBN 978-1-315-15604-0. [Google Scholar]
  38. Landa Oregi, I.; Gonzalez Ochoantesana, I.; Anaya Rodriguez, M. Understanding the Engagement of Citizens in the Regeneration of Urban Spaces Through Human-Centered Design: A Systematic Literature Review. Cities 2025, 168, 106414. [Google Scholar] [CrossRef]
  39. Wang, R.; Huang, C.; Ye, Y. Measuring Street Quality: A Human-Centered Exploration Based on Multi-Sourced Data and Classical Urban Design Theories. Buildings 2024, 14, 3332. [Google Scholar] [CrossRef]
  40. Chang, S.; Smith, M.K. Residents’ Quality of Life in Smart Cities: A Systematic Literature Review. Land 2023, 12, 876. [Google Scholar] [CrossRef]
  41. Calzada, I. The Right to Have Digital Rights in Smart Cities. Sustainability 2021, 13, 11438. [Google Scholar] [CrossRef]
  42. Xu, H.; Geng, X. People-Centric Service Intelligence for Smart Cities. Smart Cities 2019, 2, 135–152. [Google Scholar] [CrossRef]
  43. Alverti, M.N.; Themistocleous, K.; Kyriakidis, P.C.; Hadjimitsis, D.G. A Human Centric Approach on the Analysis of the Smart City Concept: The Case Study of the Limassol City in Cyprus. Adv. Geosci. 2018, 45, 305–320. [Google Scholar] [CrossRef]
  44. Allam, Z.; Newman, P. Redefining the Smart City: Culture, Metabolism and Governance. Smart Cities 2018, 1, 4–25. [Google Scholar] [CrossRef]
  45. Albino, V.; Berardi, U.; Dangelico, R.M. Smart Cities: Definitions, Dimensions, Performance, and Initiatives. J. Urban Technol. 2015, 22, 3–21. [Google Scholar] [CrossRef]
  46. Agee, P.; Gao, X.; Paige, F.; McCoy, A.; Kleiner, B. A Human-Centred Approach to Smart Housing. Build. Res. Inf. 2021, 49, 84–99. [Google Scholar] [CrossRef]
  47. Maqousi, A.; Basu, K.; Almomani, A.; Alkasassbeh, M. Human-Centered Design for Smart Cities: Integrating Social Aspects in Planning and Policy. In Revolutionizing Urban Development and Governance with Emerging Technologies; Al Maqousi, A., Almomani, A., Aldweesh, A., Alauthman, M., Eds.; IGI Global: Hershey, PA, USA, 2025; pp. 463–490. ISBN 979-8-3373-1375-7. [Google Scholar]
  48. Bosch, P.; Jongeneel, S.; Rovers, V.; Neumann, H.-M.; Huovila, A. CITYkeys Indicators for Smart City Projects and Smart Cities. CITYkeys Rep. 2017, 10, 2027. [Google Scholar]
  49. Ishaq Bhatti, M.; Awan, H.M.; Razaq, Z. The Key Performance Indicators (KPIs) and Their Impact on Overall Organizational Performance. Qual. Quant. 2014, 48, 3127–3143. [Google Scholar] [CrossRef]
  50. Higher Committee for Erbil Citadel Revival (HCECR) Planning Areas of The Buffer Zone of The Erbil Citadel 2024.
  51. Higher Committee for Erbil Citadel Revival (HCECR); United Nations Planning and Construction Regulations for the Buffer Zone of Erbil Citadel 2013.
  52. depthMapX Space Syntax—Online Training Platform. Available online: https://www.spacesyntax.online/software-and-manuals/depthmap/ (accessed on 10 August 2025).
  53. Fladd, S.G. Social Syntax: An Approach to Spatial Modification through the Reworking of Space Syntax for Archaeological Applications. J. Anthr. Archaeol. 2017, 47, 127–138. [Google Scholar] [CrossRef]
  54. Software Space Syntax Network. Available online: https://www.spacesyntax.net/software/ (accessed on 10 August 2025).
  55. Pinelo, J.; Turner, A. Introduction to Depthmap; UCL: London, UK, 2010. [Google Scholar]
  56. Turner, A. Depthmap 4—A Researcher’s Handbook; UCL School of Graduate Studies: London, UK, 2004. [Google Scholar]
  57. van Nes, A.; Yamu, C. Introduction to Space Syntax in Urban Studies; Springer Nature: Norway, The Netherlands, 2023; ISBN 978-3-030-59139-7. [Google Scholar]
  58. Matejcek, J.; Pribyl, O. Space Syntax: A Multi-Disciplinary Tool to Understand City Dynamics. In Proceedings of the 2020 Smart City Symposium Prague (SCSP), Virtual, 25 June 2020; IEEE: Prague, Czech Republic, 2020; pp. 1–6. [Google Scholar]
  59. Hillier, B.; Hanson, J. The Social Logic of Space, 1st ed.; Cambridge University Press: Cambridge, UK, 1984; ISBN 13 978-0-521-23365-1. [Google Scholar]
  60. Hillier, B.; Burdett, R.; Peponis, J.; Penn, A. Creating Life: Or, Does Architecture Determine Anything? Available online: https://discovery.ucl.ac.uk/id/eprint/101/ (accessed on 10 August 2025).
  61. Esposito, D.; Santoro, S.; Camarda, D. Agent-Based Analysis of Urban Spaces Using Space Syntax and Spatial Cognition Approaches: A Case Study in Bari, Italy. Sustainability 2020, 12, 4625. [Google Scholar] [CrossRef]
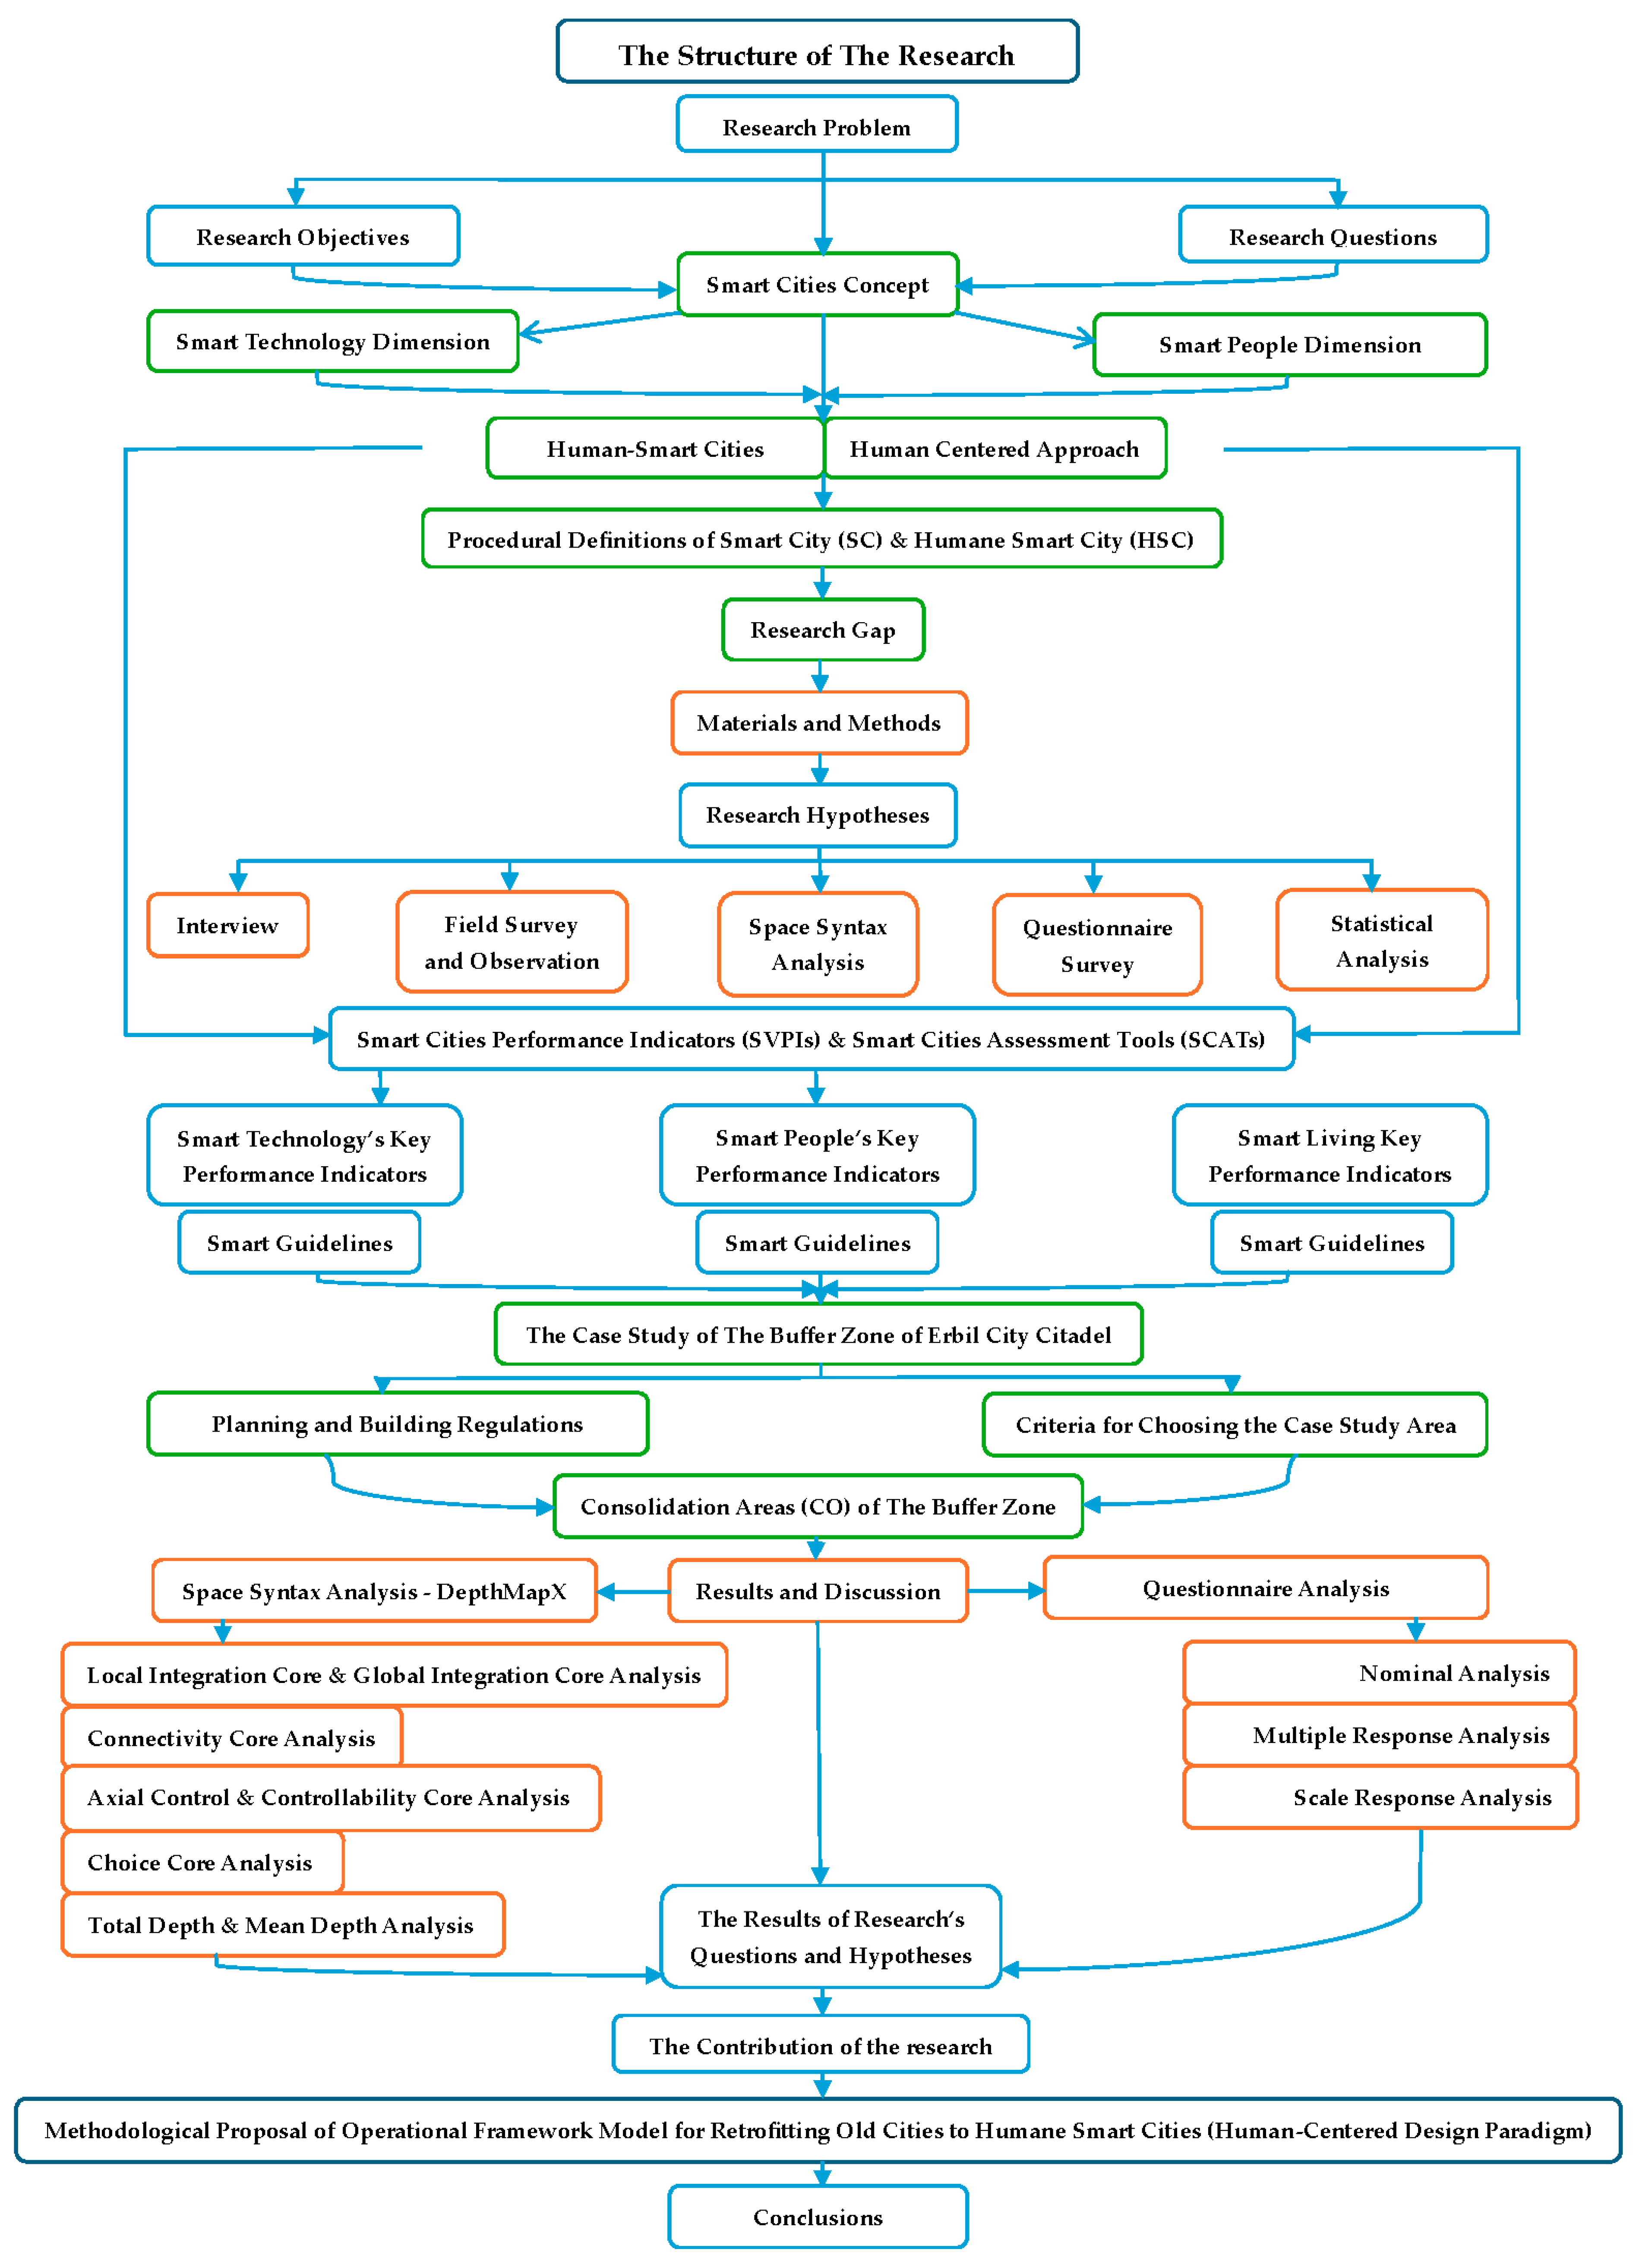
Figure 1. The structure of the research [researcher].
Buildings 15 03597 g001
Figure 2. Smart technology architecture for smart cities [researcher].
Buildings 15 03597 g002
Figure 3. Smart people architecture for smart cities [researcher].
Buildings 15 03597 g003
Figure 4. Erbil City from satellite view [researcher using Google Earth].
Buildings 15 03597 g004
Figure 5. Enlarged satellite view showing the Buffer Zone [researcher using Google Earth GIS and AutoCAD].
Buildings 15 03597 g005
Figure 6. Buffer Zone of Erbil Citadel [50].
Buildings 15 03597 g006
Figure 7. Planning areas of the Buffer Zone of the Erbil Citadel [50].
Buildings 15 03597 g007
Figure 8. Consolidation Areas (CO) [51].
Buildings 15 03597 g008
Figure 9. Consolidation Area 1 (CO1) of the Buffer Zone of Erbil [researcher through field survey].
Buildings 15 03597 g009aBuildings 15 03597 g009b
Figure 10. Consolidation Area 2 (CO2) of the Buffer Zone of Erbil [researcher through field survey].
Buildings 15 03597 g010
Figure 11. Consolidation Area 3 (CO3) of the Buffer Zone of Erbil [researcher through field survey].
Buildings 15 03597 g011aBuildings 15 03597 g011b
Figure 12. (a) Local integration analysis for the Buffer Zone of Erbil Citadel. (b) Global integration analysis for the Buffer Zone of Erbil Citadel [researcher using space syntax—DepthMapX].
Buildings 15 03597 g012
Figure 13. (a) Global connectivity analysis for the Buffer Zone. (b) Local connectivity analysis for the Buffer Zone. (c) Visual connectivity analysis for the Buffer Zone of Erbil Citadel [researcher using space syntax—DepthMapX].
Buildings 15 03597 g013
Figure 14. (a) Control analysis for the Buffer Zone of Erbil Citadel. (b) Controllability analysis for the Buffer Zone of Erbil Citadel [researcher using space syntax—DepthMapX].
Buildings 15 03597 g014
Figure 15. (a) Global choice analysis for the Buffer Zone of Erbil Citadel. (b) Local choice analysis for the Buffer Zone of Erbil Citadel [researcher using space syntax—DepthMapX].
Buildings 15 03597 g015
Figure 16. (a) Global Total Depth analysis for the Buffer Zone. (b) Local Total Depth analysis for the Buffer Zone. (c) Global Mean Depth analysis for the Buffer Zone. (d) Local Mean Depth analysis for the Buffer Zone of Erbil Citadel [researcher using space syntax—DepthMapX].
Buildings 15 03597 g016
Figure 17. (a,b) Nominal analysis results—perceptions of and opportunities for smart technology implementation [Researcher].
Buildings 15 03597 g017
Figure 18. (ac) Nominal analysis results—challenges in implementing smart technology strategies in old cities [researcher].
Buildings 15 03597 g018
Figure 19. (a,b) Nominal analysis results—human-centered approach integration results [researcher].
Buildings 15 03597 g019
Figure 20. (a,b) Nominal analysis results—people and community engagement results [researcher].
Buildings 15 03597 g020
Figure 21. Multiple response analysis results—perceptions of and opportunities for smart city implementation [researcher].
Buildings 15 03597 g021
Figure 22. (ac); Multiple response analysis results—human-centered approach integration [researcher].
Buildings 15 03597 g022
Figure 23. (a,b); Multiple response analysis results—people and community engagement [researcher].
Buildings 15 03597 g023
Figure 24. Methodological proposal for an operational framework model for retrofitting old cities into humane smart cities (human-centered design paradigm) [researcher].
Buildings 15 03597 g024
Table 1. Smart city definitions [gathered from the literature and modified by the researcher].
Literature/AuthorsYearSmart City Definitions
Gracias, J.S. et al. [1]2023
  • Smart cities offer an effective and efficient service environment that enhances urban quality of life and promotes sustainability through digital, communication, and data analytics technologies. The goal is to establish an efficient and effective service environment that encourages sustainability and economic progress. The concept depends on the use of technology and data-driven solutions to address urban challenges, enhance living conditions, and promote sustainability [1].
Patrão, C. et al. [8]2020
  • The International Telecommunication Union (ITU) defines the “Smart City” as a city that uses Information and Communication Technologies (ICTs) and other means to enhance quality of life, the effectiveness of urban operation and services, and competitiveness while also ensuring that it satisfies the needs of both current and future generations in terms of economic, social, and environmental as well as cultural aspects [8].
Belli, L. et al. [9]2020
  • The “Smart City” is a well-defined geographic area where advanced technologies, including energy production, logistics, and Information and Communication Technologies (ICTs), work together to improve inhabitants’ well-being, involvement, and access to intelligent development and a high-quality environment [9].
González-Reverté, F. [10]2019
  • A “smart city” is a community that uses technology and the Internet to manage resources efficiently and engage in participatory governance to improve quality of life and economic progress. In a “smart city,” Information and Communication Technologies (ICTs) are used to complement human and natural resources and physical and social infrastructure, enhancing the delivery of public and social services, revitalizing the urban environment, and improving public service accessibility, energy efficiency, safety, and environmental quality [10].
Yigitcanlar, T. et al. [11]2018
  • The “smart city” refers to any technological innovation in urban design, development, operation, and management, such as the application of smart mobility solutions to alleviate traffic problems in urban areas. This city is knowledge-based, creative, sustainable, digital, intelligent, and technological [11].
Schipper, R. P. J. and Silvius, A. J. G. [6]2018
  • A city becomes smart when investments in human capital and information technology (IT) infrastructure generate long-term growth and improve the quality of life. The “Smart City” components are technology, people, infrastructure, the economy, governance, the environment, mobility, and services [6].
Kumar, T.M. and Dahiya, B. [12]2017
  • A “Smart City” uses smart computing technology to increase the intelligence, connectivity, and effectiveness of its vital infrastructure and services, including real estate, utilities, public safety, education, healthcare, and city administration. It is a high-performing, equitable, safe, livable, and sustainable urban region that excels in public service delivery, energy conservation, environmental preservation, and other natural resource management, as well as economics, governance of people, mobility, and the environment [12].
Tekin Bilbil, E. [13]2017
  • A city is considered smart, according to the “International Business Machines Corporation (IBM),” if all its citizens consistently have a higher standard of living. It works effectively with all its stakeholders, leveraging technology to achieve its objectives, and operates efficiently and sustainably [13].
Depiné, A. et al. [14]2017
  • A “smart city” is a city that is based on an ICT system to collect data about urban life, security cameras, sanitation, traffic lights, and parking spaces, which are associated with human capital. It is monitored by systems and technology platforms that are informed by smart individuals who possess the capability of learning and education, contributing to urban planning and management, urban development, and transformation, and participating in decision-making through interaction, innovation, and collaboration [14].
Niaros, V. [15]2016
  • A “Smart City” is a city that includes better energy and waste management, reduced water consumption, enhanced citizen mobility, ICT solutions that meet people’s needs, and crime prevention [15].
Hara, M. et al. [7]2016
  • The “Smart City” is a knowledge-based city that uses ICTs to meet citizens’ needs for services and provide comfortable mobility, energy, and natural resource conservation [7].
Lara, A.P. et al. [16]2016
  • A “Smart City” is a community that systematically promotes the overall well-being of all of its residents and is flexible enough to proactively and sustainably enhance each member’s quality of life and employment [16].
Al-Nasrawi, S. et al. [17]2015
  • “Smart Cities” monitor and integrate their infrastructure, including roads, bridges, water, power, subways, airports, buildings, resources, communications, and maintenance activities, in addition to monitoring security issues and increasing services to inhabitants [17].
Mora, L. and Bolici, R. [18]2015
  • “Smart Cities” are intelligent urban areas that use ICT to solve regional problems and advance social, economic, and/or environmental sustainability [18].
Piro, J. et al. [19]2014
  • A “smart city” refers to an urban setting where pervasive ICT technologies enable residents to receive innovative services that enhance their quality of life overall [19].
Cavada, M., Hunt, D., and Rogers, C. [20]2014
  • Smart cities are defined by the “British Standards Institution” as places where human, digital, and physical systems have been skillfully integrated to produce a built environment that ensures the future prosperity, sustainability, and inclusion of its inhabitants [20].
Greco, I. and Bencardino, M. [21]2014
  • A “smart city” is a city that can support the development of public–private partnerships, include the public in the formulation of public policy, and increasingly emphasize participatory procedures, such as online discussions and consultations, and the activation of workshops on engaged creativity [21].
Schaffers, S. et al. [22]2012
  • A “Smart City” is an urban area of the future that is efficient, safe, eco-friendly, and equipped with cutting-edge networks, sensors, and electronics to support long-term economic growth and high standards of living [22].
Nam and Pardo [23]2011
  • “Smart Cities” are employing smart technologies to integrate public safety, utilities, healthcare, education, and transportation with other city infrastructure services. These intelligent, efficient, and networked cities excel in terms of their economy, governance, people, mobility, quality of life, and environment. They are also more equitable, sustainable, livable, and efficient [23].
Zhao, J. [24]2011
  • The “Smart City” addresses cultural, ecological, political, social, institutional, and economic issues without endangering future generations to improve the quality of life [24].
Table 2. Terms related to the “Techno-Centric Approach” of the “Smart Cities” [Gathered and modified by the researcher].
FieldsTermsDefinitions
Infrastructure and ICTs
Adoption of economic and social development methods based on the supply of modern infrastructure, particularly in the widespread usage of ICTs [16].
Ubiquitous
city
-
An urban environment in which ubiquitous technologies are integrated into physical objects and buildings to increase the efficiency of urban functions and, as a result, the quality of people’s lives [16].
-
It enables urban components, such as people, buildings, infrastructure, and open space, to access ubiquitous computing. Its goal is to create a constructed environment where every person can access any service from any device, anywhere, and at any time [23].
Digital city
-
It is a digital community area used to support and complement activities and functions that occur in the city’s physical environment [34].
-
It is a linked city that integrates broadband communications infrastructure, shares flexible networks, and includes service-oriented computer architecture based on open industry standards, offering innovative services to meet the demands of governments, consumers, organizations, and enterprises, and connecting them [23].
Smart
community
-
A community in which government, business, and people recognize the power of information technology and make a conscious decision to use it to improve life and work in their town [35].
Informational
city
-
An information city is a digital ecosystem that collects data from local communities and makes this data available to the public through online portals. Many residents of the city can live and work online. It is a city that serves as a hub for commercial, social, and civic services and supports social connections among individuals, corporations, and government agencies [23].
Knowledge-based society and a creative economy
Increasing competitiveness and aligning with the so-called knowledge economy, with an emphasis on fostering entrepreneurship, creativity, and innovation [16].
Intelligent city
-
It is a place with great potential for learning and innovation thanks to its residents’ creativity, knowledge-generating institutions, and digital infrastructure for communication and knowledge management [34].
-
A city that has all of the infrastructure and infrastructure of information technology, with electronic, telecommunications, and mechanical technology. It encourages study, technical advancement, and innovation. Every intelligent city has digital elements [23].
Creative city
-
Within a competitive global context, creative cities are about how local urban places may be reimagined, regenerated, and repurposed [16].
Knowledge
city
-
Integrated communities that physically and institutionally blend the operations of a science park with civic and residential functions [36].
-
A knowledge city is like a learning city. It refers to a city that was built specifically to foster the growth of knowledge. Knowledge-based urban development has emerged as a critical component of knowledge city development [23].
-
It is a place where fresh information is generated regularly, as the entire social system is dedicated to the creation, dissemination, and application of knowledge, which can then be leveraged and utilized by businesses and organizations [16].
Innovative
city
-
It is a pattern of urban development that utilizes creative solutions to address city challenges, aiming to achieve urban rebirth and drive long-term urban growth through innovation [16].
Table 3. Terms related to the “Human-Centric Approach” of “Smart Cities” [gathered and modified by the researcher].
FieldsTermsDefinitions
Human infrastructure
Investment in social and human capital; citizen participation in governance processes; and the formation of public–private partnerships to promote activities and initiatives [16].
Human
smart city
  • Application of citizen-centric and co-design participatory approaches, development, and production of the services of smart cities that balance the sensors’ technical smartness, meters, and infrastructure with clarity of vision, social interaction in the physical environment, citizen empowerment, and public citizens’ partnership [16].
Humane city
  • Environments and places where people enjoy life and work and have many opportunities to exploit their human possibilities and lead a creative life [16].
Learning city
  • A town that realizes and understands the vital role of learning and education in the development of social stability, basic prosperity, and personal satisfaction, and creatively and sensitively mobilizes all of its physical, human, and financial resources to help all of its citizens reach their whole human possibility [16].
Table 4. Smart guidelines for smart technology Key Performance Indicators for smart cities [researcher].
Indicators/Dependent VariablesPossible Values/Independent Variables
Smart functionality and smart devices—Information and Communication Technologies (ICTs) and Internet of Things (IoT)The integration of smart devices involves technological applications, such as; lighting, air conditioning control (HVAC systems), heat, and temperature-sensitive sensors, smart parking, weather tracking, environmental pollution, security systems, digital camera systems, and the detection of energy or water shortages.
Using smart computing technology and network technologies in healthcare, education, and transportation.
Sensors and actuators, monitoring, and smart meters.
Automated control devices.
Improved quality of life—improved sustainability efficiencySmart infrastructure services.
Water resource management.
Healthcare and education.
Environmental sensors.
Waste management.
Smart energy—energy efficiency.
Smart mobility and transportation.
The integration of information, the environment, technical aspects, people, and social aspects.
Using new technologies to connect people and information to produce a sustainable, greener city.
Enhancing life quality through the interaction between urban technologies and knowledge-based activities, and integrating smart technologies into urban design.
People’s behavior and human rightsUsing artificial intelligence for monitoring people’s behavior and tracking human rights in cyberspace.
Intelligent surveillance.
Online citizens’ engagement and multi-level collaboration (public—local—private).
Using smart computing technology improves public safety and security.
Digital equity and access to technologyNetworking and communication.
Software and public platforms.
Cloud computing.
The interrelation between users and technology.
Lowering digital inequity and increasing digital capacity.
High-speed internet.
Innovation and creativityArtificial intelligence.
Improved urban spatial intelligence (hardware, software, programming technologies, information, and communication).
Data analysis and machine learning.
Adopting innovative systems, communication, and information technologies in the local community.
The integration between networks, databases, analytics, applications, and users.
Decision-making innovation.
Table 5. Smart guidelines for smart people Key Performance Indicators for smart cities [researcher].
Indicators/Dependent VariablesPossible Values/Independent Variables
Education, learning, innovation, and awareness issuesKnowledge and smart education.
Developing learning environments.
Enabling local skills and innovation.
Human and social capital, as well as inventiveness.
Raising citizens’ awareness, e.g., training courses.
Strengthening communities and building capacities.
Employment rateProviding jobs and employment.
People-centered investment.
Optimizing business processes, e.g., using smart integrated computing systems and network technology.
Building capabilities, qualifications, and citizens’ skills.
HealthcareProviding smart health centers and e-health.
Emergency health quick response system.
ParticipationCitizens’ participation, social engagement, leadership, and decision-making in public life.
Promoting public participation in policymaking.
Citizens’ engagement in the development of the city.
People’s interaction in real and virtual spaces, involvement, and collaboration.
Cooperation and collaboration between public institutions, the private sector, and voluntary organizations.
People’s inequity, social inequity, poverty, human rights, and people’s behaviorUrban diversity and cultural mix.
Social cohesion and interaction.
Digital equity and access to ICT connectivity.
Freedom of expression.
Enhancing cultural aspects.
Using artificial intelligence to monitor people’s behavior and protect human rights in cyberspace.
Urban violence, behavior, insecurity, data safety, privacy, and surveillanceKnowledge-based urban development.
Urban security, including monitoring, alarm systems, and cameras.
Enhanced access to urban mobility.
Establishing digital strategies that are human-centered, privacy-enhanced, and rights-preserving.
CommunicationPeople’s interactions and institutions’ collaboration.
Information and Communication Technology (ICT) connectivity.
Intelligent communication network.
Digital equity: access to technological servicesPeople-centered digitalization.
Using Information and Communication Technology and the Internet of Things.
The collaboration between residents, businesses, and governmental organizations through digital platforms.
Table 6. Smart guidelines for smart living’s Key Performance Indicators for smart cities [researcher].
Indicators/Dependent VariablesPossible Values/Independent Variables
Quality of life (livability)Life enrichment (home, healthcare, community, public spaces, and education).
The interaction between the information environment and people.
The interaction between technical, environmental, and social aspects.
Personal safety.
Social cohesion and cooperation.
Affordable housingSmart buildings and housing.
Creating a range of housing opportunities and options.
Cultural issuesEnhancing cultural facilities and tourism alternatives.
Socio-cultural variety.
Availability of cultural and educational facilities and tourism attractions.
Safety and security, accidents, crimes, and violenceSmart emergency response.
Personal monitoring.
Smart public lighting.
Smart surveillance systems: sensors, cameras, and other devices.
Public services and administration (public safety, food safety, traffic safety, and environmental protection).
Healthcare supportEnhancing the smart healthcare system—connected by a smart network.
Green health facilities.
Emergency management.
Access to public servicesAvailability of social services.
Equitable access to services.
Online services.
Smart apps and networking.
Access to community services.
Intelligent, real-time sensing and online servicesGPS tracking sensors.
Linking and sharing information through GIS and GPS.
Using ICT and IoT.
Using smart computing technologies represented by hardware, software, and networks.
The integration of technological, social, and scientific solutions.
Diversification and social cohesionThe adoption of mixed land use, people’s proximity, and suitable interaction spaces.
Social cooperation.
Emphasizing spatial proximity and promoting a sustainable community.
Working issuesEmpowering citizens with digital options for working remotely.
Easy routes and reduced traffic.
Urban sustainabilityEstablishing walkable residential neighborhoods that depend on pedestrian movement.
Preserving open spaces, agricultural land, and natural beauty.
Knowledge-based urban development.
Inclusive, resilient, efficient, livable, functional, equitable, and affluent places and a safer city.
City attractivenessEnhancement of neighborhood identity.
Promoting environmental attractiveness.
Encouraging attractive communities and a sense of place.
Prosperity—povertySocial equity and inclusion.
Promoting socio-economic development.
Reducing fuel poverty by using clean energy.
Increasing productivity and utilizing resources.
Table 7. Categorization of planning areas of the Buffer Zone of Erbil Citadel [51] (edited by the researcher).
S.Categorization of Planning Areas of The Buffer ZoneConditions and Regulations
1.Conservation Areas (CA)Areas with a high degree of heritage value and a high level of protection and conservation.
2.Transitional Areas (TR)Historic areas, but with some modern buildings. Located between the conservation area and the modern building area.
3.Reconfiguration Areas (RE)Groups of modern buildings form the edge of the historic preservation area.
4.Urban Corridors (UC)Areas with intense commercial concentration. They are located along major radial roads and ring roads.
5.Consolidation Areas (CO)Areas that aim to enhance the existing classification of buildings and urban structures. Characterized by low-density residential use, and new uses, such as facilities and civil services, can be introduced.
6.New Courtyard Home Development Areas (NC)Areas that aim to preserve the classification of courtyard houses.
7.Renewal Areas (RA)Areas that aim to revive or redevelop parts of the building fabric. They are characterized by a low-quality built environment, such as abandoned land or uses that conflict with the surrounding environment.
Table 8. “Consolidation Area (CO)” characteristics and building form parameters [researcher in collaboration with HCECR [50]].
Planning AreaBuilding Form Parameters
Maximum Building HeightBuilding TypologyPlot Area and Maximum Plot CoverageBuilding SetbackValue and Construction ConditionStandard of Living
Consolidation AreaCO1 (Al-Minara and Al-Mustawfi)3 stories (12 m), 1 undergroundDetached typologies, except for the following:
  • Corner plots.
  • When the adjacent property has an existing boundary wall at least 6 m in height and half of the length of the plot.
  • Two buildings on a standard plot.
  • Plot smaller than minimum.
-
Larger plot area, between 250 and 650 m2
-
Coverage 75%
Front: 2 m
Side: 1.5 m
Back in is not compulsory
Third-floor recess required
High structural value and good conditionHigh standard of living
CO2 (Al-Minara, Al-Mustawfi, and North Khanqa)3 stories (12 m), 1 undergroundAttached, detached, or semi-detached (optional) with front setbacks.
If the plot has a triangular shape and two main facades, no front setback is required.
-
Medium-sized plot area, between 200 and 350 m2
-
Coverage 80%
Front: 2 m
Side (if applicable): 1.5 m
Back in is not compulsory
Third-floor recess required
Medium structural value and fair structural conditionMedium standard of living
CO3 (Al-Mustawfi and North Khanqa)3 stories (12 m), 1 undergroundAttached or courtyard houses required.
-
Medium-sized plot area, between 200 and 350 m2
-
Coverage 80% of plot area
In exceptional cases (corner plots of area < 100 m2 or plots of area < 42 m2), the plot coverage can be increased to 100%
No front or side setback permitted
Third-floor recess required
Poor structural value and poor structural conditionPoor standard of living
CO4A (Al-Minara)2 stories (8 m),
1 underground
Attached, detached, or semi-detached (optional) with front setback.
-
Medium-sized plot area, between 200 and 350 m2
-
Coverage 80%
Front: 2 m
Side (if applicable) 1.5 m
Back in is not compulsory
Very poor structural value and poor structural conditionPoor standard of living
CO4B (Al-Minara)2 stories (8 m),
1 or 2 underground
Free-standing volumes.
-
Medium-sized plot area, between 200 and 350 m2
-
Coverage 60%
Front setbacks are a minimum of 6 mVery poor structural value and poor structural conditionPoor standard of living
Table 9. Space syntax minimum, average, and maximum) values for the studied variables [researcher using DepthMapX].
S.AttributeMinimumAverageMaximum
1.Node Count20,72620,72620,726
2.Line Length0.001234910.4698573.57853
3.Local Integration1.231042.604844.40888
4.Global Integration1.149295.340588.30463
5.Total Local Connectivity128690,9452.26781 × 106
6.Global Connectivity3174.8211135
7.Control0.02449913.5302
8.Controllability0.02236420.192650.714286
9.Local Choice04522.47251792
10.Global Choice096420.41.06002 × 107
11.Local Mean Depth1.857142.600862.92683
12.Global Mean Depth3.66625.6523710.5488
13.Local Total Depth137357.3424,690
14.Global Total Depth75,982117,145218,624
Table 10. One-sample statistics and one-sample test analysis (test value = 3) [researcher].
HypothesisItemsNMeanStd. DeviationStd. Error Meant-testp-value
H1How important is it to adopt a human-centered approach when planning smart city projects or initiatives?204.550.7590.1709.1310.000 **
H2How important do you think it is to ensure that smart city technologies are accessible to all residents, including the elderly and disadvantaged populations?204.000.9180.2054.8730.000 **
H2To what extent do you think the integration of smart technologies can harm the historical or architectural value of old cities?203.800.6960.1565.1410.000 **
H1Do you believe that the current urban policies in your city adequately support the human-centered approach to smart city development?203.100.9680.2160.4620.649
H1How optimistic are you about the potential for implementing human-centered smart city strategies in your old city?203.650.7450.1673.901<0.001 **
** sig. at <0.01.
Table 11. One-sample statistics and one-sample test analysis (test value = 2.5) [researcher].
HypothesisItemsNMeanStd. DeviationStd. Error Meant-testp-value
H1What level of community engagement do you believe is necessary for successful smart city implementation in old urban areas?203.200.6960.1564.499<0.001 **
** sig. at <0.01.
Disclaimer/Publisher’s Note: The statements, opinions and data contained in all publications are solely those of the individual author(s) and contributor(s) and not of MDPI and/or the editor(s). MDPI and/or the editor(s) disclaim responsibility for any injury to people or property resulting from any ideas, methods, instructions or products referred to in the content.