Article

Seismic Collapse of Frictionally Isolated Timber Buildings in Subduction Zones: An Assessment Considering Slider Impact

by
Diego Quizanga
1,2,*,
José Luis Almazán
1,3 and
Pablo Torres-Rodas
4
1
Department of Structural and Geotechnical Engineering, Pontificia Universidad Católica de Chile, Av. Vicuña Mackenna 4860, Santiago 7820436, Chile
2
Carrera de Ingeniería Civil, Facultad de Ingeniería y Ciencias Aplicadas, Universidad Central del Ecuador, Gaspar de Carvajal, Quito 170521, Ecuador
3
Centro Nacional de Excelencia para la Industria de la Madera (CENAMAD) & Centro de Innovación en Madera (CIM UC-CORMA), Pontificia Universidad Católica de Chile, Av. Vicuña Mackenna 4860, Santiago 7820436, Chile
4
Colegio de Ciencias e Ingenierías, Campus Cumbaya, Universidad San Francisco de Quito USFQ, Quito 170521, Ecuador
*
Author to whom correspondence should be addressed.
Buildings 2025, 15(19), 3593; https://doi.org/10.3390/buildings15193593
Submission received: 12 August 2025 / Revised: 10 September 2025 / Accepted: 13 September 2025 / Published: 7 October 2025
(This article belongs to the Special Issue Research on Timber and Timber–Concrete Buildings)

Abstract

Due to their potential to reduce greenhouse gas emissions, light-frame timber buildings (LFTBs) are widely used in seismically active regions. However, their construction in these areas remains limited, primarily due to the high costs associated with continuous anchor tie systems (ATSs), which are required to withstand significant seismic forces. To address this challenge, frictional seismic isolation offers an alternative by enhancing seismic protection. Although frictional base isolation is an effective mitigation strategy, its performance can be compromised by extreme ground motions that induce large lateral displacements, resulting in impacts between the sliders and the perimeter protection ring. The effects of these internal lateral impacts on base-isolated LFTBs remain largely unexplored. To fill this knowledge gap, this study evaluates the collapse capacity of a set of base-isolated LFTBs representative of Chilean real estate developments. Nonlinear numerical models were developed in the OpenSeesPy platform to capture the nonlinear behavior of the superstructure, including the impact effects within the frictional isolation system. Incremental dynamic analyses following the FEMA P695 methodology were performed using subduction ground motions. Collapse margin ratios (CMRs) and fragility curves were derived to quantify seismic performance. Results indicate that frictional base-isolated LFTBs can achieve acceptable collapse safety without ATS, even with compact-size bearings. Code-conforming archetypes achieved CMRs ranging from 1.24 to 1.55, indicating sufficient safety margins. These findings support the cost-effective implementation of frictional base isolation in mid-rise timber construction for high-seismic regions.

1. Introduction

History has shown that major earthquakes can devastate communities, causing extensive loss of life, population displacement, and severe economic disruption. Events such as the 1994 Northridge (CA, USA), 1995 Kobe (Japan), 2010 Maule (Chile), 2011 Tohoku (Japan), and 2023 Turkey–Syria earthquakes resulted in hundreds to thousands of casualties and widespread building damage, with extensive building collapses in several cases. These disasters highlight the urgent need for effective preventive measures in building design, particularly for structural systems in seismically active regions. Among such measures, seismic isolation and other innovative protective technologies have proven effective in reducing building damage and safeguarding occupants.
Beyond seismic safety, the building sector faces the pressing challenge of sustainability, as it contributes significantly to global greenhouse gas emissions. Timber buildings have therefore gained increasing attention as a sustainable alternative, combining reduced environmental impacts with efficient construction practices [1]. Among various timber construction methods, light-frame timber buildings (LFTBs) are increasingly used in earthquake-prone regions such as the USA, Canada, Japan, and Chile due to their lightweight components and ease of assembly [2,3]. LFTBs rely primarily on shear walls, which are anchored either through discrete hold-downs or continuous tie-down rod systems (ATS). Although their seismic performance has generally been satisfactory, nonstructural components such as sheathing and cladding remain vulnerable, often leading to high repair costs, as documented, for instance, after the Northridge earthquake, repair costs of light-frame timber structures were estimated to exceed USD 20 billion [4,5].
Additionally, post-earthquake investigations have revealed potential failure mechanisms, such as soft-story effects observed in the Loma Prieta (1989) and Northridge (1994) earthquakes [6,7]. The high cost of ATSs and other connection components in mid-rise LFTBs further limits their competitiveness compared to steel or reinforced concrete structures. To address these challenges, cost-effective seismic protection strategies are needed to enhance the seismic performance and resilience of LFTBs. Among available protective technologies, seismic isolation has been demonstrated to be one of the most effective methods for mitigating earthquake-induced damage in concrete and steel structures. For instance, in reinforced concrete buildings, isolation systems have been shown to reduce inter-story drift and mitigate nonstructural damage. In steel moment frames, isolation improves global stability and delays the onset of plastic mechanisms [8]. More advanced technologies, such as hybrid elastomeric–friction bearings and self-centering sliding systems, have also been investigated to improve energy dissipation and re-centering capacity in RC and steel applications [9]. These studies highlight the versatility of isolation technologies across different structural typologies.
In timber structures, experimental tests have investigated seismic isolation using elastomeric and frictional bearings [10,11,12,13]. Regarding these two isolation system types, various authors [14,15] have concluded that frictional isolation is the most suitable technique for protecting light structures due to its lateral flexibility and weight-proportional restoring force [11,12]. Furthermore, frictional isolation has been shown to significantly reduce peak floor accelerations (PFAs), inter-story drift ratios (PDRs), and overall structural and nonstructural damage, all without substantial cost increases [12,13]
Nevertheless, under severe seismic loading, friction-based isolation systems may experience impact against surrounding protective elements. This can occur due to pounding between the base-isolated structure and perimeter moat walls or, in compact configurations, between the slider and a perimeter protection ring. Such pounding may amplify floor accelerations, increase base shear forces, and elevate the collapse risk, as reported in past studies [16,17]. Previous research on reinforced concrete and steel buildings has examined these effects in detail, showing that the structural response depends strongly on the superstructure’s ductility, mass distribution, and the isolation system’s restoring and energy dissipation properties [18,19]. For example, in reinforced concrete buildings, this impact has been shown to increase interstory drifts and accelerate nonstructural damage, while in steel moment frames, pounding effects may induce local plastic mechanisms and shorten the isolation period. These findings underscore the importance of accounting for impact phenomena when assessing seismic isolation performance. However, despite these advances in concrete and steel systems, similar investigations on base-isolated LFTBs remain scarce, particularly under subduction ground motions, which motivates the present study.
Although prior experimental and numerical studies have provided valuable insights into the seismic response of isolated LFTBs [20,21], the existing research has not yet quantified the effects of the impact between the slider and perimeter protection ring on global building metrics, such as probability of collapse. This knowledge gap is particularly critical for high-seismic regions like Chile, where LFTBs are gaining popularity, yet the national building code NCh2745 [22] provides no explicit provisions for seismic isolation in timber buildings. Furthermore, while FEMA P695 [23] provides a framework for assessing collapse risk in structural systems, its application to isolated LFTBs remains largely unexplored.
This study addresses this knowledge gap by evaluating the collapse fragility of mid-rise, frictionally isolated LFTBs subjected to subduction ground motions. Archetypes representative of Chilean real estate developments were modeled in OpenSeesPy [24] to capture nonlinear superstructure behavior, isolator friction, impact mechanisms, and geometric nonlinearity. Incremental dynamic analyses [25] (IDAs) were conducted in accordance with the FEMA P695 framework, and collapse margin ratios (CMRs) and fragility curves were derived. The novelty of this work lies in (i) explicitly quantifying the effects of slider–perimeter impact on the collapse safety of timber buildings, (ii) applying the FEMA P695 methodology to isolated LFTBs under subduction motions, and (iii) demonstrating that compact frictional bearings can achieve sufficient safety margins without continuous anchor tie systems (ATS), offering a cost-effective and practical pathway for the seismic protection of mid-rise timber construction in high-seismic regions.

2. Archetype Buildings

The primary purpose of this study was to evaluate the effect of frictional isolators, considering the impact of the slider and perimeter protection ring on the seismic performance of light-frame timber buildings (LFTBs). To this end, four archetype five-story residential buildings were created, reflecting the prevalent mid-rise timber designs currently adopted in Chile. The archetypes were developed based on the most common configurations in the Chilean real estate sector as part of the research project “Seismic performance factors for timber buildings with wood frame shear walls.” The design process incorporated current Chilean standards, as well as previous experimental and numerical research on shear wall systems and isolation devices. These archetypes represent typical mid-rise timber residential buildings promoted by the Chilean real estate sector in recent years, where timber construction has gained traction as a sustainable alternative to reinforced concrete. In practice, such developments are characterized by regular floor plans, repetitive wall layouts, and uniform story heights to ensure both architectural functionality and seismic efficiency. Floor plan “P,” adopted in this study, reflects these design practices and has been identified in prior research as one of the most common configurations in Chilean timber housing projects [26]. By grounding the archetypes in these widely adopted layouts, the analysis captures realistic structural and architectural features observed in actual construction.

2.1. Architectural Configuration and Structural Layout

The typical floor plan “P” adopted in this study measures 19.42 m by 27.20 m, with a total floor area of 494 m2. Among the configurations studied by Estrella et al. [26], this floor plan, “P”, has a relatively square shape and the lowest aspect ratio, which provides favorable seismic behavior. Each archetype building consists of five stories with frictional bearings intended for residential use, with a typical floor height of 2.8 m. The lateral force-resisting system comprises strong wood-frame shear walls (SSWs) composed of five 38 × 135 mm end studs and intermediate studs spaced at 400 mm intervals. These frames are sheathed with 11.1 mm oriented strand board (OSB) panels in either single or double configurations. The shear walls used in the superstructure are based on experimental testing results by Guiñez et al. [27], with nonlinear model parameters as reported by Estrella et al. [28]. The floor diaphragms consist of a structural grid of 302 mm deep I-joist wood beams topped with an OSB panel slab. Figure 1a shows the adopted architectural layout and global axes. Figure 1b illustrates the shear wall layout of a comparable fixed-base design previously studied by Estrella et al., which serves as a reference for comparing wall density and nail spacing in the current isolated designs.
Four archetype buildings were developed to analyze the influence of the superstructure and isolation system properties on the seismic performance of LFTBs. These differed in terms of target peak drift ratio (PDR), effective radius of curvature of the isolation system, and friction coefficient. The minimum target PDR considered in this study was 0.4%, which is slightly above the 0.3% limit specified in NCh2745 for reinforced concrete and steel structures. This value ensures the shear walls reach at least 40% of their strength capacity, based on findings by Guiñez et al. [27]. The maximum PDR used was 0.7%, which is slightly lower than half of the PDR limit indicated by ASCE 7–22 [29].
The isolation systems were designed to target specific isolation periods at the maximum considered earthquake (MCE) level. Two values of the radius of curvature of the sliding surfaces ( R o ) were used (i.e., R o = 1.0   m and, R o = 2.0   m ), as well as two friction coefficients at high sliding speed (i.e., μ f a s t = 0.06 and μ f a s t = 0.12 ). The coefficient μ f a s t = 0.06 is typical for isolated steel and concrete buildings, while μ f a s t = 0.12 has been proposed by Quizanga et al. [13] to reduce isolator size and cost in timber structures. Table 1 summarizes the design parameters adopted for each archetype.

2.2. Structural Design

All archetype buildings were designed in accordance with Chilean codes NCh433 [30] and NCh2745 [22], accounting for dead, live, and seismic loads using the equivalent lateral force procedure. A live load of 2 kN/m2 and a total dead load (including self-weight and superimposed loads) of 2 kN/m2 were applied uniformly across all floors. To ensure high lateral displacement demands on the isolation system, all buildings were assumed to be located in seismic Zone 3 and founded on soil type “C” ( V s 30 > 350 m/s). The total seismic weight ( W t ~ 7082   k N ) was taken as the sum of the dead load and 25% of the live load, which remained consistent across all archetypes.
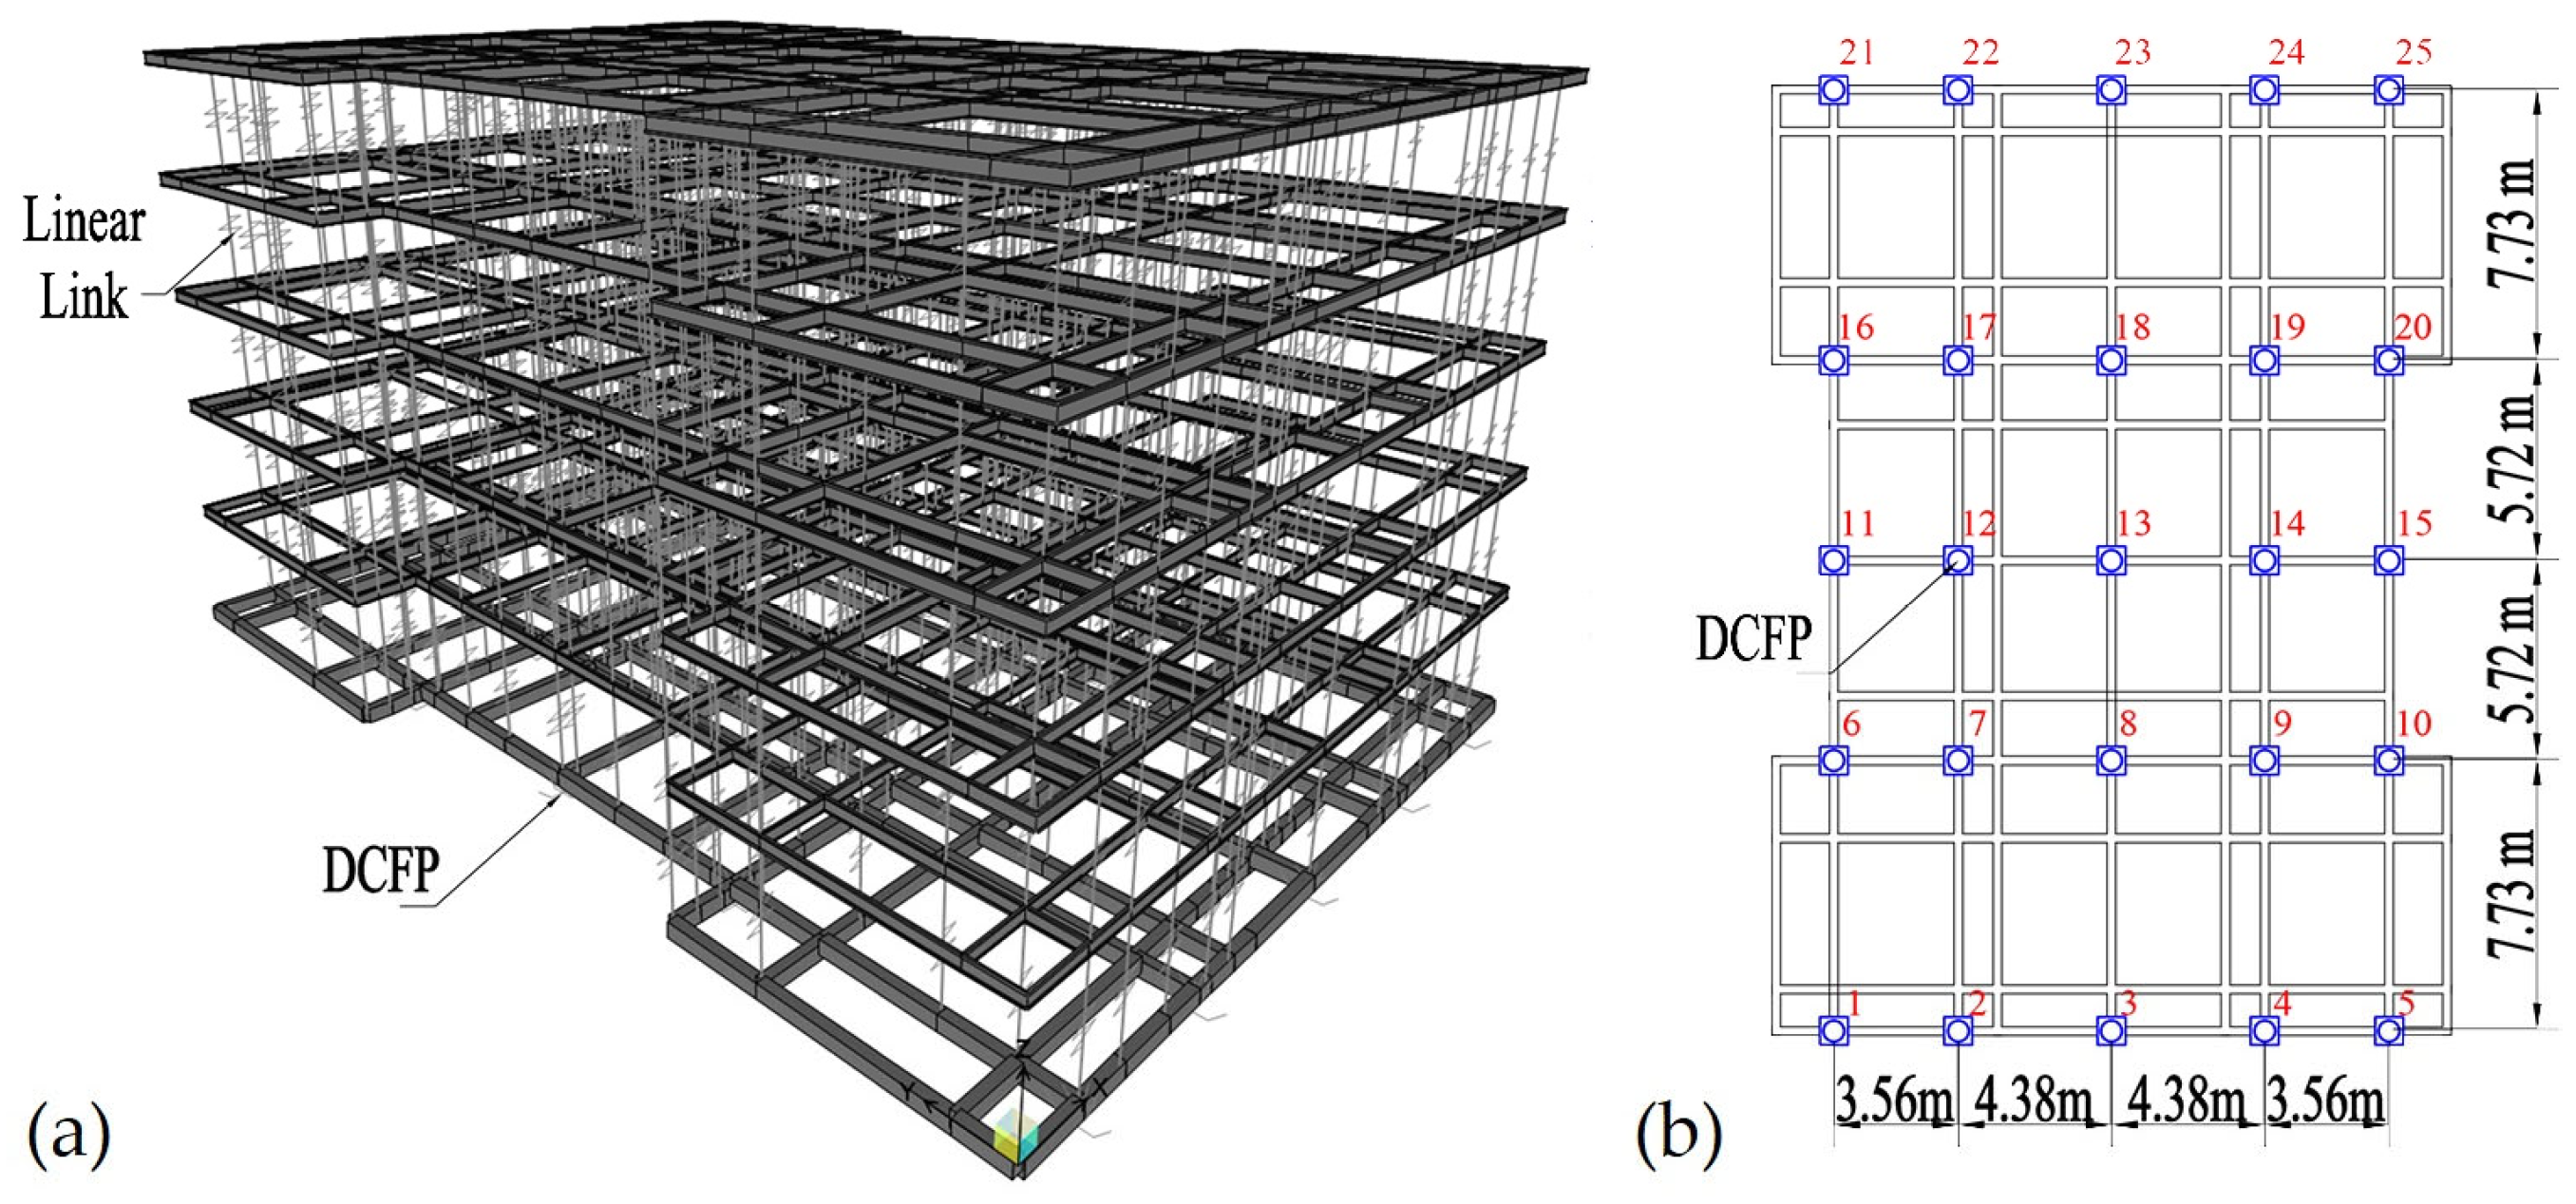
Structural analyses were performed using 3D linear models developed in the commercial software SAP2000 v19 [31] for matrix analysis. The floor diaphragms were modeled as rigid, with lumped masses on the I-joist wood beams. Shear walls were represented using linear links with effective stiffness values computed from the shear wall deflection equation in SDPWS [32], as described by Guiñez et al. [27]. It is important to mention that this SDPW’s shear wall deflection equation includes bending, shear, and rocking of the wall; therefore, the vertical elongation and the stiffness of the anchors also influence the lateral effective stiffness of the wall. The isolation system comprised 25 double concave friction pendulum (DCFP) bearings arranged beneath a grid of concrete beams with an OSB panel slab. These isolators were modeled as friction pendulum elements using effective stiffness values in accordance with NCh2745 guidelines. Figure 2a shows a 3D view of the SAP2000 model for archetype BLD-2, and Figure 2b illustrates the layout of the isolation system.

2.3. Isolation System Design

Similar to the superstructure, the isolation systems were designed using the equivalent lateral force procedure outlined in NCh2745. Table 2 presents the vertical axial loads imposed on the 25 DCFP bearings for the BLD-1 archetype, with loads ranging from 128 to 519 kN. These relatively low loads imply that the isolators can be compact in size.
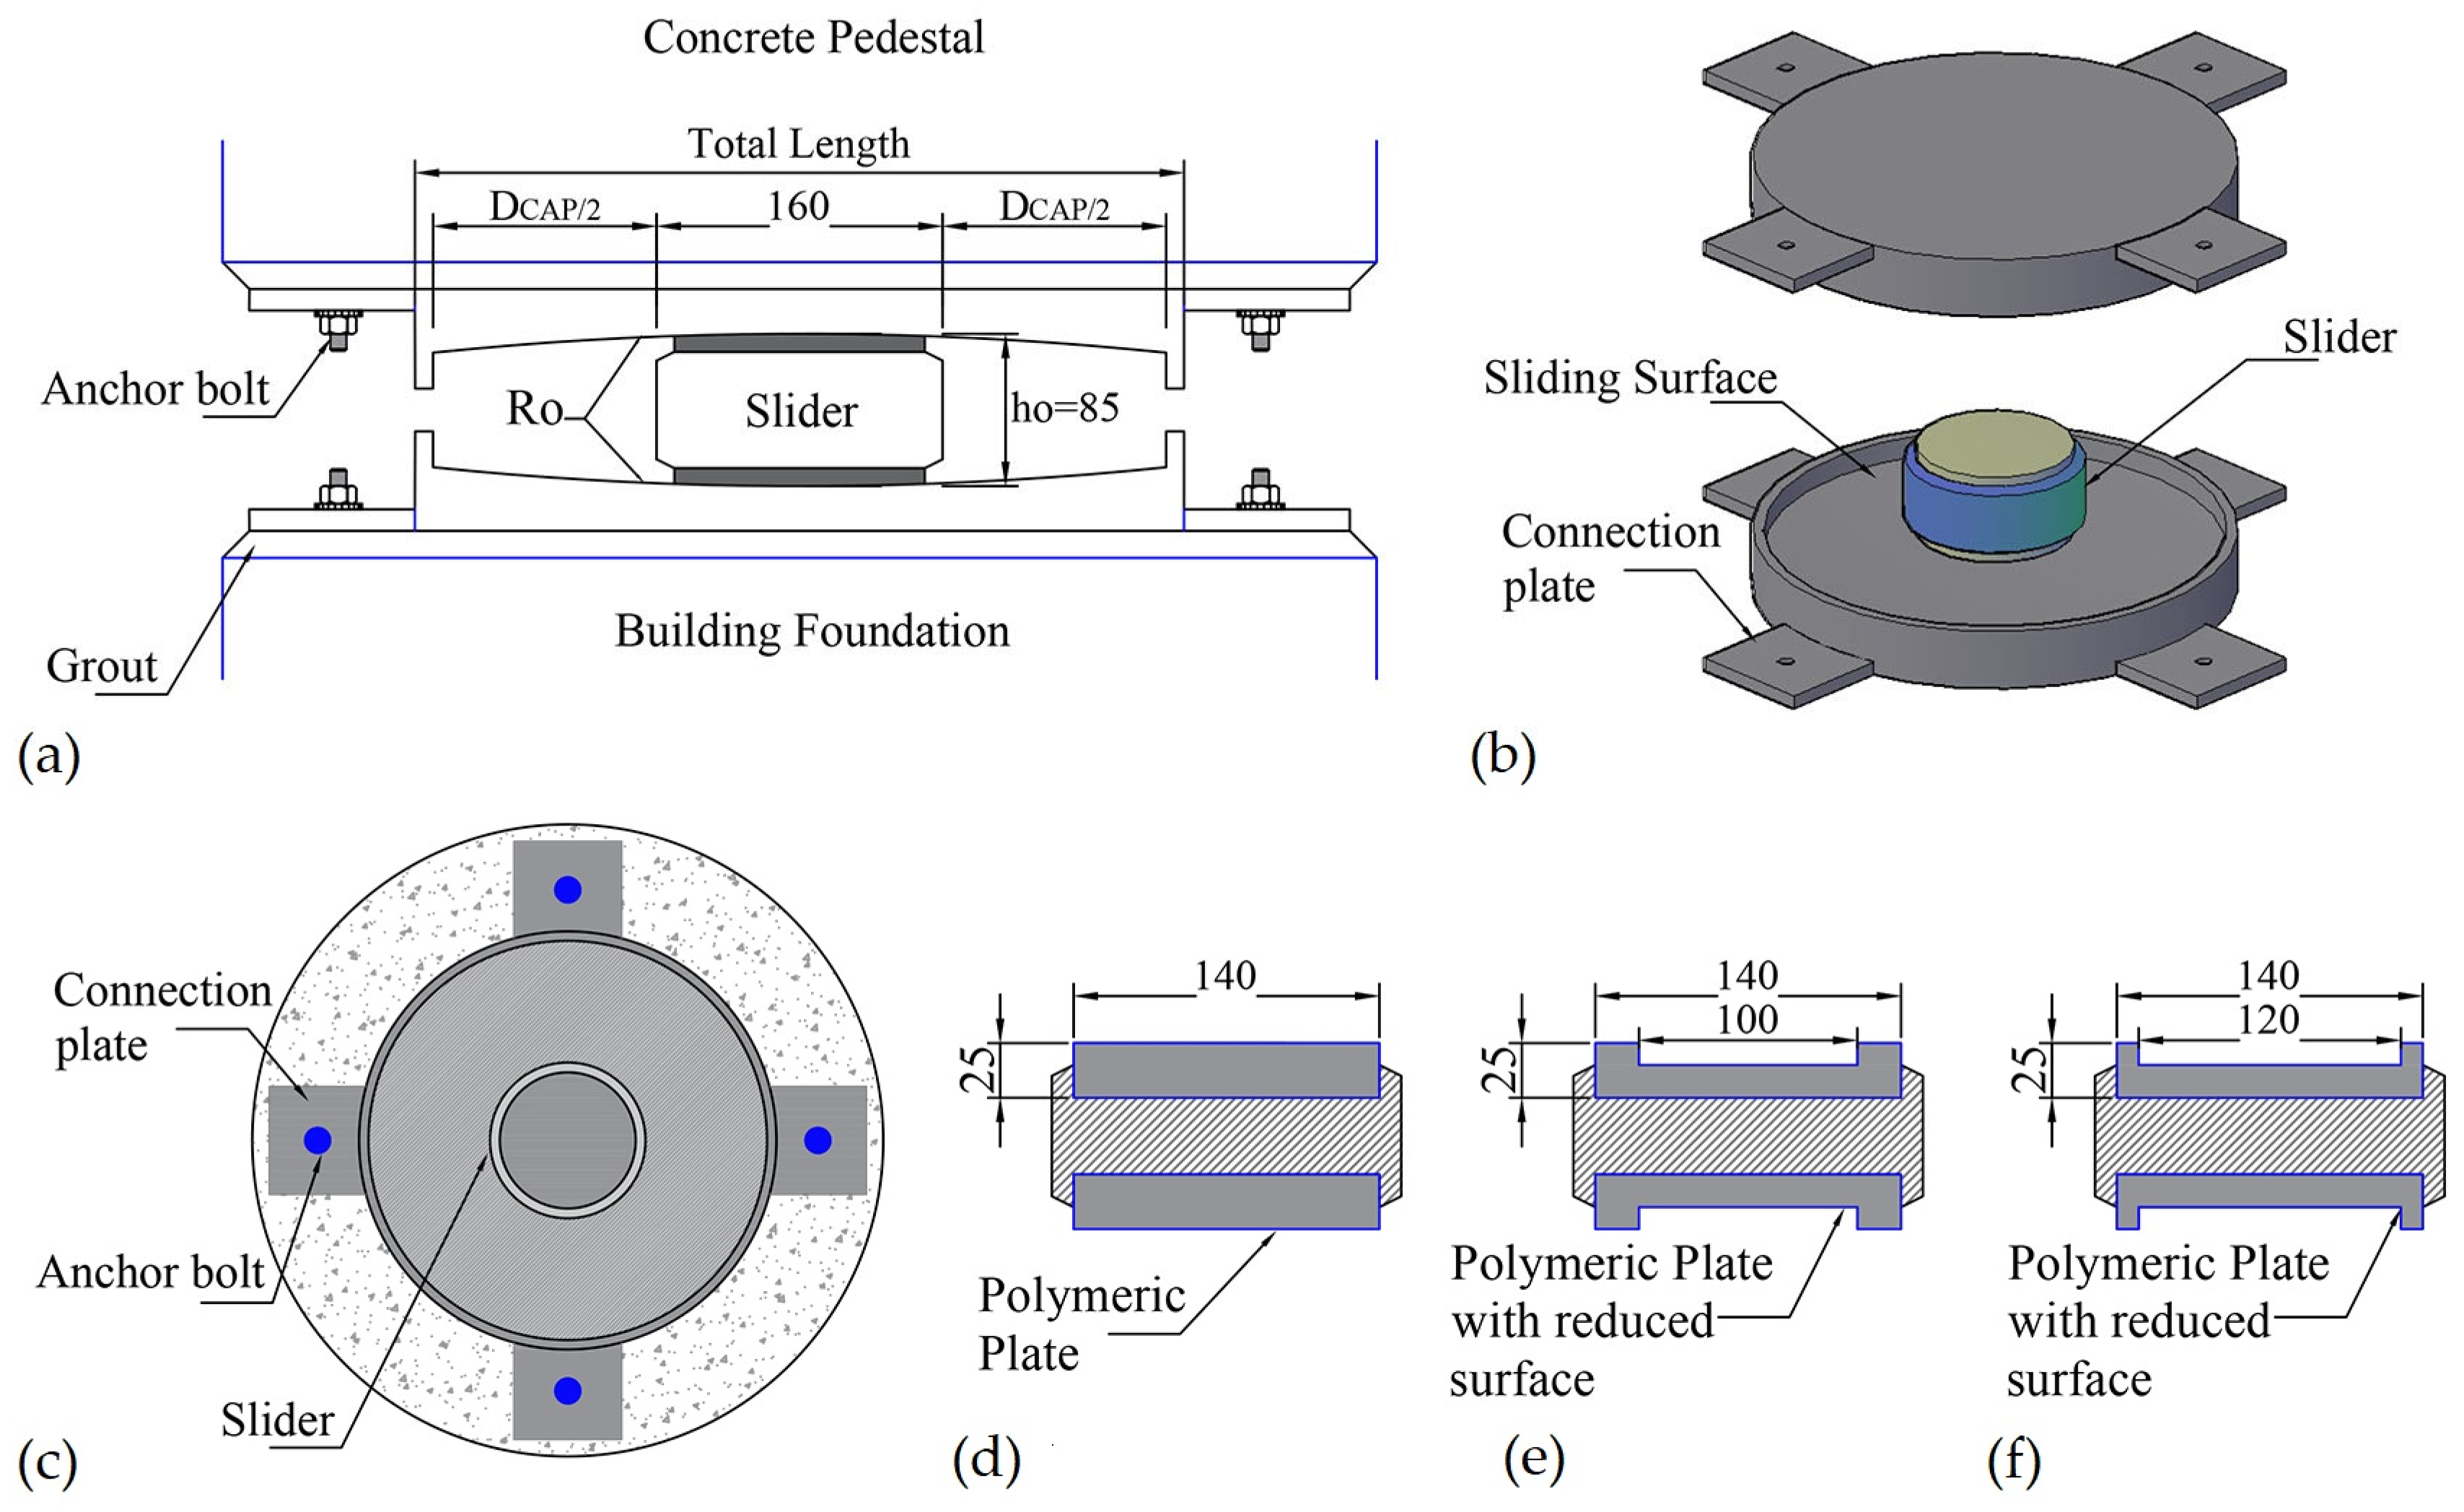
Recent studies (e.g., [13,33]) have shown that polyethylene terephthalate (PET-P) polymer plates develop friction coefficients of approximately 0.06 and 0.12 under compressive stresses of 60 MPa and 30 MPa, respectively. For this reason, the DCFP devices in this study were designed to generate the required contact pressures through axial loads, thereby achieving the desired friction levels. The internal slider has an outer diameter of 160 mm and a height (ho) of 85 mm. Contact areas of the polymeric plates were adjusted according to the load to ensure the target contact pressures were achieved.
Figure 3 presents the bearing configuration and connection details. The gap between the slider and the perimeter ring varies depending on the coefficient of friction, which determines the onset of impact. Figure 3a shows a schematic view of the connection between the bearings and the LFTB’s foundation, while Figure 3b presents a schematic 3D view of the slider and the sliding surfaces. Figure 3c shows a plan view of the bearing’s connection plates, while Figure 3d–f illustrate how the contact area of the PET-P plates was modified based on load magnitude to achieve the target pressure levels. For instance, when loads exceed 420 kN, the full contact area (Figure 3d) is utilized; otherwise, reduced contact areas (Figure 3e,f) are required. Note that the isolation system of BLD-1, BLD-2, and BLD-3 requires the polymeric plates presented in Figure 3e,f to reach a friction coefficient with μ f a s t = 0.06 . On the other hand, the isolation system of BLD-4 requires using the polymeric plates presented in Figure 3d,e to obtain a friction coefficient μ f a s t = 0.12 . In all cases, the selection of the polymer plate depends on the load, as previously described.
Table 3 summarizes the design parameters of the isolation systems at the Design Basis Earthquake (DBE) and Maximum Considered Earthquake (MCE) levels, including system displacement, effective period, damping ratio, and stiffness. These values were obtained using the iterative procedure prescribed in the Chilean isolation code NCh2745 [22]. The effective stiffness, damping ratios, and displacement demands were calculated using representative friction coefficients (μ_fast = 0.06–0.12) and maximum displacement capacities according to the static procedure of the Chilean design standard.
Table 4 presents the geometric dimensions of the DCFP bearings used in the archetypes, including the effective radius ( R e f f ), displacement capacity D C A P , and total bearing length. The D C A P was calculated multiplying D M by an amplification factor equal to 1.25, i.e., D C A P is higher than the total maximum displacement at the MCE level ( D T M = 1.1 D M ) , see Figure 3a. Referring to Figure 3, the effective radius was computed as R e f f = 2 R o h o .

2.4. Superstructure Design

As mentioned, the superstructure design shear forces were calculated using the Equivalent Lateral Force (ELF) procedure in NCh2745. The total base shear ( V s ) was computed using Equation (1):
V s = K E D × D D R
where D D is the displacement at the DBE level, and K E D is the effective stiffness at D D . This effective stiffness is computed by Equation (2), where k p is the post-elastic stiffness of the isolation system, determined by Equation (3). All terms from these equations have been defined.
K E D = k p + μ f a s t × W t D D
k p = W t R e f f
The distribution of V s over the height of the superstructure was made uniform as recommended by NCh2745. The response modification factor of the superstructure selected is R = 1 , which implies that the seismic coefficients adopted C = V s / W t are higher than that commonly used for isolated buildings under the same design conditions, i.e., C m i n = 0.066 in elastomeric systems, and C m i n = 1.5 μ b k d in frictional systems, where μ b k d is the breakdown friction coefficient. The assumption of R = 1 is based on the following rationale: (i) LFTB design is drift-controlled; (ii) higher strength improves impact performance; and (iii) NCh2745 does not specify R for timber systems. This conservative approach results in seismic coefficients higher than those typically used for isolated buildings. Shear wall capacity checks were performed using SDPWS. For archetype BLD-3, a non-code-conforming design was considered by allowing the SDPWS shear capacity to be exceeded in selected walls.
The density values of walls in both “x” ( ρ x ) and “y” ( ρ y ) directions (Figure 1a) were obtained by dividing the area of the parallel walls at “x” and “y”, respectively, by the total floor area. Table 5 summarizes the superstructure design results, including seismic coefficients, wall density at the first story in both directions (i.e., ρ x , ρ y ), and the typical edge distance between the nails that connect the OSB boards to the frame of the walls in each story (i.e., typical wall’s edge nail spacing). Compared to Estrella et al. [26], reductions in wall density were observed for all archetypes when evaluating the seismic performance of a fixed-base LFTB, except for BLD-4, which showed a slight increase. The most remarkable reduction of wall density is presented in archetype BLD-1, where the density of the walls in the “Y” direction ( ρ y ) was reduced to 50% of that given by Estrella et al. for a fixed base. Figure 4 presents the wall density distribution for each archetype.

2.5. Modal Properties

Modal analysis confirmed that the isolated archetypes are dominated by two translational modes in the “x” and “y” directions, while the third mode corresponds to torsion. Table 6 presents the fundamental periods of the isolated and fixed-base versions of each archetype. As expected, the isolated buildings exhibit longer periods. The resulting modal characteristics confirm that the archetypes behave consistently with typical code-conforming Chilean mid-rise timber buildings, i.e., the first two modes are translational, and the third is torsional, with isolated fixed-base period ratios ranging from approximately 2.4 to 3.2, confirming the increased flexibility introduced by the isolation system. Given the regular and nearly square configuration, torsional effects are minor and do not affect the seismic response. These properties, combined with the architectural configuration outlined in Section 2.1 and the code-based design methodology presented in Section 2.2, ensure that the archetypes are realistic representations of Chilean mid-rise LFTBs, making them suitable for evaluating their collapse fragility.
Because the archetypes were modeled in full three dimensions in OpenSeesPy, torsional effects due to mass or stiffness distribution were inherently captured. However, given the relatively square plan and symmetric wall configuration, modal analyses confirmed that torsional participation was limited and did not govern the collapse response.

3. Numerical Models for Evaluating Collapse

3.1. Overall Archetype Model Description

Evaluating the collapse capacity of isolated LFTBs requires numerical models that consider the nonlinear characteristics of the SSWs and frictional bearings. These models consider the effect of the slider’s pounding against the perimetral ring restraint. Sophisticated three-dimensional models were implemented in OpenSeesPy using the Python 3.11.5 interface. The geometry of the SAP2000 linear models previously described was exported via custom Python scripts developed by the authors for each archetype, ensuring consistency in joint constraints and lumped mass assignments.
To represent inherent material and nonstructural damping in the superstructure, a small amount of viscous damping (2% of critical) was introduced using Rayleigh damping targeted at the fourth and fifth modes of the superstructure, while the isolation system controlled the first three modes. This approach, recommended in prior studies of base-isolated buildings [20], suppresses unrealistic high-frequency elastic vibrations while avoiding overdamping of the fundamental isolation mode. The hysteretic damping of the isolation system was captured explicitly through the friction and impact behavior of the DCFP bearings and governs the dynamic response of the first three modes. Table 3 summarizes these damping ratios, while details about this modeling technique are provided in Section 3.3. Geometric nonlinearity was considered by including P-Delta transformations that enable the simulation of collapse. These models were subjected to incremental dynamic analysis (IDA) and nonlinear static pushover (NSP) analysis. The former analysis allows us to compute the collapse capacity of the buildings, while the latter type of analysis provides useful estimates of the overall building response and properties, including the system overstrength factor and the period-based ductility capacity. Details of the models are discussed next, while findings from IDA and NSP analysis are discussed in a subsequent section of the paper.

3.2. Superstructure Model

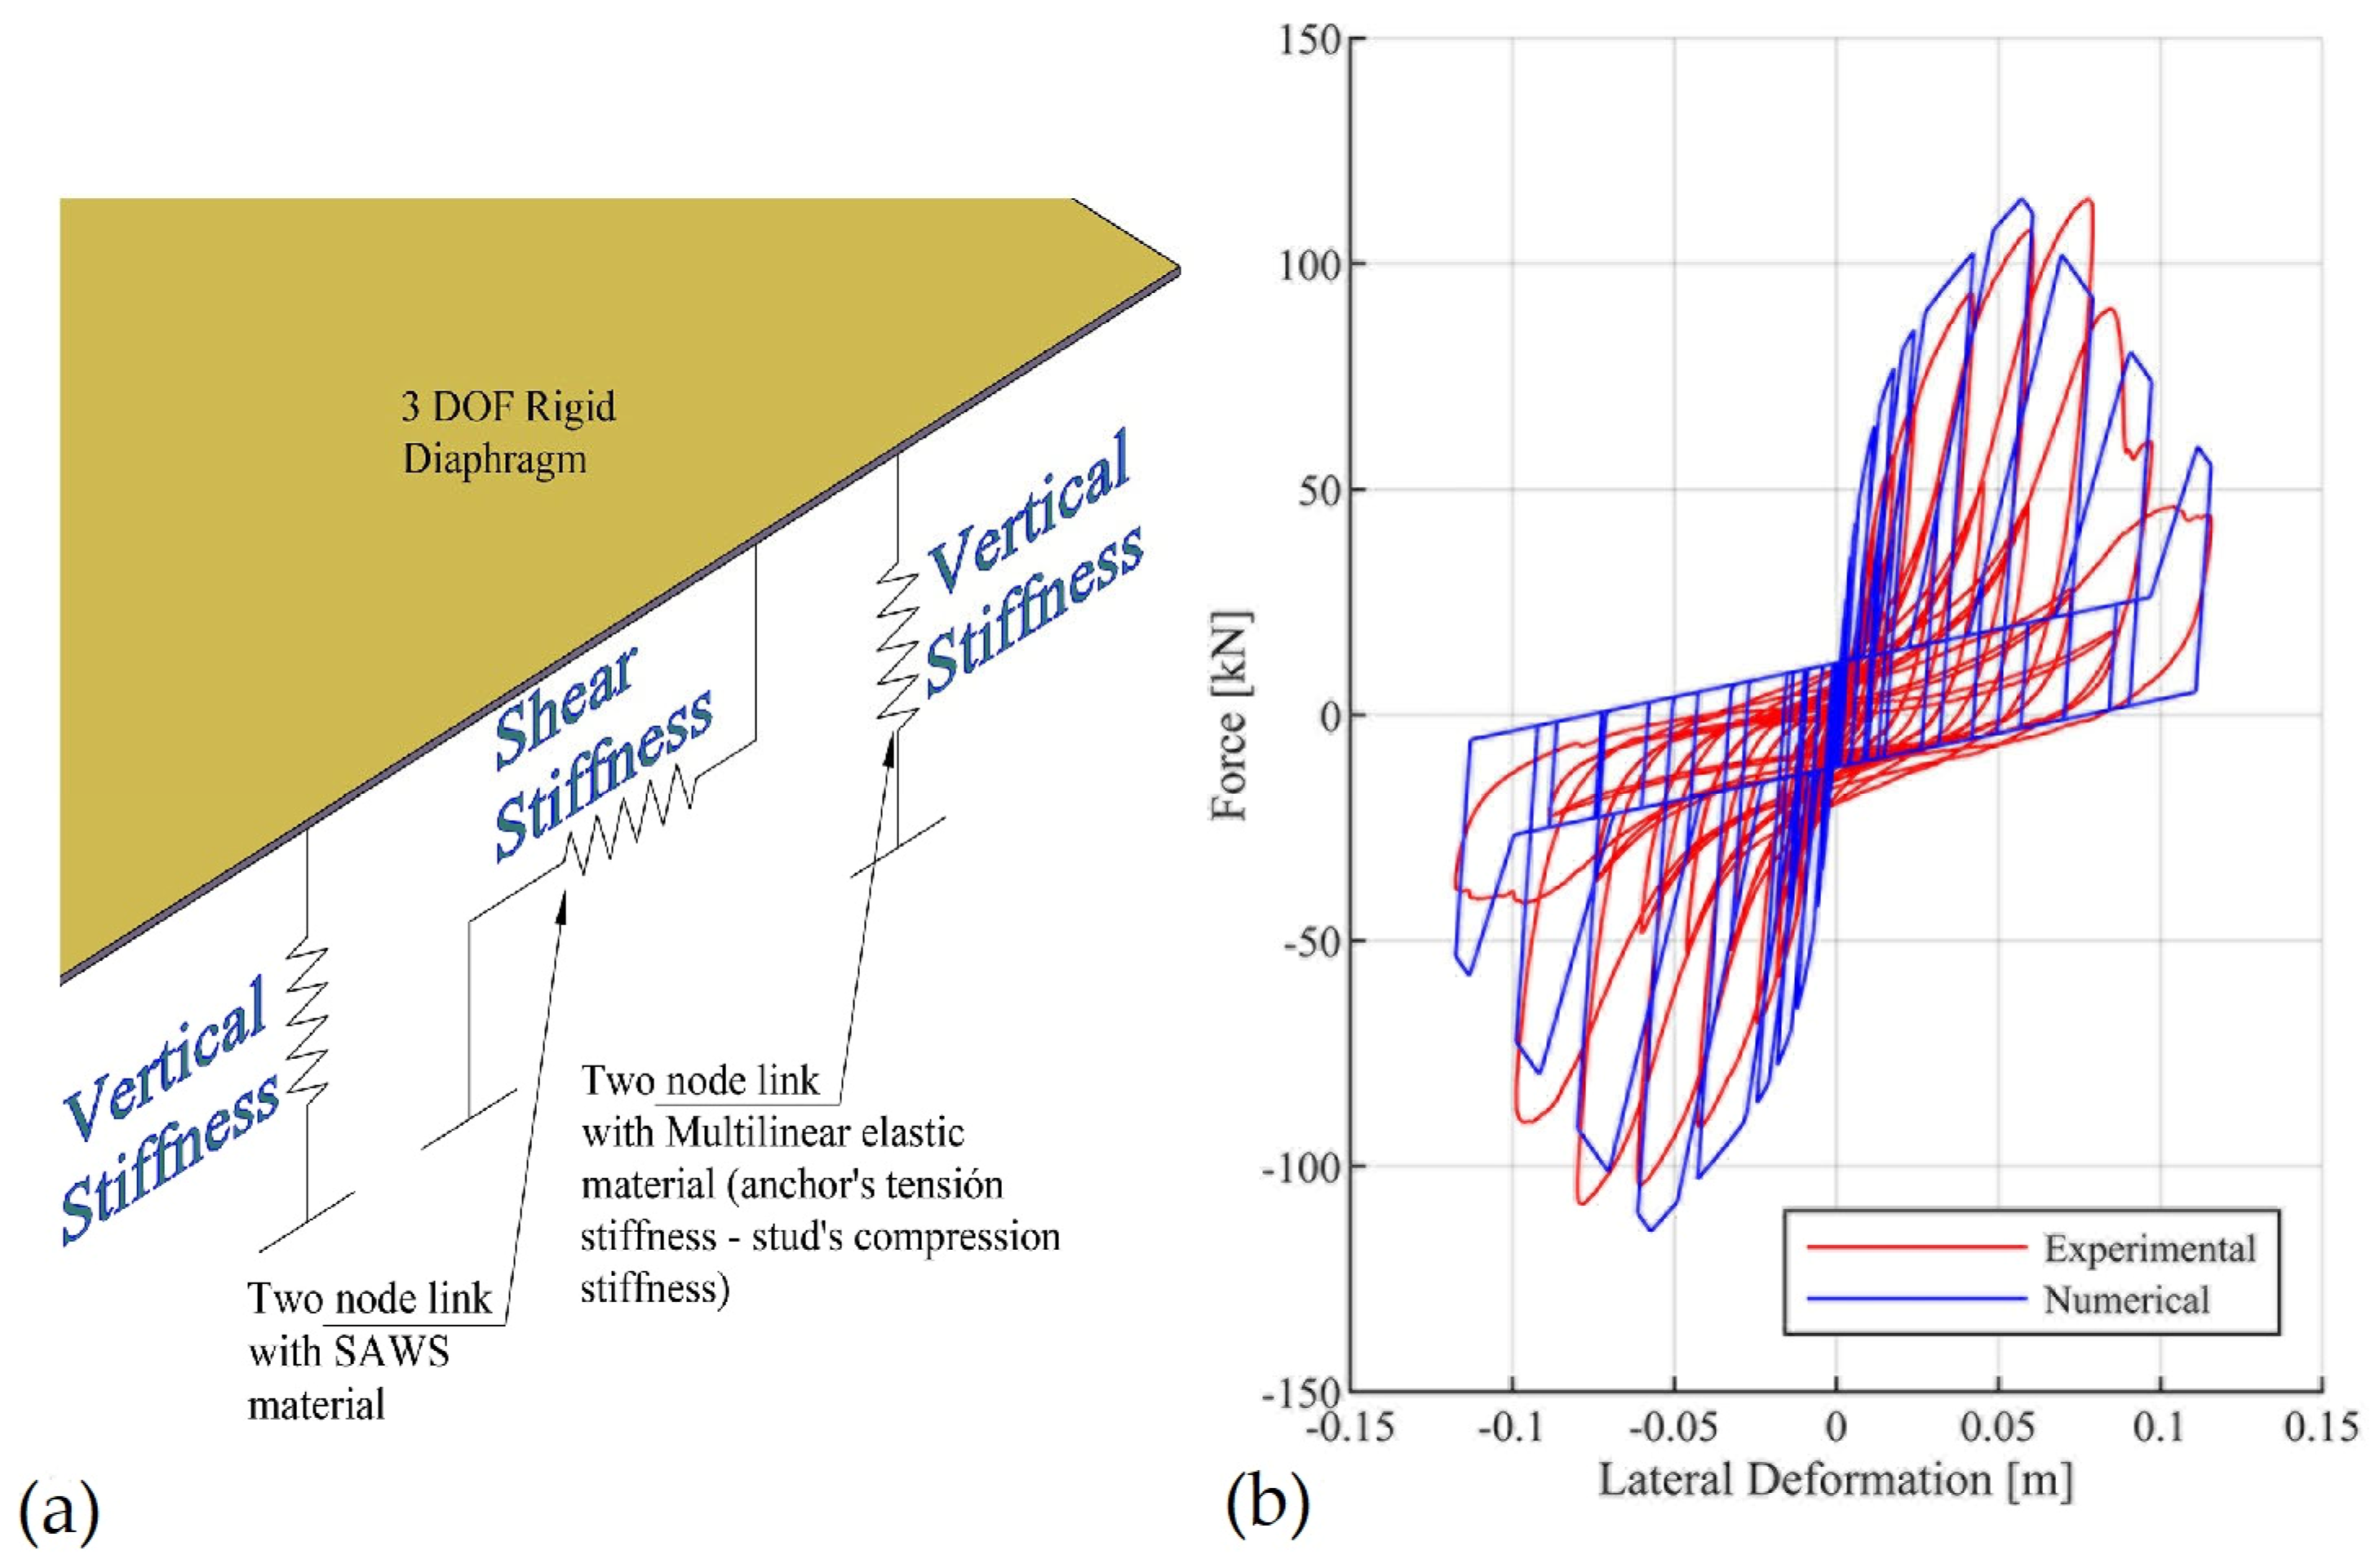
The structural grid of I-joist beams in the diaphragms was modeled using elastic Timoshenko beam elements, and horizontal rigid diaphragms with three degrees of freedom per story were defined. SSWs were modeled using the simplified approach proposed by Pei and Van de Lindt [34], which represents each wall with three two-node link elements: (i) a central horizontal link to simulate shear behavior and (ii) two vertical links to simulate axial effects. This approach requires the use of rigid diaphragms to connect the shear walls. Although the horizontal framed diaphragms can still slightly deflect in their plane, experimental and numerical studies of LFTBs’ behavior [12,26] have shown that the assumption of a rigid diaphragm is valid. Thus, each SSW was modeled in OpenSeesPy using three two-node link elements, as shown in Figure 5a.
The central link uses the SAWS (Seismic Analysis of Woodframe Structures) material, developed by Folz and Filiatrault (2001) [35], to replicate the nonlinear hysteretic behavior of shear walls. The vertical links use the Multilinear Elastic material to represent the axial force–deformation behavior of the end studs and anchorage, where the obtained anchor’s stiffness is 11,844 kN/m, and the stud’s compression stiffness is 106,753 kN/m. The SAWS parameters were adopted from the calibration presented by Estrella et al. [28]. Figure 5a shows the numerical model configuration, and Figure 5b compares the experimental results from Guiñez [27] for a 3.60 m-long SSW with double OSB panels and 100 mm nail spacing against the model response. As per Figure 5b, the adopted model was able to replicate the shear hysteretic behavior of the wall with high fidelity, including pinching and degradation of strength and stiffness.

3.3. Isolation System Model

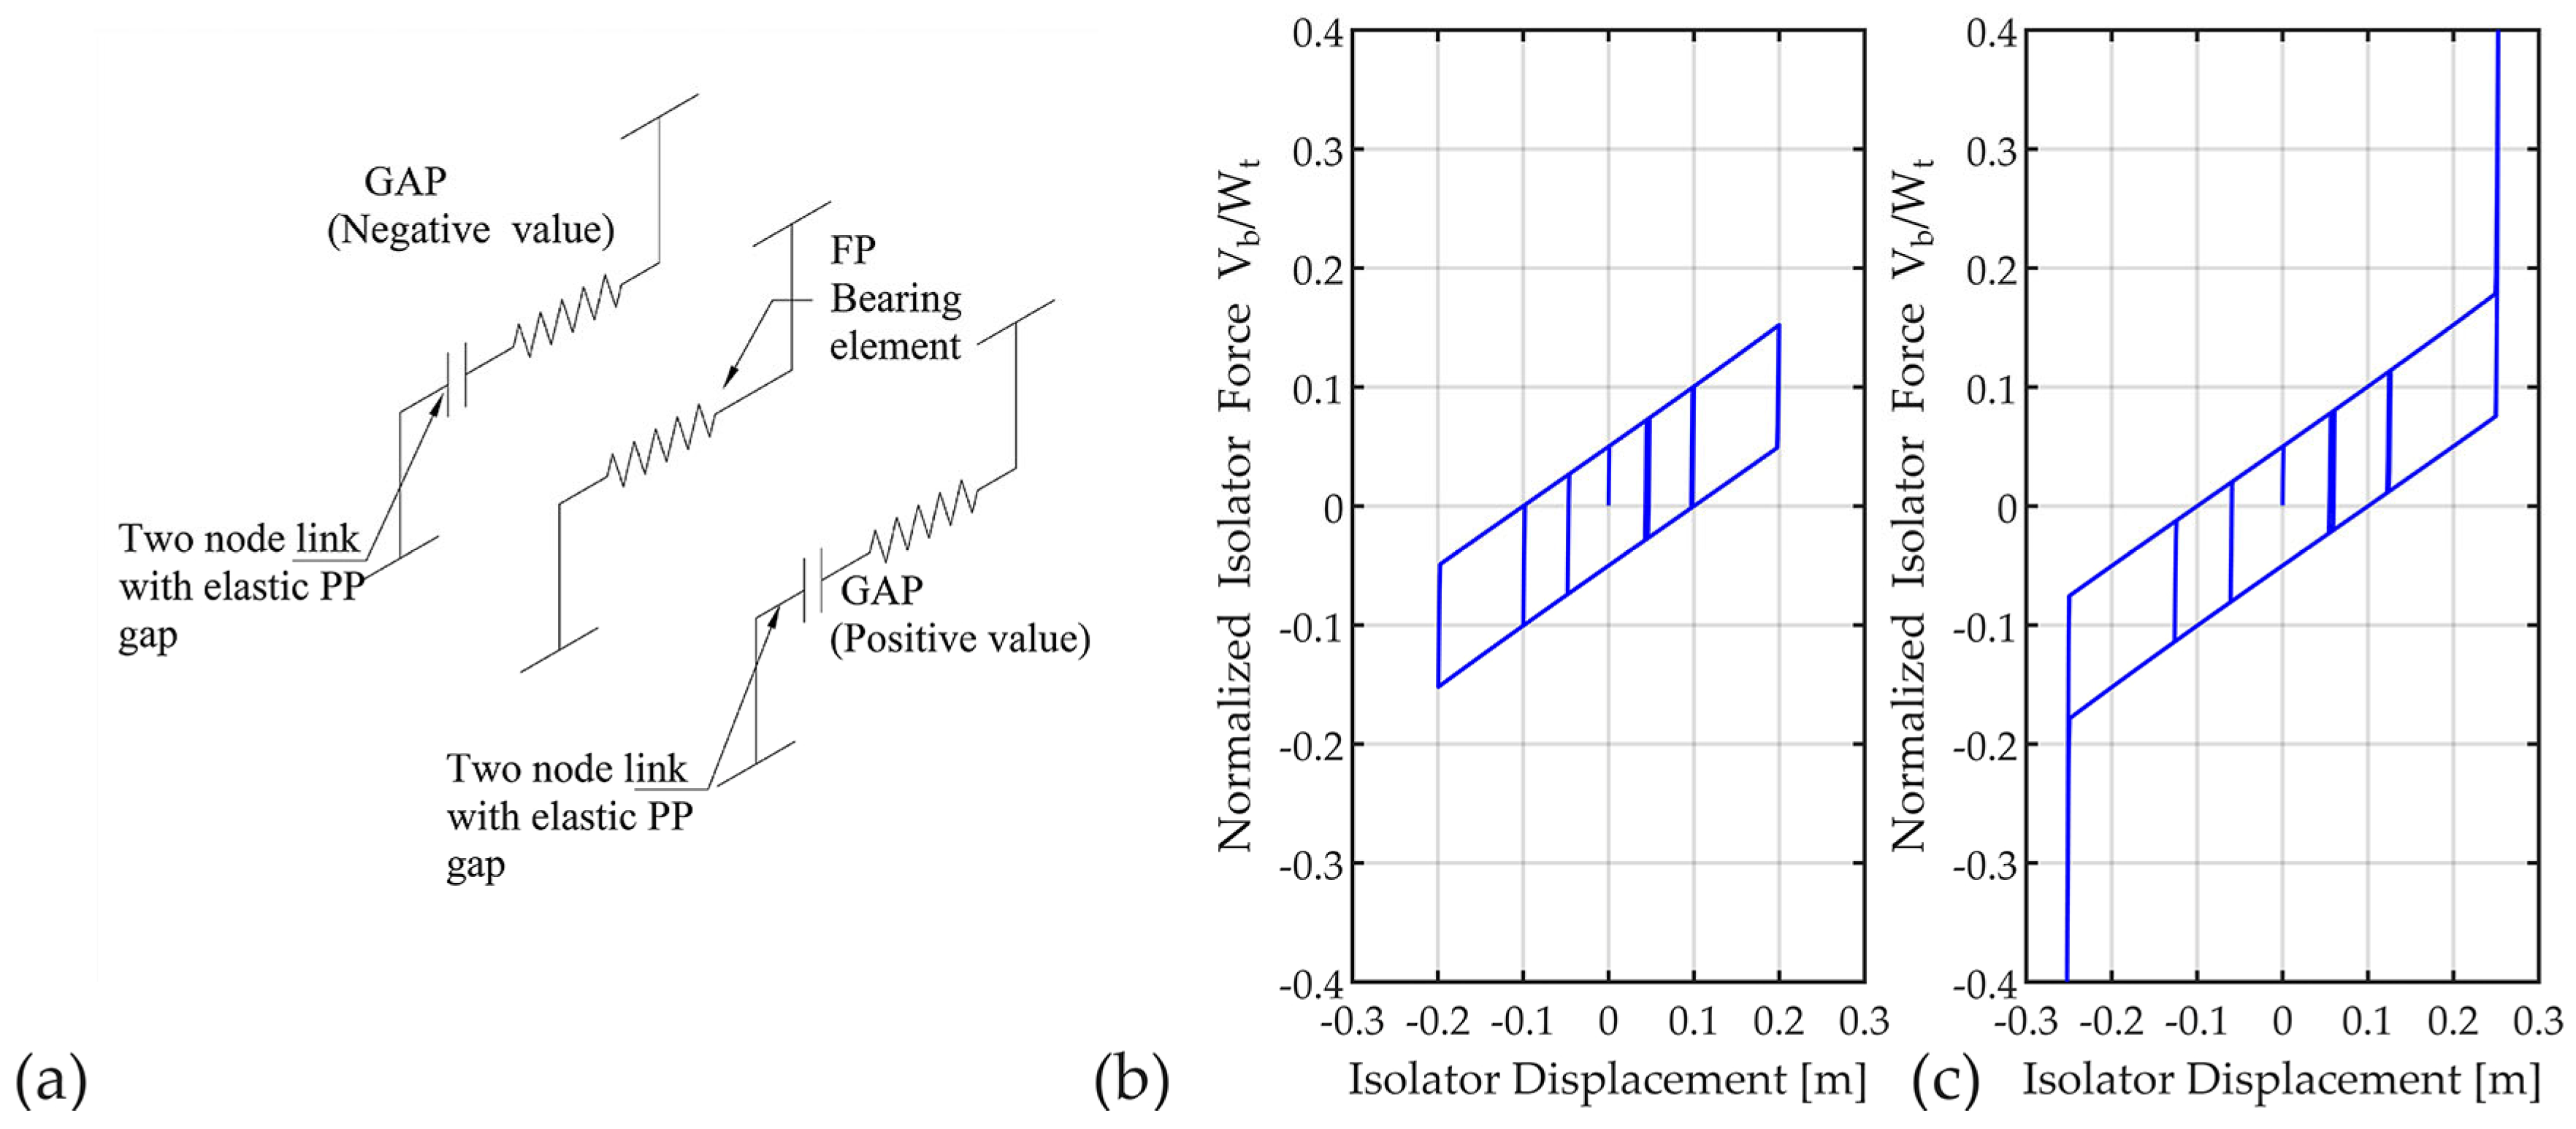
Following the recommendations of Quizanga et al. [33], each isolator was modeled using three parallel two-node link elements to simulate both the nonlinear frictional behavior and the impact against the perimeter ring. The first link represented a single friction pendulum (FP) bearing, calibrated to be equivalent to the double concave configuration. The remaining two links used the Elastic–Perfectly Plastic Gap material in OpenSees to simulate the onset of impact when displacements exceed the designed gap (i.e., D > D C A P ).
For the FP bearing, a velocity-dependent friction model was used based on the formulation by Constantinou et al. [36], where the friction coefficient μ ( u ˙ ) is obtained as per Equation (4).
μ u ˙ = μ f a s t μ f a s t μ s l o w e α μ ˙
where u ˙ s the velocity, μ f a s t is the coefficient of friction for high velocity, μ s l o w is the coefficient for low velocity, and α is a transition parameter. In this study, μ f a s t is a varying parameter, while consistent with previous publications on the topic [13] it is assumed μ s l o w = 0.04 and α = 22 (s/m). It is important to point out that the FP element included in OpenSeesPy does not simulate the coupling effect between the slider’s horizontal movement and its vertical displacement [33]. However, this effect is negligible as vertical displacements remain small relative to horizontal displacements. Moreover, the gap elements were assigned high stiffness values corresponding to the shear stiffness of the perimeter ring, following recommendations by Kitayama and Constantinou [19]. Although this model does not simulate the energy dissipation upon the impact, in the context of collapse assessment, this assumption is conservative.
Figure 6a shows a schematic diagram of the proposed model to capture the impact between the slider and the perimetral ring. Figure 6b,c shows the hysteresis obtained from an impact and non-impact low-friction isolator and D C A P = 0.25   m . Figure 6b shows the force-displacement loop of an isolator obtained with a cyclic pushover of the proposed assembly and a protocol displacement with a maximum displacement D = 0.75 D C A P . In this case, in the absence of impact, the assembly acts as a conventional DCFP isolator. Figure 6b,c shows the hysteresis obtained from an impact and non-impact low-friction isolator and D C A P = 0.25   m , where the horizontal axis plots the isolator displacements, and the vertical axis plots the normalized isolator force, which is the isolator lateral force V b divided by the total weight W t over the device. Figure 6c shows the hysteresis obtained with a cyclic pushover using a displacement protocol with maximum displacement D = 1.01 D C A P . As per Figure 6c, it can be observed that the proposed assembly allows the simulation of the effect caused by the impact between the slider and the perimetral ring on both sides.
The grid of concrete beams of the isolated base was created using Elastic Timoshenko beam elements. In addition, a rigid diaphragm was assigned at the isolation level.
It is worth noting that the isolator model proposed in this study has not been calibrated against experimental data. However, the hysteretic behavior obtained from this model closely resembles the numerical and experimental responses reported in previous studies (e.g., [13]). Based on this alignment and the use of well-established modeling techniques, the adopted model is considered sufficiently accurate and reliable for the collapse assessment objectives of this study.

4. Collapse Assessment

4.1. Collapse Definition

In modern performance-based earthquake engineering, two key components are required to assess seismic performance: engineering demand parameters (EDPs) and intensity measures (IMs). EDPs are often defined using local or global structural response metrics. Among global response metrics, the peak inter-story drift ratio (PDR) is widely used and is adopted in this study. Following prior research on the seismic performance of LFTBs (e.g., [26]), a 3% PDR threshold was selected to define collapse.
Various IMs can be used, including peak ground acceleration ( P G A ), peak ground velocity ( P G V ), and spectral acceleration at the first mode period ( S a ( T 1 ) ). While no universal standard exists for selecting the most effective IM, ( S a ( T 1 ) ) has been commonly used in studies of collapse in subduction zones (e.g., [37,38]). Accordingly, this study adopts S a ( T M ) , the spectral acceleration corresponding to the fundamental period used in the NCh2745 MCE spectrum as the IM for collapse evaluation. Incremental dynamic analysis (IDA) was conducted in accordance with the FEMA P695 methodology to estimate the collapse capacities of the archetype buildings.

4.2. Ground Motion Selection

The selection of appropriate ground motions plays a critical role in collapse assessment using IDA [39]. FEMA P695 provides two record sets compatible with US crustal tectonic regimes (far-field and near-field). However, since this study focuses on evaluating the collapse capacity of Chilean representative LFTBs, the ground motions from FEMAP695 cannot be directly used. In contrast, for Chile’s subduction zone, Estrella et al. [39] propose conducting IDA using a representative set of 26 ground motions, comprising 18 subduction and 8 crustal earthquake records. The selection criteria proposed by Estrella et al. [39] include definitions of earthquake magnitude (above 6.5), fault type, distance to fault (greater than 10 km), records with two horizontal orthogonal components, peak ground acceleration greater than 0.2 g, peak ground velocity more than 15 cm/s, ground motions coming from soft rock and stiff soil, and records with instrumental and baseline corrections. Thus, these records include two horizontal components ( C 1 and C 2 ) and span moment magnitudes ( M w ) from 6.5 to 9, recorded over the last 30 years. To align with FEMA P695 guidelines, each record was first normalized individually and then scaled collectively. Normalization was done to remove variability due to differences in earthquake magnitude, fault type, and distance, using peak ground velocity (PGV) and normalization factors ( N f i ) from Estrella et al. [39]. The set was then scaled collectively to the S a ( T M ) , value at the MCE level. Figure 7a presents the 5% damped acceleration response spectra of the normalized records and their median. Figure 7b shows the spectra of the median record scaled to the MCE level for archetype BLD-4. Notably, collective scaling increases spectral acceleration values at higher frequencies. It is worth mentioning that the higher effective damping ratios (20–50%) reported in Table 3 arise from hysteretic energy dissipation of the frictional isolators and were directly captured through the nonlinear isolator model.

4.3. Incremental Dynamic Analysis

Each 3D nonlinear model was subjected to 26 two-component records (52 in total) and scaled progressively and incrementally by scaling factors (SF). Consistent with the FEMAP 695 methodology, the scaling process on the ground motions is collectively performed based on the spectral acceleration at the fundamental period of the structure. Analyses were conducted in the “Y” direction of the building, which is considered the more flexible axis and, therefore, more critical for collapse. IDA was terminated when 26 out of 52 records led to the collapse. As defined by FEMA P695, collapse is considered to occur when the maximum PDR exceeds a defined threshold (3% in this study) or when dynamic instability is observed. It is essential to note that dynamic instability is caused by a combination of structural element deterioration (in this case, shear walls) and the P-Delta effects, both of which are simulated in the nonlinear models developed herein. Dynamic instability is detected when the IM vs. EDP curves flatten or when numerical instability is observed in the models. Considering that previous studies on LFTBs do not support higher drift limits, a threshold of 3% was set to realistically provide an upper bound deformation. This threshold is consistent with previous studies on collapse assessment of LFTBs, which indicate that the collapse capacity of buildings is directly related to the ground motion intensity at which dynamic instability occurs.

4.4. Collapse Margin Ratio and Fragility Curves

The collapse margin ratio (CMR) is the primary performance metric in FEMA P695 to evaluate the collapse capacity of archetype buildings, since it is considered a safety factor against this extreme limit state. It is defined as the ratio between the median collapse capacity ( S C T ) and the spectral acceleration at the fundamental period at the MCE level of shaking ( S M T ). This relation is presented in Equation (5):
C M R = S C T S M T
where S C T is the median spectral acceleration at which 50% of the ground motion records cause collapse, and S M T is the MCE-level spectral acceleration. ACMR > 1.0 indicates sufficient collapse resistance. To account for spectral shape effects and modeling variability, the adjusted collapse margin ratio (ACMR) is computed as follows:
A C M R i = C M R i × S S F × 1.2
Here, S S F is the spectral shape factor, and 1.2 is a FEMA-specified adjustment factor for 3D models. However, in this study, as a conservative approach, this adjustment factor was not considered. Fragility curves represent the conditional probability of collapse given a certain level of seismic intensity (IM); in this case, S M T . These curves are fitted using a lognormal cumulative distribution function based on the IDA results. The next section of the manuscript presents a detailed discussion of the findings from the nonlinear time history analysis.

5. Results and Discussion

This section presents the results obtained from the nonlinear static pushover (NSP), nonlinear dynamic analysis, and incremental dynamic analysis (IDA) of the four archetype buildings. The section starts by discussing the insights gained from the NSP analysis, and then the results from IDA are discussed.
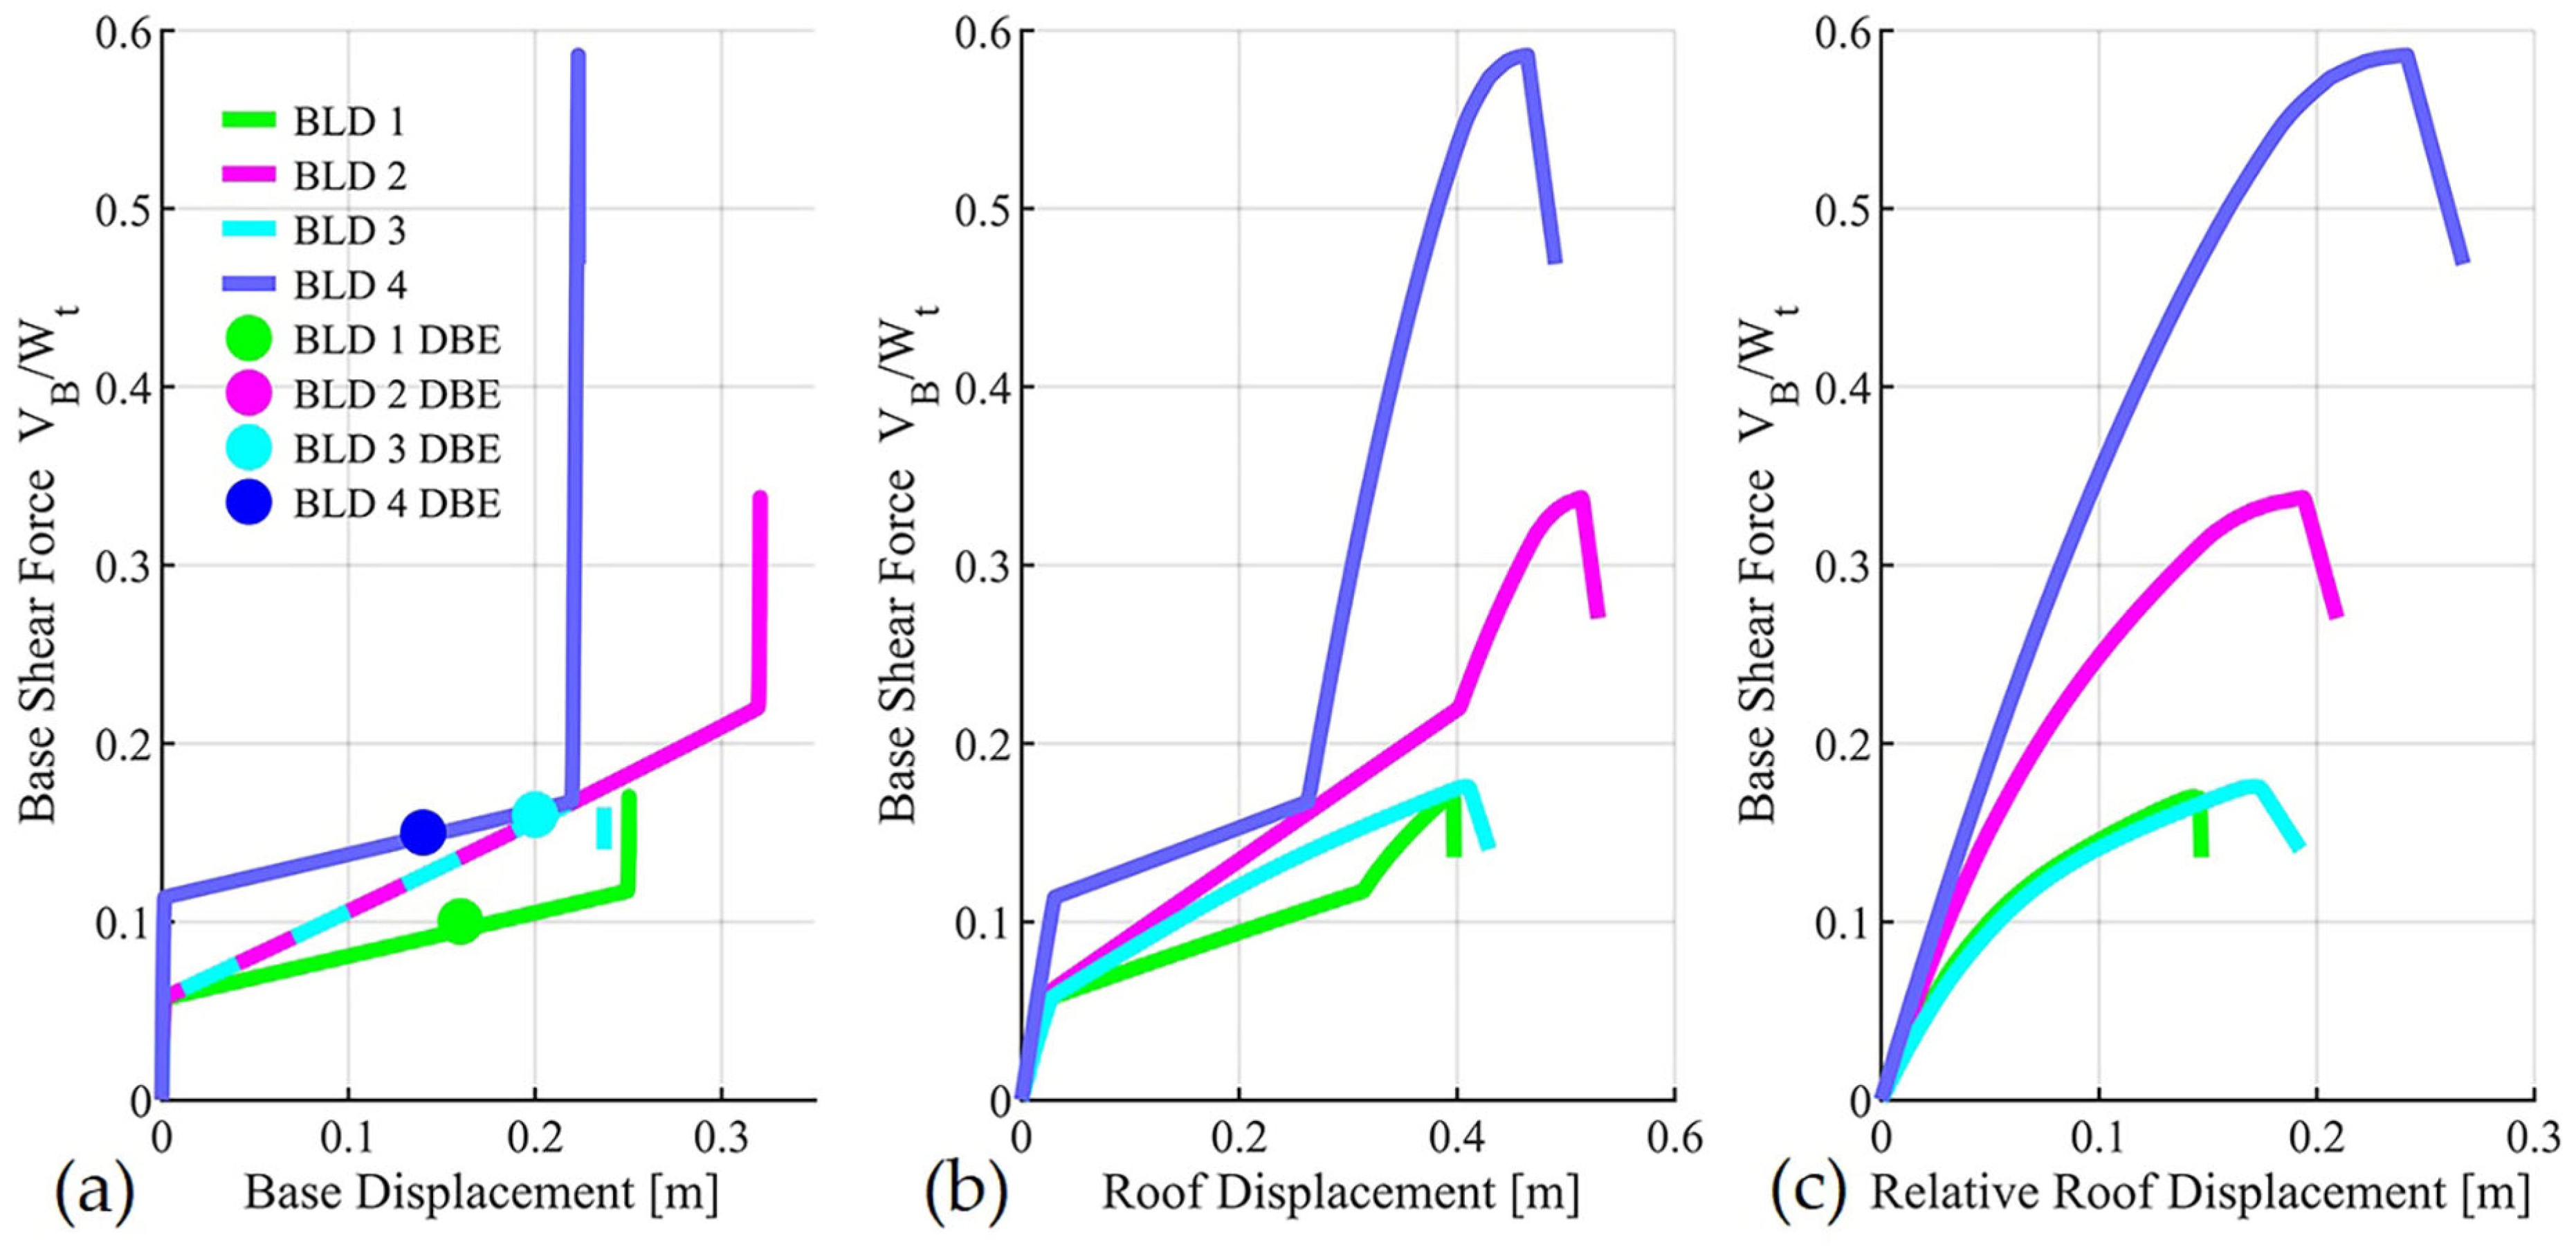
Figure 8 summarizes the overall results of the NSP analysis. In Figure 8a, the normalized base shear versus base displacement demonstrates the capability of the model to capture slider impact. The isolation systems of BLD-2 and BLD-3 have the same properties; therefore, in this Figure, the displayed point of BLD-2 at DBE level overlaps with the displayed point of BLD-3 at DBE level. Figure 8b shows that buildings BLD-1, BLD-2, and BLD-4 exhibited sliding behavior and were able to dissipate energy after impact. In contrast, BLD-3, due to its low superstructure stiffness, did not display this post-impact energy dissipation capacity. Figure 8c highlights the superior resistance of BLD-4, which reached approximately three times the base shear of BLD-1 and BLD-3.
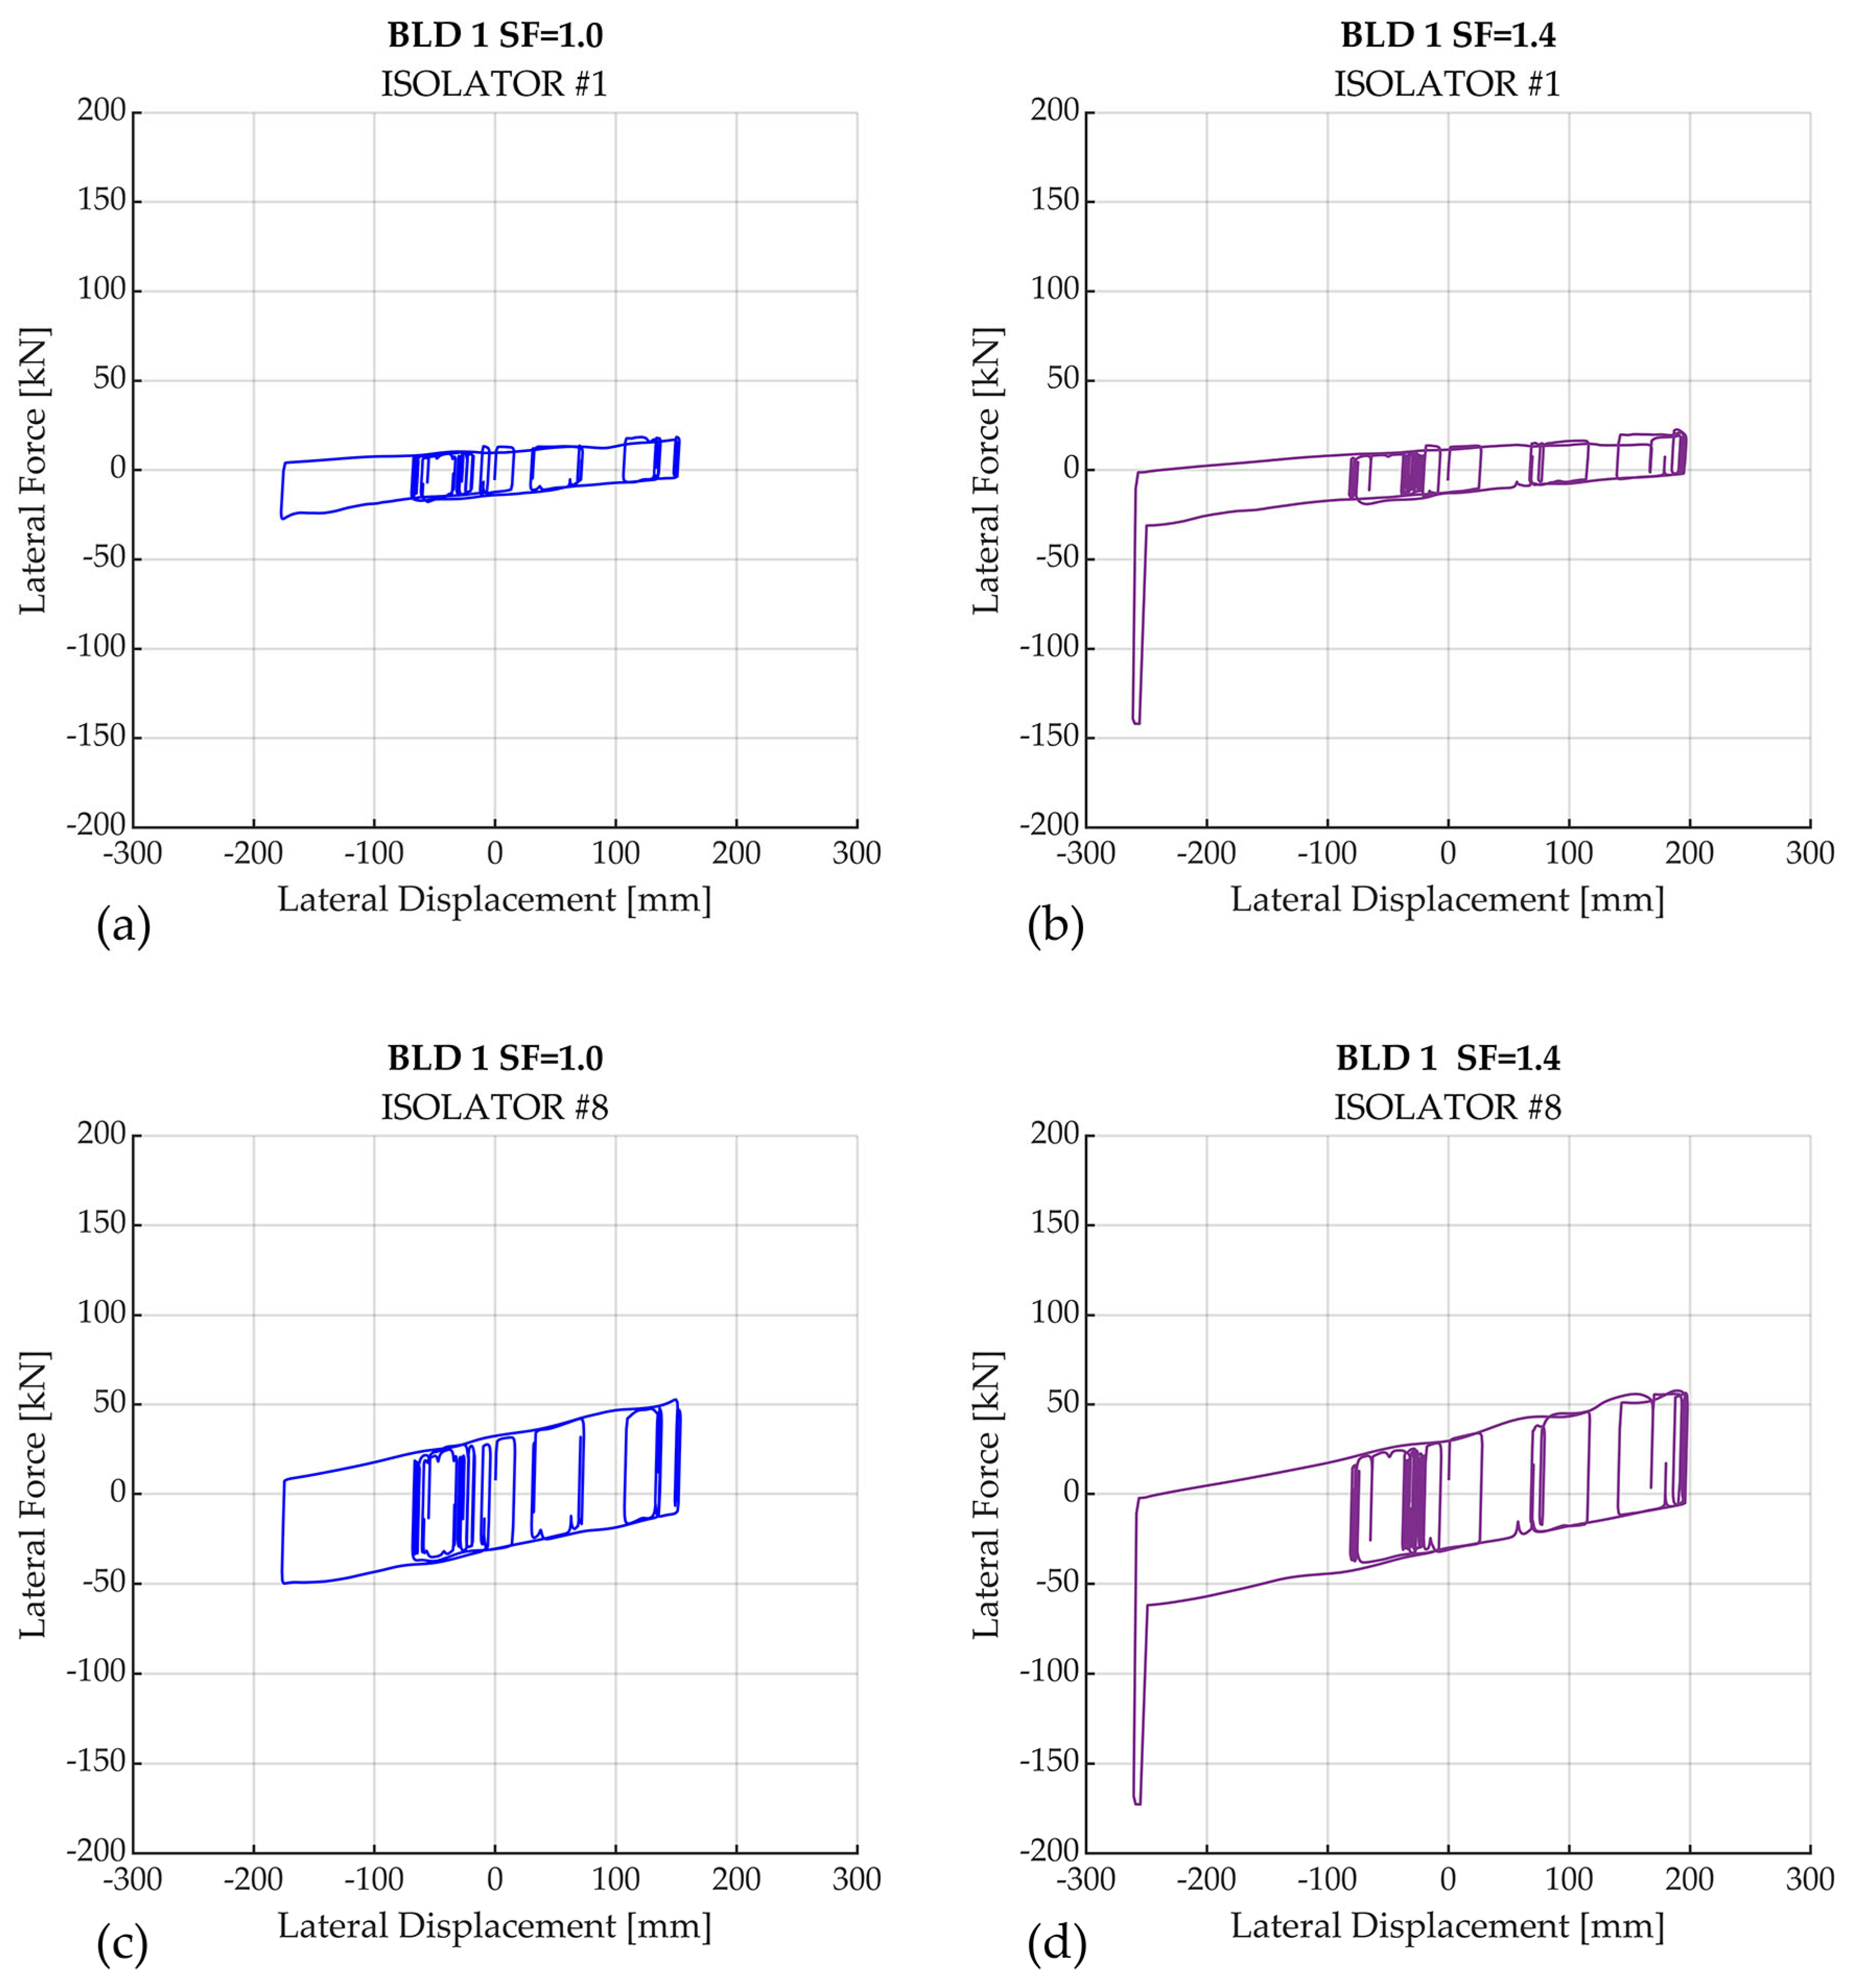
To illustrate the behavior of the isolated buildings under seismic excitation, a nonlinear dynamic analysis was conducted using the C1 component of the Cape Mendocino earthquake. Results for BLD-1 are presented in Figure 9, Figure 10 and Figure 11. Figure 9a shows the hysteretic response of isolator #1 (corner bearing) for the as-recorded motion. When this record is scaled by a factor of 1.4, as shown in Figure 9b, the displacement demand exceeds the isolator gap ( D C A P = 250   m m ) , triggering impact and increased lateral force. Similar trends were observed in isolator #8 (interior bearing); Figure 9c,d show the difference in response with and without impact.
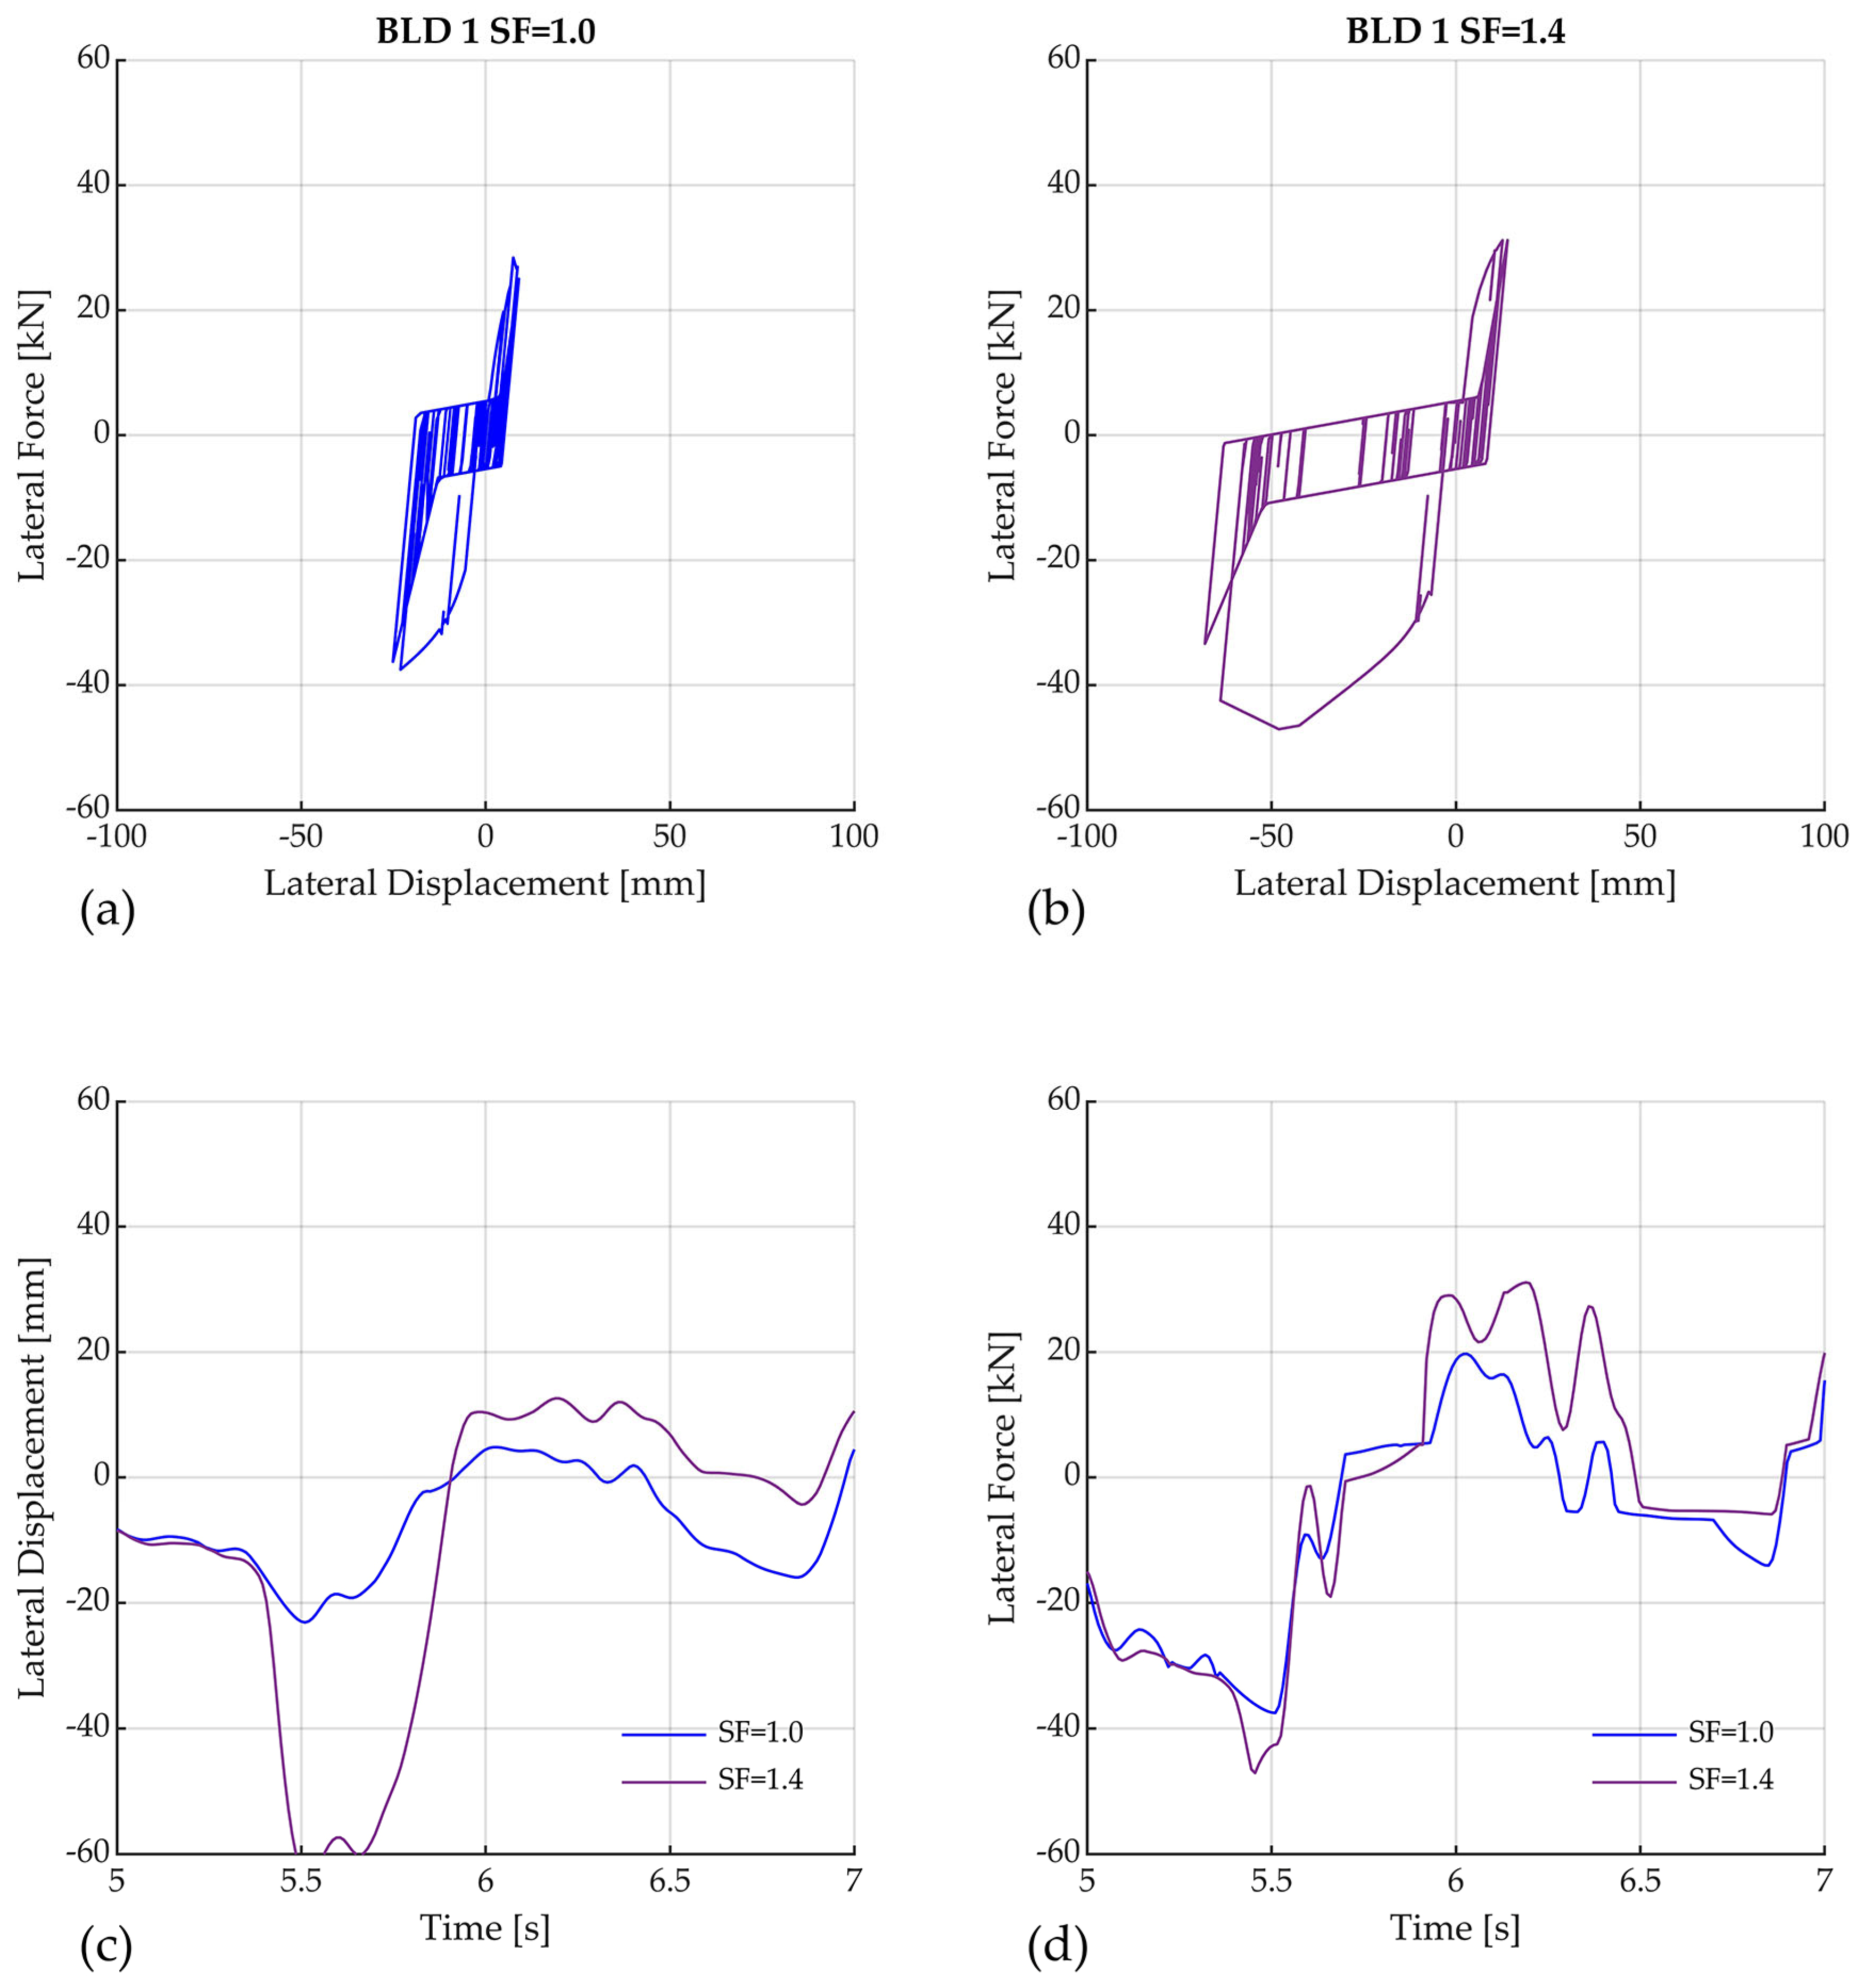
On the other hand, Figure 10 examines the SSW located above isolator #1. The lateral force-deformation behavior is illustrated in Figure 10a,b, showing the record without scaling and with scaling, respectively. As per Figure 10a, the SSW does not reach its maximum strength. However, when the record is scaled at SF = 1.4 (Figure 10b), the wall reaches its strength capacity and undergoes stiffness degradation. Figure 10c shows the SSW’s lateral displacement time history. It can be seen in this Figure that at 5.5 s, the maximum lateral displacement of the SSW is D S S W = 22   m m when the wall is subjected to the as-recorded ground motion and D S S W = 66   m m when it is amplified by 1.4. These results show that the impact of the isolation system produces an increase in the shear demand of the SSWs, which causes a considerable displacement of the first-story walls, potentially leading them to collapse. It is worth noting that, in this case, the IDA allowed verifying that the PDR exceeded the collapse limit value of 3% when the scaling factor was 1.5. Figure 10d shows the SSW lateral force history; it is observed that there is no significant increase in force at 5.5 s, where the lateral force of the SSW varies from 37 to 42 kN when the as-recorded and amplified ground motion records (by 1.4) were applied, respectively.
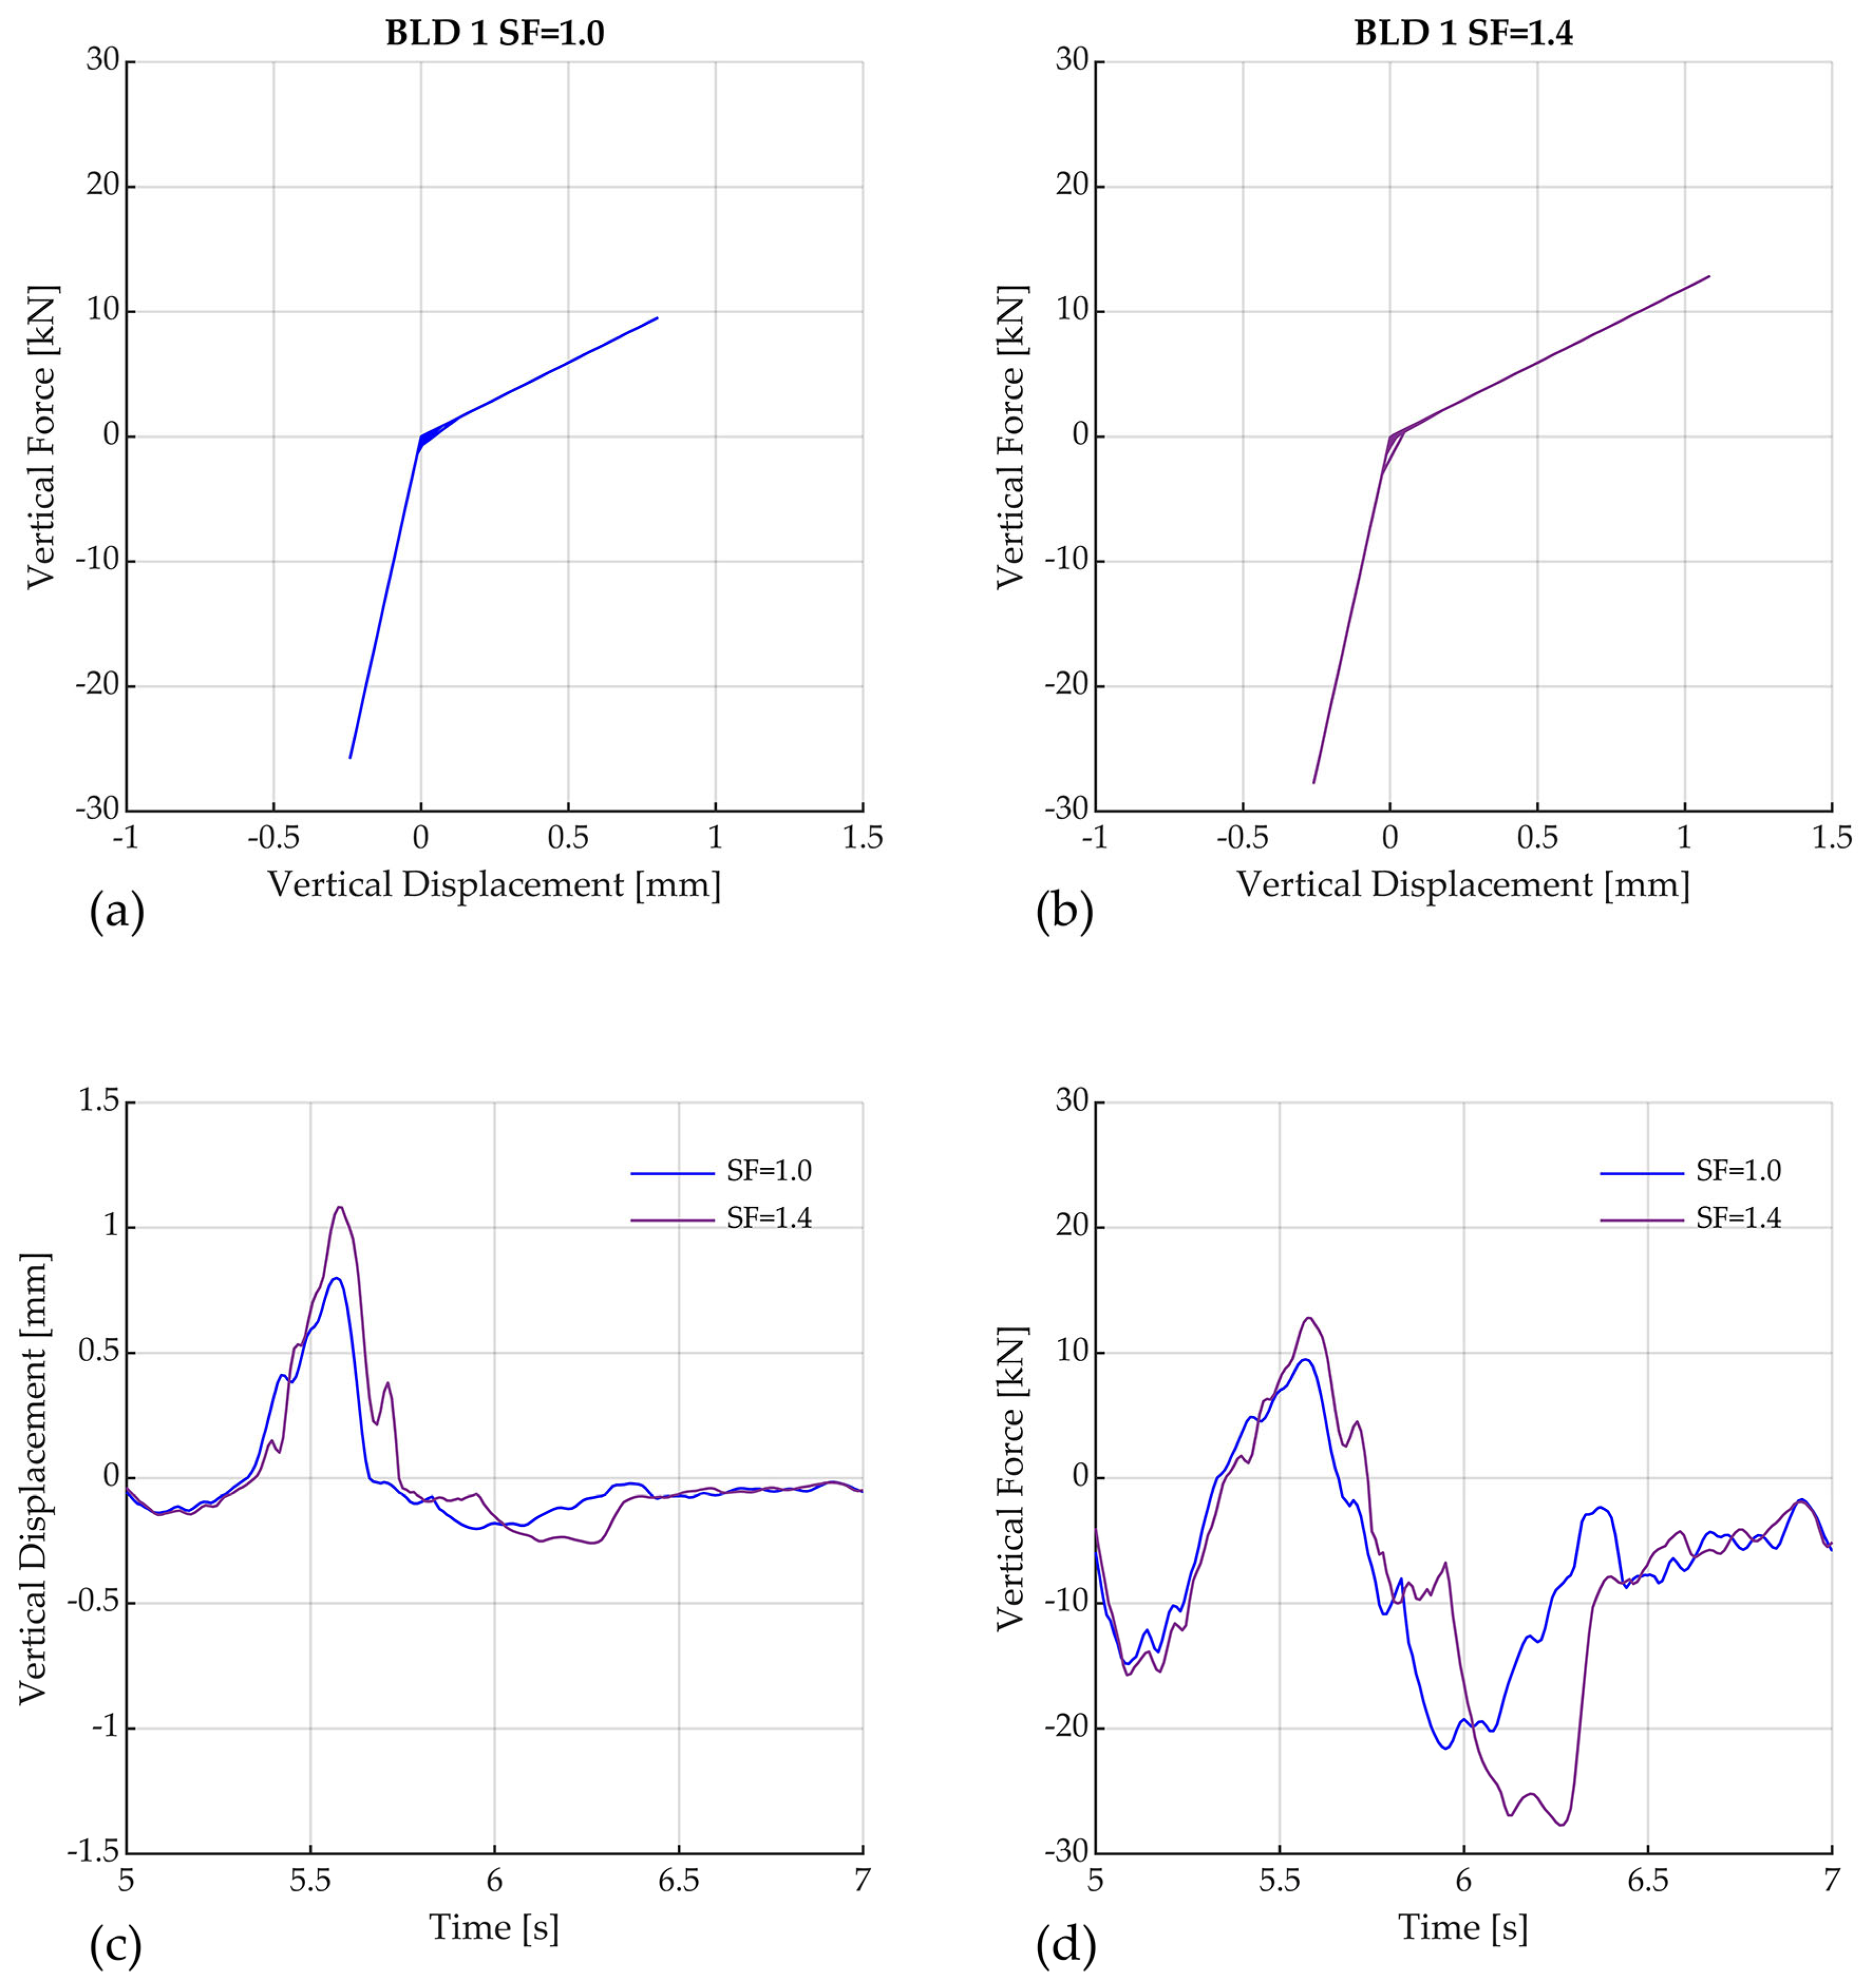
Figure 11a shows the vertical hysteresis of one of the lateral vertical links used to capture the axial behavior of the SSW located on isolator #1. The maximum uplift displacement increased from 0.8 mm (SF = 1.0) to 1.1 mm (SF = 1.4), as seen in Figure 11a,b. The corresponding time histories of displacement and force are shown in Figure 11c,d. The higher axial forces and vertical displacements occurred after 5.5 s.
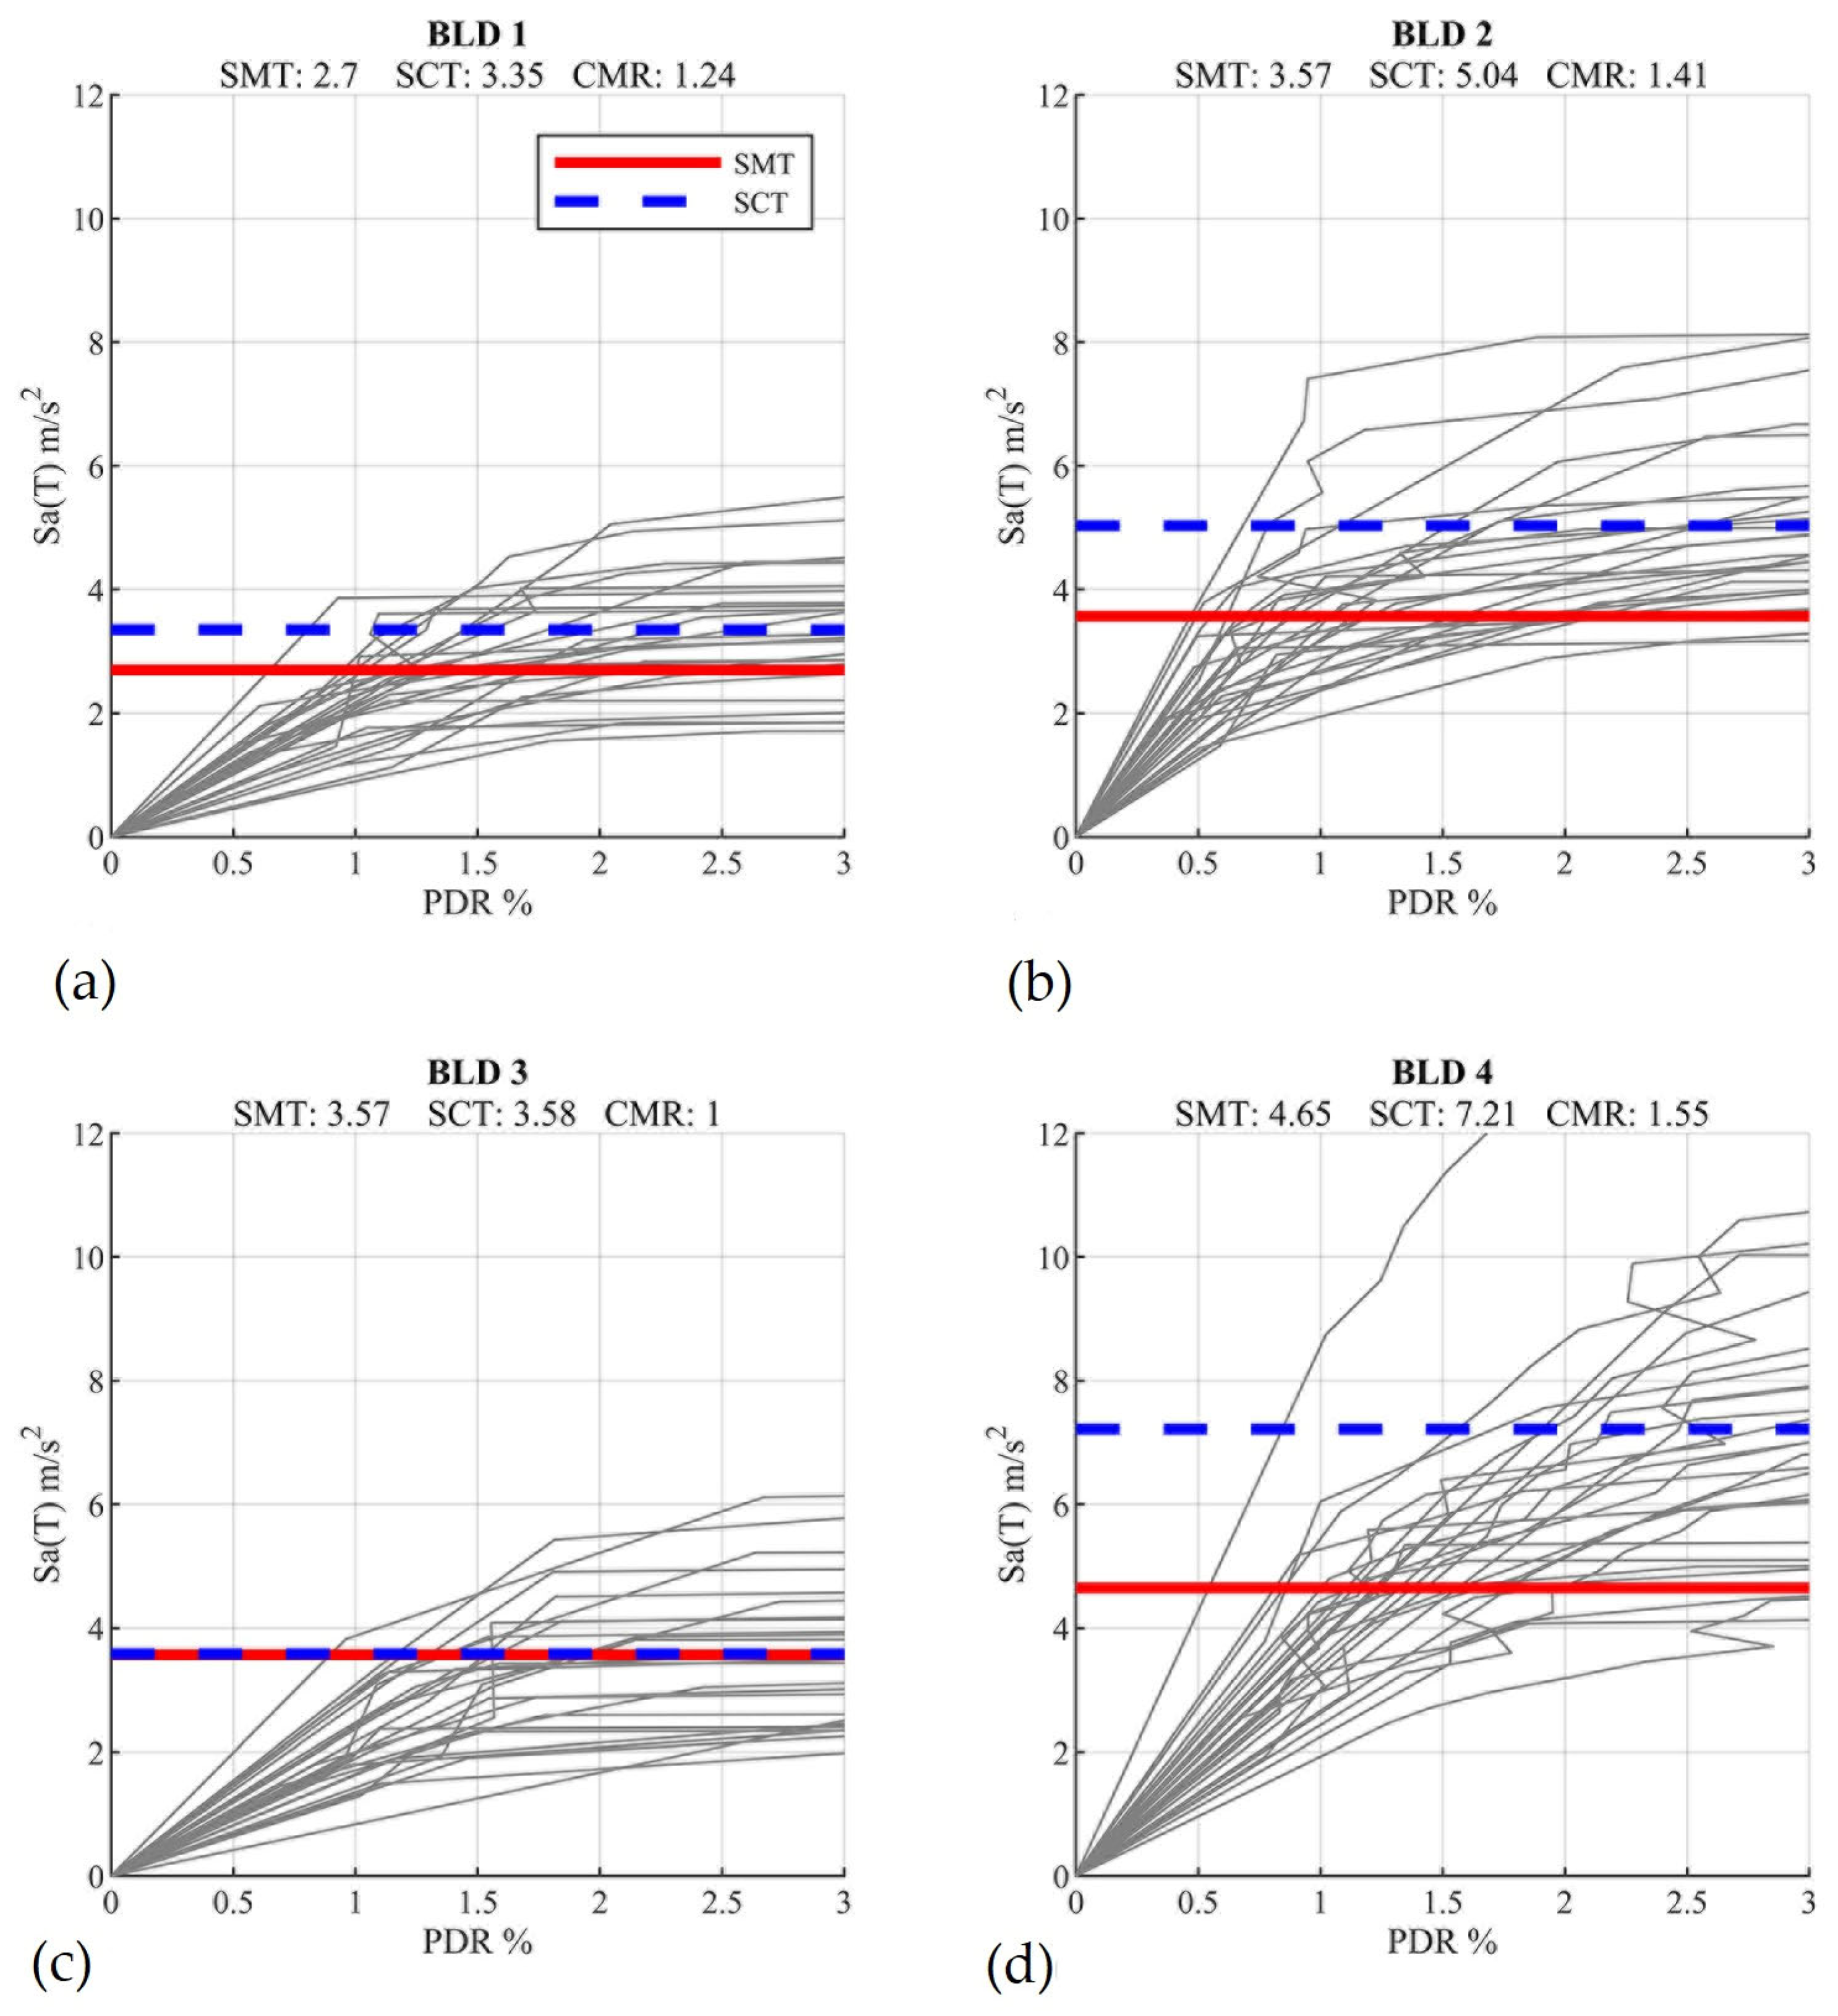
Figure 12 shows the IDA curves for each archetype. Grey lines indicate individual record responses, the red horizontal line represents the MCE spectral demand, and the blue dashed line indicates the median collapse capacity S C T . As per Figure 12, BLD-1, BLD-2, and BLD-4 all have CMRs greater than 1.0. In contrast, the archetype BLD-3, designed with a PDR that considerably exceeded the maximum PDR of NCh2745 (PDR = 0.7%), presented the lowest value of CMR among the analyzed archetypes (i.e., CMR ~ 1).
Figure 12a shows that archetype BLD-1 has a CMR of 1.24. It should be mentioned that a fixed-base LFTB designed for the same conditions as the archetype of this study was previously presented by Estrella et al. This fixed-base LFTB building required continuous anchor tie systems (ATS) in the SSWs to withstand the code forces. In addition, the SSWs of the fixed-base LFTB were sheathed with a double OSB panel. Therefore, the following differences can be mentioned between the isolated archetype BLD-1 and the fixed-base archetype: (i) a significant reduction in the BLD-1 model of 50% of the wall density in the analysis direction (i.e., ρ y ), (ii) replacement of continuous anchors tie systems (ATS) by discrete anchors (hold down), and (iii) elimination of an OSB panel on one side of the SSWs. Consequently, from the above arguments, it can be inferred that frictional seismic isolation would considerably reduce the cost of the superstructure of square-shaped LFTBs.
The archetype BLD-3’s marginal performance highlights the risk of using maximum permissible design parameters without further safety margins. It is essential to mention that this archetype would have met the design requirements of resistance and deformation if the shear force of the superstructure ( V s ) had been calculated assuming a response reduction factor R = 2 (maximum R-value allowed by the NCh2745 [22] standard). However, designing isolated LFTBs with the maximum factors of the NCh2745 standard (R = 2 and a PDR = 0.3%) could lead to designs with higher collapse probabilities than those accepted. The archetype BLD-4 achieved the highest CMR (1.55) despite a high friction coefficient (μ = 0.12). The high friction coefficient of the isolation system allows the reduction of the bearing’s total length to a value of 40 cm (considering the slider’s dimension of 16 cm). Its superior performance is attributed to its high wall density and use of double OSB sheathing. Despite this, the results obtained for archetype BLD-4 indicate that to achieve a CMR greater than 1.5, isolated LFTBs do not require continuous anchor tie systems (ATSs). The compact bearing size (40 cm) used in BLD-4 aligns with the findings by Quizanga et al. [13], and further reduction is possible using impact-resilient double concave friction pendulum devices.
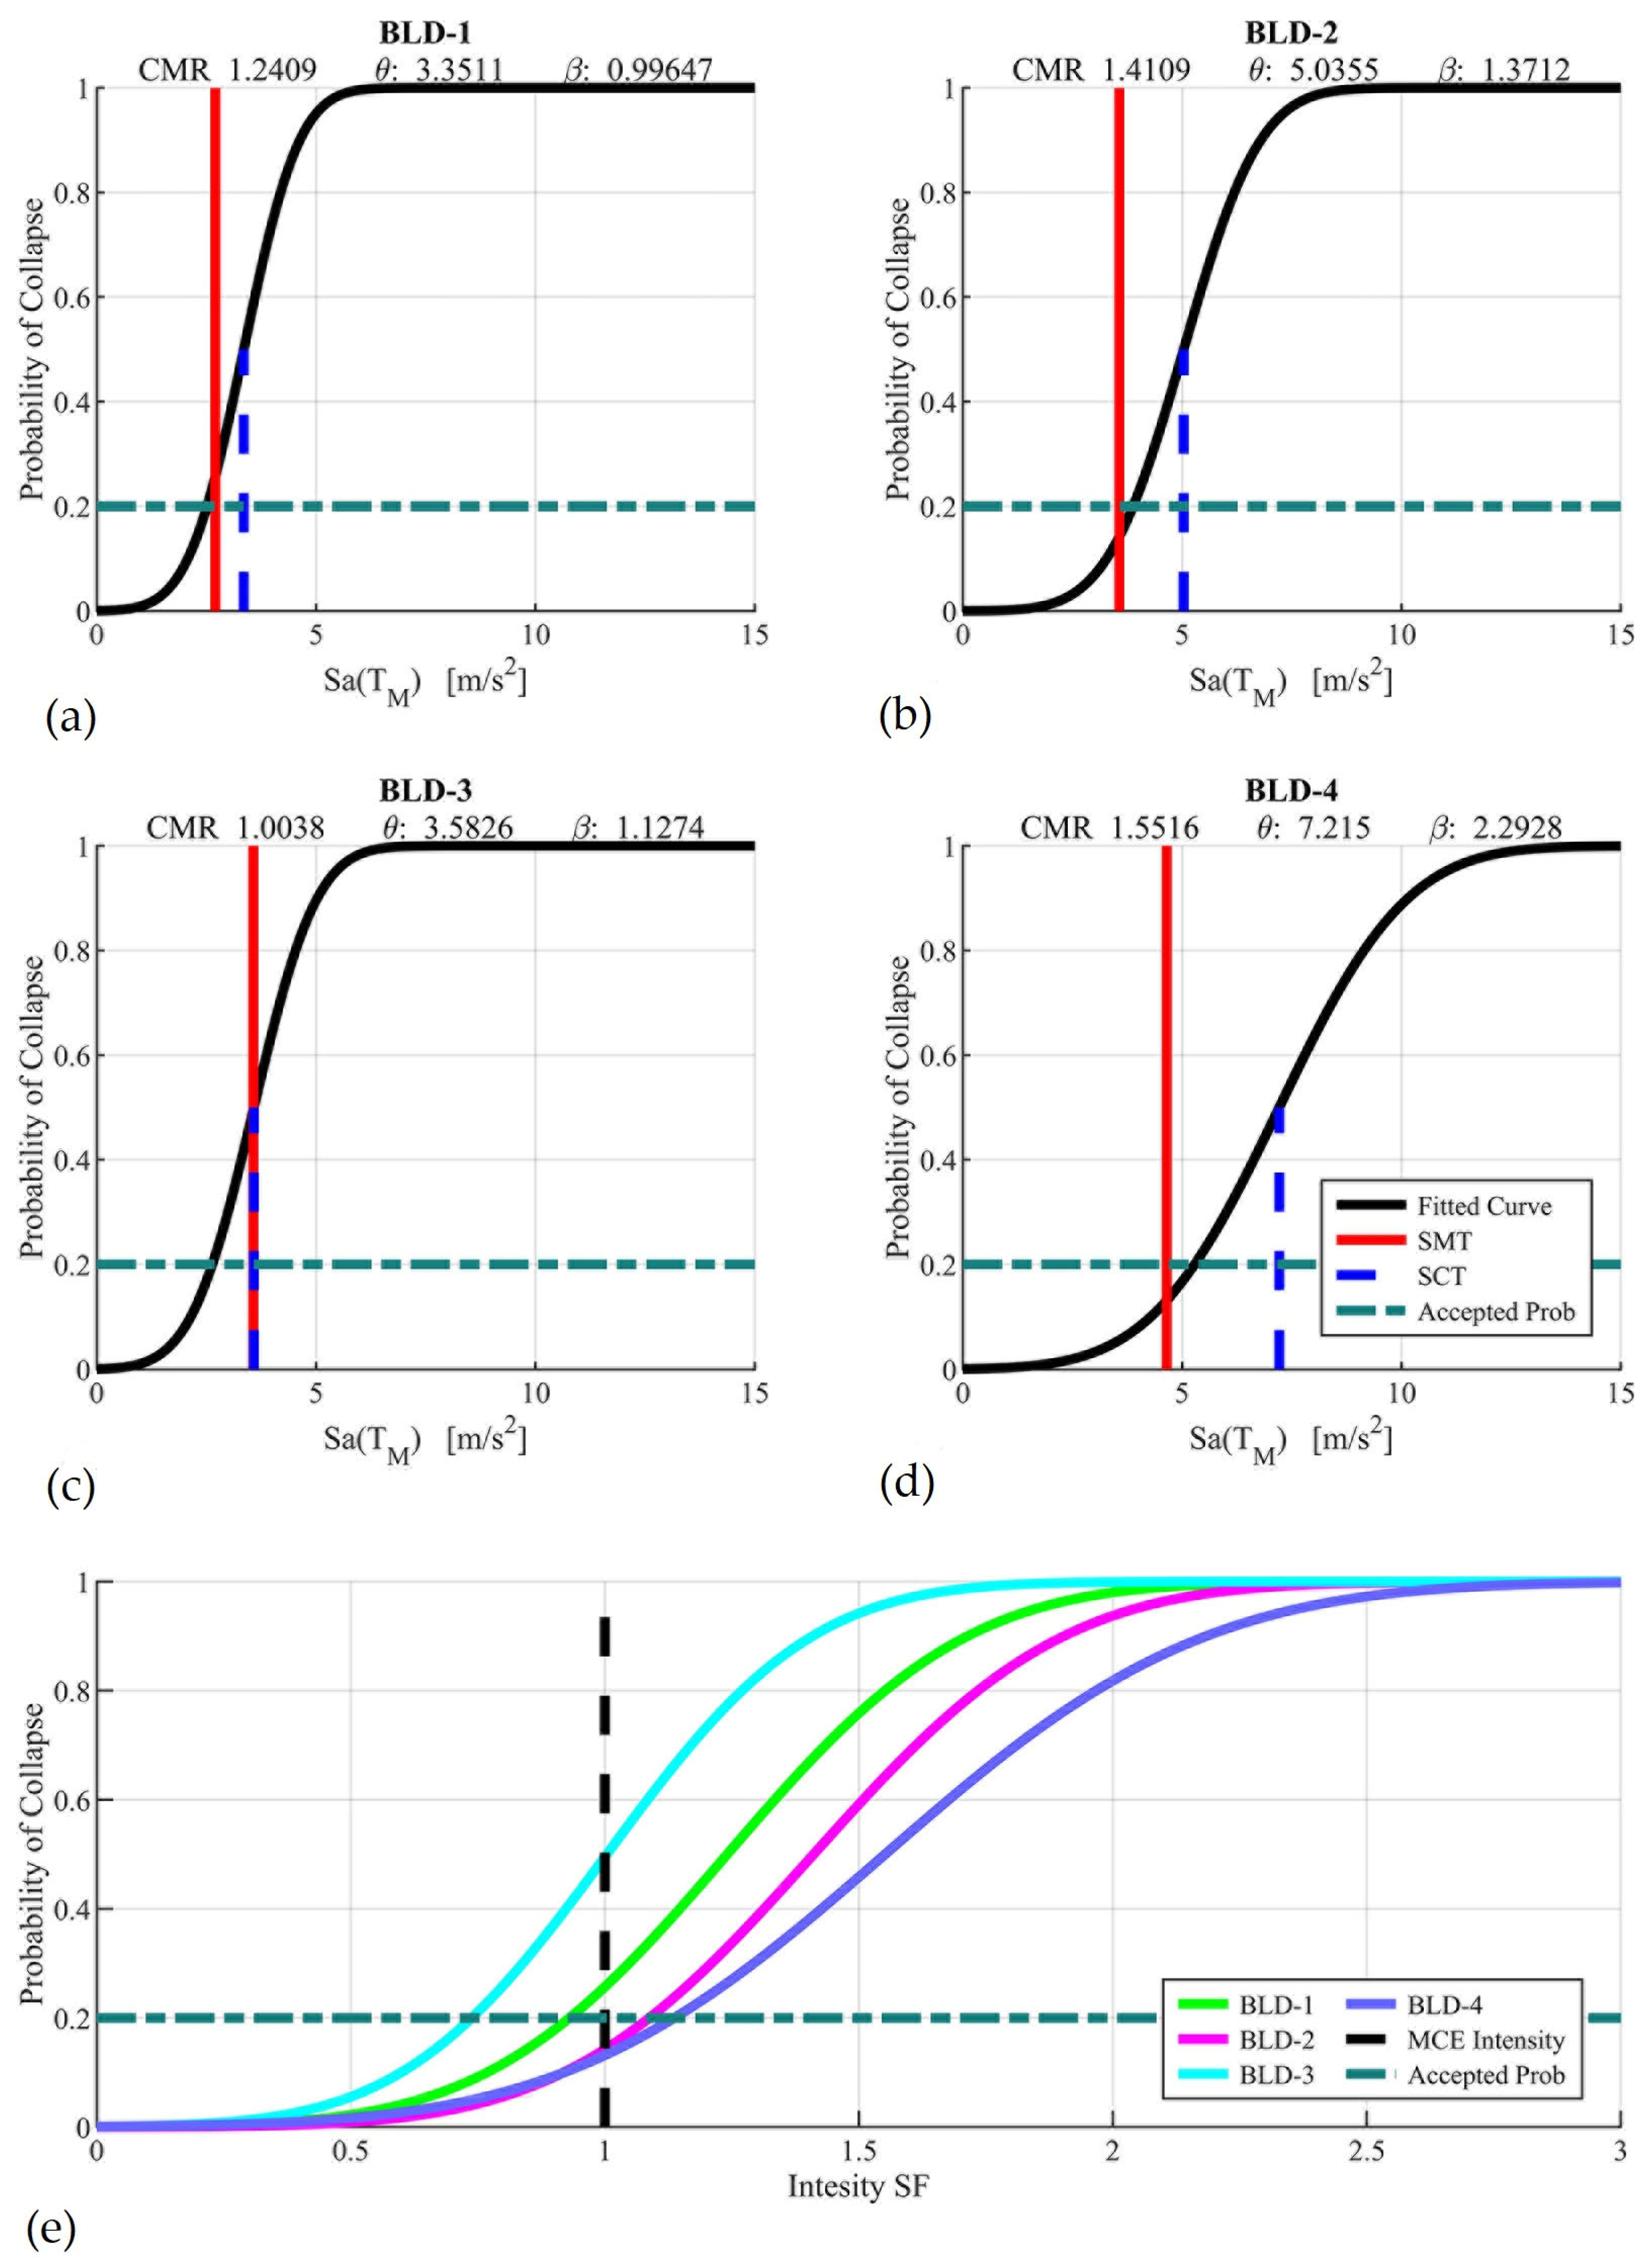
As mentioned, the fragility curves were obtained using the median collapse capacity S C T and the values of S a T M by fitting a lognormal function with a standard deviation β and mean θ . Figure 13a–d shows the fragility curves of the archetypes. In these figures, a probability of exceeding 20% is adopted as a criterion of acceptability (shown with a green dotted line). The fragility curves show that the best seismic performances occurred in archetypes BLD-2 and BLD-4. These buildings have a similar wall density ( ρ y ~ 3.6 % ) than those obtained in a fixed-base LFTB, with a T 1 ( i b ) / T 1 ( f b ) ratio close to 3, and with an isolation system designed using a friction coefficient μ f a s t ranging from low to high values (i.e., 0.06 or 0.12). Therefore, it can be concluded that the friction coefficient of the isolation system has a negligible impact on the performance of the archetypes if a correct relationship between the stiffness of the isolation system and the superstructure is established. Figure 13e compares the fragility curves of the archetype buildings, considering normalization of the intensity measurement. At SF = 1 (MCE intensity), BLD-2 and BLD-4 remain below the 20% collapse probability threshold.
It is important to note that the results presented are conservative due to the following:
  • The impact model does not include potential energy dissipation through perimeter ring plasticity;
  • The fragility curves do not include the FEMA-specified 1.2 amplification factor for 3D models;
  • The SSW model does not consider beneficial 3D coupling or gravity load effects.
It has been shown that axial load effects can increase the collapse margin. Therefore, even BLD-1 may exceed the minimum acceptable collapse performance if these effects are considered. The findings in this section highlight that frictional base-isolated LFTBs can achieve acceptable collapse performance without ATS, even with compact-sized isolators. The isolation system’s friction coefficient plays a secondary role if the stiffness balance between the isolation system and the superstructure is well proportioned.

6. Conclusions

This study evaluated the seismic performance of mid-rise light-frame timber buildings (LFTBs) equipped with frictional base isolation systems, focusing on the influence of the impact between the slider and the perimeter protection ring. Four archetype buildings were developed to explore the effects of varying design parameters, including peak drift ratio (PDR) target limits (ranging from 0.4% to 0.7%), effective radii of curvature, and friction coefficients (0.06, 0.12). Sophisticated nonlinear models were implemented in OpenSees, incorporating realistic representations of both the superstructure and isolation system, including impact behavior.
Collapse performance was assessed using Incremental Dynamic Analysis (IDA) following the FEMA P695 methodology. The collapse margin ratios (CMRs) and fragility curves derived for each archetype allowed for a comprehensive evaluation of their seismic performance. Based on the analyses, the following key conclusions can be drawn:
  • Code-conforming isolated LFTBs (R = 1, PDR ≤ 0.4%) can achieve acceptable collapse performance with reduced shear wall density and without continuous anchor tie systems (ATS), providing potential for substantial cost savings;
  • Non-code-conforming designs, such as BLD-3 with a 0.7% PDR, showed marginal performance (CMR ≈ 1.0), highlighting that drift limits in NCh2745 should not be exceeded without proper compensation in wall strength or redundancy;
  • The equivalent lateral force procedure, as prescribed by NCh2745, resulted in safe design outcomes for frictionally isolated regular LFTBs, even though nonlinear time history analysis is formally required;
  • Archetypes with a period ratio T 1 ( i b ) / T 1 ( f b ) close to 3.0, such as BLD-2 and BLD-4, displayed the best seismic performance. BLD-4, despite having the highest friction coefficient (μ = 0.12), achieved the highest CMR (1.55) and required compact isolators (40 cm length);
  • The isolation system’s friction coefficient had a limited effect on global performance, provided that the stiffness of the isolation system and the superstructure were well balanced. High-friction systems, when properly designed, can yield compact and cost-effective isolators;
  • Discrete hold-down anchors were sufficient to achieve good seismic performance in the archetypes, eliminating the need for costly continuous ATS and simplifying construction;
  • Even in the presence of slider impact, acceptable collapse probabilities were achieved in BLD-2 and BLD-4, and performance could be further improved by increasing the gap distance between the slider and perimeter ring.
Finally, several limitations presented in this study deserve to be discussed, and future research should address the following issues.
  • The vertical component of seismic ground motion was not considered. Although consistent with prior FEMA P695 applications, future studies should assess its potential to amplify peak floor accelerations and drift demands. To the best of the author’s knowledge, the only studies that evaluated the seismic performance of isolated buildings using the FEMA P695 methodology, considering 3D models and the impact effect, are the study of isolated steel buildings by Masroor et al. [16] and the study of hybrid timber buildings by Quizanga et al. [33]. However, even in these studies, the effect of the vertical component was neglected, too. Thus, the effect of a record’s vertical component warrants further investigation, as incorporating this vertical component could potentially increase PFAs and PDRs.
  • Axial load and 3D coupling effects in shear walls were not modeled. Including these effects is likely to enhance system stiffness and collapse resistance, as suggested by previous studies (e.g., [40]).
  • Impact was modeled via a linear-elastic approach that simplified the impact effect simulation by using easily calculable stiffnesses, as in previous studies by Kitayama and Constantinou [19]. More advanced impact models, capable of simulating energy dissipation, could improve the realism of the analysis, albeit at a high computational cost. Moreover, experimental data on small-scale DCFP bearings in timber applications are currently lacking. For these reasons, the authors adopted this simplified modeling assumption, looking for a balance between simplicity and accuracy.
  • This paper considers a limited number of archetype frames, all of which share the same plan and story number. This may limit the generality of these findings, as varying the number of stories would affect mass distribution and potentially the collapse fragility curves. Lower-rise buildings would likely exhibit reduced drift demands, whereas taller archetypes could experience increased instability. It should be noted that the results presented herein correspond to archetypes representative of five-story timber buildings on Site Class C soils with shallow foundations. Different structural and geotechnical parameters could influence the seismic response. For example, softer soils (e.g., Site D/E) may amplify isolation displacements and increase the likelihood of ring impact, while deeper foundation embedment could reduce lateral flexibility and modify isolator demands. While these aspects were outside the scope of the present study, they represent important directions for future research to extend the applicability of the findings.
Although frictional base-isolation introduces additional upfront costs including bearing units, foundation adaptation, and specialized detailing, these initial investments can be partially offset in LFTBs by eliminating expensive and labor-intensive continuous ATS. Moreover, the seismic resilience afforded by isolation significantly reduces repair costs, operational downtime, and damage to nonstructural components following earthquakes. Takahashi et al. [41] demonstrated that a base-isolated wooden house in Japan exhibited favorable lifecycle cost performance compared to a conventional counterpart, particularly in high seismicity zones. More broadly, lifecycle cost–benefit studies affirm that, in many cases, the higher initial cost of seismic isolation is outweighed by savings over time, particularly for buildings where downtime and repair costs are substantial [21]. Although a full cost-benefit analysis was beyond our scope, our results support the potential for frictional isolation to be a cost-effective strategy for enhancing the seismic resilience of mid-rise timber buildings.
Overall, this study demonstrates that frictional seismic isolation is a promising and cost-effective strategy for enhancing the seismic resilience of LFTBs in high-seismicity regions. Despite some modeling limitations, the results support the practical implementation of such systems and point to opportunities for refining design standards and numerical models in the future.

Author Contributions

Conceptualization, D.Q. and J.L.A.; methodology, D.Q. and J.L.A.; software, D.Q.; validation, D.Q. and P.T.-R.; formal analysis, D.Q. and P.T.-R.; investigation, D.Q.; resources, D.Q., P.T.-R. and J.L.A.; data curation, D.Q., and P.T.-R.; writing—original draft preparation, D.Q.; writing—review and editing, J.L.A. and P.T.-R.; visualization, J.L.A.; supervision, J.L.A.; project administration, J.L.A.; funding acquisition, J.L.A. All authors have read and agreed to the published version of the manuscript.

Funding

The authors express their gratitude for the financial support provided by the ANID BASAL FB210015 (CENAMAD), the ANID/FONDECYT/1241340 project.

Data Availability Statement

The data presented in this study are available on request from the corresponding author due to privacy restrictions.

Acknowledgments

The authors are grateful for the technical support received from the National Center of Excellence for the Wood Industry (CENAMAD). The first author appreciates the financial support provided by the Central University of Ecuador.

Conflicts of Interest

The authors declare no conflicts of interest.

Abbreviations

The following abbreviations are used in this manuscript:
ACMRAdjusted Collapse Margin Ratio
ASCEAmerican Society of Civil Engineers
ATSAnchor tie system
β Standard deviation
B D Effective damping at the DBE level
B M Effective damping at the MCE level
BLDBuilding
CSeismic coefficient
CMRCollapse margin ratio
D C A P Displacement capacity
D D Displacement at the DBE level
D M Displacement at the MCE level
D T M Total maximum displacement at MCE level
DBEDesign Basis Earthquake
DCFPDouble concave friction pendulum
D S S W Maximum lateral displacement of the SSW
EDPEngineering demand parameter
FEMAFederal Emergency Management Agency
FPSingle Friction Pendulum
hoSlider height
IMIntensity measure
K E D Effective stiffness at the DBE level
K E M Effective stiffness at the MCE level
LFTBLight-frame timber building
μ f a s t Friction coefficient at high sliding speed
MCEMaximum considered earthquake
N f Normalization factor
NSPNonlinear static pushover
OSBOriented strand board
ρ Wall density
PDRInter-story peak drift ratio
PFAPeak floor acceleration
PET-PPolyethylene terephthalate
PGAPeak ground acceleration
PGVPeak ground velocity
RResponse modification factor
R e f f Effective radius
R o Radius of curvature of the sliding surfaces
SAWSSeismic Analysis of Woodframe Structures
SDPWSSpecial Design Provisions for Wind and Seismic
SFScale factor
SSFSpectral shape factor
SSWStrong wood-frame shear wall
S C T Median collapse capacity
S M T Spectral acceleration at the fundamental period at the MCE level
T 1 Fundamental period
T D Effective period at the DBE level
T M Effective period at the MCE level
V s Base shear force
W t Total seismic weight
θ Mean

References

  1. Skullestad, J.L.; Bohne, R.A.; Lohne, J. High-rise Timber Buildings as a Climate Change Mitigation Measure—A Comparative LCA of Structural System Alternatives. Energy Procedia 2016, 96, 112–123. [Google Scholar] [CrossRef]
  2. Guindos, P. Fundamentos del diseño y la Construcción con Madera; Ediciones UC: Santiago, Chile, 2019. [Google Scholar]
  3. Ellingwood, B.R.; Rosowsky, D.V.; Pang, W. Performance of Light-Frame Wood Residential Construction Subjected to Earthquakes in Regions of Moderate Seismicity. J. Struct. Eng. 2008, 134, 1353–1363. [Google Scholar] [CrossRef]
  4. Kircher, C.A.; Reitherman, R.K.; Whitman, R.V.; Arnold, C. Estimation of Earthquake Losses to Buildings. Earthq. Spectra 1997, 13, 703–720. [Google Scholar] [CrossRef]
  5. Symans, M.D.; Cofer, W.F.; Fridley, K.J. Base Isolation and Supplemental Damping Systems for Seismic Protection of Wood Structures: Literature Review. Earthq. Spectra 2002, 18, 549–572. [Google Scholar] [CrossRef]
  6. Yang, T.Y.; Etebarian, H. Enhancing the seismic performance of mid-rise wood-frame buildings with rigid spine columns. Struct. Des. Tall Spec. Build. 2019, 28, e1556. [Google Scholar] [CrossRef]
  7. FEMA. FEMA P807. Seismic Evaluation and Retrofit of Multi-Unit Wood-Frame Buildings with Weak First Stories; Homeland Security: Washington, DC, USA, 2012.
  8. Wang, B.; Chen, P.; Zhu, S.; Dai, K. Seismic performance of buildings with novel self-centering base isolation system for earthquake resilience. Earthq. Eng. Struct. Dyn. 2023, 52, 1360–1380. [Google Scholar] [CrossRef]
  9. Liu, Q.; Guo, Z.; Zhu, S.; Wang, C.; Ren, X.; Wu, X. Performance-Based Seismic Design of Hybrid Isolation Systems with Gap-Tunable BRBs for Bearing-Supported Bridges. Symmetry 2022, 14, 1373. [Google Scholar] [CrossRef]
  10. Sakamoto, I.; Ohashi, Y.; Fujii, Y. Seismic Behavior of Base Isolated Two-storied Wooden Buildings. In Proceedings of the International Timber Engineering Conference, Tokyo, Japan, 23–25 October 1990; pp. 938–945. [Google Scholar]
  11. Van De Lindt, J.W.; Liu, H.; Symans, M.D.; Shinde, J.K. Seismic Performance and Modeling of a Half-Scale Base-Isolated Wood Frame Building. J. Earthq. Eng. 2011, 15, 469–490. [Google Scholar] [CrossRef]
  12. Jampole, E.; Deierlein, G.; Miranda, E.; Fell, B.; Swensen, S.; Acevedo, C. Full-Scale Dynamic Testing of a Sliding Seismically Isolated Unibody House. Earthq. Spectra 2016, 32, 2245–2270. [Google Scholar] [CrossRef]
  13. Quizanga, D.; Almazán, J.L.; Valdivieso, D.; López-García, D.; Guindos, P. Shaking table test of a timber building equipped with a novel cost-effective, impact-resilient seismic isolation system. J. Build. Eng. 2024, 82, 108402. [Google Scholar] [CrossRef]
  14. Pall, A.S.; Pall, R. Seismic response of a friction-base-isolated house in Montreal. In Proceedings of the 6th Canadian Conference on Earthquake Engineering, Toronto, ON, Canada, 12–14 June 1991; University of Toronto Press: Toronto, ON, Canada, 1991; pp. 375–382. [Google Scholar] [CrossRef]
  15. Zayas, V.; Low, S. Seismic Isolation of a Four-Story Wood Building. Earthquake Performance and Safety of Timber Structures; Forest Products Society Proc. No. 7289; Forest Products Society: Ruston, LA, USA, 1997; pp. 83–91. [Google Scholar]
  16. Masroor, A.; Mosqueda, G. Assessing the Collapse Probability of Base-Isolated Buildings considering Pounding to Moat Walls using the FEMA P695 Methodology. Earthq. Spectra 2015, 31, 2069–2086. [Google Scholar] [CrossRef]
  17. Bao, Y.; Becker, T.C. Inelastic response of base-isolated structures subjected to impact. Eng. Struct. 2018, 171, 86–93. [Google Scholar] [CrossRef]
  18. Bao, Y.; Becker, T.C.; Sone, T.; Hamaguchi, H. To limit forces or displacements: Collapse study of steel frames isolated by sliding bearings with and without restraining rims. Soil Dyn. Earthq. Eng. 2018, 112, 203–214. [Google Scholar] [CrossRef]
  19. Kitayama, S.; Constantinou, M.C. Seismic Performance Assessment of Seismically Isolated Buildings Designed by the Procedures of ASCE/SEI 7. Technical Report MCEER-18-004. University at Bufalo, State University of New York: New York, NY, USA, 2018; ISSN 1520-295X. [Google Scholar]
  20. Jampole, E.; Deierlein, G.; Miranda, E.; Fell, B.; Swensen, S.; Acevedo, C. An economic sliding isolation system for light frame residential structures. In Proceedings of the 16th World Conference on Earthquake Engineering, Santiago, Chile, 9–13 January 2017. [Google Scholar]
  21. Sancin, L.; Rinaldin, G.; Fragiacomo, M.; Amadio, C. Seismic analysis of an isolated and a non-isolated light-frame timber building using artificial and natural accelerograms. Boll. Geofis. Teor. Ed. Appl. 2014, 55, 103. [Google Scholar] [CrossRef]
  22. NCh 2745-13; Análisis y Diseño Sísmico de Edificios con Aislación Sísmica. Instituto Nacional de Normalización: Santiago, Chile, 2013.
  23. FEMA. FEMA P695. Quantification of Building Seismic Performance Factors; Homeland Security: Washington, DC, USA, 2009.
  24. Mckenna, F.; Fenves, G.; Scott, M. Open system for earthquake engineering simulation; University of California: Berkeley, CA, USA, 2000; Available online: https://opensees.berkeley.edu (accessed on 16 September 2025).
  25. Vamvatsikos, D.; Allin Cornell, C. Incremental dynamic analysis. Earthq. Eng. Struct. Dyn. 2002, 31, 491–514. [Google Scholar] [CrossRef]
  26. Estrella, X.; Guindos, P.; Almazán, J.L.; Malek, S.; María, H.S.; Montaño, J.; Berwart, S. Seismic performance factors for timber buildings with woodframe shear walls. Eng. Struct. 2021, 248, 113185. [Google Scholar] [CrossRef]
  27. Guíñez, F.; María, H.S.; Almazán, J.L. Monotonic and cyclic behaviour of wood frame shear walls for mid-height timber buildings. Eng. Struct. 2019, 189, 100–110. [Google Scholar] [CrossRef]
  28. Estrella, X.; Guindos, P.; Almazán, J.L.; Malek, S. Efficient nonlinear modeling of strong wood frame shear walls for mid-rise buildings. Eng. Struct. 2020, 215, 110670. [Google Scholar] [CrossRef]
  29. American Society of Civil Engineers. Minimum Design Loads and Associated Criteria for Buildings and Other Structures; American Society of Civil Engineers: Reston, VA, USA, 2022. [Google Scholar]
  30. Nch 433-of 1996 Mod 2012 Mod; Diseño sísmico de Edificios. Instituto Nacional de Normalización: Santiago, Chile, 2012.
  31. Computers and Structures Inc. SAP2000: Integrated Solution for Structural Analysis and Design, Structural Analysis Program; Computers and Structures Inc.: Berkeley, CA, USA, 2019. [Google Scholar]
  32. American Wood Council. Special Design Provisions for Wind and Seismic. 2015. Available online: https://awc.org/publications/2015-sdpws/ (accessed on 5 February 2025).
  33. Quizanga, D.; Almazán, J.L.; Torres-Rodas, P.; Guindos, P. Seismic performance of timber buildings retrofitted with hybrid walls and impact-resilient isolators. Soil Dyn. Earthq. Eng. 2025, 198, 109586. [Google Scholar] [CrossRef]
  34. Pei, S.; van de Lindt, J.W. Coupled shear-bending formulation for seismic analysis of stacked wood shear wall systems. Earthq. Eng. Struct. Dyn. 2009, 38, 1631–1647. [Google Scholar] [CrossRef]
  35. Folz, B.; Filiatrault, A. Cyclic Analysis of Wood Shear Walls. J. Struct. Eng. 2001, 127, 433–441. [Google Scholar] [CrossRef]
  36. Constantinou, M.; Mokha, A.; Reinhorn, A. Teflon Bearings in Base Isolation II: Modeling. J. Struct. Eng. 1990, 116, 455–474. [Google Scholar] [CrossRef]
  37. Gallegos, M.F.; Araya-Letelier, G.; Lopez-Garcia, D.; Parra, P.F. Seismic collapse performance of high-rise RC dual system buildings in subduction zones. Case Stud. Constr. Mater. 2023, 18, e02042. [Google Scholar] [CrossRef]
  38. Cando, M.A.; Hube, M.A.; Parra, P.F.; Arteta, C.A. Effect of stiffness on the seismic performance of code-conforming reinforced concrete shear wall buildings. Eng. Struct. 2020, 219, 110724. [Google Scholar] [CrossRef]
  39. Estrella, X.; Guindos, P.; Almazán, J.L. Ground motions for FEMA P-695 application in subduction zones. Lat. Am. J. Solids Struct. 2019, 16, e237. [Google Scholar] [CrossRef]
  40. Benedetti, F.; Jara-Cisterna, A.; Grandón, J.C.; Astroza, N.; Opazo-Vega, A. Numerical Analysis of the Seismic Performance of Light-Frame Timber Buildings Using a Detailed Model. Buildings 2022, 12, 981. [Google Scholar] [CrossRef]
  41. Takahashi, Y.; Masaki, N.; Anahara, K.; Isoda, H. Life-Cycle Cost Effectiveness of Base-Isolated Wooden House in Seismically Active Region. In Proceedings of the 13th World Conference on Earthquake Engineering, Vancouver, BC, Canada, 1–6 August 2004. [Google Scholar]
Figure 1. (a) Floor plan “P,” (b) Shear wall layout presented in Estrella et al. 2021 (dimensions in meters).
Buildings 15 03593 g001
Figure 2. SAP2000 linear model (a) 3D view (b) layout of 25 DCFP isolators, note the distance between axes (dimensions in meters).
Buildings 15 03593 g002
Figure 3. DCFP bearing: (a) schematic configuration; (b) 3D view; (c) plan view of slider–polymeric plates; (d) 30 MPa, load > 420 kN (e); 30 MPa, load < 420 kN; (f) 60 MPa, load < 420 kN (dimensions in millimeters).
Buildings 15 03593 g003
Figure 4. Shear wall density (a) BLD-1 (b) BLD-2 (c) BLD-3 (d) BLD-4.
Buildings 15 03593 g004
Figure 5. (a) SSW numerical model (b) Test results and Model Prediction.
Buildings 15 03593 g005
Figure 6. (a) Numerical model for FP bearing with impact. Hysteretic used in the model (b) without impact and (c) with impact.
Buildings 15 03593 g006
Figure 7. Set of records for archetype BLD-4 (a) normalized individually and (b) scaled collectively.
Buildings 15 03593 g007
Figure 8. NSP results (a) Base level (b) Roof level (c) Considering relative roof Displacements.
Buildings 15 03593 g008
Figure 9. DCFP Hysteresis (Isolator # 1) (a) Cape-Mendocino SF = 1.0 (b) Cape-Mendocino SF = 1.4. DCFP Hysteresis (Isolator # 8) (c) Cape-Mendocino SF = 1.0 (d) Cape-Mendocino SF = 1.4.
Buildings 15 03593 g009
Figure 10. SSW (located over isolator #1) Lateral Hysteresis (a) as-recorded Cape-Mendocino record (b) Cape-Mendocino amplified by 1.4. SSW Time history (c) Displacements (d) Lateral.
Buildings 15 03593 g010
Figure 11. SSW (located over isolator #1) Vertical Hysteresis (a) Cape-Mendocino SF = 1.0 (b) Cape-Mendocino SF = 1.4. SSW Time history (c) Vertical Displacements (d) Vertical forces.
Buildings 15 03593 g011
Figure 12. IDA curves and CMRs of archetype (a) BLD-1 (b) BLD-2 (c) BLD-3 (d) BLD-4.
Buildings 15 03593 g012
Figure 13. Fragility curves (a) BLD-1 (b) BLD-2 (c) BLD-3 (d) BLD-4 (e) BLD1 to BLD4.
Buildings 15 03593 g013
Table 1. Archetypes—adopted input parameters.
Archetype IDPDR Target [%] μ f a s t R o [m]
BLD-10.400.062.0
BLD-20.400.061.0
BLD-30.700.061.0
BLD-40.400.122.0
Table 2. Axial load in DCFP bearings.
Isolator # Axial Load [kN]Isolator # Axial Load [kN]Isolator # Axial Load [kN]Isolator # Axial Load [kN]Isolator # Axial Load [kN]
1219.176313.7711128.6016313.7721219.17
2225.187422.3012320.8917422.3022225.18
3138.598518.8813147.3218518.8823138.59
4225.189422.3014320.8919422.3024225.18
5219.1710313.7715128.6020313.7725219.17
Note: # indicates the number of the bearing (See Figure 3b).
Table 3. Design parameters of the isolation system.
DBE Level
Archetype
ID
  Displacement   D D [mm] Effective   Period   T D [s] Effective   Damping   B D [%] Effective   Stiffness   K E D [kN/mm]
BLD-1157.002.5137.924.52
BLD-2197.002.2123.335.86
BLD-3197.002.2123.335.86
BLD-4139.001.9048.777.92
MCE Level
Archetype
ID
Displacement   D M [mm] Effective   Period   T M [s] Effective   Damping   B M [%] Effective   Stiffness   K E M [kN/mm]
BLD-1196.002.6834.533.98
BLD-2259.002.3119.495.34
BLD-3259.002.3119.495.34
BLD-4171.002.0546.406.78
Table 4. Dimensions of individual DCFPs bearing.
Archetype ID FPS   R e f f [m] D C A P [mm]Total Length [mm]
BLD-13.92250.00430.00
BLD-21.92320.00500.00
BLD-31.92320.00500.00
BLD-43.92220.00400.00
Table 5. Superstructure design.
Archetype IDSeismic Coefficient C ρ x ρ y Nail Spacing *
Story
1
Story
2
Story
3
Story
4
Story
5
BLD-110.01%2.84%1.78%S50S100S100S100S150
BLD-216.29%3.07%3.53%D100S50S50S100S150
BLD-316.29%2.88%2.29%S100S150S150S150S150
BLD-415.55%3.24%3.89%D50D50D50D100D100
Notes: * The first character indicates the sheathed of the SSWs (S = simple or D = double OSB panel). The numbers show the perimetral nail spacing in mm. The nail spacing in this table summarizes the typical wall’s edges nail spacing used on each story; however, it was reduced on some walls when the design required it.
Table 6. Modal Properties.
Archetype ID Isolated LFTB
T 1 ( i b ) [s]
Fix
LFTB
T 1 ( f b ) [s]
Ratio
T 1 ( i b ) / T 1 ( f b )
BLD-12.841.012.81
BLD-22.450.763.22
BLD-32.491.052.37
BLD-42.170.732.97
Disclaimer/Publisher’s Note: The statements, opinions and data contained in all publications are solely those of the individual author(s) and contributor(s) and not of MDPI and/or the editor(s). MDPI and/or the editor(s) disclaim responsibility for any injury to people or property resulting from any ideas, methods, instructions or products referred to in the content.