Article

A Markerless Photogrammetric Framework with Spatio-Temporal Refinement for Structural Deformation and Strain Monitoring

Department of Civil Engineering, National Yang Ming Chiao Tung University, No. 1001, Daxue Road, East District, Hsinchu City 300, Taiwan
*
Author to whom correspondence should be addressed.
Buildings 2025, 15(19), 3584; https://doi.org/10.3390/buildings15193584
Submission received: 29 August 2025 / Revised: 27 September 2025 / Accepted: 2 October 2025 / Published: 5 October 2025
(This article belongs to the Special Issue Advances in Nondestructive Testing of Structures)

Abstract

Photogrammetry offers a non-contact and efficient alternative for monitoring structural deformation and is particularly suited to large or complex surfaces such as masonry walls. This study proposes a spatio-temporal photogrammetric refinement framework that enhances the accuracy of three-dimensional (3D) deformation and strain analysis by integrating advanced filtering techniques into markerless image-based measurement workflows. A hybrid methodology was developed using natural image features extracted using the Speeded-Up Robust Features algorithm and refined through a three-stage filtering process: median absolute deviation filtering, Gaussian smoothing, and representative point selection. These techniques significantly mitigated the influence of noise and outliers on deformation and strain analysis. Comparative experiments using both manually placed targets and automatically extracted feature points on a full-scale masonry wall under destructive loading demonstrated that the proposed spatio-temporal filtering effectively improves the consistency of displacement and strain fields, achieving results comparable to traditional marker-based methods. Validation against laser rangefinder measurements confirmed sub-millimeter accuracy in displacement estimates. Additionally, strain analysis based on filtered data captured crack evolution patterns and spatial deformation behavior. Therefore, integrating photogrammetric 3D point tracking with spatio-temporal refinement provides a practical, accurate, and scalable approach to monitor structural deformation in civil engineering applications.

1. Introduction

1.1. Motivation

The safety and durability of structures are of paramount importance, making structural deformation monitoring an increasingly critical area of research in civil engineering. Traditional structural deformation-monitoring methods primarily rely on contact-based measurements, such as strain gauges and displacement transducers. However, these approaches often require complex equipment setups and entail high maintenance costs. Moreover, they may be unsuitable for large-scale or irregularly shaped structures. Consequently, non-contact measurement techniques, such as photogrammetry, have garnered growing attention due to their advantages in providing rapid, comprehensive, and surface-independent data acquisition, thereby effectively overcoming the limitations of conventional methods [1].
Photogrammetry extracts three-dimensional (3D) coordinate information of structural surfaces by analyzing multi-view images, enabling the accurate monitoring of structural deformations. This study focused on the application of photogrammetry in structural experiments and specifically explored its potential for measuring deformation and computing the strain on masonry walls using natural image feature point extraction techniques.

1.2. Previous Studies

In traditional destructive testing of concrete structures, displacements induced by external loads are typically measured using contact instruments such as dial gauges and linear variable displacement transducers (LVDTs). While these instruments provide accurate displacement measurements within their operational linear range, they have inherent limitations, as each device only captures displacement at a single specific point. Therefore, it is necessary to deploy numerous LVDTs to obtain comprehensive spatial displacement data; however, this significantly increases both experimental complexity and cost. Furthermore, when structures approach failure, these contact instruments are prone to damage, which can potentially compromise data integrity.
To overcome these drawbacks, non-contact measurement methods such as close-range digital photogrammetry and laser scanning have become increasingly prominent. Photogrammetry measures displacements mainly through angular calculations derived from image data, whereas laser scanning relies on direct range measurements. Close-range photogrammetry has emerged as a promising technique for measuring 3D deformations in concrete structures [2] and masonry walls [3]. This non-contact method offers advantages over traditional point-measurement techniques, providing full-field, spatially intensive data. Various studies have demonstrated its effectiveness in monitoring concrete walls, beams, and tunnels, achieving high accuracy. Given the comparative cost-effectiveness of imaging equipment over laser scanners, this study employed close-range photogrammetry techniques to monitor structural deformation.
Previous research has underscored the efficacy of photogrammetry across various structural monitoring applications, including concrete beams, steel beams, and bridges. Comparisons with conventional methods, such as LVDTs and total station instruments, have shown good correlation and accuracy. For instance, Whiteman et al. (2002) [4] employed photogrammetry to assess deflections of concrete beams by strategically positioning targets on beam surfaces and placing reference points within the test environment. Their dual-camera experimental setup, operating under diverse loading conditions, achieved sub-millimeter accuracy comparable to traditional LVDT measurements, demonstrating that photogrammetry can capture critical shear deformation parameters in U-shaped carbon fiber-reinforced concrete beams, such as crack width and strain distribution. Their findings confirmed that the accuracy of photogrammetry matches that of conventional instrumentation while offering superior efficiency and simplified experimental setup.
Valença et al. (2012) [5] further validated the versatility of photogrammetry, illustrating its effectiveness in monitoring large-scale structures, including long-span beams and bridges. Their research highlighted key advantages, notably that photogrammetry can acquire extensive measurement data through automated image processing and increased flexibility in data acquisition.
However, existing studies on photogrammetry have predominantly focused on capturing displacements in one-dimensional (1D) vertical or two-dimensional (2D) fields, primarily for beams. Comprehensive 3D deformation monitoring has traditionally relied on laser scanning techniques [6]. Recognizing the importance of capturing complete 3D deformation profiles, especially for concrete walls subjected to destructive loading, this study aimed to apply photogrammetric methodologies, specifically for detailed 3D deformation analysis of concrete walls under varied loading conditions.
Recent advancements have further strengthened photogrammetry’s capabilities for precise deformation monitoring. Liebold and Maas (2016) [7] presented advanced spatio-temporal filtering techniques using an empirical orthogonal function analysis and Kolmogorov–Smirnov tests to detect cracks from image sequences under variable loading conditions. The authors performed displacement vector analyses around cracks with accuracy, explaining up to 99% variance and significantly enhancing noise mitigation and measurement precision. Subsequently, Liebold et al. (2020) [8] refined these methods by integrating median absolute deviation (MAD) and Mahalanobis distance techniques for enhanced data filtering, successfully reducing displacement measurement errors to millimeter precision. Liebold et al. (2023) [9] proposed a photogrammetric image sequence analysis method to measure deformation and detect cracks in carbon-reinforced concrete during shear testing. Using a monocular digital image correlation (DIC) approach, the authors extracted subpixel-accurate deformation vectors from sequential images. A triangular mesh model captured relative displacements across the cracked regions, enabling crack detection and quantification. The method was validated through a shear test on a high-strength, carbon-reinforced concrete member, revealing detailed insights into crack evolution and shear transfer mechanisms. The study provides a contact-free, high-resolution alternative to traditional sensors, offering valuable contributions for the structural monitoring of brittle composite materials.
Additionally, DIC techniques have substantially advanced deformation measurement accuracy in numerous fields, including civil engineering and materials testing. In civil engineering, DIC has been instrumental in evaluating structural behavior under various loading conditions. Notable applications include monitoring concrete crack propagation [10], concrete masonry structures [11], dynamic structural responses [12], and overall structural health monitoring [13]. In materials testing, DIC has been employed to comprehensively evaluate displacement and strain fields, providing critical insights into mechanical properties. Compared to traditional measurement techniques, DIC offers marked advantages in efficiency and accuracy [14,15,16]. These extensive applications highlight the potential of photogrammetry and DIC in precise, efficient analyses of structural deformation and monitoring.
Image quality in DIC or holographic reconstruction (speckle noise, insufficient resolution, destruction of texture details) is a critical constraint on measurement accuracy and robustness. Strategies have recently emerged that use deep-learning models together with traditional methods or novel network architectures to restore or enhance image quality. Different approaches include: noise suppression while preserving detail [17]; handling the trade-off between complex deformation, spatial resolution, and measurement resolution [18]; and improving image resolution under low-resolution conditions to enhance DIC matching [19].

1.3. Need for Further Study and Research Purpose

In structural deformation monitoring, photogrammetric techniques have traditionally relied on signalized targets (also called photogrammetric targets) that offer well-defined centers, making it possible to determine coordinates precisely. While effective, this approach requires the manual placement or attachment of targets onto structural surfaces—a process that is both time-consuming and labor-intensive, particularly in large-scale or complex scenarios.
To address these limitations, an alternative strategy involves the use of natural image features, which is commonly referred to as markerless or targetless photogrammetry. This method eliminates the need for physical targets, offering greater flexibility and reducing the setup time. However, existing studies have shown that targetless feature extraction often yields higher strain measurement errors compared to conventional target-based methods, mainly due to irregular feature point distributions and lower positional accuracy. For different materials (e.g., smooth planar surfaces) and for structures at larger scales, challenges may arise in image acquisition and computational demands. Moreover, under varying weather and lighting conditions, the extraction of feature points can become more difficult. Nevertheless, the proposed method has the advantage over conventional DIC in that it does not require a very dense speckle pattern, and it can also be applied to slightly uneven surfaces. These features make the method applicable under different scenarios, thereby offering relatively high versatility. Therefore, refining the precision and robustness of markerless photogrammetric workflows remains a critical research challenge. It is essential to enhance the accuracy of natural feature-based extraction and tracking to broaden the practical applicability of photogrammetry in structural deformation monitoring.

1.4. Objectives

The objective of this study was to develop and validate spatio-temporal filtering techniques to enhance the accuracy of markerless photogrammetry for 3D deformation measurement and strain calculation in masonry wall tests. Specifically, the study employed MAD filtering and 1D convolution smoothing to improve the quality of extracted feature point coordinates and evaluate the effectiveness of these enhancements in strain computation.

1.5. Contributions

This study makes the following key contributions:
1.
Development and validation of filtering techniques: This study presents a spatio-temporal filtering framework that is specifically designed for markerless photogrammetric data. Instead of considering only spatial smoothing at a single time step, the proposed method also integrates temporal information, which effectively reduces random noise, enhances the precision of 3D deformation measurements and strain field estimations.
2.
Experimental demonstration of method effectiveness: The study experimentally demonstrates the feasibility, accuracy, and improved computational efficiency of the proposed markerless approach through full-scale testing on a masonry wall under controlled loading, providing a reliable and efficient non-contact alternative for monitoring structural deformation in civil engineering applications.
3.
Methodological advancement in non-contact monitoring: By integrating advanced image-based tracking with spatio-temporal refinement, the study contributes to the ongoing development of photogrammetry-based structural monitoring techniques, supporting the broader adoption of scalable, high-resolution, and target-free measurement systems in real-world practice.

2. Methodology

This study used photogrammetric techniques to determine the 3D coordinates of points on a masonry wall surface, enabling the analysis of its deformation behavior under various loading conditions. Two approaches were employed to generate the 3D coordinates of points: (1) using the centroids of circular artificial targets and (2) using image feature points. The proposed scheme comprises three major parts (Figure 1): (1) generating 3D coordinates of wall surface points through photogrammetry; (2) applying spatio-temporal filtering to refine the 3D points; and (3) computing strain and analyzing strain field distributions.

2.1. Time-Series 3D Points Generation

This study positioned multiple cameras at fixed locations to capture synchronized images of a masonry wall from different viewpoints. During the experiment, multi-view images were acquired at varying time intervals under different external load conditions, enabling the calculation of 3D coordinates of wall surface points via photogrammetric space intersection. These time-series points were used to analyze the deformation of the wall. Since the cameras remained fixed throughout the experiment, only the wall surface itself experienced deformation. An initial set of multi-view images was captured before loading to establish the exterior orientation parameters (EOPs), serving as the reference (undeformed) coordinates of the wall. After determining the EOPs and capturing time-sequenced images during different loading conditions, the study performed feature extraction, tracking, and space intersection to derive the time-series 3D coordinates of the wall surface points, enabling a detailed observation of wall deformation.
Two different strategies were employed to identify wall surface feature points for generating time-series 3D coordinates used in deformation analysis:
(1)
Marker-based feature points: Artificial targets in the form of black circular markers were manually applied to the wall surface. The centroids of these circles were extracted as precise feature point locations. This approach offers the advantages of uniform distribution and well-defined, easily identifiable points.
(2)
Algorithm-derived feature points: The Speeded-Up Robust Features (SURF) [20] algorithm was used to detect keypoint descriptors directly from the images. This method does not require physical markers on the wall and can generate a much higher density of feature points compared to the artificial targets.
The main procedures for obtaining the time-series 3D coordinates of wall surface points were as follows: (1) camera calibration to determine the interior orientation parameters (IOPs); (2) orientation modeling to obtain the EOPs; (3) extraction of wall surface feature points from the initial image set; (4) sequential image matching to track the 2D image coordinates of feature points; and (5) space intersection to compute the time-series 3D coordinates of the wall surface points.

2.1.1. Camera Calibration to Determine IOPs

This study used a non-metric digital camera for data acquisition. Before the experiment, camera calibration, which corrects systematic errors and improves the accuracy of 3D positioning, was necessary to determine the camera’s IOPs. The objective of camera calibration is to compute the IOPs to compensate for lens distortion, a type of optical aberration that can cause shifts or distortions in the shape, size, or position of objects in the image.
Lens distortion can be categorized into two main types: radial lens distortion and decentric (or tangential) lens distortion. Radial distortion results in the symmetric, outward, or inward displacement of image points relative to the center of the image, while decentric distortion introduces asymmetric shifts due to the misalignment of lens elements. This study used Brown equations [21] (Equations (1)–(7)) to model these distortions in camera calibration and establish a calibration field with markers of known object-space coordinates. The camera captured highly overlapped multi-view images of these markers from different angles. Calibration was performed using self-calibrating bundle adjustment [22,23], which applies the collinearity condition equations in a rigorous least-squares adjustment framework. The study adopted detailed parameter estimation methods to solve the IOPs, following the approach described in Wolf and Dewitt (2000) [24].
x = x r + x d
y = y r + y d
x r = x ¯ × ( K 1 r 2 + K 2 r 4 + K 3 r 6 )
y r = y ¯ × ( K 1 r 2 + K 2 r 4 + K 3 r 6 )
x d = P 1 r 2 + 2 x ¯ + 2 P 2 x y ¯
y d = P 2 r 2 + 2 x ¯ + 2 P 1 x y ¯
r = ( x ¯ ) 2 + ( y ¯ ) 2 = ( x x 0 ) 2 + ( y y 0 ) 2
where (Δxy) are the total lens distortion; (Δxryr) are the radial distortion; (Δxd,Δyd) are the tangential distortion; (K1–K3) are the coefficients of radial distortion; (P1P2) are the coefficients of tangential distortion; r is the radial distance; (x,y) are the photo coordinates; and (x0,y0) are the principal points.

2.1.2. Orientation Modeling to Determine EOPs

After determining the camera’s IOPs in the preceding calibration step, numerous conjugate points and control points identified in the images were used in this stage to perform bundle adjustment. This least-squares method simultaneously refines the EOPs by minimizing image measurement residuals, ensuring accurate estimation of the camera’s position (Xc,Yc,Zc) and rotation (attitude) angles (ω,ϕ,κ) for each camera. Orientation modeling was performed to determine the camera’s EOPs based on the collinearity equations (Equation (8)), which is a critical step in defining the camera’s position and attitude in object space. Note that orientation modeling was only performed for the first set of multi-view images captured before the experiment.
x x 0 + Δ x = f m 11 ( X X c ) + m 12 ( Y Y c ) + m 13 ( Z Z c ) m 31 ( X X c ) + m 32 ( Y Y c ) + m 33 ( Z Z c ) y y 0 + Δ y = f m 21 ( X X c ) + m 22 ( Y Y c ) + m 23 ( Z Z c ) m 31 ( X X c ) + m 32 ( Y Y c ) + m 33 ( Z Z c )
where (Xc,Yc,Zc) are the spatial coordinates of the camera perspective center, which means the projection center in the object-space coordinate system; (X,Y,Z) are the object coordinates; (m11m33) are the camera rotation matrix derived from the rotation angles (ω,φ,κ); f is the focal length; (x,y) are the image coordinates; (x0,y0) are the principal point; and (∆x,∆y) are the total lens distortion.

2.1.3. Marker-Based Feature Points Extraction: Artificially Placed Feature Points

An artificial marker refers to a black circular target placed on a white background. It is manually distributed uniformly across the wall surface. Their high contrast facilitates the clear identification of the circle centroids, which are used as feature points to observe wall deformation under different loading conditions. A key advantage of these circular markers is their ability to provide stable centroid extraction from multiple camera viewpoints, thus enhancing the consistency of feature point tracking across time-series images.
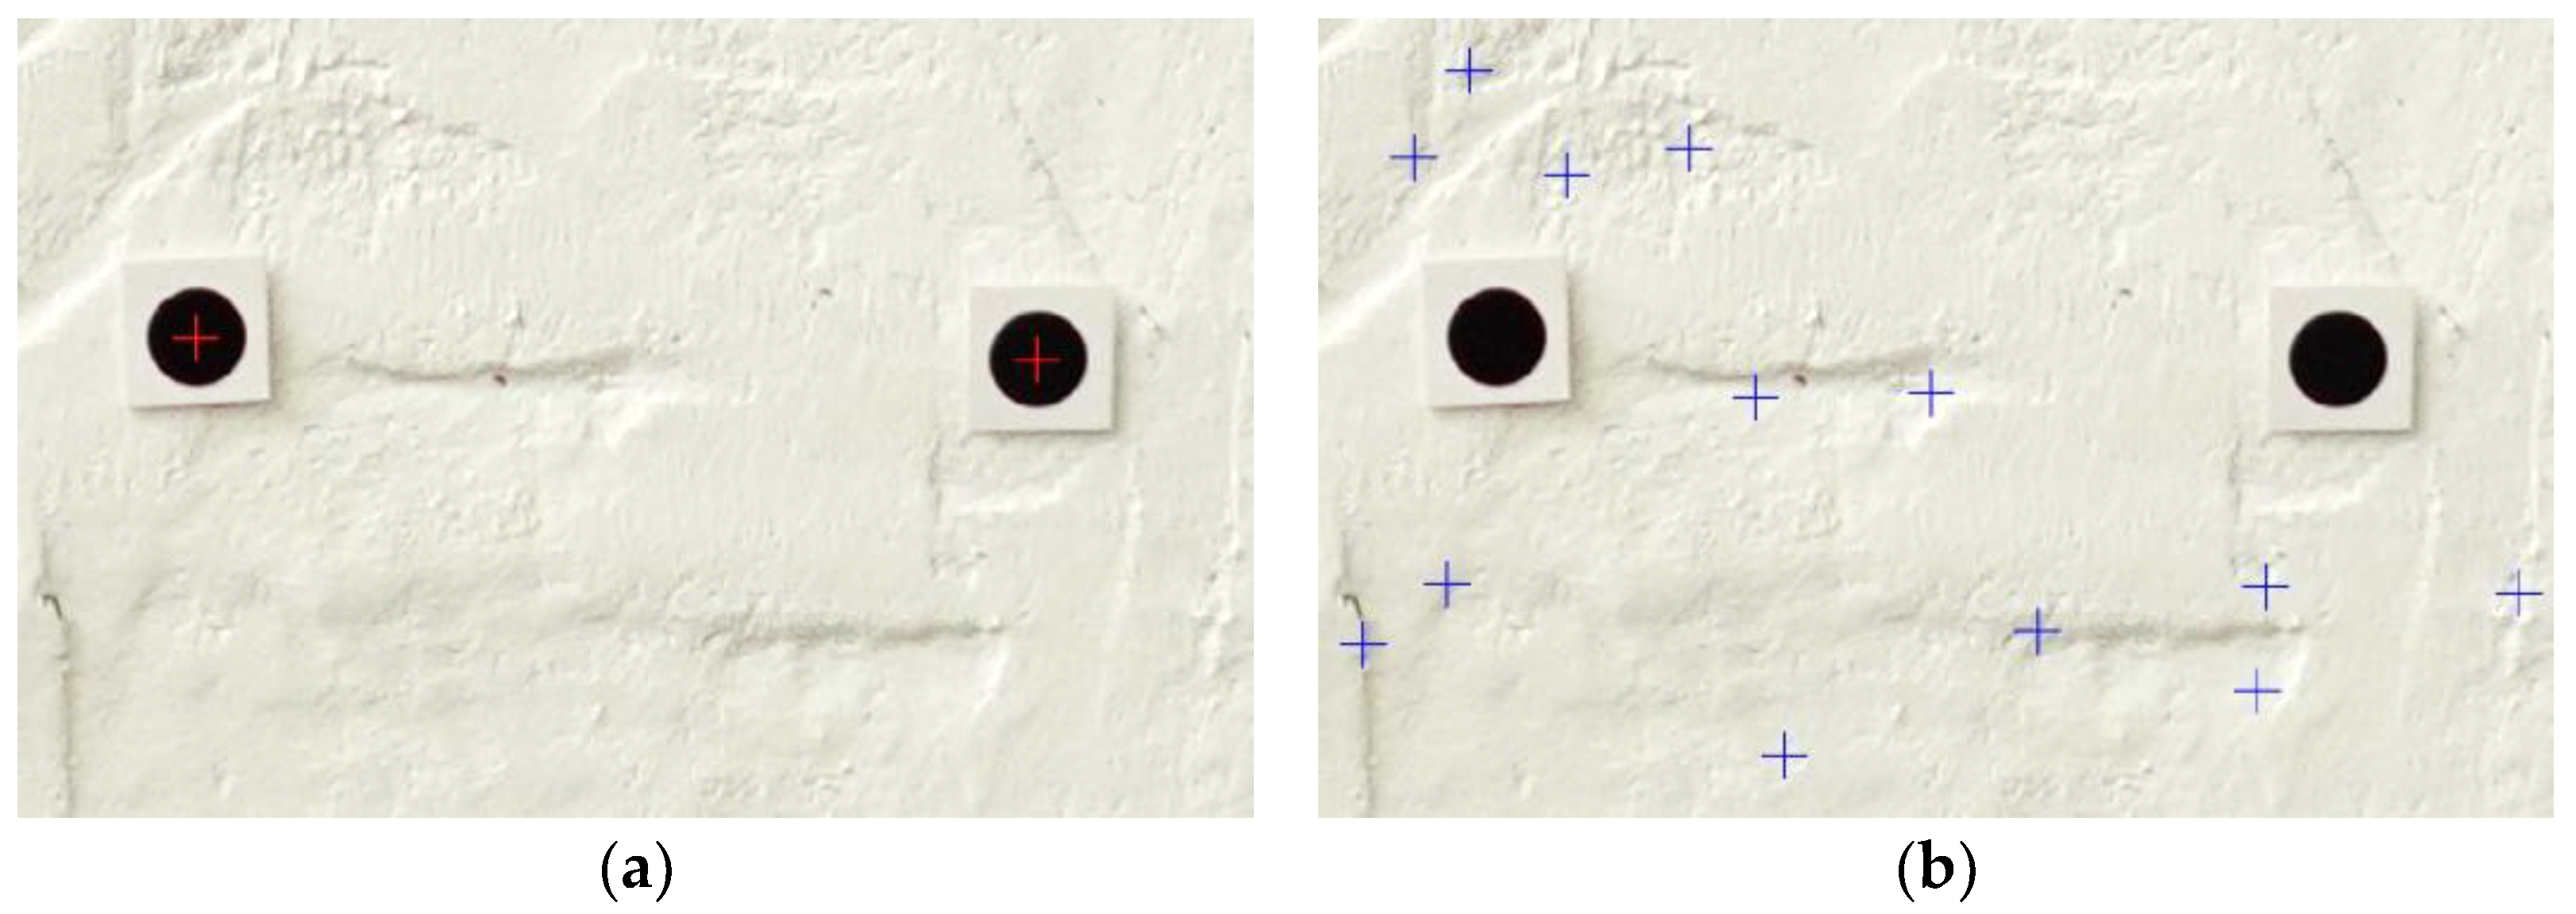
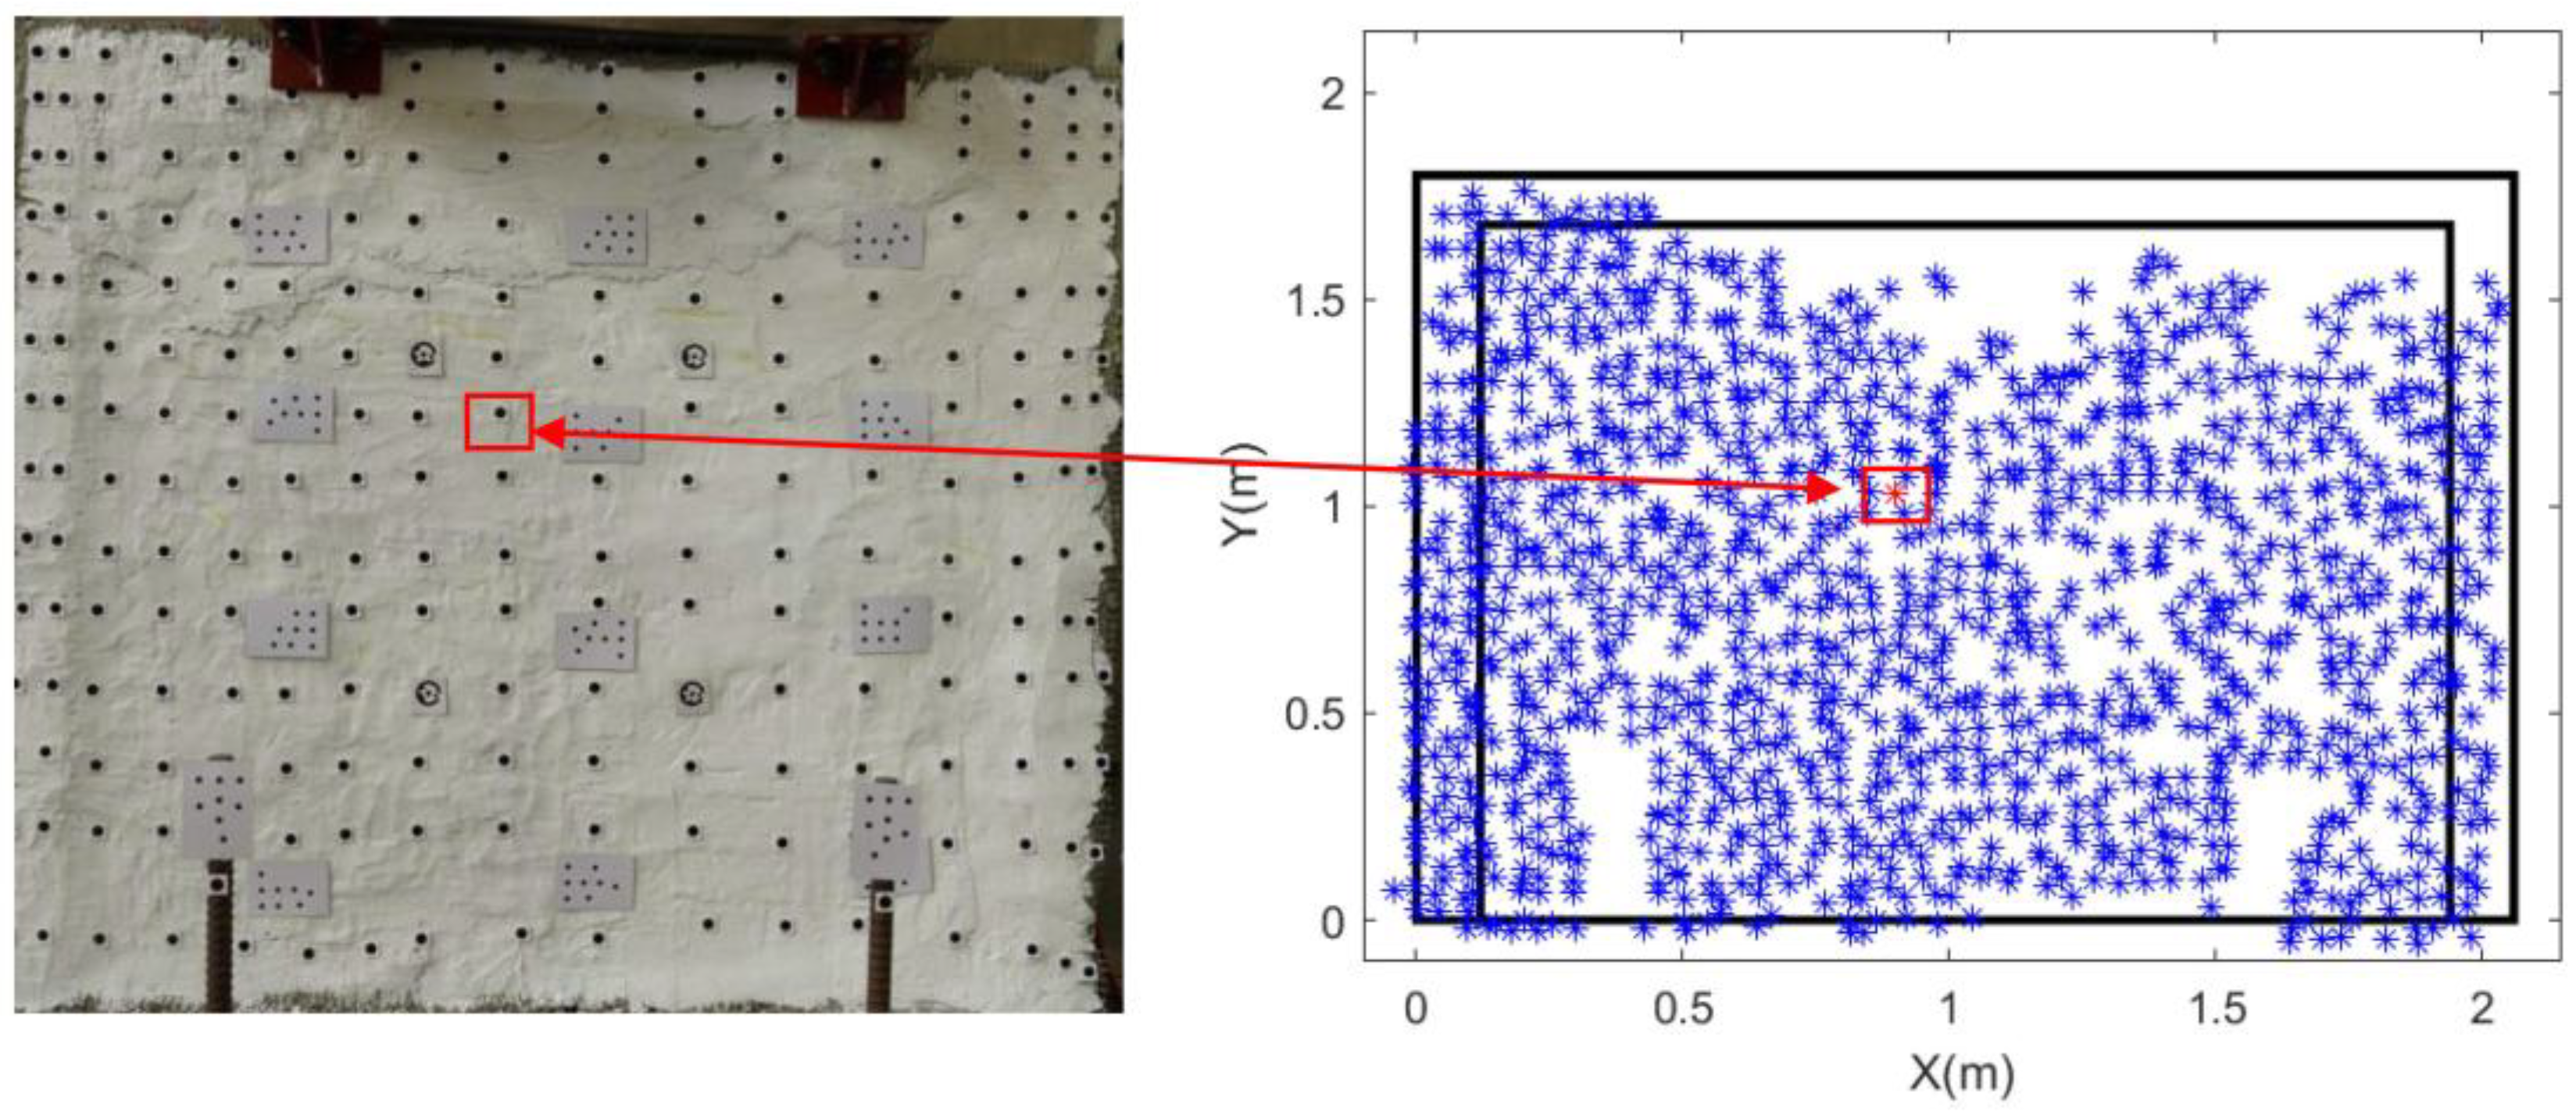
To automatically extract the centroid positions of these markers, this study first applied a binary classification method in the workflow to segment the black circular markers from the white background. Next, a region-growing algorithm was used to merge pixel regions with similar characteristics, enabling the accurate extraction of each marker’s shape region and the subsequent computation of its geometric centroid as a wall surface feature point (Figure 2a). Recognizing that binary classification might produce misclassifications in practice (e.g., shadows or stains incorrectly identified as markers), this study manually verified the initial reference image (captured without external loading). In this step, false detections were manually removed to retain only the correct marker centroids, which then served as the basis for subsequent time-series image matching and analysis. The artificial markers will be referred to as “target points” from here on in this study.

2.1.4. Algorithm-Derived Feature Points: Natural Image Feature Points

The use of manually placed target points for feature matching offers the advantage of well-defined, uniformly distributed locations across the wall surface, facilitating subsequent deformation analysis. However, manual placement calls for considerable manual labor, making it a time-consuming process. Furthermore, to achieve high spatial resolution of wall deformation details, a large number of markers must be applied, which increases implementation complexity and potentially obscures the wall’s surface texture, thereby hindering the identification of cracks or damage in the images. Conversely, if too few markers are applied, the resulting feature point density becomes insufficient to describe localized deformation behavior on the wall accurately.
To address these limitations, this study introduces natural image feature points as an alternative approach. The SURF [20] algorithm was employed to automatically extract stable and distinctive feature descriptors directly from the images (Figure 2b), serving as the source of wall surface feature points. This markerless method eliminates the need for physical marker placement, significantly reducing manual setup time while preserving the full texture of the wall surface.
SURF offers higher computational efficiency and robust matching accuracy compared to conventional marker-based methods. It also provides excellent invariance to illumination changes, rotation, and scale, making it particularly suitable for tracking wall features over time. In the time-series imagery of a wall, SURF not only enables the dense extraction of image feature points but also ensures sufficient repeatability and stability, thereby enhancing the overall efficiency and accuracy of deformation field measurements. The natural markerless image feature points will be referred to as “targetless points” from here on in this study.
Figure 2 compares the different types of feature points. The target points (red cross in Figure 2a) were manually placed on the wall surface, providing well-defined, high-contrast centroids for feature extraction. This target approach enables precise reference points but requires significant manual effort for installation. It may also obscure surface textures that are essential for damage assessment. In this study, artificial markers were generally arranged using a scale with a spacing of 15 cm. However, due to the need to also install control targets and the unevenness of the brick wall surface, some points had a spacing of 20 cm. As a result, although artificial markers provide relatively high accuracy, it is practically impossible to ensure perfectly uniform distribution on the surface, and such situations are often unavoidable in practice. This limitation was one of the motivations for developing the targetless approach adopted in this study, which alleviates the issues of time-consuming, labor-intensive, and potentially non-uniform manual marker placement. Targetless points (blue cross in Figure 2b) were automatically extracted using the SURF algorithm without any physical markers. This targetless approach preserved the wall’s original texture, enabling dense and adaptive feature point distribution and significantly reducing the setup time while maintaining robustness in matching under varying imaging conditions.

2.1.5. Time-Series 2D Feature Tracking

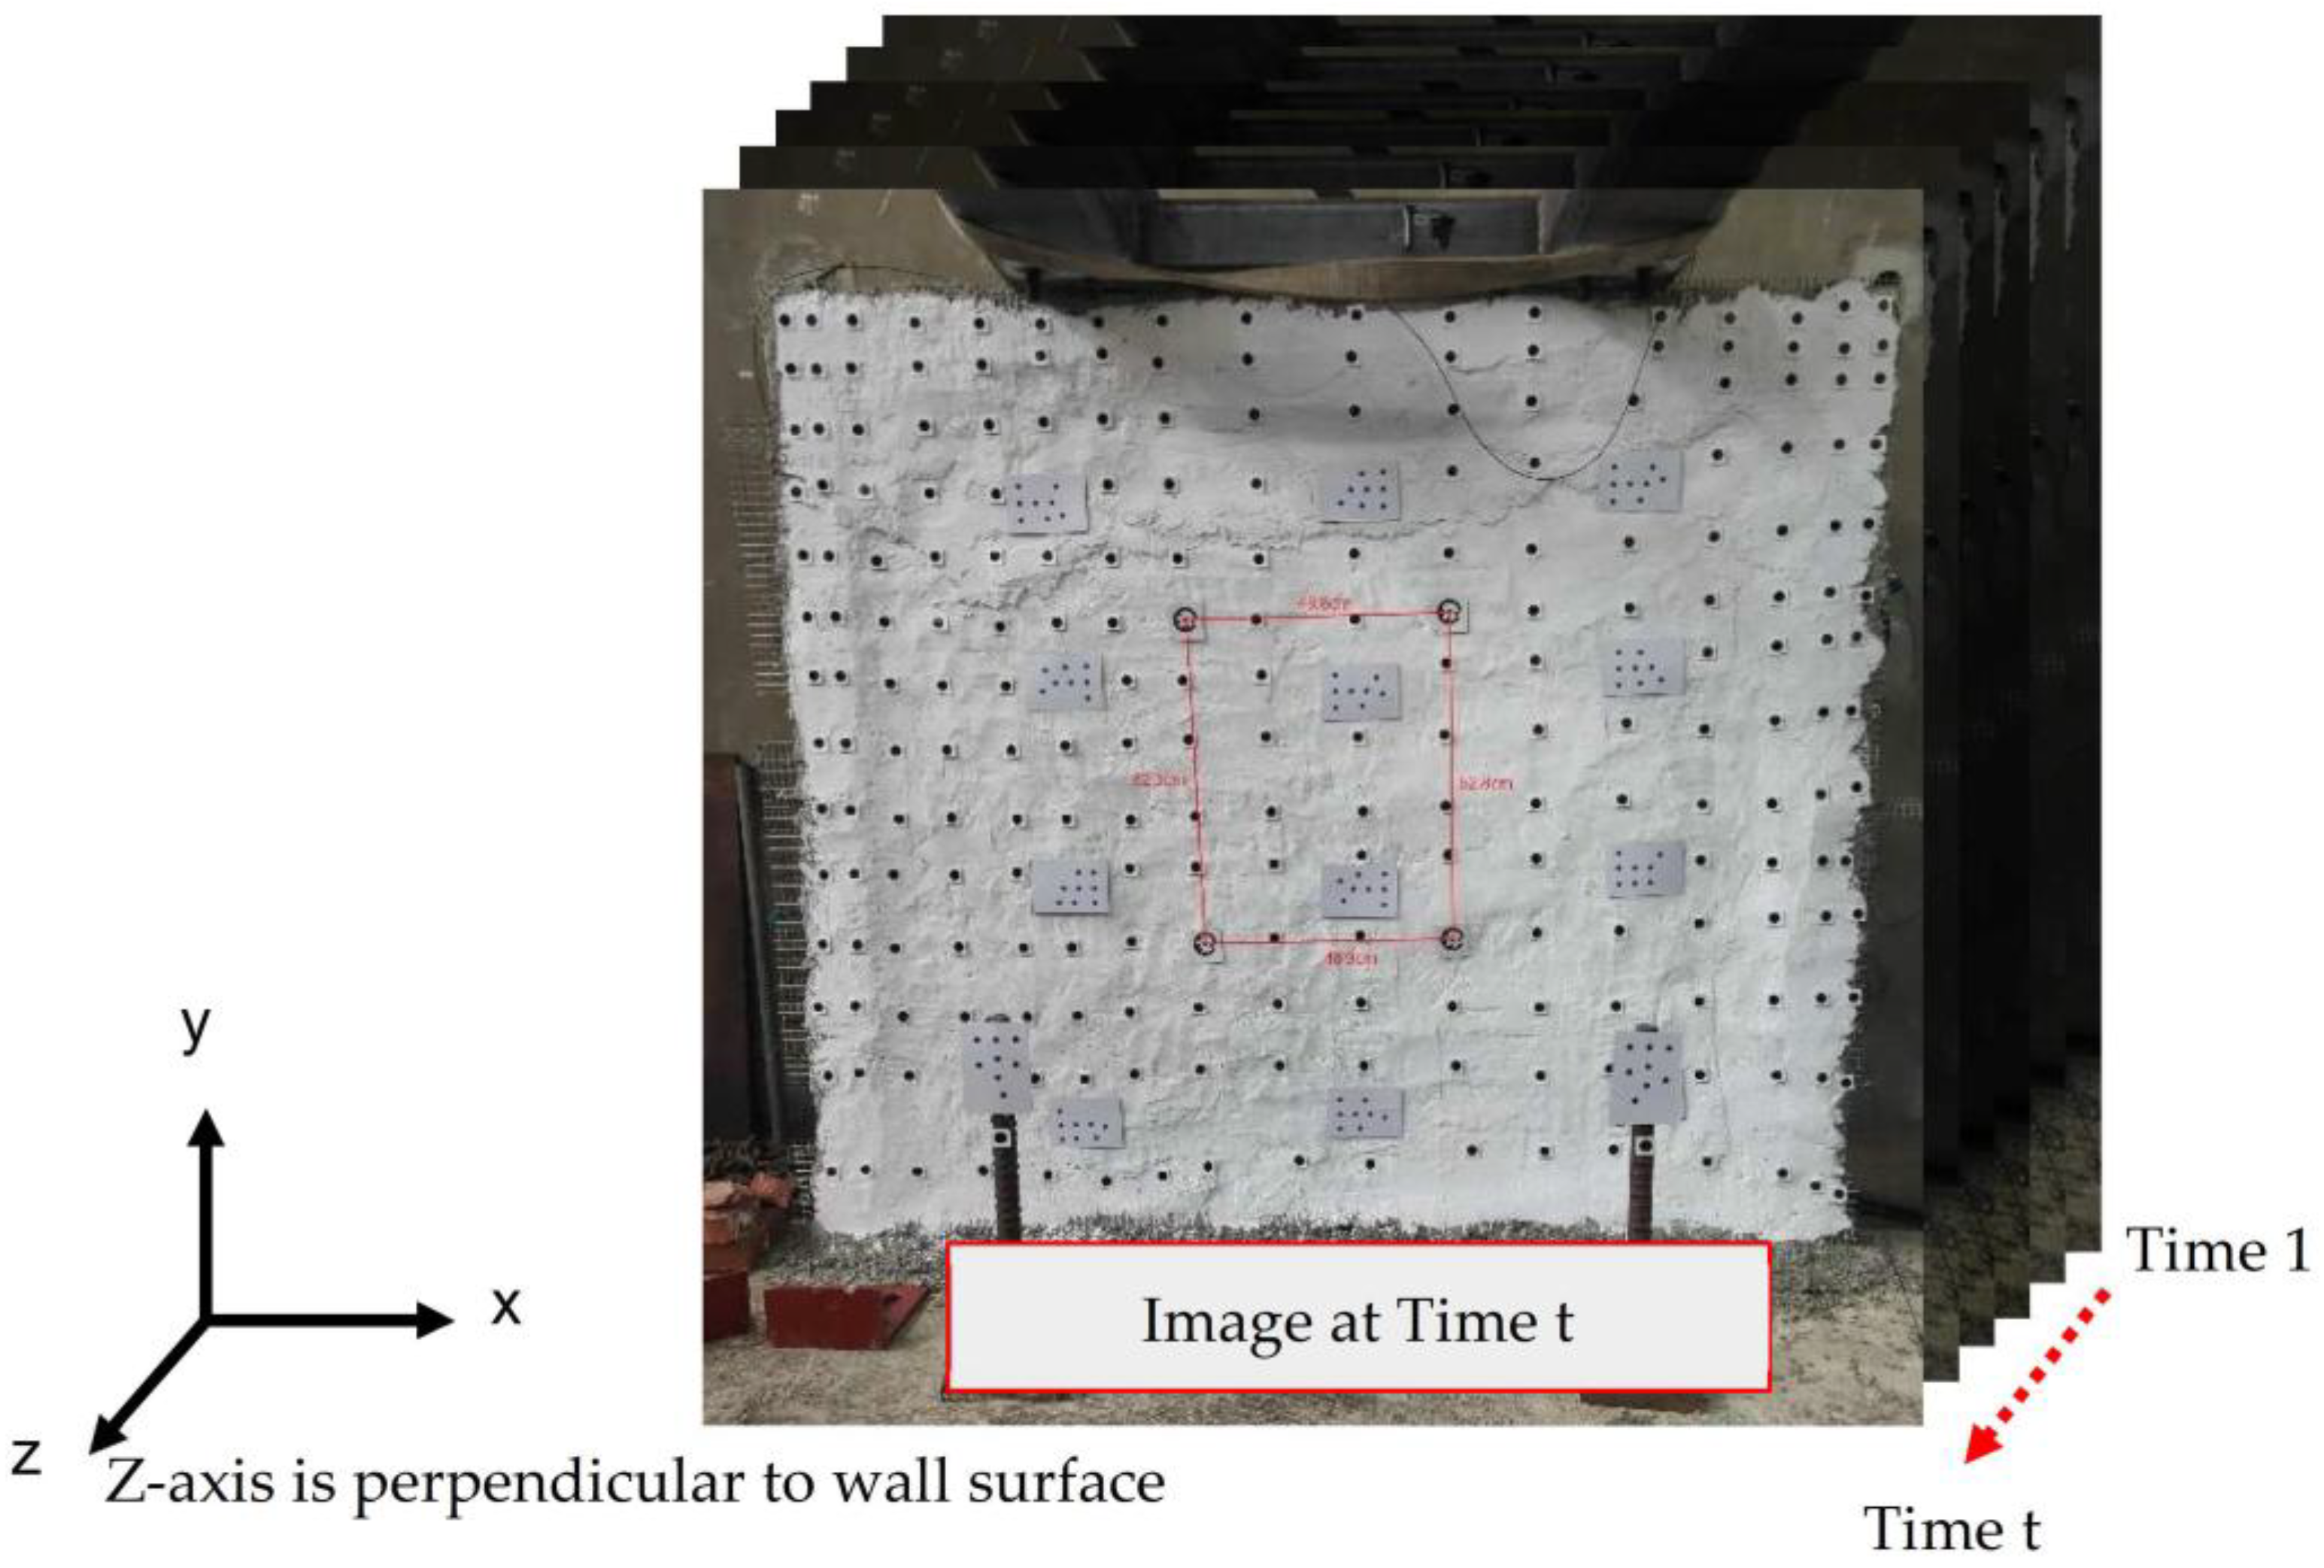
To enable subsequent time-series analysis and compare changes at the same points over time, this study established the displacement of the same feature points across images captured at different time intervals, thereby constructing time-series image coordinate sequences for these points. Image matching techniques were employed to track the positions of identical wall points in images captured at different times (Figure 3). The primary goal was to extract the image coordinates of specific feature points across varying time steps and viewpoints, thus establishing consistent point correspondences as a foundation for deformation analysis. Image matching is a crucial technique to identify corresponding points between image pairs at different times.
In this study, feature points on the wall surface were first extracted from the initial reference set of multi-view images. Each point was assigned a fixed identifier, and its image coordinates were recorded. To track these points in subsequent time-series images, a region-based matching approach was used: the normalized cross-correlation (NCC) method [25]. This approach computes the correlation coefficient between corresponding regions in the reference and target images. The region with the highest correlation coefficient was taken as the successful match location.
To further improve matching accuracy, the study employed sub-pixel refinement following the initial NCC-based localization. Additionally, phase correlation matching [26] was introduced to achieve sub-pixel alignment in the frequency domain. This method transforms the images into the Fourier domain and computes phase differences to locate the optimal match point, offering greater robustness to variations in intensity compared to spatial-domain techniques. If a specific feature point could not be reliably matched in a target image due to factors such as occlusion, image blur, or texture changes, it was excluded from the subsequent time-series matching and deformation tracking to ensure the overall reliability and accuracy of the matching results.

2.1.6. Three-Dimensional Points Generation Using Space Intersection

After tracking the 2D feature points in the time-series images, this study further performed space intersection to determine the 3D object-space coordinates of these points based on their corresponding positions in the multi-view images. Space intersection is a geometric modeling technique grounded in the collinearity equations. It leverages the intersection of conjugate rays formed by corresponding 2D points in overlapping images to compute the 3D location of a point in object space. Four collinearity equations can be established for each pair of conjugate image points. The corresponding 3D object-space coordinates can be estimated by applying least-squares adjustment to solve the multi-ray intersection problem. Since each pair of conjugate points has only one degree of freedom, a minimum of two different viewpoints is required to resolve a single set of 3D coordinates [24].
In validating centroid extraction from multi-view images, if the centroids correspond exactly to conjugate points (tie points), their intersection will converge to a single location in object space. However, if the centroids are imprecise, the intersecting rays will form a region rather than a single point. Using the results of time-series image matching, this study extracted conjugate points for multiple feature points across different time intervals. Space intersection was then performed at each time step to calculate the 3D coordinates of each feature point at that moment, yielding time-series 3D coordinate data for the wall surface. To ensure the geometric stability and reliability of the derived 3D coordinates, the study computed the error components (σX, σY, σZ) of each 3D coordinate solution after each intersection as a basis for quality control. These error components were used to assess the accuracy of matching and intersection.

2.2. Spatio-Temporal Filtering of 3D Coordinates for the Algorithm-Derived Feature Points

Spatio-temporal filtering was applied to the time-series 3D coordinates generated from the algorithm-derived feature points (i.e., natural image features) to improve data quality and enhance the reliability of subsequent strain analyses. These feature points were automatically extracted using the SURF algorithm. Under experimental conditions involving the wall, variations in lighting and surface texture—such as shadows or local texture changes—can degrade the quality of feature point extraction in certain regions, subsequently reducing the quality of 3D coordinates obtained via space intersection. While the earlier space intersection step applied geometric constraints and outlier rejection to remove gross errors, residual noise and subtle outliers might have persisted. To address this, a three-stage spatio-temporal filtering procedure was designed to further enhance the quality of the point data.
For spatial-domain filtering, the MAD method was used to identify outliers by detecting points that deviated significantly from local trends within a neighborhood region. For temporal-domain filtering, a 1D Gaussian convolution filter was applied to smooth the time-series coordinate data, which preserved genuine deformation trends while reducing random noise. Finally, a grid-based sampling method, with grid dimensions of 10 cm × 10 cm, was used to retain only the representative points within each grid cell, eliminating outliers and redundant points in the regions. This approach improved the overall uniformity and representativeness of point distribution.
The stability of the 3D coordinate data derived from natural feature points was significantly enhanced through this three-stage process of spatio-temporal filtering. The filtered data were then used for strain calculations. Additionally, the study conducted a comparative analysis of strain results before and after filtering to assess the impact of improved point quality on strain estimation accuracy, thereby validating the effectiveness of the proposed spatio-temporal filtering strategy in enhancing the reliability of analysis.

2.2.1. Median Absolute Deviation (MAD) Filtering

MAD is used for spatial filtering and applied independently at each time epoch. Similarly to mean absolute deviation, MAD is a widely used statistical measure for assessing variability. Compared to traditional standard deviation, which is more sensitive to squared terms and thus more heavily influenced by outliers, MAD provides a more robust measure to identify and filter anomalous values.
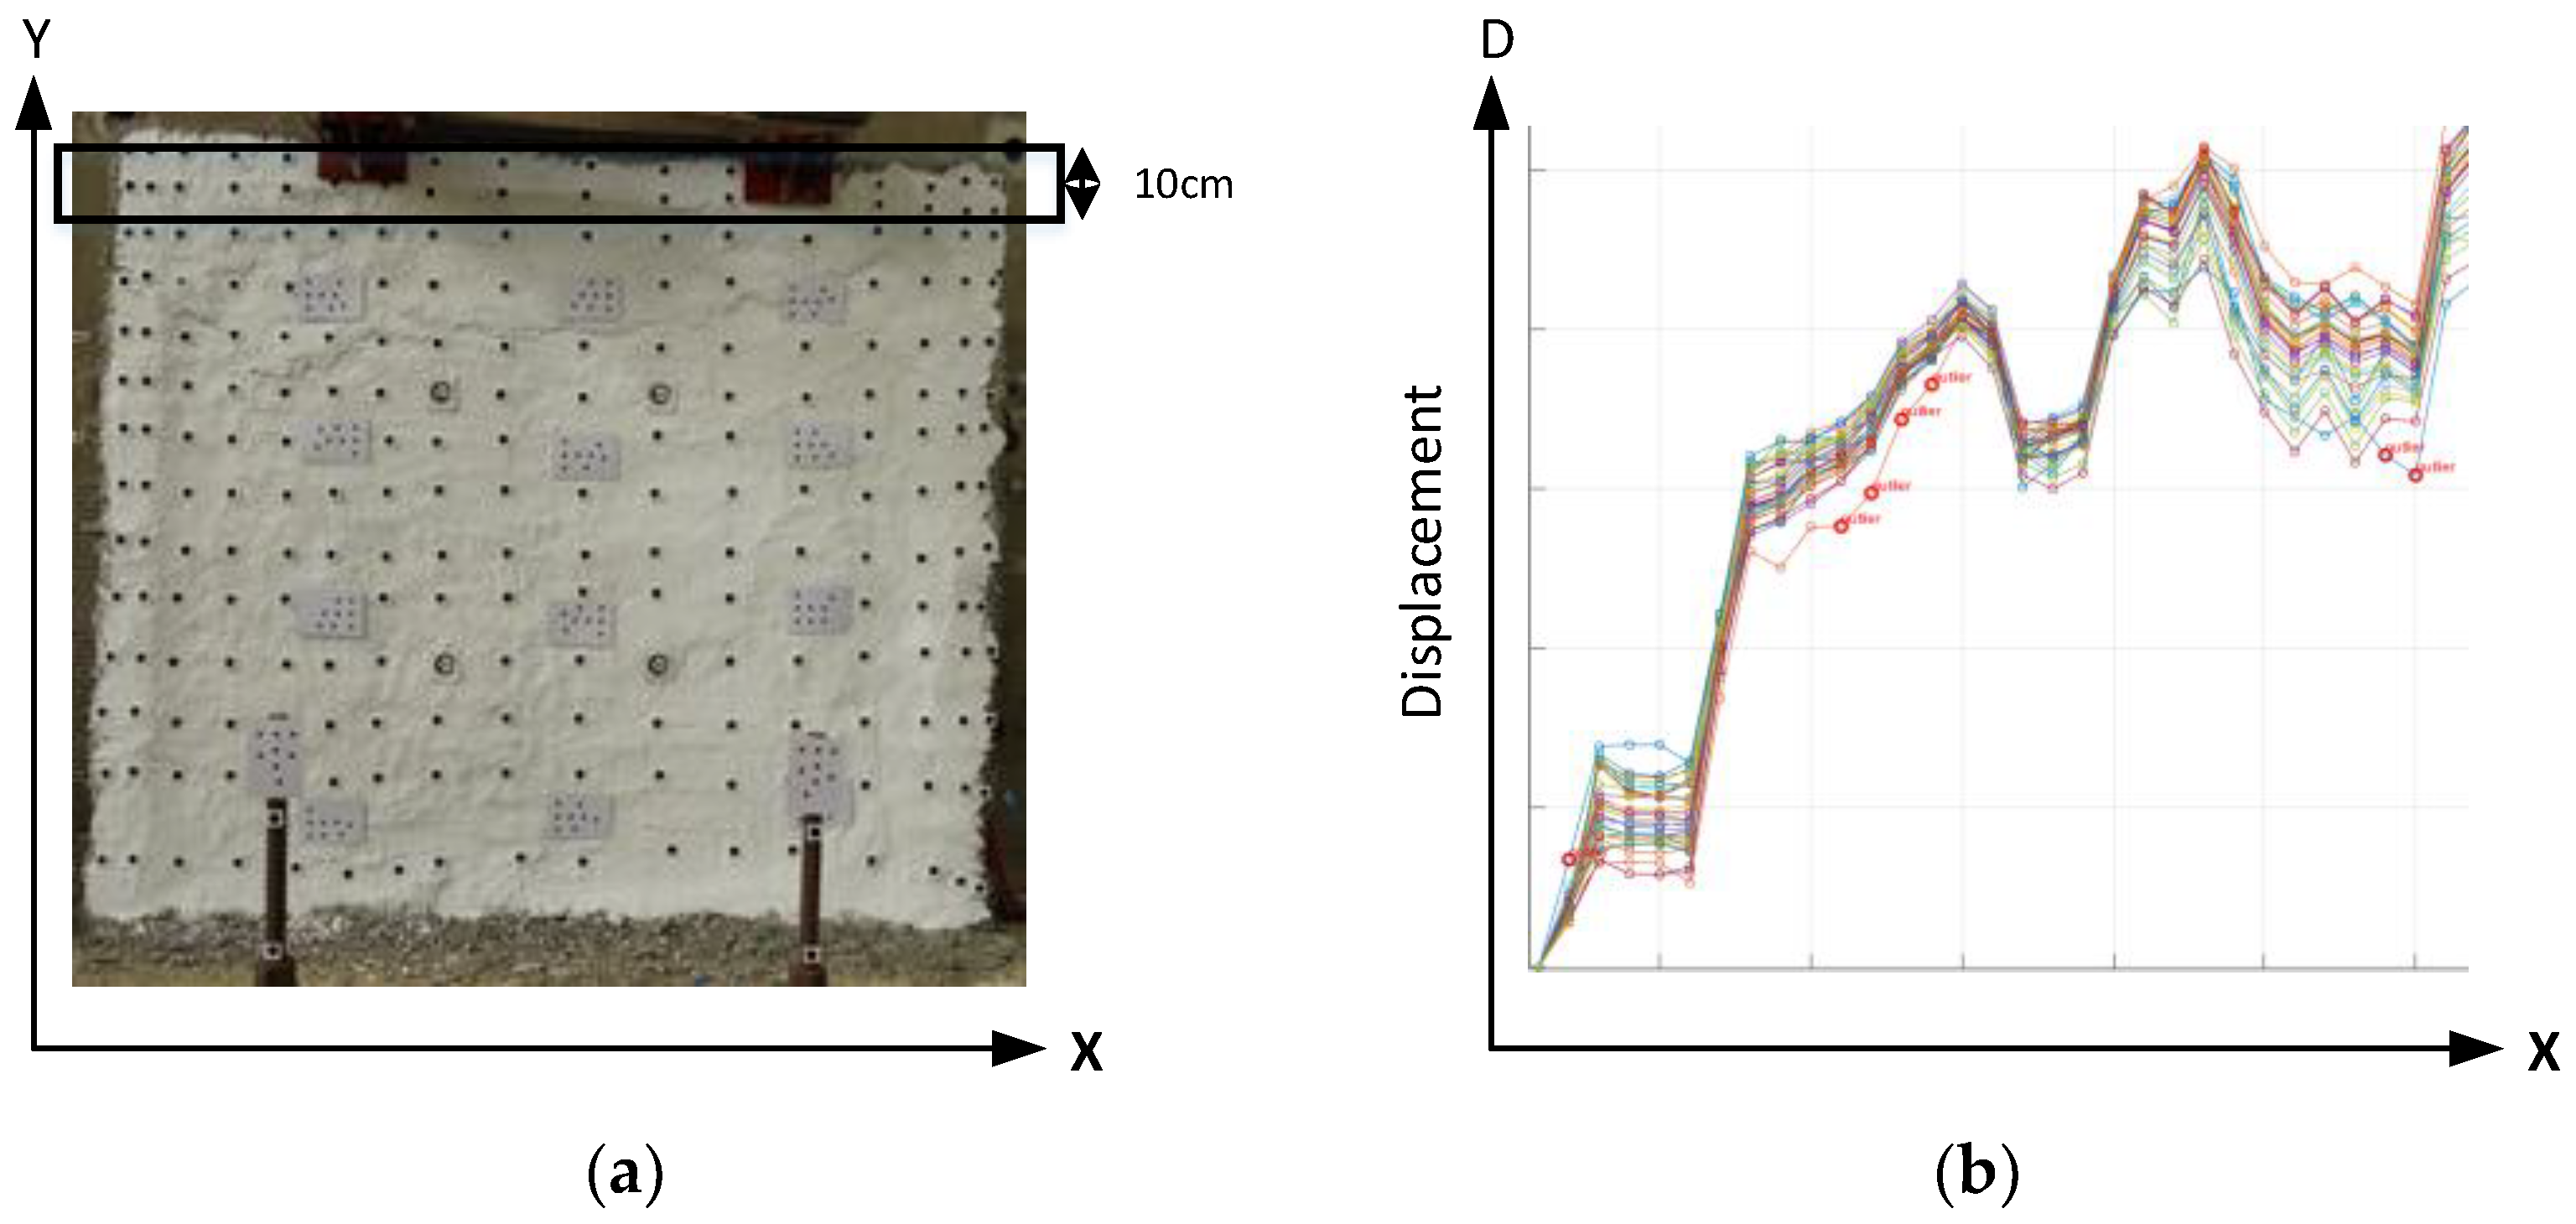
This study focused on removing outliers in data containing noise and abnormal values. MAD is calculated by first determining the median of the dataset within a predefined region. Then, the absolute deviation of each value from this median is computed. Finally, the median of these absolute deviations is taken. MAD offers greater stability than mean absolute deviation when filtering noisy data with outliers. Therefore, MAD was selected for outlier detection in this analysis. The calculation procedure involved determining the median of the data, computing the absolute differences between each data point and the median, and then using the median of these differences as the MAD value (Equations (9) and (10)). By setting a threshold based on MAD, points with 3D displacements exceeding this range were identified as outliers and removed. This step helped eliminate outliers in SURF-derived feature points in the spatial domain. To define the working region, considering that crack development in walls under loading typically propagates laterally (X direction) with a gradual increase in displacement, the data were segmented horizontally along the Y direction (vertical) into 10 cm intervals. Outlier detection and removal were performed within each region to filter local noise (Figure 4) effectively. Furthermore, for more complex geometries or multi-axial stress states this assumption may not hold, and in such cases the filtering region or computation range may need to be adjusted.
M A D = m e d i a n X i m e d i a n X
i f   X i m e d i a n X > K     M A D ,   t h e n ,   X i   i s   o u t l i e r
where MAD is the median of all absolute deviations; X i is the i-th individual value in the dataset X ; and m e d i a n X is the median of the dataset. K typically varies from 2 to 5. This study used the k value of 5to remove outliers.

2.2.2. One-Dimensional Convolution Smoothing

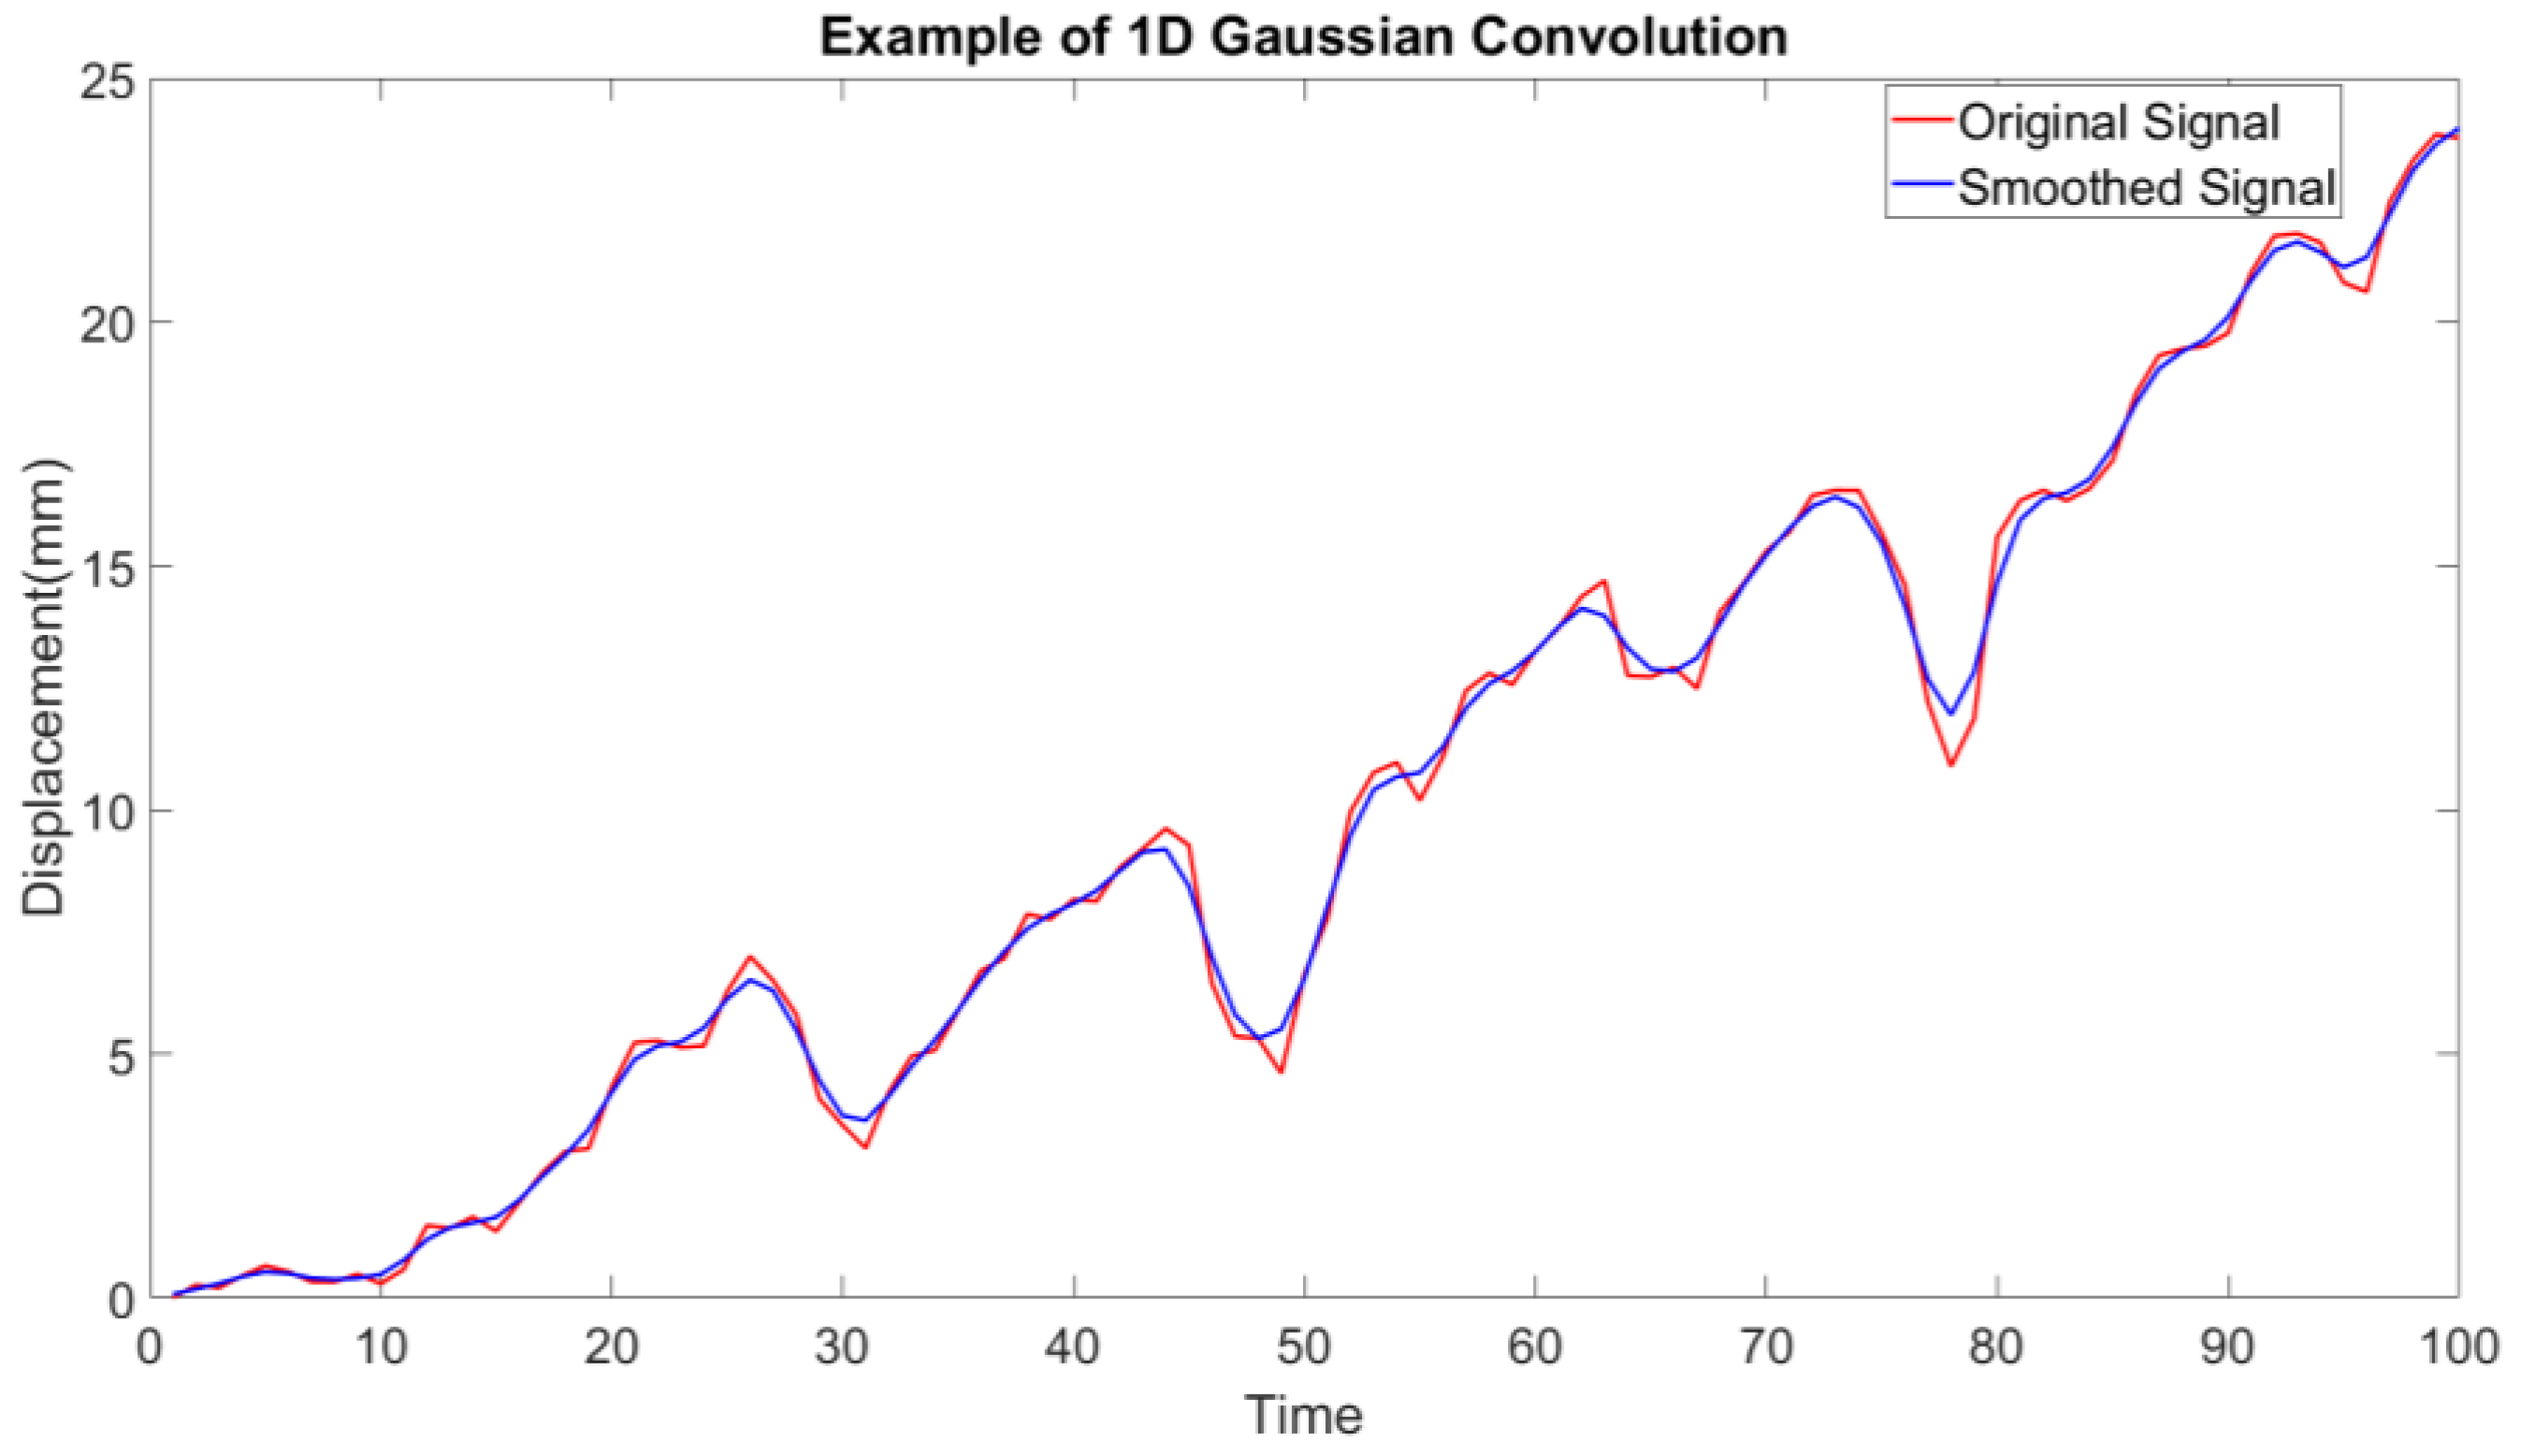
This study applied 1D Gaussian convolution in the time domain to filter displacements of the same point across different time steps. One-Dimensional convolution is commonly used for smoothing time-series data; it effectively suppresses sudden displacement spikes or anomalous variations caused by image matching errors. To address such issues, this study applied 1D Gaussian smoothing convolution to the 3D coordinates of each feature point along the time axis, thus reducing the impact of matching errors on deformation analysis. The method uses a Gaussian distribution function as the convolution kernel. In this method, a kernel width that covers approximately three standard deviations (typically corresponding to about four time steps on either side) is selected. This design emphasizes the influence of neighboring time steps, helping eliminate short-term unreasonable displacement fluctuations while preserving the overall deformation trend.
By convolving the original time series with a 1D Gaussian kernel, local outliers can be smoothed while maintaining the primary trend of the data, thereby effectively improving the stability and reliability of subsequent 3D deformation field analyses. The Gaussian kernel function is defined in Equation (11). For any 3D point P = (xt,yt,zt) at time t, the smoothed result is obtained via convolution (Equation (12))
G t = 1 2 π σ · e t 2 2 σ 2
where G(t) represents the Gaussian weight at time lag t, and σ is the standard deviation that controls the degree of smoothing. A larger σ yields stronger smoothing but may flatten subtle variations; therefore, parameters must be chosen based on the data characteristics.
x t = i = k k x t + i · G i ,       y t = i = k k y t + i · G i ,       z t = i = k k z t + i · G i
where 2k + 1 is the Gaussian kernel window size that defines the temporal range considered. Boundary data can be handled using mirror padding or fixed boundary values to complete the convolution.
In this study, the kernel width k was 7 (=3 + 1 + 3), and the standard deviation σ was 3. These values balanced the smoothing effect while preserving the original deformation trend. After applying this method, the time-series 3D coordinate data became more stable along the time axis (Figure 5), effectively filtering high-frequency noise and enhancing the accuracy of subsequent strain analysis and deformation field reconstruction.

2.2.3. Selection of Representative Wall Surface Points Within Predefined Grids

A representative point is selected within a defined spatial range to reduce the impact of positional uncertainty on short-distance strain calculations. For example, an uncertainty of 1 mm results in an error of 10% when computing strain over a 10 mm gauge length but only a 1% error over 100 mm. Thus, selecting points farther apart proves advantageous for reliable strain estimation.
When calculating strain, the result represents the deformation ratio between neighboring points. Although automatically extracted natural image feature points can provide high-density measurements without manual marker placement, these points often have irregular spatial distributions with variable spacing. Specifically, excessively dense clusters in local regions can prove problematic for strain computation. When neighboring points are too close, even small displacements can produce disproportionately large strain values, leading to artificially amplified local strain anomalies. This issue is especially critical in regions of a structure where no cracks have propagated. In such zones, even minor deformations can yield falsely high strain estimates if the point spacing is too short, potentially resulting in misinterpreting the deformations as cracks.
To address this problem, this study applied a grid-based representative point selection strategy on the basis of selection, not interpolation. The original set of automatically extracted feature points was divided into fixed 10 cm × 10 cm grid cells. The feature point closest to the grid center was selected within each cell as the representative point for subsequent strain calculations. This approach reduced the influence of excessively dense point clusters, ensuring a more uniform and orderly point distribution and improving the stability and reliability of the computed strain field.

2.3. Strain Calculation and Refinement

2.3.1. Strain Calculation

The 3D coordinates at each epoch obtained through photogrammetric reconstruction were used in this step to calculate strain and analyze wall surface deformation. In materials mechanics, strain plays a critical role in understanding material deformation. By establishing the relationship between strain and stress, the actual loading conditions of a material can be inferred, which is essential for structural design.
Green–Lagrange strain (hereafter referred to as Green strain) is widely used in large-strain analysis. It is particularly suited for cases where the stress–strain relationship is nonlinear, as Green strain incorporates higher-order displacement terms, providing a finite-strain measure that remains valid under large deformations. Including these higher-order terms ensures rotation invariance, allowing the measure to account for material rotation and more accurately capture actual deformation behavior compared to conventional engineering strain [27].
Green strain is expressed using the deformation gradient tensor F i j [27], which eliminates the influence of rigid-body rotation through its formulation. The deformation gradient tensor F i j is defined as the matrix of partial derivatives of the deformed coordinates x i with respect to each reference coordinate X j :
j F i j d X j = d x i   or   F · d X = d x
where x i = X i + u i represents the current position of a material point after undergoing displacement u i . The Green strain tensor E i j is then computed as
E i j = 1 2 F T · F I = 1 2 k F k i · F k j I i j
where I i j is the identity matrix. Green strain can eliminate the effect of rigid body rotation R , retaining only the actual deformation described by the stretch tensor U because F T · F = R · U T · R · U = U T · R T · R · U = U T · U . Therefore, Equation (14) can be further expressed as follows:
E i j = 1 2 u i X j + u j X i + u k X i u k X j
Compared to the classical small-strain formulation ε i j = 1 2 u i X j + u j X i , Green strain includes an additional quadratic term u k X i u k X j . The small-strain terms (i.e., u i X j + u j X i ) represent linear approximations of deformation, which is valid for small displacements. The quadratic terms (i.e., u k X i u k X j ) account for higher-order displacement effects, enabling the strain measure to remain accurate under large deformations and rotations. In summary, the quadratic terms are what confer rotation invariance to the Green strain measure, making it well-suited for capturing realistic deformation behavior, even under large rotations.

2.3.2. Strain Refinement

To avoid extreme peak values in certain regions (caused by severe damage or cracking) that could affect comparisons with other areas and to address issues such as irregular spacing in automatically extracted feature points or data loss due to the detachment of manually placed markers during testing, a 2D convolution-based smoothing approach was applied to the computed strain fields.
This strategy helps mitigate the impact of localized data gaps, ensuring that missing or sparse data in a few regions do not disproportionately affect the overall results. By smoothing the strain field after its initial computation, the approach enforces continuity in the deformation trend, reduces the influence of local errors on overall interpretation, improves the stability of the numerical results, and enhances the interpretability of the visualization.
The computed strain results are inherently discrete data. The 2D convolution smoothing is implemented using the following equation:
C j , k = p q A p , q B j p + 1 , k q + 1
where A is the Gaussian convolution kernel, with (p,q) indexing the kernel size. B is the input strain field, with (i,j) representing the data dimensions. C is the smoothed strain field.
In this study, the strain was interpolated to a grid with dimensions 1 cm × 1 cm (i.e., 1cm/pixel). The kernel size of the 2D convolution was 81 × 81 pixels. Three sigma was used for Gaussian convolution. After this calculation, the originally rough or noisy strain data were refined and smoothed, yielding improved strain field results suitable for strain refinement. This process enhanced the overall consistency of the strain field, reduced local anomalies, and supported more reliable interpretation of structural deformation behavior.

3. Experimental Data

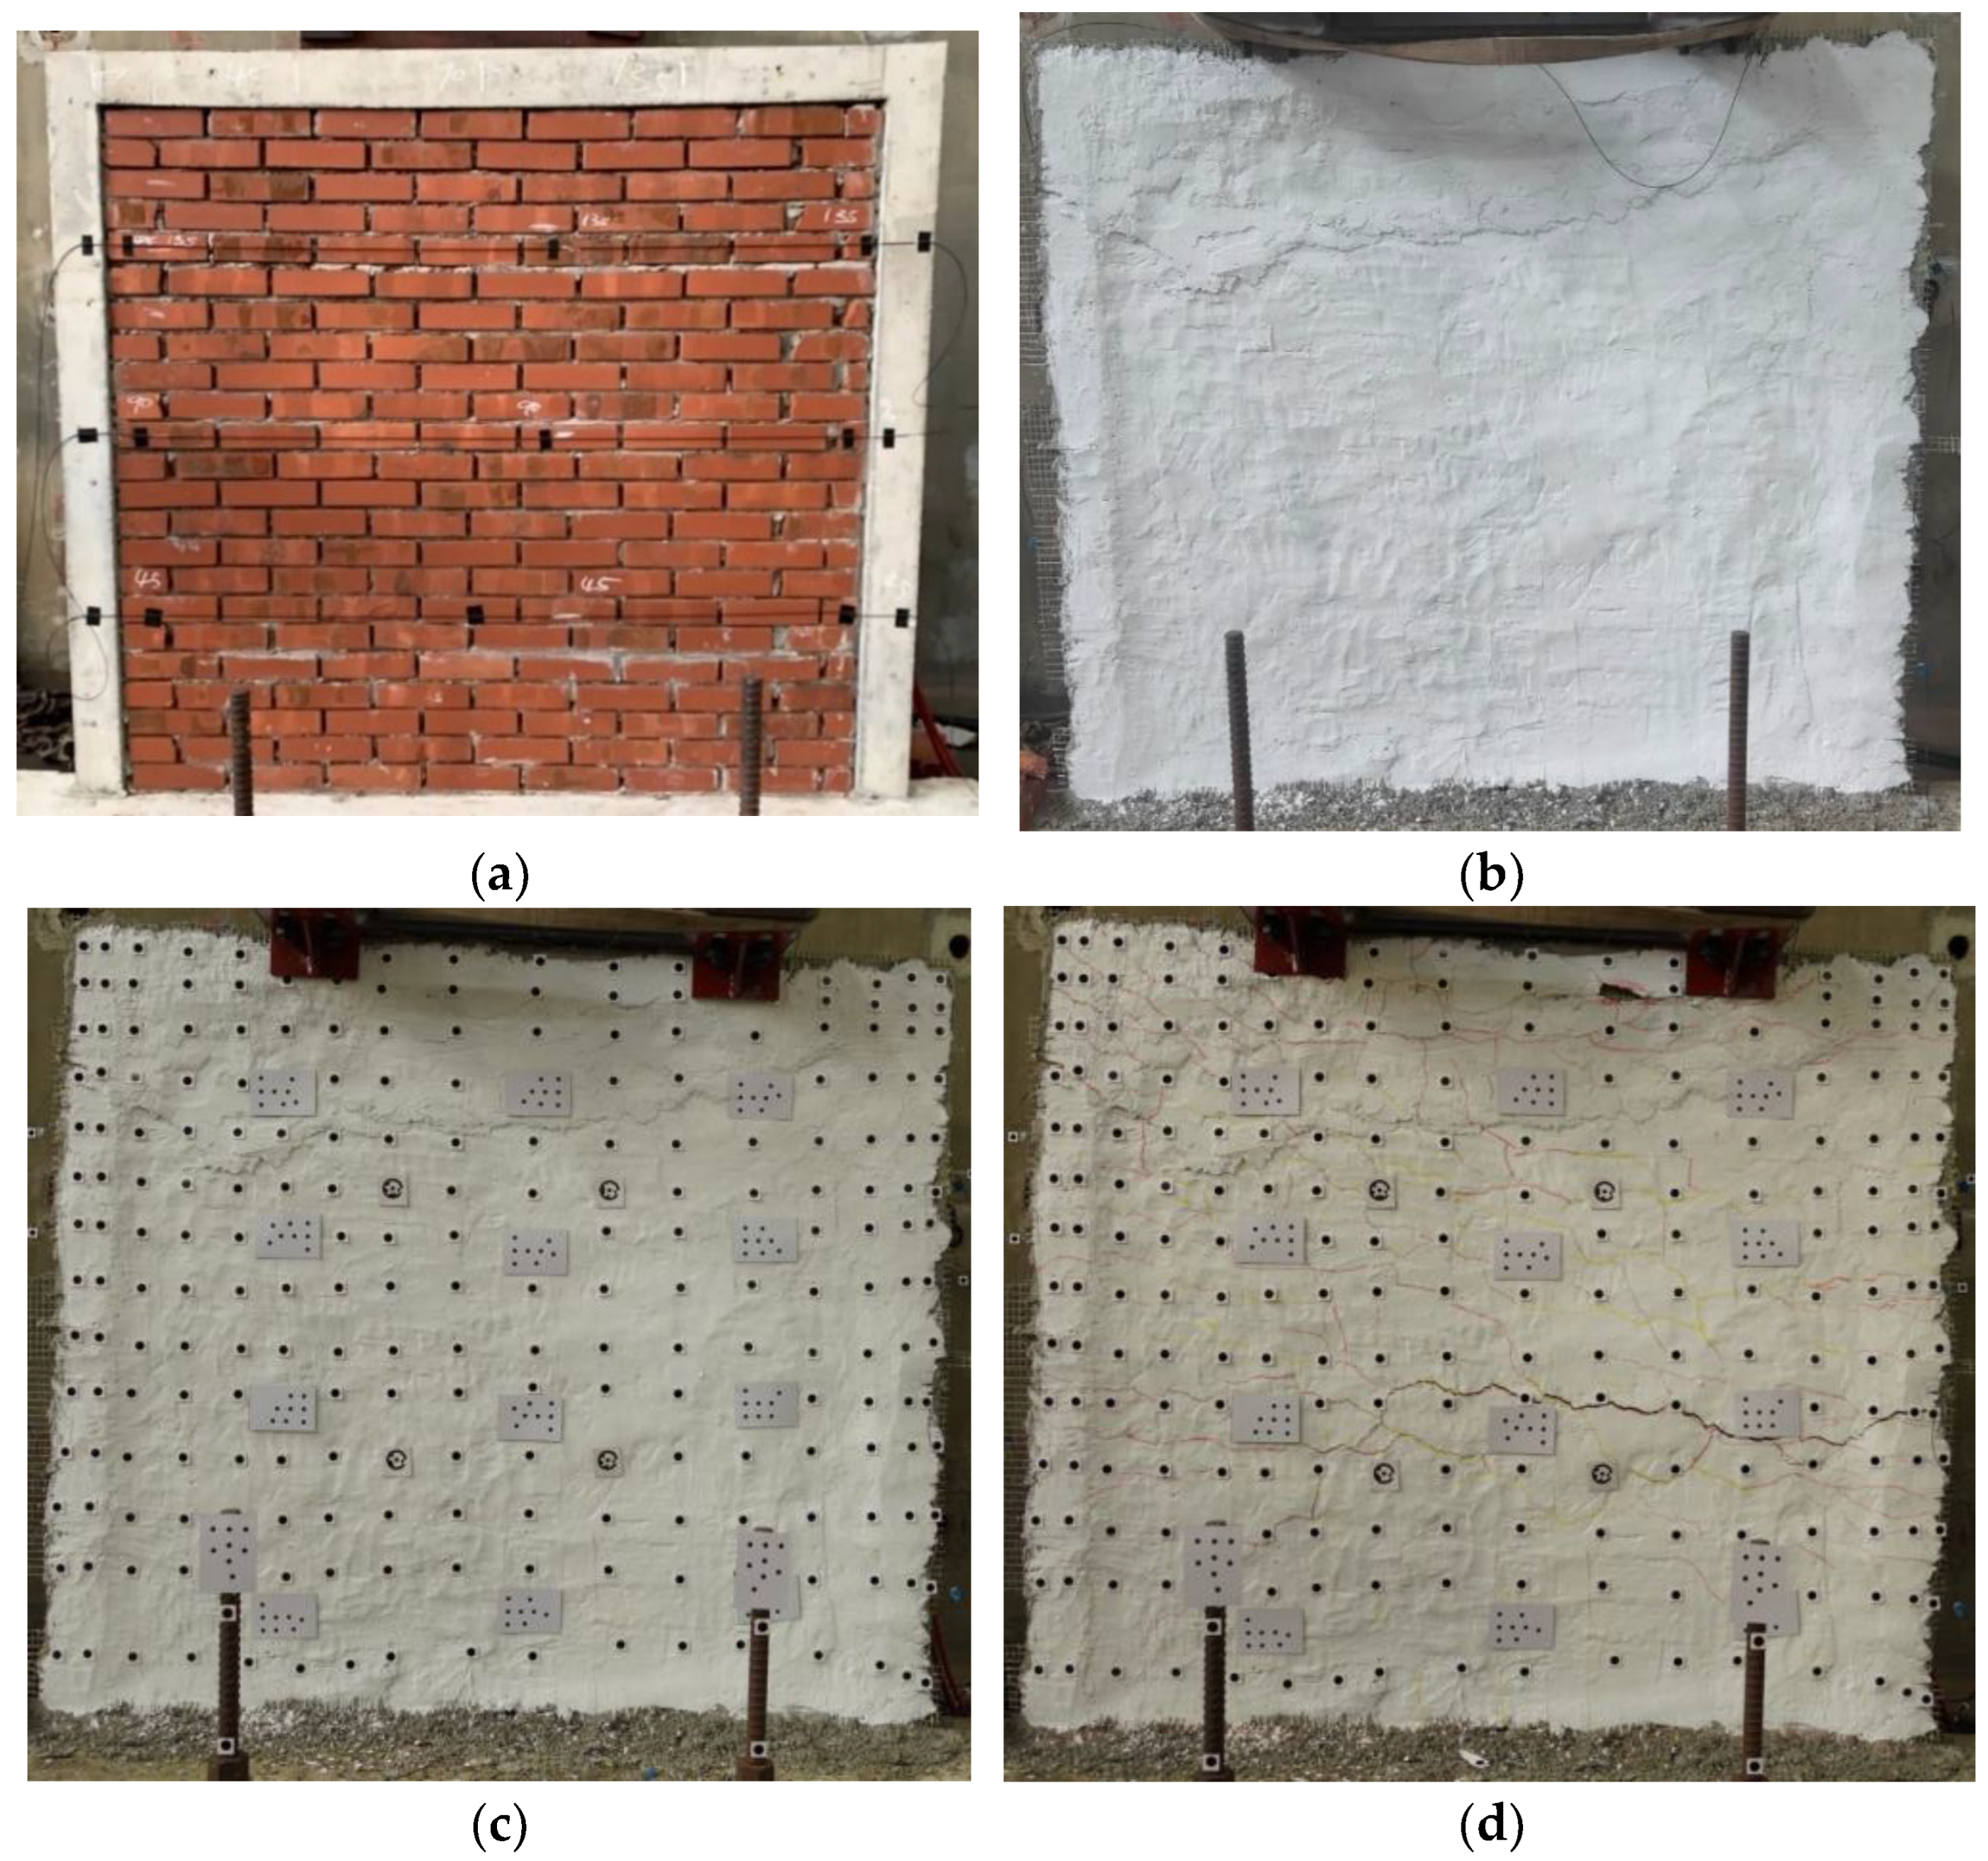
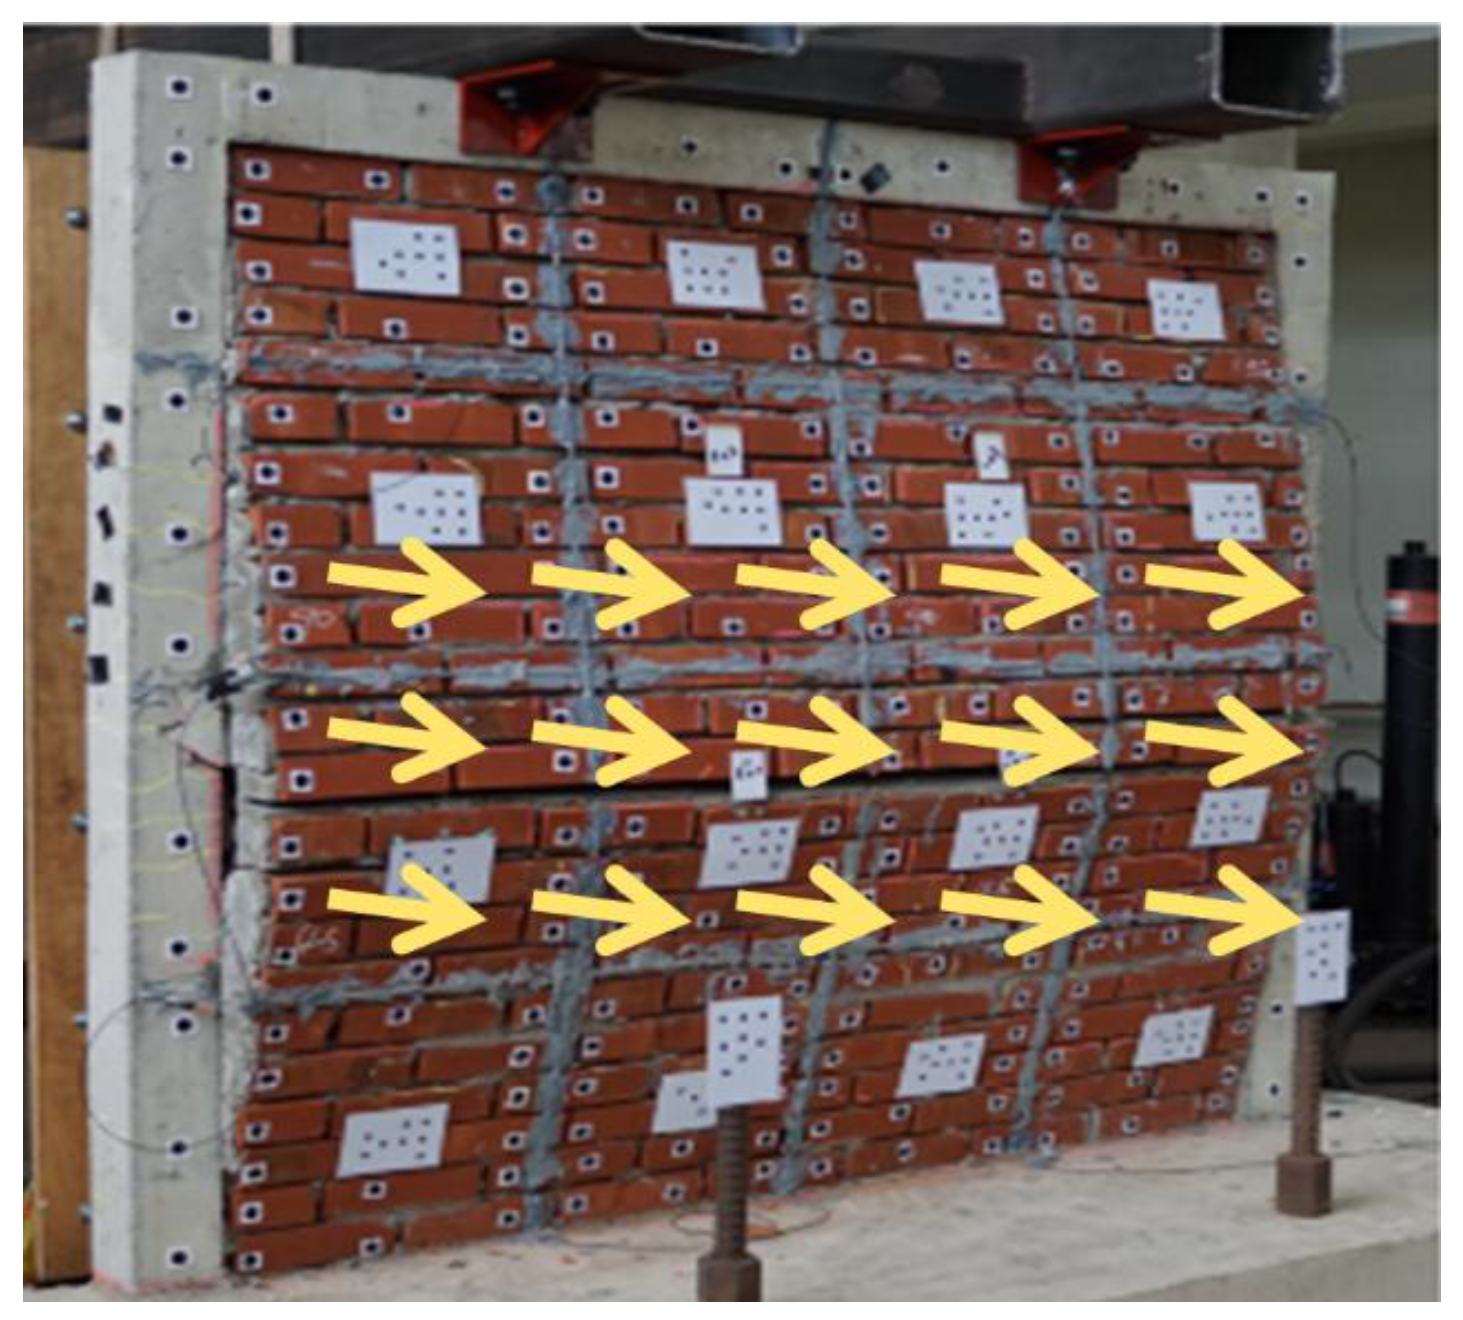
This study used a large-scale GFRP (glass fiber reinforced polymer)-retrofitted brick wall in the experiment. The height, width, and thickness of the wall were 168 cm, 182 cm, and 12 cm, respectively. Externally, it was framed by a 12 cm-thick reinforced concrete frame and base. The concrete frame at the top was secured to a square steel tube using L-shaped steel brackets, while the base was anchored to the floor with anchor bolts. A GFRP mesh sheet was applied over the entire wall surface to enhance the masonry wall’s out-of-plane strength and stability. The fiber layer was then coated with cement mortar and finished with a coat of white paint. The masonry wall is shown in Figure 6. During the experiment, an airbag-type hydraulic jack (Figure 7) was used to apply loading from the rear of the wall, inducing out-of-plane forces that tended to cause tensile failure on the front surface. The loading was applied in a stepwise manner with holding or unloading periods, and the wall was loaded until visible cracking occurred. The loading direction is shown in Figure 8.
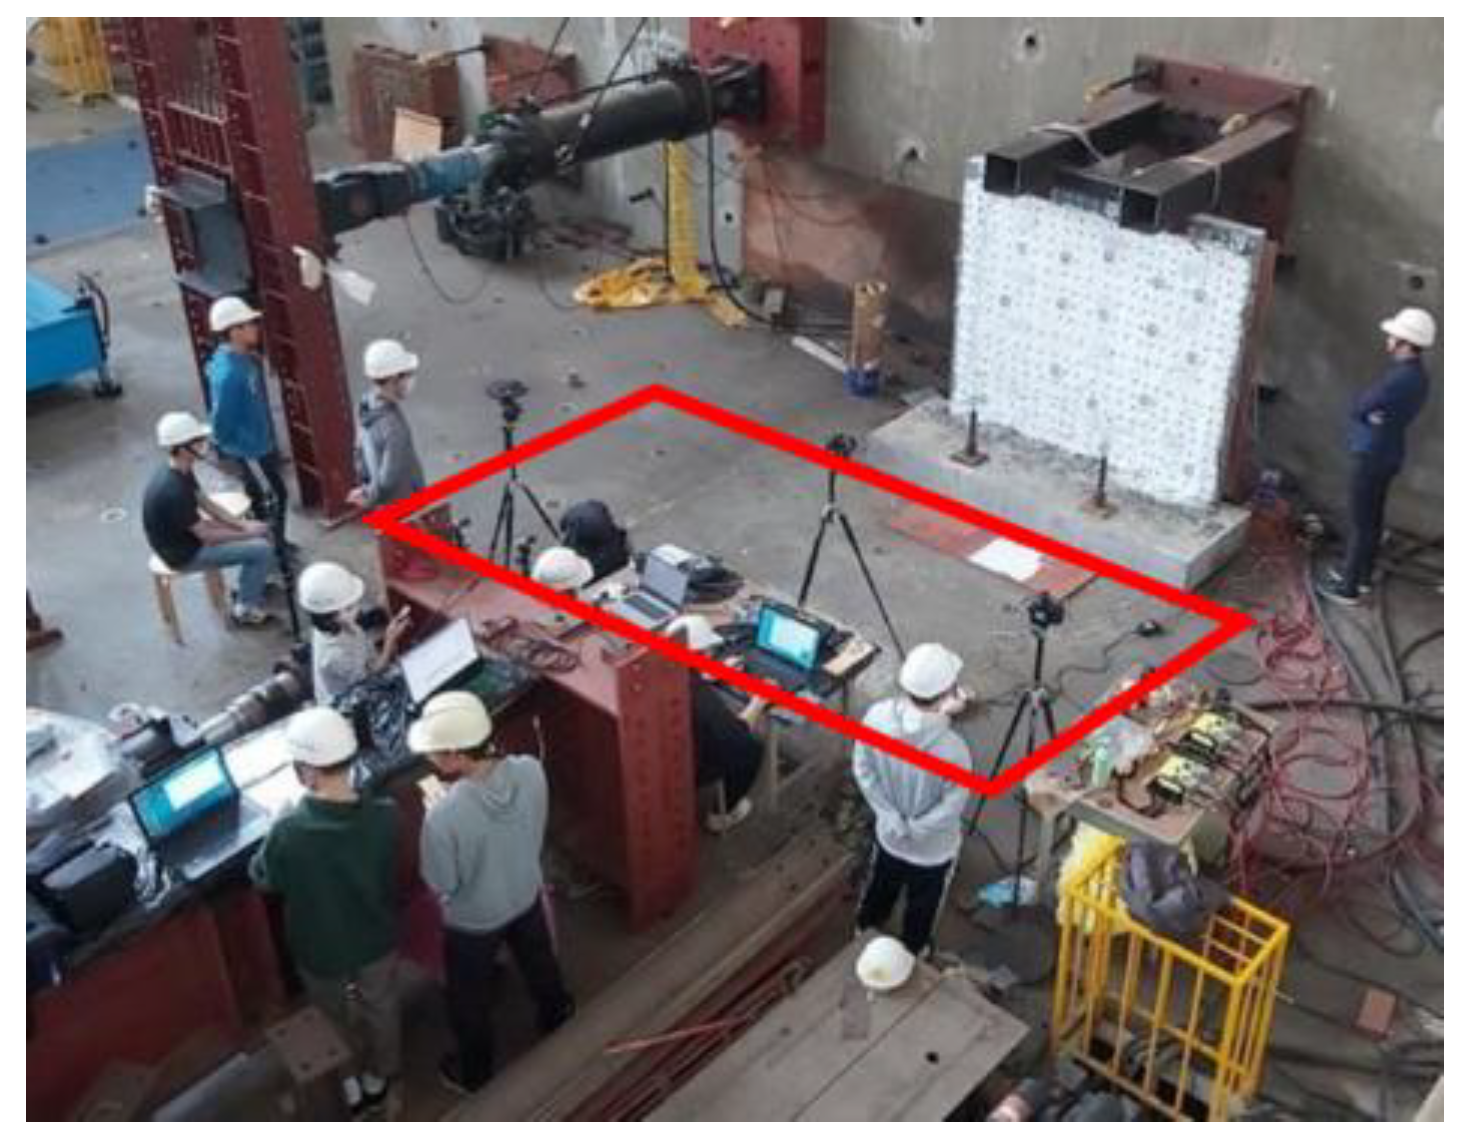
Prior to the loading tests, to capture the wall’s surface deformation, three fixed-position cameras were installed at the front of the wall to photograph it from different angles (Figure 9). The central camera was a Sony A7R4 (with a focal length of 23 mm and image size of 9504 × 6336 pixels) mounted approximately 3 m from the wall. This setup provided a spatial image resolution of 0.45 mm per pixel. The two side cameras were both Sony A77 (image size of 6000 × 4000 pixels), equipped with a focal length of 30 mm, positioned to achieve a 45° angle relative to the wall and the central camera, each at a distance of about 3.8 m from the wall. Their calculated spatial resolutions were 0.48 mm and 0.47 mm, respectively. All three cameras were mounted on sturdy tripods and operated via remote control without any manual contact, ensuring that the camera positions and orientations remained fixed throughout the entire deformation test. After securing all three cameras in place, the first set of synchronized images was remotely captured to serve as the reference (unloaded) condition for orientation reconstruction. During the loading and unloading cycles, images were continuously captured remotely in synchronized sets at approximately 30 s intervals, providing the time resolution for the analysis. The experiment duration was approximately 93 min, and the total number of epochs was 186 (Figure 10).
The computer was equipped with an Intel i5-10600K CPU and 64 GB of RAM. Dense feature extraction and image matching required approximately three hours for 186 epochs. Among the processes, feature extraction was relatively fast, whereas phase-based image matching consumed the majority of the computational time. Since the processing cost is proportional to the number of feature points, the average runtime was about one minute per epoch. The strain calculation typically requires about half an hour, while the filtering process usually takes only a few seconds. In comparison, the processing time is approximately 10 s per epoch.
To evaluate the measurement accuracy, the study also used high-precision laser distance measurements as a reference. A Leica Disto X3 laser distance meter (with a stated standard error of ±1 mm) was employed. During the experiment, the laser device was fixed in position to repeatedly measure the distance to a single target point. The data were transmitted via Bluetooth and recorded on a computer for subsequent comparison and evaluation of the photogrammetric distance measurement accuracy.

4. Experimental Results

This section presents the experimental results and provides a detailed discussion of the findings. The study focused on examining two types of feature points—target-based and targetless—and conducted evaluations in three steps. First, the quality of 3D point reconstruction was assessed through multi-ray space intersection. Second, the photogrammetrically derived displacements were compared with those measured by the laser rangefinder. Lastly, the effectiveness of spatio-temporal filtering for targetless feature points was evaluated.

4.1. Precision of 3D Points from Space Intersection

The study analyzed the quality of the 3D points obtained through space intersection. The findings are provided in this section. Space intersection was performed using the image coordinates of the feature points derived from multi-camera imaging at different time epochs, yielding time-series 3D coordinates for these points. The standard deviation of the 3D points resulting from space intersection represents the consistency of feature point triangulation across multiple camera views.
For the target-based approach, the feature points were defined by the centroids of manually placed markers. In the targetless approach, the feature points were automatically extracted using the SURF algorithm. All the feature points were then processed using the same image matching and space intersection workflow to obtain their 3D coordinates. The results of these space intersection computations are presented in Figure 11.
The targetless approach identified 1192 feature points; however, their spatial distribution was less uniform than that of the manually placed targets. This uneven distribution was influenced by the overall lighting conditions during the experiment, as well as by mechanical equipment overhead and occlusions near the rectangular frame on the right side and the anchor bolts at the bottom, which limited feature detection in those areas. However, since the damage in the masonry wall experiment was concentrated in the central region and the concrete frame area was excluded in subsequent strain analysis, the lower feature density in these peripheral regions was not expected to have a significant impact on the deformation analysis.
This step also evaluated the standard deviation of space intersection errors for both the targetless and target-based feature points to determine whether the data were suitable for subsequent displacement analysis. The three cameras used in the experiment had spatial resolutions of 0.45 mm/pixel, 0.48 mm/pixel, and 0.47 mm/pixel, respectively. All the intersection errors are summarized in Table 1, which presents the mean and standard deviation of the intersection errors for target-based and targetless 3D points across all epochs.
It was observed that the error along the Z axis (depth direction) was typically two to three times larger than the error in the X or Y directions, which is considered reasonable in photogrammetric processes [28]. The errors in the X and Y directions were maintained below 1 mm, ensuring that they did not affect crack detection accuracy, thus meeting the experimental design requirements. When comparing the Z-axis errors between the target-based and targetless methods, the target-based approach demonstrated better precision. Therefore, this study identified that spatio-temporal filtered needed to be applied to the targetless method to further refine the 3D point coordinates.

4.2. Accuracy Evaluation of a 3D Point Using a Laser Ranger

The displacement error of a 3D point located at the center of the wall was evaluated. The findings are detailed in this section. The reference displacement was measured using a Leica Disto X3 laser distance meter with a stated standard error of ±1 mm. The laser ranger was set up to measure the displacement of the wall’s central point. To assess displacement accuracy, the displacement in the Z direction—representing out-of-plane deformation—was compared against the displacement measured by the laser ranger to evaluate the absolute accuracy of the photogrammetric method. During setup, the laser ranger was securely fixed on a platform positioned in front of the wall and aligned toward its approximate center. The exact location of the measured point on the wall is shown in Figure 12 and Figure 13.
Throughout the experiment, the laser ranger recorded distance measurements every 5 s. The distance measured at the start of the experiment—when the wall was unloaded (i.e., D(1)), not subjected to out-of-plane forces)—was used as the reference distance for computing the displacement during deformation, as defined in Equation (17):
d z t = D t D ( 1 )
where dz(t) is the displacement at time t; D(t) is the measured distance at time t; and D(1) is the reference distance at time 1 (unloaded condition).
Because the camera system captured synchronized images every 30 s, while the laser ranger collected data every 5 s, linear interpolation was used to obtain laser distance values corresponding to the camera acquisition times. The displacement difference between the two methods at each time point was calculated using Equation (18):
E r r o r d z ( t ) = | d z p h o t o ( t ) d z l a s e r ( t ) |
where Errordt(t) is the difference between photogrammetric-derived and laser-derived displacement at time t.
By synchronizing the imaging timestamps with the laser ranger’s recorded times, the displacement data from the photogrammetric and laser measurement methods could be directly compared. The maximum displacement differences (Errordz) for the targetless and target methods were found to be 1.962 mm and 1.403 mm, respectively, as shown in Table 2. The root mean square error for both the targetless and target methods remained below 1 mm, demonstrating that the photogrammetric time-series displacement measurements achieved reliable accuracy. Figure 14 illustrates the highly consistent trends observed between the photogrammetric and laser measurement methods.
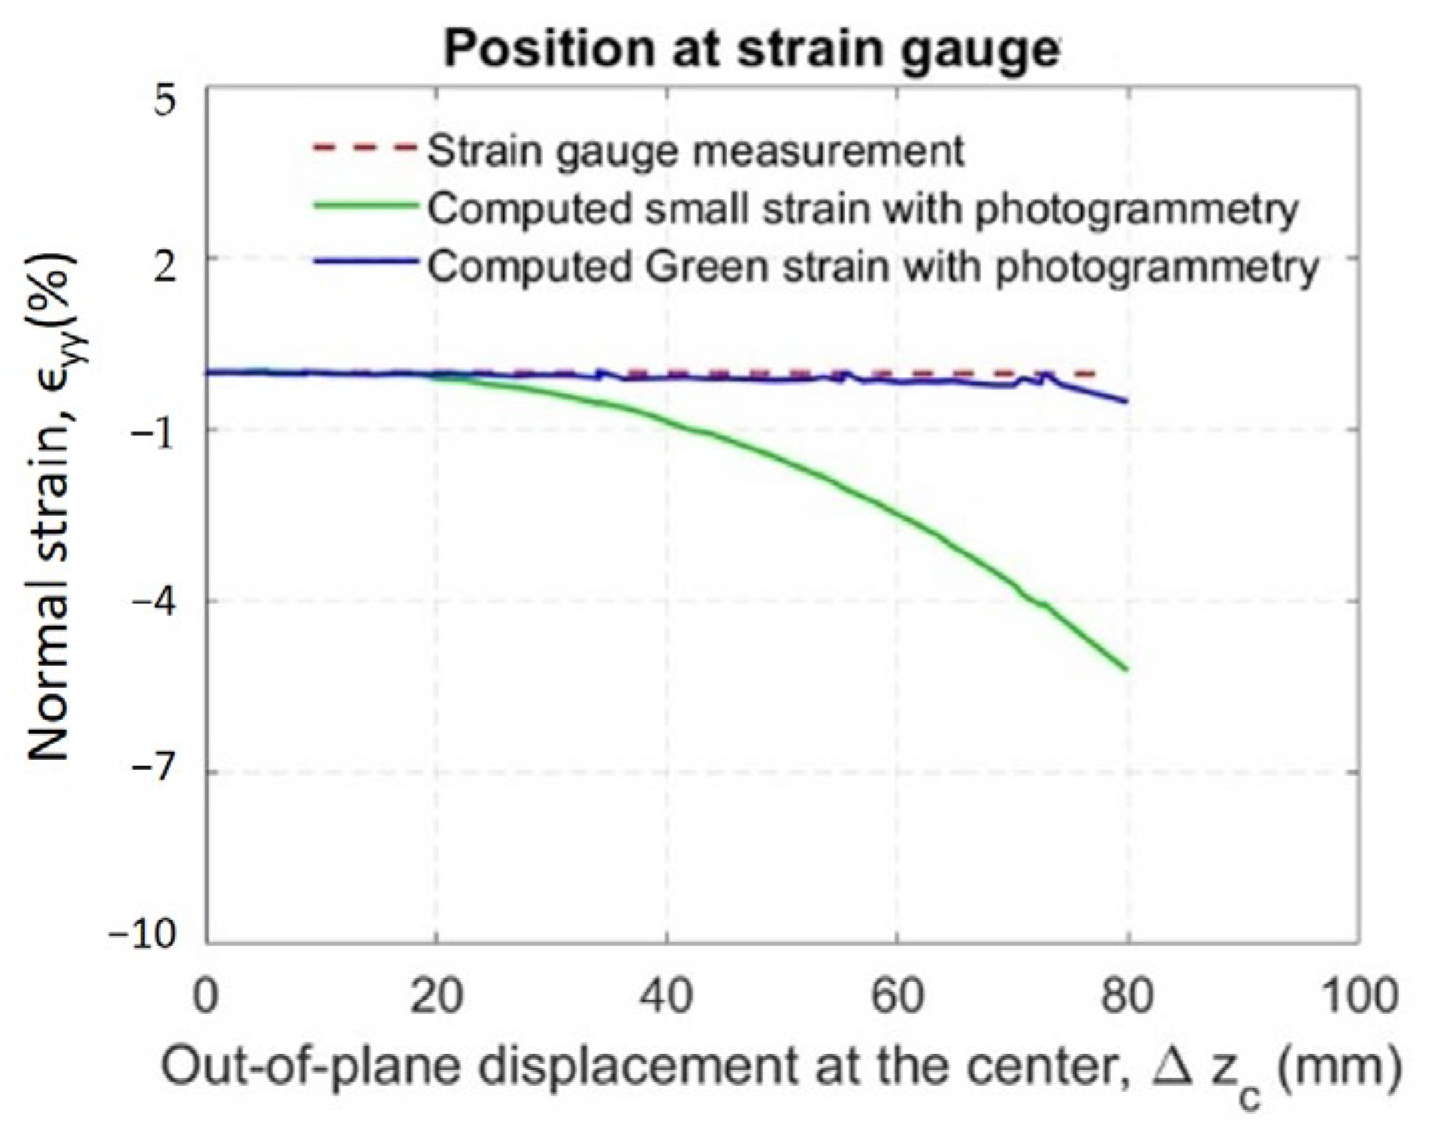
With an average GSD of 0.480 mm/pixel and an RMSE of 0.843 pixels, the displacement uncertainty is approximately 0.566 mm ( = 2 × 0.480 × 0.843 ) . Thus, cracks wider than > 0.6 mm can be detected, while finer cracks would require complementary high-resolution DIC for improved sensitivity. Moreover, the accuracy of strain quantification can be assessed by placing strain gauges on the specimen and comparing the single-point results with those calculated in this study. As shown in Figure 15, as the experiment progressed, it is evident that the Green strain provides more reliable results than the small strain formulation.

4.3. Spatio-Temporal Filtering for Targetless-Based 3D Displacement Analysis

This study derived 3D spatial coordinates using both target-based and targetless methods. Although the targetless approach fully extracted the feature points from the natural image features automatically, these automatically detected points may have included significant noise and outliers. Therefore, this study proposed a spatio-temporal filtering workflow designed to improve the displacement results obtained from the targetless method.
To evaluate the effectiveness of this spatio-temporal filtering technique for the targetless approach, this section presents results from three selected epochs (i.e., time steps 1, 90, and 170) to analyze the filtering performance. The results from each stage of filtering have been provided to enable direct comparison and gauge their effectiveness.
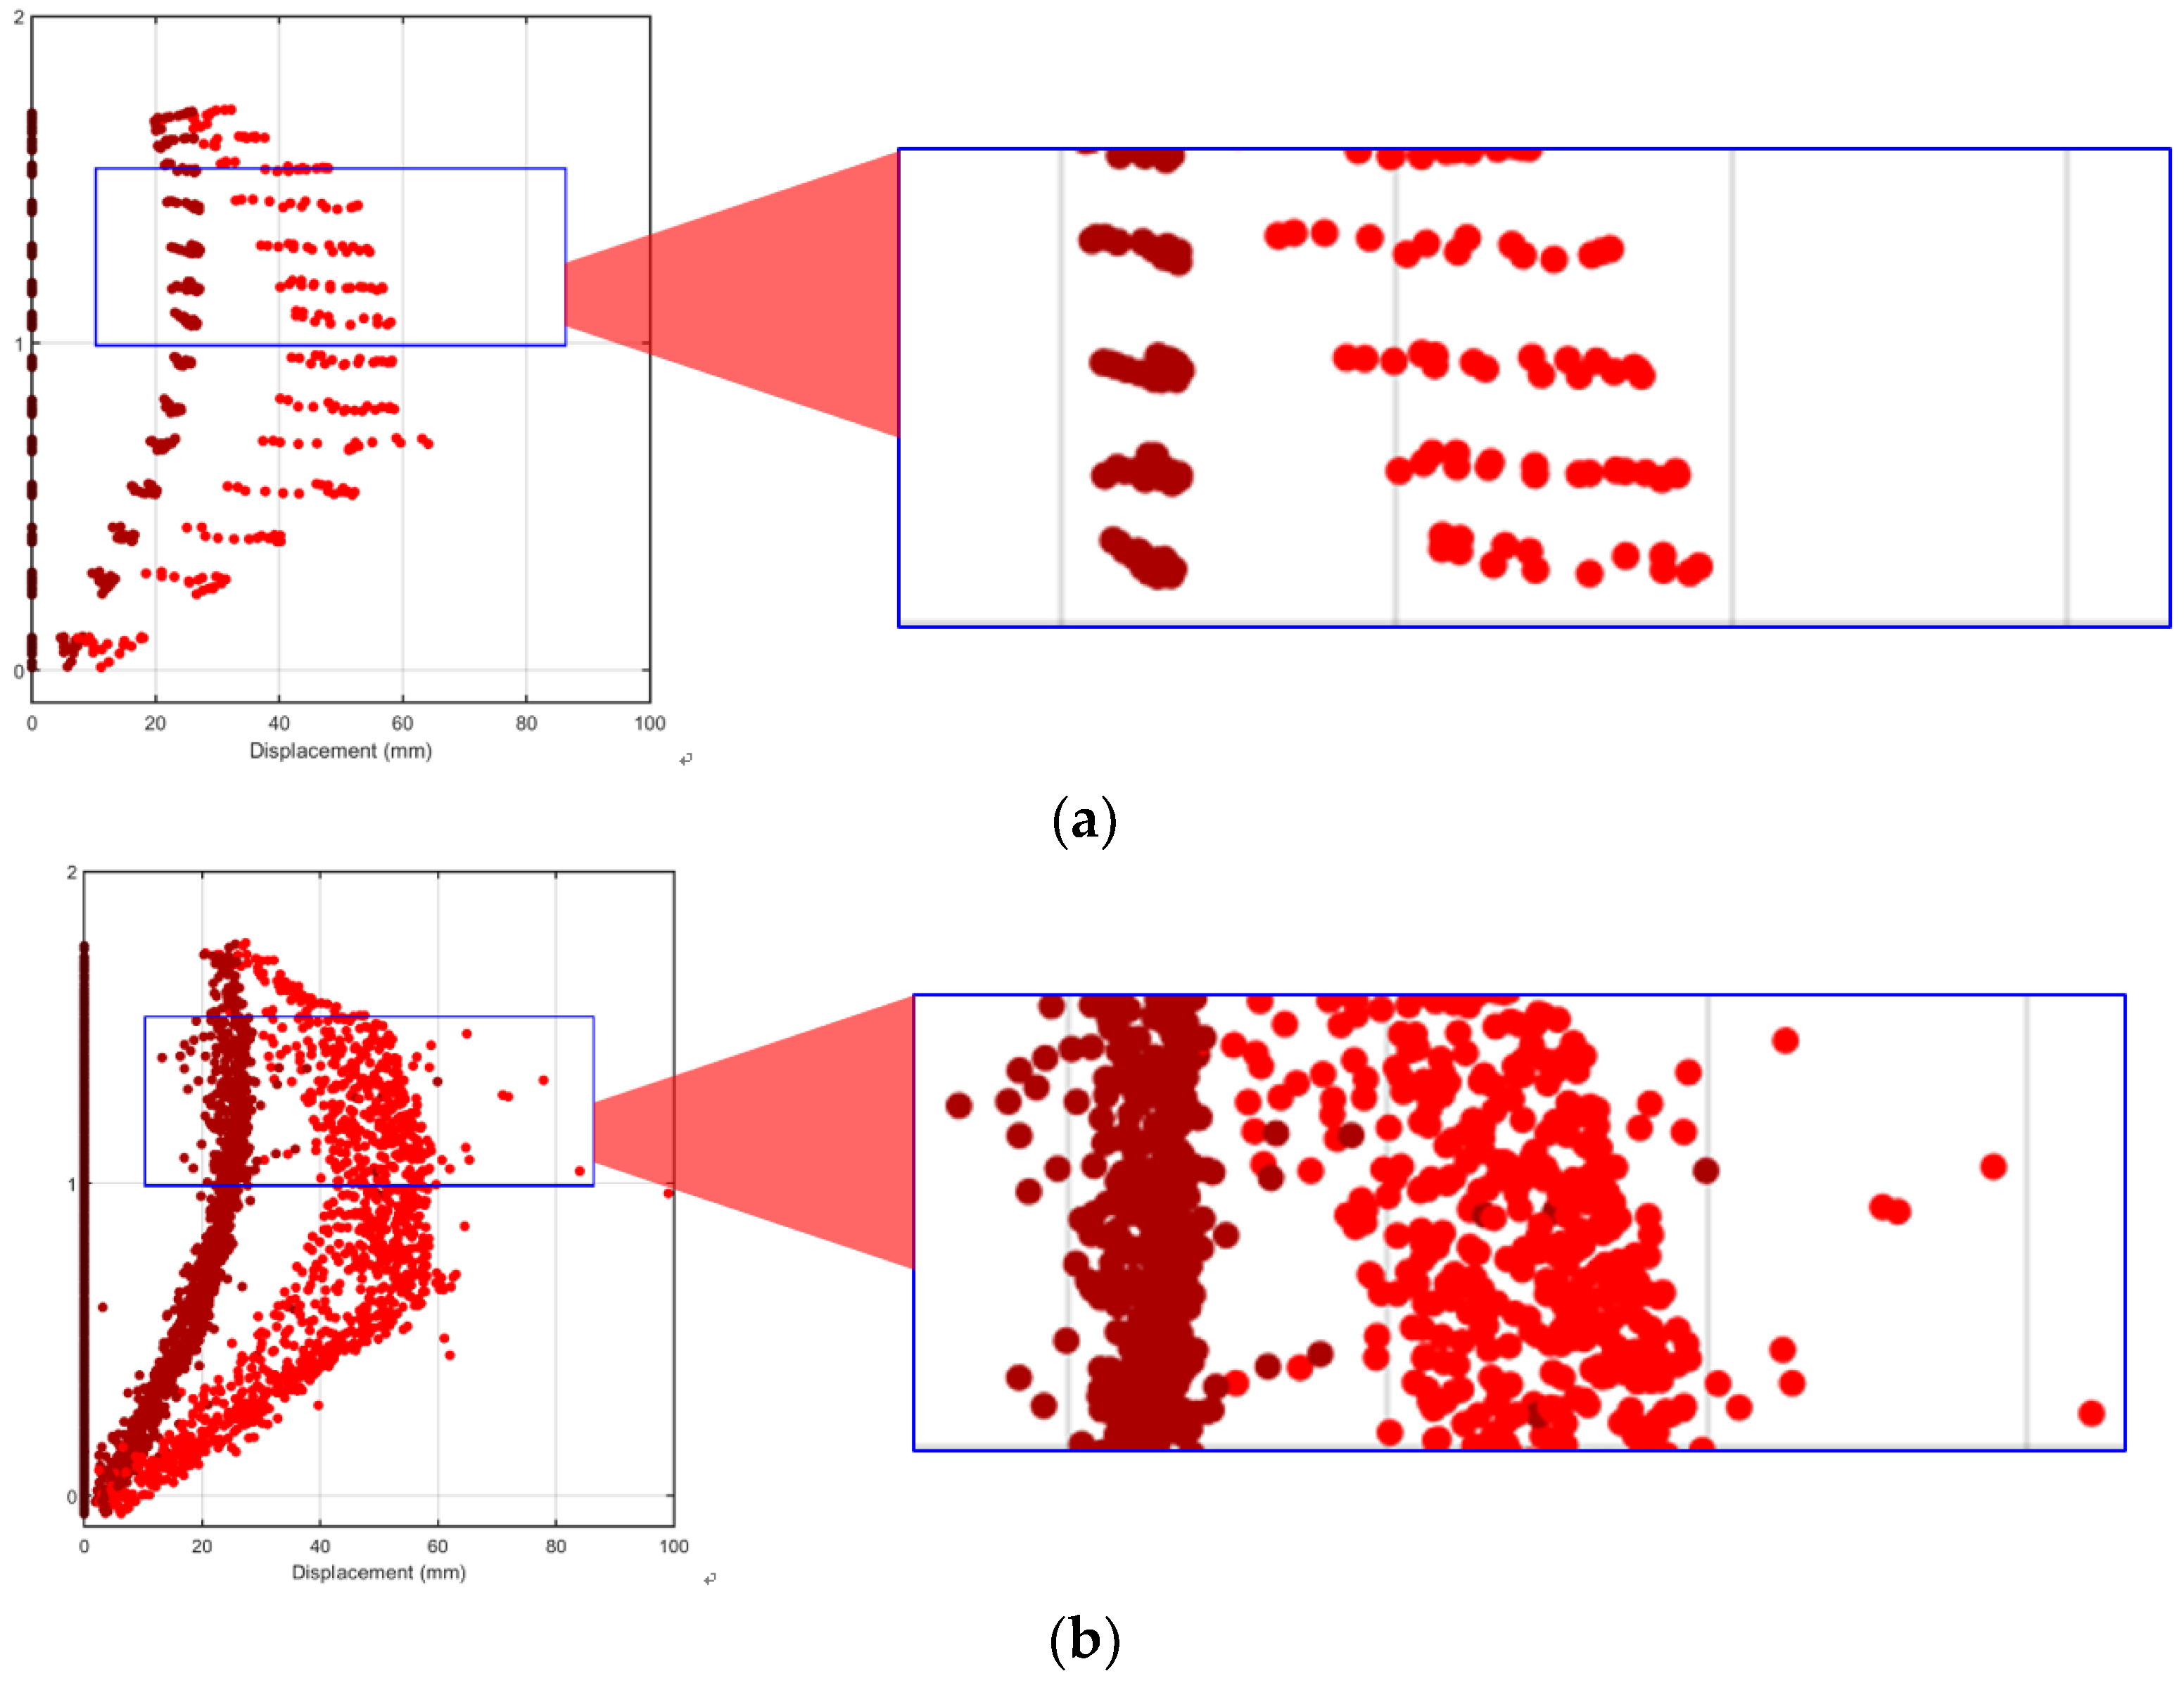
To illustrate the wall’s deformation behavior under varying loading conditions, Figure 16a shows the deformation states at time steps 1, 90, and 170 for the target-based method. Because the wall was loaded directly from behind, it exhibited significant out-of-plane deformation in the Z direction. A Y-Z profile view is shown in the figure to highlight this deformation. It also includes local enlargements to show the detailed distribution and movement of the target points. Deformation was largest near the central region of the wall, where the concentrated load was applied, while it diminished progressively toward the edges constrained by the surrounding concrete frame. Overall, the photogrammetric results successfully captured the deformed shape of the wall as a curved surface with an outwardly spreading arc, centered slightly below mid-height.
For the target-based 3D points (Figure 16a), the results reflect the use of manually placed markers, yielding a smaller number of points. However, these were arranged in a highly regular and uniformly spaced grid. This configuration provided precise and consistent deformation measurements. In contrast, the targetless-based 3D points (Figure 16b) were extracted automatically from high-contrast natural features on the wall surface. This approach produced a much higher density of feature points distributed across the entire surface. However, when the targetless-based points were examined in detail, some outliers were clearly identified—points that deviated noticeably from the wall’s overall deformation surface due to matching errors. Such outliers caused abnormally large and noisy strain values in subsequent calculations, making it difficult to produce meaningful strain results without additional processing. This underscores the need for effective filtering and smoothing to obtain reliable strain data.
To improve data quality, MAD filtering (Figure 16c) was first applied to the displacement data; the results clearly demonstrated the method’s effectiveness. For example, at time step 90—before any visible cracking or large deformation had developed—the outliers were already removed effectively. However, methods that used only 1D convolution smoothing (Figure 16d) or representative point selection (Figure 16e) showed that while these approaches reduced local noise, they faced limitations in addressing significant outliers if such values were not first removed. Nevertheless, both smoothing and resampling remain necessary steps for strain computation, and their roles will be further explained in the strain analysis section.
Finally, by combining these methods in the proposed spatio-temporal filtering workflow—first applying MAD filtering to remove outliers and then performing 1D convolution smoothing and representative point selection—the resulting 3D displacement field showed substantial improvement (Figure 16f). This integrated spatio-temporal filtering approach effectively eliminated erroneous and noisy points. Additionally, the resulting point distribution more closely matched that of the target-based method. When viewed in the Y-Z profile, the deformation thickness appeared more focused, and the overall deformation contour was better aligned with the actual wall surface behavior. This comprehensive approach provided a stronger, cleaner foundation for subsequent strain field analysis.

4.4. Strain Analysis

The strain analysis presents computed strain fields from both target-based and targetless methods. As major cracks formed along the horizontal plane, the associated bending deformation also developed in this plane, while the principal bending strain was oriented along the vertical axis (hereafter referred to as bending strain). Accordingly, the analysis presented here focuses on this bending strain. For the targetless approach, the results calculated from the original unfiltered data are presented alongside the strain fields obtained using various filtering and smoothing techniques. Finally, the spatio-temporal filtered results produced by sequentially applying all the filtering steps are also showcased. After compiling these different strain results, the analysis includes a detailed discussion to compare them with the observed crack patterns on the wall surface to assess whether the strain trends accurately reflect the actual development of cracks.

4.4.1. Strains from the Target Method

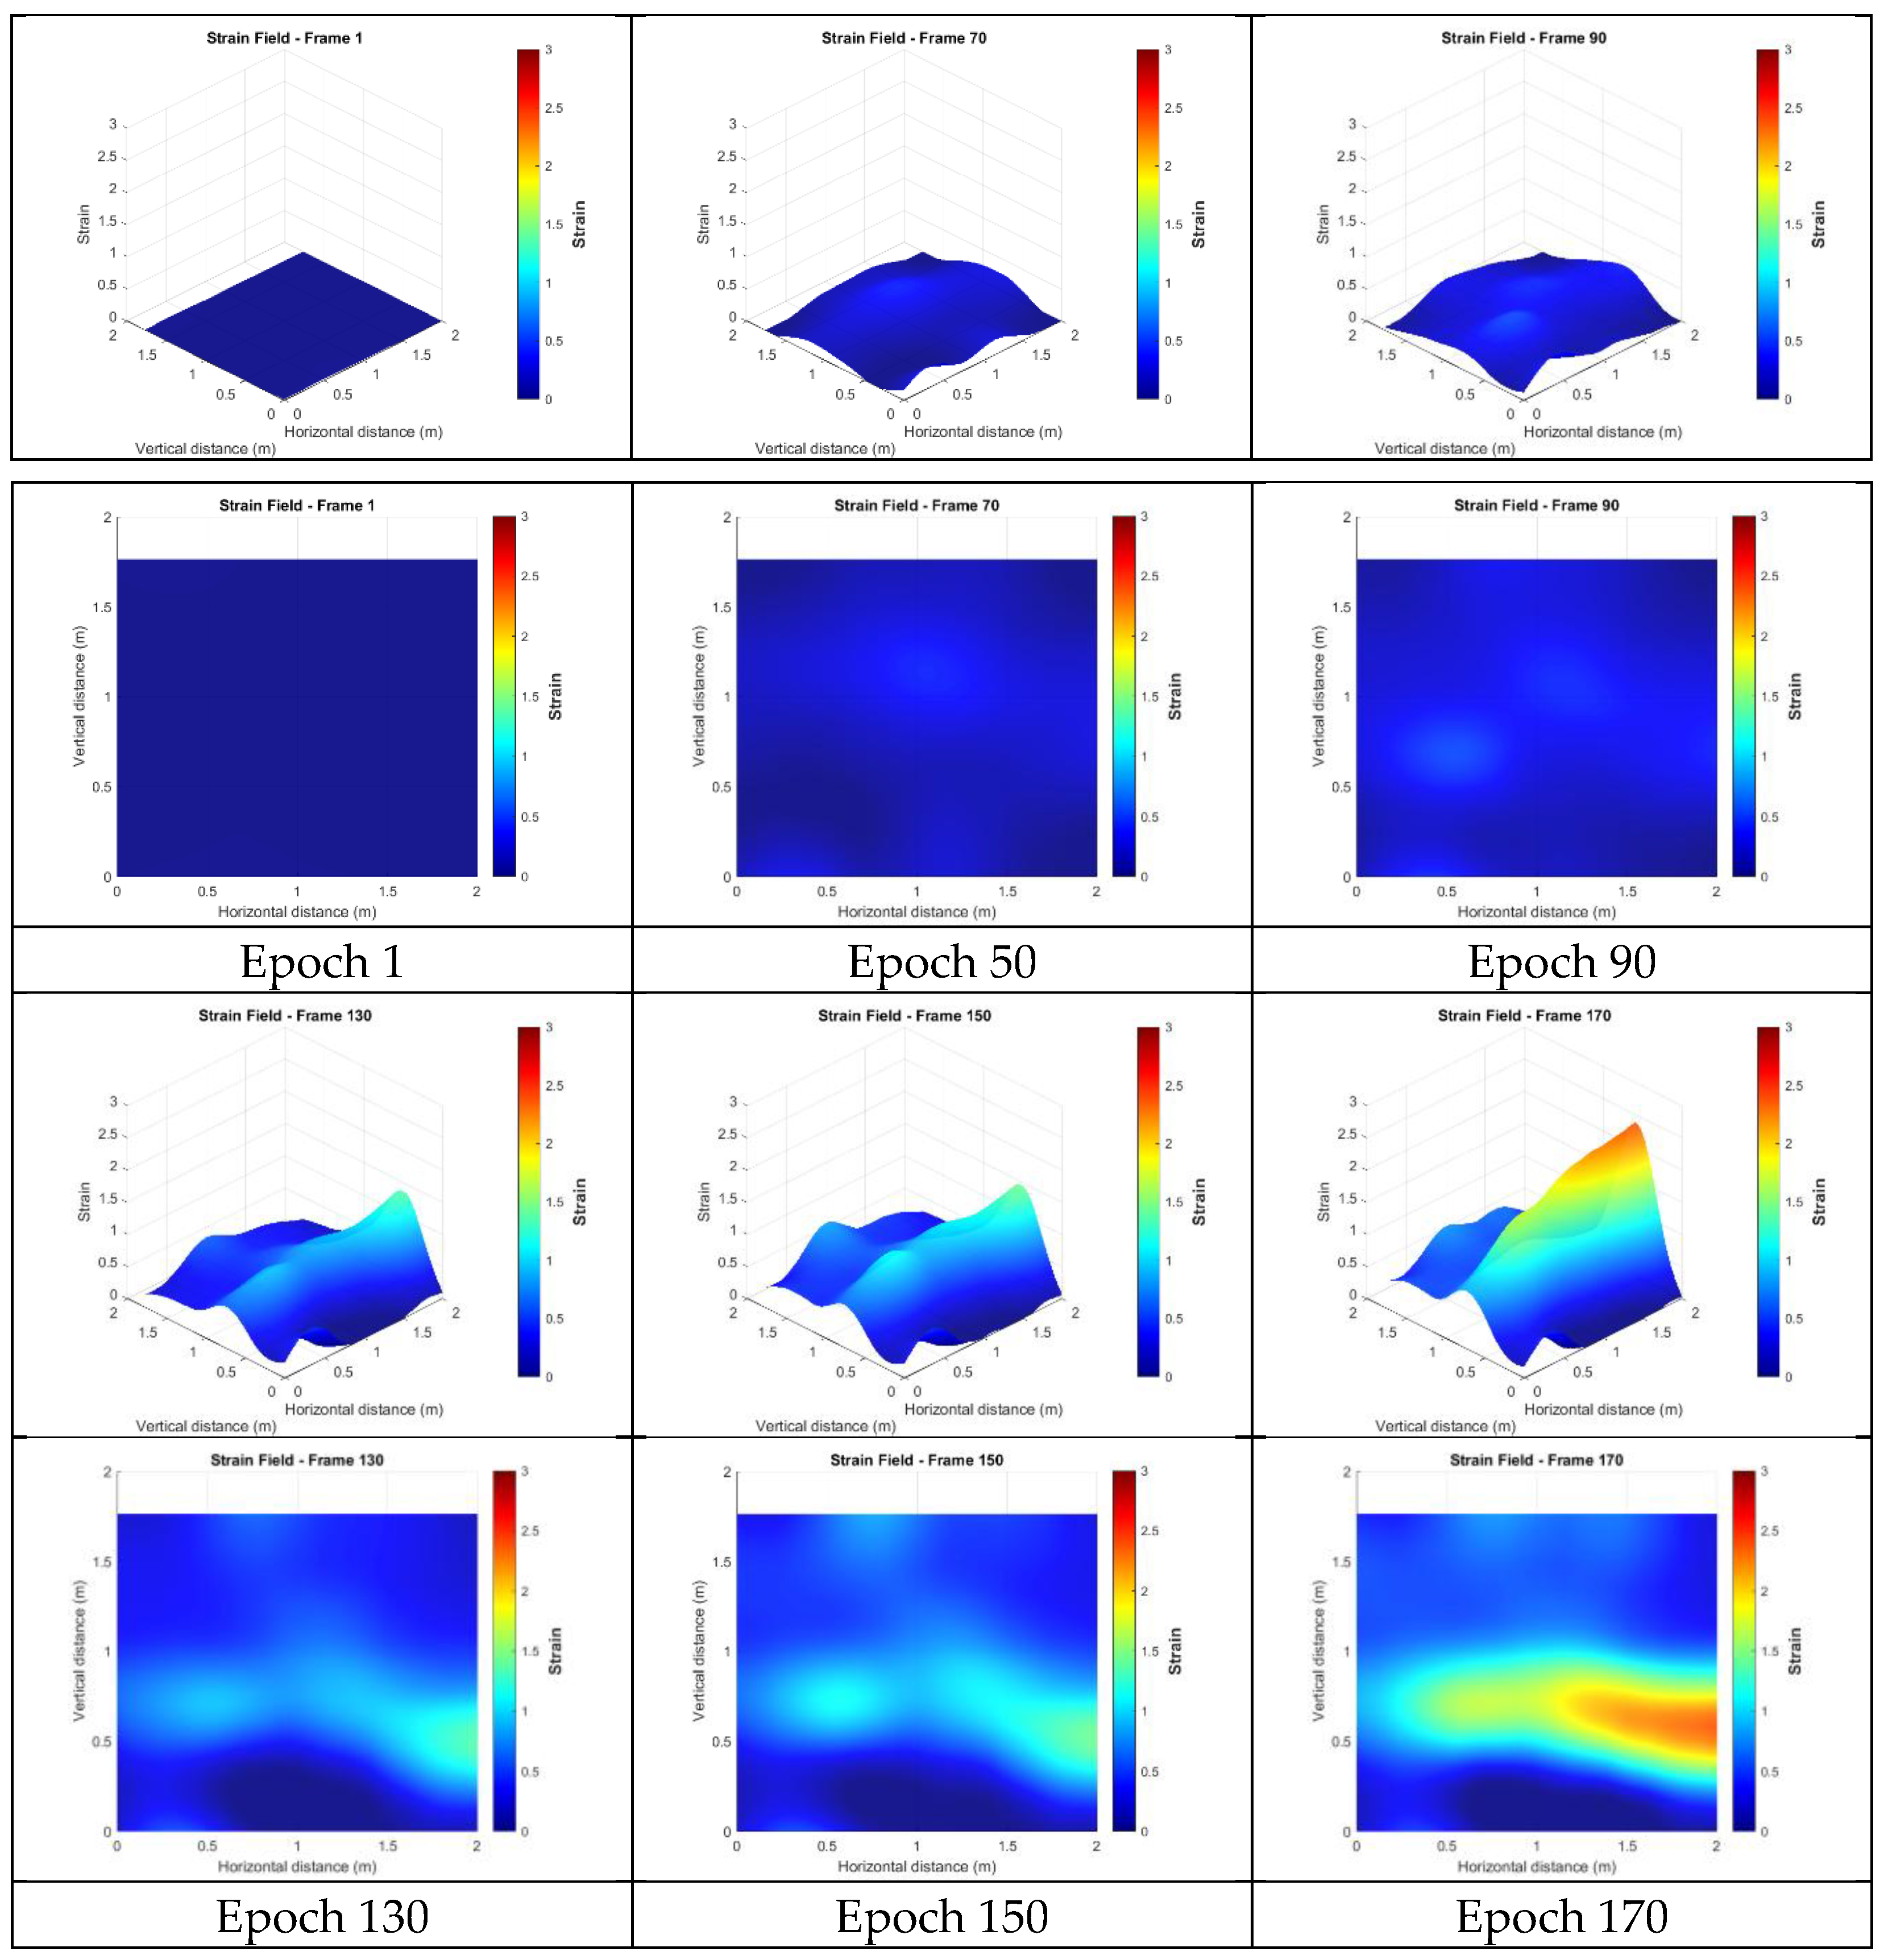
A total of 222 points from the target-based method were used to perform strain analysis. The maximum bending strain calculated was 3.8729, and the strain distribution is shown in Figure 17. From a 3D perspective, deformation in the upper region appeared less pronounced, although subtle trends could still be observed. In contrast, the target method effectively captured the deformation associated with major cracks, particularly in the lower-central region of the masonry wall, where the most significant cracking occurred. The strain field derived from the target-based points reflected the actual deformation behavior; overall, it aligned well with the main deformation patterns observed on the wall surface.

4.4.2. Strains from the Unfiltered Targetless Data

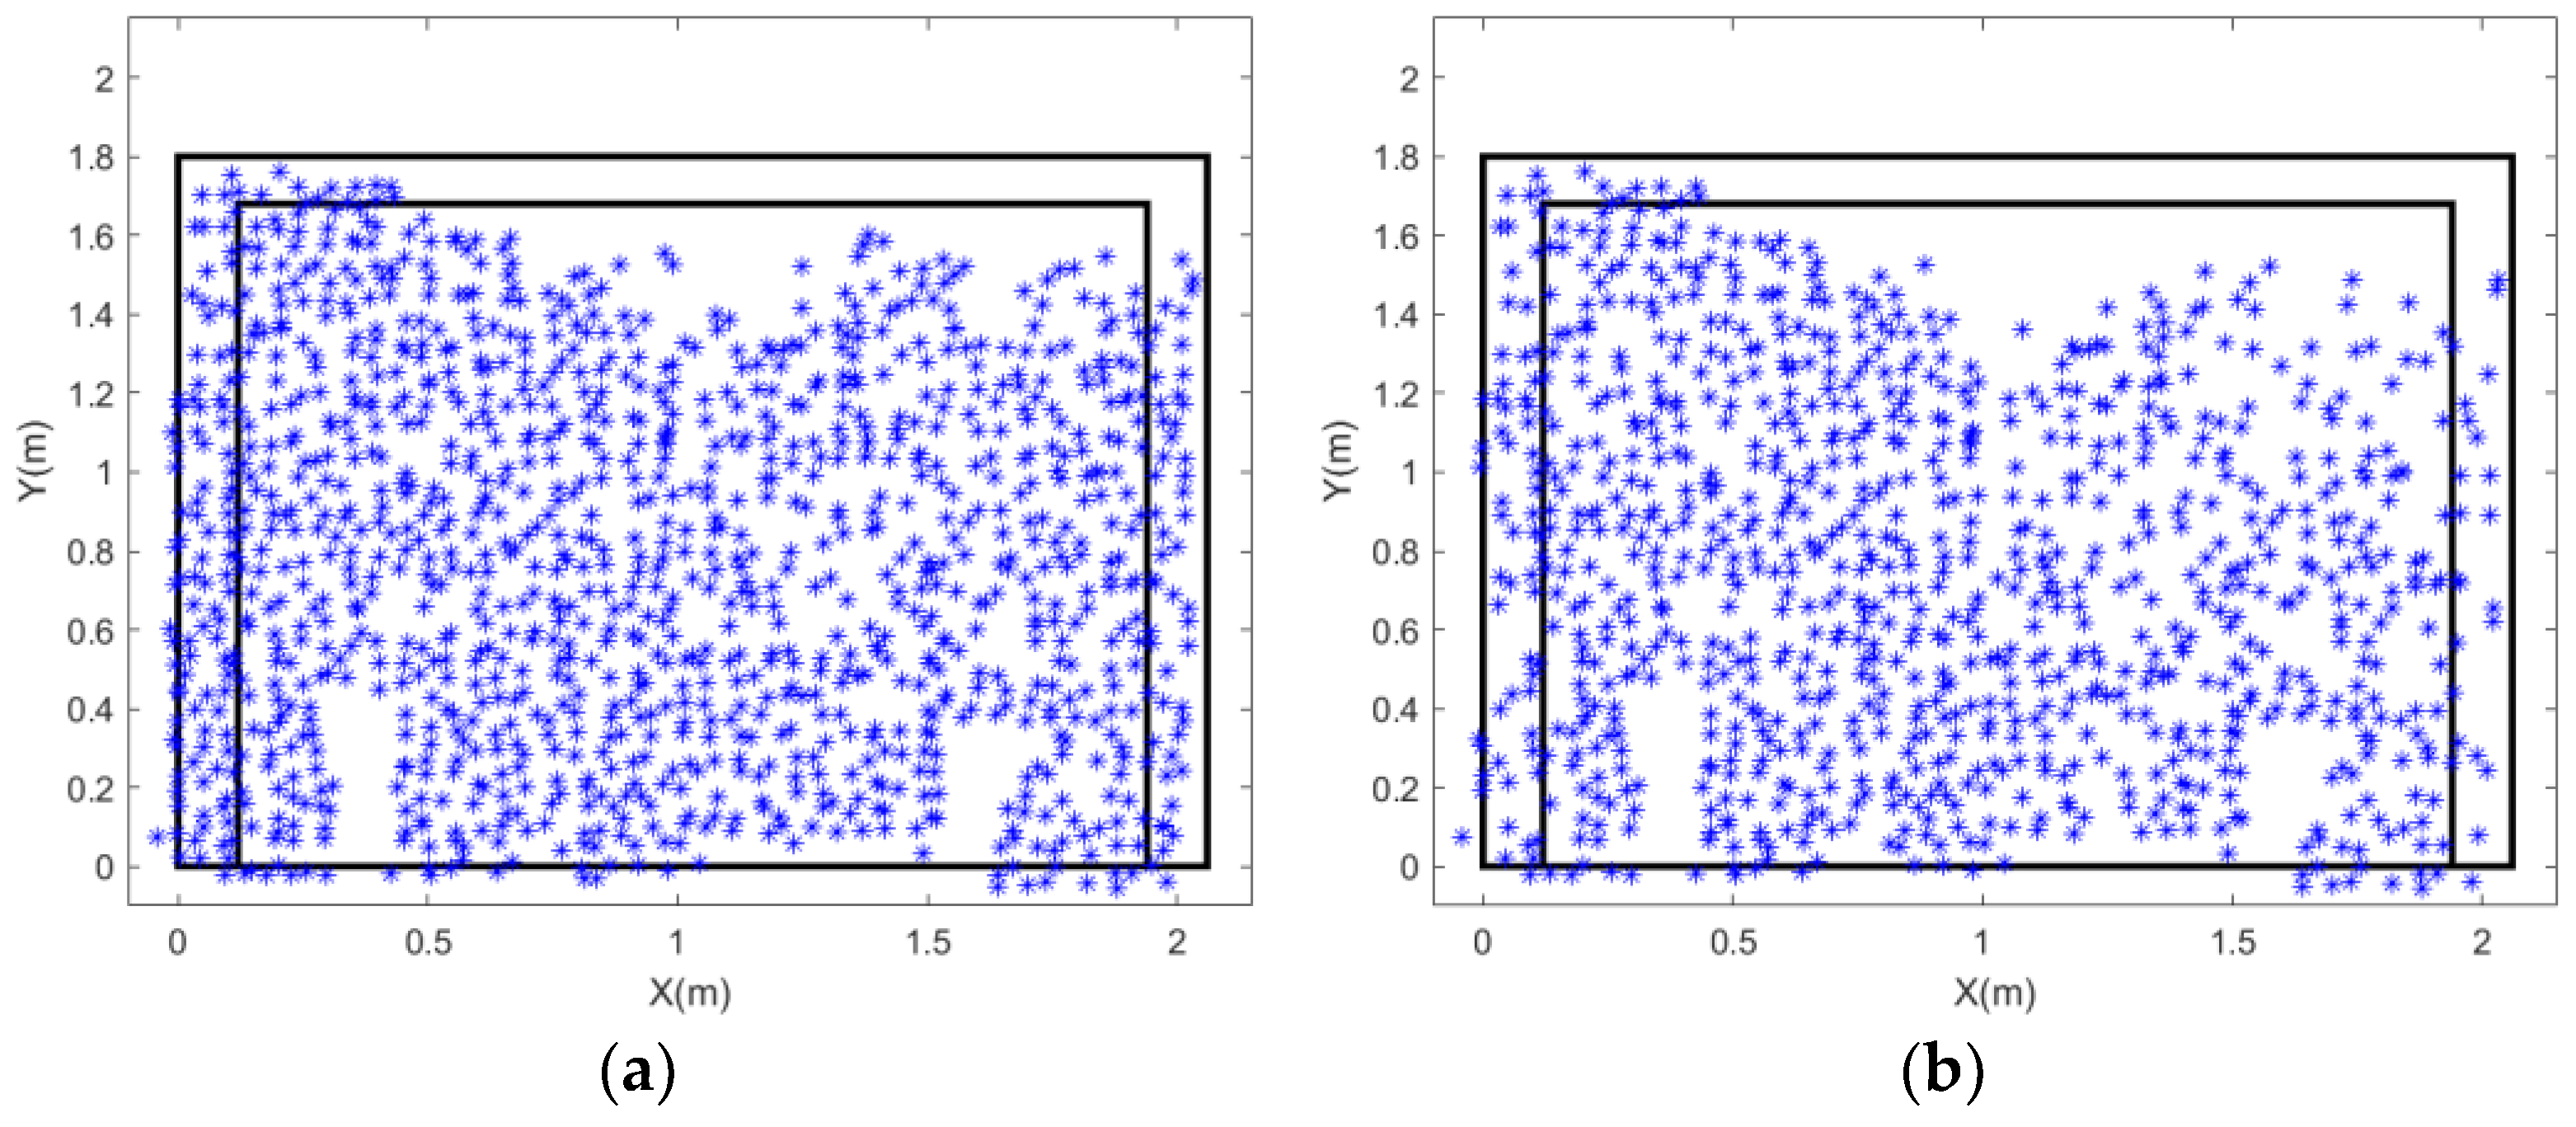
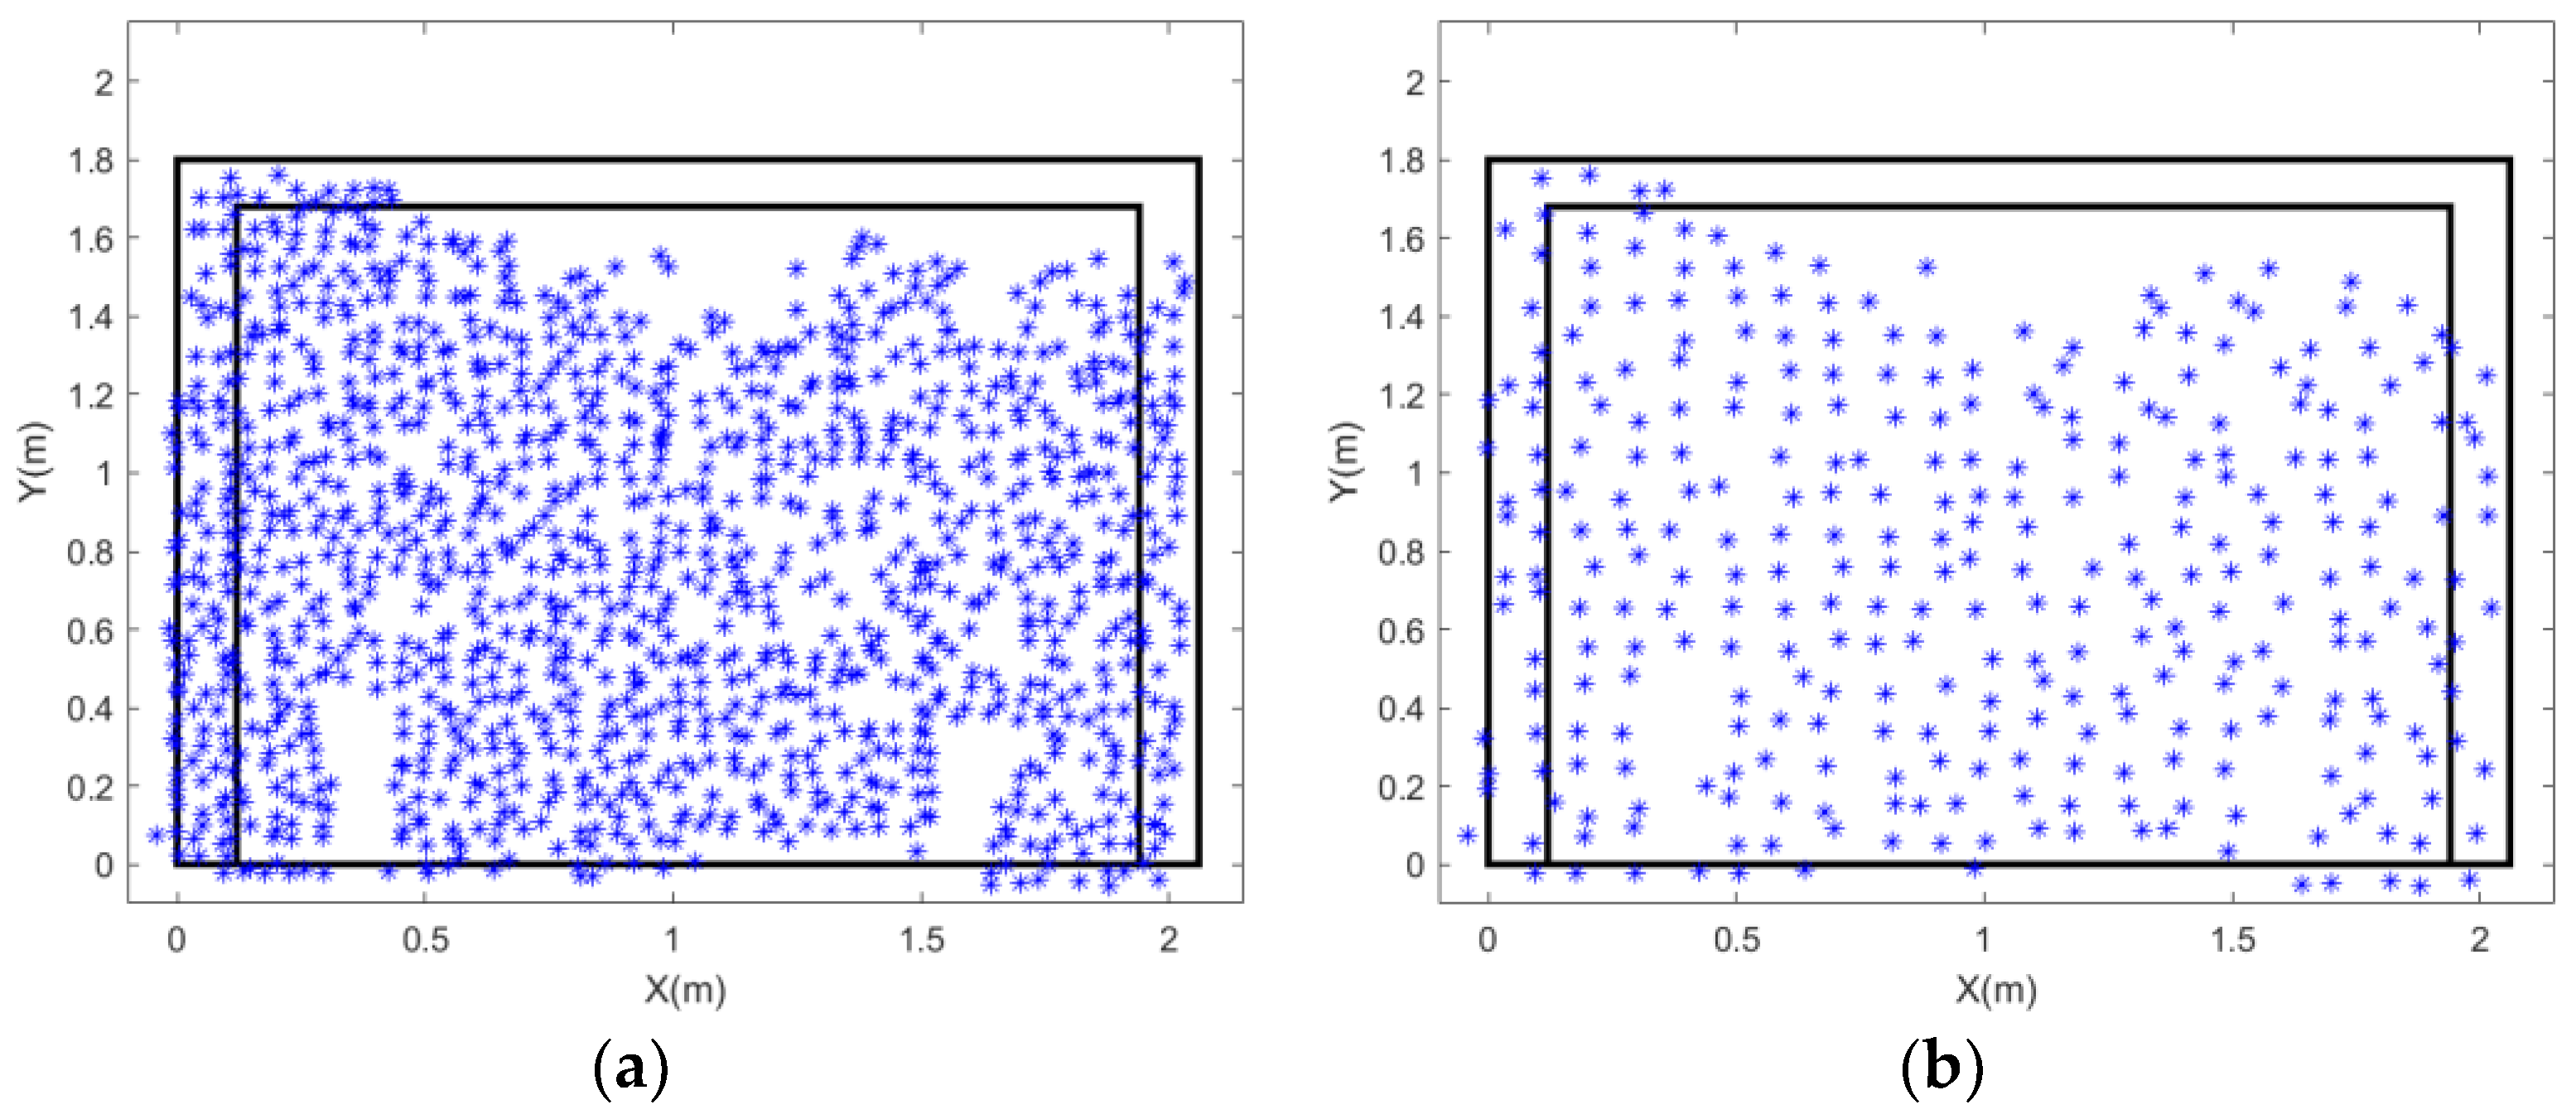
The targetless method identified a total of 1192 feature points using natural image feature points. While some regions exhibited gaps in point distribution due to occlusions, a comparison with the observed crack patterns suggests that these gaps would have had minimal impact on the analysis. Therefore, these points were still used for subsequent strain calculations. The spatial distribution of these feature points is shown in Figure 11a.
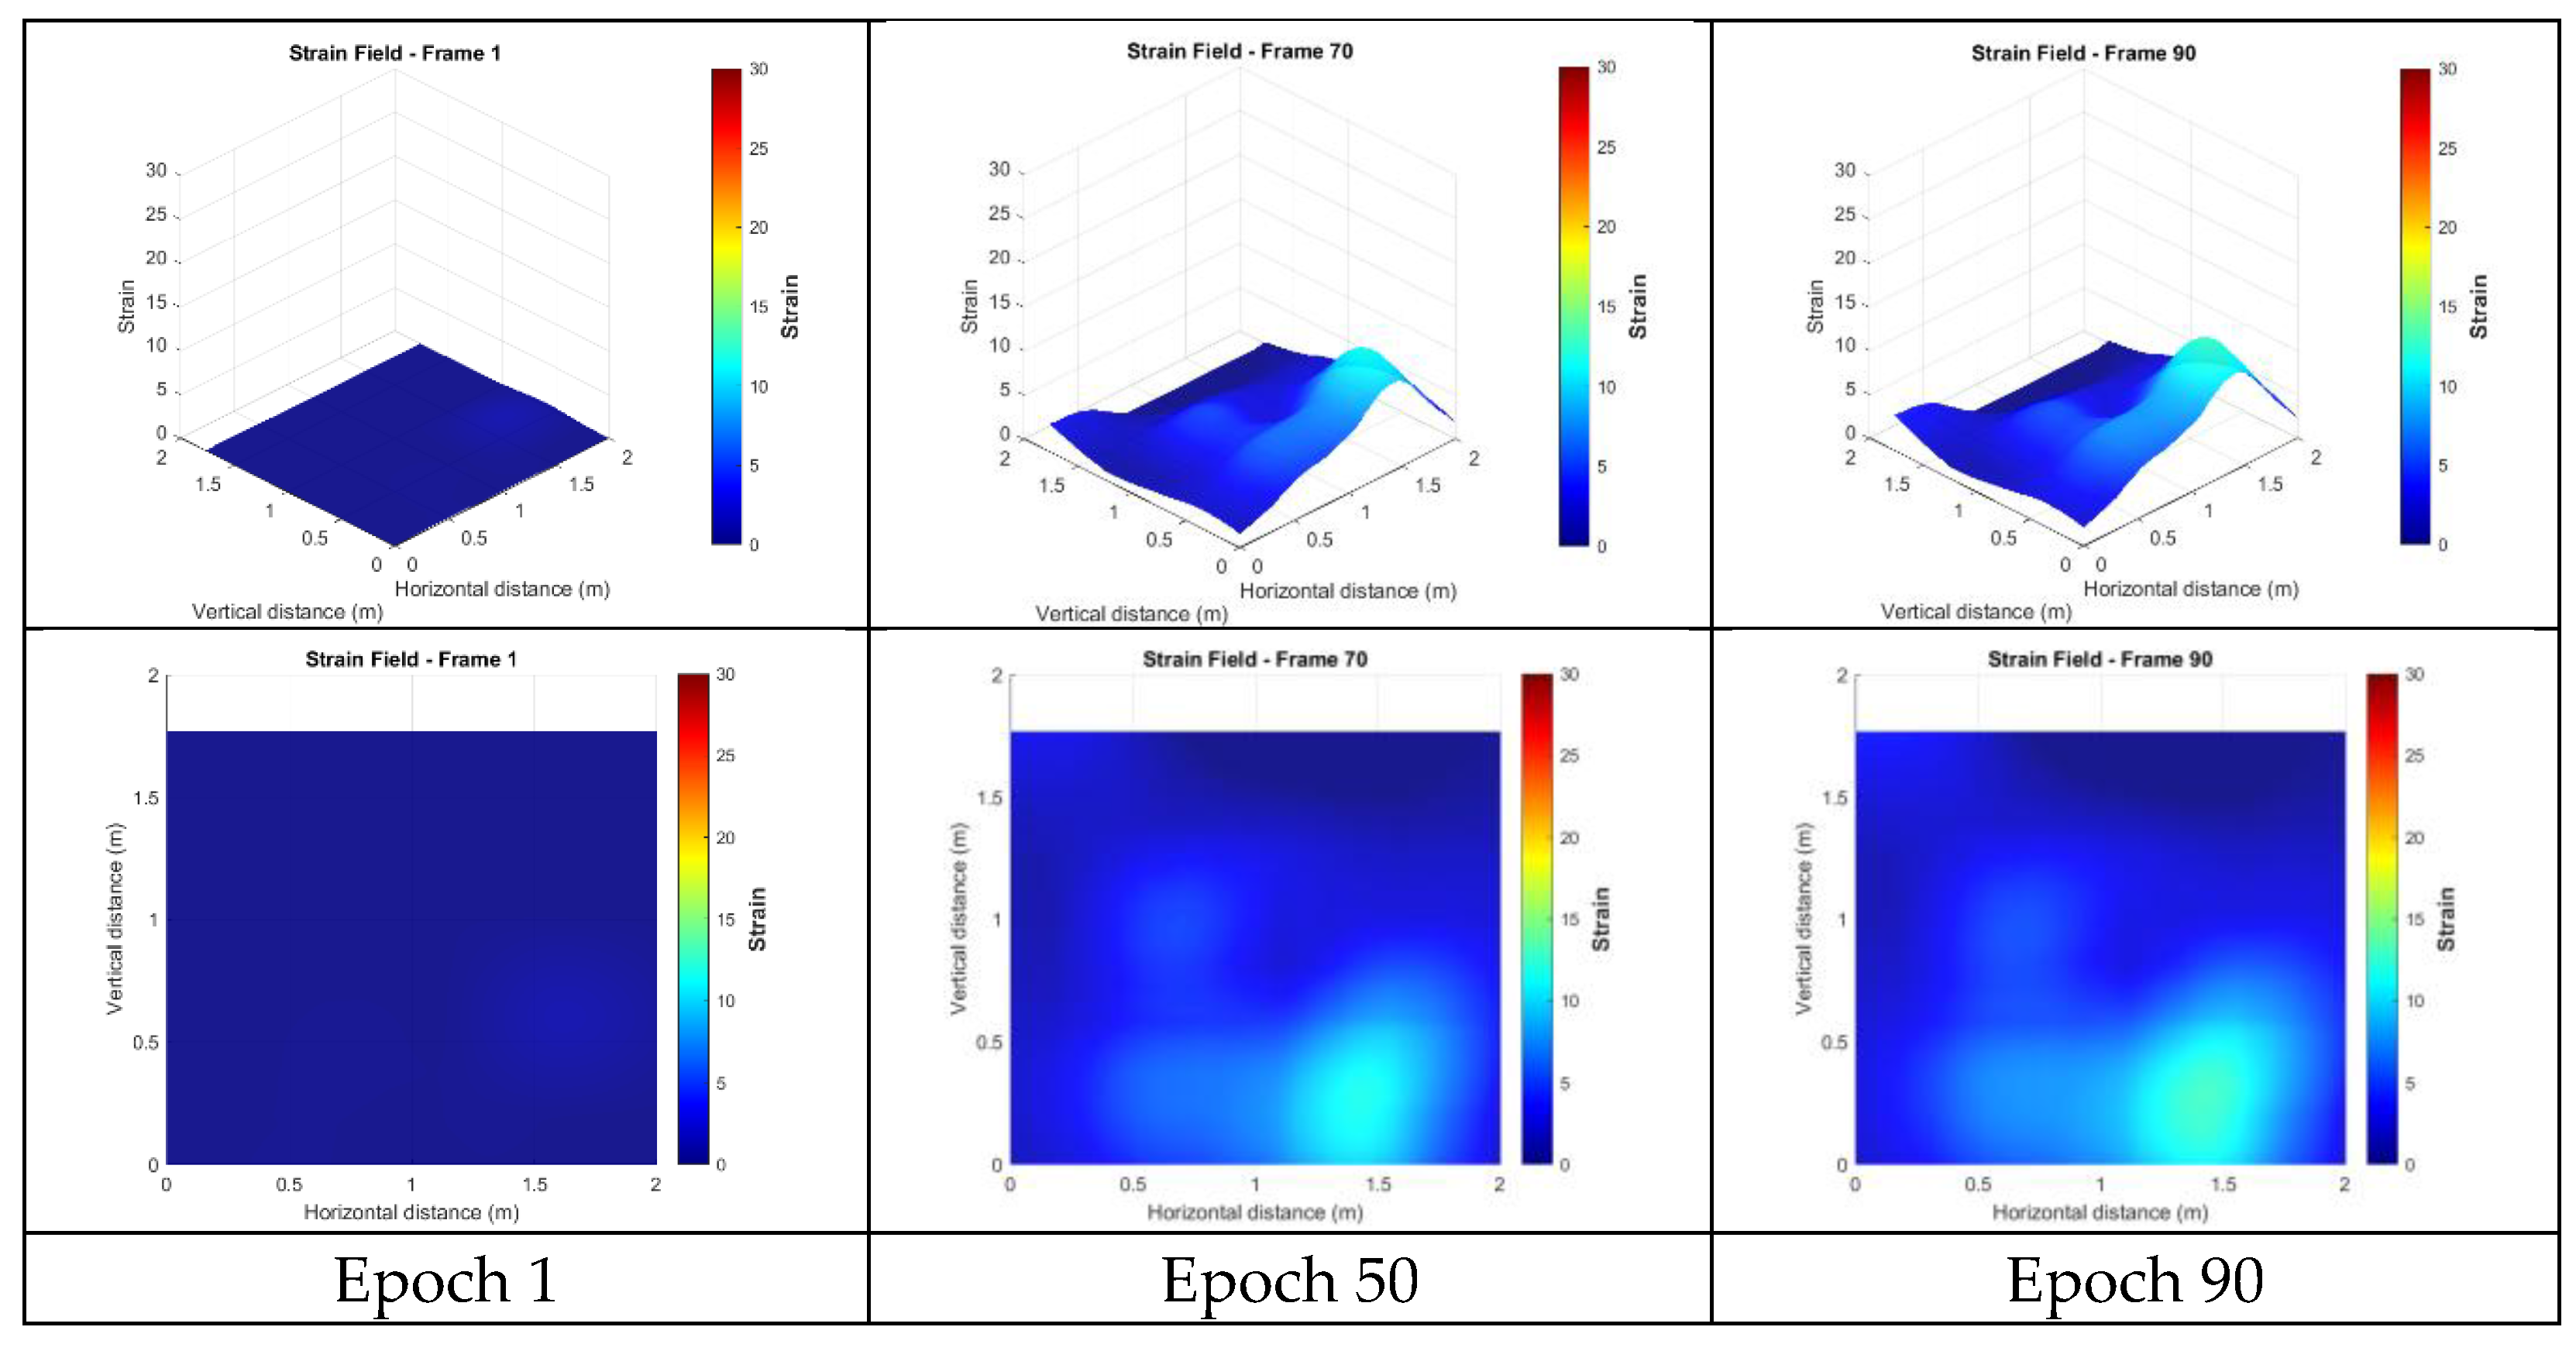
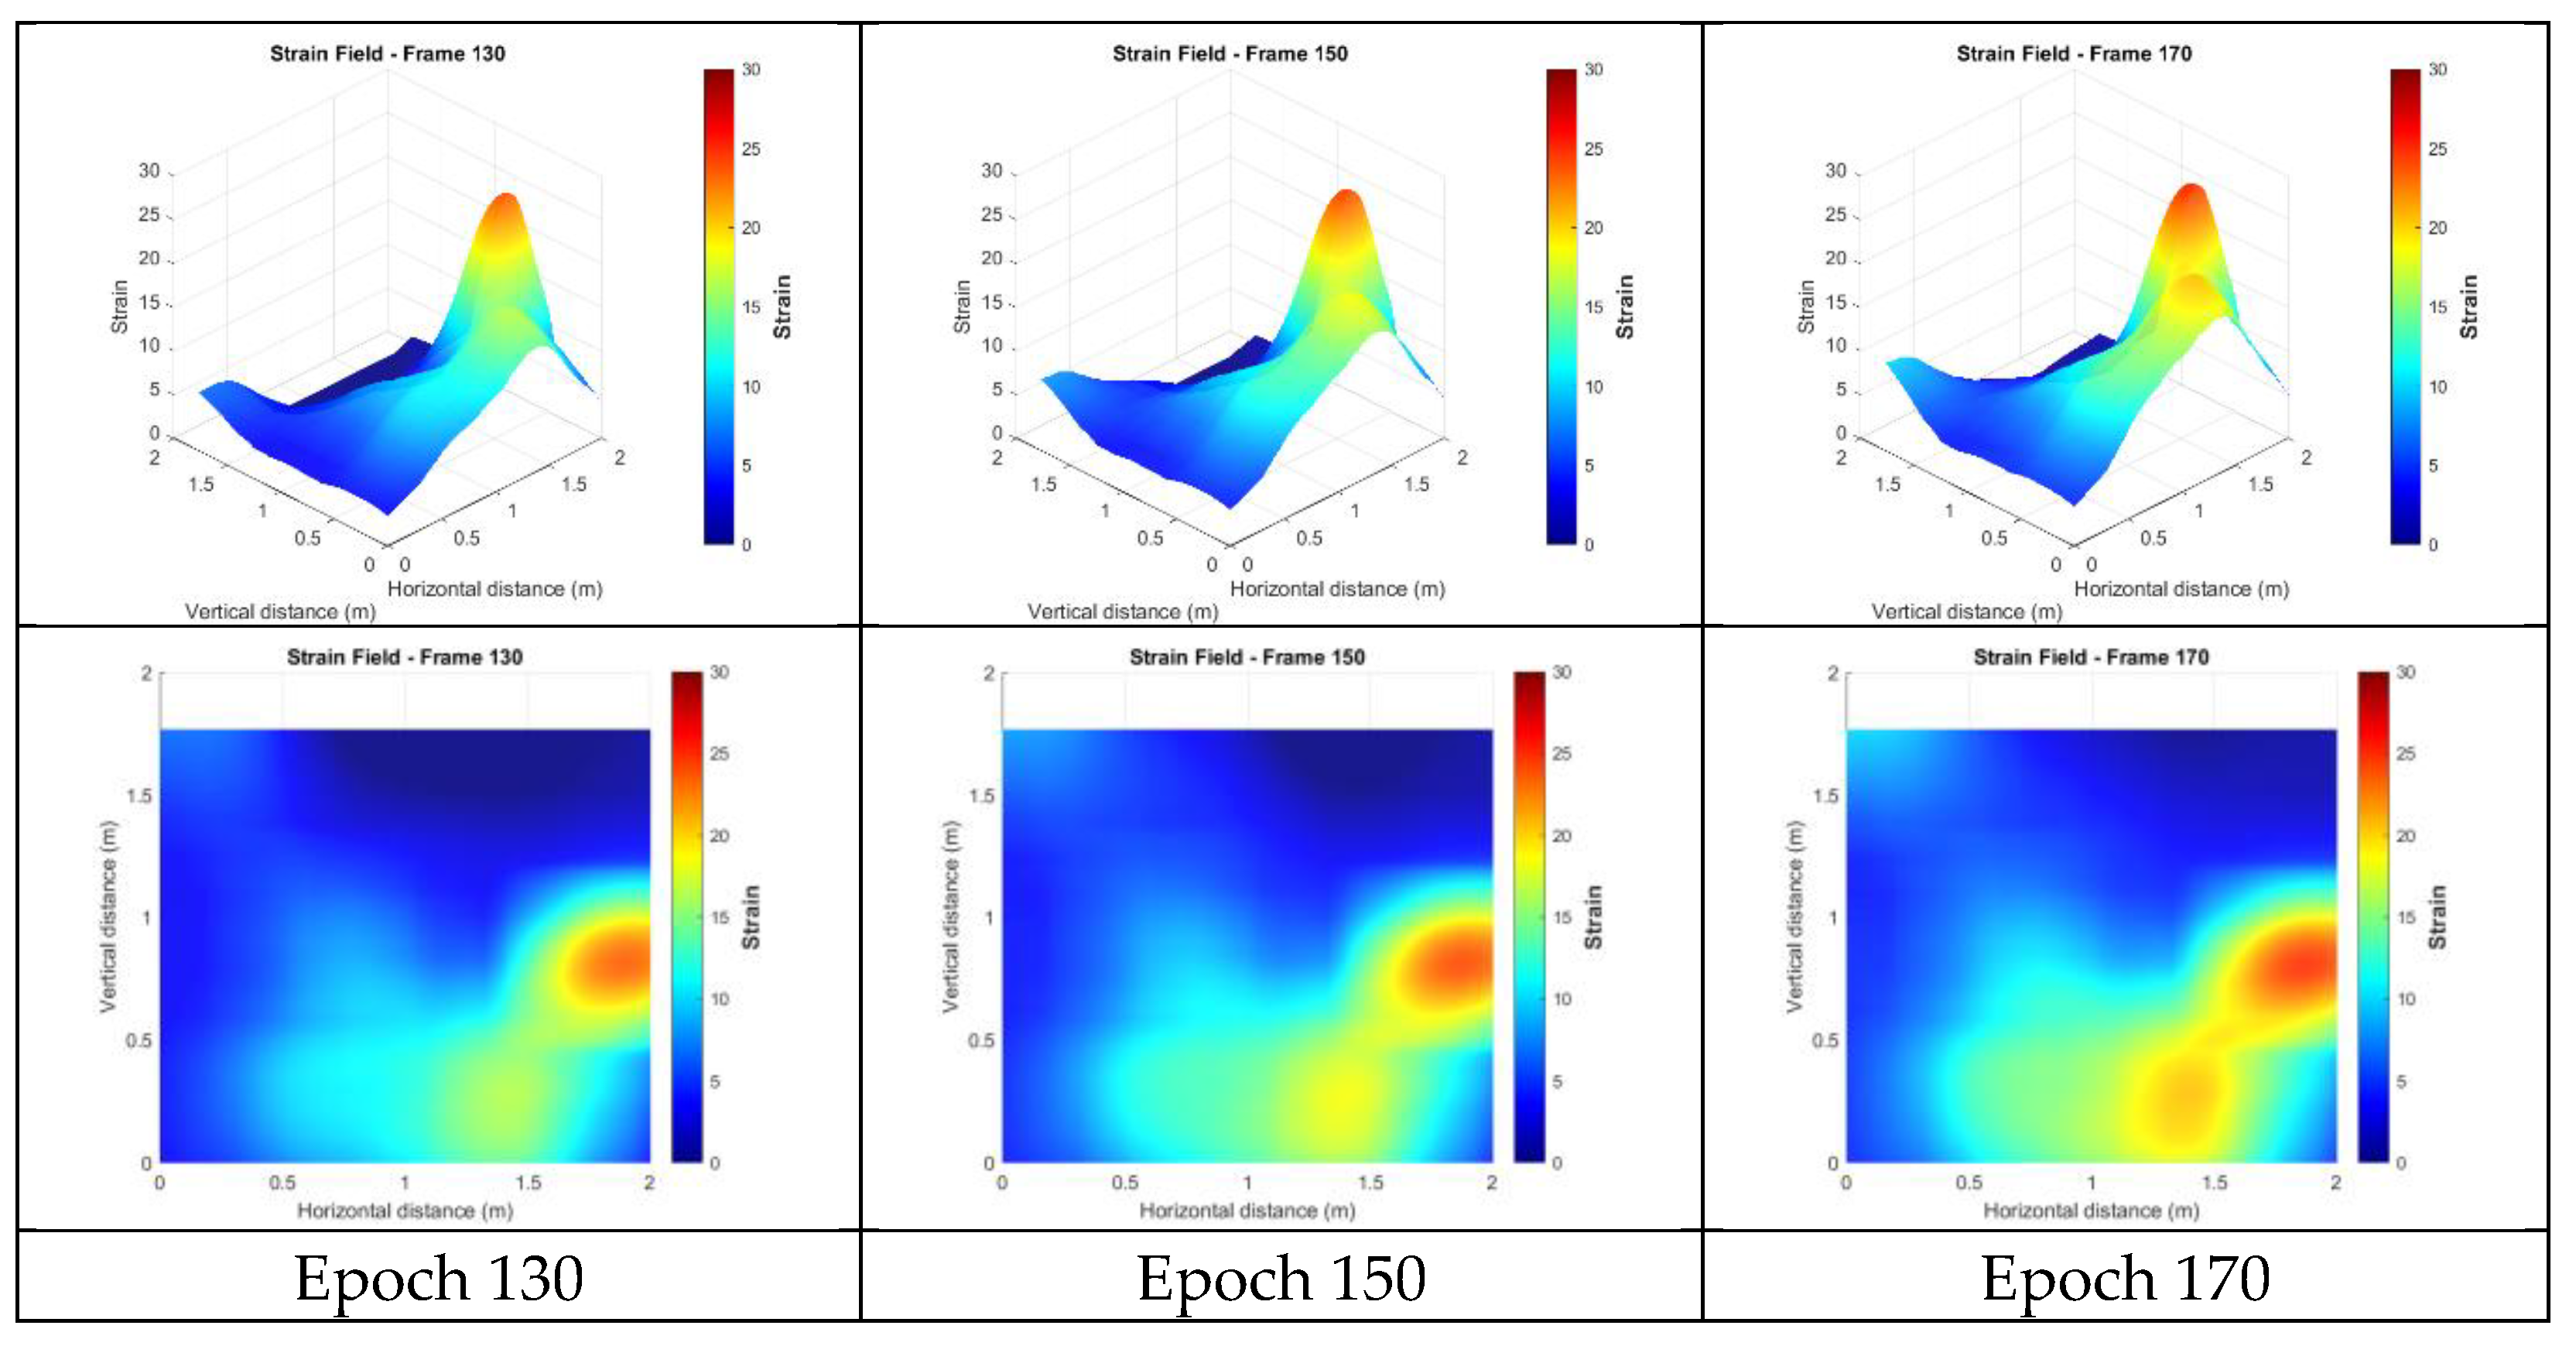
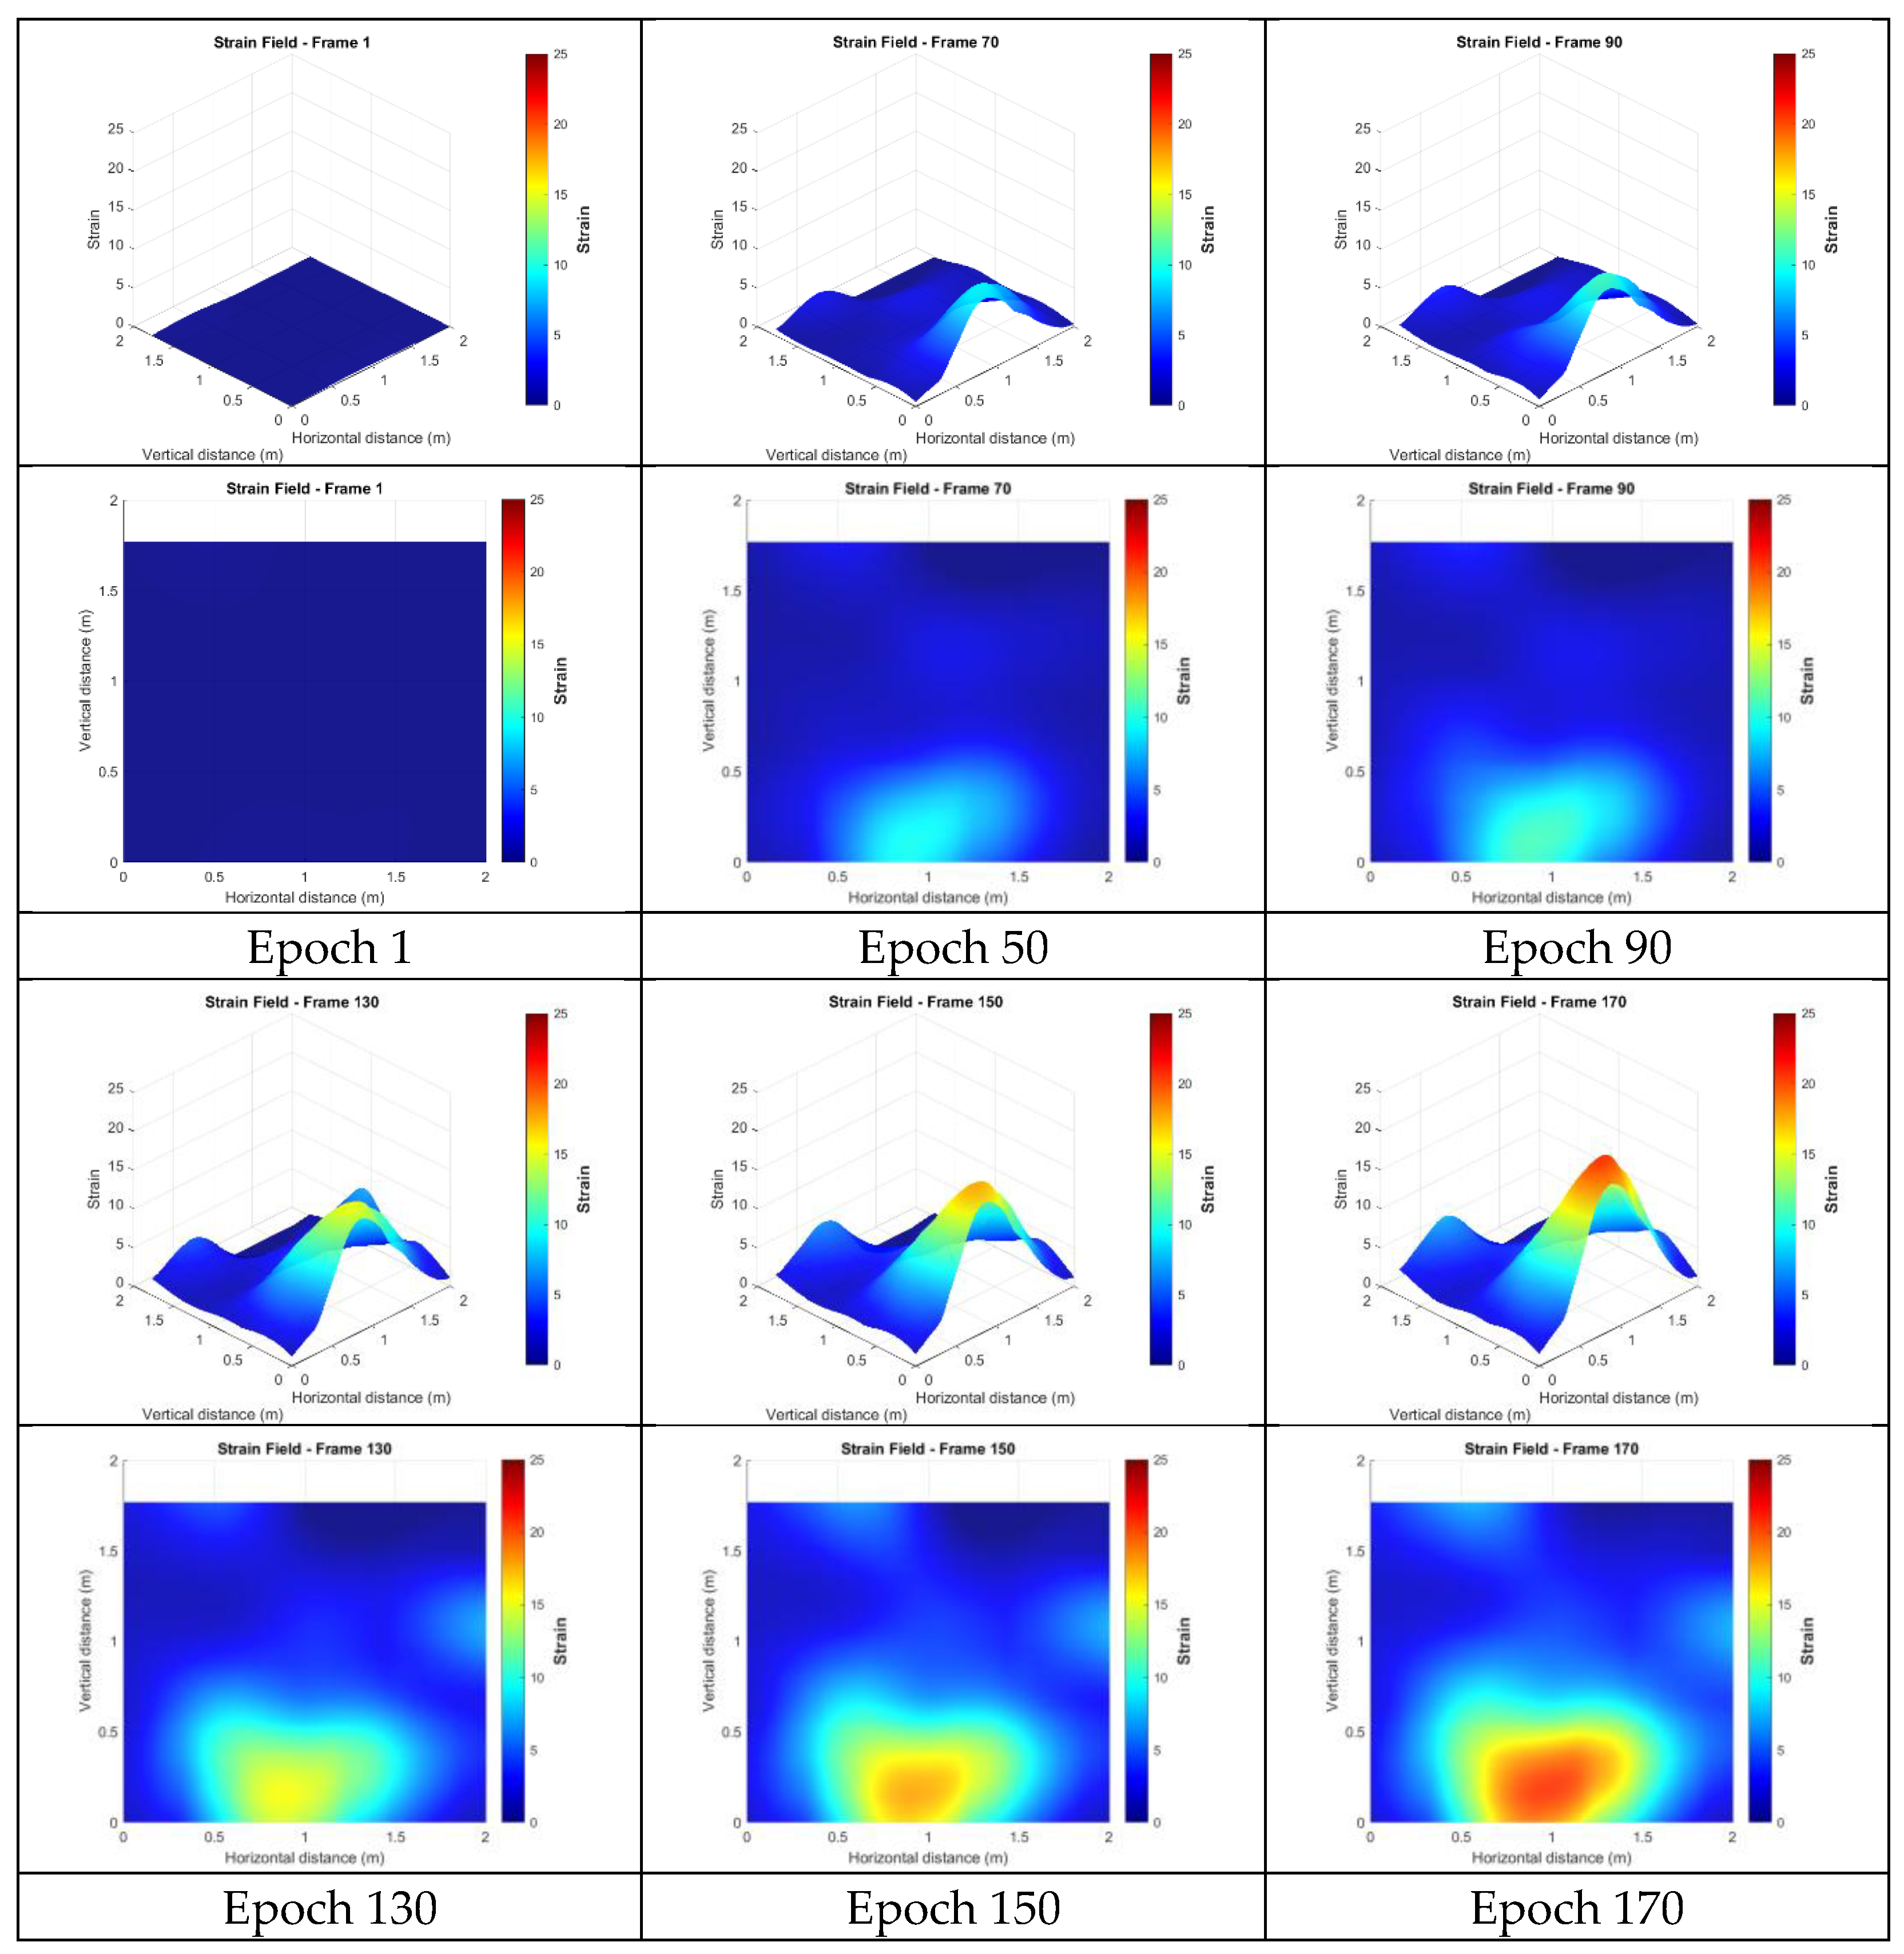
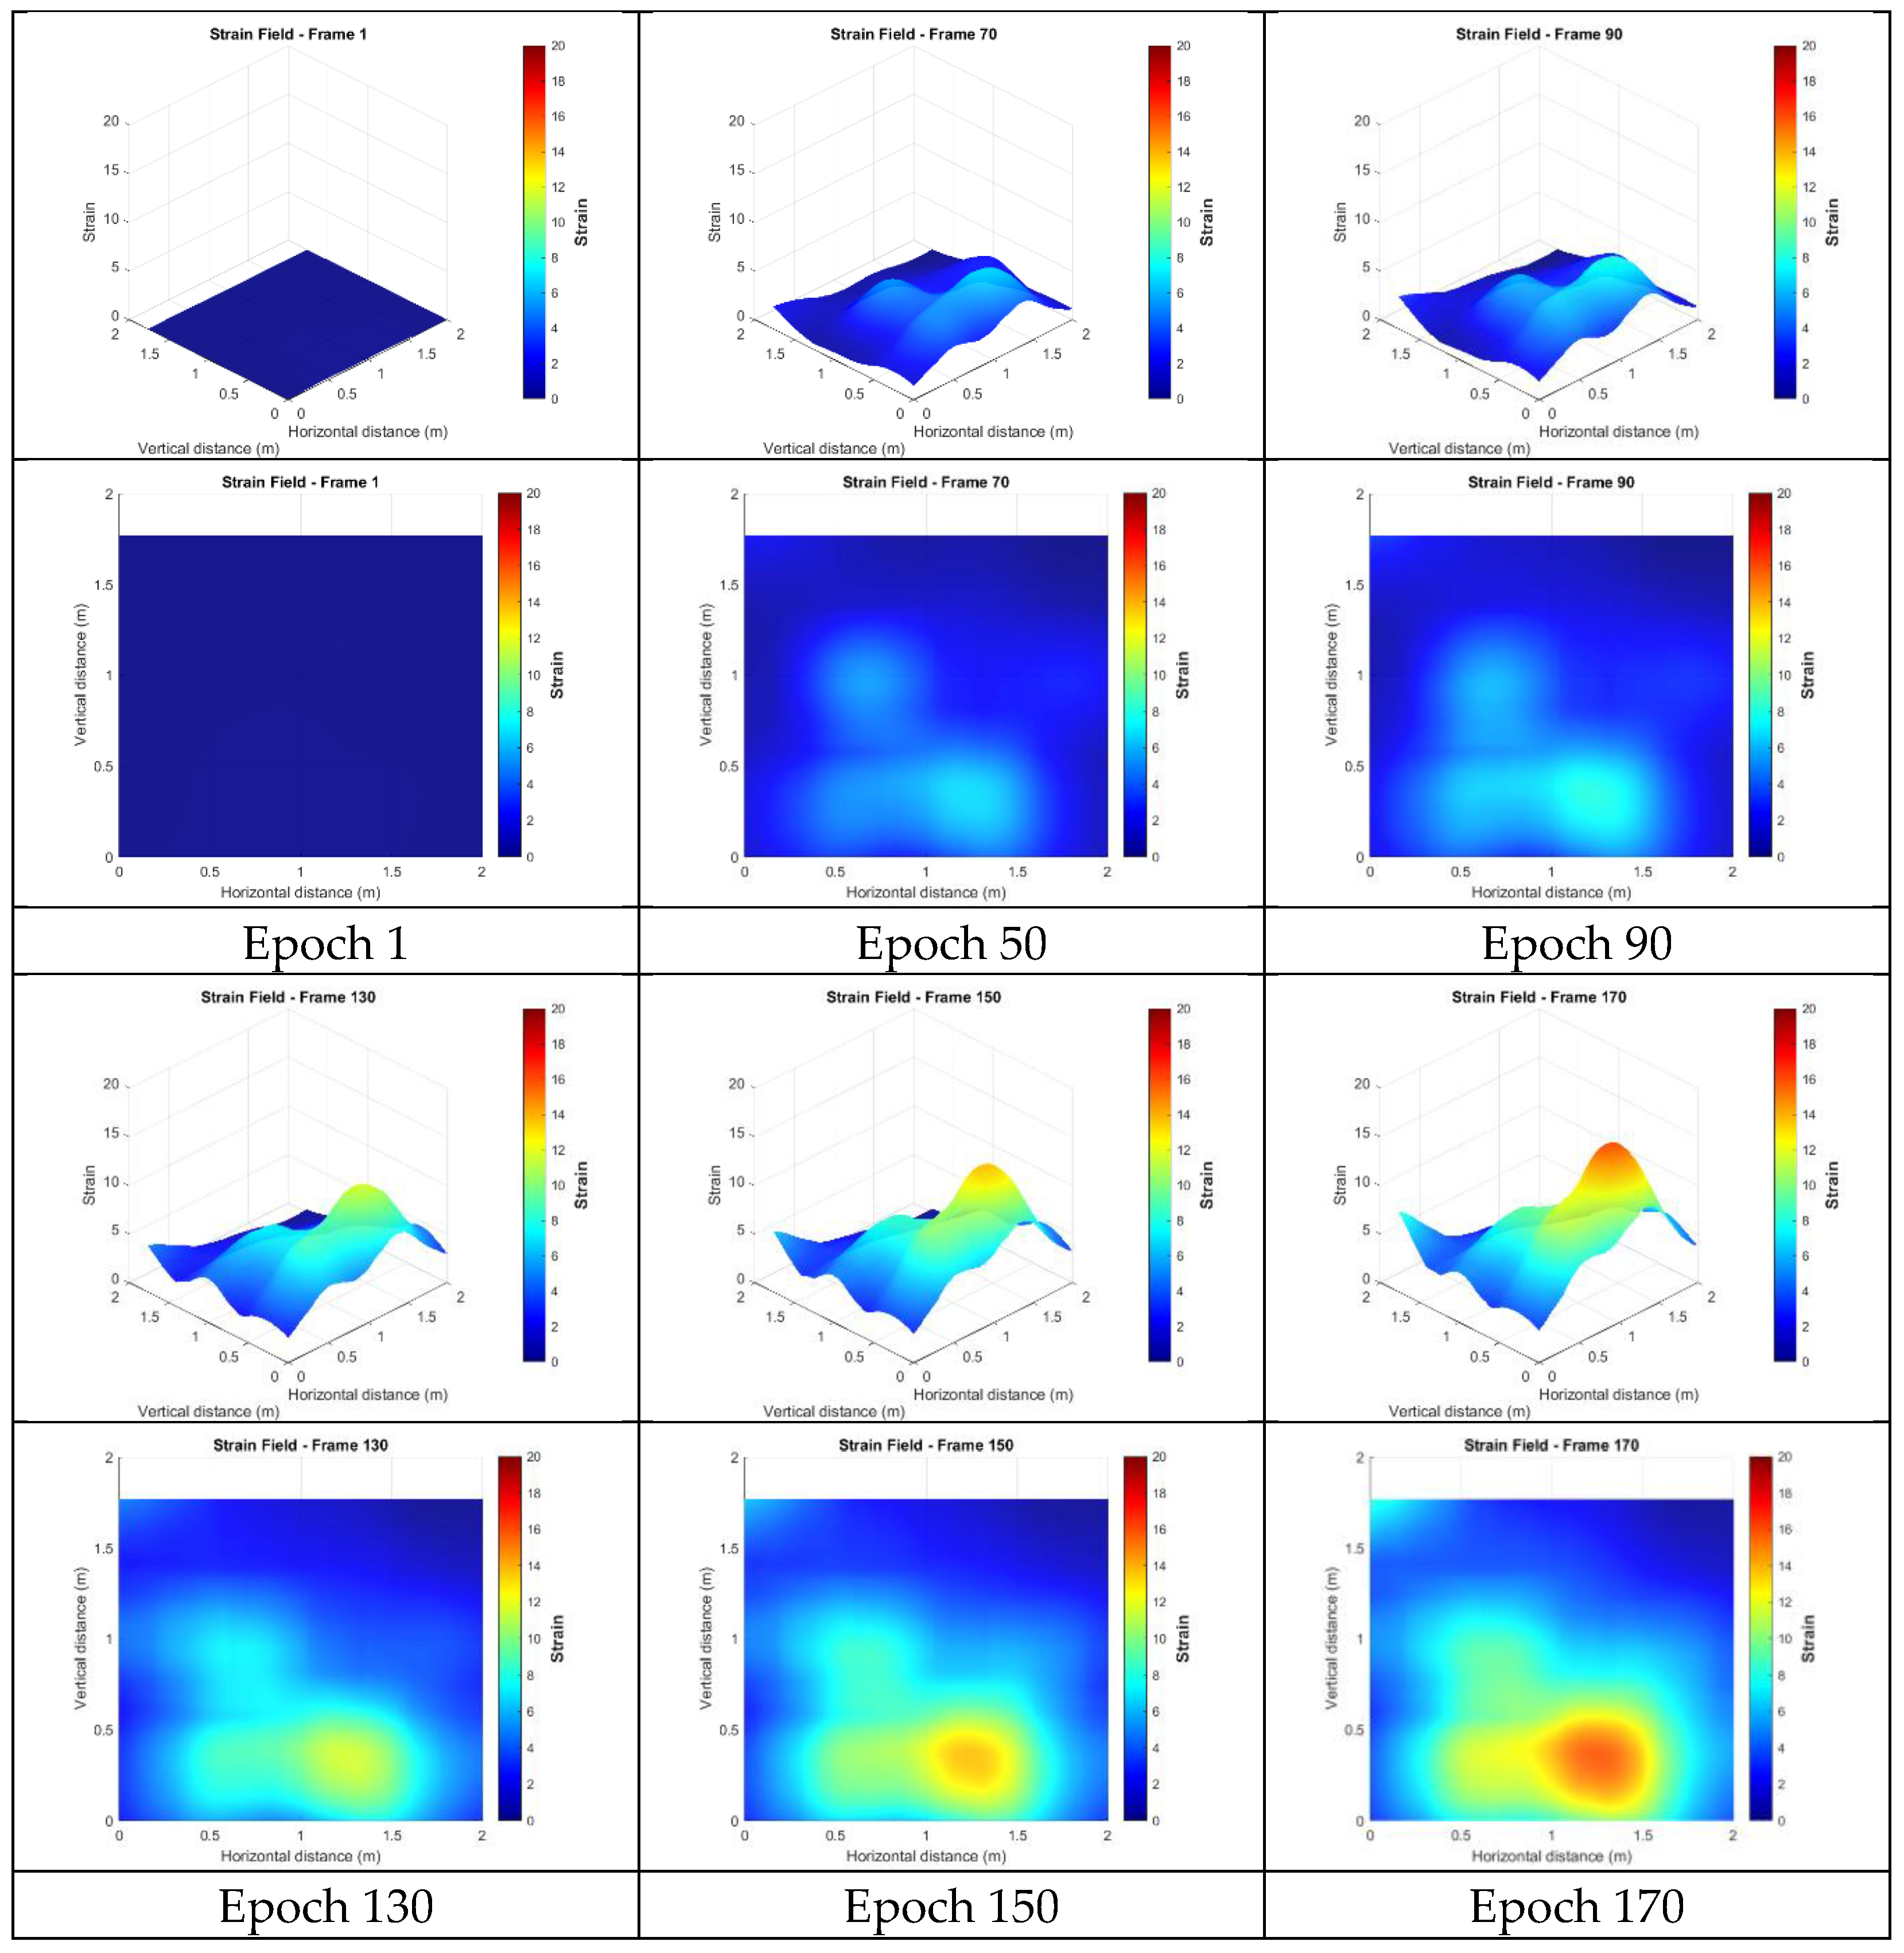
This section presents the strain fields calculated from the targetless-derived 3D points before any filtering was applied. Figure 18 illustrates the strain distributions at epochs 1, 50, 90, 130, 150, and 170. In these figures, red indicates regions of high strain, while blue represents low strain. The results revealed broad, high-strain distributions along the right side and lower edge of the wall, characterized by multiple localized peaks. This pattern suggests that damage may have occurred in these regions, potentially indicating significant cracking on the right side or separation from the surrounding concrete frame. However, the wide distribution and numerous peaks made it challenging to identify precise crack locations. Additionally, a smaller region of high strain was observed in the upper left, potentially indicating damage or separation from the upper concrete frame. The remaining upper areas lacked sufficient feature points, making it hard to confirm whether similar damage occurred in those regions.
In other words, the strain field derived from the unfiltered targetless data was sensitive to positioning errors, making spatio-temporal filtering a critical step to ensure reliable and interpretable strain analysis.

4.4.3. Strains from the Targetless Data After MAD Filtering in the Spatial Domain

This section analyzes the strain fields after the application of MAD filtering to the original targetless data. Because cracks in the wall generally extend horizontally, it was assumed that points at the same elevation should exhibit similar displacement trends. Therefore, the Y direction was divided into 10 cm intervals, and all points within each interval were compared.
For each of the 186 epochs, any point whose displacement in any time segment exceeded five times the MAD of all points in its interval was classified as an outlier and removed. Consequently, 265 erroneous feature points were eliminated, reducing the total from 1192 to 927 points for subsequent strain analysis. The updated spatial distribution of these filtered points is shown in Figure 19b.
In Figure 20, after removing the erroneous points, the extreme strain values previously observed near the right boundary were eliminated, resulting in a noticeably different strain distribution in the lower-central region. The strain values in the lower area became more pronounced, with apparent differences in spatial distribution and peak location compared to the unfiltered results. Additionally, the peak strain value decreased from 25.220 to 17.042, representing a more realistic magnitude. However, due to the overall broad distribution of strain variations, it was challenging to precisely identify detailed crack patterns. Nevertheless, the results indicate that more significant deformation behavior occurred in the lower region of the wall.

4.4.4. Strains from the Targetless Data After 1D Convolution Smoothing in the Temporal Domain

This section presents the strain results calculated from the original targetless data without prior MAD filtering, after the application of 1D convolution smoothing to all points (Figure 21). Unlike simply removing erroneous points, 1D convolution offers an alternative strategy by smoothing the displacement data via the temporal domain. This effectively reduces the impact of localized errors and produces a consistently smoother strain field.
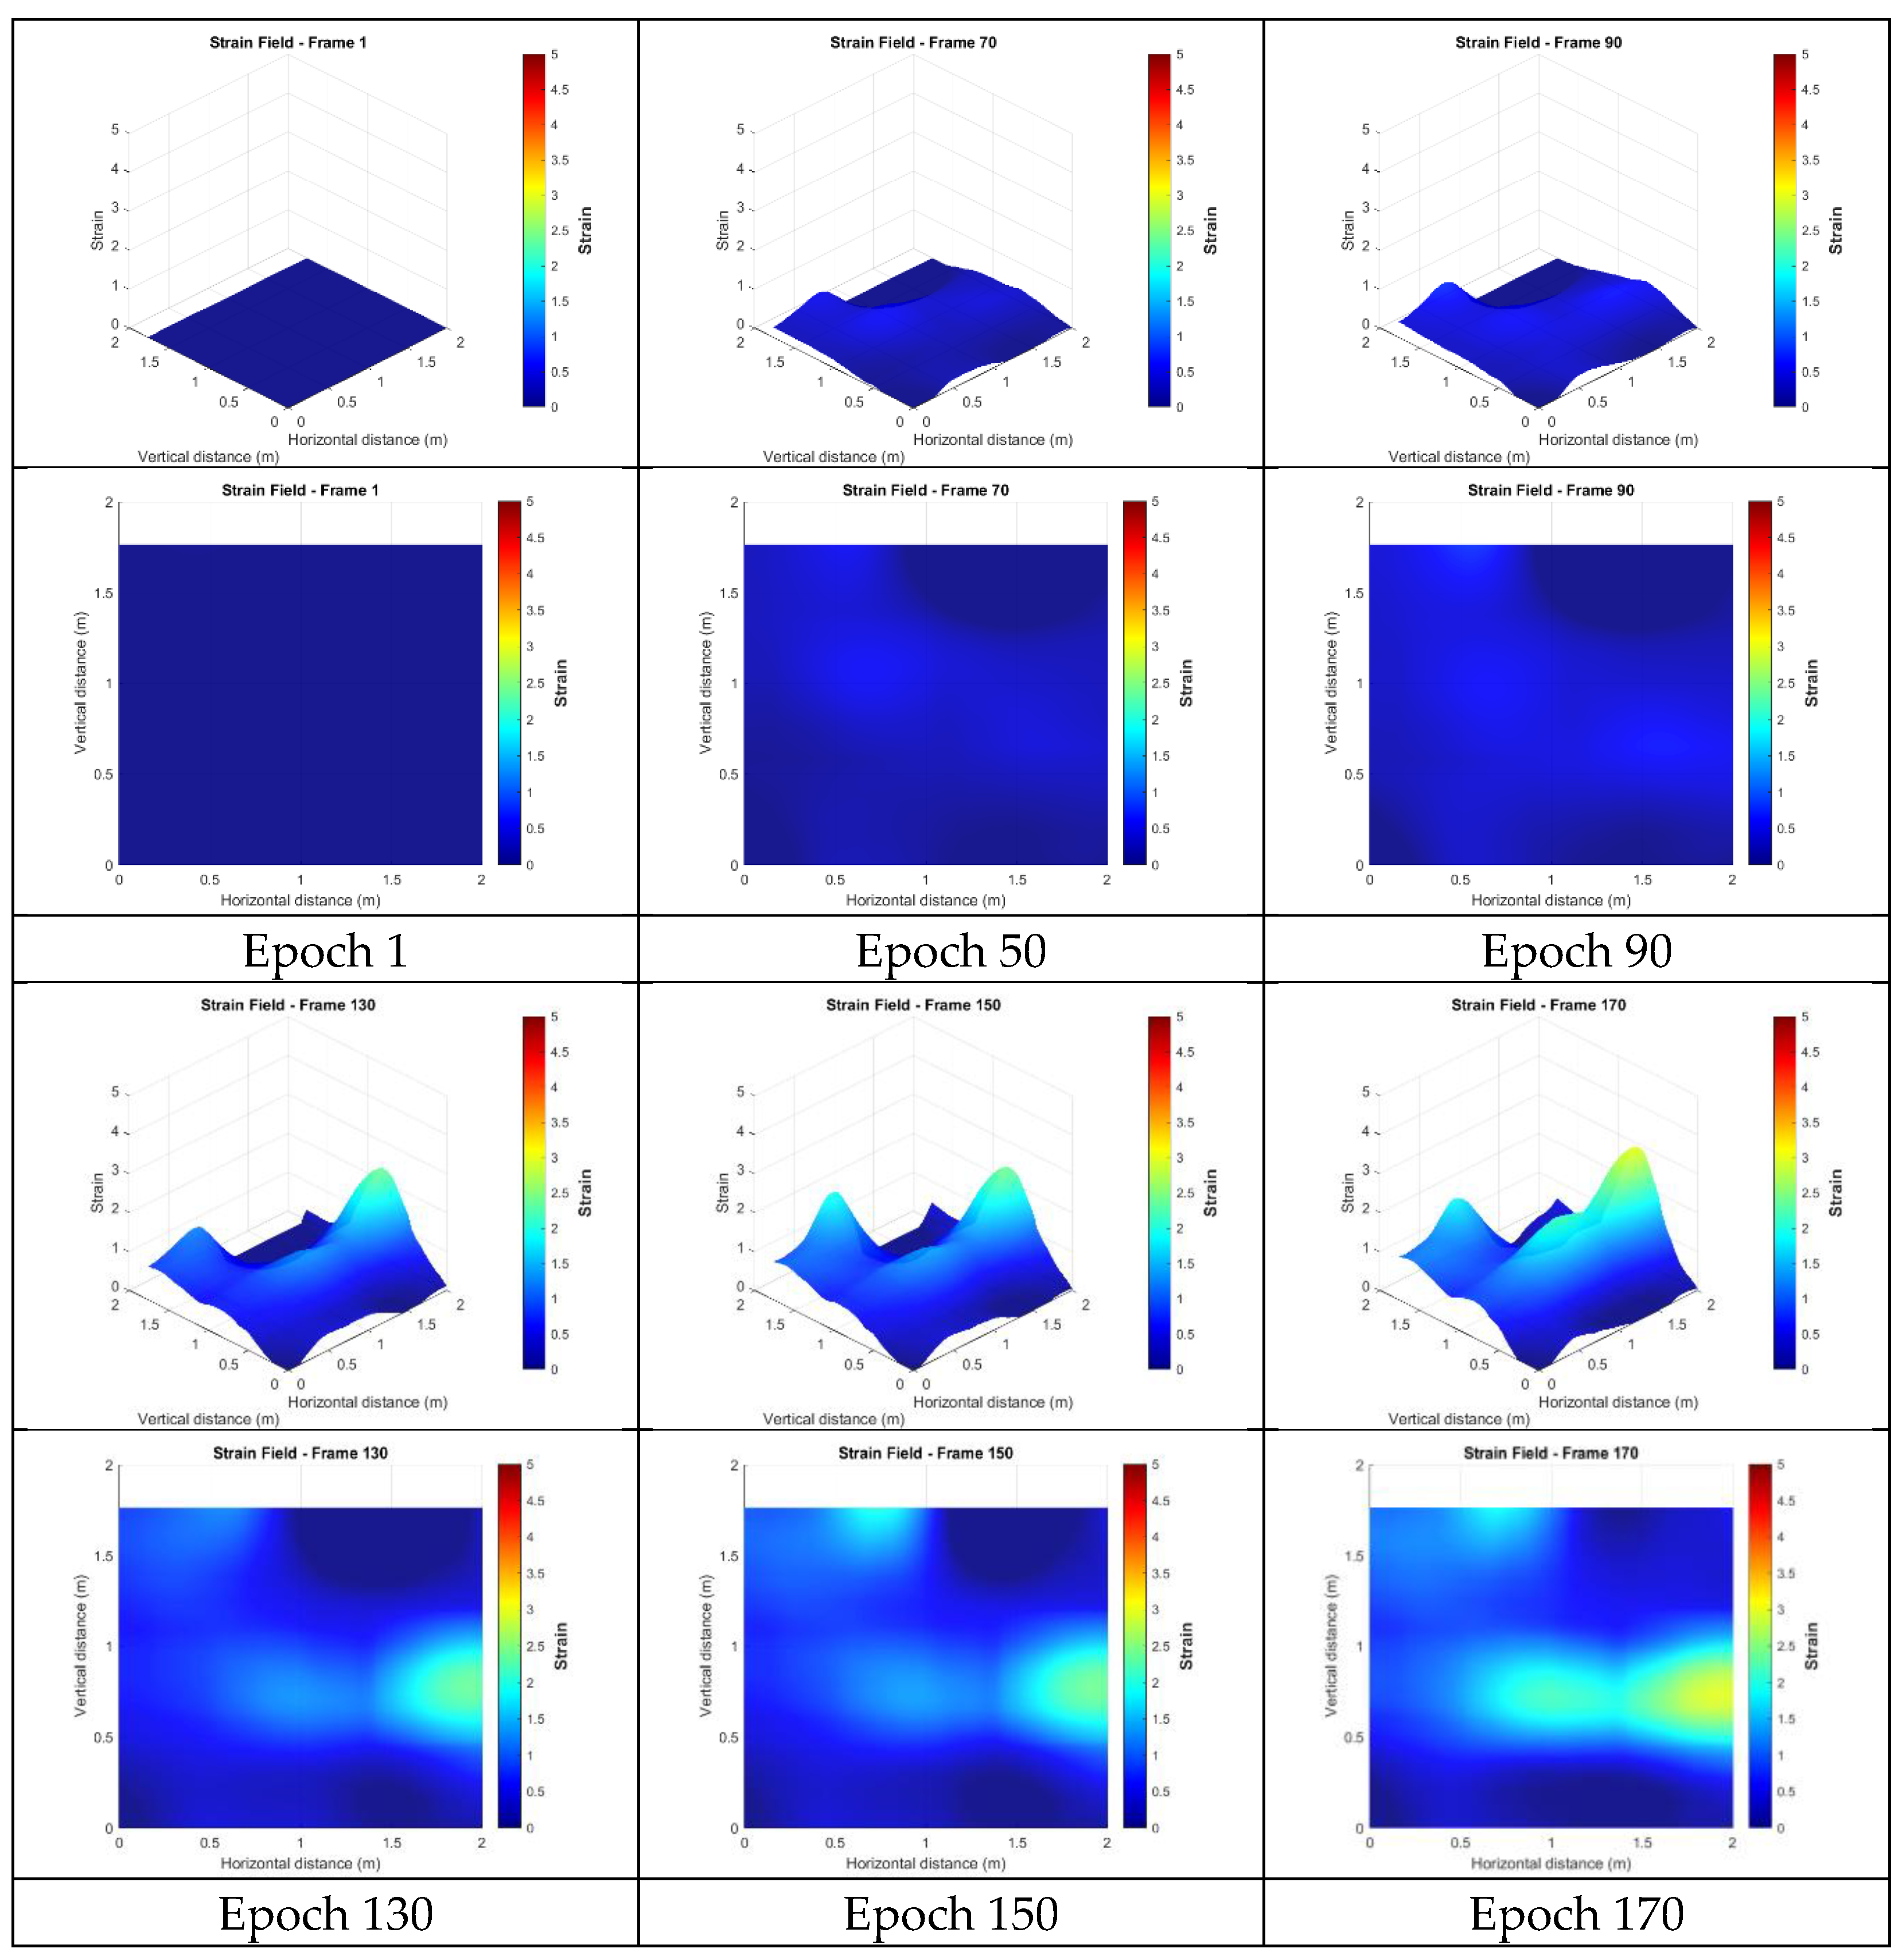
After applying 1D convolution smoothing, the maximum strain value was reduced to 3.931, which aligned more closely with the expected values under realistic deformation conditions. The resulting strain distribution across the wall also differed noticeable from previous analyses. The lower peak region seen in the earlier results disappeared entirely and was replaced by a continuous band of elevated strain extending from the lower-central area toward the right side. This pattern closely corresponded to the largest crack region observed during the physical experiment. Additionally, the upper peak features were preserved, further reinforcing the consistency of these results with the expected deformation behavior of the wall.
Overall, the 1D convolution-smoothed strain field exhibited a more continuous and coherent deformation pattern, effectively addressing the limitations of the previous MAD filtering approach, which relied solely on removing outliers without smoothing the remaining data.

4.4.5. Strains from the Targetless Data After Representative Point Selection

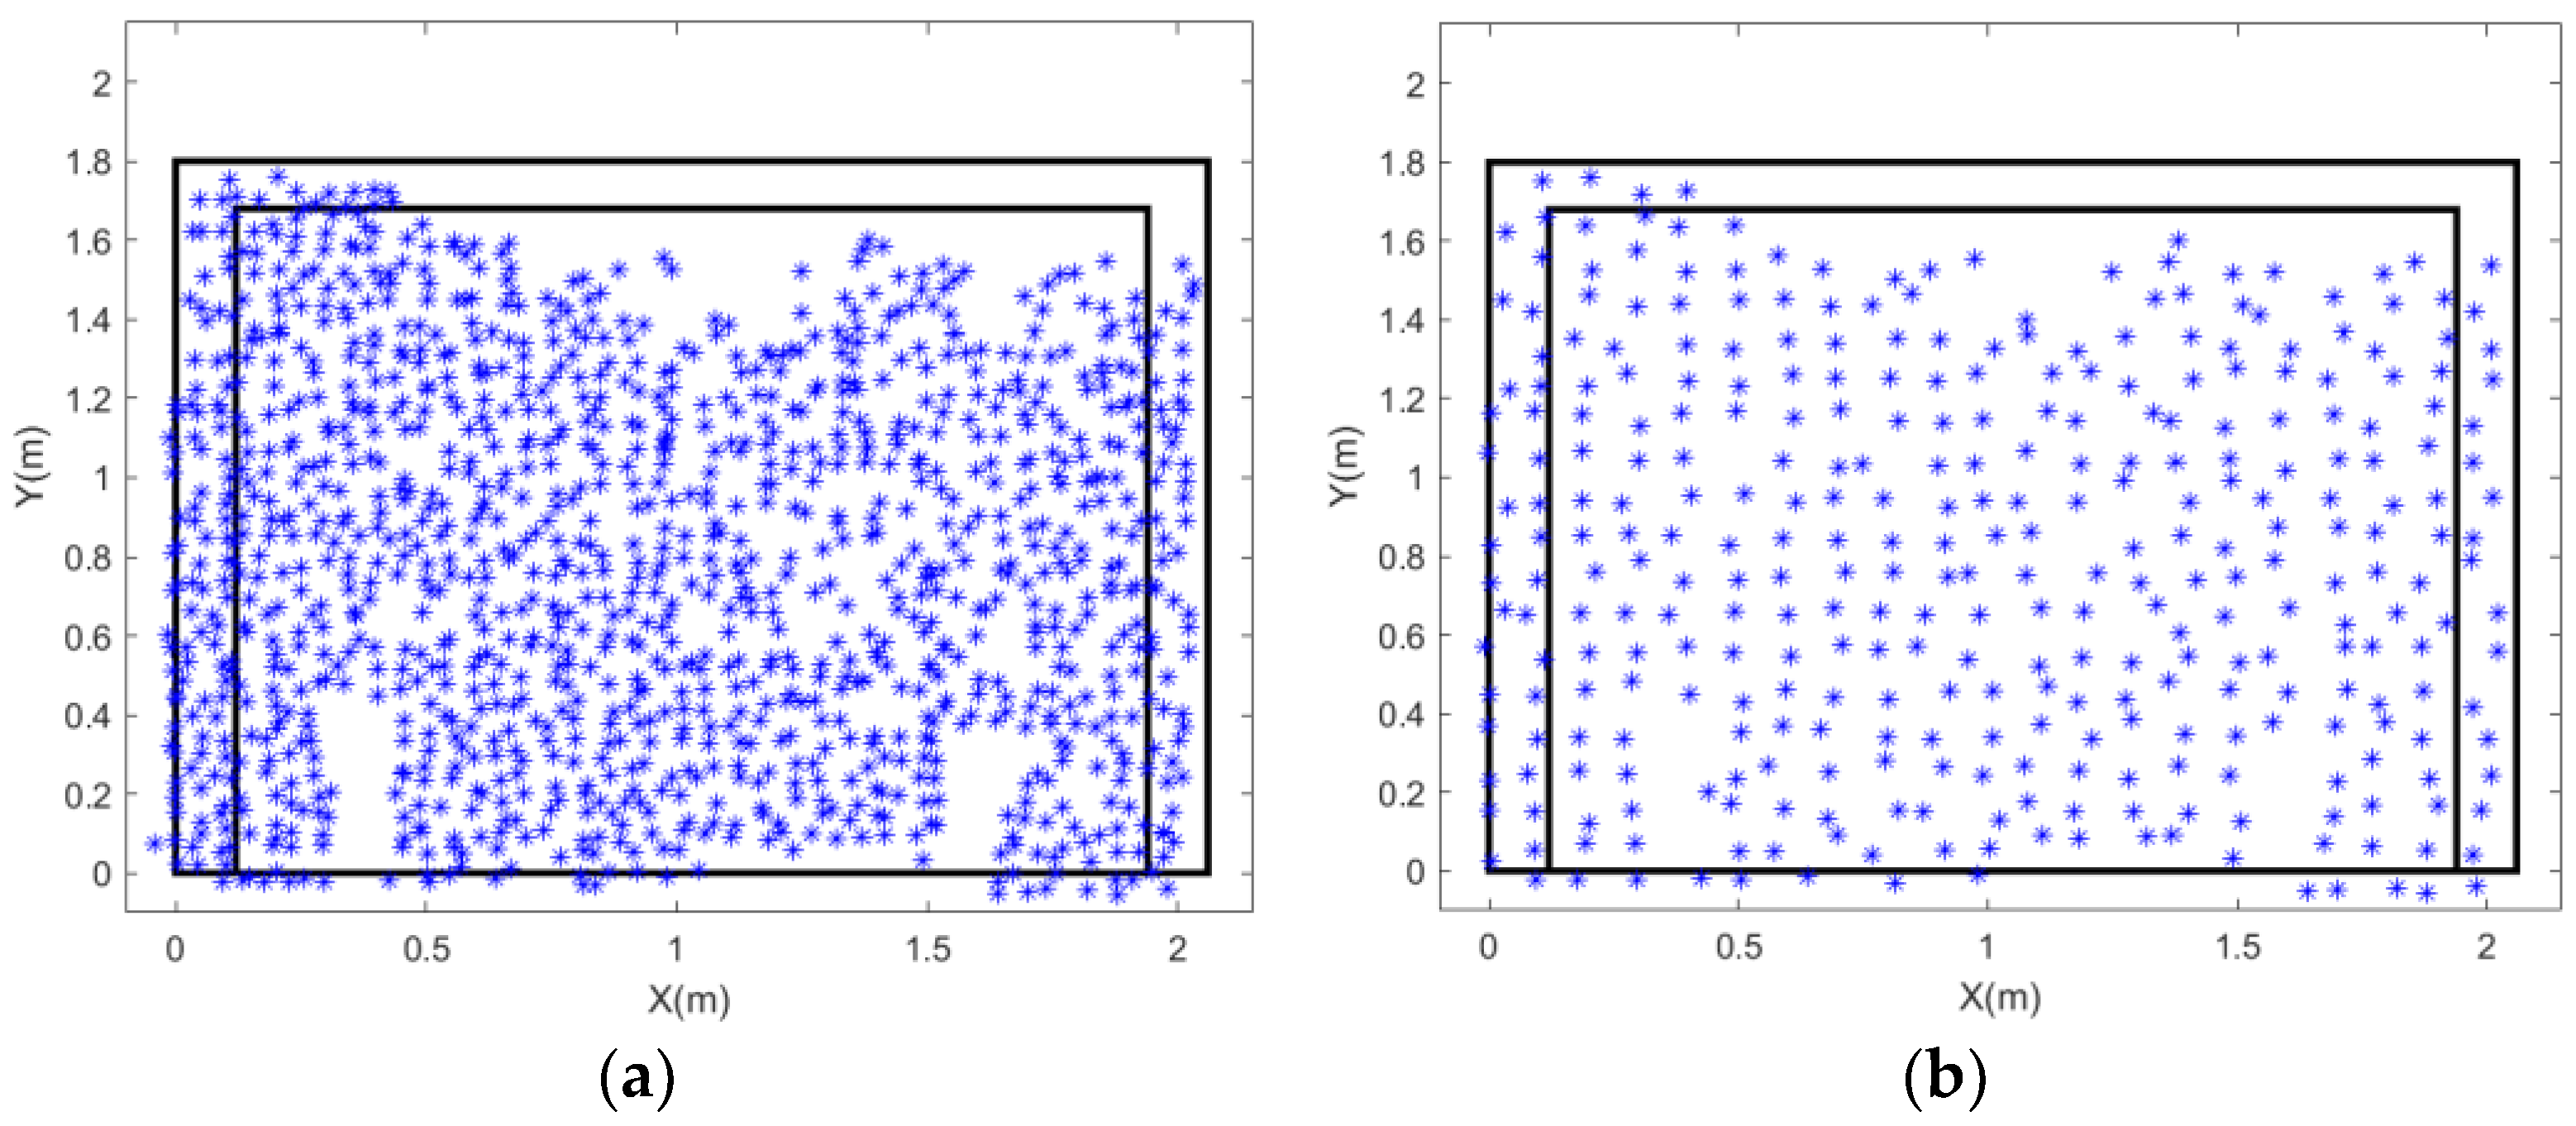
In this analysis, MAD filtering or 1D convolution smoothing was not applied; instead, only representative point selection was used by sampling the original 1192 targetless points at 10 cm × 10 cm intervals to achieve a more uniform spatial distribution. This sampling strategy was designed to increase the average distance between the points, thereby reducing the impact of positional uncertainty when calculating strain. Figure 22 compares the targetless data before and after representative point selection. Following this process, the number of points was reduced from 1192 to 345.
However, because no error filtering was applied, the results showed a slight improvement compared to the ones obtained from the unfiltered data improvement from 25.220 to 22.035) (Figure 23). The simple point selection still retained many erroneous points, resulting in a maximum strain value of 22.035, which was outside a reasonable range. This made it difficult to identify meaningful correlations with the actual crack patterns. These results underscore the importance of integrating multiple filtering methods to achieve reliable and interpretable strain analysis.

4.4.6. Strains from the Targetless Data After Spatio-Temporal Filtering

Based on the preceding analyses, the final spatio-temporal filtering approach involved three sequential steps. First, MAD filtering was applied to remove erroneous points. Second, 1D convolution smoothing was performed on the remaining data. Third, 10 cm interval sampling was applied to achieve a more uniform point distribution, resulting in 321 points used for strain calculation. The spatial distribution of these filtered points is shown in Figure 24.
This proposed spatio-temporal filtering strategy resulted in a maximum strain value of 2.712, which was the lowest among all the tested configurations and well within a reasonable range for strain measurement. The resulting strain field displayed significantly fewer unexplained peaks than in previous analyses. While the upper peak features were further smoothed and retained only subtle indications, the overall strain distribution highlighted major crack locations, closely matching the observed crack patterns on the actual wall surface. Overall, compared to earlier approaches that applied filtering and smoothing independently, this integrated strategy provided a more realistic and interpretable representation of crack development in the wall experiment, as illustrated in Figure 25. Figure 26 shows the actual crack locations in the image space, providing clear evidence supporting the correctness of the calculated strain fields.
A comprehensive comparison of all methods indicates that 1D convolution smoothing proved particularly effective at reducing unrealistic strain peaks. As shown in Table 3, the unprocessed data exhibited peak strain values around 25.220, which were not only unrealistically high but also obscured finer details elsewhere on the wall. The 1D convolution approach effectively suppressed these spurious peaks resulting from unstable, noisy displacements. Furthermore, when combined with other point filtering methods before smoothing, the results achieved even lower maximum strain values and better correspondence with the actual crack locations. This demonstrates that removing erroneous points is essential for achieving accurate and meaningful strain analysis.
While the local deformation may appear moderate, the overall rigid-body out-of-plane displacement was not negligible, particularly as the wall approached failure. This rigid-body motion contributes to differences between the Green–Lagrange and engineering strain formulations. An example comparing the Green–Lagrange and engineering strain fields of the tested specimen is shown in Figure 27.

5. Conclusions and Future Works

This study demonstrates that reliable strain fields can be derived from targetless photogrammetric point clouds by applying a combination of spatial and temporal filtering strategies. The computed strain peaks showed strong spatial correlation with the locations of major cracks observed during the experiment, affirming the method’s capability to capture meaningful structural deformation. Notably, the results closely aligned with those obtained using conventional target-based approaches.
A dense 3D deformation field was reconstructed using automatic extraction of natural feature points and sequential image matching. The targetless data were subsequently processed through a three-stage filtering pipeline comprising MAD filtering, 1D convolutional smoothing, and spatial resampling. The corresponding maximum strain values after each step were 25.220, 17.042, 3.930, and 22.035, respectively. Among them, the strain value after 1D convolution smoothing (3.930) was in close agreement with the target-based result (3.873). When all three filtering steps were integrated, the final maximum strain was further reduced to 2.712, indicating effective suppression of spurious peaks and improved data stability for deformation analysis.
The findings also highlight the inherent limitations of strain-based crack initiation detection, stemming from the stochastic nature of material properties and the fact that strain is derived from the gradient of the deformation field. Even slight fluctuations in the deformation can result in large variations in strain. As a result, crack initiation cannot be reliably inferred from a fixed strain threshold. Both targetless and target-based approaches showed reduced sensitivity to minor cracks, and spatial inconsistency in point distribution introduced further uncertainty. Nevertheless, strain mapping remains a valuable di-agnostic tool: while minor crack detection is limited, regions of pronounced strain con-centration can be effectively identified, providing a reliable warning of imminent structural failure.
The proposed photogrammetry-based method is effective in capturing large cracks critical to structural safety, but its relatively coarse feature points make it less sensitive to small cracks that mainly affect durability. High-resolution DIC, while less practical for large-scale 3D field measurements, is better suited for detecting fine crack initiation. A complementary use of both techniques could therefore provide a more comprehensive SHM approach.
In summary, this study confirms that the proposed filtering framework enables targetless photogrammetry to achieve high-accuracy 3D displacement measurements and generate strain fields that are consistent with those produced using traditional target-based techniques. In contrast to manual target placement—which is labor-intensive, prone to marker detachment, and often suffers from uneven spatial distribution—the targetless method offers improved robustness, scalability, and operational efficiency, making it a promising solution for practical structural health monitoring applications.
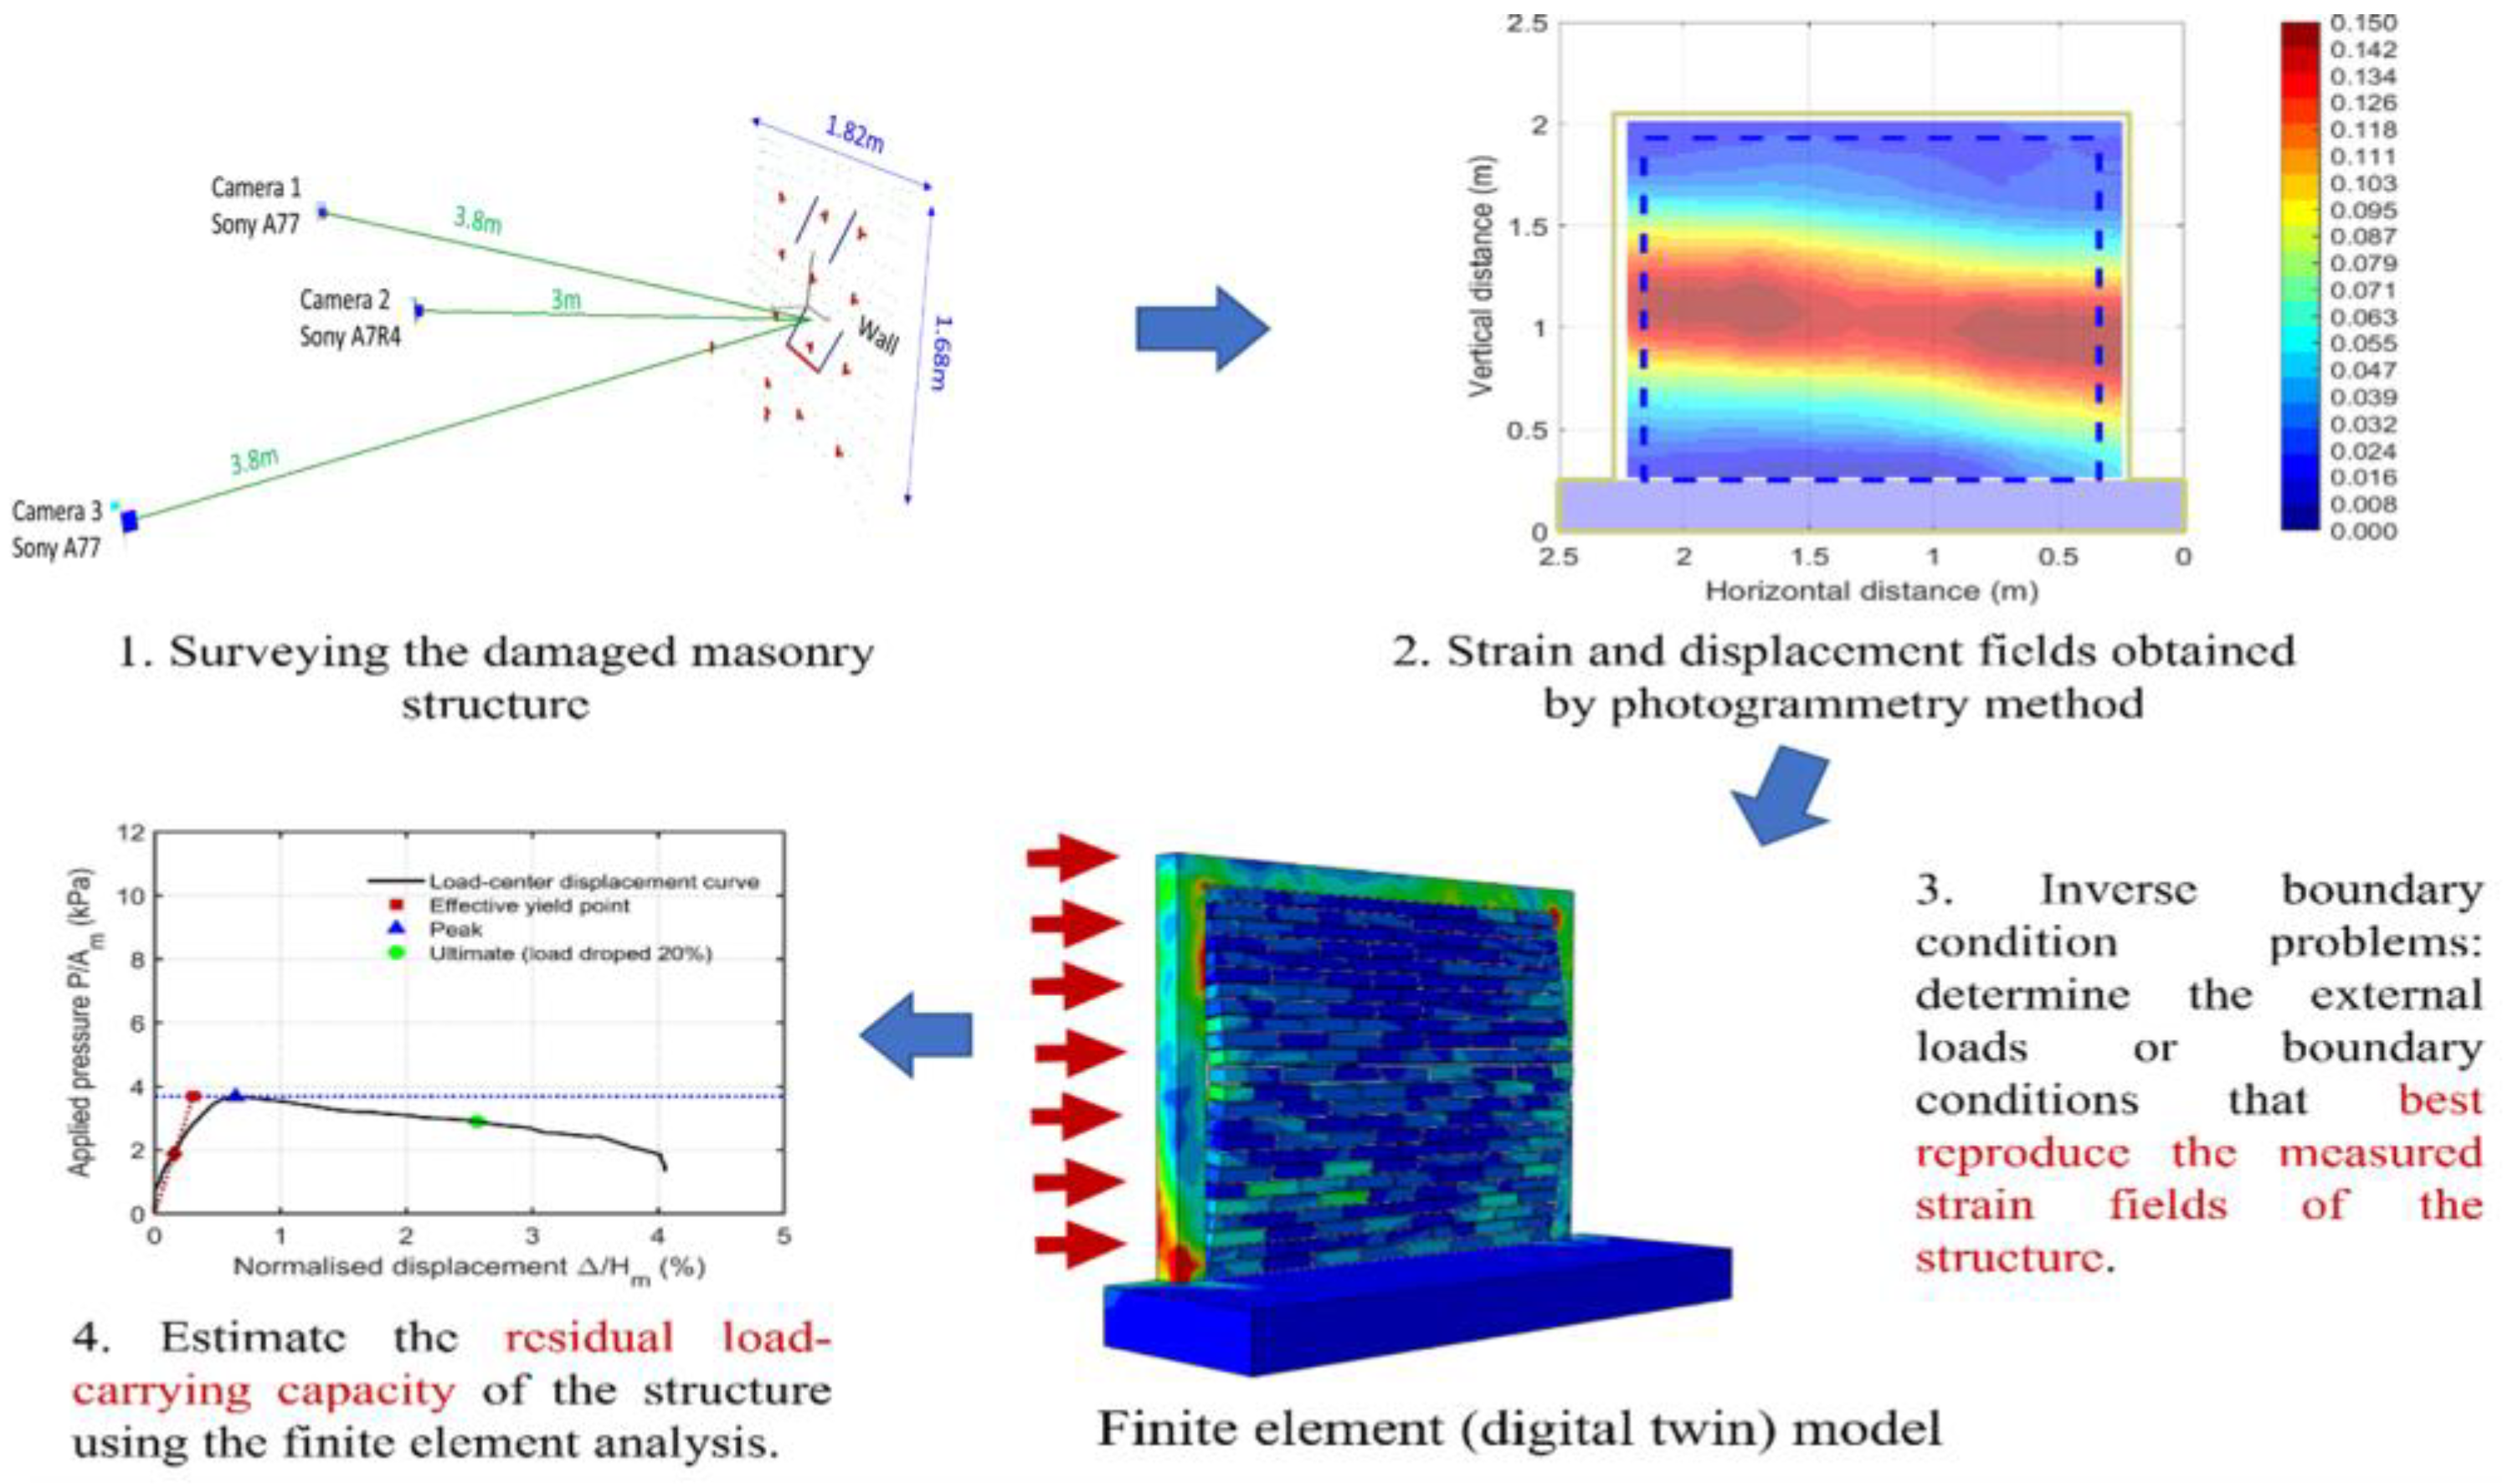
Future research directions may include evaluating alternative feature detection and matching algorithms to reduce the impact of lighting variations and enhance point stability, and testing the generalizability of the method across different structural materials and configurations under similar loading conditions; we consider the integration of measured strain fields with finite-element models to be the most important step toward practical deployment. This integration enables not only damage localization but also estimation of the residual load-carrying capacity of structures, which helps provide a more comprehensive understanding of crack initiation and propagation mechanisms. Accordingly, a conceptual workflow has been added to illustrate (Figure 28) how the measured strain fields can be incorporated into FE models for both capacity assessment and damage localization.

Author Contributions

Conceptualization, T.-A.T.; Methodology, T.-A.T.; Software, K.-H.M.; Validation, K.-H.M. and T.Y.P.Y.; Writing—original draft, T.-A.T.; Writing—review and editing, K.-H.M. and T.Y.P.Y.; Supervision, T.-A.T. All authors have read and agreed to the published version of the manuscript.

Funding

This research was partially supported by Ministry of Interior (MOI) of Taiwan under project no. 114PC050201A.

Data Availability Statement

The data presented in this study are available from the corresponding author upon reasonable request.

Conflicts of Interest

The authors declare no conflicts of interest.

References

  1. Remondino, F.; Spera, M.G.; Nocerino, E.; Menna, F.; Nex, F. State of the art in high density image matching. Photogramm. Rec. 2014, 29, 144–166. [Google Scholar] [CrossRef]
  2. Al-Ruzouq, R.; Dabous, S.A.; Junaid, M.T.; Hosny, F. Nondestructive deformation measurements and crack assessment of concrete structure using close-range photogrammetry. Results Eng. 2023, 18, 101058. [Google Scholar] [CrossRef]
  3. Mojsilović, N.; Salmanpour, A.H. Masonry walls subjected to in-plane cyclic loading: Application of digital image correlation for deformation field measurement. Int. J. Mason. Res. Innov. 2016, 1, 165–187. [Google Scholar] [CrossRef]
  4. Whiteman, T.; Lichti, D.D.; Chandler, I. Measurement of deflections in concrete beams by close-range digital photogrammetry. Geospatial Theory Process. Appl. 2002, 34, 40–48. [Google Scholar]
  5. Valença, J.; Júlio, E.N.B.S.; Araújo, H.J. Applications of photogrammetry to structural assessment. Exp. Tech. 2012, 36, 71–81. [Google Scholar] [CrossRef]
  6. González-Aguilera, D.; Gómez-Lahoz, J.; Sánchez, J. A new approach for structural monitoring of large dams with a three-dimensional laser scanner. Sensors 2008, 8, 5866–5883. [Google Scholar] [CrossRef]
  7. Liebold, F.; Maas, H.G. Advanced spatio-temporal filtering techniques for photogrammetric image sequence analysis in civil engineering material testing. ISPRS J. Photogramm. Remote Sens. 2016, 111, 13–21. [Google Scholar] [CrossRef]
  8. Liebold, F.; Maas, H.G.; Deutsch, J. Photogrammetric determination of 3D crack opening vectors from 3D displacement fields. ISPRS J. Photogramm. Remote Sens. 2020, 164, 1–10. [Google Scholar] [CrossRef]
  9. Liebold, F.; Bergmann, S.; Bosbach, S.; Adam, V.; Marx, S.; Claßen, M.; Hegger, J.; Maas, H.G. Photogrammetric image sequence analysis for deformation measurement and crack detection applied to a shear test on a carbon reinforced concrete member. In Proceedings of the International Symposium of the International Federation for Structural Concrete, Istanbul, Turkey, 5–7 June 2023; pp. 1273–1282. [Google Scholar]
  10. Wang, Y.; Qin, L. Progress of Application of Digital Image Correlation Method (DIC) in Civil Engineering. In Proceedings of the 2023 International Seminar on Computer Science and Engineering Technology (SCSET), New York, NY, USA, 29–30 April 2023; pp. 1–5. [Google Scholar]
  11. Bolhassani, M.; Rajaram, S.; Hamid, A.A.; Kontsos, A.; Bartoli, I. Damage detection of concrete masonry structures by enhancing deformation measurement using DIC. In Proceedings of the Nondestructive Characterization and Monitoring of Advanced Materials, Aerospace, and Civil Infrastructure 2016, Las Vegas, NV, USA, 22 April 2016; Volume 9804, pp. 227–240. [Google Scholar]
  12. Shih, M.H.; Sung, W.P.; Tung, S.H. Using the digital image correlation technique to measure the mode shape of a cantilever beam. In Proceedings of the 10th International Conference on Computational Structures Technology, Valencia, Spain, 4–17 September 2010; Volume 65. [Google Scholar]
  13. Shih, M.H.; Sung, W.P. Application of digital image correlation method for analysing crack variation of reinforced concrete beams. Sadhana 2013, 38, 723–741. [Google Scholar] [CrossRef]
  14. Tung, S.H.; Weng, M.C.; Shih, M.H. Measuring the in situ deformation of retaining walls by the digital image correlation method. Eng. Geol. 2013, 166, 116–126. [Google Scholar] [CrossRef]
  15. Zaya, M.A.; Adam, S.M.; Abdulrahman, F.H. Application of digital image correlation method in materials-testing and measurements: A review. J. Duhok Univ. 2023, 26, 145–167. [Google Scholar]
  16. Shih, M.H.; Tung, S.H.; Sung, W.P. Applying the integrated digital image correlation method to detect stress measurements in precision drilling. J. Test. Eval. 2024, 52, 25–41. [Google Scholar] [CrossRef]
  17. Chen, Y.; Fan, Y.; Zhang, G.; Wang, Q.; Li, S.; Wang, Z.; Dong, M. Speckle noise suppression of a reconstructed image in digital holography based on the BM3D improved convolutional neural network. Appl. Opt. 2024, 63, 6000–6011. [Google Scholar] [CrossRef]
  18. Zhou, Y.; Zuo, Q.; Chen, N.; Zhou, L.; Yang, B.; Liu, Z.; Liu, Y.; Tang, L.; Dong, S.; Jiang, Z. Transformer based deep learning for digital image correlation. Opt. Lasers Eng. 2025, 184, 108568. [Google Scholar] [CrossRef]
  19. Wang, L.; Lei, Z. Deep learning based speckle image super-resolution for digital image correlation measurement. Opt. Laser Technol. 2025, 181, 111746. [Google Scholar]
  20. Bay, H.; Tuytelaars, T.; Van Gool, L. Surf: Speeded up robust features. In Computer Vision–ECCV 2006: 9th European Conference on Computer Vision, Graz, Austria, 7–13 May 2006: Proceedings, Part I 9; Springer: Berlin/Heidelberg, Germany, 2006; pp. 404–417. [Google Scholar]
  21. Brown, D.C. Close-range camera calibration. Photogramm. Eng. Remote Sens. 1971, 37, 855–866. [Google Scholar]
  22. Fraser, C.S.; Hanley, H.B. Developments in close-range photogrammetry for 3D modelling: The iWitness example. Int. Arch. Photogramm. Remote Sens. Spat. Inf. Sci. 2004, 5, 1682–1777. [Google Scholar]
  23. Teo, T. Video-based point cloud generation using multiple action cameras. Int. Arch. Photogramm. Remote Sens. Spat. Inf. Sci. 2015, 40, 55. [Google Scholar] [CrossRef]
  24. Wolf, P.R.; Dewitt, B.A. Elements of Photogrammetry with Applications in GIS, 3rd ed.; McGraw-Hill Higher Education: Columbus, OH, USA, 2000. [Google Scholar]
  25. Debella-Gilo, M.; Kääb, A. Sub-pixel precision image matching for measuring surface displacements on mass movements using normalized cross-correlation. Remote Sens. Environ. 2011, 115, 130–142. [Google Scholar]
  26. Leprince, S.; Barbot, S.; Ayoub, F.; Avouac, J.P. Automatic and precise orthorectification, coregistration, and subpixel correlation of satellite images, application to ground deformation measurements. IEEE Trans. Geosci. Remote Sens. 2007, 45, 1529–1558. [Google Scholar] [CrossRef]
  27. Fung, Y.C.; Tong, P. Classical and Computational Solid Mechanics; World Scientific: Hackensack, NJ, USA, 2001; pp. 525–529. [Google Scholar]
  28. Abdullah, Q.A. Mapping Matters. Photogramm. Eng. Remote Sens. 2009, 75, 1260–1261. [Google Scholar]
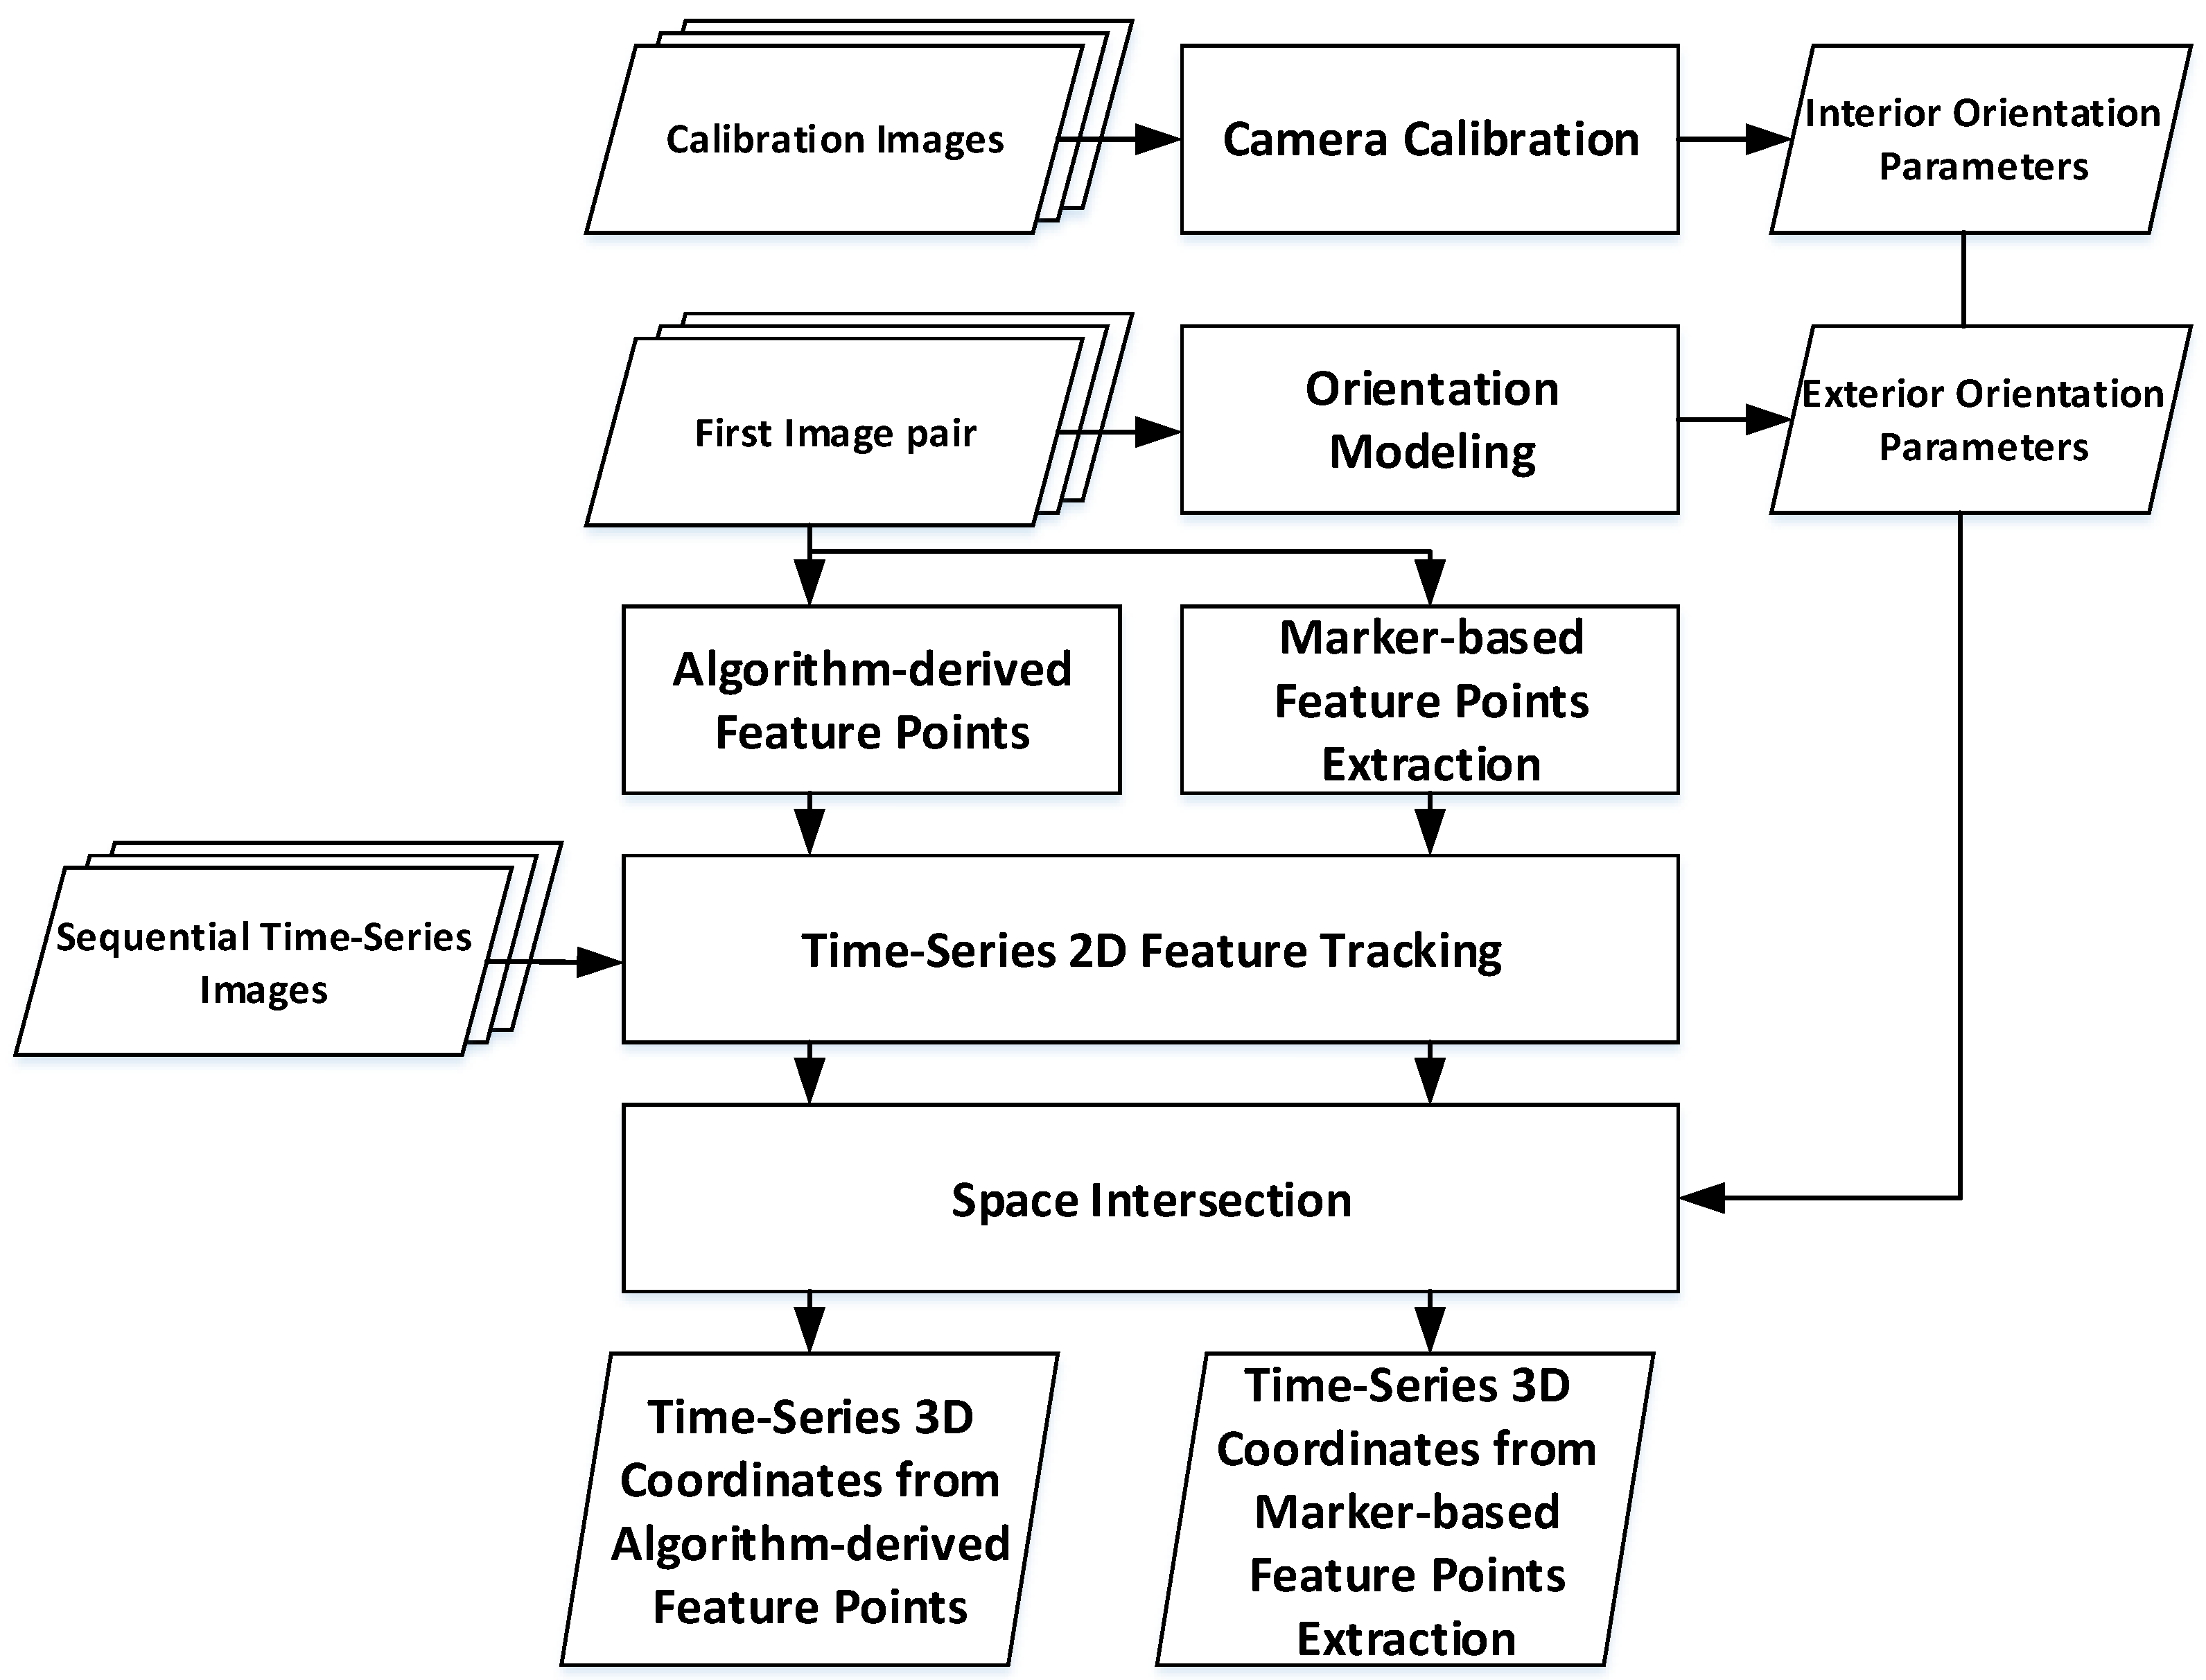
Figure 1. Workflow of this study.
Buildings 15 03584 g001
Figure 2. Comparison of different feature points: (a) marker-based feature points (red-colored cross) and (b) SURF-derived feature points (blue-colored cross).
Buildings 15 03584 g002
Figure 3. Illustration of sequential matching.
Buildings 15 03584 g003
Figure 4. Illustration of spatial filtering using local MAD filtering: (a) local MAD filtering performed within a 10 cm vertical slide window and (b) an example of local MAD filtering (different colors indicate different target points).
Buildings 15 03584 g004
Figure 5. Illustration of temporal filtering using 1D Gaussian convolution.
Buildings 15 03584 g005
Figure 6. Experimental wall: (a) brick wall, (b) GFRP masonry walls, (c) reference image, and (d) post-cracking image.
Buildings 15 03584 g006
Figure 7. Airbag-type hydraulic jack.
Buildings 15 03584 g007
Figure 8. Loading direction (The yellow arrows indicate loading direction).
Buildings 15 03584 g008
Figure 9. Configuration of experiment (The red box indicate the fixed cameras).
Buildings 15 03584 g009
Figure 10. Coordinate system.
Buildings 15 03584 g010
Figure 11. Comparison of photogrammetric-derived 3D points between the target and targetless methods: (a) results of the targetless method and (b) results of the target method.
Buildings 15 03584 g011
Figure 12. Location of the evaluated point for the targetless method (The red boxes indicates the location of evaluated point).
Buildings 15 03584 g012
Figure 13. Location of the evaluated point for the target method (The red boxes indicates the location of evaluated point).
Buildings 15 03584 g013
Figure 14. Comparison of photogrammetric-derived and laser ranger displacements (the red line indicate the regression line): (a) correlation (targetless method) and (b) correlation (target method).
Buildings 15 03584 g014
Figure 15. Strain quality from strain gauge.
Buildings 15 03584 g015
Figure 16. Spatio-temporal filtering for targetless displacement in side view (Y-Z profile): (a) displacements at 1, 90, and 170 epochs (target method); (b) displacements at 1, 90, and 170 epochs (targetless method); (c) results of MAD filtering only (targetless method); (d) results of 1D convolution smoothing only (targetless method); (e) results of representative point selection only (targetless method); and (f) results of the spatio-temporal filtering process (targetless method).
Buildings 15 03584 g016aBuildings 15 03584 g016b
Figure 17. Bending strains from the target data.
Buildings 15 03584 g017
Figure 18. Bending strains from the unfiltered targetless data.
Buildings 15 03584 g018aBuildings 15 03584 g018b
Figure 19. (a) Before MAD filtering (1192 points) and (b) after MAD filtering (927 points).
Buildings 15 03584 g019
Figure 20. Bending strains from the targetless data after MAD filtering.
Buildings 15 03584 g020
Figure 21. Bending strains from the targetless data after 1D convolution smoothing.
Buildings 15 03584 g021
Figure 22. (a) Before representative point selection and (b) after representative point selection.
Buildings 15 03584 g022
Figure 23. Bending strains from the targetless data after representative point selection.
Buildings 15 03584 g023
Figure 24. Before and after representative point selection: (a) results of MAD and (b) after representative point selection.
Buildings 15 03584 g024
Figure 25. Bending strains from the targetless data after spatio-temporal filtering.
Buildings 15 03584 g025
Figure 26. Comparison of strain and crack in image: (a) strain of filtered targetless data and (b) post-cracking image.
Buildings 15 03584 g026
Figure 27. Comparison of strain in image: (a) Green–Lagrange strain and (b) engineering strain.
Buildings 15 03584 g027
Figure 28. A conceptual workflow for an FE mode l (The red arrows illustrate loading direction).
Buildings 15 03584 g028
Table 1. Comparison of the intersection error between the target and targetless methods.
Mean (STD_Intersection)Std (STD_Intersection)
Unit: mm σ x σ y σ x y σ z σ x σ y σ x y σ z
Targetless0.5330.5030.7331.3730.5860.5210.7841.466
Target0.2510.2380.3460.6010.1410.1350.1950.430
Table 2. Comparison of photogrammetric-derived and laser ranger displacements.
Number of ObservationMean ErrorRMSEMax. ErrorR2
Targetless1860.7196 mm0.843 mm1.962 mm0.9992
Target1860.4440 mm0.527 mm1.403 mm0.9996
Table 3. Maximum strain in different processes.
Process LevelMax Strain
Target data3.873
Targetless data without post-processing25.220
Targetless data with MAD filtering17.042
Targetless data with 1D Convolution smoothing3.9305
Targetless data with representative point selection22.035
Targetless with spatio-temporal filtering2.712
Disclaimer/Publisher’s Note: The statements, opinions and data contained in all publications are solely those of the individual author(s) and contributor(s) and not of MDPI and/or the editor(s). MDPI and/or the editor(s) disclaim responsibility for any injury to people or property resulting from any ideas, methods, instructions or products referred to in the content.