Article

Effects of Levels of Realism on Perceived Distance in Computer-Simulated Urban Spaces

Department of Architecture, College of Engineering, Al Yamamah University, King Fahd Branch Rd, Al Qirawan, Riyadh 13541, Saudi Arabia
Buildings 2025, 15(19), 3565; https://doi.org/10.3390/buildings15193565
Submission received: 9 August 2025 / Revised: 21 September 2025 / Accepted: 28 September 2025 / Published: 2 October 2025
(This article belongs to the Section Architectural Design, Urban Science, and Real Estate)

Abstract

Today, as planners and urban designers increasingly rely on computational modeling to study complex urban systems, a methodological shift toward virtual experimentation is discernible because the real-world factors are difficult to control. This paper investigates the effect of the realism of computer simulations on distance perception in urban squares and streets. This study used Autodesk 3ds Max® for modeling and V-Ray for rendering to create systematic variations in distances, with 172 participants providing distance estimates for 216 images. Results indicated that realism had a significant effect on distance perception, increasing estimation accuracy from r = 0.8 to r = 0.94. Lower realism was always associated with an underestimation of the distance, whereas higher realism manifested both overestimation and underestimation. Underestimation is dominant at long distances (>20 m), attributable to a lack of cues, common in low realism; overestimation happens only for short distances (≤20 m) due to high realism. These findings underscore the importance of simulation fidelity for urban designers and planners, enhancing the validity of virtual tools in design, research, and decision-making.

1. Introduction

The perception of space, such as the width of the urban space and the height of the surrounding buildings, determines the level of people’s sense of comfort and safety [1]. These factors are important in the design of communities focusing on creating pedestrian-friendly environments [2]. Some previous research confirmed the influence of levels of perception of users of urban spaces on their territorial behavior [3]. Since most studies depend on perceived distances rather than objective ones, it is essential to understand how people judge distances, specifically in virtual research procedures.
It is established that although cities are living organisms with many unquantifiable variables, simulations are used as an analytical tool to isolate various perceptual variables in a controlled environment; the fact that this study’s findings are consistent with those obtained in real-world experiments validates the process. This method reduces the gap between rigid experimental settings and urban lively reality. It aims at extracting the replicable perception variables that can lead to improvements in design practices [4].
Empirical research is challenged by the complex and intricate nature of urban environments. According to the literature of urban planning and design, investigating urban environments poses significant research challenges due to the presence of numerous intertwining variables, be they physical, social, or psychological. Therefore, this study uses computer simulation as a method to control the research procedure, as ratified by previous research, to select focus variables and exclude the confounding ones.
Previous research has shown that computer simulation is a reliable protocol to study urban phenomena. This is reflected in the works of Cui et al. [5] and Trossman Haifler et al. [6]. This research employed an experiment that isolated the variables of level of realism, distance, and distance orientation within computer-simulated urban spaces’ settings. The research experiment involved building these urban spaces and manipulating variable levels to discover correlations or differences caused by these variations [7,8,9], Figure 1.
Prior research on distance perception suggested that people often misjudge distances in real-world contexts, either underestimating or overestimating them [10], and noted that this phenomenon extends to computer-simulated environments, but more drastically, as asserted by Nguyen et al. [11]. Realism, defined as the degree of accuracy that makes simulations resemble real-life situations, is suspected to affect the perception of distance. However, to the best of our knowledge, there is no study that has investigated how different levels of realism influence the perception of distance in simulated urban spaces.
A systematic review of the prior literature reveals fragmented insights. Studies that used low realism [12,13,14] confounded accurate perceptions because of a lack of scale cues. Photorealistic studies [11] confirmed distance compression but concluded that realism is constant or linear, which needed verification. Psychophysical dominance is evident in distance paradigms in urban studies [15,16], in which texture and enclosure influence distance perception, yet none incorporated levels of realism, and few used controlled urban variables. Distance studies on realism per se [17,18] yielded divergent results, potentially due to a lack of control on realism level. This evaluation confirms a valid gap in systematic, graded explorations of realism’s effects on urban distance perception, which our study addresses via controlled variations.

1.1. Practical Context and Relevance

This study fills a void between environmental psychology and urban simulation approaches. It provides a foundation to improve the fidelity of virtual tools widely adopted during design processes, public participation, and policy decisions in response to the increased challenges associated with urbanization [19]. The findings of the current study are particularly relevant for architects, urban designers, and urban planners, who work with simulations to prototype and evaluate urban environments, and can help toward generating more accurate estimations regarding perception in planning practice [20,21].
Community involvement may indirectly benefit from improved participatory design practice, but the focus is to improve professional tools to minimize perceptual biases in planning and design [22,23]. The study simulates static rendered images of urban space (rather than navigated virtual reality environments) to control variation in realism and distance cues without participant navigation variables [24]. Although this approach sacrifices dynamic interaction, it provides better experimental control, consistent with common simulation setups used in urban design previews [25].

1.2. Research Questions

  • Main Question: How does the level of realism influence perceived distance in simulated urban spaces?
  • Secondary questions:
    • What is the relationship between perceived and objective distance?
    • What differences might exist between perceived width, height, or depth in simulated urban spaces?

1.3. Research Significance

This research is important for several reasons. Urban environments are known for their intricate complexity, a strength that presents significant challenges for empirical research [18,26]. As a result, simulations become central to understanding how objective distances are perceived. Furthermore, the simulated environments range from very low levels of realism, such as those created with colored pencils [27], to very high levels with the use of software like Autodesk 3ds-Max Ver. 2024, and the V-Ray 7 rendering engine [28].
Previous research offered divergent evidence on realism’s influence, often limited by binary (high/low) manipulations rather than graded levels, non-urban contexts, or insufficient controls for variables like enclosure and orientation [18], concluded minimal effects using wireframes vs. panoramas. Kunz et al. [18] found a significant impact, suggesting quality of graphics as a cause, prompting this work to answer how. Low-realism proponents, Al-Kodmany [29] and Lange [30], emphasized that the level of realism depends on the purpose, and high realism for projects oriented to design. This underscores the gap in understanding realism’s role for urban simulations, thereby provoking a need for this work.
In the previous literature, the realism level has been operationalized in various ways, often based on qualitative visual fidelity measurements, including geometric fidelity, material textures, lighting, and context, which is a basis for real-world representations of scenes. An example is Ferwerda’s [31] minimal tripartite taxonomy: functional realism, photorealism, and physical realism (as detailed in the literature review section), which this study adopts as its operational framework. Other authors quantify realism in a binary sense: Thompson et al. [17], operationalized it as high-quality panoramas (photorealistic) versus low-texture graphics or wireframes (functional), whereas Kunz et al. [18] defined it in terms of graphics quality levels (e.g., polygon count and shading complexity) and quantified effects on distance estimation accuracy.
Supporters of low realism operationalize it for efficiency (e.g., approximate models assessed by computational cost relative to the information they produce), but also recognize the limitations of validation, such as perceptual errors [32]. The method of this current study provides a well-defined operational definition, treating LOR as an ordinal variable on a four-level scale: (1) masses (basic geometry and functional), (2) masses with lines (added scale cues), (3) textured (photorealistic details), and (4) articulated (physical with furniture/illumination via V-Ray). This was quantitatively measured by the incremental addition of visual elements and validated through correlation improvements (r = 0.83 to 0.94) and ANOVA (p < 0.001). This is in line with and further backs up earlier binary measures (e.g., Thompson et al. [17]; Kunz et al. [18]); however, despite being effective, the question remains whether it is optimal for comparability, while addressing urban-specific gaps by controlling the effect of enclosure and orientation in the simulations, ensuring enhanced validity without methodological divergence.
Furthermore, this research also highlights the importance of realism in the research methodology used to investigate variables such as level of complexity, architectural articulation, texture, colors, and enclosure in simulated urban environments [33]. Examining the variable complexity, for instance, cannot be accomplished with the use of black ink sketches where shadows and shades are distorted, distances and 3D geometric values are poorly presented, and clues of scale references are absent. Examining urban enclosure is weakened when surfaces offer no indicators of scale. If realism does affect distance judgment, some prior studies may exhibit perceptual distortions due to low realism, which deserves cautious interpretation, rather than immediate invalidation, especially where other representational abilities are demonstrably enhanced, for example, in expressive representations [34,35].
Moreover, the importance of distance estimation emerges because people make decisions about navigating based on their perception of distances and not the objective measurement of them. How people behave in urban spaces is a result of their estimation of distance, and the resulting sense of space scale and enclosure [36]. Perception of scale and enclosure will influence their sense of comfort and safety, in addition to the obvious rational decision of what shorter routes they need to travel [37].
In addition, computer-simulated environments display significantly compressed distances [17,38,39,40,41]. We ask the question: Does increased realism improve distance estimation and thereby reduce this compression? Additionally, this question fits in with the search for a full environmental distance model [42]. If realism impacts distance judgment, then it is reasonable to suggest that some previous studies might have extreme errors due to low levels of realism. It is also reasonable to conclude that replication of any of the previous works is not meaningful without replicating the same level of realism as well [35]. This study’s systematic evaluation (detailed in Section 2) confirms this gap: fragmented, binary insights fail to resolve realism gradients’ influence on urban distance, addressed here through 216 conditions isolating realism, distance, and orientation.

1.4. Research Hypotheses

Hypothesis 1:
Level of realism influences people’s judgment of distances in a computer-simulated urban environment. The higher the level of realism, the higher the accuracy in estimating distances.
Hypothesis 2:
Distance is expected to be perceived as shorter than the objective.
Hypothesis 3:
Width, height, and depth orientation are expected to influence their perception.

1.5. Literature Review

1.5.1. Level of Realism (LOR)

The literature of urban design and planning has explored varying levels of realism in urban simulation. Proponents of lower realism emphasize cost, time, and computational efficiency. Al-Kodmany [29] noted that basic simulations addressed resource limits but still conveyed essential information for research purposes. Lange [30] asserted that low realism suits projects that are not oriented to design, reserving high detail for design needs [43].
Other researchers argued that high realism enhances the judgment made by participants, and that fewer details in the simulated images will reduce the correlation with original scenes, which creates a significant difference in assessments [27]. Moreover, Bosselmann [33] argued that low realism may distort perception to the extent that the displayed stimuli might not be understood. Other research asserted that computer-simulated urban environments need to contain enough information to give real-life information. This ensures participants remain engaged with the variables under investigation, and they will be undistracted by efforts to interpret the simulations [44].
Ferwerda [31] endorses a three-level classification for the realism in computer graphics: functional realism (a minimum of visual information, e.g., wireframes), photorealism (photo-like), and physical realism (exact geometry, materials, and illumination). Functional examples include the following: Jansen and Wiedenbauer [12] on distance cognition, and O’Neill [13] on wayfinding employing low-detail simulations that were not systematically varied, Imamoglu [14] on facades demonstrated distortions created by missing cues. Photorealistic examples include: Nguyen et al. [45] on density and Nguyen [11] on scale, revealing compression, but did not vary realism. Physical realism (e.g., V-Ray) is underexplored; no previous graded realism manipulations in urban contexts were explored. Overall, realism’s categorization is underrepresented, with low realism often distorting perceptions without cross-level comparisons [32].
The decision about the appropriate level of realism for specific research or a professional purpose is a methodological problem [27,44]. This challenge requires a careful evaluation of the research’s purpose to inform the choice of realism level. In representing urban environments, distances might be the most important factor that determines the success of the research procedure.
The ability of computer-simulated environments to accurately convey the scene’s visual information depends on the purpose of the visual simulation on one hand, and the capacity of the simulator to resemble reality on the other hand. The objective of some research works is to convey information by using a simple format of the scene, like wireframe renderings [17]. This simplified format would be acceptable if it did not alter judgments when compared to photographs. In contrast, other investigations maintained that higher image quality would influence the judgment in virtual environments [18]. Karjalainen and Tyrväinen [46] considered realism as the first criterion for appropriate visualization methods in simulated environments.
Achieving higher quality in rendering needs a simulation that mirrors the accurate geometry, materials, and illumination properties of the scene. Geometry as a function of distance is very important. It can be argued that, among other properties, conveying distances accurately will enhance spatial perception as well. Accordingly, the influenced perception of distances at different realism levels is significant.
Two previous studies reported on distance estimation as related to the level of realism and delivered divergent findings. The first is the work of Thompson et al. [17], which used three graphical displays: high-quality panorama images, low-quality texture-mapped computer graphics, and wireframes. The study concluded that distance judgment was almost not affected by varying realism. On the other hand, the work of Kunz et al. [18] established that the quality of graphics significantly alters distance estimation.
The current experiment resolves the conflicting results regarding realism’s influence on distance perception by incorporating components from Thompson et al. [17], who reported low effects, and Kunz [18], who found significant effects. It integrates with (Kunz) verbal estimates in static urban simulations, extends with four graded realism levels (per Ferwerda [31]), and controls for urban space variables (e.g., orientation, enclosure), yielding significant findings (ANOVA p < 0.001; r = 0.83–0.94) in support of Kunz et al. [18], and attributing Thompson’s [17] null to design variations.

1.5.2. Distance

Distance perception is presented in the literature in twofold: first, environmental/cognitive distance, which involves cognition of larger environments (e.g., kilometers), in which cognitive maps are studied, and people’s responses about routes are considered. Second, perceptual distance, which is about perceiving from a single location, mostly in a single urban space [10]. This work is concerned with the latter, the perceptual distance. Distance perception is also classified into four paradigms based on four procedural points of view: expert, psychophysical, cognitive, and experiential. This paper belongs to the psychophysical research procedure, which involves the assessment of physical environments through testing the public evaluation of the properties of the environments. Participants in this process are passive observers, and the visual elements of the environment are measured through their assessments [47].
On distance perception, the literature suggests that smaller distances tend to be overestimated, while longer ones are underestimated. Additionally, it has reported other factors which influence distance judgment; the environmental setting of the scene, like geometry, texture, and materials, is of high significance [48]. Higher realism, particularly, can make spaces appear more expansive [18]; a change in scale affects distance estimation [11], and small-scale spaces are perceived as being larger than they are measured objectively [49]. Moreover, texture affects distance judgment [40], the accuracy of distance estimation is influenced by the height of objects [5], enclosed urban spaces evoke overestimation of scale and distance [50], empty distance seems shorter than filled distances [6], and uphill distance is overestimated compared to level ground [49].
These variables that are reported in the literature as having an influence on distance estimation must be prioritized to disentangle possible effects of realism. The design of this study integrates texture as incremental LOR additions, varies the geometry and height for distance testing (7–130 m increments) while neutralizing others (e.g., materials are standardized through rendering, scale and enclosure are randomized, space is kept the same across LORs, no slope is present), as further detailed in Section 3.1. Regression validates these controls, as 95% of the compression variance is accounted for by LOR, distance, and orientation alone.
Because distance perception is significantly influenced by the numerous environmental factors stated above, any virtual settings that researchers design need to be like the real counterparts as accurate as possible. Apparently, in urban environments, enclosure and complexity are of special interest; they are products of distance, thus they will most likely be influenced by how distances are perceived.

2. Materials and Methods

2.1. Experiment Design

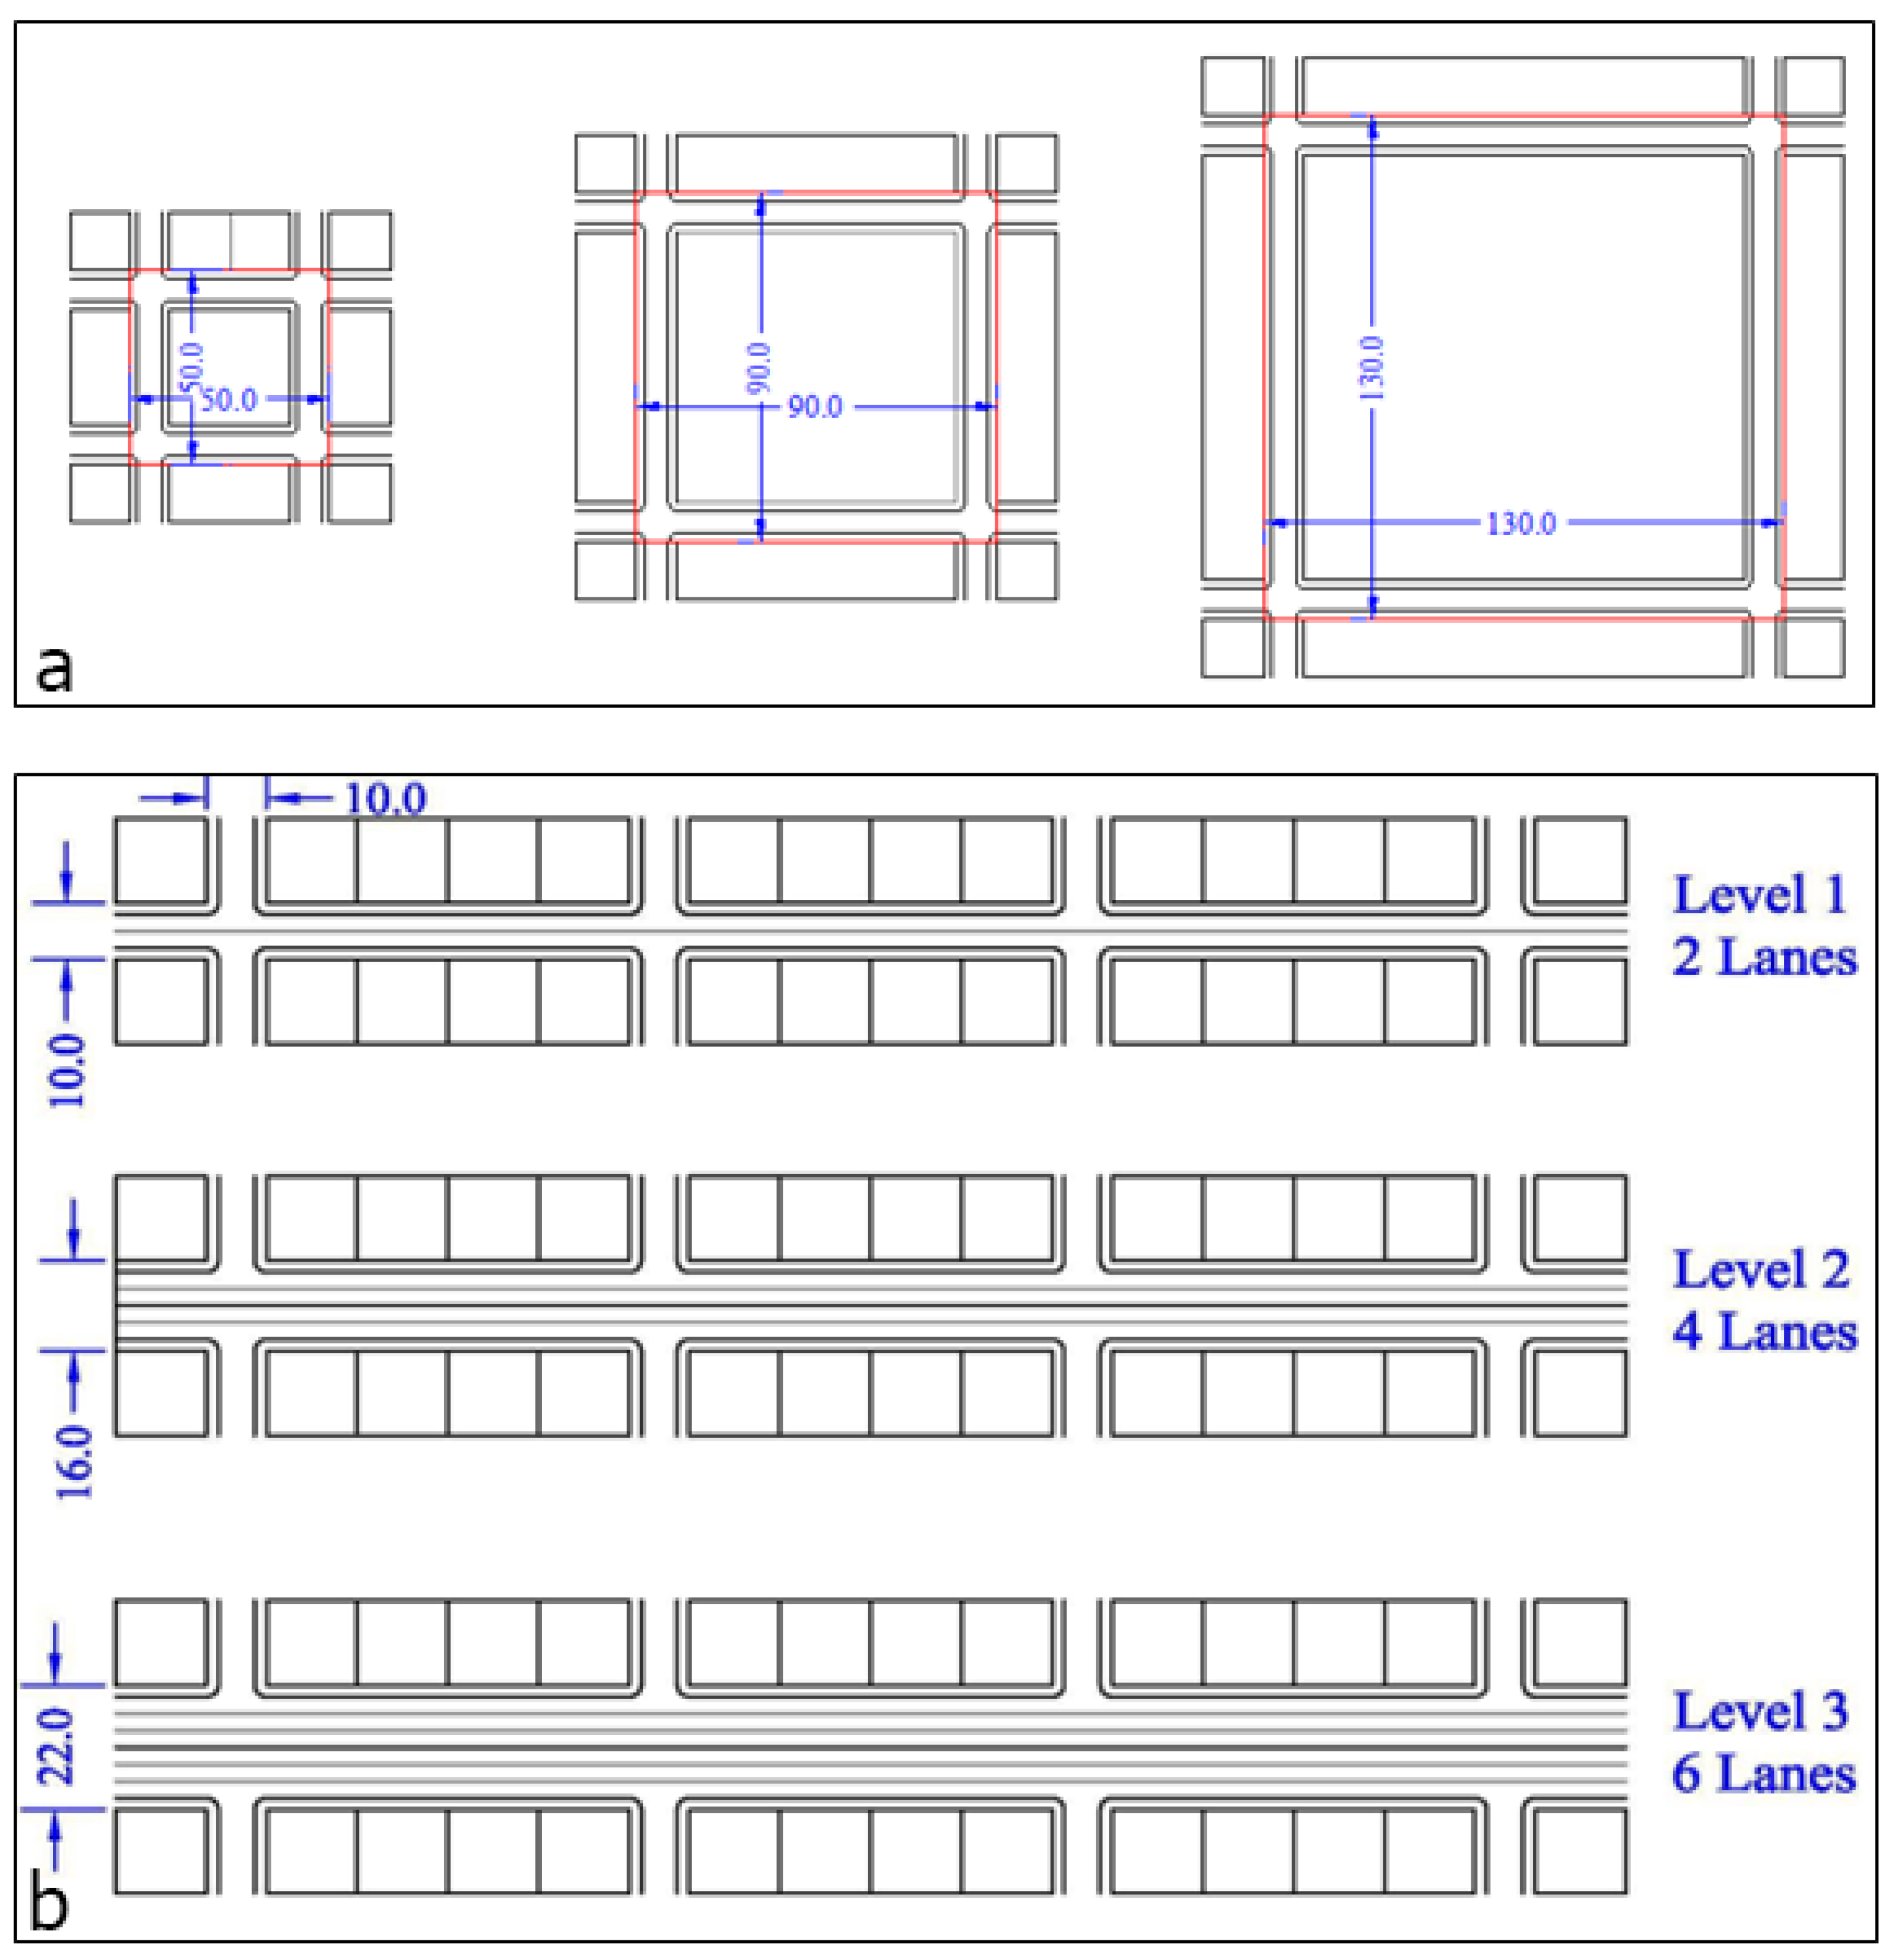
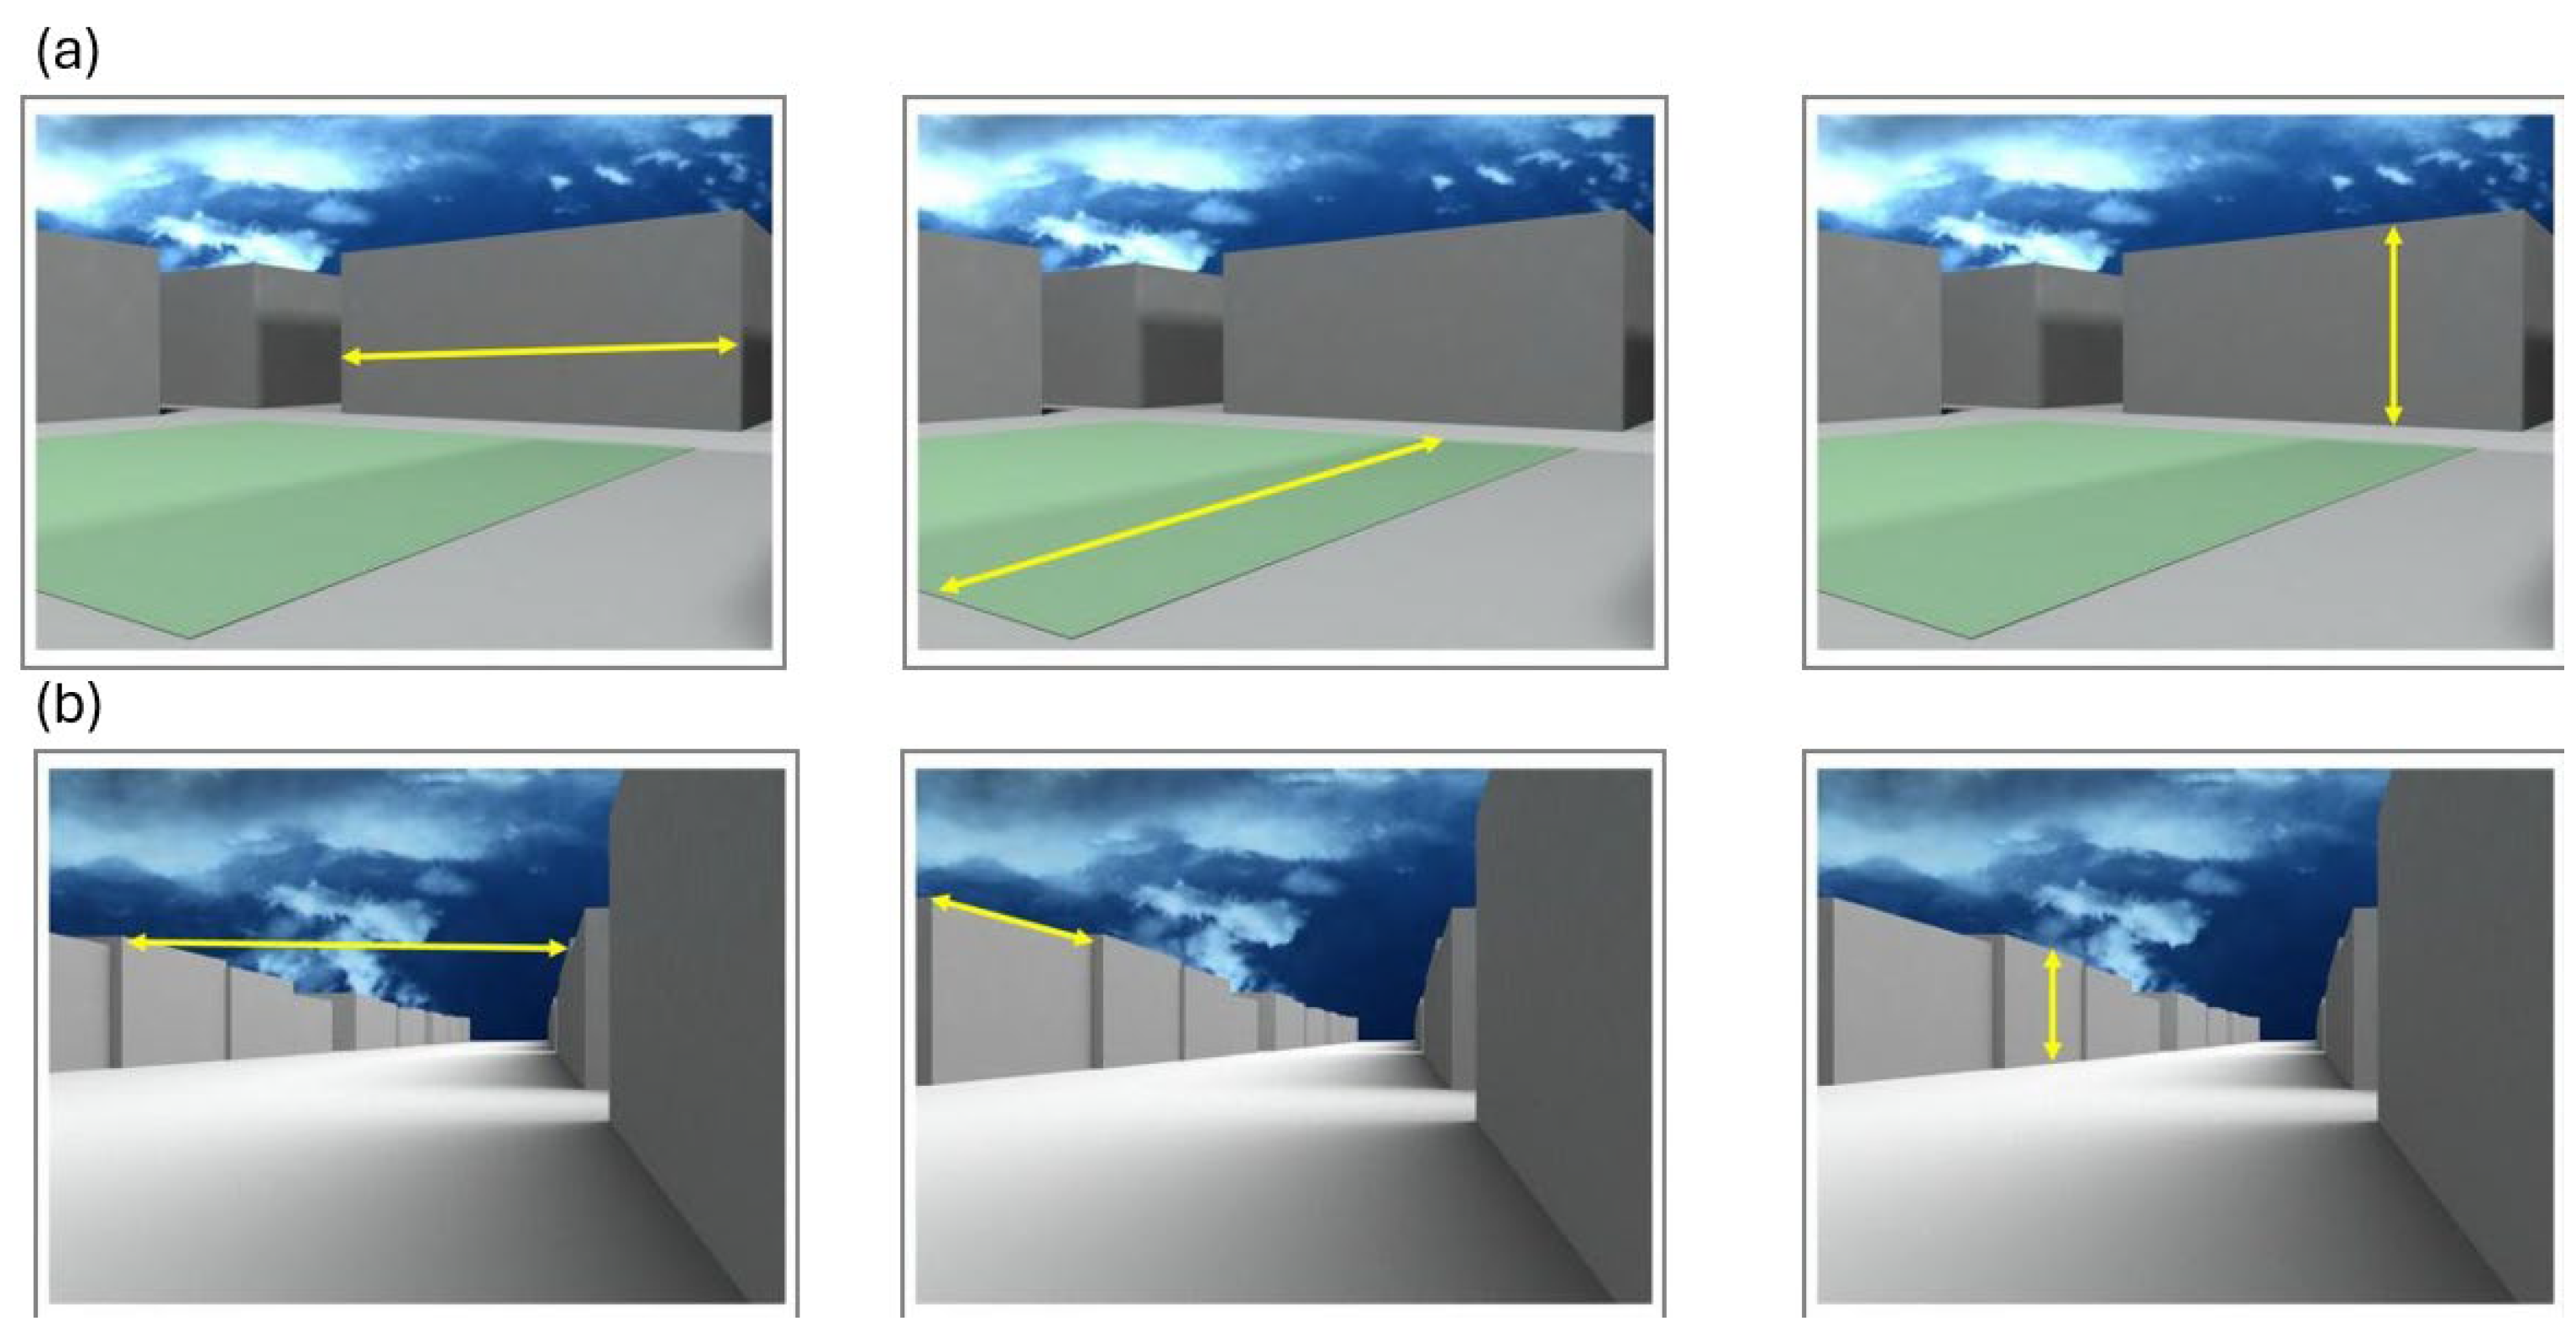
This experiment was designed to explore two types of urban environments: urban squares and urban streets. Urban squares were varied in width and depth in increments of 40 m, producing levels of 50 m, 90 m, and 130 m. Building heights around the squares were incremented by two floors, resulting in heights of two floors (7 m), four floors (13 m), and six floors (19 m). Urban streets were varied in width by an increment of six meters (two lanes), and the heights of the buildings were incremented in the same manner as for the urban squares (Figure 2). In each space, three orientations—width, height, and depth—of objective distances were indicated by a clear arrow that was imposed on the image (Figure 3).
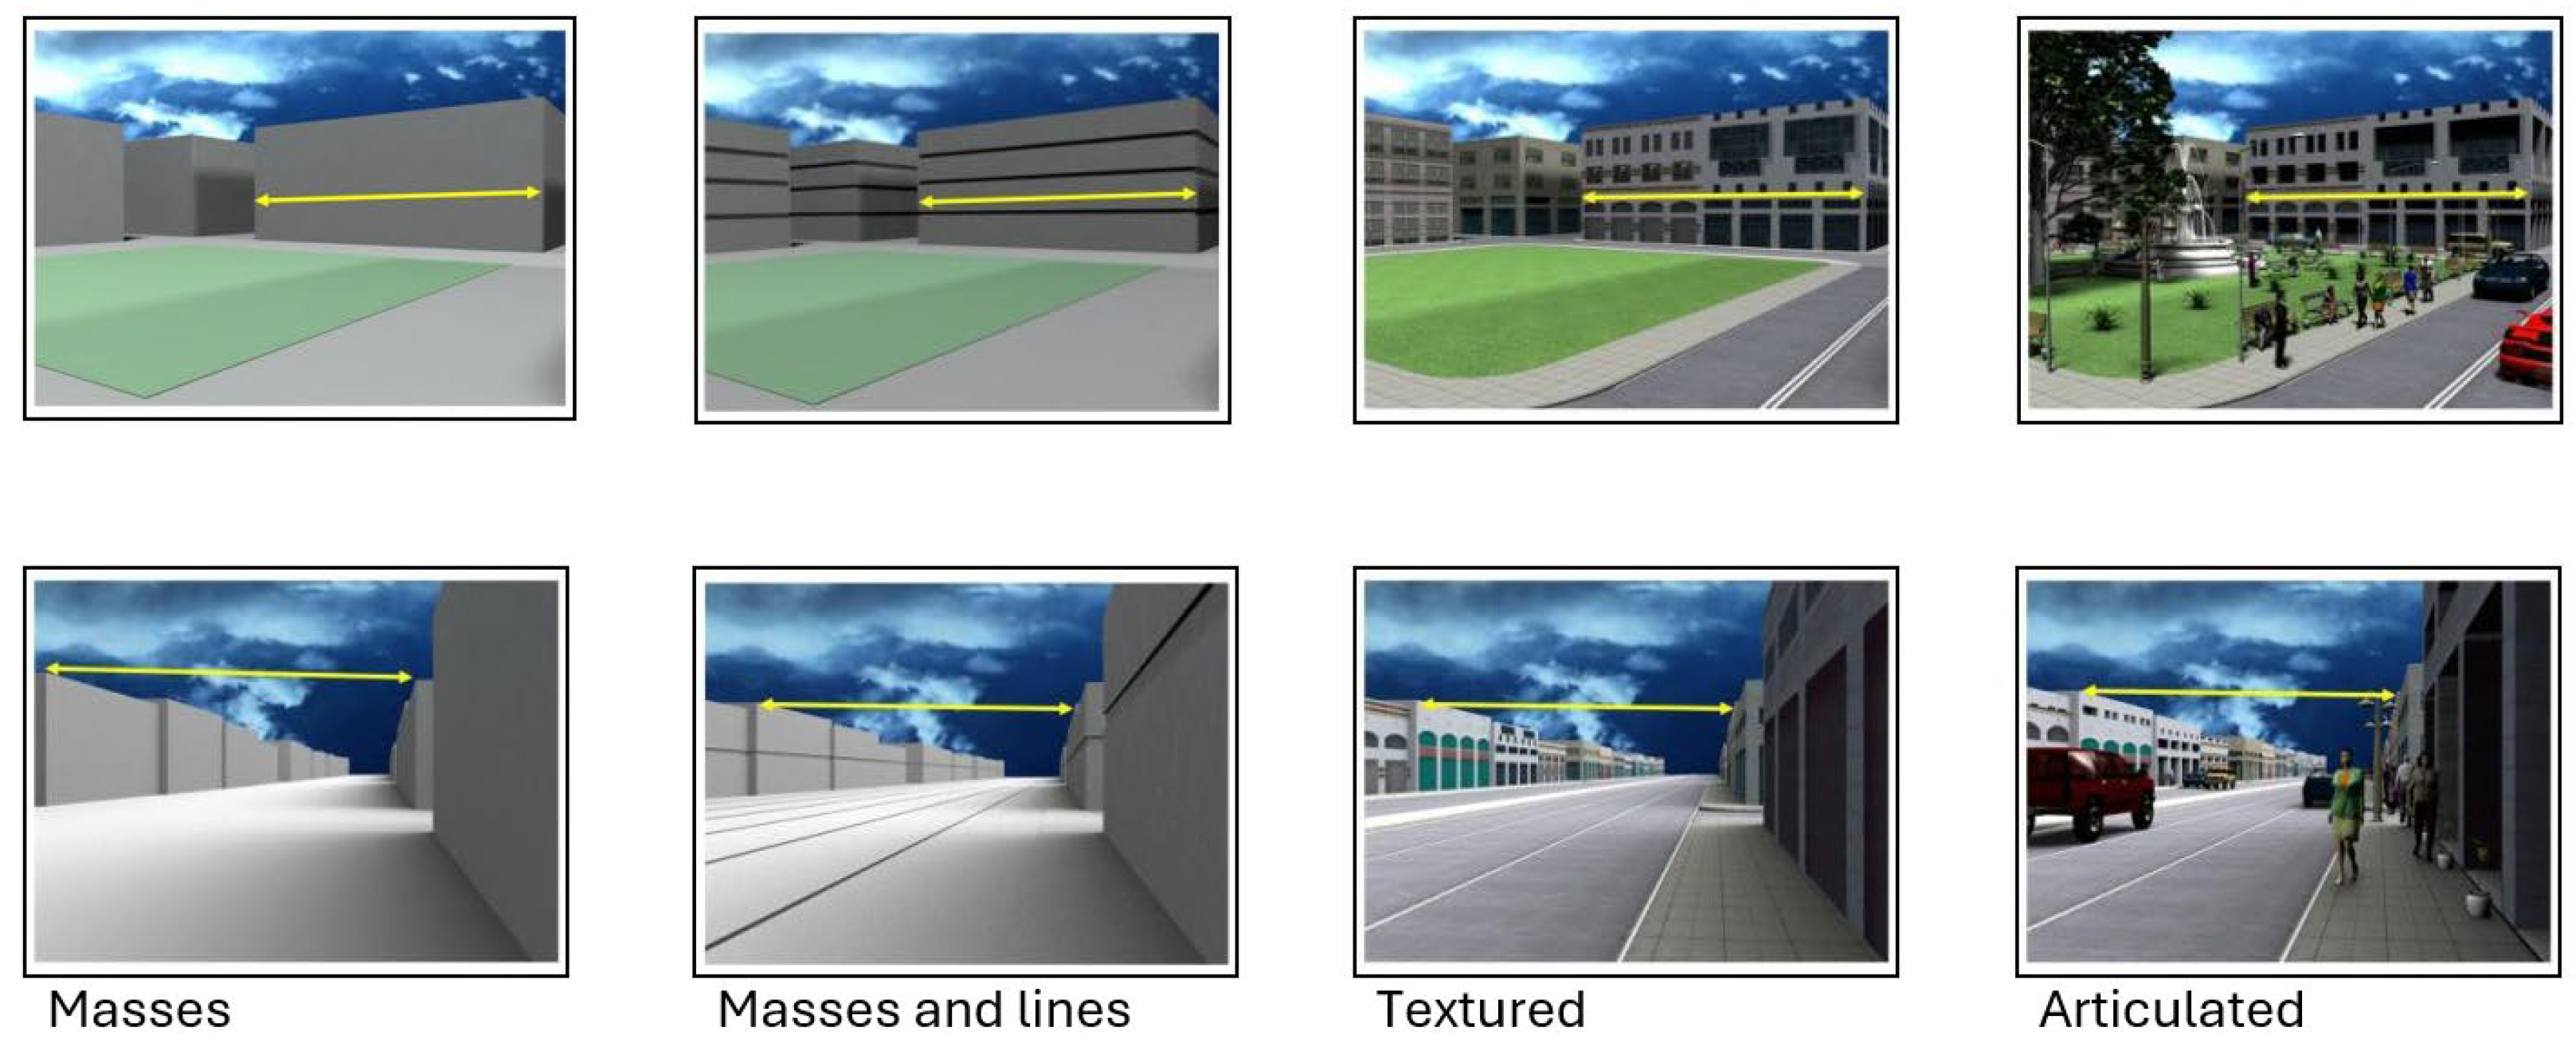
As a result of the above variations, a total of 54 unique combinations were generated. These combinations were presented at four levels of realism: (1) masses—basic geometric shapes, (2) masses with lines—surfaces with floor lines, (3) textured—surfaces with detailed textures, and (4) articulated—detailed render incorporating masses, textures, and street furniture. The multiplication of the 54 combinations by four realism levels resulted in 216 distinct experimental conditions [17,18].
This design prioritized LOR by incrementing textures, which was controlled as part of realism, varied geometry for distance using increments to test its ranges, and neutralized confounders (e.g., materials uniformity via 3ds Max/V-Ray, scale and enclosure, and space complexity randomized, and slope eliminated), ensuring the influence of realism to dominate. This is validated by the insignificant influence of randomizing variables in the regression test explained in Section 4.1. Examples of these visual displays vary across the four realism levels (Figure 4).
Utilizing AutoCAD 2024 for basic geometry and Autodesk 3ds Max® for advanced rendering, this study developed 216 different variations. To achieve higher levels of realism, V-Ray©, a plug-in for high-quality rendering, was used to simulate sophisticated light behavior. The resulting 54 images per realism level were then integrated into an on-screen survey that was designed using Microsoft Visual Basic 6.0©. This virtual setup abstracts real-world urban variability to allow for the controlled modification of perceptual cues, with a standardized daylight rendering (and hence a neutral temporal context), which implies neither cultural nor climatic conditions.

2.2. Participants

The questionnaire employed in this study was ethically reviewed and approved by the Al Yamamah University Ethics committee. A total of 172 participants were recruited based on their availability and diverse perspectives. Participants were 58% male and 42% female (mean age = 22.4). They were divided into four groups, with each group designated to respond to one level of realism. Upon opening the survey, participants were provided with an overview of the research objectives, followed by instructions on how to input their estimations of distances from the 54 images, concluding with a section for demographic data (Figure 5). At the end, responses were collected and then coded in SPSS 2022 for statistical analysis. The study recorded 9288 estimation observations (172 participants × 54 stimuli).
Post hoc power analysis (G*Power 3.1; medium f = 0.25, α = 0.05, power = 0.80) confirms that our sample size is appropriate for a mixed ANOVA model (observed power > 0.95). In the absence of fatiguing or design-biasing complexity, participants appraised only 54 stimuli each (LOR group block), untimed, brief inputs, and randomized order; ethical review and no issues reported ensured minimal cognitive load.

2.3. Independent and Dependent Variables

Although demographic variations might influence participant responses, this study treated participants primarily as evaluators, with the emphasis placed on their perceptual judgments. All independent variables were treated as within-subjects factors, tied to variations in the stimuli or images, rather than to individual participant characteristics or demographic factors. The study included three independent variables and one dependent variable. The first independent variable was objective distance, quantified in meters on a discrete scale ranging from seven meters to 130 m. The second independent variable was level of realism (LOR), measured on an ordinal scale, varied at four levels: Masses, Masses and lines, Textured, and “Articulated”. The third independent variable was distance orientation measured at a nominal scale, varied at the levels, width, height, and depth. The dependent variable was perceived distance, which was measured in meters at a discrete scale. The Randomizing variables were four; three of which were urban space measurements of width, height, and depth, and the fourth was the type of space: square or street (Table 1). User activities or social perspectives were deliberately avoided in Table 1, because the design stimulus-driven perceptual judgments over behavioral or contextual interactions consistent with psychophysical paradigms in the urban simulation literature (see Section 1.1). No user-category breakdowns (e.g., by age/gender) were conducted, treating participants as a unified perceptual group to isolate stimulus effects.
Statistical tests of differences, correlations, ANOVA, and regression were used to uncover potential relationships between the variables. ANOVA test specifically was used because it proved suitable for this study, as it maintains strong performance in repeated-measures designs, which enables it to identify multiple independent variable levels (LOR and orientation) while preventing Type I errors, through sphericity assumption verification using Mauchly’s test. The test enables this study to determine the exact impact of realism on perception through post hoc tests (e.g., Tukey), which perform specific pair-by-pair comparisons.

3. Results

3.1. Perceived Distance

A Pearson correlation demonstrated that perceived distance was correlated positively and significantly with objective distance across all the experimental conditions (r = 0.8, N = 216, p = 0.001), confirming that the simulation communicated variations in distance effectively. The overall correlation coefficient was r = 0.8 for all levels of realism. However, when correlations were conducted separately for each level of realism, the coefficients increased; r = 0.83 for LOR 1 (masses), r = 0.88 for LOR 2 (masses + lines), and r = 0.94 for both LOR 3 (textured) and LOR4 (articulated). Fisher’s r-to-z transformation confirms these increases are statistically significant, not random: LOR1 vs. LOR3/4 (z = −2.78, p = 0.005); LOR2 vs. LOR3/4 (z = −1.83, p = 0.067, marginal); overall vs. LOR3/4 (z = −4.10, p < 0.001). The relation between perceived and simulated distances (Figure 6) demonstrates significant positive correlations across all 172 participants overall (r = 0.80, p < 0.001; width r = 0.85, height r = 0.82; depth r = 0.79), with increased compression at greater distances (ANOVA F = 25, p < 0.001).
The ANOVA test indicated a significant difference in perceived values across all levels of objective distances (F = 25, p = 0.001). For example, the mean perceived distance for an objective distance of 7 m was 3 m less than that for 10 m, 8 m less than that for 21 m, and 32 m less than that for 130 m (Figure 6). The experiment was able to convey differences among objective distance values systematically; the longer the distance, the higher the compression. These correlations derive from the collective verbal estimates of the 172 subjects treated as a unique evaluator group (as mentioned in Section 3.3) without any breakdown by demographic variables to keep the focus on perception variables. ANOVA was suitable for use with a repeated-measures design where the sphericity assumption was met (Mauchly’s W = 0.92, p > 0.05), enabling detection of significant differences (e.g., F = 25, p < 0.001), while controlling for Type I errors via post hoc Tukey tests. This approach improves the guideline by uniformly characterizing the perceptual differences.

3.2. Compression

Compression in distance perception, quantified as the difference between objective and perceived distances (objective–perceived), revealed a range from −3.55 m to +113 m. Notably, 91% of the difference values were positive (indicating underestimation, where objective > perceived), while 9% were negative (indicating overestimation, where perceived > objective). All the negative values were found to be related to shorter objective distances ≤ 20 m. However, for the lower levels of realism (LOR 1 and LOR 2), no overestimation was observed; participants consistently underestimated distances, whether short or long. Overestimation appeared only at higher levels of realism (LOR 3 and LOR 4), exclusively for shorter distances.
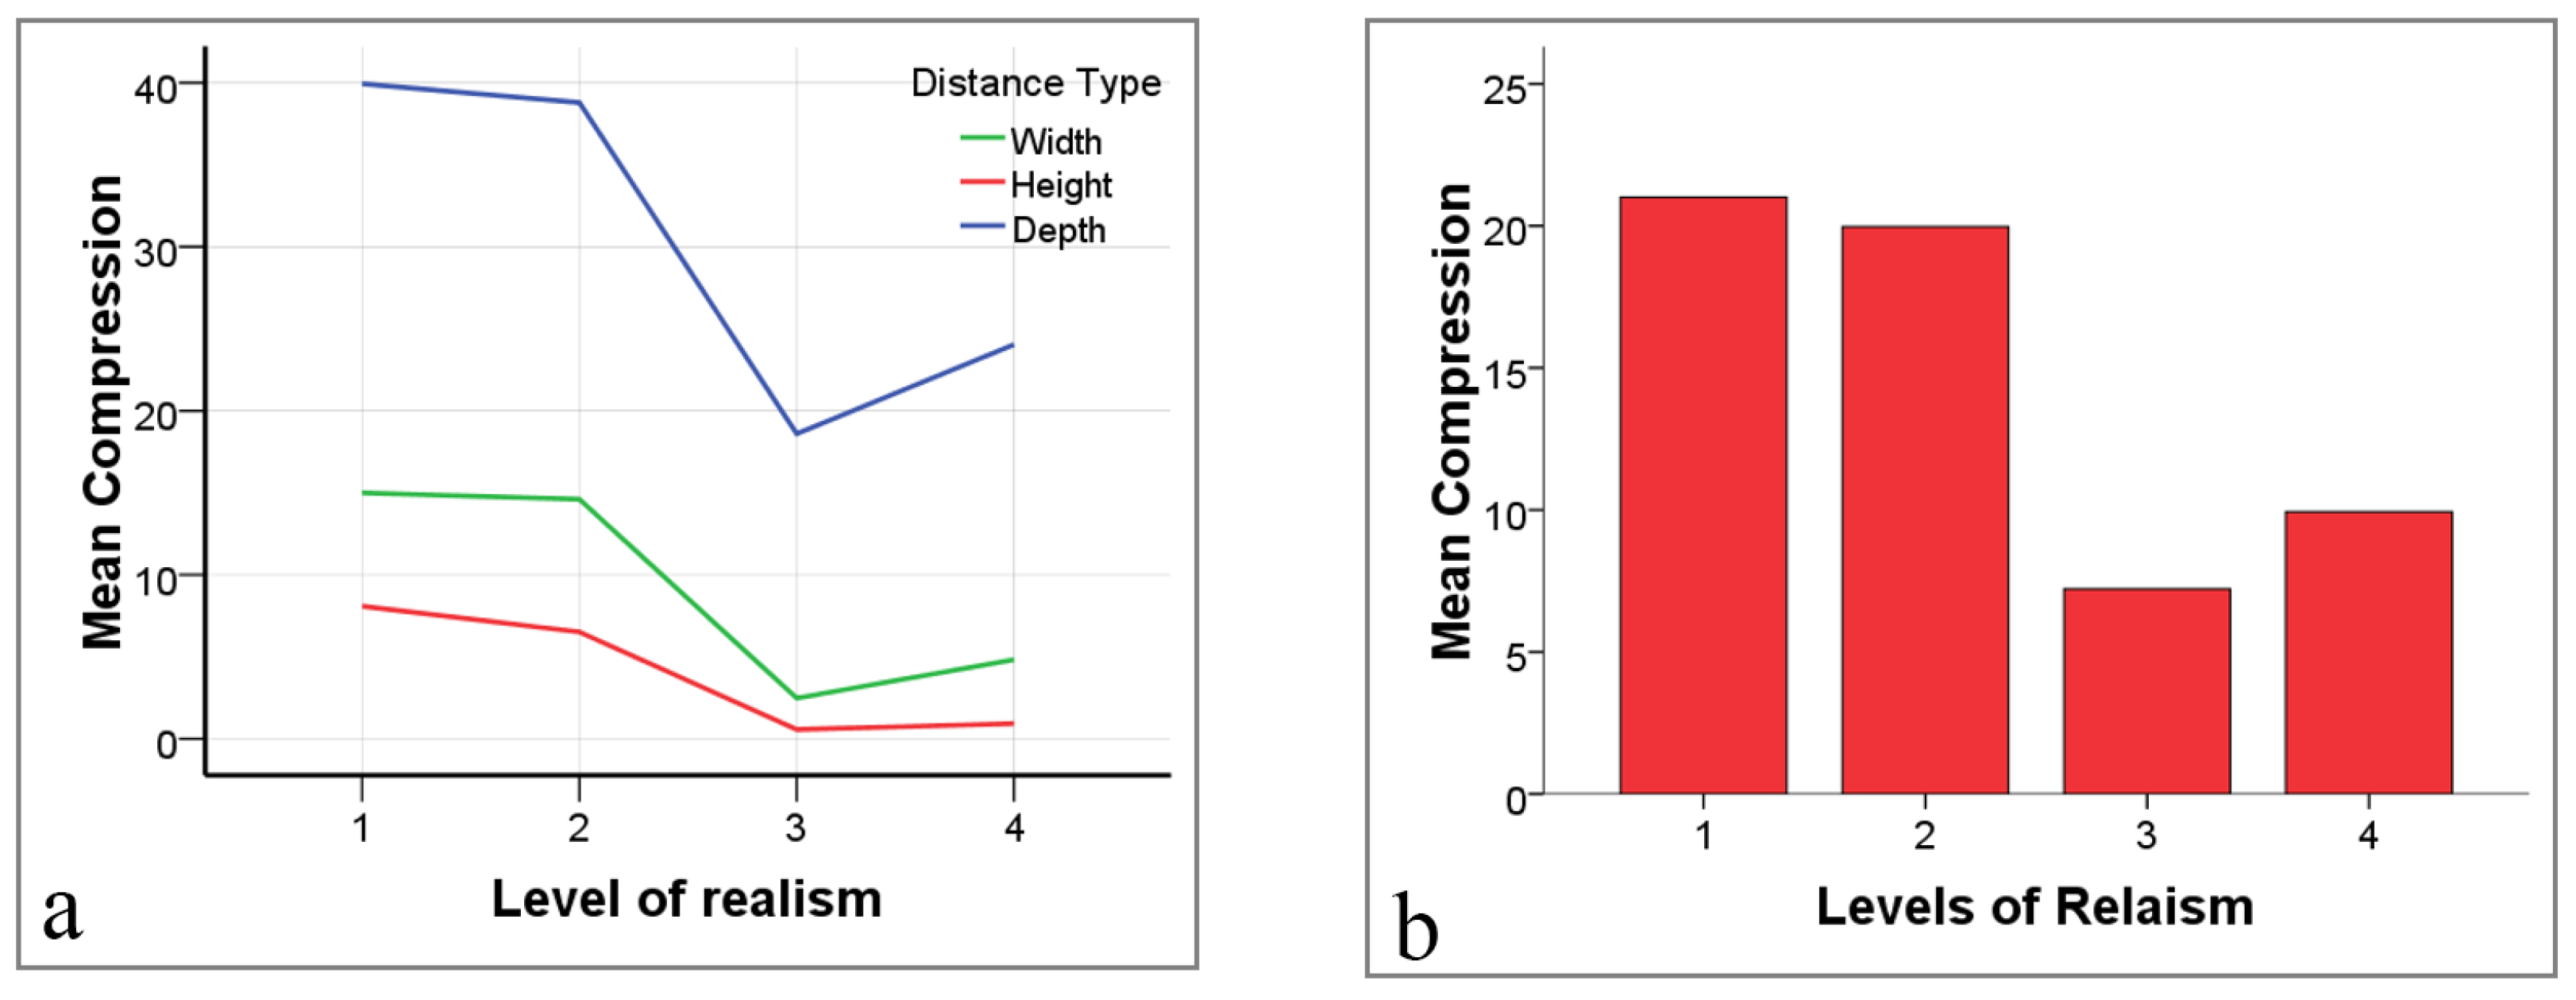
An ANOVA test revealed that values of compression (under- or overestimated) differed significantly across values of objective distances (F = 182.4, p = 0.001); the longer the objective distance, the larger the compression (Figure 7a, Table 2). To test the influence of the three orientations on compression, objective distance values ≤ 20 m were selected for equal representation. The ANOVA test indicated no significant difference in compression values between width and height; there is no statistical proof that participants perceive height and width distances compressed differently. However, the test was significant for depth distances (p = 0.002). On average, depth distances were about 3 m more compressed than both width and height distances (Figure 7b).
The effect of the four levels of realism on compression was also examined. An ANOVA test confirmed a significant difference in compression across LORs. Adding texture maps to surfaces of masses enhanced mean estimation by about 14 m, and contrary to expectation, adding street furniture and human scales did not improve estimation. This finding suggested that the fourth level of realism (LOR4) contained elements of design that did not enhance distance estimations; future investigation on the interplay between the realism variable and enclosure variable is needed (Figure 8).

3.3. Regression Analysis

A linear regression analysis demonstrated that objective distance alone accounted for 88% of the compression values (p = 0.001). When the variable level of realism was added to the model, it enhanced the model to predict 94% of the compression values pertaining to lower realism levels, evidently, and when distance orientation was included, the model enhanced marginally to explain 95% of compression values (p = 0.001) (Table 3). All randomizing variables of space type, objective width, height, and depth of the urban space have no significant influence on the regression model. Hierarchical F-change tests confirm significant increments: adding LOR, F (1,213) = 213.0, p < 0.001 (ΔR2 = 0.06); adding orientation, F (1,212) = 23.6, p < 0.001 (ΔR2 = 0.006). An interaction term (distance × LOR group) is also significant (B = −0.15, t = −3.42, p < 0.001; ΔR2 = 0.006, F-change = 11.7, p < 0.001), showing realism moderates distance’s effect on compression.
Hypothesis 1 was supported; perceived distance was generally shorter than objective distance. Hypothesis 2 was supported; the level of realism influenced people’s judgment of distances in computer simulations of urban environments. The higher the level of realism, the higher the accuracy in estimating distances. Hypothesis 3 was supported; distance orientation influenced perception. Although compression occurred across all three orientations (width, height, and depth), depth distances were significantly more compressed than width and height distances.

4. Discussion and Conclusions

4.1. Discussion

4.1.1. Overlaps with Prior Findings

This research confirmed a key concept that distances are perceived as shorter than their actual measurements [12,51]. This study aligns with past research showing that distances perceived via virtual environments are significantly smaller than their actual lengths [17,38]. For comparison with real-world perception, the virtual underestimation seen in our data here (20–40% at low realism) is dramatically less than real-life performance (~95%) for 5–15 m distances according to reports by Thompson et al. [17], allowing a more analytical assessment of simulation fidelity and effect sizes comparisons (Cohen’s d ≈ 4.00 for virtual–real differences, indicating an extremely large effect according to reported means and SD in their work). This research also confirmed the high correlation between perceived and objective distance, as Hirtle and Hudson [15] suggested. However, correlation is stronger between perceived and real distances when very realistic virtual urban scenes are used; this study reveals a correlation coefficient (r = 0.94) when urban masses were textured and rendered with a powerful rendering engine like V-Ray©.
This study confirmed the conviction that longer distances are underestimated, while shorter ones are overestimated. In very realistic virtual settings, people thought widths that are less than 16 m and heights around 7 m were larger than they actually were. All longer distances of width and height, in addition to all depth distances, are perceived to be underestimated. On the other hand, in a lower realistic environment, distances of all lengths and all three orientations are underestimated. The well-established rule of compression was found to be concealed at lower levels of realism. So, in low-resolution displays, compression will be drastically exaggerated.
Crompton and Brown [49] established that spaces with fewer hints are misleading. This study agrees with their notion and confirms that objects without clues of texture or similar scale-hinting features will mislead estimation of distances, consequently, affect senses of scale, safety, or comfort in urban spaces. Yang et al. [51] found that long distances seem shorter and short ones seem longer. The present study extended this finding and identified a correlation with length; the tests indicated that the longer the distance, the more people tend to underestimate it (r = 0.94). Furthermore, this research can explain the notion of Kunz et al. [18] that more realistic spaces seem larger in size. Realistic virtual spaces reduce underestimation, so they feel larger than simpler ones because people see distances as longer.

4.1.2. Differentiations and Novel Contributions

Unlike binary (high/low) realism manipulations in the previous literature (e.g., Thompson et al. [17]), this grade four-level method distinguishes itself by a series of accuracy levels (ranging from 0.83 to 0.94), demonstrating the non-linear role of textures and cues in urban simulations. Napieralski et al. [38] asserted that people accurately estimate distances under 20 m in real life but underestimate them in virtual displays. This study argues the opposite, as it found that people overestimated distances under 20 m. Agreeing with the argument of Kitchin [52], it is reasonable to say that understanding perceived dimensions of urban space might be helpful to alter people’s perception of distance and scale for the rightful purposes; this is mostly true if that perception was already altered negatively by some other social, emotional, or physical factors.
Regarding statistical findings for real perception, this study focuses on simulated environment, and no real-world data was collected. However, a realistic comparison to benchmarks from other recent studies, e.g., Thompson et al. [17], who reported near-accurate estimates (95% of actual distance) for the intervals of 5–15 m, in sharp contrast to our virtual compression (of 20–40% underestimate for similar intervals at low realism). This demonstrates that this study’s results extend virtual-specific distortions and coincide with real-world accuracy for very high (r = 0.94) realism.
Designers might use this as a tool to visually alter perception for the purpose of enhancing the experience of the users of urban spaces. Larger spaces, for instance, may be given fewer details to increase underestimation and bring higher favorable enclosure to space. On the other hand, claustrophobic feeling in a highly enclosed urban space might be reduced by more articulation, textures and clues of scale given to horizontal surfaces to decrease compression, therefore give the impression of a wider space. For example, using textured surfaces in narrow alleys to enhance perceived width, thereby correlating reduced underestimation (from r = 0.83 at low realism to r = 0.94 at high) with decreased claustrophobia in real-world applications.
Consistent with the argument of Pocock [50], perceived, as opposed to objective metric distances, should be considered when designing urban environments. Yang et al. [51] reported that distance perception is related to the complexity of the environment (that is, because detailed cityscapes provide people with more hints about size, in a similar way that textures do, and that helps them judge distances more accurately, and underestimate less). This is why the correlation between complexity levels and perceived distances was high in the research of Yang et al. [51].
Urban streets look wider (Crompton and Brown [49]). Without cars, in this study, on level four, adding cars and other objects reduces the emptiness that makes a space look wide. This caused distance underestimation to be even more biased than at level three. So, a more realistic, lively virtual city looks great but feels smaller. The findings of this work might be taken into consideration by urban designers and planners to enhance the existing or future built environments. Far from devaluing the richness of existing urban spaces, these perceptual insights uphold opportunities and provide techniques for amplifying inherent qualities, such as enclosure conducive to public intimacy, while minimizing distortions that could exacerbate discomfort.

4.1.3. Addressing Contradictory Evidence

The present study reconciles the conflict between minimal realism effects in Thompson et al. [17] and positive effects in Kunz et al. [18] by including controlled urban parameters (e.g., orientation and enclosure) and verbal point estimation and attributing differences to design variations and yielding robust results (ANOVA p < 0.001).

4.2. Limitations

The employment of static images, though a methodological benefit for variable isolation, may perhaps not adequately reflect perceptual dynamics in navigable virtual spaces: future work may replicate these results in immersive VR settings to maximize ecological validity. Furthermore, as a virtual study, the results may not generalize to real-life situations, where social (e.g., interpersonal cues), emotional (e.g., affective states), and sensory (e.g., multisensory integration) factors affect the perception of distance. Although the literature demonstrated a high virtual–real correspondence, these uncontrolled factors need field validations in diverse urban contexts to test the reliability and the implications of manipulation in terms of comfort/experiences.
While the results of this advocate for perceptual tools in urban design and planning, they should take into consideration the temporal and multi-layered character of the city. Cities are generally enriched by historical and socially driven developments, rather than being imposed in the form of standardization. Combining realism with site-specific narratives, such as overlaying textures that reference these perceptions, designers can induce regenerative processes that are respectful of urban diversity, mitigating the claustrophobia through inclusive, evolving spaces, rather than fixed, linear models.
Additionally, the convenience sample is relatively young and possibly more homogeneous, limiting the generalizability to diverse urban users; although focusing on stimulus-driven perceptual effects minimizes demographic confounds, future studies are needed that can test different ages/genders/cultures to ensure generalizability.

4.3. Conclusions

This research investigated how LOR in computer-simulated urban environments influenced perceived distance and thus contributes to the understanding of virtual representations and space perception. The investigation showed that in computer-simulated urban environments, perceived distances tend to increase as objective distances increase. However, distances in urban spaces were generally overestimated, and the distortion was mainly compression (underestimation) [53,54]. The perceived distances became more compressed as the objective distances increased. Distances were overestimated for short distances, while underestimated for long ones. Furthermore, the research found that depth distances were compressed more than width or height distances [55,56].
Relative to level of realism, this study maintains that creating more realistic simulated spaces decreases compression; in other words, it enhances the estimation of distances [57]. It should be stressed here that compression was unavoidable, but more realism produced less compression. The realism that was needed to enhance the estimation of distances in urban spaces was the one that introduced scale clues like textures of buildings and grounds, such as streets, walkways, building floors, and windows (LOR3) [58,59]. Nevertheless, limitations remain. When more precise estimations of distance were sought beyond that, by adding elements like cars, human figures, trees, and street furniture, the addition failed to enhance distance estimation any further. Adding these elements evoked higher enclosure and consequently reduced perceived distance in (LOR4) [60]. This enclosure attribution is supported by LOR4-controlled additions (e.g., furniture density as a realism component), with regression confirming no confounding from spatial randomizers (p > 0.05); however, dedicated studies are needed to isolate density or any other variables from enclosure.
Lower levels of realism, such as LOR1 and LOR2, and those suggested by the literature, like wireframe representations, will increase compression severely, rendering these representations ineffective for general urban design investigation purposes. Unless the research question is not dependent on distance, that is not related to scale, enclosure, senses of comfort, sense of safety, sense of time, or any other sensory qualities attached to distance, then lower levels of realism might be convenient. Lower levels of realism are useful for investigations that do not rely on accurate distance perception, acting as additional rather than alternative methodological devices [61,62].
In this study, the level of realism in computer-simulated urban spaces is established not merely as a technical choice but as a fundamental factor for defining how distances, and therefore the experiences of urban spaces, are perceived [63]. Simulations are becoming increasingly central to urban research and design, and as such, the emphasis on realism, particularly through scale-hinting elements, will lead to more accurate representations of the built environment.
Insights from previous research carried out significant implications concerning comfort and safety as related to enclosure in urban spaces [1,64,65]. Because enclosure is a function of urban space dimensions, which we can measure only through perception, it is logical to conclude that a relationship does exist between the perceived distances and senses of comfort and safety in urban spaces [36]. Enclosure as a function of objective distances might be altered by perception. This means that enclosure, as an independent variable, should be measured using perceived distances and not objective ones. An example of that is the (LOR4) in this research, where more elements evoked more enclosure, and more enclosure means shorter estimations. There is a need to investigate this relationship in future research.
Cullen [66] argued in his book, “The Concise Townscape”, a city is more than a mere accumulation of people or buildings; rather, a city produces a “surplus of amenity” through relationships, juxtaposition for contrast, enclosure for intimacy, revelation for wonder, forming the urban fabric according to the human optics, position, and sensory experience. Distance perception is a basis for sensing the compositional characters of the urban environment, including those mentioned by Cullen. Therefore, this work positions itself among the studies concerned with uncovering the roots of sensorial values, where humans perceive positions of contrast, proportions of beauty, and enclosures for intimacy.
This study demonstrates how varying levels of realism help reduce perception biases in the simulated environment, suggesting a more realistic prototyping of virtual urban spaces to improve reflections of pedestrian senses of comfort, safety, and enclosure [67,68]. This relates to the urban design principles in supporting evidence-based decision-making process to develop walkable, human-focused environments (street width/felt sense of intimacy, and street ceiling length/felt sense of openness), and therefore improving quality of life.
Several limitations should be considered, including: lack of dynamic stimuli (which may underestimate dynamic cues such as motion parallax, and indicate a reduction in compression by 10–15% in immersive VR [54]), Saudi-based participant sample (limiting generalizability to other cultural contexts where spatial preferences differ [30], and focus, on subjective estimates only and not more formal behavioral measures (e.g., walking tasks [68]. These are attenuated by our matched design but underline areas of caution in interpretation. Moreover, the neutral daylight rendering technique that was used removes temporal biases through its ability to eliminate seasonal and diurnal variations, which allows spatial elements analysis without any confounding variables. However, beyond the scope of this study, the assessment of lighting effects on simulation realism needs the integration of different lighting conditions of the day in any future simulation development.
This study suggests, towards a wider scope, further extensions in the future, including adding AI-driven dynamic VR as real-time urban simulators [69]; cross-cultural studies to test the outcomes of realism for different climates and densities; hybrid studies combining the perceptual level with objective measures (e.g., through GIS integration) for comprehensive urban design. This broadens the scope of parameters to reconcile simulations with sustainable design criteria, such as fostering active mobility and minimizing enclosure-induced anxiety in high-density planning.

Funding

This research received no external funding at the time of submission. Partial funding may be received post-publication from Al Yamamah University.

Institutional Review Board Statement

The study was conducted in accordance with the Declaration of Helsinki and approved by the Ethics Committee of Al Yamamah University on 17 March 2025.

Informed Consent Statement

Informed consent was obtained from all subjects involved in the study.

Data Availability Statement

The original contributions presented in the study are included in the article, further inquiries can be directed to the corresponding author.

Acknowledgments

The author gratefully acknowledges Al Yamamah University for its generous support of this research. Their commitment to advancing research has been instrumental in disseminating my findings. This contribution reflects the university’s dedication to fostering academic excellence.

Conflicts of Interest

The author declares that he has no known competing financial interests or personal relationships that could have appeared to influence the work reported in this paper.

References

  1. Stamps, A. Enclosure and Safety in Urbanscapes. Environ. Behav. 2005, 37, 102–133. [Google Scholar] [CrossRef]
  2. Abdelfattah, D.; Nasreldin, R. Perceptional Dimension Towards More Walkable Communities: An Assessment Tool Approach. J. Urban Res. 2019, 33, 172–183. [Google Scholar] [CrossRef]
  3. Yeganeh, M.; Kamalizadeh, M. Territorial behaviors and integration between buildings and city in urban public spaces of Iran’s metropolises. Front. Archit. Res. 2018, 7, 588–599. [Google Scholar] [CrossRef]
  4. Higuera-Trujillo, J.L.; Maldonado, J.L.-T.; Castilla, N.; Llinares, C. Architectonic Design Supported by Visual Environmental Simulation—A Comparison of Displays and Formats. Buildings 2024, 14, 216. [Google Scholar] [CrossRef]
  5. Cui, G.; Wang, M.; Fan, Y.; Xue, F.; Chen, H. Assessment of Health-Oriented Layout and Perceived Density in High-Density Public Residential Areas: A Case Study of Shenzhen. Buildings 2024, 14, 3626. [Google Scholar] [CrossRef]
  6. Haifler, Y.T.; Fisher-Gewirtzman, D. Spatial Parameters Determining Urban Wellbeing: A Behavioral Experiment. Buildings 2024, 14, 211. [Google Scholar] [CrossRef]
  7. Bosselmann, P. Dynamic Simulations of Urban Environments. In Environmental Simulation: Research and Policy Issues; Marans, R.W., Stokols, D., Eds.; Springer: Boston, MA, USA, 1993; pp. 279–302. [Google Scholar] [CrossRef]
  8. Clipson, C. Simulation for Planning and Design. In Environmental Simulation: Research and Policy Issues; Marans, R.W., Stokols, D., Eds.; Springer: Boston, MA, USA, 1993; pp. 23–57. [Google Scholar] [CrossRef]
  9. Kaplan, R. Physical Models in Decision Making for Design. In Environmental Simulation; Springer: Boston, MA, USA, 1993; pp. 61–86. [Google Scholar] [CrossRef]
  10. Bailly, A.S. Subjective distances and spatial representations. Geoforum 1986, 17, 81–88. [Google Scholar] [CrossRef]
  11. Nguyen, T.D.; Ziemer, C.J.; Grechkin, T.; Chihak, B.; Plumert, J.M.; Cremer, J.F.; Kearney, J.K. Effects of scale change on distance perception in virtual environments. ACM Trans. Appl. Percept. 2008, 8, 1–18. [Google Scholar] [CrossRef]
  12. Jansen, P.; Wiedenbauer, G. Distance cognition in virtual environmental space: Further investigations to clarify the route-angularity effect. Psychol. Res. 2004, 70, 43–51. [Google Scholar] [CrossRef]
  13. O’Neill, M.J. Effects of familiarity and plan complexity on wayfinding in simulated buildings. J. Environ. Psychol. 1992, 12, 319–327. [Google Scholar] [CrossRef]
  14. Imamoglu, C. Complexity, liking and familiarity: Architecture and non-architecture Turkish students’ assessments of traditional and modern house facades. J. Environ. Psychol. 2000, 20, 5–16. [Google Scholar] [CrossRef]
  15. Hirtle, S.C.; Hudson, J. Acquisition of spatial knowledge for routes. J. Environ. Psychol. 1991, 11, 335–345. [Google Scholar] [CrossRef]
  16. Peruch, P.; Giraudo, M.-D.; Garling, T. Distance cognition by taxi drivers and the general public. J. Environ. Psychol. 1989, 9, 233–239. [Google Scholar] [CrossRef]
  17. Thompson, W.; Willemsen, P.; Gooch, A.; Creem-Regehr, S.; Loomis, J.; Beall, A. Does the Quality of the Computer Graphics Matter when Judging Distances in Visually Immersive Environments? Presence 2004, 13, 560–571. [Google Scholar] [CrossRef]
  18. Kunz, B.R.; Wouters, L.; Smith, D.; Thompson, W.B.; Creem-Regehr, S.H. Revisiting the effect of quality of graphics on distance judgments in virtual environments: A comparison of verbal reports and blind walking. Atten. Percept. Psychophys. 2009, 71, 1284–1293. [Google Scholar] [CrossRef]
  19. Szczepańska, A.; Kaźmierczak, R.; Myszkowska, M. Virtual Reality as a Tool for Public Consultations in Spatial Planning and Management. Energies 2021, 14, 6046. [Google Scholar] [CrossRef]
  20. Ehab, A.; Aladawi, A.; Burnett, G. Exploring AI-Integrated VR Systems: A Methodological Approach to Inclusive Digital Urban Design. Urban Sci. 2025, 9, 196. [Google Scholar] [CrossRef]
  21. Zhang, J.; Yu, Z.; Li, Y.; Wang, X. Uncovering Bias in Objective Mapping and Subjective Perception of Urban Building Functionality: A Machine Learning Approach to Urban Spatial Perception. Land 2023, 12, 1322. [Google Scholar] [CrossRef]
  22. Dane, G.; Evers, S.; Berg, P.v.D.; Klippel, A.; Verduijn, T.; Wallgrün, J.O.; Arentze, T. Experiencing the future: Evaluating a new framework for the participatory co-design of healthy public spaces using immersive virtual reality. Comput. Environ. Urban Syst. 2024, 114, 102194. [Google Scholar] [CrossRef]
  23. Schewenius, M.; Wallhagen, M. Virtual Reality in planning, design, and management of urban green and blue infrastructure. Front. Virtual Real. 2024, 5, 1432556. [Google Scholar] [CrossRef]
  24. Boos, U.C.; Reichenbacher, T.; Kiefer, P.; Sailer, C. An augmented reality study for public participation in urban planning. J. Locat. Based Serv. 2023, 17, 48–77. [Google Scholar] [CrossRef]
  25. Kouzeleas, S. Architectural and Urban Spatial Digital Simulations. Int. J. Eng. Model. 2024, 36, 95–118. [Google Scholar] [CrossRef]
  26. Creem-Regehr, S.H.; Stefanucci, J.K.; Bodenheimer, B. Perceiving distance in virtual reality: Theoretical insights from contemporary technologies. Philos. Trans. R. Soc. B 2023, 378, 20210456. [Google Scholar] [CrossRef] [PubMed]
  27. Zacharias, J. Preferences for view corridors through the urban environment. Landsc. Urban Plan. 1999, 43, 217–225. [Google Scholar] [CrossRef]
  28. Alkhresheh, M. Preference for void-to-solid ratio in residential facades. J. Environ. Psychol. 2012, 32, 234–245. [Google Scholar] [CrossRef]
  29. Al-Kodmany, K. Visualization Tools and Methods in Community Planning: From Freehand Sketches to Virtual Reality. J. Plan. Lit. 2002, 17, 189–211. [Google Scholar] [CrossRef]
  30. Lange, E. The limits of realism: Perceptions of virtual landscapes. Landsc. Urban Plan. 2001, 54, 163–182. [Google Scholar] [CrossRef]
  31. Ferwerda, J. Three Varieties of Realism in Computer Graphics. In Proceedings of the Human Vision and Electronic Imaging VIII, Santa Clara, CA, USA, 17 June 2003; Volume 5007. [Google Scholar] [CrossRef]
  32. Bosselmann, P. Representation of Places: Reality and Realism in City Design. 1998. Available online: https://api.semanticscholar.org/CorpusID:107906093 (accessed on 15 October 2022).
  33. Zahid, H.; Hijazi, I.; Donaubauer, A.; Kolbe, T.H. Enhancing Realism in Urban Simulations: A Mapping Framework for the German National Standard XPlanung and CityGML. In Recent Advances in 3D Geoinformation Science; Kolbe, T.H., Donaubauer, A., Beil, C., Eds.; Springer Nature: Cham, Switzerland, 2024; pp. 437–457. [Google Scholar]
  34. Newman, M.; Gatersleben, B.; Wyles, K.J.; Ratcliffe, E. The use of virtual reality in environment experiences and the importance of realism. J. Environ. Psychol. 2022, 79, 101733. [Google Scholar] [CrossRef]
  35. Jung, S.; Lindeman, R.W. Perspective: Does Realism Improve Presence in VR? Suggesting a Model and Metric for VR Experience Evaluation. Front. Virtual Real. 2021, 2, 693327. [Google Scholar] [CrossRef]
  36. Alkhresheh, M. Enclosure as a Function of Height-to-Width Ratio and Scale: Its Influence on User’s Sense of Comfort and Safety in Urban Street Space. Ph.D. Thesis, University of Florida, Gainesville, FL, USA, May 2007. [Google Scholar]
  37. Mondschein, A.; Blumenberg, E.; Taylor, B. Accessibility and Cognition: The Effect of Transport Mode on Spatial Knowledge. Urban Stud. 2010, 47, 845–866. [Google Scholar] [CrossRef]
  38. Napieralski, P.E.; Altenhoff, B.M.; Bertrand, J.W.; Long, L.O.; Babu, S.V.; Pagano, C.C.; Kern, J.; Davis, T.A. Near-field distance perception in real and virtual environments using both verbal and action responses. ACM Trans. Appl. Percept. 2011, 8, 1–19. [Google Scholar] [CrossRef]
  39. Plumert, J.M.; Kearney, J.K.; Cremer, J.F.; Recker, K. Distance perception in real and virtual environments. ACM Trans. Appl. Percept. 2005, 2, 216–233. [Google Scholar] [CrossRef]
  40. Serpa, A.; Muhar, A. Effects of plant size, texture and colour on spatial perception in public green areas—A cross-cultural study. Landsc. Urban Plan. 1996, 36, 19–25. [Google Scholar] [CrossRef]
  41. Seehamart, M.; Pueboobpaphan, S.; Pueboobpaphan, R. Actual walking distance vs. Perceived walking distance: Relationship and impact on determining acceptable walking distances to stations of the Bangkok Metro. Results Eng. 2025, 25, 104088. [Google Scholar] [CrossRef]
  42. Montello, D.R. The perception and cognition of environmental distance: Direct sources of information. In Spatial Information Theory A Theoretical Basis for GIS; Hirtle, S.C., Frank, A.U., Eds.; Springer: Berlin/Heidelberg, Germany, 1997; pp. 297–311. [Google Scholar]
  43. Al-Kodmany, K. Using Visualization Techniques for Enhancing Public Participation in Planning and Design: Process, Implementation, and Evaluation. Landsc. Urban Plan. 1999, 45, 37–45. [Google Scholar] [CrossRef]
  44. Smith, T.; Nelischer, M.; Perkins, N. Quality of an urban community: A framework for understanding the relationship between quality and physical form. Landsc. Urban Plan. 1997, 39, 229–241. [Google Scholar] [CrossRef]
  45. Nguyen, T.; Cremer, J.; Kearney, J.; Plumert, J. Effects of scene density and richness on traveled distance estimation in virtual environments. In Proceedings of the ACM SIGGRAPH Symposium on Applied Perception in Graphics and Visualization, Toulouse, France, 27–28 August 2011. [Google Scholar] [CrossRef]
  46. Karjalainen, E.; Tyrväinen, L. Visualization in forest landscape preference research: A Finnish perspective. Landsc. Urban Plan. 2002, 59, 13–28. [Google Scholar] [CrossRef]
  47. Zube, E.H.; Sell, J.L.; Taylor, J.G. Landscape perception: Research, application and theory. Landsc. Plan. 1982, 9, 1–33. [Google Scholar] [CrossRef]
  48. MacEachren, A.M. Travel time as the basis of cognitive distance∗. Prof. Geogr. 1980, 32, 30–36. [Google Scholar] [CrossRef]
  49. Crompton, A.; Brown, F. Distance Estimation in a Small-Scale Environment. Environ. Behav. 2006, 38, 656–666. [Google Scholar] [CrossRef]
  50. Pocock, D.C.D. City of the mind: A review of mental maps of urban areas. Scott. Geogr. Mag. 1972, 88, 115–124. [Google Scholar] [CrossRef]
  51. Yang, P.; Putra, S.; Chaerani, M. Computing the sense of time in urban physical environment. Urban Des. Int. 2007, 12, 115–129. [Google Scholar] [CrossRef]
  52. Kitchin, R.M. Cognitive maps: What are they and why study them? J. Environ. Psychol. 1994, 14, 1–19. [Google Scholar] [CrossRef]
  53. Korshunova-Fucci, V.; van Himbergen, F.F.; Fan, H.M.; Kohlrausch, A.; Cuijpers, R.H. Quantifying Egocentric Distance Perception in Virtual Reality Environment. Int. J. Hum. Comput. Interact. 2024, 40, 5431–5442. [Google Scholar] [CrossRef]
  54. Madsen, C.; Steinø, N.; Lucaci, A.; Sandkvist, E.; Jonstrup, A. Scale Perception in VR for Urban Scale Environments: 360° Photos versus Full 3D Virtual Reality. In Proceedings of the 6th International Conference on Computer-Human Interaction Research and Applications, Valletta, Malta, 27–28 October 2022; SCITEPRESS—Science and Technology Publications: Setúbal, Portugal, 2022; pp. 32–40. [Google Scholar] [CrossRef]
  55. Buck, L.; Paris, R.; Bodenheimer, B. Distance Compression in the HTC Vive Pro: A Quick Revisitation of Resolution. Front. Virtual Real. 2021, 2, 728667. [Google Scholar] [CrossRef]
  56. Zhang, J.; Yang, X.; Jin, Z.; Li, L. Distance Estimation in Virtual Reality Is Affected by Both the Virtual and the Real-World Environments. Iperception 2021, 12, 20416695211023956. [Google Scholar] [CrossRef]
  57. Vaziri, K.; Liu, P.; Aseeri, S.; Interrante, V. Impact of visual and experiential realism on distance perception in VR using a custom video see-through system. In Proceedings of the ACM Symposium on Applied Perception, New York, NY, USA, 16–17 September 2017; pp. 1–8. [Google Scholar] [CrossRef]
  58. Guzsvinecz, T.; Perge, E.; Szűcs, J. Examining the Results of Virtual Reality-Based Egocentric Distance Estimation Tests Based on Immersion Level. Sensors 2023, 23, 3138. [Google Scholar] [CrossRef]
  59. Lew, W.H.; Coates, D.R. The effect of target and background texture on relative depth discrimination in a virtual environment. Virtual Real. 2024, 28, 103. [Google Scholar] [CrossRef]
  60. Phillips, L.; Interrante, V. A little unreality in a realistic replica environment degrades distance estimation accuracy. In Proceedings of the 2011 IEEE Virtual Reality Conference, Washington, DC, USA, 19–23 March 2011; pp. 235–236. [Google Scholar] [CrossRef]
  61. Næss, P. Critical Realism, Urban Planning and Urban Research. Eur. Plan. Stud. 2015, 23, 1228–1244. [Google Scholar] [CrossRef]
  62. Brisotto, C.; Carney, J.; Foroutan, F.; Ochoa, K.S.; Schroder, W. Exploring the Role of AI in Urban Design Research: A Comparative Analysis of Analogical and Machine Learning Approaches. Plan J. 2023, 8, 237–264. [Google Scholar] [CrossRef]
  63. McGowin, G.; Fiore, S.M. Mind the Gap! Advancing Immersion in Virtual Reality—Factors, Measurement, and Research Opportunities. In Proceedings of the Human Factors and Ergonomics Society Annual Meeting, Phoenix, AZ, USA, 9–13 September 2024; Volume 68, pp. 1648–1654. [Google Scholar] [CrossRef]
  64. Stamps, A.E., III; Smith, S. Environmental Enclosure in Urban Settings. Environ. Behav. 2002, 34, 781–794. [Google Scholar] [CrossRef]
  65. Oselinsky, K.; Spitzer, A.N.; Yu, Y.; Ortega, F.R.; Malinin, L.H.; Curl, K.A.; Leach, H.; Graham, D.J. Virtual reality assessment of walking in a modifiable urban environment: A feasibility and acceptability study. Sci. Rep. 2023, 13, 5867. [Google Scholar] [CrossRef]
  66. Cullen, G. The Concise Townscape; Taylor & Francis: London, UK, 1961. [Google Scholar]
  67. Mouratidis, K. Urban planning and quality of life: A review of pathways linking the built environment to subjective well-being. Cities 2021, 115, 103229. [Google Scholar] [CrossRef]
  68. Pereira, M.F.; Santana, P.; Vale, D.S. The Impact of Urban Design on Utilitarian and Leisure Walking—The Relative Influence of Street Network Connectivity and Streetscape Features. Urban Sci. 2024, 8, 24. [Google Scholar] [CrossRef]
  69. Sharma, A. AI-Driven Virtual Reality Applications. SSRN Electron. J. 2015, 15, 465–473. [Google Scholar]
Figure 1. Previous research themes related to urban spaces, visualization, realism, and distance perception. This bibliometric-inspired map highlights key interconnections, derived from a systematic review of sources, akin to VOSviewer Ver. 1.6.20 analysis.
Buildings 15 03565 g001
Figure 2. (a) Urban squares—variations in width and depth; (b) urban streets’ variations in width.
Buildings 15 03565 g002
Figure 3. Three variations in distance orientation: width, height, and depth represented by yellow arrows. (a) Urban squares. (b) Urban streets.
Buildings 15 03565 g003
Figure 4. Four variations in the level of realism. (1) Masses—basic geometric shapes; (2) masses with lines—surfaces with floor lines; (3) textured—surfaces with detailed textures; (4) articulated—detailed render incorporating masses, textures, and street furniture.
Buildings 15 03565 g004
Figure 5. A typical question in the survey; participants were asked to enter their estimations.
Buildings 15 03565 g005
Figure 6. Relationship between perceived and simulated distances, displayed across all directions combined (overall r = 0.8, p < 0.001) and separately by width (r = 0.85, p < 0.001), height (r = 0.82, p < 0.001), and depth (r = 0.79, p < 0.001). (a) All Distance Orientations. (b) Width Distances. (c) Height Distances. (d) Depth Distances.
Buildings 15 03565 g006
Figure 7. Influence of objective distance and distance orientation on compression. (a) The longer the simulated distance, the larger the compression. (b) Depth distances are more compressed than both width and height distances.
Buildings 15 03565 g007
Figure 8. Compression being influenced by levels of realism and distance orientation. (a) Higher levels of realism are less compressed. (b) Depth distances are more compressed than both width and height distances. LORs 3 and 4 are less compressed.
Buildings 15 03565 g008
Table 1. Independent and dependent variables.
VariableScaleRange
Independent
Variables
Simulated distance
Level of realism
Distance Orientation
Interval
Ordinal
Nominal
7 m–130 m
1–4 (Masses –Articulated)
Width, Height, Depth
Randomizing VariablesSpace width
Space depth
Space height
Space Type
Interval
Interval
Interval
Nominal
10 m–130 m
15 m–150 m
7 m–19 m
Square, Street
Dependent
Variable
Perceived distanceIntervalResponses range (0.01 m–1500 m)
Table 2. Correlation between simulated distance and compression values.
Simulated DistanceDifference Ratio
Simulated DistancePearson Correlation

Sig. (2-tailed)
10.939 **

0.000
N216216
** Correlation is significant at the 0.01 level (two-tailed).
Table 3. Regression model: simulated distance, LOR, and distance orientation predicted 95% of compression values.
Model StepPredictors IncludedR2ΔR2F-Changep-Value
1Objective Distance0.88--<0.001
2+Level of Realism (LOR)0.940.06213.0<0.001
3+Distance Orientation0.950.00623.6<0.001
4+Distance × LOR0.9560.00611.7<0.001
ModelRR SquareAdjusted R SquareStd. Error of the Estimate
10.9720.9460.9455.62379
Standardized
Unstandardized CoefficientsCoefficients
ModelBStd. ErrorBetatSig.
(Constant)9.8401.531 6.4280.000
Simulated Distance0.7250.0130.92754.1260.000
LOR Two groups−11.9150.765−0.250−15.5690.000
Distance Type1.0150.5010.0352.0270.044
Predictors: (Constant), Distance Type, LOR Two groups, Simulated Distance. Dependent Variable: Compression. Randomizing Variables (Width, Depth, Height, Type): No significant contribution (p > 0.05; ΔR2 = 0).
Disclaimer/Publisher’s Note: The statements, opinions and data contained in all publications are solely those of the individual author(s) and contributor(s) and not of MDPI and/or the editor(s). MDPI and/or the editor(s) disclaim responsibility for any injury to people or property resulting from any ideas, methods, instructions or products referred to in the content.