Article

Structural Robustness Analysis of Reverse Arch Beam String-Inclined Column Structure

1
Hunan Architectural Design Institute Group Co., Ltd., Changsha 410017, China
2
School of Civil and Environmental Engineering, Changsha University of Science and Technology, Changsha 410114, China
*
Author to whom correspondence should be addressed.
Buildings 2025, 15(19), 3556; https://doi.org/10.3390/buildings15193556
Submission received: 29 June 2025 / Revised: 15 August 2025 / Accepted: 22 August 2025 / Published: 2 October 2025
(This article belongs to the Section Building Structures)

Abstract

Reverse arch beam string-inclined column structures have been applied in large-scale event venues due to their unique load-bearing characteristics. However, ensuring their resistance to progressive collapse remains a critical challenge. To investigate the structural robustness of reverse arch beam string-inclined column structure in practical engineering applications, a simplified finite element model is developed herein using ANSYS APDL. The natural frequencies of the actual engineering structure are measured through the hammering method to validate the accuracy of the simulation model. Based on the component removal method, different structural components are removed and finite element analysis is carried out. The dynamic response of the overall structure and the importance coefficients of individual components after removal are examined. The results demonstrate good agreement between the natural frequencies measured by the impact hammer test and those predicted by the finite element simulations, with the difference being only 1.67%. It is found that upper beam failure is fatal to this structure; the outer inclined columns significantly affect the robustness of the structure, while the failure of a single strut has a negligible impact. According to the component division, the importance of the overall robustness of the structure is in the following order: upper beam > column end > column base > strut. The maximum stress is mostly located in beam 7, beam 8, beam 28, and beam 107, which needs to be focused on.

1. Introduction

Progressive collapse represents a particularly catastrophic failure mode in structural engineering, characterized by the disproportionate propagation of local damage leading to the collapse of a significant portion or even the entirety of a structure, far exceeding the consequences of the initial triggering event [1,2]. Such cascading failures can be initiated by unforeseen extreme events like impacts, explosions, fire, or even undetected material degradation or construction errors [3]. Such events can lead to catastrophic consequences far exceeding the initial damage, resulting in significant casualties, economic losses, and social disruption. Consequently, the study of the progressive collapse and robustness of building structures has become a paramount concern in structural engineering.
A beam string structure is connected by an upper beam and a cable through a vertical strut. It has good mechanical properties and high structural efficiency, and has broad application prospects as a roof [4]. At present, the research on structural robustness mainly focuses on reinforced concrete (RC) structures [5,6,7]. Yang et al. [8,9,10,11] studied the mechanism and performance of RC slab structures under different working conditions and situations. It was found that the compressive and tensile membrane actions were the main resistance mechanisms during the loading and collapse stages of RC slab structures, respectively. The punching failure of the slab and the fracture of the slab reinforcement will lead to progressive collapse. Anil et al. [12,13,14,15,16] studied the progressive collapse behavior of RC frame structures under fire or high temperature conditions. Through the establishment of finite element model analysis, it is shown that the failure of the damaged RC frame caused by slight fire is determined by the fracture of the steel bar at the beam end near the side column, while the RC frame damaged by severe fire is due to the fracture of the steel bar at the top steel bar cut-off point. To evaluate the structural dynamic reliability under extreme loading scenarios, equivalent nonlinear system methods have been adopted in prior studies [17], demonstrating the effectiveness in capturing complex Duffing-type behavior.
However, with the continuous occurrence of large-span collapses [18,19,20,21], it has been realized that structural systems such as steel frames and concrete shear walls have significant limitations under extreme working conditions. In this context, beam string structures have demonstrated significant potential for resisting continuous collapse by realizing a diversified distribution of load paths through a self-balancing mechanism generated by prestressing [22]. In order to investigate the progressive collapse behavior of beam string structure after the failure of cables, Zhang et al. [23,24,25,26] conducted numerical simulations of the progressive collapse of the structure under different loading conditions, investigated the displacement and force response of the structure after the destruction of the cables, and revealed the collapse mechanism of the structure after the destruction of the cables: After the fracture of the cable, the plastic strain first appears in the mid-span region, and then the upper chord and the web member buckle in turn, which eventually leads to the overall collapse. Xu et al. [27] found that structures using discontinuous cable strut joints have higher anti-collapse capabilities compared to those using continuous cable-strut joints. Zhao et al. [28] proposed a new type of bi-directional glued timber tensioned upper beams and investigated its mechanical properties. Zhou et al. [29] proposed an improved design method using a fixed load dividing factor and an optimal resistance coefficient, which can improve the collapse carrying performance of the beam string structure. Zhang et al. [30] proposed an ultra-lightweight CFRP beam string structure. Driven by Dempster–Shafer (D-S) evidence theory, Zhu et al. [31] proposed a method based on digital twin (DT) technology to capture the key components of beam string structures and perform intelligent safety analysis., thus providing a basis for the safe maintenance of the structure. The current research on the structural robustness of beam string structure mainly focuses on the tension cable failure scenarios.
In recent years, the reverse arch beam string-inclined column structure has been applied in large-span public buildings such as stadiums, exhibition centers, and transportation hubs, owing to its structural efficiency, material economy, and esthetics. However, the intricate force transfer mechanisms arising from highly interdependent load paths among these distinct structural components introduce unique challenges to system robustness, particularly under localized component failure scenarios. The failure of critical components can lead to severe asymmetric loading, significant unbalanced forces, and complex dynamic force redistribution within the relatively low-redundancy large-span roof system, a scenario that has not been adequately addressed in current research or relevant design codes. Motivated by the urgent need to address this knowledge gap and to ensure the safety of these widely adopted structures, this study aims to comprehensively investigate the progressive collapse resistance mechanisms of the reverse arch beam string-inclined column structure.
This study investigates the influence of various structural components on the robustness of a reverse arch beam string-inclined column structure. Unlike previous studies that typically select the cable as the failure location, representative components from multiple positions are analyzed. The ANSYS Mechanical APDL 2021 is used to establish the finite element model of the reverse arch beam string-inclined column structure based on a convention and exhibition center in Changsha. Using the component removal method to remove different components, the deformation and stress of the remaining structure after demolition is calculated, and the dynamic response law of the overall structure after demolition is explored. According to the failure criterion, whether the structure will undergo progressive collapse, and the robustness of the structure is evaluated. A component importance coefficient is proposed to explore the influence of different components on the robustness of the reverse arch beam string-inclined column structure.

2. Field Measurements

2.1. Brief Introduction of Structure

The studied structure is a representative single frame extracted from a large exhibition center in Changsha, China, and is part of the main structural system of the exhibition hall. The facility is primarily used for large public events and gatherings, such as concerts or sporting activities. Investigating the progressive collapse of this type of structures is of significance for ensuring the safety of the people using or occupying the structure. In its original design, only conventional wind and seismic loads were considered; unconventional loads such as vehicle impacts or explosions were not included. The structure was designed in compliance with the provisions of the steel structure building code, thereby satisfying the prescribed ductility requirements.
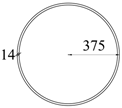
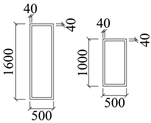
The structure has a total span of 172.8 m and consists of two major parts: the lower frame support system and the upper beam string structure system. The lower frame support system is a steel-tube concrete column–steel beam structure, and the roof system is a herringbone reverse arch beam string structure system. The main beam of the upper chord is 1600 mm × 500 mm × 20 mm box-shaped steel beam, and the lower chord is arranged with two 97 high vanadium-plated tension cables. The component cross-section numbering and dimensions of the reverse arch beam string-inclined column structure are shown in Figure 1. In view of the symmetrical structure, in order to simplify the diagram, only half of the structure is dimensioned. All cable struts (CSs) use the CS-1 cross-section. In the section form of the upper beam, UB-4 and UB-5 are box-type beams with variable cross-sections. Detailed cross-sectional dimensions of each component are provided in Table 1.

2.2. Test Methods

The hammering method is a type of experimental modal analysis used to identify the natural frequencies of a structure through transient excitation [32,33,34,35]. Its core principle involves striking the structure’s surface with an impact hammer to generate a short-duration force, thereby exciting broadband vibrations that contain multiple modal frequencies. Accelerometers or displacement sensors are arranged on the structure to measure the vibration response signals. The excitation force and corresponding response signals are synchronously collected by a data acquisition system. A Fourier transform is then performed on the time-domain signals to obtain frequency-domain information. The frequency response function (FRF) is calculated, and the natural frequencies of each mode are identified by analyzing the peak positions in the FRF amplitude spectrum.
The hammering method is used for modal testing and data acquisition. To investigate the dynamic characteristics of the structure, an excitation method needed to be selected that would be practical for its geometry and size. Considering the large volume of the structure (span 172.8 m), this test adopts the single-point excitation method with excitation at a fixed location. Specifically, the force hammer is used to apply excitation to the structure, measure the response of the acceleration signal, and collect and export the acceleration time-domain data using the dynamic signal acquisition and analysis system software. The acceleration signal is recognized by MATLAB R2024a, and Fourier transform is performed to transform the time domain signal into frequency domain signal to obtain the intrinsic frequency of the structure. The actual structure and field test are shown in Figure 2.

2.3. Analysis of Test Results

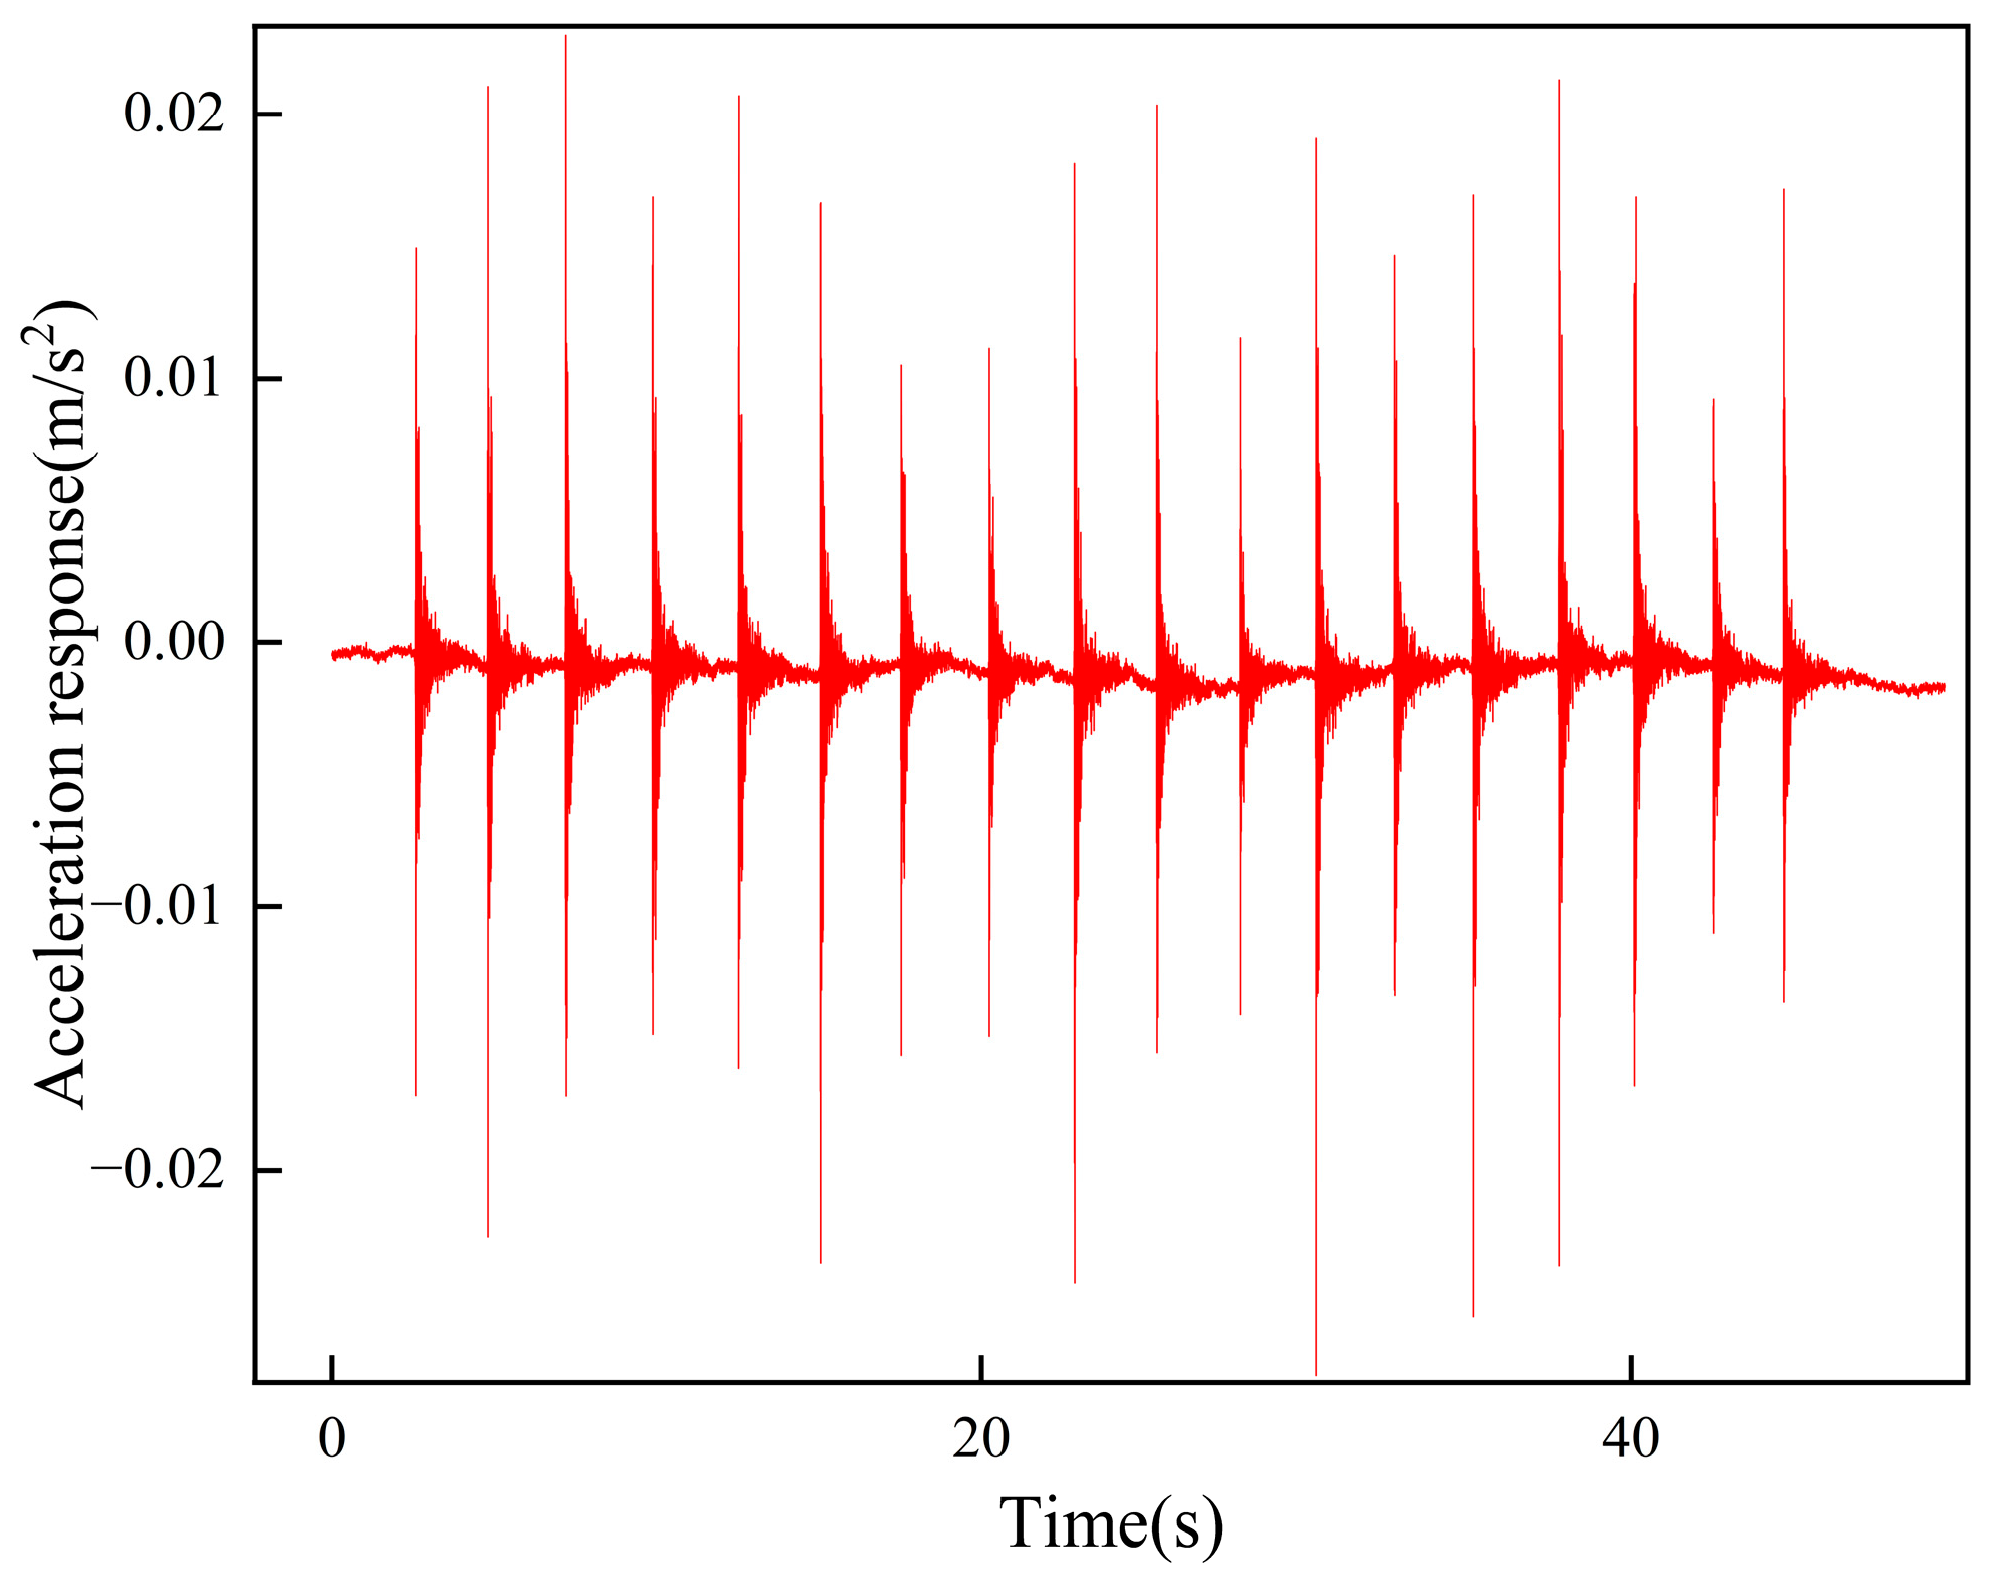
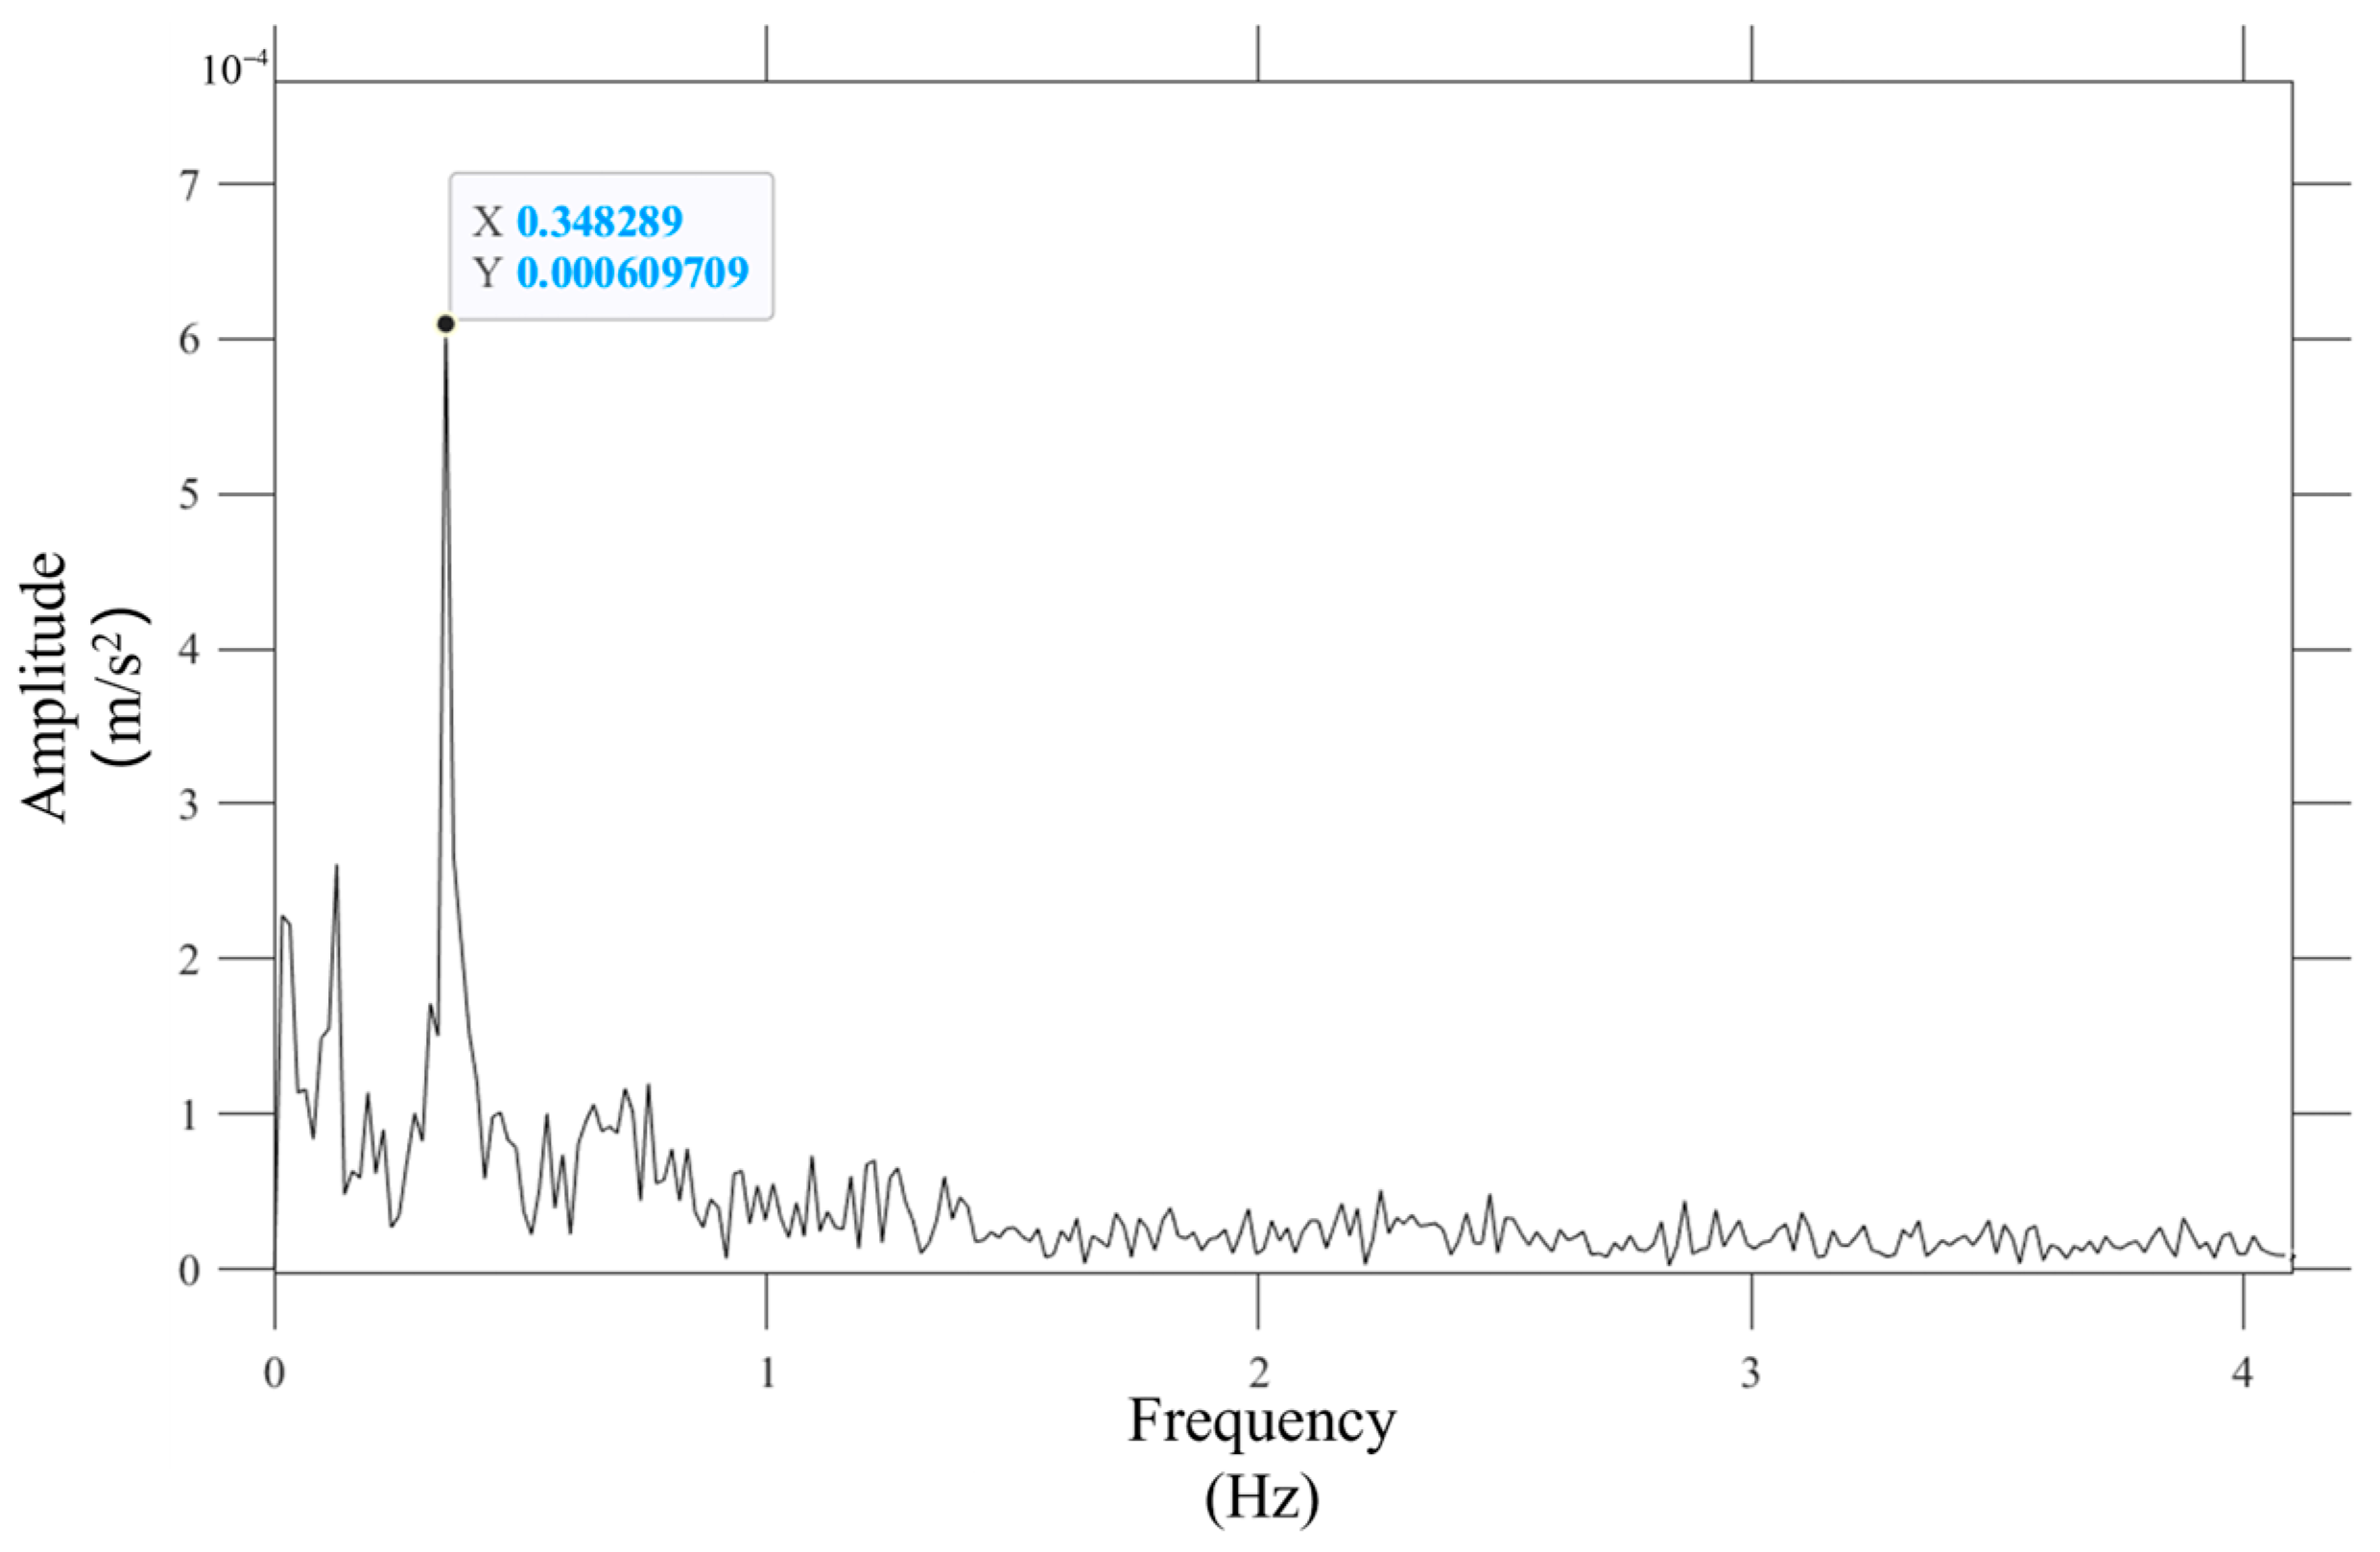
The acceleration time-domain signal collected by dynamic signal acquisition and analysis system software is shown in Figure 3. The time-domain signal shows the free-decaying vibration characteristics of the structure under environmental excitation, and the waveform presents a typical exponential decay law. The acceleration frequency domain signal after MATLAB Fourier transform is shown in Figure 4, and the frequency domain analysis shows a significant single peak at 0.348 Hz, which is in line with the first-order modal characteristics. The intrinsic frequency of the reverse arch beam string-inclined column structure is obtained as 0.348 Hz.

3. Finite Element Analysis

3.1. Finite Element Modeling Methods

ANSYS Mechanical APDL 2021 is used for structural modal analysis, and the structural model of the reverse arch beam string-inclined column structure is shown in Figure 5. The concrete-filled steel tubular (CFST) column is fixedly restrained at the lower end, hinged at the upper end with the UB, and the CS is hinged with the upper beam, with lateral restraints applied at the connection between CFST, CS, and UB. The UB and CFST are simulated with the BEAM188 element, and the tension cables are simulated with the CABLE280 element, with the prestressing force of 500 MPa. The roof load is simulated by MASS21 element, which is applied to the joint of beam string and concrete-filled steel tube column and strut. The mass of MASS21 element is 3000 kg. The materials used in the structure are Q345 steel and C60 concrete, and the material parameters of each member are shown in Table 2. The material adopts the bilinear ideal elastic–plastic model.

3.2. Model Verification

The modal analysis is performed using the chunked Lanczos method [36], and the number of vibration patterns is taken as 10. The 1st-order vibration of the frame model is shown in Figure 6, and the obtained fundamental frequency of one-bay frame vibration is 0.3422 Hz, which is smaller than the measured value of 0.348 Hz. The relative error between the two is only 1.67%, which meets the requirement of test accuracy, indicating that the finite element model established is applicable and has good accuracy.

3.3. Initial State

The analysis model in this paper is a practical engineering building. Therefore, only the influence of sudden failure of components under normal operation and extreme load conditions on the reverse arch beam string-inclined column structure is considered, and its structural robustness is analyzed. The normal operation conditions are as follows: there is no wind load, which is only affected by roof load and self-weight. The roof load is simulated by MASS21 element, which is applied to the joint of beam string and concrete-filled steel tube column and strut. The mass of MASS21 element is 3000 kg. The extreme load conditions are as follows: (1) a design wind load of 60 kN/m, derived from the converted typhoon wind speed under extreme weather conditions; (2) an enhanced roof load, conservatively represented by increasing the mass of the MASS21 elements to 5000 kg (compared to 3000 kg under normal operation) to account for severe roof load (e.g., severe snowstorms or the superimposition of additional equipment and materials), the roof load is applied to the joint of beam string and concrete-filled steel tube column and strut; and (3) the structure’s inherent self-weight.
The structural robustness analysis model is shown in Figure 7. The vertical displacement of the reverse arch beam string-inclined column structure frame under normal operation and extreme load conditions is shown in Figure 8.

4. Structural Robustness Analysis

4.1. Methods for Analyzing Resistance to Progressive Collapse

The analysis methods and design codes for progressive collapse vary from country to country, such as the National Building Code of Canada [37], the General Services Administration [38], and the Uniform Standards for the Reliability Design of Structures [39], but the core objective is the same: to prevent local damage from causing overall structural failure through redundancy and ductile construction and load redistribution capacity.
The member removal method [40] is used to simulate the removal of different members of a reverse arch beam string-inclined column structure to investigate the dynamic response of the overall structure and the importance coefficients of the members after the removal of different members. The core idea of the component removal method is to simulate the load redistribution capacity of the remaining structure after local failure by virtually removing key components (e.g., columns, beams, joints.), so as to verify whether the structure is still able to maintain the overall stability and to avoid the progressive collapse triggered by the local damage.
In the finite element simulations performed using ANSYS, both material nonlinearity and geometric nonlinearity are incorporated to ensure accurate representation of the structural behavior under progressive collapse conditions. Material nonlinearity was modeled using an ideal bilinear elastoplastic constitutive model with a clear yield point and post-yield behavior.
In this paper, an importance coefficient is proposed to evaluate the influence of failed components on the robustness of the structure. γi and γi′ are the important coefficients of failure components under normal operation conditions and extreme load conditions, respectively. They are calculated as the relative change in mid-span node displacement before and after the component failure. Where i is the number of the failed component, and the equation of γi and γi′ can be written as follows:
γ i = S 0 S i / S 0
γ i = S 0 S i / S 0
Among them, S0 and S0′ are the vertical displacement of the mid-span node position of the structure before the failure of the i-component under normal operation and extreme load conditions, respectively. Si and Si′ are the vertical displacement of the mid-span node position after the balance of the i-component failure structure under normal operation and extreme load conditions, respectively. The larger the importance coefficient, the greater the contribution of the component to the robustness of the structure, and vice versa.
The failure components and some components are shown in Figure 9. The table of failed components is shown in Table 3.

4.2. Column End Failure

Figure 10 shows the design of end column connection in practical engineering. The connection design exhibits clear hinging behavior. Therefore, the column ends are modeled as hinged in the finite element analysis. Additionally, considering the real structural conditions where lateral movement is restrained by adjacent elements or structural systems, a lateral constraint was applied at the top of the end columns to ensure stability while maintaining realistic boundary conditions.
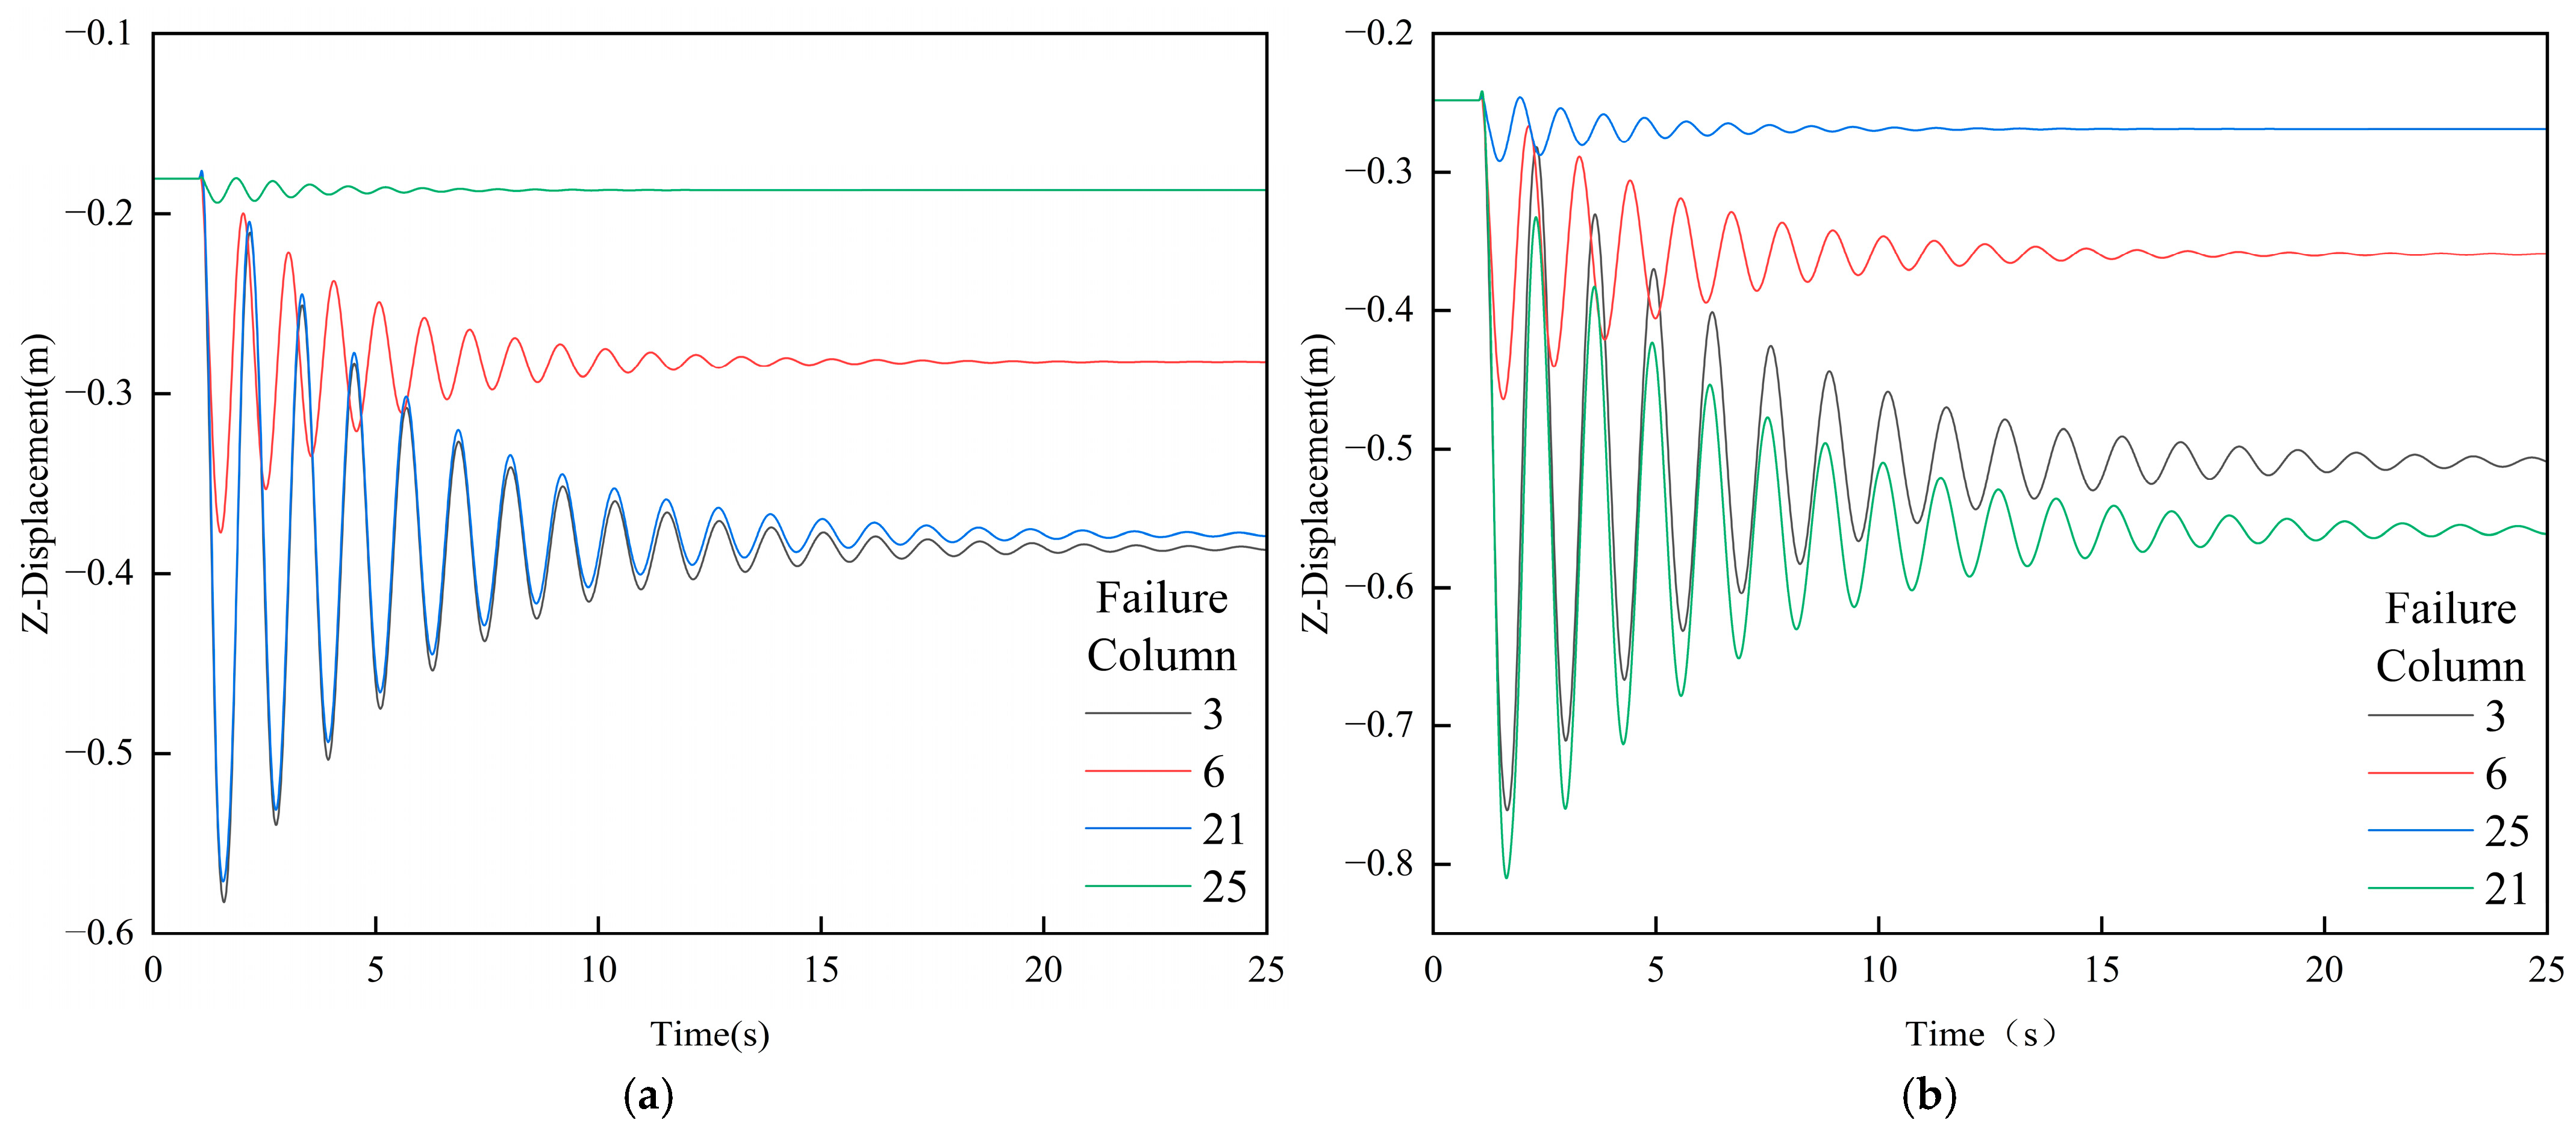
Taking the reverse arch beam string-inclined column structure as the research object, the influence of column end failure on its structural robustness is investigated. The vertical displacement time history curves of the mid-span node (x node) of the beam string after the failure of each concrete-filled steel tube column end are shown in Figure 11. The displacement data of the mid-span node of the beam string before and after failure are shown in Table 4 and Table 5, and the importance coefficient of each component is shown in Table 6.
From the displacement time history curve shown in the above diagram, it can be seen that the structure fails at the end of the concrete-filled steel tubular column at 1 s, and the mid-span node of the beam string has a sudden displacement. Then it oscillates repeatedly in the vertical direction and finally tends to be stable under its own damping. It can be seen from Table 4 that before and after the failure of the end of the concrete-filled steel tubular column, the maximum displacement variation of the x node is 401.96 mm, each component did not yield. The structure has not completely collapsed.
From the above chart, it can be seen that compared with the normal operation and maintenance situation, the maximum displacement variation under extreme load conditions and the displacement of the mid-span node of the beam upper beam after the column end failure balance become larger, with a maximum increase of about 43.8%. Each component does not reach the yield strength. The structure has not completely collapsed and is finally stable.
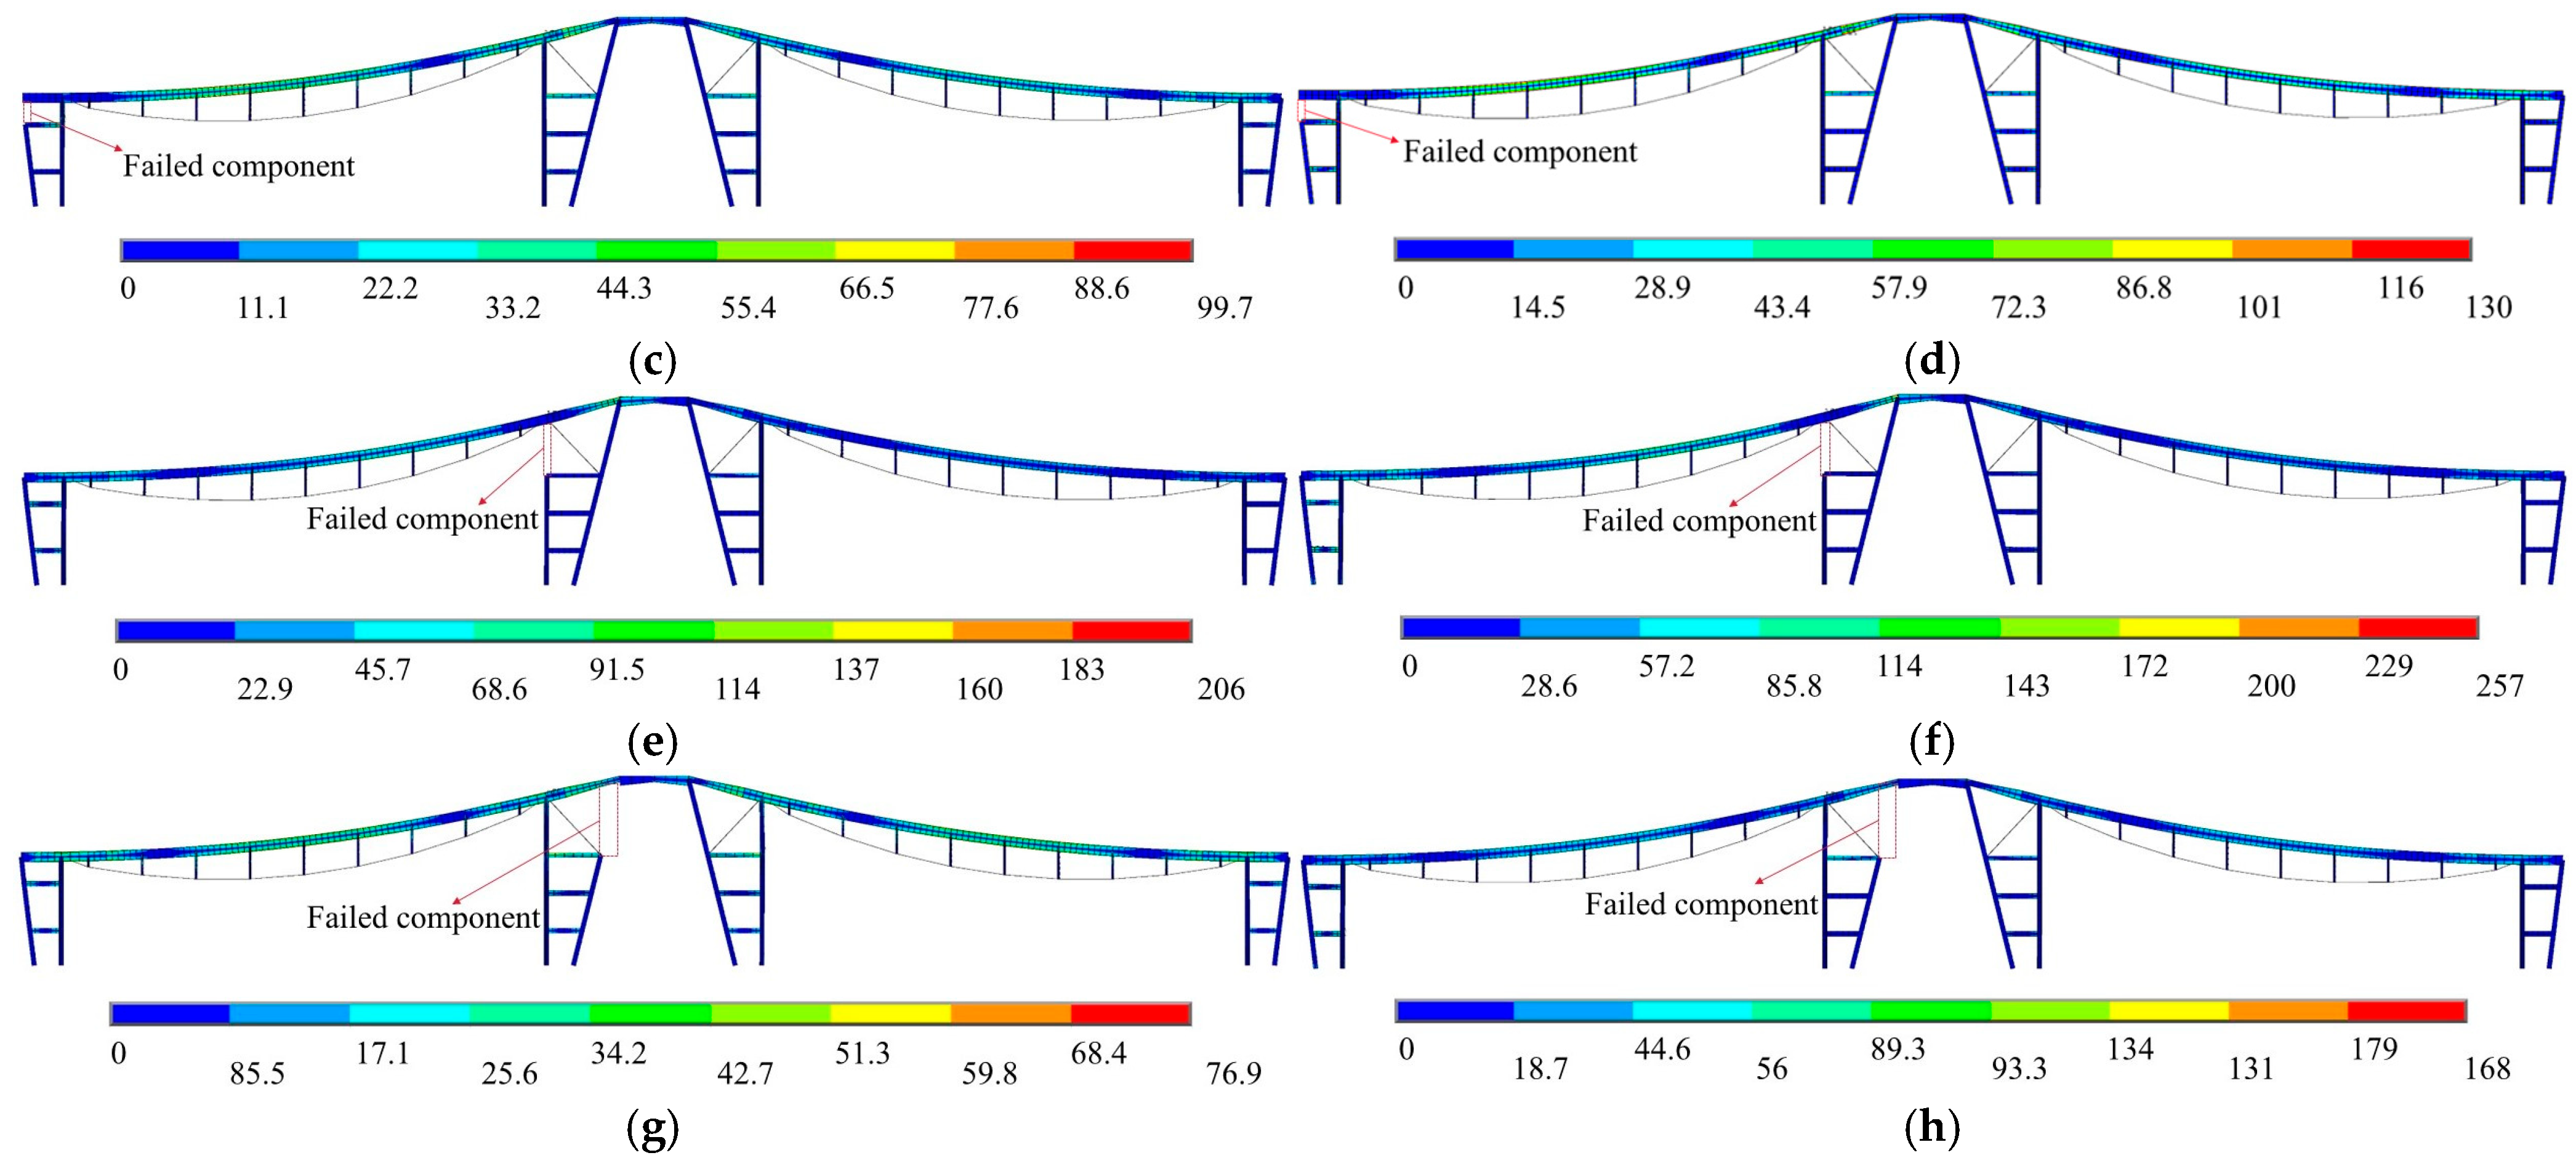
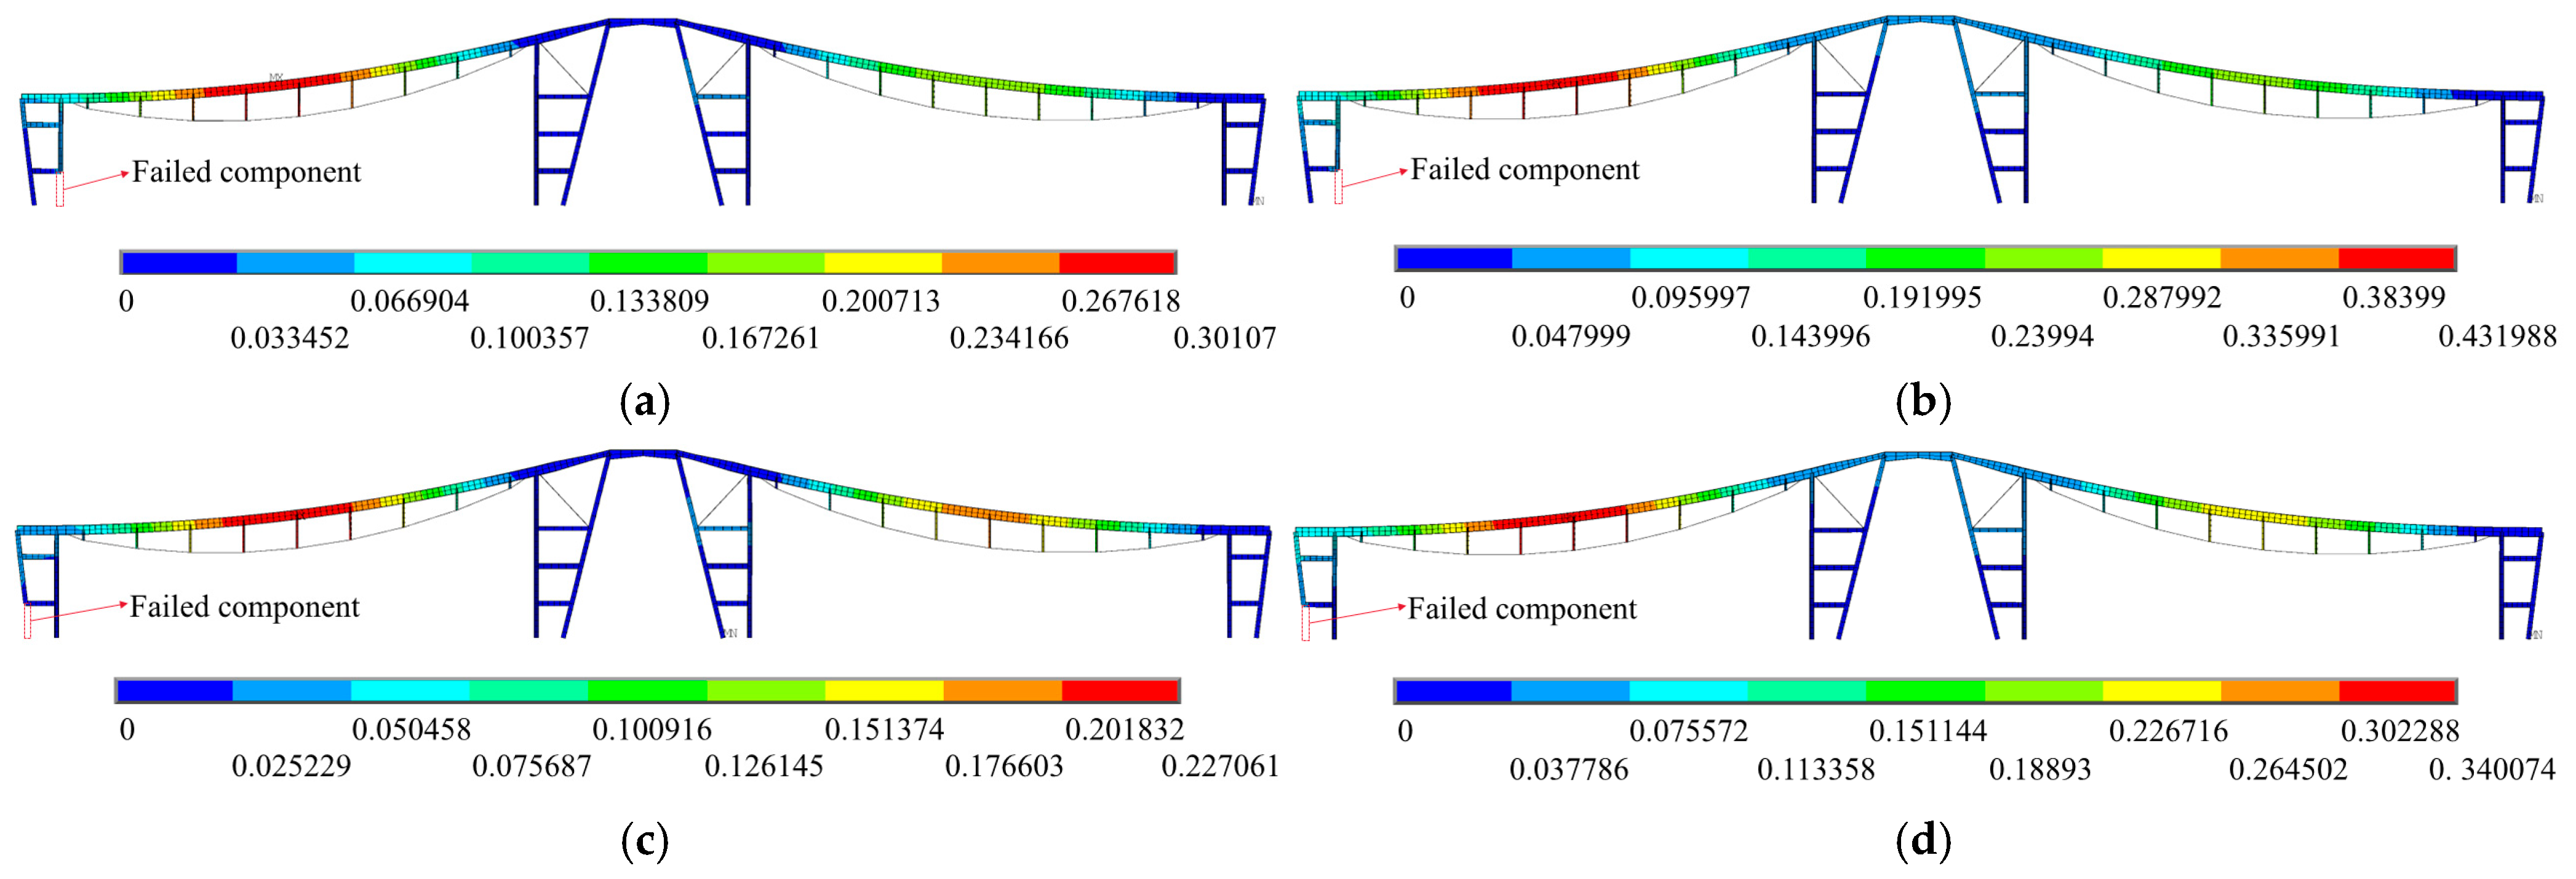
Under normal operation, the importance coefficients of column 3, column 6, column 21 and column 25 are 1.142, 0.564, 1.100 and 0.035, respectively. The importance of column 3 and column 21 is significantly greater than that of column 25 and column 6. Column 25 has little effect on the collapse performance of the whole structure. Under extreme load, the maximum stress value is 257 MPa, which still meets the requirements of elastic design. The final displacement deformation and stress after the failure of each column end are shown in Figure 12 and Figure 13. Note: A represents normal operation and B represents extreme load, the same below.

4.3. Column Base Failure

The actual foundations consist of bored cast-in-place piles (rotary drilling bored piles), which offer substantial lateral and rotational stiffness. In the finite element model, the bases of the columns were idealized as fixed supports. Therefore, the fixed-base modeling assumption is consistent with the real boundary conditions provided by the pile foundations and does not notably affect the predicted collapse behavior.
Taking the reverse arch beam string-inclined column structure as the research object, the influence of column bottom failure on its structural robustness is investigated. After the failure of the bottom of each concrete-filled steel tubular column, the vertical displacement time history curve of the mid-span joint (x node) of the beam upper beam are shown in Figure 14. The displacement data of the mid-span joint of the beam upper beam before and after the failure are shown in Table 7 and Table 8, and the importance coefficient of each component is shown in Table 9.
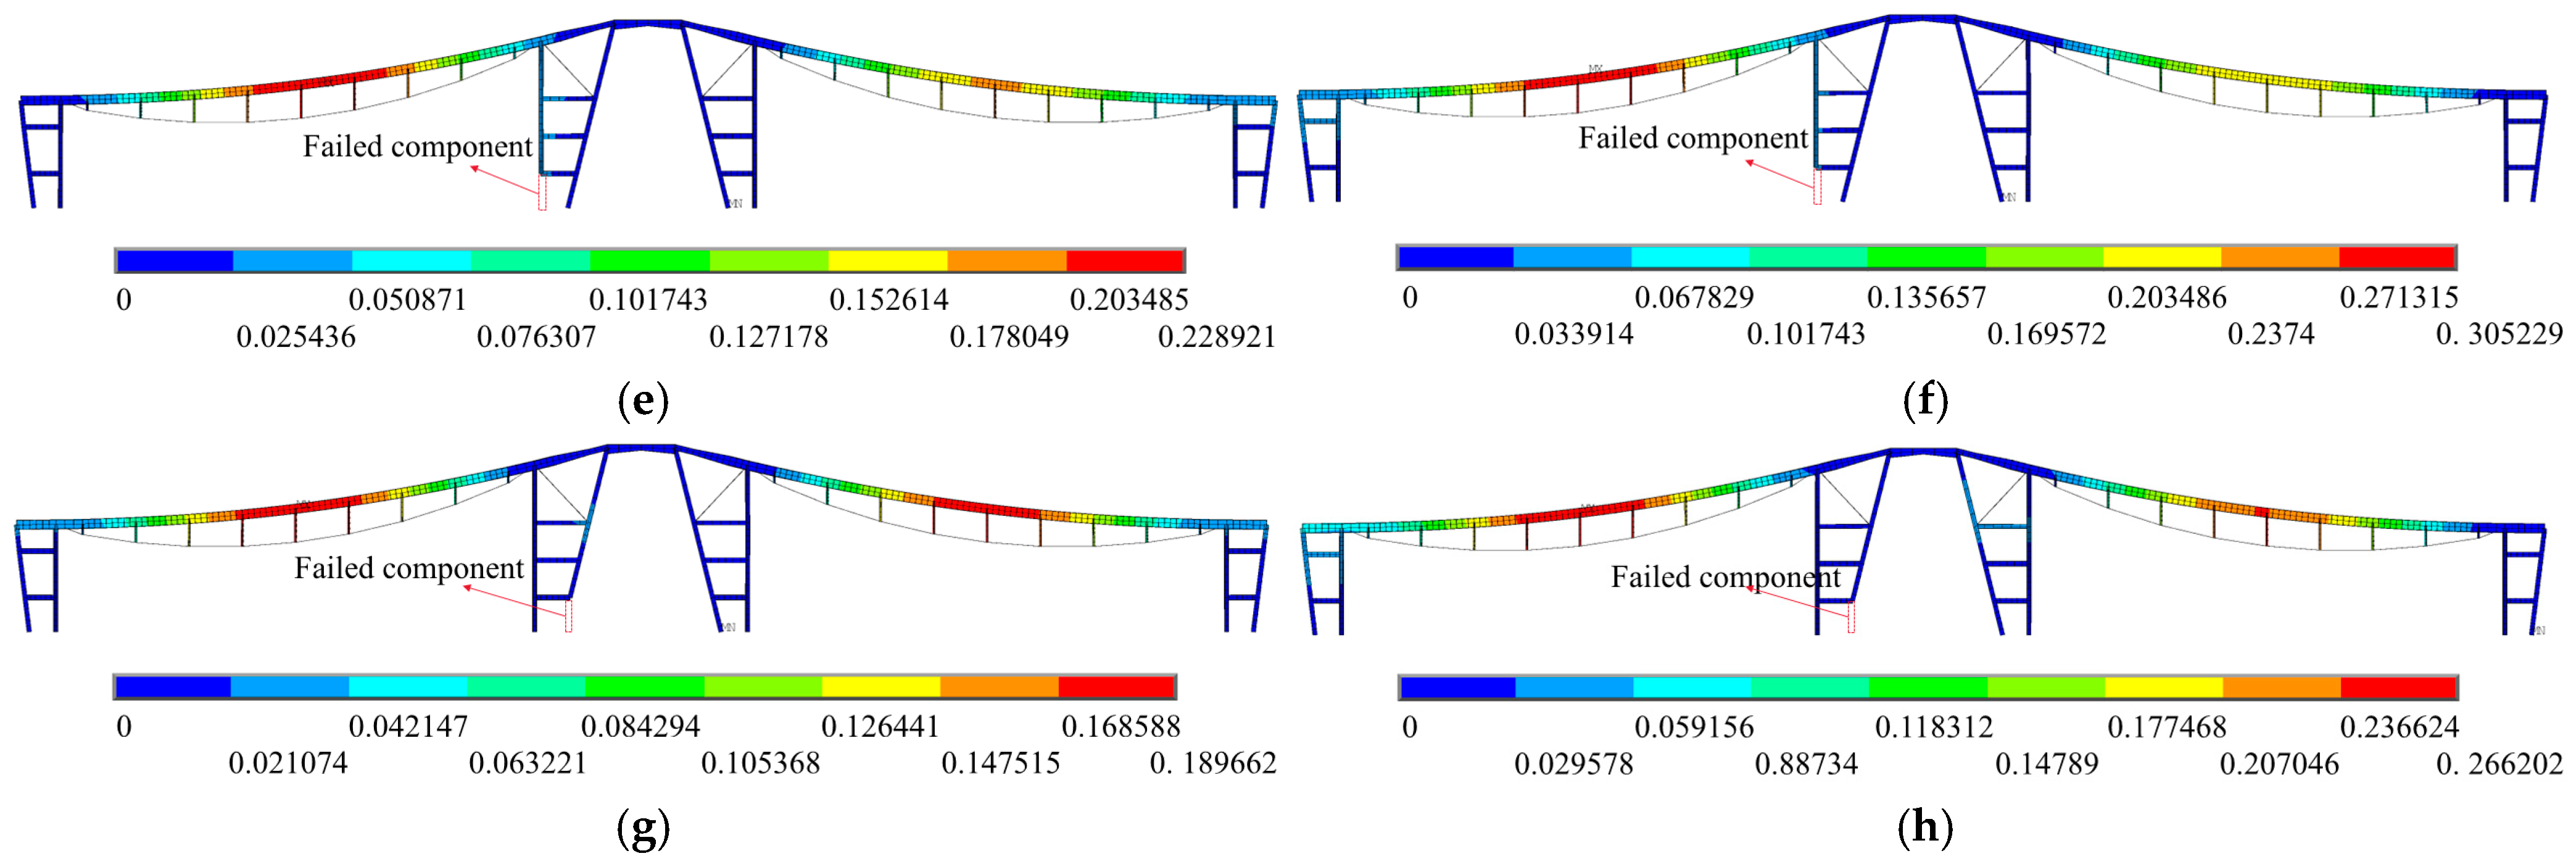
The failure of the bottom of the column is roughly the same as that of the end of the column. The failure of the bottom of the concrete-filled steel tube column occurs at 1 s, and the mid-span node of the beam string generates a sudden displacement. Then it oscillates repeatedly in the vertical direction and finally tends to be stable. The maximum increase in the maximum displacement variation is about 49.5% under extreme loading. The importance coefficient of each component under extreme load is higher than that under normal operation. Under extreme load, the maximum stress value is 237 MPa, which is much lower than the design value of steel strength. The final displacement deformation and stress after the failure of each column bottom are shown in Figure 15 and Figure 16.

4.4. Strut Failure

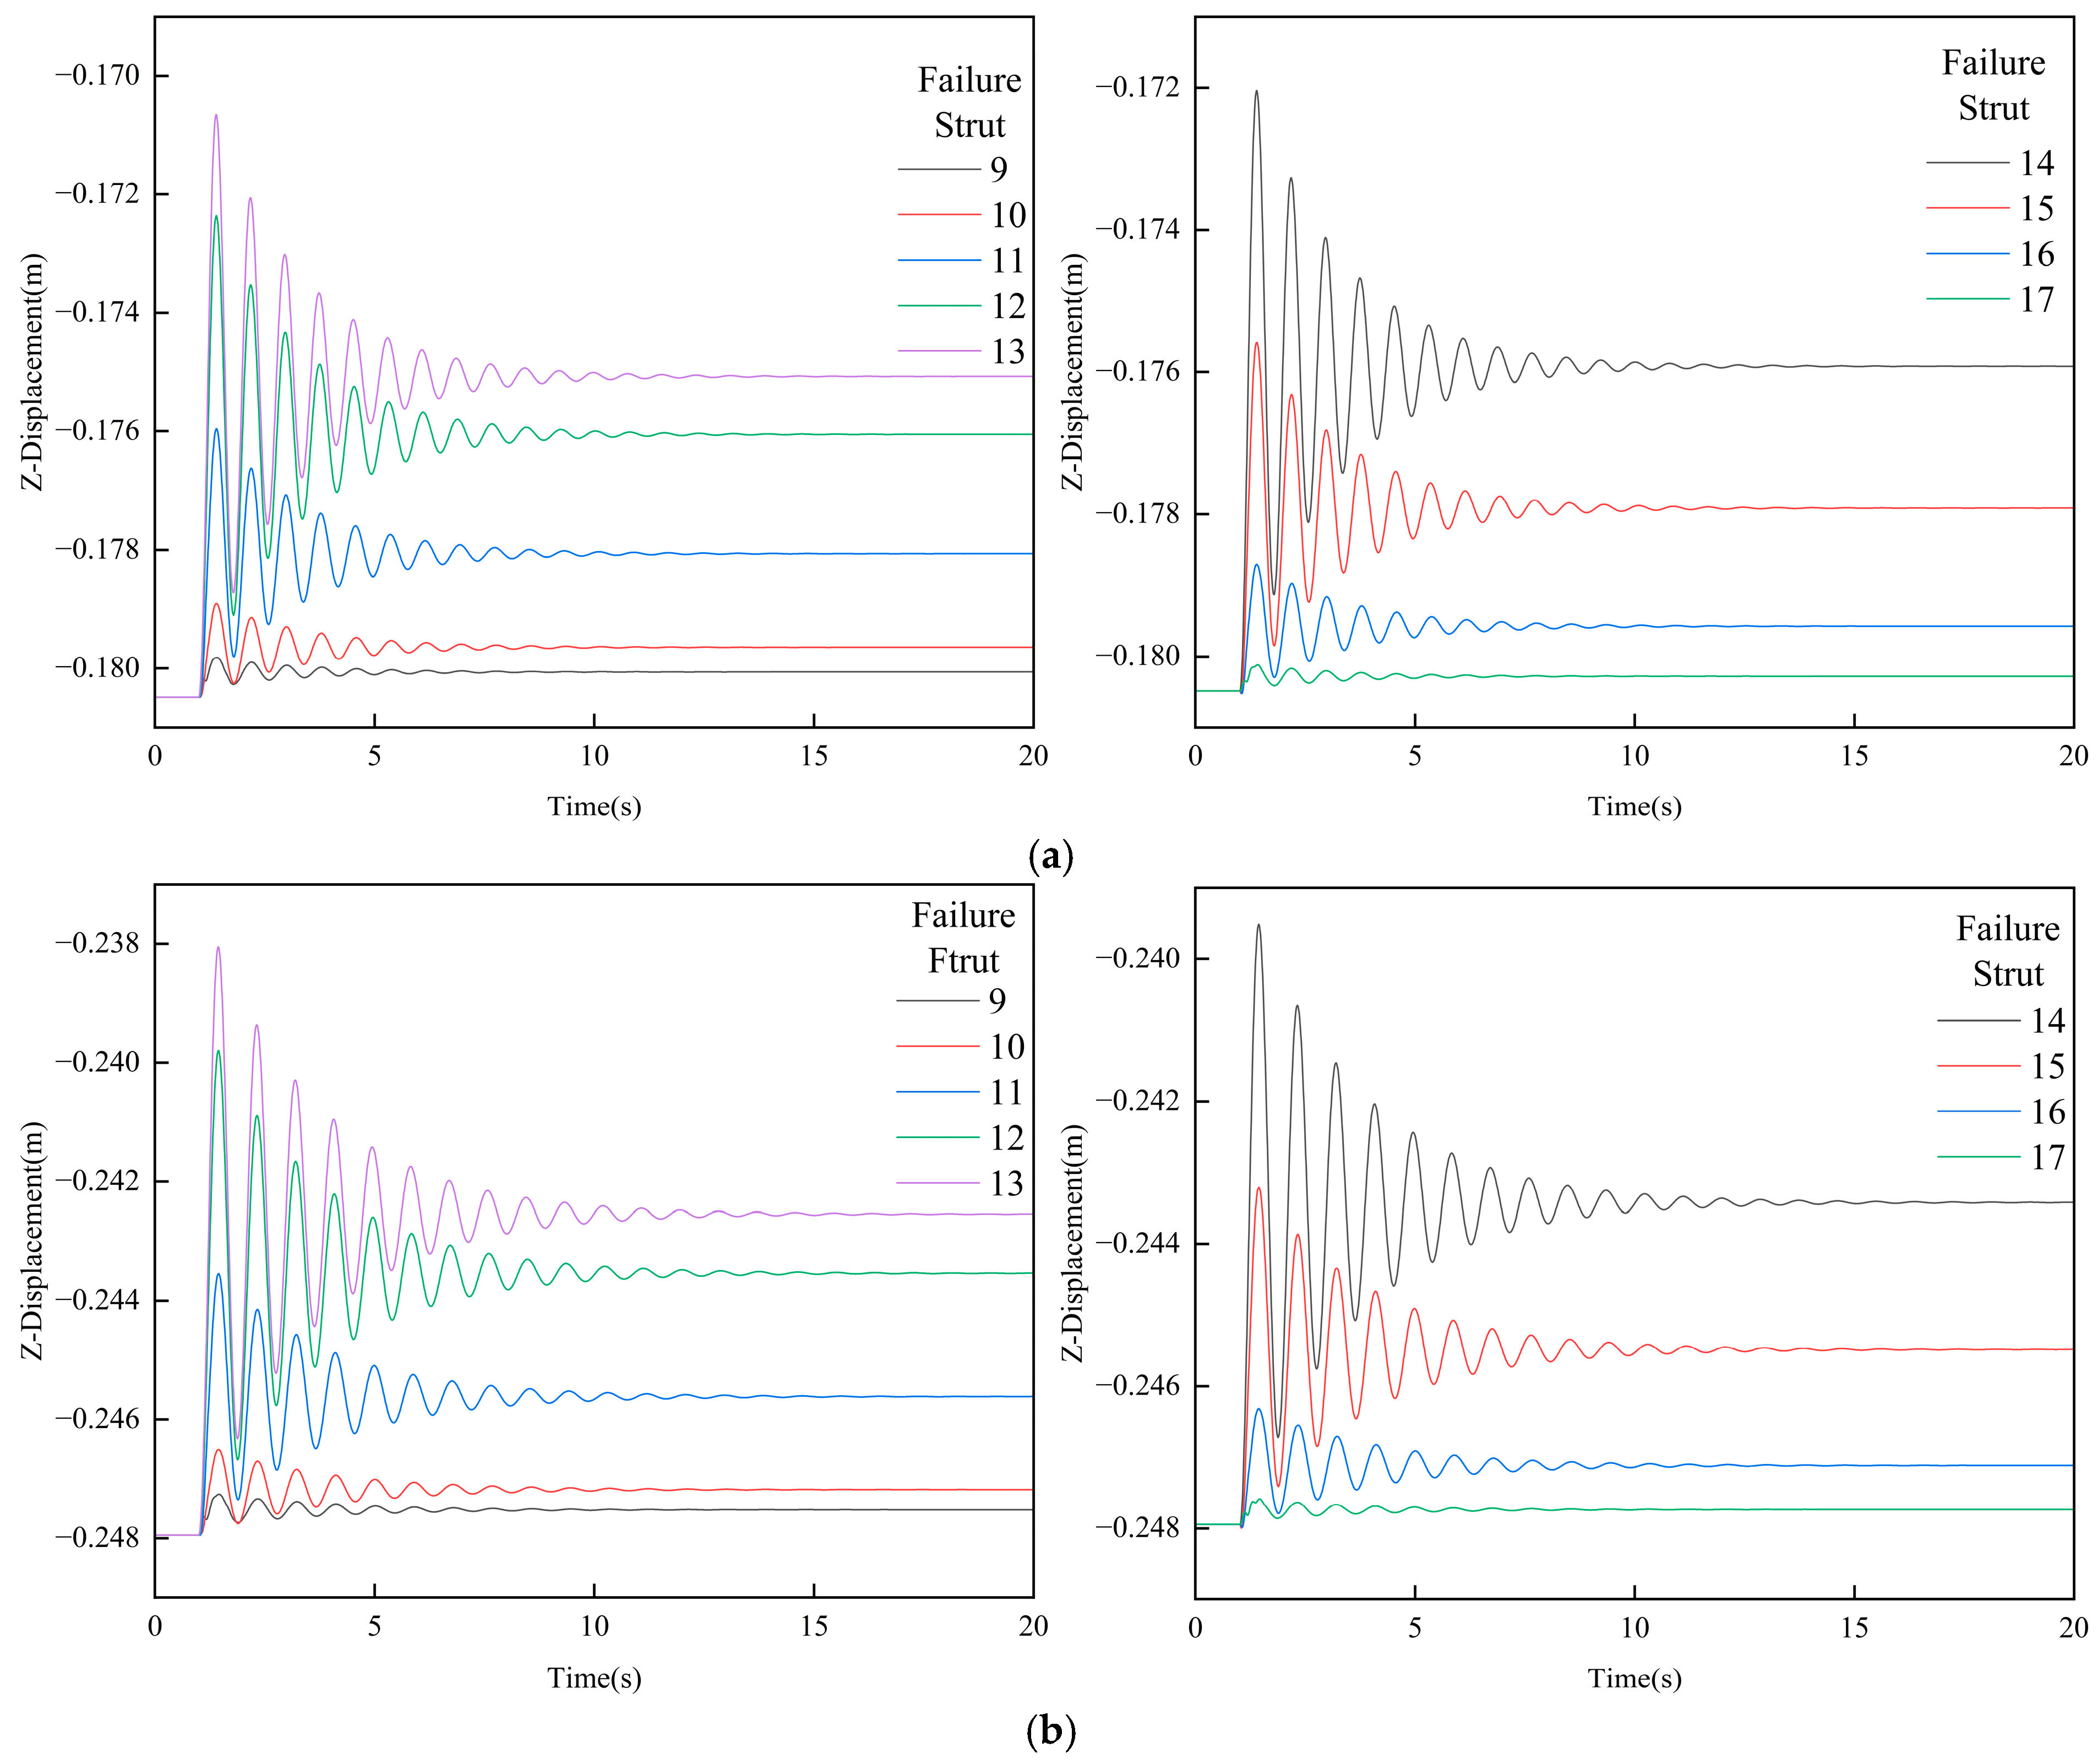
Taking the reverse arch beam string-inclined column structure as the research object, the influence of strut failure on its structural robustness is investigated. The vertical displacement time history curve of the mid-span node (x node) of the beam string after each strut failure are shown in Figure 17. The displacement data of the x node of the beam string before and after failure are shown in Table 10 and Table 11, and the importance coefficient of each component is shown in Table 12.
The dynamic time history analysis shows that after the failure of the strut, the maximum displacement variation of the x node of the beam string is only 9.88 mm, indicating that it has not completely collapsed. It can be seen from the above chart that compared with the concrete-filled steel tubular column, the strut has little effect on the robustness of the structure. The failed strut will transfer its internal force to other struts. The internal force of adjacent struts increases significantly after the failure of side struts.
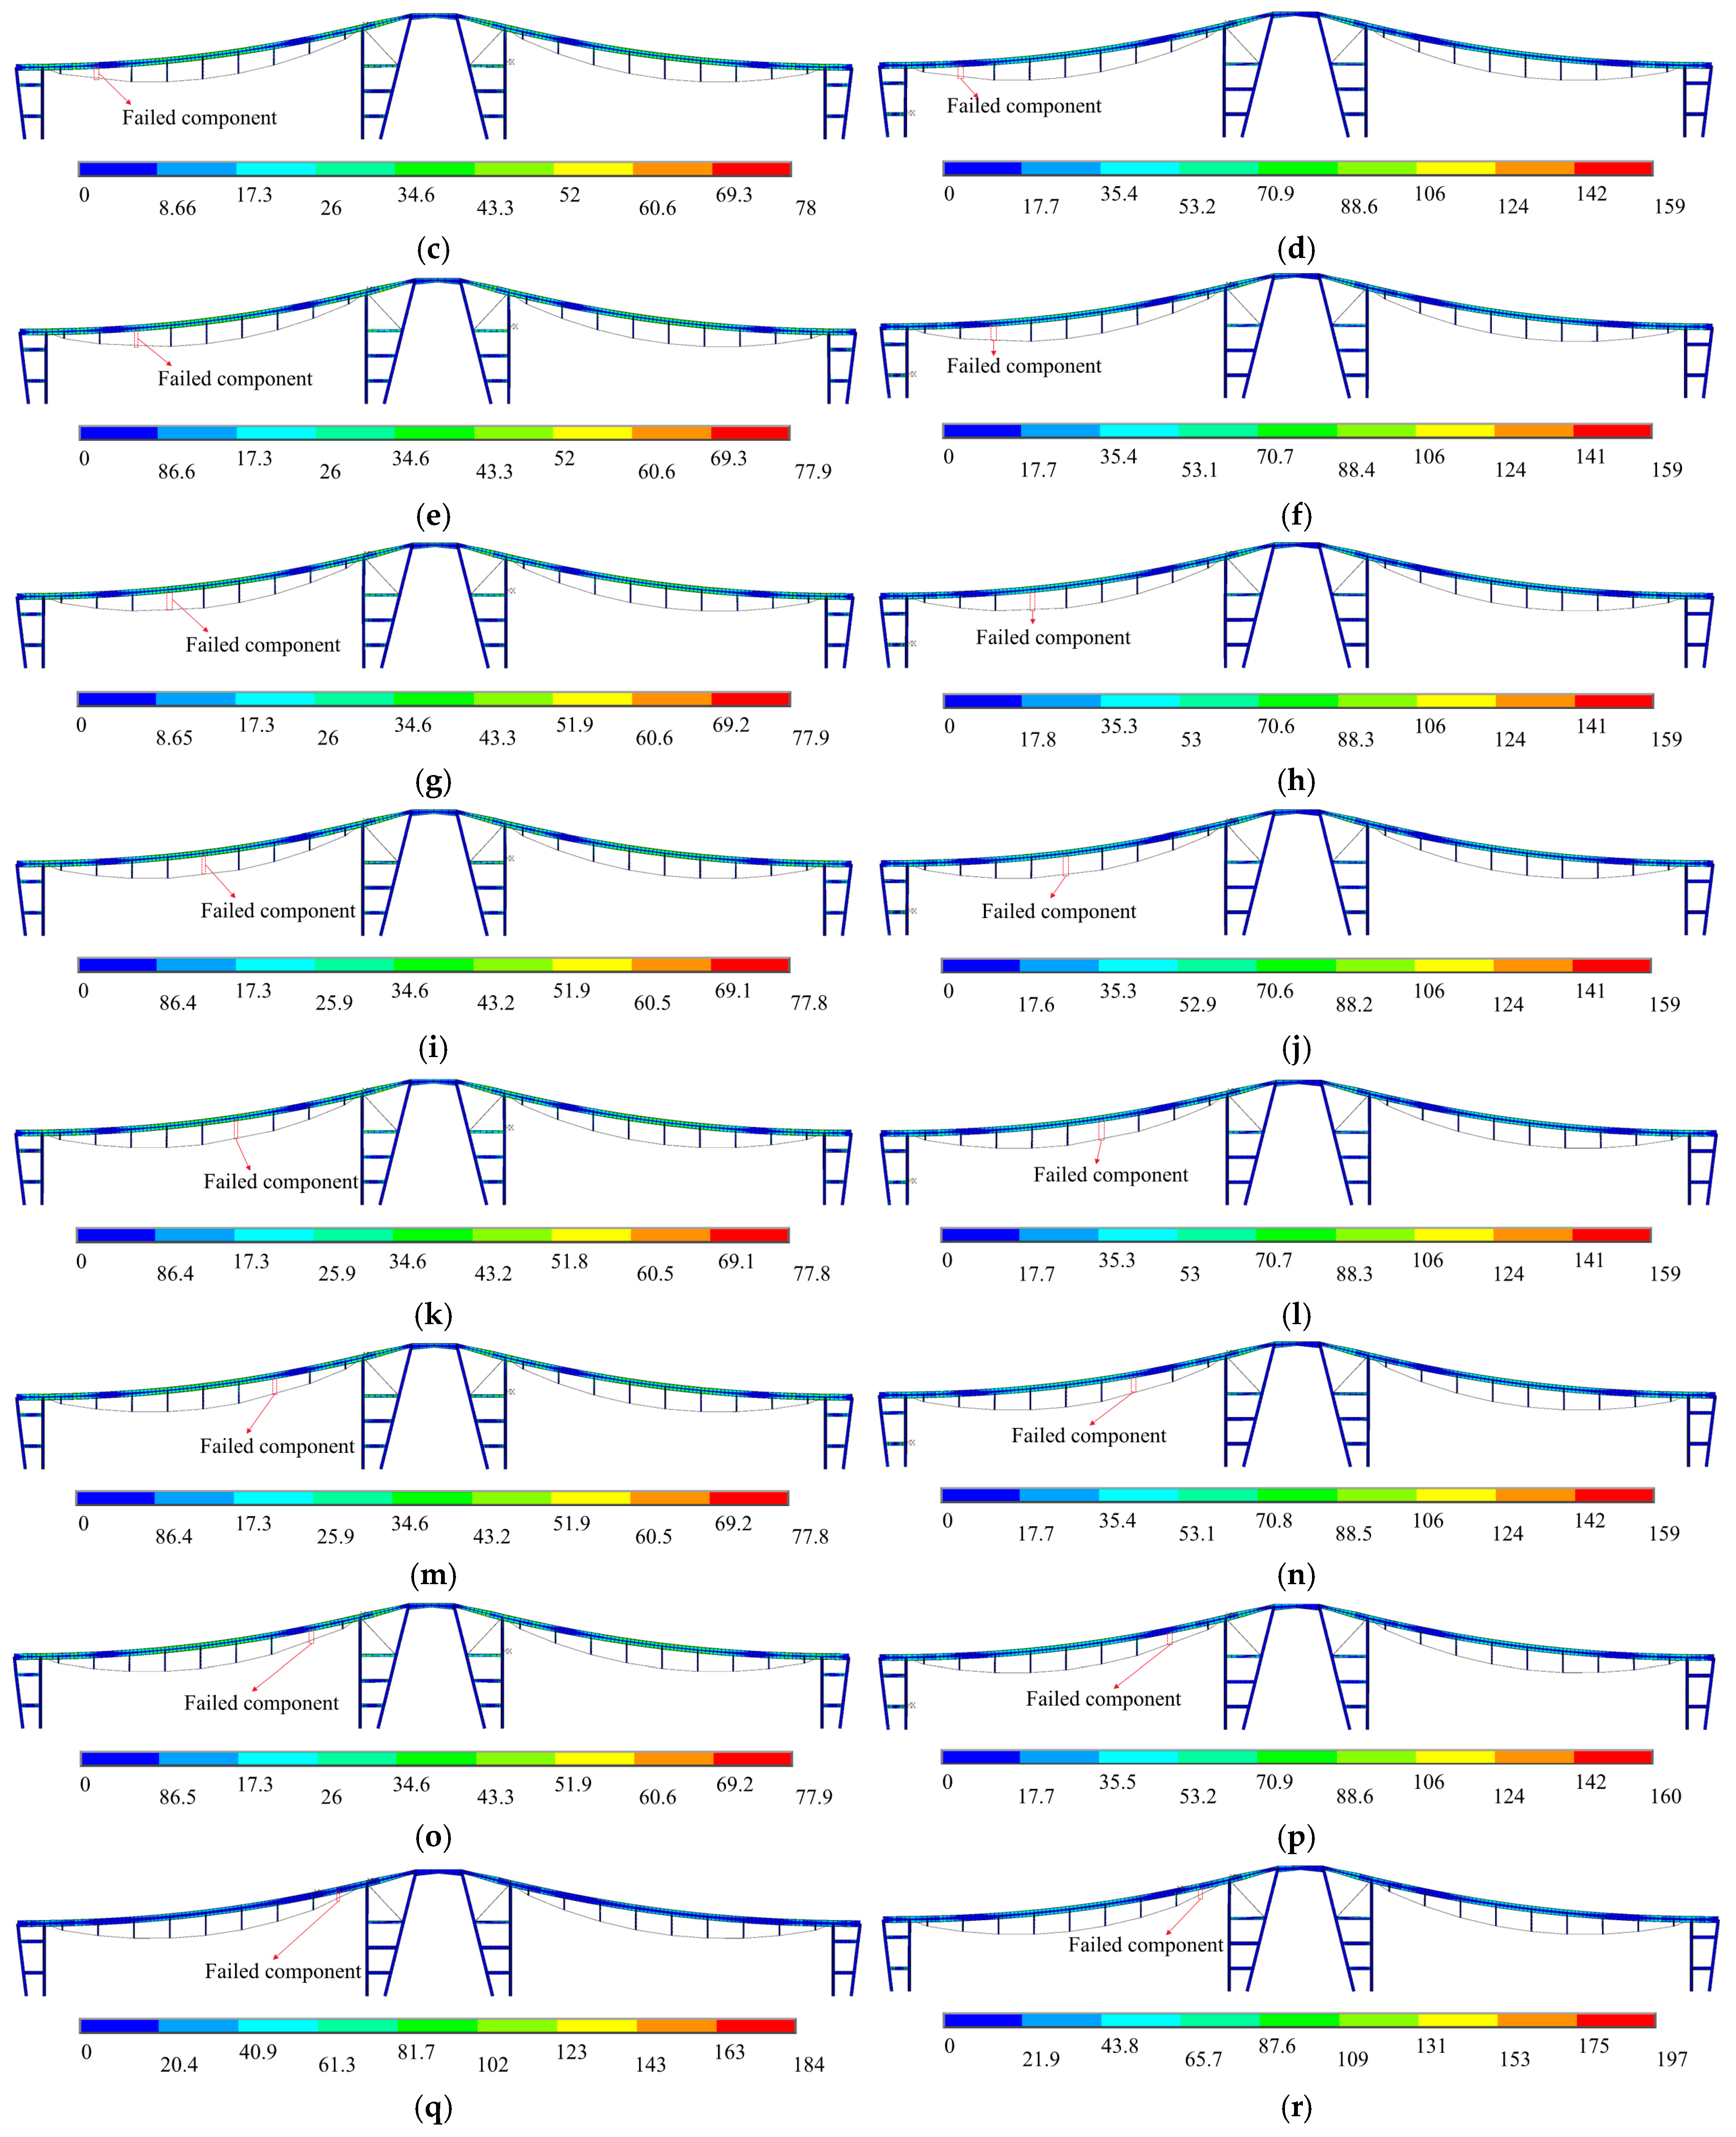
The failure of a single strut will not cause a large displacement of the structure, and the structure will not collapse due to its sudden failure. Under both working conditions, after the struts fail, the maximum stress in the structure occurs at Strut 10 and Strut 16. Both cases correspond to the failure of side struts. In the case of failure of other struts, the maximum stress is almost unchanged. The final displacement deformation and stress of each strut failure are shown in Figure 18 and Figure 19.

4.5. Upper Beam Failure

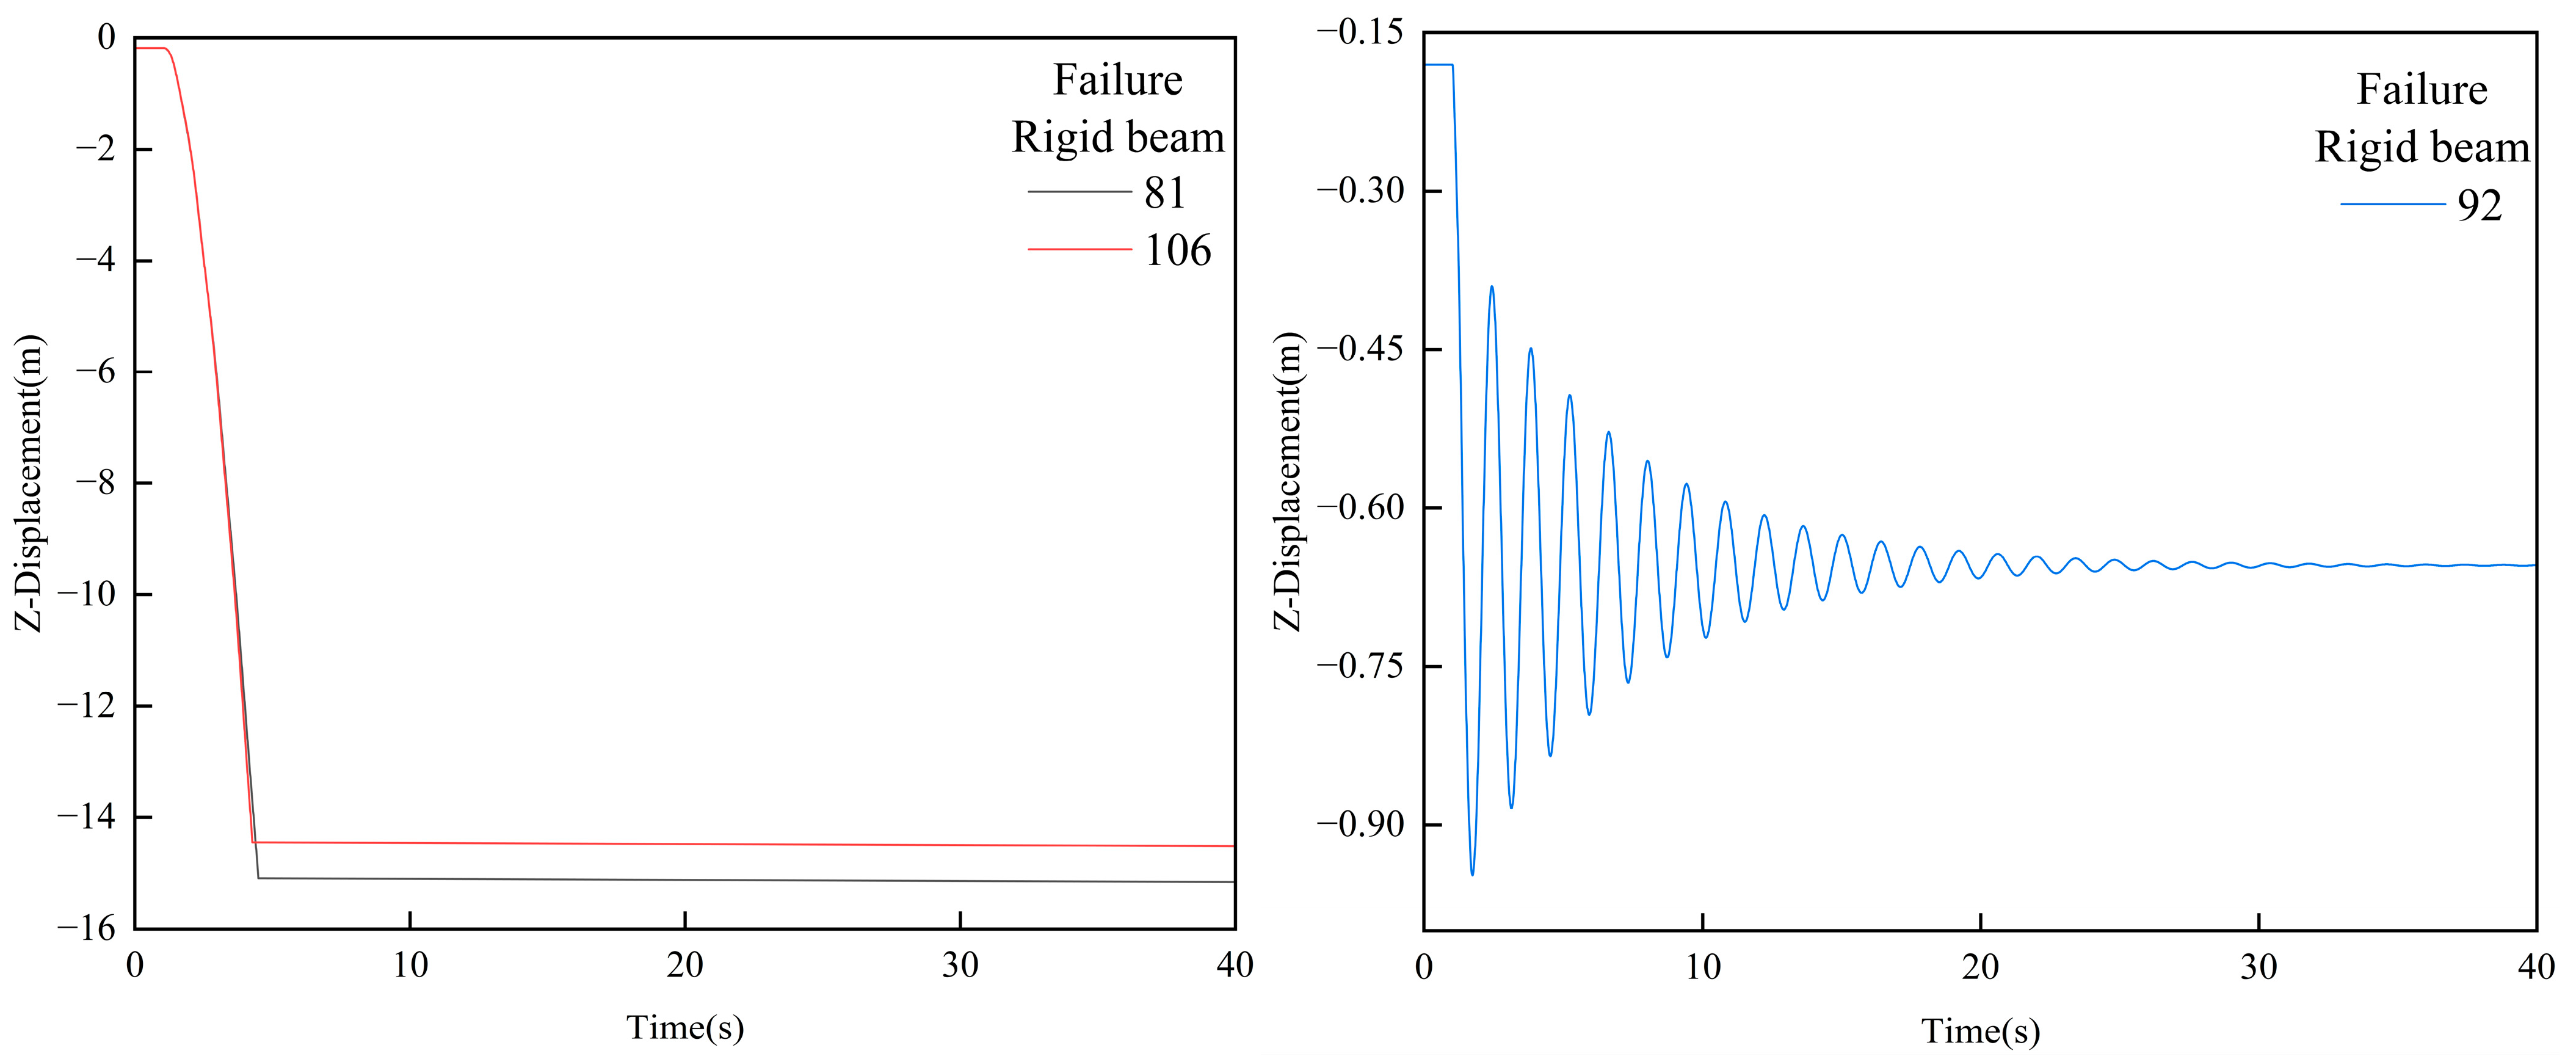
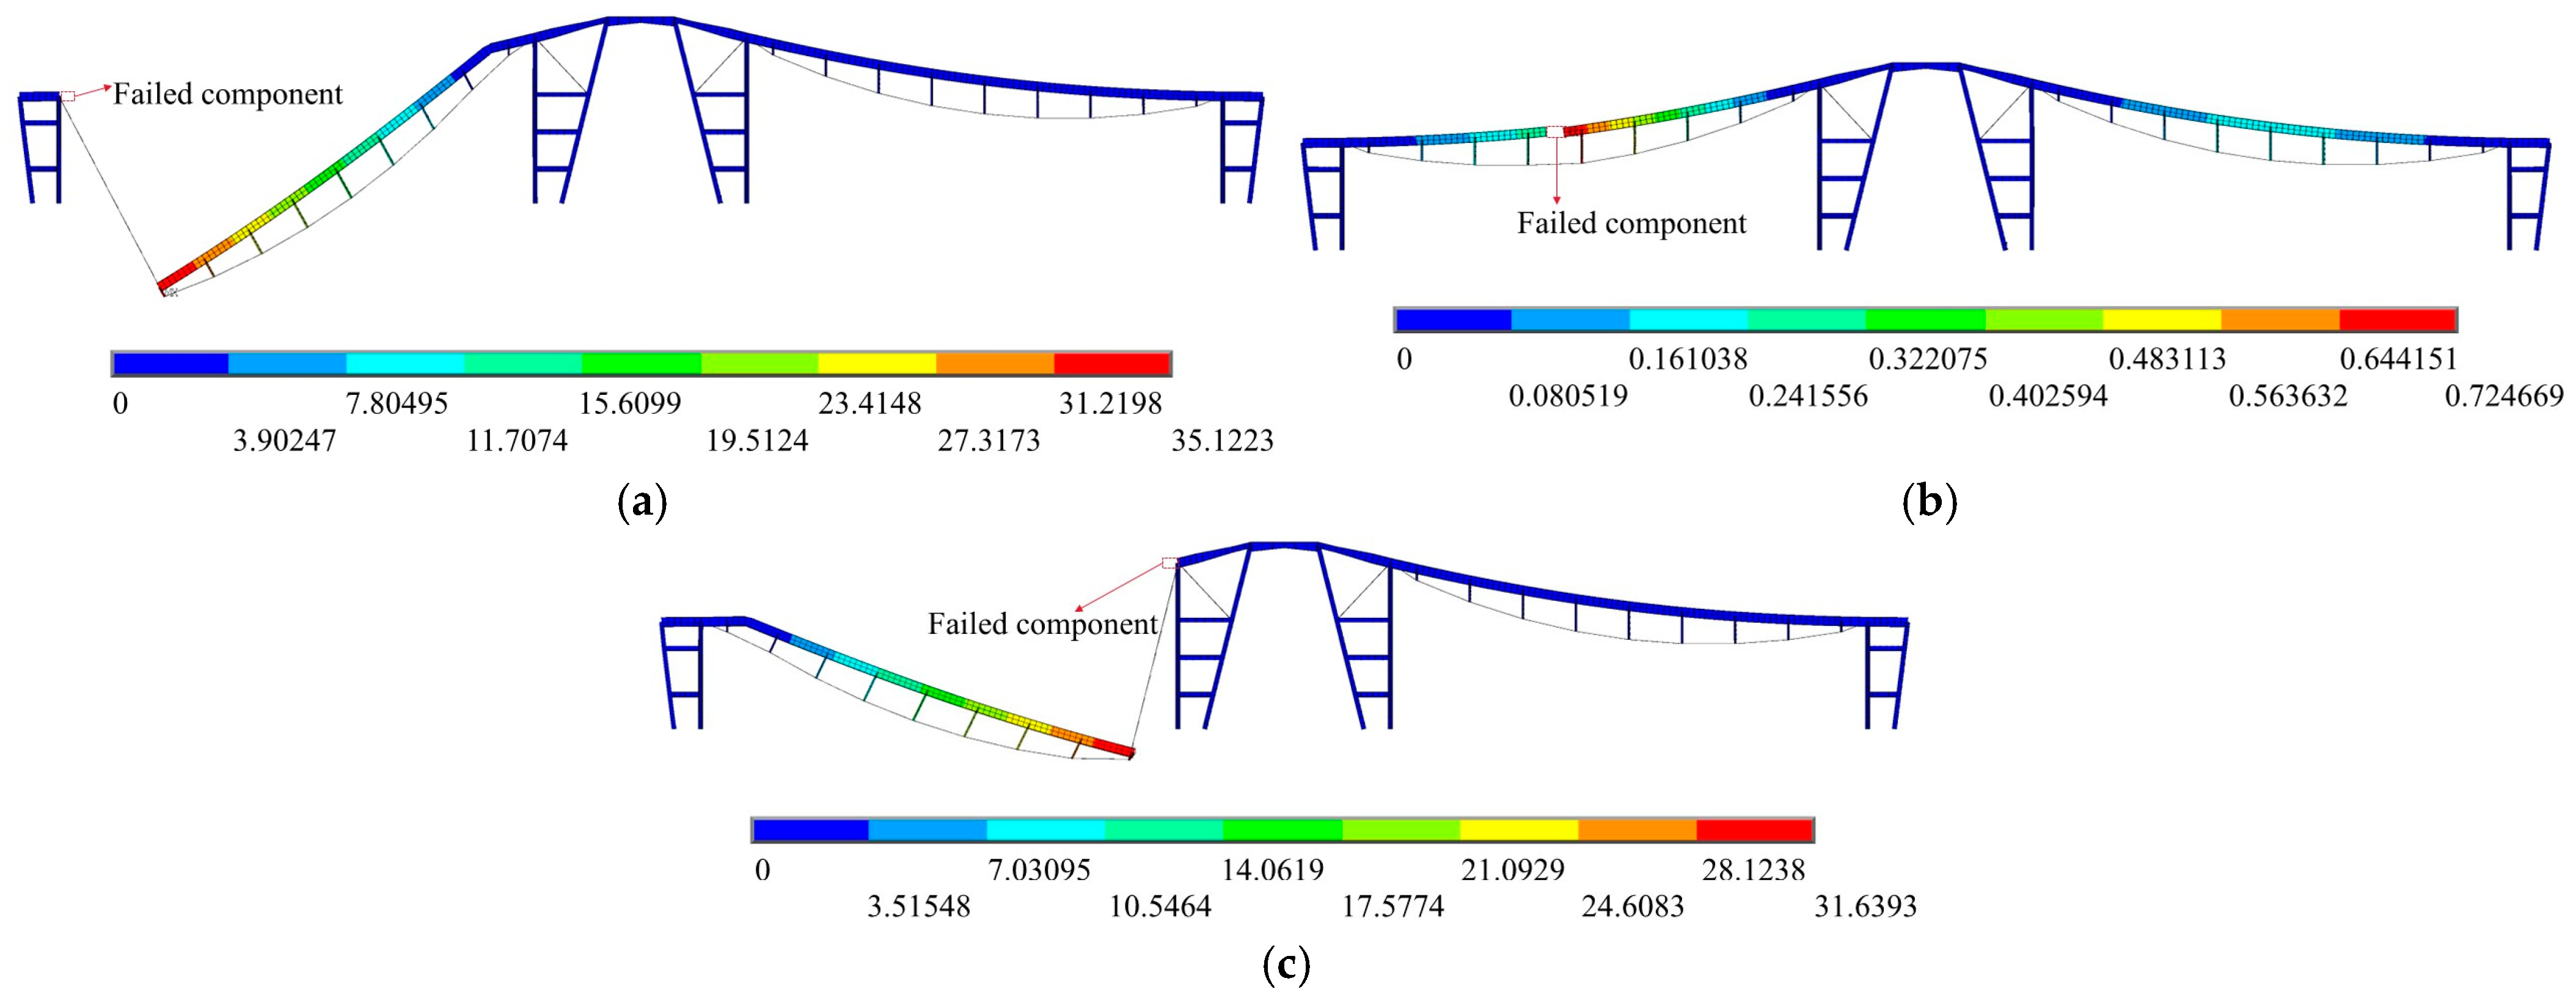
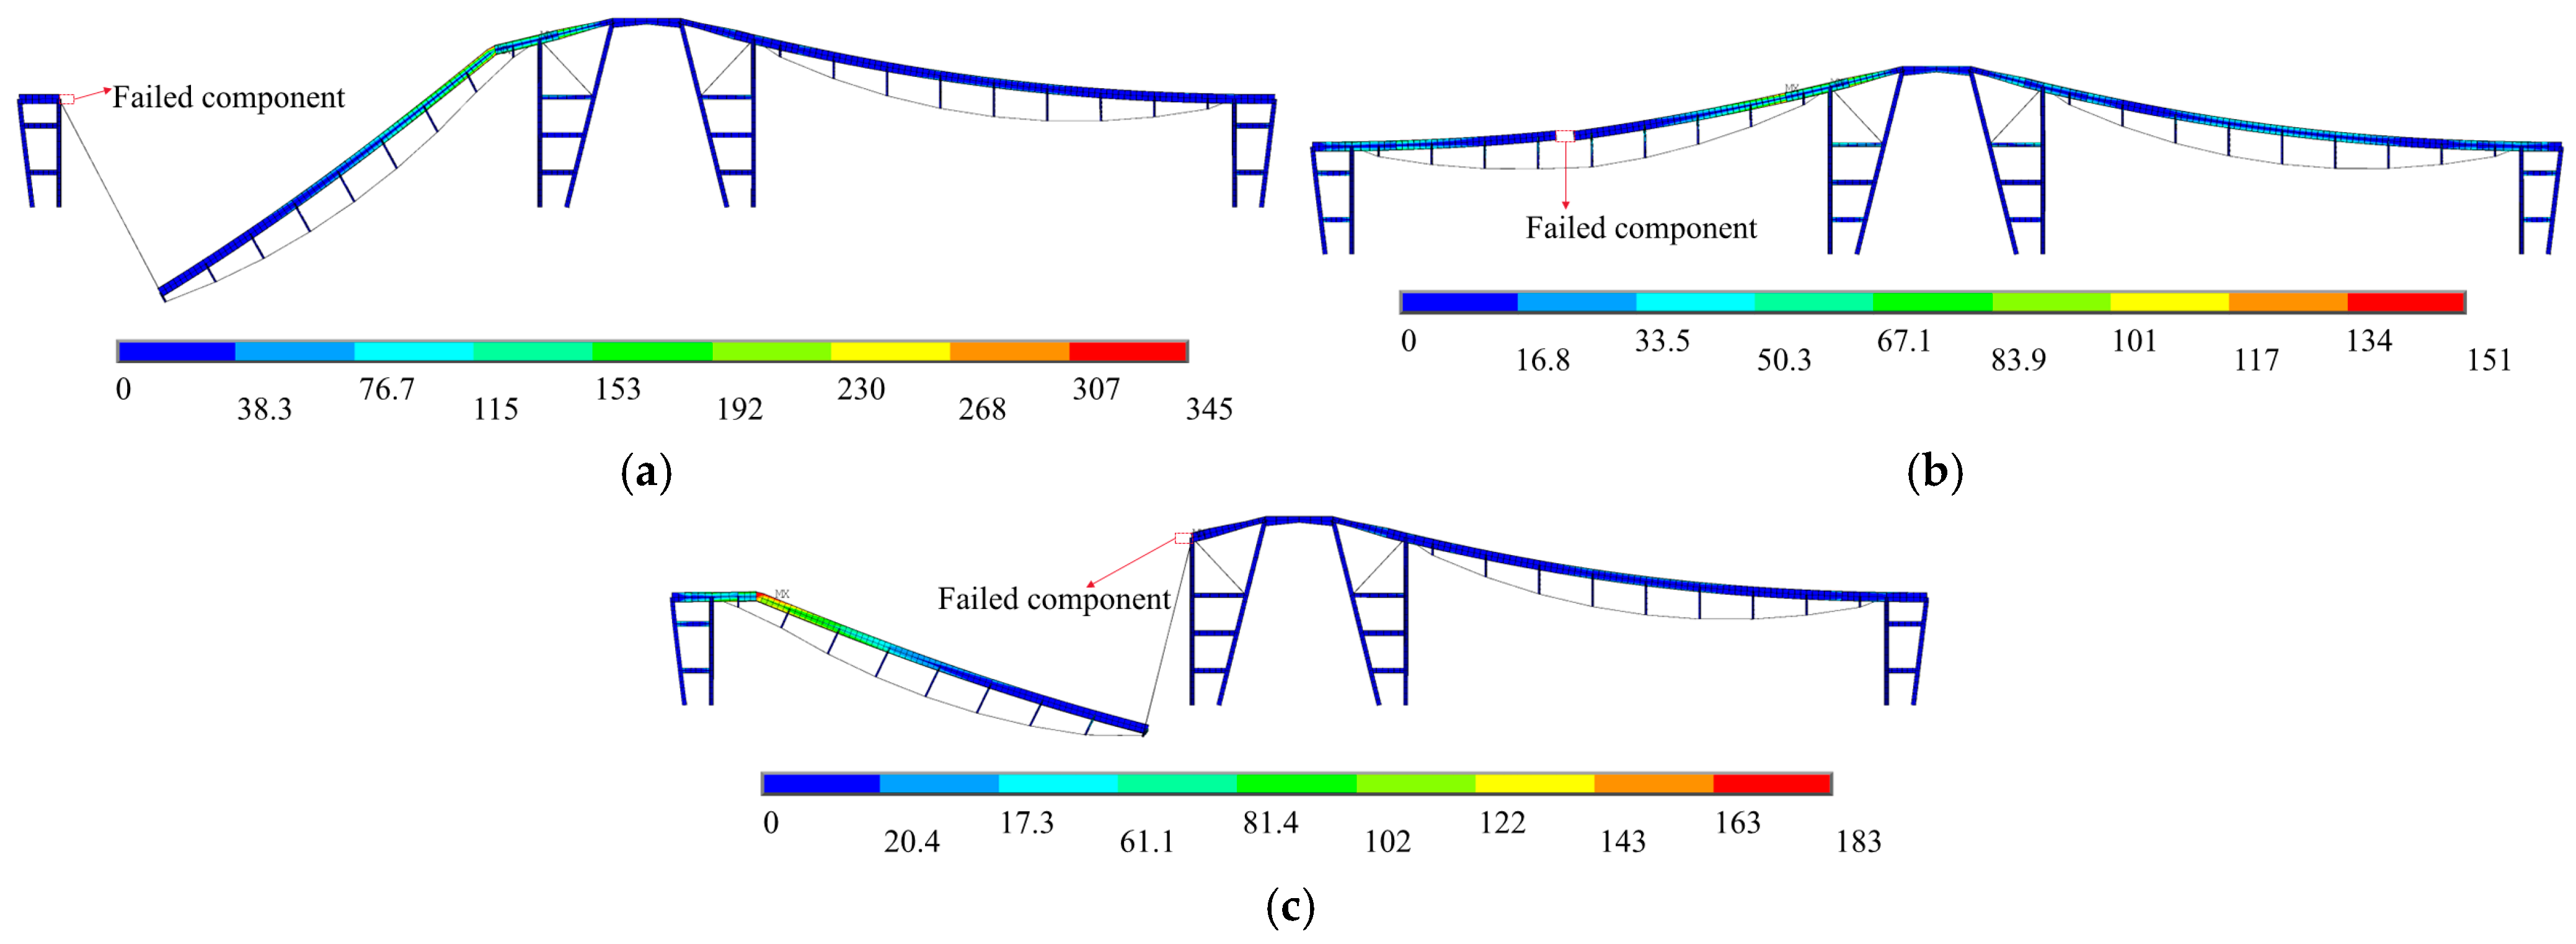
Three upper beam members are selected to investigate the influence of upper beam failure on the overall structural robustness of the structure under normal operation and maintenance conditions. After the failure of each upper beam, the vertical displacement time history curve of the mid-span node (x node) of the upper beam are shown in Figure 20. The displacement data and importance coefficient of the mid-span node of the beam upper beam before and after failure are shown in Table 13. The final displacement deformation diagram is shown in Figure 21, and the final stress diagram is shown in Figure 22.
The dynamic time history analysis shows that after the failure of the upper beam on the side, the upper beam on the other side yields due to excessive bending moment, and the whole structure collapses. After the failure of beam 92, the structure does not collapse, but the displacement deformation of the beam string structure is too large, which is not suitable for further bearing. Therefore, the failure of the upper beam is fatal to the reverse arch beam string-inclined column structure.

4.6. Internal Force Redistribution

4.6.1. Column End Failure

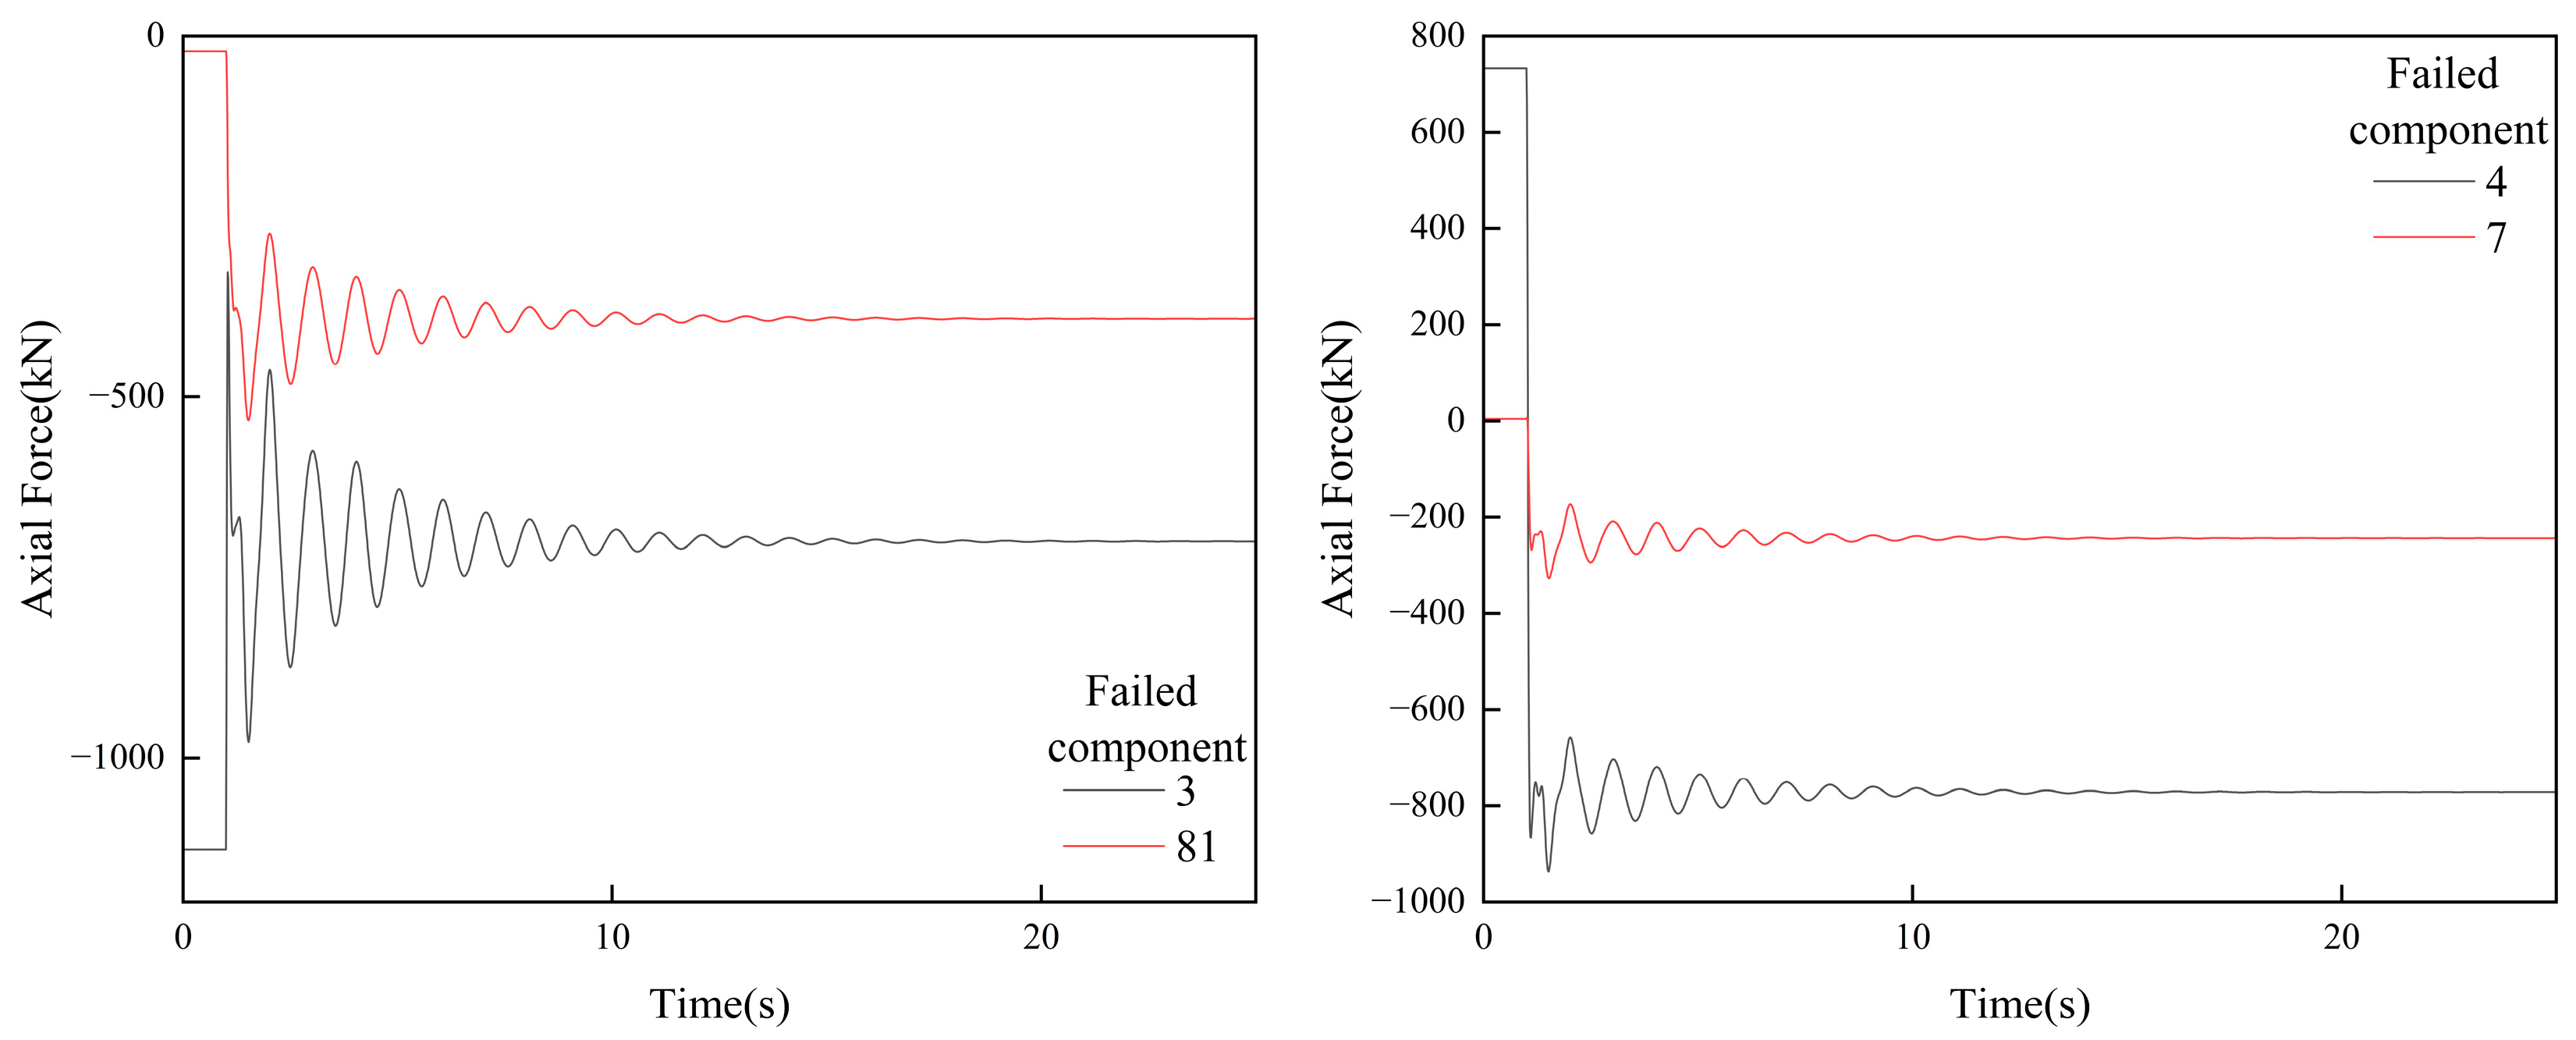
In order to study the internal force redistribution process of the structure after the failure of the column end, taking the column end 3 as an example, several nearby components (column base 1, upper beam 81, column end 6, beam 7, and beam 8) are selected for axial force time history tracking. The axial force time history curves of the components near the column end 3 after failure are shown in Figure 23.
After the failure of column end 3, the axial force of column end 6 decreases sharply from 591.44 kN to −590.31 kN, and finally stabilizes at −402.78 kN. The axial force of column base 1 decreases sharply from −1592.19 kN to −344.74 kN, and finally stabilizes at −530.57 kN. After the failure of column end 3, the sudden load is mainly borne by the adjacent concrete-filled steel tubular column. However, due to the failure of column base 1, the main transfer path of the upper load to column base 1 disappears, so the axial force of column base 1 decreases. The axial forces of other members have different degrees of change to resist the sudden load caused by the failure of column end 3.

4.6.2. Column Base Failure

In order to study the internal force redistribution process of the structure after the failure of the column base, taking the column base 1 as an example, several nearby components (column base 4, upper beam 81, column end 3, and beam 7) are selected for axial force time history tracking. The axial force time history curves of each component near the column end 3 after failure are shown in Figure 24.
After the failure of column base 1, the axial force of column end 3 increases sharply from −1126.67 kN to −327.8 kN, and finally stabilizes at −699.99 kN. The axial force of column base 4 decreases sharply from 732.09 kN to −935.72 kN, and finally stabilizes at−771.43 kN. After the failure of column base 1, the sudden load is mainly borne by the adjacent concrete-filled steel tubular column. However, due to the failure of column end 1, the supporting effect of the lower concrete-filled steel tubular column disappears, and the axial force of column end 3 increases under the action of gravity. When the column base 1 fails, beam 7 plays a supporting role in the remaining column structure, which causes the axial force to change. The axial forces of other members have different degrees of change to resist the sudden change load caused by the failure of column base 1.

4.6.3. Strut Failure

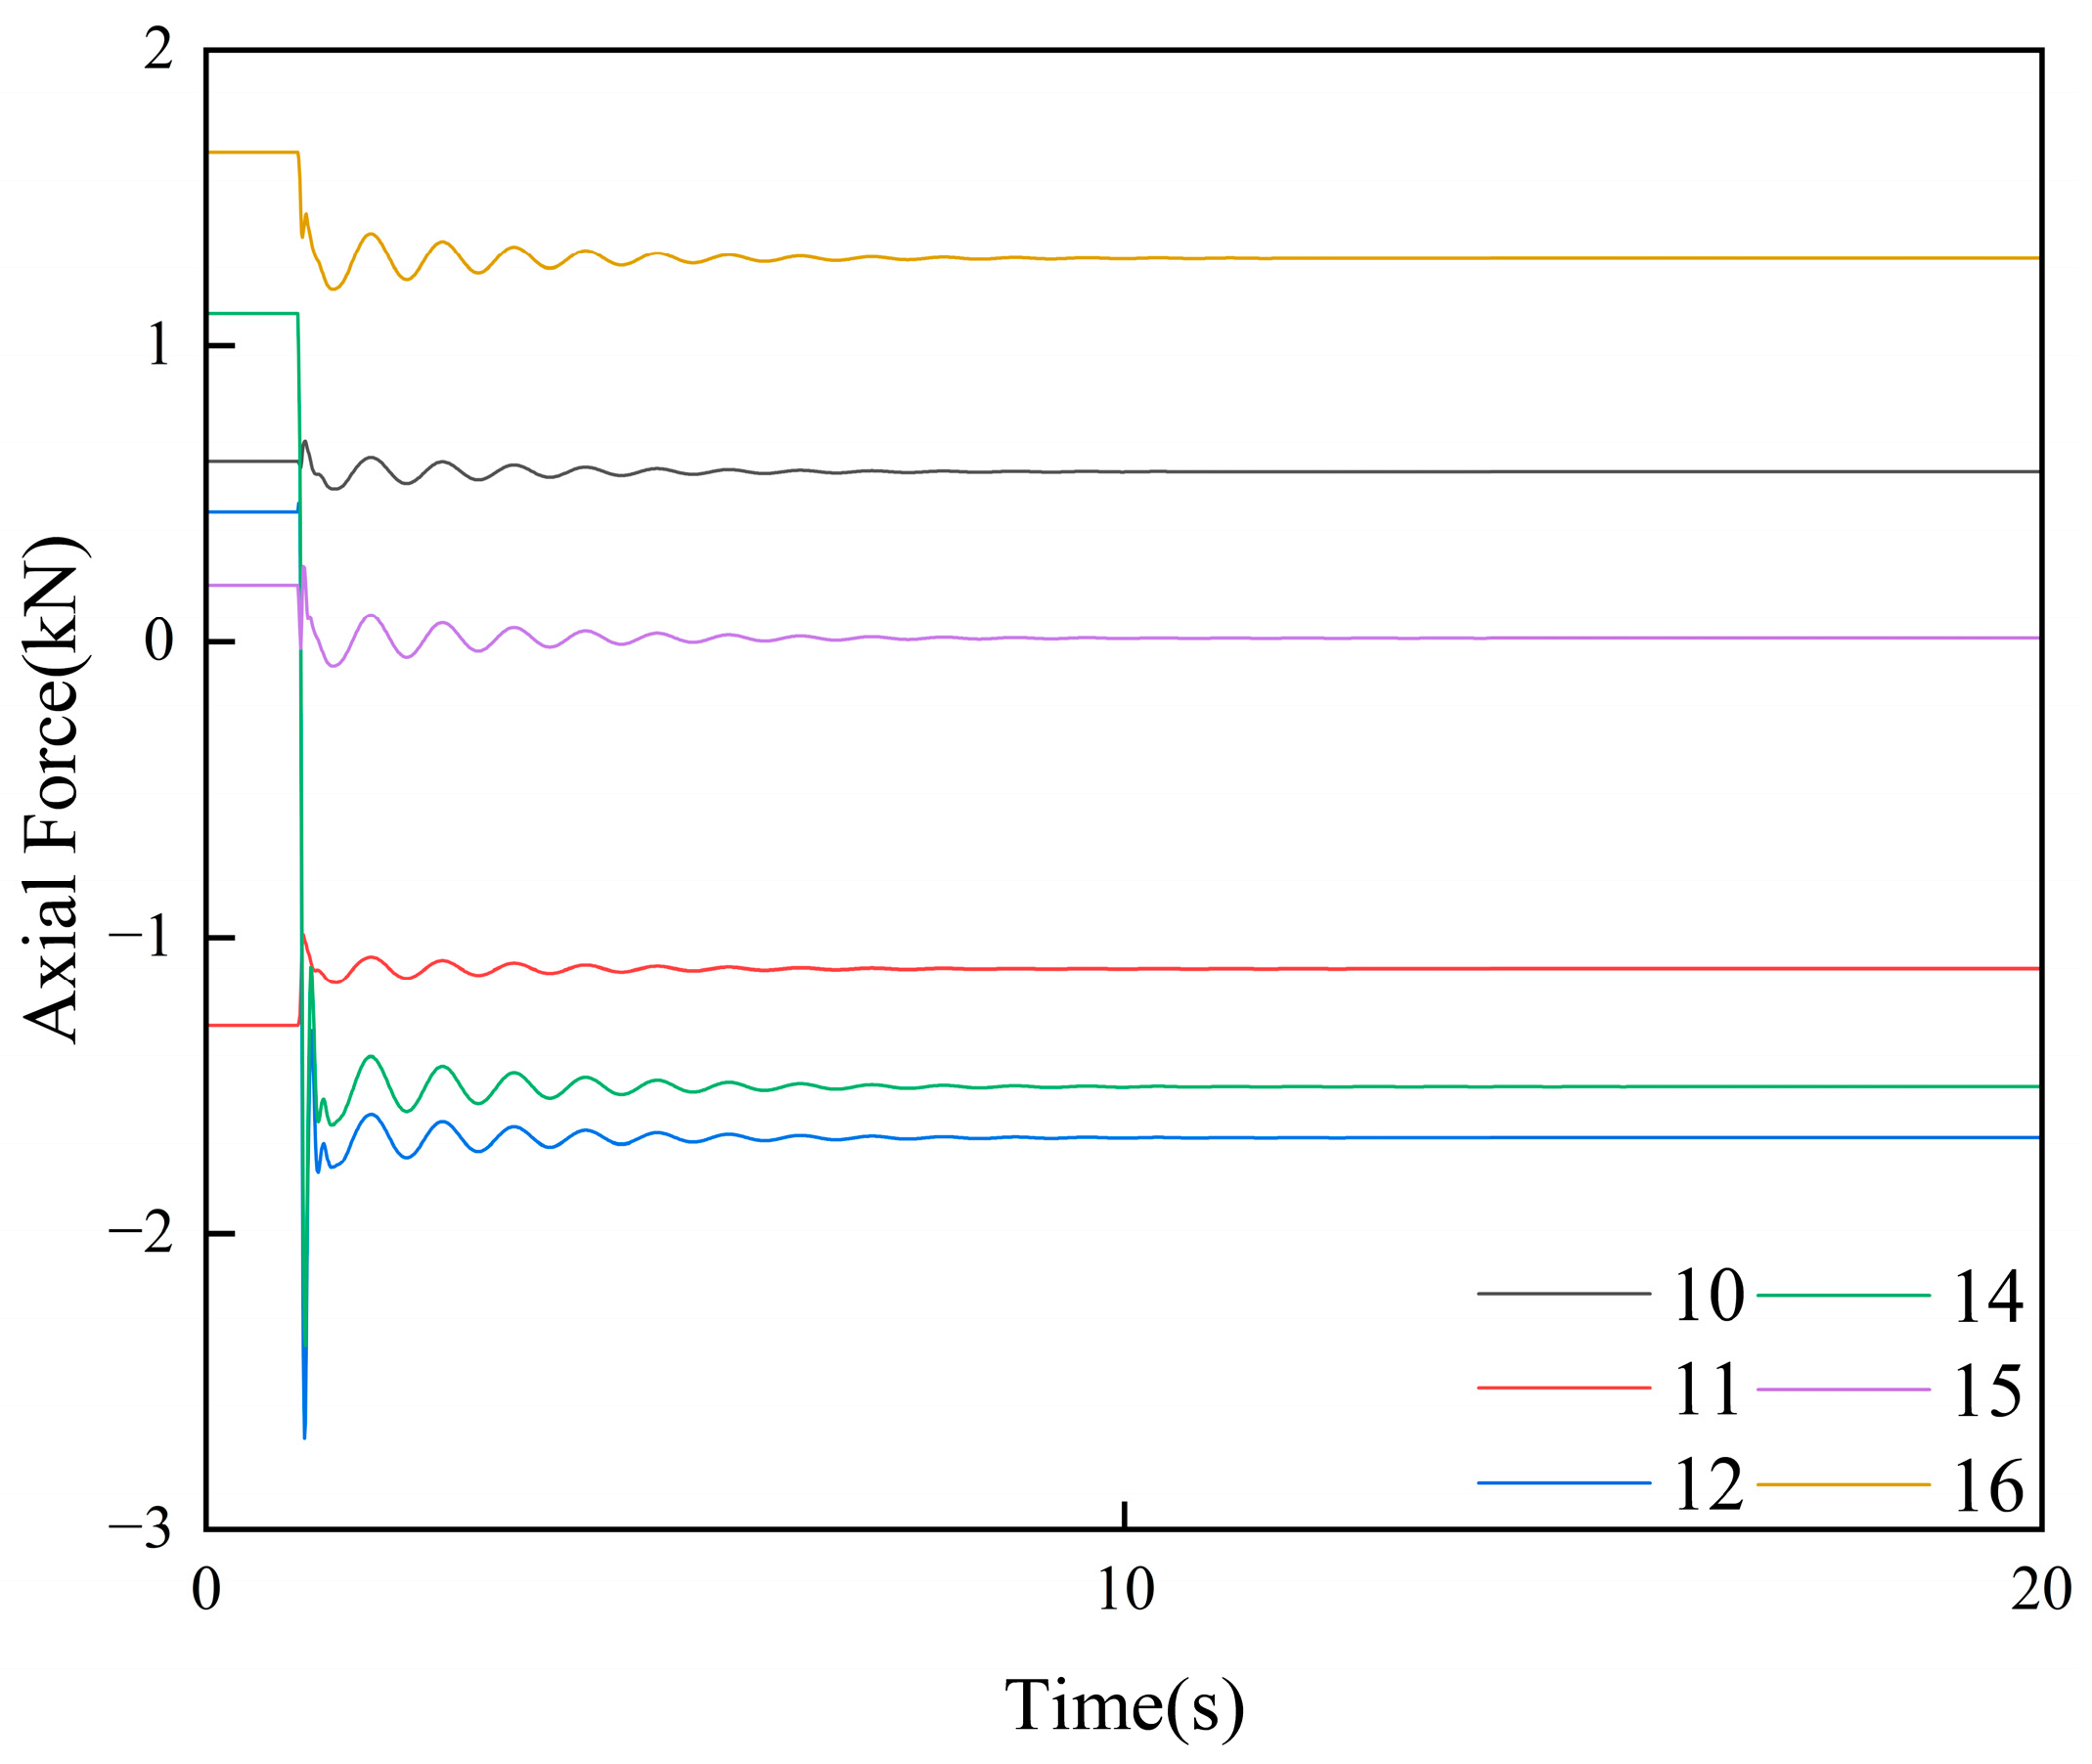
In order to study the internal force redistribution process of the structure after the failure of the strut, taking the strut 13 as an example, several nearby struts (strut 10, strut 11, strut 12, strut 14, strut 15, and strut 16) are selected for axial force time history tracking. The axial force time history curve of each component near the strut 13 after failure is shown in Figure 25.
After the failure of Strut 13, the axial force of each strut decreases to varying degrees. Taking Strut 12 as an example, after the sudden failure of strut 13, the axial force of Strut 12 decreases sharply from 0.44 kN to −2.69 kN, and finally stabilizes at −1.67 kN. This shows that after the failure of strut 13, the internal force of strut 13 is transferred to the other struts, and the axial force of the other struts decreases. It is not difficult to see from the figure that with the increase in the distance between each strut and the failure strut, the internal force distributed gradually decreases. The internal force caused by the failure strut will be mainly borne by the adjacent strut.

5. Conclusions

In this paper, dynamic analysis of the reverse arch beam string-inclined column structure is carried out by removing members. The collapse performance of the structure under different working conditions is analyzed by removing the column end, the column base, the strut, and the upper beam. The displacement time history curve and axial force time history curve under different situations are compared and analyzed. An importance coefficient is proposed to evaluate the influence of different components on the collapse performance of the structure. The following conclusions can be drawn:
(1) The finite element model shows good agreement with the experimental results, with a deviation of only 1.67%, demonstrating the high accuracy of the model developed in this study.
(2) According to the finite element analysis, according to the degree of influence on the remaining structure, the importance of the above single component to the robustness of the structure can be sorted as follows:
Upper beam: 81 > 106 > 92;
End column: 3 ≈ 21 > 6 > 25;
Column base: 1 > 4 > 18 > 22;
Strut: 13 > 14 > 12 > 15 > 11 > 16 > 10 > 17 > 9.
According to the component division, the importance of the robustness of the structure is in the following order: upper beam > column end > column base >strut.
(3) The failure of a single strut has little effect on the structural robustness of the frame. As the distance between the strut and the mid-span node of the beam string increases, the structural robustness of the frame decreases gradually. The maximum stress is mostly located in beam 7, beam 8, strut 28, and strut 107, so it is necessary to pay more attention to this part.
(4) Upper beam failure is fatal to the beam string structure. The failure of the side string beam leads to the collapse of the structure. After the failure of the middle string beam, the structure does not experience overall collapse; however, it undergoes considerable displacement deformation. Due to the loss of the failed string beam, the structure no longer maintains its original effective load transfer path and is, therefore, unsuitable for further load bearing.
(5) For the failure of the column end, the column base, and the strut, the structure has a good force transmission path to resist the sudden load caused by the failure of the component. The sudden load caused by the failure of the strut is mainly borne by the adjacent struts of the failed strut.

Author Contributions

Methodology, S.W.; Software, Z.Z. and X.X.; Validation, M.W., X.X. and F.W.; Investigation, S.W.; Data curation, Z.Z.; Writing—original draft, S.W.; Writing—review & editing, F.W.; Visualization, M.W.; Project administration, F.W.; Funding acquisition, F.W. All authors have read and agreed to the published version of the manuscript.

Funding

This work was supported by the Open Fund of Industry Key Laboratory of Traffic Infrastructure Security Risk Management (Changsha University of Science & Technology) (21KB10) and the Scientific Research Fund of Hunan Provincial Education Department (24B0307).

Conflicts of Interest

The authors declare that they have no known competing financial interests or personal relationships that could have appeared to influence the work reported in this paper.

References

  1. Nair, R.S. Progressive collapse basics. In Proceedings of the Steel Building Symposium: Blast and Progressive Collapse Resistance, New York, NY, USA, 4–5 December 2003; American Institute of Steel Construction: Chicago, IL, USA, 2003; pp. 1–11. [Google Scholar]
  2. Kiakojouri, F.; De Biagi, V.; Chiaia, B.; Sheidaii, M.R. Progressive collapse of framed building structures: Current knowledge and future prospects. Eng. Struct. 2020, 206, 110061. [Google Scholar] [CrossRef]
  3. Adam, J.M.; Parisi, F.; Sagaseta, J.; Lu, X. Research and practice on progressive collapse and robustness of building structures in the 21st century. Eng. Struct. 2018, 173, 122–149. [Google Scholar] [CrossRef]
  4. Zhao, X.; Yan, S.; Xu, Z.; Wu, A. Research and application of beam string structures. Struct. Eng. Int. 2015, 25, 26–33. [Google Scholar] [CrossRef]
  5. Adam, J.M.; Buitrago, M.; Bertolesi, E.; Sagaseta, J.; Moragues, J.J. Dynamic performance of a real-scale reinforced concrete building test under a corner-column failure scenario. Eng. Struct. 2020, 210, 110414. [Google Scholar] [CrossRef]
  6. Buitrago, M.; Sagaseta, J.; Adam, M.J. Effects of sudden failure of shoring elements in concrete building structures under construction. Eng. Struct. 2018, 172, 508–522. [Google Scholar] [CrossRef]
  7. Buitrago, M.; Setiawan, A.; Makoond, N.; Gerbaudo, M.L.; Marin, L.; Cetina, D.; Caredda, G.; Sempertegui, G.; Oliver, M.; Adam, J.M. Failure analysis after the progressive collapse of a precast building. Eng. Struct. 2024, 321, 118893. [Google Scholar] [CrossRef]
  8. Yang, Z.; Guo, X.; Li, Y.; Guan, H.; Diao, M.; Gilbert, B.P.; Sun, H. Real collapse responses of an RC flat plate structure under extreme overloading condition: Reversing load redistribution. Eng. Struct. 2025, 322, 119120. [Google Scholar] [CrossRef]
  9. Jin, Y.; Yu, X.; Li, B. Probabilistic assessment of progressive collapse resistance in RC slab-incorporated frame structures: Accounting for slab effects. J. Build. Eng. 2025, 103, 112119. [Google Scholar] [CrossRef]
  10. Zhao, Z.; Guan, H.; Li, Y.; Xue, H.; Gilbert, B.P. Collapse-resistant mechanisms induced by various perimeter column damage scenarios in RC flat plate structures. Structures 2024, 59, 105716. [Google Scholar] [CrossRef]
  11. Pang, B.; Wang, F.; Yang, J.; Nyunn, S.; Azim, I. Performance of slabs in reinforced concrete structures to resist progressive collapse. Structures 2021, 33, 4843–4856. [Google Scholar] [CrossRef]
  12. Agarwal, A.; Varma, H.A. Fire induced progressive collapse of steel building structures: The role of interior gravity columns. Eng. Struct. 2014, 58, 129–140. [Google Scholar] [CrossRef]
  13. Lan, D.; Jin, L.; Yang, Y.; Qian, K.; Zhang, R.; Li, J. Progressive collapse behavior of geometrically similar RC frames at ambient and elevated temperatures. Fire Saf. J. 2025, 152, 104325. [Google Scholar] [CrossRef]
  14. Zhu, Y.F.; Chen, C.H.; Huang, Y.; Huang, Z.H.; Yao, Y.; Keer, L.M. Dynamic progressive collapse of steel moment frames under different fire scenarios. J. Constr. Steel Res. 2020, 173, 106256. [Google Scholar] [CrossRef]
  15. Nan, Z.; Dai, X.; Chen, H.; Welch, S.; Usmani, A. A numerical investigation of 3D structural behaviour for steel-composite structures under various travelling fire scenarios. Eng. Struct. 2022, 267, 114587. [Google Scholar] [CrossRef]
  16. Lan, D.Q.; Jin, L.; Qian, K.; Zhang, R.B.; Li, J. Progressive collapse resistance of RC frames subjected to localized fire. J. Build. Eng. 2023, 79, 107746. [Google Scholar] [CrossRef]
  17. Zhang, Z.; Liu, M.; Zhou, M.; Chen, J. Dynamic Reliability Analysis of Nonlinear Structures Using a Duffing-System-Based Equivalent Nonlinear System Method. Int. J. Approx. Reason. 2020, 126, 84–97. [Google Scholar] [CrossRef]
  18. Kabando, E.K.; Gong, J. An overview of long-span spatial grid structures failure case studies. Asian J. Civ. Eng. 2019, 20, 1137–1152. [Google Scholar] [CrossRef]
  19. Pellecchia, C.; Cardoni, A.; Cimellaro, G.P.; Domaneschi, M.; Ansari, F.; Khalil, A.A. Progressive collapse analysis of the Champlain Towers South in Surfside, Florida. J. Struct. Eng. 2024, 150, 04023211. [Google Scholar] [CrossRef]
  20. Park, W.T. Inspection of collapse cause of Sampoong Department Store. Forensic Sci. Int. 2012, 217, 119–126. [Google Scholar] [CrossRef]
  21. Ahmadi, M.T.; Aghakouchak, A.A.; Mirghaderi, R.; Tahouni, S.; Garivani, S.; Shahmari, A.; Epackachi, S. Collapse of the 16-Story Plasco Building in Tehran due to Fire. Fire Technol. 2020, 56, 769–799. [Google Scholar] [CrossRef]
  22. Zhang, N.; Luo, B.; Liu, H.; Zhang, M. Prestress self-equilibrium force-finding method for cable-supported grid structures considering zero-stress state form-finding and the construction process. Buildings 2022, 12, 749. [Google Scholar] [CrossRef]
  23. Zhang, H.; Lu, J.; Wu, X.; Li, N. Progressive collapse behavior of large-span truss string structures subjected to cable failure. KSCE J. Civ. Eng. 2024, 28, 1379–1391. [Google Scholar] [CrossRef]
  24. Shekastehband, B.; Abedi, K. Collapse behavior of tensegrity systems due to cable rupture. Int. J. Struct. Stab. Dyn. 2013, 13, 1250079. [Google Scholar] [CrossRef]
  25. Liu, J.; Zhang, H.; Wang, X. Experimental study on collapse behaviour of truss string structures under cable rupture. J. Constr. Steel Res. 2021, 185, 106864. [Google Scholar] [CrossRef]
  26. Liu, W.; Zeng, B.; Zhou, Z.; Zheng, Y. Theoretical Study on Progressive Collapse of Truss String Structures under Cable Rupture. J. Constr. Steel Res. 2022, 199, 107609. [Google Scholar] [CrossRef]
  27. Xu, Z.; Zhu, D. Impact of Continuous Cable-Strut Joints on the Anti-Progressive-Collapse Performance of Suspended-Dome Structures. Buildings 2023, 13, 2225. [Google Scholar] [CrossRef]
  28. Zhao, J.; Liu, H.; Chen, Z.; Zhao, S.; Yang, S.; He, F. Investigation on the mechanical behavior of two-way glulam beam string. J. Build. Eng. 2024, 87, 108931. [Google Scholar] [CrossRef]
  29. Zhou, H.; Jiang, Y.; Adhikari, S.; Yin, Q.; Cai, J. Comparisons of design methods for beam string structure based on reliability and progressive collapse analysis. Structures 2021, 33, 2166–2176. [Google Scholar] [CrossRef]
  30. Zhang, J.; Zhou, P.; Guan, C.; Liu, T.; Kang, W.H.; Feng, P.; Gao, S. An ultra-lightweight CFRP beam-string structure. Compos. Struct. 2020, 257, 113149. [Google Scholar] [CrossRef]
  31. Zhang, H.; Wang, Y. Key component capture and safety intelligent analysis of beam string structure based on digital twins. Symmetry 2022, 14, 1152. [Google Scholar] [CrossRef]
  32. Madan, K.S.; Dutta, S. Free vibration analysis of a laminated composite plate using experimental modal testing. Mater. Today Proc. 2023, 72 Pt 3, 1573–1583. [Google Scholar]
  33. Liu, G.; Cong, J.; Wang, P.; Du, S.; Wang, L.; Chen, R. Study on vertical vibration and transmission characteristics of railway ballast using impact hammer test. Constr. Build. Mater. 2022, 316, 125898. [Google Scholar] [CrossRef]
  34. Grosel, J.; Sawicki, W.; Pakos, W. Application of classical and operational modal analysis for examination of engineering structures. Procedia Eng. 2014, 91, 136–141. [Google Scholar] [CrossRef]
  35. Zheng, Z.; Chen, J.; Hu, J.; Xu, J.; Bai, T.; Lai, J.; Wang, P. Nonlinear vibration characteristics of turnout rails: Simulation and advanced nonlinear modal testing. Mech. Syst. Signal Process. 2025, 230, 112623. [Google Scholar] [CrossRef]
  36. Ahiwale, D.; Madake, H.; Phadtare, N.; Jarande, A.; Jambhale, D. Modal analysis of cracked cantilever beam using ANSYS software. Mater. Today Proc. 2022, 56, 165–170. [Google Scholar] [CrossRef]
  37. National Research Council Canada. National Building Code of Canada 2020; Canadian Commission on Building and Fire Codes: Ottawa, ON, Canada, 2020. [Google Scholar]
  38. General Services Administration. PBS-P100: Facilities Standards for the Public Buildings Service; Office of the Chief Architect: Washington, DC, USA, 2023.
  39. GB 50068-2018; Unified Standard for Reliability Design of Building, Structures; Ministry of Housing and Urban-Rural Development of the People’s Republic of China: Beijing, China. China Architecture & Building Press: Beijing, China, 2018.
  40. Weng, J.; Tan, K.H.; Lee, C.K. Modeling progressive collapse of 2D reinforced concrete frames subject to column removal scenario. Eng. Struct. 2017, 141, 126–143. [Google Scholar] [CrossRef]
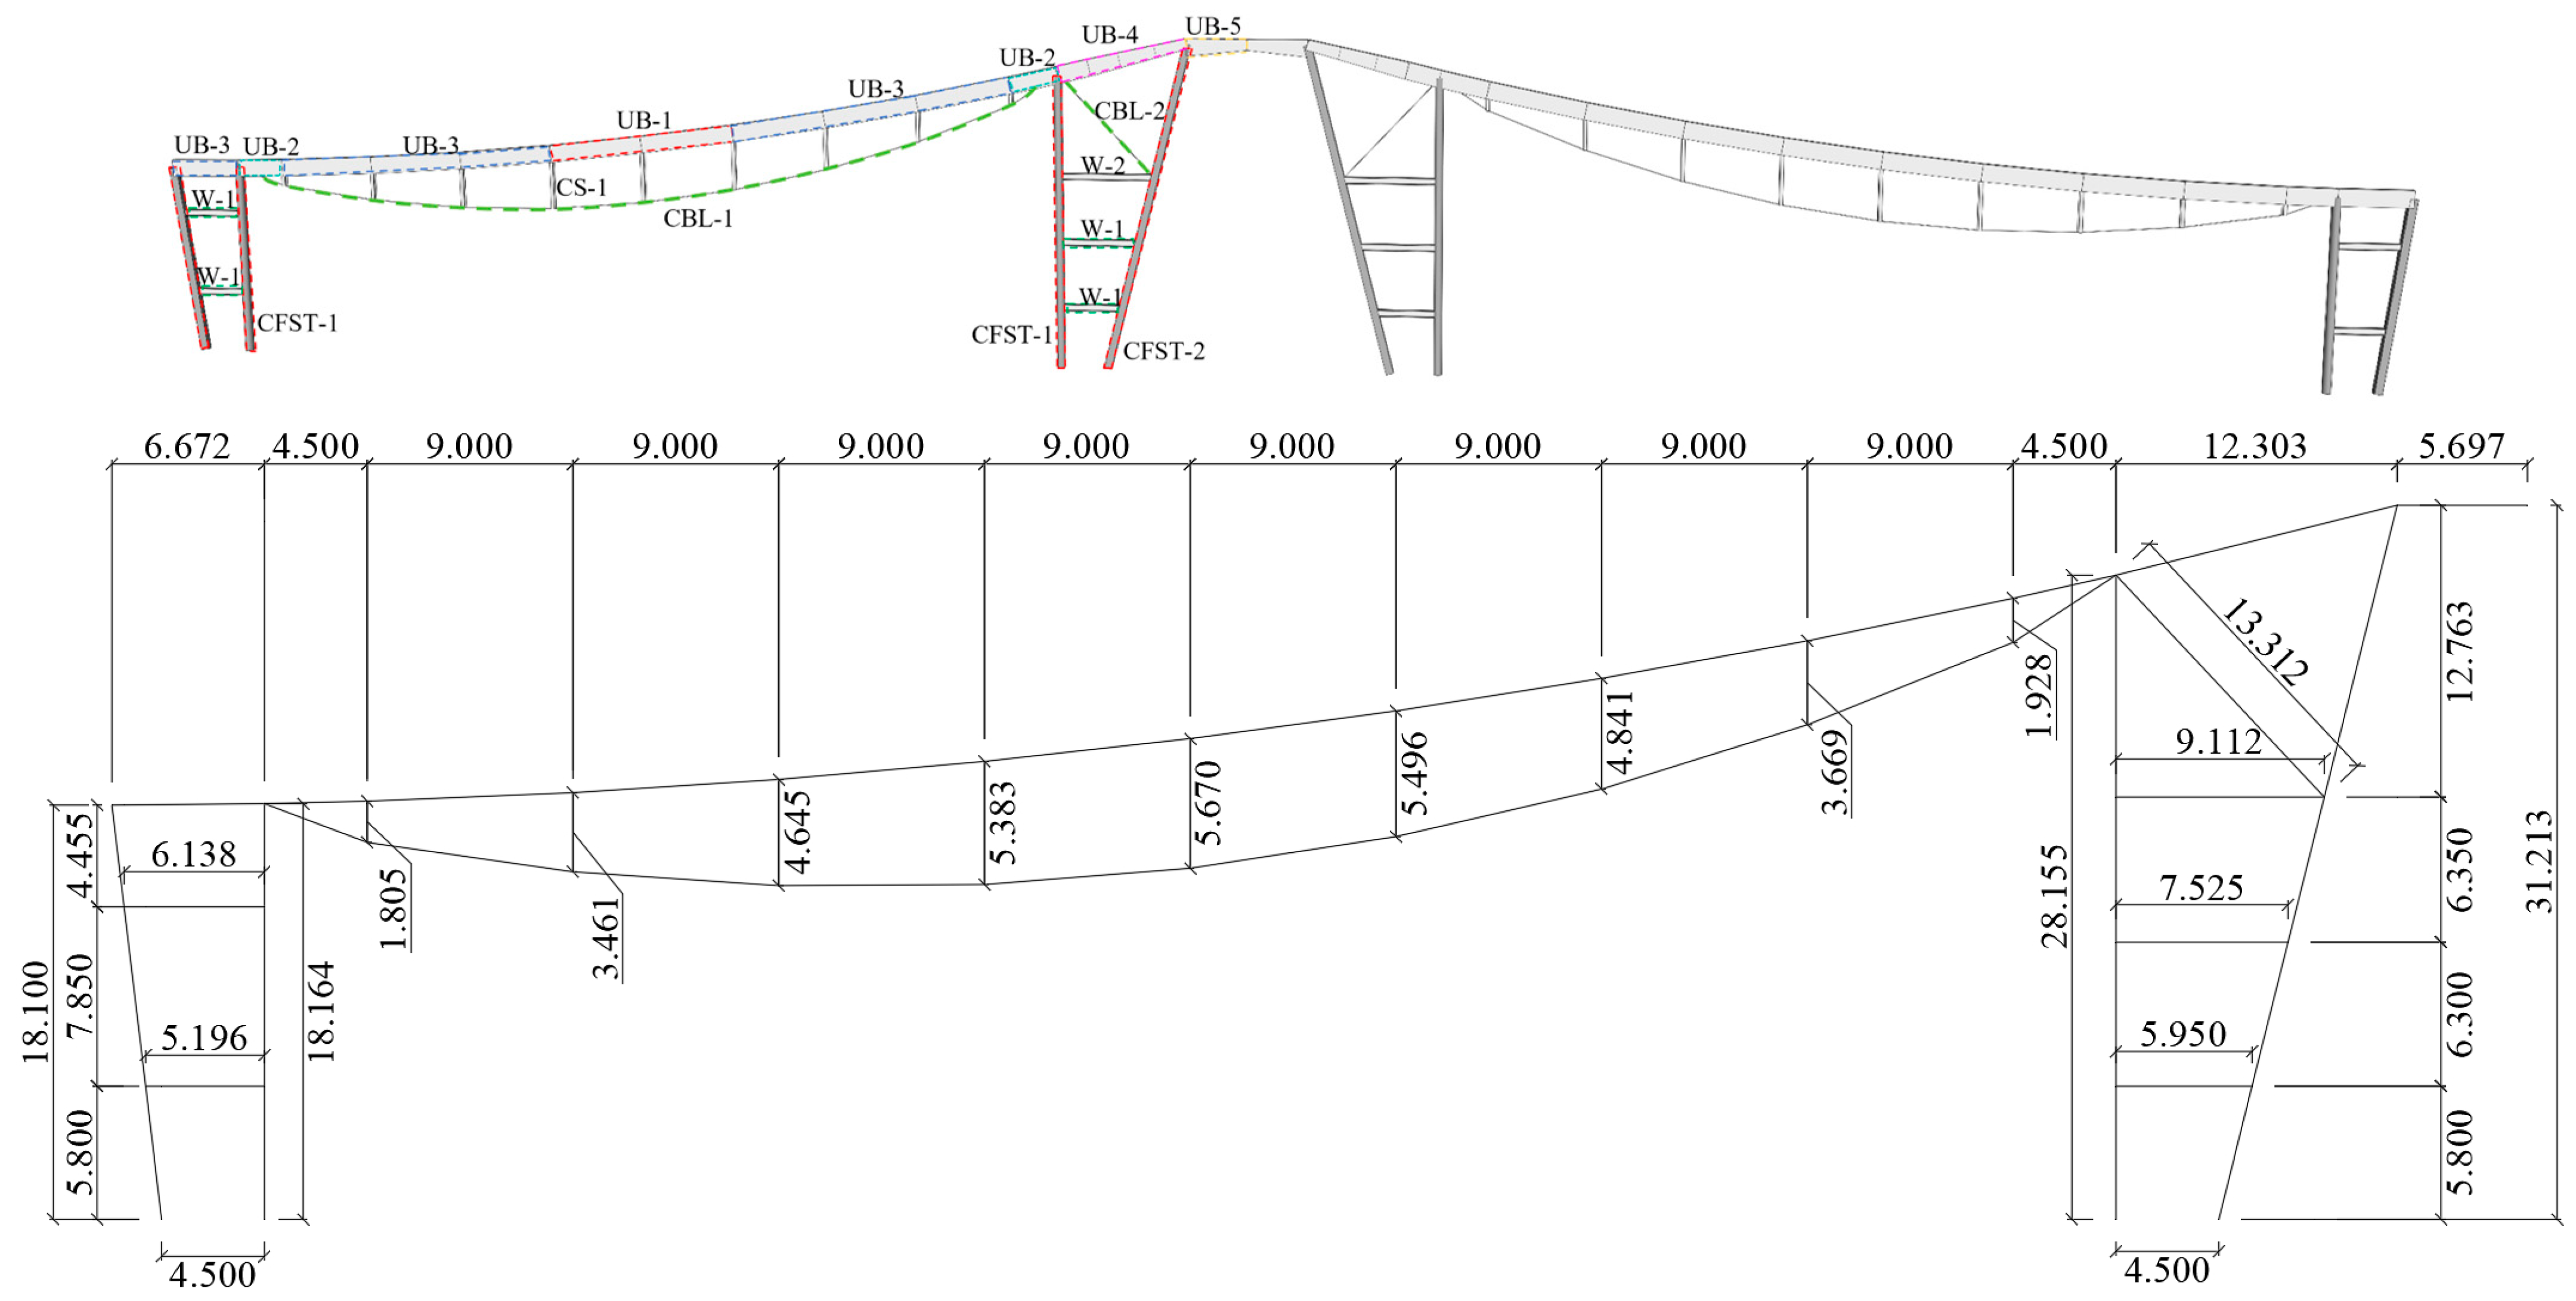
Figure 1. Section numbering and dimensions (m).
Buildings 15 03556 g001
Figure 2. Actual structure and field test.
Buildings 15 03556 g002
Figure 3. Excitation signal of hammering method.
Buildings 15 03556 g003
Figure 4. Fourier transformed time domain signal.
Buildings 15 03556 g004
Figure 5. Finite element model.
Buildings 15 03556 g005
Figure 6. The first mode of vibration.
Buildings 15 03556 g006
Figure 7. Structural robustness analysis model.
Buildings 15 03556 g007
Figure 8. Vertical displacement (m). (a) Normal operation. (b) Extreme load.
Buildings 15 03556 g008
Figure 9. Failure components and some other components.
Buildings 15 03556 g009
Figure 10. Column end connection design (mm).
Buildings 15 03556 g010
Figure 11. X node displacement time history curves. (a) Normal operation. (b) Extreme load.
Buildings 15 03556 g011
Figure 12. Final displacement deformation diagram (m). (a) Column 3 Failure-A. (b) Column 3 Failure-B. (c) Column 6 Failure-A. (d) Column 6 Failure-B. (e) Column 21 Failure-A. (f) Column 21 Failure-B. (g) Column 25 Failure-A. (h) Column 25 Failure-B.
Buildings 15 03556 g012
Figure 13. Final stress diagram (MPa). (a) Column 3 Failure-A. (b) Column 3 Failure-B. (c) Column 6 Failure-A. (d) Column 6 Failure-B. (e) Column 21 Failure-A. (f) Column 21 Failure-B. (g) Column 25 Failure-A. (h) Column 25 Failure-B.
Buildings 15 03556 g013aBuildings 15 03556 g013b
Figure 14. X node displacement time history curves. (a) Normal operation. (b) Extreme load.
Buildings 15 03556 g014
Figure 15. Final displacement deformation diagram (m). (a) Column 1 Failure-A. (b) Column 1 Failure-B. (c) Column 4 Failure-A. (d) Column 4 Failure-B. (e) Column 18 Failure-A. (f) Column 18 Failure-B. (g) Column 22 Failure-A. (h) Column 22 Failure-B.
Buildings 15 03556 g015aBuildings 15 03556 g015b
Figure 16. Final stress diagram (MPa). (a) Column 1 Failure-A. (b) Column 1 Failure-B. (c) Column 4 Failure-A. (d) Column 4 Failure-B. (e) Column 18 Failure-A. (f) Column 18 Failure-B. (g) Column 22 Failure-A. (h) Column 22 Failure-B.
Buildings 15 03556 g016
Figure 17. X node displacement time history curves. (a) Normal operation. (b) Extreme load.
Buildings 15 03556 g017
Figure 18. Final displacement deformation diagram (m). (a) Strut 9 Failure-A. (b) Strut 9 Failure-B. (c) Strut 10 Failure-A. (d) Strut 10 Failure-B. (e) Strut 11 Failure-A. (f) Strut 11 Failure-B. (g) Strut 12 Failure-A. (h) Strut 12 Failure-B. (i) Strut 13 Failure-A. (j) Strut 13 Failure-B. (k) Strut 14 Failure-A. (l) Strut 14 Failure-B. (m) Strut 15 Failure-A. (n) Strut 15 Failure-B. (o) Strut 16 Failure-A. (p) Strut 16 Failure-B. (q) Strut 17 Failure-A. (r) Strut 17 Failure-B.
Buildings 15 03556 g018aBuildings 15 03556 g018b
Figure 19. Final stress diagram (MPa). (a) Strut 9 Failure-A. (b) Strut 9 Failure-B. (c) Strut 10 Failure-A. (d) Strut 10 Failure-B. (e) Strut 11 Failure-A. (f) Strut 11 Failure-B. (g) Strut 12 Failure-A. (h) Strut 12 Failure-B. (i) Strut 13 Failure-A. (j) Strut 13 Failure-B. (k) Strut 14 Failure-A. (l) Strut 14 Failure-B. (m) Strut 15 Failure-A. (n) Strut 15 Failure-B. (o) Strut 16 Failure-A. (p) Strut 16 Failure-B. (q) Strut 17 Failure-A. (r) Strut 17 Failure-B.
Buildings 15 03556 g019aBuildings 15 03556 g019b
Figure 20. X node displacement time history curves.
Buildings 15 03556 g020
Figure 21. Final displacement deformation diagram (m). (a) Upper beam 81 Failure. (b) Upper beam 92 Failure. (c) Upper beam 106 Failure.
Buildings 15 03556 g021
Figure 22. Final stress diagram (MPa). (a) Upper beam 81 Failure. (b) Upper beam 92 Failure. (c) Upper beam 106 Failure.
Buildings 15 03556 g022
Figure 23. Axial force time history curve diagram.
Buildings 15 03556 g023
Figure 24. Axial force time history curve diagram.
Buildings 15 03556 g024
Figure 25. Axial force time history curve diagram.
Buildings 15 03556 g025
Table 1. Sectional dimensions.
Serial NumberSection Size (mm)Serial NumberSection Size (mm)
UB-1Buildings 15 03556 i001CS-1Buildings 15 03556 i002
UB-2Buildings 15 03556 i003CFST-1Buildings 15 03556 i004
UB-3Buildings 15 03556 i005CFST-2Buildings 15 03556 i006
W-1Buildings 15 03556 i007UB-4Buildings 15 03556 i008
W-2Buildings 15 03556 i009UB-5Buildings 15 03556 i010
CBL-1Buildings 15 03556 i011CBL-2Buildings 15 03556 i012
Table 2. Material parameters.
MemberModulus of
Elasticity (Pa)
Poisson’s RatioMass
Density
(kg/m3)
Yield Strength
(MPa)
Upper beam2.06 × 10110.37850345
Cable strut2.06 × 10110.37850345
Cable1.6 × 10110.380501570
Concrete-filled steel tubular column (circular)4.3 × 10100.21310093
Concrete-filled steel tubular column (square)4.3 × 10100.213100108
Table 3. Failure component.
NameFailure Component Number
End column3, 6, 21, 25
Column base1, 4, 18, 22
Upper beam81, 92, 106
Strut9, 10, 11, 12, 13, 14, 15, 16, 17
Table 4. X node displacement (normal operation).
Column
End
Number
Before
Failure
(mm)
Maximum
Displacement After
Failure (mm)
After Failure to Balance (mm)Maximum
Displacement
Variation (mm)
Maximum Stress (MPa)Location of Maximum Stress
3180.49−582.45−386.64401.96137Beam 8
6180.49−377.21−282.29196.73100Beam 8
21180.49−571.01−378.94390.52206Beam 107
25180.49−193.85−186.8713.3675Beam 107
Table 5. X node displacement (extreme load).
Column
End
Number
Before
Failure
(mm)
Maximum
Displacement After
Failure (mm)
After Failure to Balance (mm)Maximum
Displacement
Variation (mm)
Maximum Stress (MPa)Location of Maximum Stress
3247.92−760.70−509.22512.78168Beam 8
6247.92−463.95−358.94216.03130Beam 107
21247.92−809.89−561.21561.97257Beam 7
25247.92−292.08−268.5644.15201Beam 7
Table 6. Importance factors.
Serial Numberγiγi
31.142 1.054
60.564 0.448
211.100 1.264
250.035 0.083
Table 7. X node displacement (normal operation).
Column
Base
Number
Before
Failure
(mm)
Maximum
Displacement After
Failure (mm)
After Failure to Balance (mm)Maximum
Displacement
Variation (mm)
Maximum Stress (MPa)Location of Maximum Stress
1180.49−393.31−285.79212.82216Beam 7
4180.49−259.44−220.0278.9592Beam 28
18180.49−271.73−224.3991.24183Beam 26
22180.49−192.18−186.3211.69106Beam 28
Table 8. X node displacement (extreme load).
Column
Base
Number
Before
Failure
(mm)
Maximum
Displacement After
Failure (mm)
After Failure to Balance (mm)Maximum
Displacement
Variation (mm)
Maximum Stress (MPa)Location of Maximum Stress
1247.92−565.25−400.84317.33183Beam 7
4247.92−396.11−320.50148.18139Beam 107
18247.92−347.19−295.4999.26237Beam 26
22247.92−263.51−255.6715.59163Beam 7
Table 9. Importance factors.
Serial Numberγiγi
10.583 0.617
40.219 0.293
180.243 0.192
220.032 0.031
Table 10. X node displacement (normal operation).
Number of StrutsBefore
Failure
(mm)
Maximum
Displacement After
Failure (mm)
After Failure to Balance (mm)Maximum
Displacement
Variation (mm)
Maximum Stress (MPa)Location of Maximum Stress
9180.49−179.82−180.060.67183Strut 10
10180.49−178.91−179.651.5878Beam 28
11180.49−175.96−178.064.5373Beam 28
12180.49−172.36−176.058.1378Beam 28
13180.49−170.66−175.089.8373Beam 28
14180.49−172.04−175.928.4573Beam 28
15180.49−175.58−177.914.9173Beam 28
16180.49−178.70−179.571.7878Beam 28
17180.49−180.12−180.280.37184Strut 16
Table 11. X node displacement (extreme load).
Number of StrutsBefore
Failure
(mm)
Maximum
Displacement After
Failure (mm)
After Failure to Balance (mm)Maximum
Displacement
Variation (mm)
Maximum Stress (MPa)Location of Maximum Stress
9247.92−247.26−247.520.66199Strut 10
10247.92−246.51−247.181.42159Beam 7
11247.92−243.54−245.614.38159Beam 7
12247.92−239.80−243.548.13159Beam 7
13247.92−238.05−242.549.88159Beam 7
14247.92−239.51−243.428.42159Beam 7
15247.92−243.21−245.484.72160Beam 7
16247.92−246.32−247.121.61160Beam 7
17247.92−247.59−247.740.34197Strut 16
Table 12. Importance factors.
Serial Numberγiγi
90.002 0.002
100.005 0.003
110.013 0.009
120.025 0.018
130.030 0.022
140.025 0.018
150.014 0.010
160.005 0.003
170.001 0.001
Table 13. X node displacement and importance factor.
Upper Beam
Number
Before
Failure (mm)
Maximum
Displacement
After
failure (mm)
After Failure
to Balance (mm)
Maximum
Displacement
Variation (mm)
Maximum Stress (MPa)Location of Maximum Stressγi
81180.49 345Beam 104
92180.49−947.48−653.99766.99151Beam 1042.623
106180.49 349Beam 83
Disclaimer/Publisher’s Note: The statements, opinions and data contained in all publications are solely those of the individual author(s) and contributor(s) and not of MDPI and/or the editor(s). MDPI and/or the editor(s) disclaim responsibility for any injury to people or property resulting from any ideas, methods, instructions or products referred to in the content.