Article

Quantifying the Impact of Energy Storage Capacity on Building Energy Flexibility: A Case Study of the PV-ESS-GSHP System

School of Municipal and Environmental Engineering, Shenyang Jianzhu University, Shenyang 110168, China
*
Author to whom correspondence should be addressed.
Buildings 2025, 15(19), 3536; https://doi.org/10.3390/buildings15193536
Submission received: 3 September 2025 / Revised: 23 September 2025 / Accepted: 29 September 2025 / Published: 1 October 2025
(This article belongs to the Special Issue Sustainable Architecture and Healthy Environment)

Abstract

Demand-side management has been demonstrated as an efficient and feasible method to unlock the flexibility on the demand side and support the flexible regulation of power systems. In integrated energy systems (IES) of buildings, through energy storage systems (ESS) and demand response methods, the utilization rate of renewable energy can be effectively improved, and the stability of the grid can be enhanced. However, the traditional energy usage methods of IES have limited responsiveness to the power system. Moreover, existing flexible energy usage strategies based on demand response rarely consider the impact of ESS in IES on energy usage strategies. Addressing the aforementioned issues, this paper proposes a flexible energy usage strategy based on ESS and demand-side management. This strategy takes into account the daily energy production and consumption of IES, as well as the relationship between user load and the grid, forming a hierarchical scheduling mechanism for energy usage. To fully explore the impact of ESS capacity on flexible energy usage scheduling strategies, the scheduling role of ESS is quantified in terms of photovoltaic utilization rate, responsiveness, and overall cost. The results indicate that implementing the flexible energy scheduling strategy in the system increases the annual PV self-consumption by 35.29%. With higher ESS capacity, the PV self-consumption rate (SCR) can be maximized, improving by up to 4.07%. The system’s response capability is enhanced after adopting the scheduling strategy and improves further with increasing ESS capacity. Regarding costs, although applying this strategy leads to a rise in ESS operational loss costs during its functioning phase, the overall system costs decrease by approximately 65.13%, with a capacity-based variation of about 1.48%.

1. Introduction

Global climate change represents a major challenge that humanity is facing in the 21st century. Low-carbon, zero-carbon, and even negative-carbon technologies aimed at achieving carbon neutrality will be crucial to future global industrial revolutions and technological competition. According to the International Energy Agency (IEA), carbon emissions from the global building sector totaled approximately 4.5 billion tons of CO2 in 2023, accounting for 21% of total global carbon emissions [1]. In 2021, China’s carbon emissions from the operational phase of buildings amounted to 2.3 billion tons of CO2, representing 56.6% of total lifecycle emissions [2]. Therefore, optimizing system operations, combined with efficient energy storage devices and energy systems, is essential to achieving carbon reduction goals for buildings [3].
The proportion of renewable energy sources such as solar and wind energy integrated into distribution networks has been increasing year by year. According to the 2019 report by the International Renewable Energy Agency (IRENA), by 2050, the share of renewable energy in global annual electricity generation needs to rise from 25% to 86% [4]. Due to the volatility and intermittency of renewable energy generation, the interaction with the grid often leads to significant energy waste, such as curtailment of wind and solar power, which poses substantial challenges to the stability of the grid [5]. To reduce energy waste and enhance the flexibility of energy use, it is essential to promote research on building energy systems and flexible energy management technologies, improving their flexibility, safety, reliability, and efficiency [6,7].
The future energy structure to achieve carbon neutrality will be a new integrated energy system (IES) dominated by solar energy, with a complementarity of various energy sources. By integrating multiple forms of energy, such as electricity, heat, cooling, and gas, this system will enable multi-energy complementarity and intelligent scheduling [8,9,10,11]. Photovoltaic (PV) systems are one of the key technologies for achieving low-carbon buildings and clean energy supply. In recent years, PV technology has been widely applied in various fields such as buildings and industry, owing to its clean, efficient, and highly scalable characteristics. Especially in building-integrated photovoltaic (BIPV) systems, PV not only provides sustainable power for buildings but also serves a functional role in building design [12]. Although PV generation faces issues of intermittency and variability, these problems can be effectively mitigated through integration with energy storage systems and demand-side management, enabling efficient utilization of PV energy. Ground source heat pump (GSHP) technology, which utilizes the stable thermal properties of the underground for heating and cooling, is an efficient solution with significant advantages in cold regions [13]. Compared to air-source heat pumps, GSHPs are less affected by external climate fluctuations, and their high energy utilization efficiency plays a critical role in both winter and summer, providing stable indoor cooling and heating [14]. By integrating them with PV systems and energy storage, GSHPs can further enhance energy efficiency and reduce reliance on fossil fuels [15]. As PV and GSHP technologies continue to advance and be applied, their role in IES becomes increasingly vital, especially in terms of multi-energy complementarity and intelligent scheduling. By optimizing the collaborative operation of these systems, it is possible to further improve the energy autonomy and sustainability of buildings, thereby promoting the development of low-carbon buildings and smart grids.

2. Related Studies

A considerable amount of research has been conducted on the flexible scheduling of multi-energy systems [16,17,18]. Lamnatou [19] summarized the changes in intelligent technologies for photovoltaic and energy storage systems in residential buildings but did not focus on the impact of demand-side data on building services The literature [20] analyzes the applicability of energy flexibility strategies in hot climates, using a building in Dubai as a case study. Mlecnik [21] discussed the progress of key policies and factors in building energy systems, noting that flexible energy supply has become a key research area in multi-energy systems. Niklas [22] explored how energy storage can improve flexibility in multi-energy systems. Wang [23] comprehensively considered the flexibility utility of energy production, conversion, storage, and user-side effects, including the flexibility of gas and thermal pipelines. They developed a two-stage adaptive robust optimization (ARO) method to obtain flexibility parameters for microgrids, taking into account uncertainties from renewable energy power, load configurations, and scheduling instructions from the power distribution system. The literature [24] proposes a building microgrid energy management model integrated with battery storage, using a market-based pricing approach to schedule the battery as a flexible energy resource. Research [25] has shown that, compared to thermal water tank solutions, the clever use of building thermal inertia can significantly reduce excess electricity production and fuel consumption, while lowering overall costs. Shakeri [26] proposed a strategy for energy storage charging and discharging under time-of-use electricity pricing, as well as an optimization strategy for microgrid operation, developing a model aimed at maximizing photovoltaic utilization and annual net profit. In summary, existing research has made significant strides in the flexible scheduling of multi-energy systems, focusing on areas such as photovoltaic integration, energy storage, demand-side management, and optimization methods. While many studies have addressed the technological advancements and strategies for improving energy flexibility, there remains a gap in incorporating demand-side data into the scheduling processes and fully evaluating the economic implications of different system configurations.
As a pivotal coupling device enabling energy conversion between electricity and heat, heat pumps play a critical role in the coordinated operation of power systems and heating systems. Literature [27] highlights the significant contributions of heat pumps in enhancing energy utilization efficiency and facilitating renewable energy integration. The operational flexibility of heat pumps manifests in their adjustable power characteristics and inherent thermal storage potential. Li et al. studied the optimization of DC variable-frequency heat pumps under photovoltaic power fluctuations and demand-side load characteristics [28]. Gradwohl et al. optimized the operation strategy of heat pumps to reduce energy costs, improve self-sufficiency, and alleviate grid pressure [29]. The literature [30] investigates the coupled optimization of GSHP systems and district heating networks. Under power constraints, the study optimizes the coordinated use of GSHP and district heating, achieving effective cost–benefit control. Studies demonstrate that coordinated scheduling of heat pumps with electric boilers and TES systems can effectively mitigate peak-valley load differences in power grids while reducing operational costs. For instance, through time-of-use electricity pricing mechanisms, heat pumps can store thermal energy during off-peak periods and release it during peak demand intervals, thereby optimizing electricity-heat supply-demand matching [31].
As renewable energy gradually becomes the mainstream energy source, its inherent volatility and intermittency pose challenges to the stability of the power grid. PV generation exhibits significant sensitivity to solar irradiation fluctuations, while heat pump load demands (for heating/cooling) demonstrate a time-dependent nature. ESS can regulate the electricity demand profile of heat pumps through peak shaving and valley filling [32,33], achieving economic optimization of energy storage and discharge by leveraging peak-valley electricity price differentials [34]. For example, Li [35] investigated the integration of PV and ESS, demonstrating that real-time energy management strategies, through execution and optimization, enhanced the system’s performance, economics, and reliability. This approach proved particularly advantageous in addressing fluctuations in photovoltaic generation and load variability. Depending on the technology, ESS can be classified into mechanical, electrochemical, electrical, chemical, and thermal forms [36], with battery energy storage systems (BESS) being particularly notable. Although degradation occurs during usage, BESS can still provide a degree of flexibility services [37]. Sandoval [38] assessed the DSM of distributed electrical storage, evaluating the flexibility of electricity demand with different battery sets in residential buildings, highlighting the active coordination role of buildings between electricity utilities and end-users. The authors of [39] introduced commonly used mathematical models for microgrid Energy management systems (EMS) and methods for determining BESS capacity. Li et al. [40] proposed an optimization scheduling method for photovoltaic-battery energy storage systems based on dynamic programming algorithms. They compared the impact of unit storage cost and storage capacity on the system’s profitability. The results indicated that when the unit storage cost decreased to 100 $/kWh, the system became profitable under various time-of-use electricity pricing structures. Additionally, the system demonstrated superior economic performance in cold regions, with dynamic electricity pricing having a significant impact on its economic viability. In summary, the integration of renewable energy sources, such as PV and heat pumps, with ESS offers solutions to grid stability issues, reduces costs, and enhances system performance through real-time energy management and optimization.
In addition to promoting renewable energy usage, demand-side management (DSM) also plays a crucial role in building energy conservation. By implementing effective demand-side management strategies, buildings can optimize energy consumption, reduce peak loads, and improve energy efficiency [41,42,43]. Through raising users’ awareness of energy efficiency and guiding rational energy use behaviors, DSM can make a significant contribution to energy-saving and emission-reduction efforts in buildings. Practical experience has shown that in grid-interactive buildings, DSM is an effective method for load reshaping, such as load shifting [44]. Studies indicate that DSM can also increase the proportion of renewable energy used and promote grid systems with a higher share of intermittent energy [45]. Compared to traditional building energy systems, the application of energy storage and renewable energy in buildings requires additional investment. However, these methods can leverage dynamic energy prices and DSM incentives to achieve economic benefits, fundamentally enhancing the capacity for energy flexibility [46]. DR programs are generally divided into two categories: price-based demand response and incentive-based demand response [47]. Both price-based and incentive-based DR have been extensively studied both domestically and internationally. Alipour et al. [48] proposed a demand response management model for cogeneration users based on real-time electricity prices. The model aims to minimize costs, taking into account different thermal-electric dependence characteristics and meeting technical constraints such as minimizing start/stop cycles, ramping rate limitations, and time constraints. Rehman [49] considered using demand response to achieve flexible operation of an independent power system containing renewable energy. Consumers can make decisions about load shifting based on the elastic relationship between price and response, thereby addressing issues such as increased peak shaving difficulty and rising peak shaving costs. Sarsabahi [50] studied the extent to which residential energy storage systems participating in incentive-based demand response programs can achieve load shifting, as well as how users of heat pump systems can better realize flexibility advantages. While dynamic pricing and DSM incentives are emphasized, practical implementation remains constrained by investment costs and technical challenges, particularly in grid-interactive systems with intermittent renewable energy sources.
This paper provides a comprehensive review of multi-energy system scheduling, the flexibility of heat pumps and ESS, and the application of DSM in energy systems. Current research on the flexible scheduling of multi-energy systems and their interaction with the grid remains limited. Many studies have not focused on the integration of photovoltaic, heat pump, and energy storage systems, particularly in achieving dynamic responses based on grid-side signals.
As highlighted in the literature review, ESS and DSM are effective means to achieve flexible energy use in buildings. This study proposes a hierarchical scheduling strategy for energy systems based on DSM, exploring how building loads influence energy scheduling. The strategy incorporates dynamic electricity pricing and load response to enhance flexibility and economic efficiency. It effectively adapts to time-of-use price variations while ensuring calculation accuracy and speed. Additionally, the study emphasizes the critical role of ESS in flexible energy scheduling. Multiple metrics are used to quantify the ESS’s flexibility. The impact of different energy storage capacities on photovoltaic self-consumption rate, system responsiveness, and economic performance is analyzed in depth, ensuring the effectiveness of the optimal energy management strategy and improving overall system efficiency. The specific research content of this study is as follows:
Section 3 introduces a hierarchical flexible energy scheduling strategy based on the PV-ESS-GSHP system, outlining the energy usage priorities within the system. ESS capacity constraints are proposed based on the system’s energy balance. Finally, the section describes the setup of the simulation case and the input data used.
Section 4, based on specific building energy consumption data and climate conditions, uses simulations to analyze the impact of different energy storage capacities on PV utilization, system responsiveness, and cost-effectiveness. The study also investigates the operational performance of the GSHP system under various climatic conditions, with a particular focus on its applicability in northern regions.

3. Method

3.1. Flexible Energy Use Hierarchical Scheduling Strategy

Traditional scheduling models often overlook the interactions between energy systems and the potential for flexible scheduling [51]. In contrast, this study optimizes the overall performance of energy systems by considering the synergies between different energy sources. Particularly in northern China, the seasonal fluctuations in heating demand during winter and cooling demand during summer require scheduling systems to have higher adaptability and responsiveness. Therefore, this study proposes a multi-energy system integration of PV, energy storage, and GSHP, and constructs a hierarchical energy scheduling framework. The model first prioritizes various energy resources based on production conditions and energy demand and then schedules them according to actual load requirements and the variability of renewable energy. By incorporating demand-side management strategies, the model enables flexible adjustment of building energy usage during grid load peak periods, reducing reliance on the grid and enhancing the utilization efficiency of renewable energy.
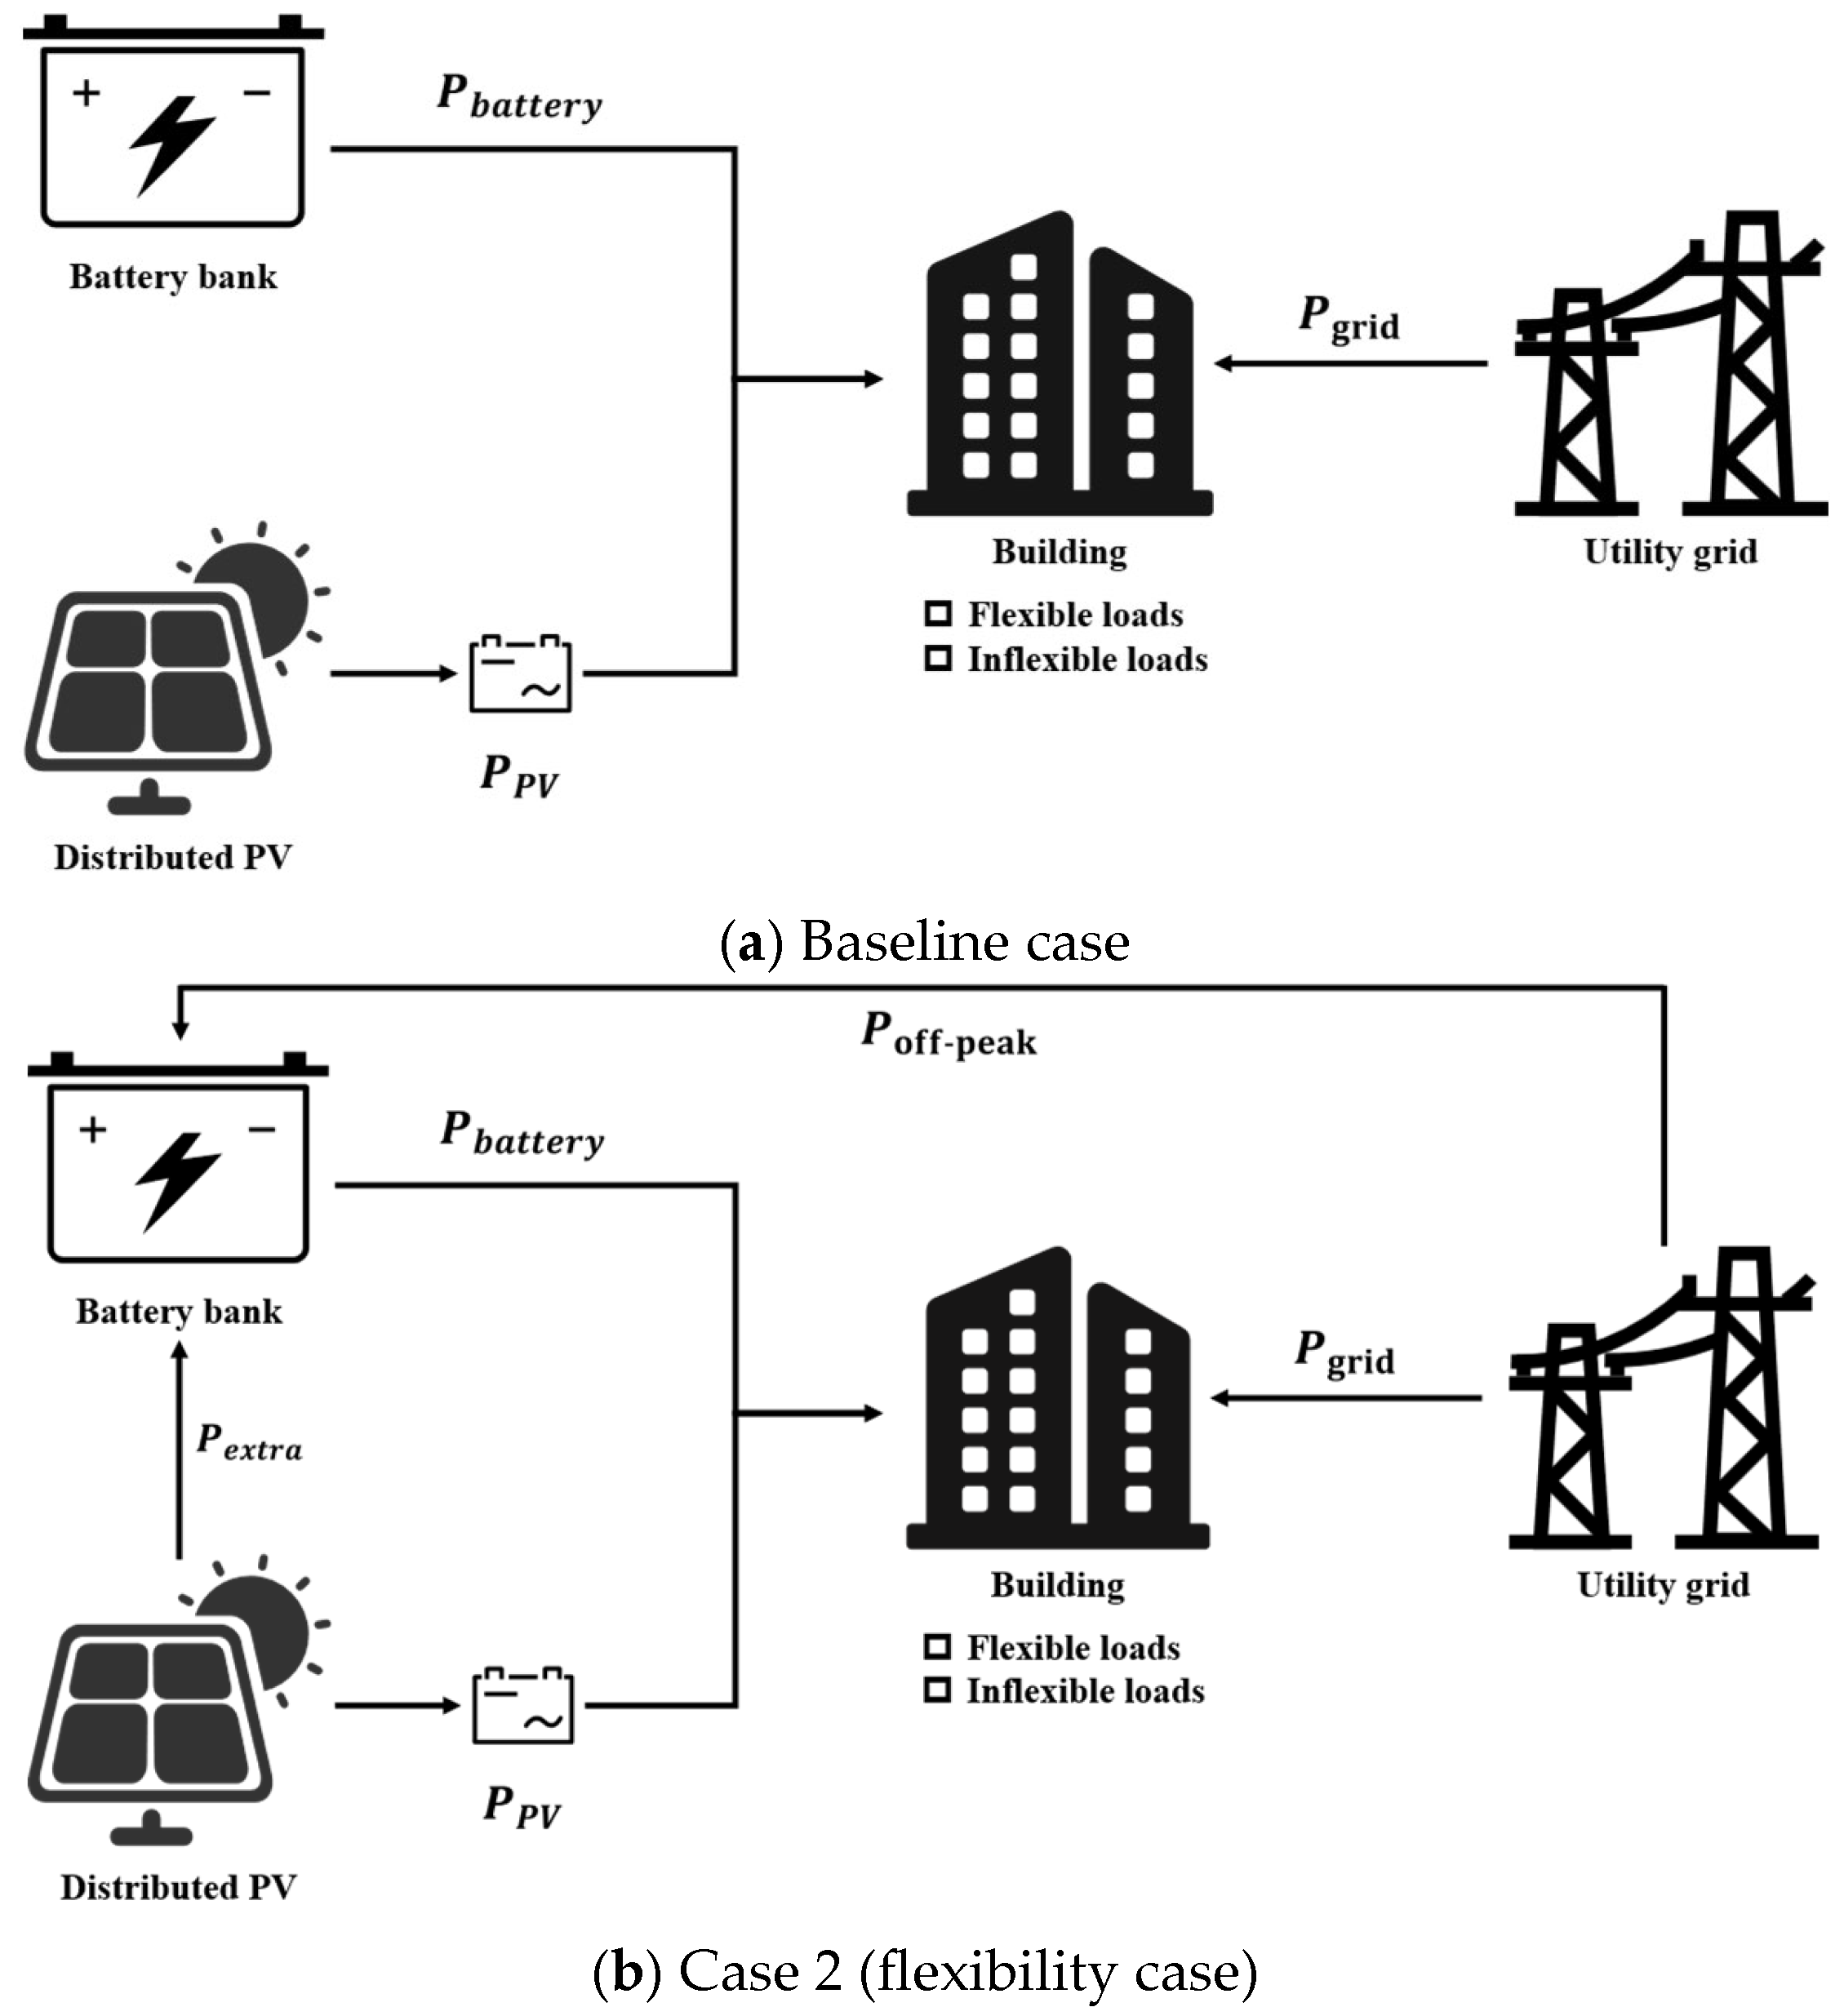
The energy scheduling priority refers to the principle by which users or the system assign a priority to processes, with the system scheduling processes with higher priorities to run first [52]. In this study, the photovoltaic generation module is the first priority for energy supply, the ESS is the second priority, and the municipal grid is the third priority for energy supply. The lighting, office equipment, and other non-movable loads are the first priority for energy demand, while the geothermal heat pump system is the second priority. The structure of the building’s energy system is shown in Figure 1.
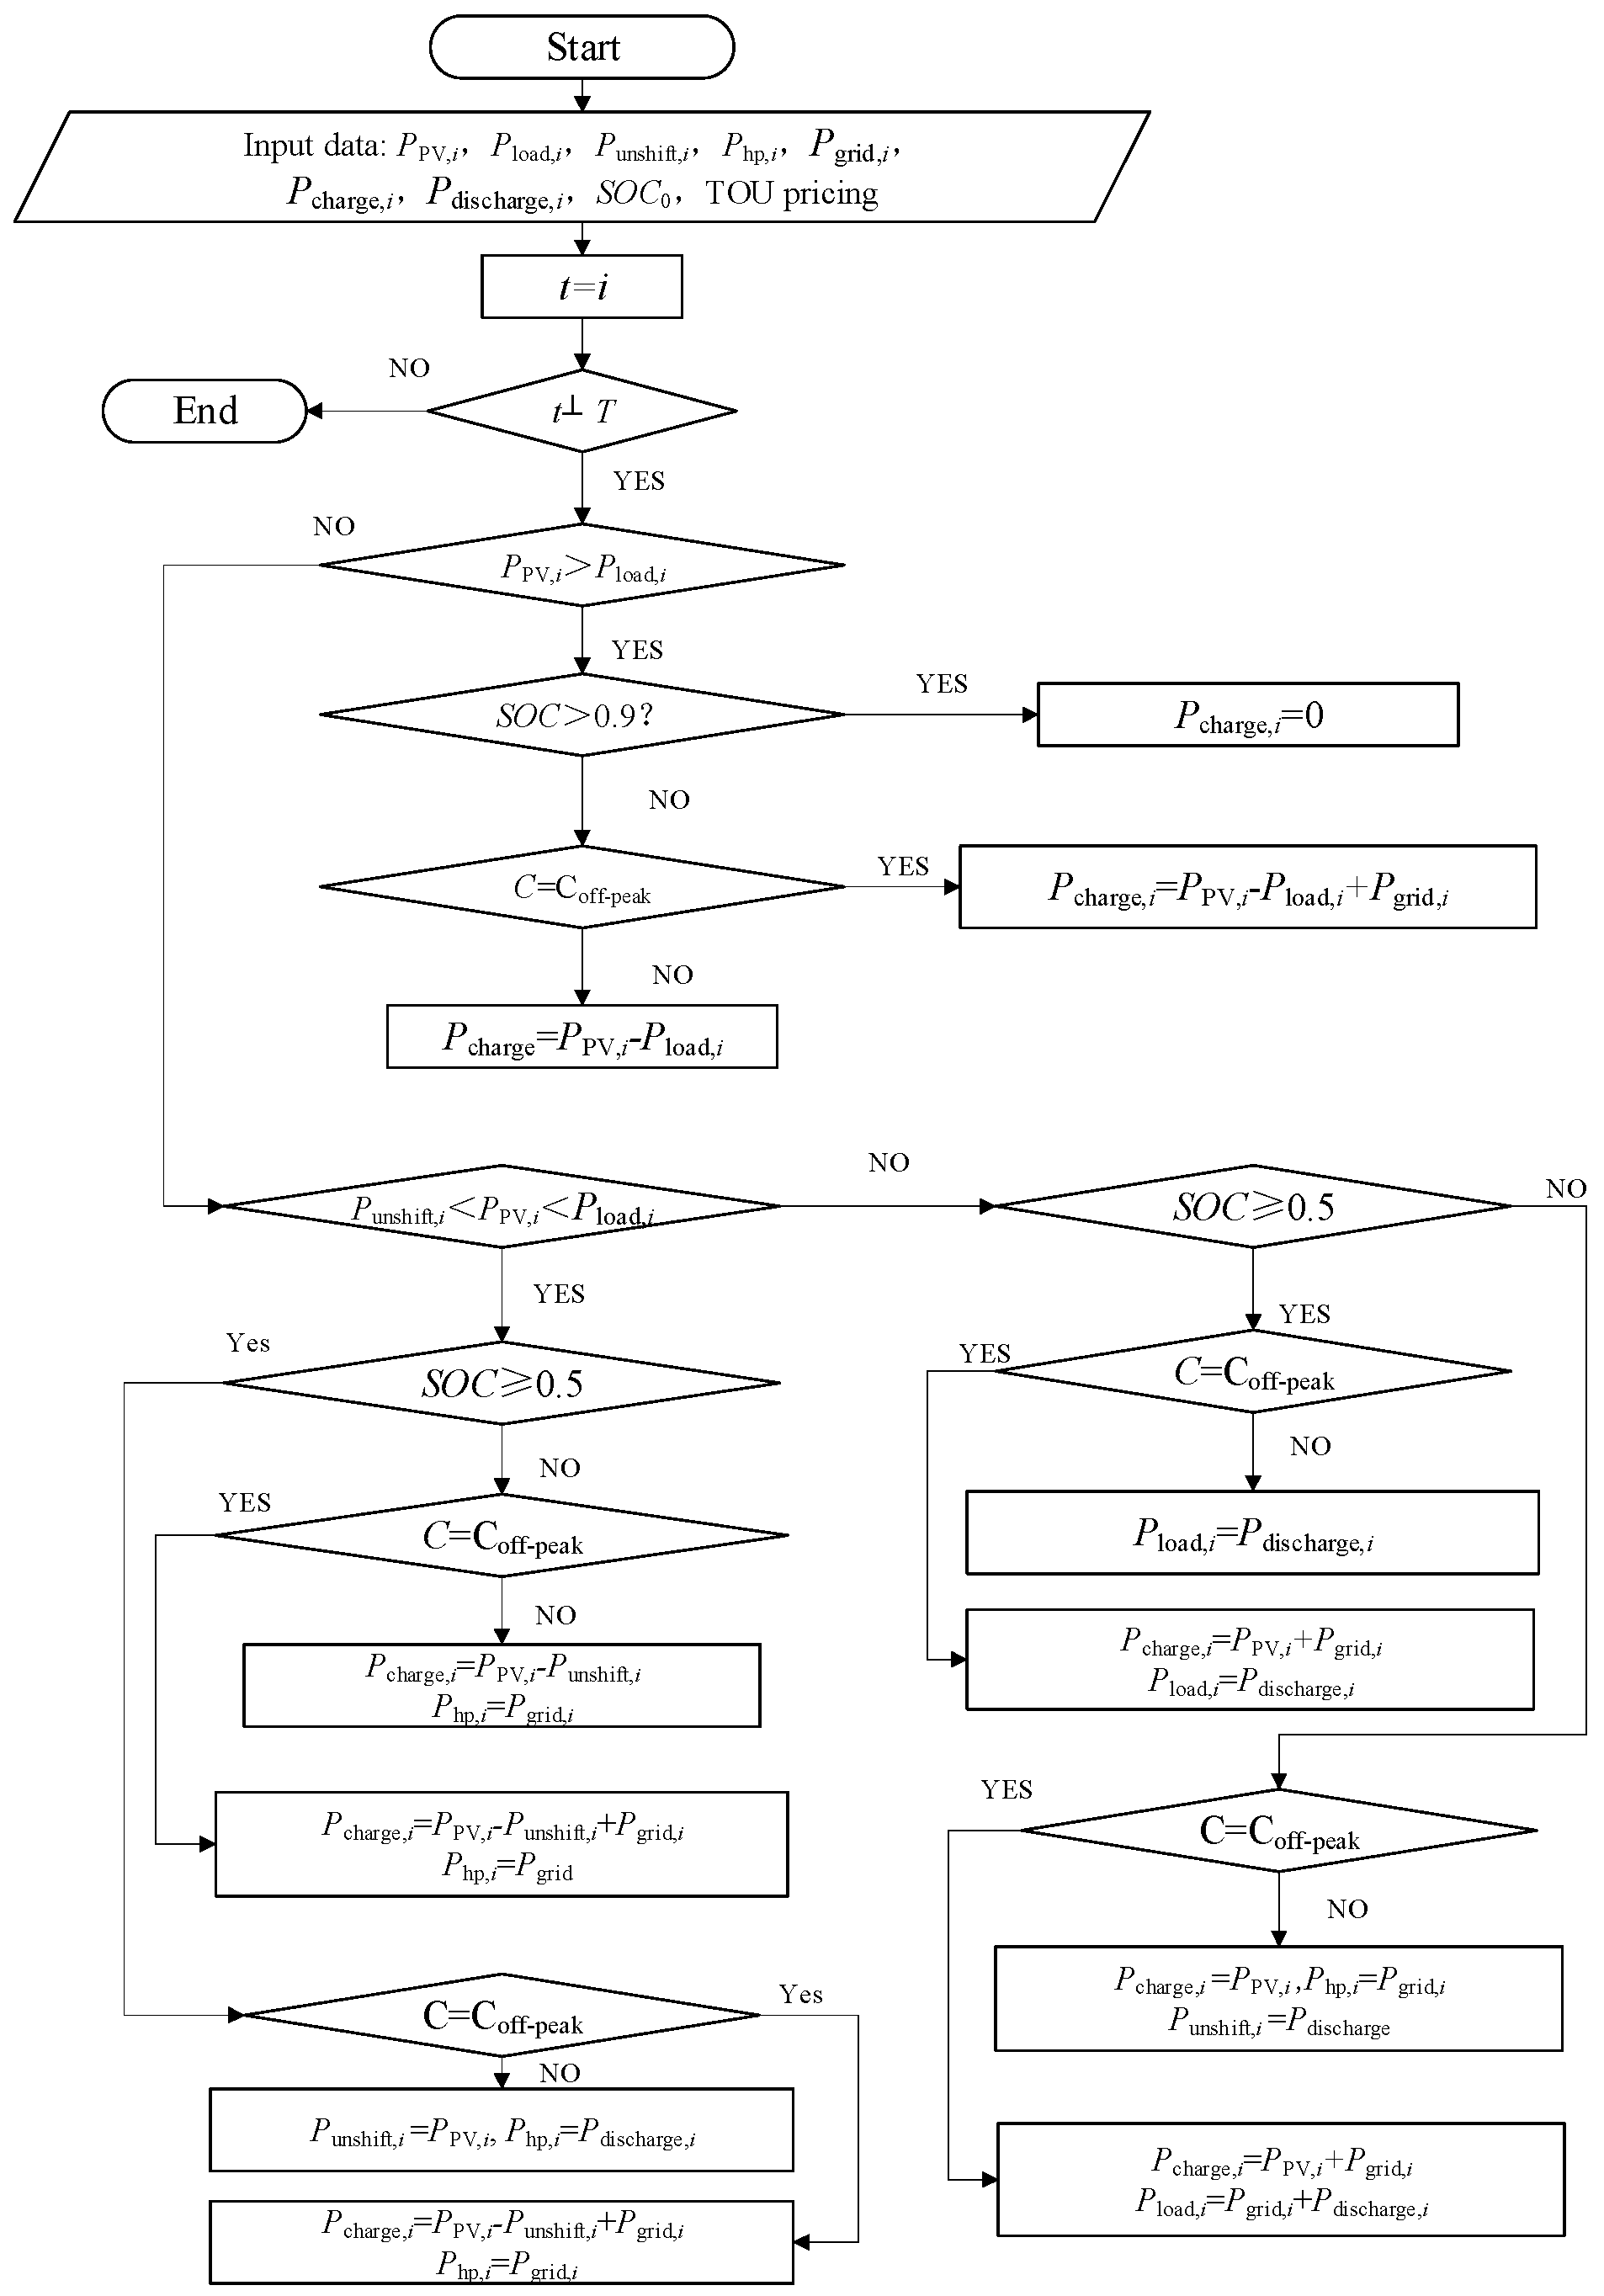
Based on the scheduling principles and judgment conditions, an energy management module has been developed in TRNSYS to manage energy use. The module determines the relationship between energy production and consumption based on the scheduling principles, thereby enabling energy scheduling. Figure 2 illustrates the scheduling priorities and judgment principles set within the energy management module.
The energy scheduling strategy is based on priority rules, considering PV power consumption, battery charging/discharging, and equipment energy use across different time intervals. On the supply side, the PV generation is compared to the total user load, followed by an assessment of the battery’s SOC and the current electricity pricing period. On the demand side, non-movable loads, such as lighting and office equipment, are prioritized, followed by the geothermal heat pump system. The energy scheduling process is hierarchical, as outlined in Figure 3.
The textual description of the steps for the hierarchical scheduling strategy is as follows:
Input Parameters: The model reads hourly parameters including PV generation, user load, initial battery SOC, battery capacity, and peak/off-peak electricity prices.
Step 1: PV Generation vs. User Load: The first condition checks whether PV generation can meet the user load.
Step 2: Battery SOC: The second condition evaluates the battery’s SOC to determine if excess PV generation can be stored.
Step 3: Off-peak Pricing: The third condition checks if the current time is within the off-peak period. If so, and if the SOC allows, the battery may be charged.

3.2. Supply-Demand Matching and ESS Constraints

Section 3.2.1 presents the model of the energy balance equation based on supply-demand equilibrium, while Section 3.2.2 provides the constraints for the ESS capacity.

3.2.1. Energy Balance Relationship

The energy generation and supply of the PV-ESS-GSHP system are primarily composed of several modules: energy supply modules such as the municipal grid and photovoltaic PV panels, energy consumption devices such as end-user equipment and water pumps, energy storage devices like ESS, and energy conversion devices like geothermal heat pump units and inverters. During the charging process, the ESS acts as an energy consumption device, while during the discharging process, it functions as an energy supply device. The electrical energy demand of the equipment is supplied by the photovoltaic system, the grid, and the battery storage, while the thermal demand of the end-user equipment is supplied by the heat pump. The energy balance of the system is as follows.
P PV ( i ) + P grid ( i ) + P discharge ( i ) = P unshift ( i ) + P hp ( i ) + P charge ( i )
P PV ( i ) is the PV-to-load power at time interval i, P grid ( i ) is the grid-to-load power at time interval i, P discharge ( i ) is the ESS discharge power at time interval i, P unshift ( i ) is the non-shiftable load power at time interval i, P hp ( i ) is the GSHP power at time interval i, P charge ( i ) is the ESS charge power at time interval i.

3.2.2. Constraints for the Election of ESS Capacity

The power constraints of the ESS are shown in Equation (2).
0 P charge ( i ) μ DC P ESS , max 0 P discharge ( i ) μ DC P ESS , max
μ DC is the inverter conversion efficiency. P ESS , max is the maximum discharging power of the battery.
The capacity constraints of the ESS are shown in Equations (3).
η MIN S O C ( i ) η MAX S O C ( t ) = S O C ( t 1 ) + P E S S ( t ) η discharge t E E S S
ηMIN and ηMAX are the minimum and maximum allowable discharge depths of the battery. ηdischarge is the discharge efficiency.

3.3. Description of the Case

3.3.1. Simulation Case Setting

To investigate the impact of energy storage capacity on the flexible energy scheduling strategy within the PV-ESS-GSHP system, two comparative cases are considered in this study. Baseline case: The building’s energy supply is provided by PV power, energy storage batteries, and the power grid. The building prioritizes the use of PV-generated electricity, with any surplus PV generation stored in the energy storage batteries. Case 2 (Flexibility case): Based on the baseline case, a flexible energy scheduling strategy is applied, utilizing the developed energy management module to prioritize energy usage. Table 1 compares the energy strategies for the two cases, and Figure 4 illustrates the system diagram for the cases.

3.3.2. Input Data

In severe cold regions of China, characterized by short winter daylight hours and low solar radiation intensity, the power generation capacity of PV systems is significantly constrained. This study addresses the challenge by proposing a hybrid energy system integrating ESS and GSHP. A small-scale office building in such a climate zone is selected as the case study to demonstrate this energy complementarity strategy. The building has two above-ground floors and a total floor area of 167.4 m2. The dimensions of the building are 18.6 m in length, 10 m in width, and 7 m in height, with the first floor having a ceiling height of 3.3 m and the second floor having a ceiling height of 3.6 m. The building’s form factor is 0.47, and the window-to-wall ratio is 0.09, with the following orientations: 0.09 for the west-facing side, 0.12 for the south-facing side, 0.12 for the north-facing side, and 0.05 for the east-facing side. The building’s functional rooms include a heat pump room, kitchen, demonstration room, restrooms, and office areas. An architectural model is established in the TRNBuild based on the physical dimensions and envelope parameters of the building. The roof area of the building determines the area for the photovoltaic module installation. The selection of the GSHP is determined by the building load, while the ESS capacity is determined based on the photovoltaic generation and the building’s load demand. A schematic diagram of the building model is shown in Figure 5, while Table 2 and Table 3 present the parameters of the system modules and the usage proportions of the equipment. Table 4 presents the Time-of-Use electricity pricing in Shenyang city.

4. Results and Discussion

4.1. Evaluation of the Effectiveness of the Energy Use Hierarchical Scheduling Strategy

This study establishes a simulation model of the PV-ESS-GSHP system using TRNSYS18 as the platform. In TRNSYS, the energy management module Type 328 was developed by integrating with other modules for data transfer. The relationships between performance parameters, input parameters, and output parameters were established (as shown in Figure 3). The charging power and storage capacity of the battery are configurable performance parameters of the energy management module Type 328. The hourly PV generation, load, lighting and office loads, and geothermal heat pump power consumption are set as input parameters. The output parameters include battery charging and discharging power, grid electricity purchase, PV grid-exported power, and the SOC of the battery. The building data are based on the physical dimensions and envelope properties of a real small office building. The PV, battery, and other modules are standard modules within the software, while the geothermal heat pump model is based on a semi-empirical model [53]. The developed models have been validated.

4.1.1. Energy Production and Consumption Curves and Load Characteristics

To investigate the impact of ESS capacity on the effectiveness of the strategy, it is first necessary to understand the building’s load characteristics, the generation capacity curve of the PV-ESS-GSHP system, and the charging and discharging behavior of the ESS. Case 2 is selected, with an energy storage capacity of 50 kWh, to simulate the energy generation and consumption curves of the PV-ESS-GSHP system as well as the load characteristics.
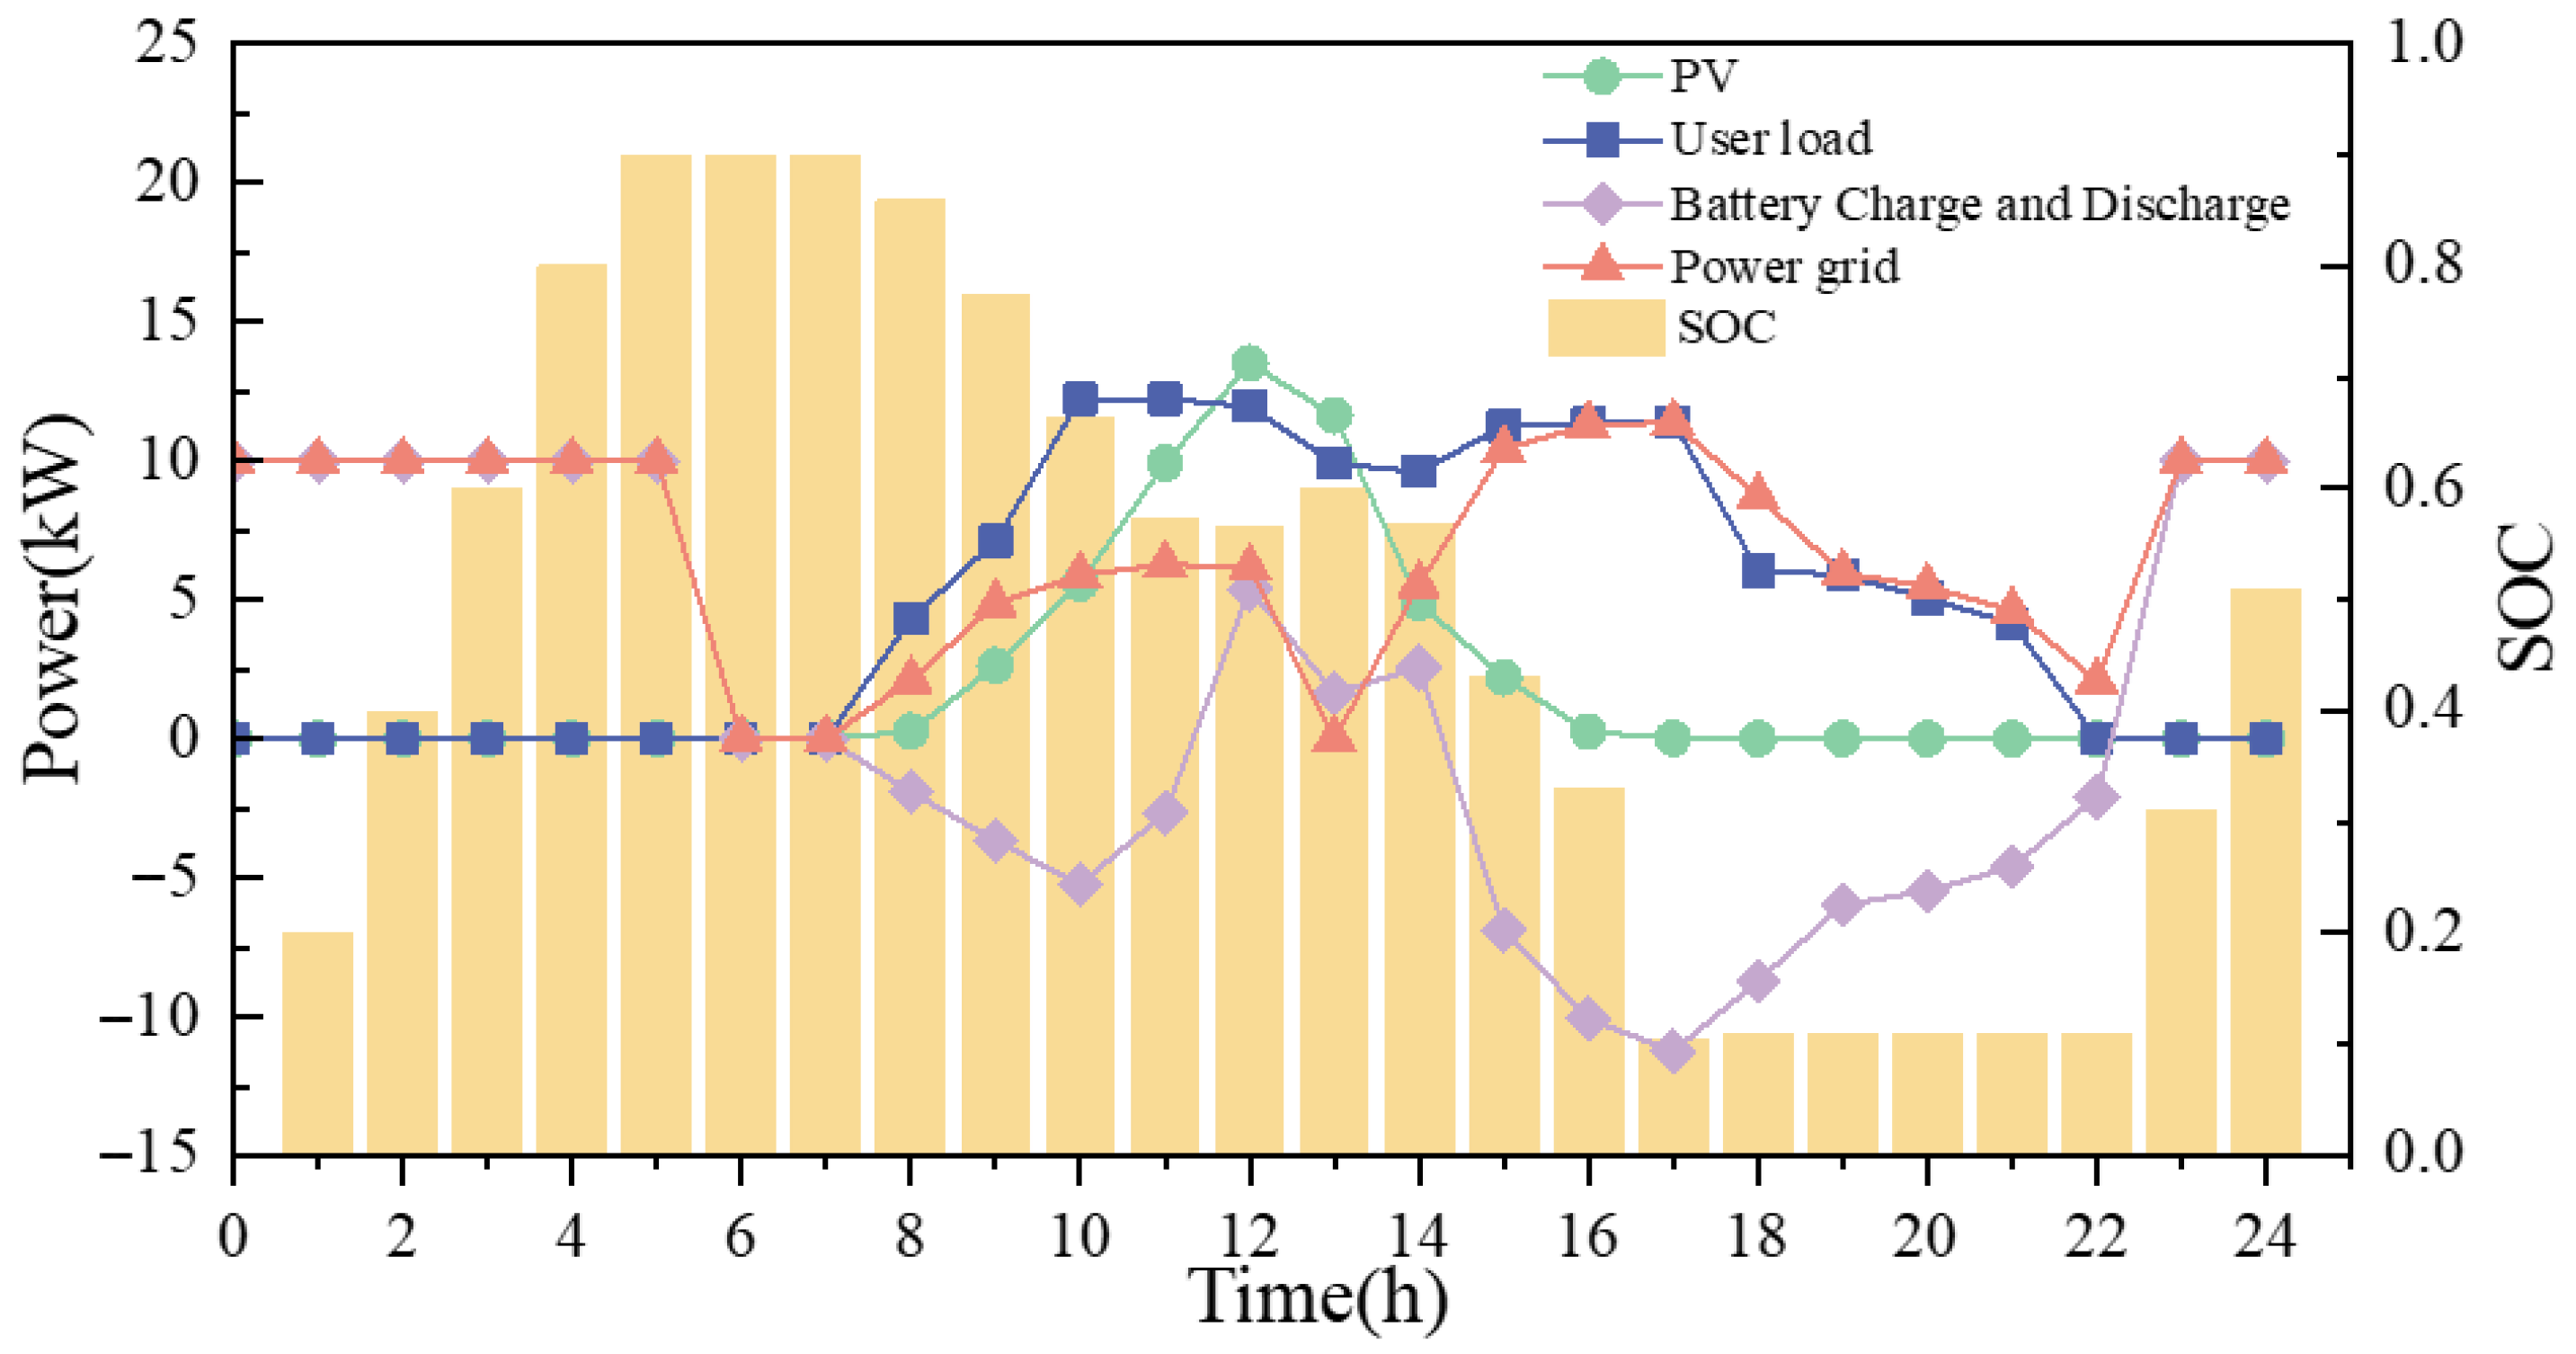
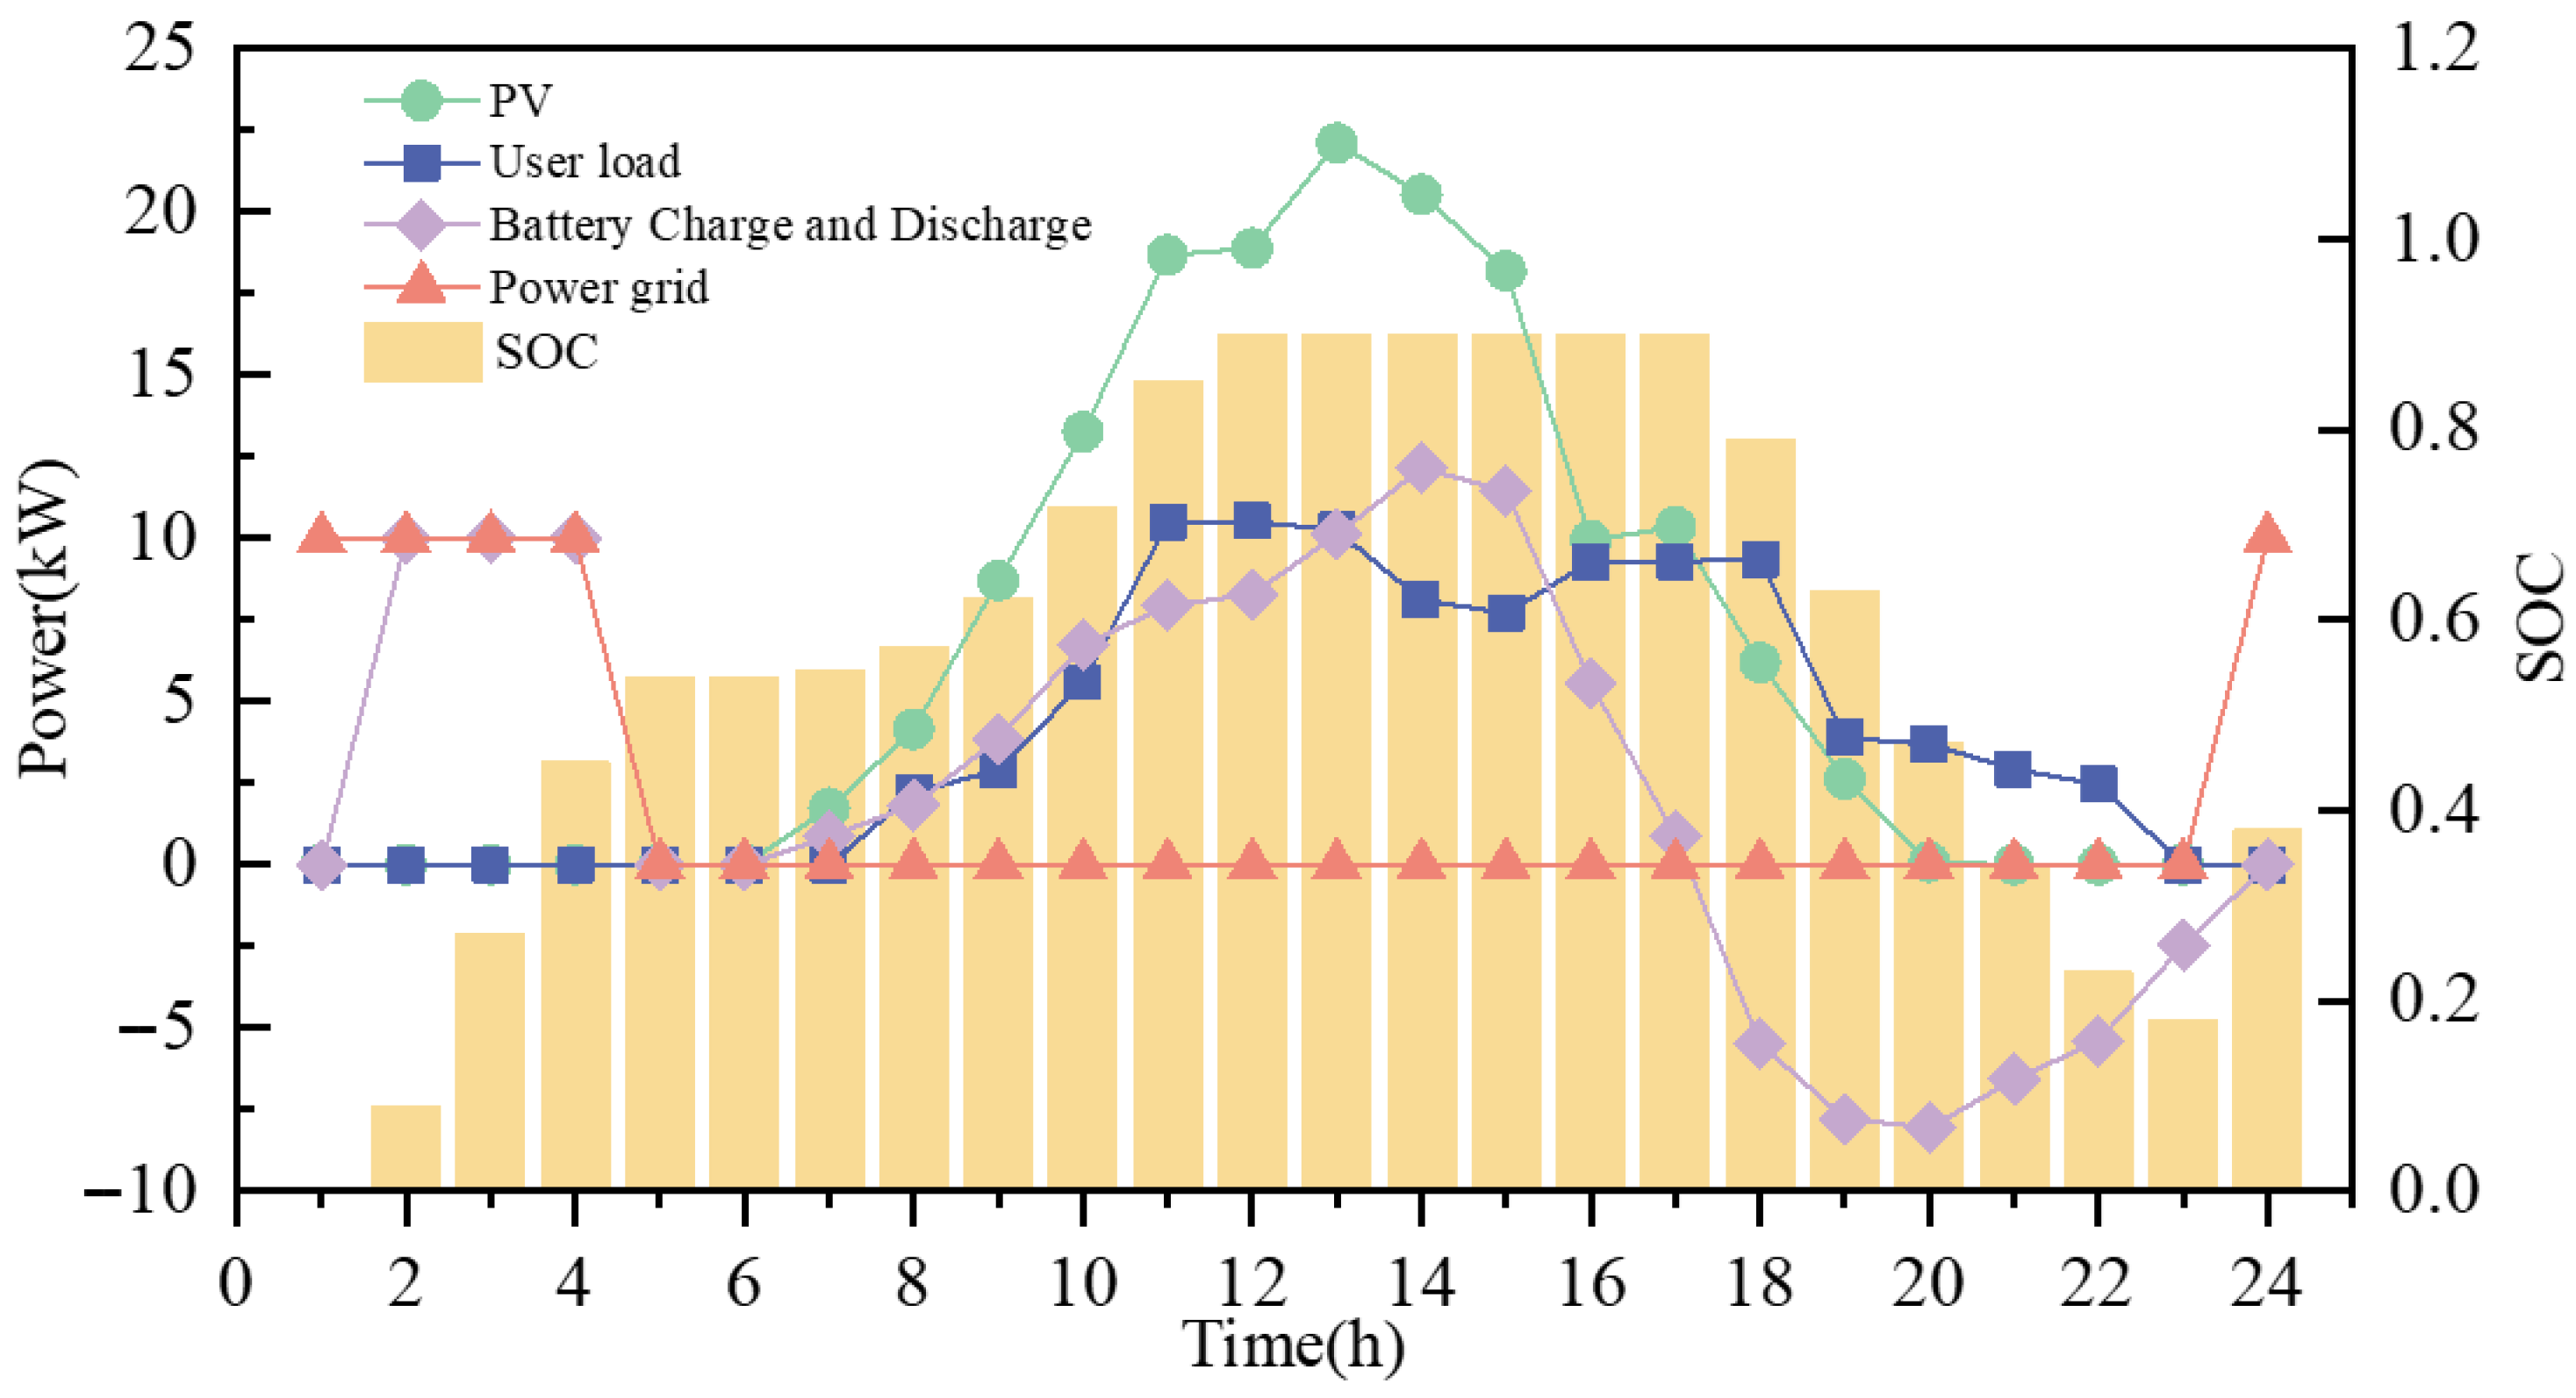
Figure 6 shows the 24-h system operation for a typical day in Case 2 during the winter season, highlighting grid power generation, PV generation, ESS charging and discharging, and battery SOC. From 08:00 to 18:00, PV generation fails to meet the load demand, and the ESS discharges to supply the load, eliminating the need to purchase electricity from the grid. From 18:00 to 22:00, the combined energy storage and PV generation cannot meet peak load demand, requiring electricity from the grid. At 22:00, with the ESS SOC below 0.5, the grid supplies power during the off-peak period (22:00 to 05:00) to cover the shifted load. Figure 7 illustrates the 24-h system operation for a typical day in Case 2 during the summer season. For most of the day, PV generation exceeds the total load demand. The flexible energy management module stores excess electricity in the ESS during off-peak periods. As PV generation increases, the stored energy is used to supply the load, significantly reducing grid electricity purchases.
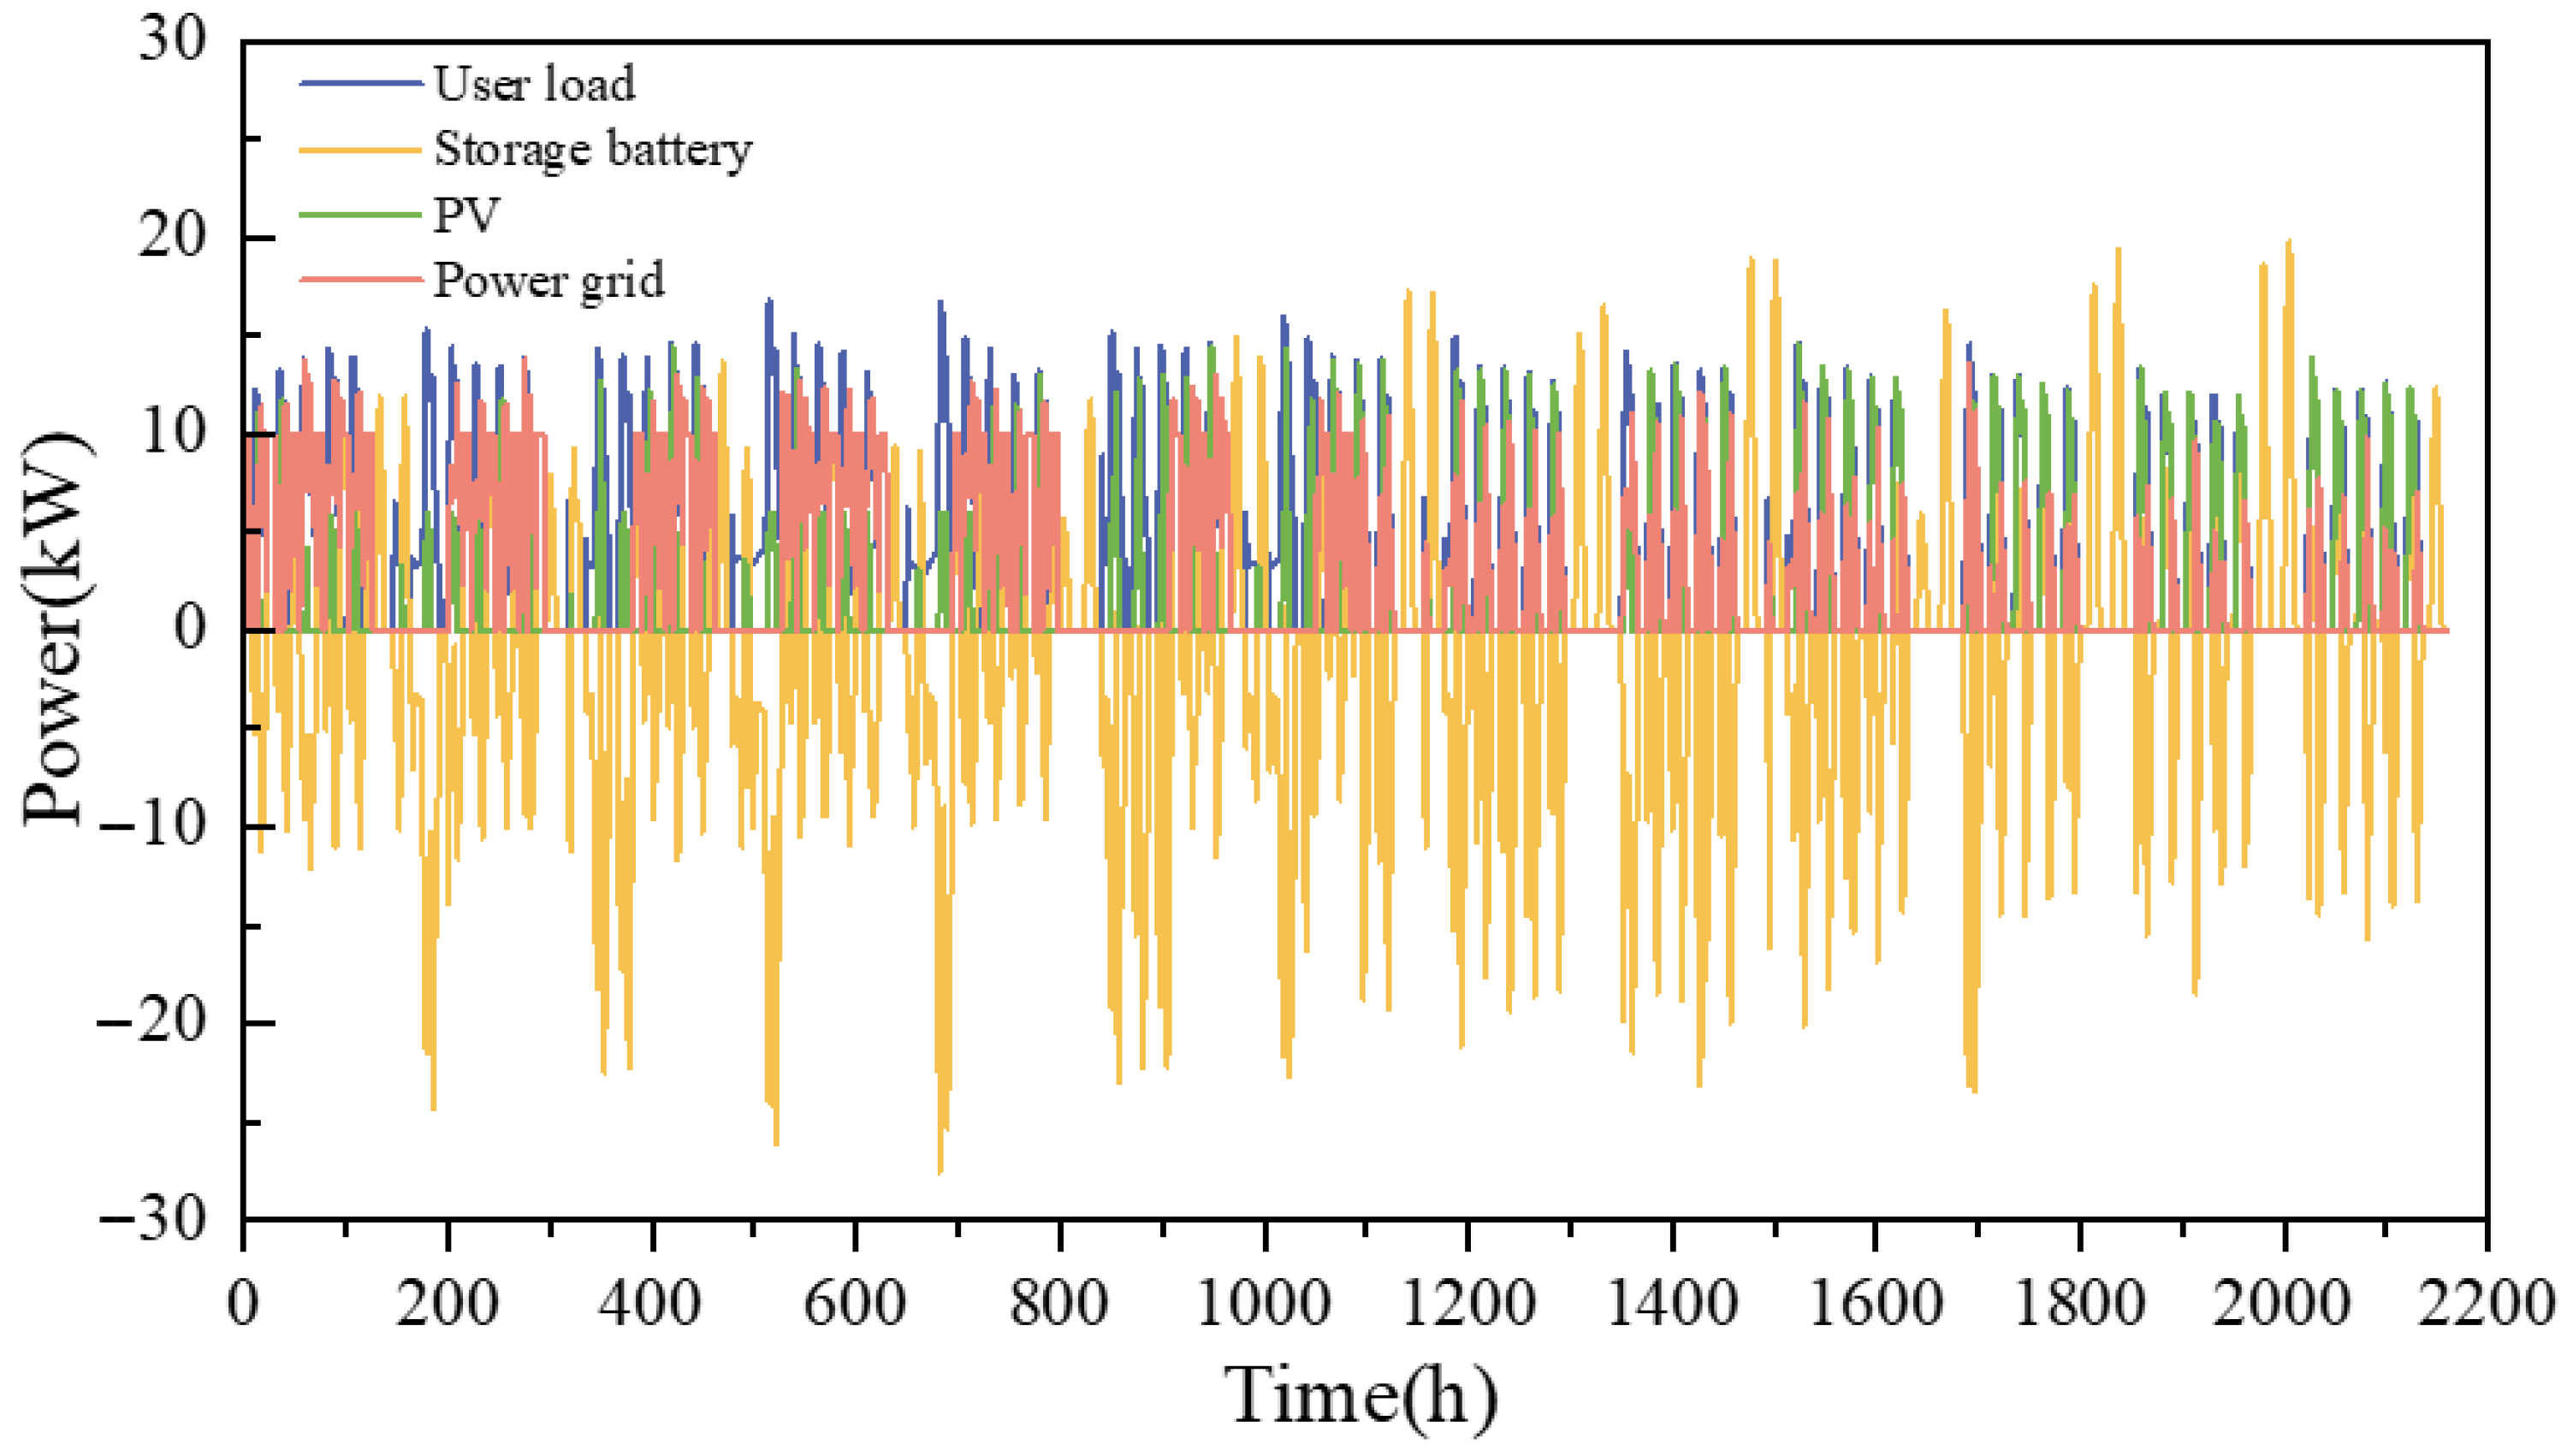
Figure 8 shows the overall energy consumption for Case 2 during the winter season. After implementing the flexible energy scheduling strategy, the high winter load demand and limited ESS capacity prevent the stored excess PV generation from fully meeting the user’s demand, requiring some load to be supplied by the grid. As the season progresses, the amount of electricity purchased from the grid decreases. During the heating season, the grid directly supplies 25.77% of the total load, while providing 21.31% during off-peak periods for ESS charging. PV generation covers 39.24% of the load, and ESS supplies 13.68%. Figure 9 illustrates the energy consumption for Case 2 during the summer season. PV generation directly supplies most of the load, with the ESS covering the remainder and only minimal periods requiring grid electricity. During the cooling season, the grid directly supplies 3.28% of the load, PV provides 72.71%, and ESS accounts for 24.01%. These results show that the flexible energy scheduling strategy promotes off-peak electricity use in winter and enhances PV absorption in summer.

4.1.2. The Impact of Energy Storage Capacity on Photovoltaic Utilization

Reasonable scheduling of flexible resources is beneficial for improving the synchronization and tightness between the load curve and the PV output curve. Achieving maximum utilization of renewable energy in active distribution networks is another important goal [54]. In this section, the PV self-consumption rate (SCR) and the curtailed PV generation are used to assess the PV utilization under different ESS capacities.
The photovoltaic SCR is defined as the ratio of the PV power provided to the load and the ESS to the total PV generation. A higher SCR indicates a higher on-site utilization of PV generation and greater flexible potential. The calculation method for the PV absorption rate is given by Equation (4).
S C R = P pv - load ( i ) + P pv - battery ( i ) P pv ( i )
Based on the building load, PV generation, and battery charge/discharge data obtained in the previous subsection, the impact of different ESS capacities on the flexible energy scheduling strategy is explored. According to the constraints, the ESS capacities are set to 20/30/40/50 kWh.
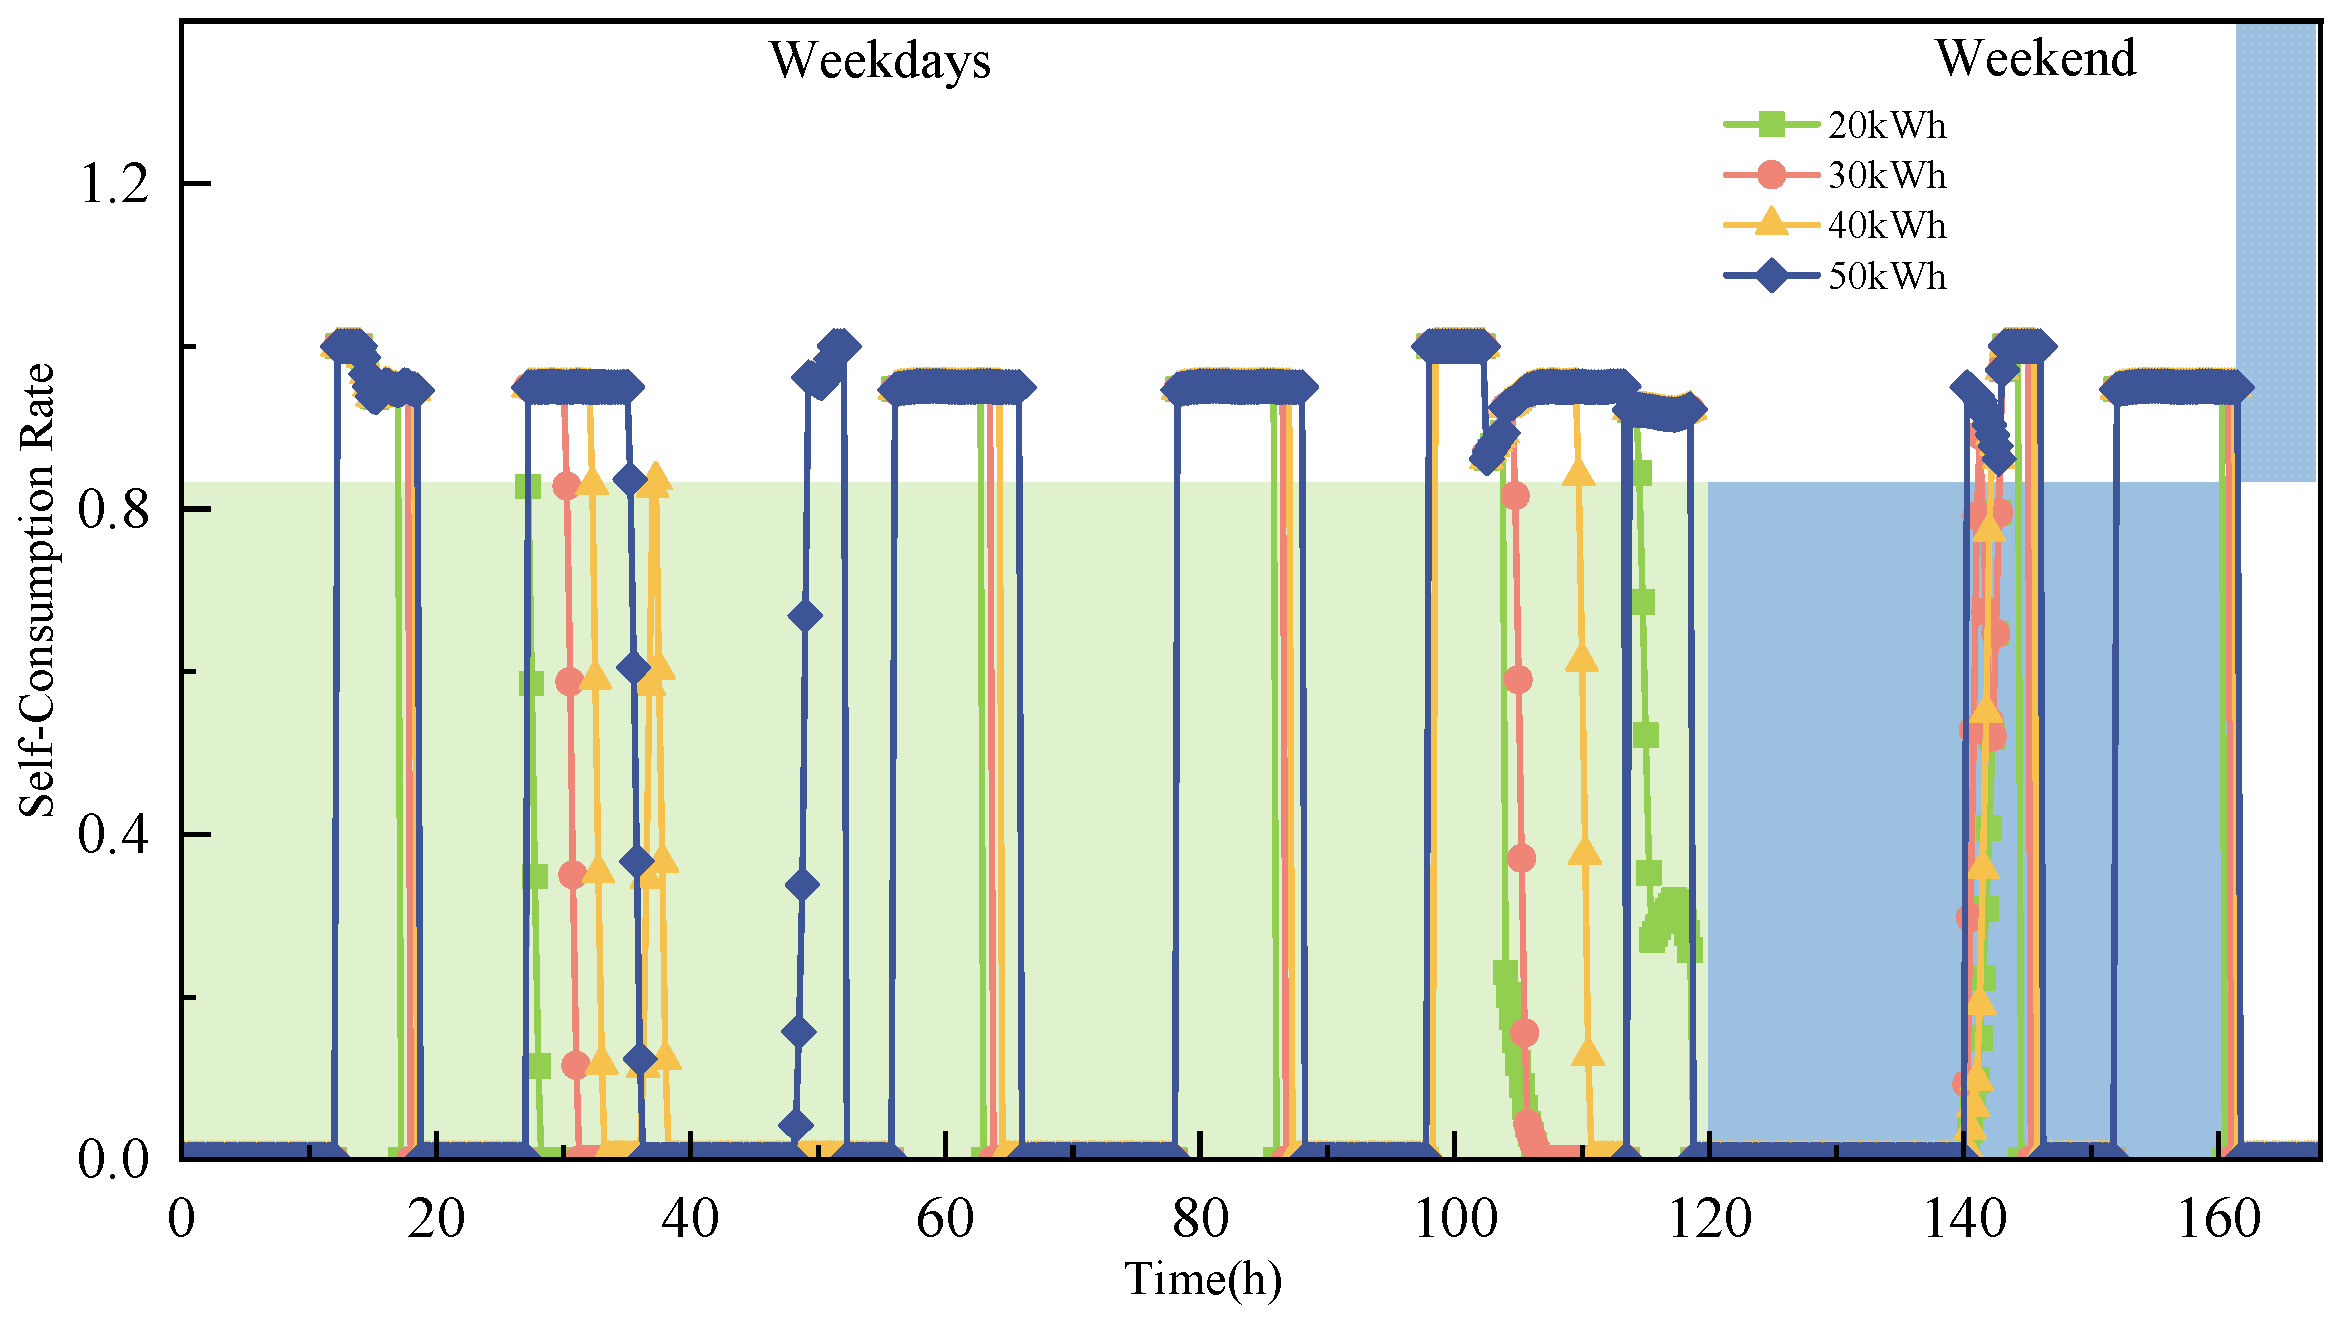
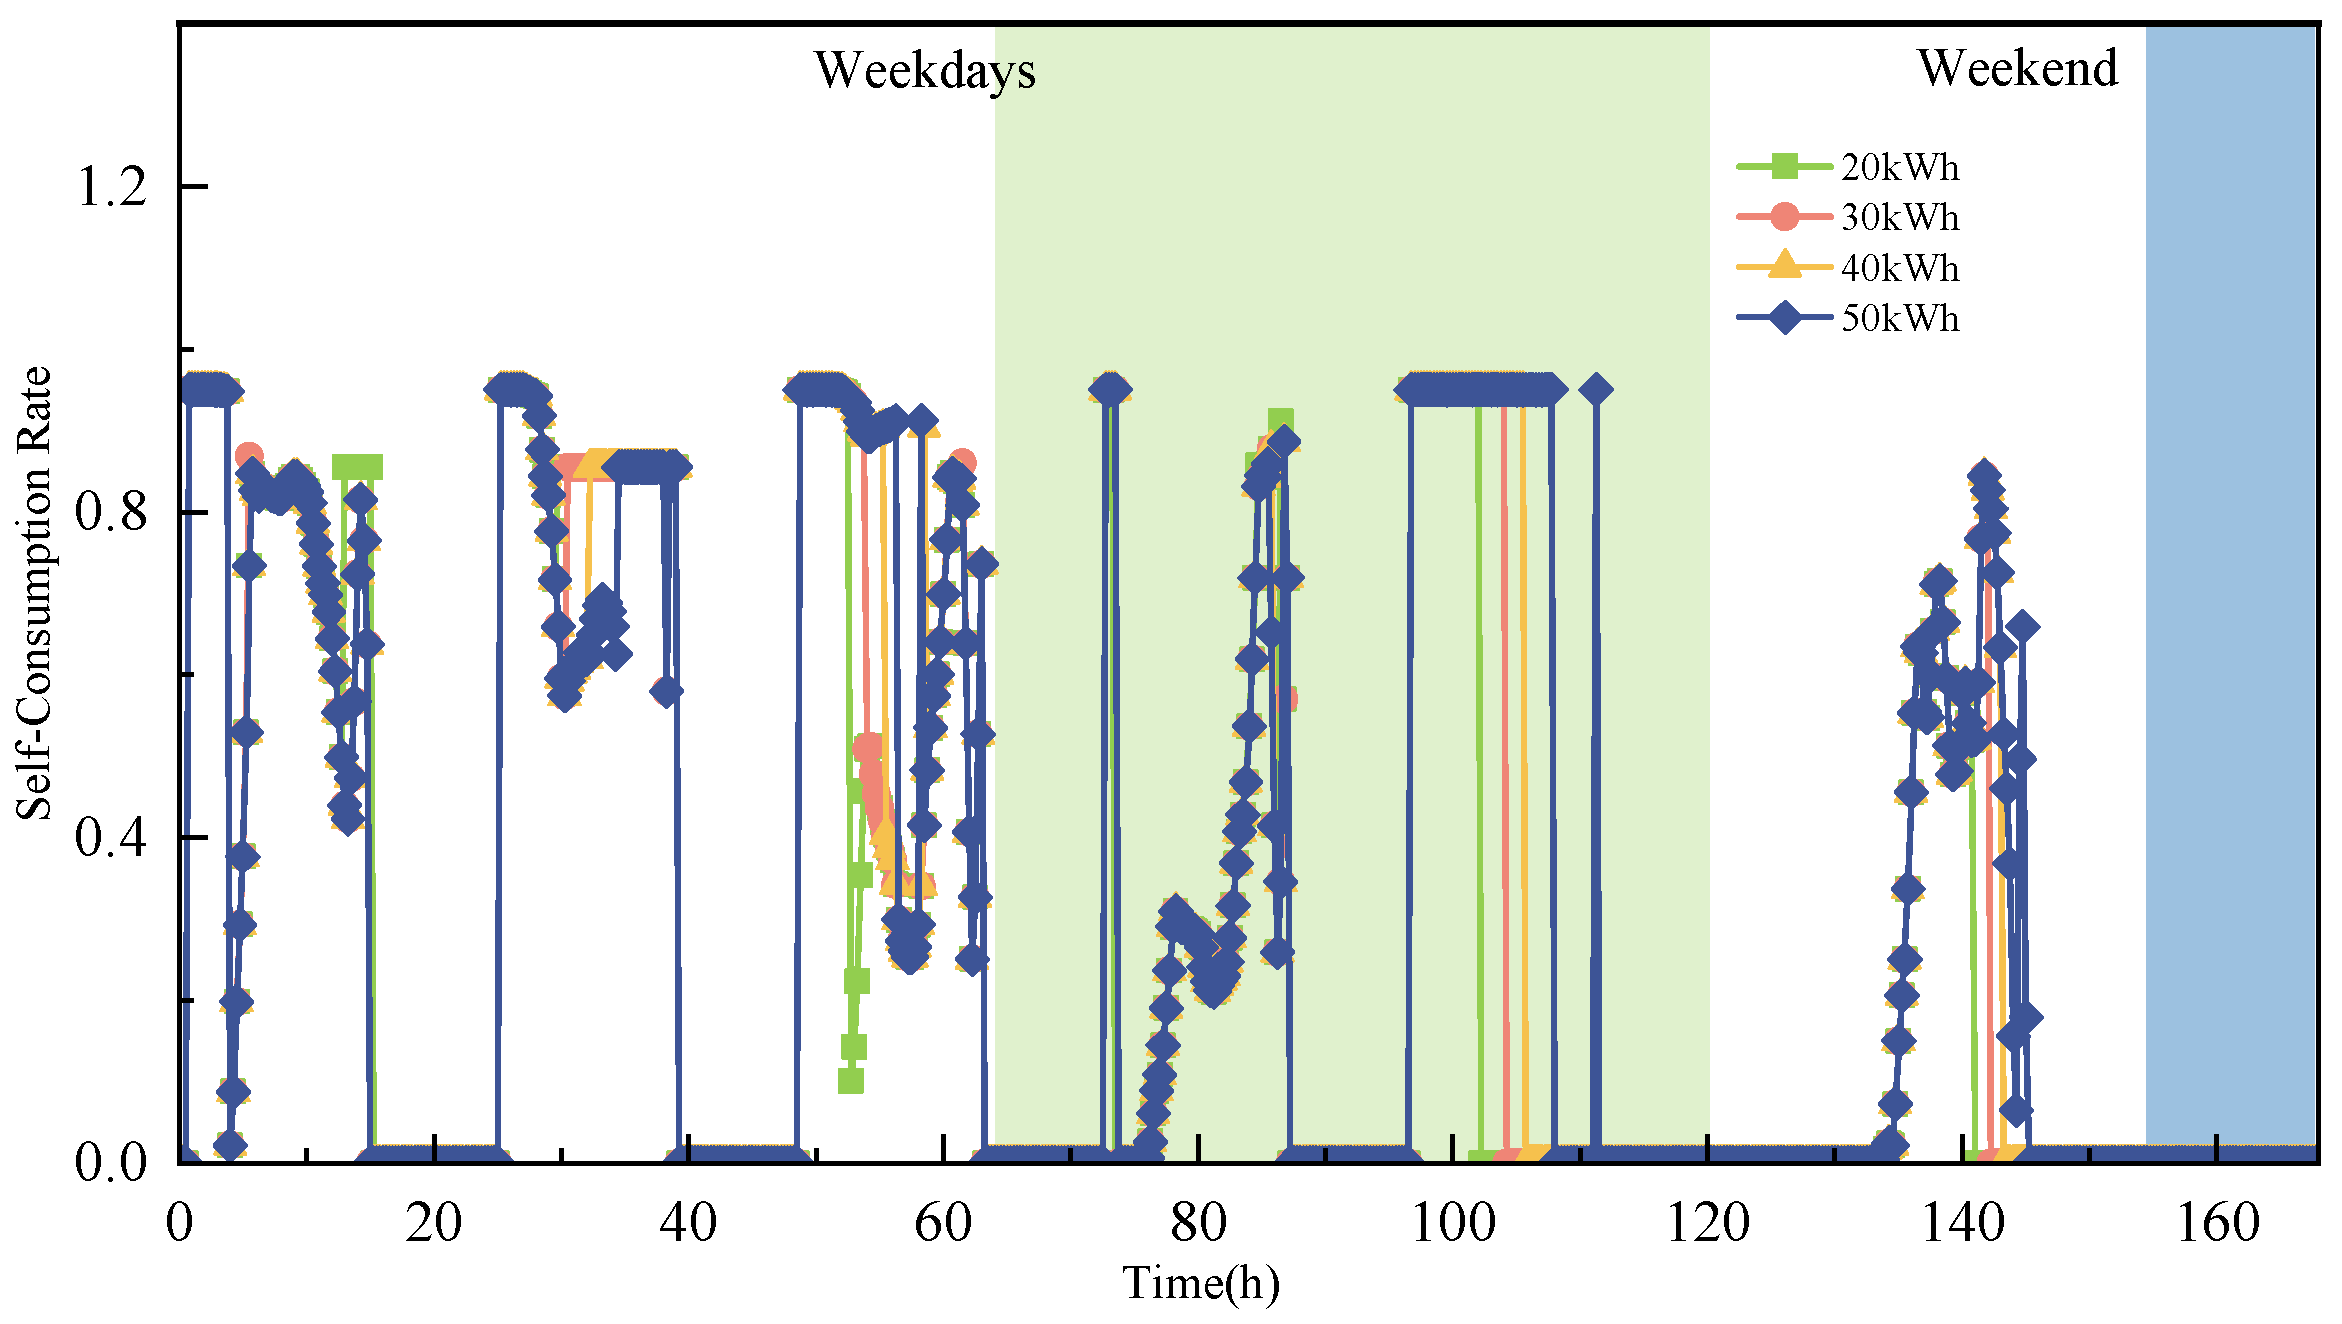
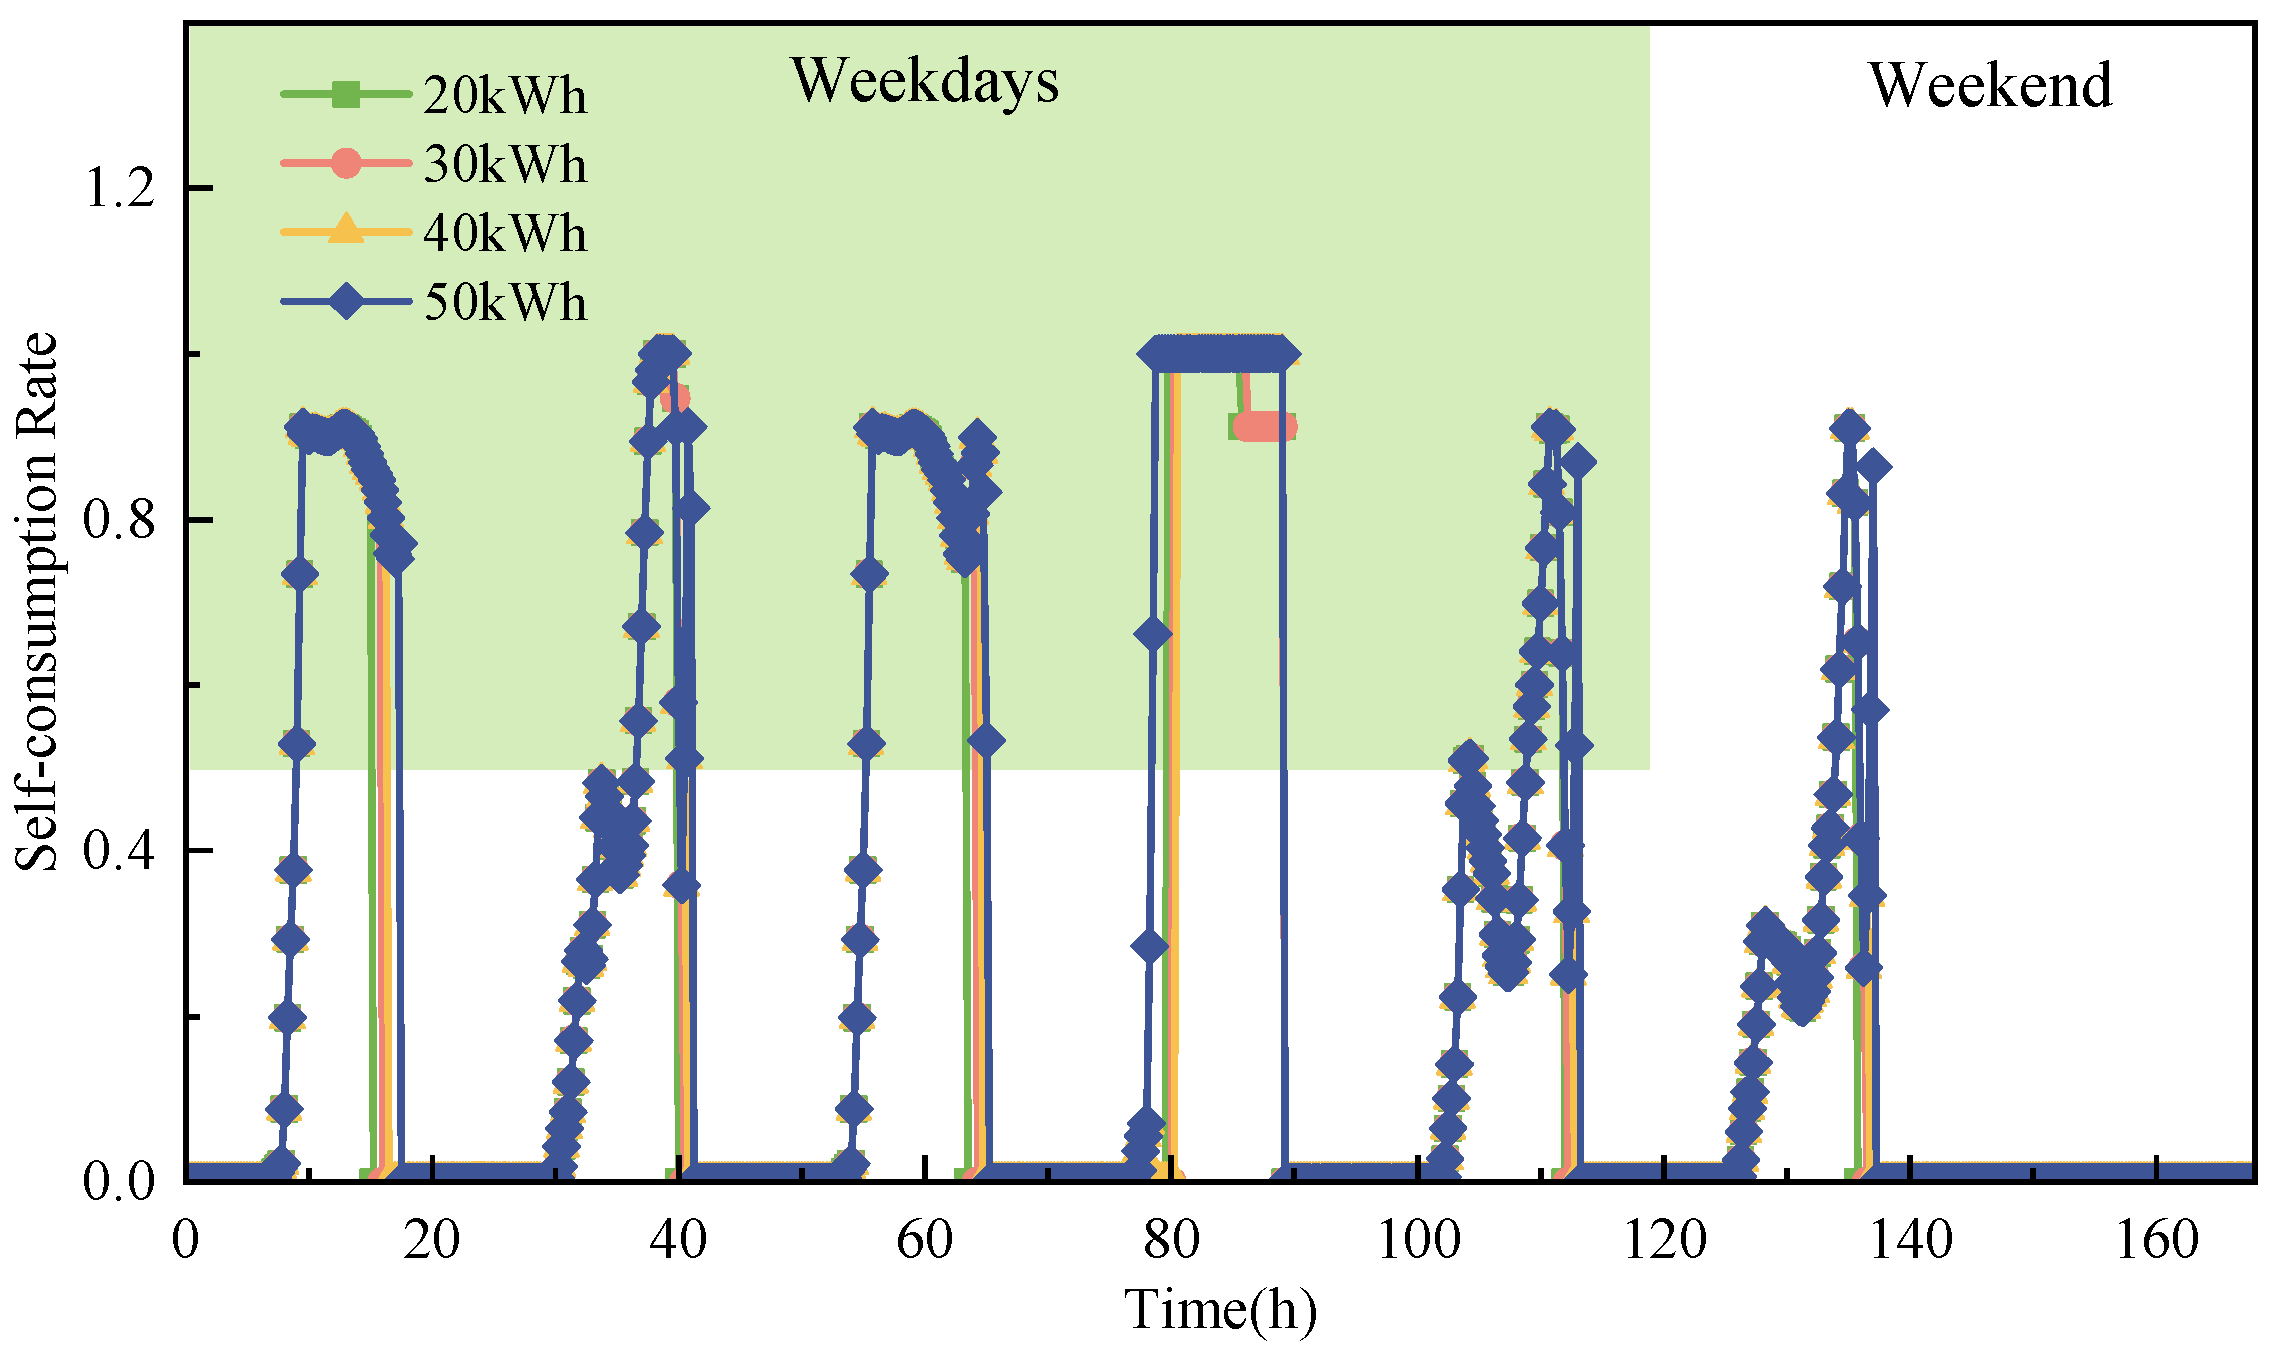
Figure 10 shows the PV absorption rate for different ESS capacities over a week during the winter in the baseline case. As ESS capacity increases, the periods during which the PV absorption rate approaches 1 also increase. Figure 11 presents the PV absorption rate during the summer for the baseline case. Similar to winter, the PV absorption rate increases with ESS capacity, with a more pronounced impact observed on weekends. Compared to winter, the effect of ESS capacity on PV absorption is more significant in the summer. These results highlight that increasing ESS capacity enhances PV absorption, with a more noticeable effect during off-peak periods, especially on weekends.
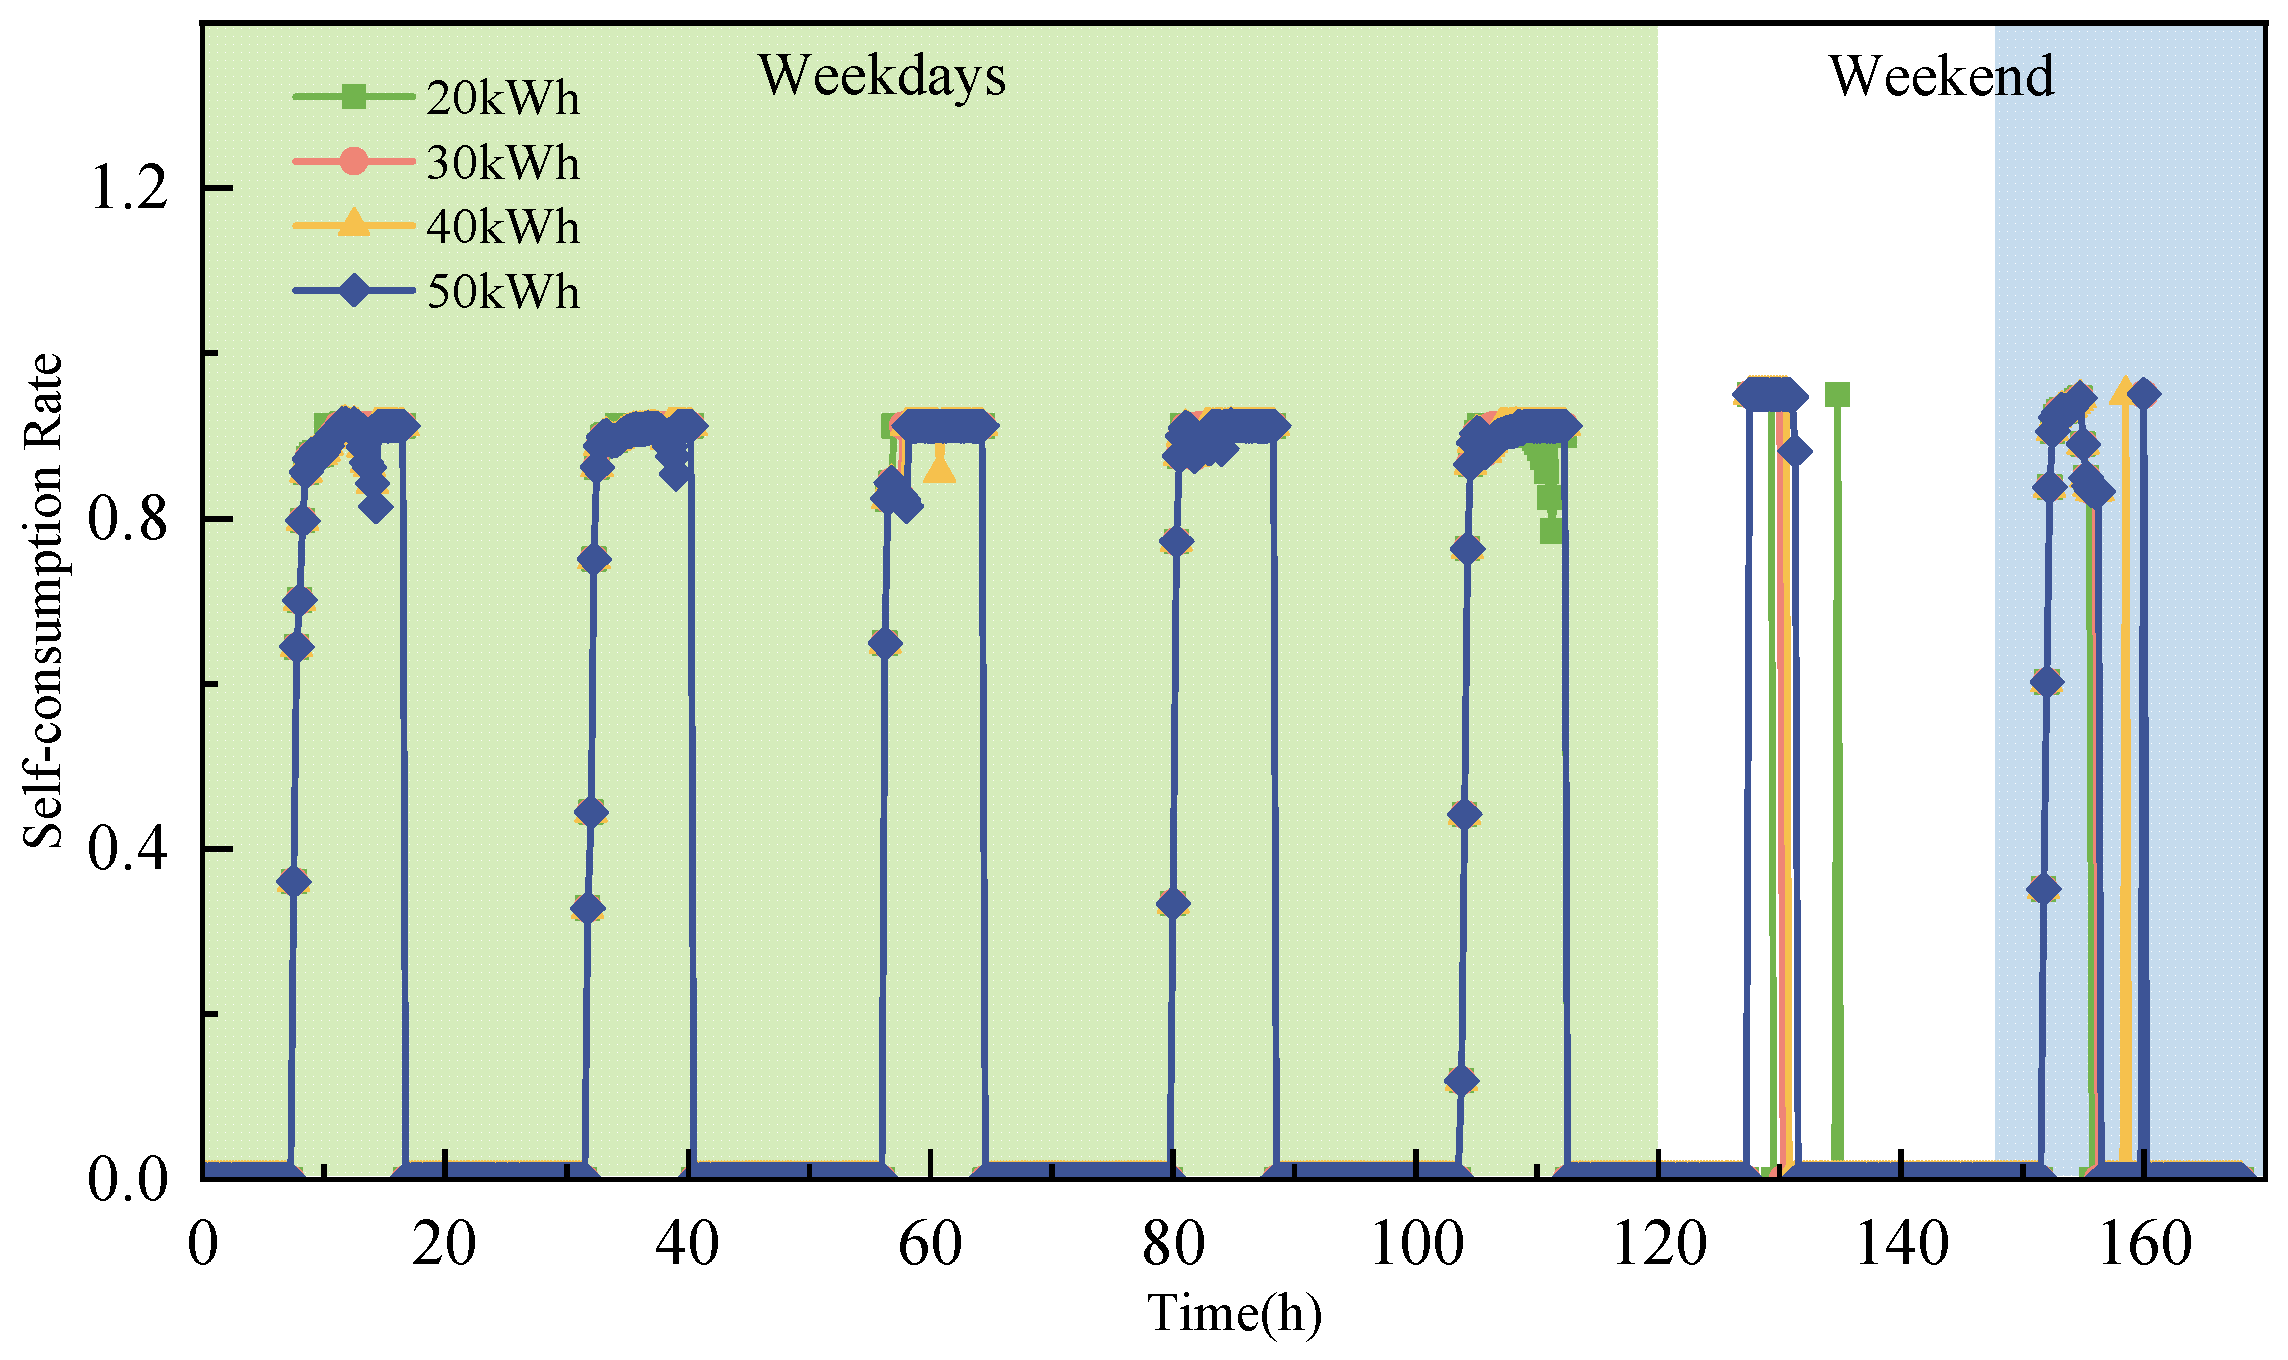
Figure 12 and Figure 13 show the SCR for different ESS capacities during winter and summer in Case 2. Compared to the baseline case, Case 2, by implementing a hierarchical scheduling strategy, effectively stores energy during low photovoltaic generation periods and releases it during peak times, thereby improving the system’s SCR. The 50 kWh ESS achieves a maximum self-consumption rate of 0.95 and maintains it for an extended period, while the 20 kWh ESS maintains a high SCR for only a short duration. In winter, under conditions of low photovoltaic generation, larger ESS capacities can maintain a high SCR even in low temperatures and better match the building’s load fluctuations. In summer, with higher photovoltaic generation, the advantages of ESS are more prominent. Larger ESS capacities enable the building to minimize curtailment and maximize the self-consumption rate. A comparison of the two cases demonstrates that Case 2 shows significant advantages in both SCR and seasonal adaptability.
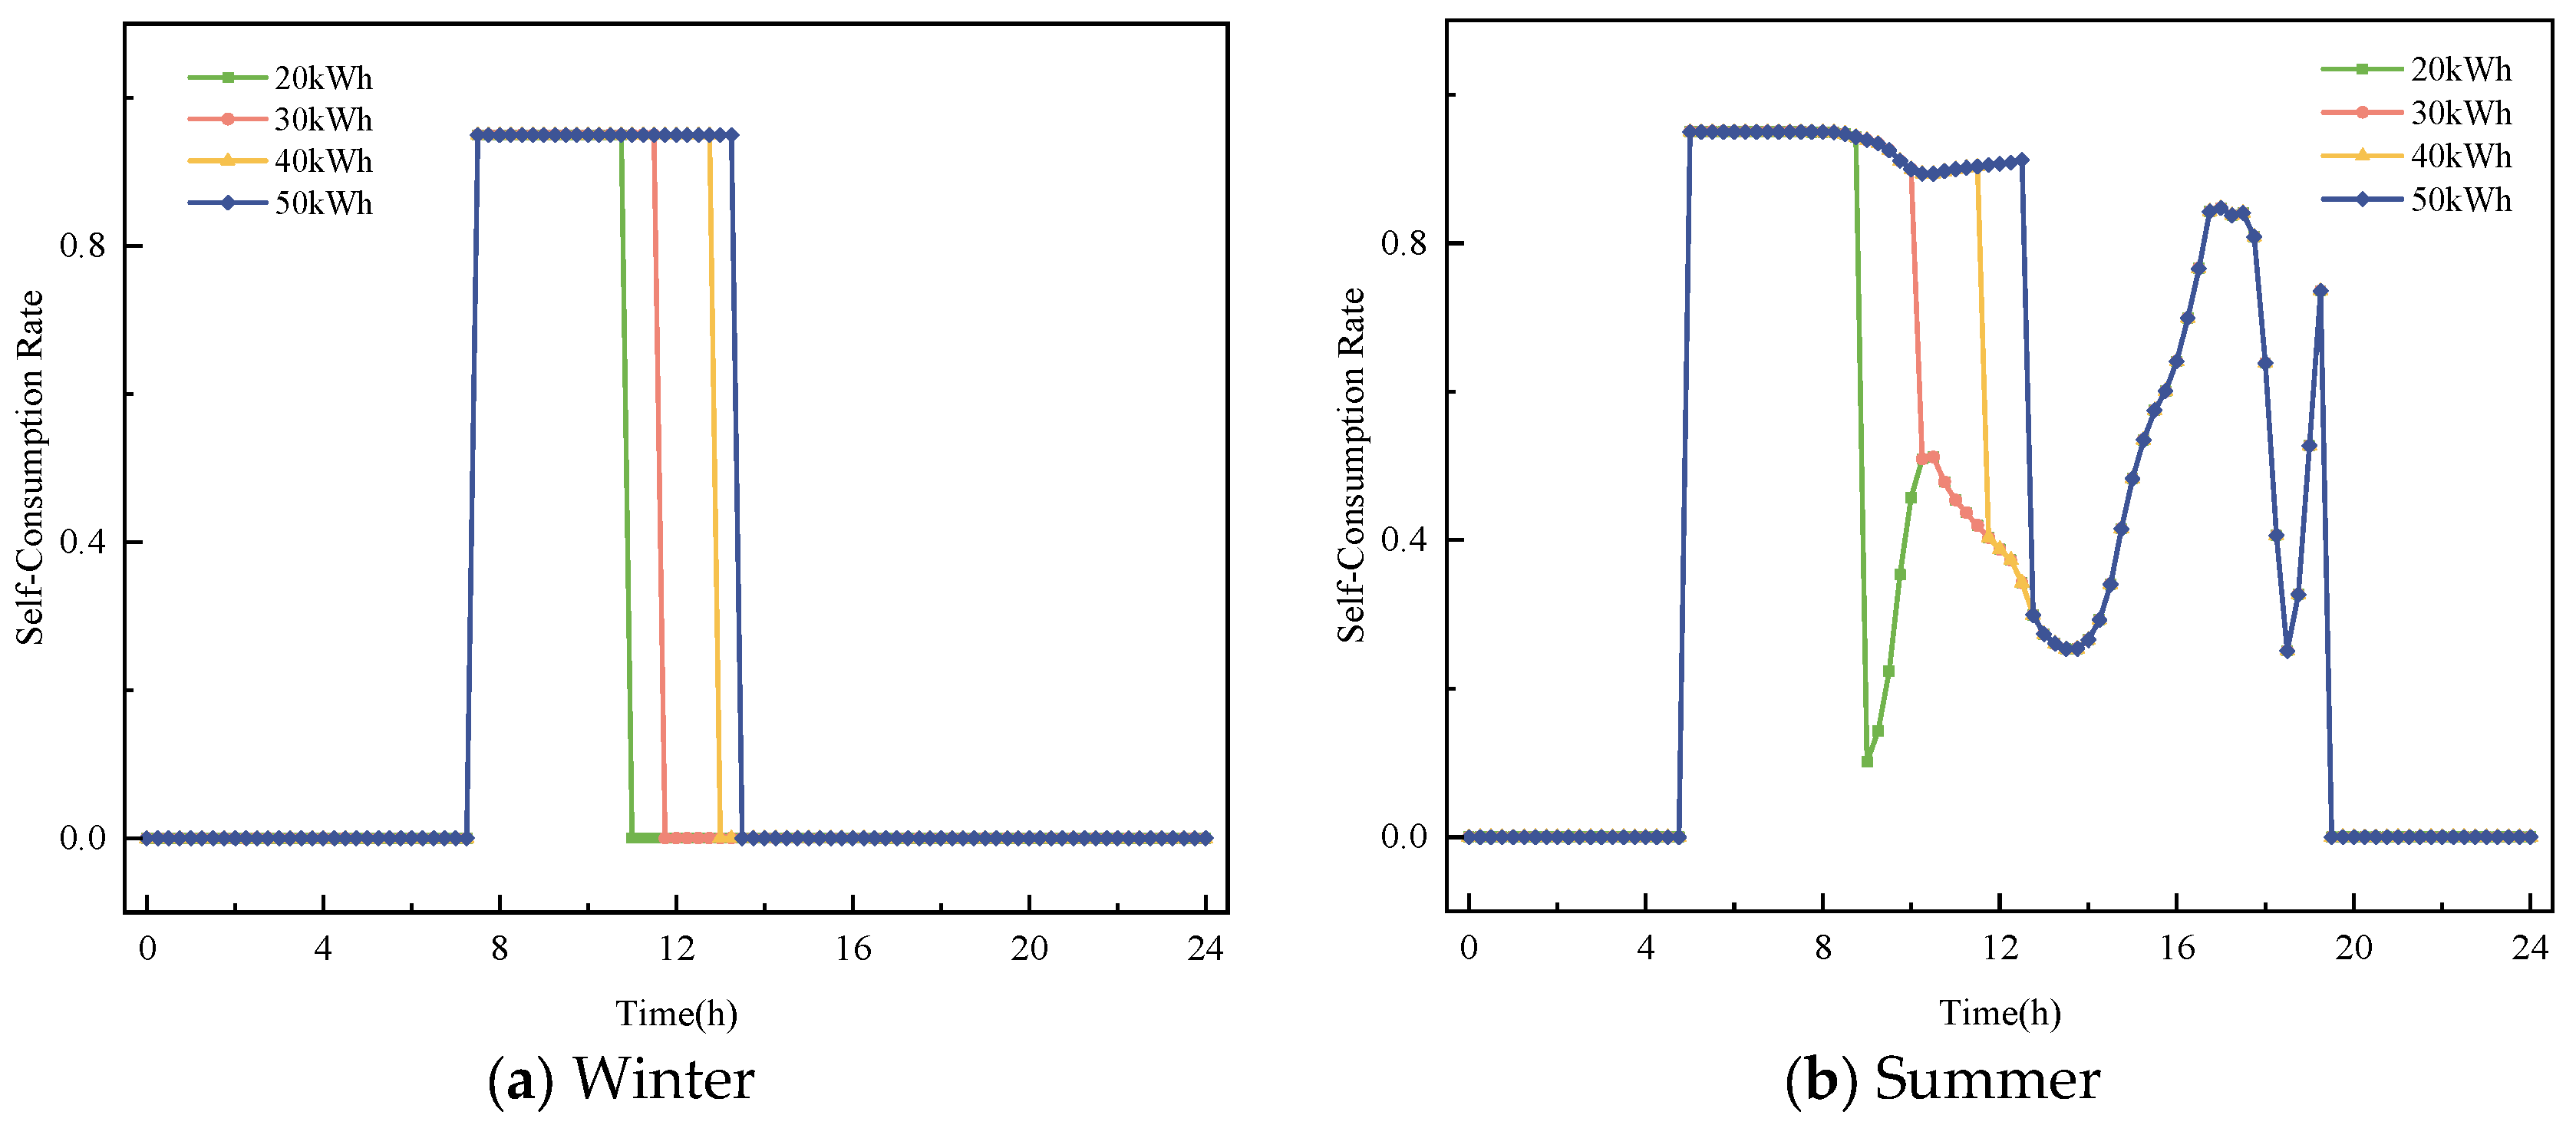
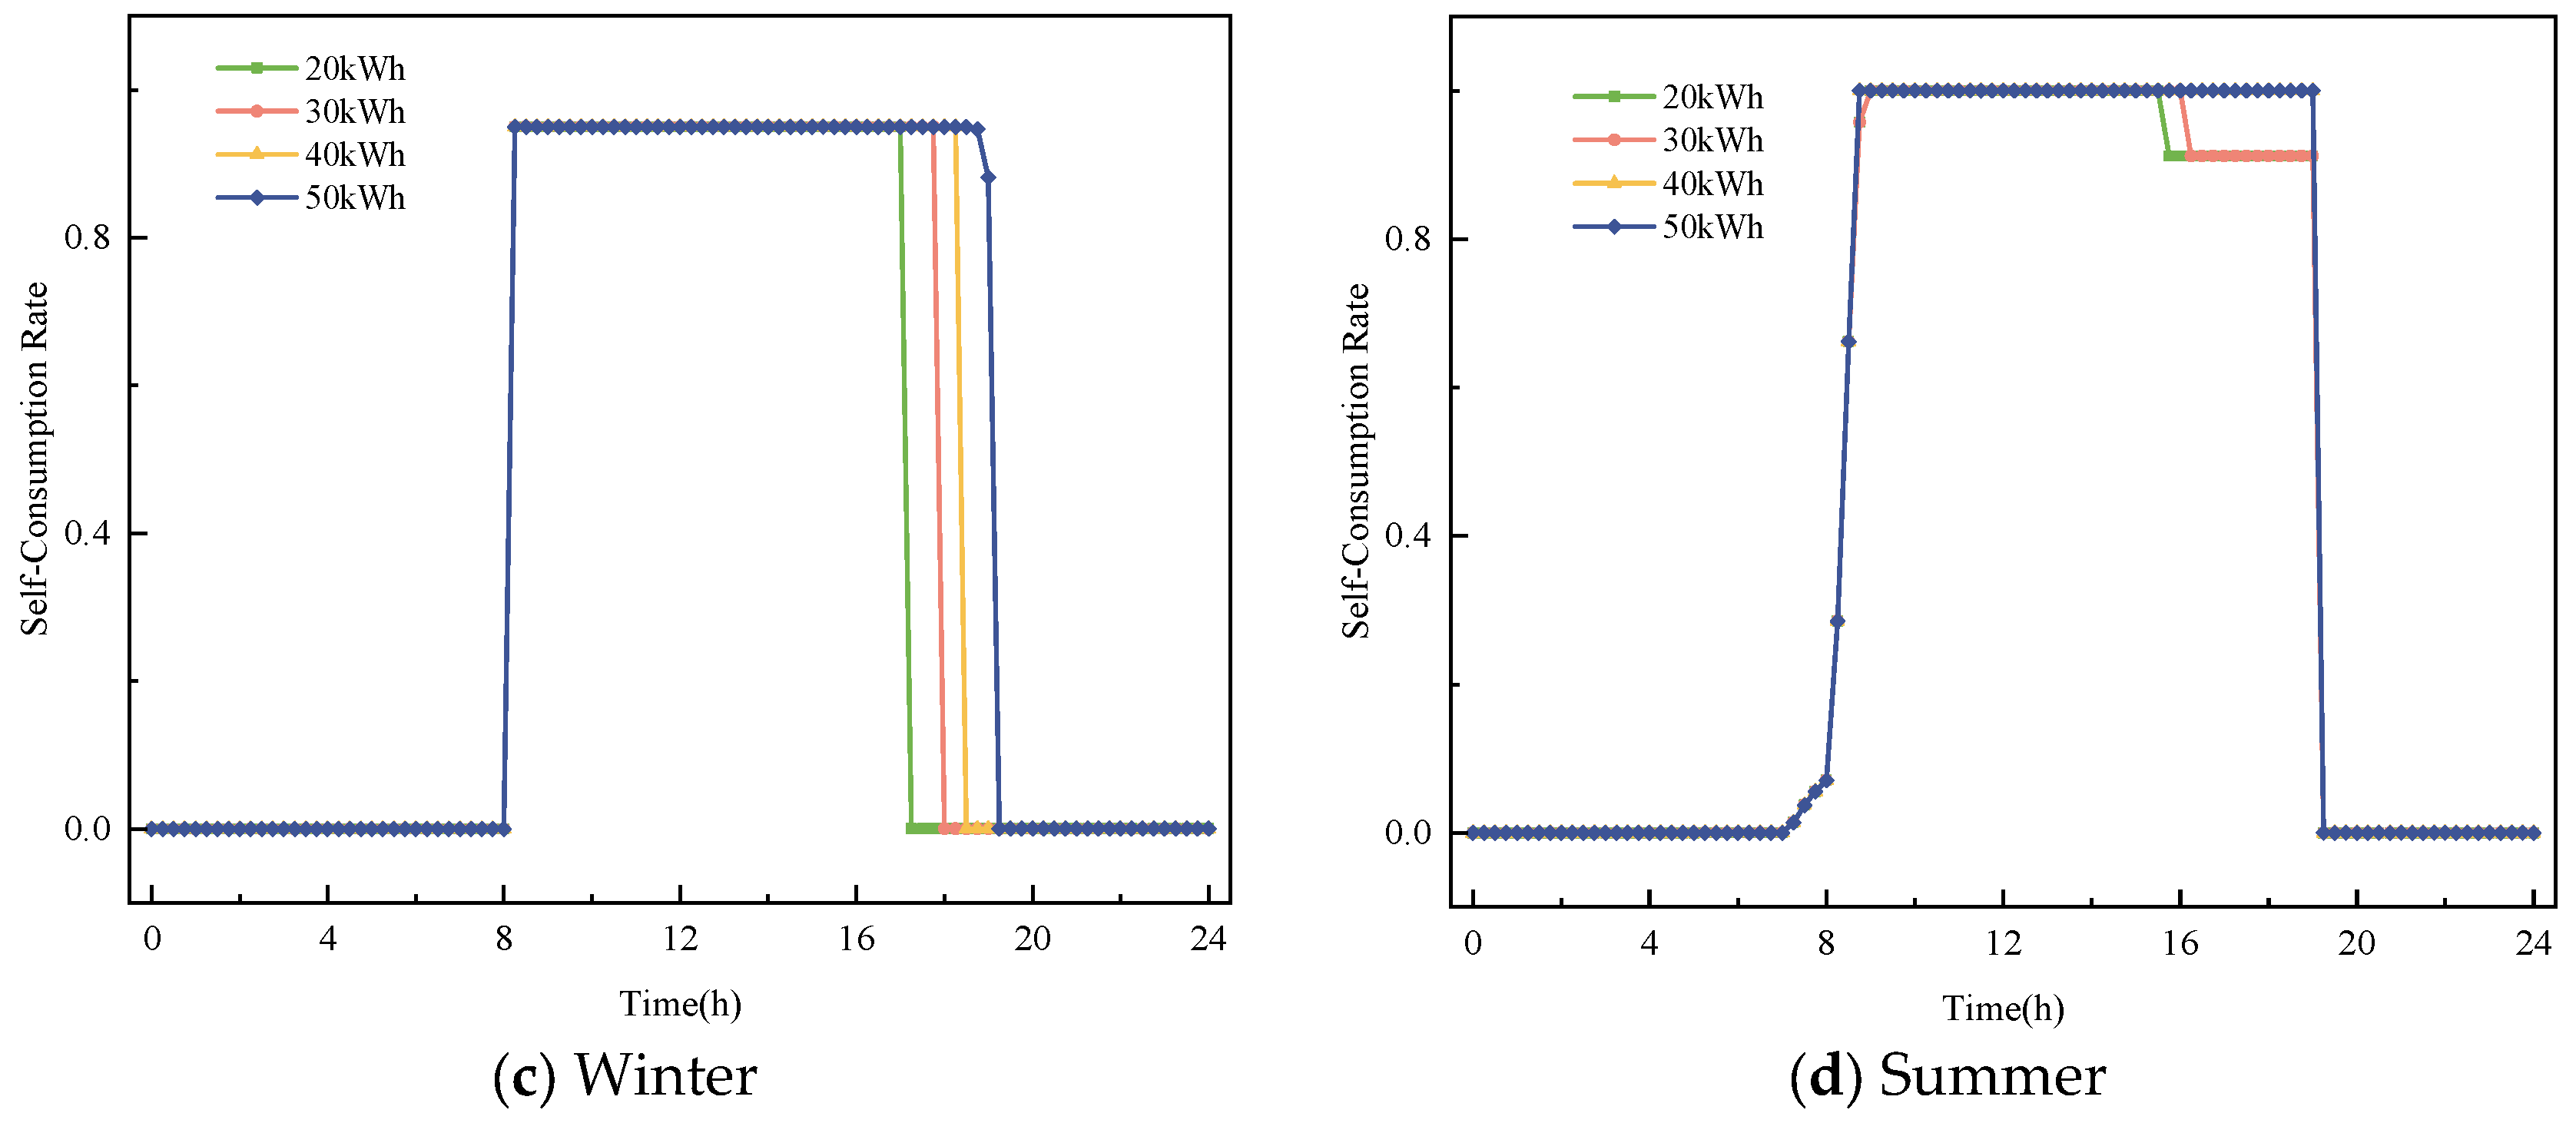
In the seasonal analysis, the impact of different ESS capacities on the photovoltaic SCR varies with occupancy times. To better capture daily fluctuations and trends, we analyzed the self-consumption rate on typical winter and summer days for two cases. As shown in Figure 14a, the shorter photovoltaic generation period in winter makes the effect of ESS capacity on improving the photovoltaic SCR more pronounced. A larger ESS capacity enables better utilization of midday electricity generation in winter. Figure 14b presents the photovoltaic SCR in summer. Between 9:00 and 14:00, a larger ESS capacity maintains a photovoltaic SCR of 0.9 to 1 for a longer duration. In contrast, smaller ESS capacities show greater volatility and struggle to store surplus electricity during peak generation. Figure 14c,d show the battery SCR for different energy storage system capacities on typical winter and summer days in Case 2. The proportion of time with SCR greater than 0.95 for the four storage capacities in Case 2 is 36%, 39%, 42%, and 43%, respectively, an improvement of approximately 20% compared to the baseline case. In summer, the SCR for 20 kW and 30 kW storage capacities is lower between 15:00 and 19:00 than for 40 kW and 50 kW capacities. However, from 08:00 to 15:00, the SCR is similar across all storage capacities, as photovoltaic generation exceeds the user load, and excess electricity is stored. Smaller storage capacities cannot store all the surplus generation, leading to a reduced SCR.
Table 5 provides the annual PV total SCR for case 2 with different ESS capacities. As the ESS capacity increases, the photovoltaic utilization rate improves. The 50 kWh capacity battery shows a 4.07% increase in annual SCR compared to the 20 kWh capacity.

4.1.3. The Impact of Energy Storage Capacity on the System’s Response Capability

In energy systems, the charging and discharging behavior of the ESS reflects the system’s responsiveness. The daily charging and discharging actions of the ESS indicate its ability to respond to fluctuations in power demand during different periods. Different ESS capacities possess varying flexible load adjustment capabilities. Therefore, this section conducts a study on the impact of ESS capacity on the system’s response ability. In this study, the energy stored in the ESS is defined as “dispatchable energy.” This portion characterizes the difference between user demand, non-dispatchable loads, and flexible loads. When the dispatchable energy in the system is higher at any given moment, it indicates that the system has a stronger capacity to respond to subsequent user demand.
Figure 15 compares the charging and discharging behavior of the ESS for different storage capacities on typical winter and summer days in the baseline case. From Figure 16a, it can be seen that between 7:00 AM and 12:00 PM, the ESS discharges, as the PV generation cannot meet the entire load demand. The 20 kWh battery depletes its stored energy by 11:00 AM. Between 12:00 PM and 5:00 PM, the battery stores the remaining PV generation. However, due to the capacity limitation of smaller batteries, the remaining PV generation cannot be fully stored. For instance, the 20 kWh and 30 kWh batteries have a charging power of 0 at 3:00 PM. In contrast, the 40 kWh and 50 kWh batteries continue charging until 5:00 PM. The discharge periods of the batteries vary with capacity: the 20 kWh battery discharges between 5:00 PM and 8:00 PM, the 30 kWh battery discharges between 5:00 PM and 9:00 PM, and the 40 kWh and 50 kWh batteries discharge between 5:00 PM and 10:00 PM. It can be observed that as the storage capacity increases, both the charging and discharging power of the battery increases, thus enhancing the system’s ability to respond to power demands in subsequent periods. In the summer, with abundant PV generation, the ESS begins charging between 8:00 AM and 12:00 PM. The same trend holds: the larger the storage capacity, the stronger the system’s responsiveness.
The results of case 2 show that, during winter, the remaining PV generation during the day is relatively small. Furthermore, during the nighttime off-peak period, the SOC of the battery is less than 0.5. As a result, the battery is charged by the grid during the night. With an increase in storage capacity, more energy is stored at night, which can then be used to supply power during the daytime when the PV generation is insufficient to meet the load demand. In summer, the 50 kWh energy storage system maximizes the use of photovoltaic generation, reduces curtailment, and provides stable power supply during peak demand periods. In contrast, smaller capacity storage systems, such as the 20 kWh system, have lower energy storage capacity during peak loads and exhibit larger fluctuations in charging and discharging power.
Overall, Case 2 achieves peak load shifting to off-peak nighttime periods using the hierarchical energy scheduling strategy. A higher energy storage capacity significantly enhances system performance. The 50 kWh energy storage system ensures stable power supply in both winter and summer, reducing reliance on the grid during peak periods.

4.2. The Impact of Energy Storage Capacity on the Comprehensive Operating Cost of the System
This section investigates the impact of flexible energy usage scheduling strategies and ESS capacity on the system’s total cost. The total cost for different ESS capacities in case 2 is calculated, which mainly includes operating costs, annual average investment cost, charge–discharge loss costs, and curtailment costs.
The total cost is calculated using the formula (5).
C = C 1 + C 2 + C 3 + C 4
where C1 is the operating cost. C2 is the annual average investment cost. C3 is the charge–discharge loss cost. C4 is the curtailment penalty.
C 1 ( t ) = [ J ( x , t ) ] = x ( t ) P g r i d ( t )
J ( x , t ) is the system’s electricity consumption cost function. x ( t ) is the peak-valley electricity price function. P g r i d ( t ) is the system’s electricity grid power intake.
C 2 = E b a t t e r y C TZ / N y e a r
E b a t t e r y is the rated capacity of the battery. C T Z is the investment cost per unit capacity of the battery. N y e a r is the battery’s service life.
C 3 = i = 1 N λ i E b a t t e r y C TZ
λ i = 1 1 / 5349 × e 3.57 D b e s s , i + 95.81 × e 1.5 D b e s s , i
λ i is the charge–discharge loss rate for the battery. D b e s s , i is the discharge depth of the i-th cycle. When i = 1 N λ i = 100 % it indicates that the battery needs to be replaced.
C 4 = C qi [ P PV ( t ) P PV , use ( t ) ]
Cqi is the curtailment penalty price. It is set to 0.6 ¥/(kWh) in this paper.
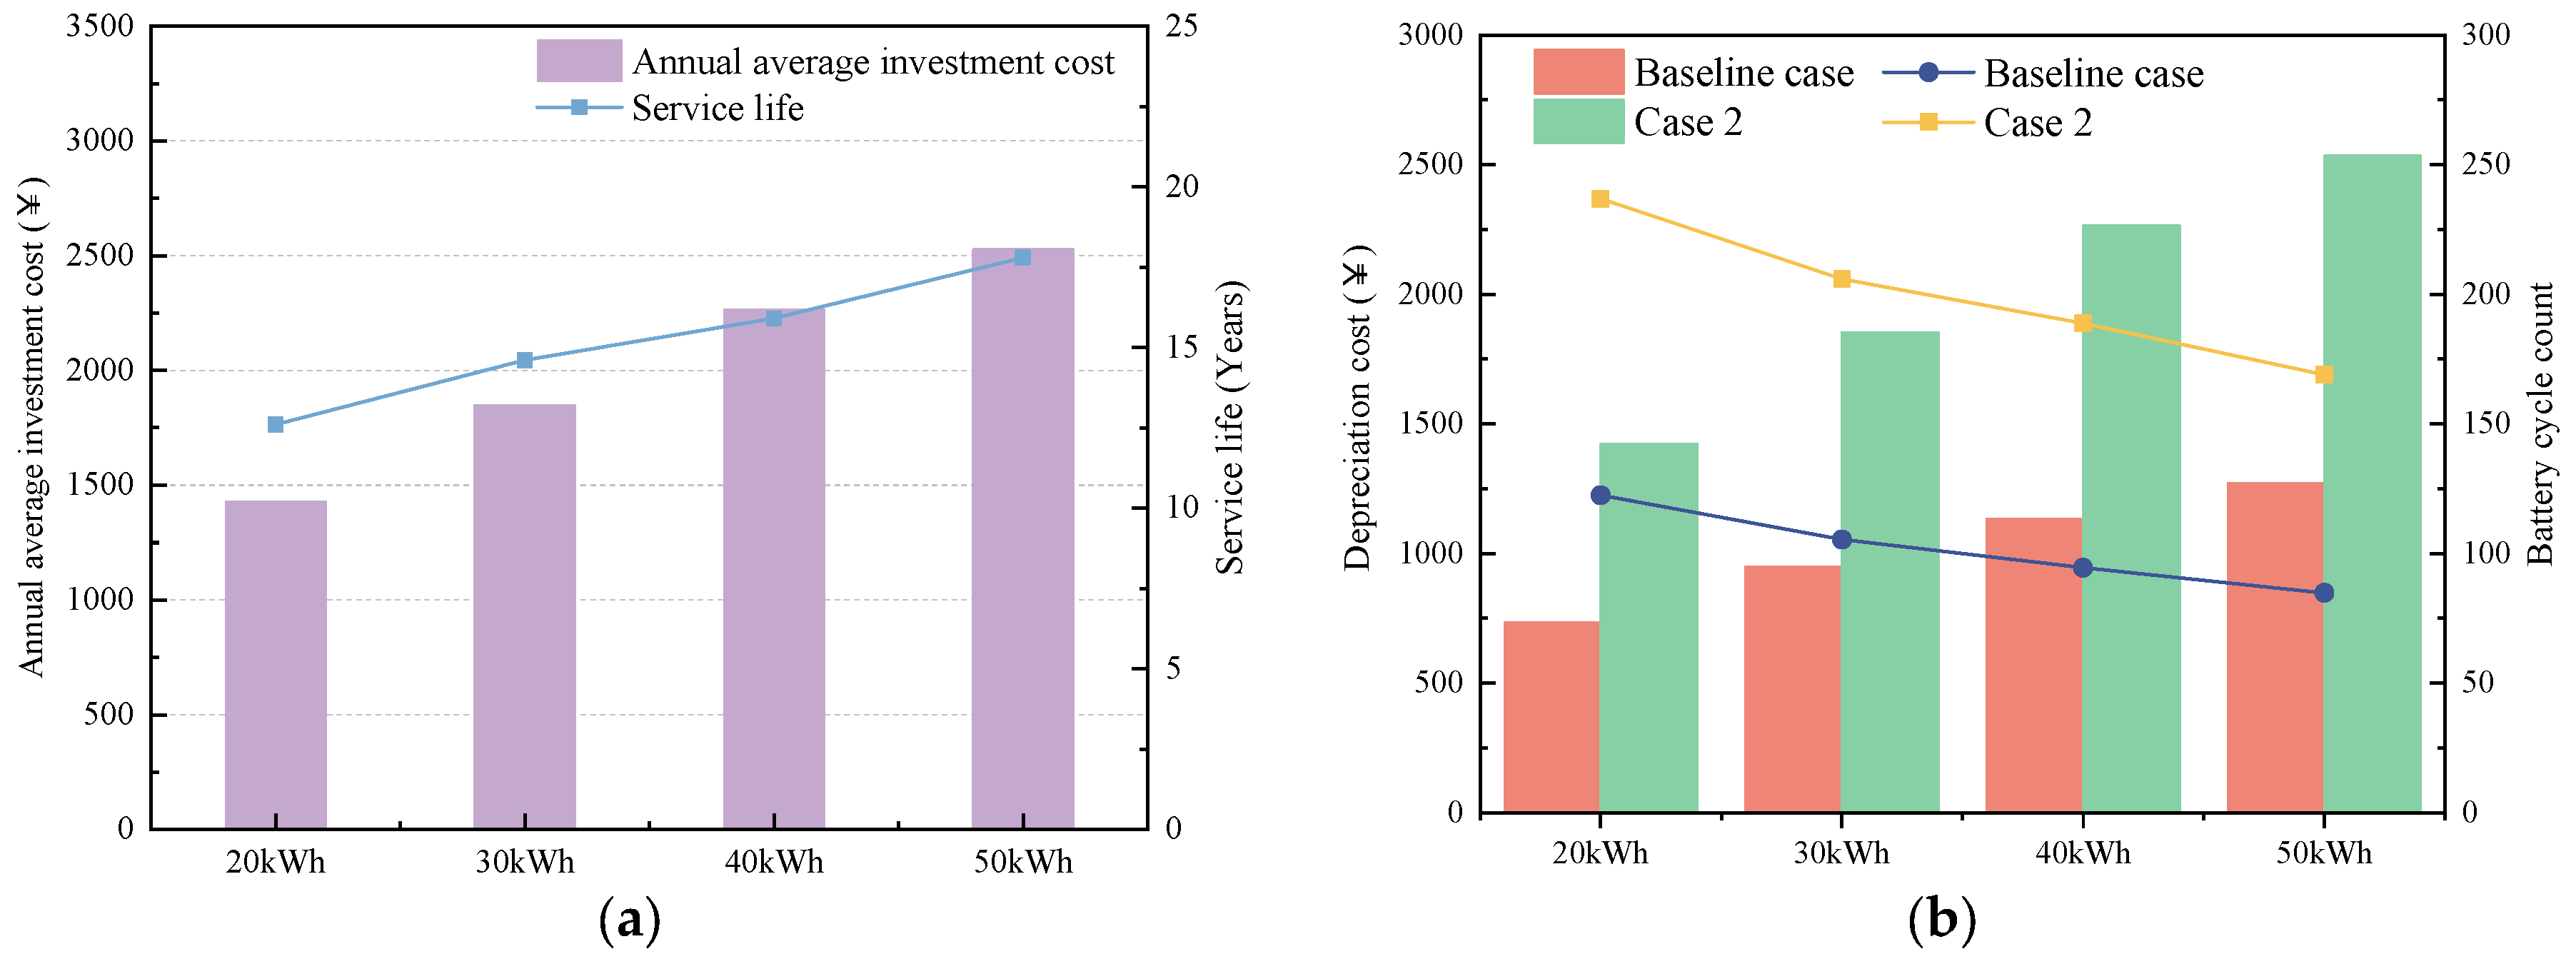
The investment cost and service life of different ESS capacities vary, which also affects the battery’s cycle life and, consequently, its degradation cost. Figure 16a shows the investment costs and service life for four different capacities. The investment cost is positively correlated with capacity, while the service life increases significantly with medium capacities before stabilizing at higher capacities. In Case 2, the flexible energy management scheduling strategy leads to more frequent use of the ESS, resulting in a noticeable increase in degradation costs. When considering the flexible energy management scheduling strategy, it is important to account for not only the investment and degradation costs but also the benefits associated with the ESS capacity.
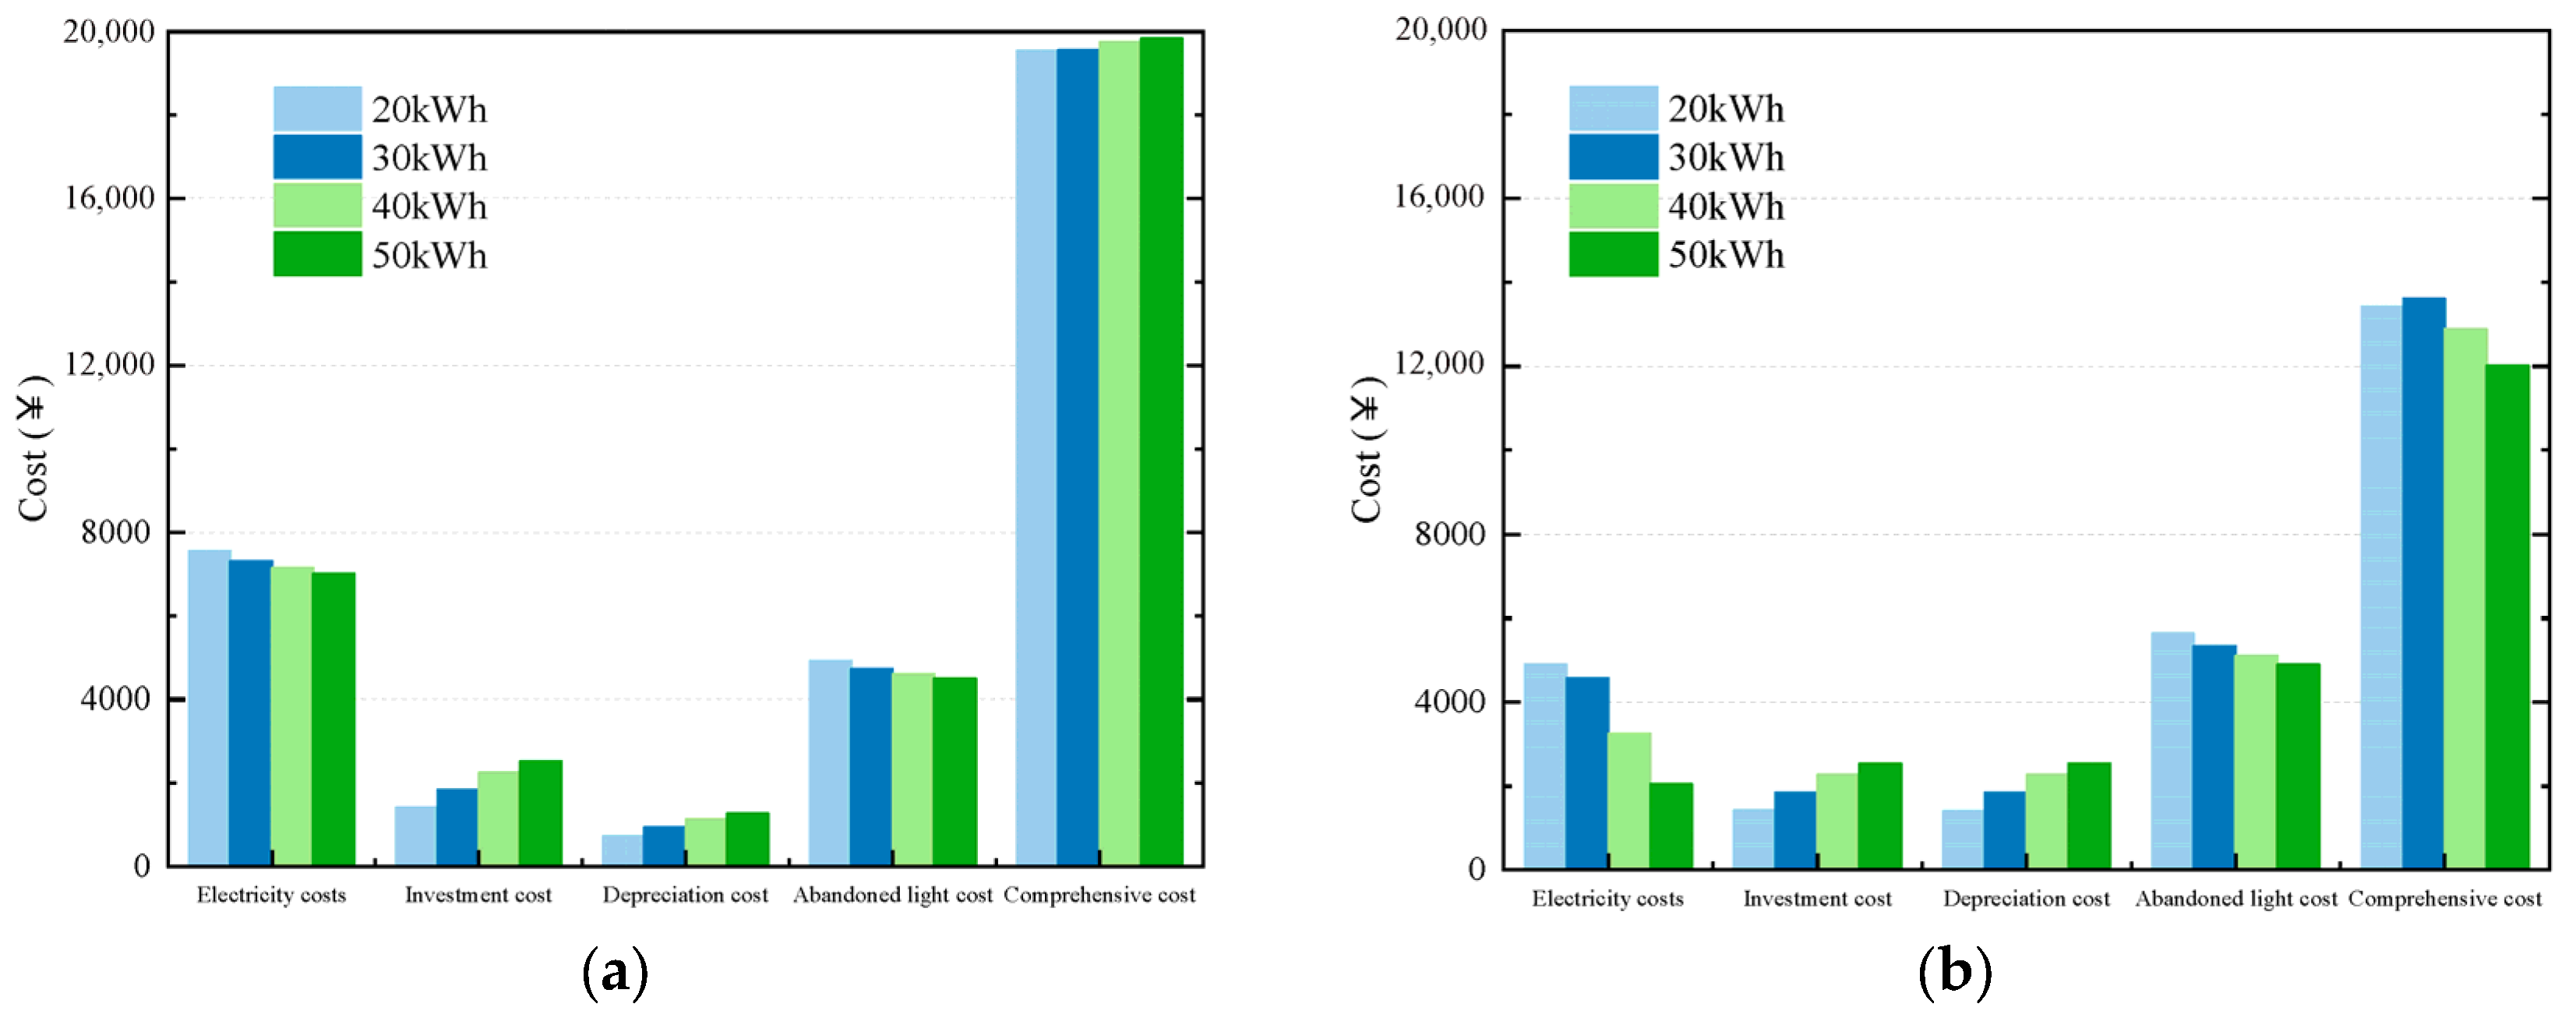
Figure 17. Cost classification analysis of the energy system for different storage capacities. (a) Baseline case: Comparison of electricity costs, investment costs, depreciation costs, abandoned light costs, and comprehensive costs for different storage capacities (20 kWh, 30 kWh, 40 kWh, 50 kWh). (b) Case 2: Comparison of electricity costs, investment costs, depreciation costs, abandoned light costs, and comprehensive costs under an alternative case scenario for different storage capacities.
Buildings 15 03536 g017
A classified cost analysis of the two cases clearly demonstrates that the flexible energy management strategy can significantly reduce overall system costs. From Figure 17a, in the baseline case, larger ESS capacities store more surplus PV generation, thereby lowering operational costs and minimizing penalties associated with unused PV energy. Overall, higher ESS capacity results in a reduction in total costs. From Figure 17b, in Case 2, the 50 kWh high-capacity ESS enhances the system’s operational flexibility but slightly increases the overall cost. Therefore, in scenarios with high load demand, a balance between performance and economic considerations must be maintained.

5. Conclusions

This research delves into the impact of storage capacity on the flexible energy management strategy in a PV-ESS-GSHP system, evaluating its role in enhancing PV energy utilization, improving system responsiveness, and optimizing overall costs. The specific conclusions are as follows:
  • The flexible energy management strategy significantly improves the PV energy absorption. The implementation of this strategy increases the annual PV consumption by 35.29%, with the PV self-consumption rate improving by up to 4.07% as ESS capacity increases. After adopting this strategy, the system effectively reduces PV waste caused by variability and intermittency. A larger ESS capacity provides greater flexibility for energy absorption, strengthening the system’s operational security and adaptability.
  • Analysis of the ESS charge and discharge curves shows that the system’s responsiveness improves under the flexible energy management strategy. As ESS capacity increases, the system is better able to respond to fluctuations in PV power generation. The system’s ability to adapt and respond strengthens continuously, with the increase in storage capacity playing a vital role in enhancing system stability and regulatory capabilities.
  • In terms of overall costs, while the degradation costs during operation slightly rise with the implementation of the flexible energy management strategy, the total cost decreases by 65.13%. A comparison of different capacities shows that the cost differences between various ESS sizes are within 1.48%, indicating that, within a certain range, the choice of ESS capacity should balance both system performance and economic feasibility.
Based on the above findings, the flexible energy scheduling strategy proposed in this paper is well-suited for applications where photovoltaic energy is dominant. By optimizing energy storage capacity and scheduling strategies, the proposed solution significantly enhances the utilization of renewable energy, contributing positively to the development of low-carbon buildings. This approach provides valuable insights for advancing energy-efficient, low-carbon infrastructure and offers strong support for the application of renewable energy and energy storage systems.
However, the case study in this research has certain limitations. The analysis was conducted on a small office building in northern China. While this building is representative, its small scale and limited rooftop area restrict the installation of photovoltaic systems. Future research could extend to buildings of varying sizes and types to verify the broader applicability of the proposed strategy. Additionally, future studies should focus on the long-term performance of energy storage systems, particularly their operating costs, aging, and other factors under different climatic conditions.

Author Contributions

Conceptualization, F.H. and S.Y.; methodology, F.H.; software, F.H.; validation, F.H.; formal analysis, F.H.; investigation, F.H.; resources, S.Y.; data curation, F.H.; writing—original draft preparation, F.H.; writing—review and editing, F.H. and S.Y.; visualization, F.H.; supervision, S.Y.; project administration, S.Y.; funding acquisition, S.Y. All authors have read and agreed to the published version of the manuscript.

Funding

This research was funded by the Natural Science Foundation of Liaoning Province, grant number 2024-MS-117; the National Natural Science Foundation of China, grant number 52478099; and the National Natural Science Foundation of China, grant number U23A20657.

Data Availability Statement

Data are contained within the article.

Conflicts of Interest

The authors declare no conflicts of interest.

Abbreviations

The following abbreviations are used in this manuscript:
IESIntegrated energy systems
ESSEnergy storage systems
SCRSelf-consumption rate
DSMDemand-side management
DRDemand response

References

  1. Jensen, S.Ø.; Marszal-Pomianowska, A.; Lollini, R.; Pasut, W.; Knotzer, A.; Engelmann, P.; Stafford, A.; Reynders, G. IEA EBC Annex 67 Energy Flexible Buildings. Energy Build. 2017, 155, 25–34. [Google Scholar] [CrossRef]
  2. Camarasa, C.; Mata, É.; Navarro, J.P.J.; Reyna, J.; Bezerra, P.; Angelkorte, G.B.; Feng, W.; Filippidou, F.; Forthuber, S.; Harris, C.; et al. A Global Comparison of Building Decarbonization Scenarios by 2050 towards 1.5–2 °C Targets. Nat. Commun. 2022, 13, 3077. [Google Scholar] [CrossRef]
  3. Mittelviefhaus, M.; Georges, G.; Boulouchos, K. Electrification of Multi-Energy Hubs under Limited Electricity Supply: De-/Centralized Investment and Operation for Cost-Effective Greenhouse Gas Mitigation. Adv. Appl. Energy 2022, 5, 100083. [Google Scholar] [CrossRef]
  4. Gielen, D.; Boshell, F.; Saygin, D.; Bazilian, M.D.; Wagner, N.; Gorini, R. The Role of Renewable Energy in the Global Energy Transformation. Energy Strategy Rev. 2019, 24, 38–50. [Google Scholar] [CrossRef]
  5. Lv, F.; Tang, H. Assessing the Impact of Climate Change on the Optimal Solar–Wind Hybrid Power Generation Potential in China: A Focus on Stability and Complementarity. Renew. Sustain. Energy Rev. 2025, 212, 115429. [Google Scholar] [CrossRef]
  6. Wang, J.; Kontar, R.E.; Jin, X.; King, J. Electrifying High-Efficiency Future Communities: Impact on Energy, Emissions, and Grid. Adv. Appl. Energy 2022, 6, 100095. [Google Scholar] [CrossRef]
  7. Aruta, G.; Ascione, F.; Fistola, R.; Iovane, T. The City as a Power Hub for Boosting Renewable Energy Communities: A Case Study in Naples. Sustainability 2024, 16, 7988. [Google Scholar] [CrossRef]
  8. McGarry, C.; Dixon, J.; Flower, J.; Bukhsh, W.; Brand, C.; Bell, K.; Galloway, S. Electrified Heat and Transport: Energy Demand Futures, Their Impacts on Power Networks and What It Means for System Flexibility. Appl. Energy 2024, 360, 122836. [Google Scholar] [CrossRef]
  9. Zhang, P.; Mansouri, S.A.; Rezaee Jordehi, A.; Tostado-Véliz, M.; Alharthi, Y.Z.; Safaraliev, M. An ADMM-Enabled Robust Optimization Framework for Self-Healing Scheduling of Smart Grids Integrated with Smart Prosumers. Appl. Energy 2024, 363, 123067. [Google Scholar] [CrossRef]
  10. Wack, Y.; Sollich, M.; Salenbien, R.; Diriken, J.; Baelmans, M.; Blommaert, M. A Multi-Period Topology and Design Optimization Approach for District Heating Networks. Appl. Energy 2024, 367, 123380. [Google Scholar] [CrossRef]
  11. Bao, M.; Hui, H.; Ding, Y.; Sun, X.; Zheng, C.; Gao, X. An Efficient Framework for Exploiting Operational Flexibility of Load Energy Hubs in Risk Management of Integrated Electricity-Gas Systems. Appl. Energy 2023, 338, 120765. [Google Scholar] [CrossRef]
  12. Rotas, R.; Fotopoulou, M.; Drosatos, P.; Rakopoulos, D.; Nikolopoulos, N. Adaptive Dynamic Building Envelopes with Solar Power Components: Annual Performance Assessment for Two Pilot Sites. Energies 2023, 16, 2148. [Google Scholar] [CrossRef]
  13. Zhang, H.; Hao, S.; Wen, M.; Bai, X.; Liu, L.; Zhang, P. Optimization of Ground Source Heat Pump System Based on TRNSYS in Hot Summer and Cold Winter Region. Buildings 2024, 14, 2764. [Google Scholar] [CrossRef]
  14. Saleh, A. Experimental Performance Evaluation of Water Source Heat Pumps in Different Circumstances and Comparison to Air Source Heat Pumps. J. Therm. Eng. 2023, 9, 954–967. [Google Scholar] [CrossRef]
  15. Hosseinnia, S.M.; Sorin, M. Energy Targeting Approach for Optimum Solar Assisted Ground Source Heat Pump Integration in Buildings. Energy 2022, 248, 123528. [Google Scholar] [CrossRef]
  16. Mayer, M.J.; Szilágyi, A.; Gróf, G. Environmental and Economic Multi-Objective Optimization of a Household Level Hybrid Renewable Energy System by Genetic Algorithm. Appl. Energy 2020, 269, 115058. [Google Scholar] [CrossRef]
  17. Erdinç, F.G.; Çiçek, A.; Erdinç, O. Resiliency-Sensitive Decision Making Mechanism for a Residential Community Enhanced with Bi-Directional Operation of Fuel Cell Electric Vehicles. Energies 2022, 15, 8729. [Google Scholar] [CrossRef]
  18. Tang, H.; Wang, S.; Li, H. Flexibility Categorization, Sources, Capabilities and Technologies for Energy-Flexible and Grid-Responsive Buildings: State-of-the-Art and Future Perspective. Energy 2021, 219, 119598. [Google Scholar] [CrossRef]
  19. Lamnatou, C.; Chemisana, D.; Cristofari, C. Smart Grids and Smart Technologies in Relation to Photovoltaics, Storage Systems, Buildings and the Environment. Renew. Energy 2022, 185, 1376–1391. [Google Scholar] [CrossRef]
  20. Saberi-Derakhtenjani, A.; Barbosa, J.D.; Rodriguez-Ubinas, E. Energy Flexibility Strategies for Buildings in Hot Climates: A Case Study for Dubai. Buildings 2024, 14, 3008. [Google Scholar] [CrossRef]
  21. Mlecnik, E.; Parker, J.; Ma, Z.; Corchero, C.; Knotzer, A.; Pernetti, R. Policy Challenges for the Development of Energy Flexibility Services. Energy Policy 2020, 137, 111147. [Google Scholar] [CrossRef]
  22. Nolzen, N.; Leenders, L.; Bardow, A. Flexibility-Expansion Planning of Multi-Energy Systems by Energy Storage for Participating in Balancing-Power Markets. Front. Energy Res. 2023, 11, 1225564. [Google Scholar] [CrossRef]
  23. Wang, J.; Wu, Z.; Zhao, Y.; Sun, Q.; Wang, F. A Robust Flexibility Evaluation Method for Distributed Multi-Energy Microgrid in Supporting Power Distribution System. Front. Energy Res. 2023, 10, 1021627. [Google Scholar] [CrossRef]
  24. Antoniadou-Plytaria, K.; Steen, D.; Tuan, L.A.; Carlson, O.; Fotouhi Ghazvini, M.A. Market-Based Energy Management Model of a Building Microgrid Considering Battery Degradation. IEEE Trans. Smart Grid 2021, 12, 1794–1804. [Google Scholar] [CrossRef]
  25. Lu, F.; Yu, Z.; Zou, Y.; Yang, X. Energy Flexibility Assessment of a Zero-Energy Office Building with Building Thermal Mass in Short-Term Demand-Side Management. J. Build. Eng. 2022, 50, 104214. [Google Scholar] [CrossRef]
  26. Shakeri, M.; Shayestegan, M.; Abunima, H.; Reza, S.M.S.; Akhtaruzzaman, M.; Alamoud, A.R.M.; Sopian, K.; Amin, N. An Intelligent System Architecture in Home Energy Management Systems (HEMS) for Efficient Demand Response in Smart Grid. Energy Build. 2017, 138, 154–164. [Google Scholar] [CrossRef]
  27. Gupta, R.; Pena-Bello, A.; Streicher, K.N.; Roduner, C.; Farhat, Y.; Thöni, D.; Patel, M.K.; Parra, D. Spatial Analysis of Distribution Grid Capacity and Costs to Enable Massive Deployment of PV, Electric Mobility and Electric Heating. Appl. Energy 2021, 287, 116504. [Google Scholar] [CrossRef]
  28. Li, Y.; Lu, Y.; Sun, J.; Wang, T.; Zong, S.; Zhou, T.; Wang, X. Operational Strategy of a DC Inverter Heat Pump System Considering PV Power Fluctuation and Demand-Side Load Characteristics. Buildings 2024, 14, 1139. [Google Scholar] [CrossRef]
  29. Gradwohl, C.; Maxim, D.C.; Islam, S.; Kienberger, T. Unlocking Heat Pump Flexibility: A Multi-Objective Optimisation Approach for Self Sufficiency and Energy Costs. Energy Convers. Manag. 2025, 334, 119822. [Google Scholar] [CrossRef]
  30. Xue, T.; Jokisalo, J.; Kosonen, R. Demand Response Potential of an Educational Building Heated by a Hybrid Ground Source Heat Pump System. Energies 2024, 17, 5428. [Google Scholar] [CrossRef]
  31. Dong, X.; Liu, Y.; Pu, Z.; Zhang, L. Experimental Investigation of an Off-Grid Photovoltaic Heat Pump Collection System with Heat Collecting as a Core. Appl. Therm. Eng. 2025, 260, 125004. [Google Scholar] [CrossRef]
  32. Tan, K.M.; Babu, T.S.; Ramachandaramurthy, V.K.; Kasinathan, P.; Solanki, S.G.; Raveendran, S.K. Empowering Smart Grid: A Comprehensive Review of Energy Storage Technology and Application with Renewable Energy Integration. J. Energy Storage 2021, 39, 102591. [Google Scholar] [CrossRef]
  33. Fan, M.; Cao, S.; Lu, S. Optimal Allocation of Multiple Energy Storage in the Integrated Energy System of a Coastal Nearly Zero Energy Community Considering Energy Storage Priorities. J. Energy Storage 2024, 87, 111323. [Google Scholar] [CrossRef]
  34. Zhang, S.; Li, Y.; Du, E.; Fan, C.; Wu, Z.; Yao, Y.; Liu, L.; Zhang, N. A Review and Outlook on Cloud Energy Storage: An Aggregated and Shared Utilizing Method of Energy Storage System. Renew. Sustain. Energy Rev. 2023, 185, 113606. [Google Scholar] [CrossRef]
  35. Li, J.; Guo, Q.; Wang, X.; Tu, C.; Xiao, F.; Hou, Y.; Shen, X. Parallel-Execute-Based Real-Time Energy Management Strategy for FTPSS Integrated PV and ESS. Appl. Energy 2025, 385, 125538. [Google Scholar] [CrossRef]
  36. Dehghani-Sanij, A.R.; Tharumalingam, E.; Dusseault, M.B.; Fraser, R. Study of Energy Storage Systems and Environmental Challenges of Batteries. Renew. Sustain. Energy Rev. 2019, 104, 192–208. [Google Scholar] [CrossRef]
  37. Zubi, G.; Dufo-López, R.; Carvalho, M.; Pasaoglu, G. The Lithium-Ion Battery: State of the Art and Future Perspectives. Renew. Sustain. Energy Rev. 2018, 89, 292–308. [Google Scholar] [CrossRef]
  38. Sandoval, D.; Goffin, P.; Leibundgut, H. How Low Exergy Buildings and Distributed Electricity Storage Can Contribute to Flexibility within the Demand Side. Appl. Energy 2017, 187, 116–127. [Google Scholar] [CrossRef]
  39. Hannan, M.A.; Faisal, M.; Jern Ker, P.; Begum, R.A.; Dong, Z.Y.; Zhang, C. Review of Optimal Methods and Algorithms for Sizing Energy Storage Systems to Achieve Decarbonization in Microgrid Applications. Renew. Sustain. Energy Rev. 2020, 131, 110022. [Google Scholar] [CrossRef]
  40. Li, Y.; Peng, J.; Jia, H.; Zou, B.; Hao, B.; Ma, T.; Wang, X. Optimal Battery Schedule for Grid-Connected Photovoltaic-Battery Systems of Office Buildings Based on a Dynamic Programming Algorithm. J. Energy Storage 2022, 50, 104557. [Google Scholar] [CrossRef]
  41. Cruz, C.; Tostado-Véliz, M.; Palomar, E.; Bravo, I. Pattern-Driven Behaviour for Demand-Side Management: An Analysis of Appliance Use. Energy Build. 2024, 308, 113988. [Google Scholar] [CrossRef]
  42. Zhou, Y.; Wang, J.; Yang, M.; Xu, H. Hybrid Active and Passive Strategies for Chance-Constrained Bilevel Scheduling of Community Multi-Energy System Considering Demand-Side Management and Consumer Psychology. Appl. Energy 2023, 349, 121646. [Google Scholar] [CrossRef]
  43. Iranpour Mobarakeh, A.; Sadeghi, R.; Saghafi Esfahani, H.; Delshad, M. Optimal Planning and Operation of Energy Hub by Considering Demand Response Algorithms and Uncertainties Based on Problem-Solving Approach in Discrete and Continuous Space. Electr. Power Syst. Res. 2023, 214, 108859. [Google Scholar] [CrossRef]
  44. Li, H.; Wang, Z.; Hong, T.; Piette, M.A. Energy Flexibility of Residential Buildings: A Systematic Review of Characterization and Quantification Methods and Applications. Adv. Appl. Energy 2021, 3, 100054. [Google Scholar] [CrossRef]
  45. Ali, S.; Rehman, A.U.; Wadud, Z.; Khan, I.; Murawwat, S.; Hafeez, G.; Albogamy, F.R.; Khan, S.; Samuel, O. Demand Response Program for Efficient Demand-Side Management in Smart Grid Considering Renewable Energy Sources. IEEE Access 2022, 10, 53832–53853. [Google Scholar] [CrossRef]
  46. Zulfiqar, M.; Ul Abdeen, Z.; Kamran, M. Optimizing Electric Vehicle Charging Scheduling Using Enhanced Multi-Agent Neural Networks with Dynamic Pricing. J. Energy Storage 2024, 99, 113317. [Google Scholar] [CrossRef]
  47. Asadinejad, A.; Tomsovic, K. Optimal Use of Incentive and Price Based Demand Response to Reduce Costs and Price Volatility. Electr. Power Syst. Res. 2017, 144, 215–223. [Google Scholar] [CrossRef]
  48. Alipour, M.; Zare, K.; Seyedi, H.; Jalali, M. Real-Time Price-Based Demand Response Model for Combined Heat and Power Systems. Energy 2019, 168, 1119–1127. [Google Scholar] [CrossRef]
  49. Rehman, A.U.; Hafeez, G.; Albogamy, F.R.; Wadud, Z.; Ali, F.; Khan, I.; Rukh, G.; Khan, S. An Efficient Energy Management in Smart Grid Considering Demand Response Program and Renewable Energy Sources. IEEE Access 2021, 9, 148821–148844. [Google Scholar] [CrossRef]
  50. Sarsabahi, Y.; Safari, A.; Quteishat, A.; Salehi, J. Strategic Energy Storage Scheduling with Fast Acting Demand Side Schemes to Improve Flexibility of Hybrid Renewable Energy System. J. Energy Storage 2024, 92, 112182. [Google Scholar] [CrossRef]
  51. Jiang, H.; Lu, S.; Li, B.; Wang, R. The Power Regulation Characteristics, Key Challenges, and Solution Pathways of Typical Flexible Resources in Regional Energy Systems. Energies 2025, 18, 3830. [Google Scholar] [CrossRef]
  52. Shi, M.; Wang, H.; Lyu, C.; Xie, P.; Xu, Z.; Jia, Y. A Hybrid Model of Energy Scheduling for Integrated Multi-Energy Microgrid with Hydrogen and Heat Storage System. Energy Rep. 2021, 7, 357–368. [Google Scholar] [CrossRef]
  53. De Carli, M.; Galgaro, A.; Pasqualetto, M.; Zarrella, A. Energetic and Economic Aspects of a Heating and Cooling District in a Mild Climate Based on Closed Loop Ground Source Heat Pump. Appl. Therm. Eng. 2014, 71, 895–904. [Google Scholar] [CrossRef]
  54. Jonban, M.S.; Romeral, L.; Akbarimajd, A.; Ali, Z.; Ghazimirsaeid, S.S.; Marzband, M.; Putrus, G. Autonomous Energy Management System with Self-Healing Capabilities for Green Buildings (Microgrids). J. Build. Eng. 2021, 34, 101604. [Google Scholar] [CrossRef]
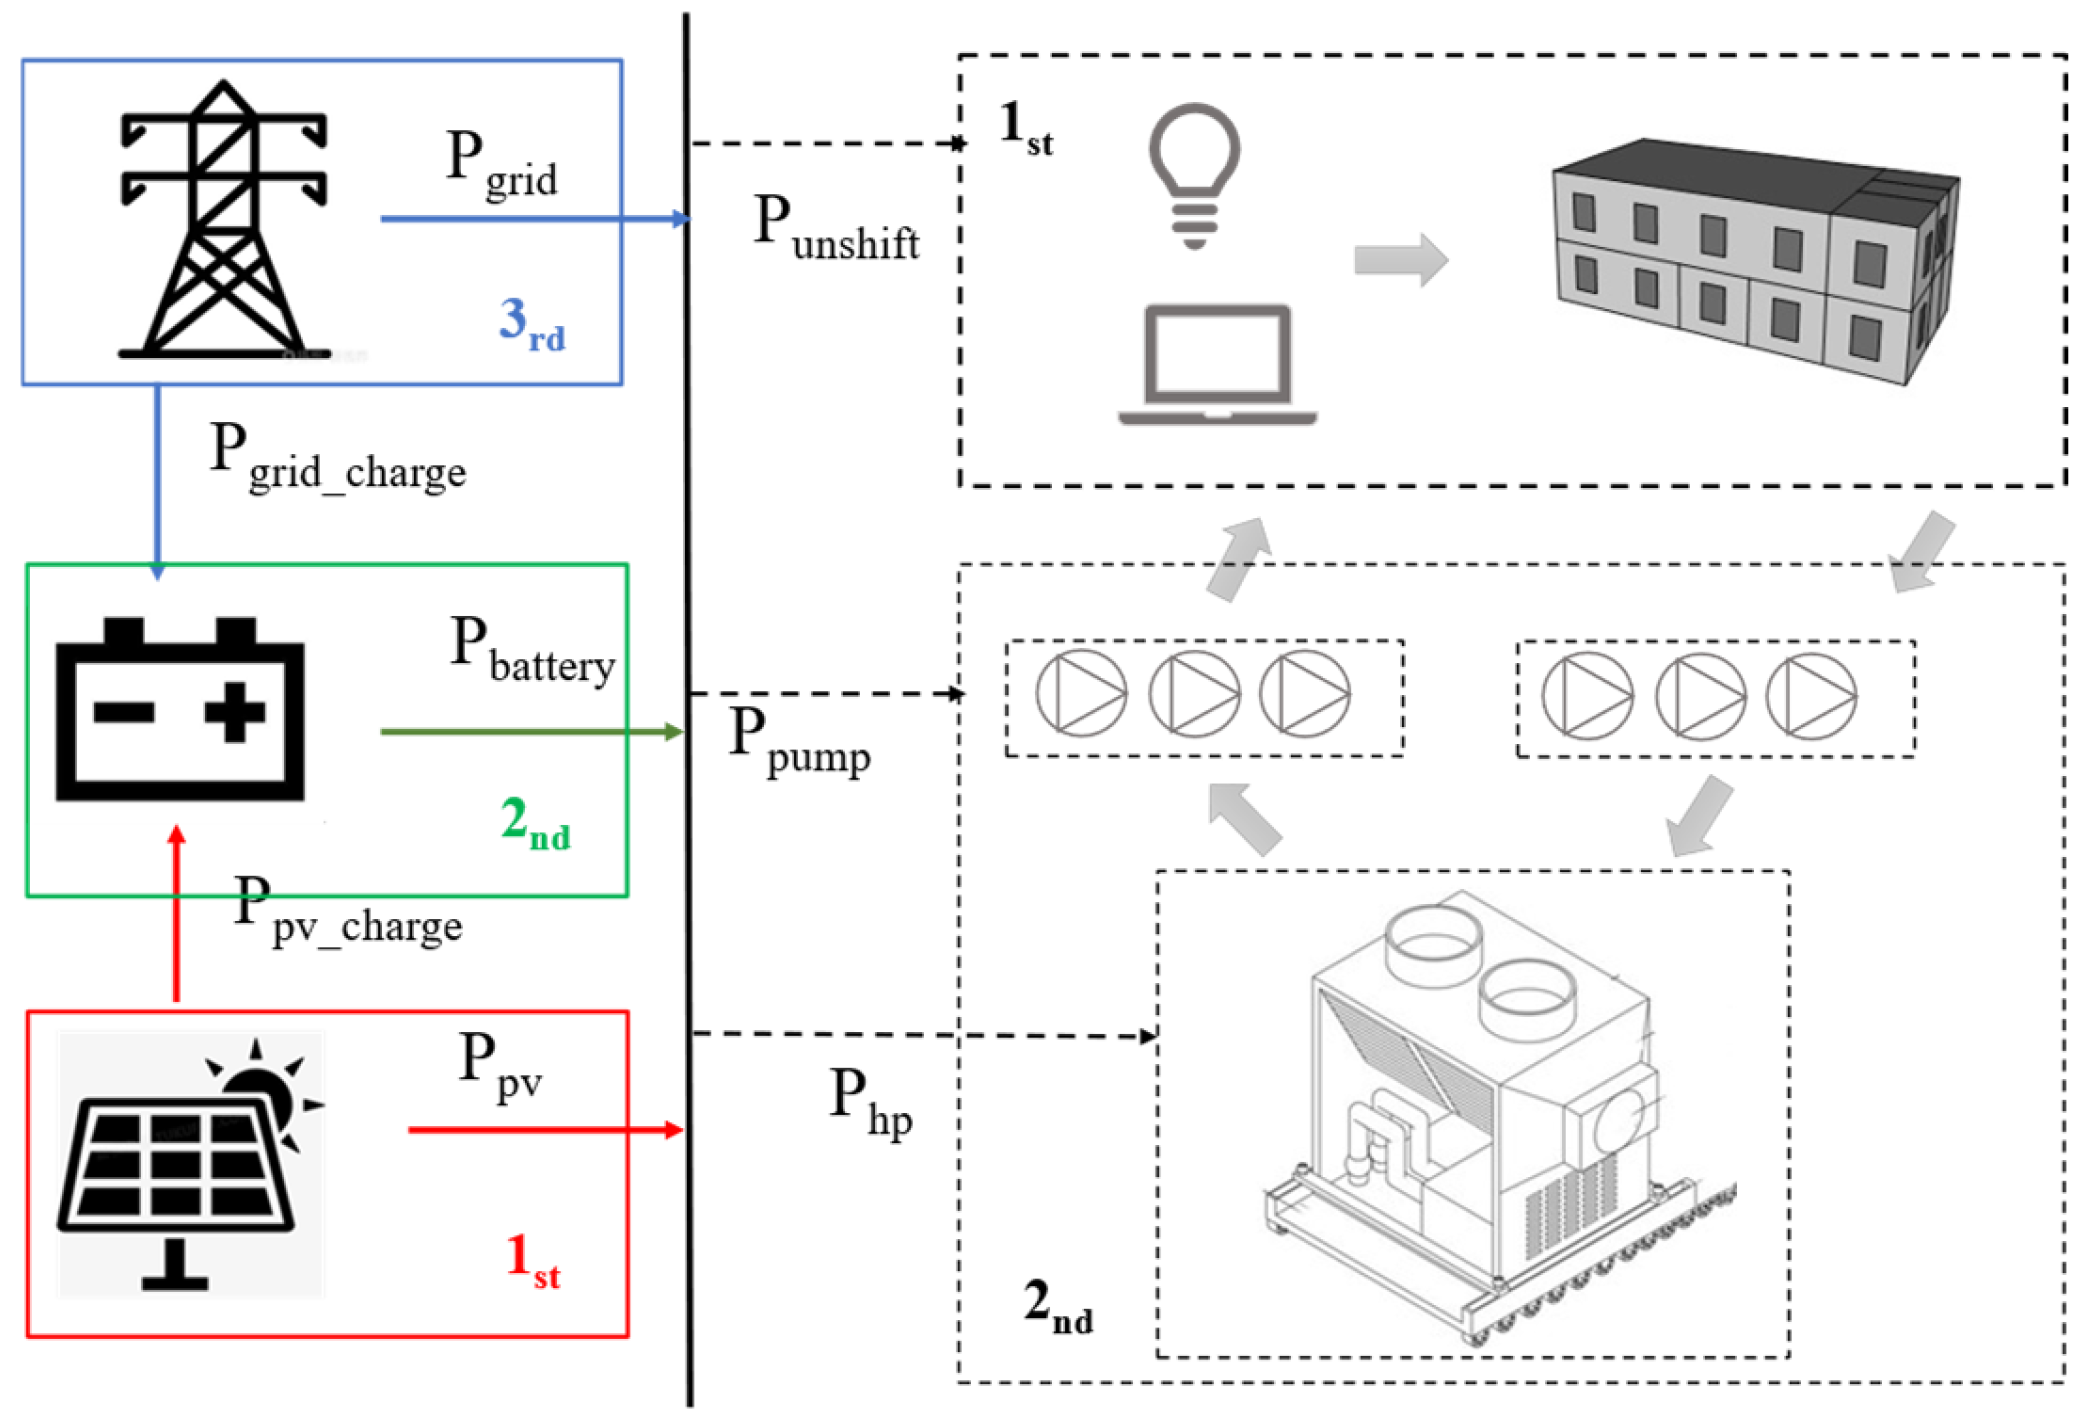
Figure 1. Energy system structure and priority setting.
Buildings 15 03536 g001
Figure 2. Energy use scheduling priorities and decision principles.
Buildings 15 03536 g002
Figure 3. Flowchart of hierarchical flexible energy scheduling strategy.
Buildings 15 03536 g003
Figure 4. Schematic diagram of energy systems in different cases.
Buildings 15 03536 g004
Figure 5. Architectural model.
Buildings 15 03536 g005
Figure 6. 24-Hour winter energy production, consumption, and battery charging/discharging.
Buildings 15 03536 g006
Figure 7. 24-Hour summer energy production, consumption, and battery charging/discharging.
Buildings 15 03536 g007
Figure 8. Winter energy production, consumption, and battery charging/discharging.
Buildings 15 03536 g008
Figure 9. Summer energy production, consumption, and battery charging/discharging.
Buildings 15 03536 g009
Figure 10. Baseline Case: SCR with different energy storage capacities in winter.
Buildings 15 03536 g010
Figure 11. Baseline Case: SCR with different energy storage capacities in summer.
Buildings 15 03536 g011
Figure 12. Case 2: SCR with different energy storage capacities in winter.
Buildings 15 03536 g012
Figure 13. Case 2: SCR with different energy storage capacities in summer.
Buildings 15 03536 g013
Figure 14. (a) Baseline case: SCR for different ESS capacities (20 kWh, 30 kWh, 40 kWh, 50 kWh) during winter. (b) Baseline case: SCR for different ESS capacities during summer. (c) Case 2: SCR for different ESS capacities during winter. (d) Case 2: SCR for different ESS capacities during summer.
Buildings 15 03536 g014aBuildings 15 03536 g014b
Figure 15. (a) Baseline Case: Charging and discharging power of ESS with different capacities (20 kWh, 30 kWh, 40 kWh, 50 kWh) in winter. (b) Baseline Case: Charging and discharging power of ESS with different capacities in summer. (c) Case 2: Charging and discharging power of ESS with different capacities in winter. (d) Case 2: Charging and discharging power of ESS with different capacities in summer.
Buildings 15 03536 g015
Figure 16. Annual average investment cost, service life, operating phase loss depreciation costs and battery cycle count. (a) Annual average investment cost and service life for different capacities. (b) Operating phase depreciation costs and battery cycle count for the baseline and Case 2 scenarios.
Buildings 15 03536 g016
Table 1. Strategies of cases.
PVESSPower Grid
Baseline case×
Case 2 (Flexibility case)
Table 2. System module parameter table.
Energy System ModuleParameters
PVMonocrystalline silicon photovoltaic panels, 5 × 10 pieces, 45° south
ESS20/30/40/50 kWh lithium battery, discharge efficiency 0.9, SOC ∈ (0.1, 0.9)
GSHPSingle U-shaped ground heat exchanger, with a unit rated heating capacity of 42.78 kWh and a rated cooling capacity of 34.22 kWh.
Table 3. The power ratio of lighting and electrical equipment.
Time (h)1–6789–1112–1314–1718–1920–24
Weekday Usage Proportion (%)01050958095300
Holiday Usage Proportion (%)00000000
Table 4. Time-of-Use electricity pricing in Shenyang City.
Time PeriodPrice (Yuan)Time Slot
Peak Period1.26768817:00–19:00
High Peak Period1.0209157:30–11:30, 19:00–21:00
Off-Peak Period0.6918855:00–7:30, 11:30–17:00, 21:00–5:00 (next day)
Table 5. Annual PV total SCR for case 2.
20 kWh30 kWh40 kWh50 kWh
Total annual PV self-consumption22,111.14 22,639.99 23,170.60 23,750.45
Annual PV self-consumption rate0.680.700.710.73
Disclaimer/Publisher’s Note: The statements, opinions and data contained in all publications are solely those of the individual author(s) and contributor(s) and not of MDPI and/or the editor(s). MDPI and/or the editor(s) disclaim responsibility for any injury to people or property resulting from any ideas, methods, instructions or products referred to in the content.